- Analiza
- Novosti i instrumenti
- Vesti sa tržišta
Forex-novosti i prognoze od 12-09-2024
- EUR/USD rallied on a weakening Greenback on Thursday.
- US PPI inflation data failed to spark any major moves, but remained steady.
- The market’s Fed-centric tilt continues unabated as the wait for rate cuts rolls on.
EUR/USD found higher ground on Thursday, rising back above the 1.1050 level as markets lean into a risk-on stance after US Producer Price Index (PPI) figures kept up market hopes for an opening volley from the Federal Reserve (Fed) next week. Markets are confident that the Fed will be kicking off a rate cutting cycle on September 16.
Forex Today: An impasse is likely ahead of the FOMC meeting
EU data remains inconsequential on Friday, and Euro traders will be taking a bit of a breather after the European Central Bank (ECB) dropped its main reference rate to 3.65% from 4.25% on Thursday. The University of Michigan’s Consumer Sentiment Index will give traders on the US side one last glimpse into how consumer’s feel about the overall US economy before wrapping up the trading week.
US PPI rose to 0.2% MoM in August, with core PPI accelerating to 0.3% MoM. Headline PPI was forecast to rise to 0.1% from the previous 0.0%, while core PPI was expected to rise to 0.2% from July’s -0.2% contraction. Despite the near-term upswing, annualized PPI inflation figures were much more attractive to investors, with YoY headline PPI easing to 1.7% from the previous period’s revised 2.1%, and ticking below the expected 1.8%. Core annualized PPI also beat the expected print, holding steady at 2.4% YoY versus the expected 2.5% uptick.
US Initial Jobless Claims also rose slightly higher for the week ended September 6, increasing to the expected 230K from the previous week’s revised 228K.
With PPI inflation remaining tame and the number of unemployment benefits seekers holding firmly in tepid territory, little lies in the way of a first rate cut from the Federal Reserve (Fed) on September 18. The Fed is broadly expected to deliver a 25 bps cut to kick off 2024’s late-starting rate cut cycle. According to the CME’s FedWatch Tool, rate markets are pricing in over 80% odds of the Fed cutting by a quarter point next week, with a slim 20% still leaning into hopes for an initial double-cut for 50 bps. Rate traders also overwhelmingly expect the Fed to deliver four cuts in total, with December’s rate call expected to land between 425 and 450 bps.
Economic Indicator
Producer Price Index ex Food & Energy (YoY)
The Producer Price Index ex Food & energy released by the Bureau of Labor statistics, Department of Labor measures the average changes in prices in primary markets of the US by producers of commodities in all states of processing. Those volatile products such as food and energy are excluded in order to capture an accurate calculation. Generally speaking, a high reading is seen as positive (or bullish) for the USD, whereas a low reading is seen as negative (or bearish).
Read more.Last release: Thu Sep 12, 2024 12:30
Frequency: Monthly
Actual: 2.4%
Consensus: 2.5%
Previous: 2.4%
Source: US Bureau of Labor Statistics
EUR/USD price forecast
Thursday’s rally comes as welcome relief to EUR/USD bulls as the pair recovers from a mid-week plunge toward the 1.1000 handle. Despite a near-term decline from 13-month highs set in late August near 1.1200, short pressure is facing significant challenges from Fiber bidders, and the pair refuses to dip all the way back to the 50-day Exponential Moving Average (EMA) at 1.0984.
EUR/USD daily chart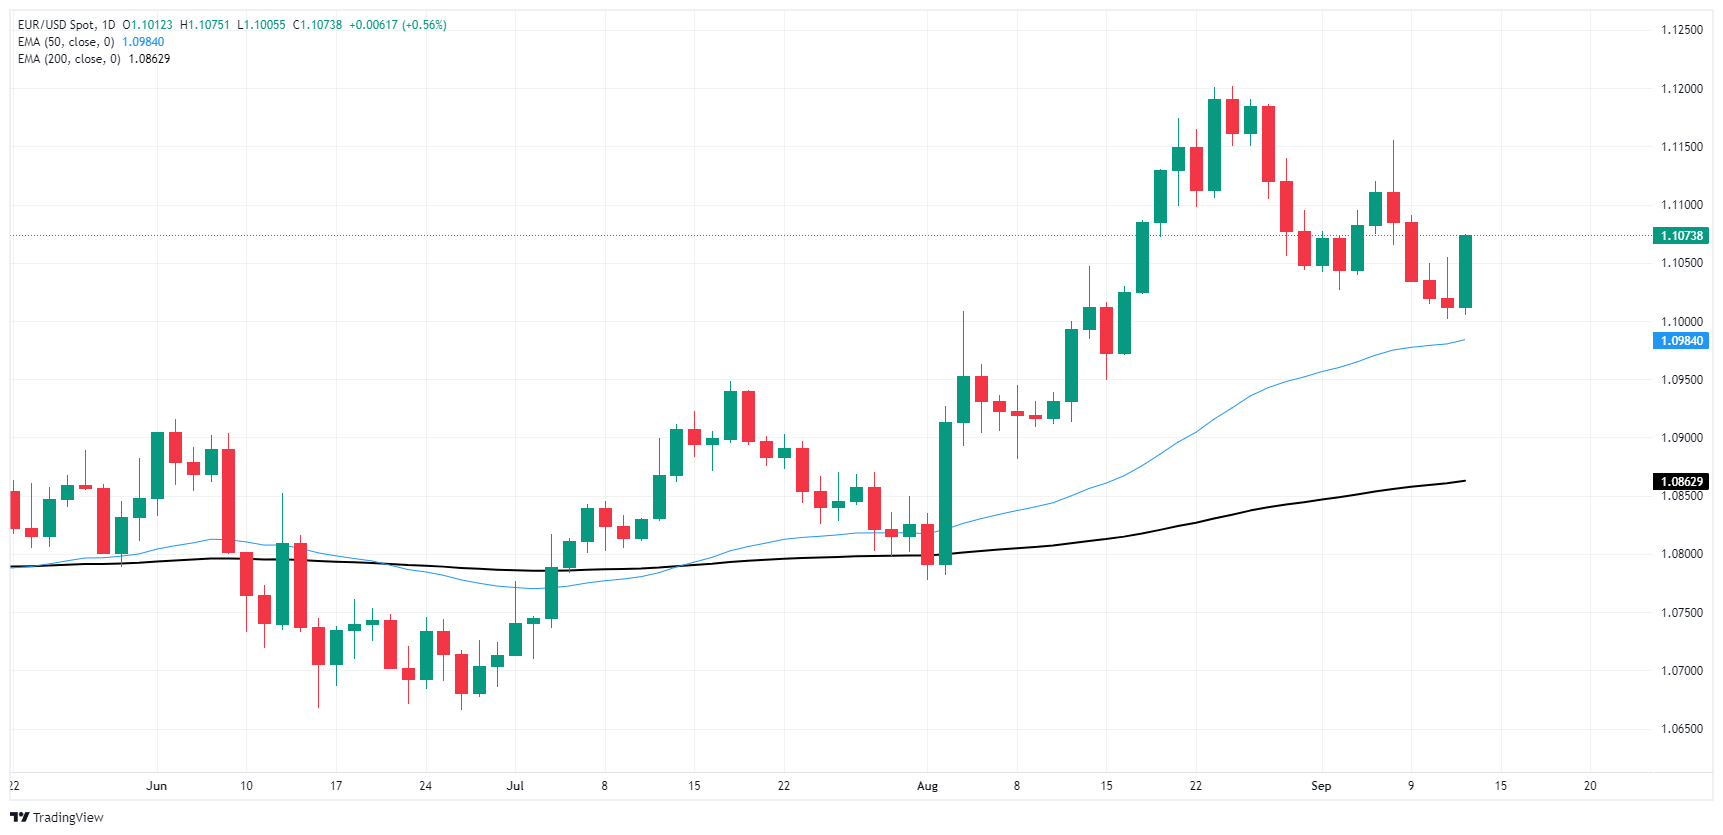
Euro FAQs
The Euro is the currency for the 20 European Union countries that belong to the Eurozone. It is the second most heavily traded currency in the world behind the US Dollar. In 2022, it accounted for 31% of all foreign exchange transactions, with an average daily turnover of over $2.2 trillion a day. EUR/USD is the most heavily traded currency pair in the world, accounting for an estimated 30% off all transactions, followed by EUR/JPY (4%), EUR/GBP (3%) and EUR/AUD (2%).
The European Central Bank (ECB) in Frankfurt, Germany, is the reserve bank for the Eurozone. The ECB sets interest rates and manages monetary policy. The ECB’s primary mandate is to maintain price stability, which means either controlling inflation or stimulating growth. Its primary tool is the raising or lowering of interest rates. Relatively high interest rates – or the expectation of higher rates – will usually benefit the Euro and vice versa. The ECB Governing Council makes monetary policy decisions at meetings held eight times a year. Decisions are made by heads of the Eurozone national banks and six permanent members, including the President of the ECB, Christine Lagarde.
Eurozone inflation data, measured by the Harmonized Index of Consumer Prices (HICP), is an important econometric for the Euro. If inflation rises more than expected, especially if above the ECB’s 2% target, it obliges the ECB to raise interest rates to bring it back under control. Relatively high interest rates compared to its counterparts will usually benefit the Euro, as it makes the region more attractive as a place for global investors to park their money.
Data releases gauge the health of the economy and can impact on the Euro. Indicators such as GDP, Manufacturing and Services PMIs, employment, and consumer sentiment surveys can all influence the direction of the single currency. A strong economy is good for the Euro. Not only does it attract more foreign investment but it may encourage the ECB to put up interest rates, which will directly strengthen the Euro. Otherwise, if economic data is weak, the Euro is likely to fall. Economic data for the four largest economies in the euro area (Germany, France, Italy and Spain) are especially significant, as they account for 75% of the Eurozone’s economy.
Another significant data release for the Euro is the Trade Balance. This indicator measures the difference between what a country earns from its exports and what it spends on imports over a given period. If a country produces highly sought after exports then its currency will gain in value purely from the extra demand created from foreign buyers seeking to purchase these goods. Therefore, a positive net Trade Balance strengthens a currency and vice versa for a negative balance.
- NZD/USD rose by 0.70% on Thursday to 0.6180.
- The RSI is in positive territory with a rising slope, suggesting that buying pressure is increasing
- If the bulls secure the 20-day SMA at 0.6185, it could confirm a recovery of the buying traction.
In Thursday's session, the New Zealand Dollar appreciated against its US counterpart, recovering from the previous session's decline. The NZD/USD pair moved up by 0.75% to a high of 0.6180, as the bulls took control of the market.
The Relative Strength Index (RSI) is currently at 55, which is in positive territory and has a rising slope, suggesting that the bulls are gaining momentum. The Moving Average Convergence Divergence (MACD) printed decreasing red bars, a sign of a potential reversal in the bearish momentum. This is aligned with the recent price action, which shows the bulls are pushing back.
NZD/USD daily chart
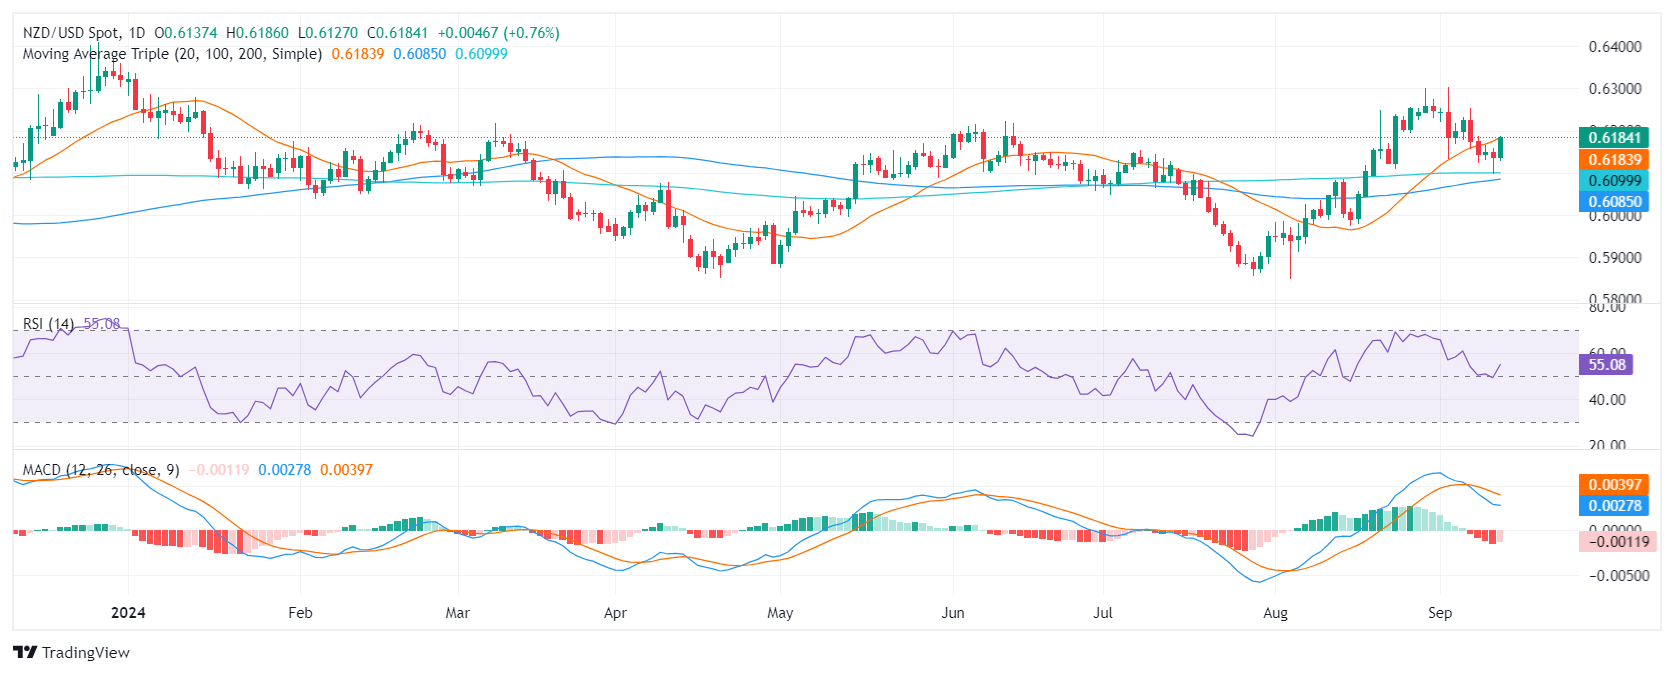
Key support levels to watch are 0.6120, 0.6140, and 0.6160, while resistance levels are 0.6185 (20-day Simple Moving Average), 0.6210, and 0.6230. A consolidation above the 0.6200 would put the pair back above the 20,100 and 200-days SMA which could trigger additional upwards movements.
- GBP/USD climbed back over 1.3100 after mid-week slump into 1.3000.
- US PPI inflation figures didn’t spark significant moves, but kept Fed rate cut hopes pinned.
- Market’s see an overwhelming likelihood of a quarter-point Fed cut next week.
GBP/USD turned higher on Thursday, rising back above the 1.3100 handle after the Greenback went limp amid a broad-market uptick in risk-on market sentiment. US Producer Price Index (PPI) inflation data wrapped around median market estimates, failing to deliver a concise picture of US price growth factors, but still kept market expectations of an impending Federal Reserve (Fed) rate cut keel-side down.
Forex Today: An impasse is likely ahead of the FOMC meeting
Friday will deliver only mid-tier Consumer Inflation Expectations from the UK side, while US markets will be looking out for another print of the US Michigan Consumer Sentiment Index for September. Markets will be looking for one last improvement in the key consumer outlook survey before heading into next week’s looming Fed rate call.
US PPI rose to 0.2% MoM in August, with core PPI accelerating to 0.3% MoM. Headline PPI was forecast to rise to 0.1% from the previous 0.0%, while core PPI was expected to rise to 0.2% from July’s -0.2% contraction. Despite the near-term upswing, annualized PPI inflation figures were much more attractive to investors, with YoY headline PPI easing to 1.7% from the previous period’s revised 2.1%, and ticking below the expected 1.8%. Core annualized PPI also beat the expected print, holding steady at 2.4% YoY versus the expected 2.5% uptick.
US Initial Jobless Claims also rose slightly higher for the week ended September 6, increasing to the expected 230K from the previous week’s revised 228K.
With PPI inflation remaining tame and the number of unemployment benefits seekers holding firmly in tepid territory, little lies in the way of a first rate cut from the Federal Reserve (Fed) on September 18. The Fed is broadly expected to deliver a 25 bps cut to kick off 2024’s late-starting rate cut cycle. According to the CME’s FedWatch Tool, rate markets are pricing in over 80% odds of the Fed cutting by a quarter point next week, with a slim 20% still leaning into hopes for an initial double-cut for 50 bps. Rate traders also overwhelmingly expect the Fed to deliver four cuts in total, with December’s rate call expected to land between 425 and 450 bps.
Economic Indicator
Producer Price Index ex Food & Energy (YoY)
The Producer Price Index ex Food & energy released by the Bureau of Labor statistics, Department of Labor measures the average changes in prices in primary markets of the US by producers of commodities in all states of processing. Those volatile products such as food and energy are excluded in order to capture an accurate calculation. Generally speaking, a high reading is seen as positive (or bullish) for the USD, whereas a low reading is seen as negative (or bearish).
Read more.Last release: Thu Sep 12, 2024 12:30
Frequency: Monthly
Actual: 2.4%
Consensus: 2.5%
Previous: 2.4%
Source: US Bureau of Labor Statistics
GBP/USD price forecast
GBP/USD took advantage of the Greenback’s Thursday weakness, climbing back above the 1.3100 handle after dipping below the key figure earlier this week. Cable staunched the bleed in the mid-week, bounding just north of the 1.3000 round figure.
Price action continues to lean firmly into the bullish side, with bids trading well above the 50-day Exponential Moving Average (EMA) at 1.2970. Short pressure has still kept bidding below recent multi-year highs just north of 1.3250, however an extended decline to the 200-day EEMA at 1.2757 is looking increasingly unlikely.
GBP/USD daily chart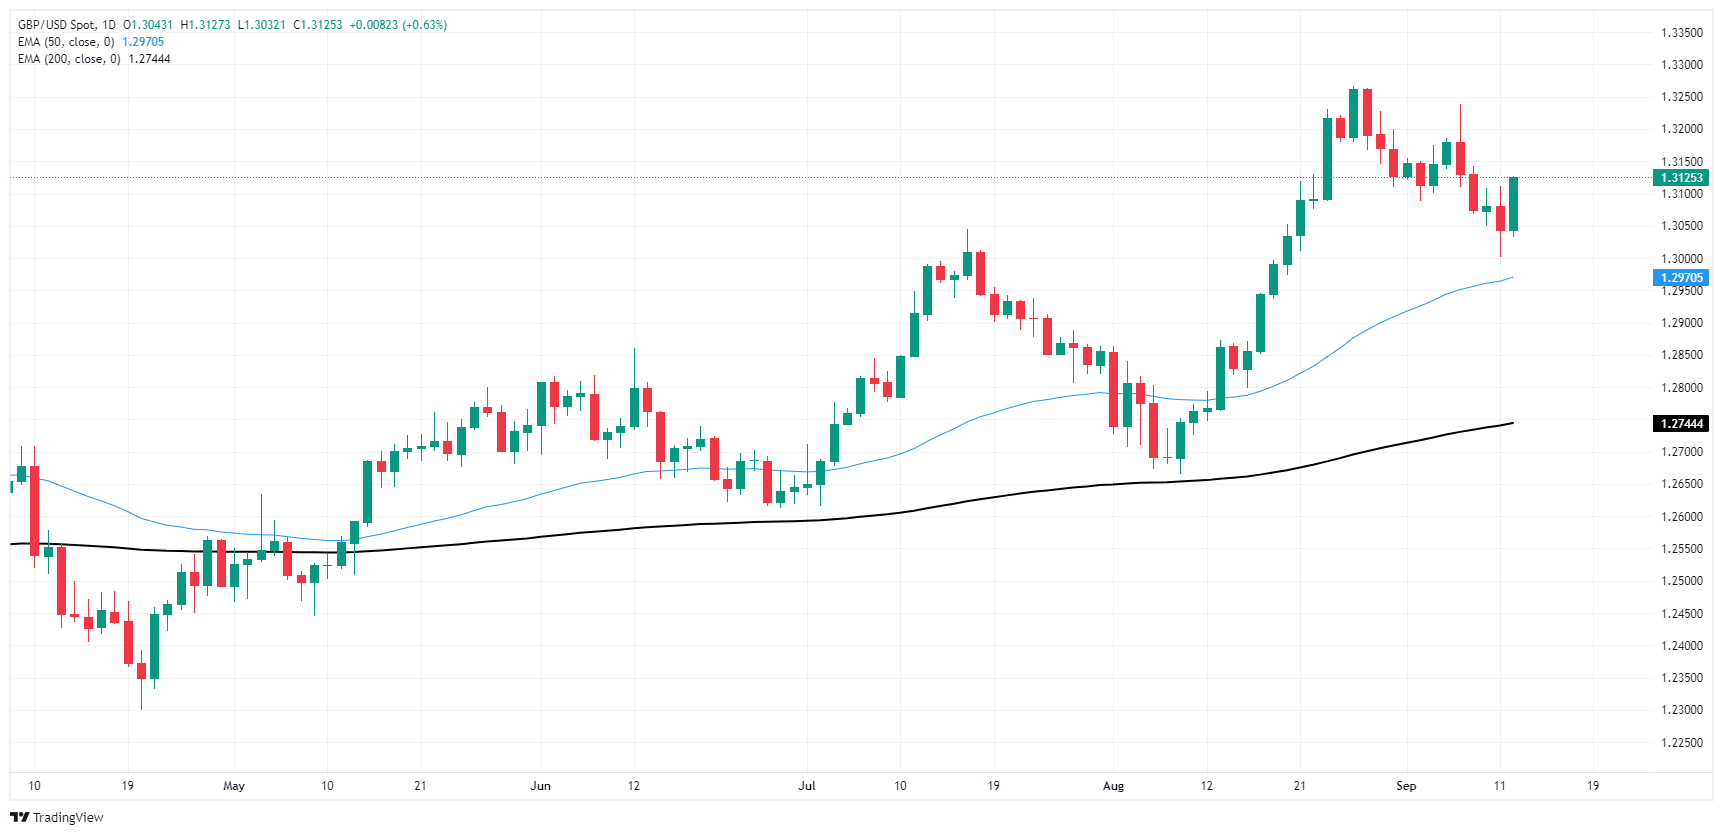
Pound Sterling FAQs
The Pound Sterling (GBP) is the oldest currency in the world (886 AD) and the official currency of the United Kingdom. It is the fourth most traded unit for foreign exchange (FX) in the world, accounting for 12% of all transactions, averaging $630 billion a day, according to 2022 data. Its key trading pairs are GBP/USD, aka ‘Cable’, which accounts for 11% of FX, GBP/JPY, or the ‘Dragon’ as it is known by traders (3%), and EUR/GBP (2%). The Pound Sterling is issued by the Bank of England (BoE).
The single most important factor influencing the value of the Pound Sterling is monetary policy decided by the Bank of England. The BoE bases its decisions on whether it has achieved its primary goal of “price stability” – a steady inflation rate of around 2%. Its primary tool for achieving this is the adjustment of interest rates. When inflation is too high, the BoE will try to rein it in by raising interest rates, making it more expensive for people and businesses to access credit. This is generally positive for GBP, as higher interest rates make the UK a more attractive place for global investors to park their money. When inflation falls too low it is a sign economic growth is slowing. In this scenario, the BoE will consider lowering interest rates to cheapen credit so businesses will borrow more to invest in growth-generating projects.
Data releases gauge the health of the economy and can impact the value of the Pound Sterling. Indicators such as GDP, Manufacturing and Services PMIs, and employment can all influence the direction of the GBP. A strong economy is good for Sterling. Not only does it attract more foreign investment but it may encourage the BoE to put up interest rates, which will directly strengthen GBP. Otherwise, if economic data is weak, the Pound Sterling is likely to fall.
Another significant data release for the Pound Sterling is the Trade Balance. This indicator measures the difference between what a country earns from its exports and what it spends on imports over a given period. If a country produces highly sought-after exports, its currency will benefit purely from the extra demand created from foreign buyers seeking to purchase these goods. Therefore, a positive net Trade Balance strengthens a currency and vice versa for a negative balance.
- The NZD/JPY pair has been trading sideways, with a slight downward bias, over the last sessions.
- The RSI is in the negative area, but the slope is rising, suggesting that buying pressure is recovering.
Thursday's session saw the NZD/JPY pair rise by 0.50% to 87.70. Despite the uptick, the pair has been trading sideways, with a slight downward bias, over the last sessions. The overall technical outlook is mixed, and the pair is likely to continue trading sideways in the near term.
The RSI is currently at 37, which is in the negative area. However, the slope of the RSI is rising sharply, which suggests that buying pressure is recovering. The MACD histogram is currently flat and red, which suggests that selling pressure is flat. The overall outlook for the NZD/JPY is mixed, and the pair is likely to continue trading sideways in the near term.
NZD/JPY daily chart
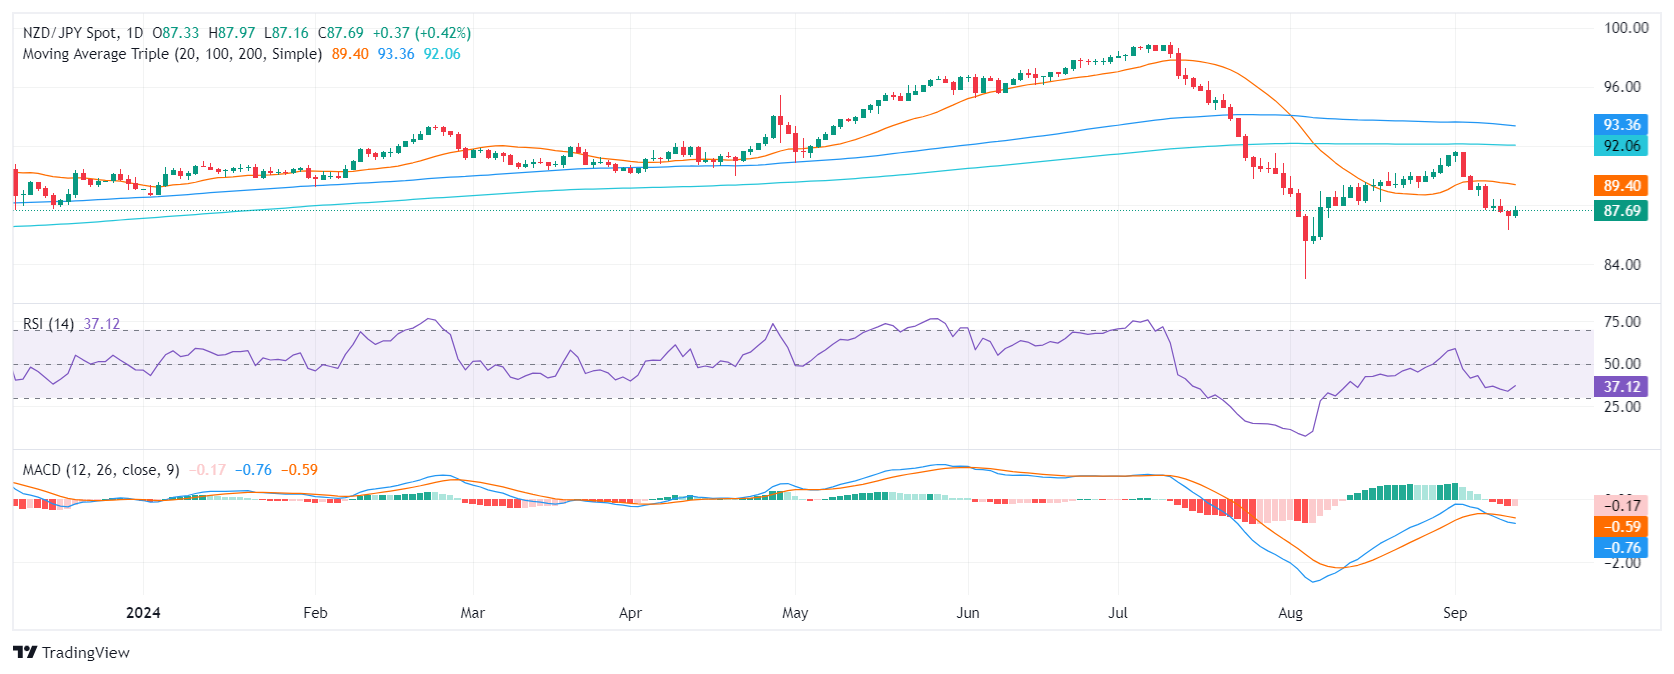
Supports to the downside are located at 87.00, 86.00, and 85.00, while resistances are seen at 88.00, 89.00, and 90.00.
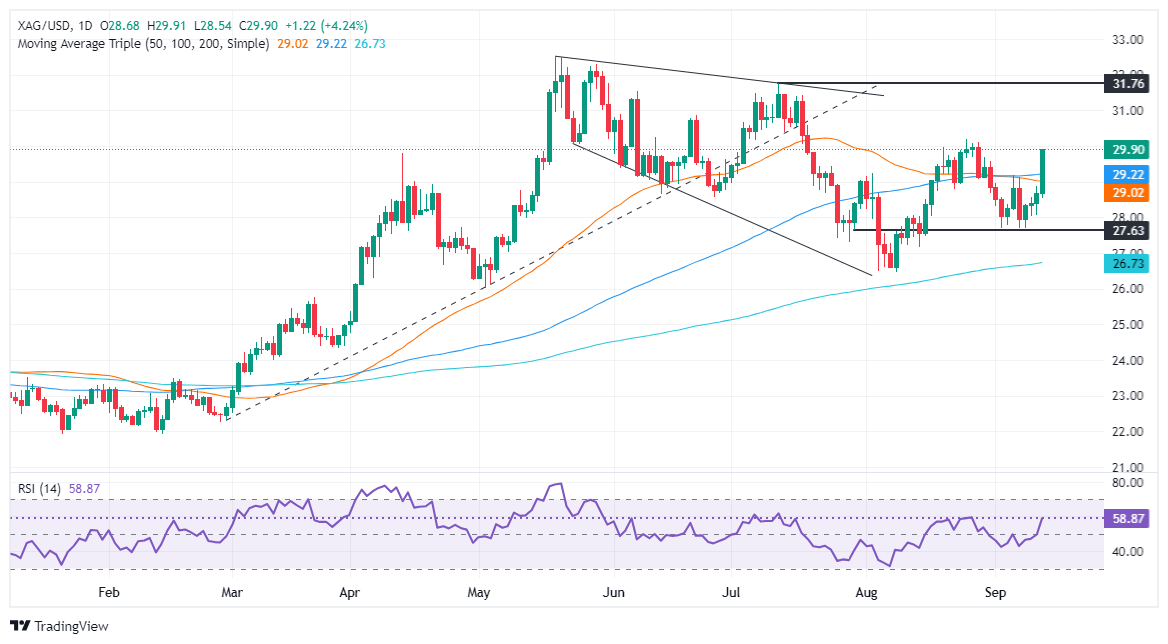
- Silver breaks above the 50-DMA at $28.99 and 100-DMA at $29.20, supported by a bullish ‘double bottom’ formation.
- RSI signals strong momentum, with first resistance at $30.00, followed by targets at $30.18 and $30.84.
- A drop below $29.00 could signal a bearish shift, with key support at this level.
Silver's price rallied sharply on Thursday and gained over 4.30% during the day, trading at $29.90 after bouncing off daily lows of $28.54. The grey metal climbed due to overall US Dollar weakness, even though inflation slightly increased. Nevertheless, a bad jobs report sponsored Silver’s leg up.
XAG/USD Price Forecast: Technical outlook
From a technical standpoint, a ‘double bottom’ formation sponsored the non-yielding advance, clearing on its way north, key resistance at the 50-day moving average (DMA) at 28.99, and the 100-DMA at 29.20.
Momentum is bullish, as portrayed by the Relative Strength Index (RSI). Hence, XAG/USD’s path of least resistance is tilted to the upside.
Silver’s first resistance would be $30.00. A breach of the latter will expose the August 26 high at 30.18, followed by the Jun 21 peak at $30.84. If surpassed the next stop would be the July 11 high at $31.75.
If bears would like a bearish resumption, they need to drive prices below the $29.00 figure.
XAG/USD Price Action – Daily Chart
Silver FAQs
Silver is a precious metal highly traded among investors. It has been historically used as a store of value and a medium of exchange. Although less popular than Gold, traders may turn to Silver to diversify their investment portfolio, for its intrinsic value or as a potential hedge during high-inflation periods. Investors can buy physical Silver, in coins or in bars, or trade it through vehicles such as Exchange Traded Funds, which track its price on international markets.
Silver prices can move due to a wide range of factors. Geopolitical instability or fears of a deep recession can make Silver price escalate due to its safe-haven status, although to a lesser extent than Gold's. As a yieldless asset, Silver tends to rise with lower interest rates. Its moves also depend on how the US Dollar (USD) behaves as the asset is priced in dollars (XAG/USD). A strong Dollar tends to keep the price of Silver at bay, whereas a weaker Dollar is likely to propel prices up. Other factors such as investment demand, mining supply – Silver is much more abundant than Gold – and recycling rates can also affect prices.
Silver is widely used in industry, particularly in sectors such as electronics or solar energy, as it has one of the highest electric conductivity of all metals – more than Copper and Gold. A surge in demand can increase prices, while a decline tends to lower them. Dynamics in the US, Chinese and Indian economies can also contribute to price swings: for the US and particularly China, their big industrial sectors use Silver in various processes; in India, consumers’ demand for the precious metal for jewellery also plays a key role in setting prices.
Silver prices tend to follow Gold's moves. When Gold prices rise, Silver typically follows suit, as their status as safe-haven assets is similar. The Gold/Silver ratio, which shows the number of ounces of Silver needed to equal the value of one ounce of Gold, may help to determine the relative valuation between both metals. Some investors may consider a high ratio as an indicator that Silver is undervalued, or Gold is overvalued. On the contrary, a low ratio might suggest that Gold is undervalued relative to Silver.
- AUD/USD falls after US inflation data eases, suggesting a slower pace of consumer spending.
- PPI growth slows in the US with headline PPI rising by 1.7% annually and core PPI by 2.4%, below expectations.
- RBA rate hike concerns weigh on AUD, experts discuss a possible policy-easing pivot.
The AUD/USD fell on Thursday after the release of US inflation data, which eased concerns about a faster pace of consumer spending. Producer Price Index (PPI) growth slowed in the US, which weighed on the USD.
Despite the uncertain economic outlook in Australia, the Reserve Bank of Australia (RBA) remains cautious due to persistent inflation. As a result, financial markets anticipate a modest interest rate cut of only 0.25% in 2024. This conservative stance reflects both the ongoing inflationary pressure and the central bank's commitment to maintaining financial stability.
Daily digest market movers: Australian Dollar declines on US inflation data, RBA concerns
- PPI report shows slower annual headline PPI growth of 1.7% (vs. estimates of 1.8%).
- Core producer inflation rises by 2.4%, below expectations of 2.5%.
- Slower producer inflation suggests sluggish consumer spending, prompting Fed interest rate cut bets.
- On the other hand, the AUD struggles due to concerns over Australian economic growth.
- In addition, high RBA interest rates raise worries over recessionary risks.
- Former RBA Governor Bernie Fraser calls for an Official Cash Rate (OCR) reduction to avoid severe employment consequences. He also criticized the bank for prioritizing inflation over labor market concerns.
AUD/USD technical outlook: Mixed momentum with signs of bullish recovery
The AUD/USD pair is currently trading within a well-defined range, indicating mixed market sentiment. The Relative Strength Index (RSI) has recently entered positive territory and is rising sharply, suggesting that buying pressure is increasing.
However, the Moving Average Convergence Divergence (MACD) is showing a decreasing red histogram, indicating that selling pressure is still present. The overall outlook is mixed with both bullish and bearish signals present.
Australian Dollar FAQs
One of the most significant factors for the Australian Dollar (AUD) is the level of interest rates set by the Reserve Bank of Australia (RBA). Because Australia is a resource-rich country another key driver is the price of its biggest export, Iron Ore. The health of the Chinese economy, its largest trading partner, is a factor, as well as inflation in Australia, its growth rate and Trade Balance. Market sentiment – whether investors are taking on more risky assets (risk-on) or seeking safe-havens (risk-off) – is also a factor, with risk-on positive for AUD.
The Reserve Bank of Australia (RBA) influences the Australian Dollar (AUD) by setting the level of interest rates that Australian banks can lend to each other. This influences the level of interest rates in the economy as a whole. The main goal of the RBA is to maintain a stable inflation rate of 2-3% by adjusting interest rates up or down. Relatively high interest rates compared to other major central banks support the AUD, and the opposite for relatively low. The RBA can also use quantitative easing and tightening to influence credit conditions, with the former AUD-negative and the latter AUD-positive.
China is Australia’s largest trading partner so the health of the Chinese economy is a major influence on the value of the Australian Dollar (AUD). When the Chinese economy is doing well it purchases more raw materials, goods and services from Australia, lifting demand for the AUD, and pushing up its value. The opposite is the case when the Chinese economy is not growing as fast as expected. Positive or negative surprises in Chinese growth data, therefore, often have a direct impact on the Australian Dollar and its pairs.
Iron Ore is Australia’s largest export, accounting for $118 billion a year according to data from 2021, with China as its primary destination. The price of Iron Ore, therefore, can be a driver of the Australian Dollar. Generally, if the price of Iron Ore rises, AUD also goes up, as aggregate demand for the currency increases. The opposite is the case if the price of Iron Ore falls. Higher Iron Ore prices also tend to result in a greater likelihood of a positive Trade Balance for Australia, which is also positive of the AUD.
The Trade Balance, which is the difference between what a country earns from its exports versus what it pays for its imports, is another factor that can influence the value of the Australian Dollar. If Australia produces highly sought after exports, then its currency will gain in value purely from the surplus demand created from foreign buyers seeking to purchase its exports versus what it spends to purchase imports. Therefore, a positive net Trade Balance strengthens the AUD, with the opposite effect if the Trade Balance is negative.
- The Canadian Dollar is strung across familiar chart territory on Thursday.
- Low-tier data from Canada gets swamped out by US PPI inflation figures.
- Markets are broadly pivoting toward the countdown to a Fed rate cut next week.
The Canadian Dollar (CAD) struggled to find room on the topside on Thursday, broadly easing back across the major currency boards, and unable to gain ground against the also-soft Greenback. US Producer Price Index (PPI) didn’t really deliver a thunderous inflation print in either direction, but mixed headline price figures helped keep broad-market hopes for a September rate cut afloat.
Canada continues to deliver low-tier, low-impact economic figures that get swamped out by more important data: anything that will confirm or threaten a Federal Reserve (Fed) rate cut expected on September 18.
Daily digest market movers
- The Canadian Dollar fell to the bottom as the market’s weakest-performing major currency on Thursday.
- Canadian Building Permits rebounded to 22.1% Mom in July, reversing the previous month’s -13% revised contraction, but the figure did little to galvanize CAD bidders.
- US PPI rose to 0.2% MoM in August, with core PPI accelerating to 0.3% MoM.
- Headline PPI was forecast to rise to 0.1% from the previous 0.0%, while core PPI was expected to rise to 0.2% from July’s -0.2% contraction.
- The Fed is widely expected to deliver an initial 25 bps rate cut next week, with markets pricing in another 75-100 bps by the end of the year.
Canadian Dollar price forecast
The Canadian Dollar (CAD) lost ground against all of its major currency peers on Thursday, tumbling back across the board and struggling to pump the brakes on a recent swing low against the US Dollar. USD/CAD is drifting in the middle of near-term technical congestion just south of the 200-day Exponential Moving Average (EMA) at 1.3623.
Price action continues to be vexed by the 1.3600 handle, and despite a 3.63% rally against the Greenback that dragged the pair down to 1.3440, USD/CAD is bitterly entrenched in a Greenback recovery zone as markets head into the pre-Fed slowdown with 2024’s first rate call on the block for next week.
USD/CAD daily chart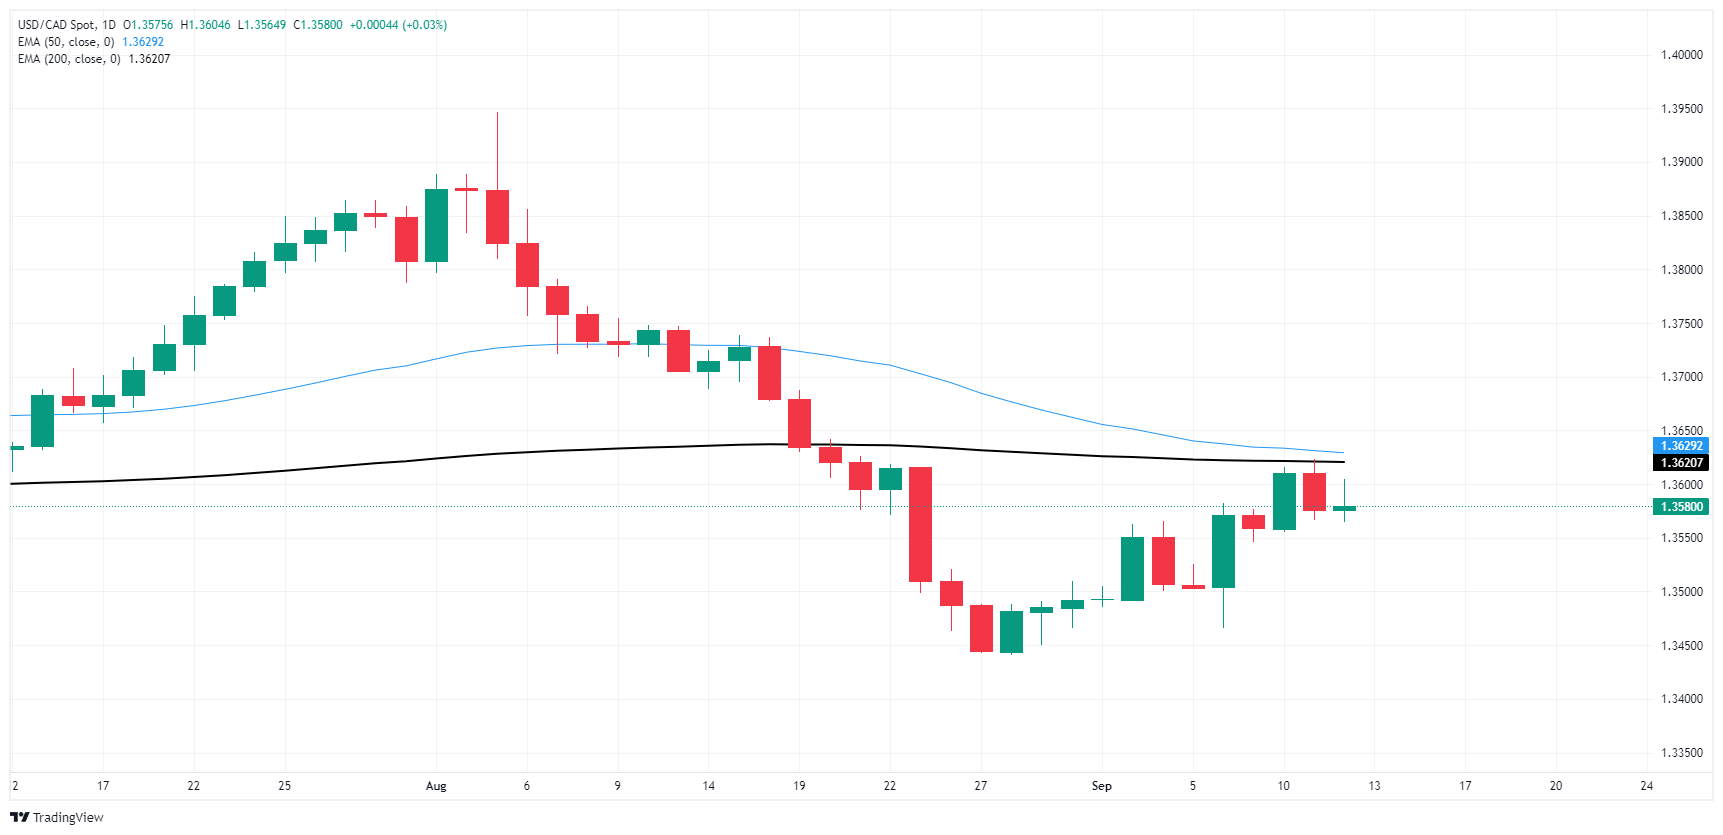
Canadian Dollar FAQs
The key factors driving the Canadian Dollar (CAD) are the level of interest rates set by the Bank of Canada (BoC), the price of Oil, Canada’s largest export, the health of its economy, inflation and the Trade Balance, which is the difference between the value of Canada’s exports versus its imports. Other factors include market sentiment – whether investors are taking on more risky assets (risk-on) or seeking safe-havens (risk-off) – with risk-on being CAD-positive. As its largest trading partner, the health of the US economy is also a key factor influencing the Canadian Dollar.
The Bank of Canada (BoC) has a significant influence on the Canadian Dollar by setting the level of interest rates that banks can lend to one another. This influences the level of interest rates for everyone. The main goal of the BoC is to maintain inflation at 1-3% by adjusting interest rates up or down. Relatively higher interest rates tend to be positive for the CAD. The Bank of Canada can also use quantitative easing and tightening to influence credit conditions, with the former CAD-negative and the latter CAD-positive.
The price of Oil is a key factor impacting the value of the Canadian Dollar. Petroleum is Canada’s biggest export, so Oil price tends to have an immediate impact on the CAD value. Generally, if Oil price rises CAD also goes up, as aggregate demand for the currency increases. The opposite is the case if the price of Oil falls. Higher Oil prices also tend to result in a greater likelihood of a positive Trade Balance, which is also supportive of the CAD.
While inflation had always traditionally been thought of as a negative factor for a currency since it lowers the value of money, the opposite has actually been the case in modern times with the relaxation of cross-border capital controls. Higher inflation tends to lead central banks to put up interest rates which attracts more capital inflows from global investors seeking a lucrative place to keep their money. This increases demand for the local currency, which in Canada’s case is the Canadian Dollar.
Macroeconomic data releases gauge the health of the economy and can have an impact on the Canadian Dollar. Indicators such as GDP, Manufacturing and Services PMIs, employment, and consumer sentiment surveys can all influence the direction of the CAD. A strong economy is good for the Canadian Dollar. Not only does it attract more foreign investment but it may encourage the Bank of Canada to put up interest rates, leading to a stronger currency. If economic data is weak, however, the CAD is likely to fall.
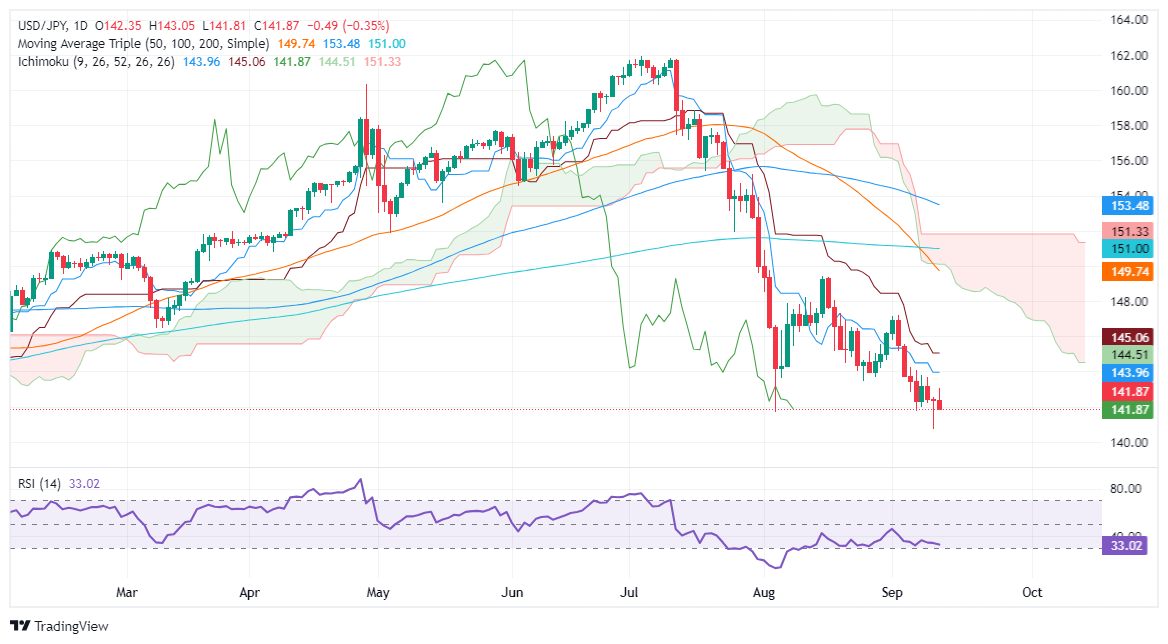
- USD/JPY remains downward biased, with a daily close below 142.00 signaling potential for further losses toward 140.71 and 140.25.
- Bears maintain control as RSI stays flat, indicating consolidation before the next move.
- On an upward correction, resistance lies at 142.00, followed by 143.04 and key levels at 143.96 (Tenkan-Sen) and 144.50 (Senkou Span A).
The USD/JPY fell from around 143.00 peak and lost over 0.28% due to mixed economic data from the United States (US), bolstering the odds for the Federal Reserve’s first rate cut next week. At the time of writing, the pair trades at 141.96.
USD/JPY Price Forecast: Technical outlook
The USD/JPY remains downward biased, but after Wednesday's long tail, it could face an upward correction and test key resistance levels.
Despite that, bears remain in charge as the Relative Strength Index (RSI) shows, though a flat slope, hints that consolidation lies ahead.
If USD/JPY achieves a daily close below 142.00, traders could drag prices toward the September 11 trough at 140.71. If cleared, the next stop would be December 28, 2023, with a cycle low of 140.25, ahead of 140.00.
On further strength, the first resistance would be the 142.00 mark. If hurdled, the next stop would be the September 12 high at 143.04, followed by the Tenkan-Sen at 143.96 and Senkou Span A at 144.50.
USD/JPY Price Action – Daily Chart
Japanese Yen FAQs
The Japanese Yen (JPY) is one of the world’s most traded currencies. Its value is broadly determined by the performance of the Japanese economy, but more specifically by the Bank of Japan’s policy, the differential between Japanese and US bond yields, or risk sentiment among traders, among other factors.
One of the Bank of Japan’s mandates is currency control, so its moves are key for the Yen. The BoJ has directly intervened in currency markets sometimes, generally to lower the value of the Yen, although it refrains from doing it often due to political concerns of its main trading partners. The current BoJ ultra-loose monetary policy, based on massive stimulus to the economy, has caused the Yen to depreciate against its main currency peers. This process has exacerbated more recently due to an increasing policy divergence between the Bank of Japan and other main central banks, which have opted to increase interest rates sharply to fight decades-high levels of inflation.
The BoJ’s stance of sticking to ultra-loose monetary policy has led to a widening policy divergence with other central banks, particularly with the US Federal Reserve. This supports a widening of the differential between the 10-year US and Japanese bonds, which favors the US Dollar against the Japanese Yen.
The Japanese Yen is often seen as a safe-haven investment. This means that in times of market stress, investors are more likely to put their money in the Japanese currency due to its supposed reliability and stability. Turbulent times are likely to strengthen the Yen’s value against other currencies seen as more risky to invest in.
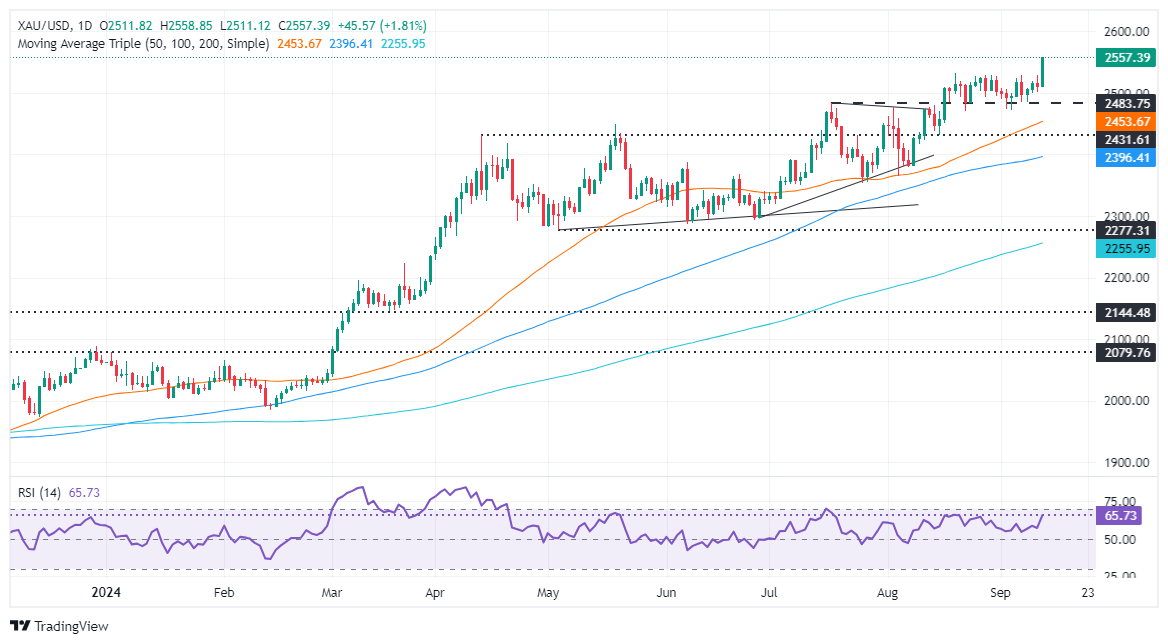
- Gold hits new all-time high as US jobless claims and producer inflation data reinforce a likely Fed rate cut.
- US Dollar Index (DXY) falls 0.29%, while US Treasury yields rise, with the 10-year T-note at 3.689%.
- CME FedWatch Tool shows an 85% chance of a 25 bps Fed rate cut, further boosting Gold’s appeal in a low-rate environment.
Gold price rallied to new all-time highs above $2,550 after US data reinforced that the US Federal Reserve (Fed) would likely lower interest rates next week. At the time of writing, the XAU/USD trades at $2,552 after bouncing off a daily low of $2,511 to gain 1.67%.
Sentiment is upbeat as Wall Street posts gains. The US Labor Department revealed that Initial Jobless Claims for the week ending September 7 rose as expected, increasing above the previous week’s reading. Other data showed that prices paid by producers, known as factory inflation, rose above estimates due to higher costs in services.
After the data, the US Dollar Index (DXY), which tracks the buck’s performance against its peers, dived to a daily low of 101.44 and lost 0.29%. On the contrary, US Treasury yields rose, with the 10-year T-note gaining three and a half basis points (bps) and sitting at 3.689%.
A source quoted by Reuters noted, “We are headed towards a lower interest rate environment, so gold is becoming a lot more attractive... I think we could potentially have a lot more frequent cuts as opposed to a bigger magnitude.”
The CME FedWatch Tool shows that market participants are pricing an 85% chance of the Fed lowering rates by 25 basis points and a 15% odds of a 50 bps cut.
Besides US data fueling expectations for the Fed’s first cut, the European Central Bank (ECB) lowering rates by a quarter of a percentage point sponsored a rally on the EUR/USD and weighed on the Greenback’s value.
Bullion traders will examine the Consumer Sentiment survey released by the University of Michigan on Friday.
Daily digest market moves: Gold price surges post US jobs and inflation data
- Bureau of Labor Statistics (BLS) revealed that Initial Jobless Claims for the week ending September 7 rose 230K as expected, up from 228K on the previous number.
- August's Producer Price Index (PPI) rose by 1.7% YoY, slightly below estimates of 1.8%, while core PPI increased from 2.3% to 2.4%, below expectations of 2.5%.
- Monthly, headline and core PPI increased compared to the previous month's reading. Headline PPI expanded by 0.2%, exceeding the 0.1% forecast, and core PPI rose by 0.3%, up from 0.2%.
- Today’s data and Wednesday’s Consumer Price Index (CPI) have cemented a 25 bps rate cut, sponsoring Gold’s rally ahead of the Fed’s meeting.
- Data from the Chicago Board of Trade suggests the Fed will cut at least 98 basis points this year, down from 108 a day ago, according to the fed funds rate futures contract for December 2024.
Technical outlook: Gold price clings to $2,500 despite posting losses
Gold prices skyrocketed to new all-time highs (ATH), clearing on its way north the previous ATH at $2,531 and the $2,550 figure. Momentum accelerated to the upside despite the inverse correlation between bullion prices and US Treasury yields breaking during the day.
If XAU/USD extends its uptrend, the next resistance would be the psychological key levels like the $2,575 mark, followed by the $2,600 figure.
For a pullback, sellers must clear $2,550, followed by the August 20 high at $2,531 before aiming toward $2,500. On further weakness, the next support would be the August 22 low at $2,470, followed by the May 20 peak at $2,450.
Gold FAQs
Gold has played a key role in human’s history as it has been widely used as a store of value and medium of exchange. Currently, apart from its shine and usage for jewelry, the precious metal is widely seen as a safe-haven asset, meaning that it is considered a good investment during turbulent times. Gold is also widely seen as a hedge against inflation and against depreciating currencies as it doesn’t rely on any specific issuer or government.
Central banks are the biggest Gold holders. In their aim to support their currencies in turbulent times, central banks tend to diversify their reserves and buy Gold to improve the perceived strength of the economy and the currency. High Gold reserves can be a source of trust for a country’s solvency. Central banks added 1,136 tonnes of Gold worth around $70 billion to their reserves in 2022, according to data from the World Gold Council. This is the highest yearly purchase since records began. Central banks from emerging economies such as China, India and Turkey are quickly increasing their Gold reserves.
Gold has an inverse correlation with the US Dollar and US Treasuries, which are both major reserve and safe-haven assets. When the Dollar depreciates, Gold tends to rise, enabling investors and central banks to diversify their assets in turbulent times. Gold is also inversely correlated with risk assets. A rally in the stock market tends to weaken Gold price, while sell-offs in riskier markets tend to favor the precious metal.
The price can move due to a wide range of factors. Geopolitical instability or fears of a deep recession can quickly make Gold price escalate due to its safe-haven status. As a yield-less asset, Gold tends to rise with lower interest rates, while higher cost of money usually weighs down on the yellow metal. Still, most moves depend on how the US Dollar (USD) behaves as the asset is priced in dollars (XAU/USD). A strong Dollar tends to keep the price of Gold controlled, whereas a weaker Dollar is likely to push Gold prices up.
The Greenback came under renewed downside pressure following further cooling of the US labour market as well as extra signs that disinflationary pressures remained far from abated in August, this time via Producer Prices. Those readings seem to have cemented investors’ prospects of a rate cut by the Fed at its meeting next week.
Here is what you need to know on Friday, September 13:
The US Dollar Index (DXY) halted a four-day positive streak on the back of the resurgence of the downward bias in response to soft US data. Import and Export Prices are due on September 13, seconded by the preliminary Michigan Consumer Sentiment gauge.
EUR/USD finally saw some signs of life and regained composure following four straight days of losses. The Industrial Production in the broader euro bloc will be published on September 13 ahead of the Eurogroup Meeting and the speech by the ECB’s C. Lagarde.
GBP/USD regained the smile and trespassed the 1.3100 barrier following further selling pressure in the Greenback. The next risk event on the UK docket will be the release of the Inflation Rate on September 18.
USD/JPY extended its weekly leg lower and revisited once again the area below the 142.00 support on the back of higher yields and the daily pullback in the Greenback. The final Industrial Production prints are due on September 11, along with Capacity Utilization.
AUD/USD advanced to weekly tops and left behind the 0.6700 hurdle following the intense buying interest in the risk-linked assets. The Westpac Leading Index is expected on September 18.
Prices of WTI added to Wednesday’s recovery and approached the key $70.00 mark per barrel on the back of supply concerns before Hurricane Francine’s landfall.
Gold prices clinched an all-time top around $2,555 per ounce troy in response to the weaker US Dollar and expectations of the Fed's easing. Silver rallied to two-week highs, trading at shouting distance from the key $30.00 mark per ounce.
- Weak labor data led to a decline in the US Dollar during Thursday session.
- Initial Jobless Claims remained at 230K, indicating a persistent labor market.
- PPI fell short of expectations, signaling a potential easing of inflation, which also added to the USD’s downside.
The US Dollar Index, which measures the value of the USD against a basket of six currencies, is posting daily losses after soft labor and inflation data.
Despite positive economic indicators, current market valuations may be overly optimistic. Recent data reveals that the US economy remains robust, expanding at a rate exceeding expectations.
Daily digest market movers: DXY down after inflation and labor data
- The US Dollar declined against its major rivals amid dovish signals from the latest US labor market and inflation reports.
- Initial Jobless Claims, a proxy for layoffs in the US, increased to 230K in the week ended September 7, matching estimates and slightly above the prior week's upwardly revised 228K.
- The advance seasonally-adjusted insured unemployment rate remained unchanged at 1.2%, and the 4-week moving average rose to 230.75K.
- The Producer Price Index (PPI) for final demand in the US rose 2.2% YoY in July, below the 2.3% market forecast and the previous 2.7% increase.
- The annual core PPI rose 2.4%, missing the 2.7% consensus estimate. On a monthly basis, the PPI increased 0.1%, while the core PPI remained flat.
- The CME FedWatch tool indicates a 13% probability of the Fed cutting interest rates by 50 basis points in September, unchanged from before the PPI release.
- These reports suggest that the US labor market remains resilient despite economic headwinds, while inflation pressures may be moderating, supporting the Fed's dovish stance.
DXY technical outlook: DXY resumes downside, breakout improves outlook
Technical analysis indicators for the DXY index have resumed their downward trend in negative territory. However, on Tuesday, the index regained the 20-day Simple Moving Average (SMA) at approximately 101.60. This breakout has improved the short-term outlook, and the immediate task for buyers is to hold this level.The Relative Strength Index (RSI) and Moving Average Convergence Divergence (MACD) indicators remain in negative territory, suggesting bearish momentum. However, both indicators are showing some signs of upward movement, which could indicate a potential reversal in trend.
Supports are located at 101.60, 101.30 and 101.00. Resistances are found at 101.80, 102.00 and 102.30.
US Dollar FAQs
The US Dollar (USD) is the official currency of the United States of America, and the ‘de facto’ currency of a significant number of other countries where it is found in circulation alongside local notes. It is the most heavily traded currency in the world, accounting for over 88% of all global foreign exchange turnover, or an average of $6.6 trillion in transactions per day, according to data from 2022. Following the second world war, the USD took over from the British Pound as the world’s reserve currency. For most of its history, the US Dollar was backed by Gold, until the Bretton Woods Agreement in 1971 when the Gold Standard went away.
The most important single factor impacting on the value of the US Dollar is monetary policy, which is shaped by the Federal Reserve (Fed). The Fed has two mandates: to achieve price stability (control inflation) and foster full employment. Its primary tool to achieve these two goals is by adjusting interest rates. When prices are rising too quickly and inflation is above the Fed’s 2% target, the Fed will raise rates, which helps the USD value. When inflation falls below 2% or the Unemployment Rate is too high, the Fed may lower interest rates, which weighs on the Greenback.
In extreme situations, the Federal Reserve can also print more Dollars and enact quantitative easing (QE). QE is the process by which the Fed substantially increases the flow of credit in a stuck financial system. It is a non-standard policy measure used when credit has dried up because banks will not lend to each other (out of the fear of counterparty default). It is a last resort when simply lowering interest rates is unlikely to achieve the necessary result. It was the Fed’s weapon of choice to combat the credit crunch that occurred during the Great Financial Crisis in 2008. It involves the Fed printing more Dollars and using them to buy US government bonds predominantly from financial institutions. QE usually leads to a weaker US Dollar.
Quantitative tightening (QT) is the reverse process whereby the Federal Reserve stops buying bonds from financial institutions and does not reinvest the principal from the bonds it holds maturing in new purchases. It is usually positive for the US Dollar.
- The Dow Jones is still battling to reclaim the 41,000 level.
- US PPI inflation kept the door open for a Fed rate cut next week.
- US Initial Jobless Claims also ticked up, but not enough to deter a rate trim.
The Dow Jones Industrial Average (DJIA) stuck close to familiar midrange territory on Thursday, holding close to the 41,000 handle but struggling to decisely reclaim the key technical figure. US Producer Price Index (PPI) business-level inflation rose slightly faster than expected on a monthly basis, while the annualized figure held steady, alleviating fears of rate-cut-threatening inflation pressures.
US PPI rose to 0.2% MoM in August, with core PPI accelerating to 0.3% MoM. Headline PPI was forecast to rise to 0.1% from the previous 0.0%, while core PPI was expected to rise to 0.2% from July’s -0.2% contraction. Despite the near-term upswing, annualized PPI inflation figures were much more attractive to investors, with YoY headline PPI easing to 1.7% from the previous period’s revised 2.1%, and ticking below the expected 1.8%. Core annualized PPI also beat the expected print, holding steady at 2.4% YoY versus the expected 2.5% uptick.
US Initial Jobless Claims also rose slightly higher for the week ended September 6, increasing to the expected 230K from the previous week’s revised 228K.
With PPI inflation remaining tame and the number of unemployment benefits seekers holding firmly in tepid territory, little lies in the way of a first rate cut from the Federal Reserve (Fed) on September 18. The Fed is broadly expected to deliver a 25 bps cut to kick off 2024’s late-starting rate cut cycle. According to the CME’s FedWatch Tool, rate markets are pricing in over 80% odds of the Fed cutting by a quarter point next week, with a slim 20% still leaning into hopes for an initial double-cut for 50 bps. Rate traders also overwhelmingly expect the Fed to deliver four cuts in total, with December’s rate call expected to land between 425 and 450 bps.
Dow Jones news
The Dow Jones struggled at the start of Thursday’s market session, but a late break in the trading day has the index on the climb, with only a third of the DJIA testing into the red. Losses are being led by Dow Inc (DOW), which fell by 1.1% to below $50.20 per share. On the high side, Caterpillar Inc (CAT) rose nearly 1.5%, climbing back into $340 per share.
Elsewhere in equities, UnitedHealth Group Inc (UNH) took a hit following the Trump vs Harris political debate this week. Presidential candidate Donald Trump took a big hit to his election odds following a poor debate performance.
Dow Jones price forecast
The Dow Jones spent early Thursday in the doldrums, holding on the low end despite an overall uptick in US equity markets. The index waffled below 40,750 before catching a late break into the high side, returning to challenge the 41,000 key price level once more.
The major equity index has struggled to make headway above the major price handle, remaining trapped below 41,000 for the six previous trading days. However, bulls look set to take another run at the high side, rallying prices 2.6% bottom-to-top over the last two days as daily candlesticks chalk in a bullish bounce from the 50-day Exponential Moving Average (EMA) at 40,366.
Dow Jones daily chart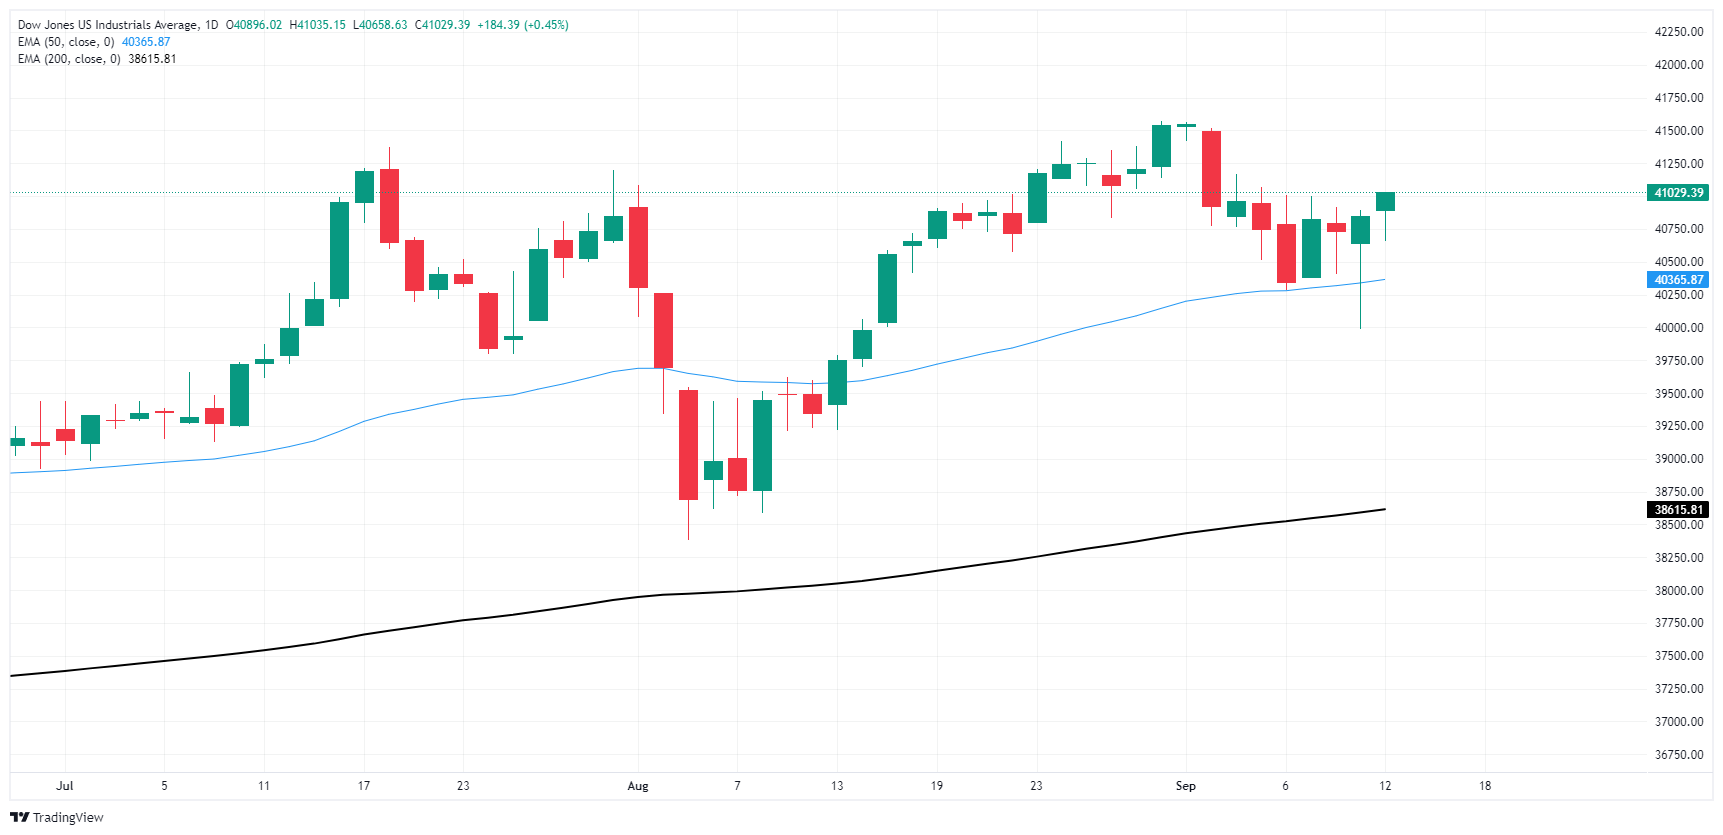
Dow Jones FAQs
The Dow Jones Industrial Average, one of the oldest stock market indices in the world, is compiled of the 30 most traded stocks in the US. The index is price-weighted rather than weighted by capitalization. It is calculated by summing the prices of the constituent stocks and dividing them by a factor, currently 0.152. The index was founded by Charles Dow, who also founded the Wall Street Journal. In later years it has been criticized for not being broadly representative enough because it only tracks 30 conglomerates, unlike broader indices such as the S&P 500.
Many different factors drive the Dow Jones Industrial Average (DJIA). The aggregate performance of the component companies revealed in quarterly company earnings reports is the main one. US and global macroeconomic data also contributes as it impacts on investor sentiment. The level of interest rates, set by the Federal Reserve (Fed), also influences the DJIA as it affects the cost of credit, on which many corporations are heavily reliant. Therefore, inflation can be a major driver as well as other metrics which impact the Fed decisions.
Dow Theory is a method for identifying the primary trend of the stock market developed by Charles Dow. A key step is to compare the direction of the Dow Jones Industrial Average (DJIA) and the Dow Jones Transportation Average (DJTA) and only follow trends where both are moving in the same direction. Volume is a confirmatory criteria. The theory uses elements of peak and trough analysis. Dow’s theory posits three trend phases: accumulation, when smart money starts buying or selling; public participation, when the wider public joins in; and distribution, when the smart money exits.
There are a number of ways to trade the DJIA. One is to use ETFs which allow investors to trade the DJIA as a single security, rather than having to buy shares in all 30 constituent companies. A leading example is the SPDR Dow Jones Industrial Average ETF (DIA). DJIA futures contracts enable traders to speculate on the future value of the index and Options provide the right, but not the obligation, to buy or sell the index at a predetermined price in the future. Mutual funds enable investors to buy a share of a diversified portfolio of DJIA stocks thus providing exposure to the overall index.
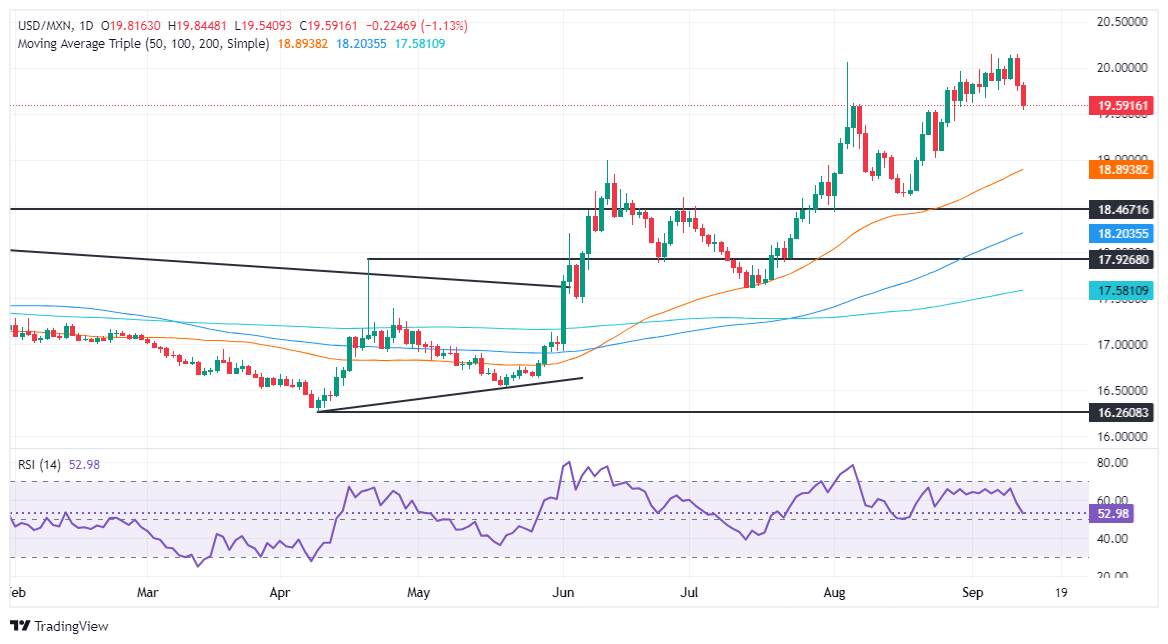
- Mexican Peso climbs after judiciary reform approval with state-level voting underway to finalize the constitutional change.
- Moody’s warns the reform could threaten Mexico’s judicial independence and impact the country’s credit rating.
- Mixed US economic results reduce likelihood of a 50 bps Fed rate cut with upcoming US Consumer Sentiment data in focus.
The Mexican Peso rallied sharply against the Greenback on Thursday following the approval of the judiciary reform on Tuesday. US economic data showed mixed readings, with an uptick in factory inflation and soft jobs data. The USD/MXN trades at 19.60, down almost 1%.
Mexico’s political turmoil has faded, though the approval of the judicial reform is a certainty. Congresses in 32 states began the approval process, and once voted by a majority in 17 states, it will be declared a law. Aside from this, the economic docket is empty. The next economic release comes on September 18, when INEGI will reveal Aggregate Demand and Private Spending data.
Regarding the judicial reform, Moody’s warned of its impact on Mexico’s credit rating. An analysis emphasizes that “the constitutional change threatens the independence and impartiality of Mexico's judiciary” and “would undermine sovereign credit quality.”
The Greenback remained offered in the US after the US Bureau of Labor Statistics (BLS) revealed that the August Producer Price Index (PPI) figures were mixed. At the same time, the number of Americans filing for unemployment benefits rose as estimated and cleared the previous week's reading.
After the latest consumer and producer inflation reports in the US, expectations for a 50-basis-point (bps) rate cut by the Federal Reserve (Fed) were trimmed. The chances for a 50 bps cut are 15%, while for a 25 bps cut they are 85%, via CME FedWatch Tool data.
USD/MXN will eye the Consumer Sentiment survey released by the University of Michigan on Friday.
Daily digest market movers: Mexican Peso on the front foot after judicial reform approval
- Mexico’s Industrial Production in July offered mixed readings, yet most economists estimate an economic slowdown.
- Inflation in August dipped below the 5% threshold and augmented speculation of additional easing by the Bank of Mexico (Banxico).
- September’s Citibanamex Survey showed that Banxico is expected to lower rates to 10.25% in 2024 and to 8.25% in 2025. The USD/MXN exchange rate is forecast to end 2024 at 19.50 and 2025 at 19.85.
- BLS revealed that PPI in August rose by 1.7%, below estimates of 1.8%, and core PPI rose from 2.3% to 2.4%, beneath expectations of 2.5%.
- Headline PPI and core increased compared to the previous month's reading. PPI exceeded expectations of 0.1%, expanded by 0.2%, and core PPI rose by 0.3%, up from 0.2%.
- Data from the Chicago Board of Trade suggests the Fed will cut at least 98 basis points this year, up from 108 a day ago, according to the fed funds rate futures contract for December 2024.
USD/MXN technical outlook: Mexican Peso surges as USD/MXN slumps below 19.60
The USD/MXN uptrend remains in place on Thursday despite the ongoing correction for the last two days. Momentum shifted negatively in the pair, as shown by the Relative Strength Index (RSI). This is despite the approval of an unwelcome judicial reform that foreign investors, banks and credit agencies opposed.
In the meantime, the USD/MXN is headed to the downside in the short term. The first support would be the 19.50 area. Once cleared, the next support would be the August 23 swing low of 19.02, shy of the 50-day Simple Moving Average (SMA) at 18.99.
Conversely, the USD/MXN must clear the psychological 20.00 figure for a bullish continuation. If surpassed, the next ceiling level would be the YTD high at 20.22. On further strength, the pair could challenge the daily high of September 28, 2022, at 20.57. If those two levels are surrendered, the next stop would be the swing high at 20.82 on August 2, 2022, ahead of 21.00.
Mexican Peso FAQs
The Mexican Peso (MXN) is the most traded currency among its Latin American peers. Its value is broadly determined by the performance of the Mexican economy, the country’s central bank’s policy, the amount of foreign investment in the country and even the levels of remittances sent by Mexicans who live abroad, particularly in the United States. Geopolitical trends can also move MXN: for example, the process of nearshoring – or the decision by some firms to relocate manufacturing capacity and supply chains closer to their home countries – is also seen as a catalyst for the Mexican currency as the country is considered a key manufacturing hub in the American continent. Another catalyst for MXN is Oil prices as Mexico is a key exporter of the commodity.
The main objective of Mexico’s central bank, also known as Banxico, is to maintain inflation at low and stable levels (at or close to its target of 3%, the midpoint in a tolerance band of between 2% and 4%). To this end, the bank sets an appropriate level of interest rates. When inflation is too high, Banxico will attempt to tame it by raising interest rates, making it more expensive for households and businesses to borrow money, thus cooling demand and the overall economy. Higher interest rates are generally positive for the Mexican Peso (MXN) as they lead to higher yields, making the country a more attractive place for investors. On the contrary, lower interest rates tend to weaken MXN.
Macroeconomic data releases are key to assess the state of the economy and can have an impact on the Mexican Peso (MXN) valuation. A strong Mexican economy, based on high economic growth, low unemployment and high confidence is good for MXN. Not only does it attract more foreign investment but it may encourage the Bank of Mexico (Banxico) to increase interest rates, particularly if this strength comes together with elevated inflation. However, if economic data is weak, MXN is likely to depreciate.
As an emerging-market currency, the Mexican Peso (MXN) tends to strive during risk-on periods, or when investors perceive that broader market risks are low and thus are eager to engage with investments that carry a higher risk. Conversely, MXN tends to weaken at times of market turbulence or economic uncertainty as investors tend to sell higher-risk assets and flee to the more-stable safe havens.
- Overall bearish outlook remains, RSI and MACD indicate short-term mixed momentum.
- Selling pressure is declining, indicated by decreasing red MACD bars.
- The 20-day SMA continues to be a strong resistance.
In Thursday's session, the EUR/GBP retreated and stands flat around 0.8440, showcasing a mixed technical outlook. Bears appear to be moderating their short-term bearish pressure, but the overall technical outlook remains bearish.
The Relative Strength Index (RSI) is currently at 44, within negative territory, and exhibits a flat slope, signifying a gradual recovery in buying momentum. The Moving Average Convergence Divergence (MACD) histogram is displaying decreasing red bars, indicating a decline in selling pressure. This mixed outlook suggests that the buying and selling forces are relatively balanced at the moment.
EUR/GBP daily chart
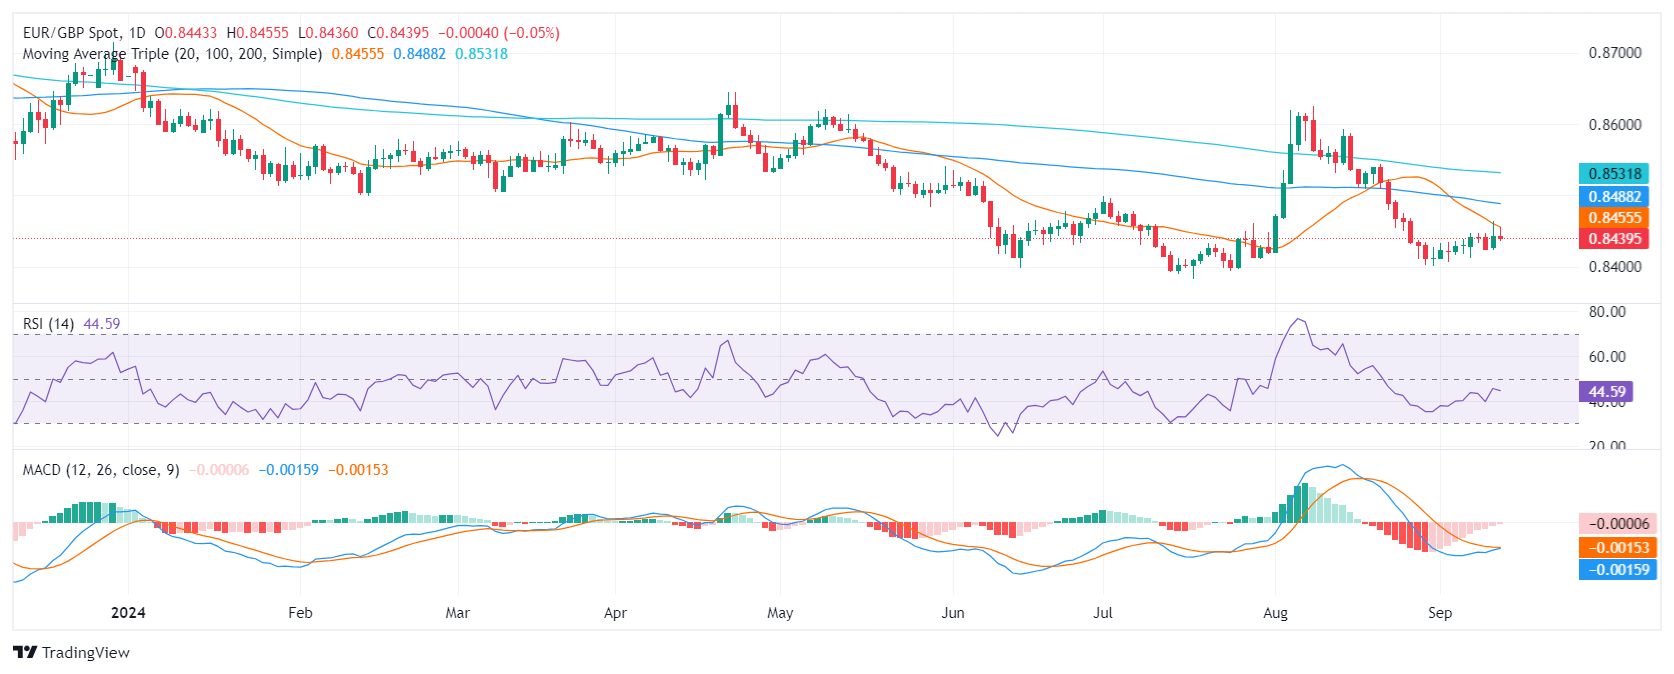
The EUR/GBP pair has been consolidating within a narrow range for the past few trading sessions, fluctuating between 0.8420 and 0.8450. This consolidation is indicative of a lack of clear directional bias in the near term. If the pair manages to break above the immediate resistance level of 0.8450 (20-day SMA), it could potentially target 0.8460 and 0.8470. Conversely, a break below 0.8420 could open up further downside potential below 08400.
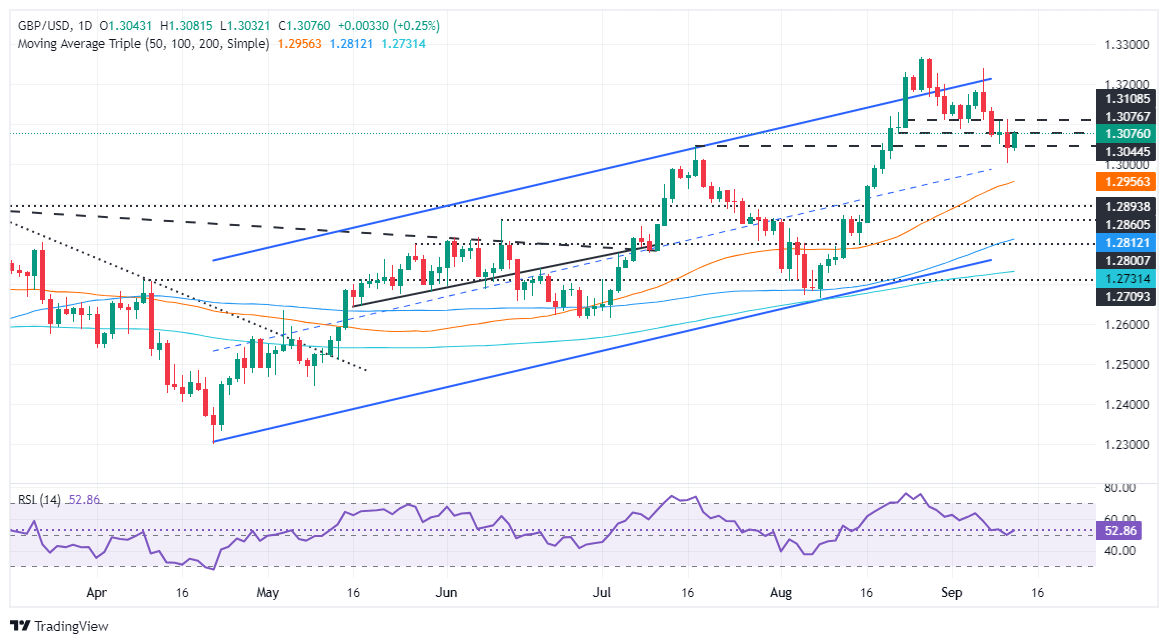
- GBP/USD bounces from a daily low of 1.3031, with momentum turning bullish as RSI points upward.
- Bulls need to clear resistance at 1.3111 and 1.3143 to target the key psychological level of 1.3200.
- A drop below 1.3000 would expose the 50-DMA at 1.2953, with further support at 1.2872 and 1.2810 (100-DMA).
The Pound Sterling advanced modestly against the US Dollar on Thursday after economic data showed that factory inflation in the United States (US) was a tick higher than foreseen. That and a softer US jobs report weighed on the buck. The GBP/USD trades at 1.3078 after hitting a daily low of 1.3031.
GBP/USD Price Forecast: Technical outlook
After diving to a three-week low of 1.3001, the GBP/USD bounced off and sat within the mid 1.3000-1.3100 range after UK economic data showed the economy is cooling.
Momentum shows buyers stepping into the market as the Relative Strength Index (RSI), which, at the brisk of turning bearish, made a U-turn, aiming up.
If bulls want to regain control, they must reclaim the September 11 peak of 1.3111. This would expose the current week’s peak at 1.3143, followed by 1.3200.
Conversely for a bearish continuation, if GBP/USD tumbles below 1.3000, the first support would be the 50-day moving average (DMA) at 1.2953. On further weakness, the next stop would be the August 13 high turned support at 1.2872, ahead of challenging 1.2810, the 100-DMA.
GBP/USD Price Action – Daily Chart
British Pound PRICE Today
The table below shows the percentage change of British Pound (GBP) against listed major currencies today. British Pound was the strongest against the Swiss Franc.
| USD | EUR | GBP | JPY | CAD | AUD | NZD | CHF | |
|---|---|---|---|---|---|---|---|---|
| USD | -0.28% | -0.28% | -0.03% | 0.12% | -0.24% | -0.23% | 0.15% | |
| EUR | 0.28% | 0.00% | 0.22% | 0.42% | 0.05% | 0.06% | 0.43% | |
| GBP | 0.28% | -0.01% | 0.00% | 0.41% | 0.04% | 0.05% | 0.43% | |
| JPY | 0.03% | -0.22% | 0.00% | 0.12% | -0.24% | -0.26% | 0.15% | |
| CAD | -0.12% | -0.42% | -0.41% | -0.12% | -0.36% | -0.37% | 0.01% | |
| AUD | 0.24% | -0.05% | -0.04% | 0.24% | 0.36% | 0.00% | 0.38% | |
| NZD | 0.23% | -0.06% | -0.05% | 0.26% | 0.37% | -0.01% | 0.38% | |
| CHF | -0.15% | -0.43% | -0.43% | -0.15% | -0.01% | -0.38% | -0.38% |
The heat map shows percentage changes of major currencies against each other. The base currency is picked from the left column, while the quote currency is picked from the top row. For example, if you pick the British Pound from the left column and move along the horizontal line to the US Dollar, the percentage change displayed in the box will represent GBP (base)/USD (quote).
- USD/JPY slumps to near 142.00 as the US Dollar corrects after the US PPI report release.
- The US headline and core PPI for August came in softer-than-expected.
- BoJ Tamura sees interest rates rising to at least 1%.
The USD/JPY pair falls sharply to near 142.00 in Thursday’s North American session. The asset declines as the US Dollar (USD) faces selling pressure after the release of the softer-than-expected United States (US) annual Producer Price Index (PPI) data for August.
The US Dollar Index (DXY), which tracks the Greenback’s value against six major currencies, corrects to near 101.60.
The PPI report showed that the annual headline produce inflation grew by 1.7%, slower than estimates of 1.8% and the prior release of 2.1%, downwardly revised from 2.2%. The core PPI – which excludes volatile food and energy prices – rose steadily by 2.4%, at a slower pace than expectations of 2.5%. The impact of the US PPI data appears to be insignificant on market speculation for the Federal Reserve (Fed) interest rate cut path for next week’s policy meeting.
According to the CME FedWatch tool, the probability for the Fed reducing interest rates by 50 basis points (bps) to 4.75%-5.00% in September remains at 13% as they were before the US PPI data release.
Going forward, investors will focus on the preliminary Michigan Consumer Sentiment Index data for September, which will be published on Friday. The sentiment data is estimated to have remained almost steady at 68.0 from the prior release of 67.9.
On the Tokyo front, the Japanese Yen (JPY) strengthens as Bank of Japan (BoJ) policymaker Naoki Tamura delivers a hawkish interest rate guidance. Tamura sees interest rates rising to at least 1% by the early second half of 2025. Tamura refrained from providing a pre-set interest rate hike path.
Japanese Yen FAQs
The Japanese Yen (JPY) is one of the world’s most traded currencies. Its value is broadly determined by the performance of the Japanese economy, but more specifically by the Bank of Japan’s policy, the differential between Japanese and US bond yields, or risk sentiment among traders, among other factors.
One of the Bank of Japan’s mandates is currency control, so its moves are key for the Yen. The BoJ has directly intervened in currency markets sometimes, generally to lower the value of the Yen, although it refrains from doing it often due to political concerns of its main trading partners. The current BoJ ultra-loose monetary policy, based on massive stimulus to the economy, has caused the Yen to depreciate against its main currency peers. This process has exacerbated more recently due to an increasing policy divergence between the Bank of Japan and other main central banks, which have opted to increase interest rates sharply to fight decades-high levels of inflation.
The BoJ’s stance of sticking to ultra-loose monetary policy has led to a widening policy divergence with other central banks, particularly with the US Federal Reserve. This supports a widening of the differential between the 10-year US and Japanese bonds, which favors the US Dollar against the Japanese Yen.
The Japanese Yen is often seen as a safe-haven investment. This means that in times of market stress, investors are more likely to put their money in the Japanese currency due to its supposed reliability and stability. Turbulent times are likely to strengthen the Yen’s value against other currencies seen as more risky to invest in.
The AUD is in an interesting position. On one hand it should be able to draw support from the fact that the RBA is one of the most hawkish central banks in the G10. On the other hand, as a commodities exporter, it is vulnerable to concerns about slow growth in China, Rabobank’s Senior FX Strategist Jane Foley notes.
AUD/USD may head back to 0.70 on a 6-month view
“It can be argued that the performance of the AUD in the year to date reflects the diverging impact of these fundamentals. Measured against the other G10 currencies, in the year to date the AUD is right in the middle of the pack. That said, it has climbed higher in the performance table in the past few days. For a short while this morning the AUD was the best performing G10 currency.”
“In the months ahead, we expect AUD/USD should draw support from rate differentials as the Fed launches its rate cutting cycle and as the RBA continues to look for a turning point in Australian inflationary risks. Consequently, we maintain the view that AUD/USD may head back to 0.70 on a 6-month view.”
“The assumption that the RBA will be one of the last G10 central banks to cut rates, is supportive for the AUD. But, the dominance of iron ore and coal in Australia’s export offering and the importance of its trade relationship with China has added another series of uncertainties for the AUD. The negative implications of weak iron prices and concerns over Chinese demand are set to temper the outlook for the AUD. In view of the RBA’s hawkish position we favour buying AUD/USD on dips.”
- AUD/USD struggles to gain strength despite the US Dollar corrects after the release of the US annual PPI report for August.
- Investors see the Fed reducing interest rates by 25 bps next week.
- Growing worries over Australian economic prospects have prompted the need for RBA rate cuts.
The AUD/USD pair strives for strong buying interest to extend its upside to near 0.6700 in Thursday’s North American session. The Aussie asset struggles to gain strength despite the release of the softer-than-expected United States (US) annual Producer Price Index (PPI) data for August.
The PPI report showed that the annual headline PPI grew at a slower pace of 1.7% from the estimates of 1.8% and 2.1% in July, downwardly revised from 2.2%. In the same period, the core producer inflation – which excludes volatile food and energy prices – rose steadily by 2.4%, slower than expectations of 2.5%. A slower pace in the price increase of goods and services at factory gates suggests a sluggish consumer spending trend, which generally prompts Federal Reserve (Fed) interest rate cut bets.
However, the monthly headline and core PPI rose at a faster-than-expected pace of 0.2% and 0.3%, respectively. Soft US annual PPI data has weighed on the US Dollar (USD). The US Dollar Index (DXY), which tracks the Greenback’s value against six major currencies, edges lower to near 101.60.
The impact of the US PPI is expected to be lower on market speculation for Fed interest rate guidance. The central bank is almost certain to start reducing its borrowing rates gradually from next week as Wednesday’s Consumer Price Index (CPI) data for August showed signs of stickiness in inflationary pressures.
Meanwhile, the Australian Dollar (AUD) struggles to gain strength amid growing concerns over the Aussie economic growth due to the maintenance of higher interest rates by the Reserve Bank of Australia (RBA). Deepening economic worry has also forced market experts to discuss over RBA’s pivot to policy-easing.
Former RBA Governor Bernie Fraser criticized the current Monetary Policy Committee (MPC) for being overly focused on inflation at labour market’s cost. Fraser advised to lower the Official Cash Rate (OCR), warning of "recessionary risks" that could have severe consequences for employment.
Economic Indicator
Producer Price Index (YoY)
The Producer Price Index released by the Bureau of Labor statistics, Department of Labor measures the average changes in prices in primary markets of the US by producers of commodities in all states of processing. Changes in the PPI are widely followed as an indicator of commodity inflation. Generally speaking, a high reading is seen as positive (or bullish) for the USD, whereas a low reading is seen as negative (or bearish).
Read more.Last release: Thu Sep 12, 2024 12:30
Frequency: Monthly
Actual: 1.7%
Consensus: 1.8%
Previous: 2.2%
Source: US Bureau of Labor Statistics
- Silver spikes higher following the release of mixed Producer Price Index data.
- Although the annual figures came in lower-than-expected, the monthly data rose.
- US Jobless claims released at the same time showed an uptick in people claiming benefits.
Silver (XAG/USD) price is trading higher on Thursday after the release of US “factory gate” inflation, otherwise known as the Producer Price Index (PPI). The precious metal is exchanging hands in the $29.30s after rising over 2.0% on the day and breaching the top of a mini consolidation zone.
The Producer Price Index, which is often seen as a predictor of broader inflation, came in mixed in August, with the monthly readings beating – but the annual readings falling below expectations. There were also substantial downward revisions to July’s data. The US Dollar (USD) sold off following and precious metals like Gold and Silver, which are negatively correlated to USD rose.
The Producer Price Index (PPI) ex Food & Energy rose by 2.4% in August, the same as the 2.4% registered in July. The result came in below expectations of 2.5%, according to data from the US Bureau of Labor Statistics (BLS).
On the month, core PPI rose 0.3% compared to the downwardly-revised 0.2% decline in July. Economists had expected a 0.2% rise.
Headline PPI, meanwhile, rose 1.7% in August after a downwardly-revised 2.1% rise in the previous month. The result was below expectations of 1.8%. On a monthly basis PPI rose 0.2%, which compared to the revised-down 0.0% registered in July and was above the 0.1% expected.
Employment data released at the same time showed US Initial Jobless Claims rose 230K in the week ending September 6, coming in above the revised-up 228K of the previous week and was in line with the 230K forecast.
Continuing Jobless Claims rose 1.850M, which was higher/lower than the previous week’s revised-up 1.845M, according to the US Department of Labor.
Although the data caused the US Dollar to fall it did not change the outlook for interest rates in the US. The probability of a larger 0.50% reduction at the Federal Reserve’s (Fed) September stayed around the 13%-15% mark following the release, according to the CME FedWatch tool, after falling dramatically on Wednesday following CPI data.
Christine Lagarde, President of the European Central Bank (ECB), explains the ECB's decision to lower the benchmark interest rate by 25 basis points at the September policy meeting and responds to questions from the press.
Key quotes
"We need to be attentive to risk of below target inflation."
"Services inflation requires attention, monitoring."
"Expecting services inflation to decline in 2025."
Inflation FAQs
Inflation measures the rise in the price of a representative basket of goods and services. Headline inflation is usually expressed as a percentage change on a month-on-month (MoM) and year-on-year (YoY) basis. Core inflation excludes more volatile elements such as food and fuel which can fluctuate because of geopolitical and seasonal factors. Core inflation is the figure economists focus on and is the level targeted by central banks, which are mandated to keep inflation at a manageable level, usually around 2%.
The Consumer Price Index (CPI) measures the change in prices of a basket of goods and services over a period of time. It is usually expressed as a percentage change on a month-on-month (MoM) and year-on-year (YoY) basis. Core CPI is the figure targeted by central banks as it excludes volatile food and fuel inputs. When Core CPI rises above 2% it usually results in higher interest rates and vice versa when it falls below 2%. Since higher interest rates are positive for a currency, higher inflation usually results in a stronger currency. The opposite is true when inflation falls.
Although it may seem counter-intuitive, high inflation in a country pushes up the value of its currency and vice versa for lower inflation. This is because the central bank will normally raise interest rates to combat the higher inflation, which attract more global capital inflows from investors looking for a lucrative place to park their money.
Formerly, Gold was the asset investors turned to in times of high inflation because it preserved its value, and whilst investors will often still buy Gold for its safe-haven properties in times of extreme market turmoil, this is not the case most of the time. This is because when inflation is high, central banks will put up interest rates to combat it. Higher interest rates are negative for Gold because they increase the opportunity-cost of holding Gold vis-a-vis an interest-bearing asset or placing the money in a cash deposit account. On the flipside, lower inflation tends to be positive for Gold as it brings interest rates down, making the bright metal a more viable investment alternative.
August’s RICS House Price Balance data strengthened to +1%, well ahead of July’s –18% and the forecast of –14%, Scotiabank’s Chief FX Strategist Shaun Osborne notes.
GBP is consolidating for the time being
“The data (reflecting the difference between agents reporting higher house prices minus those reporting a fall) was the strongest in close to two years. Details in the report were strong as well, suggesting that expectations of lower interest rates has given the UK housing market a significant lift.”
“Cable is holding a narrow range well withing yesterday’s spot range. This implies some moderation at least in short-term pressure on the pound. Support is 1.3000 intraday while resistance is 1.3110.”
Christine Lagarde, President of the European Central Bank (ECB), explains the ECB's decision to lower the benchmark interest rate by 25 basis points at the September policy meeting and responds to questions from the press.
Key quotes
"Policy decisions were unanimous."
"Data comforts us that we're heading to target."
"We have reinforced confidence in solidity, robustness of projections."
"Declining path for rates is pretty obvious."
"September will deliver low inflation reading."
"Inflation to rise again in Q4."
"Relatively short time to October meeting."
"No commitment of any kind about October."
Inflation FAQs
Inflation measures the rise in the price of a representative basket of goods and services. Headline inflation is usually expressed as a percentage change on a month-on-month (MoM) and year-on-year (YoY) basis. Core inflation excludes more volatile elements such as food and fuel which can fluctuate because of geopolitical and seasonal factors. Core inflation is the figure economists focus on and is the level targeted by central banks, which are mandated to keep inflation at a manageable level, usually around 2%.
The Consumer Price Index (CPI) measures the change in prices of a basket of goods and services over a period of time. It is usually expressed as a percentage change on a month-on-month (MoM) and year-on-year (YoY) basis. Core CPI is the figure targeted by central banks as it excludes volatile food and fuel inputs. When Core CPI rises above 2% it usually results in higher interest rates and vice versa when it falls below 2%. Since higher interest rates are positive for a currency, higher inflation usually results in a stronger currency. The opposite is true when inflation falls.
Although it may seem counter-intuitive, high inflation in a country pushes up the value of its currency and vice versa for lower inflation. This is because the central bank will normally raise interest rates to combat the higher inflation, which attract more global capital inflows from investors looking for a lucrative place to park their money.
Formerly, Gold was the asset investors turned to in times of high inflation because it preserved its value, and whilst investors will often still buy Gold for its safe-haven properties in times of extreme market turmoil, this is not the case most of the time. This is because when inflation is high, central banks will put up interest rates to combat it. Higher interest rates are negative for Gold because they increase the opportunity-cost of holding Gold vis-a-vis an interest-bearing asset or placing the money in a cash deposit account. On the flipside, lower inflation tends to be positive for Gold as it brings interest rates down, making the bright metal a more viable investment alternative.
Christine Lagarde, President of the European Central Bank (ECB), explains the ECB's decision to lower the benchmark interest rate by 25 basis points at the September policy meeting and responds to questions from the press.
Key quotes
"Negotiated wage growth will remain high and volatile for the rest of 2024."
"Overall labor cost growth is moderating."
"Unit labor costs expected to continue to decline."
"Risks to growth are skewed to the downside."
"Wages, profits, trade tensions potential upside risks for inflation."
ECB FAQs
The European Central Bank (ECB) in Frankfurt, Germany, is the reserve bank for the Eurozone. The ECB sets interest rates and manages monetary policy for the region. The ECB primary mandate is to maintain price stability, which means keeping inflation at around 2%. Its primary tool for achieving this is by raising or lowering interest rates. Relatively high interest rates will usually result in a stronger Euro and vice versa. The ECB Governing Council makes monetary policy decisions at meetings held eight times a year. Decisions are made by heads of the Eurozone national banks and six permanent members, including the President of the ECB, Christine Lagarde.
In extreme situations, the European Central Bank can enact a policy tool called Quantitative Easing. QE is the process by which the ECB prints Euros and uses them to buy assets – usually government or corporate bonds – from banks and other financial institutions. QE usually results in a weaker Euro. QE is a last resort when simply lowering interest rates is unlikely to achieve the objective of price stability. The ECB used it during the Great Financial Crisis in 2009-11, in 2015 when inflation remained stubbornly low, as well as during the covid pandemic.
Quantitative tightening (QT) is the reverse of QE. It is undertaken after QE when an economic recovery is underway and inflation starts rising. Whilst in QE the European Central Bank (ECB) purchases government and corporate bonds from financial institutions to provide them with liquidity, in QT the ECB stops buying more bonds, and stops reinvesting the principal maturing on the bonds it already holds. It is usually positive (or bullish) for the Euro.
Christine Lagarde, President of the European Central Bank (ECB), explains the ECB's decision to lower the benchmark interest rate by 25 basis points at the September policy meeting and responds to questions from the press.
Key quotes
"The recovery if facing headwinds, based on surveys."
"Recovery is expected to strengthen."
"Fading monetary policy restriction should support the economy."
"The labor market is resilient."
"Surveys point to further moderation in demand for labor."
Interest rates FAQs
Interest rates are charged by financial institutions on loans to borrowers and are paid as interest to savers and depositors. They are influenced by base lending rates, which are set by central banks in response to changes in the economy. Central banks normally have a mandate to ensure price stability, which in most cases means targeting a core inflation rate of around 2%. If inflation falls below target the central bank may cut base lending rates, with a view to stimulating lending and boosting the economy. If inflation rises substantially above 2% it normally results in the central bank raising base lending rates in an attempt to lower inflation.
Higher interest rates generally help strengthen a country’s currency as they make it a more attractive place for global investors to park their money.
Higher interest rates overall weigh on the price of Gold because they increase the opportunity cost of holding Gold instead of investing in an interest-bearing asset or placing cash in the bank. If interest rates are high that usually pushes up the price of the US Dollar (USD), and since Gold is priced in Dollars, this has the effect of lowering the price of Gold.
The Fed funds rate is the overnight rate at which US banks lend to each other. It is the oft-quoted headline rate set by the Federal Reserve at its FOMC meetings. It is set as a range, for example 4.75%-5.00%, though the upper limit (in that case 5.00%) is the quoted figure. Market expectations for future Fed funds rate are tracked by the CME FedWatch tool, which shapes how many financial markets behave in anticipation of future Federal Reserve monetary policy decisions.
Mexican President Andres Lopez Obrador (AMLO), who leaves office at the end of the month, is wasting no time when it comes to the controversial judicial reform, Commerzbank’s FX Analyst Antje Praefcke notes.
Peso is likely to remain under downward pressure
“It was passed yesterday without amendment by the Senate with more than the two-thirds majority required for constitutional amendments. Although the bill still has to be passed by more than half of Mexico's local congresses, this should only be a formality.”
“All in all, the law, which aims to ensure that judges of the Supreme Court and federal judges are elected by popular vote in future, ultimately undermining the division of power and extending the influence of the current regime, is likely to come into force before the end of the month.”
“AMLO's move undermines investor confidence in the regime. It is also questionable whether the law violates the North American Trade Agreement (USMCA). Under these conditions, the peso is likely to remain under downward pressure.”
- Initial Jobless Claims rose to 230K, up from the previous week's 228K.
- Continuing Jobless Claims increased to 1.850M in the week ending August 31.
US citizens that newly applied for unemployment insurance benefits reached 230K in the week ending September 7, according to the US Department of Labor (DoL) on Thursday. The prints came in above initial consensus (227K) and were a tad higher than the previous weekly figure of 228K (revised from 227K).
Further details of the publication revealed that the advance seasonally adjusted insured unemployment rate was 1.2% and the 4-week moving average was 230.75K, an increase of 0.500K from the previous week's revised average.
In addition, Continuing Claims increased by 5K to 1.850M in the week ending August 31.
Market reaction
The US Dollar Index (DXY) remains under downside pressure and hovers around the 101.60 region in the wake of the release.
The CAD is little changed on the session, Scotiabank’s Chief FX Strategist Shaun Osborne notes.
Spreads are headwind for CAD gains
“Yesterday’s brief rally in the USD was quickly reversed, dumping funds back under the 1.36 level where spot is consolidating. The positive risk backdrop is a mild support for CAD sentiment in the short run but the uptick in short-term US/Canada spreads and swaps over the past week or so are an impediment to further CAD gains, I think. Estimated fair value has edged a little lower this morning to 1.3634.”
“The USD’s failed attempt to hold gains above 1.36 yesterday casts a bit of a shadow over the short-term chart for USD/CAD. The market is sustaining a minor uptrend, supported by bullish-leaning DMIs on the intraday and daily oscillators but spot closed—and is holding—below the 200-day MA (1.3587) yesterday and that might suggest some constraint on USD gains for now. More rangey trade between 1.3550/1.3650 looks likely.”
- GBP/JPY is correcting within a short-term downtrend.
- The odds favor a resumption lower once the correction completes.
GBP/JPY has pulled back up to resistance at 186.51 in a counter-trend reaction after plumbing new lows.
The descending sequence of peaks and troughs since the September 2 high suggests the pair is in a short-term downtrend.
GBP/JPY 4-hour Chart
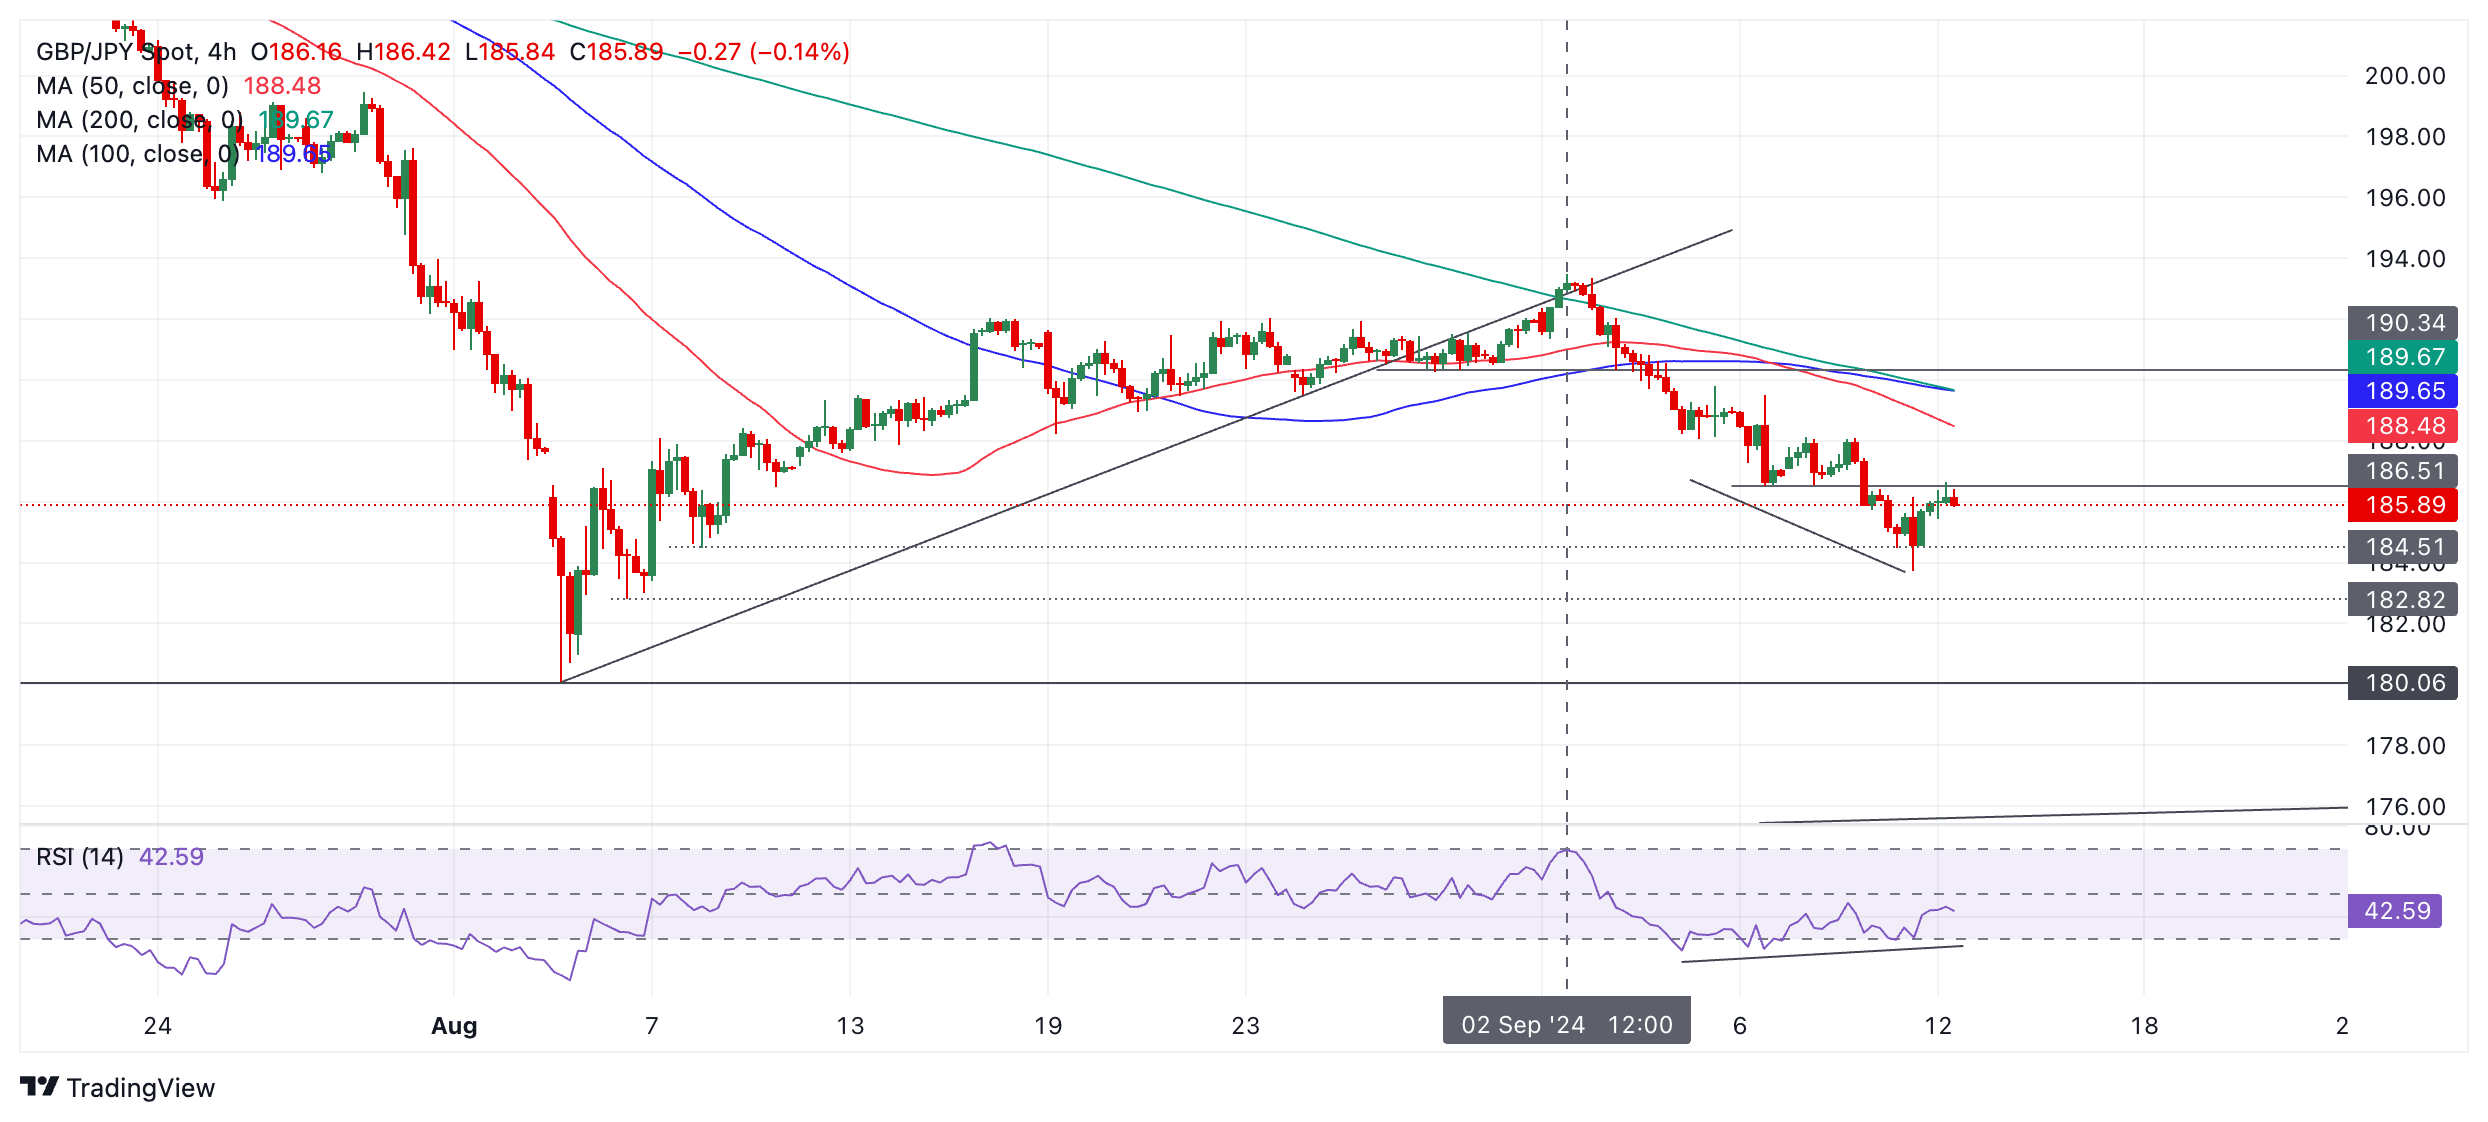
Since it is a principle of technical analysis that “the trend is your friend” more weakness is expected.
There is every chance, therefore, that the pull back will soon run out of steam and prices will resume their downtrend.
A break below the 183.72 (September 11 low) would confirm a lower low to the next bearish target at 182.82 (August 6 swing low), followed by 180.06, the low of August 5.
The Relative Strength Index (RSI) momentum indicator is showing bullish convergence with price. On September 4 RSI entered oversold territory when price bottomed; on September 12 price is even lower but RSI is actually higher. The non-correspondence is a mildly bullish indication.
Norwegian inflation was slightly lower than expected in August, as the overall rate fell to 2.6%. As expected, the core rate fell to 3.2%. Although inflation is moving towards Norges Bank's target of 2%, the core rate remains stubbornly high, Commerzbank’s FX Analyst Antje Praefcke notes.
Weak NOK is Norges Bank's biggest concern
“That the core rate appears to have fallen somewhat faster in the last two months than Norges Bank expected in June. This could be an argument for Norges Bank at its interest rate meeting next week to consider lowering the policy interest rate earlier rather than in 2025 (as signaled in June).”
“If Norges Bank's regional network survey, which will be published today as the last piece of information before the interest rate decision, shows that the economic outlook risks deteriorating in the next couple of months, the risk that Norges Bank could bring forward first interest rate cuts increases further.”
“However, I would be cautious with such speculation. Norges Bank's biggest concern seems to be the weakness of the NOK, which implies the risk of inflationary pressure. Therefore, any further NOK weakness argues for later rather than earlier rate cuts, as Norges Bank has proven in recent quarters to be restrictive and focused on price stability.”
The USD is mixed to slightly softer in subdued FX trading this morning. Firmer stocks, slightly softer bonds and some gains in key commodities (crude, copper, iron ore) are all fairly orderly as investors await this morning’s developments, Scotiabank’s Chief FX Strategist Shaun Osborne notes.
USD trades narrowly mixed versus majors
“The ECB policy decision and the next round of US economic data are due today. The US releases PPI and weekly claims at 8.30ET. PPI is expected to rise 0.1% in August, with core PPI expected to gain 0.2%. Subdued data may not have much impact on trade but, after the market’s reaction to the slightly higher core CPI M/M reading yesterday, minor data surprises clearly have the capacity to roil markets that are eager for clarity, one way or the other, on the near-term Fed policy outlook.”
“The minor CPI miss further dampened market expectations of an aggressive Fed rate cut next week. Underlying inflation pressures are moderating and the Fed’s attention is focused more intently on jobs now. The July FOMC minutes showed that ‘several’ policymakers thought progress on inflation and the deterioration in the labour market provided a ‘plausible case’ for a 25bps cut and that they could have supported such decision to cut back then. Labour market conditions are, net of revisions, even weaker now so there may still be a case to argue for a bold move next week even if a more measured outcome looks most likely.
“Despite yesterday’s push higher in the DXY, the dollar index is showing some signs of stalling close to the earlier September peak just under 102 (retracement resistance at 101.85). A clear push above the 102 area will indicate potential for additional DXY gains (1-1.5%) in the next few weeks. Recall that seasonal trends typically suggest the USD staying soft until later in Q4.”
- EUR/GBP continues rising in a shallow channel.
- It will probably extend unless there is a breakout one way or another.
EUR/GBP is extending a shallow ascending recovery channel that began at the August 30 lows. The overall short-term trend is unclear – both positive and negative signs complicate the picture.
EUR/GBP 4-hour Chart
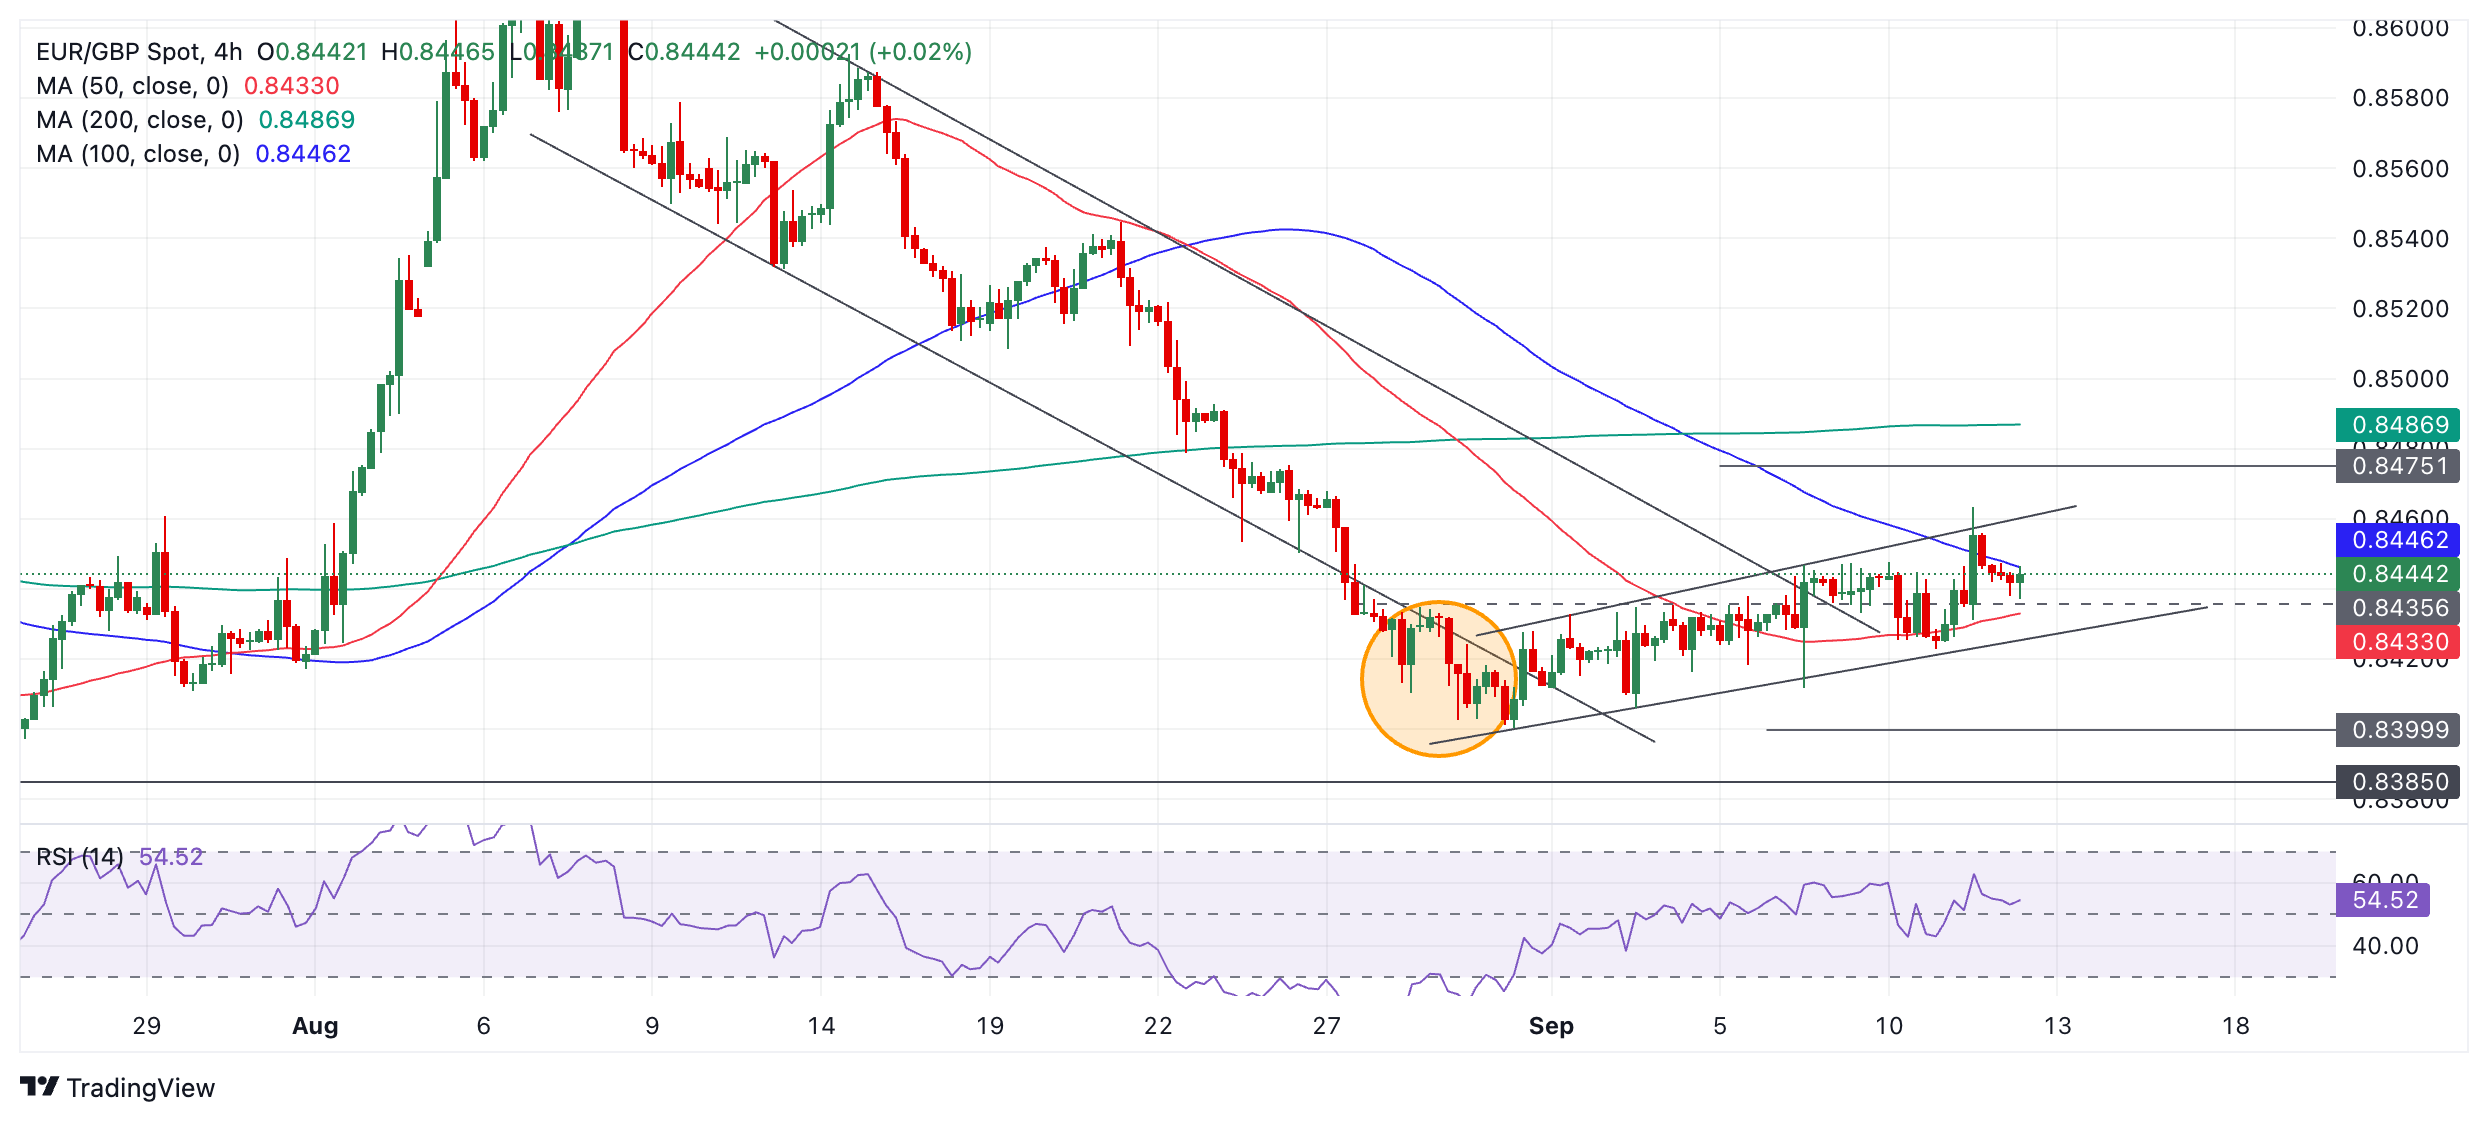
EUR/GBP continues respecting the guard rails of the channel and in the absence of a breakout in either direction the it will probably continue climbing steadily higher.
A close above the 0.8464 high (September 11 high) would be required to confirm an upside breakout from the channel. Such a move could be expected to reach roughly 0.8477, the 0.618 Fibonacci (Fib) extension if the height of the channel extrapolated higher.
Alternatively a close below 0.8423 (September 10 low) would pave the way for further weakness to a downside target at 0.8406, the 0.618 Fib extension lower.
Bullish signs are that price is in a rising channel, that it has broken all the way through the previous falling channel and the exhaustion break during August (orange shaded circle) when it accelerated to the downside, which is a reversal sign.
The main bearish sign is the relative shallowness of the rising channel in comparison to the much steeper previous bear move.
The Swedish inflation figures for August could give us a clearer picture of whether the Riksbank sees three or two more rate cuts for the rest of the year. In August, it stated: “If the inflation outlook remains the same, the policy rate can be cut two or three more times this year”. In doing so, it implicitly signaled another possible interest rate cut and almost completely aligned itself with market expectations, Commerzbank’s FX Analyst Antje Praefcke notes.
Inflation figures to be rather neutral for the SEK
“In fact, the underlying inflation trend for the monthly seasonally adjusted rates of change is in line with the inflation target, while the annual rate has even fallen below the 2% target due to base effects (1.3% in June, 1.7% in July). Due to base effects, the annual rate in August could even be slightly below the July figure again. Although the core rate is still slightly above the trend according to seasonally adjusted monthly rates of change and in the annual rate (2.2% in July), it has also stabilized close to the target.”
“In this respect, the inflation figures suggest that the Riksbank is more likely to cut three more times this year — i.e. at every meeting. In addition, the latest growth figures have been disappointing. The economic weakness is an additional argument for a looser monetary policy.”
“The market has already gone a long way in its rate cut expectations and has fully priced in three moves by the end of the year, even seeing a small chance of a little more than 75 basis points in total. The publication of the inflation figures should therefore be rather neutral for the SEK.”
Today’s ECB decision is expected to result in a 25bps cut in the main target rate to 3.50%, Scotiabank’s Chief FX Strategist Shaun Osborne notes.
Focus is on ECB guidance
“The key focus for markets will fall more onto guidance in the statement and President Lagarde’s press conference. Markets are pricing in another 38bps or so of easing in Q4 but it is not clear that the ECB will move rates lower as quickly as markets are currently expecting.”
“A cautious outlook for additional easing would suggest the ECB is comfortable sticking with its 25bps per quarter pace which may extend the EUR a little support.”
“Spot is tracking a little higher intraday but the overall tone for spot looks soft after yesterday’s failed rally and rejection of 1.1050+ levels. Support in the low 1.10s is holding but momentum is tilting risks towards a bit more softness and a test of supports in the high 1.09s.”
- Silver price moves higher towards $29 even though traders pare Fed large rate cut bets.
- The US Dollar and bond yields rise as the US CPI data for August shows signs of stickiness.
- Investors await the US PPI and the Initial Jobless Claims data.
Silver price (XAG/USD) edges higher towards the crucial resistance of $29.00 in Thursday’s European session. The white metal rises slightly despite investors seem confident that the Federal Reserve (Fed) will start reducing interest rates gradually by 25 basis points (bps) to 5.00%-5.25% this month.
Market speculation for the Fed starting to reduce its key borrowing rates aggressively has diminished significantly as Wednesday’s United States (US) Consumer Price Index (CPI) data for August showed signs of stickiness in inflationary pressures. Annual US core inflation - which excludes volatile food and energy prices – rose in line with estimates and the prior release of 3.2%.
Declining market expectation for Fed interest rate cut by 50 bps has uplifted the US Dollar (USD) and bond yields. The US Dollar Index (DXY), which tracks the Greenback’s value against six major currencies, clings to gains near 101.70. 10-year US Treasury yields rise to 3.67%. Generally, higher yields on interest-bearing assets weigh on the Silver price, given that they increase the opportunity cost of holding an investment in non-yielding assets, such as Silver. But, in this case, the Silver price remains firm.
Going forward, investors will focus on the US Producer Price Index (PPI) data for August, which will be published at 12:30 GMT. The core PPI is estimated to have accelerated further. At the same time, investors will also focus on the US Initial Jobless Claims data for the week ending September 6.
The significance of the jobless claims data has increased in last few weeks as recent comments from a string of Fed officials signal that the central bank has become more concerned over preventing job losses.
Silver technical analysis
Silver price trades in a limited range of $27.70-$28.20 from more than a week. The upside in the white metal remains restricted by the 200-period Exponential Moving Average (EMA), which trades around $28.80.
The 14-period Relative Strength Index (RSI) oscillates in the 40.00-60.00 range, exhibiting a sideways trend.
Silver four-hour chart
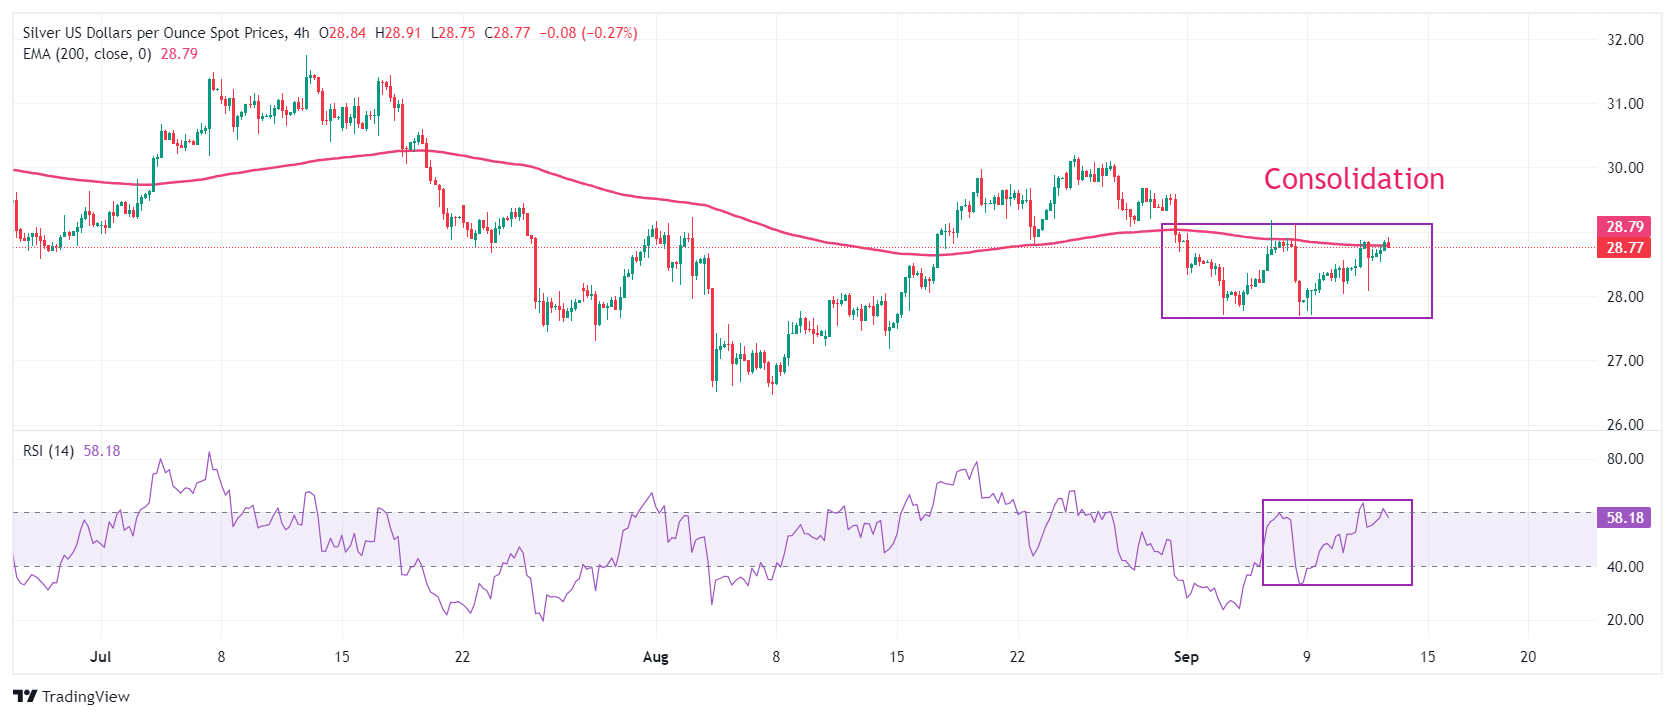
Silver FAQs
Silver is a precious metal highly traded among investors. It has been historically used as a store of value and a medium of exchange. Although less popular than Gold, traders may turn to Silver to diversify their investment portfolio, for its intrinsic value or as a potential hedge during high-inflation periods. Investors can buy physical Silver, in coins or in bars, or trade it through vehicles such as Exchange Traded Funds, which track its price on international markets.
Silver prices can move due to a wide range of factors. Geopolitical instability or fears of a deep recession can make Silver price escalate due to its safe-haven status, although to a lesser extent than Gold's. As a yieldless asset, Silver tends to rise with lower interest rates. Its moves also depend on how the US Dollar (USD) behaves as the asset is priced in dollars (XAG/USD). A strong Dollar tends to keep the price of Silver at bay, whereas a weaker Dollar is likely to propel prices up. Other factors such as investment demand, mining supply – Silver is much more abundant than Gold – and recycling rates can also affect prices.
Silver is widely used in industry, particularly in sectors such as electronics or solar energy, as it has one of the highest electric conductivity of all metals – more than Copper and Gold. A surge in demand can increase prices, while a decline tends to lower them. Dynamics in the US, Chinese and Indian economies can also contribute to price swings: for the US and particularly China, their big industrial sectors use Silver in various processes; in India, consumers’ demand for the precious metal for jewellery also plays a key role in setting prices.
Silver prices tend to follow Gold's moves. When Gold prices rise, Silver typically follows suit, as their status as safe-haven assets is similar. The Gold/Silver ratio, which shows the number of ounces of Silver needed to equal the value of one ounce of Gold, may help to determine the relative valuation between both metals. Some investors may consider a high ratio as an indicator that Silver is undervalued, or Gold is overvalued. On the contrary, a low ratio might suggest that Gold is undervalued relative to Silver.
Data released this morning show Swedish CPIF inflation declined to 1.2% versus a consensus of 1.4% in August, and core CPIF (excluding energy) was on consensus at 2.2%. Like the Fed, the Riksbank is no longer looking too closely at small deviations in the inflation figures, and bumps in some generally volatile series will probably be overlooked in the path to lower rates, ING’s FX strategist Francesco Pesole notes.
EUR/SEK can move back above 11.50
“Markets are currently pricing in 85bp of easing by year-end, which translates into one 25bp cut at each meeting (September, November, December) plus some speculation that one of those will be a 50bp move.”
“Recently, Riksbank Governor Eric Thedeen explicitly said three cuts look more likely than two by year-end, but there hasn’t been much discussion about half-point moves. Given the Riksbank started cutting rates in May and the central bank wants to avoid adding pressure to SEK, we think policymakers will keep moving in 25bp steps.”
“EUR/SEK has been supported in September, as the krona depreciated in line with other pro-cyclical currencies. Despite the Riksbank dovish cuts, SEK is showing much more resilience than its closest peer NOK, which remains vulnerable to speculative selling due to thinner liquidity conditions. In the near term, EUR/SEK could move back above 11.50, but should struggle to rally much further unless the Fed surprises on the hawkish side or, later, Trump wins the US elections.”
- The US Dollar popped higher on Wednesday after a surprise uptick in Core CPI data.
- Markets gear up for another batch of data, with weekly Jobless Claims and PPI.
- The US Dollar Index is on the brink of popping above 102.00, which would break out of its bandwidth from recent weeks.
The US Dollar (USD) trades broadly flat on Thursday, clinging to gains posted on Wednesday after US core inflation surprised to the upside. After the US inflation data,, markets have now nearly fully priced in a 25 basis point (bp) rate cut by the Federal Reserve meeting on September 18, largely ruling out the possibility of a larger cut. Meanwhile, markets will shift focus to the other side of the Atlantic Ocean, where the European Central Bank (ECB) is set to announce a 25-basis-point rate cut.
Amidst the ECB rate decision, a rather full data set out of the US will be released. Besides the weekly Jobless Claims, the Producer Price Index (PPI) will shed more light on the inflation front. Expect thus some volatility across the board for both the Euro and the US Dollar, with the DXY US Dollar Index bound to move substantially.
Daily digest market movers: ECB message will be vital
- The European Central Bank (ECB) will draw most attention this Thursday, with a near certainty of a 25 basis point rate cut. More important will be the message ECB President Christine Lagarde will bring after some concerning headlines regarding the performance of the German economy and other countries in the Eurozone. The rate decision will be published at 12:15 GMT, and the press conference will start at 12:45 GMT.
- In the US, Weekly Jobless Claims will be released near 12:30 GMT, with Initial Claims expected to mildly jump to 230,000 from 227,00. Continuing Claims were previously at 1.838 million.
- Together with the weekly Jobless Claims, the Producer Price Index (PPI) for August will be released:
- The monthly headline PPI is expected to grow at a stable 0.1%, and the yearly headline PPI should ease to 1.8% from 2.2% a month earlier.
- The monthly core PPI is expected to increase by 0.2% after being unchanged a month earlier, while the yearly core PPI is expected to rise by 2.5%, accelerating from the 2.4% increase seen in July.
- The US Treasury will swamp the bond market with a 4-week bill auction at 15:30 GMT, and a 30-year bond auction at 17:00 GMT.
- Equities have priced in the 25 basis point rate cut for the Fed next week, and are jumping higher this Thursday. The ECB set to deliver a rate cut as well, and European equities are rallying over 1% on the day.
- The CME Fedwatch Tool shows a 87.0% chance of a 25 basis points (bps) interest rate cut by the Fed on September 18 against a 13.0% chance for a 50 bps cut. For the meeting on November 7, another 25 bps cut (if September is a 25 bps cut) is expected by 49.3%, while there is a 45.0% chance that rates will be 75 bps (25 bps + 50 bps) and a 5.6% probability of rates being 100 (25 bps + 75 bps) basis points lower.
- The US 10-year benchmark rate trades at 3.67%, off the fresh 15-month low at 3.60%.
US Dollar Index Technical Analysis: Here comes the breakout
The US Dollar Index (DXY) is churning higher this week, testing the higher level of the range it has been trading since the end of August. The level to challenge is 101.90, and it could get broken with some help from the ECB. Seeing the recent weak economic data coming from the Eurozone, the ECB might need to go for more rate cuts to spur the economy. This would widen the rate differential between the US and the Eurozone, resulting. in a stronger US Dollar and a stronger DXY.
The first resistance at 101.90 is getting ready for a third test after its rejection last week and earlier this week. Further up, a steep 1.2% uprising would be needed to get the index to 103.18. The next tranche up is a very misty one, with the 55-day Simple Moving Average (SMA) at 103.40, followed by the 200-day SMA at 103.89, just ahead of the big 104.00 round level.
On the downside, 100.62 (the low from December 28) holds strong and has already made the DXY rebound four times in recent weeks. Should it break, the low from July 14, 2023, at 99.58, will be the ultimate level to look out for. Once that level gives way, early levels from 2023 are coming in near 97.73.
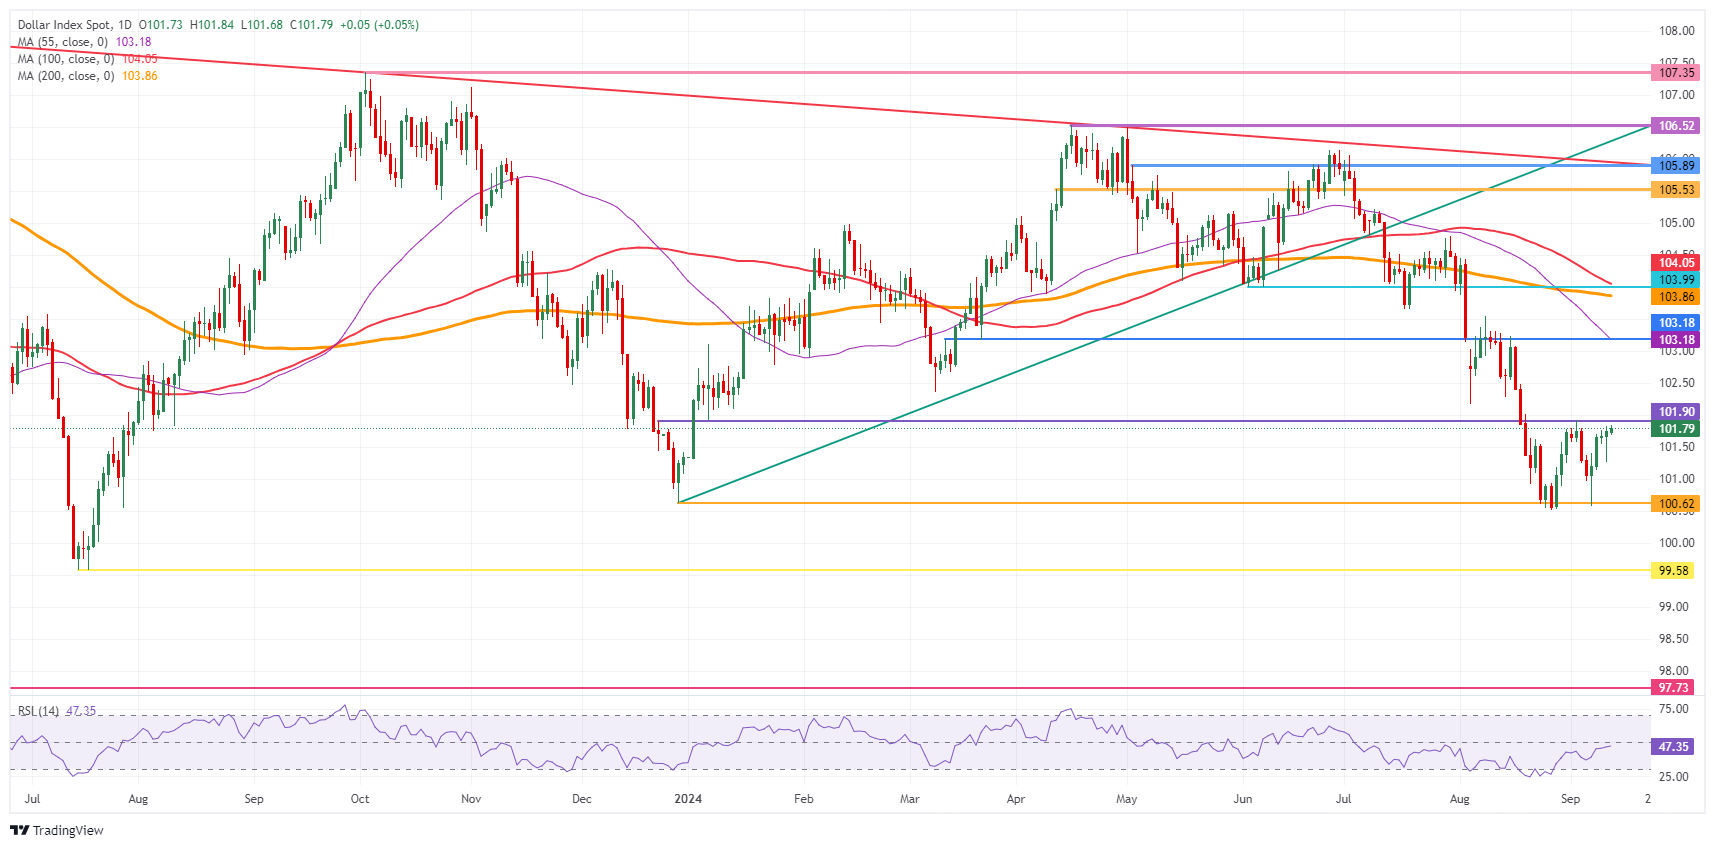
US Dollar Index: Daily Chart
US Dollar FAQs
The US Dollar (USD) is the official currency of the United States of America, and the ‘de facto’ currency of a significant number of other countries where it is found in circulation alongside local notes. It is the most heavily traded currency in the world, accounting for over 88% of all global foreign exchange turnover, or an average of $6.6 trillion in transactions per day, according to data from 2022. Following the second world war, the USD took over from the British Pound as the world’s reserve currency. For most of its history, the US Dollar was backed by Gold, until the Bretton Woods Agreement in 1971 when the Gold Standard went away.
The most important single factor impacting on the value of the US Dollar is monetary policy, which is shaped by the Federal Reserve (Fed). The Fed has two mandates: to achieve price stability (control inflation) and foster full employment. Its primary tool to achieve these two goals is by adjusting interest rates. When prices are rising too quickly and inflation is above the Fed’s 2% target, the Fed will raise rates, which helps the USD value. When inflation falls below 2% or the Unemployment Rate is too high, the Fed may lower interest rates, which weighs on the Greenback.
In extreme situations, the Federal Reserve can also print more Dollars and enact quantitative easing (QE). QE is the process by which the Fed substantially increases the flow of credit in a stuck financial system. It is a non-standard policy measure used when credit has dried up because banks will not lend to each other (out of the fear of counterparty default). It is a last resort when simply lowering interest rates is unlikely to achieve the necessary result. It was the Fed’s weapon of choice to combat the credit crunch that occurred during the Great Financial Crisis in 2008. It involves the Fed printing more Dollars and using them to buy US government bonds predominantly from financial institutions. QE usually leads to a weaker US Dollar.
Quantitative tightening (QT) is the reverse process whereby the Federal Reserve stops buying bonds from financial institutions and does not reinvest the principal from the bonds it holds maturing in new purchases. It is usually positive for the US Dollar.
USDSGD was a touch firmer this morning, on follow-through momentum from the USD bounce after US CPI, real hourly earnings surprised to the upside, OCBC’s FX analysts Frances Cheung and Christopher Wong note.
Markets are waiting for US PPI, initial jobless claims
“Pair was last at 1.3053. Daily momentum is mild bullish while RSI was flat. Consolidation likely. Resistance at 1.3065 (21 DMA), 1.3160 levels (23.6% fibo retracement of 2024 high to low). Support at 1.30, 1.2953 (recent low).”
““S$NEER was last estimated at ~1.88% above our model-implied mid, with model implied spot lower bound at 1.3036. With S$NEER close to its strong end of its band, the room for further downside in USD/SGD may be limited intra-day unless broader USD takes another leg lower, then the implied lower bound of USD/SGD can be lower.”
“We watch US PPI, initial jobless claims later tonight.”
UK rates softened quite a lot yesterday and for the month so far, two-year sterling swap rates are off around 30bp, ING’s FX strategist Chris Turner notes.
EUR/GBP to correct to the 0.8485/8500 area
“It is unclear whether this is a function of the soft UK GDP data yesterday or more just a conviction that rates will be taken lower around the world and that the UK should be no exception – despite radio silence from the Bank of England.”
“If we are right with our call for a back-up in euro rates today, EUR/GBP could correct to the 0.8485/8500 area.”
The case we discussed yesterday has arisen: US core inflation in August was +0.28% above market expectations of +0.2%. This means that if inflation over the next twelve months were to be as high as in August, it would exceed the Fed target. Rates from the previous month are notoriously volatile. Therefore, they have to be smoothed. The exponentially weighted moving average (EWMA) is almost exactly in line with the Fed's target, Commerzbank’s Head of FX and Commodity Research Ulrich Leuchtmann notes.
Rapid interest rate cuts to contain deflation risks
“This means that the market's fear has not been confirmed: that instead of excessively high inflation becoming a problem for the Fed, excessively low inflation will now become the new problem. But at least the current core CPI figures suggest that the Fed's target has already been met and that the talk of the supposedly particularly difficult ‘last mile’ has apparently not materialized. This would give the Fed room to devote its full attention to a weakening labor market.”
“However, the situation in the US labor market is not dramatic enough to justify 100 or even 125 basis points of Fed rate cuts at the next three meetings. This would require a faster and more pronounced cooling of the labor market or even inflation well below target. In this case, rapid interest rate cuts would be advisable because they would contain deflation risks. Yesterday's data indicated that this scenario has not yet materialized. The fact that the USD was unable to appreciate more strongly nonetheless can probably be attributed to two reasons.”
On the one hand, something may yet come that has not yet come. It's easy to identify a clear trend of falling month-on-month inflation rates since 2022. This development might just stop exactly at the Fed's target, if the timing of its interest rate policy has been absolutely perfect. With all due respect, this degree of precision is unlikely. It is more likely that the inflation rate trend will actually slip below the Fed target in the near future. On the other, the US labor market could continue to weaken. All in all, there was no reason yesterday to revalue the USD more than marginally. The days of spectacular USD movements following CPI releases are over.
USD/JPY’s rebound was stopped in its track after BoJ’s Tamura said that BoJ needs to lift rate to 1% by outlook period end (2026), OCBC’s FX analysts Frances Cheung and Christopher Wong note.
The broader direction of travel for USD/JPY us to the downside
“He also said that the neutral rate is at least at 1%. He is perceived as a hawkish member. Yesterday, BoJ’s Nakagama said that real rates are at very low level and that BoJ will continue to adjust the degree of easing if the economy and prices perform in line with expectations.”
“Pair was last seen at 142.78 levels. Daily momentum is not showing a clear bias for now while RSI is flat. Death cross earlier formed with 50-DMA cutting 200-DMA to the downside. Bias to sell rallies. Resistance at 143.70, 145 (21-DMA) and 146.40 (23.6% fibo retracement of Jul high to Aug low). Support at 141.50, 140.70.”
“We reiterate that Fed-BoJ policy shifts and growing pace of normalisation can bring about faster narrowing of UST-JGB yield differentials and this should continue to underpin the broader direction of travel for USD/JPY to the downside.”
Today it's that time again with the ECB meeting, when is allowed to take the stage and play its part. The interest rate decision is not very exciting in itself, as the consensus is expecting a 25-basis point cut in the deposit rate, which would then be reduced to 3.50%. Nevertheless, there are two exciting aspects this time, Commerzbank’s FX Analyst Antje Praefcke notes.
Euro is more likely to lose ground against the USD
“Market players should not be confused if a message suddenly flickers across the screens about ‘ECB cuts main refinancing rate by 60 basis points’. The central bankers decided to reduce the gap between the main refinancing and deposit rates from 50 to 15 basis points when they adjusted their ‘operational framework’ back in March. Like the deposit rate, the marginal lending rate will be reduced by 25 basis points to 3.90%.”
“The far more important aspect, however, is the question of how the cutting cycle will continue. Will the next move come in October, or not until December? Those in favor of October could cite inflation, which was almost on target at 2.2% in August, and the weakness of the economy. Our experts do not expect the next move to come as early as October, and the market is not convinced either, as it currently sees roughly a 40% chance of this happening.”
“And this is precisely the crux of the matter for the euro. Because if President Lagarde continues to emphasize the data dependency of the decision, the market could interpret this to mean that the next interest rate hike could follow as early as October. The euro could come under pressure and presumably dip further with every weaker price or economic figure in the coming weeks. For me, the risks for the euro are asymmetrically distributed today. Although the single currency is setting the tone in EUR/USD today, I fear that the euro is more likely to lose ground against the dollar.”
- Crude Oil pops above a crucial pivotal level as it recovers for a second day in a row.
- Tropical storm Francine hits Louisiana, with several on- and offshore installations in the region evacuated.
- The US Dollar Index trades above 101.50 and tests its upper boundary of its bandwidth for a break higher.
Crude Oil pops over 1.50% for a second day in a row after booking over 1.50% gains on Wednesday, which was the biggest daily gain for Crude Oil in two weeks. The uptick comes amid increasing concerns over the impact of tropical storm Francine on US production and after the most recent OPEC report – which cut the outlook for Oil demand – was deemed unrealistic considering recent US and global economic activity.
The US Dollar Index (DXY), which tracks the performance of the US Dollar (USD) against a basket of currencies, is stronger and tests the upper band of its tight bandwidth in which it has been trading for over two weeks. The stronger Greenback emerged after US Consumer Price Index data revealed a surprise uptick in the monthly core measure. That closed the door for a 50-basis-point rate cut from the US Federal Reserve next week, supporting the US Dollar.
At the time of writing, Crude Oil (WTI) trades at $67.93 and Brent Crude at $71.57
Oil news and market movers: Statistics add up
- The International Energy Agency (IEA) released its monthly report, which showed that the recent outage from Libya triggered a 70,000 barrels per day decline in OPEC’s daily output. Supply from Libya declined by 180,000 barrels per day to 980,000, Bloomberg reported.
- The IEA also reported that supply from the Gulf producers was largely steady, with Saudi output unchanged at 9.01 million barrels per day, Iraq at 4.38 million b/d, UAE at 3.3 million b/d and Kuwait at 2.52 million b/d, Reuters reports.
- In the US, tropical storm Francine has hit the coast of Louisiana, reaching a Category 2 strength. Oil and gas companies had previously evacuated offshore platforms in the Gulf of Mexico, Reuters reported.
Oil Technical Analysis: Damned if you do, and damned if you don’t
Crude Oil price is set for volatility, and it has no one other than OPEC to thank for it. Still, the chances for more downside look higher than the potential for rebound. Should OPEC tweak its policy and prolong production cuts, or broaden them, markets could interpret it as a sign of weakness and perceive it as the situation is far more dire than anticipated. In case it does nothing, markets will likely remain focused on oversupply.
Oil has a long road to recovery ahead before heading back above $75. First up is $67.11, which needs to see a daily close above at least. Once that level gets reclaimed, $70.00 gets back on the table with $71.46 as the first level to look out for. Ultimately, a return to $75.27 is still possible, but would likely come due to a seismic shift in current balances.
The next level further down the line is $64.38, the low from March and May 2023. Should that level face a second test and snap, $61.65 becomes a target, with of course $60.00 as a psychologically big figure just below it, at least tempting to be tested.
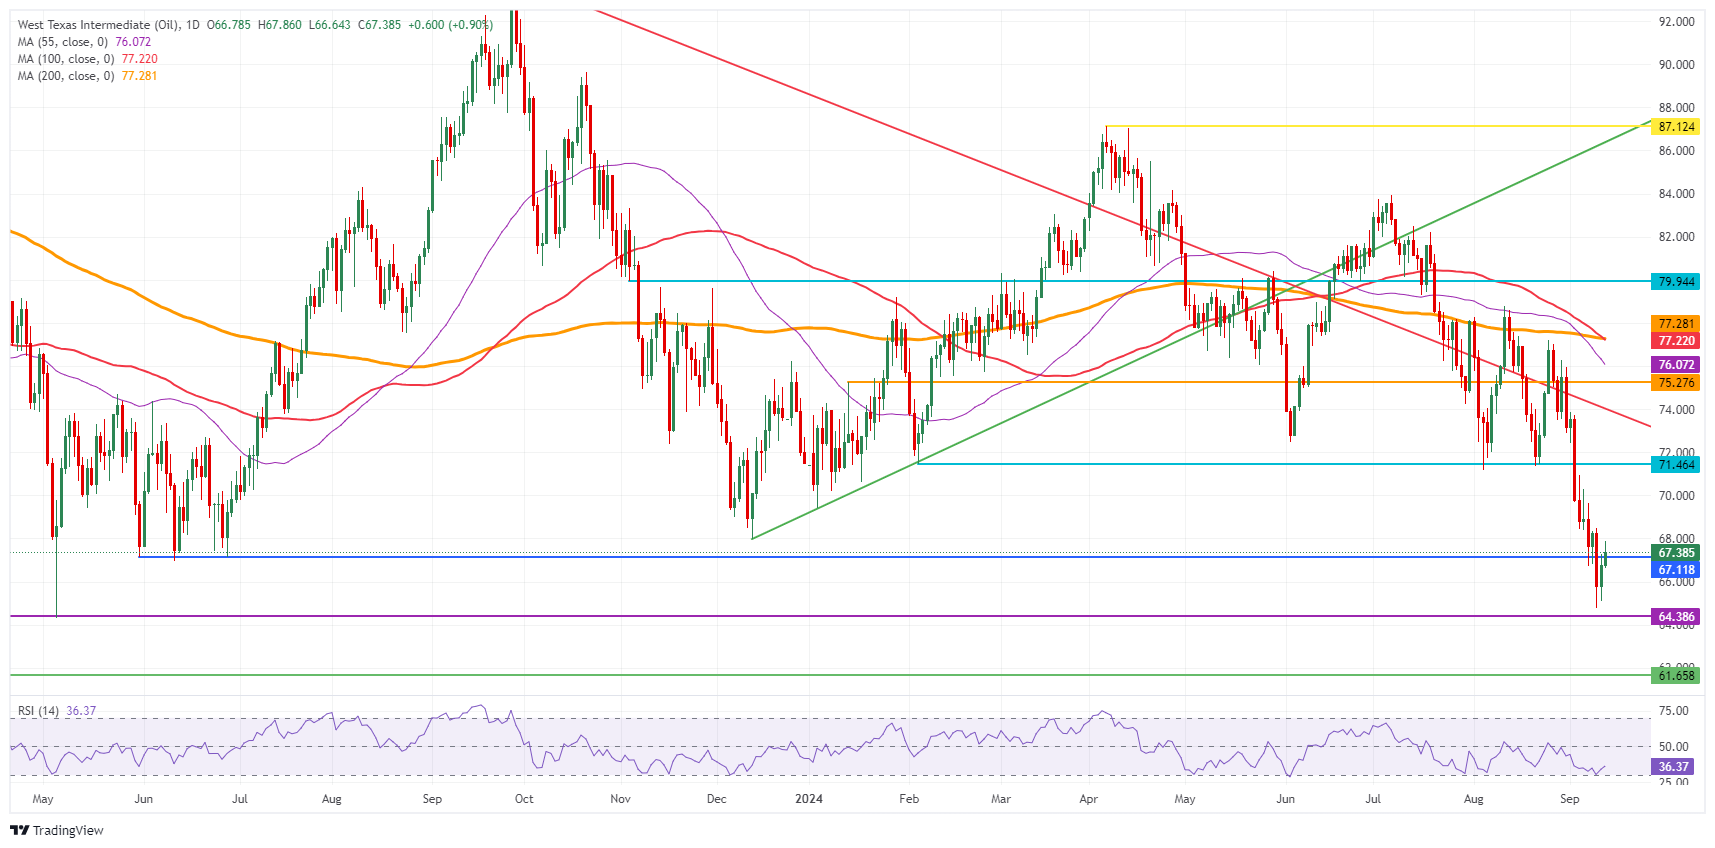
US WTI Crude Oil: Daily Chart
WTI Oil FAQs
WTI Oil is a type of Crude Oil sold on international markets. The WTI stands for West Texas Intermediate, one of three major types including Brent and Dubai Crude. WTI is also referred to as “light” and “sweet” because of its relatively low gravity and sulfur content respectively. It is considered a high quality Oil that is easily refined. It is sourced in the United States and distributed via the Cushing hub, which is considered “The Pipeline Crossroads of the World”. It is a benchmark for the Oil market and WTI price is frequently quoted in the media.
Like all assets, supply and demand are the key drivers of WTI Oil price. As such, global growth can be a driver of increased demand and vice versa for weak global growth. Political instability, wars, and sanctions can disrupt supply and impact prices. The decisions of OPEC, a group of major Oil-producing countries, is another key driver of price. The value of the US Dollar influences the price of WTI Crude Oil, since Oil is predominantly traded in US Dollars, thus a weaker US Dollar can make Oil more affordable and vice versa.
The weekly Oil inventory reports published by the American Petroleum Institute (API) and the Energy Information Agency (EIA) impact the price of WTI Oil. Changes in inventories reflect fluctuating supply and demand. If the data shows a drop in inventories it can indicate increased demand, pushing up Oil price. Higher inventories can reflect increased supply, pushing down prices. API’s report is published every Tuesday and EIA’s the day after. Their results are usually similar, falling within 1% of each other 75% of the time. The EIA data is considered more reliable, since it is a government agency.
OPEC (Organization of the Petroleum Exporting Countries) is a group of 13 Oil-producing nations who collectively decide production quotas for member countries at twice-yearly meetings. Their decisions often impact WTI Oil prices. When OPEC decides to lower quotas, it can tighten supply, pushing up Oil prices. When OPEC increases production, it has the opposite effect. OPEC+ refers to an expanded group that includes ten extra non-OPEC members, the most notable of which is Russia.
In its monthly oil market report published on Thursday, the International Energy Agency (IEA) cut 2024 global oil demand growth forecast to 903,000 barrels per day (b/d) from 970,000 b/d.
Additional takeaways
China slowdown will continue to weigh on global oil demand growth.
Global oil-demand growth continues to decelerate.
Global demand rose by 800,000 b/d on year in 1H.
Global downturn driven by rapid slowdown in Chinese consumption.
Keeps 2025 global oil-demand growth forecast broadly stable at 954,000 b/d.
Trims 2024 total demand forecast to average of 103 mln b/d from 103.1 mln b/d.
Keeps 2024 non-OPEC+ production growth estimate at 1.5 mln b/d.
Trims 2025 total demand forecast to average of 103.9 mln b/d from 104 mln b/d.
Keeps 2025 non-OPEC+ production growth estimate at 1.5 mln b/d.
Global oil supply rose by 80,000 b/d in August, partly due to libyan losses.
Keeps 2024 total oil-supply forecast at average of 102.9 mln b/d.
Slightly raises 2025 total oil-supply forecast to average of 105 mln b/d from 104.9 mln b/d.
Lowers 2024 global refinery output forecast to 83 mln b/d from 83.3 mln b/d.
Lowers 2025 global refinery output forecast to 83.7 mln b/d from 83.9 mln b/d.
Russian oil exports fell by 290,000 b/d on-month to 7 mln b/d in August.
Russian commercial export revenue fell by $1.6 bln on-month to $15.3 bln in August.
- Gold trades in a narrow range just below its record highs.
- US “factory gate” price inflation and the ECB meeting could impact the precious metal on Thursday.
- Risk sentiment turns upbeat, however, curbing enthusiasm for the safe-haven.
Gold (XAU/USD) continues trading in its established range just below its all-time high on Thursday, as traders await more US inflation data, this time in the form of “factory gate” price inflation, or the Producer Price Index (PPI) for August. The data could further impact expectations regarding the trajectory of US interest rates, which in turn will likely impact both the price of Gold and the US Dollar (USD).
In addition, Thursday’s European Central Bank (ECB) meeting could further impact Gold price, depending on how much easing the ECB decides to implement. The bank will also republish its economic projections, with fears it could radically revise down economic growth and inflation forecasts for the region in light of recent downbeat data from Germany, the largest member of the bloc.
Market sentiment turns positive, meanwhile, after Asian stocks rose overnight, commodities rebounded, and European bourses clock gains. The upbeat mood is likely to weigh on safe-haven Gold.
Gold fell after US inflation data showed rise in core component
Gold price weakened on Wednesday, falling from the range highs to a low of around $2,500 after the release of US Consumer Price Index (CPI) data for August showed a higher-than-expected uptick in core CPI of 0.3% versus expectations of 0.2% and 0.2% previously.
The stickier-than-expected core CPI led traders to downgrade the probabilities of the Federal Reserve (Fed) cutting interest rates by a larger 0.50% at their meeting next week, with expectations rising for a more cautious 0.25% cut instead.
The data lifted the US Dollar but weighed on Gold as the expectation that interest rates might remain elevated for longer reduces the attractiveness of non-interest-paying assets, like Gold.
The release of PPI data on Thursday, as well as the conclusion of the ECB policy meeting, could further calibrate expectations regarding the future course of interest rates globally – a key driver for Gold.
US Jobless Claims data could also influence the trajectory of the yellow metal given the Fed’s focus on the weakening labor market.
Technical Analysis: Gold makes multiple touches to top-of-range
Gold (XAU/USD) trades back in the middle of its multi-week sideways range after briefly retesting the all-time high of $2,531 on Wednesday.
As seen from the chart below, Gold price has tested the ceiling of the range on multiple occasions (orange-shaded circles) and, according to technical analysis theory, this suggests that if it does eventually break through, the move will be volatile.
XAU/USD 4-hour Chart

The longer-term trend for Gold is bullish, and since “the trend is your friend,” this increases the odds of an eventual breakout higher materializing.
The precious metal has an as-yet unreached bullish target at $2,550, generated after the original breakout from the July-August range on August 14. If Gold breaks above the range highs, it will probably rapidly reach its goal.
A break above the August 20 all-time high of $2,531 would provide more confirmation of a continuation higher toward the $2,550 target.
The short-term trend is now sideways, however, so it is also quite possible the yellow metal will continue trading up and down within its multi-week range between the $2,480s and the $2,531 record high.
If Gold closes below $2,460 it would change the picture and bring the bullish bias into question.
Economic Indicator
Producer Price Index (YoY)
The Producer Price Index released by the Bureau of Labor statistics, Department of Labor measures the average changes in prices in primary markets of the US by producers of commodities in all states of processing. Changes in the PPI are widely followed as an indicator of commodity inflation. Generally speaking, a high reading is seen as positive (or bullish) for the USD, whereas a low reading is seen as negative (or bearish).
Read more.Next release: Thu Sep 12, 2024 12:30
Frequency: Monthly
Consensus: 1.8%
Previous: 2.2%
Source: US Bureau of Labor Statistics
- USD/CAD turns sideways near 1.3570 after correcting from a three-week high of 1.3623.
- Investors await the US PPI for August and the weekly Initial Jobless Claims data.
- Sticky US core inflation cements Fed smaller rate cut prospects.
The USD/CAD pair trades in a tight range near 1.3570 in Thursday’s European session after falling from a three-week high near 1.3620 on Wednesday. The Loonie asset could recover sooner as the US Dollar (USD) trades close to a fresh weekly high, with the US Dollar Index (DXY), which tracks the Greenback’s value against six major currencies, trading near 101.80.
The outlook for the US Dollar has improved as investors see the Federal Reserve (Fed) starting to reduce interest rates gradually. For the past few weeks, traders have been split over whether the Fed will deliver 25-basis points (bps) or a 50-bps interest rate cut in September. The United States (US) Consumer Price Index (CPI) data for August, released on Wednesday, showed signs of stickiness in inflationary pressures, which forced traders to pare Fed sizeable interest rate cut bets.
In today’s session, investors will focus on the US Producer Price Index (PPI) data for August and the Initial Jobless Claims for the week ending September 6, which will be published at 12:30 GMT.
Meanwhile, the Canadian Dollar (CAD) has come under pressure amid growing speculation that the Bank of Canada (BoC) will cut interest rates again this year. Investors seem to be confident that the BoC will extend its policy-easing cycle as the Canadian labor market conditions continue to deteriorate. August job data showed that the Unemployment Rate rose to 6.6%. The BoC has already reduced its key borrowing rates by 75 basis points (bps) to 4.25% this year.
USD/CAD delivers a mean reversion to near the 200-day Exponential Moving Average (EMA), which trades around 1.3620. The near-term outlook of the pair appears to be bearish as the 14-day Relative Strength Index (RSI) has shifted into the bearish range of 20.00-60.00 from 40.00-80.00.
The horizontal resistance plotted from May 15 low of 1.3590 continues to act as a major barricade for the US Dollar bulls.
An upside recovery above August 21 high of 1.3626 would drive the asset towards 19 August high of 1.3687 and August 15 high of 1.3738.
On the flip side, further correction below April 5 low of 1.3540 will drag the asset towards the psychological support of 1.3500, followed by September 6 low of 1.3466.
USD/CAD daily chart
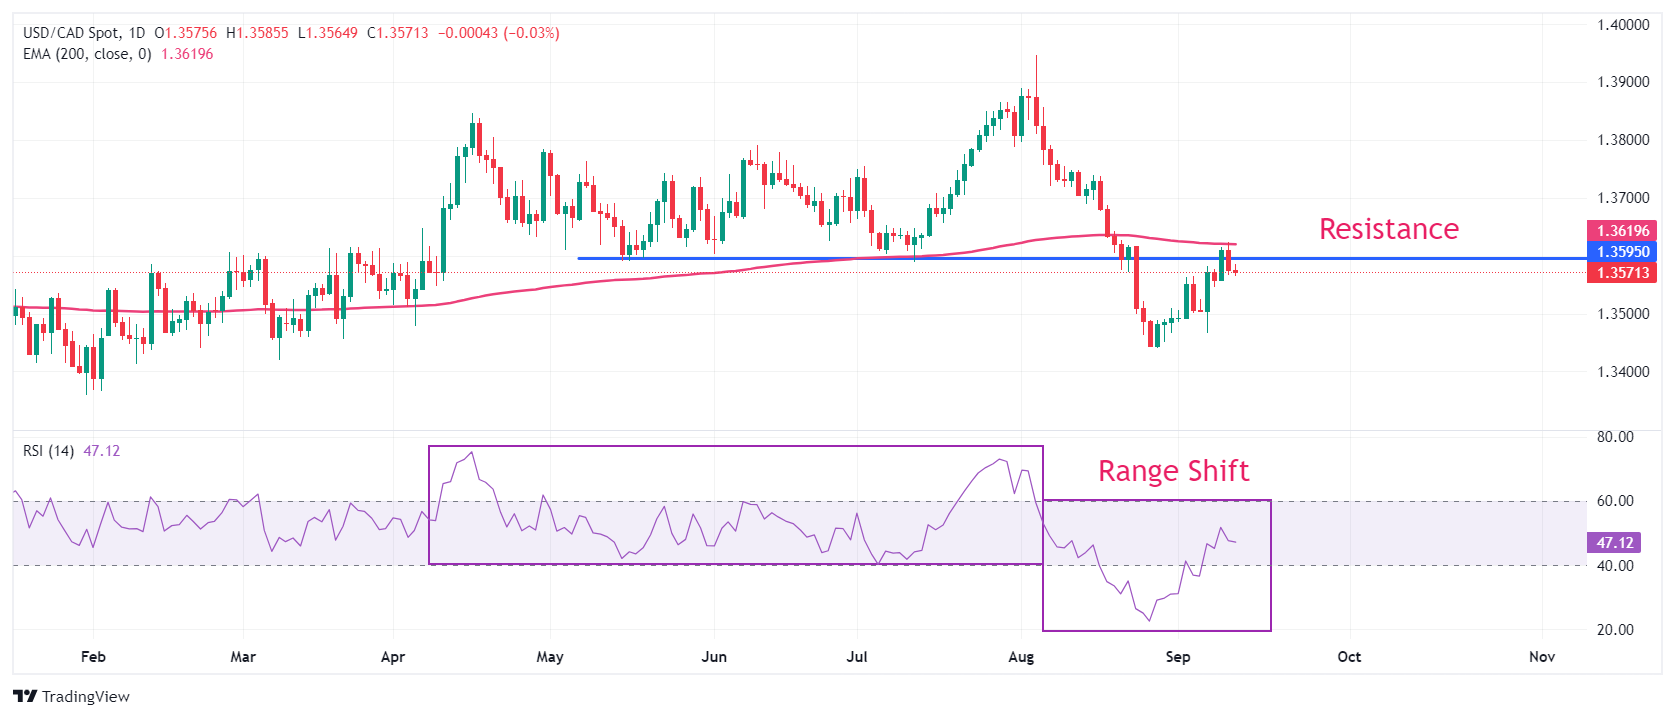
Canadian Dollar FAQs
The key factors driving the Canadian Dollar (CAD) are the level of interest rates set by the Bank of Canada (BoC), the price of Oil, Canada’s largest export, the health of its economy, inflation and the Trade Balance, which is the difference between the value of Canada’s exports versus its imports. Other factors include market sentiment – whether investors are taking on more risky assets (risk-on) or seeking safe-havens (risk-off) – with risk-on being CAD-positive. As its largest trading partner, the health of the US economy is also a key factor influencing the Canadian Dollar.
The Bank of Canada (BoC) has a significant influence on the Canadian Dollar by setting the level of interest rates that banks can lend to one another. This influences the level of interest rates for everyone. The main goal of the BoC is to maintain inflation at 1-3% by adjusting interest rates up or down. Relatively higher interest rates tend to be positive for the CAD. The Bank of Canada can also use quantitative easing and tightening to influence credit conditions, with the former CAD-negative and the latter CAD-positive.
The price of Oil is a key factor impacting the value of the Canadian Dollar. Petroleum is Canada’s biggest export, so Oil price tends to have an immediate impact on the CAD value. Generally, if Oil price rises CAD also goes up, as aggregate demand for the currency increases. The opposite is the case if the price of Oil falls. Higher Oil prices also tend to result in a greater likelihood of a positive Trade Balance, which is also supportive of the CAD.
While inflation had always traditionally been thought of as a negative factor for a currency since it lowers the value of money, the opposite has actually been the case in modern times with the relaxation of cross-border capital controls. Higher inflation tends to lead central banks to put up interest rates which attracts more capital inflows from global investors seeking a lucrative place to keep their money. This increases demand for the local currency, which in Canada’s case is the Canadian Dollar.
Macroeconomic data releases gauge the health of the economy and can have an impact on the Canadian Dollar. Indicators such as GDP, Manufacturing and Services PMIs, employment, and consumer sentiment surveys can all influence the direction of the CAD. A strong economy is good for the Canadian Dollar. Not only does it attract more foreign investment but it may encourage the Bank of Canada to put up interest rates, leading to a stronger currency. If economic data is weak, however, the CAD is likely to fall.
The Dollar Index (DXY) initially fell to 101.27 from 101.68 during the US Presidential debate, DBS Senior FX Strategist Philip Wee notes.
Waiting for Fed’s Summary of Economic Projections
“Vice President Kamala Harris beat former President Donald Trump and won the endorsement of Taylor Swift. However, a higher-than-expected US CPI core inflation, which rose by 0.3% MoM in August instead of staying unchanged at July’s pace of 0.2%, lifted the DXY Index from 101.40 to 101.80.”
“During this period, the greenback became a haven on a sell-off in US equities from the futures market pulling back their bets for a 50 bps cut at the FOMC meeting on September 18. Following a 1.6% drop to 5407, the S&P 500 staged a steady recovery and ended Wednesday 1% higher at 5554, keeping the DXY in the 101.65-101.75 range for the rest of the session. The US Treasury 2Y yield rose 4.7 bps to 3.64%, while the 10Y yield edged up by 1.1 bps to 3.65%.”
“Despite expectations for today’s PPI core inflation to rise 0.2% MoM in August from 0% in July, mirroring its CPI counterpart, they do not change our long-held expectations for the Fed to lower rates by 25 bps next week. The Fed will also release its Summary of Economic Projections, which will provide insights on how concerned it is about averting a further cooling in the labour market. DXY is still keeping to its three-week range of 100.5-101.9.”
Yesterday's slightly higher-than-expected core US CPI for August saw 7bp priced out of the expected 2024 Fed easing cycle. Yet 100bp is still priced in. We doubt those expectations change meaningfully today. In focus will be the August PPI readings and the weekly initial claims data, ING’s FX strategist Chris Turner notes.
101.90/102.00 resistance should hold in DXY
“This year, PPI readings have taken on greater focus as the market analyses key components such as portfolio management fees, healthcare costs and airfares which read through to the Fed's preferred measure of inflation, the core PCE deflator. However, now that the Fed has declared ‘the time has come’ to start cutting rates, financial markets will be far less worried by the inflation data prints and have shifted their focus squarely on activity data – particularly jobs data. Here the holiday-shortened week probably means that initial claims data today will remain low near 225,000. In short, not a lot new from the US calendar.”
“The reason we have a down arrow on the dollar today is that the risk environment looks slightly better bid today and we are looking for a slightly stronger euro – which has a large weight in the DXY. Overnight, tech stocks (particularly Nvidia) saw the S&P 500 end up 1% and have sparked some decent rallies across Asia. There is also a small risk that Chinese leaders announce some fiscal support measures – potentially targeted at consumers – at this week's National People's Congress.”
“A budget tweak was made at the same meeting this time last year. Any moves to address weak Chinese demand would be most welcome and break the stagnation fears stalking markets (especially energy markets) this week. If we are right with our EUR/USD call below, c and we can end the day closer to 101.00.”
- EUR/USD exhibits uncertainty near 1.1000 ahead of the ECB’s policy decision.
- The ECB is expected to cut the Rate On Deposit Facility by 25 bps to 3.5%.
- Sticky US inflation data cements Fed’s 25 bps interest rate cut prospects for next week’s policy meeting.
EUR/USD struggles near more than a three-week low, around 1.1000 in Thursday’s European session. The major currency pair remains on tenterhooks, with investors focusing on the European Central Bank’s interest rate decision, which will be announced at 12:15 GMT. The ECB is widely anticipated to cut the Rate On Deposit Facility by 25 basis points (bps) to 3.5%.
This will be the second interest rate cut by the ECB in its current policy easing cycle, which it started in June after gaining confidence that inflationary pressures in the Eurozone will return to the central bank’s target of 2% in 2025. The ECB left its key borrowing rates steady in July as officials seemed worried that an aggressive monetary stance could revamp price pressures again.
Market speculation for the ECB reducing interest rates on Thursday strengthened due to a sharp decline in Eurozone price pressures and growing risks to Germany’s economic growth, the largest nation of the old continent. The German economy contracted by 0.1% in the second quarter of the year and is exposed to a recession due to a poor demand environment.
Given that the ECB is almost certain to cut interest rates again on Thursday, investors will keenly focus on cues about the interest rate cut path. “The ECB is unlikely to offer enough information through forward guidance or new economic forecasts to justify another rate cut in October,” “Our house view remains 25bp rate cuts today and December 12”, said Chris Turner, analyst at ING.
Daily digest market movers: EUR/USD remains on the back foot as US Dollar posts fresh weekly high
- EUR/USD remains under pressure as the US Dollar (USD) refreshes its weekly high during European trading hours on Thursday. The US Dollar Index (DXY), which tracks the Greenback’s value against six major currencies, rises to nearly 101.80. The Greenback gains further as signs of stickiness in the United States (US) Consumer Price Index (CPI) data for August forced traders to pare bets supporting the Federal Reserve (Fed) to start reducing interest rates this month aggressively.
- Wednesday’s CPI data showed that the annual core inflation – which excludes volatile food and energy prices – rose by 3.2%, as expected. The monthly core CPI rose by 0.3%, faster than estimates and the prior release of 0.2%. However, the annual headline CPI grew by 2.5%, slower than the expected 2.6% and July’s print of 2.9% due to lower energy prices. Historically, Fed officials give more weightage to core inflation as it excludes those volatile items, which are guided by global and environmental forces.
- The sticky US core inflation data cemented market expectations for the Fed to begin reducing its key borrowing rates gradually. According to the CME FedWatch tool, the probability of the Fed reducing interest rates by 50 basis points (bps) to 4.75%-5.00% in September has diminished to 13% from 40% a week ago.
- In Thursday’s session, market participants will focus on the US Producer Price Index (PPI) data for August and the Initial Jobless Claims data for the week ending September 6, which will be published at 12:30 GMT. The significance of the jobless claims data has increased as recent comments from an array of Fed officials signal that the central bank has become more concerned about reviving job growth.
Technical Analysis: EUR/USD hovers near 1.1000
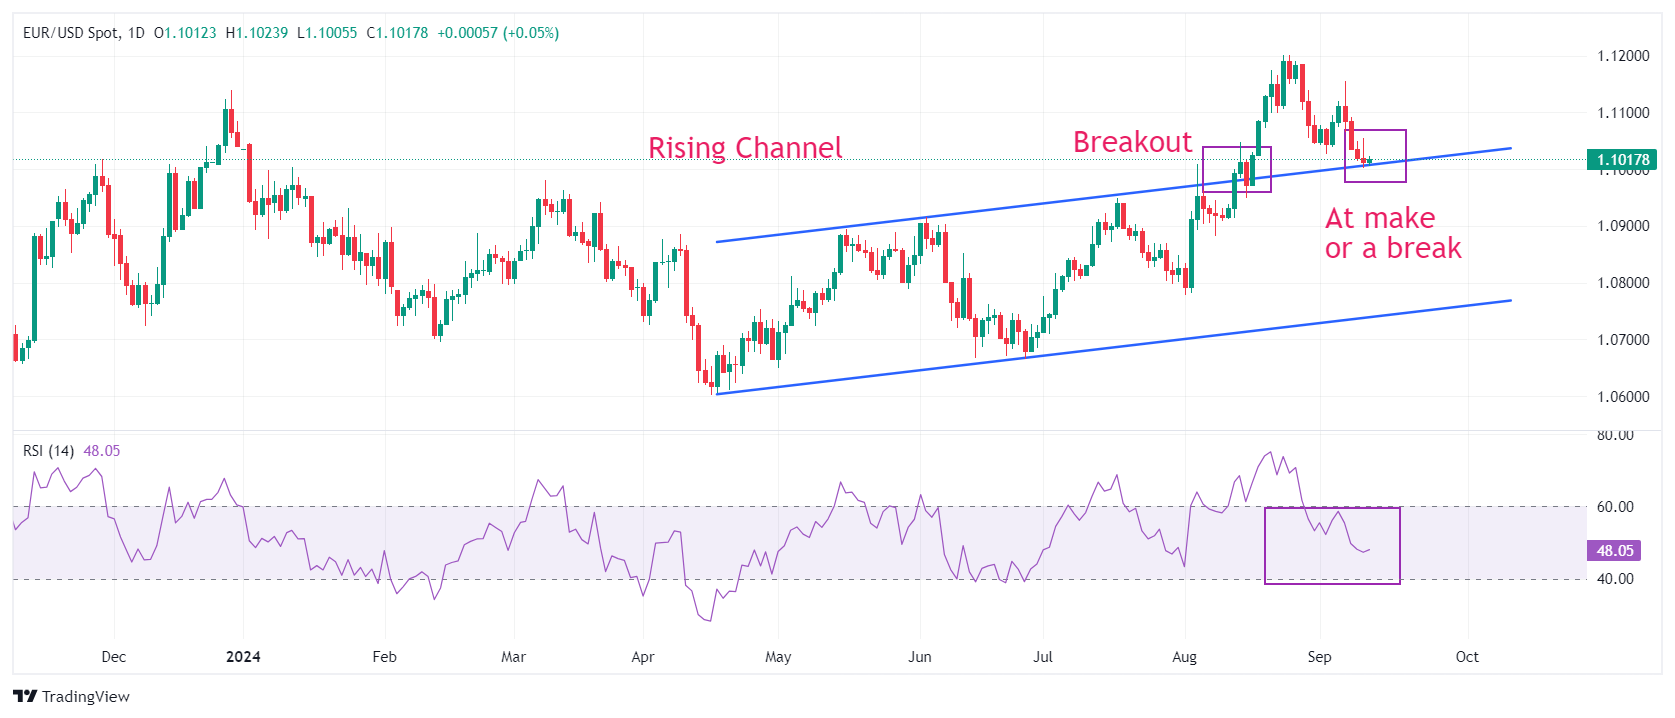
EUR/USD trades at make or a break near 1.1000 ahead of the ECB’s interest rate policy decision. The pair has corrected to near the upper line of a Rising Channel formation in the daily timeframe, from where it delivered a breakout on August 14, which resulted in a sharp upside move. The 20-day Exponential Moving Average (EMA) near 1.1047 acts as a major resistance for the Euro bulls.
The 14-day Relative Strength Index (RSI) falls further below 50.00, suggesting that the near-term outlook is uncertain.
The pair continues to hold the psychological level of 1.1000. A downside move below the same would drag the asset toward the July 17 high near 1.0950. On the upside, last week’s high of 1.1155 and the round-level resistance of 1.1200 will act as major barricades for the Euro bulls.
Euro FAQs
The Euro is the currency for the 20 European Union countries that belong to the Eurozone. It is the second most heavily traded currency in the world behind the US Dollar. In 2022, it accounted for 31% of all foreign exchange transactions, with an average daily turnover of over $2.2 trillion a day. EUR/USD is the most heavily traded currency pair in the world, accounting for an estimated 30% off all transactions, followed by EUR/JPY (4%), EUR/GBP (3%) and EUR/AUD (2%).
The European Central Bank (ECB) in Frankfurt, Germany, is the reserve bank for the Eurozone. The ECB sets interest rates and manages monetary policy. The ECB’s primary mandate is to maintain price stability, which means either controlling inflation or stimulating growth. Its primary tool is the raising or lowering of interest rates. Relatively high interest rates – or the expectation of higher rates – will usually benefit the Euro and vice versa. The ECB Governing Council makes monetary policy decisions at meetings held eight times a year. Decisions are made by heads of the Eurozone national banks and six permanent members, including the President of the ECB, Christine Lagarde.
Eurozone inflation data, measured by the Harmonized Index of Consumer Prices (HICP), is an important econometric for the Euro. If inflation rises more than expected, especially if above the ECB’s 2% target, it obliges the ECB to raise interest rates to bring it back under control. Relatively high interest rates compared to its counterparts will usually benefit the Euro, as it makes the region more attractive as a place for global investors to park their money.
Data releases gauge the health of the economy and can impact on the Euro. Indicators such as GDP, Manufacturing and Services PMIs, employment, and consumer sentiment surveys can all influence the direction of the single currency. A strong economy is good for the Euro. Not only does it attract more foreign investment but it may encourage the ECB to put up interest rates, which will directly strengthen the Euro. Otherwise, if economic data is weak, the Euro is likely to fall. Economic data for the four largest economies in the euro area (Germany, France, Italy and Spain) are especially significant, as they account for 75% of the Eurozone’s economy.
Another significant data release for the Euro is the Trade Balance. This indicator measures the difference between what a country earns from its exports and what it spends on imports over a given period. If a country produces highly sought after exports then its currency will gain in value purely from the extra demand created from foreign buyers seeking to purchase these goods. Therefore, a positive net Trade Balance strengthens a currency and vice versa for a negative balance.
ECB policy decision is due today (815pm SG time) followed by Lagarde’s press conference (845pm SGT). Softer CPI prints out of Euro-area, Germany and Spain and softer mfg PMI readings added to expectation that ECB should be on course to lower rate again, OCBC’s FX analysts Frances Cheung and Christopher Wong note.
Rate cut decision is more or less a done deal
“Markets have priced in 25bp cut at this meeting and about 38bp cut for remainder of the year (another 1.5 cut). While a rate cut decision is more or less a done deal, focus is on Lagarde’s press conference and staff macroeconomic projection. So far, ECB officials have not been outright dovish, and officials seemed to posture for a more gradual pace when it comes to policy easing.”
“Potentially, ECB may even turn out to be a non-event if officials reiterate that policy is not on a preset cycle and policy making remains data dependent. EUR was last seen at 1.1010 levels. Bearish momentum on daily chart intact while RSI fell. Risks are skewed to the downside for now.”
“Support at 1.0970 (50 DMA, 38.2% fibo retracement of 2024 low to high), 1.09 (50% fibo). Resistance at 1.1060 (23.6% fibo), 1.1080 (21 DMA).”
Silver prices (XAG/USD) rose on Thursday, according to FXStreet data. Silver trades at $28.80 per troy ounce, up 0.41% from the $28.68 it cost on Wednesday.
Silver prices have increased by 21.04% since the beginning of the year.
| Unit measure | Silver Price Today in USD |
|---|---|
| Troy Ounce | 28.80 |
| 1 Gram | 0.93 |
The Gold/Silver ratio, which shows the number of ounces of Silver needed to equal the value of one ounce of Gold, stood at 87.38 on Thursday, down from 87.57 on Wednesday.
Silver FAQs
Silver is a precious metal highly traded among investors. It has been historically used as a store of value and a medium of exchange. Although less popular than Gold, traders may turn to Silver to diversify their investment portfolio, for its intrinsic value or as a potential hedge during high-inflation periods. Investors can buy physical Silver, in coins or in bars, or trade it through vehicles such as Exchange Traded Funds, which track its price on international markets.
Silver prices can move due to a wide range of factors. Geopolitical instability or fears of a deep recession can make Silver price escalate due to its safe-haven status, although to a lesser extent than Gold's. As a yieldless asset, Silver tends to rise with lower interest rates. Its moves also depend on how the US Dollar (USD) behaves as the asset is priced in dollars (XAG/USD). A strong Dollar tends to keep the price of Silver at bay, whereas a weaker Dollar is likely to propel prices up. Other factors such as investment demand, mining supply – Silver is much more abundant than Gold – and recycling rates can also affect prices.
Silver is widely used in industry, particularly in sectors such as electronics or solar energy, as it has one of the highest electric conductivity of all metals – more than Copper and Gold. A surge in demand can increase prices, while a decline tends to lower them. Dynamics in the US, Chinese and Indian economies can also contribute to price swings: for the US and particularly China, their big industrial sectors use Silver in various processes; in India, consumers’ demand for the precious metal for jewellery also plays a key role in setting prices.
Silver prices tend to follow Gold's moves. When Gold prices rise, Silver typically follows suit, as their status as safe-haven assets is similar. The Gold/Silver ratio, which shows the number of ounces of Silver needed to equal the value of one ounce of Gold, may help to determine the relative valuation between both metals. Some investors may consider a high ratio as an indicator that Silver is undervalued, or Gold is overvalued. On the contrary, a low ratio might suggest that Gold is undervalued relative to Silver.
(An automation tool was used in creating this post.)
The ECB announces its rates decision today at 1415CET. The deposit rate is widely expected to be cut by 25bp to 3.50%, while in a technical adjustment, the Main Refinancing Rate will be cut by 60bp, ING’s FX strategist Chris Turner notes.
EUR/USD to enjoy a modest bounce towards the 1.1080 area
“Our core view today is that the ECB will not offer the market enough information (be it forward guidance or new economic forecasts) to justify the roughly 11bp of easing priced in for the 17 October meeting. Our house view remains 25bp rate cuts today and 12 December. If we're right, EUR/USD should be able to enjoy a modest bounce towards the 1.1080 area.”
“Elsewhere, we have a speech from outgoing Swiss National Bank President Thomas Jordan at 1625CET today. He's speaking at a Swiss Bankers Association event. It is not clear he will stray near monetary policy in his speech, but we are very surprised to see the market pricing 32bp of rate cuts for the 26 September meeting.”
“We very much doubt it would be cut by more than 25bp since with an already very low policy rate (1.25%) it has far less room to cut. In addition, the economy has been performing quite well. EUR/CHF could rally today if the short end of the euro curve backs up on the ECB today. But we imagine it would meet sellers against in the 0.9450 area.”
- AUD/JPY offers its daily profits following reports that China is preparing to cut rates on $5 trillion worth of mortgages.
- Australia's Consumer Inflation Expectations eased to 4.4% in September, slightly down from the four-month high of 4.5% recorded in August.
- BoJ board member Naoki Tamura stated that there is no predetermined plan for the pace of future rate hikes.
AUD/JPY trims its intraday gains, still trading higher around 95.10 during the European session on Thursday. The Australian Dollar (AUD) appreciated against its peers, driven by improved risk-on sentiment amid rising odds of the Federal Reserve (Fed) beginning its easing cycle with a 25-basis points interest rate cut in September.
However, the Aussie Dollar receives downward pressure as China, one of Australia's key trading partners, is reportedly set to cut interest rates on $5 trillion worth of mortgages as soon as this month. According to Bloomberg, several Chinese banks are already finalizing preparations for these mortgage rate adjustments, which could take effect as early as September.
Australia’s Consumer Inflation Expectations eased to 4.4% in September, down slightly from August's four-month high of 4.5%. This decline highlights the central bank's efforts to strike a balance between bringing inflation down within a reasonable timeframe and maintaining gains in the labor market.
The former Reserve Bank of Australia (RBA) Governor Bernie Fraser criticized the current RBA board for being overly focused on inflation at the expense of the job market. Fraser suggested that the Board should lower the cash rate, warning of "recessionary risks" that could have severe consequences for employment.
The Japanese Yen (JPY) remains subdued following the remarks from the Bank of Japan (BoJ) board member Naoki Tamura. Tamura stated that there is "no preset idea on the pace of further rate hikes." Unlike in the US and Europe, Japan's rate hikes are expected to proceed more gradually. The exact timing for when short-term rates in Japan might reach 1% will depend on the economic and price conditions at that time.
Interest rates FAQs
Interest rates are charged by financial institutions on loans to borrowers and are paid as interest to savers and depositors. They are influenced by base lending rates, which are set by central banks in response to changes in the economy. Central banks normally have a mandate to ensure price stability, which in most cases means targeting a core inflation rate of around 2%. If inflation falls below target the central bank may cut base lending rates, with a view to stimulating lending and boosting the economy. If inflation rises substantially above 2% it normally results in the central bank raising base lending rates in an attempt to lower inflation.
Higher interest rates generally help strengthen a country’s currency as they make it a more attractive place for global investors to park their money.
Higher interest rates overall weigh on the price of Gold because they increase the opportunity cost of holding Gold instead of investing in an interest-bearing asset or placing cash in the bank. If interest rates are high that usually pushes up the price of the US Dollar (USD), and since Gold is priced in Dollars, this has the effect of lowering the price of Gold.
The Fed funds rate is the overnight rate at which US banks lend to each other. It is the oft-quoted headline rate set by the Federal Reserve at its FOMC meetings. It is set as a range, for example 4.75%-5.00%, though the upper limit (in that case 5.00%) is the quoted figure. Market expectations for future Fed funds rate are tracked by the CME FedWatch tool, which shapes how many financial markets behave in anticipation of future Federal Reserve monetary policy decisions.
Experts now see BoJ hiking the base rate in December vs January to use this window to normalise policy. Economists raise their policy rate forecasts to 0.50% (0.25% prior) for 2024, and 0.75% (0.50%) for 2025 and 2026. Markets remain vulnerable to a hawkish surprise by the BoJ in Q4, in our view. Analysts see downside risk to their USD/JPY forecast of 140 in Q4 on BoJ hikes and GPIF portfolio rejig flows, Standard Chartered economists Chong Hoon Park and Nicholas Chia note.
Path to normalisation
“We now expect the Bank of Japan (BoJ) to hike the base rate by 25bps in December (from 15bps in Q2 and 10bps in Q3-2025 prior) to 0.50% by end-2024 (0.25% prior) on stronger-than expected inflation that has stayed above its 2% target for the past 21 months. Wages grew in real terms in June for the first time since March 2022, adding to concerns over demand-side inflation. The BoJ may hike earlier to avoid losing an opportunity to normalise policy before dovish pressures kick in from possible Fed rate cuts of 75bps by end-2024, risk of a global recession and China’s slowdown.”
“We also raise our policy rate forecasts to 0.75% in 2025 and 2026 each. We think the BoJ will hike again by 25bps in Q4-2025 to continue normalisation, if it sees strong wage growth after the Shunto wage negotiations as well as a virtuous demand-growth cycle.”
“The BoJ is on a gradual path toward monetary policy normalisation. Unlike other major economies, it maintained a dovish stance in 2022 and 2023 even amid high inflation to combat a deflationary mindset. Given that inflation has been sticky and high for a prolonged period around its 2% target, the BoJ will likely look to resume its path to normalisation. The positive turn in real wage growth in June (1.1% y/y) and July (0.4%) could further fuel domestic consumption, and consequently inflation. Even with a December rate hike, Japan’s base rate would still be far below that of other economies, and the Japanese yen (JPY) will likely be on the historically weak side even after any rate hike-driven appreciation.”
- AUD/USD attracts some intraday sellers on reports that China will cut mortgage rates this month.
- Diminishing odds for a larger Fed rate cut underpins the USD and further contributes to the slide.
- Bets for the start of the Fed’s policy-easing cycle, the upbeat mood caps the buck and lends support.
The AUD/USD pair retreats around 40 pips from the vicinity of the 0.6700 mark, or a fresh weekly high set earlier this Thursday and drops to a daily low during the first half of the European session. Spot prices, for now, seem to have stalled the recovery from a four-week trough touched on Wednesday and currently trade around the 0.6670-0.6665 region, nearly unchanged for the day.
Reports that China will cut interest rates on $5 trillion mortgages as soon as this month to try and bolster consumption activity revive concerns about a slowdown in the world's second-largest economy. This, in turn, weighs on antipodean currencies, including the Australian Dollar (AUD), which, along with a modest US Dollar (USD) strength, turn out to be key factors behind the sharp intraday downfall.
The crucial US Consumer Price Index (CPI) report released on Wednesday indicated that consumer prices in the US are easing overall. That said, the core CPI suggests that the underlying inflation remains sticky and dashed hopes for a larger rate cut by the Federal Reserve (Fed) next week. This leads to an uptick in the US Treasury bond yields and lifts the Greenback back closer to the monthly peak.
Investors, however, seem convinced that the US central bank will begin its policy-easing cycle and lower borrowing costs by 25 basis points at each of the three remaining policy meetings in 2024. This, along with the upbeat market mood, keeps a lid on any further gains for the safe-haven buck and offers some support to the risk-sensitive Aussie. Traders now look to the US Producer Price Index (PPI) for a fresh impetus.
Australian Dollar FAQs
One of the most significant factors for the Australian Dollar (AUD) is the level of interest rates set by the Reserve Bank of Australia (RBA). Because Australia is a resource-rich country another key driver is the price of its biggest export, Iron Ore. The health of the Chinese economy, its largest trading partner, is a factor, as well as inflation in Australia, its growth rate and Trade Balance. Market sentiment – whether investors are taking on more risky assets (risk-on) or seeking safe-havens (risk-off) – is also a factor, with risk-on positive for AUD.
The Reserve Bank of Australia (RBA) influences the Australian Dollar (AUD) by setting the level of interest rates that Australian banks can lend to each other. This influences the level of interest rates in the economy as a whole. The main goal of the RBA is to maintain a stable inflation rate of 2-3% by adjusting interest rates up or down. Relatively high interest rates compared to other major central banks support the AUD, and the opposite for relatively low. The RBA can also use quantitative easing and tightening to influence credit conditions, with the former AUD-negative and the latter AUD-positive.
China is Australia’s largest trading partner so the health of the Chinese economy is a major influence on the value of the Australian Dollar (AUD). When the Chinese economy is doing well it purchases more raw materials, goods and services from Australia, lifting demand for the AUD, and pushing up its value. The opposite is the case when the Chinese economy is not growing as fast as expected. Positive or negative surprises in Chinese growth data, therefore, often have a direct impact on the Australian Dollar and its pairs.
Iron Ore is Australia’s largest export, accounting for $118 billion a year according to data from 2021, with China as its primary destination. The price of Iron Ore, therefore, can be a driver of the Australian Dollar. Generally, if the price of Iron Ore rises, AUD also goes up, as aggregate demand for the currency increases. The opposite is the case if the price of Iron Ore falls. Higher Iron Ore prices also tend to result in a greater likelihood of a positive Trade Balance for Australia, which is also positive of the AUD.
The Trade Balance, which is the difference between what a country earns from its exports versus what it pays for its imports, is another factor that can influence the value of the Australian Dollar. If Australia produces highly sought after exports, then its currency will gain in value purely from the surplus demand created from foreign buyers seeking to purchase its exports versus what it spends to purchase imports. Therefore, a positive net Trade Balance strengthens the AUD, with the opposite effect if the Trade Balance is negative.
EUR/USD has been depreciating towards 1.10 over the past four sessions into the interest rate cuts expected at today’s European Central Bank governing council meeting, OCBC’s FX analysts Frances Cheung and Christopher Wong note.
ECB is not on auto-pilot yet
“Apart from the deposit facility rate declining a second time by 25 bps to 3.50%, there are also expectations for the main refi and marginal lending facility rates to fall by a larger 35 bps to 3.65% and 3.90%, respectively. However, this does not imply that ECB President Christine Lagarde is about to ditch the data-dependent path of lowering rates.”
“ECB Chief Economist Philip Lane said a fortnight ago at Jackson Hole that the goal to return to the 2% target was not yet secure, pending the projections for wage growth to slow significantly in 2025 and 2026. Echoing Lane’s caution against complacency regarding price stability, Bundesbank Joachim Nagel wants to avoid cutting rates too quickly.”
“Nagel’s recent comments about the “great wave of inflation” being over should be viewed against his call on the coalition government to push ahead with measures to support the weak German economy. Lagarde’s guidance will be important in deciding if the EUR holds or falls below the psychological 1.10 level.”
August CPI came in as expected, but core CPI inflation unexpectedly rose to 0.3% m/m, on higher shelter costs and pick up in core-services inflation, UOB Group Senior Economist Alvin Liew notes.
No change to the view for 25 bps cut in September FOMC
“Headline CPI was in line with expectations as it rose by 0.2% m/m, 2.5% y/y in August (Jul: 0.2% m/m, 2.9% y/y). However, core CPI re-accelerated as it rose by 0.3% m/m (from 0.2% m/m in Jul) while compared to 12 months ago, it stayed elevated at 3.2% y/y. Shelter costs was the key factor driving inflation as it rose in August at the fastest m/m pace since start of 2024, while core services inflation also accelerated on a m/m basis in Aug, for the second month in a row.”
“We still expect headline CPI inflation to ease and average lower in 2024 (compared to the 4.1% recorded in 2023), but it is now likely to be higher at 2.9% than our previous forecast of 2.5%. And while core inflation may also ease, it is now likely to average 3.3% in 2024 (from previous forecast of 2.5%). It is still a significant moderation from the 4.8% average in 2023 but remains well above the Fed’s 2% objective.”
“The not-so-cool August core CPI certainly decimated expectations for a bigger 50-bps rate cut in September FOMC, but the view of Fed starting its rate cutting cycle in September remains intact. We reiterate our base case for the Fed to begin its rate cut cycle in the 17/18 September FOMC with a 25-bps cut to the Fed Funds Target Rate (FFTR) followed by another 25bps in Dec FOMC and 100 bps of cuts in 2025 (one 25- bps cuts per quarter).”
- The Mexican Peso is rising in line with upbeat sentiment on Thursday.
- The move comes after the Peso made gains on Wednesday despite the passing of controversial judiciary reforms in Mexico.
- USD/MXN breaks down from its rising bullish channel, indicating potentially more weakness on the horizon.
The Mexican Peso (MXN) continues rising in its most heavily traded pairs on Thursday, building on the 1.4% to 1.7% gains of the previous day.
Market sentiment is strong, with Asian equities making gains overnight, the Old Continent’s stock indexes rising at the start of the European session, and commodities recovering across the board. Overall, the positive market mood supports the risk-sensitive Peso.
Mexican Peso shrugs off Senate vote
The Mexican Peso rose on Wednesday despite passing a controversial judicial reform bill through the Senate. Several large-name investors, including Morgan Stanley, Julius Bear, and rating agency Moody’s, have warned the reforms could undermine the independence of the judiciary, harming both foreign direct investment and the country’s economic prospects.
In June, the Peso depreciated by over 10%, and Mexican bourses saw similar losses following the news that the ruling Morena-led coalition won a super-majority in Mexico’s general election. The victory enabled them to pass a set of controversial reforms, including the judicial reforms passed in the Senate on Wednesday, which require amendments to the country’s constitution. However, the eventual voting through of the bill did not cause any additional weakness to the Peso on the day.
MXN actually bucked the FX-market trend on Wednesday by gaining over 1.4% against the US Dollar (USD). This contrasted with most other currencies, which weakened against the Greenback following the release of higher-than-expected core US inflation data. USD rose because the data lessened the chances of the Federal Reserve (Fed) making a larger-than-standard 50 basis points (bps) cut to interest rates at its September meeting.
Strong automobile sales data showing record car sales in Mexico could have been one factor in the Peso’s strength. Commercial car sales in the country are expected to hit a record 56,592 in 2024, according to a report from the Mexican Automotive Distributors Association (AMDA) on Wednesday. This is above the previous record of 53,300 sales set in 2007.
The data follows the announcement in August that Volvo is planning to build a $700 million heavy-duty truck manufacturing plant in the northern Mexican city of Monterrey. The company cited logistic efficiencies and the benefit of being able to sell vehicles across the region, including the US, as reasons for the move, according to Reuters.
The trend continues the nearshoring boom Mexico has enjoyed in recent years. “Mexico exported $593 billion worth of goods in 2023, with much of it transported over land using trucks or tractor-trailers. Cargo flows over the U.S.-Mexico border also made the countries each other's largest trading partners last year,” said the Reuters report.
At the time of writing, one US Dollar (USD) buys 19.75 Mexican Pesos, EUR/MXN trades at 21.75, and GBP/MXN at 25.76.
Technical Analysis: USD/MXN breaks out of rising channel
USD/MXN has broken out of an ascending mini-channel. The breakdown indicates more weakness probably on the horizon for the pair.
USD/MXN 4-hour Chart
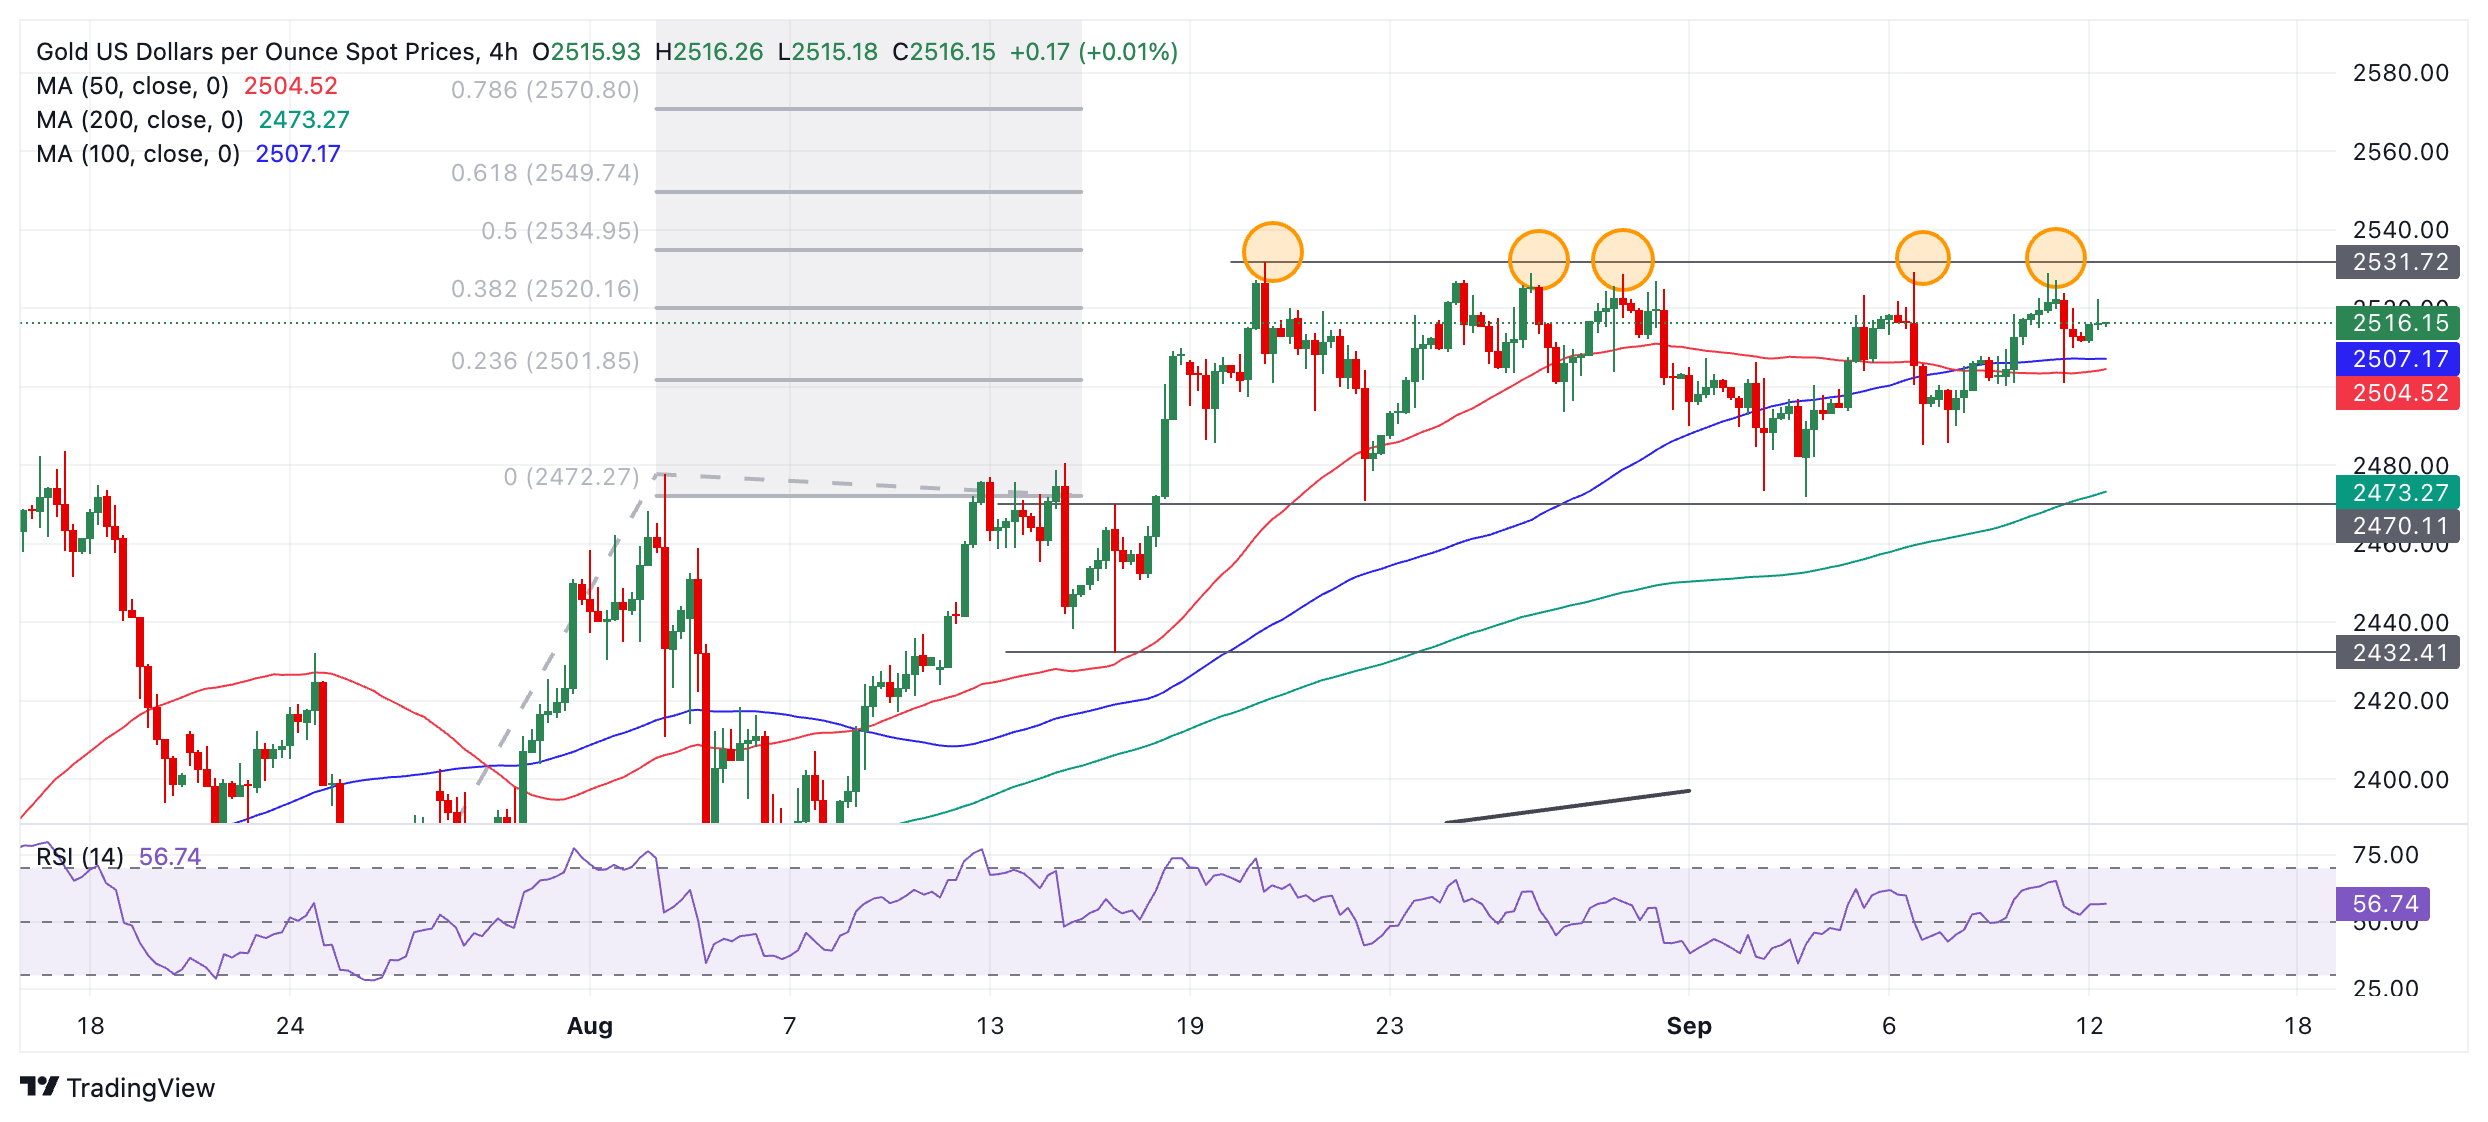
According to technical analysis, the breakout from the channel activates a downside target at 19.62, the 0.618 Fibonacci (Fib) extension of the height of the channel extrapolated to the downside. More bearishness could even see prices fall to around the 19.50 mark, the 1.000 ratio Fib extension and the key support level from the August 22 swing high.
However, the overall trend on the medium and long-term is bullish, and since, according to technical analysis theory, “the trend is your friend,” this favors more upside emerging eventually. As such, any weakness may be temporary before the pair rallies again.
A break above the top of the mini-channel and year-to-date high at 20.15 would provide confirmation of a continuation of the bull trend, with the next target at the upper channel line in the 20.60s.
Risk sentiment FAQs
In the world of financial jargon the two widely used terms “risk-on” and “risk off'' refer to the level of risk that investors are willing to stomach during the period referenced. In a “risk-on” market, investors are optimistic about the future and more willing to buy risky assets. In a “risk-off” market investors start to ‘play it safe’ because they are worried about the future, and therefore buy less risky assets that are more certain of bringing a return, even if it is relatively modest.
Typically, during periods of “risk-on”, stock markets will rise, most commodities – except Gold – will also gain in value, since they benefit from a positive growth outlook. The currencies of nations that are heavy commodity exporters strengthen because of increased demand, and Cryptocurrencies rise. In a “risk-off” market, Bonds go up – especially major government Bonds – Gold shines, and safe-haven currencies such as the Japanese Yen, Swiss Franc and US Dollar all benefit.
The Australian Dollar (AUD), the Canadian Dollar (CAD), the New Zealand Dollar (NZD) and minor FX like the Ruble (RUB) and the South African Rand (ZAR), all tend to rise in markets that are “risk-on”. This is because the economies of these currencies are heavily reliant on commodity exports for growth, and commodities tend to rise in price during risk-on periods. This is because investors foresee greater demand for raw materials in the future due to heightened economic activity.
The major currencies that tend to rise during periods of “risk-off” are the US Dollar (USD), the Japanese Yen (JPY) and the Swiss Franc (CHF). The US Dollar, because it is the world’s reserve currency, and because in times of crisis investors buy US government debt, which is seen as safe because the largest economy in the world is unlikely to default. The Yen, from increased demand for Japanese government bonds, because a high proportion are held by domestic investors who are unlikely to dump them – even in a crisis. The Swiss Franc, because strict Swiss banking laws offer investors enhanced capital protection.
The US Dollar (USD) bounced overnight after core CPI, real hourly earnings report surprised to the upside, OCBC’s FX analysts Frances Cheung and Christopher Wong note.
USD shorts may just get another squeeze again
“The upside surprise in US data serves as a reminder how crowded USD shorts can further be squeezed out – these also underscores how US data can prove to be asymmetric to USD price action. Today, we have PPI and initial jobless claims. Another better-than-expected print in favour of US may well see dovish expectation being scaled back.”
“On this note, USD shorts may just get another squeeze again. DXY was last at 101.82. Daily momentum is bullish while RSI rose. Resistance at 102.20 (23.6% fibo retracement of 2023 high to 2024 low). Support at 100.50 levels.”
- USD/CHF appreciates as August’s US inflation data decrease the odds of an aggressive rate cut by the Fed in September.
- CME FedWatch Tool suggests the odds of a 50 bps rate cut by the Fed have decreased to 15.0%.
- The yield on the Swiss 10-year government bond dropped below 0.4%, marking fresh three-week lows.
USD/CHF appreciates for the second successive session, trading around 0.8550 during the European hours on Thursday. The US Dollar (USD) receives support as Treasury yields extend its gains for the second successive day.
The US Dollar Index (DXY), which measures the value of the US Dollar against six other major currencies, continues its winning streak for the fifth consecutive day. The DXY trades around 101.80 with 2-year and 10-year yields on US Treasury bonds standing at 3.67% and 3.65%, respectively.
Additionally, the upside of the USD/CHF pair could be attributed to rising expectations of a smaller interest rate cut by the Fed in September. August’s US Consumer Price Index (CPI) data showed that headline inflation dropped to a three-year low. This development has heightened the likelihood that the Federal Reserve (Fed) will begin its easing cycle with a 25-basis points interest rate cut in September.
The US Consumer Price Index dipped to 2.5% year-on-year in August, from the previous reading of 2.9%. The index has fallen short of the expected 2.6% reading. Meanwhile, headline CPI stood at 0.2% MoM. Core CPI ex Food & Energy, remained unchanged at 3.2% YoY. On a monthly basis, core CPI rose to 0.3% from the previous 0.2% reading.
The yield on the 10-year Swiss government bond depreciates below 0.4% to reach new three-week lows. This drop coincided with a surge in the Swiss Franc (CHF), which reached its highest level in 2024, fueling expectations that the Swiss National Bank (SNB) might implement a substantial rate cut later this year.
Swiss inflation fell to 1.1% in August, further intensifying speculation about an imminent rate cut by the SNB. The market is anticipating a 25 basis point reduction at its September meeting, with a total of 55 basis points of easing expected by the end of the year.
Swiss economy FAQs
Switzerland is the ninth-largest economy measured by nominal Gross Domestic Product (GDP) in the European continent. Measured by GDP per capita – a broad measure of average living standards –, the country ranks among the highest in the world, meaning that it is one the richest countries globally. Switzerland tends to be in the top spots in global rankings about living standards, development indexes, competitiveness or innovation.
Switzerland is an open, free-market economy mainly based on the services sector. The Swiss economy has a strong export sector, and the neighboring European Union (EU) is its main trading partner. Switzerland is a leading exporter of watches and clocks, and hosts leading firms in the food, chemicals and pharmaceutical industries. The country is considered to be an international tax haven, with significantly low corporate and income tax rates compared with its European neighbors.
As a high-income country, the growth rate of the Swiss economy has diminished over the last decades. Still, its political and economic stability, its high education levels, top-tier firms in several industries and its tax-haven status have made it a preferred destination for foreign investment. This has generally benefited the Swiss Franc (CHF), which has historically kept relatively strong against its main currency peers. Generally, a good performance of the Swiss economy – based on high growth, low unemployment and stable prices – tends to appreciate CHF. Conversely, if economic data points to weakening momentum, CHF is likely to depreciate.
Switzerland isn’t a commodity exporter, so in general commodity prices aren’t a key driver of the Swiss Franc (CHF). However, there is a slight correlation with both Gold and Oil prices. With Gold, CHF’s status as a safe-haven and the fact that the currency used to be backed by the precious metal means that both assets tend to move in the same direction. With Oil, a paper released by the Swiss National Bank (SNB) suggests that the rise in Oil prices could negatively influence CHF valuation, as Switzerland is a net importer of fuel.
- EUR/JPY builds on the overnight recovery from a one-month low amid a modest JPY weakness.
- An unexpected fall in Japan’s PPI, along with a positive risk tone, undermines the safe-haven JPY.
- Bets for another BoJ rate hike in 2024 should cap the cross ahead of the key ECB policy decision.
The EUR/JPY cross gains some positive traction on Thursday and recovers further from over a one-month low, around the 155.45 region touched the previous day. Spot prices, however, retreat a few pips from the daily peak and currently trade around the 157.00 mark as investors look to the European Central Bank (ECB) interest rate decision for a fresh impetus.
The ECB is widely expected to announce a 25 basis points (bps) rate cut at the end of its September policy meeting, marking the second adjustment in its current policy easing cycle. The market focus, however, will remain glued to the updated economic projections and the forward guidance. Apart from this, ECB President Christine Lagarde's comments at the post-meeting press conference will influence the shared currency and determine the near-term trajectory for the EUR/JPY cross.
Heading into the key central bank event risk, a soft reading on Japan's Producer Price Index (PPI) undermined hawkish signals from the Bank of Japan (BoJ) and prompted some selling around the Japanese Yen (JPY). In fact, the headline PPI declined by 0.2% in August and the yearly rate decelerated more-than-anticipated, to 2.5% from 3.0% in July. This, along with a generally positive tone around the equity markets, dents demand for the safe-haven JPY and lends support to the EUR/JPY cross.
That said, comments by Bank of Japan (BoJ) board member Naoki Tamura, saying that the path towards ending the easy policy is still very long, reaffirms bets that the central bank will raise borrowing costs further by the end of this year. This marks a big divergence in comparison to a dovish stance adopted by the ECB, which should limit the JPY losses. Hence, it will be prudent to wait for strong follow-through buying before confirming that the EUR/JPY cross has bottomed out.
Economic Indicator
ECB Press Conference
Following the European Central Bank’s (ECB) economic policy decision, the ECB President gives a press conference regarding monetary policy. The president’s comments may influence the volatility of the Euro (EUR) and determine a short-term positive or negative trend. If the president adopts a hawkish tone it is considered bullish for the EUR, whereas if the tone is dovish the result is usually bearish for the Euro.
Read more.Next release: Thu Sep 12, 2024 12:45
Frequency: Irregular
Consensus: -
Previous: -
Source: European Central Bank
- USD/JPY gains ground due to rising odds of a smaller rate cut by the Fed in September.
- BoJ board member Naoki Tamura stated that there is no predetermined plan regarding the pace of future rate hikes.
- CME FedWatch Tool suggests the odds of a 50 bps rate cut by the Fed have decreased to 15.0%.
USD/JPY breaks its two-day losing streak, trading around 142.90 during the European hours on Thursday. The Japanese Yen (JPY) remains subdued following the remarks from the Bank of Japan (BoJ) board member Naoki Tamura.
BoJ board member Tamura stated that there is "no preset idea on the pace of further rate hikes." Unlike in the US and Europe, Japan's rate hikes are expected to proceed more gradually. The exact timing for when short-term rates in Japan might reach 1% will depend on the economic and price conditions at that time.
Read the full article: BoJ’s Tamura doesn't have a preset idea on the pace of further rate hikes
The upside of the USD/JPY pair could be attributed to rising expectations of a smaller interest rate cut by the Fed in September. August’s US Consumer Price Index (CPI) data showed that headline inflation dropped to a three-year low. This development has heightened the likelihood that the Federal Reserve (Fed) will begin its easing cycle with a 25-basis points interest rate cut in September.
The US Consumer Price Index dipped to 2.5% year-on-year in August, from the previous reading of 2.9%. The index has fallen short of the expected 2.6% reading. Meanwhile, headline CPI stood at 0.2% MoM. Core CPI ex Food & Energy, remained unchanged at 3.2% YoY. On a monthly basis, core CPI rose to 0.3% from the previous 0.2% reading.
According to the CME FedWatch Tool, markets are fully anticipating at least a 25 basis point (bps) rate cut by the Federal Reserve at its September meeting. The likelihood of a 50 bps rate cut has sharply decreased to 15.0%, down from 44.0% a week ago.
Japanese Yen FAQs
The Japanese Yen (JPY) is one of the world’s most traded currencies. Its value is broadly determined by the performance of the Japanese economy, but more specifically by the Bank of Japan’s policy, the differential between Japanese and US bond yields, or risk sentiment among traders, among other factors.
One of the Bank of Japan’s mandates is currency control, so its moves are key for the Yen. The BoJ has directly intervened in currency markets sometimes, generally to lower the value of the Yen, although it refrains from doing it often due to political concerns of its main trading partners. The current BoJ ultra-loose monetary policy, based on massive stimulus to the economy, has caused the Yen to depreciate against its main currency peers. This process has exacerbated more recently due to an increasing policy divergence between the Bank of Japan and other main central banks, which have opted to increase interest rates sharply to fight decades-high levels of inflation.
The BoJ’s stance of sticking to ultra-loose monetary policy has led to a widening policy divergence with other central banks, particularly with the US Federal Reserve. This supports a widening of the differential between the 10-year US and Japanese bonds, which favors the US Dollar against the Japanese Yen.
The Japanese Yen is often seen as a safe-haven investment. This means that in times of market stress, investors are more likely to put their money in the Japanese currency due to its supposed reliability and stability. Turbulent times are likely to strengthen the Yen’s value against other currencies seen as more risky to invest in.
Here is what you need to know on Thursday, September 12:
Financial markets stay relatively quiet early Thursday as investors await the next batch of macroeconomic events. The European Central Bank (ECB) will announce monetary policy decisions on Thursday and ECB President Christine Lagarde will speak on the policy outlook in a press conference. The US economic docket will feature weekly Initial Jobless Claims and Producer Price Index (PPI) data for August.
US Dollar PRICE This week
The table below shows the percentage change of US Dollar (USD) against listed major currencies this week. US Dollar was the strongest against the Swiss Franc.
| USD | EUR | GBP | JPY | CAD | AUD | NZD | CHF | |
|---|---|---|---|---|---|---|---|---|
| USD | 0.66% | 0.65% | 0.40% | 0.03% | -0.25% | 0.51% | 1.06% | |
| EUR | -0.66% | -0.05% | -0.22% | -0.62% | -0.95% | -0.14% | 0.38% | |
| GBP | -0.65% | 0.05% | -1.44% | -0.56% | -0.89% | -0.11% | 0.43% | |
| JPY | -0.40% | 0.22% | 1.44% | -0.36% | -0.62% | 0.11% | 0.86% | |
| CAD | -0.03% | 0.62% | 0.56% | 0.36% | -0.23% | 0.46% | 1.19% | |
| AUD | 0.25% | 0.95% | 0.89% | 0.62% | 0.23% | 0.80% | 1.31% | |
| NZD | -0.51% | 0.14% | 0.11% | -0.11% | -0.46% | -0.80% | 0.54% | |
| CHF | -1.06% | -0.38% | -0.43% | -0.86% | -1.19% | -1.31% | -0.54% |
The heat map shows percentage changes of major currencies against each other. The base currency is picked from the left column, while the quote currency is picked from the top row. For example, if you pick the US Dollar from the left column and move along the horizontal line to the Japanese Yen, the percentage change displayed in the box will represent USD (base)/JPY (quote).
On Wednesday, mixed August inflation data from the US helped the US Dollar (USD) stay resilient against its rivals. On a yearly basis, the Consumer Price Index (CPI) rose 2.5% in August, down from the 2.9% increase recorded in July. However, the core CPI, which excludes volatile food and energy prices, increased 0.3% on a monthly basis, surpassing the market expectation of 0.2%. The benchmark 10-year US Treasury bond yield recovered toward 3.7% with the immediate reaction to CPI readings and the USD Index erased its losses to end the day flat. Early Thursday, the USD Index holds steady above 101.50 and the 10-year yield fluctuates slightly below 3.7%. Meanwhile, US stock index futures trade marginally higher on the day.
The ECB is widely expected to lower key rates by 25 basis points (bps) after the September policy meeting. Following a short-lasting recovery attempt, EUR/USD lost its traction and touched its lowest level since mid-August at 1.1000 on Wednesday. The pair stays in a consolidation phase above this level in the European morning on Thursday.
GBP/USD lost nearly 0.3% on Wednesday and registered its lowest daily close in three weeks. The pair holds steady at around 1.3050 to begin the European session.
Bank of Japan (BoJ) board member Naoki Tamura said on Thursday that he sees a very long the path towards ending the easy policy. "We must raise short-term rates in several stages while scrutinizing how the economy, inflation respond to such steps," he added. After touching a fresh 2024-low of 140.70 on Wednesday, USD/JPY reversed its direction and was last seen trading modestly higher on the day above 142.50.
Gold closed modestly lower on Wednesday but managed to stabilize above. XAU/USD inches higher early Thursday and was last seen trading slighlty below $2,520.
ECB FAQs
The European Central Bank (ECB) in Frankfurt, Germany, is the reserve bank for the Eurozone. The ECB sets interest rates and manages monetary policy for the region. The ECB primary mandate is to maintain price stability, which means keeping inflation at around 2%. Its primary tool for achieving this is by raising or lowering interest rates. Relatively high interest rates will usually result in a stronger Euro and vice versa. The ECB Governing Council makes monetary policy decisions at meetings held eight times a year. Decisions are made by heads of the Eurozone national banks and six permanent members, including the President of the ECB, Christine Lagarde.
In extreme situations, the European Central Bank can enact a policy tool called Quantitative Easing. QE is the process by which the ECB prints Euros and uses them to buy assets – usually government or corporate bonds – from banks and other financial institutions. QE usually results in a weaker Euro. QE is a last resort when simply lowering interest rates is unlikely to achieve the objective of price stability. The ECB used it during the Great Financial Crisis in 2009-11, in 2015 when inflation remained stubbornly low, as well as during the covid pandemic.
Quantitative tightening (QT) is the reverse of QE. It is undertaken after QE when an economic recovery is underway and inflation starts rising. Whilst in QE the European Central Bank (ECB) purchases government and corporate bonds from financial institutions to provide them with liquidity, in QT the ECB stops buying more bonds, and stops reinvesting the principal maturing on the bonds it already holds. It is usually positive (or bullish) for the Euro.
- The Pound Sterling edges slightly up against the US Dollar, but a decline in bets that the Fed will opt for a large rate cut keeps the downside bias afloat.
- Investors see the BoE leaving interest rates unchanged at 5% at its September meeting.
- Market participants await the US PPI report for August.
The Pound Sterling (GBP) holds the late Wednesday’s recovery move from the psychological support of 1.3000 to near 1.3050 against the US Dollar (USD) in Thursday’s London session. However, the outlook of the GBP/USD pair is tilted to the downside as the US Dollar clings to gains near a fresh weekly high, with investors gaining confidence that the Federal Reserve (Fed) will start the policy-easing process with a 25-basis-points interest-rate cut.
The US Dollar Index (DXY), which tracks the Greenback’s value against six major currencies, holds gains near 101.70. Investors have been speculating for weeks about the size of the upcoming Fed rate cut. Expectations for a small 25-basis-points interest-rate cut have strengthened after the Consumer Price Index (CPI) data for August, released on Wednesday, showed signs of some stickiness in inflationary pressures.
Annual headline inflation came in lower than anticipated. However, the core inflation data – which excludes volatile food and energy prices – remained sticky. Core inflation rose by 3.2% as expected, but the monthly figure grew by 0.3%, faster than the 0.2% anticipated.
Sticky US core inflation data significantly weighed on market expectations for sizable Fed rate cuts. According to the CME FedWatch tool, the probability of the Fed reducing interest rates by 50 basis points (bps) to 4.75%-5.00% in September has diminished to 13% from 40% a week ago.
In Thursday’s session, investors await the United States (US) Producer Price Index (PPI) data for August and the Initial Jobless Claims for the week ending September 6. Both reports will be published at 12:30 GMT.
The headline producer inflation data is expected to have slowed further due to falling energy prices, while core figures are projected to have accelerated.
Daily digest market movers: Pound Sterling wobbles against US Dollar
- The Pound Sterling ticks up against its major peers, except Asia-Pacific currencies, in Thursday’s European trading hours. The British currency rises as market participants seem confident that the Bank of England’s (BoE) policy-easing cycle will be less aggressive than that of other central banks.
- According to a Reuters poll, the BoE is expected to leave interest rates unchanged at 5% next week but is expected to reduce them again in November despite inflation remaining above the bank’s target of 2%. The comments from BoE Governor Andrew Bailey at the Jackson Hole (JH) Symposium also indicated that the central bank will cut interest rates gradually to keep a lid over inflationary pressures.
- An increase in market expectations for the BoE, keeping interest rates steady this month, appears to be the outcome of robust job growth and a decline in the Unemployment Rate. In the three months ending July, the jobless rate fell to 4.1%, while UK employers hired 265K new workers, a significantly higher number than the former release of 24K.
- Going forward, the next big triggers for the Pound Sterling will be the United Kingdom (UK) Consumer Price Index (CPI) data for August and the BoE’s interest rate decision, which are scheduled for next week.
Technical Analysis: Pound Sterling rises slightly to near 1.3050
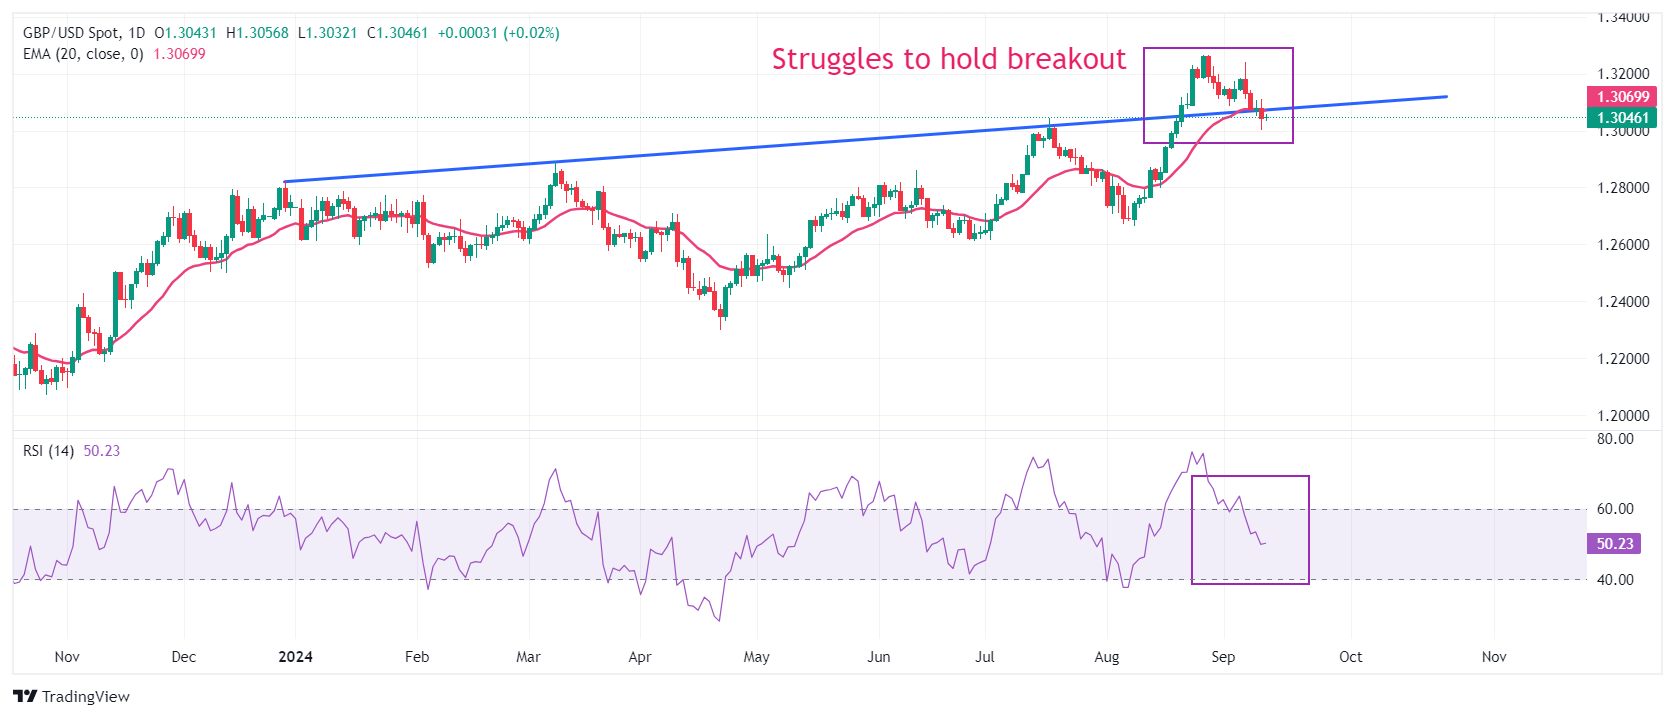
The Pound Sterling edges higher against the US Dollar to near 1.3050, recovering from 1.3000. However, the near-term outlook of the Cable has become gloomy as the pair’s price action falls below the trendline plotted from the December 28, 2023, high of 1.2828 – from where it delivered a sharp upside move after a breakout on August 21. Also, a downside move below the 20-day Exponential Moving Average (EMA) near 1.3070 has weakened the Pound Sterling’s appeal.
The 14-day Relative Strength Index (RSI) declines into the 40.00-60.00 range, suggesting that the bullish momentum has concluded for now. However, the long-term bullish trend remains intact.
Looking up, the Cable will face resistance near the round-level at 1.3200 and the psychological level of 1.3500. On the downside, the psychological level of 1.3000 emerges as crucial support for the Pound Sterling bulls.
Pound Sterling FAQs
The Pound Sterling (GBP) is the oldest currency in the world (886 AD) and the official currency of the United Kingdom. It is the fourth most traded unit for foreign exchange (FX) in the world, accounting for 12% of all transactions, averaging $630 billion a day, according to 2022 data. Its key trading pairs are GBP/USD, aka ‘Cable’, which accounts for 11% of FX, GBP/JPY, or the ‘Dragon’ as it is known by traders (3%), and EUR/GBP (2%). The Pound Sterling is issued by the Bank of England (BoE).
The single most important factor influencing the value of the Pound Sterling is monetary policy decided by the Bank of England. The BoE bases its decisions on whether it has achieved its primary goal of “price stability” – a steady inflation rate of around 2%. Its primary tool for achieving this is the adjustment of interest rates. When inflation is too high, the BoE will try to rein it in by raising interest rates, making it more expensive for people and businesses to access credit. This is generally positive for GBP, as higher interest rates make the UK a more attractive place for global investors to park their money. When inflation falls too low it is a sign economic growth is slowing. In this scenario, the BoE will consider lowering interest rates to cheapen credit so businesses will borrow more to invest in growth-generating projects.
Data releases gauge the health of the economy and can impact the value of the Pound Sterling. Indicators such as GDP, Manufacturing and Services PMIs, and employment can all influence the direction of the GBP. A strong economy is good for Sterling. Not only does it attract more foreign investment but it may encourage the BoE to put up interest rates, which will directly strengthen GBP. Otherwise, if economic data is weak, the Pound Sterling is likely to fall.
Another significant data release for the Pound Sterling is the Trade Balance. This indicator measures the difference between what a country earns from its exports and what it spends on imports over a given period. If a country produces highly sought-after exports, its currency will benefit purely from the extra demand created from foreign buyers seeking to purchase these goods. Therefore, a positive net Trade Balance strengthens a currency and vice versa for a negative balance.
- The European Central Bank is expected to cut key rates by 25 bps at the September policy meeting.
- ECB President Christine Lagarde’s presser and updated economic forecasts will be closely scrutinized for fresh policy cues.
- The ECB policy announcements are set to inject volatility around the EUR/USD pair.
The European Central Bank (ECB) interest rate decision will be announced alongside the publication of the staff’s updated economic projections following the September monetary policy meeting due on Thursday at 12:15 GMT.
ECB President Christine Lagarde's press conference will follow, beginning at 12:45 GMT, where she will deliver the prepared statement on monetary policy and respond to media questions. The ECB announcements are likely to rock the Euro (EUR) against the US Dollar (USD).
What to expect from the European Central Bank interest rate decision?
After standing pat on interest rates in July, the ECB is widely expected to reduce key rates by 25 basis points (bps) at its September policy meeting. The interest rates on the main refinancing operations, the marginal lending facility, and the deposit facility will likely be lowered to 4.0%, 4.25%, and 3.50%, respectively.
In June’s post-policy meeting press conference, ECB President Christine Lagarde said that "we are determined not to have a predetermined rate path. September decision is wide open." "September projections, plus other data, will be taken into account,” Lagarde added.
The accounts of the July ECB meeting showed that September “was widely seen as a good time to re-evaluate” the level of monetary policy restriction.
Since the July meeting, the Eurozone inflation cooled off significantly, returning closer to the central bank’s 2.0% target.
Eurostat's preliminary data showed on August 30 that the Harmonised Index Of Consumer Prices (HICP) across the currency bloc rose 2.2% over the year in August, marking the lowest annual inflation rate since July 2021. Meanwhile, the Euro area negotiated wages increased at an annual pace of 3.55% in Q2 2024 after rising 4.74% in the first quarter of this year.
The ECB accounts combined with a sharp decline in the pace of wage growth, cooling inflation and weakening Euro area business activity indicate that a rate reduction is a given on Thursday.
Therefore, the ECB’s communication on the path forward and its outlook on inflation and growth will hold the key for the market’s pricing of the future rate cuts and the Euro’s (EUR) next directional move.
Previewing the ECB meeting, TD Securities analysts said: “A 25bps cut is a near-certainty. What matters will be guidance beyond September, where there's strong pressure on both sides. Wage growth and services inflation remain strong (emboldening the hawks), while growth indicators are flagging softer (emboldening the doves).” “Lagarde is unlikely to rule out an October cut, but quarterly cuts are likely more consistent with the new projections,” the analysts added.
How could the ECB meeting impact EUR/USD?
Heading into the ECB showdown, the Euro is clinging to recovery gains, with EUR/USD reversing from monthly lows of 1.1020. The pair’s fate hinges on the ECB’s outlook on interest rates beyond September.
ECB President Christine Lagarde is likely to stick to the bank’s data-dependent stance and refrain from giving a certain response on the next rate cut move. Unless the policy statement, or Lagarde, hints at more rate reduction coming in the final quarter of this year, the EUR/USD recovery is seen gathering further traction.
Conversely, the Euro could come under renewed selling pressure if the staff projections show downward revisions to both the inflation and economic growth outlook. Meanwhile, Lagarde’s increased confidence in the disinflation progress could also revive Euro sellers. These factors could double down on the dovish expectations, fuelling the resumption of the recent EUR/USD downtrend.
Dhwani Mehta, Asian Session Lead Analyst at FXStreet, offers a brief technical outlook for EUR/USD:
“EUR/USD maintains its bearish streak, especially after the Relative Strength Index (RSI) indicator returned below the 50 level on the daily chart. If sellers flex their muscles, the immediate support of the 50-day SMA at 1.0964 will be tested. Further south, the pair could aim for the strong demand area near 1.0870, where the 100-day SMA and the 200-day SMA coincide.”
“On the upside, the pair needs to find acceptance above the 21-day Simple Moving Average (SMA) at 1.1082 on a daily closing basis to sustain the recovery toward the September 6 high of 1.1155, above which the 1.1200 psychological level will challenge bearish commitments.”
Economic Indicator
ECB Rate On Deposit Facility
One of the European Central Bank's three key interest rates, the rate on the deposit facility, is the rate at which banks earn interest when they deposit funds with the ECB. It is announced by the European Central Bank at each of its eight scheduled annual meetings.
Read more.Next release: Thu Sep 12, 2024 12:15
Frequency: Irregular
Consensus: 3.5%
Previous: 3.75%
Source: European Central Bank
Interest rates FAQs
Interest rates are charged by financial institutions on loans to borrowers and are paid as interest to savers and depositors. They are influenced by base lending rates, which are set by central banks in response to changes in the economy. Central banks normally have a mandate to ensure price stability, which in most cases means targeting a core inflation rate of around 2%. If inflation falls below target the central bank may cut base lending rates, with a view to stimulating lending and boosting the economy. If inflation rises substantially above 2% it normally results in the central bank raising base lending rates in an attempt to lower inflation.
Higher interest rates generally help strengthen a country’s currency as they make it a more attractive place for global investors to park their money.
Higher interest rates overall weigh on the price of Gold because they increase the opportunity cost of holding Gold instead of investing in an interest-bearing asset or placing cash in the bank. If interest rates are high that usually pushes up the price of the US Dollar (USD), and since Gold is priced in Dollars, this has the effect of lowering the price of Gold.
The Fed funds rate is the overnight rate at which US banks lend to each other. It is the oft-quoted headline rate set by the Federal Reserve at its FOMC meetings. It is set as a range, for example 4.75%-5.00%, though the upper limit (in that case 5.00%) is the quoted figure. Market expectations for future Fed funds rate are tracked by the CME FedWatch tool, which shapes how many financial markets behave in anticipation of future Federal Reserve monetary policy decisions.
FX option expiries for Sept 12 NY cut at 10:00 Eastern Time, via DTCC, can be found below.
EUR/USD: EUR amounts
- 1.0905 1b
- 1.0945 2.1b
- 1.0950 1b
- 1.0990 891m
- 1.1000 4.4b
- 1.1025 1.6b
- 1.1040 936m
- 1.1045 1.1b
- 1.1050 3.3b
- 1.1100 1.1b
- 1.1110 1.1b
- 1.1200 2.4b
GBP/USD: GBP amounts
- 1.3050 416m
USD/JPY: USD amounts
- 140.00 981m
- 141.40 984m
- 142.00 1.5b
- 145.00 720m
USD/CHF: USD amounts
- 0.8455 815m
- 0.8600 556m
AUD/USD: AUD amounts
- 0.6675 957m
- 0.6710 1.1b
- 0.6750 1.2b
USD/CAD: USD amounts
- 1.3590 1.4b
- 1.3690 400m
EUR/GBP: EUR amounts
- 0.8470 622m
- 0.8550 515m
The Bank of Japan (BoJ) board member Naoki Tamura is back on the wires on Thursday, noting that “don't have a preset idea on the pace of further rate hikes,” when asked whether the BoJ could raise rates again by year-end, or March end of the current fiscal year.
Additional comments
Unlike US and Europe, Japan's rate hikes are likely to be slow.
Exact timing on when Japan can see short-term rates reach 1% will depend on economic, price conditions at the time.
Data out so far show Japan's economy moving in line with forecasts made in BoJ July meeting.
Focusing too much on whether markets are stable or not could prevent BoJ from conducting monetary policy appropriately reflecting economic, price developments.
In long-term perspective, markets move in a way reflecting fundamentals.
Having said that, big, rapid market volatility is undesirable.
When markets are quite fragile, we need to set a period to ensure markets cool down.
Cannot say now whether BoJ could raise rates by end of this year.
Weak yen being reversed somewhat but rise in import costs seen earlier this year will likely affect consumer inflation with a lag.
Compared to when USD/JPY was at 160, upward risk to inflation has subsided somewhat.
BoJ must slowly raise rates in several stages, while closely watching how each rate hike affects economic activity.
Market reaction
These comments fail to move the Japanese Yen, as USD/JPY adds 0.32% on the day to trade near 142.80, as of writing.
- Silver price holds gains ahead of the ECB interest rate decision scheduled for Thursday.
- ECB is highly expected to lower rates to 4.0% by implementing a 25 basis points rate cut.
- August’s US Consumer Price Index data have increased the odds of a 25-basis points rate cut by the Fed in September.
Silver price (XAG/USD) edges higher for the fourth consecutive day, trading around $28.74 during the Asian hours on Thursday. The non-yielding assets like Silver receive support as traders anticipate that the European Central Bank (ECB) will lower interest rates to 4.0% by implementing a 25 basis points rate cut at its upcoming policy meeting later in the day.
Easing monetary policies by central banks globally benefits Silver by reducing the opportunity cost of holding non-interest-bearing bullion assets. August’s US Consumer Price Index (CPI) data showed that headline inflation dropped to a three-year low, which has increased expectations of a 25-basis points rate cut by the Fed in September. Investors will shift focus on the US Producer Price Index and Initial Jobless Claims data scheduled for Thursday for further insights.
Moreover, no growth in the UK economy reinforces expectations of a possible quarter-point rate cut by the Bank of England (BoE) in November. Some traders are also pricing in the possibility of an additional rate cut in December.
The US CPI fell to 2.5% year-on-year in August, down from the previous reading of 2.9% and below the expected 2.6%. The headline CPI rose by 0.2% month-on-month. Core CPI, excluding food and energy, remained steady at 3.2% year-on-year, while it increased to 0.3% month-on-month, up from the previous 0.2% reading.
According to the CME FedWatch Tool, markets are fully anticipating at least a 25 basis point (bps) rate cut by the Federal Reserve at its September meeting. The likelihood of a 50 bps rate cut has sharply decreased to 15.0%, down from 44.0% a week ago.
Silver FAQs
Silver is a precious metal highly traded among investors. It has been historically used as a store of value and a medium of exchange. Although less popular than Gold, traders may turn to Silver to diversify their investment portfolio, for its intrinsic value or as a potential hedge during high-inflation periods. Investors can buy physical Silver, in coins or in bars, or trade it through vehicles such as Exchange Traded Funds, which track its price on international markets.
Silver prices can move due to a wide range of factors. Geopolitical instability or fears of a deep recession can make Silver price escalate due to its safe-haven status, although to a lesser extent than Gold's. As a yieldless asset, Silver tends to rise with lower interest rates. Its moves also depend on how the US Dollar (USD) behaves as the asset is priced in dollars (XAG/USD). A strong Dollar tends to keep the price of Silver at bay, whereas a weaker Dollar is likely to propel prices up. Other factors such as investment demand, mining supply – Silver is much more abundant than Gold – and recycling rates can also affect prices.
Silver is widely used in industry, particularly in sectors such as electronics or solar energy, as it has one of the highest electric conductivity of all metals – more than Copper and Gold. A surge in demand can increase prices, while a decline tends to lower them. Dynamics in the US, Chinese and Indian economies can also contribute to price swings: for the US and particularly China, their big industrial sectors use Silver in various processes; in India, consumers’ demand for the precious metal for jewellery also plays a key role in setting prices.
Silver prices tend to follow Gold's moves. When Gold prices rise, Silver typically follows suit, as their status as safe-haven assets is similar. The Gold/Silver ratio, which shows the number of ounces of Silver needed to equal the value of one ounce of Gold, may help to determine the relative valuation between both metals. Some investors may consider a high ratio as an indicator that Silver is undervalued, or Gold is overvalued. On the contrary, a low ratio might suggest that Gold is undervalued relative to Silver.
- NZD/USD gains ground due to risk-on mood following August’s US Consumer Price Index data released on Wednesday.
- The headline US inflation dropped to a three-year low, increasing the odds of a Fed 25 basis points rate cut.
- The upside of the Kiwi Dollar could be limited as RBNZ may implement additional rate cuts by the end of 2024.
NZD/USD retraces its recent losses registered in the previous session, trading around 0.6150 during the Asian hours on Thursday. The upside of the NZD/USD pair could be attributed to improved risk sentiment amid rising expectations of a 25-basis points rate cut by the Fed in September.
August’s US Consumer Price Index (CPI) data showed that headline inflation dropped to a three-year low, although core inflation exceeded expectations. This development has heightened the likelihood that the Federal Reserve (Fed) will begin its easing cycle with a 25-basis points interest rate cut in September.
The US Consumer Price Index dipped to 2.5% year-on-year in August, from the previous reading of 2.9%. The index has fallen short of the expected 2.6% reading. Meanwhile, headline CPI stood at 0.2% MoM. Core CPI ex Food & Energy, remained unchanged at 3.2% YoY. On a monthly basis, core CPI rose to 0.3% from the previous 0.2% reading.
According to the CME FedWatch Tool, markets are fully anticipating at least a 25 basis point (bps) rate cut by the Federal Reserve at its September meeting. The likelihood of a 50 bps rate cut has sharply decreased to 15.0%, down from 44.0% a week ago.
In New Zealand, Electronic Card Retail Sales edged up by 0.2% month-on-month in August, recovering from a 0.1% decline in the previous month. Year-on-year, electronic card transactions fell by 2.9%, improving from a 4.9% decrease in the prior month. Additionally, the monthly Food Price Index rose by 0.2% in August, down from a 0.4% increase in July.
The Reserve Bank of New Zealand (RBNZ) began its easing cycle in August with a 25 basis point cut to interest rates. The RBNZ is anticipated to implement additional rate cuts at each of its remaining two meetings this year. Market expectations suggest that the current cash rate of 5.25% could decline to 3.0% by the end of 2025.
New Zealand Dollar FAQs
The New Zealand Dollar (NZD), also known as the Kiwi, is a well-known traded currency among investors. Its value is broadly determined by the health of the New Zealand economy and the country’s central bank policy. Still, there are some unique particularities that also can make NZD move. The performance of the Chinese economy tends to move the Kiwi because China is New Zealand’s biggest trading partner. Bad news for the Chinese economy likely means less New Zealand exports to the country, hitting the economy and thus its currency. Another factor moving NZD is dairy prices as the dairy industry is New Zealand’s main export. High dairy prices boost export income, contributing positively to the economy and thus to the NZD.
The Reserve Bank of New Zealand (RBNZ) aims to achieve and maintain an inflation rate between 1% and 3% over the medium term, with a focus to keep it near the 2% mid-point. To this end, the bank sets an appropriate level of interest rates. When inflation is too high, the RBNZ will increase interest rates to cool the economy, but the move will also make bond yields higher, increasing investors’ appeal to invest in the country and thus boosting NZD. On the contrary, lower interest rates tend to weaken NZD. The so-called rate differential, or how rates in New Zealand are or are expected to be compared to the ones set by the US Federal Reserve, can also play a key role in moving the NZD/USD pair.
Macroeconomic data releases in New Zealand are key to assess the state of the economy and can impact the New Zealand Dollar’s (NZD) valuation. A strong economy, based on high economic growth, low unemployment and high confidence is good for NZD. High economic growth attracts foreign investment and may encourage the Reserve Bank of New Zealand to increase interest rates, if this economic strength comes together with elevated inflation. Conversely, if economic data is weak, NZD is likely to depreciate.
The New Zealand Dollar (NZD) tends to strengthen during risk-on periods, or when investors perceive that broader market risks are low and are optimistic about growth. This tends to lead to a more favorable outlook for commodities and so-called ‘commodity currencies’ such as the Kiwi. Conversely, NZD tends to weaken at times of market turbulence or economic uncertainty as investors tend to sell higher-risk assets and flee to the more-stable safe havens.
Gold prices rose in India on Thursday, according to data compiled by FXStreet.
The price for Gold stood at 6,795.84 Indian Rupees (INR) per gram, up compared with the INR 6,781.96 it cost on Wednesday.
The price for Gold increased to INR 79,265.35 per tola from INR 79,103.48 per tola a day earlier.
| Unit measure | Gold Price in INR |
|---|---|
| 1 Gram | 6,795.84 |
| 10 Grams | 67,958.41 |
| Tola | 79,265.35 |
| Troy Ounce | 211,374.40 |
FXStreet calculates Gold prices in India by adapting international prices (USD/INR) to the local currency and measurement units. Prices are updated daily based on the market rates taken at the time of publication. Prices are just for reference and local rates could diverge slightly.
Gold FAQs
Gold has played a key role in human’s history as it has been widely used as a store of value and medium of exchange. Currently, apart from its shine and usage for jewelry, the precious metal is widely seen as a safe-haven asset, meaning that it is considered a good investment during turbulent times. Gold is also widely seen as a hedge against inflation and against depreciating currencies as it doesn’t rely on any specific issuer or government.
Central banks are the biggest Gold holders. In their aim to support their currencies in turbulent times, central banks tend to diversify their reserves and buy Gold to improve the perceived strength of the economy and the currency. High Gold reserves can be a source of trust for a country’s solvency. Central banks added 1,136 tonnes of Gold worth around $70 billion to their reserves in 2022, according to data from the World Gold Council. This is the highest yearly purchase since records began. Central banks from emerging economies such as China, India and Turkey are quickly increasing their Gold reserves.
Gold has an inverse correlation with the US Dollar and US Treasuries, which are both major reserve and safe-haven assets. When the Dollar depreciates, Gold tends to rise, enabling investors and central banks to diversify their assets in turbulent times. Gold is also inversely correlated with risk assets. A rally in the stock market tends to weaken Gold price, while sell-offs in riskier markets tend to favor the precious metal.
The price can move due to a wide range of factors. Geopolitical instability or fears of a deep recession can quickly make Gold price escalate due to its safe-haven status. As a yield-less asset, Gold tends to rise with lower interest rates, while higher cost of money usually weighs down on the yellow metal. Still, most moves depend on how the US Dollar (USD) behaves as the asset is priced in dollars (XAU/USD). A strong Dollar tends to keep the price of Gold controlled, whereas a weaker Dollar is likely to push Gold prices up.
(An automation tool was used in creating this post.)
- EUR/USD holds steady above the 1.1000 mark as traders keenly await the ECB policy decision.
- Reduced bets for a more aggressive Fed easing underpin the USD and cap gains for the major.
- Traders seem reluctant ahead of the key central bank event risk and the release of the US PPI.
The EUR/USD pair struggles to gain any meaningful traction during the Asian session on Thursday and oscillates in a narrow band, just above the 1.1000 psychological mark, or a four-week low touched the previous day. Traders seem reluctant and opt to wait for the highly-anticipated European Central Bank (ECB) policy meeting before positioning for the next leg of a directional move.
The ECB is widely expected to lower interest rates by 25 basis points (bps) amid signs of cooling inflation in the Eurozone. The bets were reaffirmed by the data showing that the German Consumer Price Index (CP) print fell to its lowest level in over three years in August and touched the ECB's 2% target. This, in turn, undermines the shared currency and acts as a headwind for the EUR/USD pair amid a modest US Dollar (USD) strength.
The US CPI report released on Wednesday indicated that consumer prices in the US are easing overall. The core CPI, however, suggested that the underlying inflation remains sticky and dashed hopes for a larger rate cut by the Federal Reserve (Fed) next week. This is reinforced by an uptick in the US Treasury bond yields and lifts the USD Index (DXY), which tracks the buck against a basket of currencies, closer to the monthly peak.
That said, the markets have fully priced in the prospects for an imminent start of the Fed's policy easing cycle and a 25 bps rate cut at the end of the September 17-18 FOMC meeting. This, along with the upbeat market mood, caps any further appreciating move for the safe-haven Greenback. This should continue to offer some support to the EUR/USD pair heading into the key central bank event risk and warrants caution for bearish traders.
Investors might also prefer to wait for the ECB's updated economic projections, which, along with ECB Christine Lagarde's comments, will influence the Euro. Apart from this, the release of the US Producer Price Index (PPI) might provide a fresh impetus to the EUR/USD pair and produce some meaningful trading opportunities later during the North American session.
Economic Indicator
ECB Main Refinancing Operations Rate
One of the three key interest rates set by the European Central Bank (ECB), the main refinancing operations rate is the interest rate the ECB charges to banks for one-week long loans. It is announced by the European Central Bank at its eight scheduled annual meetings. If the ECB expects inflation to rise, it will increase its interest rates to bring it back down to its 2% target. This tends to be bullish for the Euro (EUR), since it attracts more foreign capital inflows. Likewise, if the ECB sees inflation falling it may cut the main refinancing operations rate to encourage banks to borrow and lend more, in the hope of driving economic growth. This tends to weaken the Euro as it reduces its attractiveness as a place for investors to park capital.
Read more.Next release: Thu Sep 12, 2024 12:15
Frequency: Irregular
Consensus: 4%
Previous: 4.25%
Source: European Central Bank
- The Indian Rupee may receive support from expected foreign inflows into domestic equities following US Consumer Price Index data.
- Traders expect RBI interventions to prevent the INR from weakening beyond the 84.00 level.
- The US inflation report has increased the odds of a 25-basis points rate cut by the Fed in September.
The USD/INR pair moves sideways on Thursday as traders speculate potential market interventions by the Reserve Bank of India (RBI) to prevent the Indian Rupee (INR) from weakening beyond the 84.00 level. Traders await Consumer Price Index and Industrial Output data from India scheduled to be released later in the day.
Additionally, subdued crude Oil prices provide support for the Indian Rupee against the US Dollar (USD). India, the world’s third-largest Oil importer, stands to benefit from lower import costs. Concerns over weakened Oil demand have offset the impact of Hurricane Francine on the United States (US) Oil production, the world's largest crude producer.
The Indian Rupee may receive support from the expected rise in foreign inflows into domestic equities following August’s US Consumer Price Index (CPI) data. This US inflation report has heightened the likelihood that the Federal Reserve (Fed) will begin its easing cycle with a 25-basis points interest rate cut in September.
According to the CME FedWatch Tool, markets are fully anticipating at least a 25 basis point (bps) rate cut by the Federal Reserve at its September meeting. The likelihood of a 50 bps rate cut has sharply decreased to 15.0%, down from 44.0% a week ago.
Daily Digest Market Movers: Indian Rupee consolidates amid thin volatility
- India is considering relaxing investment rules for Chinese firms to stimulate its manufacturing sector. Additionally, the country has eased visa issuance for Chinese nationals to support local manufacturing. India's trade deficit with China has nearly doubled since 2020, according to a Reuters’ report.
- The US Consumer Price Index dipped to 2.5% year-on-year in August, from the previous reading of 2.9%. The index has fallen short of the expected 2.6% reading. Meanwhile, headline CPI stood at 0.2% MoM. Core CPI ex Food & Energy, remained unchanged at 3.2% YoY. On a monthly basis, core CPI rose to 0.3% from the previous 0.2% reading.
- The first US presidential debate between former President Donald Trump and Democratic nominee Kamala Harris in Pennsylvania was won by Harris, according to a CNN poll. The debate began with a critical focus on the economy, inflation, and economic policies.
- On Tuesday, Reuters reported that six Indian bankers indicated that investors are urging the Indian federal government to increase the issuance of short-term and green bonds and to restart auctions for floating-rate bonds. These recommendations were discussed during a series of meetings about the government’s borrowing strategy for the latter half of the fiscal year.
- Chicago Fed President Austan Goolsbee remarked on Friday that Fed officials are starting to align with the broader market's sentiment that a policy rate adjustment by the US central bank is imminent, according to CNBC. FXStreet’s FedTracker, which uses a custom AI model to evaluate Fed officials' speeches on a dovish-to-hawkish scale from 0 to 10, rated Goolsbee's comments as dovish, assigning them a score of 3.2.
- India's FX Reserves reached a record high of $683.99 billion as of August 30, up from $681.69 billion previously. This surge is largely due to a substantial influx of foreign exchange into the Indian economy, spurred by robust economic growth and the long-anticipated inclusion of Indian assets in JPMorgan's major emerging market debt index, which has enhanced foreign investment.
Technical Analysis: USD/INR remains below 84.00, tests upper boundary of the symmetrical triangle
The Indian Rupee remains slightly below 84.00 on Thursday. Analysis of the daily chart shows that the USD/INR pair is consolidating within a symmetrical triangle pattern, indicating reduced volatility and a phase of consolidation. However, the 14-day Relative Strength Index (RSI) remains above 50, suggesting that the bullish trend is still in play.
On the downside, the nine-day Exponential Moving Average (EMA) at 83.93 could serve as immediate support, aligning with the lower boundary of the symmetrical triangle near 83.90. A drop below this level might indicate a bearish shift, potentially applying downward pressure on the USD/INR pair and driving it toward its six-week low around 83.72.
On the resistance side, the USD/INR pair is consolidating, along with the upper boundary of the symmetrical triangle near the 84.00 level. A breakout above this point could propel the pair toward the all-time high of 84.14, recorded on August 5.
USD/INR: Daily Chart
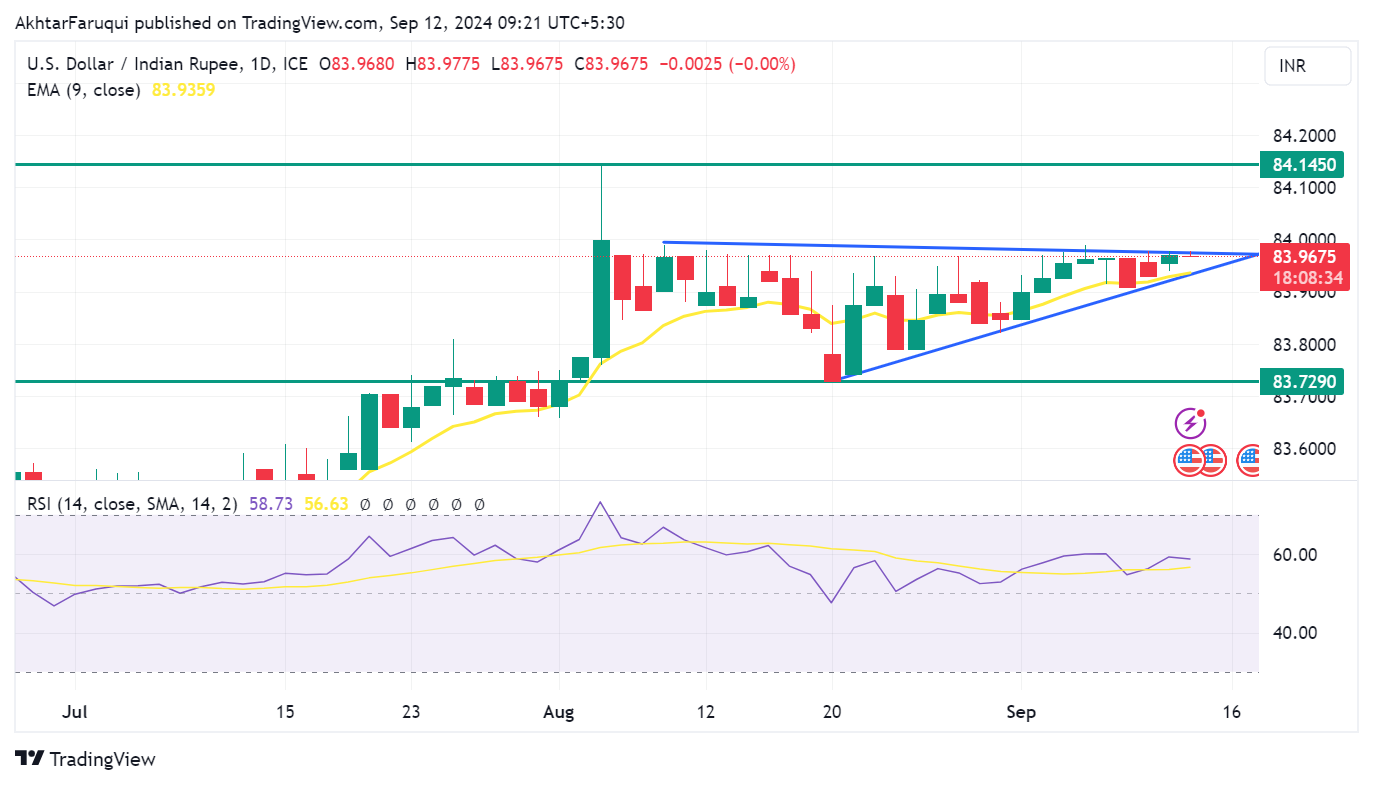
Indian economy FAQs
The Indian economy has averaged a growth rate of 6.13% between 2006 and 2023, which makes it one of the fastest growing in the world. India’s high growth has attracted a lot of foreign investment. This includes Foreign Direct Investment (FDI) into physical projects and Foreign Indirect Investment (FII) by foreign funds into Indian financial markets. The greater the level of investment, the higher the demand for the Rupee (INR). Fluctuations in Dollar-demand from Indian importers also impact INR.
India has to import a great deal of its Oil and gasoline so the price of Oil can have a direct impact on the Rupee. Oil is mostly traded in US Dollars (USD) on international markets so if the price of Oil rises, aggregate demand for USD increases and Indian importers have to sell more Rupees to meet that demand, which is depreciative for the Rupee.
Inflation has a complex effect on the Rupee. Ultimately it indicates an increase in money supply which reduces the Rupee’s overall value. Yet if it rises above the Reserve Bank of India’s (RBI) 4% target, the RBI will raise interest rates to bring it down by reducing credit. Higher interest rates, especially real rates (the difference between interest rates and inflation) strengthen the Rupee. They make India a more profitable place for international investors to park their money. A fall in inflation can be supportive of the Rupee. At the same time lower interest rates can have a depreciatory effect on the Rupee.
India has run a trade deficit for most of its recent history, indicating its imports outweigh its exports. Since the majority of international trade takes place in US Dollars, there are times – due to seasonal demand or order glut – where the high volume of imports leads to significant US Dollar- demand. During these periods the Rupee can weaken as it is heavily sold to meet the demand for Dollars. When markets experience increased volatility, the demand for US Dollars can also shoot up with a similarly negative effect on the Rupee.
- USD/CAD edges higher during the Asian session on Wednesday amid a modest USD strength.
- Reduced bets for a 50-bps Fed rate cut lift the US bond yields higher and underpin the buck.
- An uptick in Oil prices lends support to the Loonie and keeps a lid on further gains for the pair.
The USD/CAD pair attracts dip-buying during the Asian session on Thursday and for now, seems to have stalled its retracement slide from a three-week top, around the 1.3620-1.3625 area touched the previous day. The intraday uptick, however, lacks bullish conviction, warranting some caution before positioning for any meaningful appreciating move.
The crucial US Consumer Price Index (CPI) report indicated that consumer prices in the US are easing overall. That said, the core CPI indicated that the underlying inflation remains sticky and dashed hopes for a larger, 50 basis points (bps) rate cut by the Federal Reserve (Fed) next week. This, in turn, leads to an uptick in the US Treasury bond yields, which lifts the US Dollar (USD) back closer to the monthly peak and turns out to be a key factor acting as a tailwind for the USD/CAD pair.
Meanwhile, the US central bank is almost certain to start its policy easing cycle and lower borrowing costs by 25 bps at the September 17-18 policy meeting. This, along with a generally positive tone around the equity markets, keeps a lid on the safe-haven Greenback. Moreover, a modest pickup in Crude Oil prices underpins the commodity-linked Loonie and contributes to capping the USD/CAD pair, making it prudent to wait for strong follow-through buying before placing fresh bullish bets.
Market participants now look forward to the release of the US Producer Price Index (PPI) for some impetus later during the early North American session. This, along with the US bond yields and the broader risk sentiment, will drive the USD demand. Apart from this, Oil price dynamics should allow traders to grab short-term opportunities around the USD/CAD pair.
US Dollar PRICE Today
The table below shows the percentage change of US Dollar (USD) against listed major currencies today. US Dollar was the strongest against the Japanese Yen.
| USD | EUR | GBP | JPY | CAD | AUD | NZD | CHF | |
|---|---|---|---|---|---|---|---|---|
| USD | -0.00% | 0.01% | 0.11% | -0.00% | -0.11% | -0.04% | 0.06% | |
| EUR | 0.00% | 0.02% | 0.13% | 0.02% | -0.10% | -0.03% | 0.06% | |
| GBP | -0.01% | -0.02% | 0.00% | -0.00% | -0.12% | -0.06% | 0.04% | |
| JPY | -0.11% | -0.13% | 0.00% | -0.13% | -0.25% | -0.20% | -0.08% | |
| CAD | 0.00% | -0.02% | 0.00% | 0.13% | -0.10% | -0.05% | 0.04% | |
| AUD | 0.11% | 0.10% | 0.12% | 0.25% | 0.10% | 0.07% | 0.15% | |
| NZD | 0.04% | 0.03% | 0.06% | 0.20% | 0.05% | -0.07% | 0.10% | |
| CHF | -0.06% | -0.06% | -0.04% | 0.08% | -0.04% | -0.15% | -0.10% |
The heat map shows percentage changes of major currencies against each other. The base currency is picked from the left column, while the quote currency is picked from the top row. For example, if you pick the US Dollar from the left column and move along the horizontal line to the Japanese Yen, the percentage change displayed in the box will represent USD (base)/JPY (quote).
- Gold price drifted lower following the release of the crucial US CPI report on Wednesday.
- Diminishing odds for a 50-bps rate cut in September lifts the US bond yields and the USD.
- The prospects for an imminent start of the Fed’s policy-easing cycle offer some support.
Gold price (XAU/USD) witnessed an intraday pullback from the vicinity of the all-time peak on Wednesday after the latest US consumer inflation figures dashed hopes for a larger interest rate cut by the Federal Reserve (Fed) in September. Apart from this, the risk-on impulse further undermined the safe-haven precious metal, which settled in the red for the first time in three days. That said, the prospects for an imminent start of the Fed's policy-easing cycle assisted the non-yielding yellow metal to find some support and bounce off the $2,500 psychological mark.
Furthermore, investors expect the US central bank to lower interest rates by 25 basis points (bps) at each of the three remaining policy meetings in 2024. This, in turn, acts as a tailwind for the Gold price during the Asian session on Thursday. The upside, however, remains capped amid the emergence of some US Dollar (USD) buying, bolstered by a pickup in the US Treasury bond yields. Moreover, the XAU/USD remains confined in a multi-week-old trading range, warranting some caution for aggressive traders and positioning for a firm near-term direction.
Daily Digest Market Movers: Gold price struggles to gain traction as traders trim bets for aggressive Fed policy easing
- Gold price fell on Wednesday after the crucial US Consumer Price Index (CPI) report forced investors to scale back their expectations of a larger, 50-basis-points interest rate cut by the Federal Reserve next week.
- The US Bureau of Labor Statistics reported that the headline CPI rose 0.2% in August and the yearly rate decelerated more than anticipated, from 2.9% to 2.5%, marking the smallest increase since February 2021.
- Meanwhile, the core CPI, which excludes volatile food and energy prices, was up 0.3% during the reported month and rose 3.2% in the 12 months through August, matching July's increase and market expectations.
- According to the CME Group's FedWatch tool, the markets are currently pricing in an 87% chance of a 25 bps rate cut at the next FOMC policy meeting on September 17-18 as compared to 71% before the US CPI data.
- Diminishing odds for a more aggressive policy easing by the US central bank push the US Treasury bond yields and the US Dollar higher, which, in turn, is likely to act as a headwind for the non-yielding yellow metal.
- Traders now look forward to the release of the US Producer Price Index (PPI) for some impetus, though the market reaction is likely to be limited amid the prospects for an imminent start of the Fed's rate-cutting cycle.
Technical Outlook: Gold price extends its consolidative price move and remains confined in a multi-week-old range
From a technical perspective, the recent range-bound price action constitutes the formation of a rectangle on short-term charts and might still be categorized as a bullish consolidation phase against the backdrop of a rally from the June swing low. Adding to this, mixed oscillators on the daily chart make it prudent to wait for a breakout through the short-term range before placing fresh directional bets. Meanwhile, any subsequent move up might continue to confront some resistance near the $2,530-2,532 region, or the all-time peak touched in August. Some follow-through buying will be seen as a fresh trigger for bullish traders and pave the way for the resumption of the prior well-established uptrend.
On the flip side, weakness below the $2,500 mark is likely to find support near the $2,485 region ahead of the $2,470 horizontal zone. The latter coincides with the lower boundary of the aforementioned trading range and should act as a strong base for the Gold price. A convincing break below might prompt aggressive technical selling and drag the XAU/USD to the 50-day Simple Moving Average (SMA), currently pegged near the $2,453-2,452 region. The corrective decline could extend further towards testing sub-$2,400 levels, or the 100-day SMA support.
Gold FAQs
Gold has played a key role in human’s history as it has been widely used as a store of value and medium of exchange. Currently, apart from its shine and usage for jewelry, the precious metal is widely seen as a safe-haven asset, meaning that it is considered a good investment during turbulent times. Gold is also widely seen as a hedge against inflation and against depreciating currencies as it doesn’t rely on any specific issuer or government.
Central banks are the biggest Gold holders. In their aim to support their currencies in turbulent times, central banks tend to diversify their reserves and buy Gold to improve the perceived strength of the economy and the currency. High Gold reserves can be a source of trust for a country’s solvency. Central banks added 1,136 tonnes of Gold worth around $70 billion to their reserves in 2022, according to data from the World Gold Council. This is the highest yearly purchase since records began. Central banks from emerging economies such as China, India and Turkey are quickly increasing their Gold reserves.
Gold has an inverse correlation with the US Dollar and US Treasuries, which are both major reserve and safe-haven assets. When the Dollar depreciates, Gold tends to rise, enabling investors and central banks to diversify their assets in turbulent times. Gold is also inversely correlated with risk assets. A rally in the stock market tends to weaken Gold price, while sell-offs in riskier markets tend to favor the precious metal.
The price can move due to a wide range of factors. Geopolitical instability or fears of a deep recession can quickly make Gold price escalate due to its safe-haven status. As a yield-less asset, Gold tends to rise with lower interest rates, while higher cost of money usually weighs down on the yellow metal. Still, most moves depend on how the US Dollar (USD) behaves as the asset is priced in dollars (XAU/USD). A strong Dollar tends to keep the price of Gold controlled, whereas a weaker Dollar is likely to push Gold prices up.
- WTI prices remain stable as demand concerns have counterbalanced the potential impact of Hurricane Francine on US Oil production.
- Oil demand faces challenges due to the growing adoption of electric vehicles in key markets like China.
- EIA Crude Oil Stocks rose by 0.833 million barrels for the previous week, against the forecasted 0.9 million-barrel increase.
West Texas Intermediate (WTI) Oil prices remain steady, hovering around $66.80 per barrel during Thursday's Asian session. Concerns over weakened demand have offset the impact of Hurricane Francine on the United States (US) Oil production, the world's largest crude producer.
In particular, Oil demand in key markets, such as China, is under pressure, with the growing adoption of electric vehicles reducing oil consumption.
On Wednesday, energy production in the US Gulf of Mexico was partially disrupted, and several Oil refineries in Louisiana scaled back operations ahead of Hurricane Francine's landfall, according to official reports cited by Reuters.
US Oil stockpiles increased across the board last week as crude imports rose and exports declined, according to the Energy Information Administration (EIA) on Wednesday. The report also showed that gasoline demand fell to its lowest level since May, while distillate fuel demand also dropped, alongside a decline in refinery activity.
Despite a smaller-than-expected inventory build, crude Oil prices remained subdued. EIA data showed that Crude Oil Stocks rose by 0.833 million barrels for the week ending September 6, slightly below the forecasted increase of 0.9 million barrels.
Earlier in the week, the Organization of the Petroleum Exporting Countries (OPEC) lowered its forecast for global Oil demand growth in 2024, marking its second consecutive downward revision. OPEC also reduced its demand expectations for the upcoming year.
Oil traders are now anticipating the release of the International Energy Agency's (IEA) monthly market report later this week, searching for indications of a weakening demand outlook, according to a note from ANZ Research on Thursday.
WTI Oil FAQs
WTI Oil is a type of Crude Oil sold on international markets. The WTI stands for West Texas Intermediate, one of three major types including Brent and Dubai Crude. WTI is also referred to as “light” and “sweet” because of its relatively low gravity and sulfur content respectively. It is considered a high quality Oil that is easily refined. It is sourced in the United States and distributed via the Cushing hub, which is considered “The Pipeline Crossroads of the World”. It is a benchmark for the Oil market and WTI price is frequently quoted in the media.
Like all assets, supply and demand are the key drivers of WTI Oil price. As such, global growth can be a driver of increased demand and vice versa for weak global growth. Political instability, wars, and sanctions can disrupt supply and impact prices. The decisions of OPEC, a group of major Oil-producing countries, is another key driver of price. The value of the US Dollar influences the price of WTI Crude Oil, since Oil is predominantly traded in US Dollars, thus a weaker US Dollar can make Oil more affordable and vice versa.
The weekly Oil inventory reports published by the American Petroleum Institute (API) and the Energy Information Agency (EIA) impact the price of WTI Oil. Changes in inventories reflect fluctuating supply and demand. If the data shows a drop in inventories it can indicate increased demand, pushing up Oil price. Higher inventories can reflect increased supply, pushing down prices. API’s report is published every Tuesday and EIA’s the day after. Their results are usually similar, falling within 1% of each other 75% of the time. The EIA data is considered more reliable, since it is a government agency.
OPEC (Organization of the Petroleum Exporting Countries) is a group of 13 Oil-producing nations who collectively decide production quotas for member countries at twice-yearly meetings. Their decisions often impact WTI Oil prices. When OPEC decides to lower quotas, it can tighten supply, pushing up Oil prices. When OPEC increases production, it has the opposite effect. OPEC+ refers to an expanded group that includes ten extra non-OPEC members, the most notable of which is Russia.
| Raw materials | Closed | Change, % |
|---|---|---|
| Silver | 28.674 | 0.97 |
| Gold | 251.231 | -0.18 |
| Palladium | 1015.7 | 4.47 |
- The AUD/USD pair edges higher following the remarks from former RBA Governor Bernie Fraser.
- Bernie Fraser criticized the RBA board for being overly focused on inflation at the expense of the job market.
- Australia’s Consumer Inflation Expectations eased to 4.4% in September, down slightly from August's four-month high of 4.5%.
The AUD/USD pair gains ground following soft Consumer Inflation Expectations from Australia released on Thursday. Additionally, the former Reserve Bank of Australia (RBA) Governor Bernie Fraser criticized the current RBA board for being overly focused on inflation at the expense of the job market. Fraser suggested that the Board should lower the cash rate, warning of "recessionary risks" that could have severe consequences for employment.
The Australian Dollar (AUD) gained support against the US Dollar (USD) as improved risk sentiment followed the release of the US inflation report on Wednesday. The August’s US Consumer Price Index (CPI) data showed that headline inflation dropped to a three-year low, although core inflation exceeded expectations. This development has heightened the likelihood that the Federal Reserve (Fed) will begin its easing cycle with a 25-basis points interest rate cut in September.
On Wednesday, Sarah Hunter, the Reserve Bank of Australia's (RBA) Assistant Governor for Economics, remarked that high interest rates are suppressing demand, which is expected to lead to a mild economic downturn. Hunter also pointed out that the labor market remains tight relative to full employment levels, with employment growth projected to continue, though slower than population growth, according to Reuters.
Daily Digest Market Movers: Australian Dollar holds ground due to improved risk sentiment
- According to the CME FedWatch Tool, markets are fully anticipating at least a 25 basis point (bps) rate cut by the Federal Reserve at its September meeting. The likelihood of a 50 bps rate cut has sharply decreased to 15.0%, down from 44.0% a week ago.
- Australia’s Consumer Inflation Expectations eased to 4.4% in September, down slightly from August's four-month high of 4.5%. This decline highlights the central bank's efforts to strike a balance between bringing inflation down within a reasonable timeframe and maintaining gains in the labor market.
- US Consumer Price Index dipped to 2.5% year-on-year in August, from the previous reading of 2.9%. The index has fallen short of the expected 2.6% reading. Meanwhile, headline CPI stood at 0.2% MoM.
- US core CPI ex Food & Energy, remained unchanged at 3.2% YoY. On a monthly basis, core CPI rose to 0.3% from previous 0.2% reading.
- The first US presidential debate between former President Donald Trump and Democratic nominee Kamala Harris in Pennsylvania was won by Harris, according to a CNN poll. The debate began with a critical focus on the economy, inflation, and economic policies.
- Morgan Stanley's Chief China Economist, Robin Xing, stated that China is undoubtedly experiencing deflation, likely in the second stage of the process. Xing noted that Japan's experience suggests that the longer deflation persists, the greater the need for China to implement significant stimulus measures to overcome the debt-deflation challenge, per Business Standard.
- Australia's Westpac Consumer Confidence fell by 0.5% month-on-month in September, swinging from a 2.8% gain in August.
- China's Trade Balance reported a trade surplus of CNY 649.34 billion for August, increasing from the previous reading of CNY 601.90 billion. Meanwhile, China's Exports (CNY) increased by 8.4% year-on-year, following the previous rise of 6.5%.
Technical Analysis: Australian Dollar moves above 0.6650; next barrier at the nine-day EMA
The AUD/USD pair trades near 0.6680 on Thursday, with technical analysis of the daily chart indicating that it remains within a descending channel, signaling a bearish bias. The 14-day Relative Strength Index (RSI) remains below the 50 level, confirming the ongoing bearish trend.
On the downside, the AUD/USD pair could target the lower boundary of the descending channel around 0.6600. A break below this level may strengthen the bearish outlook, potentially driving the pair toward the throwback support zone near 0.6575.
On the upside, the AUD/USD pair may face resistance around the nine-day Exponential Moving Average (EMA) at 0.6694, followed by the upper boundary of the descending channel near 0.6720. A break above this upper boundary could diminish the bearish bias, potentially opening the door for the pair to retest its seven-month high of 0.6798, last seen on July 11.
AUD/USD: Daily Chart
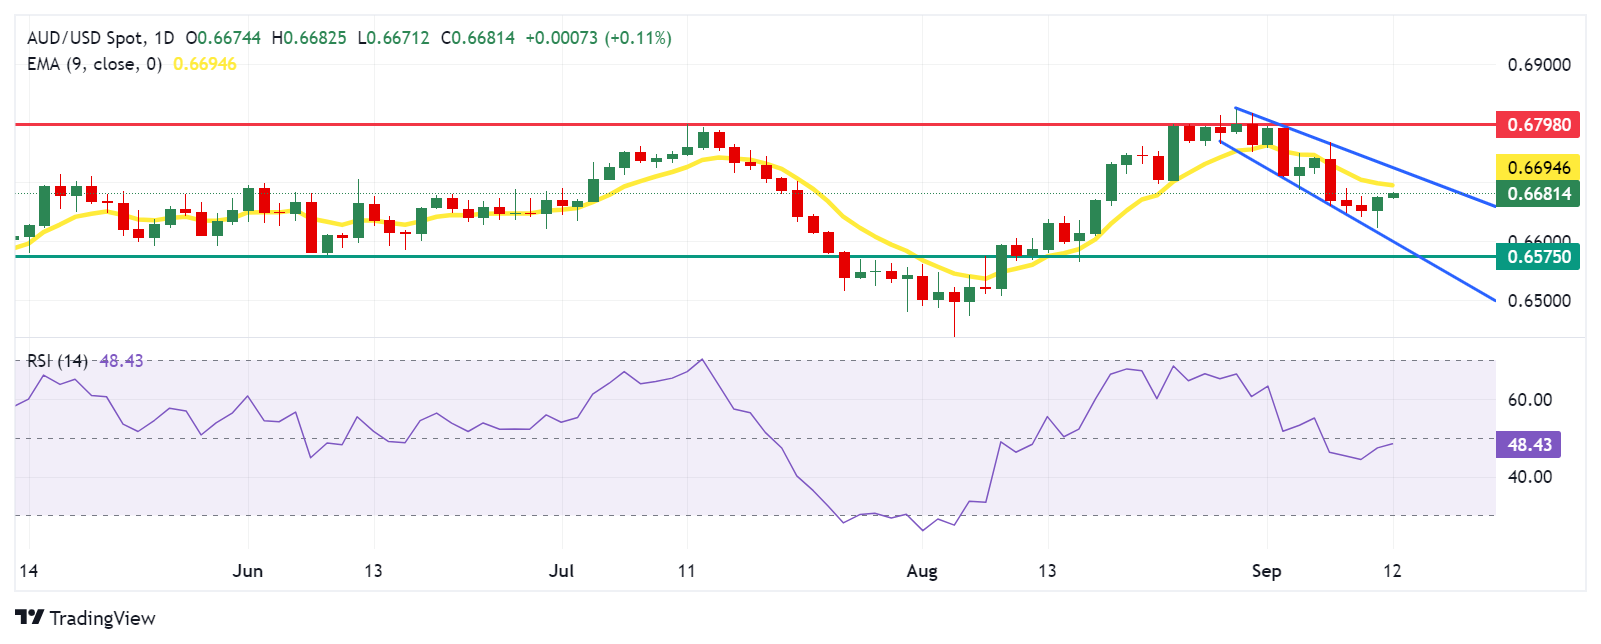
Australian Dollar PRICE Today
The table below shows the percentage change of Australian Dollar (AUD) against listed major currencies today. Australian Dollar was the strongest against the Japanese Yen.
| USD | EUR | GBP | JPY | CAD | AUD | NZD | CHF | |
|---|---|---|---|---|---|---|---|---|
| USD | -0.00% | 0.03% | 0.10% | 0.00% | -0.10% | 0.02% | -0.03% | |
| EUR | 0.00% | 0.03% | 0.13% | 0.02% | -0.09% | 0.04% | -0.04% | |
| GBP | -0.03% | -0.03% | 0.00% | -0.02% | -0.13% | 0.00% | -0.08% | |
| JPY | -0.10% | -0.13% | 0.00% | -0.12% | -0.22% | -0.11% | -0.16% | |
| CAD | -0.01% | -0.02% | 0.02% | 0.12% | -0.09% | 0.02% | -0.06% | |
| AUD | 0.10% | 0.09% | 0.13% | 0.22% | 0.09% | 0.13% | 0.04% | |
| NZD | -0.02% | -0.04% | -0.00% | 0.11% | -0.02% | -0.13% | -0.08% | |
| CHF | 0.03% | 0.04% | 0.08% | 0.16% | 0.06% | -0.04% | 0.08% |
The heat map shows percentage changes of major currencies against each other. The base currency is picked from the left column, while the quote currency is picked from the top row. For example, if you pick the Australian Dollar from the left column and move along the horizontal line to the US Dollar, the percentage change displayed in the box will represent AUD (base)/USD (quote).
Australian Dollar FAQs
One of the most significant factors for the Australian Dollar (AUD) is the level of interest rates set by the Reserve Bank of Australia (RBA). Because Australia is a resource-rich country another key driver is the price of its biggest export, Iron Ore. The health of the Chinese economy, its largest trading partner, is a factor, as well as inflation in Australia, its growth rate and Trade Balance. Market sentiment – whether investors are taking on more risky assets (risk-on) or seeking safe-havens (risk-off) – is also a factor, with risk-on positive for AUD.
The Reserve Bank of Australia (RBA) influences the Australian Dollar (AUD) by setting the level of interest rates that Australian banks can lend to each other. This influences the level of interest rates in the economy as a whole. The main goal of the RBA is to maintain a stable inflation rate of 2-3% by adjusting interest rates up or down. Relatively high interest rates compared to other major central banks support the AUD, and the opposite for relatively low. The RBA can also use quantitative easing and tightening to influence credit conditions, with the former AUD-negative and the latter AUD-positive.
China is Australia’s largest trading partner so the health of the Chinese economy is a major influence on the value of the Australian Dollar (AUD). When the Chinese economy is doing well it purchases more raw materials, goods and services from Australia, lifting demand for the AUD, and pushing up its value. The opposite is the case when the Chinese economy is not growing as fast as expected. Positive or negative surprises in Chinese growth data, therefore, often have a direct impact on the Australian Dollar and its pairs.
Iron Ore is Australia’s largest export, accounting for $118 billion a year according to data from 2021, with China as its primary destination. The price of Iron Ore, therefore, can be a driver of the Australian Dollar. Generally, if the price of Iron Ore rises, AUD also goes up, as aggregate demand for the currency increases. The opposite is the case if the price of Iron Ore falls. Higher Iron Ore prices also tend to result in a greater likelihood of a positive Trade Balance for Australia, which is also positive of the AUD.
The Trade Balance, which is the difference between what a country earns from its exports versus what it pays for its imports, is another factor that can influence the value of the Australian Dollar. If Australia produces highly sought after exports, then its currency will gain in value purely from the surplus demand created from foreign buyers seeking to purchase its exports versus what it spends to purchase imports. Therefore, a positive net Trade Balance strengthens the AUD, with the opposite effect if the Trade Balance is negative.
- USD/JPY attracts fresh sellers following an intraday gains to the 143.00 neighborhood.
- BoJ Tamura’s hawkish remarks boost the JPY and exert downward pressure on the pair.
- A goodish pickup in the USD demand and the upbeat market mood lend some support.
The USD/JPY pair fails to capitalize on modest Asian session gains to the 143.00 neighborhood and for now, seems to have stalled its goodish recovery from a nearly nine-month low touched the previous day. Spot prices currently trade around the mid-143.00s, or the lower end of the daily range and seem vulnerable to prolonging the recent well-established downtrend witnessed over the past two months or so.
Despite further signs that consumer prices in the US are easing overall, the core CPI print indicated that the underlying inflation remains sticky and dashed hopes for an outsized, 50 basis points (bps) rate cut by the Federal Reserve (Fed) next week. This, in turn, assists the US Dollar (USD) to regain positive traction and climb back closer to the monthly peak. Apart from this, the risk-on impulse undermined the safe-haven Japanese Yen (JPY) and acted as a tailwind for the USD/JPY pair higher.
The JPY was further weighed down by an unexpected decline in Japan's Producer Price Index (PPI), by 0.2% in August. Adding to this, the yearly rate decelerated more than anticipated to 2.5% during the reported month from 3.0% in July. That said, comments by Bank of Japan (BoJ) board member Naoki Tamura, saying that the path towards ending the easy policy is still very long, reaffirms bets for a further rise in borrowing costs by the end of this year and helps limit losses for the JPY.
Furthermore, the markets have fully priced in a 25 bps Fed rate cut move at its upcoming policy meeting on September 17-18, marking a big divergence in comparison to a hawkish BoJ. This, in turn, prompts fresh selling around the USD/JPY pair and turns out to be a key factor behind the intraday pullback. Traders now look forward to the release of the US PPI for a fresh impetus, though the fundamental backdrop suggests that the path of least resistance for spot prices is to the downside.
Bank of Japan FAQs
The Bank of Japan (BoJ) is the Japanese central bank, which sets monetary policy in the country. Its mandate is to issue banknotes and carry out currency and monetary control to ensure price stability, which means an inflation target of around 2%.
The Bank of Japan has embarked in an ultra-loose monetary policy since 2013 in order to stimulate the economy and fuel inflation amid a low-inflationary environment. The bank’s policy is based on Quantitative and Qualitative Easing (QQE), or printing notes to buy assets such as government or corporate bonds to provide liquidity. In 2016, the bank doubled down on its strategy and further loosened policy by first introducing negative interest rates and then directly controlling the yield of its 10-year government bonds.
The Bank’s massive stimulus has caused the Yen to depreciate against its main currency peers. This process has exacerbated more recently due to an increasing policy divergence between the Bank of Japan and other main central banks, which have opted to increase interest rates sharply to fight decades-high levels of inflation. The BoJ’s policy of holding down rates has led to a widening differential with other currencies, dragging down the value of the Yen.
A weaker Yen and the spike in global energy prices have led to an increase in Japanese inflation, which has exceeded the BoJ’s 2% target. With wage inflation becoming a cause of concern, the BoJ looks to move away from ultra loose policy, while trying to avoid slowing the activity too much.
The People’s Bank of China (PBOC) set the USD/CNY central rate for the trading session ahead on Thursday at 7.1214, as against the previous day's fix of 7.1182 and 7.1219 Reuters estimates.
The Bank of Japan (BoJ) board member Naoki Tamura crossed the wires during the Asian session on Thursday, saying that the path towards ending the easy policy is still very long.
Key Quotes:
- Japan's neutral rate is likely to be around 1% at the minimum.
- Will carefully examine the pros and cons of exiting easy policy.
Market Reaction:
The hawkish remarks reaffirm market expectations for an additional interest rate hike by the BoJ in 2024 and offer some support to the Japanese Yen (JPY), capping the USD/JPY pair's recovery from a multi-month low near the 143.00 mark.
| Index | Change, points | Closed | Change, % |
|---|---|---|---|
| NIKKEI 225 | -539.39 | 35619.77 | -1.49 |
| Hang Seng | -125.38 | 17108.71 | -0.73 |
| KOSPI | -10.06 | 2513.37 | -0.4 |
| ASX 200 | -24 | 7987.9 | -0.3 |
| DAX | 64.35 | 18330.27 | 0.35 |
| CAC 40 | -10.72 | 7396.83 | -0.14 |
| Dow Jones | 124.75 | 40861.71 | 0.31 |
| S&P 500 | 58.61 | 5554.13 | 1.07 |
| NASDAQ Composite | 369.65 | 17395.53 | 2.17 |
| Pare | Closed | Change, % |
|---|---|---|
| AUDUSD | 0.66721 | 0.29 |
| EURJPY | 156.694 | -0.12 |
| EURUSD | 1.10124 | -0.07 |
| GBPJPY | 185.595 | -0.33 |
| GBPUSD | 1.30432 | -0.28 |
| NZDUSD | 0.61356 | -0.21 |
| USDCAD | 1.35732 | -0.26 |
| USDCHF | 0.85193 | 0.6 |
| USDJPY | 142.286 | -0.05 |


© 2000-2026. Sva prava zaštićena.
Sajt je vlasništvo kompanije Teletrade D.J. LLC 2351 LLC 2022 (Euro House, Richmond Hill Road, Kingstown, VC0100, St. Vincent and the Grenadines).
Svi podaci koji se nalaze na sajtu ne predstavljaju osnovu za donošenje investicionih odluka, već su informativnog karaktera.
The company does not serve or provide services to customers who are residents of the US, Canada, Iran, The Democratic People's Republic of Korea, Yemen and FATF blacklisted countries.
Izvršenje trgovinskih operacija sa finansijskim instrumentima upotrebom marginalne trgovine pruža velike mogućnosti i omogućava investitorima ostvarivanje visokih prihoda. Međutim, takav vid trgovine povezan je sa potencijalno visokim nivoom rizika od gubitka sredstava. Проведение торговых операций на финанcовых рынках c маржинальными финанcовыми инcтрументами открывает широкие возможноcти, и позволяет инвеcторам, готовым пойти на риcк, получать выcокую прибыль, но при этом неcет в cебе потенциально выcокий уровень риcка получения убытков. Iz tog razloga je pre započinjanja trgovine potrebno odlučiti o izboru odgovarajuće investicione strategije, uzimajući u obzir raspoložive resurse.
Upotreba informacija: U slučaju potpunog ili delimičnog preuzimanja i daljeg korišćenja materijala koji se nalazi na sajtu, potrebno je navesti link odgovarajuće stranice na sajtu kompanije TeleTrade-a kao izvora informacija. Upotreba materijala na internetu mora biti praćena hiper linkom do web stranice teletrade.org. Automatski uvoz materijala i informacija sa stranice je zabranjen.
Ako imate bilo kakvih pitanja, obratite nam se pr@teletrade.global.
транcфери