- Analiza
- Novosti i instrumenti
- Vesti sa tržišta
Forex-novosti i prognoze od 12-08-2024
- The New Zealand Dollar holds positive ground in Tuesday’s early Asian session.
- Reduced bets for a RBNZ rate cut and signs of stronger demand from China supported the Kiwi.
- Rising Middle East geopolitical risks might limit the pair’s downside.
- The US Producer Price Index (PPI) will be in the spotlight on Tuesday before the RBNZ rate decision.
The New Zealand Dollar (NZD) trades on a stronger note on Tuesday amid the modest decline of the Greenback. The stronger-than-expected New Zealand employment report last week diminished the possibility of the Reserve Bank of New Zealand (RBNZ) rate cut on Wednesday, which continues to support the Kiwi. Additionally, signs that Chinese demand is improving could contribute to the NZD’s upside as China is New Zealand's largest trading partner.
On the other hand, safe-haven buying amid elevated geopolitical tensions in the Middle East might push the US Dollar (USD) higher. The RBNZ interest rate decision and press conference on Wednesday will be closely watched. The hawkish messages from RBNZ Governor Adrian Orr might lift the NZD against the USD in the near term. Elsewhere, traders will keep an eye on the US economic data, which should shed further light on the Federal Reserve’s (Fed) outlook for rates. The Producer Price Index (PPI), Consumer Price Index (CPI) and Retail Sales will be released on Tuesday, Wednesday and Thursday, respectively.
Daily Digest Market Movers: New Zealand Dollar edges higher, with all eyes on RBNZ Interest Rate Decision
- ING’s FX analysts Francesco Pesole and Chris Turner noted, “We narrowly favor a hold in August but see a greater chance that the RBNZ will cut 50 bps in October after the Fed has moved first. Ultimately, with over 90 bps of easing priced in by year-end, the difference between a hawkish cut and a dovish hold may not be huge: we still think easing bets can be trimmed by year-end.”
- 12 of 21 economists surveyed by Bloomberg expect the RBNZ to leave its OCR unchanged at 5.5% on Wednesday.
- Over half of the NZIER Shadow Board expects a 25 bps reduction in the OCR is required due to the persistent weakening of the New Zealand economy. The other members suggested that the New Zealand central bank should keep the OCR at 5.50%.
- The US Producer Price Index (PPI) is expected to drop to 0.1% MoM in July from 0.2% in June.
- Traders have priced in a nearly 47.5% chance that the Fed will cut the rate by 50 basis points (bps) in the September meeting, down from 52.5% last Friday, according to the CME FedWatch Tool.
Technical Analysis: New Zealand Dollar’s bearish trend prevails
The New Zealand Dollar trades stronger on the day. The bearish outlook of the NZD/USD pair remains intact on the daily chart as the pair holds below the key 100-day Exponential Moving Average (EMA). Nonetheless, if the price decisively crosses above the key EMA, it would resume the uptrend. Meanwhile, the 14-day Relative Strength Index (RSI) is slightly above the 50 midline, indicating a potential shift towards more bullish sentiment in the short term.
A bullish turn could expose NZD/USD to the 100-period EMA near 0.6050. Any follow-through buying above this level will see a rally to 0.6082, the upper boundary of the Bollinger Band. Further north, the next upside target emerges at 0.6134, a high of July 8.
On the flip side, a low of August 6 at 0.5912 acts as an initial support level for the pair. Extended losses below this level could pave the way to 0.5856, a low of July 29 and the lower limit of the Bollinger Band.
US Dollar price today
The table below shows the percentage change of US Dollar (USD) against listed major currencies today. US Dollar was the weakest against the Australian Dollar.
| USD | EUR | GBP | CAD | AUD | JPY | NZD | CHF | |
| USD | -0.02% | -0.01% | -0.01% | -0.02% | -0.01% | -0.01% | 0.00% | |
| EUR | 0.01% | -0.01% | 0.00% | 0.01% | 0.00% | 0.00% | 0.01% | |
| GBP | 0.01% | 0.00% | 0.02% | -0.03% | 0.00% | -0.01% | 0.02% | |
| CAD | 0.00% | 0.00% | -0.01% | -0.01% | 0.00% | -0.04% | 0.01% | |
| AUD | 0.02% | -0.02% | -0.01% | 0.01% | 0.01% | -0.02% | 0.01% | |
| JPY | -0.07% | -0.02% | -0.02% | -0.02% | 0.00% | -0.02% | 0.03% | |
| NZD | -0.02% | 0.00% | 0.01% | 0.01% | 0.00% | 0.00% | 0.02% | |
| CHF | -0.01% | -0.02% | -0.02% | -0.03% | -0.03% | -0.01% | -0.04% |
The heat map shows percentage changes of major currencies against each other. The base currency is picked from the left column, while the quote currency is picked from the top row. For example, if you pick the Euro from the left column and move along the horizontal line to the Japanese Yen, the percentage change displayed in the box will represent EUR (base)/JPY (quote).
New Zealand Dollar FAQs
The New Zealand Dollar (NZD), also known as the Kiwi, is a well-known traded currency among investors. Its value is broadly determined by the health of the New Zealand economy and the country’s central bank policy. Still, there are some unique particularities that also can make NZD move. The performance of the Chinese economy tends to move the Kiwi because China is New Zealand’s biggest trading partner. Bad news for the Chinese economy likely means less New Zealand exports to the country, hitting the economy and thus its currency. Another factor moving NZD is dairy prices as the dairy industry is New Zealand’s main export. High dairy prices boost export income, contributing positively to the economy and thus to the NZD.
The Reserve Bank of New Zealand (RBNZ) aims to achieve and maintain an inflation rate between 1% and 3% over the medium term, with a focus to keep it near the 2% mid-point. To this end, the bank sets an appropriate level of interest rates. When inflation is too high, the RBNZ will increase interest rates to cool the economy, but the move will also make bond yields higher, increasing investors’ appeal to invest in the country and thus boosting NZD. On the contrary, lower interest rates tend to weaken NZD. The so-called rate differential, or how rates in New Zealand are or are expected to be compared to the ones set by the US Federal Reserve, can also play a key role in moving the NZD/USD pair.
Macroeconomic data releases in New Zealand are key to assess the state of the economy and can impact the New Zealand Dollar’s (NZD) valuation. A strong economy, based on high economic growth, low unemployment and high confidence is good for NZD. High economic growth attracts foreign investment and may encourage the Reserve Bank of New Zealand to increase interest rates, if this economic strength comes together with elevated inflation. Conversely, if economic data is weak, NZD is likely to depreciate.
The New Zealand Dollar (NZD) tends to strengthen during risk-on periods, or when investors perceive that broader market risks are low and are optimistic about growth. This tends to lead to a more favorable outlook for commodities and so-called ‘commodity currencies’ such as the Kiwi. Conversely, NZD tends to weaken at times of market turbulence or economic uncertainty as investors tend to sell higher-risk assets and flee to the more-stable safe havens.
- EUR/USD remains capped below 1.0950 as market look for a reason to move.
- Key US inflation data due in the midweek to set the tone.
- EU GDP growth figures also on the docket this week.
EUR/USD continued to churn chart paper just south of 1.0950 as markets settle in for the wait to Wednesday’s key US Consumer Price Index (CPI) inflation print. US Producer Price Index (PPI) business-level inflation figures are on the docket for Tuesday, and markets are hoping for a continued easing in structural inflation pressures. Core PPI for the year ended in July is forecast to ease to 2.7% from the previous 3.0%.
Forex Today: US Producer Prices… for starters
Wednesday’s YoY core CPI inflation is likewise expected to tick down to 3.2% from the previous 3.3%. Markets have trapped themselves in a Goldilocks forecast scenario; if CPI comes in too high, market sentiment will take a hit. On the other hand, if CPI comes in too low, it could spark another fear-fueled pullback, leaving the only topside option available to equities a soft but not too soft inflation print.
Rate markets have eased back on bets of a double-cut in September, according to the CME’s FedWatch Tool. Rate traders now see less than 50% odds of a 50-bps cut on September 18, down from last week’s 70% odds. Despite the chill in bets for a double-cut, rate markets are still pricing in 100% odds of at least a 25-bps cut from the Fed in September.
Pan-EU Gross Domestic Product (GDP) figures are due early Wednesday, with headline growth figures forecast to hold steady at previous levels, and that will wrap up the Euro’s meaningful representation on the economic calendar this week.
Economic Indicator
Producer Price Index (MoM)
The Producer Price Index released by the Bureau of Labor statistics, Department of Labor measures the average changes in prices in primary markets of the US by producers of commodities in all states of processing. Changes in the PPI are widely followed as an indicator of commodity inflation. Generally speaking, a high reading is seen as positive (or bullish) for the USD, whereas a low reading is seen as negative (or bearish).
Read more.Next release: Tue Aug 13, 2024 12:30
Frequency: Monthly
Consensus: 0.1%
Previous: 0.2%
Source: US Bureau of Labor Statistics
EUR/USD price forecast
Fiber continues to trade on the high side of a rough descending channel that has weighed on EUR/USD for the duration of 2024. The pair is holding just outside of recent technical ceiling barriers, but bullish momentum remains crimped below 1.1000.
A rising pattern of higher lows is solidifying on daily candlesticks, but EUR/USD is still poised for another dip back into the 200-day Exponential Moving Average (EMA) near 1.0800 if bidders don’t return to the fold and get EUR/USD bolstered into fresh near-term highs.
EUR/USD daily chart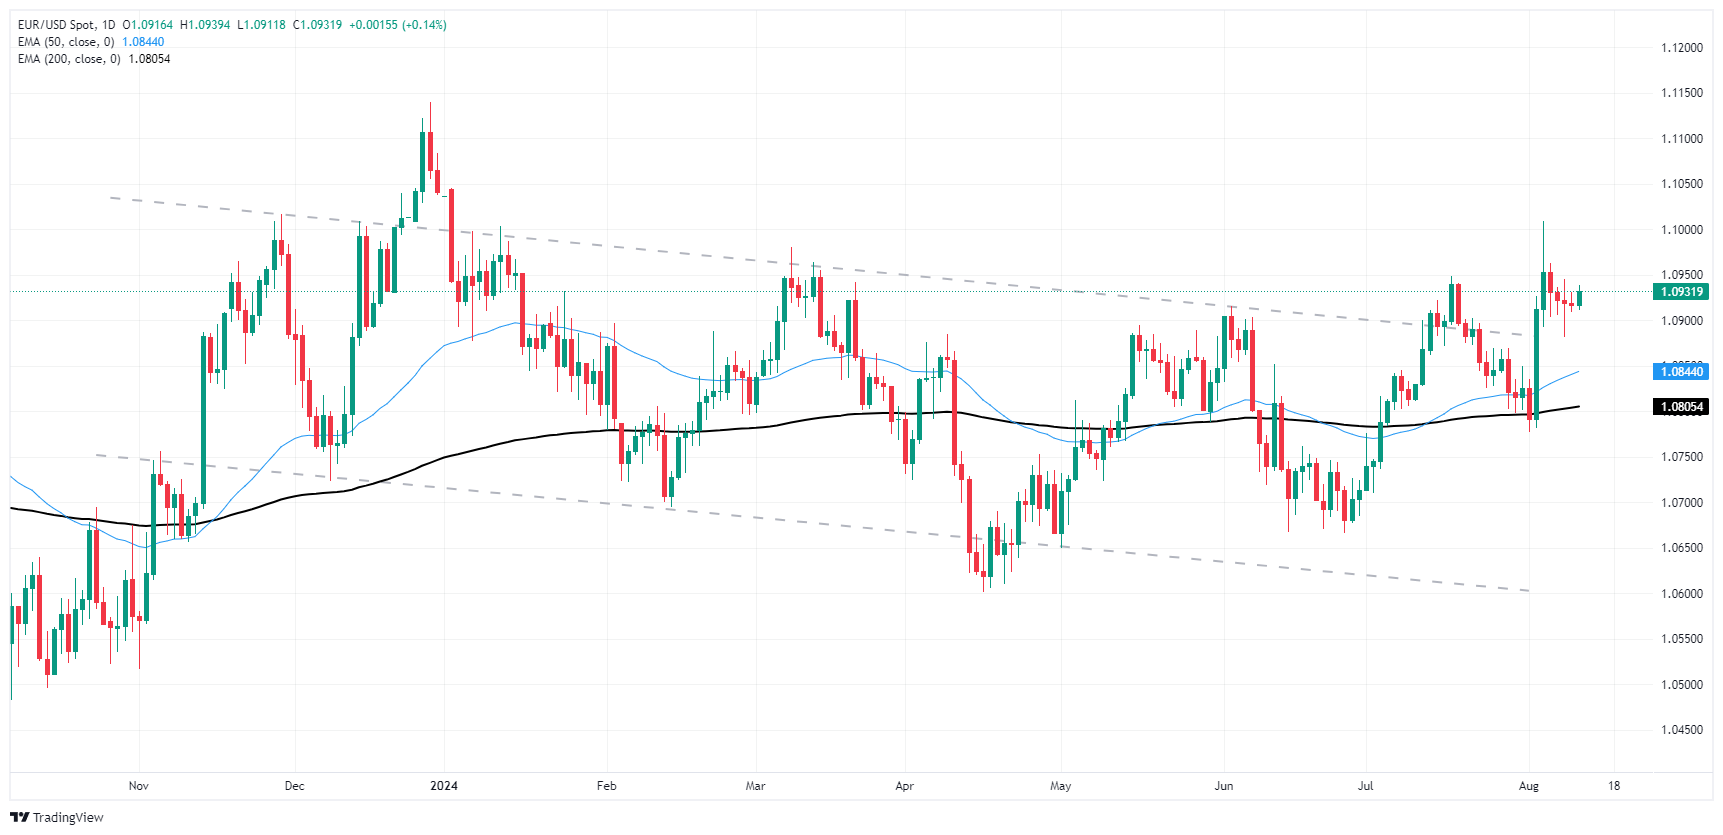
Euro FAQs
The Euro is the currency for the 20 European Union countries that belong to the Eurozone. It is the second most heavily traded currency in the world behind the US Dollar. In 2022, it accounted for 31% of all foreign exchange transactions, with an average daily turnover of over $2.2 trillion a day. EUR/USD is the most heavily traded currency pair in the world, accounting for an estimated 30% off all transactions, followed by EUR/JPY (4%), EUR/GBP (3%) and EUR/AUD (2%).
The European Central Bank (ECB) in Frankfurt, Germany, is the reserve bank for the Eurozone. The ECB sets interest rates and manages monetary policy. The ECB’s primary mandate is to maintain price stability, which means either controlling inflation or stimulating growth. Its primary tool is the raising or lowering of interest rates. Relatively high interest rates – or the expectation of higher rates – will usually benefit the Euro and vice versa. The ECB Governing Council makes monetary policy decisions at meetings held eight times a year. Decisions are made by heads of the Eurozone national banks and six permanent members, including the President of the ECB, Christine Lagarde.
Eurozone inflation data, measured by the Harmonized Index of Consumer Prices (HICP), is an important econometric for the Euro. If inflation rises more than expected, especially if above the ECB’s 2% target, it obliges the ECB to raise interest rates to bring it back under control. Relatively high interest rates compared to its counterparts will usually benefit the Euro, as it makes the region more attractive as a place for global investors to park their money.
Data releases gauge the health of the economy and can impact on the Euro. Indicators such as GDP, Manufacturing and Services PMIs, employment, and consumer sentiment surveys can all influence the direction of the single currency. A strong economy is good for the Euro. Not only does it attract more foreign investment but it may encourage the ECB to put up interest rates, which will directly strengthen the Euro. Otherwise, if economic data is weak, the Euro is likely to fall. Economic data for the four largest economies in the euro area (Germany, France, Italy and Spain) are especially significant, as they account for 75% of the Eurozone’s economy.
Another significant data release for the Euro is the Trade Balance. This indicator measures the difference between what a country earns from its exports and what it spends on imports over a given period. If a country produces highly sought after exports then its currency will gain in value purely from the extra demand created from foreign buyers seeking to purchase these goods. Therefore, a positive net Trade Balance strengthens a currency and vice versa for a negative balance.
- GBP/USD pulled into the middle on Monday as markets quiet back down.
- Near-term volatility spikes have given way to easy waters.
- Key UK and US inflation data lie ahead in the middle of the week.
GBP/USD continued to flatten out on Monday, trading in place and testing key technical levels as markets buckle down for the wait to a midweek inflation data outing. Recent volatility that saw Cable drop back to long-run averages below 1.2700 have eased into the background for now, and investors will be pivoting to face a round of key inflation prints on both sides of the Atlantic due in the midweek.
Forex Today: UK jobs report and US Producer Prices… for starters
US Producer Price Index (PPI) business-level inflation figures are due on Tuesday. The forecast indicates a decrease in core PPI to 2.7% from 3.0%. On Wednesday, YoY core CPI inflation is expected to drop to 3.2% from 3.3%. Market sentiment relies on a balanced inflation outcome for equities to perform well.
On the UK side, an easy Monday gives way to a packed economic release calendar, with UK unemployment claims on Tuesday and UK CPI inflation slated for Wednesday. Core UK CPI inflation is expected to tick down to 3.4% YoY from 3.5%, while headline CPI inflation is forecast to rise to 2.3% YoY from 2.0%.
Economic Indicator
Claimant Count Change
The Claimant Count Change released by the UK Office for National Statistics presents the change in the number of unemployed people in the UK claiming benefits. There is a tendency for the metric to influence GBP volatility. Usually, a rise in the indicator has negative implications for consumer spending and economic growth. Generally, a high reading is seen as bearish for the Pound Sterling (GBP), while a low reading is seen as bullish.
Read more.Next release: Tue Aug 13, 2024 06:00
Frequency: Monthly
Consensus: 14.5K
Previous: 32.3K
Source: Office for National Statistics
The change in the number of those claiming jobless benefits is an early gauge of the UK’s labor market. The figures are released for the previous month, contrary to the Unemployment Rate, which is for the prior one. This release is scheduled around the middle of the month. An increase in applications is a sign of a worsening economic situation and implies looser monetary policy, while a decrease indicates improving conditions. A higher-than-expected outcome tends to be GBP-bearish.
GBP/USD price forecast
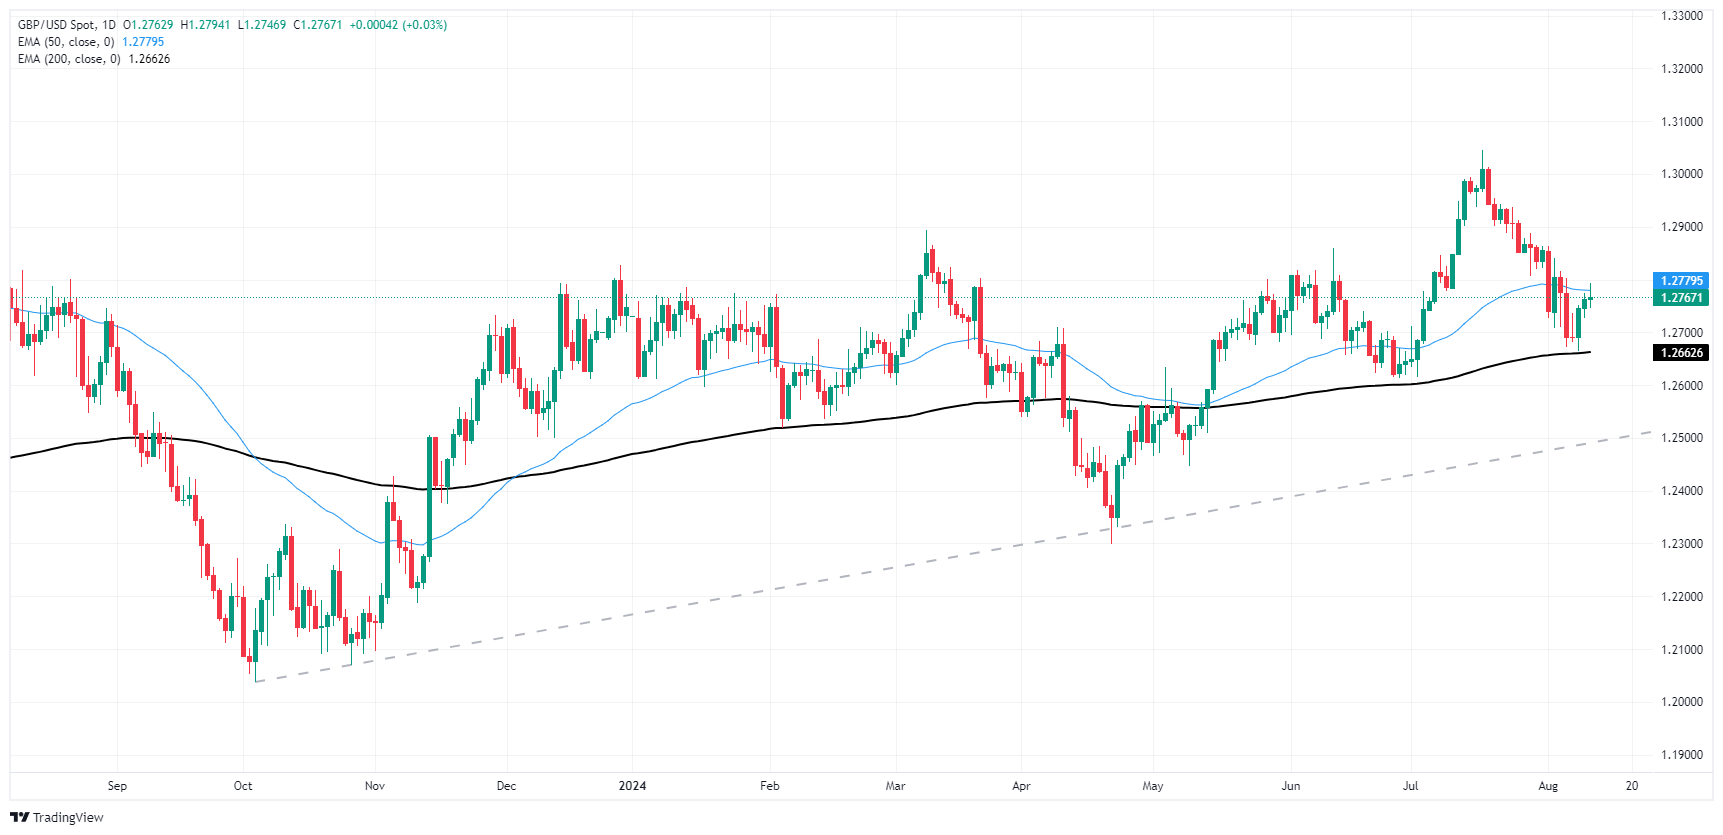
Cable continues to tease a bearish fall back into the 200-day Exponential Moving Average (EMA) at 1.2649, but bidders have thus far stepped up to keep bids from falling any closer toward the 1.2600 handle. However, bullish momentum has evaporated as GBP/USD remains down over 2% from 12-month peaks just above 1.3000 set in July.
GBP/USD daily chart
Pound Sterling FAQs
The Pound Sterling (GBP) is the oldest currency in the world (886 AD) and the official currency of the United Kingdom. It is the fourth most traded unit for foreign exchange (FX) in the world, accounting for 12% of all transactions, averaging $630 billion a day, according to 2022 data. Its key trading pairs are GBP/USD, aka ‘Cable’, which accounts for 11% of FX, GBP/JPY, or the ‘Dragon’ as it is known by traders (3%), and EUR/GBP (2%). The Pound Sterling is issued by the Bank of England (BoE).
The single most important factor influencing the value of the Pound Sterling is monetary policy decided by the Bank of England. The BoE bases its decisions on whether it has achieved its primary goal of “price stability” – a steady inflation rate of around 2%. Its primary tool for achieving this is the adjustment of interest rates. When inflation is too high, the BoE will try to rein it in by raising interest rates, making it more expensive for people and businesses to access credit. This is generally positive for GBP, as higher interest rates make the UK a more attractive place for global investors to park their money. When inflation falls too low it is a sign economic growth is slowing. In this scenario, the BoE will consider lowering interest rates to cheapen credit so businesses will borrow more to invest in growth-generating projects.
Data releases gauge the health of the economy and can impact the value of the Pound Sterling. Indicators such as GDP, Manufacturing and Services PMIs, and employment can all influence the direction of the GBP. A strong economy is good for Sterling. Not only does it attract more foreign investment but it may encourage the BoE to put up interest rates, which will directly strengthen GBP. Otherwise, if economic data is weak, the Pound Sterling is likely to fall.
Another significant data release for the Pound Sterling is the Trade Balance. This indicator measures the difference between what a country earns from its exports and what it spends on imports over a given period. If a country produces highly sought-after exports, its currency will benefit purely from the extra demand created from foreign buyers seeking to purchase these goods. Therefore, a positive net Trade Balance strengthens a currency and vice versa for a negative balance.
- The daily MACD and RSI suggest a flat momentum with bulls taking a breather following a recent recovery.
- A robust resistance persists at 162.00 and bulls keep on getting rejected.
The EUR/JPY pair experienced minor gains on Monday, with the bulls unable to surpass the 162.00 area. In case they fail to conquer this threshold, the downside may resume.
The daily Relative Strength Index (RSI) has outlined a slight increase but remains deep below 50, suggesting a steady selling pressure pressure. The MACD bars remain flat and red, signaling subdued bearish momentum.
EUR/JPY Daily Chart
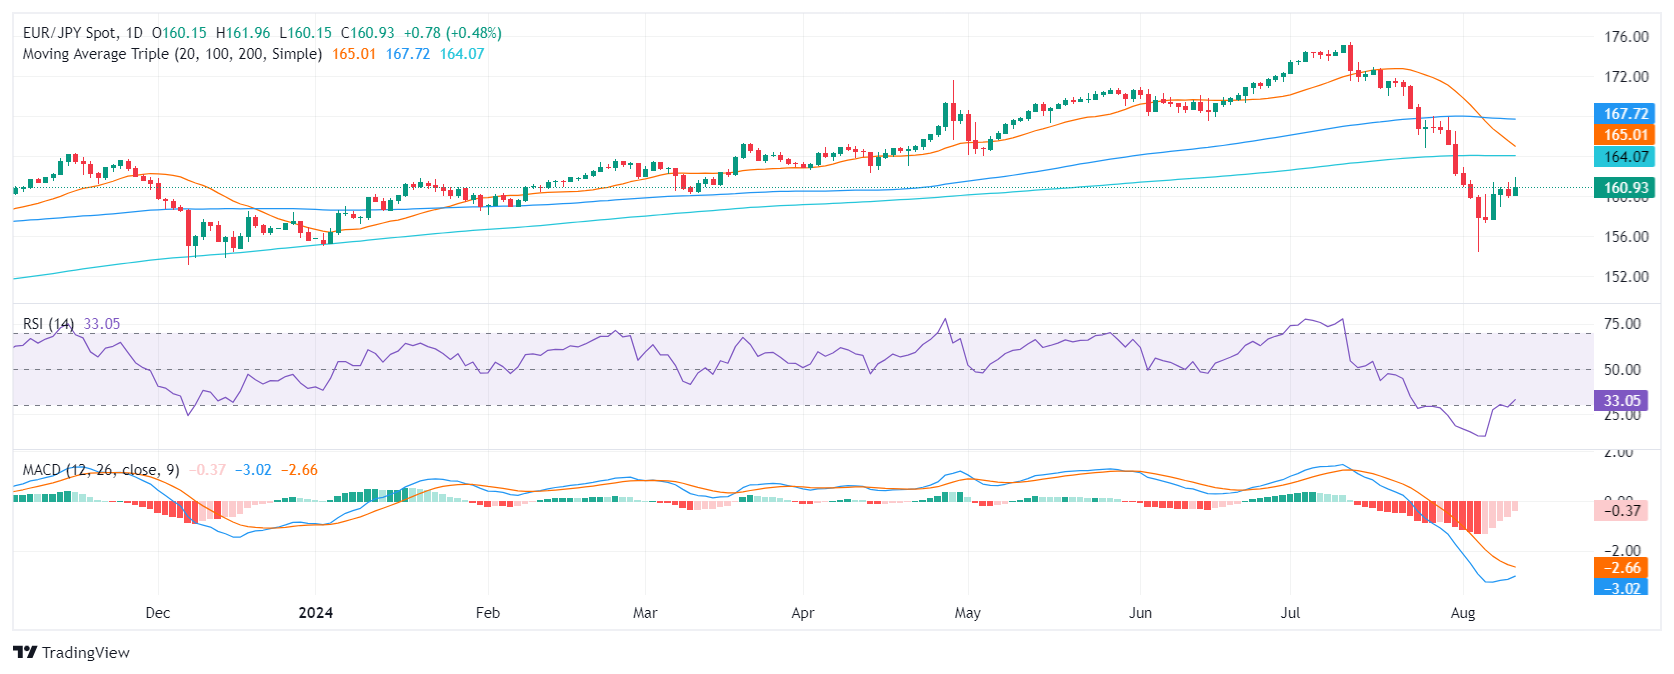 The overarching selling forces are still active. This is backed by the pair still below the 20,100 and 200-day Simple Moving Averages (SMAs). All eyes remain on the developments around the 162.00 resistance which might trigger either a recovery to 164.00 (200-day SMA) or a deeper correction to 161.00-160.00. In that sense, as bulls continue facing resistance at the 161.50-162.00 area, and with momentum weak, the last hope is a fundamental catalyst to breach it.
- AUD/JPY forms a 'shooting star' pattern, signaling potential for further downside if 96.15 is breached.
- Key support levels include 96.00 and 95.00, with deeper losses targeting the Tenkan-Sen at 94.43.
- If buyers reclaim 97.85, resistance lies at 98.00, with further gains challenging 98.74.
The AUD/JPY advances during the day yet retreats after hitting a daily high of 97.85 and sitting below 97.00. At the time of writing, the cross-pair trades at 96.97 and posts gains of 0.68%.
AUD/JPY Price Forecast: Technical outlook
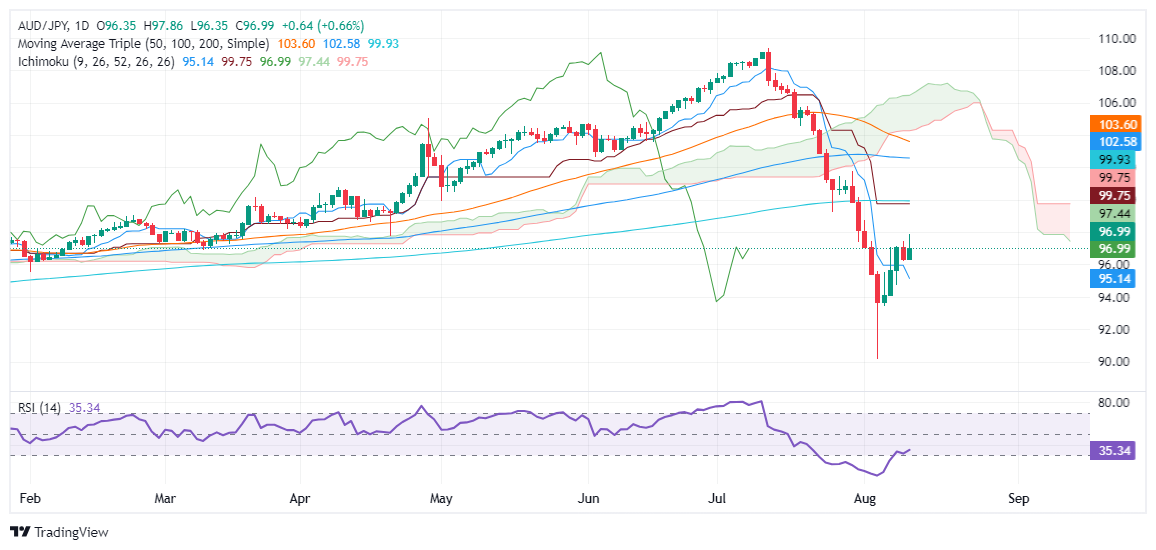
The AUD/JPY downtrend remains in play despite the ongoing leg-up that saw the Aussie strengthen above the 97.00 figure. Momentum favors sellers, though in the short term, the Relative Strength Index (RSI) is aiming below its neutral line, indicating buyers are stepping in.
Nevertheless, the August 12 price action formed a ‘shooting star’, usually a bearish candle followed by a daily close below the low of 96.15, which could pave the way for further losses.
In that outcome, the AUD/JPY first support would be the 96.00 psychological mark, ahead of the 95.00 figure. Further losses lie beneath the Tenkan Sen at 94.43.
Conversely, if AUD/JPY climbs past 97.85, buyers could challenge the 98.00 mark. Further gains are seen above the confluence of the Kijun-Sen and Senkou Span B at 98.74.
AUD/JPY Price Action – Daily Chart
Australian Dollar FAQs
One of the most significant factors for the Australian Dollar (AUD) is the level of interest rates set by the Reserve Bank of Australia (RBA). Because Australia is a resource-rich country another key driver is the price of its biggest export, Iron Ore. The health of the Chinese economy, its largest trading partner, is a factor, as well as inflation in Australia, its growth rate and Trade Balance. Market sentiment – whether investors are taking on more risky assets (risk-on) or seeking safe-havens (risk-off) – is also a factor, with risk-on positive for AUD.
The Reserve Bank of Australia (RBA) influences the Australian Dollar (AUD) by setting the level of interest rates that Australian banks can lend to each other. This influences the level of interest rates in the economy as a whole. The main goal of the RBA is to maintain a stable inflation rate of 2-3% by adjusting interest rates up or down. Relatively high interest rates compared to other major central banks support the AUD, and the opposite for relatively low. The RBA can also use quantitative easing and tightening to influence credit conditions, with the former AUD-negative and the latter AUD-positive.
China is Australia’s largest trading partner so the health of the Chinese economy is a major influence on the value of the Australian Dollar (AUD). When the Chinese economy is doing well it purchases more raw materials, goods and services from Australia, lifting demand for the AUD, and pushing up its value. The opposite is the case when the Chinese economy is not growing as fast as expected. Positive or negative surprises in Chinese growth data, therefore, often have a direct impact on the Australian Dollar and its pairs.
Iron Ore is Australia’s largest export, accounting for $118 billion a year according to data from 2021, with China as its primary destination. The price of Iron Ore, therefore, can be a driver of the Australian Dollar. Generally, if the price of Iron Ore rises, AUD also goes up, as aggregate demand for the currency increases. The opposite is the case if the price of Iron Ore falls. Higher Iron Ore prices also tend to result in a greater likelihood of a positive Trade Balance for Australia, which is also positive of the AUD.
The Trade Balance, which is the difference between what a country earns from its exports versus what it pays for its imports, is another factor that can influence the value of the Australian Dollar. If Australia produces highly sought after exports, then its currency will gain in value purely from the surplus demand created from foreign buyers seeking to purchase its exports versus what it spends to purchase imports. Therefore, a positive net Trade Balance strengthens the AUD, with the opposite effect if the Trade Balance is negative.
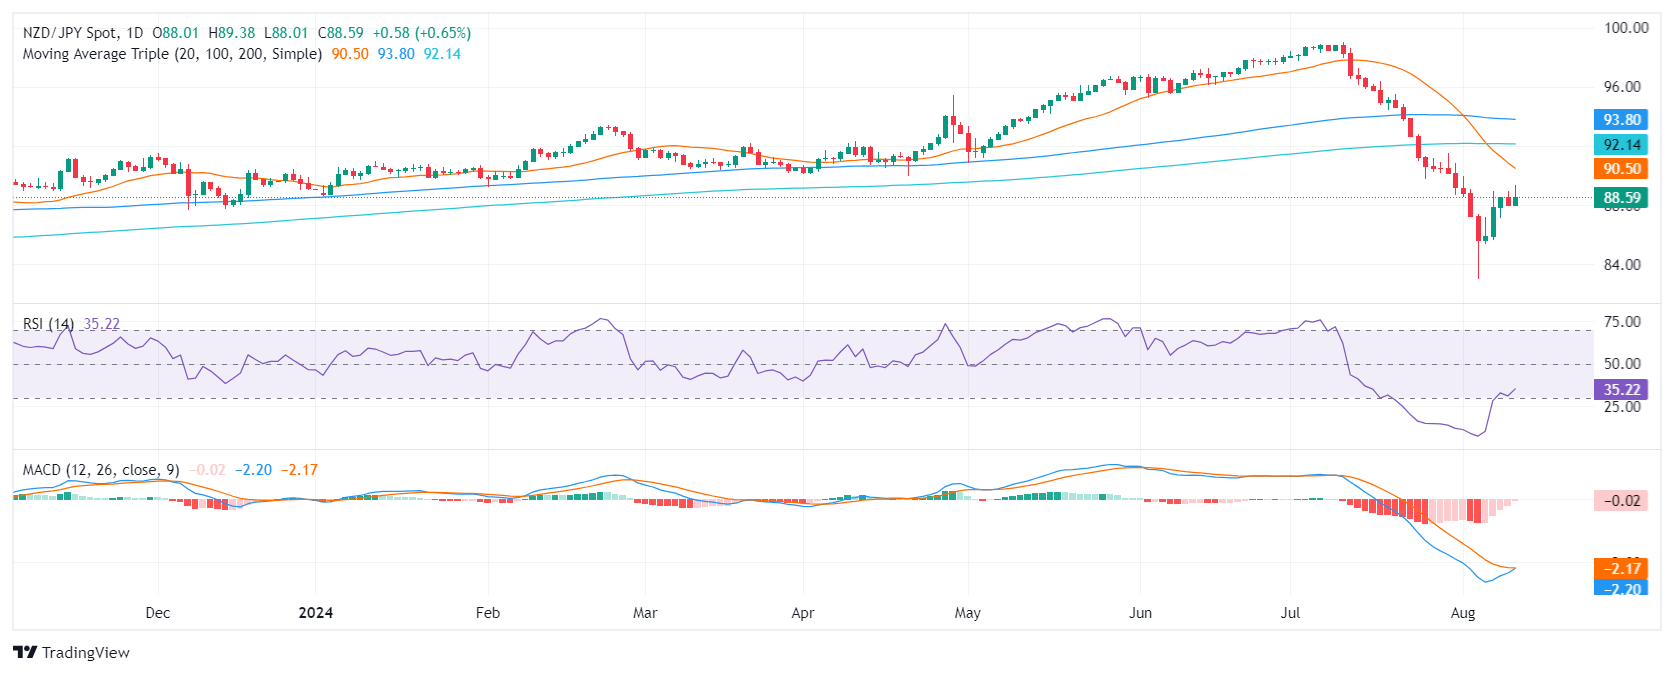
- NZD/JPY cleared gains on Monday, indicating that the buying traction remains weak and stabilized at 88.60.
- The RSI remains below 30, and the MACD still shows red bars, signaling that sellers remain steady.
- If the bulls fail to conquer the 89.00 area, the downside movements might return.
The NZD/JPY tallied gains on Monday but the momentum seems to be flattening. The selling pressure remains strong, and further downside is possible in the near term if bulls fail to pass through the 89.00 threshold.
From a technical perspective, the Relative Strength Index (RSI) remains near 30, indicating strong bearish momentum. The Moving Average Convergence Divergence (MACD) indicator shows decreasing red bars, suggesting that bullish momentum despite diminishing is still around the corner.
On the positive side, trading volume remains subdued, which could indicate that the selling pressure is easing. The pair's immediate support is at 88.00 and a break below could see the pair test the 87.80-88.50 area, while a break above 89.00 could retest the 90.50 zone (20-day SMA).
NZD/JPY daily chart
- NZD/USD rises above 0.6000, with bullish momentum increasing.
- RSI rises above 50, and MACD shows increasing bullish momentum.
- 0.6040 (200-day SMA) resistance in focus, a break above could extend gains.
In Monday's session, the NZD/USD pair rose by 0.30% to 0.6015, continuing the bullish trend seen in recent sessions. The technical indicators suggest that the bulls have gained the upper hand and a further rise towards 0.6040 where the 200-day Simple Moving Average (SMA) converges is likely.
The Relative Strength Index (RSI) has risen above 50, indicating a shift towards bullish territory. The Moving Average Convergence Divergence (MACD) is also showing increasing bullish momentum, with rising green bars signaling increasing upside potential. This combination of technical indicators suggests that the buying pressure is increasing and that the bulls are in control.
NZD/USD daily chart
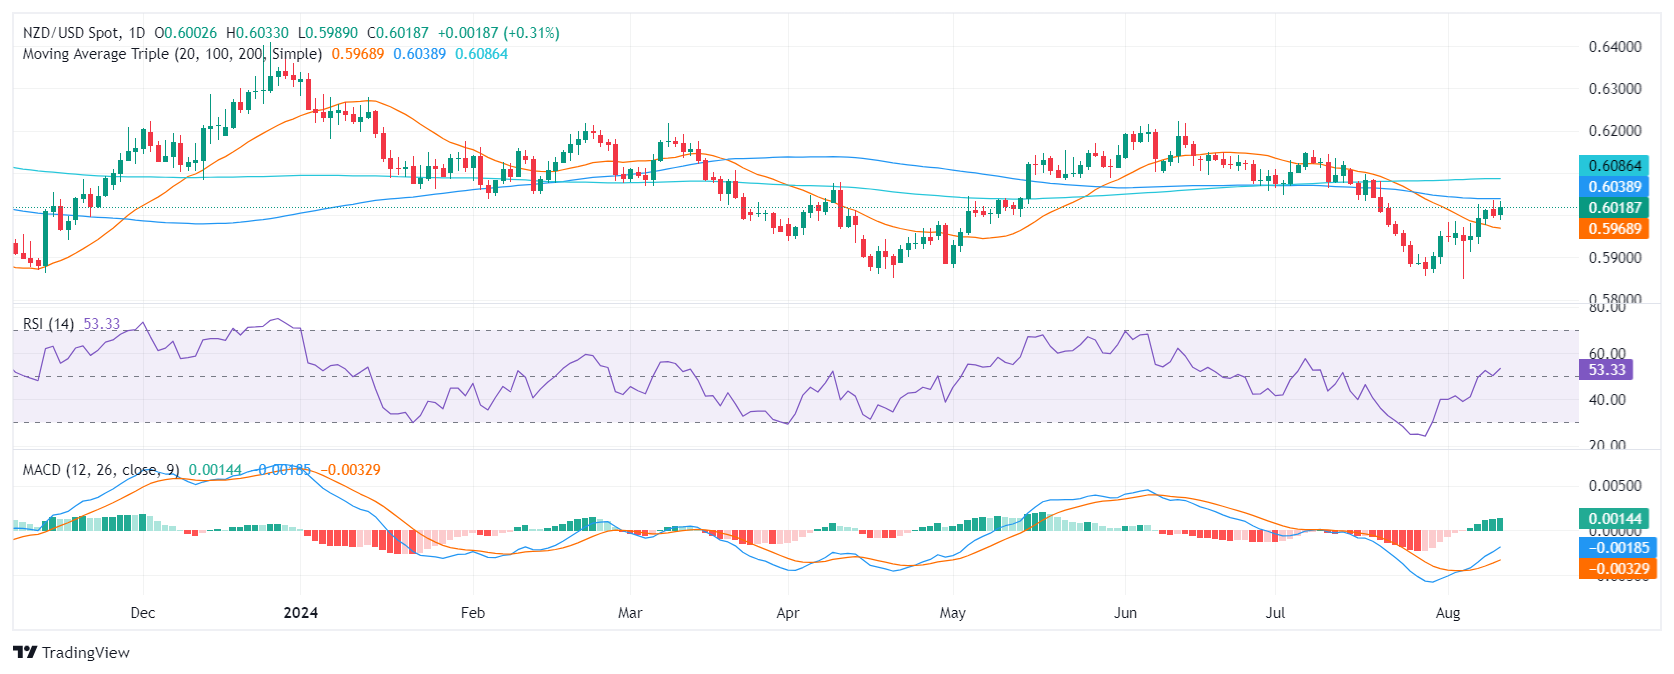
On the daily chart, the NZD/USD pair is facing immediate resistance at 0.6040. A break above this level and a consolidation above the 200-day Simple Moving Average (SMA) could open the door for a deeper rally toward 0.6100 and 0.6150. On the downside, support lies at 0.5970 (20-day SMA) and 0.5900. A break below 0.5900 could trigger a deeper pullback.
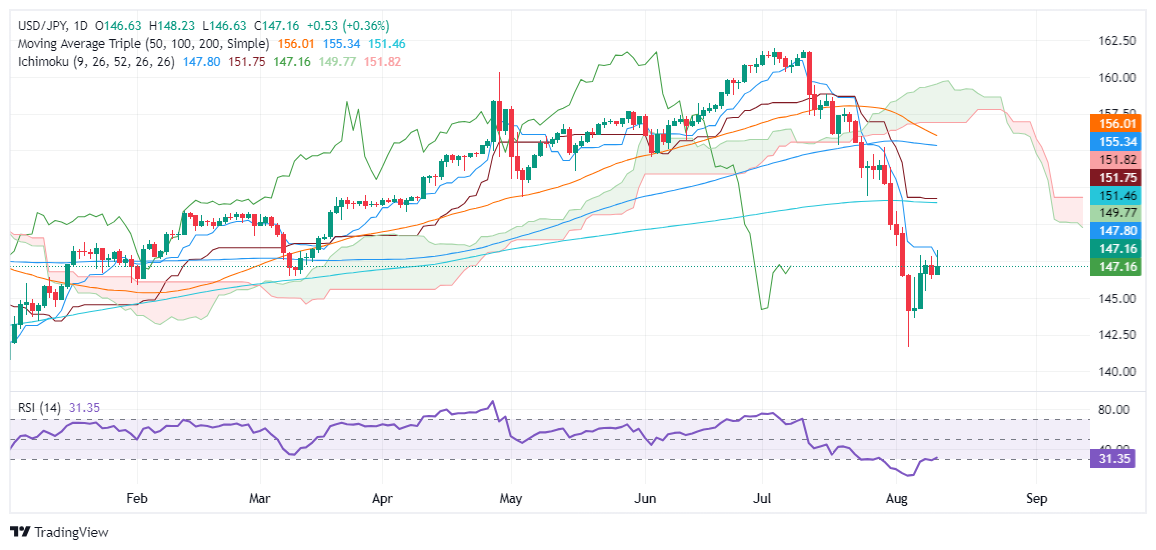
- USD/JPY briefly clears 148.00 before reversing, with RSI suggesting seller dominance.
- A drop below 146.27 could trigger further losses, targeting 145.44 and 144.28.
- If USD/JPY reclaims 147.79, resistance levels are at 148.00 and potentially 149.77, with the 200-DMA at 151.46 as a longer-term target.
The Japanese Yen fails to gain traction late in the North American session versus the Greenback as the USD/JPY rises from last Friday's daily low of 146.62 and trades at 147.28, up by 0.47%.
USD/JPY Price Forecast: Technical outlook
The USD/JPY is downward biased despite the uptick that saw the pair clear the 148.00 figure and hit a six-day high at 148.22 before reversing its course and tumbling below the Tenkan-Sen at 147.79.
The Relative Strength Index (RSI) remains bearish, hinting that momentum favors sellers.
The USD/JPY could extend its losses if the pair slumps past the August 9 low of 146.27. Once cleared, the next demand zone would be the August 8 low of 145.44, followed by the August 7 bottom at 144.28. Up next would be the last cycle low at 141.69.
Conversely, if USD/JPY clears the Tenkan-Sen at 147.79, this will clear the path to August’s 12 peaks of 148.00. On further strength, the pair could rally toward the Sekou Span A at 149.77 before testing the 200-day moving average (DMA) at 151.46.
USD/JPY Price Action – Daily Chart
Japanese Yen FAQs
The Japanese Yen (JPY) is one of the world’s most traded currencies. Its value is broadly determined by the performance of the Japanese economy, but more specifically by the Bank of Japan’s policy, the differential between Japanese and US bond yields, or risk sentiment among traders, among other factors.
One of the Bank of Japan’s mandates is currency control, so its moves are key for the Yen. The BoJ has directly intervened in currency markets sometimes, generally to lower the value of the Yen, although it refrains from doing it often due to political concerns of its main trading partners. The current BoJ ultra-loose monetary policy, based on massive stimulus to the economy, has caused the Yen to depreciate against its main currency peers. This process has exacerbated more recently due to an increasing policy divergence between the Bank of Japan and other main central banks, which have opted to increase interest rates sharply to fight decades-high levels of inflation.
The BoJ’s stance of sticking to ultra-loose monetary policy has led to a widening policy divergence with other central banks, particularly with the US Federal Reserve. This supports a widening of the differential between the 10-year US and Japanese bonds, which favors the US Dollar against the Japanese Yen.
The Japanese Yen is often seen as a safe-haven investment. This means that in times of market stress, investors are more likely to put their money in the Japanese currency due to its supposed reliability and stability. Turbulent times are likely to strengthen the Yen’s value against other currencies seen as more risky to invest in.
- AUD/USD registered a boost, settling near 0.6600.
- RBA maintains its hawkish position, undergirding a strengthened AUD.
- Investors to eye upcoming mid-tier Australian economic figures during the Asian session.
The AUD/USD pair experienced an increase of 0.40% during Monday's session, settling near 0.6600. Undoubtedly, the Reserve Bank of Australia's (RBA) unwavering hawkish stance and stronger Chinese inflation figures reported last week provide a supportive platform for the Aussie, although escalating geopolitical tensions in the Middle East might limit its upside.
Considering the mixed Australian economic outlook and high inflation, the RBA has all the reasons to remain hawkish, which might continue benefiting the Aussie.
Daily digest market movers: Aussie up after RBA’s hawkish directions last week, eyes on data later in Asian session
- The Reserve Bank of Australia held its rates steady at 4.35% for a sixth consecutive session last week, noting that "the board is not dismissing any possibilities."
- The Bank underlined the significance of remaining vigilant toward potential inflation threats, implying a reluctance for hasty policy changes.
- Meanwhile, Westpac analysts have shifted their forecast for the first rate cut from November 2024 to February 2025. Hence, the RBA's hawkish posture is likely to bolster the AUD in the near term.
- Investors anticipate further clues from Chinese Retail Sales and Industrial Production figures coming Thursday. Additionally, Australian Wage data from Q2 and Westpac Confidence figures from July, to be released during the upcoming Asian session, will hold the market's attention.
AUD/USD technical outlook: Pair encounters significant resistance around 0.6600
The price action of AUD/USD over the past week reflects that the bulls are facing considerable resistance around the 0.6600 level. The Relative Strength Index (RSI) continues to hover around the neutral zone, while the Moving Average Convergence Divergence (MACD) points to a steady bullish traction. This points out that the recent bullish recovery is waiting for a fundamental catalyst to pierce through the 0.6600 level.
Australian Dollar FAQs
One of the most significant factors for the Australian Dollar (AUD) is the level of interest rates set by the Reserve Bank of Australia (RBA). Because Australia is a resource-rich country another key driver is the price of its biggest export, Iron Ore. The health of the Chinese economy, its largest trading partner, is a factor, as well as inflation in Australia, its growth rate and Trade Balance. Market sentiment – whether investors are taking on more risky assets (risk-on) or seeking safe-havens (risk-off) – is also a factor, with risk-on positive for AUD.
The Reserve Bank of Australia (RBA) influences the Australian Dollar (AUD) by setting the level of interest rates that Australian banks can lend to each other. This influences the level of interest rates in the economy as a whole. The main goal of the RBA is to maintain a stable inflation rate of 2-3% by adjusting interest rates up or down. Relatively high interest rates compared to other major central banks support the AUD, and the opposite for relatively low. The RBA can also use quantitative easing and tightening to influence credit conditions, with the former AUD-negative and the latter AUD-positive.
China is Australia’s largest trading partner so the health of the Chinese economy is a major influence on the value of the Australian Dollar (AUD). When the Chinese economy is doing well it purchases more raw materials, goods and services from Australia, lifting demand for the AUD, and pushing up its value. The opposite is the case when the Chinese economy is not growing as fast as expected. Positive or negative surprises in Chinese growth data, therefore, often have a direct impact on the Australian Dollar and its pairs.
Iron Ore is Australia’s largest export, accounting for $118 billion a year according to data from 2021, with China as its primary destination. The price of Iron Ore, therefore, can be a driver of the Australian Dollar. Generally, if the price of Iron Ore rises, AUD also goes up, as aggregate demand for the currency increases. The opposite is the case if the price of Iron Ore falls. Higher Iron Ore prices also tend to result in a greater likelihood of a positive Trade Balance for Australia, which is also positive of the AUD.
The Trade Balance, which is the difference between what a country earns from its exports versus what it pays for its imports, is another factor that can influence the value of the Australian Dollar. If Australia produces highly sought after exports, then its currency will gain in value purely from the surplus demand created from foreign buyers seeking to purchase its exports versus what it spends to purchase imports. Therefore, a positive net Trade Balance strengthens the AUD, with the opposite effect if the Trade Balance is negative.
- The Canadian Dollar was soft-footed to kick off Monday trading.
- Canada is drastically underrepresented on the economic calendar this week.
- US inflation data updates are the key to the week’s market sentiment.
The Canadian Dollar (CAD) struggled to find direction on Monday, easing against most of its major currency peers and middling against the Greenback on the charts. The CAD is holding steady at the top end of a swing high against the USD, but markets are huddling in the midrange as investors await the latest batch of US inflation figures due in the midweek.
Canada has a strictly low-tier showing on the economic calendar this week, leaving the Canadian Dollar at the mercy of overall market sentiment. Investors are still grappling with how the Federal Reserve’s (Fed) upcoming rate call in September will shake out, but rate markets are firmly gripping onto expectations of at least a quarter-point trim on September 18.
Daily digest market movers: Looming CPI prints leave markets hung in the midrange
- Canadian Building Permits declined again in June, printing at -13.9% MoM and adding to the previous month’s revised -12.7% contraction. Market impact is overall limited from low-tier housing data two months behind the curve, and CAD flows remain crimped.
- Fed one-year inflation expectations ticked lower on Monday, falling to 2.97% versus the previous 3.02%.
- Rate markets have eased back on bets of a double-cut in September, according to the CME’s FedWatch Tool. Rate traders now see less than 50% odds of a 50-bps cut on September 18, down from last week’s 70% odds.
- Despite the chill in bets for a double-cut, rate markets are still pricing in 100% odds of at least a 25-bps cut from the Fed in September.
- Key US inflation data in the midweek could throw a spanner in the works if price pressures bubble over again.
- US Producer Price Index (PPI) inflation due on Tuesday, US Consumer Price Index (CPI) inflation slated for Wednesday. Both metrics are expected to tick lower.
Canadian Dollar price forecast: Steady gains lead to middling ranges
The Canadian Dollar (CAD) put in a subpar performance on Monday, ticking lower against most of its major currency peers but finding thin gains against the Japanese Yen and the Swiss Franc. The CAD backslid over a quarter of a percent against the rebounding Antipodeans, and struggled to find direction against the Greenback and the European bloc, trading down within one-fifth of one percent against the Euro and the Pound Sterling.
USD/CAD price action has ground to a halt as bids grapple with the 50-day Exponential Moving Average (EMA) at 1.3730. Last week’s early Greenback rally failed to capture the 1.3950 level, giving the Canadian Dollar a chance to reclaim recently lost ground.
Technical pressures are keeping bids bolstered above the 200-day EMA at 1.3625, but bullish CAD momentum could evaporate at any time, driving USD/CAD back into the high end.
USD/CAD daily chart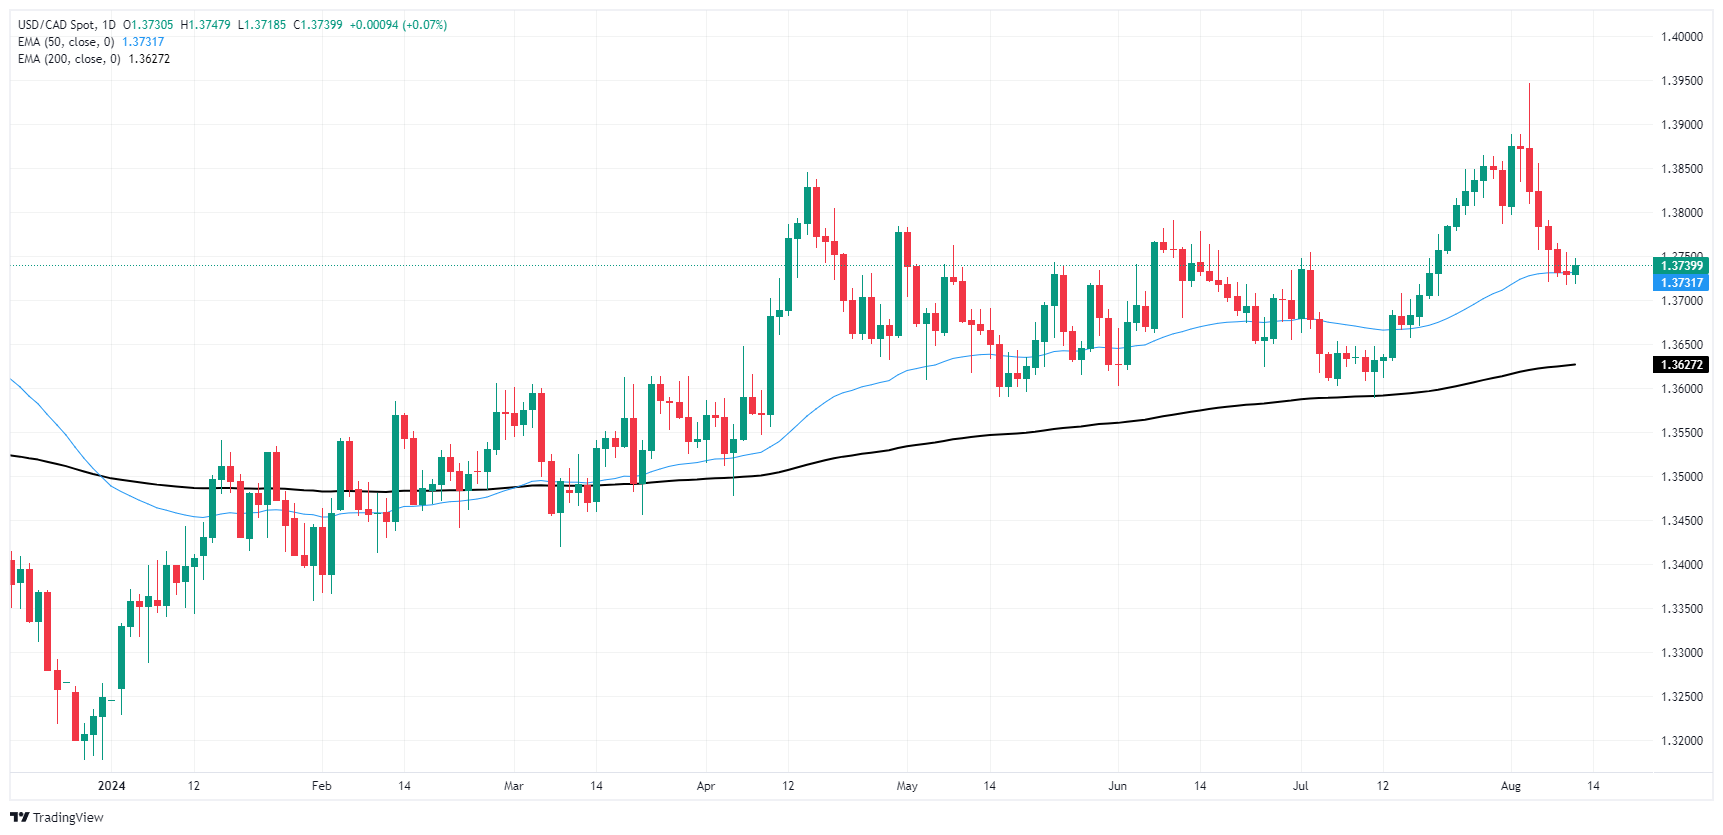
Canadian Dollar FAQs
The key factors driving the Canadian Dollar (CAD) are the level of interest rates set by the Bank of Canada (BoC), the price of Oil, Canada’s largest export, the health of its economy, inflation and the Trade Balance, which is the difference between the value of Canada’s exports versus its imports. Other factors include market sentiment – whether investors are taking on more risky assets (risk-on) or seeking safe-havens (risk-off) – with risk-on being CAD-positive. As its largest trading partner, the health of the US economy is also a key factor influencing the Canadian Dollar.
The Bank of Canada (BoC) has a significant influence on the Canadian Dollar by setting the level of interest rates that banks can lend to one another. This influences the level of interest rates for everyone. The main goal of the BoC is to maintain inflation at 1-3% by adjusting interest rates up or down. Relatively higher interest rates tend to be positive for the CAD. The Bank of Canada can also use quantitative easing and tightening to influence credit conditions, with the former CAD-negative and the latter CAD-positive.
The price of Oil is a key factor impacting the value of the Canadian Dollar. Petroleum is Canada’s biggest export, so Oil price tends to have an immediate impact on the CAD value. Generally, if Oil price rises CAD also goes up, as aggregate demand for the currency increases. The opposite is the case if the price of Oil falls. Higher Oil prices also tend to result in a greater likelihood of a positive Trade Balance, which is also supportive of the CAD.
While inflation had always traditionally been thought of as a negative factor for a currency since it lowers the value of money, the opposite has actually been the case in modern times with the relaxation of cross-border capital controls. Higher inflation tends to lead central banks to put up interest rates which attracts more capital inflows from global investors seeking a lucrative place to keep their money. This increases demand for the local currency, which in Canada’s case is the Canadian Dollar.
Macroeconomic data releases gauge the health of the economy and can have an impact on the Canadian Dollar. Indicators such as GDP, Manufacturing and Services PMIs, employment, and consumer sentiment surveys can all influence the direction of the CAD. A strong economy is good for the Canadian Dollar. Not only does it attract more foreign investment but it may encourage the Bank of Canada to put up interest rates, leading to a stronger currency. If economic data is weak, however, the CAD is likely to fall.
- Gold surges 1% as US Treasury yields retreat ahead of key CPI data, with the 10-year yield down to 3.902%.
- Ongoing tensions in the Middle East, with no ceasefire in sight, drive demand for Gold’s safe-haven status.
- Traders await critical US inflation and Retail Sales reports with Fed commentary signaling cautious optimism on disinflation.
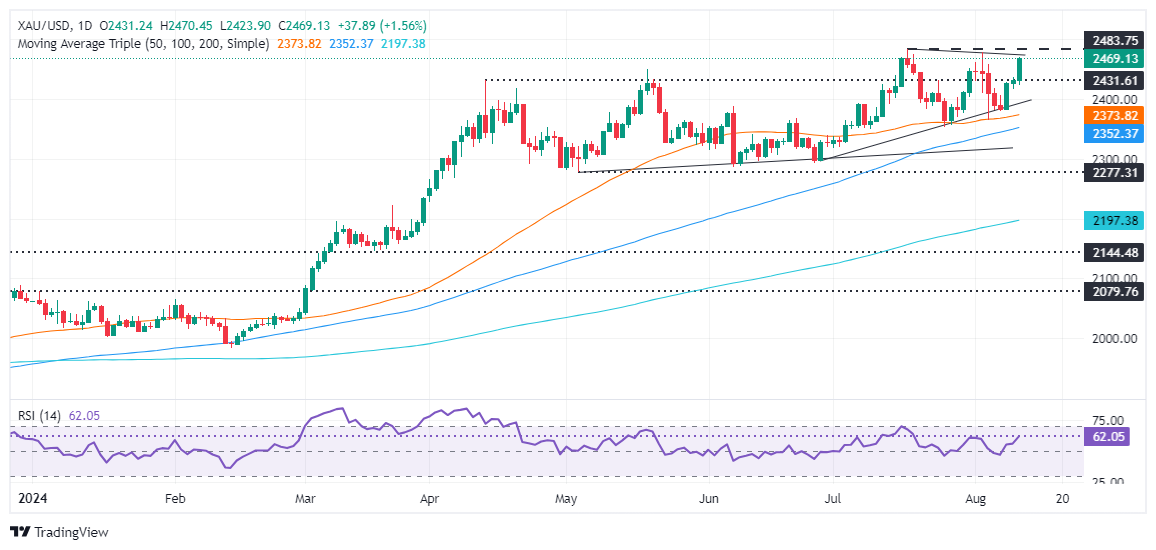
Gold price rallied over 1% on Monday during the mid-North American session as US Treasury bond yields retreated ahead of a busy economic calendar in the United States. Traders are bracing for the latest Consumer Price Index (CPI) report for July, which is expected to show an improvement in the disinflation process. The XAU/USD trades at $2,467 after bouncing off a daily low of $2,423.
Sentiment shifted sour amid ongoing developments in the Middle East. Israel, Lebanon and Iran's lack of efforts to reach a ceasefire agreement kept market participants uneasy. This triggered a flight to Gold’s safe-haven status due to a possible escalation of the conflict.
US Treasury bond yields edged lower with the 10-year benchmark note rate down four basis points (bps) to 3.902%, ahead of the release of inflation data.
In the meantime, Federal Reserve Governor Michele Bowman was neutral, contrary to her usual hawkish posture and said that some progress on inflation is welcome, according to data from the last two months.
During the week, the economic docket will feature the release of US inflation figures on Tuesday and Wednesday, followed by Retail Sales data on Thursday and Friday’s University of Michigan (UoM) Consumer Sentiment.
Daily digest market movers: Gold price soars ahead of US data release
- July’s Producer Price Index is expected to drop from 0.2% to 0.1% MoM.
- The Consumer Price Index (CPI) is estimated to drop from 3% YoY to 2.9%; core CPI is expected to continue its downtrend from 3.3% to 3.2% YoY.
- Economists expect a jump in US Retail Sales from 0% to 0.3% MoM.
- The golden metal price gathered traction despite reports that China’s central bank restrained itself from purchasing Gold for the third consecutive month.
- The CME FedWatch Tool shows the odds of a 50-basis-point interest rate cut by the Fed at the September meeting at 47.5%, down from 52.5% last Friday.
Technical analysis: Gold price advances past $2,450
Gold’s uptrend extended on Monday, with prices approaching the $2,470 figure ahead of the all-time high (ATH) of $2,483, which could be tested if inflation comes lower than foreseen. Momentum favors buyers, as reflected by the Relative Strength Index (RSI), which is above the neutral line aiming higher.
The buyer's first resistance would be the ATH. Once cleared, the next challenge would be to clear the psychological figure of $2,500. Further gains are seen above that level, with $2,550 being next, followed by $2,600.
Conversely, if XAU/USD drops below $2,450, the next support would be $2,400, followed by the 50-day Simple Moving Average (SMA) at $2,373. Once surpassed, the decline could intensify, leading to the 100-day SMA at $2,352, followed by a support trendline around $2,320.
Gold FAQs
Gold has played a key role in human’s history as it has been widely used as a store of value and medium of exchange. Currently, apart from its shine and usage for jewelry, the precious metal is widely seen as a safe-haven asset, meaning that it is considered a good investment during turbulent times. Gold is also widely seen as a hedge against inflation and against depreciating currencies as it doesn’t rely on any specific issuer or government.
Central banks are the biggest Gold holders. In their aim to support their currencies in turbulent times, central banks tend to diversify their reserves and buy Gold to improve the perceived strength of the economy and the currency. High Gold reserves can be a source of trust for a country’s solvency. Central banks added 1,136 tonnes of Gold worth around $70 billion to their reserves in 2022, according to data from the World Gold Council. This is the highest yearly purchase since records began. Central banks from emerging economies such as China, India and Turkey are quickly increasing their Gold reserves.
Gold has an inverse correlation with the US Dollar and US Treasuries, which are both major reserve and safe-haven assets. When the Dollar depreciates, Gold tends to rise, enabling investors and central banks to diversify their assets in turbulent times. Gold is also inversely correlated with risk assets. A rally in the stock market tends to weaken Gold price, while sell-offs in riskier markets tend to favor the precious metal.
The price can move due to a wide range of factors. Geopolitical instability or fears of a deep recession can quickly make Gold price escalate due to its safe-haven status. As a yield-less asset, Gold tends to rise with lower interest rates, while higher cost of money usually weighs down on the yellow metal. Still, most moves depend on how the US Dollar (USD) behaves as the asset is priced in dollars (XAU/USD). A strong Dollar tends to keep the price of Gold controlled, whereas a weaker Dollar is likely to push Gold prices up.
Global markets navigated within a consolidative theme as investors warmed up ahead of key US data releases, which will surely have an impact on bets on an interest rate cut by the Fed and give further insight on the health of the US economy.
Here is what you need to know on Tuesday, August 13:
The USD Index (DXY) alternated gains with losses around the 103.20 zone amidst the generalized flattish mood in global markets. On August 13, Producer Prices will be at the centre of the debate as well as the speech by the Fed’s R. Bostic.
EUR/USD managed to reverse part of the recent multi-day bearishness, advancing modestly to the vicinity of 1.0940. The Economic Sentiment tracked by the ZEW institute in both Germany and the euro area take centre stage on August 13 on the domestic calendar.
GBP/USD expanded its recovery and came just pips away of the key 1.2800 the figure. The UK labour market report will be the salient event across the Channel on August 13.
Further depreciation of the Japanese yen prompted USD/JPY to gather fresh impulse and surpass the 148.00 hurdle, although the pair faded a big chunk of that move towards the end of the day. Producer Prices are due in Japan on August 13.
The resurgence of the bullish trend saw AUD/USD briefly test waters above the 0.6600 barrier, a region where the key 200-day SMA also coincides. On August 13, Westpac’s Consumer Confidence Index is due, seconded by the Wage Price Index.
Prices of WTI rose for the fourth session in a row and surpassed the $79.00 mark per barrel, helped by rising geopolitical concerns and hopes of the start of the easing cycle by the Fed in September.
Prices of Gold climbed to multi-day highs near $2,470 per ounce troy following the vacillating price action in the Greenback and lower US yields, while geopolitical effervescence and hopes of rate cuts by the Fed adding to the sentiment. In the same line, Silver advanced to five-day highs and flirted with the key $28.00 mark per ounce.
- Dow Jones held close to the middle on a thin start to the new trading week.
- Equities to remain nervous ahead of key inflation data.
- Fresh batch of US PPI and CPI inflation prints due this week.
The Dow Jones Industrial Average (DJIA) pulled into the middle again on Monday, echoing last Friday’s stubborn midrange pin after investors half-hearted attempts to stage a technical rally in the equity index fizzled near key technical levels. Momentum is set to remain subdued as investors buckle down for the wait to key midweek Consumer Price Index (CPI) inflation figures due on Wednesday.
US Producer Price Index (PPI) business-level inflation figures are on the docket for Tuesday, and markets are hoping for a continued easing in structural inflation pressures. Core PPI for the year ended in July is forecast to ease to 2.7% from the previous 3.0%.
Wednesday’s YoY core CPI inflation is likewise expected to tick down to 3.2% from the previous 3.3%. Markets have trapped themselves in a Goldilocks forecast scenario; if CPI comes in too high, market sentiment will take a hit. On the other hand, if CPI comes in too low, it could spark another fear-fueled pullback, leaving the only topside option available to equities a soft but not too soft inflation print.
Dow Jones news
Two-thirds of the Dow Jones board is in the red on Monday as investors look for a meaningful foothold. Walmart Inc. (WMT) and Unitedhealth Group Inc. (UNH) rose over 1.5% apiece, while losses were led by Procter & Gamble Co. (PG) and Boeing Co. (BA), each of which fell around 2% on the day.
Dow Jones price forecast
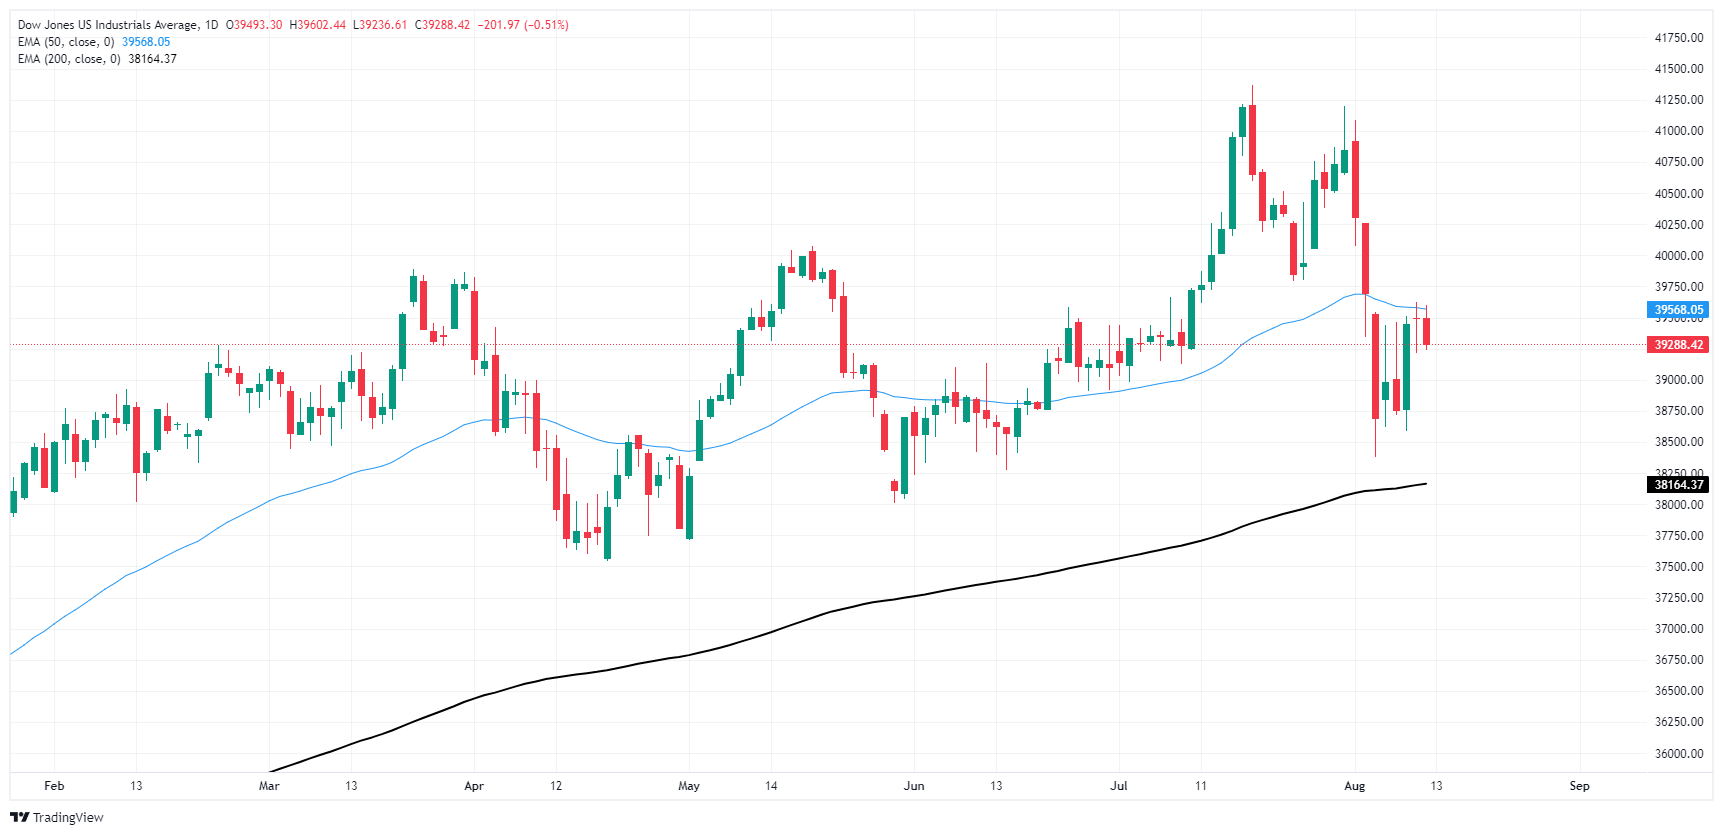
The Dow Jones traded on the tepid side on Monday, testing down around one-fifth of one percent as intraday price action struggles to find a grip on the 50-day Exponential Moving Average (EMA) near 39,583.00. The index remains down around 5% from its all-time high of 41,371.38, but bidders stepped in to keep it from falling into the 200-day EMA at 37,962.00.
The index’s nearly 7% top-to-bottom plunge kicked off earlier in the month knocked investors off their balance, but price action has recovered after finding a floor near 38,382.00. Traders should expect a continued topside recovery back over the 50-day EMA to challenge the 40,000.00 major price handle once more, but investors will be waiting for the results from upcoming inflation data prints before stepping fully in.
Dow Jones daily chart
Gold now screens as a well-populated trade. The Street is unanimously bullish, but macro fund positioning may now be tapped out without an imminent recession, CTA positioning remains near its effective 'max long' position size, the top Shanghai traders have been selling their positions from near-record highs, and Asian physical markets remain on a buyer's strike, TDS senior commodity strategist Daniel Ghali notes.
Gold prices continue to creep higher
“Positioning risks are now elevated for most major cohorts on our radar ahead of inflation data and the Jackson Hole symposium, which represent the next notable catalysts for a repricing over the coming weeks. And yet, Gold prices continue to creep higher.”
“So, who's buying it? Chinese retail. Our tracking of fund flows for Chinese Gold ETFs points to a resurgence in demand, albeit at a slower clip than the behemoth buying activity that supported prices earlier this year. This is surprising, given that Asian currency depreciation pressures appeared to be a driving force behind the previous bid from this cohort.”
“But demand from Chinese retail may either have transitioned into a momentum trade, in which case they may struggle to find subsequent buyers, or may be associated with Fed pricing, in which case they are vulnerable to the repricing we expect.”
- USD steady course remains unaffected by geopolitical tensions despite the lack of substantial fundamentals.
- Fed officials maintain positive projections of the US labor markets amid looming concerns of slow job growth.
- The market maintains the previous week's predictions; the first rate cut is anticipated in September with marginally lower odds.
The US Dollar (USD), measured by the US Dollar Index (DXY), indicated continuous horizontal movement above the 103.00 level during Monday's trading session. This follows relatively quiet market sentiment and unaltered US stock index futures, with the 10-year US yield sticking close to 4% in the earlier part of the day.
Though market expectations for upcoming monetary policy decisions remain the same, the US economic outlook continues to suggest growth above trend, insinuating a potential overestimation of the market for aggressive easing in the future.
Daily digest market movers: US Dollar stability persists ahead of inflation figures
- Market trends from the previous week transition smoothly into the current week. JPY and CHF underperformed on Monday, although global bond yields and equity markets are slightly boosted.
- Due to the lack of significant data releases on Monday, markets are upholding last week's trends while watching for important US data releases slated for this week, including PPI, CPI, and Retail Sales data.
- The market is still fully pricing in 100 bps of easing by year-end, extending to 175-200 bps of total easing over the next 12 months.
- However, this easing path seems unlikely unless the US economy sinks into a deep recession. More data is required to redirect this dovish narrative.
DXY technical outlook: Bearish bias persists amid continuous buyer efforts
DXY’s technical outlook remains bearish, with buyers struggling to evolve a significant move. The index retains its position beneath the 20, 100 and 200-day Simple Moving Averages (SMAs), conforming to a predominantly bearish bias. The momentum-based Relative Strength Index (RSI) continues its position below 50, suggesting consistent selling pressure. Additionally, the Moving Average Convergence Divergence (MACD) remains in negative terrain, showing lower red bars. Despite the week's gains, the overall technical outlook has not significantly improved, suggesting the continuous possibility for a correction.
Support Levels: 103.00, 102.50, 102.20.
Resistance Levels: 103.50, 104.00.
US Dollar FAQs
The US Dollar (USD) is the official currency of the United States of America, and the ‘de facto’ currency of a significant number of other countries where it is found in circulation alongside local notes. It is the most heavily traded currency in the world, accounting for over 88% of all global foreign exchange turnover, or an average of $6.6 trillion in transactions per day, according to data from 2022. Following the second world war, the USD took over from the British Pound as the world’s reserve currency. For most of its history, the US Dollar was backed by Gold, until the Bretton Woods Agreement in 1971 when the Gold Standard went away.
The most important single factor impacting on the value of the US Dollar is monetary policy, which is shaped by the Federal Reserve (Fed). The Fed has two mandates: to achieve price stability (control inflation) and foster full employment. Its primary tool to achieve these two goals is by adjusting interest rates. When prices are rising too quickly and inflation is above the Fed’s 2% target, the Fed will raise rates, which helps the USD value. When inflation falls below 2% or the Unemployment Rate is too high, the Fed may lower interest rates, which weighs on the Greenback.
In extreme situations, the Federal Reserve can also print more Dollars and enact quantitative easing (QE). QE is the process by which the Fed substantially increases the flow of credit in a stuck financial system. It is a non-standard policy measure used when credit has dried up because banks will not lend to each other (out of the fear of counterparty default). It is a last resort when simply lowering interest rates is unlikely to achieve the necessary result. It was the Fed’s weapon of choice to combat the credit crunch that occurred during the Great Financial Crisis in 2008. It involves the Fed printing more Dollars and using them to buy US government bonds predominantly from financial institutions. QE usually leads to a weaker US Dollar.
Quantitative tightening (QT) is the reverse process whereby the Federal Reserve stops buying bonds from financial institutions and does not reinvest the principal from the bonds it holds maturing in new purchases. It is usually positive for the US Dollar.
- Monday markets opened on a calm note after recent volatility.
- The Yen has course-corrected after a recent surge.
- Markets await the BoJ’s next move before making any decisions.
The Japanese Yen (JPY) continued to ease on Monday, falling to a one-week low against the US Dollar (USD) as markets ease off of the JPY gas pedal. The Bank of Japan’s (BoJ) recent hawkish pivot into its highest interest rate in years near 0.25% saw a large-scale unwinding of the Yen carry trade. Coupled with a recent bout of “Yenterventions” in order to defend the Yen, JPY has soared over 12.5% from multi-decade lows against the Greenback.
Market focus will pivot to US inflation data this week, with traders looking down the barrel of a fresh Consumer Price Index (CPI) inflation print on Wednesday. Japanese Gross Domestic Product (GDP) figures are also due later in the week, and could provide markets with a signal of how the BoJ plans to go about the business of trying to keep growth and inflation within Japan on the positive side.
USD/JPY price forecast
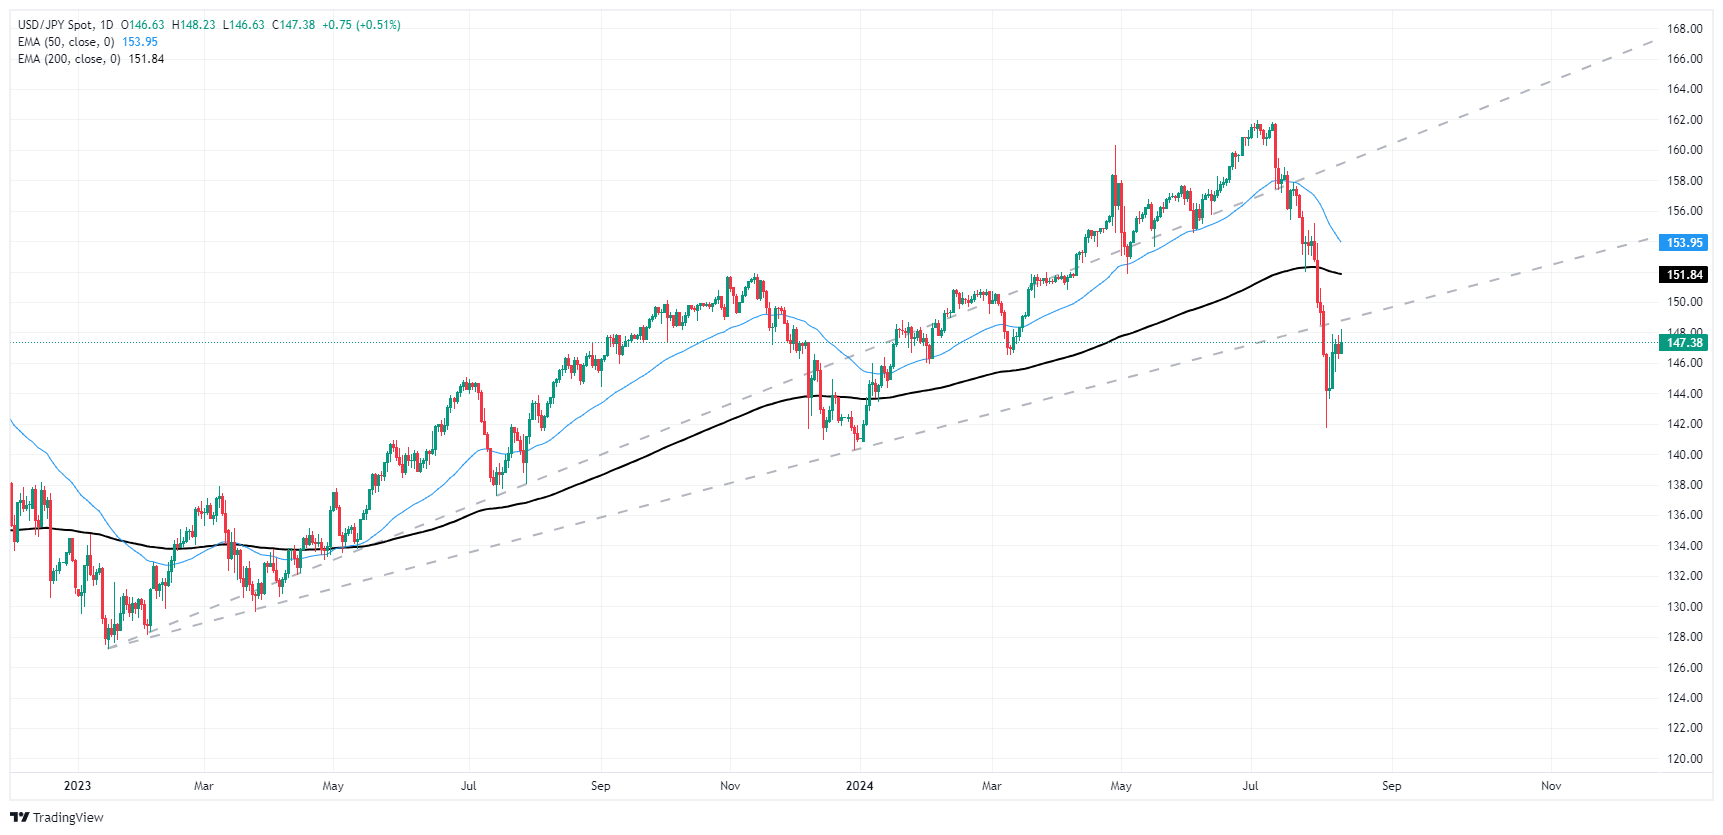
A broad-base recovery in the Yen helped to drag USD/JPY down from multi-decade highs, sending the pair plunging below the 200-day Exponential Moving Average (EMA) at 151.84. The pair reached a floor near 142.00 before buoying back to test the 148.00 region.
It’s still well too early to call a trend reversal in Yen pairs, with bidders stepping back into the Dollar-Yen trade and sending bids on a 4.4% recovery rally over the past week and a bit. Continued upside is on the cards as bulls send price action back towards the 200-day EMA, with technical support from rising trendlines helping to keep the bullish trend’s keel pointed in the right direction
USD/JPY daily chart
An August Reserve Bank of New Zealand rate cut looks like a 50-50 event. The RBNZ turned dovish in July, but non-tradable CPI, employment growth and wage inflation were all above the May projections for 2Q, ING’s FX analysts Francesco Pesole and Chris Turner note.
A move above 0.61 is a tangible possibility
“We narrowly favour a hold in August but see a greater chance that the RBNZ will cut 50bp in October, after the Fed has moved first. Ultimately, with over 90bp of easing priced in by year-end, the difference between a hawkish cut and a dovish hold may not be huge: we still think easing bets can be trimmed by year-end.”
“We remain bullish on NZD/USD in the near term. A move above 0.61 is a tangible possibility ahead of a 50bp rate cut by the Fed in September and thanks to risk sentiment stabilisation.”
- Mexican Peso pulls back after gaining over 1.50% last week, pressured by weaker Consumer Confidence.
- Banxico Governor Rodriguez justifies recent 25 bps rate cut amid 3-2 split decision, citing transitory inflation effects.
- Market focus shifts to key US inflation and retail sales data, USD gains momentum ahead of the releases.
The Mexican Peso retreats on Monday after posting solid gains of over 1.50% last week against the Greenback, with the latter posting decent gains ahead of a busy economic docket in the United States. Meanwhile, Consumer Confidence in Mexico dipped in July, which could be a prelude to the ongoing economic slowdown. The USD/MXN trades at 18.96 and gains over 0.80%.
Mexico’s National Statistics Agency announced that consumers grew less optimistic about the economic outlook and printed the second lowest reading since May’s 46.8 reading, revealed the Instituto Nacional de Estadistica Geografia e Informatica (INEGI).
In addition, Bank of Mexico (Banxico) Governor Victoria Rodriguez Ceja said in an interview with El Financiero that elements justified a 25-basis-point (bps) rate cut to the main reference rate amid a 3-2 split decision.
She acknowledged that despite headline inflation hitting 5.57%, she insisted it was unrelated to core prices, which decreased for the 18-straight month and reached 4.05% in July.
“We expect these effects of the shocks that we observe in non-core inflation to be transitory, so we are still expecting headline inflation to return to its target at the same time, at the end of 2025,” Rodriguez noted.
The USD/MXN depreciated following Banxico’s decision. Yet traders are laser-focused on the release of US inflation figures on Tuesday and Wednesday, followed by Retail Sales data on Thursday and Friday’s University of Michigan (UoM) Consumer Sentiment.
Daily digest market movers: Mexican Peso is heavy following Banxico’s cut
- Banxico’s board revealed that the Consumer Price Index (CPI) is expected to rise to 5.2% in Q3 and to edge lower to 4.4% in Q4, both readings for the remainder of 2024. They expect it will reach the 3% plus or minus 1% goal by Q4 2025.
- The board updated its inflation forecasts, indicating that headline inflation is expected to rise in the short term but remain unchanged in the longer term. Core inflation is projected to edge lower and dip below 4% in the fourth quarter of 2024.
- Mexico’s central bank acknowledged that inflationary risks remain tilted to the upside, while growth is biased to the downside.
- The CME FedWatch Tool shows the odds of a 50-basis-point interest rate cut by the Fed at the September meeting at 47.5%, down from 52.5% last Friday.
Technical analysis: Mexican Peso depreciates as USD/MXN rallies above 18.90
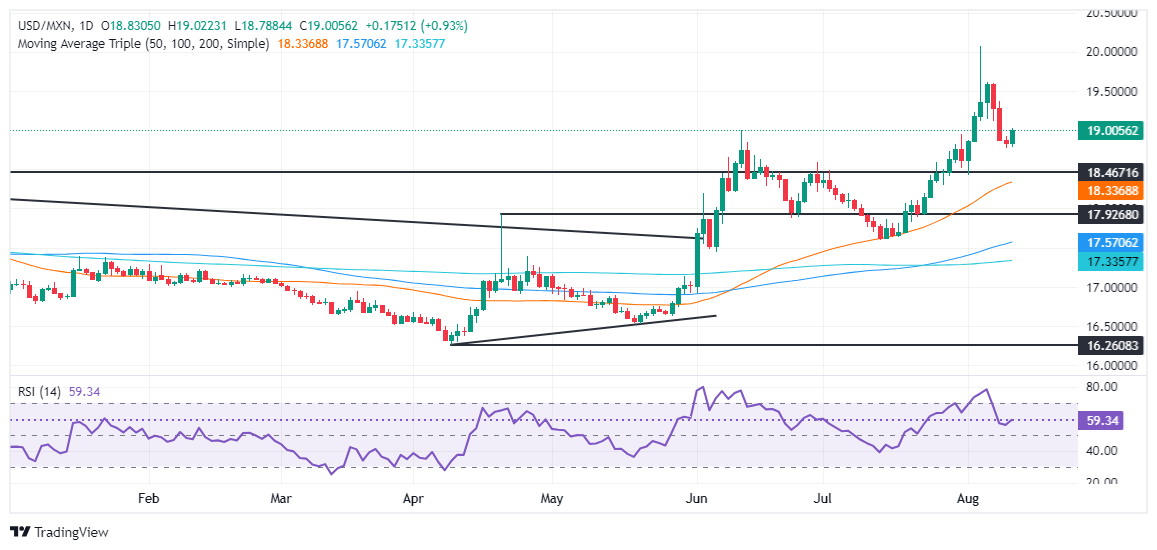
The USD/MXN uptrend resumed on Monday after hitting a six-day low of 18.76, yet traders had lifted the exchange rate past 18.90 with buyers eyeing a test of the psychological 19.00 figure.
The Relative Strength Index (RSI) is above the 50-neutral line, hinting that momentum favors buyers, which could push the exchange rate upward.
If USD/MXN clears 19.00, the next resistance would be 19.50, followed by the key 20.00 mark. A decisive break will expose the YTD high at 20.22, followed by the 20.50 mark.
Conversely, and in the most unlikely scenario in the short term, the USD/MXN’s first support would be the August 9 low 18.76. If surpassed, the next demand zone would be the June 28 peak at 18.59, followed by the psychological 18.50 mark.
Mexican Peso FAQs
The Mexican Peso (MXN) is the most traded currency among its Latin American peers. Its value is broadly determined by the performance of the Mexican economy, the country’s central bank’s policy, the amount of foreign investment in the country and even the levels of remittances sent by Mexicans who live abroad, particularly in the United States. Geopolitical trends can also move MXN: for example, the process of nearshoring – or the decision by some firms to relocate manufacturing capacity and supply chains closer to their home countries – is also seen as a catalyst for the Mexican currency as the country is considered a key manufacturing hub in the American continent. Another catalyst for MXN is Oil prices as Mexico is a key exporter of the commodity.
The main objective of Mexico’s central bank, also known as Banxico, is to maintain inflation at low and stable levels (at or close to its target of 3%, the midpoint in a tolerance band of between 2% and 4%). To this end, the bank sets an appropriate level of interest rates. When inflation is too high, Banxico will attempt to tame it by raising interest rates, making it more expensive for households and businesses to borrow money, thus cooling demand and the overall economy. Higher interest rates are generally positive for the Mexican Peso (MXN) as they lead to higher yields, making the country a more attractive place for investors. On the contrary, lower interest rates tend to weaken MXN.
Macroeconomic data releases are key to assess the state of the economy and can have an impact on the Mexican Peso (MXN) valuation. A strong Mexican economy, based on high economic growth, low unemployment and high confidence is good for MXN. Not only does it attract more foreign investment but it may encourage the Bank of Mexico (Banxico) to increase interest rates, particularly if this strength comes together with elevated inflation. However, if economic data is weak, MXN is likely to depreciate.
As an emerging-market currency, the Mexican Peso (MXN) tends to strive during risk-on periods, or when investors perceive that broader market risks are low and thus are eager to engage with investments that carry a higher risk. Conversely, MXN tends to weaken at times of market turbulence or economic uncertainty as investors tend to sell higher-risk assets and flee to the more-stable safe havens.
The Canadian labour market report for July, released on Friday, once again underlined why the Bank of Canada (BoC) has now cut interest rates for the second time. Instead of the moderate job growth that economists had been expecting, we saw job losses (albeit very small ones) for the second month in a row, Commerzbank’s FX strategist Michael Pfister notes.
BoC to make its next cut in September
“No comparison with previous months, when the labour market appeared somewhat more robust. The unemployment rate only stopped rising because the participation rate surprisingly fell – which is also not a good sign for the Canadian labour market.”
“With figures like these, it should be easy for the BoC to cut rates further in the coming months. It was already clear from the minutes of the last meeting that policymakers are concerned that the labour market is cooling too much.”
“As such, there is a strong case to be made that the BoC will make its next cut in September – cat least as long as next week's inflation figures do not show an unexpected rise. As a result, the CAD is likely to remain under pressure.”
The AUD OIS curve still includes one rate cut by year-end, ING’s FX analysts Francesco Pesole and Chris Turner note.
0.68 still looks within reach for AUD
“That is surely possible if Australian inflation eases and the Fed cuts big, but for now, the Reserve Bank of Australia is maintaining the threat of raising rates. It is one of the reasons why the Aussie dollar can perform well in the near term.”
“The RBA should have tightened policy more, and we still cannot exclude that there will be another hike if we see more acceleration in monthly CPI prints.”
“All of that means the Australian Dollar (AUD) may remain one of the market’s favourite currencies to play risk-on waves this summer, and 0.68 still looks within reach. However, the risks associated with a potential Trump re-election mean a less optimistic outlook over the medium term.”
The US Dollar (USD) has weakened since the US labor market report was published a week ago, but only moderately. The period since the labor market report is shaded gray. It can be seen that the US currency is only as weak as it was at the beginning of June, Commerzbank’s Head of FX and Commodity Research Ulrich Leuchtmann notes.
Only a slightly higher risk of a US recession
“I conclude that the currency market is by no means excessively pricing in a US recession. My fellow economists recently wrote that they still do not believe in a US recession. However, they also admit that there are new warning signs. A functioning currency market must therefore price in a higher, but only slightly higher risk of a US recession. It has done so, no more and no less.”
“In my opinion, it has even tended to price in too little. I have probably said it too often: a US recession would probably not only have a negative effect on the USD because the Fed would then lower its key interest rate. It would also damage the image of US exceptionalism: the idea that the US economy is growing faster than other developed industrialized countries for a deep, structural reason and that capital invested there is therefore more profitable than elsewhere.”
“Because in such a concept the USD is the ticket to this attractive capital market, it is particularly expensive. If, for example, the AI hype was just a bubble that is now bursting, part of this story may become implausible. Just as the strength of the US dollar crumbled when the dot-com bubble burst in the early 2000s.”
The loonie is the ‘safe-haven’ among high-beta currencies, meaning it suffers less during risk-off periods but tends to underperform in broad-based USD declines, especially if driven by worsening US macro news, ING’s FX analysts Francesco Pesole and Chris Turner note.
A gradual downward-sloping profile for USD/CAD
“Incidentally, the Bank of Canada has continued to cut rates in line with our call. With the Fed now expected to cut 100bp by year-end, the BoC may cut 25bp at each of the last three meetings of 2024. After all, the CPI picture has improved dramatically in Canada while the jobs market has loosened.”
“We retain a gradual downward-sloping profile for USD/CAD in line with the broader USD call and as BoC cuts are fully priced in. Also, CAD is in a fundamentally safer position compared to almost any other pro-cyclical currency in a Trump 2.0 scenario.”
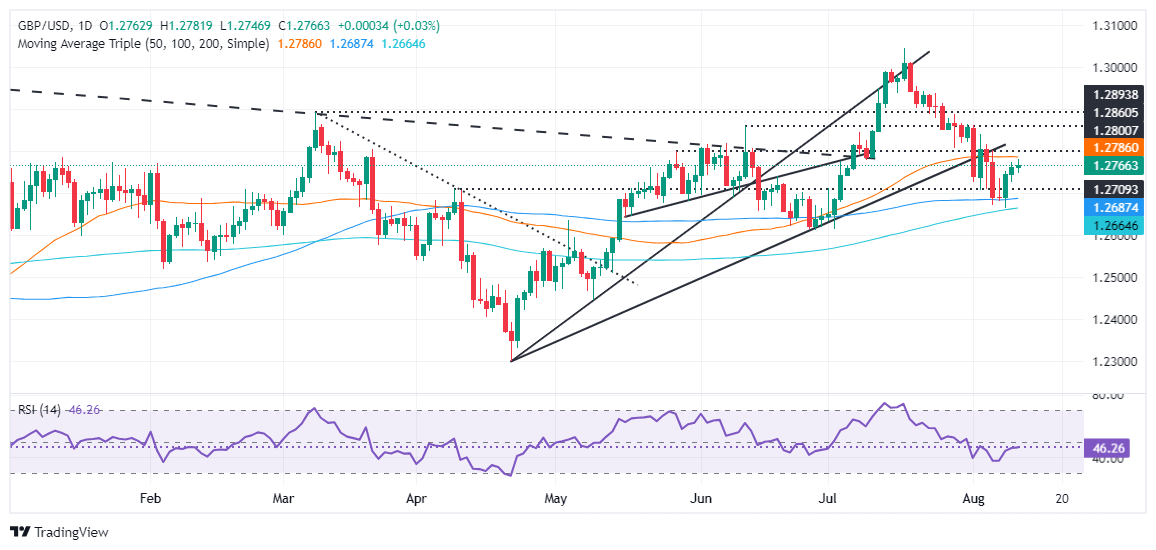
- GBP/USD remains range-bound between 1.2686 and 1.2785, with resistance at 50-DMA capping further gains.
- Sellers maintain control; RSI below the 50-neutral line suggests continued sideways movement.
- Below 1.2700, support targets are 1.2686, 1.2659, and 1.2600; above 1.2786, resistance levels include 1.2800 and 1.2861.
The Pound Sterling consolidates around the 1.2758 area on Monday, extending its gains for three straight days. However, it faces strong resistance at the 50-day moving average (DMA) at 1.2784, which quickly rejected the GBP/USD, which trades virtually unchanged, up 0.02%.
GBP/USD Price Forecast: Technical outlook
The GBP/USD is neutral biased, capped by the 50 and 100-DMA, the latter at 1.2686, with traders unable to crack the top-bottom of the 1.2686-1.2785 range, for the fourth straight day.
Momentum shows that sellers are in charge, as depicted by the Relative Strength Index (RSI) being below the 50-neutral line, but its flatlines hint that the GBP/USD could remain sideways.
If GBP/USD clears the 1.2700 figure, the next support would be the 100-DMA at 1.2686, ahead of the 200-DMA at 1.2659. Once those two levels are taken, the next stop would be the 1.2600 figure, followed by the latest cycle low of 1.2445, the May 9 daily low.
On the other hand, if GBP/USD rallies past 1.2786, look for a challenge of the 1.2800 figure. A breach of the latter will expose the June 12 peak at 1.2861 before buyers could test the 1.2900 psychological figure.
GBP/USD Price Action – Daily Chart
Pound Sterling FAQs
The Pound Sterling (GBP) is the oldest currency in the world (886 AD) and the official currency of the United Kingdom. It is the fourth most traded unit for foreign exchange (FX) in the world, accounting for 12% of all transactions, averaging $630 billion a day, according to 2022 data. Its key trading pairs are GBP/USD, aka ‘Cable’, which accounts for 11% of FX, GBP/JPY, or the ‘Dragon’ as it is known by traders (3%), and EUR/GBP (2%). The Pound Sterling is issued by the Bank of England (BoE).
The single most important factor influencing the value of the Pound Sterling is monetary policy decided by the Bank of England. The BoE bases its decisions on whether it has achieved its primary goal of “price stability” – a steady inflation rate of around 2%. Its primary tool for achieving this is the adjustment of interest rates. When inflation is too high, the BoE will try to rein it in by raising interest rates, making it more expensive for people and businesses to access credit. This is generally positive for GBP, as higher interest rates make the UK a more attractive place for global investors to park their money. When inflation falls too low it is a sign economic growth is slowing. In this scenario, the BoE will consider lowering interest rates to cheapen credit so businesses will borrow more to invest in growth-generating projects.
Data releases gauge the health of the economy and can impact the value of the Pound Sterling. Indicators such as GDP, Manufacturing and Services PMIs, and employment can all influence the direction of the GBP. A strong economy is good for Sterling. Not only does it attract more foreign investment but it may encourage the BoE to put up interest rates, which will directly strengthen GBP. Otherwise, if economic data is weak, the Pound Sterling is likely to fall.
Another significant data release for the Pound Sterling is the Trade Balance. This indicator measures the difference between what a country earns from its exports and what it spends on imports over a given period. If a country produces highly sought-after exports, its currency will benefit purely from the extra demand created from foreign buyers seeking to purchase these goods. Therefore, a positive net Trade Balance strengthens a currency and vice versa for a negative balance.
British Pound PRICE Today
The table below shows the percentage change of British Pound (GBP) against listed major currencies today. British Pound was the strongest against the Japanese Yen.
| USD | EUR | GBP | JPY | CAD | AUD | NZD | CHF | |
|---|---|---|---|---|---|---|---|---|
| USD | -0.02% | -0.02% | 0.74% | 0.02% | -0.34% | -0.35% | 0.53% | |
| EUR | 0.02% | 0.02% | 0.81% | 0.04% | -0.44% | -0.33% | 0.56% | |
| GBP | 0.02% | -0.02% | 1.04% | 0.02% | -0.47% | -0.35% | 0.55% | |
| JPY | -0.74% | -0.81% | -1.04% | -0.75% | -1.19% | -1.13% | -0.28% | |
| CAD | -0.02% | -0.04% | -0.02% | 0.75% | -0.42% | -0.37% | 0.54% | |
| AUD | 0.34% | 0.44% | 0.47% | 1.19% | 0.42% | 0.12% | 1.02% | |
| NZD | 0.35% | 0.33% | 0.35% | 1.13% | 0.37% | -0.12% | 0.90% | |
| CHF | -0.53% | -0.56% | -0.55% | 0.28% | -0.54% | -1.02% | -0.90% |
The heat map shows percentage changes of major currencies against each other. The base currency is picked from the left column, while the quote currency is picked from the top row. For example, if you pick the British Pound from the left column and move along the horizontal line to the US Dollar, the percentage change displayed in the box will represent GBP (base)/USD (quote).
The Pound Sterling (GBP) is marginally softer on the session but, like the EUR, trading has comfortably held its recent trading range, Scotiabank chief FX strategist Shaun Osborne notes.
GBP may strive to break above 1.2780/1.2810
“UK focus this week falls primarily on UK inflation data Wednesday. Prices may pick up in headline Y/Y terms and look a bit sticky across other measures. Services inflation is expected to slow only marginally to 5.5% Y/Y. Elevated prices should bolster the outlook for cautious BoE policy easing moving ahead and help bolster support for the GBP on dips.”
“Price action remains constructive for the GBP after the pound carved out a clear bull reversal (“morning star” pattern) on the daily candle chart last week. Progress is slow but the gains have broken the back of the downtrend in place since mid-July. Support is 1.2725/30. Gains through the 1.2780/1.2810 resistance band should see the GBP rebound extend to the upper 1.28s.”
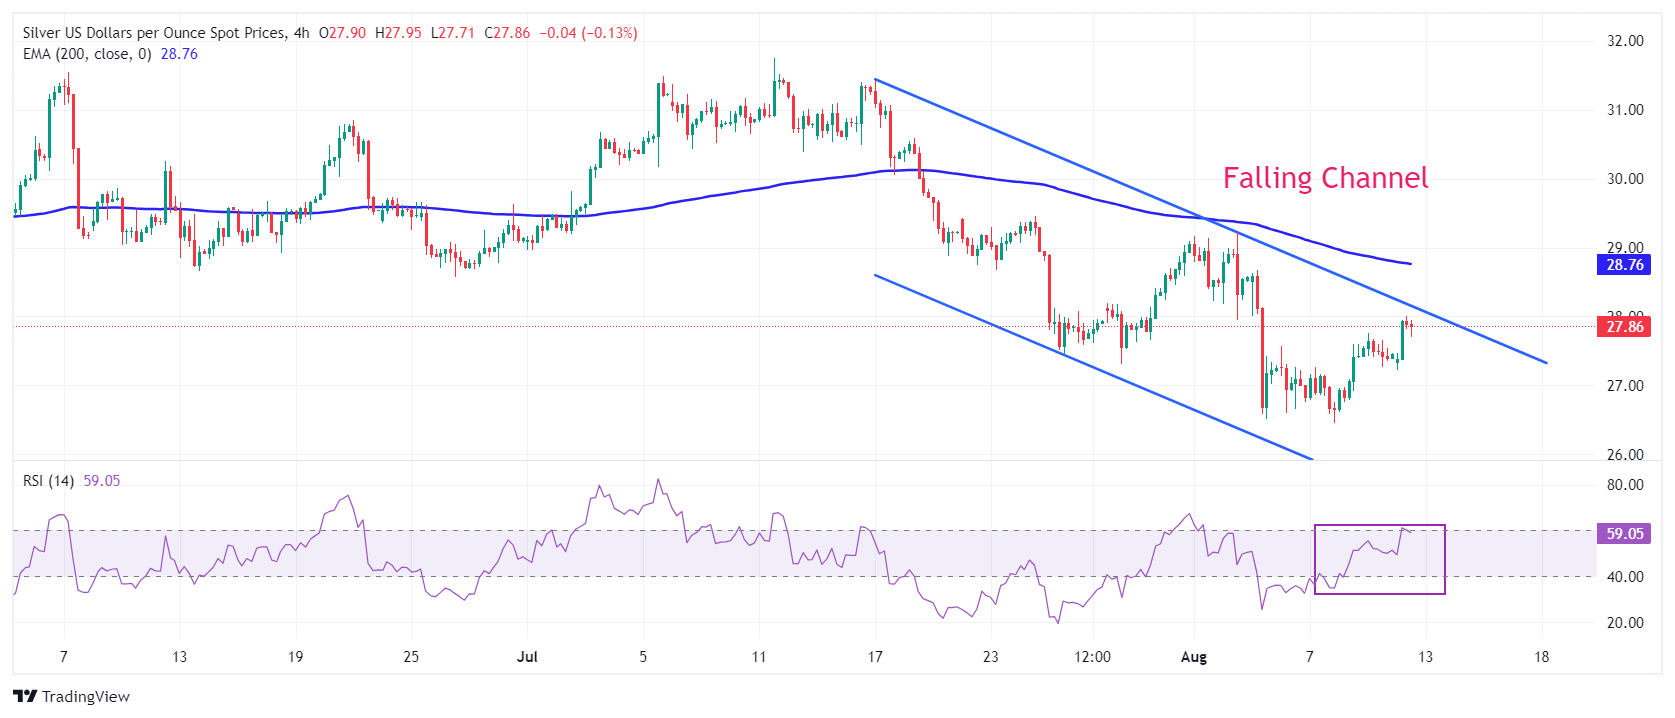
- Silver price jumps to near $28 on multiple tailwinds.
- Market speculation for Fed big rate cuts in September has waned significantly.
- Investors await the US CPI for July for fresh guidance on interest rates.
Silver price (XAG/USD) surges to near $28.00 in Monday’s North American session. The white metal gains amid geopolitical risks and firm speculation that the Federal Reserve (Fed) will start reducing interest rates from the September meeting.
Conflicts between Iran and Israel in the Middle East are expected to widen further as the former is expected to retaliate for the assassination of the Hamas leader by an Israeli air strike in Tehran. The appeal of Silver as a safe haven improves amid geopolitical uncertainty.
Meanwhile, market speculation for the Fed rate cuts in September remain robust but uncertainty over the size has deepened significantly. According to the CME FedWatch tool, 30-day Federal Funds Futures pricing data shows that traders see a 46.5% chance that interest rates will be reduced by 50 basis points (bps) in September. The likelihood of a 50 bp rate reduction has weakened significantly from 85%, recorded a week ago.
A sharp decline in the Fed's big interest-rate cut prospects has offered some support to the US Dollar (USD) and bond yields. The US Dollar Index (DXY), which tracks the Greenback’s value against six major currencies, steadies above 103.00. 10-year US Treasury yields hover near 3.95%.
Going forward, investors will focus on the United States (US) Consumer Price Index (CPI) data for July, which will be published Wednesday. Headline and core CPI, which strips off volatile food and energy prices, are expected to have decelerated to 2.9% and 3.2%, respectively.
Silver technical analysis
Silver price rises to near the upward boundary of the Falling Channel formation in a four-hour timeframe. Usually, investors see pullbacks in the above-mentioned chart pattern as selling opportunities by market participants. The asset remains below the 200-period Exponential Moving Average (EMA) near $28.76, suggesting that the overall outlook is bullish.
The 14-period Relative Strength Index (RSI) attempts to break above 60.00. Sustenance above the same would improve Silver’s appeal.
Silver four-hour chart
Silver FAQs
Silver is a precious metal highly traded among investors. It has been historically used as a store of value and a medium of exchange. Although less popular than Gold, traders may turn to Silver to diversify their investment portfolio, for its intrinsic value or as a potential hedge during high-inflation periods. Investors can buy physical Silver, in coins or in bars, or trade it through vehicles such as Exchange Traded Funds, which track its price on international markets.
Silver prices can move due to a wide range of factors. Geopolitical instability or fears of a deep recession can make Silver price escalate due to its safe-haven status, although to a lesser extent than Gold's. As a yieldless asset, Silver tends to rise with lower interest rates. Its moves also depend on how the US Dollar (USD) behaves as the asset is priced in dollars (XAG/USD). A strong Dollar tends to keep the price of Silver at bay, whereas a weaker Dollar is likely to propel prices up. Other factors such as investment demand, mining supply – Silver is much more abundant than Gold – and recycling rates can also affect prices.
Silver is widely used in industry, particularly in sectors such as electronics or solar energy, as it has one of the highest electric conductivity of all metals – more than Copper and Gold. A surge in demand can increase prices, while a decline tends to lower them. Dynamics in the US, Chinese and Indian economies can also contribute to price swings: for the US and particularly China, their big industrial sectors use Silver in various processes; in India, consumers’ demand for the precious metal for jewellery also plays a key role in setting prices.
Silver prices tend to follow Gold's moves. When Gold prices rise, Silver typically follows suit, as their status as safe-haven assets is similar. The Gold/Silver ratio, which shows the number of ounces of Silver needed to equal the value of one ounce of Gold, may help to determine the relative valuation between both metals. Some investors may consider a high ratio as an indicator that Silver is undervalued, or Gold is overvalued. On the contrary, a low ratio might suggest that Gold is undervalued relative to Silver.
It looks like G10 policy rates (ex-Japan) are going lower, ING’s FX analysts Francesco Pesole and Chris Turner note.
EUR/CHF may struggle to stay above 0.95
“We are looking for at least another 125bp of ECB easing into next summer, if not 175bp. Switzerland is closer to the zero-bound constraint, however, and markets are reluctant to price the Swiss National Bank policy rate below 0.50% - just 75bp lower from current levels. Spread compression could therefore weigh on EUR/CHF into 2025.”
“We also think the SNB pays close attention to the real CHF. At the end of July, it was still some 4% off the highest levels seen in January 2024 and suggests the SNB may not emerge with strong verbal intervention until EUR/CHF is closer to the 0.91 area.”
“Geopolitics also means EUR/CHF may struggle to stay above 0.95.”
- NZD/USD moves higher to near 0.6030 with a focus on RBNZ monetary policy.
- The RBNZ is expected to leave its OCR unchanged at 5.5%.
- The next move in the US Dollar will be guided by the US Inflation data for July.
The NZD/USD pair climbs to near almost three-week high of 0.6030 in Monday’s North American session. The Kiwi asset strengthens as the New Zealand Dollar (NZD) performs strongly ahead of the Reserve Bank of New Zealand’s (RBNZ) monetary policy announcement on Wednesday.
The RBNZ is widely anticipated to keep its Official Cash Rate (OCR) steady at 5.5%. Therefore, investors will keenly focus on the interest rate guidance.
Recently, the New Zealand Institute of Economic Research (NZIER) ran a “shadow board”, which showed that analysts were divided over the August rate cut. Over half of analysts favored a quarter-to-a-percent rate cut to prevent the economy from slowing further. Other analysts wanted to see more evidence of inflation easing further.
Meanwhile, the US Dollar (USD) trades sideways, with investors focusing on the United States (US) Consumer Price Index (CPI) data for July, which will be published on Wednesday. The US Dollar Index (DXY), which tracks the Greenback’s value against six major currencies, stays in a tight range above 103.00.
NZD/USD struggles to extend upside above the immediate supply zone plotted in the range of 0.6037-0.6046 on a daily timeframe. The asset has recovered strongly above the 20-day Exponential Moving Average (EMA) near 0.5990, suggesting that the near-term outlook is bullish. The major aims to stabilize above the 50-day EMA, which hovers around 0.6030.
The 14-day Relative Strength Index (RSI) has returned inside the 40.00-60.00 range, suggesting that the bearish momentum has ended.
More upside would appear if the asset decisively breaks May 3 high at 0.6046. This would push the asset higher to July 17 high near 0.6100 and July 12 high of 0.6127.
In an alternate scenario, a downside move below April 19 low around 0.5850 would drag the asset towards the round-level support of 0.5800, followed by 26 October 2023 low at 0.5770.
NZD/USD daily chart
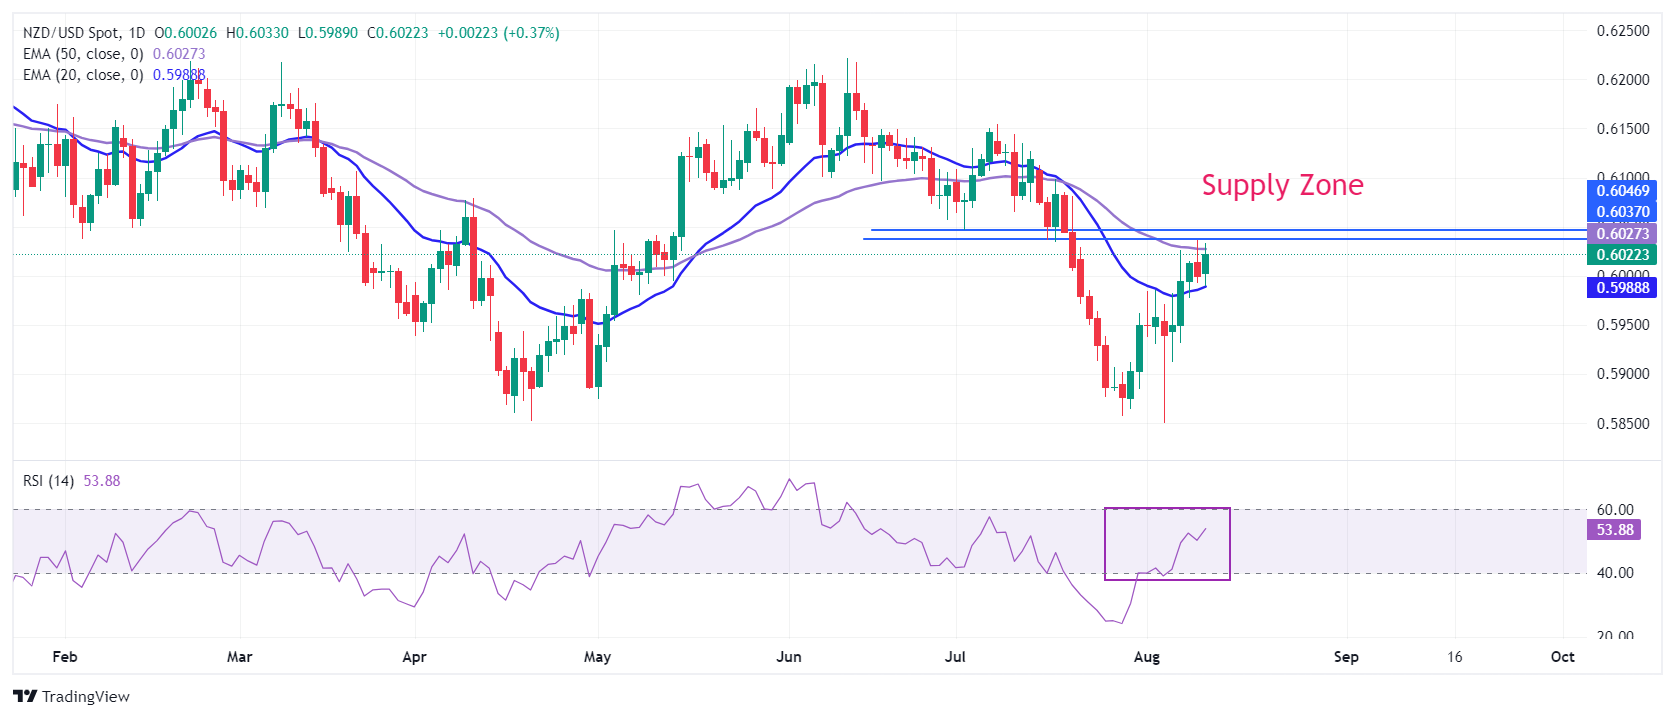
Economic Indicator
RBNZ Interest Rate Decision
The Reserve Bank of New Zealand (RBNZ) announces its interest rate decision after its seven scheduled annual policy meetings. If the RBNZ is hawkish and sees inflationary pressures rising, it raises the Official Cash Rate (OCR) to bring inflation down. This is positive for the New Zealand Dollar (NZD) since higher interest rates attract more capital inflows. Likewise, if it reaches the view that inflation is too low it lowers the OCR, which tends to weaken NZD.
Read more.Next release: Wed Aug 14, 2024 02:00
Frequency: Irregular
Consensus: 5.5%
Previous: 5.5%
Source: Reserve Bank of New Zealand
The Reserve Bank of New Zealand (RBNZ) holds monetary policy meetings seven times a year, announcing their decision on interest rates and the economic assessments that influenced their decision. The central bank offers clues on the economic outlook and future policy path, which are of high relevance for the NZD valuation. Positive economic developments and upbeat outlook could lead the RBNZ to tighten the policy by hiking interest rates, which tends to be NZD bullish. The policy announcements are usually followed by Governor Adrian Orr’s press conference.
There were no major data reports today and, with central bankers on the beach, there have been no comments from policy makers, Scotiabank chief FX strategist Shaun Osborne notes.
Gains above 1.0940/50 to see spot progress towards 1.10+.
“The Euro (EUR) is marginally firmer on the session but holding well within recent ranges. Flows, technicals and external factors are the key drivers for the EUR as well in the short run.”
“Despite trading well off from last week’s high, broader spot trends still look relatively bullish for the EUR. Near-term trends are flat, however, and the EUR needs to pick up a bit more ground again—soon—to reinvigorate bullish underlying trends.”
“Gains through 1.0940/50 minor resistance should see spot progress towards 1.10+. Support is 1.0875/85.”
- AUD/USD reversed off the August 5 lows and struck higher, establishing a new uptrend.
- The pair could even see further gains up to the 200-period SMA in the 0.6630s.
AUD/USD has probably reversed its short-term downtrend since the recovery from the August 5 lows and will continue extending higher.
The pair rebounded from the early August lows, forming a typical trend reversal marker in the form of a long Japanese Hammer candlestick pattern on both the 4-hour (circled below) and daily chart (not shown).
AUD/USD 4-hour Chart
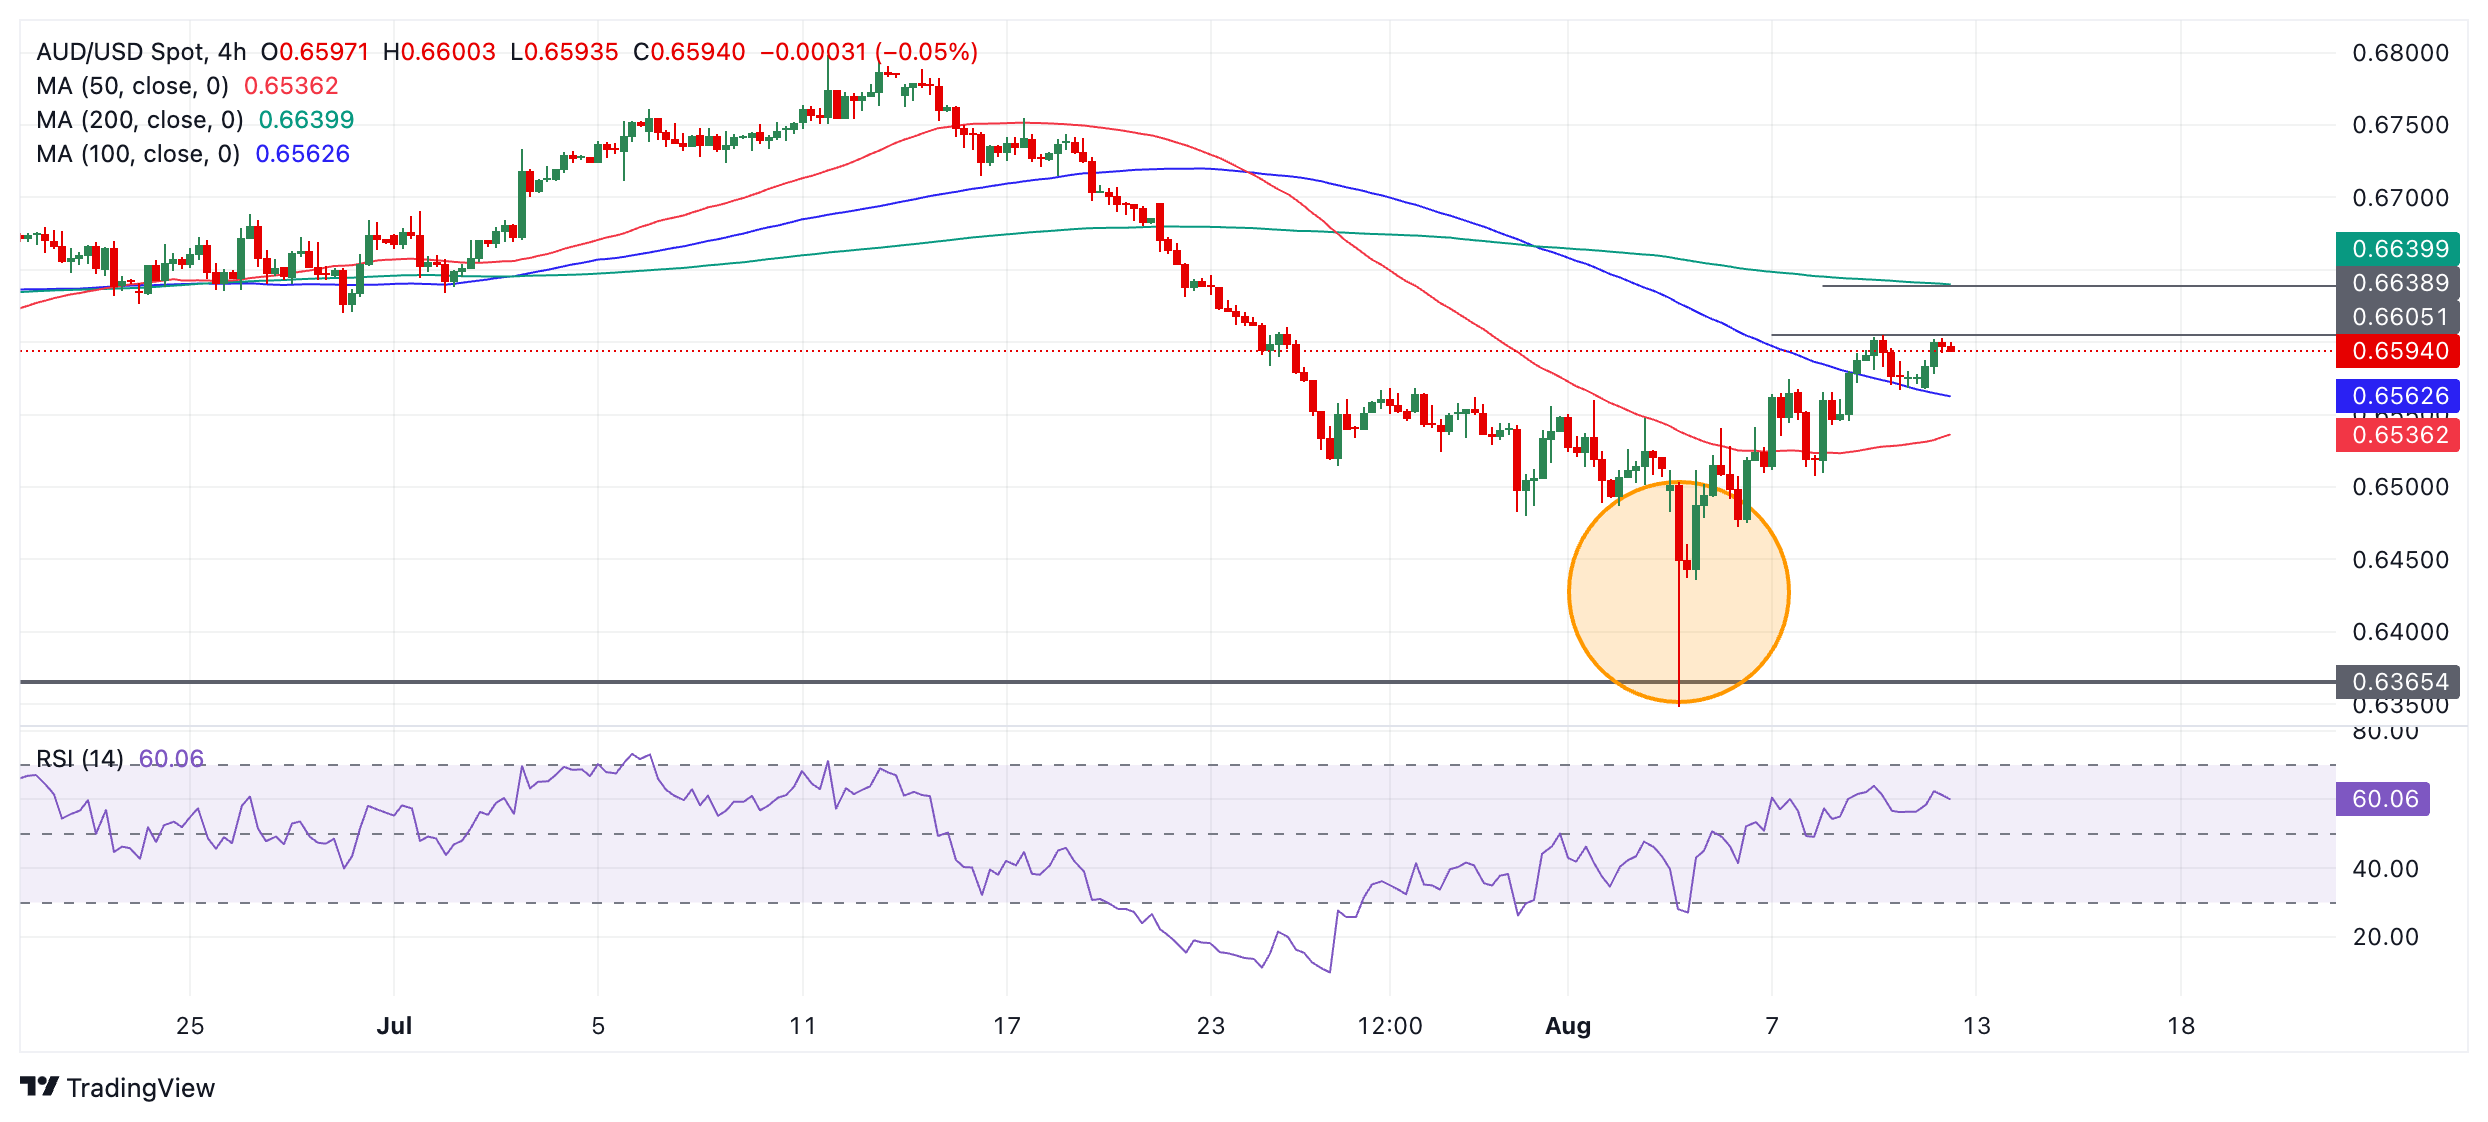
Since then the pair has begun a new sequence of rising peaks and troughs on the 4-hour chart which denotes the formation of a new short-term uptrend. Given “the trend is your friend” this uptrend is biased to extend even higher.
A break above 0.6605 (August 9 high), would provide confirmation of a continuation higher, to a target at around 0.6639, at the level of the 200-period Simple Moving Average (SMA) and 50-day SMA. These major SMAs are expected to limit further gains, at least temporarily.
AUD/USD has broken above the 50 and 100-SMAs, indicating strong bullish momentum and the Relative Strength Index (RSI) is not yet overbought, suggesting further room for more upside.
The 1 August BoE rate cut and then some sharp position adjustment finally managed to turn the trend in EUR/GBP, ING’s FX analysts Francesco Pesole and Chris Turner note.
The BoE/ECB policy rate spread is 150bp
“Currently, the policy rate spread between the BoE and the ECB is 150bp. We expect this to halve into 2025 and should mean a gently higher EUR/GBP.”
“In the UK, the 30 October budget from the new Labour government will be important. This could be restrictive and hit sterling with a tighter fiscal/looser monetary policy mix.”
“The Euro could have a rocky October too. Many governments across the region need to get budget consolidation plans into Brussels. Failure to do so could lead to bond market stress.”
There is a subtle split in G10 FX performance on the day, with the AUD and NZD firming and the NOK trading a little stronger overall while the JPY and the CHF are tending to underperform. The Canadian Dollar (CAD) is having none of that high beta/haven division and sits all but unchanged on the session, Scotiabank chief FX strategist Shaun Osborne notes.
Spot continues to look somewhat overvalued
“There is a fair bit of Canadian data out in the coming days but much of it relates to housing and may not have any major impact on spot. The CAD will continue to reflect external—rather than internal, fundamental—or technical developments for the time being.”
“Spot continues to look somewhat overvalued relative to our equilibrium assessment (1.3676 today) which should at least help limit CAD losses. Spot remains relatively stable in the low 1.37s—around retracement support and the 40-day MA at 1.2720/25.”
“But the CAD did close out last week bullishly, with USDCAD forming a huge reversal after briefly trading above 1.39 and closing well below the prior week’s low (forming a bearish key reversal signal on the weekly chart). That should mean limited upside potential for the USD (resistance is 1.3780/90) from here and incremental pressure on supports in the upper1.36s/low-1.37s.”
- USD/CHF extends gains after recession-panic selling ebbs away.
- Swiss manufacturers call their central bank to counter the Franc’s appreciation.
- US inflation data released in days to come could further impact pair.
USD/CHF rises almost half a percent on Monday to trade in the 0.8690s as the US Dollar (USD) extends its rebound against safe-haven currencies. The rally marks an over 3.0% recovery from the 0.8433 lows reached on August 5, when US recession fears led to panic selling in markets at the beginning of last week.
A lower-than-expected US Nonfarm Payrolls result in July sparked the sell-off, however, markets regained their composure on Thursday after robust US Jobless Claims data helped reassure investors that the US economy was not falling into a recession. Since then the US Dollar has rebounded, particularly against the Swiss Franc (CHF), which especially benefited during the sell-off due to its safe-haven status, which attracts increased inflows during times of strife.
The depreciation of the Swiss Franc (CHF) will come as a relief to Swiss manufacturers who have been complaining about the Francs appreciation hampering their goods export competitiveness.
“The Swiss National Bank is called upon to act quickly within the scope of its mandate,” said Swissmem, an association of Switzerland’s mechanical and electrical engineering manufacturers last Wednesday, according to Swissinfo.ch. “The SNB has the leeway to prevent or cushion any future shock appreciation using the instruments it considers best,” it added.
Despite faring better than many other developed economies, Switzerland is struggling to gain traction amid weak export demand. The Swiss Manufacturing Purchasing Managers Index (PMI) has remained below 50, the dividing line between contraction and growth since the start of 2023. In fact, Swiss Manufacturing PMI came in at 43.5 in July 2024, down from 43.9 in the previous month and worse than market expectations of 43.8.
USD/CHF may see further upside as the Swiss National Bank (SNB) is widely expected to cut interest rates by 0.25% to 1.25% at its September meeting. Such a cut would weaken the CHF as lower interest rates generally tend to decrease foreign capital inflows. It would mark the third SNB rate cut since it began easing monetary policy in March 2024. Rate-cut expectations are reinforced by Switzerland's annual inflation rate, which stands at 1.3% in July 2024, unchanged from the previous month and in line with market expectations.
The US Dollar meanwhile is likely to remain capped versus the Swiss Franc due to increasing bets the US Federal Reserve (Fed) could opt for a mega cut at its September meeting. Market probabilities stand at about a 50/50 chance of either a 0.25% cut of the fed funds rate to 5.25% and a 0.50% cut to 5.00%. These are a lot higher than earlier in the summer when sticky inflation continued to suppress expectations of future rate cuts from the Fed.
US inflation data in the form of the US Producer Price Index (PPI) and Consumer Price Index (CPI) in July, out on Tuesday and Wednesday respectively, is likely to further color the outlook for interest rates in the US and therefore the trajectory of the US Dollar. Falling inflation is likely to weigh on USD/CHF whilst rising inflation could lead to extension of the pair’s recovery.
It took the Bank of England (BoE) a while, but in August it finally started its easing cycle, ING’s FX analysts Francesco Pesole and Chris Turner note.
BoE rate cuts can prompt GBP longs downsizing
“No forward guidance was given – probably owing to the fact that it was only a 5-4 vote in favour of a cut. And the fact that the Chief Economist Huw Pill voted against the dovish Governor Andrew Bailey was notable.”
“Yet subsequent speeches suggest that if services inflation can continue to trend lower, more cuts will be forthcoming. We look for 25bp cuts in November and December. This should keep GBP/USD relatively contained and largely sub-1.30.”
“Speculators had also been running quite long GBP positions. We think BoE rate cuts can prompt some downsizing here.”
The dramatic movement of the Japanese Yen (JPY) in recent times is being sold everywhere as the ‘unwinding of carry trades’. This suggests that speculative investors have so far taken short positions in the JPY, which they financed with the low JPY interest rates, in order to invest the funds thus obtained in higher-yielding currencies. These speculative investors were thus aiming to reap a secure interest rate advantage, according to this story, Commerzbank’s Head of FX and Commodity Research Ulrich Leuchtmann notes.
The unwinding of carry trade make little sense
“As a metaphor, this story is not bad at all. It only becomes misleading if you take it too literally and calculate, for example, what percentage of the carry trade has already been unwound. Why? Because a carry trade described in this way makes little sense. Let's take the example of USD/JPY.”
“In mid-July, the low point of the implied 1-year volatility was around 9%, the USD interest rate around 5.2% and the JPY interest rate around 0.25%. This means that while it was possible to earn almost 5% p.a. on a USD/JPY carry trade, the market expected the spot rate to fluctuate by an average of 9% over the course of the next 12 months.”
“The fact that exchange rate movements appear excessive to the layperson, that it may seem implausible, for example, that a 25 basis point increase in JPY interest rates justifies a USD/JPY slide by more than 10 big figures, is of course due to a dynamic that is quite well understood by economists. As early as the 1970s, Rudi Dornbusch explained with his overshooting model why this must be the case. ‘Unwinding of carry trades’ does not appear anywhere in this explanation.”
- Oil price jumps higher for a fourth consecutive day on Monday.
- Traders are pencilling in a bullish outlook, with demand in Asia to pick up.
- The US Dollar Index trades at a pivotal level after being glued to it since last week.
Oil price jumps higher for a fourth straight day in a row on Monday. Oil traders are sending Crude prices higher with the assumption that the monthly report from the Organization of the Petroleum Exporting Countries (OPEC) will still bear a bullish undertone. Certainly, seeing recent price increases from Saudi Arabia towards Asia and Russia set to commit to its production quota by firmly reducing its production over August and September. Volatility is bound to pick up with the report from the International Energy Administration (IEA) on Wednesday, which is often a bit more dovish than the OPEC one.
The US Dollar Index (DXY), which tracks the performance of the US Dollar against six major currencies, is still having issues and trades near the pivotal level it was residing around in the aftermath of the rough Monday ride in markets last week. It looks like the DXY will orbit around this level until the first catalyst, which will probably be the US Consumer Price Index (CPI) print for July scheduled for Wednesday. Should that report reveal a pickup in inflation, market repricing would favor a stronger US Dollar.
At the time of writing, Crude Oil (WTI) trades at $76.25 and Brent Crude at $79.72
Oil news and market movers: Reports to guide markets
- This week starts with the monthly OPEC report on Monday, normally expected around noon during European trading hours.
- Bloomberg reports that US refiners are set to reduce production, with the biggest producer reporting to operate its plants at only 90% capacity. That level is the lowest since 2020.
- Saudi Aramco is providing nearly 2 million barrels less in September than it will do for August, Reuters reports.
- Although headlines from the Middle East have moved a bit to the background, tensions are still present, and the element still needs to be factored in as a tail risk for more upside.
Oil Technical Analysis: Pivotal recovery point
Oil price is rallying higher, with several traders having bought the dip that took place last week. Expect this move to start fading slowly but surely under pressure from profit-taking along the way. The OPEC and IEA report could be the catalyst for that turnaround, together with possible price action turning just ahead or at the 200-day Simple Moving Average near $77.69.
On the upside the pivotal level near $75.27 has now been reclaimed by bulls, which now will act as support level to head back to the 200-day Simple Moving Average (SMA) at $77.69. The two other major moving averages reside very close, with the 55-day SMA at $78.55 and the 100-day SMA at $79.84.
The Relative Strength Index (RSI) has rebounded in the daily chart, meaning there is room again to trend lower. Looking down, the first level to watch out for is $72.00. Once a new low for August gets printed in the charts, another leg lower would not rule out $68.00 or even $67.11, an 18-month low.
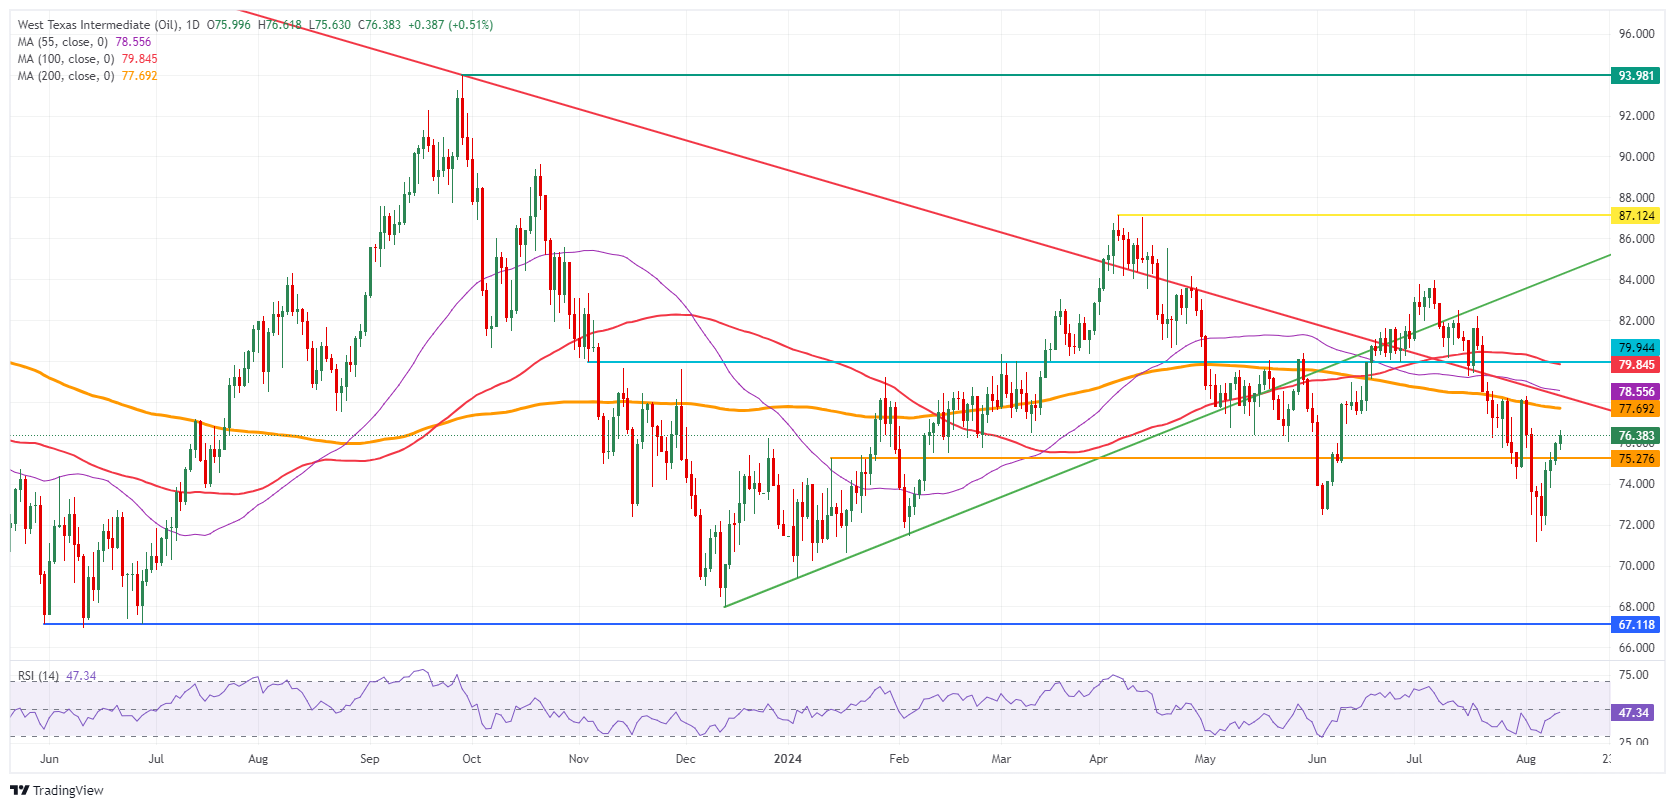
US WTI Crude Oil: Daily Chart
WTI Oil FAQs
WTI Oil is a type of Crude Oil sold on international markets. The WTI stands for West Texas Intermediate, one of three major types including Brent and Dubai Crude. WTI is also referred to as “light” and “sweet” because of its relatively low gravity and sulfur content respectively. It is considered a high quality Oil that is easily refined. It is sourced in the United States and distributed via the Cushing hub, which is considered “The Pipeline Crossroads of the World”. It is a benchmark for the Oil market and WTI price is frequently quoted in the media.
Like all assets, supply and demand are the key drivers of WTI Oil price. As such, global growth can be a driver of increased demand and vice versa for weak global growth. Political instability, wars, and sanctions can disrupt supply and impact prices. The decisions of OPEC, a group of major Oil-producing countries, is another key driver of price. The value of the US Dollar influences the price of WTI Crude Oil, since Oil is predominantly traded in US Dollars, thus a weaker US Dollar can make Oil more affordable and vice versa.
The weekly Oil inventory reports published by the American Petroleum Institute (API) and the Energy Information Agency (EIA) impact the price of WTI Oil. Changes in inventories reflect fluctuating supply and demand. If the data shows a drop in inventories it can indicate increased demand, pushing up Oil price. Higher inventories can reflect increased supply, pushing down prices. API’s report is published every Tuesday and EIA’s the day after. Their results are usually similar, falling within 1% of each other 75% of the time. The EIA data is considered more reliable, since it is a government agency.
OPEC (Organization of the Petroleum Exporting Countries) is a group of 13 Oil-producing nations who collectively decide production quotas for member countries at twice-yearly meetings. Their decisions often impact WTI Oil prices. When OPEC decides to lower quotas, it can tighten supply, pushing up Oil prices. When OPEC increases production, it has the opposite effect. OPEC+ refers to an expanded group that includes ten extra non-OPEC members, the most notable of which is Russia.
Silver prices (XAG/USD) rose on Monday, according to FXStreet data. Silver trades at $27.99 per troy ounce, up 1.93% from the $27.46 it cost on Friday.
Silver prices have increased by 17.63% since the beginning of the year.
| Unit measure | Silver Price Today in USD |
|---|---|
| Troy Ounce | 27.99 |
| 1 Gram | 0.90 |
The Gold/Silver ratio, which shows the number of ounces of Silver needed to equal the value of one ounce of Gold, stood at 87.25 on Monday, down from 88.54 on Friday.
Silver FAQs
Silver is a precious metal highly traded among investors. It has been historically used as a store of value and a medium of exchange. Although less popular than Gold, traders may turn to Silver to diversify their investment portfolio, for its intrinsic value or as a potential hedge during high-inflation periods. Investors can buy physical Silver, in coins or in bars, or trade it through vehicles such as Exchange Traded Funds, which track its price on international markets.
Silver prices can move due to a wide range of factors. Geopolitical instability or fears of a deep recession can make Silver price escalate due to its safe-haven status, although to a lesser extent than Gold's. As a yieldless asset, Silver tends to rise with lower interest rates. Its moves also depend on how the US Dollar (USD) behaves as the asset is priced in dollars (XAG/USD). A strong Dollar tends to keep the price of Silver at bay, whereas a weaker Dollar is likely to propel prices up. Other factors such as investment demand, mining supply – Silver is much more abundant than Gold – and recycling rates can also affect prices.
Silver is widely used in industry, particularly in sectors such as electronics or solar energy, as it has one of the highest electric conductivity of all metals – more than Copper and Gold. A surge in demand can increase prices, while a decline tends to lower them. Dynamics in the US, Chinese and Indian economies can also contribute to price swings: for the US and particularly China, their big industrial sectors use Silver in various processes; in India, consumers’ demand for the precious metal for jewellery also plays a key role in setting prices.
Silver prices tend to follow Gold's moves. When Gold prices rise, Silver typically follows suit, as their status as safe-haven assets is similar. The Gold/Silver ratio, which shows the number of ounces of Silver needed to equal the value of one ounce of Gold, may help to determine the relative valuation between both metals. Some investors may consider a high ratio as an indicator that Silver is undervalued, or Gold is overvalued. On the contrary, a low ratio might suggest that Gold is undervalued relative to Silver.
(An automation tool was used in creating this post.)
Japanese efforts to turn the USD/JPY bull turn around have been a little too successful, ING’s FX analysts Francesco Pesole and Chris Turner note.
USD/JPY set to be back to the 137/138 area
“They exposed a ‘fast money’ community that at the start of July had been exceptionally short Japanese Yen (JPY). And as is the case with carry trade strategies, a trend that was years in the making was reversed in a heartbeat. We think positioning is better balanced now and that a further drop will be orderly.”
“Our call is that USD/JPY will revert to being driven by macro factors rather than by position adjustment. Lower growth and US rates, plus the Bank of Japan on a path to higher rates (next hike in October) should drag USD/JPY back to the 137/138 area.”
“More Trump comments on the need for a weak USD are also a risk.”
Financial markets have taken the view that the Federal Reserve has left it too late to cut rates and that a US recession is likely, ING’s FX analysts Francesco Pesole and Chris Turner note.
US exceptionalism is finally waning
“We are not as bearish as some but expect the Fed to start easing restrictive conditions with a 50bp rate cut on 18 September, followed by 25bp cuts in November and December. We see the policy rate dropping to 3.50% next summer. This should be broadly bearish for the USD – though November US elections will be pivotal.”
“Our near-term call is that equity markets and volatility settle, allowing EUR/USD to trade over 1.10 as it reconnects with rate spreads. In effect, we are looking for an orderly USD decline.”
“The eurozone economy does not look great, but we are now in a convergence story. ‘US exceptionalism’ is finally waning.”
- USD/CAD extends its losing spree as firm Oil prices continue to strengthen the Canadian Dollar.
- The appeal of risk-sensitive assets improves as fears of US recession have waned.
- Investors await the US Inflation data for July for fresh guidance on interest rates.
The USD/CAD pair continues its losing spell for the seventh trading session on Monday. The Loonie asset faces severe selling pressure due to sheer strength in global Oil prices on deepening supply issues.
West Texas Intermediate (WTI), futures on NYMEX, rose by more than 5% in last four trading sessions due to worsening geopolitical tensions and a temporary shutdown of Libya's largest oil field, Sharara amid civil unrest due to rising fuel prices, poor economic opportunity and unemployment.
Conflicts in the Middle East between Iran and Israel are expected to widen further as the latter prepares in anticipation of Iran’s retaliation for the assassination of the Hamas leader by an Israeli air strike in Tehran.
It is worth noting that Canada is the leading exporter of Oil to the United States (US) and higher Oil prices strengthen the Canadian Dollar (CAD).
Meanwhile, the market sentiment has improved as fears of a potential US recession have waned. S&P 500 futures have posted decent gains in European trading hours. The US Dollar Index (DXY), which tracks the Greenback’s value against six major currencies, trades sideways above 103.00.
This week, the US Dollar will be guided by the US Consumer Price Index (CPI) data for July, which will be published on Wednesday. The US CPI report is expected to that annual headline and core inflation has decelerated for the fourth month in a row. This will boost expectations of a big interest-rate cut announcement by the Federal Reserve (Fed).
Canadian Dollar FAQs
The key factors driving the Canadian Dollar (CAD) are the level of interest rates set by the Bank of Canada (BoC), the price of Oil, Canada’s largest export, the health of its economy, inflation and the Trade Balance, which is the difference between the value of Canada’s exports versus its imports. Other factors include market sentiment – whether investors are taking on more risky assets (risk-on) or seeking safe-havens (risk-off) – with risk-on being CAD-positive. As its largest trading partner, the health of the US economy is also a key factor influencing the Canadian Dollar.
The Bank of Canada (BoC) has a significant influence on the Canadian Dollar by setting the level of interest rates that banks can lend to one another. This influences the level of interest rates for everyone. The main goal of the BoC is to maintain inflation at 1-3% by adjusting interest rates up or down. Relatively higher interest rates tend to be positive for the CAD. The Bank of Canada can also use quantitative easing and tightening to influence credit conditions, with the former CAD-negative and the latter CAD-positive.
The price of Oil is a key factor impacting the value of the Canadian Dollar. Petroleum is Canada’s biggest export, so Oil price tends to have an immediate impact on the CAD value. Generally, if Oil price rises CAD also goes up, as aggregate demand for the currency increases. The opposite is the case if the price of Oil falls. Higher Oil prices also tend to result in a greater likelihood of a positive Trade Balance, which is also supportive of the CAD.
While inflation had always traditionally been thought of as a negative factor for a currency since it lowers the value of money, the opposite has actually been the case in modern times with the relaxation of cross-border capital controls. Higher inflation tends to lead central banks to put up interest rates which attracts more capital inflows from global investors seeking a lucrative place to keep their money. This increases demand for the local currency, which in Canada’s case is the Canadian Dollar.
Macroeconomic data releases gauge the health of the economy and can have an impact on the Canadian Dollar. Indicators such as GDP, Manufacturing and Services PMIs, employment, and consumer sentiment surveys can all influence the direction of the CAD. A strong economy is good for the Canadian Dollar. Not only does it attract more foreign investment but it may encourage the Bank of Canada to put up interest rates, leading to a stronger currency. If economic data is weak, however, the CAD is likely to fall.
- USD/JPY has pulled back after forming a market bottom on August 5.
- The move higher remains corrective, however, further upside could suggest a reversal.
USD/JPY is likely in a down trend on both a short and medium-term basis now. Given “the trend is your friend” this continues to suggest a bearish bias exists over a 6-month period. The long-term trend, however, remains bullish.
USD/JPY 4-hour Chart
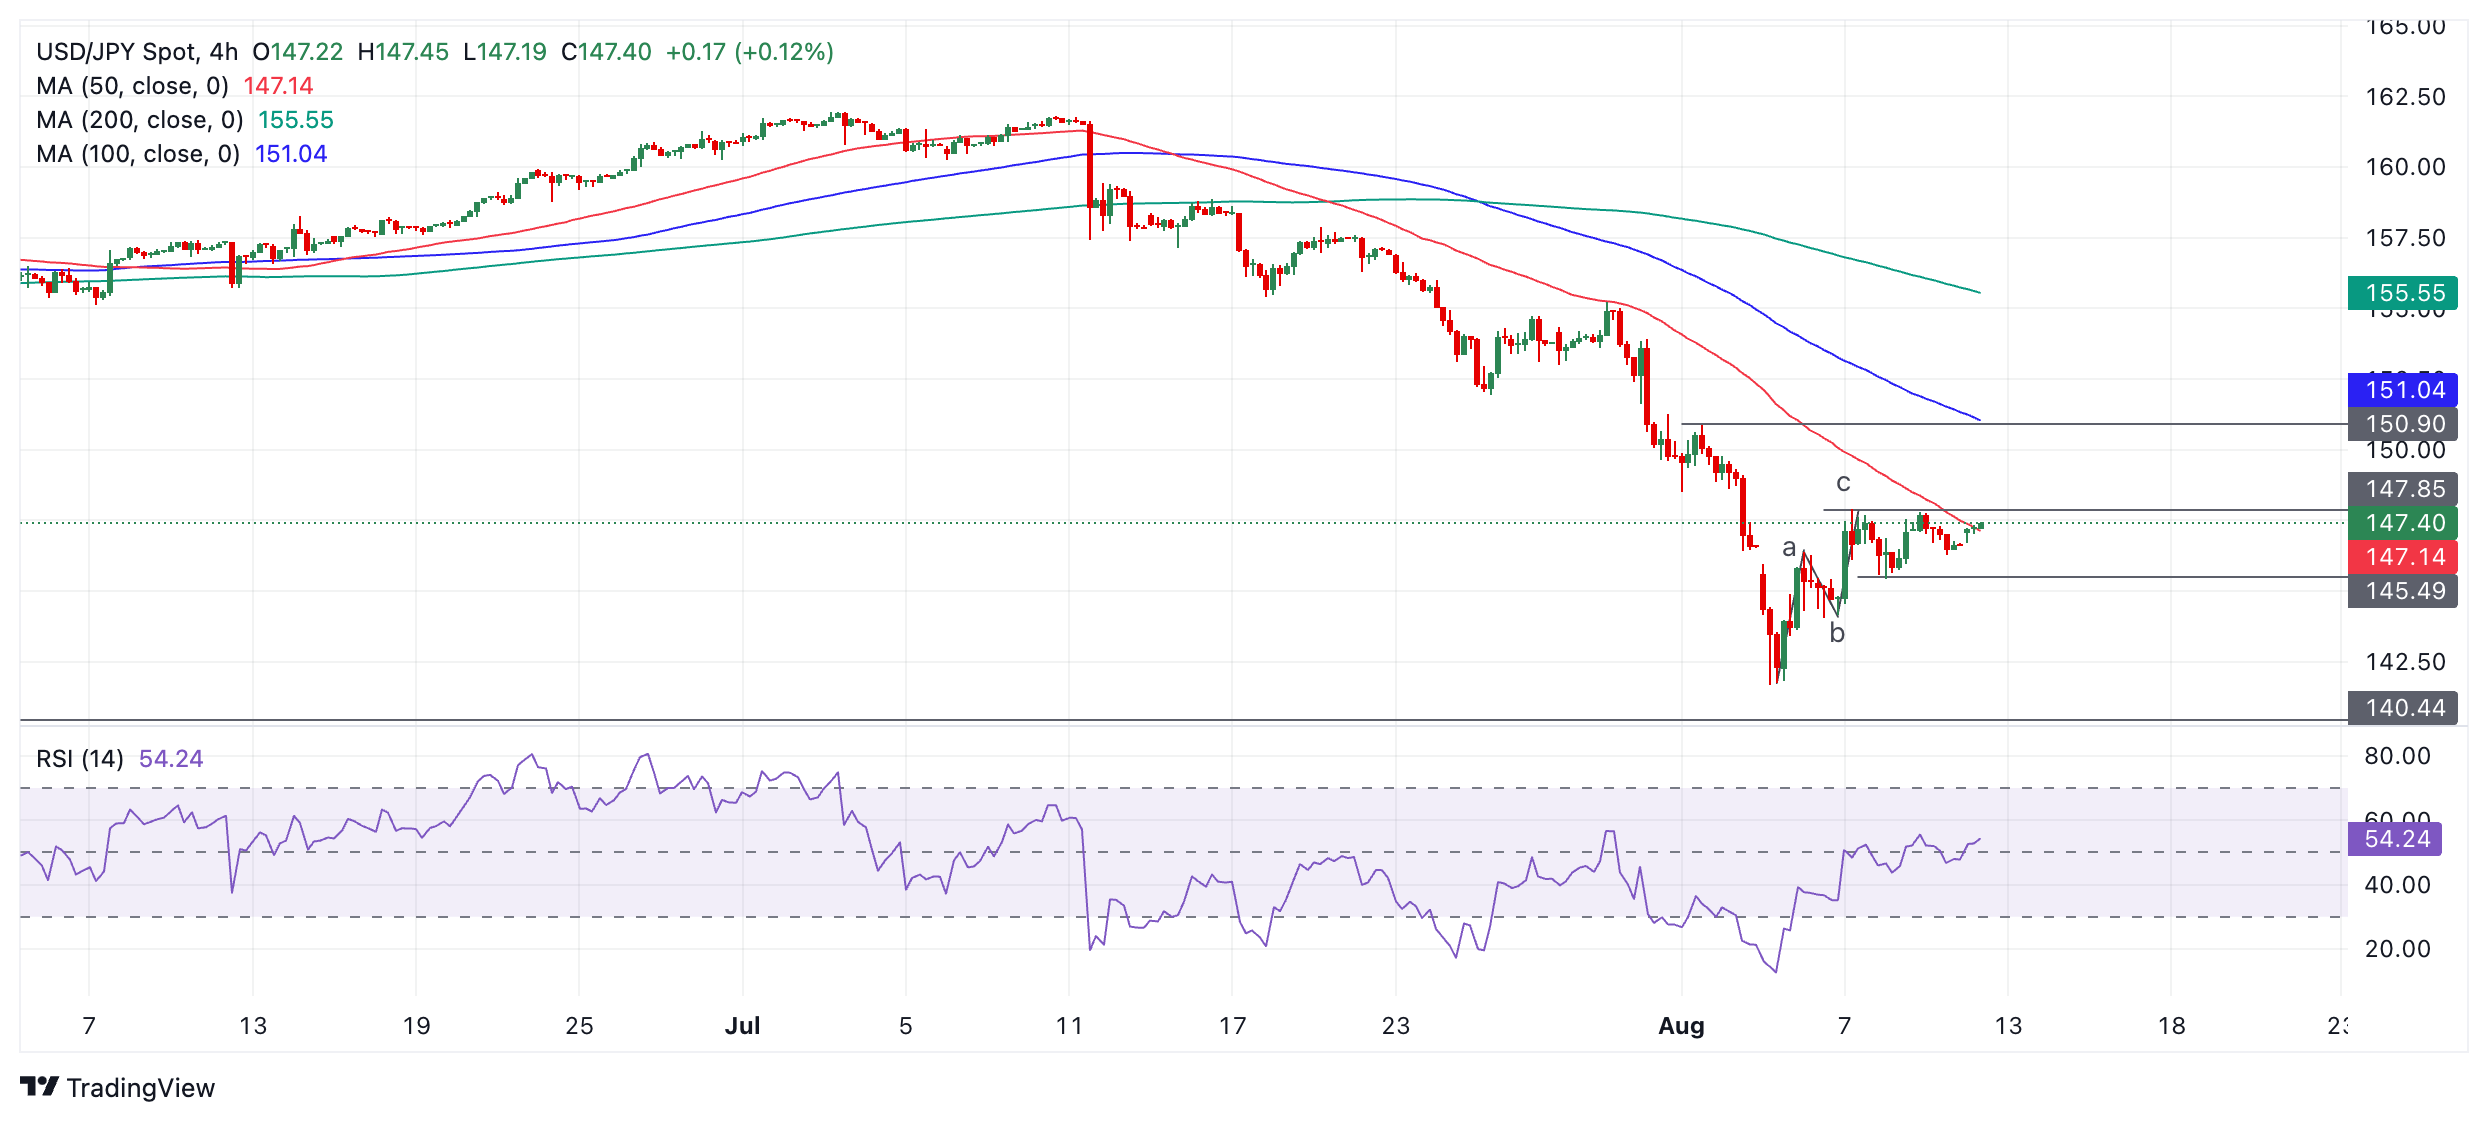
Currently the recovery from the August 5 lows looks only corrective in nature. A break below 145.43 would probably indicate the resumption of the dominant downtrend, with the next target at 141.69 (August 5 low). A break beneath that would produce a lower low, confirming the downtrend. Sturdy support at around 140.44, however, is likely to limit further weakness, at least temporarily.
There is a risk the trend is about to change on a short-term basis. A break above the 147.91 August 7 high would bring into doubt the validity of the short-term downtrend and suggest a possible reversal.
The pair has completed a standard abc correction after basing on August 5. A break above the highs of wave “c”, however, might indicate this correction was developing into something bigger, perhaps the start of a new uptrending move. Such a break might lead to a move up to 150.90.
- The US Dollar is flat to marginally gaining against most major peers.
- All eyes are on the US inflation print for July being released on Wednesday.
- The US Dollar index resides near a key level, and a substantial move could be seen later this week.
The US Dollar (USD) has a soft opening this week, with no real outliers on the quote board on Monday. Traders are taking a clean sheet and have deemed last week’s events as water under the bridge. All eyes will be on the US Consumer Price Index (CPI) for July, which is scheduled for Wednesday.
On the economic data front, it is a calm start to the week, with the US Treasury heading back to markets to auction some shorter-term bills. As such, it is nothing special, though with yields having moved quite a lot last week, traders and markets will be cautious if the bond market hits that snapping point when prices could collapse again. Besides the US CPI, the US Retail Sales data for July scheduled for Thursday will be the last important data point this week.
Daily digest market movers: Bond market pricing
- Although the week has started very calmly, the US Dollar is stronger by 0.5% against the Korean Won (KRW) and the Japanese Yen (JPY) in early European trading.
- Bloomberg reports that in a column on Friday, the People’s Bank of China (PBoC) reported that the PBoC will keep a close eye on the potential rate cuts from the US Federal Reserve (Fed) and will act accordingly to keep the Yuan (CNY) stable against the US Dollar (USD). That could mean substantial devaluations for the CNY once the US Dollar devalues on the back of interest rate cuts from the Fed in order to catch up on the move.
- At 15:30 GMT, the US Treasury will allocate a 3-month and a 6-month bill.
- The US Monthly Budget Statement for July is expected at 18:00 GMT. Expectations are for a deficit of $254.3 billion, coming from a $66 billion deficit.
- Equity markets are going for a calm start to the week. Most major indices are in the green by less than 0.5%.
- The CME Fedwatch Tool shows a 53.5% chance of a 25 basis points (bps) interest rate cut by the Fed in September against a 46.5% chance for a 50 bps. Another 25 bps cut (if September is a 25 bps cut) is expected in November by 42.1%, while a 48.0% chance for a 50 bps cut and 9.9% for a triple rate cut are being pencilled in for that meeting.
- The US 10-year benchmark rate trades at 3.96% after popping above 4.00% briefly on Thursday.
US Dollar Index Technical Analysis: Pivotal hold
The US Dollar Index (DXY) is still trading at that key level since last week, when itwas unable to close above it and continue its recovery. Everything will now depend on the inflation report on Wednesday to move the needle forward. Either the report is disinflationary, and the US Dollar eases further, or there is a pickup in inflation and September starts to look doubtful for an initial interest rate cut.
Still, the first level to recover, which gains importance every day, is 103.18, a level held on August 2 though snapped on August 5 in the Asian hours. Once the DXY closes above that level, next up is 104.00, which was the support from June. If the DXY can return above that level, the 200-day Simple Moving Average (SMA) at 104.15 is the next resistance to look out for.
On the downside, the oversold condition in the Relative Strength Index (RSI) indicator has eased in the daily chart and holds room again for a small leg lower. Support nearby is the March 8 low at 102.35. Once through there, pressure will start to build on 102.00 as a big psychological figure before testing 101.90, which was a pivotal level in December 2023 and January 2024.
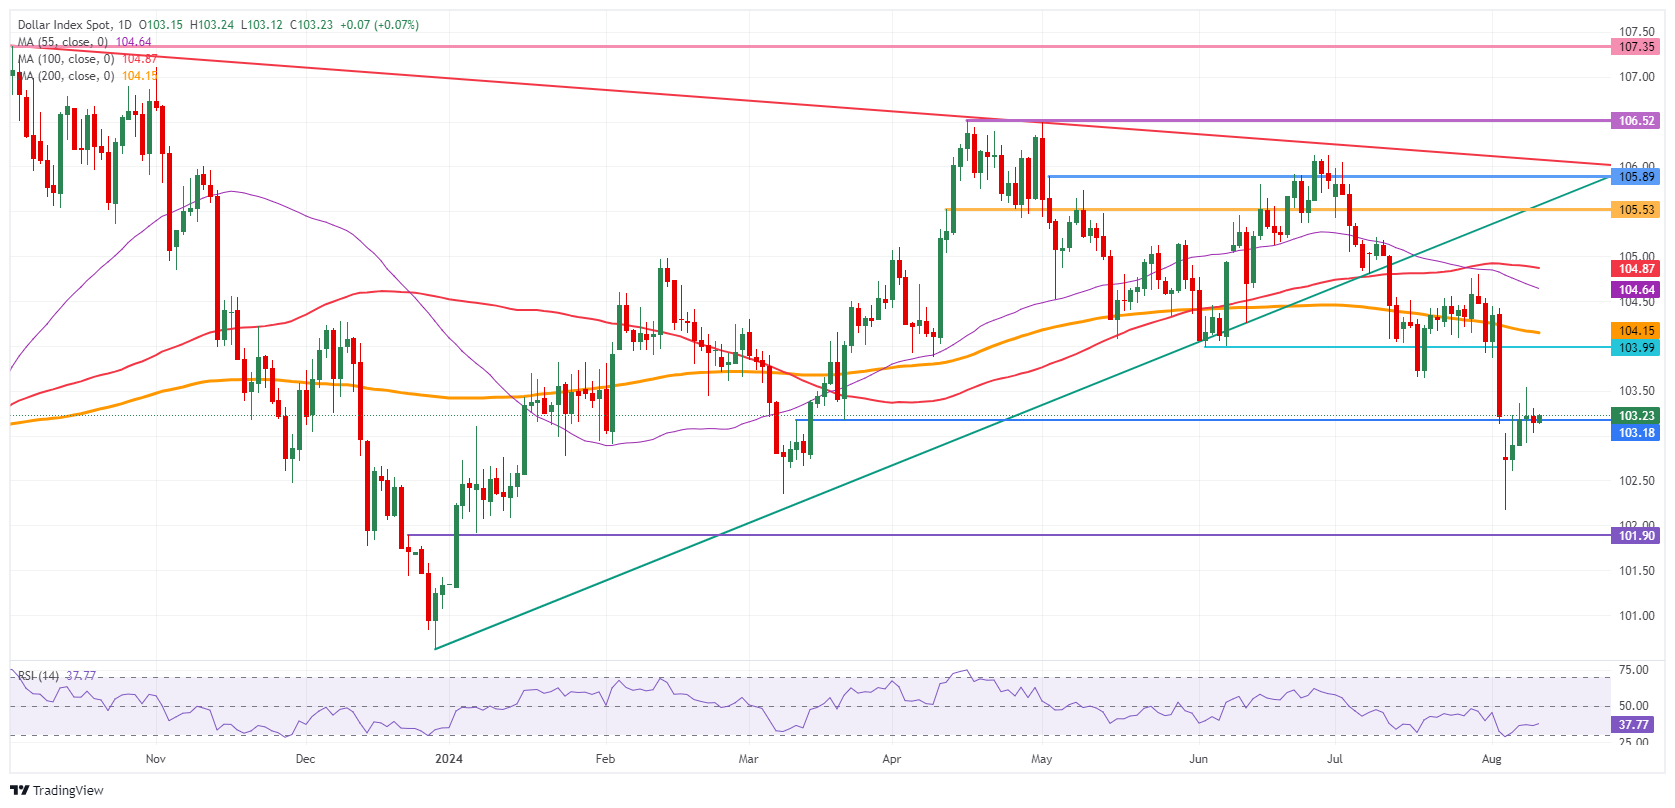
US Dollar Index: Daily Chart
US Dollar FAQs
The US Dollar (USD) is the official currency of the United States of America, and the ‘de facto’ currency of a significant number of other countries where it is found in circulation alongside local notes. It is the most heavily traded currency in the world, accounting for over 88% of all global foreign exchange turnover, or an average of $6.6 trillion in transactions per day, according to data from 2022. Following the second world war, the USD took over from the British Pound as the world’s reserve currency. For most of its history, the US Dollar was backed by Gold, until the Bretton Woods Agreement in 1971 when the Gold Standard went away.
The most important single factor impacting on the value of the US Dollar is monetary policy, which is shaped by the Federal Reserve (Fed). The Fed has two mandates: to achieve price stability (control inflation) and foster full employment. Its primary tool to achieve these two goals is by adjusting interest rates. When prices are rising too quickly and inflation is above the Fed’s 2% target, the Fed will raise rates, which helps the USD value. When inflation falls below 2% or the Unemployment Rate is too high, the Fed may lower interest rates, which weighs on the Greenback.
In extreme situations, the Federal Reserve can also print more Dollars and enact quantitative easing (QE). QE is the process by which the Fed substantially increases the flow of credit in a stuck financial system. It is a non-standard policy measure used when credit has dried up because banks will not lend to each other (out of the fear of counterparty default). It is a last resort when simply lowering interest rates is unlikely to achieve the necessary result. It was the Fed’s weapon of choice to combat the credit crunch that occurred during the Great Financial Crisis in 2008. It involves the Fed printing more Dollars and using them to buy US government bonds predominantly from financial institutions. QE usually leads to a weaker US Dollar.
Quantitative tightening (QT) is the reverse process whereby the Federal Reserve stops buying bonds from financial institutions and does not reinvest the principal from the bonds it holds maturing in new purchases. It is usually positive for the US Dollar.
The US Dollar (USD) is likely to trade in a sideways range of 7.1620/7.1900. Downward momentum is fading, and the likelihood of USD revisiting the 7.0635 support level has diminished, UOB Group FX analysts Quek Ser Leang and Peter Chia note.
A break above 7.1900 is possible near term
24-HOUR VIEW: “USD traded in a sideways range of 7.1639/7.1895 last Friday, closing largely unchanged at 7.1750 (+0.01%). Further sideways range trading seems likely today, probably in a range of 7.1620/7.1900.”
1-3 WEEKS VIEW: “We have held a negative USD view since late last month. After USD fell sharply to 7.0636 and rebounded, in our most recent narrative from last Tuesday (06 Aug, spot at 7.1400), we highlighted that while further USD weakness is not ruled out, the low near 7.0635 is solid support now. We added, ‘a breach of 7.2000 would mean that the weakness has stabilised.’ USD subsequently traded sideways for a few days, and downward momentum is fading. The likelihood of USD breaking below 7.0635 has diminished.”
The US Dollar (USD) is expected to trade in a range, likely between 146.30 and 147.70. Downward momentum is beginning to wane; a breach of 148.30 would mean the weakness in USD has stabilised, UOB Group FX analysts Quek Ser Leang and Peter Chia note.
USD bulls may try to test 147.70
24-HOUR VIEW: “Last Friday, USD fluctuated between 146.26 and 147.81, closing at 146.61 (-0.45%). The price action did not result in any increase in either upward or downward momentum. Today, USD is expected to trade in a range, likely between 146.30 and 147.70.”
1-3 WEEKS VIEW: “In our most recent narrative from last Monday (05 Aug, spot at 145.25), we noted that ‘the weakness in USD has not stabilised.’ We pointed out that ‘the next significant support level is some distance away at 140.80, but it remains to be seen if this level will come into view.’ USD subsequently dropped to 141.66 and then rebounded. Downward momentum is beginning to wane, and a breach of 148.30 (no change in ‘strong resistance’ level) would mean that the weakness in USD has stabilised.”
The New Zealand Dollar (NZD) must break clearly above 0.6035 before an advance to 0.6055 can be expected, UOB Group FX analysts Quek Ser Leang and Peter Chia note.
Bulls to test 0.6035 in short term
24-HOUR VIEW: “After testing the resistance level at 0.6035 last Friday, NZD pulled back, closing at 0.5997 (-0.30%). Upward pressure has faded, and the current price action is likely part of a sideways trading phase, probably between 0.5980 and 0.6020.”
1-3 WEEKS VIEW: “We highlighted last Tuesday (06 Aug, spot at 0.5975) that ‘the recent price action continues to suggest NZD could recover, possibly towards 0.6035.’ Our view was not wrong as NZD rose to 0.6035 last Friday and then pulled back. While NZD could continue to rise, it must break clearly above 0.6035 before an advance to 0.6055 can be expected. The chance of NZD breaking clearly above 0.6035 is not high for now, but it will remain intact as long as 0.5960 (‘strong support’ level previously at 0.5890) is not breached.”
There has been a slight increase in momentum; the Australian Dollar (AUD) must break clearly above 0.6600 before further advance can be expected, UOB Group FX analysts Quek Ser Leang and Peter Chia note.
AUD may use 0.6600 as a support
24-HOUR VIEW: “Last Friday, AUD rose to 0.6605 and then pulled back to close at 0.6571 (-0.32%). The pullback in overbought conditions and slowing momentum suggests the current price action is likely part of a consolidation phase, probably between 0.6545 and 0.6595.”
1-3 WEEKS VIEW: “In our latest narrative from last Tuesday (06 Aug, spot at 0.6510), we indicated that the AUD weakness from late last month had stabilised. We held the view that AUD ’is likely to trade in a 0.6400/0.6600 range for the time being.’ Last Friday, AUD briefly rose to 0.6605 and then pulled back. There has been a slight increase in upward momentum, but not sufficiently enough to suggest the start of a sustained advance. From here, AUD must break and remain above 0.6600 before further advance can be expected. The chance of AUD breaking clearly above 0.6600 will increase in the next few days provided that 0.6510 (‘strong support’ level) is not breached. Looking ahead, if AUD breaks clearly above 0.6600, the next level to watch is 0.6660.”
- EUR/GBP finds interim cushion near 0.8550 with investors focusing on the UK data.
- UK’s Average Earnings Excluding Bonuses are estimated to have declined to 4.6% from the prior release of 5.7%.
- EUR/GBP is on the verge of delivering a Falling Wedge breakout.
The EUR/GBP pair discovers a temporary support near 0.8550 in Monday’s European session after a two-day correction from a more than three-month high of 0.8625. The asset finds support as the Pound Sterling (GBP) gains strength, with investors focusing on the United Kingdom Employment data for three-months-ending July and the consumer inflation data for July, which will be published on Tuesday and Wednesday.
The economic data will indicate whether the Bank of England (BoE) will deliver subsequent rate cuts in September. From the UK Employment report, the ILO Unemployment Rate is expected to have increased to 4.5% from the prior release of 4.4%. Average Earnings Excluding Bonuses are estimated to have decelerated significantly to 4.6% from 5.7% in three-months ending May.
A higher jobless rate and slowing wage growth momentum would dampen the Pound Sterling’s appeal, as they will boost expectations of more BoE rate cuts.
Meanwhile, the next move in the Euro (EUR) will be influenced by market speculation for European Central Bank (ECB) rate cuts. In the last monetary policy meeting, ECB President Christine Lagarde announced a steady interest rate decision but kept doors for the September meeting widely open.
EUR/GBP gathers strength to deliver a breakout of the Falling Wedge chart pattern formation on a daily timeframe. A breakout of the same results in a bullish reversal. The 200-day Exponential Moving Average (EMA) near 0.8540 acts as a major cushion for the Euro bulls.
The 14-day Relative Strength Index (RSI) shifts inside the 60.00-80.00 range for the first time in more than three months. If the RSI sustains above 60.00, a bullish momentum will trigger.
More upside would appear if the asset breaks above August 8 high at 0.8625. This would drive the asset towards January 2 high at 0.8683, followed by 28 December 2023 high at 0.8615.
In an alternate scenario, a downside move below the psychological support of 0.8500 would expose the asset to August 2 low at 0.8466 and the round-level support of 0.8400.
EUR/GBP daily chart
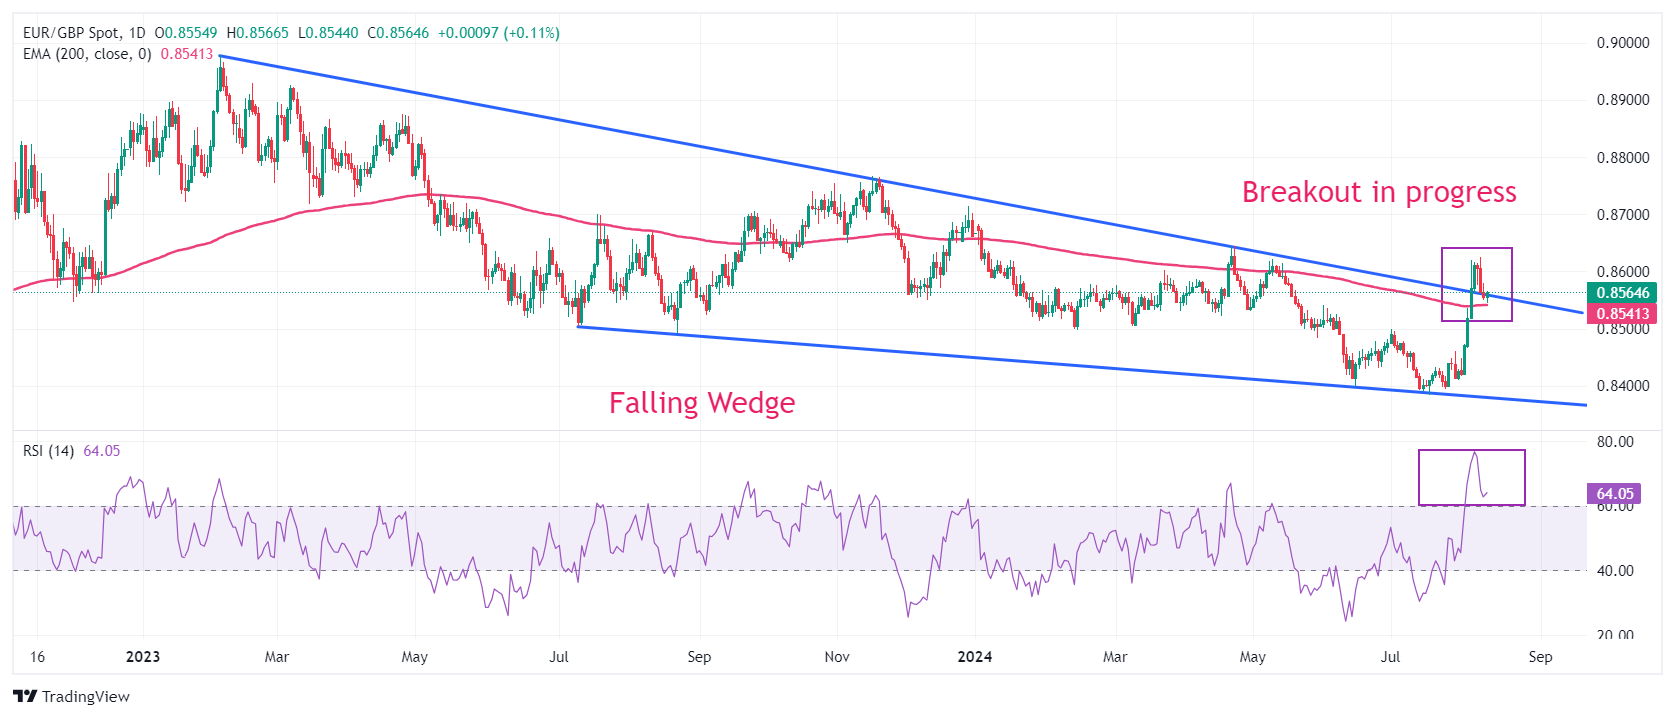
Economic Indicator
Average Earnings Excluding Bonus (3Mo/Yr)
The Average Earnings Excluding Bonus release is a key short-term indicator of how levels of pay are changing within the UK economy; it is released by the UK Office of National Statistics. It can be seen as a measure of growth in "basic pay". Generally, a positive result is seen as bullish for the Pound Sterling (GBP), whereas a low reading is seen as bearish.
Read more.Next release: Tue Aug 13, 2024 06:00
Frequency: Monthly
Consensus: 4.6%
Previous: 5.7%
Source: Office for National Statistics
The Pound Sterling (GBP) is expected to drift lower; given the mild downward pressure, any decline is unlikely to break the support at 1.2710, and the chance of GBP dropping below 1.2665 is low, UOB Group FX analysts Quek Ser Leang and Peter Chia note.
A sustained break below 1.2710 is unlikely
24-HOUR VIEW: “Last Friday, GBP traded in a range of 1.2727/1.2773, closing largely unchanged (1.2756, +0.04%). Despite the quiet price action, there has been a slight increase in downward momentum. Today, we expect GBP to drift lower. Given the mild downward pressure, any decline is unlikely to break the support at 1.2710. On the upside, resistance levels are at 1.2780 and 1.2800.”
1-3 WEEKS VIEW: “We turned negative in GBP late last month (see annotations in the chart below). After GBP fell to 1.2674, in our most recent narrative from last Wednesday (07 Aug, spot at 1.2690), we indicated that ‘the rejuvenated momentum indicates that the risk remains on the downside, and the levels to watch are 1.2645 and 1.2610.’ GBP subsequently dropped to 1.2665 and then rebounded strongly, reaching a high of 1.2773 last Friday. While our 'strong resistance’ level at 1.2780 has not been breached yet, downward momentum has eased considerably, and the chance of GBP dropping below 1.2665 is low. To look at it another way, if GBP breaches 1.2780, it would suggest that GBP has entered a consolidation phase.”
- Gold continues to edge higher as fears of an escalation of the Gaza conflict and falling interest-rate expectations support the metal.
- US inflation data out this week could color expectations of the trajectory for interest rates.
- The precious metal is trading in an up leg within a sideways trend, with a risk it could extend its trendless mode.
Gold (XAU/USD) trades in the $2,440s on Monday, clocking up a 0.45% gain from the previous day on a combination of safe-haven demand due to geopolitical risk and rising bets the Federal Reserve (Fed) will move to cut interest rates at its next meeting. The expectation of interest rates falling is positive for Gold since it lowers the opportunity cost of holding Gold which is a non-interest paying asset.
Gold rises on geopolitical risks and bets interest rates will fall
Gold is rising at the start of the trading week as fears the conflict in Gaza is about to escalate send investors into safe-haven assets. Israel is expecting Iran to mount a large-scale military attack on Israel, according to the Israeli Defence Minister, Yoav Gallant, as reported by Axios news. Such an attack would escalate the conflict substantially and threaten global stability.
The precious metal is further gaining traction as traders continue to bet on the Fed making cuts to its main interest rate, the fed funds rate, in September. The probability of a 0.25% cut in September stands at 49.5% and the chances of a 0.50% cut at 50.5%, according to the CME FedWatch Tool, which calculates the probability based on the price of 30-day fed funds futures.
US Consumer Price Index (CPI) data for July, to be released on Wednesday, and Producer Price Index (PPI) data on Tuesday could color expectations regarding future changes to interest rates. This in turn could impact Gold.
US CPI is expected to have risen by 0.2% in July compared with the previous month, both for headline and core. This comes after a 0.1% decline for headline in June (0.1% rise for core). If the real figure overshoots expectations, indicating sticky prices, it could bring into doubt the assumption the Fed will cut aggressively in September, hurting Gold price in the process.
PPI is forecast to have increased by 0.1% in July when figures are published on Tuesday, after a 0.2% gain in June.
Technical Analysis: Gold rises up within range
Gold is trading in a sideways trend, within which it is currently rising in an up leg. Given “the trend is your friend” it is expected to continue trading in a range until a significant breakout occurs in either direction. The range is narrowing, suggesting the possibility it might be forming a triangle pattern, but it is too early to say for sure.
XAU/USD 4-hour Chart
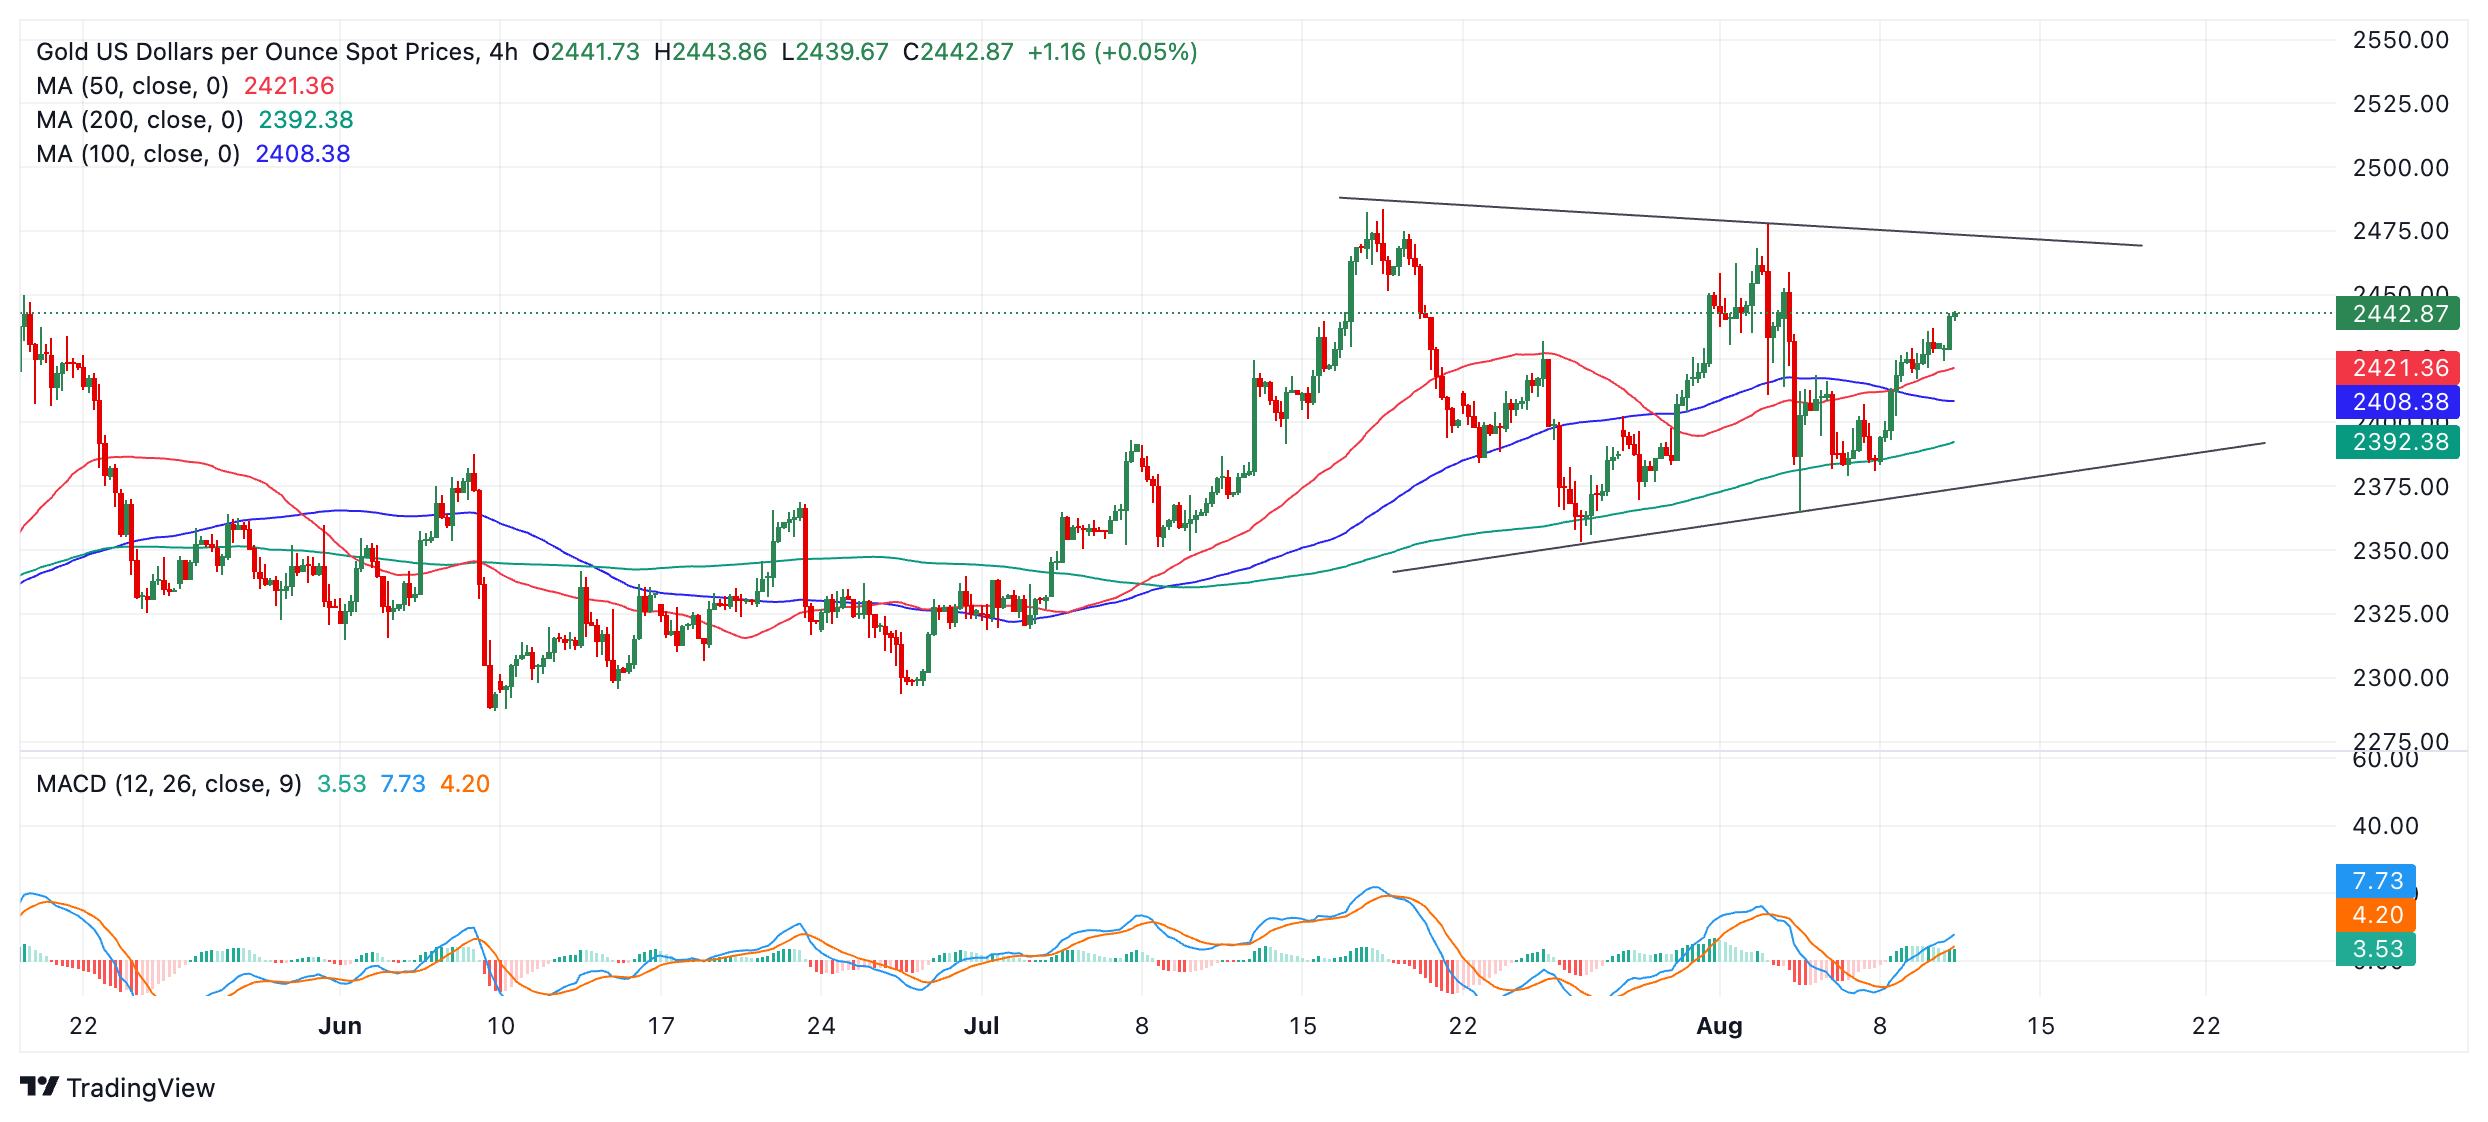
The move up within the range will probably continue until it reaches the range highs at roughly $2,475 before stalling.
A decisive break above the range ceiling would be required to indicate a more bullish trend was developing. Such a move would likely run up to at least $2,550, calculated by taking roughly the 0.618 Fibonacci ratio of the height of the range and extrapolating it higher.
A decisive break would be one characterized by a long green candle that pierced clearly through the level and closed near its high, or three green candles in a row that breached the level.
Gold FAQs
Gold has played a key role in human’s history as it has been widely used as a store of value and medium of exchange. Currently, apart from its shine and usage for jewelry, the precious metal is widely seen as a safe-haven asset, meaning that it is considered a good investment during turbulent times. Gold is also widely seen as a hedge against inflation and against depreciating currencies as it doesn’t rely on any specific issuer or government.
Central banks are the biggest Gold holders. In their aim to support their currencies in turbulent times, central banks tend to diversify their reserves and buy Gold to improve the perceived strength of the economy and the currency. High Gold reserves can be a source of trust for a country’s solvency. Central banks added 1,136 tonnes of Gold worth around $70 billion to their reserves in 2022, according to data from the World Gold Council. This is the highest yearly purchase since records began. Central banks from emerging economies such as China, India and Turkey are quickly increasing their Gold reserves.
Gold has an inverse correlation with the US Dollar and US Treasuries, which are both major reserve and safe-haven assets. When the Dollar depreciates, Gold tends to rise, enabling investors and central banks to diversify their assets in turbulent times. Gold is also inversely correlated with risk assets. A rally in the stock market tends to weaken Gold price, while sell-offs in riskier markets tend to favor the precious metal.
The price can move due to a wide range of factors. Geopolitical instability or fears of a deep recession can quickly make Gold price escalate due to its safe-haven status. As a yield-less asset, Gold tends to rise with lower interest rates, while higher cost of money usually weighs down on the yellow metal. Still, most moves depend on how the US Dollar (USD) behaves as the asset is priced in dollars (XAU/USD). A strong Dollar tends to keep the price of Gold controlled, whereas a weaker Dollar is likely to push Gold prices up.
The Euro (EUR) is likely to consolidate between 1.0895 and 1.0930. If EUR breaches 1.0875, it would mean that the likelihood of it rising to 1.1010 has faded, UOB Group FX analysts Quek Ser Leang and Peter Chia note.
The 1.0875 support is a bear magnet
24-HOUR VIEW: “EUR traded in a quiet manner between 1.0908 and 1.0931 last Friday, closing largely unchanged at 1.0916 (-0.02%). The price movements are likely part of a consolidation phase. Today, EUR is likely to trade between 1.0895 and 1.0930.”
1-3 WEEKS VIEW: “Last Monday (05 Aug, spot at 1.0905), we indicated that ‘there is a chance for EUR to advance further, and if it can break above 1.0950, it could trigger a rapid rise to 1.1000.’ After EUR broke above 1.0950 and soared to 1.1008, we indicated on 06 Aug (spot at 1.0955) that EUR ‘is still positive, but it has to surpass 1.1010 before further advance to 1.1070 can be expected.’ Since then, EUR has not been able to make further headway on the upside, trading mostly sideways. From here, if EUR breaches the ‘strong support’ at 1.0875 (level previously at 1.0865), it would mean the likelihood of it rising to 1.1010 has faded.”
- EUR/USD holds key support of 1.0900 with US inflation data in focus.
- Both US annual headline and core inflation are expected to have decelerated slightly in July.
- The ECB is expected to deliver two more interest-rate cuts this year.
EUR/USD stays in a tight range above the round-level support of 1.0900 in Monday’s European session. The major currency pair struggles for direction as investors look for fresh cues at the start of a busy data week that will likely indicate how much the Federal Reserve (Fed) will cut interest rates in September.
For fresh interest rate cues, investors mainly await the United States (US) Consumer Price Index (CPI) data for July, which will be published on Wednesday. Economists expect that monthly headline and core inflation, which strips off volatile food and energy prices, rose by 0.2%. Annual headline and core CPI are estimated to have decelerated by one-tenth to 2.9% and 3.2%, respectively.
Currently, the Fed is widely anticipated to start reducing its key borrowing rates in September as Fed policymakers seem to have become confident that price pressures are on track to return to the desired rate of 2%. Also, officials have acknowledged that downside risks have now emerged for the labor market.
According to the CME FedWatch tool, 30-day Federal Funds Futures pricing data shows that traders see a 46.5% chance that interest rates will be reduced by 50 basis points (bps) in September, significantly from the 85% recorded a week ago. The expectations for a big Fed rate-cut have waned as fears of potential US recession have eased.
Also, Fed officials have clarified that the size and timing of rate cuts will be driven by the economic data and not by the recent turmoil in equity markets.
Daily digest market movers: EUR/USD trades sideways in countdown to US Inflation
- EUR/USD continues to trade sideways above the round-level support of 1.0900. The major currency pair remains in a tight range from the last week amid absence of Eurozone top-tier economic data. This week, the Eurozone economic calendar will report the revised estimates of flash Q2 Gross Domestic Product (GDP) and preliminary Employment Change data, which will be published on Wednesday.
- According to the expectations, the Eurozone economy expanded by 0.3% on quarter, in line with flash figures and the growth rate recorded in the first quarter of this year. Meanwhile, the Employment Change, a percentage measure that shows an increase in fresh payrolls, is expected to rise at a slower pace of 0.2% from the prior release of 0.3%.
- Strong GDP and employment numbers are favorable for the Euro (EUR) as they reduce the chances of further policy easing by the European Central Bank (ECB). The ECB has already pivoted to policy normalization and investors look for cues that could suggest how far the central bank will take its key borrowing rates down.
- Currently, financial markets expect that the ECB will cut interest-rate cuts two more times this year Last week, Finnish ECB policymaker Olli Rehn said, “Rate cuts would help the eurozone economy recover, in particular the "fragile" industrial growth and subdued investments,” Reuters reported.
Technical Forecast: EUR/USD holds key 200-day EMA
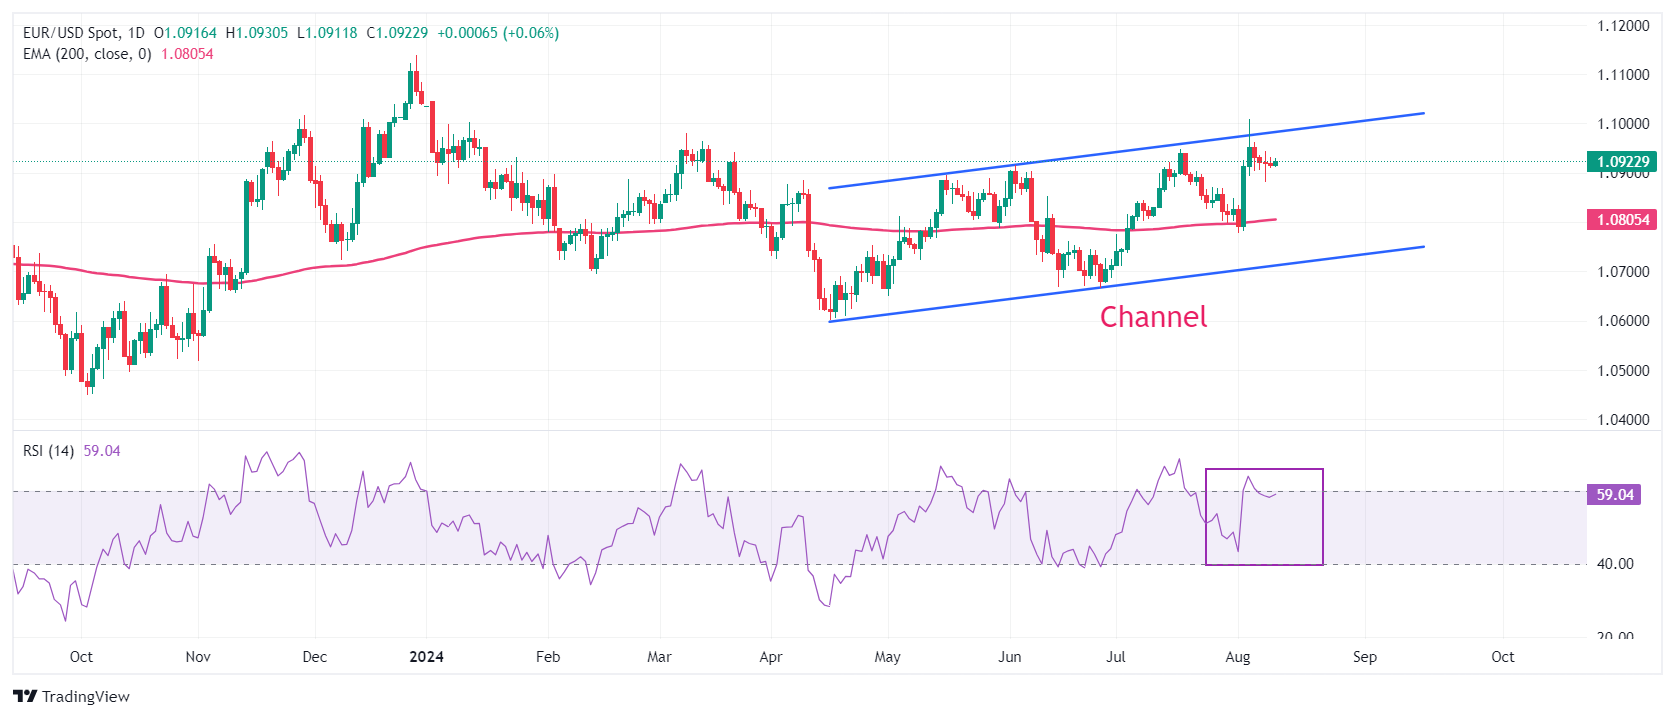
EUR/USD trades close to near the upper boundary of the Channel formation on a daily time frame. A breakout of an aforementioned chart pattern results in wider ticks on the upside and heavy volume. The 200-day Exponential Moving Average (EMA) near 1.0800 has acted as major support for the Euro bulls.
The 14-day Relative Strength Index (RSI) returns inside the 40.00-60.00 range, remaining close to its upper boundary. If the RSI sustains above 60.00, a bullish momentum will trigger.
More upside would appear if the major currency pair breaks above August 5 high of 1.1009. This would drive the asset towardsAugust 10, 2023, high at 1.1065, followed by the round-level resistance of 1.1100.
In an alternate scenario, a downside move below August 1 low at 1.0777 would drag the asset toward February low near 1.0700. A breakdown below the latter would expose the asset to June 14 low at 1.0667.
Euro FAQs
The Euro is the currency for the 20 European Union countries that belong to the Eurozone. It is the second most heavily traded currency in the world behind the US Dollar. In 2022, it accounted for 31% of all foreign exchange transactions, with an average daily turnover of over $2.2 trillion a day. EUR/USD is the most heavily traded currency pair in the world, accounting for an estimated 30% off all transactions, followed by EUR/JPY (4%), EUR/GBP (3%) and EUR/AUD (2%).
The European Central Bank (ECB) in Frankfurt, Germany, is the reserve bank for the Eurozone. The ECB sets interest rates and manages monetary policy. The ECB’s primary mandate is to maintain price stability, which means either controlling inflation or stimulating growth. Its primary tool is the raising or lowering of interest rates. Relatively high interest rates – or the expectation of higher rates – will usually benefit the Euro and vice versa. The ECB Governing Council makes monetary policy decisions at meetings held eight times a year. Decisions are made by heads of the Eurozone national banks and six permanent members, including the President of the ECB, Christine Lagarde.
Eurozone inflation data, measured by the Harmonized Index of Consumer Prices (HICP), is an important econometric for the Euro. If inflation rises more than expected, especially if above the ECB’s 2% target, it obliges the ECB to raise interest rates to bring it back under control. Relatively high interest rates compared to its counterparts will usually benefit the Euro, as it makes the region more attractive as a place for global investors to park their money.
Data releases gauge the health of the economy and can impact on the Euro. Indicators such as GDP, Manufacturing and Services PMIs, employment, and consumer sentiment surveys can all influence the direction of the single currency. A strong economy is good for the Euro. Not only does it attract more foreign investment but it may encourage the ECB to put up interest rates, which will directly strengthen the Euro. Otherwise, if economic data is weak, the Euro is likely to fall. Economic data for the four largest economies in the euro area (Germany, France, Italy and Spain) are especially significant, as they account for 75% of the Eurozone’s economy.
Another significant data release for the Euro is the Trade Balance. This indicator measures the difference between what a country earns from its exports and what it spends on imports over a given period. If a country produces highly sought after exports then its currency will gain in value purely from the extra demand created from foreign buyers seeking to purchase these goods. Therefore, a positive net Trade Balance strengthens a currency and vice versa for a negative balance.
- The US Dollar Index may reverse its trend if it moves toward the narrower part of the descending wedge.
- The momentum indicator MACD suggests a bearish trend for the US Dollar.
- The nine-day EMA at 103.39 level could act as an immediate barrier.
The US Dollar Index (DXY) retraces its recent losses from the previous session, trading around 103.20 during the European hours on Monday. The daily chart analysis shows the pair is consolidating within a descending wedge, indicating a bearish bias. A move toward the narrower part of the descending wedge could suggest a potential trend reversal.
The Moving Average Convergence Divergence (MACD) indicator points to bearish momentum, with the MACD line below both the signal line and the centerline. A convergence of the MACD line below the signal line would suggest a potential weakening of the bearish momentum for the US Dollar Index.
Additionally, the 14-day Relative Strength Index (RSI) consolidates above the 30 level, hinting at a possible upcoming correction. A further rise toward the 50 level would suggest a weakening of the bearish outlook.
On the downside, US Dollar (USD) may test key support at the lower edge of the descending wedge around the level of 102.90. A break below this level could increase downward pressure, potentially guiding the US Dollar Index to retest a six-month low at 102.17, recorded on August 5.
For resistance, the DXY may face an immediate barrier around the nine-day Exponential Moving Average (EMA) at 103.39 level, followed by the upper boundary of the descending wedge around 103.60 level. A breakout above this level could propel the index to retest a six-week high at 104.80, marked on July 30.
US Dollar Index: Daily Chart
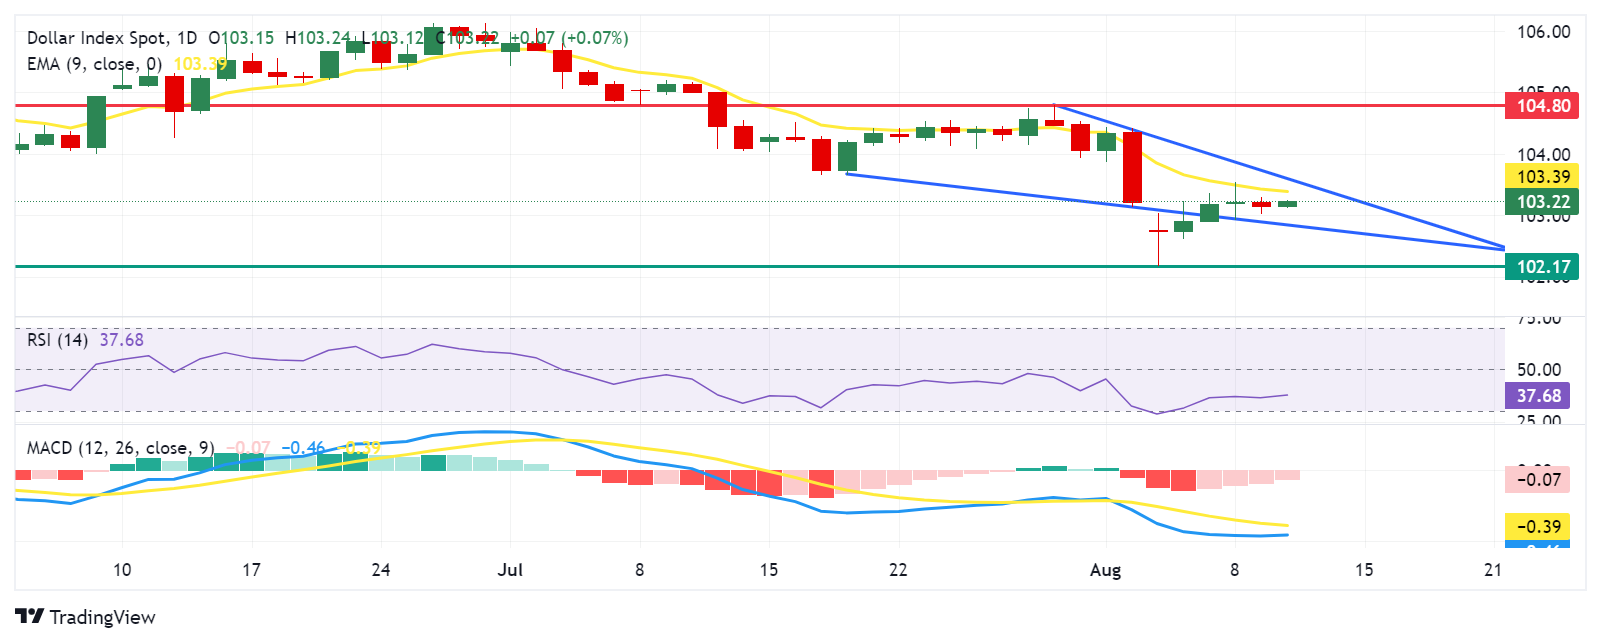
US Dollar PRICE Today
The table below shows the percentage change of US Dollar (USD) against listed major currencies today. US Dollar was the strongest against the Japanese Yen.
| USD | EUR | GBP | JPY | CAD | AUD | NZD | CHF | |
|---|---|---|---|---|---|---|---|---|
| USD | -0.06% | 0.07% | 0.44% | -0.06% | -0.33% | -0.43% | 0.42% | |
| EUR | 0.06% | 0.15% | 0.47% | -0.01% | -0.40% | -0.38% | 0.49% | |
| GBP | -0.07% | -0.15% | 0.58% | -0.15% | -0.55% | -0.53% | 0.31% | |
| JPY | -0.44% | -0.47% | -0.58% | -0.48% | -0.83% | -0.86% | -0.07% | |
| CAD | 0.06% | 0.01% | 0.15% | 0.48% | -0.33% | -0.37% | 0.47% | |
| AUD | 0.33% | 0.40% | 0.55% | 0.83% | 0.33% | 0.02% | 0.86% | |
| NZD | 0.43% | 0.38% | 0.53% | 0.86% | 0.37% | -0.02% | 0.84% | |
| CHF | -0.42% | -0.49% | -0.31% | 0.07% | -0.47% | -0.86% | -0.84% |
The heat map shows percentage changes of major currencies against each other. The base currency is picked from the left column, while the quote currency is picked from the top row. For example, if you pick the US Dollar from the left column and move along the horizontal line to the Japanese Yen, the percentage change displayed in the box will represent USD (base)/JPY (quote).
- NZD/USD regains strong positive traction and draws support from a combination of factors.
- Reduced bets for a rate cut by RBNZ and a positive risk tone lend some support to the Kiwi.
- Dovish Fed expectations keep the USD bulls on the defensive and contribute to the move up.
- Investors now look to the RBNZ on Wednesday and the US inflation figures for a fresh impetus.
The NZD/USD pair attracts fresh buyers following an intraday dip to levels below the 0.6000 psychological mark and sticks to its intraday gains through the early part of the European session on Monday. Spot prices currently trade around the 0.6025 area, just a few pips below a three-week top touched on Friday, as traders look to this week's central bank event risk and the crucial US inflation figures for a fresh impetus.
The Reserve Bank of New Zealand (RBNZ) is scheduled to announce its policy decision on Wednesday. From the US, investors will confront the release of the Producer Price Index (PPI) on Tuesday and the Consumer Price Index (CPI) on Wednesday, which might influence expectations about the Federal Reserve's (Fed) policy path. This, in turn, will drive the US Dollar (USD) demand in the near term and provide some meaningful impetus to the NZD/USD pair.
In the meantime, the New Zealand Dollar (NZD) might continue to draw support from last week's better-than-expected jobs report, which lowered the likelihood of a rate cut by the RBNZ. The USD, on the other hand, is undermined by bets for a bigger rate cut of 50 basis points (bps) by the Fed in September. Apart from this, a positive tone around the equity markets turns out to be another factor weighing on the safe-haven buck and benefiting the risk-sensitive Kiwi.
It, however, remains to be seen if bulls can capitalize on the move amid persistent worries about the slowing Chinese economy, which tends to dent demand for antipodean currencies, including the Kiwi. Nevertheless, the recent price action, along with the bearish sentiment surrounding the USD, suggests that the path of least resistance for the NZD/USD pair is to the upside. Hence, any meaningful pullback might be seen as a buying opportunity and remain limited.
Economic Indicator
RBNZ Interest Rate Decision
The Reserve Bank of New Zealand (RBNZ) announces its interest rate decision after its seven scheduled annual policy meetings. If the RBNZ is hawkish and sees inflationary pressures rising, it raises the Official Cash Rate (OCR) to bring inflation down. This is positive for the New Zealand Dollar (NZD) since higher interest rates attract more capital inflows. Likewise, if it reaches the view that inflation is too low it lowers the OCR, which tends to weaken NZD.
Read more.Next release: Wed Aug 14, 2024 02:00
Frequency: Irregular
Consensus: 5.5%
Previous: 5.5%
Source: Reserve Bank of New Zealand
The Reserve Bank of New Zealand (RBNZ) holds monetary policy meetings seven times a year, announcing their decision on interest rates and the economic assessments that influenced their decision. The central bank offers clues on the economic outlook and future policy path, which are of high relevance for the NZD valuation. Positive economic developments and upbeat outlook could lead the RBNZ to tighten the policy by hiking interest rates, which tends to be NZD bullish. The policy announcements are usually followed by Governor Adrian Orr’s press conference.
- Silver prices edge higher as tensions in the Middle East drive traders to seek safe-haven assets.
- The Israel Defense Forces intercepted approximately 30 "projectiles" crossing from Lebanon early Monday.
- The diminished odds of a 50-basis point rate cut by the Fed in September may weaken non-yielding assets like Silver.
Silver price (XAG/USD) rises to near $28.00 per troy ounce during the European session on Monday. The rising geopolitical tensions in the Middle East contribute support for the safe-haven metals like Silver.
Israel Defense Forces (IDF) intercepted around 30 "projectiles" crossing from Lebanon into northern Israel early Monday. The IDF stated that some projectiles landed in open areas, and no injuries were reported, as reported by ABC News.
Additionally, Reuters cited Gaza Civil Emergency Service on Saturday, the Israeli incursion into Gaza escalated with an airstrike targeting a school compound, leading to at least 90 fatalities. However, Israel has contested this casualty figure, labeling it as exaggerated. Meanwhile, Hamas has expressed uncertainty about engaging in new ceasefire negotiations on Sunday.
Last week’s upbeat US economic data led traders to reduce their expectations for a 50-basis point interest rate cut by the US Federal Reserve in September. The CME FedWatch Tool indicates a 46.5% chance of a two-quarter-basis point rate cut by the Fed at the September meeting, a significant decrease from the 74.0% probability reported a week ago. The expectations of prolonging higher interest rates may put pressure on non-yielding assets like Silver.
Meanwhile, Bloomberg reported on Sunday that Federal Reserve Governor Michelle Bowman stating to continues seeing upside risks for inflation and ongoing strength in the labor market. Bowman suggested that the Federal Reserve may not be prepared to cut rates at its next meeting in September.
The weak outlook for global manufacturing activity has dampened demand for Silver as an industrial input. The ISM PMI dropped more than expected, highlighting the sluggish factory momentum in the US. Traders are likely to focus on US producer inflation data due on Tuesday and consumer inflation figures on Wednesday, looking for confirmation that price growth remains stable.
Silver FAQs
Silver is a precious metal highly traded among investors. It has been historically used as a store of value and a medium of exchange. Although less popular than Gold, traders may turn to Silver to diversify their investment portfolio, for its intrinsic value or as a potential hedge during high-inflation periods. Investors can buy physical Silver, in coins or in bars, or trade it through vehicles such as Exchange Traded Funds, which track its price on international markets.
Silver prices can move due to a wide range of factors. Geopolitical instability or fears of a deep recession can make Silver price escalate due to its safe-haven status, although to a lesser extent than Gold's. As a yieldless asset, Silver tends to rise with lower interest rates. Its moves also depend on how the US Dollar (USD) behaves as the asset is priced in dollars (XAG/USD). A strong Dollar tends to keep the price of Silver at bay, whereas a weaker Dollar is likely to propel prices up. Other factors such as investment demand, mining supply – Silver is much more abundant than Gold – and recycling rates can also affect prices.
Silver is widely used in industry, particularly in sectors such as electronics or solar energy, as it has one of the highest electric conductivity of all metals – more than Copper and Gold. A surge in demand can increase prices, while a decline tends to lower them. Dynamics in the US, Chinese and Indian economies can also contribute to price swings: for the US and particularly China, their big industrial sectors use Silver in various processes; in India, consumers’ demand for the precious metal for jewellery also plays a key role in setting prices.
Silver prices tend to follow Gold's moves. When Gold prices rise, Silver typically follows suit, as their status as safe-haven assets is similar. The Gold/Silver ratio, which shows the number of ounces of Silver needed to equal the value of one ounce of Gold, may help to determine the relative valuation between both metals. Some investors may consider a high ratio as an indicator that Silver is undervalued, or Gold is overvalued. On the contrary, a low ratio might suggest that Gold is undervalued relative to Silver.
- AUD/USD regains positive traction and climbs back closer to a multi-week top touched on Friday.
- The RBA’s hawkish stance and a positive risk tone turn out to be key factors benefiting the Aussie.
- China’s economic woes could act as a headwind ahead of the US inflation figures later this week.
The AUD/USD pair catches fresh bids during the early part of the European session and climbs back closer to a two-and-half-week top touched on Friday. Spot prices currently trade around the 0.6600 round-figure mark, with bulls looking to build on the momentum beyond the technically significant 200-day Simple Moving Average (SMA).
The Australian Dollar (AUD) continues to draw support from the Reserve Bank of Australia's (RBA) stance, showing readiness to hike interest rates further to combat still sticky inflation. In fact, RBA Governor Michele Bullock last week emphasized the need to stay vigilant about inflation risks and said that the central bank will not hesitate to tighten monetary policy again if needed. This, along with a generally positive tone around the equity markets, turns out to be another factor benefiting the risk-sensitive Aussie.
The US Dollar (USD), on the other hand, struggles to attract any meaningful buying in the wake of bets for bigger interest rate cuts by the Federal Reserve (Fed). This provides an additional boost to the AUD/USD pair and remains supportive of the move up. That said, persistent worries about an economic downturn might hold back traders from placing aggressive bullish bets around the China-proxy AUD. Traders might also prefer to wait on the sidelines ahead of this week's release of US inflation figures.
The US Producer Price Index (PPI) is due on Tuesday, which will be followed by the Consumer Price Index (CPI) on Wednesday. This week's US economic docket also features the release of monthly Retail Sales figures. The crucial data will influence market expectations about the Fed's future policy decisions, which, in turn, will drive the USD demand and provide a fresh directional impetus to the AUD/USD pair. In the meantime, the fundamental backdrop favors bulls and supports prospects for additional gains.
RBA FAQs
The Reserve Bank of Australia (RBA) sets interest rates and manages monetary policy for Australia. Decisions are made by a board of governors at 11 meetings a year and ad hoc emergency meetings as required. The RBA’s primary mandate is to maintain price stability, which means an inflation rate of 2-3%, but also “..to contribute to the stability of the currency, full employment, and the economic prosperity and welfare of the Australian people.” Its main tool for achieving this is by raising or lowering interest rates. Relatively high interest rates will strengthen the Australian Dollar (AUD) and vice versa. Other RBA tools include quantitative easing and tightening.
While inflation had always traditionally been thought of as a negative factor for currencies since it lowers the value of money in general, the opposite has actually been the case in modern times with the relaxation of cross-border capital controls. Moderately higher inflation now tends to lead central banks to put up their interest rates, which in turn has the effect of attracting more capital inflows from global investors seeking a lucrative place to keep their money. This increases demand for the local currency, which in the case of Australia is the Aussie Dollar.
Macroeconomic data gauges the health of an economy and can have an impact on the value of its currency. Investors prefer to invest their capital in economies that are safe and growing rather than precarious and shrinking. Greater capital inflows increase the aggregate demand and value of the domestic currency. Classic indicators, such as GDP, Manufacturing and Services PMIs, employment, and consumer sentiment surveys can influence AUD. A strong economy may encourage the Reserve Bank of Australia to put up interest rates, also supporting AUD.
Quantitative Easing (QE) is a tool used in extreme situations when lowering interest rates is not enough to restore the flow of credit in the economy. QE is the process by which the Reserve Bank of Australia (RBA) prints Australian Dollars (AUD) for the purpose of buying assets – usually government or corporate bonds – from financial institutions, thereby providing them with much-needed liquidity. QE usually results in a weaker AUD.
Quantitative tightening (QT) is the reverse of QE. It is undertaken after QE when an economic recovery is underway and inflation starts rising. Whilst in QE the Reserve Bank of Australia (RBA) purchases government and corporate bonds from financial institutions to provide them with liquidity, in QT the RBA stops buying more assets, and stops reinvesting the principal maturing on the bonds it already holds. It would be positive (or bullish) for the Australian Dollar.
- The Mexican Peso is edging higher in key pairs, extending its three-day rally.
- Fears the US economy is entering a recession caused market turmoil last week, but these are subsiding, helping MXN.
- From a technical perspective, USD/MXN is correcting within a broadly uptrending market.
The Mexican Peso (MXN) makes marginal gains against key counterparts at the start of the new trading week amid the return of the risk appetite in the market.
Asian markets rose after being handed the baton from Wall Street’s rebound on Friday. The recovery stops the dramatic sell-off last week, sparked by fears of a recession in the US. These fears appear to be ebbing – a factor that is supporting the Peso.
At the time of writing, one US Dollar (USD) buys 18.81 Mexican Pesos, EUR/MXN trades at 20.54, and GBP/MXN at 24.00.
Mexican Peso recovers after market turmoil subsides
The Mexican Peso edges higher after posting three up days in a row in its most heavily traded pairs.
MXN is sensitive to market volatility and its recent recovery comes after fears of a US recession dissipated and investors regained their appetite for risk.
The most recent significant event for the Peso was the Banxico meeting last Thursday. This saw the central bank reducing its key interest rate by 0.25% to 10.75% in response to core inflation in Mexico declining from 4.05% to 4.00% in July. This contrasts with rising headline inflation – from 5.10% to 5.57% – although factors driving up the broader gauge are considered temporary.
The move had a negative effect on the Mexican Peso that ran counter to expectations. Usually, lower interest rates are negative for a currency as they reduce its attractiveness to foreign investors as a place to park capital, however, on this occasion the opposite was the case. The rate cut also came as a surprise to market participants.
That said, analysts believe demand for the Mexican Peso may be declining overall due to reduced carry-trade flows. The MXN has benefited from demand from carry traders using Yen-funded loans to purchase Pesos because of the high interest rates offered in Mexico. However, this could be less of a factor going forward.
“We doubt the exuberance over the Yen-funded carry trade will resume any time soon and lead the Peso to revisit its highs reached earlier this year,” says Giulia Bellicoso, Assistant Economist at Capital Economics.
In addition, Bellicoso adds that the Peso is now also “closer to what we think its fair value is.”
Technical Analysis: USD/MXN corrects uptrend
USD/MXN is falling within an upward channel on the 4-hour chart, suggesting it is in a corrective short-term down move within a longer-term uptrend.
USD/MXN 4-hour Chart
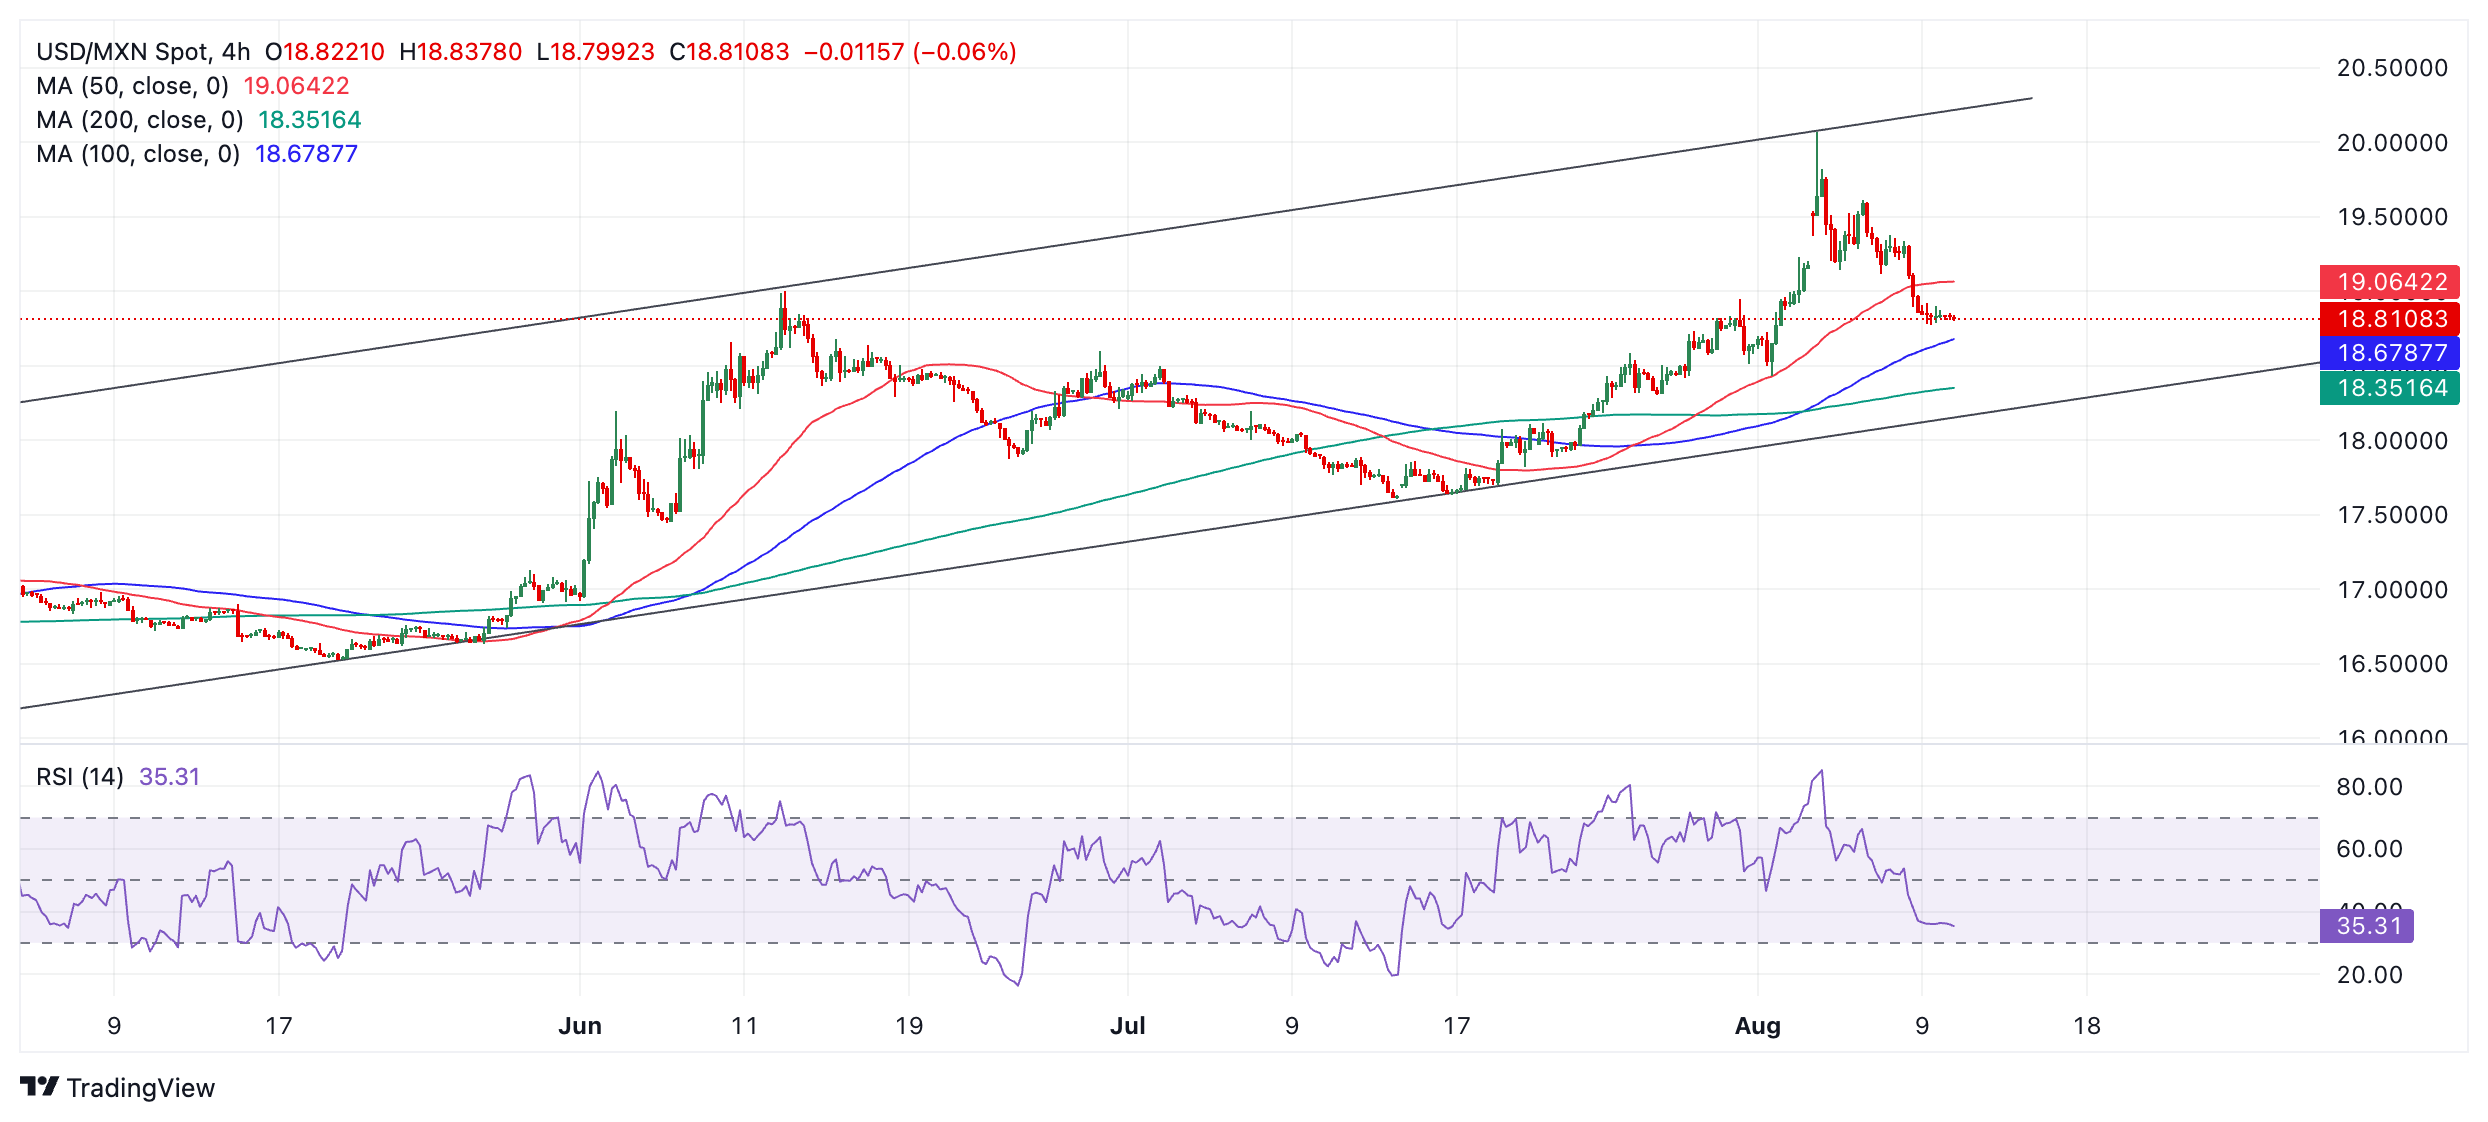
The decline is probably a correction of the broader bullish trend, which will eventually peter out before a recovery.
A break below Friday’s low of 18.77 would confirm more downside towards a target at 18.44 (August 1 low), followed by 18.35 and the 200-period Simple Moving Average (SMA). The lower channel line will likely provide solid support at roughly 18.30, too.
The Relative Strength Index (RSI) is nearing oversold but still above, further suggesting more declines are possible before the down move becomes overextended.
Economic Indicator
Central Bank Interest Rate
The Bank of Mexico announces a key interest rate which affects the whole range of interest rates set by commercial banks, building societies and other institutions for their own savers and borrowers. Generally speaking, if the central bank is hawkish about the inflationary outlook of the economy and rises the interest rates it is positive, or bullish, for the Mexican Peso.
Read more.Last release: Thu Aug 08, 2024 19:00
Frequency: Irregular
Actual: 10.75%
Consensus: 11%
Previous: 11%
Source: Banxico
- GBP/JPY gains ground as the UK key economic data loom this week.
- BoE policymaker Catherine Mann expressed that UK wage growth remains a concern for inflation.
- The upside of the GBP/JPY cross could be limited due to safe-haven flows amid increased Middle East tensions.
GBP/JPY edges higher to near 187.90 during the European session, following thin trading as the Japanese market observed Mountain Day on Monday. Traders are now awaiting the release of monthly UK employment data on Tuesday, followed by consumer inflation figures on Wednesday. These economic reports could offer new insights into the UK’s economic conditions, which may influence the Bank of England’s monetary policy outlook.
On Monday, Bank of England (BoE) policymaker Catherine Mann expressed concerns in a podcast with the Financial Times (FT) about UK wage growth, noting it remains a key issue for inflation. Despite the main rate holding steady at the BoE's 2% target in June, Mann continues to worry about potential upward pressures on inflation.
The upside potential for the GBP/JPY cross might be constrained as Japan's monetary policy outlook indicates that the Bank of Japan (BoJ) officials are prepared to raise rates further. However, they have adopted a more cautious stance due to the heightened market volatility observed last week.
Additionally, the GBP/JPY cross may face challenges due to safe-haven flows amid increased geopolitical tensions in the Middle East. ABC News reported that the Israel Defense Forces (IDF) intercepted around 30 "projectiles" crossing from Lebanon into northern Israel early Monday. Additionally, Reuters cited Gaza Civil Emergency Service on Saturday, the Israeli incursion into Gaza escalated with an airstrike targeting a school compound, leading to at least 90 fatalities.
Inflation FAQs
Inflation measures the rise in the price of a representative basket of goods and services. Headline inflation is usually expressed as a percentage change on a month-on-month (MoM) and year-on-year (YoY) basis. Core inflation excludes more volatile elements such as food and fuel which can fluctuate because of geopolitical and seasonal factors. Core inflation is the figure economists focus on and is the level targeted by central banks, which are mandated to keep inflation at a manageable level, usually around 2%.
The Consumer Price Index (CPI) measures the change in prices of a basket of goods and services over a period of time. It is usually expressed as a percentage change on a month-on-month (MoM) and year-on-year (YoY) basis. Core CPI is the figure targeted by central banks as it excludes volatile food and fuel inputs. When Core CPI rises above 2% it usually results in higher interest rates and vice versa when it falls below 2%. Since higher interest rates are positive for a currency, higher inflation usually results in a stronger currency. The opposite is true when inflation falls.
Although it may seem counter-intuitive, high inflation in a country pushes up the value of its currency and vice versa for lower inflation. This is because the central bank will normally raise interest rates to combat the higher inflation, which attract more global capital inflows from investors looking for a lucrative place to park their money.
Formerly, Gold was the asset investors turned to in times of high inflation because it preserved its value, and whilst investors will often still buy Gold for its safe-haven properties in times of extreme market turmoil, this is not the case most of the time. This is because when inflation is high, central banks will put up interest rates to combat it. Higher interest rates are negative for Gold because they increase the opportunity-cost of holding Gold vis-a-vis an interest-bearing asset or placing the money in a cash deposit account. On the flipside, lower inflation tends to be positive for Gold as it brings interest rates down, making the bright metal a more viable investment alternative.
Here is what you need to know on Monday, August 12:
Investors adopt a cautious stance at the beginning of the week as they keep a close eye on developments surrounding the Iran-Israel conflict. The economic calendar will not feature any high-tier macroeconomic data releases on Monday, allowing the risk mood to drive the action in financial markets.
Following a three-day rebound, the US Dollar Index (DXY) edged slightly lower on Friday, closing the week virtually unchanged. In the European morning on Monday, the DXY fluctuates in a narrow channel slightly above 103.00. In the meantime, the benchmark 10-year US Treasury bond yield edges higher toward 4% after ending the previous week in positive territory. Reflecting the cautious market mood, US stock index futures trade mixed in the early European session.
US Dollar PRICE Last 7 days
The table below shows the percentage change of US Dollar (USD) against listed major currencies last 7 days. US Dollar was the weakest against the Australian Dollar.
| USD | EUR | GBP | JPY | CAD | AUD | NZD | CHF | |
|---|---|---|---|---|---|---|---|---|
| USD | -0.12% | 0.32% | 0.41% | -1.03% | -1.11% | -0.97% | 0.98% | |
| EUR | 0.12% | 0.35% | 0.39% | -1.03% | -0.98% | -0.96% | 1.01% | |
| GBP | -0.32% | -0.35% | 0.08% | -1.36% | -1.33% | -1.30% | 0.63% | |
| JPY | -0.41% | -0.39% | -0.08% | -1.38% | -1.51% | -1.31% | 0.66% | |
| CAD | 1.03% | 1.03% | 1.36% | 1.38% | -0.05% | 0.06% | 1.84% | |
| AUD | 1.11% | 0.98% | 1.33% | 1.51% | 0.05% | 0.03% | 1.99% | |
| NZD | 0.97% | 0.96% | 1.30% | 1.31% | -0.06% | -0.03% | 1.96% | |
| CHF | -0.98% | -1.01% | -0.63% | -0.66% | -1.84% | -1.99% | -1.96% |
The heat map shows percentage changes of major currencies against each other. The base currency is picked from the left column, while the quote currency is picked from the top row. For example, if you pick the US Dollar from the left column and move along the horizontal line to the Japanese Yen, the percentage change displayed in the box will represent USD (base)/JPY (quote).
According to the latest headlines, Israeli forces remain on high alert for potential retaliation from Iran. Over the weekend, Hezbollah reportedly fired a barrage of rockets toward northern Israel.
Earlier in the day, the data from Germany showed that the Wholesale Price Index rose 0.3% on a monthly basis in July. This reading followed the 0.3% decline recorded in June and came in slightly above the market expectation of 0.2%. EUR/USD holds steady above 1.0900 early Monday.
GBP/USD registered weekly losses despite staging a two-day rebound in the second half of the week. In the European morning, the pair fluctuates in a narrow channel above 1.2750. The UK's Office for National Statistics will release labor market and inflation data on Tuesday and Wednesday, respectively.
USD/JPY stays relatively quiet at the beginning of the week and trades in a narrow band above 147.00.
After posting gains for two consecutive weeks, NZD/USD continues to inch higher early Monday and trades above 0.6000. In the Asian trading hours on Wednesday, the Reserve Bank of New Zealand will announce monetary policy decisions.
Gold struggled to build on Thursday's gains and closed the last trading day of the previous week with small gains. XAU/USD holds its ground amid escalating geopolitical tensions early Monday and trades in positive territory at around $2,440.
Risk sentiment FAQs
In the world of financial jargon the two widely used terms “risk-on” and “risk off'' refer to the level of risk that investors are willing to stomach during the period referenced. In a “risk-on” market, investors are optimistic about the future and more willing to buy risky assets. In a “risk-off” market investors start to ‘play it safe’ because they are worried about the future, and therefore buy less risky assets that are more certain of bringing a return, even if it is relatively modest.
Typically, during periods of “risk-on”, stock markets will rise, most commodities – except Gold – will also gain in value, since they benefit from a positive growth outlook. The currencies of nations that are heavy commodity exporters strengthen because of increased demand, and Cryptocurrencies rise. In a “risk-off” market, Bonds go up – especially major government Bonds – Gold shines, and safe-haven currencies such as the Japanese Yen, Swiss Franc and US Dollar all benefit.
The Australian Dollar (AUD), the Canadian Dollar (CAD), the New Zealand Dollar (NZD) and minor FX like the Ruble (RUB) and the South African Rand (ZAR), all tend to rise in markets that are “risk-on”. This is because the economies of these currencies are heavily reliant on commodity exports for growth, and commodities tend to rise in price during risk-on periods. This is because investors foresee greater demand for raw materials in the future due to heightened economic activity.
The major currencies that tend to rise during periods of “risk-off” are the US Dollar (USD), the Japanese Yen (JPY) and the Swiss Franc (CHF). The US Dollar, because it is the world’s reserve currency, and because in times of crisis investors buy US government debt, which is seen as safe because the largest economy in the world is unlikely to default. The Yen, from increased demand for Japanese government bonds, because a high proportion are held by domestic investors who are unlikely to dump them – even in a crisis. The Swiss Franc, because strict Swiss banking laws offer investors enhanced capital protection.
- The Pound Sterling moves higher against the US Dollar on improved market sentiment.
- BoE’s Mann warns about upside risks to price pressures.
- The Fed is expected to cut interest rates by 25 bps in September.
The Pound Sterling (GBP) gains against its major peers, except the Australian Dollar (AUD) and the New Zealand Dollar (NZD), in Monday’s London session. The British currency strengthens, with investors focusing on the United Kingdom (UK) Employment data for the three months ending June and the Consumer Price Index (CPI) data for July, which will be published on Tuesday and Wednesday, respectively.
The UK Employment report is expected to show that the ILO Unemployment Rate rose to 4.5% from the prior release of 4.4%. Investors will also focus on the Average Earnings Excluding Bonuses data, a key measure of wage growth that has been a key driver to high inflation in the service sector. The wage growth measure is estimated to have decelerated significantly to 4.6% from the former reading of 5.7%. An expected decline in wage growth measures will prompt expectations of subsequent interest rate cuts by the Bank of England (BoE).
While UK wage growth is expected to soften significantly, BoE's Monetary Policy Committee (MPC) member Catherine Mann said in an Economics Show podcast with the Financial Times in Monday’s Asian hours, “Goods and services prices were set to rise again, and wage pressures in the economy could take years to dissipate.” Mann remained concerned over upside risks to inflation despite the return of annual headline inflation to the bank’s target of 2%.
Daily digest market movers: Pound Sterling ahead of busy UK data week
- The Pound Sterling edges higher against the US Dollar (USD) in Monday’s European trading hours. The GBP/USD pair rises gradually due to a steady market sentiment. The US Dollar Index (DXY), which tracks the Greenback’s value against six major currencies, continues consolidating above 103.00.
- Current market sentiment exhibits a steady risk appetite; however, volatility is around the corner as the United States (US) CPI data for July is scheduled to be released on Wednesday. The inflation data will significantly influence market expectations for Federal Reserve (Fed) rate cuts this year.
- Economists expect that the monthly headline and core CPI, which excludes volatile food and energy prices, rose by 0.2%. The annual headline and core inflation are expected to have decelerated by 10 bps to 2.9% and 3.2%, respectively.
- According to the CME FedWatch tool, 30-day Federal Funds futures pricing data shows that traders see a 46.5% chance that interest rates will be reduced by 50 basis points (bps) in September. The likelihood of a 50 bp rate reduction has weakened significantly from 85%, recorded a week ago. A significant fall in a short time without the release of any top-tier data suggests that the high probability for big rate cuts prompted by weak US Employment data for July, which bolstered fears of a potential recession, was a mere overreaction.
- Meanwhile, the confidence of Fed policymakers that price pressures are on track to return to the desired rate of 2% has increased. Speaking at the Kansas Bankers Association on Friday, Fed Governor Michelle Bowman said, "Should the incoming data continue to show that inflation is moving sustainably toward our 2% goal, it will become appropriate to gradually lower the federal funds rate to prevent monetary policy from becoming overly restrictive on economic activity and employment." She added, "But we need to be patient and avoid undermining continued progress on lowering inflation by overreacting to any single data point,” Reuters reported.
Technical Analysis: Pound Sterling rebounds from 1.2700
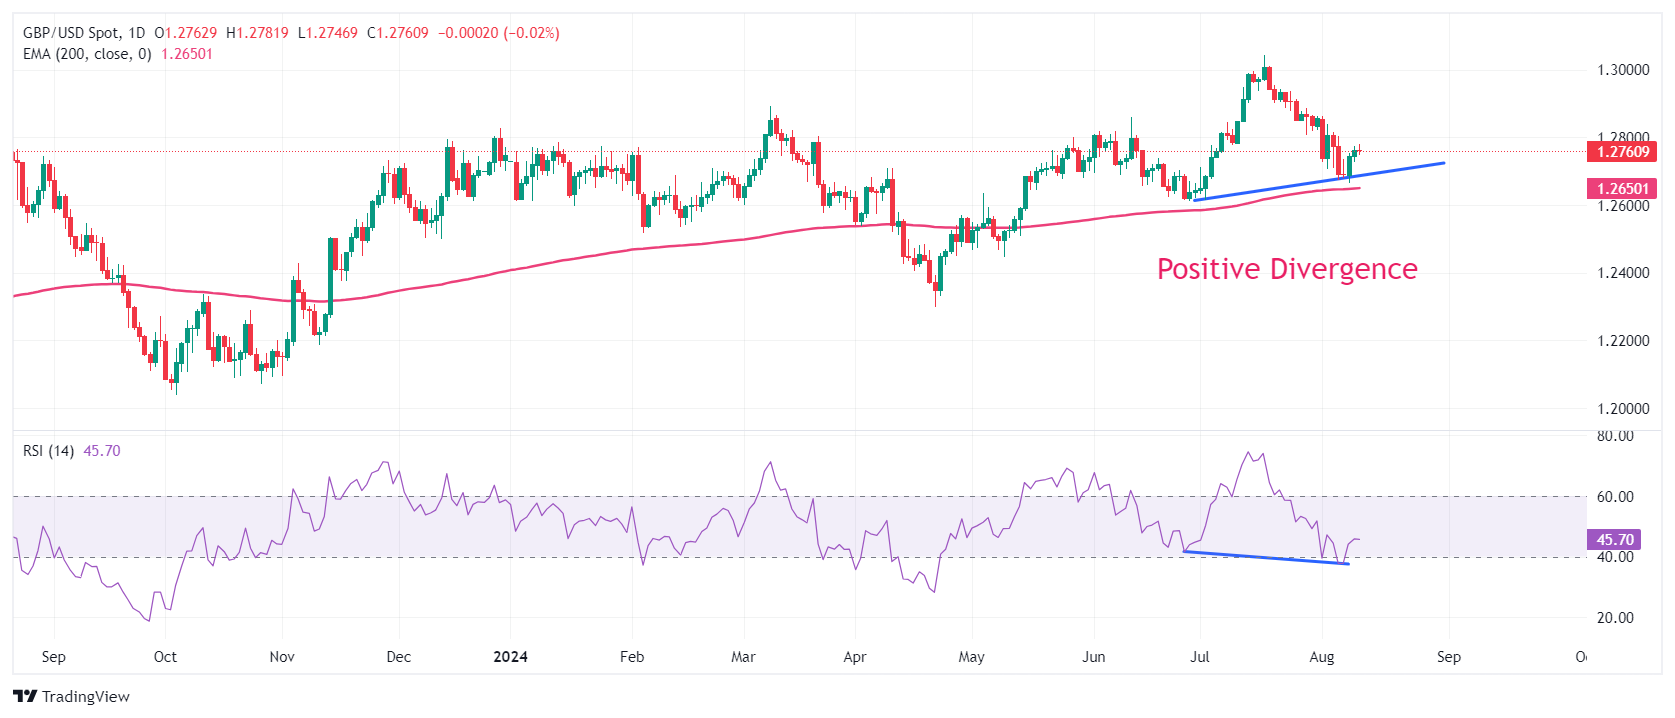
The Pound Sterling recovers after a positive divergence formation on a daily timeframe, in which the asset continues to build higher lows while a momentum oscillator makes lower lows. This generally results in a resumption of the uptrend, but it should be confirmed with more indicators.
The 14-day Relative Strength Index (RSI) indicator finds a cushion near 40.00, exhibiting signs of buying interest at lower levels.
The pair continues to hold the 200-day Exponential Moving Average (EMA), which trades at around 1.2650.
More downside could appear if the GBP/USD breaks below Thursday’s low of 1.2665. This would expose the June 27 low at 1.2613, followed by the April 29 high at 1.2570.
On the flip side, a recovery move above the August 6 high at 1.2800 would drive the pair towards the August 2 high at 1.2840 and the round-level resistance of 1.2900.
Pound Sterling FAQs
The Pound Sterling (GBP) is the oldest currency in the world (886 AD) and the official currency of the United Kingdom. It is the fourth most traded unit for foreign exchange (FX) in the world, accounting for 12% of all transactions, averaging $630 billion a day, according to 2022 data. Its key trading pairs are GBP/USD, aka ‘Cable’, which accounts for 11% of FX, GBP/JPY, or the ‘Dragon’ as it is known by traders (3%), and EUR/GBP (2%). The Pound Sterling is issued by the Bank of England (BoE).
The single most important factor influencing the value of the Pound Sterling is monetary policy decided by the Bank of England. The BoE bases its decisions on whether it has achieved its primary goal of “price stability” – a steady inflation rate of around 2%. Its primary tool for achieving this is the adjustment of interest rates. When inflation is too high, the BoE will try to rein it in by raising interest rates, making it more expensive for people and businesses to access credit. This is generally positive for GBP, as higher interest rates make the UK a more attractive place for global investors to park their money. When inflation falls too low it is a sign economic growth is slowing. In this scenario, the BoE will consider lowering interest rates to cheapen credit so businesses will borrow more to invest in growth-generating projects.
Data releases gauge the health of the economy and can impact the value of the Pound Sterling. Indicators such as GDP, Manufacturing and Services PMIs, and employment can all influence the direction of the GBP. A strong economy is good for Sterling. Not only does it attract more foreign investment but it may encourage the BoE to put up interest rates, which will directly strengthen GBP. Otherwise, if economic data is weak, the Pound Sterling is likely to fall.
Another significant data release for the Pound Sterling is the Trade Balance. This indicator measures the difference between what a country earns from its exports and what it spends on imports over a given period. If a country produces highly sought-after exports, its currency will benefit purely from the extra demand created from foreign buyers seeking to purchase these goods. Therefore, a positive net Trade Balance strengthens a currency and vice versa for a negative balance.
- USD/CAD loses ground due to higher WTI price amid escalating supply fears.
- Israel Defense Forces (IDF) intercepted around 30 "projectiles" that crossed from Lebanon early Monday.
- CME FedWatch Tool suggests a 46.5% chance of a 50-basis point Fed-rate cut in September, against 74.0% a week ago.
USD/CAD continues to lose ground for the seventh consecutive session, trading around 1.3730 during the early hours on Monday. This downside is attributed to the improved Canadian Dollar (CAD) following the higher crude Oil prices, given the fact that Canada is the biggest crude exporter to the United States (US).
West Texas Intermediate (WTI) Oil price extends its winning streak for the fourth successive day, trading $76.20 per barrel at the time of writing. Crude Oil prices appreciate due to increasing supply concerns amid geopolitical tensions in the Middle East.
ABC News reported that the Israel Defense Forces (IDF) intercepted around 30 "projectiles" crossing from Lebanon into northern Israel early Monday. The IDF stated that some projectiles landed in open areas, and no injuries were reported.
On Saturday, the Israeli incursion into Gaza escalated with an airstrike targeting a school compound, leading to at least 90 fatalities, according to the Gaza Civil Emergency Service. Israel has contested this casualty figure, labeling it as exaggerated. Meanwhile, Hamas has expressed uncertainty about engaging in new ceasefire negotiations on Sunday, as reported by Reuters.
The downside of the USD/CAD pair could be retrained as the US Dollar (USD) receives support as last week’s upbeat US economic data led traders to reduce their expectations for interest rate cuts by the US Federal Reserve. The CME FedWatch Tool indicates a 46.5% chance of a 50-basis point rate cut by the Fed at the September meeting, a significant decrease from the 74.0% probability reported a week ago.
On Sunday, Federal Reserve Governor Michelle Bowman stated that she continues to see upside risks for inflation and ongoing strength in the labor market. Bowman suggested that the Federal Reserve may not be prepared to cut rates at its next meeting in September, according to Bloomberg.
Canadian Dollar FAQs
The key factors driving the Canadian Dollar (CAD) are the level of interest rates set by the Bank of Canada (BoC), the price of Oil, Canada’s largest export, the health of its economy, inflation and the Trade Balance, which is the difference between the value of Canada’s exports versus its imports. Other factors include market sentiment – whether investors are taking on more risky assets (risk-on) or seeking safe-havens (risk-off) – with risk-on being CAD-positive. As its largest trading partner, the health of the US economy is also a key factor influencing the Canadian Dollar.
The Bank of Canada (BoC) has a significant influence on the Canadian Dollar by setting the level of interest rates that banks can lend to one another. This influences the level of interest rates for everyone. The main goal of the BoC is to maintain inflation at 1-3% by adjusting interest rates up or down. Relatively higher interest rates tend to be positive for the CAD. The Bank of Canada can also use quantitative easing and tightening to influence credit conditions, with the former CAD-negative and the latter CAD-positive.
The price of Oil is a key factor impacting the value of the Canadian Dollar. Petroleum is Canada’s biggest export, so Oil price tends to have an immediate impact on the CAD value. Generally, if Oil price rises CAD also goes up, as aggregate demand for the currency increases. The opposite is the case if the price of Oil falls. Higher Oil prices also tend to result in a greater likelihood of a positive Trade Balance, which is also supportive of the CAD.
While inflation had always traditionally been thought of as a negative factor for a currency since it lowers the value of money, the opposite has actually been the case in modern times with the relaxation of cross-border capital controls. Higher inflation tends to lead central banks to put up interest rates which attracts more capital inflows from global investors seeking a lucrative place to keep their money. This increases demand for the local currency, which in Canada’s case is the Canadian Dollar.
Macroeconomic data releases gauge the health of the economy and can have an impact on the Canadian Dollar. Indicators such as GDP, Manufacturing and Services PMIs, employment, and consumer sentiment surveys can all influence the direction of the CAD. A strong economy is good for the Canadian Dollar. Not only does it attract more foreign investment but it may encourage the Bank of Canada to put up interest rates, leading to a stronger currency. If economic data is weak, however, the CAD is likely to fall.
- EUR/GBP trades in negative territory for the fourth consecutive day around 0.8550 in Monday’s early European session.
- Bloomberg economists see the ECB cut its deposit rate once a quarter through the end of next year.
- The UK labor market data on Tuesday will be in the spotlight.
The EUR/GBP cross extends its decline to near 0.8550 during the early European session on Monday. The anticipation of the easing cycle ending sooner than previously anticipated by the European Central Bank (ECB) drags the Euro (EUR) lower. However, traders will keep an eye on the UK employment report for fresh catalysts, which is due on Tuesday.
The ECB is likely to cut its deposit rate once a quarter through the end of next year, according to Bloomberg economists. The sooner-than-previously-expected rate cuts from the ECB exert some selling pressure on the shared currency against the Pound Sterling (GBP). A Bloomberg survey of forecasters indicated that the benchmark is expected to reach 2.25% in December 2025 after six straight quarter-point declines. Previously, respondents projected that this level would be achieved in the second quarter of 2026.
On the GBP’s front, traders bet on two more rate cuts by the Bank of England (BoE) in 2024. The next monetary policy meeting is scheduled for September 19, and the market sees a 40% chance of a cut. The UK labor market data Tuesday could offer some hints about the UK economy and further rate path.
The UK Unemployment rate is expected to tick higher to 4.5% in June. Average weekly earnings ex-bonuses are expected to fall for the three months ended in June to 5.4% YoY. Including bonuses, total earnings are expected to fall to 4.6%YoY. The slower-than-expected wage growth will keep the BoE in easing mode, which will continue to undermine the GBP and cap the cross’s downside.
Pound Sterling FAQs
The Pound Sterling (GBP) is the oldest currency in the world (886 AD) and the official currency of the United Kingdom. It is the fourth most traded unit for foreign exchange (FX) in the world, accounting for 12% of all transactions, averaging $630 billion a day, according to 2022 data. Its key trading pairs are GBP/USD, aka ‘Cable’, which accounts for 11% of FX, GBP/JPY, or the ‘Dragon’ as it is known by traders (3%), and EUR/GBP (2%). The Pound Sterling is issued by the Bank of England (BoE).
The single most important factor influencing the value of the Pound Sterling is monetary policy decided by the Bank of England. The BoE bases its decisions on whether it has achieved its primary goal of “price stability” – a steady inflation rate of around 2%. Its primary tool for achieving this is the adjustment of interest rates. When inflation is too high, the BoE will try to rein it in by raising interest rates, making it more expensive for people and businesses to access credit. This is generally positive for GBP, as higher interest rates make the UK a more attractive place for global investors to park their money. When inflation falls too low it is a sign economic growth is slowing. In this scenario, the BoE will consider lowering interest rates to cheapen credit so businesses will borrow more to invest in growth-generating projects.
Data releases gauge the health of the economy and can impact the value of the Pound Sterling. Indicators such as GDP, Manufacturing and Services PMIs, and employment can all influence the direction of the GBP. A strong economy is good for Sterling. Not only does it attract more foreign investment but it may encourage the BoE to put up interest rates, which will directly strengthen GBP. Otherwise, if economic data is weak, the Pound Sterling is likely to fall.
Another significant data release for the Pound Sterling is the Trade Balance. This indicator measures the difference between what a country earns from its exports and what it spends on imports over a given period. If a country produces highly sought-after exports, its currency will benefit purely from the extra demand created from foreign buyers seeking to purchase these goods. Therefore, a positive net Trade Balance strengthens a currency and vice versa for a negative balance.
- EUR/USD holds positive ground near 1.0920 in Monday’s early European session.
- The pair keeps the positive vibe above the 100-day EMA, with a bullish RSI momentum indicator.
- The immediate resistance level emerges at 1.0973; the Initial support level is located at 1.0881.
The EUR/USD pair trades with mild gains around 1.0920 during the early European session on Monday. The uptick of the major pair is backed by the consolidation of the US Dollar (USD). Investors await the German August ZEW survey on Tuesday for fresh impetus.
Expectations are expected to arrive at 31.8 versus 41.8 in July, while the current assessment is expected to show -75.0 versus -68.9 prior. The weaker-than-expected data will contribute to a negative outlook in the economy and might keep the European Central Bank (ECB) in easing mode, with a September 12 rate cut fully priced in.
According to the daily chart, the bullish outlook of EUR/USD prevails as the major pair remains well above the key 100-day Exponential Moving Average (EMA). Additionally, the 14-day Relative Strength Index (RSI) holds in bullish territory near 58.60, indicating the potential upside in the near term.
The first upside barrier emerges near the upper boundary of the Bollinger Band around 1.0973. The crucial resistance level is located at the 1.1000-1.1010 region, portraying the confluence of psychological marks and a high of August 5. If the upswing continues, it may take the pair to 1.0981, a high of March 8.
On the other hand, a low of August 9 at 1.0881 acts as an initial support level for EUR/USD. Any follow-through selling below this level will expose the 100-day EMA at 1.0822. A breach of the mentioned would pave the way to 1.0735, a low of June 12.
EUR/USD daily chart
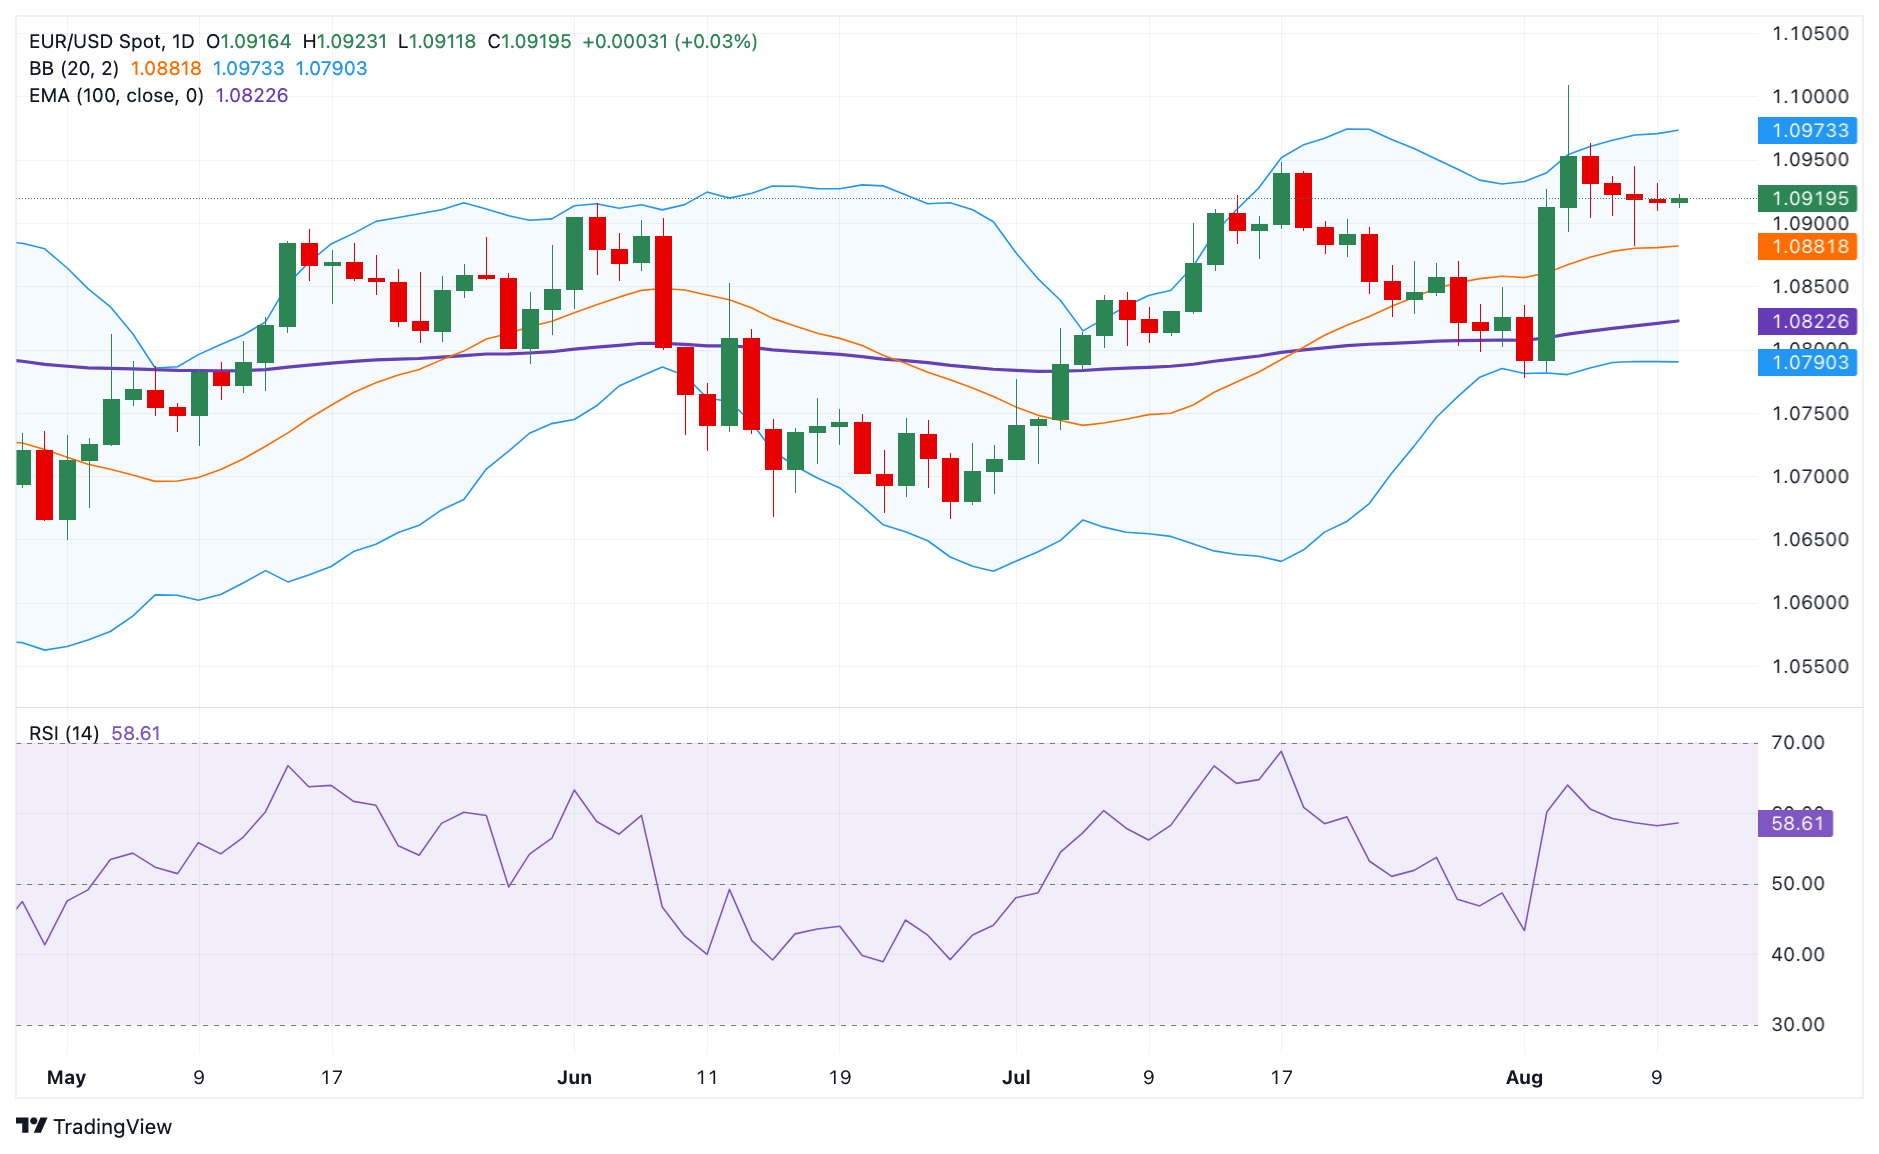
Euro FAQs
The Euro is the currency for the 20 European Union countries that belong to the Eurozone. It is the second most heavily traded currency in the world behind the US Dollar. In 2022, it accounted for 31% of all foreign exchange transactions, with an average daily turnover of over $2.2 trillion a day. EUR/USD is the most heavily traded currency pair in the world, accounting for an estimated 30% off all transactions, followed by EUR/JPY (4%), EUR/GBP (3%) and EUR/AUD (2%).
The European Central Bank (ECB) in Frankfurt, Germany, is the reserve bank for the Eurozone. The ECB sets interest rates and manages monetary policy. The ECB’s primary mandate is to maintain price stability, which means either controlling inflation or stimulating growth. Its primary tool is the raising or lowering of interest rates. Relatively high interest rates – or the expectation of higher rates – will usually benefit the Euro and vice versa. The ECB Governing Council makes monetary policy decisions at meetings held eight times a year. Decisions are made by heads of the Eurozone national banks and six permanent members, including the President of the ECB, Christine Lagarde.
Eurozone inflation data, measured by the Harmonized Index of Consumer Prices (HICP), is an important econometric for the Euro. If inflation rises more than expected, especially if above the ECB’s 2% target, it obliges the ECB to raise interest rates to bring it back under control. Relatively high interest rates compared to its counterparts will usually benefit the Euro, as it makes the region more attractive as a place for global investors to park their money.
Data releases gauge the health of the economy and can impact on the Euro. Indicators such as GDP, Manufacturing and Services PMIs, employment, and consumer sentiment surveys can all influence the direction of the single currency. A strong economy is good for the Euro. Not only does it attract more foreign investment but it may encourage the ECB to put up interest rates, which will directly strengthen the Euro. Otherwise, if economic data is weak, the Euro is likely to fall. Economic data for the four largest economies in the euro area (Germany, France, Italy and Spain) are especially significant, as they account for 75% of the Eurozone’s economy.
Another significant data release for the Euro is the Trade Balance. This indicator measures the difference between what a country earns from its exports and what it spends on imports over a given period. If a country produces highly sought after exports then its currency will gain in value purely from the extra demand created from foreign buyers seeking to purchase these goods. Therefore, a positive net Trade Balance strengthens a currency and vice versa for a negative balance.
FX option expiries for Aug 12 NY cut at 10:00 Eastern Time, via DTCC, can be found below.
EUR/USD: EUR amounts
- 1.0830 1.4b
- 1.0900 1.4b
- 1.0950 895m
- 1.0990 555m
GBP/USD: GBP amounts
- 1.2545 553m
USD/JPY: USD amounts
- 150.00 426m
AUD/USD: AUD amounts
- 0.6635 536m
USD/CAD: USD amounts
- 1.3910 602m
Gold prices remained broadly unchanged in India on Monday, according to data compiled by FXStreet.
The price for Gold stood at 6,567.86 Indian Rupees (INR) per gram, broadly stable compared with the INR 6,562.54 it cost on Friday.
The price for Gold was broadly steady at INR 76,606.23 per tola from INR 76,544.21 per tola on friday.
| Unit measure | Gold Price in INR |
|---|---|
| 1 Gram | 6,567.86 |
| 10 Grams | 65,678.60 |
| Tola | 76,606.23 |
| Troy Ounce | 204,283.40 |
FXStreet calculates Gold prices in India by adapting international prices (USD/INR) to the local currency and measurement units. Prices are updated daily based on the market rates taken at the time of publication. Prices are just for reference and local rates could diverge slightly.
Gold FAQs
Gold has played a key role in human’s history as it has been widely used as a store of value and medium of exchange. Currently, apart from its shine and usage for jewelry, the precious metal is widely seen as a safe-haven asset, meaning that it is considered a good investment during turbulent times. Gold is also widely seen as a hedge against inflation and against depreciating currencies as it doesn’t rely on any specific issuer or government.
Central banks are the biggest Gold holders. In their aim to support their currencies in turbulent times, central banks tend to diversify their reserves and buy Gold to improve the perceived strength of the economy and the currency. High Gold reserves can be a source of trust for a country’s solvency. Central banks added 1,136 tonnes of Gold worth around $70 billion to their reserves in 2022, according to data from the World Gold Council. This is the highest yearly purchase since records began. Central banks from emerging economies such as China, India and Turkey are quickly increasing their Gold reserves.
Gold has an inverse correlation with the US Dollar and US Treasuries, which are both major reserve and safe-haven assets. When the Dollar depreciates, Gold tends to rise, enabling investors and central banks to diversify their assets in turbulent times. Gold is also inversely correlated with risk assets. A rally in the stock market tends to weaken Gold price, while sell-offs in riskier markets tend to favor the precious metal.
The price can move due to a wide range of factors. Geopolitical instability or fears of a deep recession can quickly make Gold price escalate due to its safe-haven status. As a yield-less asset, Gold tends to rise with lower interest rates, while higher cost of money usually weighs down on the yellow metal. Still, most moves depend on how the US Dollar (USD) behaves as the asset is priced in dollars (XAU/USD). A strong Dollar tends to keep the price of Gold controlled, whereas a weaker Dollar is likely to push Gold prices up.
(An automation tool was used in creating this post.)
- EUR/JPY gains ground near 160.60 in Monday’s Asian session.
- German inflation rose to 2.6% YoY in July.
- Middle East geopolitical tensions might support the JPY and cap the cross’s upside.
The EUR/JPY cross trades firmer around 160.60 on Monday during the Asian trading hours. The softer Japanese Yen (JPY) provides some support to the cross on the day. Trading volumes are likely to be thin for the rest of the day as Japanese markets are closed for Mountain Day.
Data released by the Federal Statistical Office (Destatis) on Friday showed that Germany’s Harmonized Index of Consumer Prices (HICP) increased 2.6% YoY in July, in line with the consensus and the previous reading of 2.6%. The European Central Bank (ECB) is likely to cut more interest rates twice this year. However, ECB President Christine Lagarde said during the press conference that the question of any move in September is wide open, while ECB policymaker Olli Rehn said the central bank can continue cutting interest rates if there is confidence among policymakers that the inflation trend is slowing in the near future.
Meanwhile, the upside for the cross might be limited as the escalating geopolitical tensions in the Middle East might drag riskier assets like the Euro (EUR). While Hamas proposed a cease-fire implementation plan, ABC News reported that the Israel Defense Forces (IDF) intercepted around 30 "projectiles" entering from Lebanon into northern Israel early Monday. Any signs of rising geopolitical risks could boost safe-haven assets like the JPY and act as a headwind for EUR/JPY.
Japanese Yen FAQs
The Japanese Yen (JPY) is one of the world’s most traded currencies. Its value is broadly determined by the performance of the Japanese economy, but more specifically by the Bank of Japan’s policy, the differential between Japanese and US bond yields, or risk sentiment among traders, among other factors.
One of the Bank of Japan’s mandates is currency control, so its moves are key for the Yen. The BoJ has directly intervened in currency markets sometimes, generally to lower the value of the Yen, although it refrains from doing it often due to political concerns of its main trading partners. The current BoJ ultra-loose monetary policy, based on massive stimulus to the economy, has caused the Yen to depreciate against its main currency peers. This process has exacerbated more recently due to an increasing policy divergence between the Bank of Japan and other main central banks, which have opted to increase interest rates sharply to fight decades-high levels of inflation.
The BoJ’s stance of sticking to ultra-loose monetary policy has led to a widening policy divergence with other central banks, particularly with the US Federal Reserve. This supports a widening of the differential between the 10-year US and Japanese bonds, which favors the US Dollar against the Japanese Yen.
The Japanese Yen is often seen as a safe-haven investment. This means that in times of market stress, investors are more likely to put their money in the Japanese currency due to its supposed reliability and stability. Turbulent times are likely to strengthen the Yen’s value against other currencies seen as more risky to invest in.
- USD/CHF regains some positive traction amid the emergence of some USD buying on Monday.
- Bets for bigger rate cuts by the Fed and rising Middle East tensions to cap gains for the major.
- Traders might also prefer to wait on the sidelines ahead of the US inflation figures this week.
The USD/CHF pair attracts some dip-buying during the Asian session on Monday and currently trades around the 0.8660-0.8665 region, just below last week's swing high.
The US Dollar (USD) kicks off the new week on a positive note in the wake of hawkish comments by the Federal Reserve (Fed) Governor Michelle Bowman on Sunday. Bowman noted that the Fed may not be ready to cut rates in September and still sees upside risks for inflation amid continued strength in the labor market. Apart from this, a generally positive tone around the equity markets undermines the safe-haven Swiss Franc (CHF) and lends some support to the USD/CHF pair.
That said, geopolitical risks stemming from the ongoing conflicts in the Middle East keep a lid on the market optimism. In fact, the Israel Defense Forces (IDF) intercepted approximately 30 projectiles that were identified as crossing from Lebanon into northern Israel early Monday morning. Furthermore, the Israeli Air Force and Military Intelligence Directorate have been placed on high alert following observations in Western Iran, suggesting that Iran may attack Israel within days.
Apart from this, expectations for bigger interest rate cuts by the Fed might hold back the USD bulls from placing aggressive bets and contribute to capping the upside for the USD/CHF pair. Traders also seem reluctant and might prefer to move to the sidelines ahead of this week's release of the latest inflation figures from the US – the Producer Price Index (PPI) and the Consumer Price Index (CPI) on Tuesday and Wednesday, respectively.
In the meantime, the fundamental backdrop makes it prudent to wait for some follow-through buying before positioning for an extension of the USD/CHF pair's recent goodish recovery move from the 0.8430 area, or the lowest level early January touched last week.
US Dollar FAQs
The US Dollar (USD) is the official currency of the United States of America, and the ‘de facto’ currency of a significant number of other countries where it is found in circulation alongside local notes. It is the most heavily traded currency in the world, accounting for over 88% of all global foreign exchange turnover, or an average of $6.6 trillion in transactions per day, according to data from 2022. Following the second world war, the USD took over from the British Pound as the world’s reserve currency. For most of its history, the US Dollar was backed by Gold, until the Bretton Woods Agreement in 1971 when the Gold Standard went away.
The most important single factor impacting on the value of the US Dollar is monetary policy, which is shaped by the Federal Reserve (Fed). The Fed has two mandates: to achieve price stability (control inflation) and foster full employment. Its primary tool to achieve these two goals is by adjusting interest rates. When prices are rising too quickly and inflation is above the Fed’s 2% target, the Fed will raise rates, which helps the USD value. When inflation falls below 2% or the Unemployment Rate is too high, the Fed may lower interest rates, which weighs on the Greenback.
In extreme situations, the Federal Reserve can also print more Dollars and enact quantitative easing (QE). QE is the process by which the Fed substantially increases the flow of credit in a stuck financial system. It is a non-standard policy measure used when credit has dried up because banks will not lend to each other (out of the fear of counterparty default). It is a last resort when simply lowering interest rates is unlikely to achieve the necessary result. It was the Fed’s weapon of choice to combat the credit crunch that occurred during the Great Financial Crisis in 2008. It involves the Fed printing more Dollars and using them to buy US government bonds predominantly from financial institutions. QE usually leads to a weaker US Dollar.
Quantitative tightening (QT) is the reverse process whereby the Federal Reserve stops buying bonds from financial institutions and does not reinvest the principal from the bonds it holds maturing in new purchases. It is usually positive for the US Dollar.
In an Economics Show podcast with the Financial Times (FT), Bank of England (BoE) policymaker Catherine Mann warned that “UK wage growth is still a concern for inflation.”
Additional quotes
Goods and services prices were set to rise again, and wage pressures in the economy could take years to dissipate.
Still concerned about upside risks to inflation despite the main rate remaining at the bank’s 2 percent target in June.
Had moved down from 10 to seven on a scale of “hawkishness” since the start of the year as price pressures eased.
- GBP/USD could test the immediate barrier at a nine-day EMA of 1.2767 level and the upper boundary around 1.2800 level.
- The technical analysis of a daily chart suggests a bearish bias for the pair.
- The lower edge of the descending channel around the level of 1.2650 could act as a key support.
GBP/USD pauses its two-day advance, trading around 1.2760 during the Asian session on Monday. The daily chart analysis shows the pair is consolidating within a descending channel, indicating a bearish bias.
The Moving Average Convergence Divergence (MACD) indicator suggests bearish momentum, as the MACD line is below both the signal line and the centerline. Additionally, the 14-day Relative Strength Index (RSI) remains below the 50 level, reinforcing the bearish outlook.
For resistance, the pair faces an immediate barrier around the nine-day Exponential Moving Average (EMA) at the 1.2767 level, followed by the upper boundary around the 1.2800 level. A breakout above this level could propel GBP/USD toward the yearly peak of 1.3044 level, reached on July 17.
On the downside, GBP/USD may test key support at the lower edge of the descending channel around the level of 1.2650. A break below this level could increase downward pressure, potentially guiding the pair toward the throwback support at the 1.2615 level, noted in June.
GBP/USD: Daily Chart
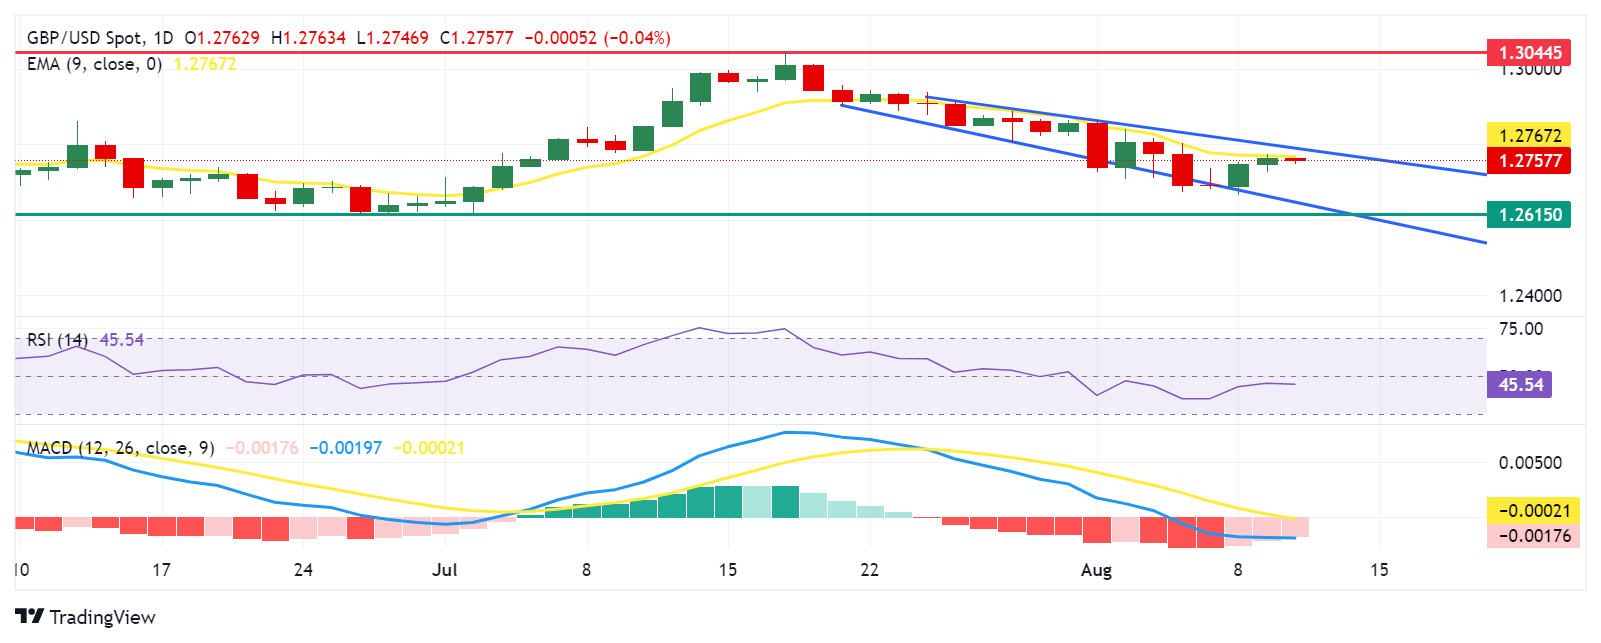
British Pound PRICE Today
The table below shows the percentage change of British Pound (GBP) against listed major currencies today. British Pound was the weakest against the Australian Dollar.
| USD | EUR | GBP | JPY | CAD | AUD | NZD | CHF | |
|---|---|---|---|---|---|---|---|---|
| USD | -0.01% | 0.01% | 0.34% | -0.02% | -0.10% | -0.16% | 0.15% | |
| EUR | 0.00% | 0.04% | 0.32% | -0.02% | -0.22% | -0.16% | 0.17% | |
| GBP | -0.01% | -0.04% | 0.54% | -0.06% | -0.26% | -0.21% | 0.13% | |
| JPY | -0.34% | -0.32% | -0.54% | -0.34% | -0.51% | -0.50% | -0.21% | |
| CAD | 0.02% | 0.02% | 0.06% | 0.34% | -0.14% | -0.14% | 0.20% | |
| AUD | 0.10% | 0.22% | 0.26% | 0.51% | 0.14% | 0.06% | 0.39% | |
| NZD | 0.16% | 0.16% | 0.21% | 0.50% | 0.14% | -0.06% | 0.33% | |
| CHF | -0.15% | -0.17% | -0.13% | 0.21% | -0.20% | -0.39% | -0.33% |
The heat map shows percentage changes of major currencies against each other. The base currency is picked from the left column, while the quote currency is picked from the top row. For example, if you pick the British Pound from the left column and move along the horizontal line to the US Dollar, the percentage change displayed in the box will represent GBP (base)/USD (quote).
- Silver remains under some selling pressure for the second straight day, albeit lacks follow-through.
- The technical setup favors bearish traders and supports prospects for a further depreciating move.
- Any meaningful move up is likely to attract fresh sellers and remain capped near the 100-day SMA.
Silver (XAG/USD) drifts lower for the second straight day on Monday and trades below mid-$27.00s during the Asian session. The white metal, however, remains confined in a broader range held over the past week or so and seems vulnerable to prolonging the recent downward trajectory witnessed over the past month or so.
From a technical perspective, Friday's failure near the 23.6% Fibonacci retracement level of the July-August downfall and some follow-through selling validates the near-term negative outlook for the XAG/USD. Moreover, oscillators on the daily chart are holding deep in negative territory and are still away from being in the oversold zone. Hence, a subsequent slide below the $27.00 mark, towards retesting the multi-month low near the $26.50-$26.45 area touched last week, looks like a distinct possibility.
A convincing break below the latter will be seen as a fresh trigger for bearish traders and drag the XAG/USD further towards the May monthly swing low, around the $26.00 mark. The white metal could extend the descending trend and eventually drop to intermediate support near the $25.60 horizontal zone en route to the $25.00 psychological mark.
On the flip side, move beyond 23.6% Fibo. level, around the $27.75 region, might trigger a short-covering rally and pave the way for some meaningful gains. The XAG/USD might then climb beyond the $28.00 round-figure mark, towards the 38.2% Fibo. level around the $28.50-$28.55 region. Any further move up, however, is more likely to attract fresh sellers and remain capped near the 100-day Simple Moving Average (SMA) support breakpoint, currently pegged near the $28.75-$28.80 area.
The latter should act as a key pivotal point, which if cleared decisively might negate the near-term bearish outlook. The XAG/USD might then reclaim the $29.00 mark and appreciate further toward the next relevant hurdle near the $29.45 zone. The recovery momentum could extend further towards the 61.8% Fibo. level, around the $29.75 region, before bullish traders aim to reclaim the $30.00 psychological mark.
Silver daily chart
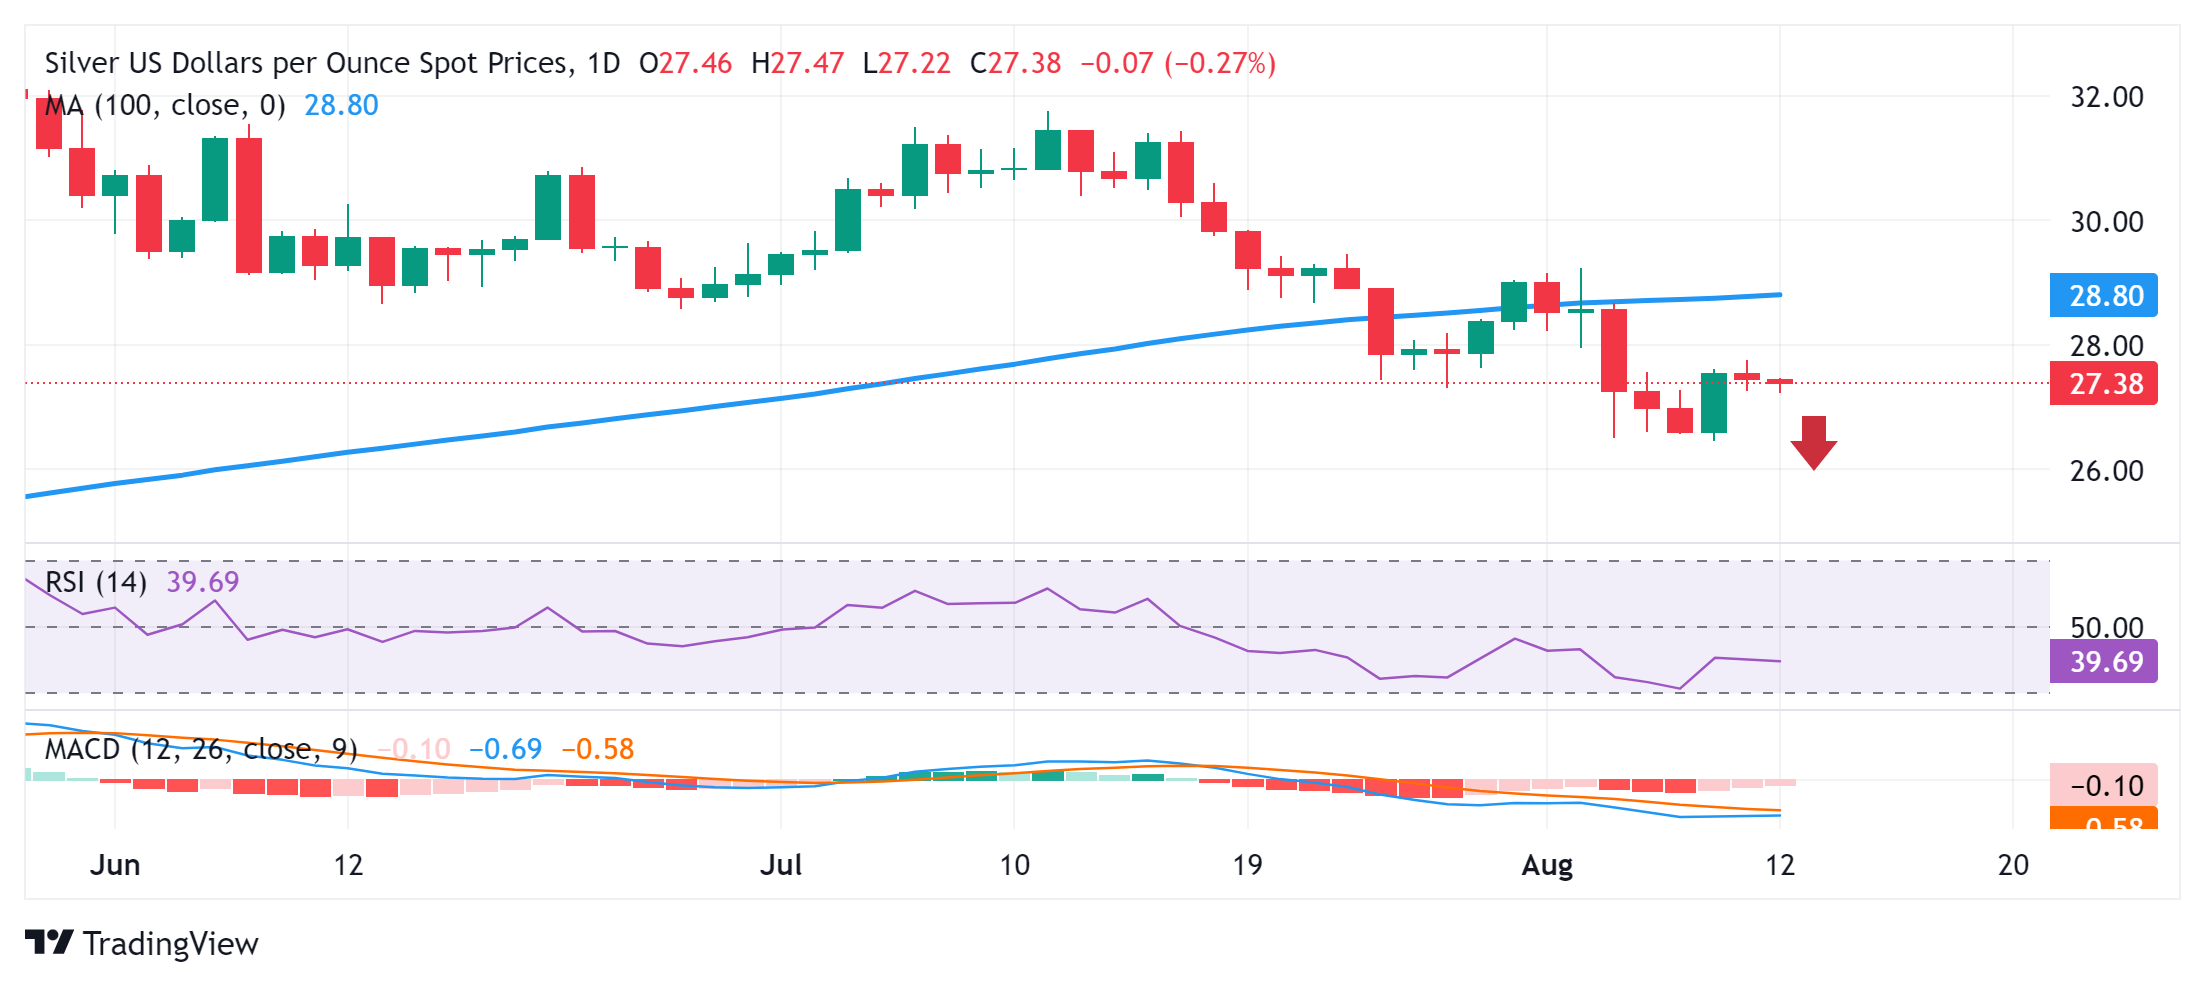
Silver FAQs
Silver is a precious metal highly traded among investors. It has been historically used as a store of value and a medium of exchange. Although less popular than Gold, traders may turn to Silver to diversify their investment portfolio, for its intrinsic value or as a potential hedge during high-inflation periods. Investors can buy physical Silver, in coins or in bars, or trade it through vehicles such as Exchange Traded Funds, which track its price on international markets.
Silver prices can move due to a wide range of factors. Geopolitical instability or fears of a deep recession can make Silver price escalate due to its safe-haven status, although to a lesser extent than Gold's. As a yieldless asset, Silver tends to rise with lower interest rates. Its moves also depend on how the US Dollar (USD) behaves as the asset is priced in dollars (XAG/USD). A strong Dollar tends to keep the price of Silver at bay, whereas a weaker Dollar is likely to propel prices up. Other factors such as investment demand, mining supply – Silver is much more abundant than Gold – and recycling rates can also affect prices.
Silver is widely used in industry, particularly in sectors such as electronics or solar energy, as it has one of the highest electric conductivity of all metals – more than Copper and Gold. A surge in demand can increase prices, while a decline tends to lower them. Dynamics in the US, Chinese and Indian economies can also contribute to price swings: for the US and particularly China, their big industrial sectors use Silver in various processes; in India, consumers’ demand for the precious metal for jewellery also plays a key role in setting prices.
Silver prices tend to follow Gold's moves. When Gold prices rise, Silver typically follows suit, as their status as safe-haven assets is similar. The Gold/Silver ratio, which shows the number of ounces of Silver needed to equal the value of one ounce of Gold, may help to determine the relative valuation between both metals. Some investors may consider a high ratio as an indicator that Silver is undervalued, or Gold is overvalued. On the contrary, a low ratio might suggest that Gold is undervalued relative to Silver.
- The Japanese Yen declines due to low trading as traders observe the Mountain Day holiday in Japan.
- The US Dollar receives support due to diminished odds of Fed rate cuts following last week’s upbeat US data.
- Safe-haven flows may limit the downside of the JPY amid increased geopolitical tensions.
The Japanese Yen (JPY) retraces its recent gains against the US Dollar (USD), with trading volumes likely to be low due to the Japanese markets being closed for Mountain Day. Support for the USD/JPY pair comes from stronger-than-expected US economic data released last week, leading traders to reduce their expectations for interest rate cuts by the US Federal Reserve.
On Sunday, Federal Reserve Governor Michelle Bowman stated that she continues to see upside risks for inflation and ongoing strength in the labor market. Bowman suggested that the Federal Reserve may not be prepared to cut rates at its next meeting in September, according to Bloomberg.
The CME FedWatch Tool indicates a 46.5% chance of a 50-basis point rate cut by the Fed at the September meeting, a significant decrease from the 74.0% probability reported a week ago.
Last week, Japan's monetary policy outlook showed that Bank of Japan’s (BoJ) officials have indicated a readiness to raise rates further, although they have become more cautious due to increased market volatility. Meanwhile, Japan’s Finance Minister Shunichi Suzuki emphasized that monetary policy decisions fall under the purview of the Bank of Japan, while they continue to monitor market developments closely, as reported by Reuters.
Daily Digest Market Movers: Japanese Yen declines due to reduced odds of Fed rate cuts
- The Japanese Yen may receive support from safe-haven flows amid increased geopolitical tensions in the Middle East. ABC News reported that the Israel Defense Forces (IDF) intercepted around 30 "projectiles" crossing from Lebanon into northern Israel early Monday. The IDF stated that some projectiles landed in open areas, and no injuries were reported.
- A Julius Baer analyst believes there is no need for the Bank of Japan to significantly raise interest rates beyond current levels. Once market conditions stabilize, the approximately 500-basis point interest rate differential between the JPY and USD is expected to become the main factor. The analyst does not foresee the Yen appreciating further.
- Bloomberg reported that JP Morgan Asset Management (JPAM) believes the Bank of Japan is unlikely to raise interest rates in the near term. According to JPAM, the BoJ may only consider further rate hikes if the Federal Reserve cuts rates and the US economy stabilizes. They anticipate that any additional tightening by the BoJ is more likely to occur in 2025, provided the global economic environment remains stable.
- On Thursday, Kansas City Fed President Jeffrey Schmid stated that reducing monetary policy could be "appropriate" if inflation remains low. Schmid noted that the current Fed policy is "not that restrictive" and that while the Fed is close to its 2% inflation goal, it has not yet fully achieved it, per Reuters.
- US Initial Jobless Claims dropped to 233,000 for the week ending August 2, coming in under the market expectation of 240,000. This decline follows an upwardly revised figure of 250,000 for the previous week, which was the highest in a year.
- The Bank of Japan’s Summary of Opinions from the Monetary Policy Meeting on July 30 and 31 showed that several members believe economic activity and prices are progressing as anticipated by the BoJ. The members are targeting a neutral rate of "at least around 1%" as a medium-term goal.
- On Wednesday, BoJ Deputy Governor Shinichi Uchida also noted that BoJ's interest rate strategy will adapt if market volatility alters economic forecasts, risk assessments, or projections. Given recent market volatility, he emphasized the need for careful monitoring of the economic and price impacts of their policies, stating, “We must maintain the current degree of monetary easing for the time being.”
- The minutes from the Bank of Japan's June meeting showed that some members expressed concerns about rising import prices due to the recent decline in the JPY, which could pose an upside risk to inflation. One member noted that cost-push inflation might intensify underlying inflation if it results in higher inflation expectations and wage increases.
Technical Analysis: USD/JPY rises to near 147.00
USD/JPY trades around 147.00 on Monday. The daily chart analysis shows that the pair is positioned above the descending channel, suggesting a weakening of a bearish bias. Moreover, the 14-day Relative Strength Index (RSI) is at the 30 level. If the RSI moves toward 50, it could signal a potential improvement in the pair's momentum.
For support levels, the USD/JPY pair may test the upper boundary around the 145.50 level. If it breaks below this level, the pair could face downward pressure, potentially pushing it toward throwback support at 140.25, and further down to the lower boundary of the descending channel near 137.00.
On the upside, the USD/JPY pair could test the immediate barrier at the nine-day Exponential Moving Average (EMA) around the 147.75 level. A breakout above this level could diminish bearish momentum and allow the pair to approach the "throwback support turned resistance" at 154.50.
USD/JPY: Daily Chart
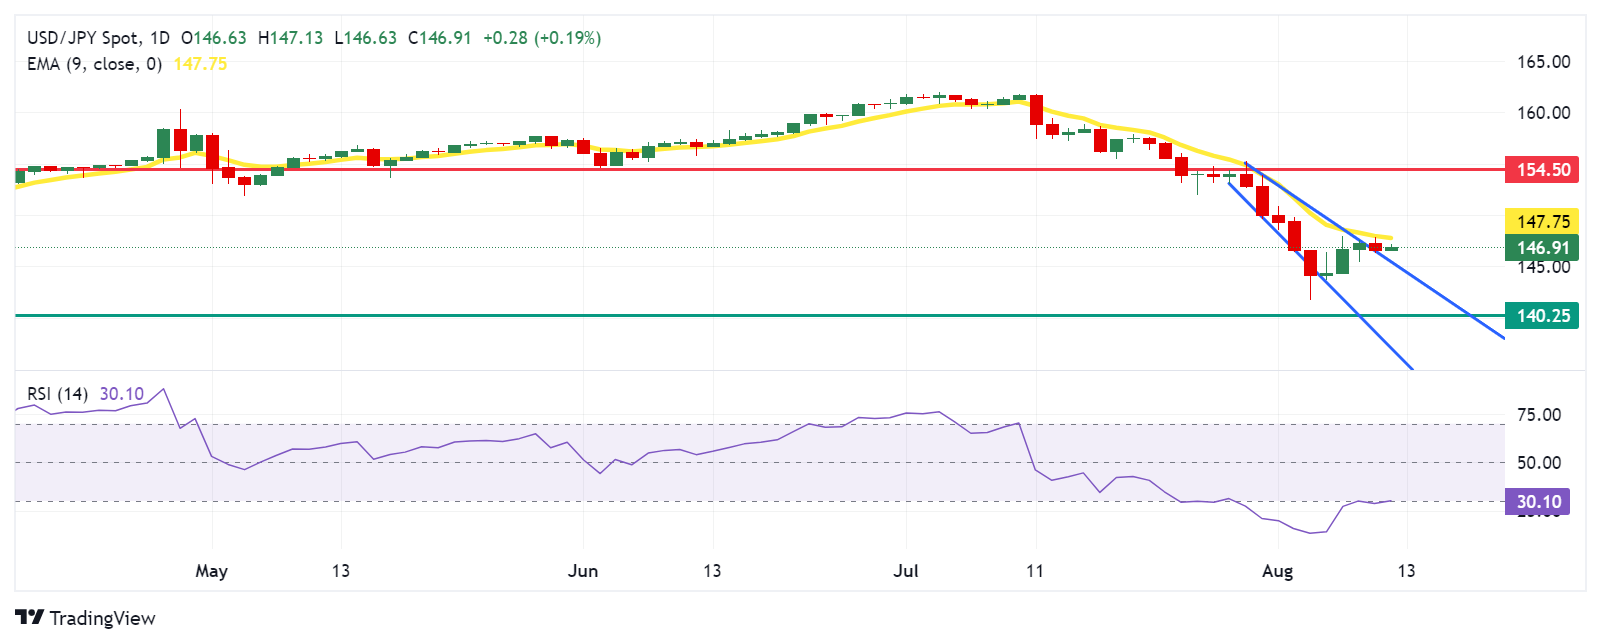
Japanese Yen PRICE Today
The table below shows the percentage change of Japanese Yen (JPY) against listed major currencies today. Japanese Yen was the weakest against the Australian Dollar.
| USD | EUR | GBP | JPY | CAD | AUD | NZD | CHF | |
|---|---|---|---|---|---|---|---|---|
| USD | 0.02% | 0.03% | 0.32% | 0.00% | -0.13% | -0.13% | 0.12% | |
| EUR | -0.02% | 0.04% | 0.27% | -0.02% | -0.28% | -0.15% | 0.12% | |
| GBP | -0.03% | -0.04% | 0.51% | -0.05% | -0.32% | -0.20% | 0.09% | |
| JPY | -0.32% | -0.27% | -0.51% | -0.30% | -0.52% | -0.45% | -0.22% | |
| CAD | -0.01% | 0.02% | 0.05% | 0.30% | -0.20% | -0.14% | 0.15% | |
| AUD | 0.13% | 0.28% | 0.32% | 0.52% | 0.20% | 0.12% | 0.40% | |
| NZD | 0.13% | 0.15% | 0.20% | 0.45% | 0.14% | -0.12% | 0.28% | |
| CHF | -0.12% | -0.12% | -0.09% | 0.22% | -0.15% | -0.40% | -0.28% |
The heat map shows percentage changes of major currencies against each other. The base currency is picked from the left column, while the quote currency is picked from the top row. For example, if you pick the Japanese Yen from the left column and move along the horizontal line to the US Dollar, the percentage change displayed in the box will represent JPY (base)/USD (quote).
Bank of Japan FAQs
The Bank of Japan (BoJ) is the Japanese central bank, which sets monetary policy in the country. Its mandate is to issue banknotes and carry out currency and monetary control to ensure price stability, which means an inflation target of around 2%.
The Bank of Japan has embarked in an ultra-loose monetary policy since 2013 in order to stimulate the economy and fuel inflation amid a low-inflationary environment. The bank’s policy is based on Quantitative and Qualitative Easing (QQE), or printing notes to buy assets such as government or corporate bonds to provide liquidity. In 2016, the bank doubled down on its strategy and further loosened policy by first introducing negative interest rates and then directly controlling the yield of its 10-year government bonds.
The Bank’s massive stimulus has caused the Yen to depreciate against its main currency peers. This process has exacerbated more recently due to an increasing policy divergence between the Bank of Japan and other main central banks, which have opted to increase interest rates sharply to fight decades-high levels of inflation. The BoJ’s policy of holding down rates has led to a widening differential with other currencies, dragging down the value of the Yen.
A weaker Yen and the spike in global energy prices have led to an increase in Japanese inflation, which has exceeded the BoJ’s 2% target. With wage inflation becoming a cause of concern, the BoJ looks to move away from ultra loose policy, while trying to avoid slowing the activity too much.
- USD/CAD seesaws between tepid gains/minor losses during the Asian session on Monday.
- Friday’s unimpressive Canadian jobs report weighs on the CAD and lends support to the pair.
- Middle East tensions benefit Oil prices, underpin the Loonie and cap gains for spot prices.
The USD/CAD pair extends its consolidative price move on the first day of a new week and is influenced by a combination of diverging forces. Spot prices currently trade with a mild positive bias, around the 1.3735 region, though remain well within the striking distance of a multi-week low touched on Friday.
The mixed Canadian jobs data released on Friday is seen weighing on the domestic currency, which, along with a modest US Dollar (USD) uptick, acts as a tailwind for the USD/CAD pair. Statistics Canada reported that the number of employed people decreased by 2.8K in July, while the Unemployment Rate held steady at 6.4% and Average Hourly Wages rose by 5.2% from a year earlier. Nevertheless, the data reaffirmed market bets for another 25 basis point (bps) rate cut by the Bank of Canada (BoC) in September and undermines the Canadian Dollar (CAD).
The US Dollar (USD), on the other hand, attracts some haven flows in the wake of rising geopolitical tensions and turns out to be another factor lending some support to the USD/CAD pair. That said, bets for bigger interest rate cuts by the Federal Reserve (Fed) hold back the USD bulls from placing aggressive bets. Adding to this, the risk of supply disruptions from the Middle East – amid the risk of a broader conflict in the region – assists Crude Oil prices to hold steady near a one-week peak, which lends some support to the commodity-linked Loonie and caps the pair.
In the absence of any relevant market-moving economic releases on Monday, either from the US or Canada, the aforementioned fundamental backdrop warrants some caution before positioning for any meaningful gains. Traders also seem reluctant and prefer to wait for this week's release of inflation figures from the US – the Producer Price Index (PPI) and the Consumer Price Index (CPI) on Tuesday and Wednesday, respectively.
US Dollar PRICE Today
The table below shows the percentage change of US Dollar (USD) against listed major currencies today. US Dollar was the strongest against the Japanese Yen.
| USD | EUR | GBP | JPY | CAD | AUD | NZD | CHF | |
|---|---|---|---|---|---|---|---|---|
| USD | 0.00% | 0.03% | 0.21% | -0.00% | -0.15% | -0.14% | 0.05% | |
| EUR | -0.01% | 0.05% | 0.19% | -0.01% | -0.28% | -0.14% | 0.06% | |
| GBP | -0.03% | -0.05% | 0.39% | -0.06% | -0.32% | -0.20% | 0.02% | |
| JPY | -0.21% | -0.19% | -0.39% | -0.20% | -0.42% | -0.35% | -0.18% | |
| CAD | 0.00% | 0.00% | 0.06% | 0.20% | -0.20% | -0.13% | 0.08% | |
| AUD | 0.15% | 0.28% | 0.32% | 0.42% | 0.20% | 0.13% | 0.34% | |
| NZD | 0.14% | 0.14% | 0.20% | 0.35% | 0.13% | -0.13% | 0.21% | |
| CHF | -0.05% | -0.06% | -0.02% | 0.18% | -0.08% | -0.34% | -0.21% |
The heat map shows percentage changes of major currencies against each other. The base currency is picked from the left column, while the quote currency is picked from the top row. For example, if you pick the US Dollar from the left column and move along the horizontal line to the Japanese Yen, the percentage change displayed in the box will represent USD (base)/JPY (quote).
On Monday, Reserve Bank of Australia (RBA) Deputy Governor Andrew Hauser spoke at the Economic Society of Australia Business Lunch in Brisbane.
Key quotes
Economic forecasts are subject to huge uncertainty.
Assume inflation stickiness due to weaker supply, labor market tightness.
But spare capacity could easily be much higher, or much lower than we assume.
Assume unemployment will rise only slowly, but risk of faster increase.
Assume household consumption to rise in line with real incomes.
Risk consumption could rise more strongly, in part due to increase in wealth.
Uncertain how far and fast savings rate might rise.
Market reaction
AUD/USD is clinging to moderate gains following these above comments. The pair is currently trading 0.20% higher on the day at 0.6585.
RBA FAQs
The Reserve Bank of Australia (RBA) sets interest rates and manages monetary policy for Australia. Decisions are made by a board of governors at 11 meetings a year and ad hoc emergency meetings as required. The RBA’s primary mandate is to maintain price stability, which means an inflation rate of 2-3%, but also “..to contribute to the stability of the currency, full employment, and the economic prosperity and welfare of the Australian people.” Its main tool for achieving this is by raising or lowering interest rates. Relatively high interest rates will strengthen the Australian Dollar (AUD) and vice versa. Other RBA tools include quantitative easing and tightening.
While inflation had always traditionally been thought of as a negative factor for currencies since it lowers the value of money in general, the opposite has actually been the case in modern times with the relaxation of cross-border capital controls. Moderately higher inflation now tends to lead central banks to put up their interest rates, which in turn has the effect of attracting more capital inflows from global investors seeking a lucrative place to keep their money. This increases demand for the local currency, which in the case of Australia is the Aussie Dollar.
Macroeconomic data gauges the health of an economy and can have an impact on the value of its currency. Investors prefer to invest their capital in economies that are safe and growing rather than precarious and shrinking. Greater capital inflows increase the aggregate demand and value of the domestic currency. Classic indicators, such as GDP, Manufacturing and Services PMIs, employment, and consumer sentiment surveys can influence AUD. A strong economy may encourage the Reserve Bank of Australia to put up interest rates, also supporting AUD.
Quantitative Easing (QE) is a tool used in extreme situations when lowering interest rates is not enough to restore the flow of credit in the economy. QE is the process by which the Reserve Bank of Australia (RBA) prints Australian Dollars (AUD) for the purpose of buying assets – usually government or corporate bonds – from financial institutions, thereby providing them with much-needed liquidity. QE usually results in a weaker AUD.
Quantitative tightening (QT) is the reverse of QE. It is undertaken after QE when an economic recovery is underway and inflation starts rising. Whilst in QE the Reserve Bank of Australia (RBA) purchases government and corporate bonds from financial institutions to provide them with liquidity, in QT the RBA stops buying more assets, and stops reinvesting the principal maturing on the bonds it already holds. It would be positive (or bullish) for the Australian Dollar.
- The Indian Rupee trades sideways in Monday’s Asian trading hours.
- Elevated Middle East geopolitical risks might boost the pair, while possible RBI intervention might cap the upside.
- Indian CPI and Industrial Production data will be the highlights on Monday.
The Indian Rupee (INR) trades on a flat note on Monday amid the consolidation of the Greenback. Traders turn cautious amid the geopolitical risks. The US is strengthening its capabilities in the Middle East by sending an additional guided missile submarine to the region "in light of rising regional tensions”, per ABC News. This might boost a safe-haven currency like the US Dollar (USD) in the near term. However, the likely intervention by the Reserve Bank of India (RBI) could support the local currency and cap the significant upside for the pair.
Looking ahead, traders will monitor the release of the Indian Consumer Price Index (CPI) and Industrial Production. On the US docket, the Producer Price Index (PPI), Consumer Price Index (CPI) and Retail Sales will be released later this week. The softer inflation data could reinforce expectations that the Federal Reserve (Fed) will start cutting interest rates soon, which might drag the Greenback lower.
Daily Digest Market Movers: Indian Rupee holds steady ahead of Indian CPI report
- Amit Somani, senior fixed income fund manager at Tata Asset Management, noted the balance of risks on the Indian Rupee remains on the downside, adding that he expects the currency to move in the 83.80-84.20 range for the week.
- "The Reserve Bank of India (RBI) has been very watchful of the Rupee's movement and has intervened in the spot market to ensure it stays near 84”, said Jigar Trivedi, senior analyst at Reliance Securities.
- The Indian CPI is expected to show an increase of 3.65% YoY in July, compared to 5.08% in the previous reading.
- The Israeli intelligence community believed Iran has decided to attack Israel directly and may do so within days, Axios reporter Barak Ravid said on Sunday, citing two sources.
- Fed Governor Michelle Bowman said on Sunday that she sees the progress in lowering inflation in the previous months, but inflation is still uncomfortably above the Fed's 2% target, highlighting the Fed may not be ready to cut rates at its upcoming meeting in September, per Reuters.
- The CME FedWatch Tool showed the possibility of a 50 basis points (bps) interest rate cut by the Fed at the September meeting at 52.5%, down from 57.5% a day ago.
Technical analysis: USD/INR’s positive stance remains unchanged
Indian Rupee trades flat on the day. However, the USD/INR pair shows a significant upward movement on the daily chart, with the price holding above the key 100-day Exponential Moving Average (EMA) and the two-month-old uptrend line. The bullish momentum is supported by the 14-day Relative Strength Index (RSI), which stands near 65.50, suggesting a continuation of the uptrend.
A decisive bullish breakout above the 84.00 psychological barrier could pave the way to the all-time high of 84.24. If the upswing continues, it may take the pair to 84.50.
On the downside, a bearish turn could keep USD/INR back to the uptrend line near 82.82. Sustained trading below this level will see a drop to the 100-day EMA at 83.52.
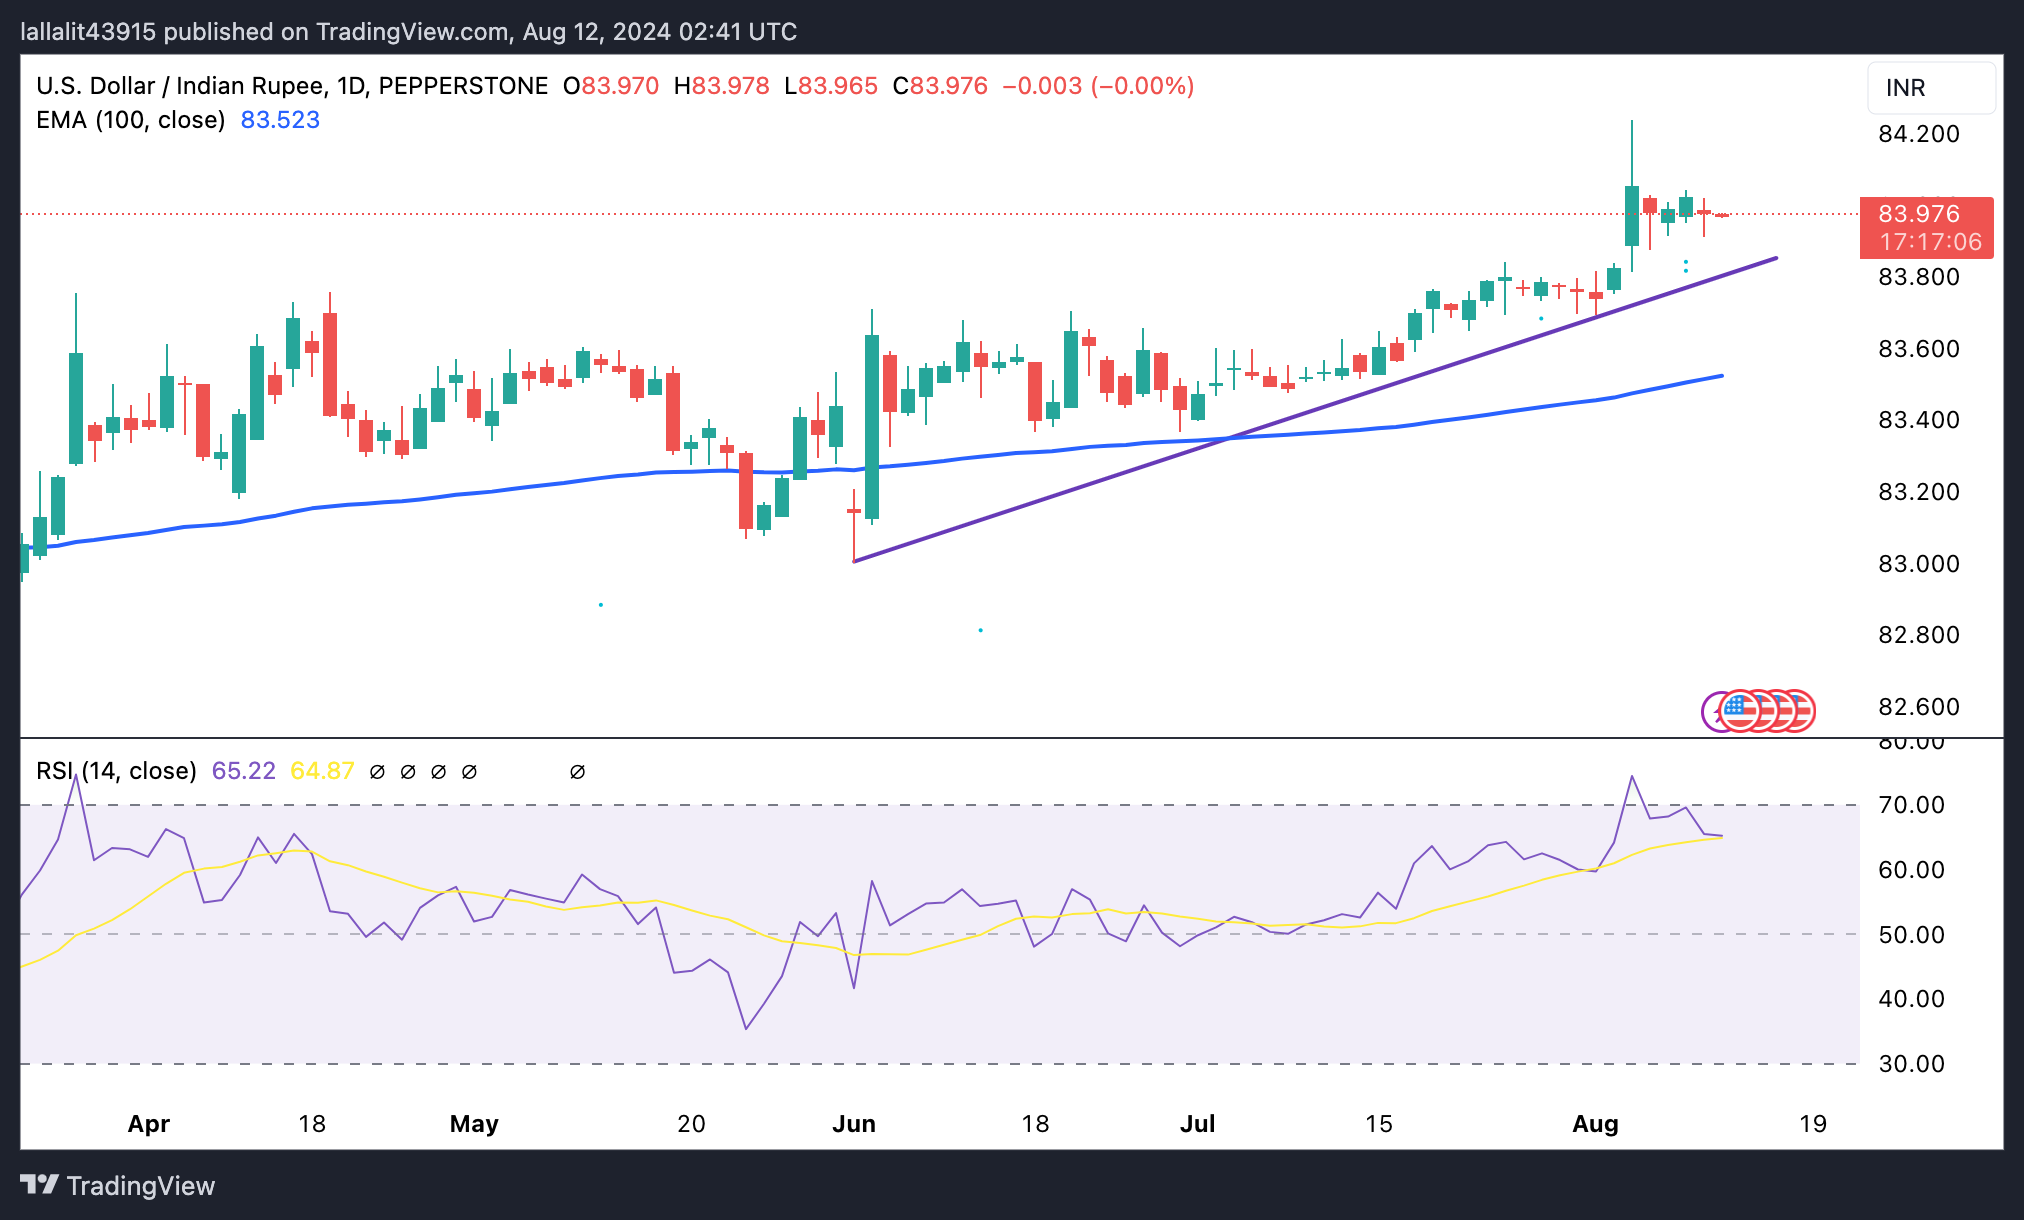
US Dollar price this week
The table below shows the percentage change of US Dollar (USD) against listed major currencies this week. US Dollar was the weakest against the Australian Dollar.
| USD | EUR | GBP | CAD | AUD | JPY | NZD | CHF | |
| USD | -0.05% | -0.09% | -0.02% | -0.23% | -0.09% | -0.23% | 0.02% | |
| EUR | 0.05% | -0.03% | 0.03% | -0.16% | -0.03% | -0.17% | 0.07% | |
| GBP | 0.08% | 0.03% | 0.06% | -0.14% | 0.00% | -0.14% | 0.10% | |
| CAD | 0.02% | -0.03% | -0.06% | -0.19% | -0.07% | -0.22% | 0.04% | |
| AUD | 0.23% | 0.16% | 0.13% | 0.20% | 0.13% | 0.00% | 0.25% | |
| JPY | 0.12% | 0.05% | 0.01% | 0.06% | -0.13% | -0.13% | 0.12% | |
| NZD | 0.22% | 0.17% | 0.14% | 0.20% | 0.01% | 0.12% | 0.24% | |
| CHF | -0.02% | -0.08% | -0.11% | -0.04% | -0.24% | -0.11% | -0.25% |
The heat map shows percentage changes of major currencies against each other. The base currency is picked from the left column, while the quote currency is picked from the top row. For example, if you pick the Euro from the left column and move along the horizontal line to the Japanese Yen, the percentage change displayed in the box will represent EUR (base)/JPY (quote).
Indian Rupee FAQs
The Indian Rupee (INR) is one of the most sensitive currencies to external factors. The price of Crude Oil (the country is highly dependent on imported Oil), the value of the US Dollar – most trade is conducted in USD – and the level of foreign investment, are all influential. Direct intervention by the Reserve Bank of India (RBI) in FX markets to keep the exchange rate stable, as well as the level of interest rates set by the RBI, are further major influencing factors on the Rupee.
The Reserve Bank of India (RBI) actively intervenes in forex markets to maintain a stable exchange rate, to help facilitate trade. In addition, the RBI tries to maintain the inflation rate at its 4% target by adjusting interest rates. Higher interest rates usually strengthen the Rupee. This is due to the role of the ‘carry trade’ in which investors borrow in countries with lower interest rates so as to place their money in countries’ offering relatively higher interest rates and profit from the difference.
Macroeconomic factors that influence the value of the Rupee include inflation, interest rates, the economic growth rate (GDP), the balance of trade, and inflows from foreign investment. A higher growth rate can lead to more overseas investment, pushing up demand for the Rupee. A less negative balance of trade will eventually lead to a stronger Rupee. Higher interest rates, especially real rates (interest rates less inflation) are also positive for the Rupee. A risk-on environment can lead to greater inflows of Foreign Direct and Indirect Investment (FDI and FII), which also benefit the Rupee.
Higher inflation, particularly, if it is comparatively higher than India’s peers, is generally negative for the currency as it reflects devaluation through oversupply. Inflation also increases the cost of exports, leading to more Rupees being sold to purchase foreign imports, which is Rupee-negative. At the same time, higher inflation usually leads to the Reserve Bank of India (RBI) raising interest rates and this can be positive for the Rupee, due to increased demand from international investors. The opposite effect is true of lower inflation.
- Gold price lacks firm intraday direction on Monday amid a combination of diverging forces.
- A positive risk tone caps gains, though geopolitical risks and Fed rate cut bets lend support.
- Traders also seem reluctant ahead of the key US inflation figures, due for release this week.
Gold price (XAU/USD) struggles to capitalize on its gains registered over the past two days and oscillates in a narrow trading band during the Asian session on Monday. A generally positive tone around the equity markets is seen acting as a headwind for the safe-haven precious metal, though a combination of factors should help limit any meaningful downside. The risk of a further escalation of geopolitical tensions in the Middle East should keep a lid on any optimism in the markets. Furthermore, dovish Federal Reserve (Fed) expectations keep the US Dollar (USD) bulls on the defensive and should offer support to the non-yielding yellow metal.
Traders also seem reluctant and might prefer to wait on the sidelines ahead of this week's release of the latest inflation figures from the US before placing aggressive directional bets around the Gold price. The US Producer Price Index (PPI) is due on Tuesday, followed by the US Consumer Price Index (CPI) on Wednesday. Apart from this, the US Retail Sales data on Thursday will influence expectations about the Fed's policy path, which, in turn, will drive the USD demand and provide some meaningful impetus to the XAU/USD. Apart from this, geopolitical developments will help in determining the near-term trajectory for the commodity.
Daily Digest Market Movers: Gold price draws support from Middle East tensions, dovish Fed expectations
- The Israel Defense Forces (IDF) intercepted approximately 30 projectiles that were identified as crossing from Lebanon into northern Israel early Monday morning.
- The Israeli Air Force and Military Intelligence Directorate have been placed on high alert following observations in Western Iran, suggesting an imminent attack.
- Hamas leaders are asking mediators of the cease-fire negotiations with Israel to present a plan based upon previous talks instead of engaging in new ones.
- The US is strengthening its capabilities in the Middle East by sending an additional guided missile submarine to the region in light of escalating regional tensions.
- The developments raise the risk of a broader conflict in the region and lend some support to the safe-haven Gold price amid dovish Federal Reserve expectations.
- Market participants have fully priced in a 25-basis points Fed rate cut move at the September policy meeting and see an equal chance of a bigger, 50-bps rate cut.
- This fails to assist the US Dollar in attracting any meaningful buying and turns out to be another factor acting as a tailwind for the non-yielding yellow metal.
- The commodity, however, lacks bullish conviction as investors await the release of the latest US inflation figures this week before placing directional bets.
- The US Producer Price Index (PPI) and the US Consumer Price Index (CPI) are due on Tuesday and Wednesday, respectively, followed by the US Retail Sales on Thursday.
- This might determine the Fed's future policy decisions, which, along with geopolitical developments, should provide a fresh directional impetus to the XAU/USD.
Technical Outlook: Gold price bulls have the upper hand; might aim to challenge all-time peak near $2,483-2,484 area
From a technical perspective, the recent bounce from the 50-day Simple Moving Average (SMA) support favors bullish traders. Moreover, oscillators on the daily chart are holding in positive territory. That said, the lack of strong follow-through warrants some caution before positioning for any meaningful appreciating move. In the meantime, any subsequent move up is more likely to confront some resistance near the $2,448-2,450 region. Some follow-through buying should pave the way for a move towards challenging the all-time top near the $2,483-2,484 area touched in July. This is followed by the $2,500 psychological mark, which if cleared decisively will set the stage for a further near-term appreciating move.
On the flip side, the $2,412-2,410 horizontal resistance breakpoint now seems to protect the immediate downside ahead of the $2,400 round-figure mark. Any further decline might continue to attract dip-buyers and remain cushioned near the 50-day SMA support, currently pegged near the $2,373-2,372 region. The latter should act as a key pivotal point, below which the Gold price could slide to the late July low, around the $2,353-2,352 area, which now coincides with the 100-day SMA support. A convincing break below will shift the near-term bias in favor of bearish traders and prompt aggressive technical selling.
Gold FAQs
Gold has played a key role in human’s history as it has been widely used as a store of value and medium of exchange. Currently, apart from its shine and usage for jewelry, the precious metal is widely seen as a safe-haven asset, meaning that it is considered a good investment during turbulent times. Gold is also widely seen as a hedge against inflation and against depreciating currencies as it doesn’t rely on any specific issuer or government.
Central banks are the biggest Gold holders. In their aim to support their currencies in turbulent times, central banks tend to diversify their reserves and buy Gold to improve the perceived strength of the economy and the currency. High Gold reserves can be a source of trust for a country’s solvency. Central banks added 1,136 tonnes of Gold worth around $70 billion to their reserves in 2022, according to data from the World Gold Council. This is the highest yearly purchase since records began. Central banks from emerging economies such as China, India and Turkey are quickly increasing their Gold reserves.
Gold has an inverse correlation with the US Dollar and US Treasuries, which are both major reserve and safe-haven assets. When the Dollar depreciates, Gold tends to rise, enabling investors and central banks to diversify their assets in turbulent times. Gold is also inversely correlated with risk assets. A rally in the stock market tends to weaken Gold price, while sell-offs in riskier markets tend to favor the precious metal.
The price can move due to a wide range of factors. Geopolitical instability or fears of a deep recession can quickly make Gold price escalate due to its safe-haven status. As a yield-less asset, Gold tends to rise with lower interest rates, while higher cost of money usually weighs down on the yellow metal. Still, most moves depend on how the US Dollar (USD) behaves as the asset is priced in dollars (XAU/USD). A strong Dollar tends to keep the price of Gold controlled, whereas a weaker Dollar is likely to push Gold prices up.
- WTI price may advance further due to escalating supply concerns amid Middle-East tensions.
- IDF intercepted around 30 "projectiles" that crossed from Lebanon into northern Israel early Monday.
- Oil prices gained ground due to positive economic data from China and the United States.
West Texas Intermediate (WTI) Oil price hovers around $76.00 per barrel during the Asian session on Monday. Crude Oil prices might extend their winning streak to a fourth consecutive day, driven by increasing supply concerns amid geopolitical tensions in the Middle East.
ABC News reported that the Israel Defense Forces (IDF) intercepted around 30 "projectiles" crossing from Lebanon into northern Israel early Monday. The IDF stated that some projectiles landed in open areas, and no injuries were reported.
On Saturday, the Israeli incursion into Gaza escalated with an airstrike targeting a school compound, leading to at least 90 fatalities, according to the Gaza Civil Emergency Service. Israel has contested this casualty figure, labeling it as exaggerated. Meanwhile, Hamas has expressed uncertainty about engaging in new ceasefire negotiations on Sunday, as reported by Reuters.
Oil prices were also driven higher by positive economic data from China and the United States (US). China's consumer prices rose faster than expected in July. China's Consumer Price Index (CPI) rose 0.5% year-on-year in July, exceeding the expected 0.3% and previous 0.2% readings. Meanwhile, the monthly index also increased 0.5%, swinging from the previous decline of 0.2%.
Additionally, US Initial Jobless Claims dropped to 233,000 for the week ending August 2, coming in under the market expectation of 240,000. This decline follows an upwardly revised figure of 250,000 for the previous week, which was the highest in a year.
Expectations for a potential interest rate cut by the Federal Reserve (Fed) in September could potentially provide support for the Oil demand, as lower borrowing cost will support the economic activities in the US. The CME FedWatch Tool indicates a 51.5% chance of a 25-basis point rate cut at the September meeting, a significant increase from the 26.0% probability reported a week ago.
WTI Oil FAQs
WTI Oil is a type of Crude Oil sold on international markets. The WTI stands for West Texas Intermediate, one of three major types including Brent and Dubai Crude. WTI is also referred to as “light” and “sweet” because of its relatively low gravity and sulfur content respectively. It is considered a high quality Oil that is easily refined. It is sourced in the United States and distributed via the Cushing hub, which is considered “The Pipeline Crossroads of the World”. It is a benchmark for the Oil market and WTI price is frequently quoted in the media.
Like all assets, supply and demand are the key drivers of WTI Oil price. As such, global growth can be a driver of increased demand and vice versa for weak global growth. Political instability, wars, and sanctions can disrupt supply and impact prices. The decisions of OPEC, a group of major Oil-producing countries, is another key driver of price. The value of the US Dollar influences the price of WTI Crude Oil, since Oil is predominantly traded in US Dollars, thus a weaker US Dollar can make Oil more affordable and vice versa.
The weekly Oil inventory reports published by the American Petroleum Institute (API) and the Energy Information Agency (EIA) impact the price of WTI Oil. Changes in inventories reflect fluctuating supply and demand. If the data shows a drop in inventories it can indicate increased demand, pushing up Oil price. Higher inventories can reflect increased supply, pushing down prices. API’s report is published every Tuesday and EIA’s the day after. Their results are usually similar, falling within 1% of each other 75% of the time. The EIA data is considered more reliable, since it is a government agency.
OPEC (Organization of the Petroleum Exporting Countries) is a group of 13 Oil-producing nations who collectively decide production quotas for member countries at twice-yearly meetings. Their decisions often impact WTI Oil prices. When OPEC decides to lower quotas, it can tighten supply, pushing up Oil prices. When OPEC increases production, it has the opposite effect. OPEC+ refers to an expanded group that includes ten extra non-OPEC members, the most notable of which is Russia.
| Raw materials | Closed | Change, % |
|---|---|---|
| Silver | 27.454 | -0.26 |
| Gold | 243.096 | 0.18 |
| Palladium | 904.86 | -1.82 |
- The Australian Dollar appreciates as the RBA may increase rates again if needed.
- The safe-haven flows may limit the upside of the AUD amid escalated Middle-East tensions.
- Fed Governor Michelle Bowman suggested that the US central bank may not be prepared to cut rates in September.
The Australian Dollar (AUD) retraces its recent losses against the US Dollar (USD) on Monday. The AUD/USD pair appreciates due to the hawkish sentiment surrounding the Reserve Bank of Australia (RBA). Additionally, the upbeat inflation in China, a close trade partner with Australia, might have provided support for the Aussie Dollar.
RBA Governor Michele Bullock highlighted last week the importance of remaining cautious regarding inflation risks and expressed that the central bank will not hesitate to raise rates again to combat inflation if needed. Those comments came just days after the RBA held rates steady at 4.35% for the sixth straight meeting.
On the USD front, market expectations for a potential interest rate cut by the Federal Reserve (Fed) in September could put pressure on the US Dollar (USD), potentially providing support for the AUD/USD pair.
Investors will likely focus on US producer inflation data set to be released on Tuesday and consumer inflation figures on Wednesday. Traders are looking for confirmation that price growth remains stable.
Daily Digest Market Movers: Australian Dollar rises due to a hawkish RBA
- The upside of the risk-sensitive AUD could be restrained due to safe-haven flows amid increased geopolitical tensions in the Middle East. On Sunday, Defense Minister Yoav Gallant informed US Defense Secretary Lloyd Austin that Iran's military activities indicate preparations for a significant strike on Israel, as reported by Axios writer Barak Ravid.
- On Sunday, Federal Reserve Governor Michelle Bowman stated that she continues to see upside risks for inflation and ongoing strength in the labor market. This suggests that the Fed may not be prepared to cut rates at their next meeting in September, according to Bloomberg.
- China's Consumer Price Index (CPI) rose 0.5% year-on-year in July, exceeding the expected 0.3% and previous 0.2% readings. Meanwhile, the monthly index also increased 0.5%, swinging from the previous decline of 0.2%.
- Westpac updated its RBA forecast, now predicting the first rate cut will occur in February 2025, a shift from the previously anticipated November 2024. They also revised their terminal rate forecast to 3.35%, up from the previous 3.10%. The RBA is now viewed as more cautious, needing stronger evidence before considering rate cuts.
- On Thursday, Kansas City Fed President Jeffrey Schmid stated that reducing monetary policy could be "appropriate" if inflation remains low. Schmid noted that the current Fed policy is "not that restrictive" and that while the Fed is close to its 2% inflation goal, it has not yet fully achieved it, per Reuters.
- Last week, Treasurer Jim Chalmers contested the RBA's view that the economy remains too robust and that large government budgets are contributing to prolonged inflation, according to Macrobusiness.
- RBA Governor Michele Bullock mentioned that the board had seriously considered increasing the cash rate from 4.35% to 4.6% due to ongoing concerns about excess demand in the economy. Additionally, RBA Chief Economist Sarah Hunter noted that the Australian economy is performing somewhat stronger than previously anticipated by the RBA.
Technical Analysis: Australian Dollar hovers around 0.6600, aligns with throwback support
The Australian Dollar trades around 0.6590 on Monday. The daily chart analysis shows that the AUD/USD pair is positioned within an ascending channel, indicating a bullish bias. Meanwhile, the 14-day Relative Strength Index (RSI) is consolidating below the 50 level. A move above this level could suggest a strengthening of bullish momentum.
In terms of resistance, the AUD/USD pair may test the upper boundary of the ascending channel at the 0.6630 level. A breakout above this level could propel the pair toward the region near its six-month high of 0.6798.
On the downside, the AUD/USD pair may find immediate support at the throwback level of 0.6575. A drop below this level could reinforce a bearish bias, potentially pushing the pair toward the lower boundary of the ascending channel around 0.6540. Additional support is seen at the throwback level of 0.6470.
AUD/USD: Daily Chart
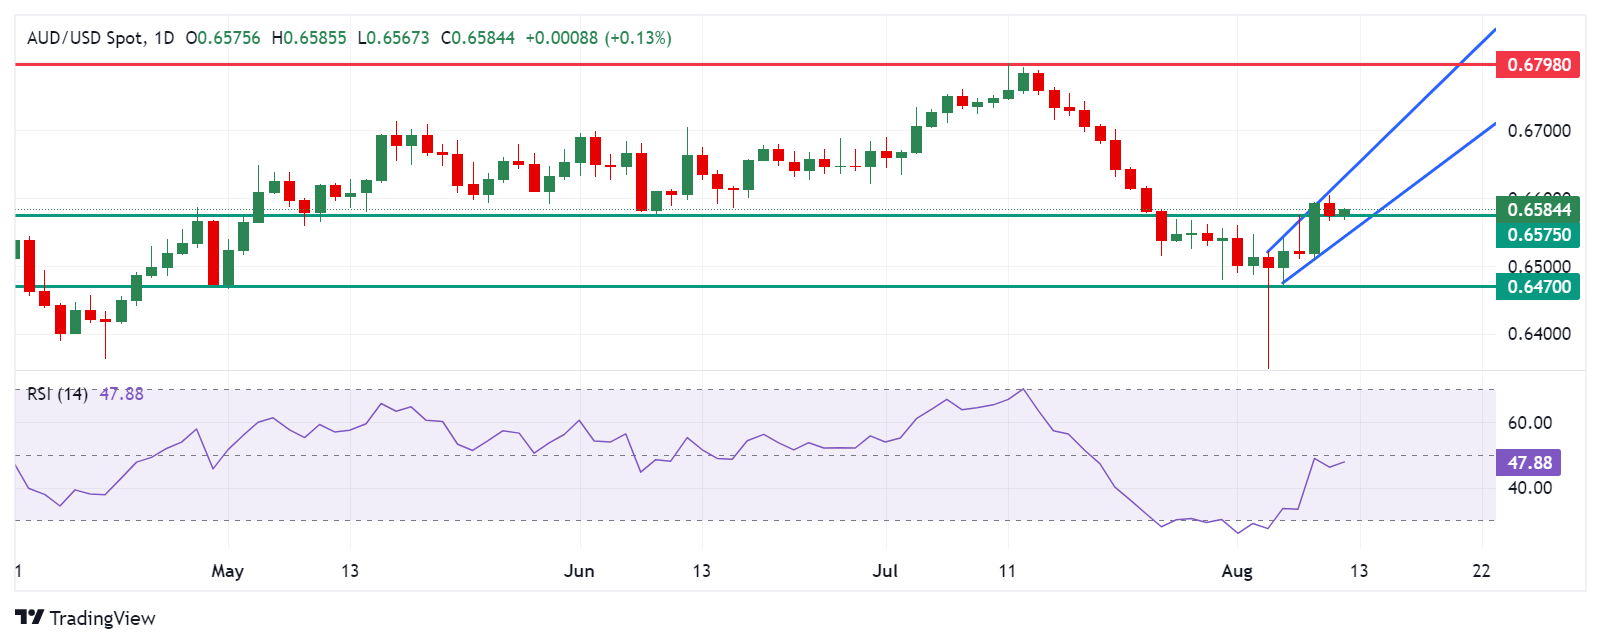
Australian Dollar PRICE Today
The table below shows the percentage change of Australian Dollar (AUD) against listed major currencies today. Australian Dollar was the strongest against the Japanese Yen.
| USD | EUR | GBP | JPY | CAD | AUD | NZD | CHF | |
|---|---|---|---|---|---|---|---|---|
| USD | -0.03% | 0.03% | 0.24% | -0.01% | -0.11% | -0.14% | 0.00% | |
| EUR | 0.03% | 0.09% | 0.24% | 0.01% | -0.19% | -0.10% | 0.05% | |
| GBP | -0.03% | -0.09% | 0.41% | -0.07% | -0.28% | -0.19% | -0.03% | |
| JPY | -0.24% | -0.24% | -0.41% | -0.24% | -0.41% | -0.37% | -0.25% | |
| CAD | 0.01% | -0.01% | 0.07% | 0.24% | -0.15% | -0.12% | 0.05% | |
| AUD | 0.11% | 0.19% | 0.28% | 0.41% | 0.15% | 0.09% | 0.25% | |
| NZD | 0.14% | 0.10% | 0.19% | 0.37% | 0.12% | -0.09% | 0.16% | |
| CHF | -0.01% | -0.05% | 0.03% | 0.25% | -0.05% | -0.25% | -0.16% |
The heat map shows percentage changes of major currencies against each other. The base currency is picked from the left column, while the quote currency is picked from the top row. For example, if you pick the Australian Dollar from the left column and move along the horizontal line to the US Dollar, the percentage change displayed in the box will represent AUD (base)/USD (quote).
RBA FAQs
The Reserve Bank of Australia (RBA) sets interest rates and manages monetary policy for Australia. Decisions are made by a board of governors at 11 meetings a year and ad hoc emergency meetings as required. The RBA’s primary mandate is to maintain price stability, which means an inflation rate of 2-3%, but also “..to contribute to the stability of the currency, full employment, and the economic prosperity and welfare of the Australian people.” Its main tool for achieving this is by raising or lowering interest rates. Relatively high interest rates will strengthen the Australian Dollar (AUD) and vice versa. Other RBA tools include quantitative easing and tightening.
While inflation had always traditionally been thought of as a negative factor for currencies since it lowers the value of money in general, the opposite has actually been the case in modern times with the relaxation of cross-border capital controls. Moderately higher inflation now tends to lead central banks to put up their interest rates, which in turn has the effect of attracting more capital inflows from global investors seeking a lucrative place to keep their money. This increases demand for the local currency, which in the case of Australia is the Aussie Dollar.
Macroeconomic data gauges the health of an economy and can have an impact on the value of its currency. Investors prefer to invest their capital in economies that are safe and growing rather than precarious and shrinking. Greater capital inflows increase the aggregate demand and value of the domestic currency. Classic indicators, such as GDP, Manufacturing and Services PMIs, employment, and consumer sentiment surveys can influence AUD. A strong economy may encourage the Reserve Bank of Australia to put up interest rates, also supporting AUD.
Quantitative Easing (QE) is a tool used in extreme situations when lowering interest rates is not enough to restore the flow of credit in the economy. QE is the process by which the Reserve Bank of Australia (RBA) prints Australian Dollars (AUD) for the purpose of buying assets – usually government or corporate bonds – from financial institutions, thereby providing them with much-needed liquidity. QE usually results in a weaker AUD.
Quantitative tightening (QT) is the reverse of QE. It is undertaken after QE when an economic recovery is underway and inflation starts rising. Whilst in QE the Reserve Bank of Australia (RBA) purchases government and corporate bonds from financial institutions to provide them with liquidity, in QT the RBA stops buying more assets, and stops reinvesting the principal maturing on the bonds it already holds. It would be positive (or bullish) for the Australian Dollar.
While Hamas proposed a cease-fire implementation plan, ABC News reported, citing the Israel Defense Forces (IDF) that they intercepted roughly 30 "projectiles" that were identified as crossing from Lebanon into northern Israel early Monday.
No injuries were reported as some projectiles landed in open areas, the IDF said.
In response, the IDF said it was striking the sources of fire.
This comes as ongoing cease-fire negotiations are underway after a diplomatic push from the United States, Egypt and Qatar for a new round of talks to take place between Israel and Hamas on Aug. 15 in either Doha or Cairo.
Also read: Israel stays on high alert, indications suggesting imminent Iran attack
Market reaction
When writing, markets remain in a wait-and-see mode, with the US Dollar Index modestly flat at around 103.15 while the US S&P 500 futures – a risk barometer- also unchanged on the day. Gold price holds lower ground near $2,425 despite a cautious mood.
Risk sentiment FAQs
In the world of financial jargon the two widely used terms “risk-on” and “risk off'' refer to the level of risk that investors are willing to stomach during the period referenced. In a “risk-on” market, investors are optimistic about the future and more willing to buy risky assets. In a “risk-off” market investors start to ‘play it safe’ because they are worried about the future, and therefore buy less risky assets that are more certain of bringing a return, even if it is relatively modest.
Typically, during periods of “risk-on”, stock markets will rise, most commodities – except Gold – will also gain in value, since they benefit from a positive growth outlook. The currencies of nations that are heavy commodity exporters strengthen because of increased demand, and Cryptocurrencies rise. In a “risk-off” market, Bonds go up – especially major government Bonds – Gold shines, and safe-haven currencies such as the Japanese Yen, Swiss Franc and US Dollar all benefit.
The Australian Dollar (AUD), the Canadian Dollar (CAD), the New Zealand Dollar (NZD) and minor FX like the Ruble (RUB) and the South African Rand (ZAR), all tend to rise in markets that are “risk-on”. This is because the economies of these currencies are heavily reliant on commodity exports for growth, and commodities tend to rise in price during risk-on periods. This is because investors foresee greater demand for raw materials in the future due to heightened economic activity.
The major currencies that tend to rise during periods of “risk-off” are the US Dollar (USD), the Japanese Yen (JPY) and the Swiss Franc (CHF). The US Dollar, because it is the world’s reserve currency, and because in times of crisis investors buy US government debt, which is seen as safe because the largest economy in the world is unlikely to default. The Yen, from increased demand for Japanese government bonds, because a high proportion are held by domestic investors who are unlikely to dump them – even in a crisis. The Swiss Franc, because strict Swiss banking laws offer investors enhanced capital protection.
- The New Zealand Dollar gains traction in Monday’s early Asian session.
- Diminishing odds of an RBNZ rate cut and hotter Chinese inflation data underpin the Kiwi.
- The RBNZ monetary policy meeting will take center stage on Wednesday.
The New Zealand Dollar (NZD) attracts some buyers to near the 0.6000 psychological level on Monday. The Kiwi gains traction as markets trimmed bets on a rate cut by the Reserve Bank of New Zealand (RBNZ) at its August meeting on Wednesday after the stronger-than-expected employment report. Furthermore, the hotter Chinese July Consumer Price Index (CPI) supports the China-proxy NZD as China is New Zealand's largest trading partner.
Nonetheless, the heightened volatility and elevated geopolitical risks in the Middle East might exert some selling pressure on riskier assets like the Kiwi and cap the pair’s upside. Traders await the RBNZ interest rate decision on Wednesday for fresh catalysts. On the US docket, the Producer Price Index (PPI), Consumer Price Index (CPI) and Retail Sales will be released on Tuesday, Wednesday and Thursday, respectively.
Daily Digest Market Movers: New Zealand Dollar trades stronger as traders trimmed bets on RBNZ rate cut
- 12 of 21 economists surveyed by Bloomberg expect the New Zealand central bank to keep the OCR at 5.5% on Wednesday.
- The NZIER Shadow Board is split on whether the Reserve Bank of New Zealand (RBNZ) should lower the Official Cash Rate (OCR) in its forthcoming August Monetary Policy Statement.
- Over half of the Shadow Board members expect a 25 bps reduction in the OCR required due to the persistent weakening of the New Zealand economy. The other members suggested that the Reserve Bank should keep the OCR at 5.50%.
- China’s CPI climbed 0.5% year-on-year in July, compared to a 0.2% increase in June, hotter than the expectations of a 0.3% rise, the National Bureau of Statistics of China reported on Friday. On a monthly basis, Chinese CPI inflation arrived at 0.5% MoM in July versus -0.2% prior, above the consensus of 0.3%.
- Fed Governor Michelle Bowman stated on Sunday that she still sees upside risks for inflation and continued strength in the labor market, highlighting the Fed may not be ready to cut rates at its upcoming meeting in September, per Reuters.
- Traders have priced in nearly 52.5% odds that the Fed will cut the rate by 50 basis points (bps) in the September meeting, down from 57.5% last week, according to the CME FedWatch Tool.
Technical Analysis: New Zealand Dollar remains bearish in the longer term
The New Zealand Dollar edges higher on the day. However, the NZD/USD pair keeps the bearish vibe on the daily timeframe, characterized by the price remaining below the key 100-day Exponential Moving Average (EMA). The 14-day Relative Strength Index (RSI) stands in the neutral territory, hovering around the 50 midline. This suggests that the price might face consolidation before making a decisive move.
In the bullish scenario, the 100-period EMA near 0.6050 acts as an immediate resistance level for NZD/USD. Further north, this may pave the way for a move towards 0.6080, the upper boundary of the Bollinger Band. The additional upside filter to watch is 0.6134, a high of July 9.
If sellers regain control, we could see a pullback towards 0.5912, a low of August 6. Sustained trading below the mentioned level could drag the pair to 0.5856, a low of July 29 and the lower limit of the Bollinger Band.
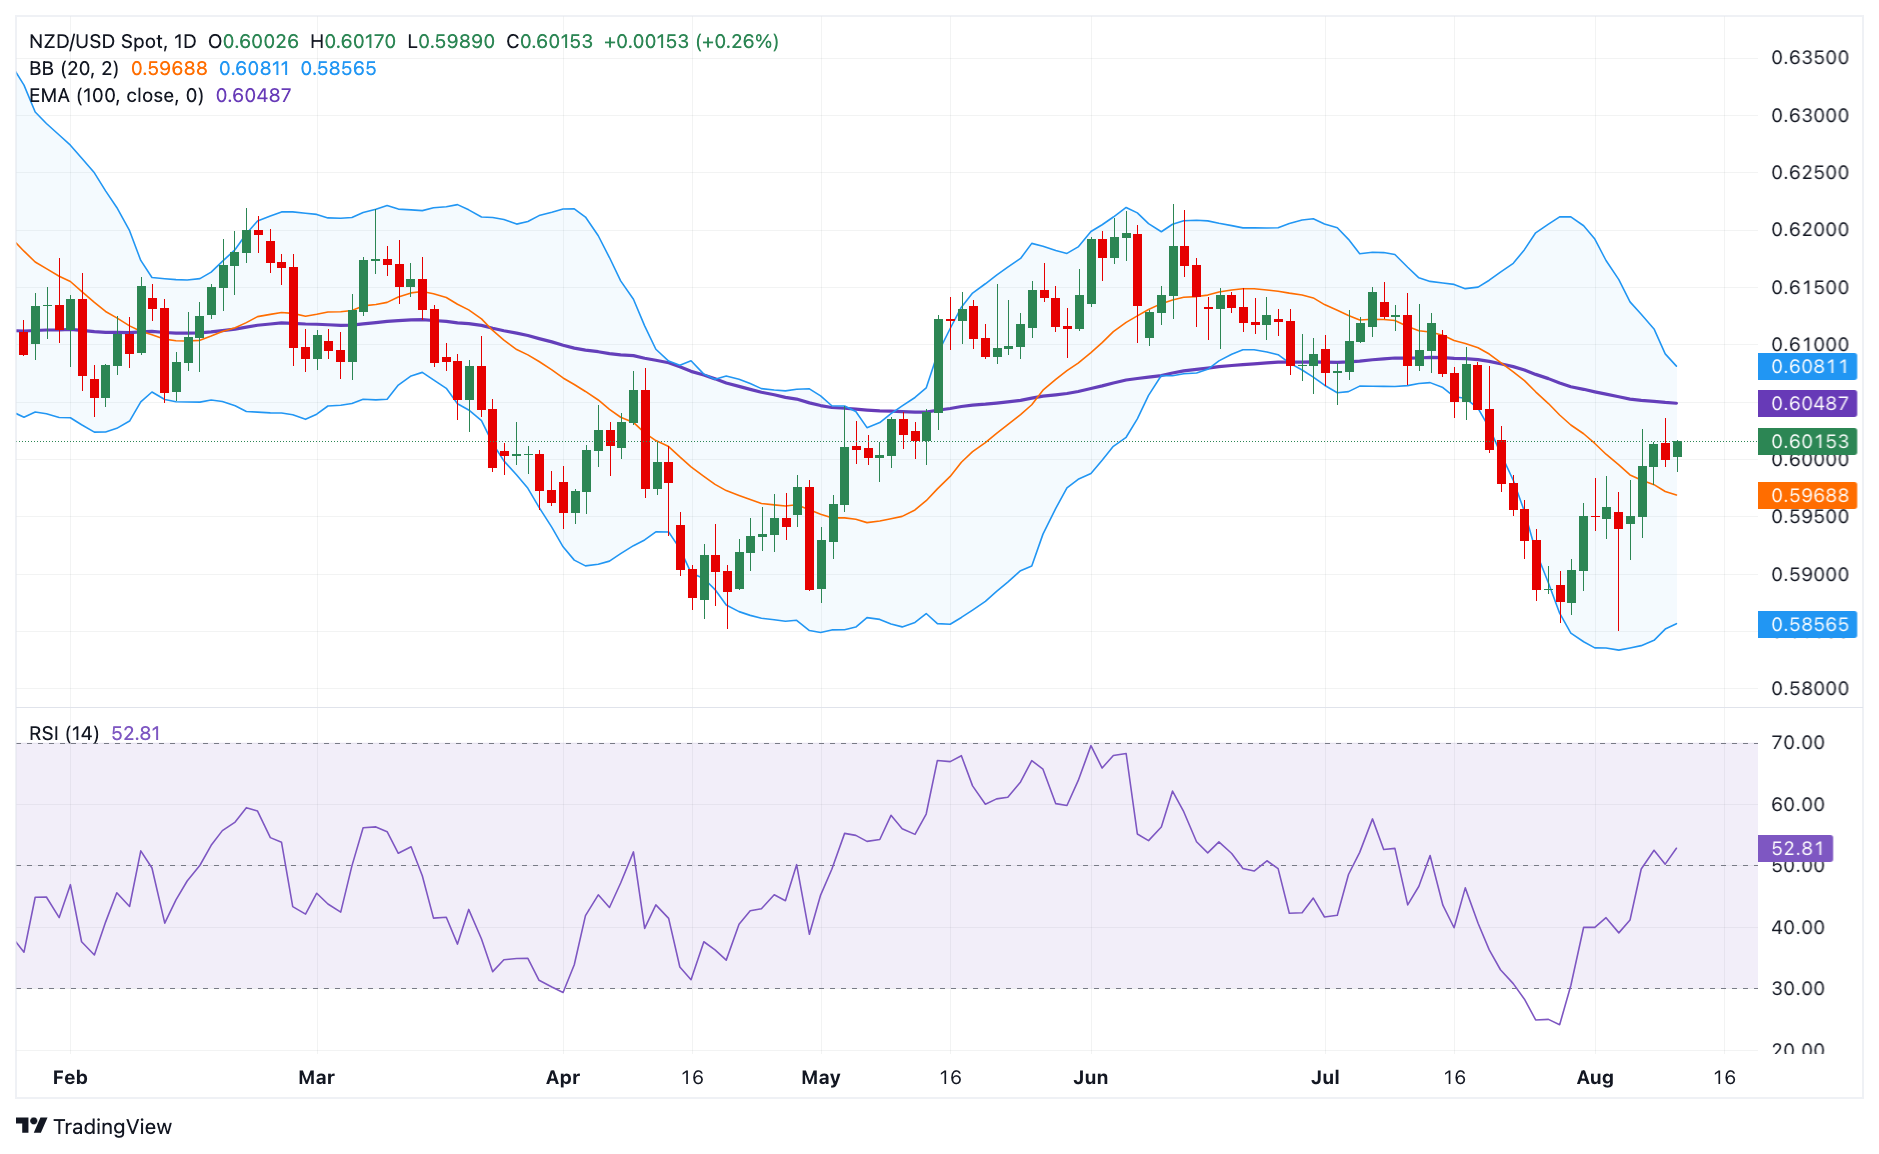
US Dollar price today
The table below shows the percentage change of US Dollar (USD) against listed major currencies today. US Dollar was the weakest against the New Zealand Dollar.
| USD | EUR | GBP | CAD | AUD | JPY | NZD | CHF | |
| USD | -0.08% | -0.09% | -0.05% | -0.26% | -0.16% | -0.34% | -0.04% | |
| EUR | 0.10% | 0.02% | 0.05% | -0.14% | -0.05% | -0.23% | 0.06% | |
| GBP | 0.09% | 0.00% | 0.04% | -0.17% | -0.07% | -0.25% | 0.03% | |
| CAD | 0.06% | -0.03% | -0.02% | -0.19% | -0.10% | -0.28% | 0.01% | |
| AUD | 0.26% | 0.16% | 0.16% | 0.18% | 0.08% | -0.10% | 0.19% | |
| JPY | 0.17% | 0.07% | 0.06% | 0.09% | -0.10% | -0.18% | 0.11% | |
| NZD | 0.33% | 0.24% | 0.24% | 0.28% | 0.08% | 0.16% | 0.28% | |
| CHF | 0.06% | -0.02% | -0.02% | 0.01% | -0.19% | -0.10% | -0.28% |
The heat map shows percentage changes of major currencies against each other. The base currency is picked from the left column, while the quote currency is picked from the top row. For example, if you pick the Euro from the left column and move along the horizontal line to the Japanese Yen, the percentage change displayed in the box will represent EUR (base)/JPY (quote).
New Zealand Dollar FAQs
The New Zealand Dollar (NZD), also known as the Kiwi, is a well-known traded currency among investors. Its value is broadly determined by the health of the New Zealand economy and the country’s central bank policy. Still, there are some unique particularities that also can make NZD move. The performance of the Chinese economy tends to move the Kiwi because China is New Zealand’s biggest trading partner. Bad news for the Chinese economy likely means less New Zealand exports to the country, hitting the economy and thus its currency. Another factor moving NZD is dairy prices as the dairy industry is New Zealand’s main export. High dairy prices boost export income, contributing positively to the economy and thus to the NZD.
The Reserve Bank of New Zealand (RBNZ) aims to achieve and maintain an inflation rate between 1% and 3% over the medium term, with a focus to keep it near the 2% mid-point. To this end, the bank sets an appropriate level of interest rates. When inflation is too high, the RBNZ will increase interest rates to cool the economy, but the move will also make bond yields higher, increasing investors’ appeal to invest in the country and thus boosting NZD. On the contrary, lower interest rates tend to weaken NZD. The so-called rate differential, or how rates in New Zealand are or are expected to be compared to the ones set by the US Federal Reserve, can also play a key role in moving the NZD/USD pair.
Macroeconomic data releases in New Zealand are key to assess the state of the economy and can impact the New Zealand Dollar’s (NZD) valuation. A strong economy, based on high economic growth, low unemployment and high confidence is good for NZD. High economic growth attracts foreign investment and may encourage the Reserve Bank of New Zealand to increase interest rates, if this economic strength comes together with elevated inflation. Conversely, if economic data is weak, NZD is likely to depreciate.
The New Zealand Dollar (NZD) tends to strengthen during risk-on periods, or when investors perceive that broader market risks are low and are optimistic about growth. This tends to lead to a more favorable outlook for commodities and so-called ‘commodity currencies’ such as the Kiwi. Conversely, NZD tends to weaken at times of market turbulence or economic uncertainty as investors tend to sell higher-risk assets and flee to the more-stable safe havens.
- USD/JPY kicks off the new week on a positive note, albeit lacks any follow-through buying.
- Persistent geopolitical risks lend support to the safe-haven JPY and cap gains for the major.
- The divergent BoJ-Fed policy expectations also contribute to keeping bulls on the sidelines.
The USD/JPY pair attracts some dip-buyers on the first day of a new week, albeit struggles to find acceptance above the 147.00 mark and capitalize on the move up. Sot prices surrender a major part of the intraday gains and currently trade with a mild positive bias, around the 146.75-146.80 region.
A former Bank of Japan (BoJ) board member Makoto Sakurai said that the central bank will not be able to hike again in 2024 and predicts a rate hike by March 2025 citing the recent market turmoil and the low likelihood of a rapid economic recovery. This comes on top of the recent dovish remarks by BoJ Deputy Governor Shinichi Uchida, saying that the central bank won't hike rates when markets are unstable, and undermines the Japanese Yen (JPY), lending some support to the USD/JPY pair.
Apart from this, a generally positive tone around the equity markets dents the JPY's relative safe-haven status, which, along with a modest US Dollar (USD) uptick, contributes to the bid tone surrounding the USD/JPY pair. Meanwhile, the BoJ's summary of opinions from the July policy meeting released last week indicated that some members see room for further rate hikes and policy normalization. Moreover, geopolitical risks help limit deeper JPY losses and cap the USD/JPY pair.
In fact, the Israeli intelligence community believed that Iran has decided to attack Israel directly and may do so within days in retaliation for the assassination of Hamas leader Ismail Haniyeh in Tehran in late July. Furthermore, US Defense Secretary Lloyd Austin told his Israeli counterpart, Gallant, in a call that he has ordered the USS Abraham Lincoln carrier strike group to accelerate its transit to the Middle East and the USS Georgia guided missile submarine to the Central Command region.
This poses the risk of a further escalation of geopolitical tensions in the Middle East. Apart from this,
rising bets for bigger interest rate cuts by the Federal Reserve (Fed) in September hold back the USD bulls from placing aggressive bets. This, in turn, contributes to keeping a lid on the USD/JPY pair amid relatively thin liquidity on the back of a holiday in Japan and absent relevant market-moving economic data.
Traders also seem reluctant and might prefer to wait on the sidelines ahead of this week's release of the US consumer inflation figures before placing fresh directional bets. The crucial CPI report will play a key role in influencing the Fed's future policy decisions, which, in turn, should provide some meaningful impetus to the Greenback and the USD/JPY pair.
Bank of Japan FAQs
The Bank of Japan (BoJ) is the Japanese central bank, which sets monetary policy in the country. Its mandate is to issue banknotes and carry out currency and monetary control to ensure price stability, which means an inflation target of around 2%.
The Bank of Japan has embarked in an ultra-loose monetary policy since 2013 in order to stimulate the economy and fuel inflation amid a low-inflationary environment. The bank’s policy is based on Quantitative and Qualitative Easing (QQE), or printing notes to buy assets such as government or corporate bonds to provide liquidity. In 2016, the bank doubled down on its strategy and further loosened policy by first introducing negative interest rates and then directly controlling the yield of its 10-year government bonds.
The Bank’s massive stimulus has caused the Yen to depreciate against its main currency peers. This process has exacerbated more recently due to an increasing policy divergence between the Bank of Japan and other main central banks, which have opted to increase interest rates sharply to fight decades-high levels of inflation. The BoJ’s policy of holding down rates has led to a widening differential with other currencies, dragging down the value of the Yen.
A weaker Yen and the spike in global energy prices have led to an increase in Japanese inflation, which has exceeded the BoJ’s 2% target. With wage inflation becoming a cause of concern, the BoJ looks to move away from ultra loose policy, while trying to avoid slowing the activity too much.
On Monday, the People’s Bank of China (PBOC) set the USD/CNY central rate for the trading session ahead at 7.1458, as against Friday's fix of 7.1449 and 7.1777 Reuters estimates.
- EUR/USD holds gains despite increasing risk aversion sentiment on Monday.
- Israeli intelligence expects Iran to launch an attack within the next few days.
- Fed Governor Bowman suggests that the central bank may not be prepared to cut rates in September.
EUR/USD halts its four-day losing streak, trading around 1.0920 during the Asian session on Monday. Traders await the preliminary Gross Domestic Product (GDP) data for the Eurozone's second quarter, which is set to be released on Wednesday.
The risk-sensitive Euro might encounter difficulties due to heightened geopolitical tensions in the Middle East. On Sunday, Defense Minister Yoav Gallant informed US Defense Secretary Lloyd Austin that Iran's military movements suggest preparations for a major strike on Israel. This potential action is reportedly in retaliation for the assassination of Hamas leader Ismail Haniyeh in Tehran in late July, according to Axios writer Barak Ravid.
On the USD front, investors will likely focus on US producer inflation data set to be released on Tuesday and consumer inflation figures on Wednesday. Traders are looking for confirmation that price growth remains stable.
Expectations for a potential interest rate cut by the Federal Reserve (Fed) in September could put pressure on the US Dollar (USD), potentially providing support for the EUR/USD pair. The CME FedWatch Tool indicates a 51.5% chance of a 25-basis point rate cut at the September meeting, a significant increase from the 26.0% probability reported a week ago.
On Sunday, Federal Reserve Governor Michelle Bowman stated that she continues to see upside risks for inflation and ongoing strength in the labor market. This suggests that the Fed may not be prepared to cut rates at their next meeting in September, according to Bloomberg.
Euro FAQs
The Euro is the currency for the 20 European Union countries that belong to the Eurozone. It is the second most heavily traded currency in the world behind the US Dollar. In 2022, it accounted for 31% of all foreign exchange transactions, with an average daily turnover of over $2.2 trillion a day. EUR/USD is the most heavily traded currency pair in the world, accounting for an estimated 30% off all transactions, followed by EUR/JPY (4%), EUR/GBP (3%) and EUR/AUD (2%).
The European Central Bank (ECB) in Frankfurt, Germany, is the reserve bank for the Eurozone. The ECB sets interest rates and manages monetary policy. The ECB’s primary mandate is to maintain price stability, which means either controlling inflation or stimulating growth. Its primary tool is the raising or lowering of interest rates. Relatively high interest rates – or the expectation of higher rates – will usually benefit the Euro and vice versa. The ECB Governing Council makes monetary policy decisions at meetings held eight times a year. Decisions are made by heads of the Eurozone national banks and six permanent members, including the President of the ECB, Christine Lagarde.
Eurozone inflation data, measured by the Harmonized Index of Consumer Prices (HICP), is an important econometric for the Euro. If inflation rises more than expected, especially if above the ECB’s 2% target, it obliges the ECB to raise interest rates to bring it back under control. Relatively high interest rates compared to its counterparts will usually benefit the Euro, as it makes the region more attractive as a place for global investors to park their money.
Data releases gauge the health of the economy and can impact on the Euro. Indicators such as GDP, Manufacturing and Services PMIs, employment, and consumer sentiment surveys can all influence the direction of the single currency. A strong economy is good for the Euro. Not only does it attract more foreign investment but it may encourage the ECB to put up interest rates, which will directly strengthen the Euro. Otherwise, if economic data is weak, the Euro is likely to fall. Economic data for the four largest economies in the euro area (Germany, France, Italy and Spain) are especially significant, as they account for 75% of the Eurozone’s economy.
Another significant data release for the Euro is the Trade Balance. This indicator measures the difference between what a country earns from its exports and what it spends on imports over a given period. If a country produces highly sought after exports then its currency will gain in value purely from the extra demand created from foreign buyers seeking to purchase these goods. Therefore, a positive net Trade Balance strengthens a currency and vice versa for a negative balance.
- GBP/USD attracts some sellers on Monday amid a modest USD uptick.
- Geopolitical risks turn out to be a key factor benefitting the Greenback.
- Dovish Fed expectations should cap the buck and limit further downside.
The GBP/USD pair kicks off the new week on a weaker note and for now, seems to have stalled a two-day-old recovery from the 1.2665 area, or the lowest level since July touched last Thursday. Spot prices currently trade around the mid-1.2700s as traders look forward to this week's important macro releases from the UK and the US.
The monthly UK employment data and the US Producer Price Index (PPI) will be published on Tuesday, which will be followed by the UK and the US consumer inflation figures on Wednesday. Apart from this, the Preliminary UK Q2 GDP on Thursday will influence the sentiment surrounding the British Pound (GBP) and help determine the next leg of a directional move for the GBP/USD pair.
In the meantime, the recent move by the Bank of England (BoE) to cut interest rates on August 1 for the first time since 2020, bets for two more rate cuts in 2024 and the ongoing riots in the UK continue to undermine the GBP. Furthermore, the risk of a further escalation of geopolitical risks in the Middle East lends some support to the safe-haven US Dollar (USD) and exerts pressure on the GBP/USD pair.
In fact, the Israeli intelligence community believed that Iran has decided to attack Israel directly and may do so within days in retaliation for the assassination of Hamas leader Ismail Haniyeh in Tehran in late July. That said, expectations for bigger interest rate cuts by the Federal Reserve (Fed) might hold back the USD bulls from placing aggressive bets and act as a tailwind for the GBP/USD pair.
Hence, it will be prudent to wait for strong follow-through selling before positioning for the resumption of a three-week-old downtrend from the vicinity of mid-1.3000s, or a one-year peak touched in July. In the absence of any relevant market-moving economic releases on Monday, the USD price dynamics will influence the GBP/USD pair and produce short-term trading opportunities.
Pound Sterling FAQs
The Pound Sterling (GBP) is the oldest currency in the world (886 AD) and the official currency of the United Kingdom. It is the fourth most traded unit for foreign exchange (FX) in the world, accounting for 12% of all transactions, averaging $630 billion a day, according to 2022 data. Its key trading pairs are GBP/USD, aka ‘Cable’, which accounts for 11% of FX, GBP/JPY, or the ‘Dragon’ as it is known by traders (3%), and EUR/GBP (2%). The Pound Sterling is issued by the Bank of England (BoE).
The single most important factor influencing the value of the Pound Sterling is monetary policy decided by the Bank of England. The BoE bases its decisions on whether it has achieved its primary goal of “price stability” – a steady inflation rate of around 2%. Its primary tool for achieving this is the adjustment of interest rates. When inflation is too high, the BoE will try to rein it in by raising interest rates, making it more expensive for people and businesses to access credit. This is generally positive for GBP, as higher interest rates make the UK a more attractive place for global investors to park their money. When inflation falls too low it is a sign economic growth is slowing. In this scenario, the BoE will consider lowering interest rates to cheapen credit so businesses will borrow more to invest in growth-generating projects.
Data releases gauge the health of the economy and can impact the value of the Pound Sterling. Indicators such as GDP, Manufacturing and Services PMIs, and employment can all influence the direction of the GBP. A strong economy is good for Sterling. Not only does it attract more foreign investment but it may encourage the BoE to put up interest rates, which will directly strengthen GBP. Otherwise, if economic data is weak, the Pound Sterling is likely to fall.
Another significant data release for the Pound Sterling is the Trade Balance. This indicator measures the difference between what a country earns from its exports and what it spends on imports over a given period. If a country produces highly sought-after exports, its currency will benefit purely from the extra demand created from foreign buyers seeking to purchase these goods. Therefore, a positive net Trade Balance strengthens a currency and vice versa for a negative balance.
| Index | Change, points | Closed | Change, % |
|---|---|---|---|
| NIKKEI 225 | 193.85 | 35025 | 0.56 |
| Hang Seng | 198.4 | 17090.23 | 1.17 |
| KOSPI | 31.7 | 2588.43 | 1.24 |
| ASX 200 | 95.7 | 7777.7 | 1.25 |
| DAX | 42.48 | 17722.88 | 0.24 |
| CAC 40 | 22.26 | 7269.71 | 0.31 |
| Dow Jones | 51.05 | 39497.54 | 0.13 |
| S&P 500 | 24.85 | 5344.16 | 0.47 |
| NASDAQ Composite | 85.28 | 16745.3 | 0.51 |
The Israeli intelligence community believed Iran has decided to attack Israel directly and may do so within days, Axios reporter Barak Ravid said on Sunday, citing two sources.
The action would be in retaliation for the assassination of Hamas leader Ismail Haniyeh in Tehran in late July, Ravid said. Israel has not claimed or denied responsibility for the killing.
Market reaction
At the time of writing, the gold price (XAU/USD) is trading 0.10% lower on the day to trade at $2,428.
Risk sentiment FAQs
In the world of financial jargon the two widely used terms “risk-on” and “risk off'' refer to the level of risk that investors are willing to stomach during the period referenced. In a “risk-on” market, investors are optimistic about the future and more willing to buy risky assets. In a “risk-off” market investors start to ‘play it safe’ because they are worried about the future, and therefore buy less risky assets that are more certain of bringing a return, even if it is relatively modest.
Typically, during periods of “risk-on”, stock markets will rise, most commodities – except Gold – will also gain in value, since they benefit from a positive growth outlook. The currencies of nations that are heavy commodity exporters strengthen because of increased demand, and Cryptocurrencies rise. In a “risk-off” market, Bonds go up – especially major government Bonds – Gold shines, and safe-haven currencies such as the Japanese Yen, Swiss Franc and US Dollar all benefit.
The Australian Dollar (AUD), the Canadian Dollar (CAD), the New Zealand Dollar (NZD) and minor FX like the Ruble (RUB) and the South African Rand (ZAR), all tend to rise in markets that are “risk-on”. This is because the economies of these currencies are heavily reliant on commodity exports for growth, and commodities tend to rise in price during risk-on periods. This is because investors foresee greater demand for raw materials in the future due to heightened economic activity.
The major currencies that tend to rise during periods of “risk-off” are the US Dollar (USD), the Japanese Yen (JPY) and the Swiss Franc (CHF). The US Dollar, because it is the world’s reserve currency, and because in times of crisis investors buy US government debt, which is seen as safe because the largest economy in the world is unlikely to default. The Yen, from increased demand for Japanese government bonds, because a high proportion are held by domestic investors who are unlikely to dump them – even in a crisis. The Swiss Franc, because strict Swiss banking laws offer investors enhanced capital protection.
| Pare | Closed | Change, % |
|---|---|---|
| AUDUSD | 0.65717 | -0.3 |
| EURJPY | 160.072 | -0.46 |
| EURUSD | 1.09151 | -0.01 |
| GBPJPY | 187.074 | -0.35 |
| GBPUSD | 1.27568 | 0.09 |
| NZDUSD | 0.59981 | -0.25 |
| USDCAD | 1.37287 | -0.03 |
| USDCHF | 0.86519 | -0.18 |
| USDJPY | 146.642 | -0.43 |


© 2000-2026. Sva prava zaštićena.
Sajt je vlasništvo kompanije Teletrade D.J. LLC 2351 LLC 2022 (Euro House, Richmond Hill Road, Kingstown, VC0100, St. Vincent and the Grenadines).
Svi podaci koji se nalaze na sajtu ne predstavljaju osnovu za donošenje investicionih odluka, već su informativnog karaktera.
The company does not serve or provide services to customers who are residents of the US, Canada, Iran, The Democratic People's Republic of Korea, Yemen and FATF blacklisted countries.
Izvršenje trgovinskih operacija sa finansijskim instrumentima upotrebom marginalne trgovine pruža velike mogućnosti i omogućava investitorima ostvarivanje visokih prihoda. Međutim, takav vid trgovine povezan je sa potencijalno visokim nivoom rizika od gubitka sredstava. Проведение торговых операций на финанcовых рынках c маржинальными финанcовыми инcтрументами открывает широкие возможноcти, и позволяет инвеcторам, готовым пойти на риcк, получать выcокую прибыль, но при этом неcет в cебе потенциально выcокий уровень риcка получения убытков. Iz tog razloga je pre započinjanja trgovine potrebno odlučiti o izboru odgovarajuće investicione strategije, uzimajući u obzir raspoložive resurse.
Upotreba informacija: U slučaju potpunog ili delimičnog preuzimanja i daljeg korišćenja materijala koji se nalazi na sajtu, potrebno je navesti link odgovarajuće stranice na sajtu kompanije TeleTrade-a kao izvora informacija. Upotreba materijala na internetu mora biti praćena hiper linkom do web stranice teletrade.org. Automatski uvoz materijala i informacija sa stranice je zabranjen.
Ako imate bilo kakvih pitanja, obratite nam se pr@teletrade.global.
транcфери