- Analiza
- Novosti i instrumenti
- Vesti sa tržišta
Forex-novosti i prognoze od 11-10-2024
- AUD/USD prints gains on Friday after US Producer Price Index (PPI) data showed inflation easing.
- The US Core PPI rose by 0.2% MoM as expected, while annual PPI declined to 1.8%, increasing the likelihood of a Fed rate cut.
- Swaps markets show a 95.6% chance of a 25 bps Fed rate cut in November, up from 83.3%.
The Australian Dollar recovered some ground against the Greenback on Friday after a measure of prices paid by producers reaffirmed that inflation is coming down, warranting further easing by the Federal Reserve. The AUD/USD trades at 0.6748, registering modest gains of over 0.12%, though it is set to post weekly losses of over 0.60%.
AUD/USD climbs as US PPI data reinforces expectations for a 25 bps Fed rate cut in November
Data from the US Bureau of Labor Statistics (BLS) showed that the Producer Price Index (PPI) for September was 0% unchanged, below August’s 0.2% Month-on-Month increase. Excluding volatile items, the so-called Core PPI expanded by 0.2% Month-on-Month as expected, down from 0.3% a prior month.
On an annual basis, PPI increased by 1.8%, down from 1.9%, while underlying prices rose by 2.8%, up from 2.6%, and missed the 2.7% mark. Today’s data and yesterday’s CPI report hint that the Fed could cut rates at the November meeting.
The swaps markets show the Fed’s odds for a 25 bps rate cut at 95.6%, substantially up from 83.3% a day ago, when traders trimmed their positions on hawkish remarks by Atlanta’s Fed Raphael Bostic, who said he is open to cut or hold rates at the upcoming two meetings.
In other data, the University of Michigan (UoM) revealed that Consumer Sentiment deteriorated slightly from 70.1 to 68.9 and missed the consensus. Americans turned pessimistic due to higher living costs, while they upward revised inflation expectations from 2.7% to 2.9% over one year.
Chicago Fed President Austan Goolsbee crossed the wires on Bloomberg, praising the progress on inflation and the labor market. He added that despite the goodish September jobs report, there are no signs of overheating.
Next week, the Australian economic docket will be scarce. Tier The Reserve Bank of Australia (RBA) Assistant Governor Sarah Hunter will cross the wires on October 15, followed by the release of jobs data on October 16.
On the US front, the calendar will feature Fed speakers, the Balance of Trade, Retail Sales, Initial Jobless Claims, Industrial Production and housing data.
AUD/USD Price Forecast: Technical outlook
From a technical standpoint, AUD/USD is in consolidation but with a slight upward bias. For buyers to resume the uptrend, they need to break above the October 9 high at 0.6761, allowing them to challenge the weekly peak at 0.6809.
Conversely, if sellers step in and push the exchange rate below the 50-day moving average (DMA) at 0.6733, it could open the door for a decline toward the 100-DMA at 0.6691.

Australian Dollar PRICE Today
The table below shows the percentage change of Australian Dollar (AUD) against listed major currencies today. Australian Dollar was the strongest against the Japanese Yen.
| USD | EUR | GBP | JPY | CAD | AUD | NZD | CHF | |
|---|---|---|---|---|---|---|---|---|
| USD | -0.05% | -0.07% | 0.39% | 0.17% | -0.20% | -0.28% | 0.12% | |
| EUR | 0.05% | -0.05% | 0.38% | 0.17% | -0.16% | -0.28% | 0.10% | |
| GBP | 0.07% | 0.05% | 0.45% | 0.24% | -0.10% | -0.21% | 0.19% | |
| JPY | -0.39% | -0.38% | -0.45% | -0.24% | -0.56% | -0.67% | -0.36% | |
| CAD | -0.17% | -0.17% | -0.24% | 0.24% | -0.34% | -0.43% | -0.03% | |
| AUD | 0.20% | 0.16% | 0.10% | 0.56% | 0.34% | -0.13% | 0.27% | |
| NZD | 0.28% | 0.28% | 0.21% | 0.67% | 0.43% | 0.13% | 0.41% | |
| CHF | -0.12% | -0.10% | -0.19% | 0.36% | 0.03% | -0.27% | -0.41% |
The heat map shows percentage changes of major currencies against each other. The base currency is picked from the left column, while the quote currency is picked from the top row. For example, if you pick the Australian Dollar from the left column and move along the horizontal line to the US Dollar, the percentage change displayed in the box will represent AUD (base)/USD (quote).
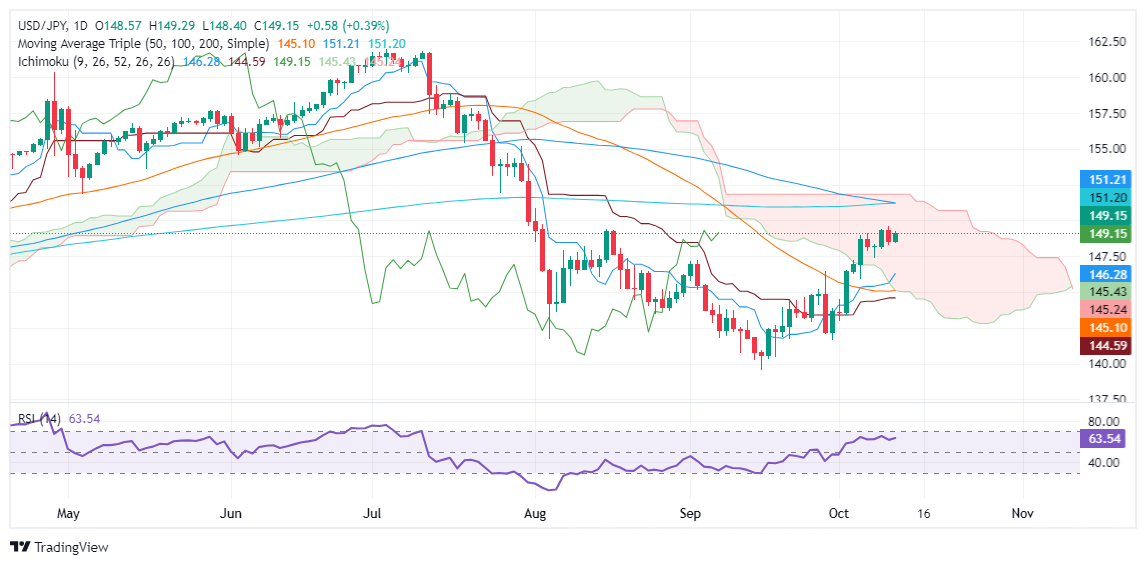
- USD/JPY edges higher, trading within a range of 148.00-149.50 as US 10-year yields rise to 4.104%.
- Momentum favors buyers, with a break above 149.50, exposing the key 150.00 level and resistance at the 200/100-DMA confluence at 151.20/21.
- A drop below 149.00 could lead to a pullback toward the October 8 swing low of 147.35.
The USD/JPY edged higher during the North American session as US Treasury yields remained higher, particularly the 10-year T-note, which was up close to four basis points at 4.104%. The positive correlation between the US 10-year yield and the pair pushed the exchange rate to 149.13, up 0.37%.
USD/JPY Price Forecast: Technical outlook
The USD/JPY is still neutrally biased, though trading in a higher range within the 148.00-149.50 area, as traders decipher the Fed and the Bank of Japan's next move.
From a momentum standpoint, buyers remain in charge, yet the Relative Strength Index (RSI) hasn’t reached a new peak to push USD/JPY prices higher.
If USD/JPY clears the 149.50 area, this will immediately expose the 150.00 figure. Once removed, the next resistance would be the 200 and 100-day moving averages (DMAs) confluence at 151.20/21.
Conversely, if the pair drops below 149.00, look for a pullback toward the October 8 swing low of 147.35.
USD/JPY Price Action – Daily Chart
Japanese Yen PRICE Today
The table below shows the percentage change of Japanese Yen (JPY) against listed major currencies today. Japanese Yen was the strongest against the Canadian Dollar.
| USD | EUR | GBP | JPY | CAD | AUD | NZD | CHF | |
|---|---|---|---|---|---|---|---|---|
| USD | -0.05% | -0.07% | 0.39% | 0.17% | -0.20% | -0.28% | 0.12% | |
| EUR | 0.05% | -0.05% | 0.38% | 0.17% | -0.16% | -0.28% | 0.10% | |
| GBP | 0.07% | 0.05% | 0.45% | 0.24% | -0.10% | -0.21% | 0.19% | |
| JPY | -0.39% | -0.38% | -0.45% | -0.24% | -0.56% | -0.67% | -0.36% | |
| CAD | -0.17% | -0.17% | -0.24% | 0.24% | -0.34% | -0.43% | -0.03% | |
| AUD | 0.20% | 0.16% | 0.10% | 0.56% | 0.34% | -0.13% | 0.27% | |
| NZD | 0.28% | 0.28% | 0.21% | 0.67% | 0.43% | 0.13% | 0.41% | |
| CHF | -0.12% | -0.10% | -0.19% | 0.36% | 0.03% | -0.27% | -0.41% |
The heat map shows percentage changes of major currencies against each other. The base currency is picked from the left column, while the quote currency is picked from the top row. For example, if you pick the Japanese Yen from the left column and move along the horizontal line to the US Dollar, the percentage change displayed in the box will represent JPY (base)/USD (quote).
- The Canadian Dollar backslid another tenth of a percent against the Greenback.
- Despite upbeat labor data from Canada, markets deferred to the US Dollar.
- US PPI inflation cooled to flat in September, but core PPI remains an issue.
The Canadian Dollar (CAD) fell against the Greenback for an eighth consecutive trading day as markets pivot out of the Loonie in favor of the US Dollar. US Producer Price Index (PPI) inflation cooled more than expected in September, but markets noted that core PPI inflation still ticked higher for the annualized period.
Canada’s labor print did little to bolster the CAD, despite new jobs data nearly doubling forecasts. Canada’s Unemployment Rate also ticked down, flaunting market expectations of another move higher. With the Bank of Canada (BoC) broadly expected to deliver another 50 bps rate cut at its next policy meeting later in the month, markets have little reason to bid up the CAD. The Loonie is now poised for its worst week against the Greenback since March of 2023.
Daily digest market movers
- Canada added 46.7K net new jobs in September, nearly double the median market forecast of 27K, compared to August’s 22.1K.
- Canada’s Unemployment Rate also ticked down to 6.5% from 6.6%, reversing the expected uptick to 6.7%.
- Despite upbeat labor figures, the BoC is still expected to cut rates by another 50 bps on October 23.
- US PPI inflation flatted in September, cooling to a flat 0.0% MoM compared to the expected 0.1% and August’s 0.2%.
- September’s YoY PPI print chilled less than expected, printing at 1.8% versus the expected 1.6%, but still came in under August’s revised print of 1.9%.
- Core PPI inflation, excluding food and energy prices, actually rose to 2.8% YoY in September, over and above the anticipated 2.7%. August’s annualized PPI figure was also revised to 2.6% from the initial print of 2.4%.
Canadian Dollar price forecast
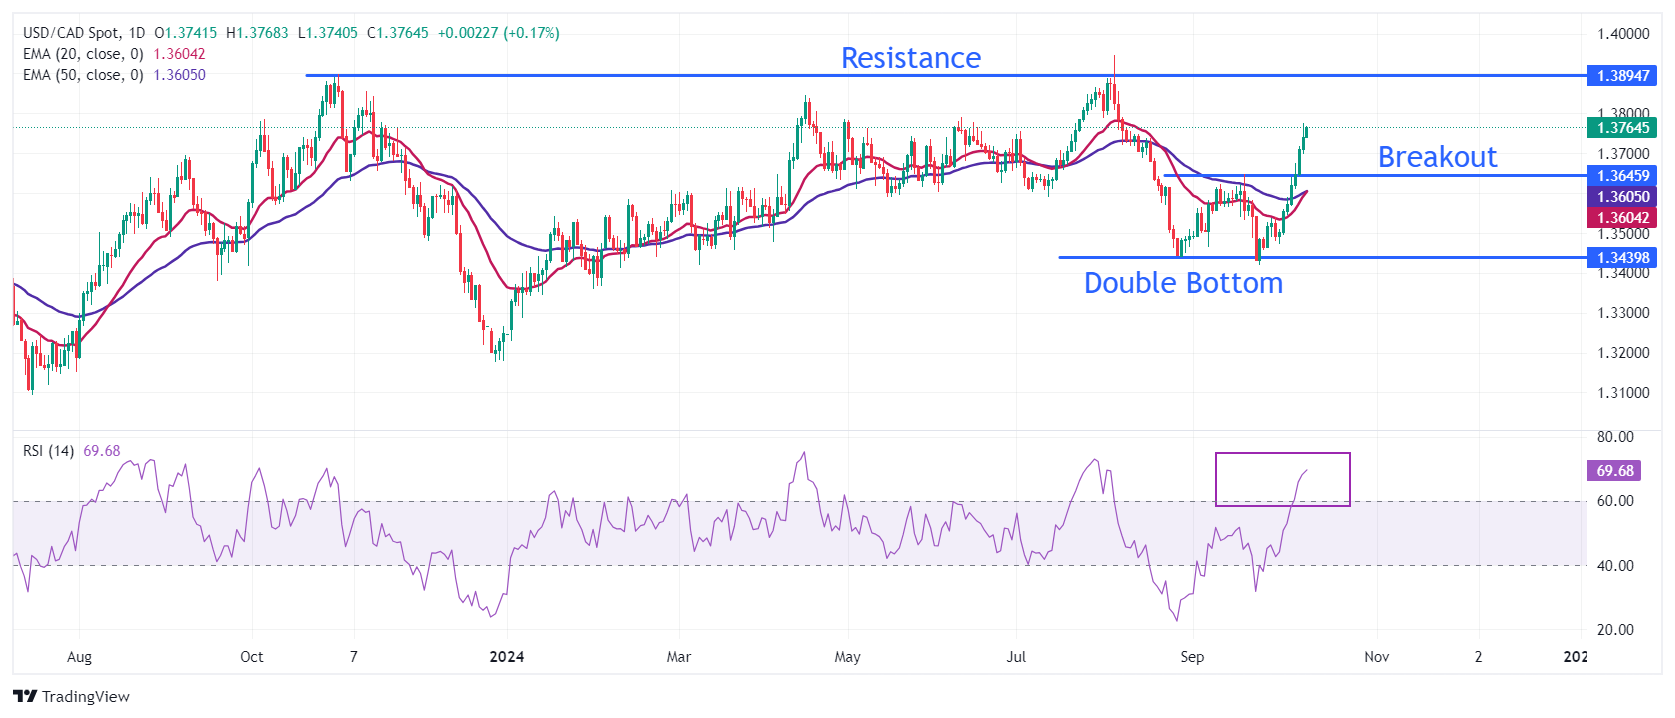
The USD/CAD currency pair continued its recent upward momentum, closing at 1.3762, up 0.15% for the day. The pair has rallied sharply over the past week, recovering from September’s lows near 1.3400. As seen in the chart, the price action is well above the 50-day exponential moving average (EMA) at 1.3605 and the 200-day EMA at 1.3612, indicating a shift toward a more bullish outlook. The pair broke above these key moving averages at the beginning of October, confirming a breakout from the downtrend that had dominated throughout August and September.
Momentum indicators support the recent bullish reversal. The Moving Average Convergence Divergence (MACD) indicator has turned positive, with the MACD line crossing above the signal line. The histogram is steadily increasing, showing growing bullish momentum. With MACD readings now in positive territory, the outlook suggests that further gains are likely in the near term, with the next key resistance level around 1.3800, a psychological and technical barrier that traders are likely to monitor closely.
However, the recent rally has left the pair overextended in the short term, as indicated by the rapid pace of gains over the last few sessions. A pullback to test the 50-day EMA or the 1.3650 level could be possible before the pair attempts to break higher. Overall, the trend appears to have shifted in favor of the USD, but traders should keep an eye on upcoming economic data and any signs of exhaustion in the bullish momentum to manage potential volatility.
USD/CAD daily chart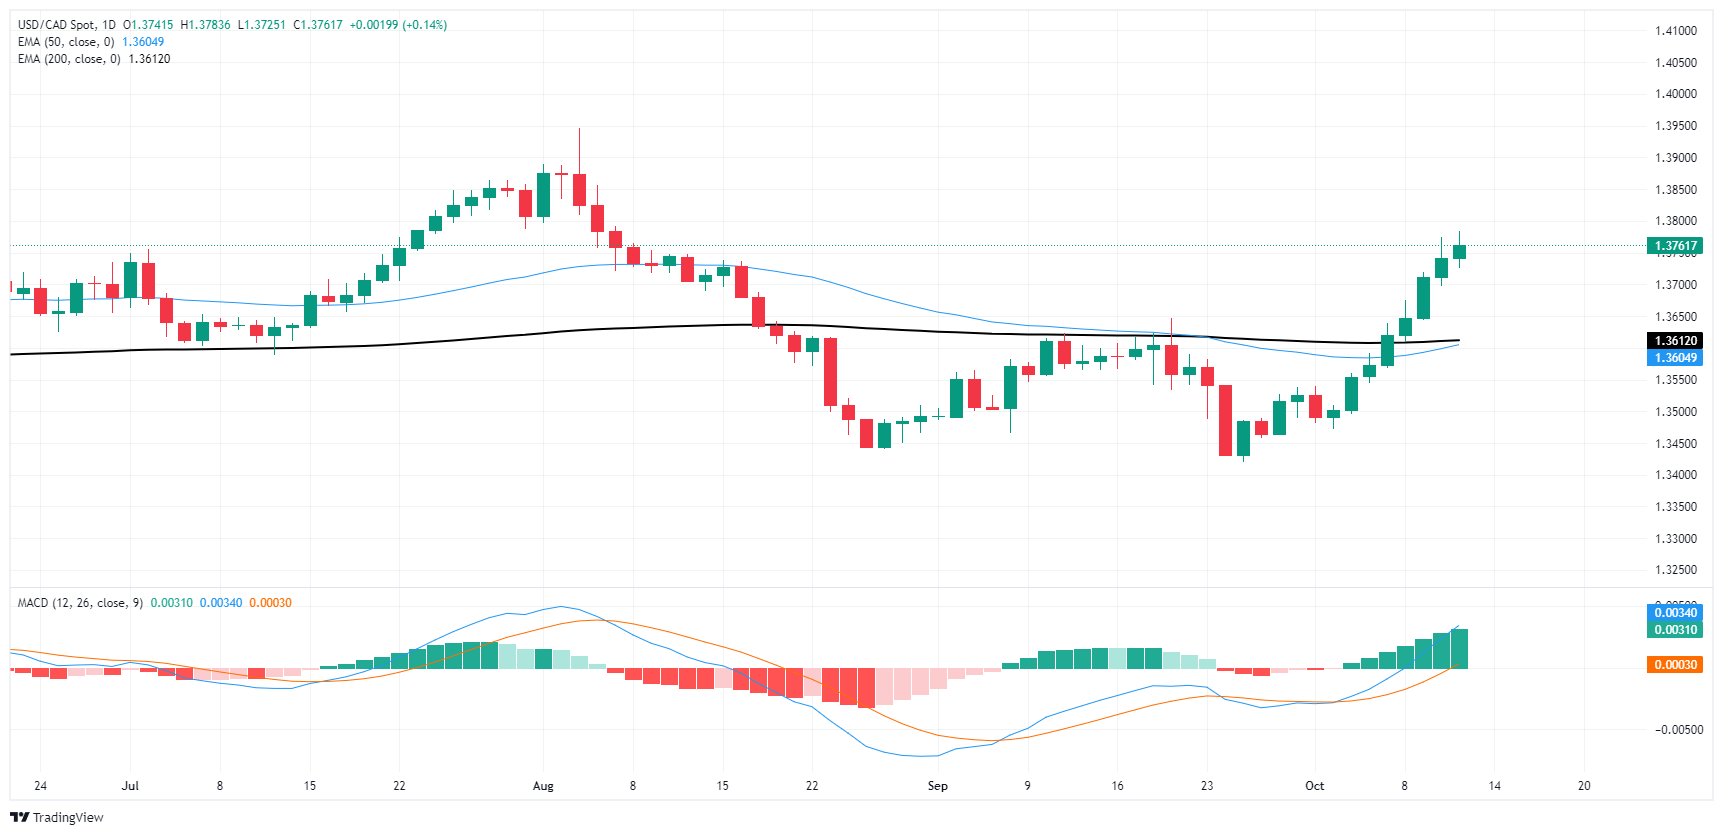
Canadian Dollar FAQs
The key factors driving the Canadian Dollar (CAD) are the level of interest rates set by the Bank of Canada (BoC), the price of Oil, Canada’s largest export, the health of its economy, inflation and the Trade Balance, which is the difference between the value of Canada’s exports versus its imports. Other factors include market sentiment – whether investors are taking on more risky assets (risk-on) or seeking safe-havens (risk-off) – with risk-on being CAD-positive. As its largest trading partner, the health of the US economy is also a key factor influencing the Canadian Dollar.
The Bank of Canada (BoC) has a significant influence on the Canadian Dollar by setting the level of interest rates that banks can lend to one another. This influences the level of interest rates for everyone. The main goal of the BoC is to maintain inflation at 1-3% by adjusting interest rates up or down. Relatively higher interest rates tend to be positive for the CAD. The Bank of Canada can also use quantitative easing and tightening to influence credit conditions, with the former CAD-negative and the latter CAD-positive.
The price of Oil is a key factor impacting the value of the Canadian Dollar. Petroleum is Canada’s biggest export, so Oil price tends to have an immediate impact on the CAD value. Generally, if Oil price rises CAD also goes up, as aggregate demand for the currency increases. The opposite is the case if the price of Oil falls. Higher Oil prices also tend to result in a greater likelihood of a positive Trade Balance, which is also supportive of the CAD.
While inflation had always traditionally been thought of as a negative factor for a currency since it lowers the value of money, the opposite has actually been the case in modern times with the relaxation of cross-border capital controls. Higher inflation tends to lead central banks to put up interest rates which attracts more capital inflows from global investors seeking a lucrative place to keep their money. This increases demand for the local currency, which in Canada’s case is the Canadian Dollar.
Macroeconomic data releases gauge the health of the economy and can have an impact on the Canadian Dollar. Indicators such as GDP, Manufacturing and Services PMIs, employment, and consumer sentiment surveys can all influence the direction of the CAD. A strong economy is good for the Canadian Dollar. Not only does it attract more foreign investment but it may encourage the Bank of Canada to put up interest rates, leading to a stronger currency. If economic data is weak, however, the CAD is likely to fall.
- Gold gains 1% on Friday, set to end the week with 0.20% gains.
- US PPI data was slightly above expectations, suggesting inflation is down but stalling above target, while UoM Consumer Sentiment highlights concerns over rising living costs.
- Despite higher US Treasury yields, with the 10-year note rising to 4.081%, Bullion prices remain supported as the Fed is expected to cut rates later this year.
Gold rallied over 1% on Friday, with the yellow metal set to end the week with modest gains of 0.20% after inflation data revealed on Friday and the Consumer Price Index (CPI) report on Thursday capped the Greenback’s advance. At the time of writing, XAU/USD trades at $2,658.
Mixed economic data underpinned the prices of the yellow metal. The US Bureau of Labor Statistics (BLS) revealed that prices paid by producers came near the consensus, indicating that inflation is trending down but above expectations. At the same time, the University of Michigan (UoM) Consumer Sentiment data for October showed a deterioration among Americans due to higher living costs.
Although the data didn’t affect the US Dollar, which remained firm, Bullion prices edged higher. This is even though US Treasury bond yields, particularly the 10-year T-note, gain one and a half basis points to 4.081%.
Chicago Fed President Austan Goolsbee crossed the wires on Bloomberg, praising the progress on inflation and the labor market. He added that despite the goodish September jobs report, there are no signs of overheating.
“The PPI numbers leaned friendly for the precious metals market bulls and suggest the Fed remains on track for two quarter-point interest rate cuts this year,” noted Jim Wyckoff, analyst at Kitco.
Next week, the US economic schedule remains busy, with Fed officials and the New York Fed Empire State Manufacturing Index continuing to grab the headlines. For the second part of the week, Retail Sales, Initial Jobless Claims, and housing data could dictate the Fed’s monetary policy path.
Daily digest market movers: Gold price climbs despite high US yields, strong USD
- Gold price finally broke the $2,650 barrier, yet it needs to achieve a daily close above that level to begin trading in the $2,650-$2,685 range.
- Consequently, the buck posts gains as seen by the US Dollar Index (DXY) gaining 0.02% to 102.90.
- The September US Producer Price Index (PPI) rose by 1.8% YoY, higher than the expected 1.6% but lower than August’s 1.9%. Core PPI increased by 2.8% YoY, exceeding forecasts and up from September's estimate of 2.7% and August's 2.6%.
- Monthly, PPI remained flat at 0%, lower than the estimated 0.1% and beneath August’s 0.2%. As expected, core PPI fell to 0.2%, down from the previous month's 0.3%.
- The University of Michigan (UoM) Consumer Sentiment Index deteriorated from 70.1 to 68.9, falling short of expectations of 70.8. Inflation expectations for one year were revised upward from 2.7% to 2.9%.
- The combination of a slightly higher Consumer Price Index (CPI) and a weak US employment report on Friday could lead to additional rate cuts by the Federal Reserve.
- Data from the Chicago Board of Trade, based on the December fed funds rate futures contract, indicates that investors estimate 49 basis points (bps) of easing by the Fed toward the end of 2024.
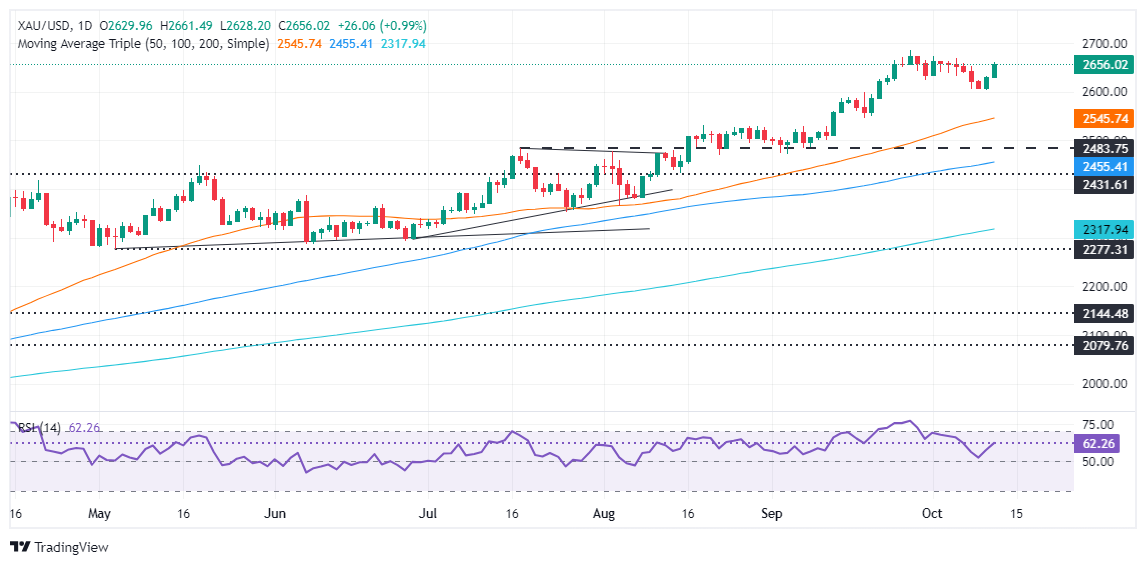
XAU/USD technical analysis: Gold price uptrend resumes, yet remains below $2,650
Gold’s uptrend has resumed, as the yellow metal posted back-to-back bullish daily candles, hinting that buyers could challenge the YTD high in the near term. According to the Relative Strength Index (RSI), momentum favors buyers, posting higher readings in bullish territory.
With that said, the XAU/USD first resistance would be the October 4 high at $2,670. Once surpassed, the next stop would be the YTD high of $2,685, ahead of the $2,700 mark.
Conversely, if XAU/USD falls underneath $2,650, this could sponsor a leg-down toward the $2,600 figure. A breach of the latter will expose the 50-day Simple Moving Average (SMA) at $2,545.
Gold FAQs
Gold has played a key role in human’s history as it has been widely used as a store of value and medium of exchange. Currently, apart from its shine and usage for jewelry, the precious metal is widely seen as a safe-haven asset, meaning that it is considered a good investment during turbulent times. Gold is also widely seen as a hedge against inflation and against depreciating currencies as it doesn’t rely on any specific issuer or government.
Central banks are the biggest Gold holders. In their aim to support their currencies in turbulent times, central banks tend to diversify their reserves and buy Gold to improve the perceived strength of the economy and the currency. High Gold reserves can be a source of trust for a country’s solvency. Central banks added 1,136 tonnes of Gold worth around $70 billion to their reserves in 2022, according to data from the World Gold Council. This is the highest yearly purchase since records began. Central banks from emerging economies such as China, India and Turkey are quickly increasing their Gold reserves.
Gold has an inverse correlation with the US Dollar and US Treasuries, which are both major reserve and safe-haven assets. When the Dollar depreciates, Gold tends to rise, enabling investors and central banks to diversify their assets in turbulent times. Gold is also inversely correlated with risk assets. A rally in the stock market tends to weaken Gold price, while sell-offs in riskier markets tend to favor the precious metal.
The price can move due to a wide range of factors. Geopolitical instability or fears of a deep recession can quickly make Gold price escalate due to its safe-haven status. As a yield-less asset, Gold tends to rise with lower interest rates, while higher cost of money usually weighs down on the yellow metal. Still, most moves depend on how the US Dollar (USD) behaves as the asset is priced in dollars (XAU/USD). A strong Dollar tends to keep the price of Gold controlled, whereas a weaker Dollar is likely to push Gold prices up.
- Mexican Peso strengthens for the second consecutive day as traders increase the odds of a 25 bps Fed rate cut to 85.9%.
- Banxico minutes confirm economic slowdown, reinforcing the view that less restrictive policy is needed as Mexican industrial production contracts.
- US Producer Price Index (PPI) data supports disinflation, while University of Michigan Consumer Sentiment weakens, and inflation expectations rise.
The Mexican Peso registers gains against the Greenback for the second consecutive day after hitting a low of 19.61 in early trading on Thursday. A tranche of economic data in the United States (US) reassured investors that the Federal Reserve (Fed) might lower borrowing costs at the November meeting, a headwind for the US Dollar. Therefore, the USD/MXN trades at 19.38, down 0.38%.
The US Bureau of Labor Statistics (BLS) revealed that prices paid by producers came in around estimates, indicating that the disinflation process is evolving. Lately, the University of Michigan (UoM) Consumer Sentiment showed signs of deterioration, while inflation expectations over the next year increased for the first time in five months.
The USD/MXN extended its losses as data from the CME FedWatch Tool showed that traders had increased the odds for a 25-basis-point rate cut to 85.9%, while the chances of the Fed keeping rates unchanged are 14.1%.
Across the south of the border, the Mexican economic docket revealed that Industrial Production contracted in monthly and annual figures, painting a gloomy economic outlook.
The minutes of the Bank of Mexico (Banxico) showed that the economy is undergoing a slowdown, losing some pace since the last quarter of 2023. This, along with the evolution of the disinflation process in Mexico, is one of the two reasons Banxico mentioned that policy needs to be less restrictive.
In the meantime, Chicago Fed President Austal Goolsbee crossed the newswires. He said he doesn’t see evidence of the economy overheating and that the central bank should focus on the dual mandate.
The US Dollar Index (DXY), which tracks the buck’s value against a basket of six peers, is virtually unchanged at 102.84, capping the USD/MXN advance on Friday.
Daily digest market movers: Mexican Peso bolstered due to soft US data
- Mexico’s Industrial Production in August plunged -0.5% MoM, missed the forecast, and July’s 0.2% increase. In the 12 months to August, production plummeted -0.9% below the 0.5% expansion awaited by the consensus.
- The Mexican Peso shrugged off the data and continued to rally due to the reduction of interest rate differentials between Mexico and the United States.
- According to Banxico’s poll, the central bank is projected to lower rates by 50 bps to 10% for the remainder of 2024. Meanwhile, the USD/MXN exchange rate will end near 19.69.
- Mexico’s economy is projected to grow by 1.45% in 2024, lower than August’s 1.57%.
- The September US Producer Price Index (PPI) came at 1.8% YoY, which was higher than the expected 1.6% but lower than August’s 1.9%. Core PPI rose by 2.8% YoY, above forecasts and September’s figures of 2.7% and 2.6%, respectively.
- PPI every month was 0%, lower than the estimated 0.1% and beneath August’s 0.2%. Core PPI ticked lower, as expected, to 0.2%, down from last month's 0.3%.
- The UoM Consumer Sentiment deteriorated from 70.1 to 68.9, below expectations of 70.8. Inflation expectations for one year were revised from 2.7% to 2.9%.
- Friday’s slightly higher Consumer Price Index (CPI) and a soft US employment report could lead to additional Fed rate cuts.
- Data from the Chicago Board of Trade via the December fed funds rate futures contract shows investors estimate 49 bps of easing by the Fed toward the end of 2024.
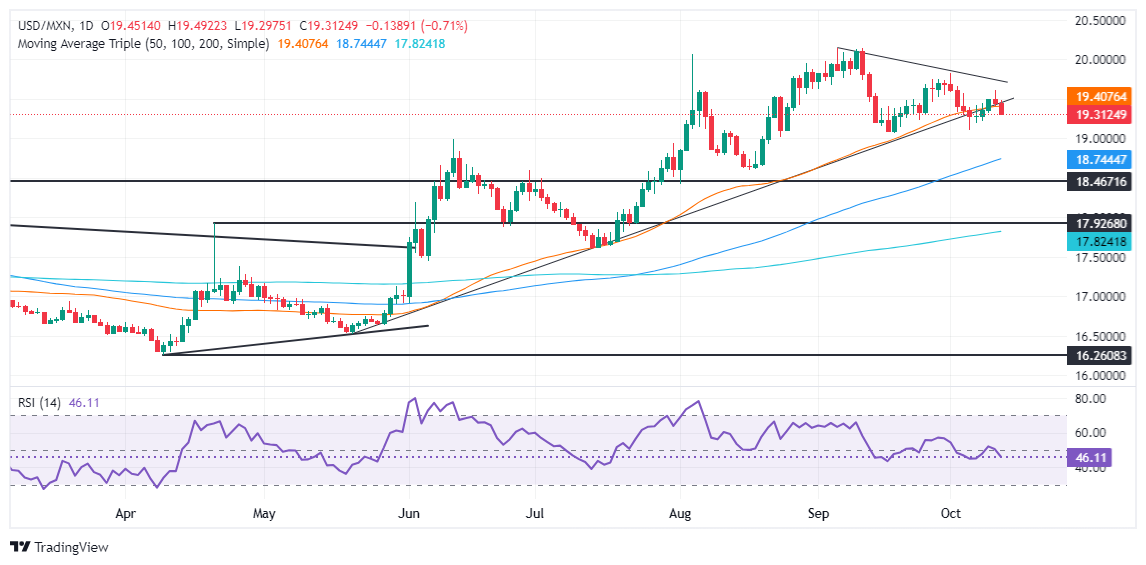
USD/MXN technical outlook: Mexican Peso counter attacks as USD/MXN falls below 19.35
The USD/MXN uptrend remains in place, but it could consolidate within the 19.00-19.50 area. Momentum shows that sellers remain in charge as the Relative Strength Index (RSI) depicts.
In that outcome, if USD/MXN drops below the October 4 wing low of 19.10, the 19.00 figure will be exposed. Once broken, the next support would be the 100-day SMA at 18.64.
Conversely, if buyers stepped in and pushed the exchange rate above 19.50, this could pave the way for testing the October 1 daily high of 19.82, ahead of 20.00. Up next would be the YTD peak of 20.22.
Mexican Peso FAQs
The Mexican Peso (MXN) is the most traded currency among its Latin American peers. Its value is broadly determined by the performance of the Mexican economy, the country’s central bank’s policy, the amount of foreign investment in the country and even the levels of remittances sent by Mexicans who live abroad, particularly in the United States. Geopolitical trends can also move MXN: for example, the process of nearshoring – or the decision by some firms to relocate manufacturing capacity and supply chains closer to their home countries – is also seen as a catalyst for the Mexican currency as the country is considered a key manufacturing hub in the American continent. Another catalyst for MXN is Oil prices as Mexico is a key exporter of the commodity.
The main objective of Mexico’s central bank, also known as Banxico, is to maintain inflation at low and stable levels (at or close to its target of 3%, the midpoint in a tolerance band of between 2% and 4%). To this end, the bank sets an appropriate level of interest rates. When inflation is too high, Banxico will attempt to tame it by raising interest rates, making it more expensive for households and businesses to borrow money, thus cooling demand and the overall economy. Higher interest rates are generally positive for the Mexican Peso (MXN) as they lead to higher yields, making the country a more attractive place for investors. On the contrary, lower interest rates tend to weaken MXN.
Macroeconomic data releases are key to assess the state of the economy and can have an impact on the Mexican Peso (MXN) valuation. A strong Mexican economy, based on high economic growth, low unemployment and high confidence is good for MXN. Not only does it attract more foreign investment but it may encourage the Bank of Mexico (Banxico) to increase interest rates, particularly if this strength comes together with elevated inflation. However, if economic data is weak, MXN is likely to depreciate.
As an emerging-market currency, the Mexican Peso (MXN) tends to strive during risk-on periods, or when investors perceive that broader market risks are low and thus are eager to engage with investments that carry a higher risk. Conversely, MXN tends to weaken at times of market turbulence or economic uncertainty as investors tend to sell higher-risk assets and flee to the more-stable safe havens.
- The Dow Jones climbed into an all-time peak on Friday.
- US PPI figures showed September producer-level inflation stayed flat overall.
- Upbeat bank earnings helped to further bolster equities.
The Dow Jones Industrial Average (DJIA) rose over 400 points bottom-to-top on Friday, bolstered into a fresh record high of 42,837 after US Producer Price Index (PPI) inflation figures cooled in September. Cooling producer-level inflation plus upbeat bank earnings lifted equities across the board as the Dow Jones heads into a fifth straight winning week.
US producer prices flattened in September, cooling to a flat 0.0% MoM compared to the expected 0.1% and August’s 0.2%. Despite the cool-off in the monthly figure, September’s YoY PPI print chilled less than expected, printing at 1.8% versus the expected 1.6%, but still came in under August’s revised print of 1.9%.
Despite the rate-cut-supporting chill in headline PPI figures, core PPI inflation still poses a threat. Core PPI inflation, excluding food and energy prices, actually rose to 2.8% YoY in September, over and above the anticipated 2.7%. August’s annualized PPI figure was also revised to 2.6% from the initial print of 2.4%.
The University of Michigan’s (UoM) Consumer Sentiment Index eased in October, declining to 68.9 from the previous print of 70.1. Markets were hoping for a slight uptick to 70.8. Meanwhile, UoM 5-year Consumer Inflation Expectations delivered good news to markets, ticking down to 3.0% from the previous print of 3.1%.
Dow Jones news
The Dow Jones was tilted firmly into the bullish side on Friday, with less than ten of the equity board’s constituent securities stuck in the red during the last trading session of the week. IBM (IBM) fell another percentage point, declining below $231 per share, followed closely by Salesforce (CRM), which shed around eight-tenths of one percent, slipping under $288 per share.
In other Dow Jones news, bank earnings season is helping to bolster the major index into a record Friday, with JPMorgan surging after a better-than-expected earnings report that handily beat forecasts.
Dow Jones price forecast
The Dow Jones added around 300 points today, gaining roughly two-thirds of a percent and trading near 42,700. This latest move comes after the index made several attempts to break above the key resistance near 42,700 over the past few sessions. The strength of today’s rally suggests that the bulls are gaining momentum, helped by a broader optimism in equities. Traders will be watching to see if the index can maintain its momentum and build on today’s gains, potentially aiming for the 43,000 mark, a psychological resistance level.
Technical indicators show continued support for a bullish outlook. The 50-day Exponential Moving Average (EMA) remains well below current price action, suggesting that short-term momentum favors the bulls. The 200-day EMA is still grinding higher, approaching 39,400, reinforcing the long-term uptrend that has been in place since early 2023. With prices trending well above these key averages, buyers appear to be in firm control of the market, though a short-term pullback to the 50-day EMA is always possible as the market digests recent gains.
Dow Jones daily chart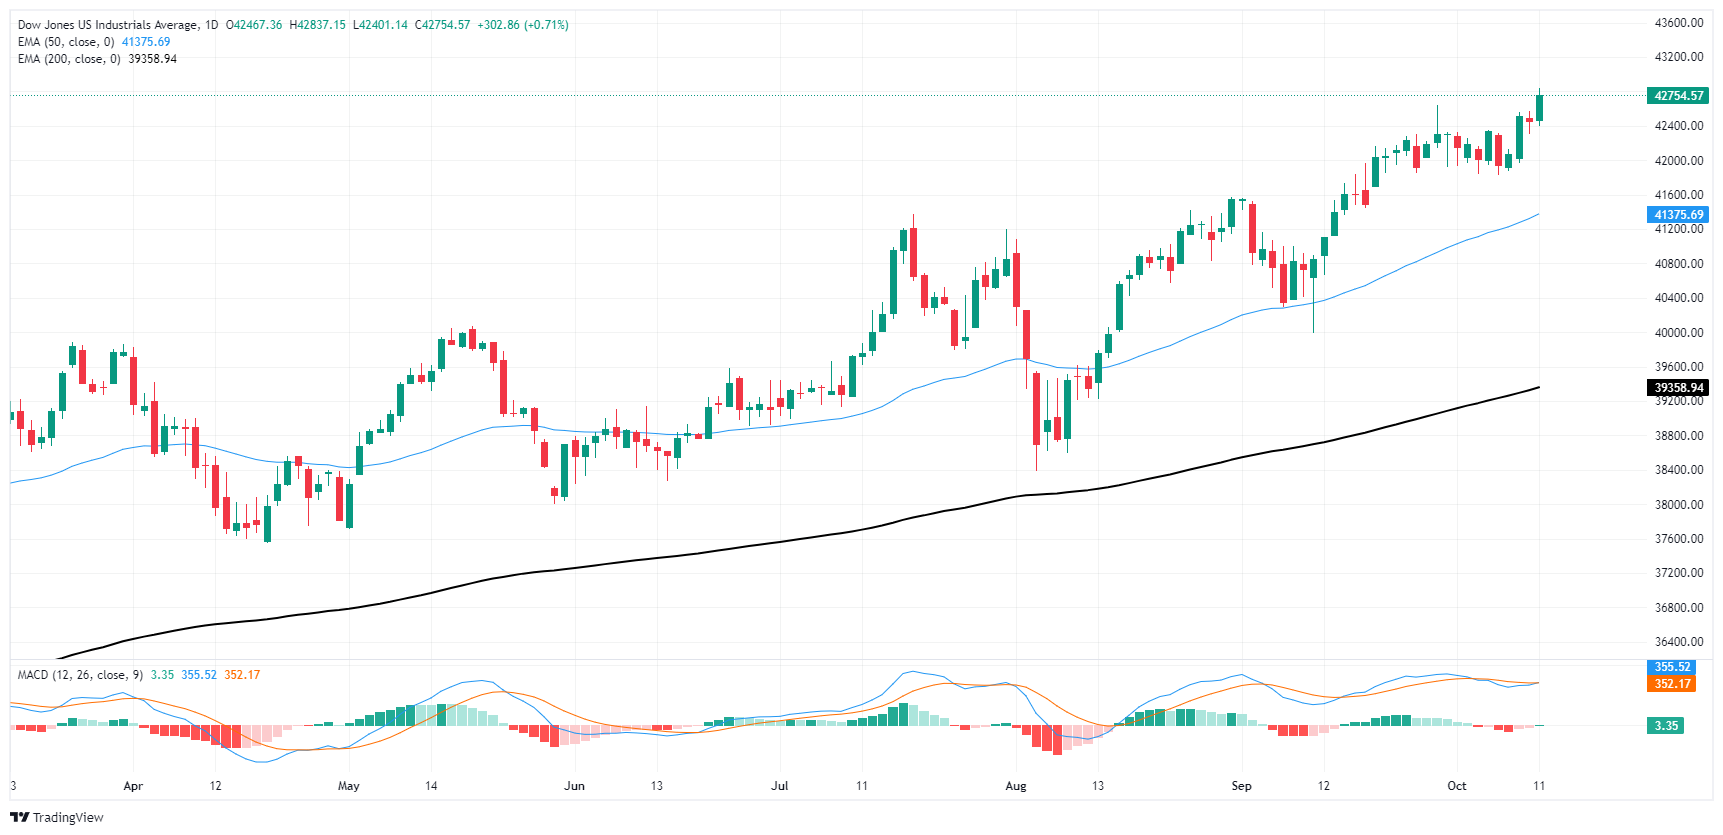
Dow Jones FAQs
The Dow Jones Industrial Average, one of the oldest stock market indices in the world, is compiled of the 30 most traded stocks in the US. The index is price-weighted rather than weighted by capitalization. It is calculated by summing the prices of the constituent stocks and dividing them by a factor, currently 0.152. The index was founded by Charles Dow, who also founded the Wall Street Journal. In later years it has been criticized for not being broadly representative enough because it only tracks 30 conglomerates, unlike broader indices such as the S&P 500.
Many different factors drive the Dow Jones Industrial Average (DJIA). The aggregate performance of the component companies revealed in quarterly company earnings reports is the main one. US and global macroeconomic data also contributes as it impacts on investor sentiment. The level of interest rates, set by the Federal Reserve (Fed), also influences the DJIA as it affects the cost of credit, on which many corporations are heavily reliant. Therefore, inflation can be a major driver as well as other metrics which impact the Fed decisions.
Dow Theory is a method for identifying the primary trend of the stock market developed by Charles Dow. A key step is to compare the direction of the Dow Jones Industrial Average (DJIA) and the Dow Jones Transportation Average (DJTA) and only follow trends where both are moving in the same direction. Volume is a confirmatory criteria. The theory uses elements of peak and trough analysis. Dow’s theory posits three trend phases: accumulation, when smart money starts buying or selling; public participation, when the wider public joins in; and distribution, when the smart money exits.
There are a number of ways to trade the DJIA. One is to use ETFs which allow investors to trade the DJIA as a single security, rather than having to buy shares in all 30 constituent companies. A leading example is the SPDR Dow Jones Industrial Average ETF (DIA). DJIA futures contracts enable traders to speculate on the future value of the index and Options provide the right, but not the obligation, to buy or sell the index at a predetermined price in the future. Mutual funds enable investors to buy a share of a diversified portfolio of DJIA stocks thus providing exposure to the overall index.
Recent weeks have been punctuated by a number of positive developments for the U.S. economy, the first of which was the significant upward revision to historical data on household disposable income. However, this was partially offset by weaker recent momentum, NBC’s Jocelyn Paquet notes.
Fed to continue cutting its key rate at a gradual pace
“In reality, however, the future path of household income will depend first and foremost on the evolution of the labour market. Which brings us to the second piece of good news of recent weeks: September's solid employment figures.”
“As for the third piece of good news, the Federal Reserve has not only decided to begin its cycle of monetary easing with a jumbo 50 basis point cut, but has also underlined its willingness to cut benchmark rates further in the months ahead, if the latest edition of its dot plot is anything to go by.”
“Assuming that inflation remains under control and that the U.S. elections do not cause too much disruption, we expect the Fed to continue cutting its key rate at a gradual pace over the coming months. This will probably not prevent growth from slowing significantly by the middle of next year, although we do not expect the economy to contract. Following this scenario, we anticipate growth of 2.6% and 1.2% in 2024 and 2025, respectively. This is better than the figures of 2.5% and 0.9% we presented last month.”
Notwithstanding concerns surrounding a wider Middle East war, which could disrupt oil flows from the region, China stimulus disappointment and OPEC+ producer plans to bring barrels back in the coming months have put the crude oil market at risk of a sharp correction. The pending surplus in early-2025, stemming from lackluster global demand and robust supply growth, may well see crude oil price trade significantly below current levels in 2025, TDS’ Head of Commodity Strategy Bart Melek notes
OPEC+ production cuts may become unnecessary
“The extension of the current OPEC+ production suppression regime, which features significant member overproduction, does not look to be sufficient to keep the market in balance next year. In the absence of the current war premium, the markets will likely need to see OPEC+ comply with production quotas and further delay the unwind of production cuts in order to prevent a drift into a $50-60/b range.”
“With non-OPEC+ production projected to jump by some 1.5m b/d and demand growing by just under one million b/d, the current inventory levels suggest that some 500k b/d of reduction from current production levels is required to preserve a rough market balance and prevent a drop lower.”
“The risk of a broader Middle East conflict, which could see oil supplies from the region disrupted as tanker traffic through the Straits of Hormuz and flows from Gulf States slow sharply, could well make OPEC+ production cuts unnecessary. Indeed, if tanker and pipeline flows from the region are interrupted due to military attacks, shortages may quickly materialize, with prices hitting triple digits for a prolonged period.”
- EUR/GBP slides as a growing number of analysts make calls that the ECB will cut interest rates at their meeting next week.
- Lower borrowing costs are negative for the Euro because they reduce capital inflows.
- Sterling stands firm following the release of robust macroeconomic data.
EUR/GBP edges lower on Friday as traders sell the Euro (EUR) due to the increasing likelihood of the European Central Bank (ECB) making more aggressive interest rate cuts in the future. Lower interest rates are negative for a currency as they reduce foreign capital inflows. Recent price action has seen EUR/GBP steadily pull back almost three quarters of a pence from the October 3 high of 0.8434 to trade in the 0.8360s at the end of the trading week.
EUR/GBP meets pressure from sellers as traders gear up for another rate cut by the ECB at its October 17 meeting. Since the last meeting inflation has fallen more rapidly than previously expected – with the headline rate down to 1.8% in September, the first time it has fallen below the ECB’s 2.0% target in over three years. Growth too is slowing, suggesting the Governing Council will want to implement another 25 bps cut (0.25%) cut to its main refinancing operations rate (currently at 3.65%) in order to help lending to the economy.
“We expect the ECB to cut rates 25bp again on 17 October. Growth is even weaker than the ECB's downwardly revised September forecasts, inflation is coming back to target sooner than the end-25 staff forecast and there is little apparent opposition from the Governing Council to a further easing in October for risk management purposes,” said Mark Wall, Director at Deutsche Bank Securities.
Following on from the 25 bps cut made in the last meeting, another cut would be significant because it would “signal a pivot into a faster easing cycle,” added Wall.
Scandinavian lender Nordea Bank also sees the ECB cutting by 25 bps in October.
“The ECB is very likely to accelerate the pace of its rate cuts by cutting 25bp again at the October meeting. However, the central bank may not be ready to signal that it intends to cut rates at every meeting going forward,” says Jan von Gerich, Chief Analyst at Nordea.
The Pound Sterling (GBP), meanwhile, made mild gains on Friday after the release of broadly positive data. Gross Domestic Product (GDP) growth in August rose by 0.2%, in line with expectations and above the 0.0% of July. The led to a dip in EUR/GBP as Sterling saw some strength.
UK Industrial Production, meanwhile, rose 0.5% in August, which was above the (revised-up) 0.7% decline of July and the 0.2% rise expected. It was a similar story with Manufacturing Production which rose by 1.1% – higher than both the previous and expected figures.
The robust economic data indicates the UK economy is holding up well despite relatively high interest rates in the UK (5.0%). It suggests the Bank of England (BoE) will not be in a hurry to cut interest rates at the next meeting, giving the Pound an advantage over its peers which are mostly committed to cutting their borrowing costs.
The Pound sold off sharply on October 3 after the Governor of the BoE Andrew Bailey said the bank might get more “activist” and “aggressive” about cutting interest rates. The Sterling stabilized on the next day after BoE’s Chief Economist Huw Pill was more cautious in his comments. The BoE’s next policy meeting is on November 7 with a balanced chance of a 25 bps cut being made.
- GBP/USD edges up after bottoming out at 1.3010, with a ‘hammer’ pattern signaling potential for further upside.
- Clearing the October 10 high of 1.3093 and the 50-DMA at 1.3099 would open the door for buyers, with resistance at 1.3113 and 1.3134.
- A failure to break 1.3100 could see sellers push the pair back toward the week’s low of 1.3010.
The Pound Sterling recovers some ground against the greenback as a ‘hammer’ emerges on the daily chart and rises above 1.3050, registering gains of over 0.15%. Goodish economic data in the UK sponsored the GBP/USD’s recovery as the economy grew around estimates. Nevertheless, a slightly hot Producer Price Index (PPI) report in the US capped the GBP’s gains.
GBP/USD Price Forecast: Technical outlook
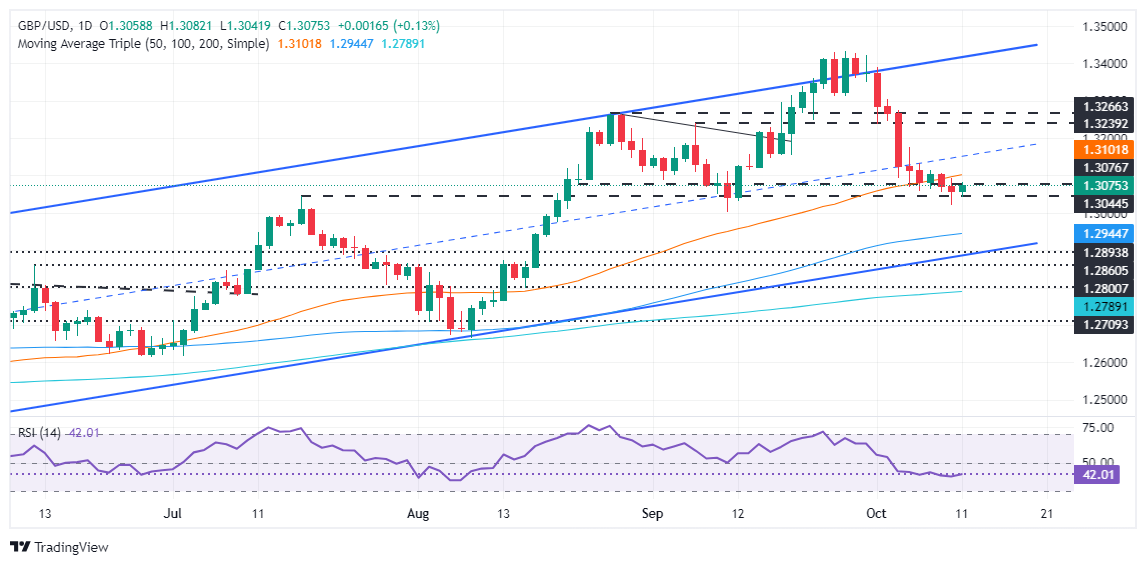
The GBP/USD seems to have bottomed out after retreating from yearly highs of 1.3434 to a daily low of 1.3010 on October 10. A ‘hammer’ formation preceded by a downtrend hints that a reversal is possible.
Nevertheless, the pair should clear the October 10 high of 1.3093, immediately followed by the 50-day moving average (DMA) at 1.3099, so buyers could remain hopeful of higher exchange rates.
In that outcome, the GBP/USD next resistance would be the 1.3100 figure, followed by the October 8 high at 1.3113. On further strength, the next supply zone will be the October 7 weekly high of 1.3134.
Conversely, if GBP/USD fails to clear 1.3100, sellers could step in and push prices below the psychological 1.3050 level, driving the exchange rate toward the week's lows at 1.3010.
From a momentum standpoint, the GBP/USD is barely biased, but the Relative Strength Index (RSI) has increased upwards during the last couple of days, opening the door for a leg-up.
GBP/USD Price Action – Daily Chart
British Pound PRICE Today
The table below shows the percentage change of British Pound (GBP) against listed major currencies today. British Pound was the strongest against the Japanese Yen.
| USD | EUR | GBP | JPY | CAD | AUD | NZD | CHF | |
|---|---|---|---|---|---|---|---|---|
| USD | -0.14% | -0.14% | 0.45% | 0.12% | -0.13% | -0.11% | 0.12% | |
| EUR | 0.14% | -0.05% | 0.54% | 0.21% | -0.00% | -0.03% | 0.20% | |
| GBP | 0.14% | 0.05% | 0.59% | 0.26% | 0.06% | 0.02% | 0.27% | |
| JPY | -0.45% | -0.54% | -0.59% | -0.33% | -0.55% | -0.57% | -0.40% | |
| CAD | -0.12% | -0.21% | -0.26% | 0.33% | -0.23% | -0.24% | 0.00% | |
| AUD | 0.13% | 0.00% | -0.06% | 0.55% | 0.23% | -0.04% | 0.19% | |
| NZD | 0.11% | 0.03% | -0.02% | 0.57% | 0.24% | 0.04% | 0.25% | |
| CHF | -0.12% | -0.20% | -0.27% | 0.40% | -0.01% | -0.19% | -0.25% |
The heat map shows percentage changes of major currencies against each other. The base currency is picked from the left column, while the quote currency is picked from the top row. For example, if you pick the British Pound from the left column and move along the horizontal line to the US Dollar, the percentage change displayed in the box will represent GBP (base)/USD (quote).
Pound Sterling gains after upbeat UK data, hot US PPI
The Pound Sterling (GBP) gyrates in a tight range near 1.3060 against the US Dollar (USD) in Friday's North American session. The GBP/USD pair remains sideways despite the release of the hotter-than-expected United States (US) annual US Producer Price Index (PPI) data for September. Read More...
UK GDP rises 0.2% MoM in August, as expected
The UK economy expanded by 0.2% over the month in August, having stagnated for the second consecutive month in July, the latest data published by the Office for National Statistics (ONS) showed on Friday. The reading matched the market consensus of 0.2% growth in the reported period. Read More...
GBP/USD consolidates around mid-1.3000s, seems vulnerable ahead of UK data
The GBP/USD pair struggles to capitalize on the previous day's modest bounce from the 1.3020 area or a one-month low and oscillates in a narrow band during the Asian session on Friday. Spot prices currently hover around mid-1.3000s, unchanged for the day, and seem vulnerable to prolonging the recent retracement slide from the highest level since March 2022 touched last month. Read More...
- Silver price rises to near $31.50 after the release of the US PPI data for September.
- The annual headline and core PPI grew faster than expected.
- The Fed is expected to cut interest rates again in November.
Silver price (XAG/USD) climbs to near $31.50 in Friday’s New York session. The white metal gains while the US Dollar (USD) remains steady after the release of the United States (US) Producer Price Index (PPI) data for September.
The US Dollar Index (DXY), which tracks the Greenback’s value against six major currencies, wobbles around 103.00.
The PPI report showed that the annual headline producer inflation grew by 1.8%, faster than estimates of 1.6%. However, it remained slower than 1.9% in August, upwardly revised from 1.7%. The annual core PPI – which excludes volatile food and energy prices – accelerated at a faster-than-expected pace to 2.8% from expectations of 2.7% and the former release of 2.6%, upwardly revised from 2.4%.
Meanwhile, the month-on-month headline producer inflation remained flat, strengthening the case for further interest rate cuts by the Federal Reserve (Fed). According to the CME FedWatch tool, 30-day Federal Fund Futures pricing data shows that the central bank will cut its borrowing rates by 25 basis points (bps) to 4.50%-4.75% in November.
The Fed started the policy-easing cycle with a 50-bps interest rate cut in September as Fed officials were concerned over growing job market risks, with confidence that price pressures will sustainably return to the bank’s target of 2%.
Silver technical analysis
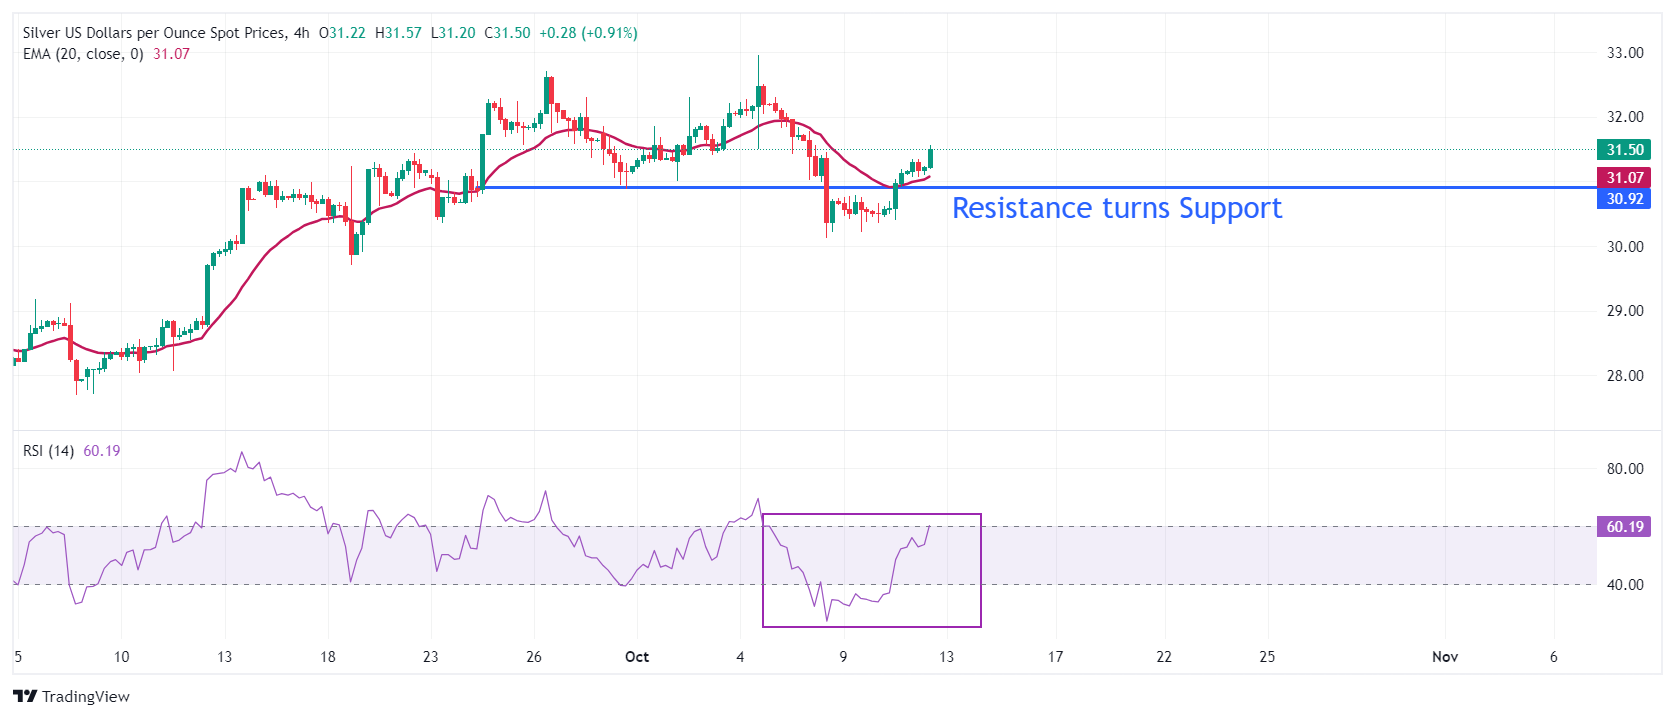
Silver price strengthens after breaking above the horizontal resistance plotted from the September 30 low of $31.30, which is expected to act as support ahead. The near-term outlook of the Silver price has become upbeat as it has climbed above the 20-period Exponential Moving Average (EMA), which trades around $31.50. The asset is expected to extend its upside toward an October high of around $33.00.
The 14-period Relative Strength Index (RSI) climbs to near 60.00. A bullish momentum would trigger if the RSI breaks above 60.00.
Silver four-hour chart
`
Silver FAQs
Silver is a precious metal highly traded among investors. It has been historically used as a store of value and a medium of exchange. Although less popular than Gold, traders may turn to Silver to diversify their investment portfolio, for its intrinsic value or as a potential hedge during high-inflation periods. Investors can buy physical Silver, in coins or in bars, or trade it through vehicles such as Exchange Traded Funds, which track its price on international markets.
Silver prices can move due to a wide range of factors. Geopolitical instability or fears of a deep recession can make Silver price escalate due to its safe-haven status, although to a lesser extent than Gold's. As a yieldless asset, Silver tends to rise with lower interest rates. Its moves also depend on how the US Dollar (USD) behaves as the asset is priced in dollars (XAG/USD). A strong Dollar tends to keep the price of Silver at bay, whereas a weaker Dollar is likely to propel prices up. Other factors such as investment demand, mining supply – Silver is much more abundant than Gold – and recycling rates can also affect prices.
Silver is widely used in industry, particularly in sectors such as electronics or solar energy, as it has one of the highest electric conductivity of all metals – more than Copper and Gold. A surge in demand can increase prices, while a decline tends to lower them. Dynamics in the US, Chinese and Indian economies can also contribute to price swings: for the US and particularly China, their big industrial sectors use Silver in various processes; in India, consumers’ demand for the precious metal for jewellery also plays a key role in setting prices.
Silver prices tend to follow Gold's moves. When Gold prices rise, Silver typically follows suit, as their status as safe-haven assets is similar. The Gold/Silver ratio, which shows the number of ounces of Silver needed to equal the value of one ounce of Gold, may help to determine the relative valuation between both metals. Some investors may consider a high ratio as an indicator that Silver is undervalued, or Gold is overvalued. On the contrary, a low ratio might suggest that Gold is undervalued relative to Silver.
- Consumer confidence in the US declined slightly in early October.
- UoM survey showed one-year inflation expectation edged higher to 2.9%.
Consumer confidence in the US weakened slightly in early October, with the preliminary University of Michigan's Consumer Sentiment Index edging lower to 68.9 from 70.1 in September. This reading came in below the market expectation of 70.8.
The Current Conditions Index declined to 62.7 from 63.3 and the Consumer Expectations Index fell to 72.9 from 74.4.
The details of the survey showed that the one-year inflation expectation edged higher to 2.9% from 2.7%, while the five-year inflation outlook decreased to 3% from 3.1%.
Market reaction
These data failed to trigger a noticeable market reaction. At the time of press, the US Dollar Index was virtually unchanged on the day at 102.85.
- USD/CAD surrenders some of its intraday gains after the US and Canada data.
- The Canadian employment data showed that job demand remained robust and the jobless rate decelerated.
- The US headline PPI remained flat, while the core producer inflation grew expectedly by 0.2% in September.
The USD/CAD pair gives up some of its intraday gains after posting a fresh two-month high to near 1.3780 in Friday’s New York session. The Loonie asset surrenders some gains after the release of the United States (US) Producer Price Index (PPI) and the Canadian Employment data for September.
The initial reaction after the data release was very bearish. However, it retraced half of its fall in the aftermath of the data.
The Canadian Employment report showed that the economy added 46.7K new jobs in September, higher than estimates of 27K and from 22.1K in August. In the same period, the Unemployment Rate surprisingly decelerated to 6.5% from the former reading of 6.6%. Economists expected the jobless rate to have accelerated to 6.7%.
Blowout job numbers could diminish market expectations for the Bank of Canada (BoC) to reduce interest rates again in October. The BoC has already cut its key borrowing rates by 75 basis points (bps) to 4.25%.
Meanwhile, Average Hourly Wages decelerated at a faster pace to 4.5% from 4.9% in August. This would keep risks of price pressures remaining persistent under control.
In the United States (US), the headline PPI remained flat on month-on-month. While the core producer inflation grew expectedly by 0.2%. However, the annual headline and core PPI rose at a faster-than-expected pace.
The US PPI data will unlikely impact market expectations for the Federal Reserve’s (Fed) likely interest rate action in November. According to the CME FedWatch tool, traders are confident that there will be an interest rate cut of 25 bps, which will push borrowing rates lower to 4.50%-4.75%.
- Unemployment Rate in Canada declined slightly in September.
- USD/CAD pushes lower following the upbeat Canadian employment data.
The Unemployment Rate in Canada edged lower to 6.5% in September from 6.6% in August, Statistics Canada reported on Friday. This reading came in below the market expectation of 6.7%.
Further details of the jobs report showed that the Net Change in Employment came in at 46.7K in the same period, up sharply from 22.1K in August. Finally, the Average Hourly Wages rose 4.5%, at a softer pace than the 4.9% increase recorded in August, while the Participation Rate declined to 64.9% from 65.1.
Market reaction
USD/CAD turned south with the immediate reaction and retreated from the two-month high it set above 1.3780. At the time of press, the pair was virtually unchanged on the day at 1.3740.
A slew of (significantly) weaker-than-expected PMI surveys in the Eurozone in the past two months has injected fresh uncertainty about the strength of the economic recovery, Rabobank’s economists Elwin de Groot and Maartje Wijffelaars note.
Uncertainty creeping in again in the Eurozone
“The services sector seems to be ‘catching down’ to the struggling industrial sector. Is industrial weakness spilling over or is the services sector facing challenges of its own?”
“Our analysis does not point towards negative spillover effects from industry to services, but to underlying weakness in consumer demand. Although near-term risks to growth appear to be to the downside, we retain a (mildly) optimistic outlook on consumer demand.”
- Producer inflation in the US rose at a stronger pace than expected in September.
- US Dollar Index stays slightly below 103.00 following the PPI data.
The Producer Price Index (PPI) for final demand in the US rose 1.8% on a yearly basis in September, the data published by the US Bureau of Labor Statistics showed on Friday. This reading followed the 1.9% increase recorded in August and came in above the market expectation of 1.6%.
The annual core PPI rose 2.8% in the same period, surpassing analysts' estimate of 2.7%. On a monthly basis, the PPI was unchanged, while the core PPI was up 0.2%
Market reaction
The US Dollar Index showed no reaction to these data and was last seen moving sideways slightly below 103.00.
UK data showed in line with expectations GDP growth in August (+0.2% m/m and the same on the 3m/3m measure), Scotiabank’s FX Chief FX Strategist Shaun Osborne notes.
GBP shows signs of stabilizing around 1.3050
“Industrial and manufacturing activity was stronger than expected in August while construction and services grew a little less than expected. The economy remains on track for a modest rise in growth in Q3 overall. The data had little impact on the Pound Sterling (GBP).”
“Spot losses extended modestly yesterday but there are tentative signs of firmer GBP demand emerging on dips below 1.3050 on the short-term charts and spot is developing—so far today—an inside range consolidation signal on the daily chart. Cable losses may be stabilizing. Resistance is 1.3110/15; gains through here are needed to signal short-term strength.”
- EUR/JPY has rallied up to the top of a medium-term range and risks rolling over as the mode extends.
- MACD momentum is declining steadily suggesting underlying weakness.
EUR/JPY rises up and almost touches the top of its nine-week range before treading water indecisively as traders await the next catalyst that will decide its future direction.
EUR/JPY 4-hour Chart
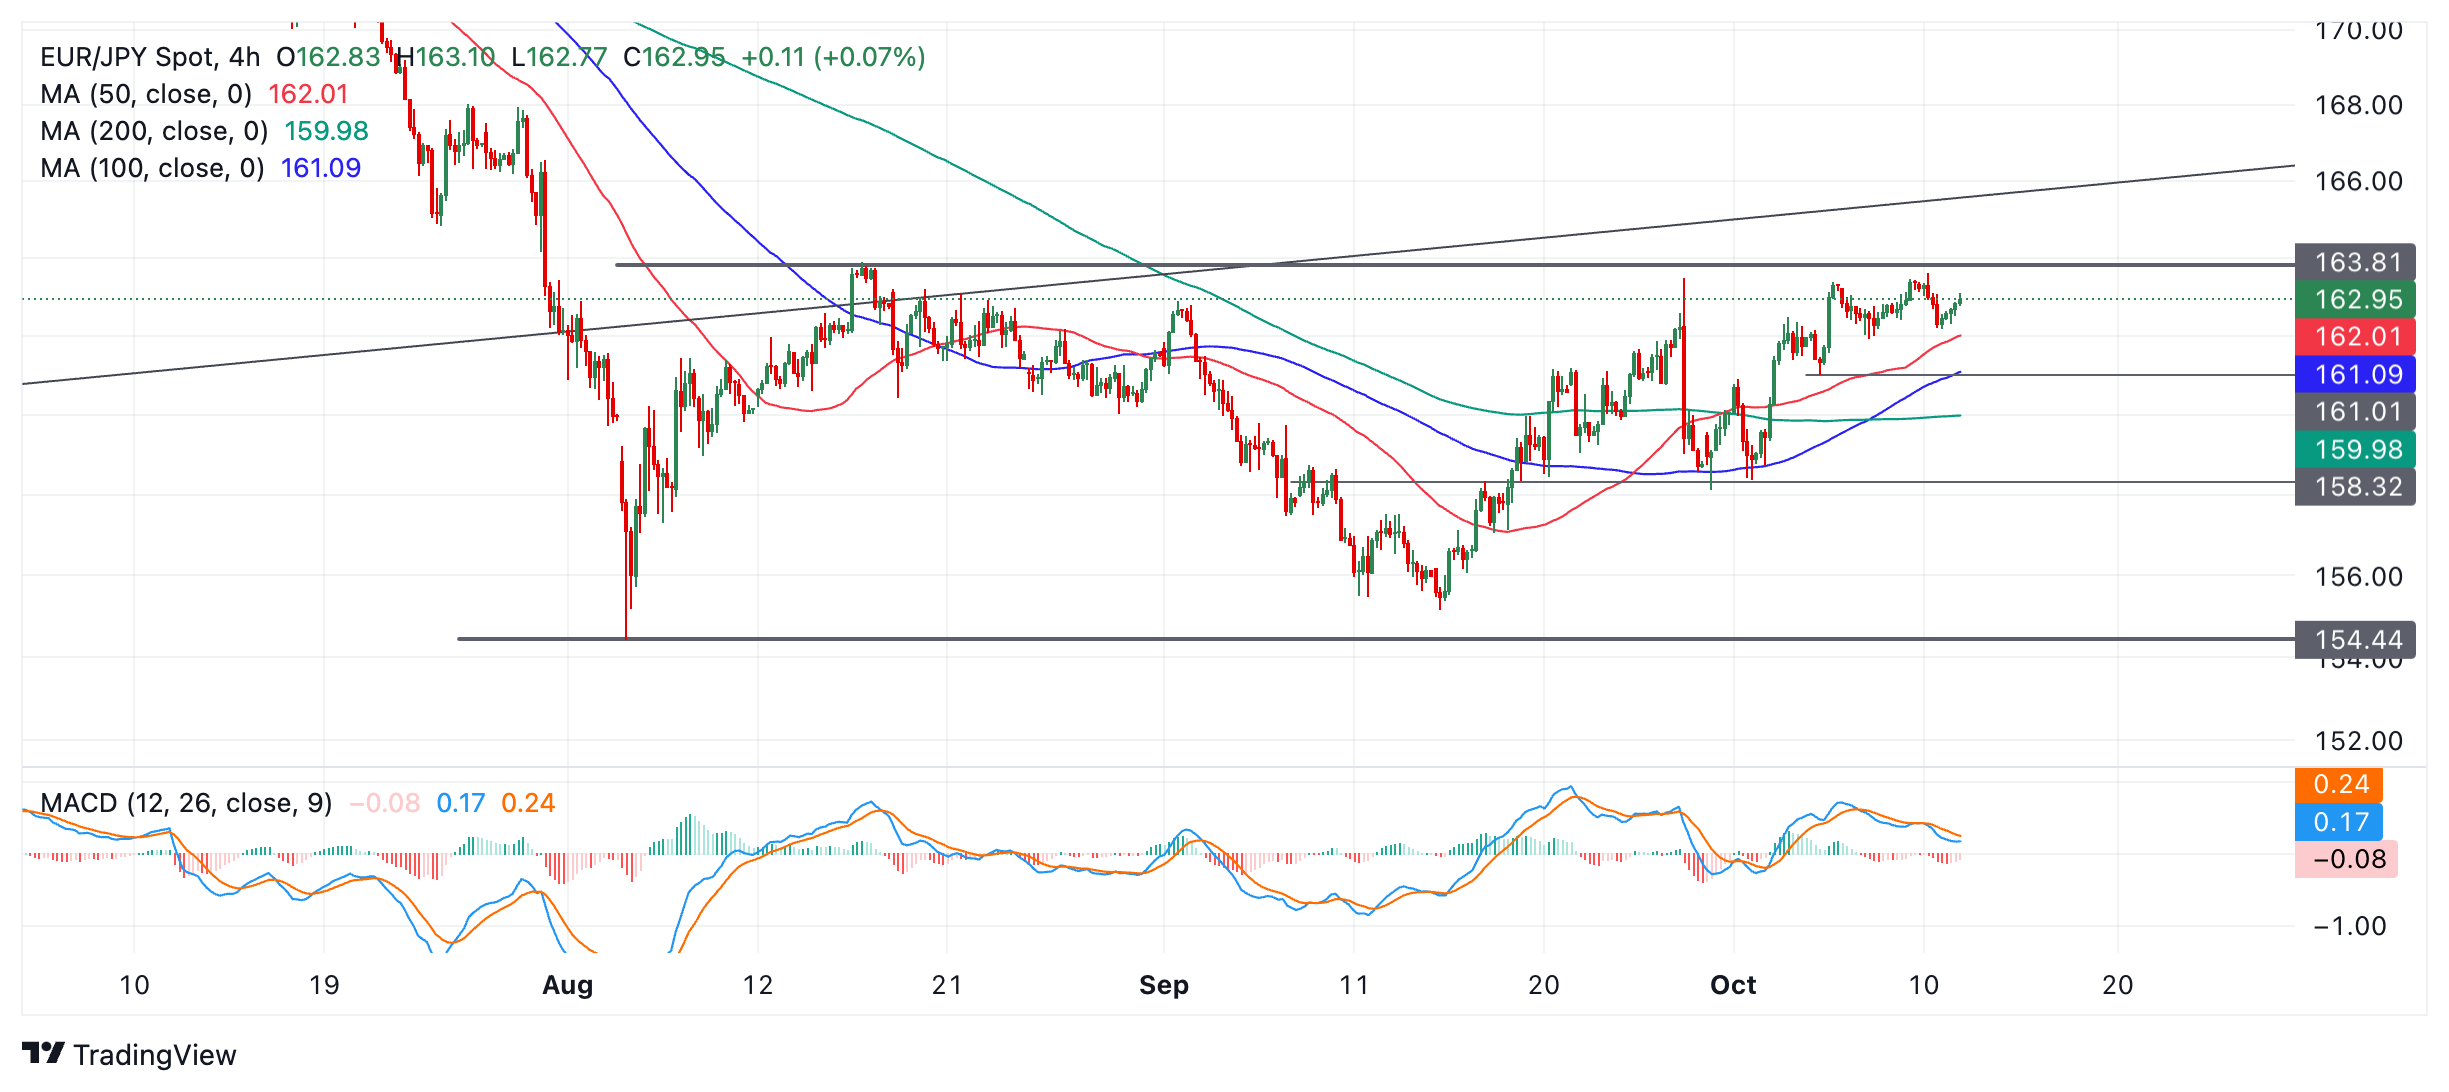
The pair is probably in a short-term sideways trend and given the guiding principle of technical analysis that “the trend is your friend”, this would suggest an extension of that sideways mode. If so, then the next move for EUR/JPY is likely to be back down towards the base of the range in the 154s.
However, there are no reversal signs from price yet and so it is too early to say with any confidence that the pair will fall. A break below 161.00 would be required to supply the additional bearish confirmation to confirm such a down leg. The next downside target for EUR/JPY is at about 158.32 and the October 1 as well as September 30 lows.
The Moving Average Convergence Divergence (MACD) momentum indicator is diverging bearishly with price. Although the MACD is currently declining, price is oscillating, suggesting weak underlying momentum underpins current price action and tilts the odds marginally in favor of more downside.
- The US Dollar trades flat on Friday, set to close the week with gains.
- Traders are gearing up for US PPI while Fed speakers keep reiterating rate cuts are to come.
- The US Dollar Index trades above 102.50 and struggles to break above 103.00.
The US Dollar (USD) stabilizes on Friday after a very solid rally this week, with the rate differential becoming the main driver. The question going forward for next week will be if this upward move in US Treasury rates was a bit overdone, seeing the US Consumer Price Index (CPI) only marginally ticked up in September compared to the previous month. This contradicts what several Federal Reserve (Fed) officials have said this week, that US rates will go lower with more interest rate cuts from the Fed confirmed.
The economic calendar is facing this week's last pieces of the puzzle. The US Producer Price Index (PPI) release for September will reveal whether the uptick in inflation is also noticeable on the production side. The last data point will be the preliminary reading from the University of Michigan on Consumer Sentiment and inflation expectations for October.
Daily digest market movers: Michigan could get distorted
- At 12:30 GMT, the US Producer Price Index numbers for September are released:
- The monthly headline PPI is expected to increase by 0.1.% from 0.2% in the previous month, with core PPI facing a similar move down to 0.2% from 0.3% previous.
- The yearly headline PPI inflation is expected to tick down to 1.6%, coming from 1.7% in August. The core PPI will be an outlier and is expected to rise 2.7%, coming from 2.4%.
- At 14:00 GMT, the University of Michigan preliminary reading for October will be released:
- Consumer Sentiment is expected to head higher to 70.8, coming from 70.1.
- 5-year consumer inflation expectations were at 3.1% in September, with no forecast available.
- The readings could be distorted due to the hurricanes in the South of the US.
- There are a few Fed speakers to look out for on Friday:
- At 13:45 GMT, Austan D. Goolsbee, head of the Federal Reserve Bank of Chicago, gives opening remarks at the Community Bankers Symposium.
- At 17:10 GMT, Federal Reserve Governor Michelle Bowman (2024 FOMC voting member) delivers a virtual speech about community banking at the Federal Reserve Bank of Chicago Community Bankers Symposium.
- Equities are overall dispersed this Friday, with main European indices on the downside, while US futures are flat to lower.
- The CME Fedwatch Tool shows an 84.0% chance of a 25 bps interest rate cut at the next Fed meeting on November 7, while 16.0% is pricing in no rate cut. Chances for a 50 bps rate cut have been fully priced out now.
- The US 10-year benchmark rate trades at 4.09, afloat above 4%.
US Dollar Index Technical Analysis: Here it gets tricky
The US Dollar Index (DXY) has had a quick sprint higher this week, with markets repositioning in the idea that interest rate cuts might be a certainty for the remainder of 2024. Although Fed officials are still very vocal on more rate cuts to come, the current move in US Treasury rates does not match with that message from the Fed. Either markets completely price out any rate cuts for 2024, which would mean the DXY break above 103.00, or it fades from here with US rates falling lower.
The psychological 103.00 is the first level to tackle on the upside. Further up, the chart identifies 103.18 as the very final resistance level for this week. Once above there, a very choppy area emerges, with the 100-day Simple Moving Average (SMA) at 103.26, the 200-day SMA at 103.77, and the pivotal 103.99-104.00 levels in play.
On the downside, the 55-day SMA at 101.91 is the first line of defence, backed by the 102.00 round level and the pivotal 101.90 as support to catch any bearish pressure and trigger a bounce. If that level does not work out, 100.62 also acts as support. Further down, a test of the year-to-date low of 100.16 should take place before more downside. Finally, and that means giving up the big 100.00 level, the July 14, 2023, low at 99.58 comes into play.
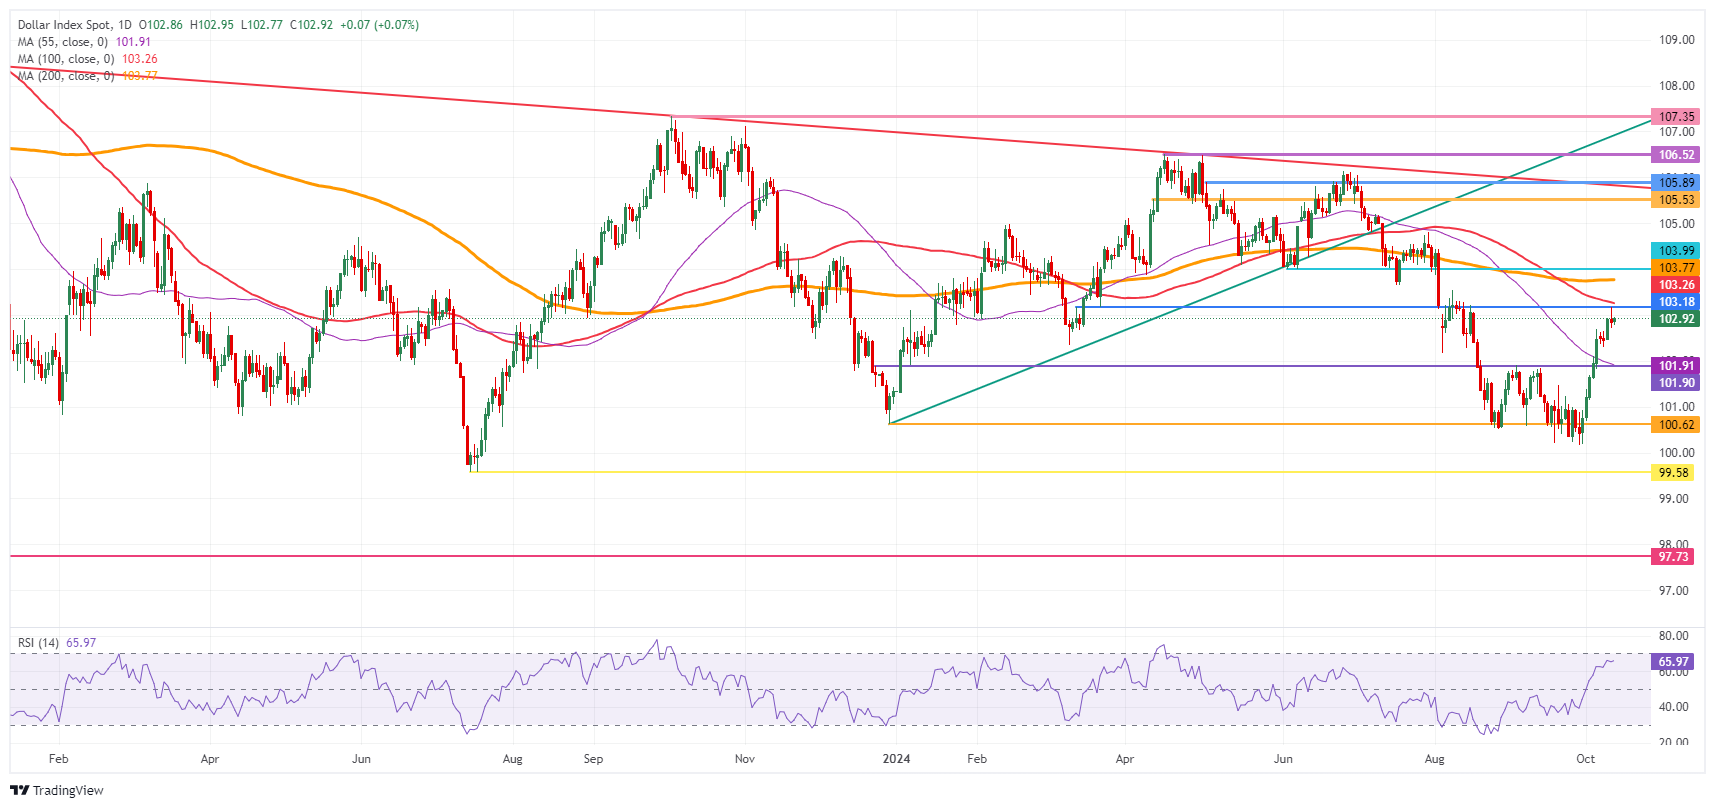
US Dollar Index: Daily Chart
US Dollar FAQs
The US Dollar (USD) is the official currency of the United States of America, and the ‘de facto’ currency of a significant number of other countries where it is found in circulation alongside local notes. It is the most heavily traded currency in the world, accounting for over 88% of all global foreign exchange turnover, or an average of $6.6 trillion in transactions per day, according to data from 2022. Following the second world war, the USD took over from the British Pound as the world’s reserve currency. For most of its history, the US Dollar was backed by Gold, until the Bretton Woods Agreement in 1971 when the Gold Standard went away.
The most important single factor impacting on the value of the US Dollar is monetary policy, which is shaped by the Federal Reserve (Fed). The Fed has two mandates: to achieve price stability (control inflation) and foster full employment. Its primary tool to achieve these two goals is by adjusting interest rates. When prices are rising too quickly and inflation is above the Fed’s 2% target, the Fed will raise rates, which helps the USD value. When inflation falls below 2% or the Unemployment Rate is too high, the Fed may lower interest rates, which weighs on the Greenback.
In extreme situations, the Federal Reserve can also print more Dollars and enact quantitative easing (QE). QE is the process by which the Fed substantially increases the flow of credit in a stuck financial system. It is a non-standard policy measure used when credit has dried up because banks will not lend to each other (out of the fear of counterparty default). It is a last resort when simply lowering interest rates is unlikely to achieve the necessary result. It was the Fed’s weapon of choice to combat the credit crunch that occurred during the Great Financial Crisis in 2008. It involves the Fed printing more Dollars and using them to buy US government bonds predominantly from financial institutions. QE usually leads to a weaker US Dollar.
Quantitative tightening (QT) is the reverse process whereby the Federal Reserve stops buying bonds from financial institutions and does not reinvest the principal from the bonds it holds maturing in new purchases. It is usually positive for the US Dollar.
The Euro (EUR) is a little firmer on the session but effectively holding within yesterday’s spot range in quiet trade, Scotiabank’s FX Chief FX Strategist Shaun Osborne notes.
EUR steadies in low 1.09s
“There are few inputs for markets to respond to so far today. Markets are all but fully priced for a dovish pivot from the ECB to unfold— 25bps cuts at each of the next two policy decisions—and the widening in EZ/US spreads has stabilized as a result. Note estimated FV for EUR/USD has steadied in the low 1.09s.”
“From here, spot movement will be driven by either, or both, evolving Fed policy expectations into year end and positioning into and around the US presidential election.”
“Spot losses have steadied over the past two sessions, with intraday chart patterns showing a bullish ‘hammer’ signal developing on the intraday candle chart around yesterday’s test of 1.09. Trends remain negative though and minor EUR gains to the mid/upper 1.09s are meeting resistance. Broader technical patterns still suggest downside risk to the 1.08 area in the coming weeks.”
The USD is consolidating this week’s gains after yesterday’s data reports interrupted its ascent, with the surprise rise in weekly claims offsetting and overshadowing slightly higher than expected CPI data, Scotiabank’s FX Chief FX Strategist Shaun Osborne notes.
USD seems mixed overall
“As I noted in yesterday’s note, the Fed’s focus is clearly turning from inflation to jobs, so the despite the stalled progress on inflation, and even if there is a weather factor in the jump in the claims data, the Fed still looks likely to cut rates 25bps in November. Fed Governor Bostic’s comment that he would be open to skipping adjusting policy in November helped trim easing bets at the margin but a 1/4 point cut remains close to 80% priced in.”
“Trading is generally quiet in the run up to the long weekend in North America. Movement in the main G10 currencies is limited and mixed—marginal gains for the GBP and EUR and slightly larger intraday losses for the JPY and commodity FX, with mild losses for European stocks and US equity futures weighing on high beta currencies. Major bond markets are a bit weaker across the board and commodities are mixed—crude oil a tad lower while industrial metals are a bit firmer.”
“US PPI data will help inform on core CPE trends but there might be a bit more focus on Fed policymakers’ comments following Bostic’s remarks. Goolsbee, Logan and Bowman are on tap today (only Bowman votes this year). Overall, dollar gains may pause in the short run, or even correct mildly, with the DXY having reached the low end of my bull target range at 103, but the risk of a bit more strength remains and the dollar should remain broadly well supported in dips for now.”
- AUD/USD rose to the top of its long-term range, formed a bearish Tweezer Top and has weakened.
- This is a bearish sign that suggests a reversal down is set to unfold.
AUD/USD rose up to the top of its range during the summer in a three-wave ABC pattern (see chart) and then formed a bearish Tweezer Top Japanese candlestick reversal pattern on the weekly chart (orange-shaded circled on chart).
AUD/USD Weekly Chart
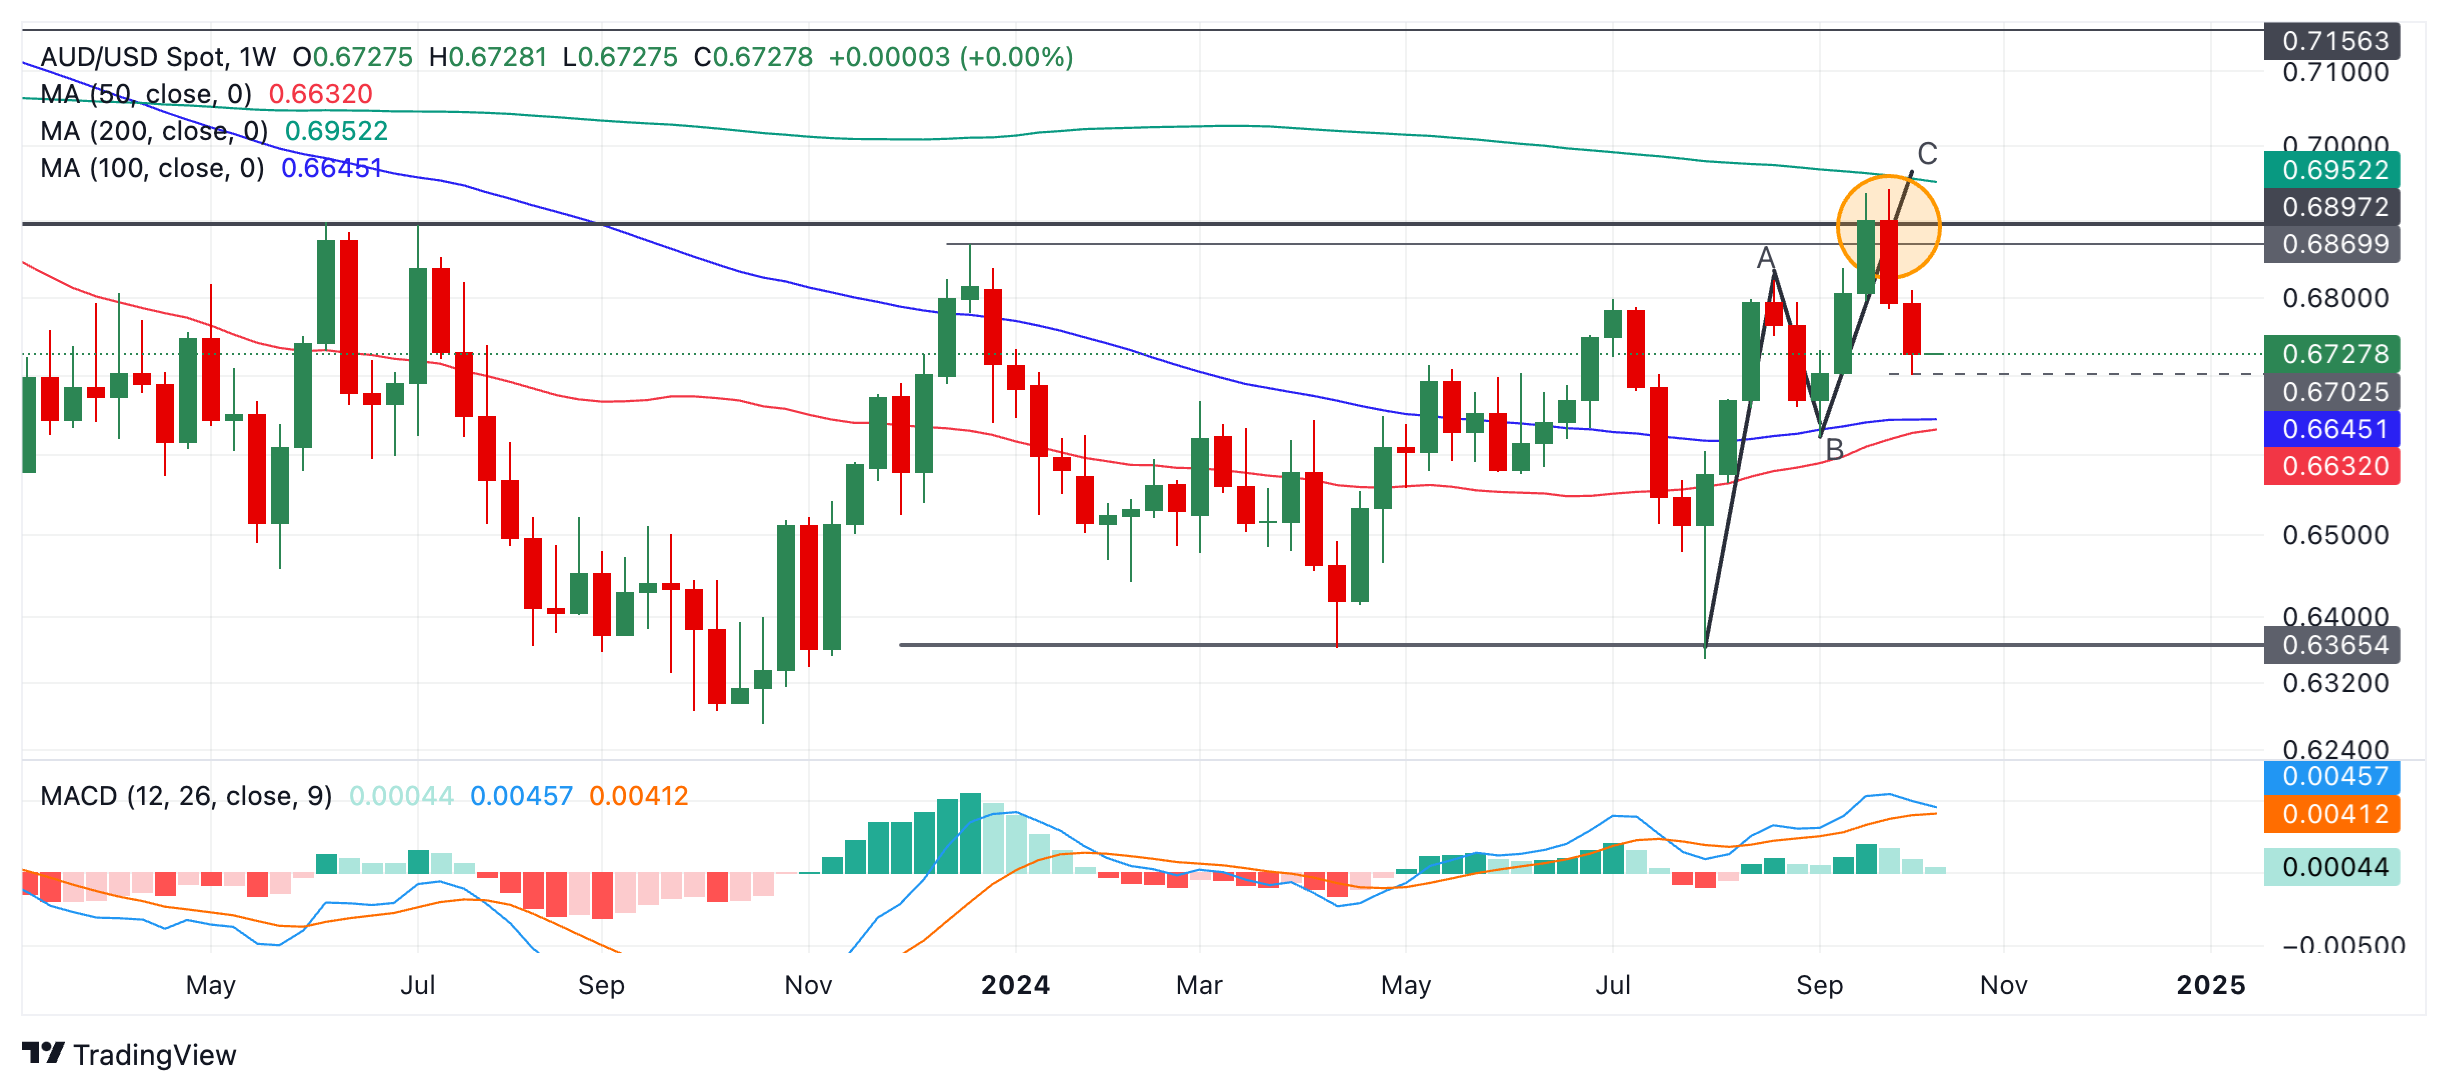
This pattern occurs at the end of an up move when two consecutive bars peak at the same or a similar level and both have a similar length “wick”. The wick is the range that sticks out above the full body of the candle. The two candlest taken together thus resemble a “tweezer”.
In the following week the pair has sold off, so far, and assuming the week ends as a red down candlestick (today is Friday), it will provide added bearish confirmation for the Tweezer Top.
The long-term trend is sideways since the pair has been moving in a range for over a year. Given the principle that “the trend is your friend” the odds favor a continuation of this trend. In this case, this would imply the next move ought to be a down leg back towards the range floor.
A break below 0.6701 (week’s lows) would provide bearish confirmation to an initial target at the cluster of major moving averages at between 0.6645 and 0.6632.
A further break below the bottom of wave B at 0.6622 would probably signal an even deeper sell-off down to a target at 0.6400 and the range lows.
Data has rapidly moved against the ECB's September messaging, and we and the market now expect a rate cut at the October meeting. Governing Council members have leaned into the cut too, TDS macro analysts note.
A rate cut at the October meeting almost imminent
“Markets are well priced for an October cut. On rates side, we doubt the ECB will provide much in terms of new information to change the current dynamics.”
“The ECB is unlikely to be a meaningful driver for the EUR. We think that a reassessment of the global data narrative, Fed pricing, and positioning adjustments will be much larger drivers of FX. We remain short EUR/USD in options.”
The Canadian Dollar (CAD) is a little softer on the session so far but losses are holding near yesterday’s low in the upper 1.37s, Scotiabank’s FX Chief FX Strategist Shaun Osborne notes.
Short-term technical position of USD/CAD looks bullish
“Before Canadian markets can think about packing it in early and heading off for the Thanksgiving weekend, there is the September employment report and the Bank of Canada’s Q3 Business Outlook survey to work through. Q3 growth is sluggish relative to expectations but markets are looking for a 27.5k rise in jobs last month. Wage growth remains sticky but the unemployment rate is expected to nudge up a tenth to 6.7%.
“The BOS will shed light on expected sales trends well as inflation expectations. Jobs data will be the driver for spot and risks here are somewhat asymmetric in terms of the likely market reaction—disappointing data will bolster expectations that the BoC will ease policy more aggressively while on expectations or better data may only temper those bets marginally, if at all. “
“It’s hard to say anything but bullish about the short-term technical position of USD/CAD. The strong run higher in the USD since the start of the month is stretching to eight consecutive sessions now and is bordering on excessive but there are no signs of vulnerability in price action and the bull trend remains firm. Support is 1.3745/50 and 1.3715. Resistance is 1.3800 and 1.3850.”
The US Dollar (USD) is likely to trade in a sideways range of 7.0650/7.0920. In the longer run, current price movements are likely part of a range trading phase; USD is likely to trade between 7.0300 and 7.1200, UOB Group’s FX analysts Quek Ser Leang and Lee Sue Ann note.
USD/CNH can break below 7.0650 mid term
24-HOUR VIEW: “We highlighted yesterday that USD ‘could rise to 7.1060 before the risk of a pullback increases.’ Our view did not materialise as it traded sideways between 7.0685 and 7.0955. Further sideways trading seems likely today, probably in a range of 7.0650/7.0920.”
1-3 WEEKS VIEW: “Our update from Wednesday (09 Oct, spot at 7.0750) remains valid. As highlighted, the current price movements are likely part of a range trading phase. For the time being, USD is expected to trade between 7.0300 and 7.1200.”
- After a volatile week, Crude Oil trades flat and stabilizes near $75 on Friday.
- Israel has signalled it is ready to retaliate against Iran’s attacks, increasing tensions and supporting Crude Oil prices.
- The US Dollar Index halts its rally after peaking at the highest level in nearly two months.
Crude Oil is back to square one for this week, stabilizing around Monday’s opening price near $75.00. The recovery from the lower levels seen earlier this week comes after Israel signaled it is ready to retaliate against Iran. The headline comes after United States (US) President Joe Biden had a phone call with Israel Prime Minister Benjamin Netanyahu on Wednesday, with President Biden urging not to attack Iranian oil installations. Meanwhile, Florida is measuring the damage of Hurricane Milton, and Oil platforms in the US Gulf of Mexico are preparing to reopen again.
The US Dollar Index (DXY), which tracks the performance of the Greenback against six other currencies, slightly retraces on Friday after its small pop on Thursday, when the US Consumer Price Index (CPI) release for September made the DXY peak to 103.18. Unfortunately, it hit resistance and saw some profit-taking going into Friday’s.
At the time of writing, Crude Oil (WTI) trades at $74.73 and Brent Crude at $78.55
Oil news and market movers: Intense weekend
- The Washington Post reports that Israel's war cabinet is meeting this Friday to decide how it will retaliate. The cabinet meeting follows Wednesday's 30-minute phone call between US President Biden and Israeli Prime Minister Netanyahu to consider the response.
- US Shale price is being calculated at around $66 per barrel, Bloomberg calculated. This means at current prices, the US will keep upscaling its shale production in order to supply enough Oil to markets and keep oil prices under control.
- At 17:00 GMT, the Baker Hughes Oil Rig Count is due. The previous reading was at 479 rigs, with no forecast available.
Oil Technical Analysis: Eventful weekend ahead
Crude Oil is set to head into a very eventful weekend, with Israel signalling it is ready to retaliate against Iran. Thus, traders can expect a lot of headlines over the weekend on geopolitics in the Middle East. And as if that is not enough, the Chinese government is set to announce possibly more stimulus measures, which will only see its impact by Monday when markets open.
Monday’s false break is to be ignored, as the move was fully paired back on Tuesday. It means that current pivotal levels on the upside are still valid: the red descending trendline in the chart below, and the 100-day Simple Moving Average (SMA) at $75.61 just hovering above it, makes that region very difficult to surpass. Once holding above that zone, the 200-day SMA at $77.17 should refute any further upticks as it did in early trading on Tuesday.
On the downside, there is a similar remark as for the upside with this false break. The rule of thumb is that if there has not been a daily close below the level, it still acts as a support. First is the 55-day SMA at $72.52, which acts as a potential first line of defence. A bit further down, $71.46 (the February 5 low) comes into play as second support before looking back to the $70.00 big figure and $67.11 as ultimate support for traders to buy the dip.
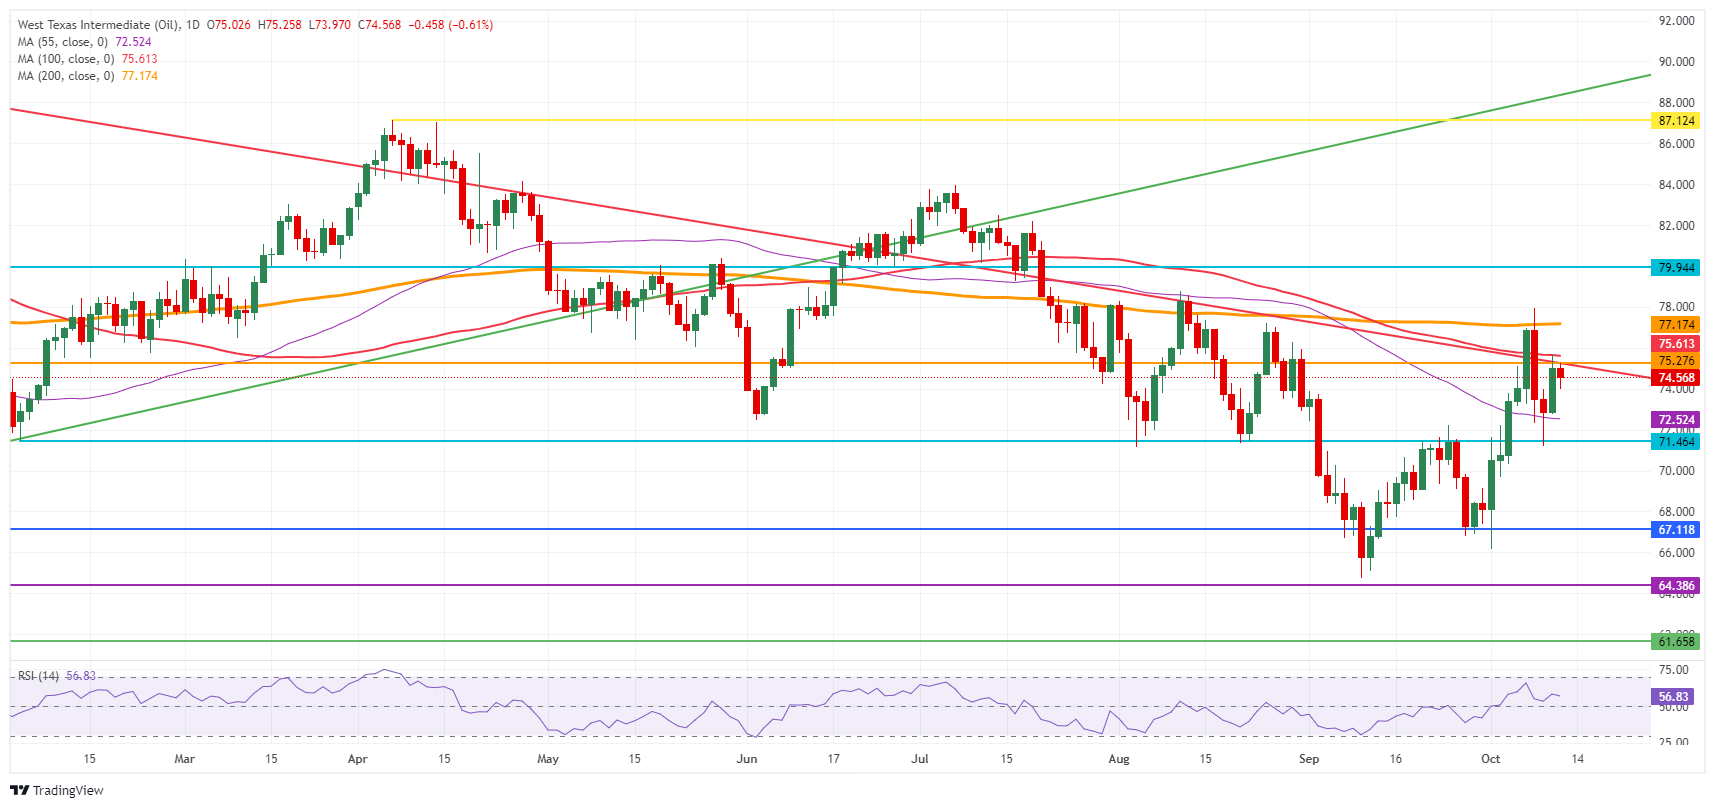
US WTI Crude Oil: Daily Chart
WTI Oil FAQs
WTI Oil is a type of Crude Oil sold on international markets. The WTI stands for West Texas Intermediate, one of three major types including Brent and Dubai Crude. WTI is also referred to as “light” and “sweet” because of its relatively low gravity and sulfur content respectively. It is considered a high quality Oil that is easily refined. It is sourced in the United States and distributed via the Cushing hub, which is considered “The Pipeline Crossroads of the World”. It is a benchmark for the Oil market and WTI price is frequently quoted in the media.
Like all assets, supply and demand are the key drivers of WTI Oil price. As such, global growth can be a driver of increased demand and vice versa for weak global growth. Political instability, wars, and sanctions can disrupt supply and impact prices. The decisions of OPEC, a group of major Oil-producing countries, is another key driver of price. The value of the US Dollar influences the price of WTI Crude Oil, since Oil is predominantly traded in US Dollars, thus a weaker US Dollar can make Oil more affordable and vice versa.
The weekly Oil inventory reports published by the American Petroleum Institute (API) and the Energy Information Agency (EIA) impact the price of WTI Oil. Changes in inventories reflect fluctuating supply and demand. If the data shows a drop in inventories it can indicate increased demand, pushing up Oil price. Higher inventories can reflect increased supply, pushing down prices. API’s report is published every Tuesday and EIA’s the day after. Their results are usually similar, falling within 1% of each other 75% of the time. The EIA data is considered more reliable, since it is a government agency.
OPEC (Organization of the Petroleum Exporting Countries) is a group of 12 Oil-producing nations who collectively decide production quotas for member countries at twice-yearly meetings. Their decisions often impact WTI Oil prices. When OPEC decides to lower quotas, it can tighten supply, pushing up Oil prices. When OPEC increases production, it has the opposite effect. OPEC+ refers to an expanded group that includes ten extra non-OPEC members, the most notable of which is Russia.
Yesterday's inflation figures in the region brought surprises in both directions. In Hungary, inflation surprised slightly down with a drop from 3.1% to 3.0% YoY. On the other hand, in the Czech Republic, it surprised on the upside with a rise from 2.2% to 2.6% YoY. In both countries, this is in line with the trend of surprises in recent months and our indications of risk. However, central banks are now in hawkish mode in Central and Eastern Europe (CEE) and while in Hungary this will not be a reason for a rate cut in October, in the Czech Republic it increases the probability of a pause in the cutting cycle, ING’s FX analyst Francesco Pesole notes.
CEE FX remains fragile
“This morning we got inflation numbers for September in Romania as well. Inflation fell from 5.10% to 4.62%, slightly below the 4.70% consensus. At the last meeting in October, the central bank left rates unchanged after two cuts earlier. Our economists don't expect a rate cut at the meeting in November, but weaker inflation numbers leave this topic open.”
“Although the first half of the week suggested stabilisation and finding ground underfoot, yesterday shows that the situation is not simple. As we have discussed here before, global risks have not changed much and CEE FX remains fragile. With higher inflation numbers in the Czech Republic, we see a chance for hawkish comments from the Czech National Bank that could support the koruna in the current uncertain environment.”
“On the other hand, the National Bank of Hungary has already commented on the current situation, essentially ruling out a rate cut in October. However, EUR/HUF is back above 400 and not far from 402. Thus, the koruna and zloty seem to be more defensive in these conditions, while the forint, as usual, remains more sensitive to global exposure.”
The US Dollar (USD) is likely to consolidate in a range of 148.10/149.40. In the longer run, although momentum has not increased much; further USD strength seems likely. Levels to watch are 150.05 and 151.00, UOB Group’s FX analysts Quek Ser Leang and Lee Sue Ann note.
USD can break above 149.40
24-HOUR VIEW: “Yesterday, we held the view that USD ‘is likely to rise above 149.50, but it does not seem to have enough momentum to break clearly above 150.05.’ However, the price action did not turn out as we expected. USD swung between 148.34 and 149.54 before closing at 148.56 (-0.49%). USD appears to have moved into a consolidation. Today, it is likely to trade in a 148.10//149.40 range.”
1-3 WEEKS VIEW: “We continue to hold the same view as yesterday (10 Oct, spot at 149.20). As indicated, although upward momentum has not increased much, further USD strength seems likely, and the levels to watch are at 150.05 and 151.00. To maintain the momentum, USD must not break below 147.50 (no change in ‘strong support’ level). Note that we have held a positive USD view since last week.”
- USD/CAD jumps above 1.3750 amid weakness in the Canadian Dollar ahead of Canada’s Employment data for September.
- The BoC is expected to cut interest rates further in the remainder of the year.
- The next move in the US Dollar will be influenced by the US PPI data for September.
The USD/CAD pair extends its winning spell for the eighth trading day on Friday. The Loonie pair strengthens and rises above 1.3750 amid sheer weakness in the Canadian Dollar (CAD). The Canadian currency exhibits weakness amid growing expectations that the Bank of Canada (BoC) will cut interest rates further in October.
The BoC has already reduced its borrowing rates by 75 basis points (bps) this year as price pressures have returned to the bank’s target of 2% and the labor market is weak. To get fresh insights of the current labor market status, investors will focus on the Employment data for September, which will be published at 12:30 GMT.
Economists expect the nation added 27K fresh workers, higher than 22.1K in August. The Unemployment Rate is estimated to have accelerated to 6.7% from the former print of 6.6%. Signs of a further slowdown in the labor demand could prompt expectations of a BoC 50 bps rate cut next month.
Meanwhile, the US Dollar (USD) edges higher ahead of the United States (US) Producer Price Index (PPI) data for September, which is scheduled at 12:30 GMT. The US Dollar Index (DXY), which gauges the Greenback’s value against six major currencies, trades close to 103.00.
USD/CAD witnessed strong buying interest after a Double Bottom formation near 1.3440 on a daily timeframe. The bullish reversal formation got the green signal after a breakout above the September 19 high around 1.3650.
The near-term outlook of the Loonie pair will strengthen further as 20-and 50-day Exponential Moving Averages (EMAs) are on track to deliver a bull cross near 1.3600.
The 14-day Relative Strength Index (RSI) shifts into the bullish range of 60.00-80.00, suggesting a strong momentum on the upside.
More upside towards April 16 high of 1.3846 and Year-To-Date (YTD) high of 1.3945 would appear if the pair breaks above Thursday’s high of 1.3775.
In an alternate scenario, a downside move below the September 19 high around 1.3650 will expose the asset to May 16 low near 1.3600, followed by September 13 high of 1.3538.
USD/CAD daily chart
Canadian Dollar FAQs
The key factors driving the Canadian Dollar (CAD) are the level of interest rates set by the Bank of Canada (BoC), the price of Oil, Canada’s largest export, the health of its economy, inflation and the Trade Balance, which is the difference between the value of Canada’s exports versus its imports. Other factors include market sentiment – whether investors are taking on more risky assets (risk-on) or seeking safe-havens (risk-off) – with risk-on being CAD-positive. As its largest trading partner, the health of the US economy is also a key factor influencing the Canadian Dollar.
The Bank of Canada (BoC) has a significant influence on the Canadian Dollar by setting the level of interest rates that banks can lend to one another. This influences the level of interest rates for everyone. The main goal of the BoC is to maintain inflation at 1-3% by adjusting interest rates up or down. Relatively higher interest rates tend to be positive for the CAD. The Bank of Canada can also use quantitative easing and tightening to influence credit conditions, with the former CAD-negative and the latter CAD-positive.
The price of Oil is a key factor impacting the value of the Canadian Dollar. Petroleum is Canada’s biggest export, so Oil price tends to have an immediate impact on the CAD value. Generally, if Oil price rises CAD also goes up, as aggregate demand for the currency increases. The opposite is the case if the price of Oil falls. Higher Oil prices also tend to result in a greater likelihood of a positive Trade Balance, which is also supportive of the CAD.
While inflation had always traditionally been thought of as a negative factor for a currency since it lowers the value of money, the opposite has actually been the case in modern times with the relaxation of cross-border capital controls. Higher inflation tends to lead central banks to put up interest rates which attracts more capital inflows from global investors seeking a lucrative place to keep their money. This increases demand for the local currency, which in Canada’s case is the Canadian Dollar.
Macroeconomic data releases gauge the health of the economy and can have an impact on the Canadian Dollar. Indicators such as GDP, Manufacturing and Services PMIs, employment, and consumer sentiment surveys can all influence the direction of the CAD. A strong economy is good for the Canadian Dollar. Not only does it attract more foreign investment but it may encourage the Bank of Canada to put up interest rates, leading to a stronger currency. If economic data is weak, however, the CAD is likely to fall.
Canada releases jobs figures for September today, and the consensus is centred around a solid 27k employment print, with unemployment inching up from 6.6% to 6.7%, ING’s FX analyst Francesco Pesole notes.
Room for hawkish repricing to offer help to the CAD
“If the numbers prove to be close to consensus, we doubt the Bank of Canada will be rushed into a 50bp cut later this month. Markets are pricing in 48bp for 23 October meeting and 70bp in total by year-end, which looks a bit overblown on the dovish side, in our view.”
“Accordingly, we see some room for hawkish repricing to offer help to the Canadian dollar, which has remained under pressure against USD despite higher oil prices.”
“We had previously identified room for CAD’s outperformance against other commodity currencies and could see another leg lower in AUD/CAD and NZD/CAD today before the expected Chinese stimulus story over the weekend gives some help to the antipodeans.”
The New Zealand Dollar (NZD) is likely to consolidate between 0.6070 and 0.6120. In the longer run, oversold weakness has not stabilised, but NZD must break clearly below 0.6050 before further sustained decline is likely, UOB Group’s FX analysts Quek Ser Leang and Lee Sue Ann note.
Bears to push towards 0.6050
24-HOUR VIEW: “Two days ago, NZD plummeted to a low of 0.6053. Yesterday, we indicated that ‘the sharp and swift decline appears to be overdone.’ We held the view that instead of weakening further, NZD ‘is more likely to consolidate between 0.6050 and 0.6100.’ Our view turned out to be correct, as NZD traded between 0.6050 and 0.6097. Further consolidation seems likely today, even though the slightly firmed underlying tone suggests a higher range of 0.6070/0.6120.”
1-3 WEEKS VIEW: “Our update from yesterday (10 Oct, spot at 0.6070) remains valid. As highlighted, the oversold in weakness has not stabilised, but NZD ‘must break and remain below 0.6050 before further sustained decline is likely.’ The probability of NZD breaking clearly below 0.6050 will remain intact as long as 0.6145 (no change in ‘strong resistance’ level) is not breached. Looking ahead, the next level to monitor below 0.6050 is 0.6005.”
USD/CAD decline stalls near August low of 1.3440, which resulted in a short-term up move, Societe Generale’s FX analysts note.
MA near 1.3600 is likely to provide support
“USD/CAD decline stalled near August low of 1.3440; this test has resulted in a short-term up move. The pair has recently reclaimed the 200-DMA.”
“Daily MACD has entered positive territory denoting regain of upward momentum. In case a brief pullback develops, the MA near 1.3600 is likely to provide support.”
“Defence of this can result in continuation in up move gradually towards April high of 1.3840. Upper limit of the range since 2022 at 1.3950/1.3980 remains a key resistance zone.”
- Gold recovers after the release of worst-than-expected US Jobless Claims data.
- Despite higher inflation data suggesting interest rates might remain high, the jobs data indicates the opposite.
- Technically, XAU/USD returns to its range-bound mode as it unfolds a leg back higher.
Gold (XAU/USD) recovers to trade back in the $2,630s on Friday as subpar United States (US) jobs data cements expectations that the Federal Reserve (Fed) will cut interest rates at their November policy meeting. The anticipation of interest rates falling is bullish for Gold as such an occurrence would reduce the opportunity cost of holding the non-interest-paying asset, making it more attractive to investors.
Gold rallies after US jobs data
Gold rebounded from just above the key $2,600 psychological level on Thursday after the release of official US Jobless Claims data showed a surprising spike in the number of people claiming unemployment benefits. US Treasury yields dipped after the release, the US Dollar (USD) marginally weakened and Gold got a lift.
US Initial Jobless Claims in the week ending October 4 rose by 258K, above the 225K of the previous week and expectations of 230K, data from the US Bureau of Labor Statistics (BLS) showed. The rise in initial claims was well above the average, although this might have been caused by the exodus from Florida ahead of the impact of Hurricane Milton, according to Bloomberg News.
Continuing Claims for the week ending September 27 rose to 1.861 million, higher than the revised-down 1.819M of the previous week and roundly above the 1.830M estimate.
Overall, the data showed weakness creeping into the jobs market, which is likely to keep the Fed on track to cut interest rates (in order to stimulate borrowing and job creation) at its November policy meeting. In August, Fed Chairman Jerome Powell signaled he was shifting his focus from inflation to the Fed’s other mandate: “full employment”.
Although the market-based probability of the Fed lowering its fed funds rate by 50 basis points (bps) (0.50%) remained at zero after the release, the chances of a smaller 25 bps (0.25%) cut rose to 89% from 85% before the jobs’ data, according to the CME Fedwatch tool. The probability of the Fed leaving its key interest rate unchanged in November fell to 11% from 15%. These probabilities have since reverted to 85% for 25 bps and 15% for no-change.
Higher-than-expected inflation data, as measured by the Consumer Price Index (CPI) for September, released at the same time as the Jobless Claims’ data, failed to act as a counter-weight. Headline CPI climbed 2.4% year-over-year (YoY) from 2.3% previously, and core CPI rose 3.3% YoY from 3.2% previously. The higher inflation would normally be expected to increase bets of the Fed keeping interest rates unchanged to continue the fight against stubbornly high inflation, however, this was not the case on Thursday. This was probably due to the Fed’s new prioritization of employment.
Gold has recently gained a further backdraught from the speeches of Fed policymakers. A long list of officials commented on the outlook for monetary policy on Wednesday, and all were assessed as either neutral or dovish according to the FXStreet FedTracker, a new AI-powered tool that gauges the tone of Fed officials’ speeches on a dovish-to-hawkish scale from 0 to 10.
More US inflation data is set to be released on Friday in the form of “factory gate” inflation figures for September, or the Producer Price Index (PPI). However, judging from the lack of reaction to the CPI data, any impact on Gold is likely to be muted unless it diverges in a sizeable way from forecasts. The US Michigan Consumer Sentiment survey is another major release on Friday that could impact Gold.
Gold could also be gaining due to attracting safe-haven flows amid elevated geopolitical tensions. Israel has stepped up its bombing of Hezbollah targets in Lebanon, causing substantial collateral damage, and investors remain on tenterhooks about the scale of Israel’s almost certain retaliation against Iran.
Technical Analysis: Gold returns to familiar range
Gold flips its short-term downtrend and rises back up into its familiar range above $2,625 after bottoming out at the $2,600 psychological level.
XAU/USD 4-hour Chart
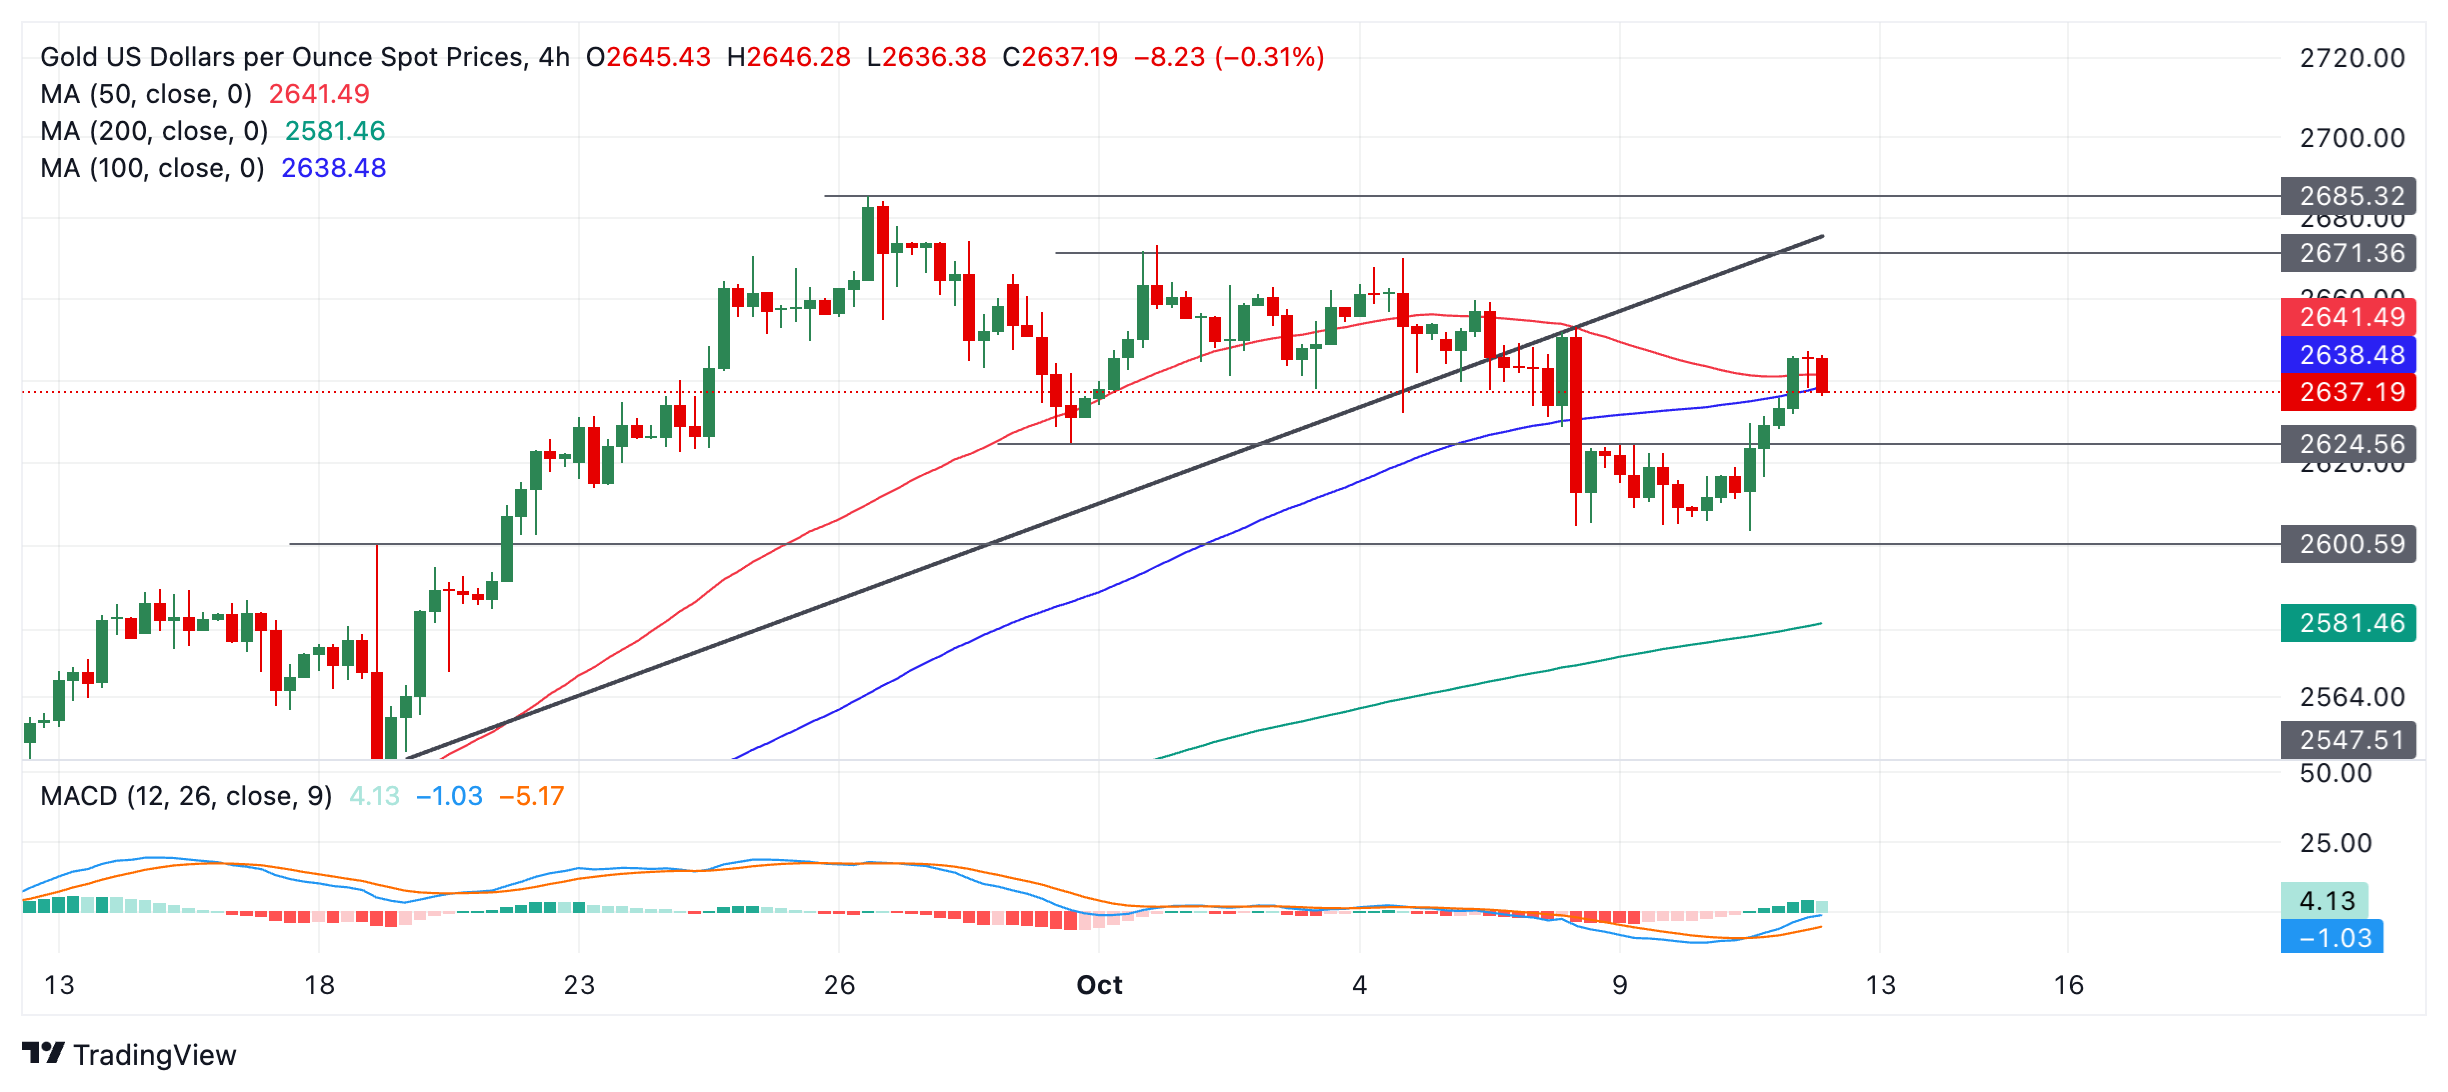
The short-term trend has probably switched back to sideways, and given the technical analysis principle that “the trend is your friend,” the odds favor a continuation in the near term. This will likely see Gold continue its up-leg towards the old range ceiling at $2,670. A break above $2,653 (October 8 high) would provide more confirmation such a leg was evolving. Following that, Gold might unfold a leg back down to the range floor as it continues oscillating.
Gold’s medium and long-term trends remain bullish, however, and if one of these longer-term cycles resumes, it could, in theory, push the asset to even higher highs.
Economic Indicator
Initial Jobless Claims
The Initial Jobless Claims released by the US Department of Labor is a measure of the number of people filing first-time claims for state unemployment insurance. A larger-than-expected number indicates weakness in the US labor market, reflects negatively on the US economy, and is negative for the US Dollar (USD). On the other hand, a decreasing number should be taken as bullish for the USD.
Read more.Last release: Thu Oct 10, 2024 12:30
Frequency: Weekly
Actual: 258K
Consensus: 230K
Previous: 225K
Source: US Department of Labor
Every Thursday, the US Department of Labor publishes the number of previous week’s initial claims for unemployment benefits in the US. Since this reading could be highly volatile, investors may pay closer attention to the four-week average. A downtrend is seen as a sign of an improving labour market and could have a positive impact on the USD’s performance against its rivals and vice versa.
EUR/USD has stabilised in the 1.09-1.10 range, but continues to face downside risks as a USD:EUR two-year swap rate gap at 130bp is consistent with sub-1.09 levels, and Middle East tensions can easily add to the negatives for the pro-cyclical, oil-sensitive EUR.
China be important for EUR/USD’s tactical picture
“Weekend developments in China will likely be important for EUR/USD’s tactical picture given the euro tends to have a good response to positive China developments. Good news from Beijing can help build a floor at 1.090 early next week. The eurozone calendar is not offering many market inputs for the time being, and the ECB is in a quiet period ahead of next week’s meeting.”
“The latest ECB minutes did not give many insights about the October meeting, especially in light of recent inflation data surprises. While arguments against a rate cut shouldn’t be entirely dismissed, it would now take quite a lot of courage from the ECB to hold, given markets and the consensus are fully aligned for a 25bp reduction.”
“Elsewhere in Europe, the UK released some slightly softer-than-expected growth figures for August, with 3M/3M GDP having slowed to 0.2%. Industrial production for the same month came in quite soft, at -1.6% YoY. This is all second-tier data for the Bank of England and sterling has barely budged, but they might be contributing to the recent narrative that a dovish repricing in the Sonia curve is overdue. Still, some encouraging news on services CPI next week is needed to take EUR/GBP sustainably back above 0.84.”
The Australian Dollar (AUD) is likely to trade in a sideways range of 0.6715/0.6770. In the longer run, bias for AUD remains on the downside; a clear break below 0.6700 would suggest further decline, potentially to 0.6670, UOB Group’s FX analysts Quek Ser Leang and Lee Sue Ann note.
Bias for AUD remains on the downside
24-HOUR VIEW: “The title of our update yesterday was ‘A break 0.6700 is not ruled out; given the mild momentum, AUD may not be able to maintain a foothold below this level.’ However, AUD did not break 0.6700, trading choppily between 0.6702 and 0.6743, before closing at 0.6742 (+0.35%). The price action is likely part of a sideways trading phase, probably in a range of 0.6715/0.6770.”
1-3 WEEKS VIEW: “We highlighted yesterday (10 Oct, spot at 0.6720) that ‘while there has been no significant increase in momentum, the bias for AUD remains on the downside.’ We added, ‘a clear break below 0.6700 would suggest AUD could decline further, potentially to 0.6670,’ and ‘the downward bias is intact provided that AUD remains below 0.6785 (‘strong resistance’ level).’ AUD subsequently dropped to 0.6702, then rebounded. We continue to hold the same view for now.”
The New Zealand Dollar (NZD) fell after RBNZ cut rate by 50bp. Pair was last at 0.6090, OCBC FX analysts Frances Cheung and Christopher Wong note.
Support comes in at 0.6060 and 0.60 levels
“MPC agreed that monthly price indices signal a continued decline in consumer price inflation. RBNZ also said that economic growth is weak, in part because of low productivity growth, but mostly due to weak consumer spending and business investment. These comments were well in line with what was earlier flagged in the NZIER’s quarterly survey of business opinions report.”
“Markets continue to expect about 50bp cut at the next MPC in Nov and another 100bp cut or so in 1H 2025. These were already priced in prior to the MPC. Dovish RBNZ may weigh on Kiwi for now but given that expectations are in the price, the downside for NZD may also be constrained.”
“Bearish momentum on daily chart intact while RSI is near oversold conditions. Support comes in at 0.6060 and 0.60 levels. Resistance at 0.61 (200 DMA), 0.6160 (50 DMA).”
The Pound Sterling (GBP) is expected to trade in a range, probably between 1.3020 and 1.3100. In the longer run, there has been no further increase in momentum; a breach of 1.3125 would suggest that 1.3000 is out of reach, UOB Group’s FX analysts Quek Ser Leang and Lee Sue Ann note.
Breach of 1.3125 to suggest that 1.3000 is out of reach
24-HOUR VIEW: “Yesterday, when GBP was at 1.3070, we expected it to ‘drift lower, potentially breaking below 1.3050.’ We added, ‘due to the lackluster momentum, any decline is unlikely to reach 1.3000.’ GBP did not break below 1.3050 until NY trade, when it dropped to 1.3011 and then rebounded sharply. GBP closed slightly lower at 1.3061 (-0.11%). The price action did not result in any increase in downward momentum. Today, we expect GBP to trade in a range, probably between 1.3020 and 1.3100.”
1-3 WEEKS VIEW: “In our most recent narrative from last Monday (04 Oct, spot at 1.3130), we indicated that “although the recent price action suggests further GBP weakness, conditions are oversold, and the next major support at 1.3000 may not come into view so soon.” Yesterday, GBP dropped to a low of 1.3011. Despite the decline, there has been no further increase in downward momentum. However, only a breach of 1.3125 (‘strong resistance’ level was at 1.3150 yesterday) would suggest that 1.3000 is out of reach this time around.”
The latest batch of US data has sent contrasting signals to the Federal Reserve and to the markets. In other circumstances, there would have been a US Dollar (USD) rally, but there are at least two sets of factors that have capped the FX reaction, ING’s FX strategist Francesco Pesole notes.
DXY may reach 103.50 in the near term
“The surprise rise in jobless claims might be due to extreme weather events but had a noticeable negative impact on the dollar. The room for further dovish repricing is limited. The link between rates/data and the dollar to soften into the US election. Yesterday’s moves seem to endorse such dynamics, and with market pricing for the Fed now likely to prove sticky on both sides, we’ll be monitoring more closely the external environment rather than US data like today’s PPI.”
“Oil volatility remains central. Crude prices are facing some large daily swings while awaiting Israel’s retaliation against Iran, which could lead to disruptions in supply. Israel's defence minister said the nation’s next move will be ‘above all surprising’, and Iran has already pledged to strike back should it be attacked, which is probably contributing to the uncertainty and the general sense it will take some time for tensions to de-escalate.”
“Another non-US development to follow is tomorrow’s announcement of new stimulus measures in China. The consensus for the size of the package is around 2tn yuan, but the market reaction will probably depend more on the targets of extra spending, with any boosts to consumption probably being favoured. Even in the case of a positive reaction, we are not sure markets are ready to take USD/CNY below 7.0 before the US election. Ultimately, the negative impact on the dollar may be contained. A strengthening into 103.50 in DXY remains possible in the near term.”
- USD/CHF remains supported near 0.8560 with US PPI on the horizon.
- Surprisingly upbeat US employment and hot inflation data for September have eradicated the Fed 50 rate cut scenario.
- The SNB is expected to cut interest rates further this year.
The USD/CHF pair wobbles near the immediate support of 0.8560 in Friday’s European session. The Swiss Franc pair edges higher despite the US Dollar (USD) exhibits a subdued performance. The US Dollar Index (DXY), which gauges the Greenback’s value against six major currencies, falls slightly but remains close to an eight-week high of around 103.00.
The outlook of the US Dollar remains firm as traders are expecting the Federal Reserve (Fed) to cut interest rates again in the November policy meeting but at a gradual pace of 25 basis points (bps), according to the CME FedWatch tool.
Lately, market participants were anticipating the Fed to deliver another 50-bps cut next month, as seen in September. Market expectations for the Fed's sizeable rate cut waned after the blowout United States (US) job data and hotter-than-expected Consumer Price Index (CPI) report for September.
For more cues on the Fed’s interest rate outlook, investors will focus on the US Producer Price Index (PPI) data for September, which will be published at 12:30 GMT. The PPI report is expected to show that the headline producer inflation rose by 1.6%, slower than 1.7% in August year-on-year. On the contrary, the annual core PPI is estimated to have accelerated to 2.7% from the prior release of 2.4%.
In the Swiss economy, the Swiss National Bank (SNB) is expected to cut interest rates further this year. "With inflation being reasonably low in Switzerland and with an economy that could grow faster, that tends in the direction of a lower policy rate," Martin told an event organized by the Swiss Financial Analysts Association in Zurich, Reuters reported.
An improvement in the likelihood of more rate cuts from the SNB would keep the Swiss Franc (CHF) on the backfoot.
Swiss Franc FAQs
The Swiss Franc (CHF) is Switzerland’s official currency. It is among the top ten most traded currencies globally, reaching volumes that well exceed the size of the Swiss economy. Its value is determined by the broad market sentiment, the country’s economic health or action taken by the Swiss National Bank (SNB), among other factors. Between 2011 and 2015, the Swiss Franc was pegged to the Euro (EUR). The peg was abruptly removed, resulting in a more than 20% increase in the Franc’s value, causing a turmoil in markets. Even though the peg isn’t in force anymore, CHF fortunes tend to be highly correlated with the Euro ones due to the high dependency of the Swiss economy on the neighboring Eurozone.
The Swiss Franc (CHF) is considered a safe-haven asset, or a currency that investors tend to buy in times of market stress. This is due to the perceived status of Switzerland in the world: a stable economy, a strong export sector, big central bank reserves or a longstanding political stance towards neutrality in global conflicts make the country’s currency a good choice for investors fleeing from risks. Turbulent times are likely to strengthen CHF value against other currencies that are seen as more risky to invest in.
The Swiss National Bank (SNB) meets four times a year – once every quarter, less than other major central banks – to decide on monetary policy. The bank aims for an annual inflation rate of less than 2%. When inflation is above target or forecasted to be above target in the foreseeable future, the bank will attempt to tame price growth by raising its policy rate. Higher interest rates are generally positive for the Swiss Franc (CHF) as they lead to higher yields, making the country a more attractive place for investors. On the contrary, lower interest rates tend to weaken CHF.
Macroeconomic data releases in Switzerland are key to assessing the state of the economy and can impact the Swiss Franc’s (CHF) valuation. The Swiss economy is broadly stable, but any sudden change in economic growth, inflation, current account or the central bank’s currency reserves have the potential to trigger moves in CHF. Generally, high economic growth, low unemployment and high confidence are good for CHF. Conversely, if economic data points to weakening momentum, CHF is likely to depreciate.
As a small and open economy, Switzerland is heavily dependent on the health of the neighboring Eurozone economies. The broader European Union is Switzerland’s main economic partner and a key political ally, so macroeconomic and monetary policy stability in the Eurozone is essential for Switzerland and, thus, for the Swiss Franc (CHF). With such dependency, some models suggest that the correlation between the fortunes of the Euro (EUR) and the CHF is more than 90%, or close to perfect.
- EUR/USD finds temporary support near 1.0900 as the Euro outperforms its major peers.
- The Euro gains despite firm ECB dovish bets amid a faster-than-expected decline in Eurozone inflationary pressures.
- Investors await the US PPI for fresh cues on the Fed’s interest rate outlook.
EUR/USD moves slightly higher to near 1.0950 on Friday after a sharp recovery from the two-month low of 1.0900 recorded on Thursday. The pullback move in the major currency pair could be short-lived as the US Dollar (USD) clings to gains ahead of the United States (US) Producer Price Index (PPI) data, which will be published at 12:30 GMT. The US Dollar Index (DXY), which tracks the Greenback’s value against six major currencies, holds onto gains near 103.00.
Investors will pay close attention to the US PPI data as it will indicate the pace at which prices of goods and services were raised by producers at factory gates in September. Producer inflation is majorly influenced by the change in input cost and households’ demand.
Economists expect the annual headline PPI inflation to have decelerated to 1.6% from 1.7% in August. The annual core PPI – which strips off volatile food and energy prices – is estimated to have accelerated sharply by 2.7% from the former release of 2.4%. The monthly headline and core PPI are expected to have grown at a slower pace of 0.1% and 0.2%, respectively.
The US Dollar is broadly upbeat as Atlanta Federal Reserve (Fed) Bank President Raphael Bostic has brought the option of leaving interest rates unchanged at 4.75%-5.00% in November on the table.
The comments from Bostic in an interview with the Wall Street Journal on Thursday indicated that he is comfortable with skipping the interest rate cut next month. Bostic said, “This choppiness to me is along the lines of maybe we should take a pause in November and I'm definitely open to that.” His comments came after the release of the US Consumer Price Index (CPI) report, which showed that inflationary pressures rose at a faster-than-expected pace in September.
Daily digest market movers: EUR/USD rises slightly as Euro gains
- EUR/USD edges higher to near 1.0950 in Friday’s European session. The major currency pair moves slightly higher as the Euro (EUR) performs strongly against its major peers despite firm expectations that the European Central Bank (ECB) will cut interest rates further in both monetary policy meetings remaining this year.
- The ECB has already reduced its Deposit Facility Rate by 50 basis points (bps) to 3.5% this year. The central bank is expected to cut them further by 50 bps again in the remaining year. Traders have priced in two rate cuts of 25 bps, one of which will come next week and the second in December.
- ECB dovish bets have been accelerated by a faster-than-expected decline in Eurozone inflationary pressures and growing risks to economic growth. This week, ECB policymaker and Governor of the Greek Central Bank Yannis Stournaras said that price pressures are declining faster than the ECB forecasted in September. Stournaras also backed two more rate cuts in each of the remaining meetings this year, emphasizing the need to reduce them further in 2025.
- Meanwhile, revised estimates for the German Harmonized Index of Consumer Prices (HICP) for September have shown that price pressures remained below the bank’s target of 2% at 1.8%, as shown in flash estimates.
- On the economic front, the growth prospects of the Eurozone are vulnerable as its largest nation, Germany is forecasted to close the year with a decline in output by 0.2%, the German economic ministry said.
Technical Analysis: EUR/USD finds cushion near 200-day EMA
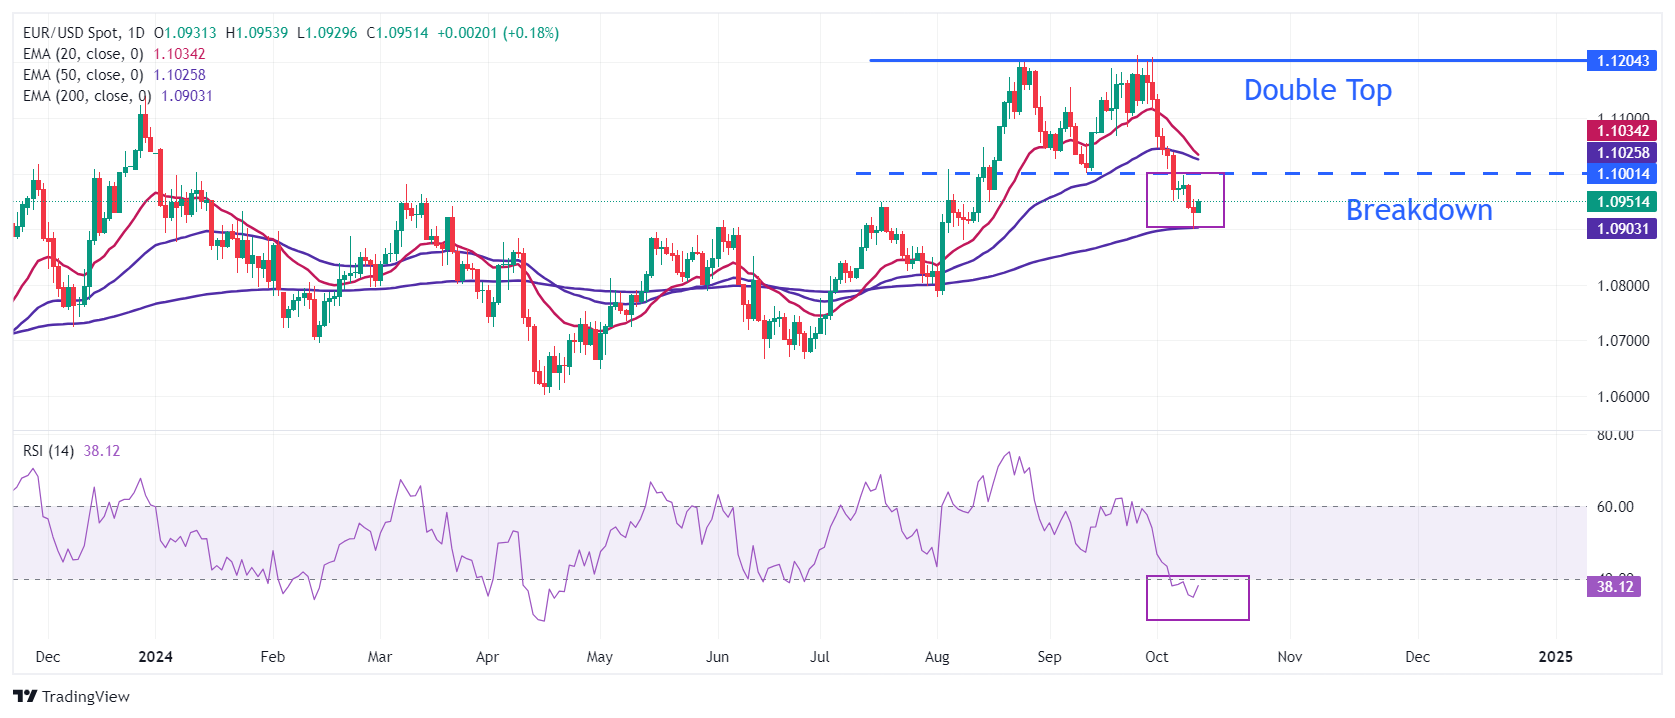
EUR/USD finds temporary support near the 200-day Exponential Moving Average (EMA) around 1.0900. The near-term outlook of the pair remains uncertain as the 20- and 50-day EMAs are on course to deliver a bear cross near 1.1020.
The shared currency pair weakened after delivering a breakdown of a Double Top chart pattern formation on a daily timeframe. The above-mentioned chart pattern was triggered after the shared currency pair broke below the September 11 low of 1.1000.
The 14-day Relative Strength Index (RSI) settles inside the bearish range of 20.00-40.00, suggesting more weakness ahead.
Looking down, the pair is expected to find support near the round-level support of 1.0800 if it decisively breaks below the 200-day EMA around 1.0900. On the upside, the September 11 low of 1.1000 and the 20-day EMA at 1.1090 will be major resistance zones.
Euro FAQs
The Euro is the currency for the 19 European Union countries that belong to the Eurozone. It is the second most heavily traded currency in the world behind the US Dollar. In 2022, it accounted for 31% of all foreign exchange transactions, with an average daily turnover of over $2.2 trillion a day. EUR/USD is the most heavily traded currency pair in the world, accounting for an estimated 30% off all transactions, followed by EUR/JPY (4%), EUR/GBP (3%) and EUR/AUD (2%).
The European Central Bank (ECB) in Frankfurt, Germany, is the reserve bank for the Eurozone. The ECB sets interest rates and manages monetary policy. The ECB’s primary mandate is to maintain price stability, which means either controlling inflation or stimulating growth. Its primary tool is the raising or lowering of interest rates. Relatively high interest rates – or the expectation of higher rates – will usually benefit the Euro and vice versa. The ECB Governing Council makes monetary policy decisions at meetings held eight times a year. Decisions are made by heads of the Eurozone national banks and six permanent members, including the President of the ECB, Christine Lagarde.
Eurozone inflation data, measured by the Harmonized Index of Consumer Prices (HICP), is an important econometric for the Euro. If inflation rises more than expected, especially if above the ECB’s 2% target, it obliges the ECB to raise interest rates to bring it back under control. Relatively high interest rates compared to its counterparts will usually benefit the Euro, as it makes the region more attractive as a place for global investors to park their money.
Data releases gauge the health of the economy and can impact on the Euro. Indicators such as GDP, Manufacturing and Services PMIs, employment, and consumer sentiment surveys can all influence the direction of the single currency. A strong economy is good for the Euro. Not only does it attract more foreign investment but it may encourage the ECB to put up interest rates, which will directly strengthen the Euro. Otherwise, if economic data is weak, the Euro is likely to fall. Economic data for the four largest economies in the euro area (Germany, France, Italy and Spain) are especially significant, as they account for 75% of the Eurozone’s economy.
Another significant data release for the Euro is the Trade Balance. This indicator measures the difference between what a country earns from its exports and what it spends on imports over a given period. If a country produces highly sought after exports then its currency will gain in value purely from the extra demand created from foreign buyers seeking to purchase these goods. Therefore, a positive net Trade Balance strengthens a currency and vice versa for a negative balance.
Instead of weakening further, the Euro (EUR) is more likely to trade in a range between 1.0910 and 1.0960. In the longer run, outlook for EUR remains negative; slowing momentum suggests that the probability of breaking the 1.0860/1.0885 support zone is not high, UOB Group’s FX analysts Quek Ser Leang and Lee Sue Ann note.
Low probability of breaking the 1.0860/1.0885 support zone
24-HOUR VIEW: “After EUR edged lower to 1.0936 two days, we indicated yesterday that ‘there has been a slight increase in momentum, and EUR is likely to continue to edge lower.’ We added, ‘it remains to be seen if it has enough momentum to break the major support at 1.0900.’ In NY trade, EUR dropped briefly to 1.0898, rebounding to close largely unchanged at 1.0935 (-0.04%). The rebound in oversold conditions and slowing momentum suggests that instead of weakening further, EUR is more likely to trade in a range, probably between 1.0910 and 1.0960.”
1-3 WEEKS VIEW: “We turned negative in EUR last Wednesday (02 Oct), when EUR was trading at 1.1065 (see annotations in the chart below). As we tracked the decline, in our update from yesterday (10 Oct, spot at 1.0940), we indicated that ‘the outlook for EUR remains negative, and the next level to watch is 1.0900.’ In NY trade, EUR dropped to 1.0898, rebounding to close largely unchanged. While the outlook remains negative, downward momentum appears to be slowing, and the probability of EUR breaking the significant support zone between 1.0860 and 1.0885 is not high for now. However, only a breach of 1.0995 (‘strong resistance’ level was at 1.1010 yesterday) would mean that the weakness in EUR has stabilised.”
Silver prices (XAG/USD) fell on Friday, according to FXStreet data. Silver trades at $31.12 per troy ounce, down 0.15% from the $31.16 it cost on Thursday.
Silver prices have increased by 30.76% since the beginning of the year.
| Unit measure | Silver Price Today in USD |
|---|---|
| Troy Ounce | 31.12 |
| 1 Gram | 1.00 |
The Gold/Silver ratio, which shows the number of ounces of Silver needed to equal the value of one ounce of Gold, stood at 84.75 on Friday, up from 84.40 on Thursday.
Silver FAQs
Silver is a precious metal highly traded among investors. It has been historically used as a store of value and a medium of exchange. Although less popular than Gold, traders may turn to Silver to diversify their investment portfolio, for its intrinsic value or as a potential hedge during high-inflation periods. Investors can buy physical Silver, in coins or in bars, or trade it through vehicles such as Exchange Traded Funds, which track its price on international markets.
Silver prices can move due to a wide range of factors. Geopolitical instability or fears of a deep recession can make Silver price escalate due to its safe-haven status, although to a lesser extent than Gold's. As a yieldless asset, Silver tends to rise with lower interest rates. Its moves also depend on how the US Dollar (USD) behaves as the asset is priced in dollars (XAG/USD). A strong Dollar tends to keep the price of Silver at bay, whereas a weaker Dollar is likely to propel prices up. Other factors such as investment demand, mining supply – Silver is much more abundant than Gold – and recycling rates can also affect prices.
Silver is widely used in industry, particularly in sectors such as electronics or solar energy, as it has one of the highest electric conductivity of all metals – more than Copper and Gold. A surge in demand can increase prices, while a decline tends to lower them. Dynamics in the US, Chinese and Indian economies can also contribute to price swings: for the US and particularly China, their big industrial sectors use Silver in various processes; in India, consumers’ demand for the precious metal for jewellery also plays a key role in setting prices.
Silver prices tend to follow Gold's moves. When Gold prices rise, Silver typically follows suit, as their status as safe-haven assets is similar. The Gold/Silver ratio, which shows the number of ounces of Silver needed to equal the value of one ounce of Gold, may help to determine the relative valuation between both metals. Some investors may consider a high ratio as an indicator that Silver is undervalued, or Gold is overvalued. On the contrary, a low ratio might suggest that Gold is undervalued relative to Silver.
(An automation tool was used in creating this post.)
The key takeaway from the US Federal Reserve’s (Fed) minutes of its 17/18 Sep 2024 Federal Open Market Committee (FOMC) meeting was that, while all participants agreed that it was appropriate to ease the stance of monetary policy in September, but not everyone was on board with the decision of a 50-bps rate cut, OCBC FX analysts Frances Cheung and Christopher Wong note.
FOMC minutes key takeaways
“The main reason for the start of easing was ‘greater confidence that inflation was moving sustainably towards 2 percent’, while the overall assessment on the labour market was ‘solid’ although many participants saw the evaluation of the labour market as challenging.”
“‘Some participants observed that they would have preferred a 25 basis point’ and ‘a few others indicated that they could have supported such a decision’ – this reflected more support for a 25bp cut as compared to the vote with one dissident only.”
“The 50bp cut was partly a catch-up as ‘there had been a plausible case for a 25 basis point rate cut at the previous [July] meeting’. Our base-case remains for a 25bp cut each at the November and December FOMC meeting.”
At next week's ECB meeting on 17 October we expect the ECB to deliver yet another rate cut of 25bp, bringing the deposit rate to 3.25%. Weaker-than-anticipated growth indicators, as well as a decline in inflation, support the case for another rate cut from the ECB, Danske Bank’s analysts note.
ECB to stick to the 'meeting by meeting' and 'data dependent' approach
“Since the US labour market report last week, markets have significantly repriced expectations for policy easing across central banks, not least the ECB. Markets are now discounting an additional 47bp of rate cuts this year, consistent with a rate cut next week and again in December, and 97bp of rate cuts next year, consistent with our baseline of quarterly rate cuts of 25bp each.”
“We expect very limited forward guidance at the upcoming meeting, meaning the ECB should stick to the 'meeting by meeting' and 'data dependent' approach that it has been following in the past few quarters.”
“Ahead of the December meeting, where it will give new staff projections, including the 2027 projection, we are set to see very important data points from the euro area (2x PMIs, 2x inflation, wage data, labour data)”.
- Silver oscillates in a range on the last trading day of the week.
- A mixed technical setup warrants caution for aggressive traders.
- Acceptance above $32.00 will set the stage for additional gains.
Silver (XAG/USD) struggles to capitalize on its modest intraday uptick and trades around the $31.15 region during the first half of the European session on Friday, nearly unchanged for the day.
Looking at the broader picture, this week's bounce from the vicinity of the $30.00 psychological mark and a subsequent strength back above the $31.00 mark favors bullish traders. That said, the recent repeated failures to capitalize on momentum beyond the $32.00 mark constitute the formation of a bearish multiple-tops pattern. This, along with mixed oscillators on the daily chart, warrants caution before positioning for any meaningful appreciating move for the XAG/USD.
From current levels, the $31.55 region is likely to act as an immediate hurdle ahead of the $31.75-$31.80 area and the $32.00 mark. This is followed by resistance near the 32.25 supply zone, which if cleared decisively has the potential to lift the XAG/USD back towards the multi-year peak, just ahead of the $33.00 round figure touched last Friday. Some follow-through buying should pave the way for a move towards the December 2012 swing high, around the $33.85 region.
On the flip side, weakness below the $31.00 round figure now seems to find some support near the $30.70-$30.65 region ahead of the $30.35-$30.25 area and the $30.00 mark. The next relevant support is pegged near the $29.80-$29.70 confluence – comprising the 100-day Simple Moving Average (SMA) and the 50-day SMA. This should act as a key pivotal point, which if broken will set the stage for an extension of the recent decline from the highest level since December 2012.
The XAG/USD might then accelerate the downfall towards the $29.00 mark before eventually dropping to test the $28.60-$28.50 zone. The descending trend could extend further towards the $28.10-$28.00 region en route to the September monthly swing low, around the $27.70 area.
Silver daily chart
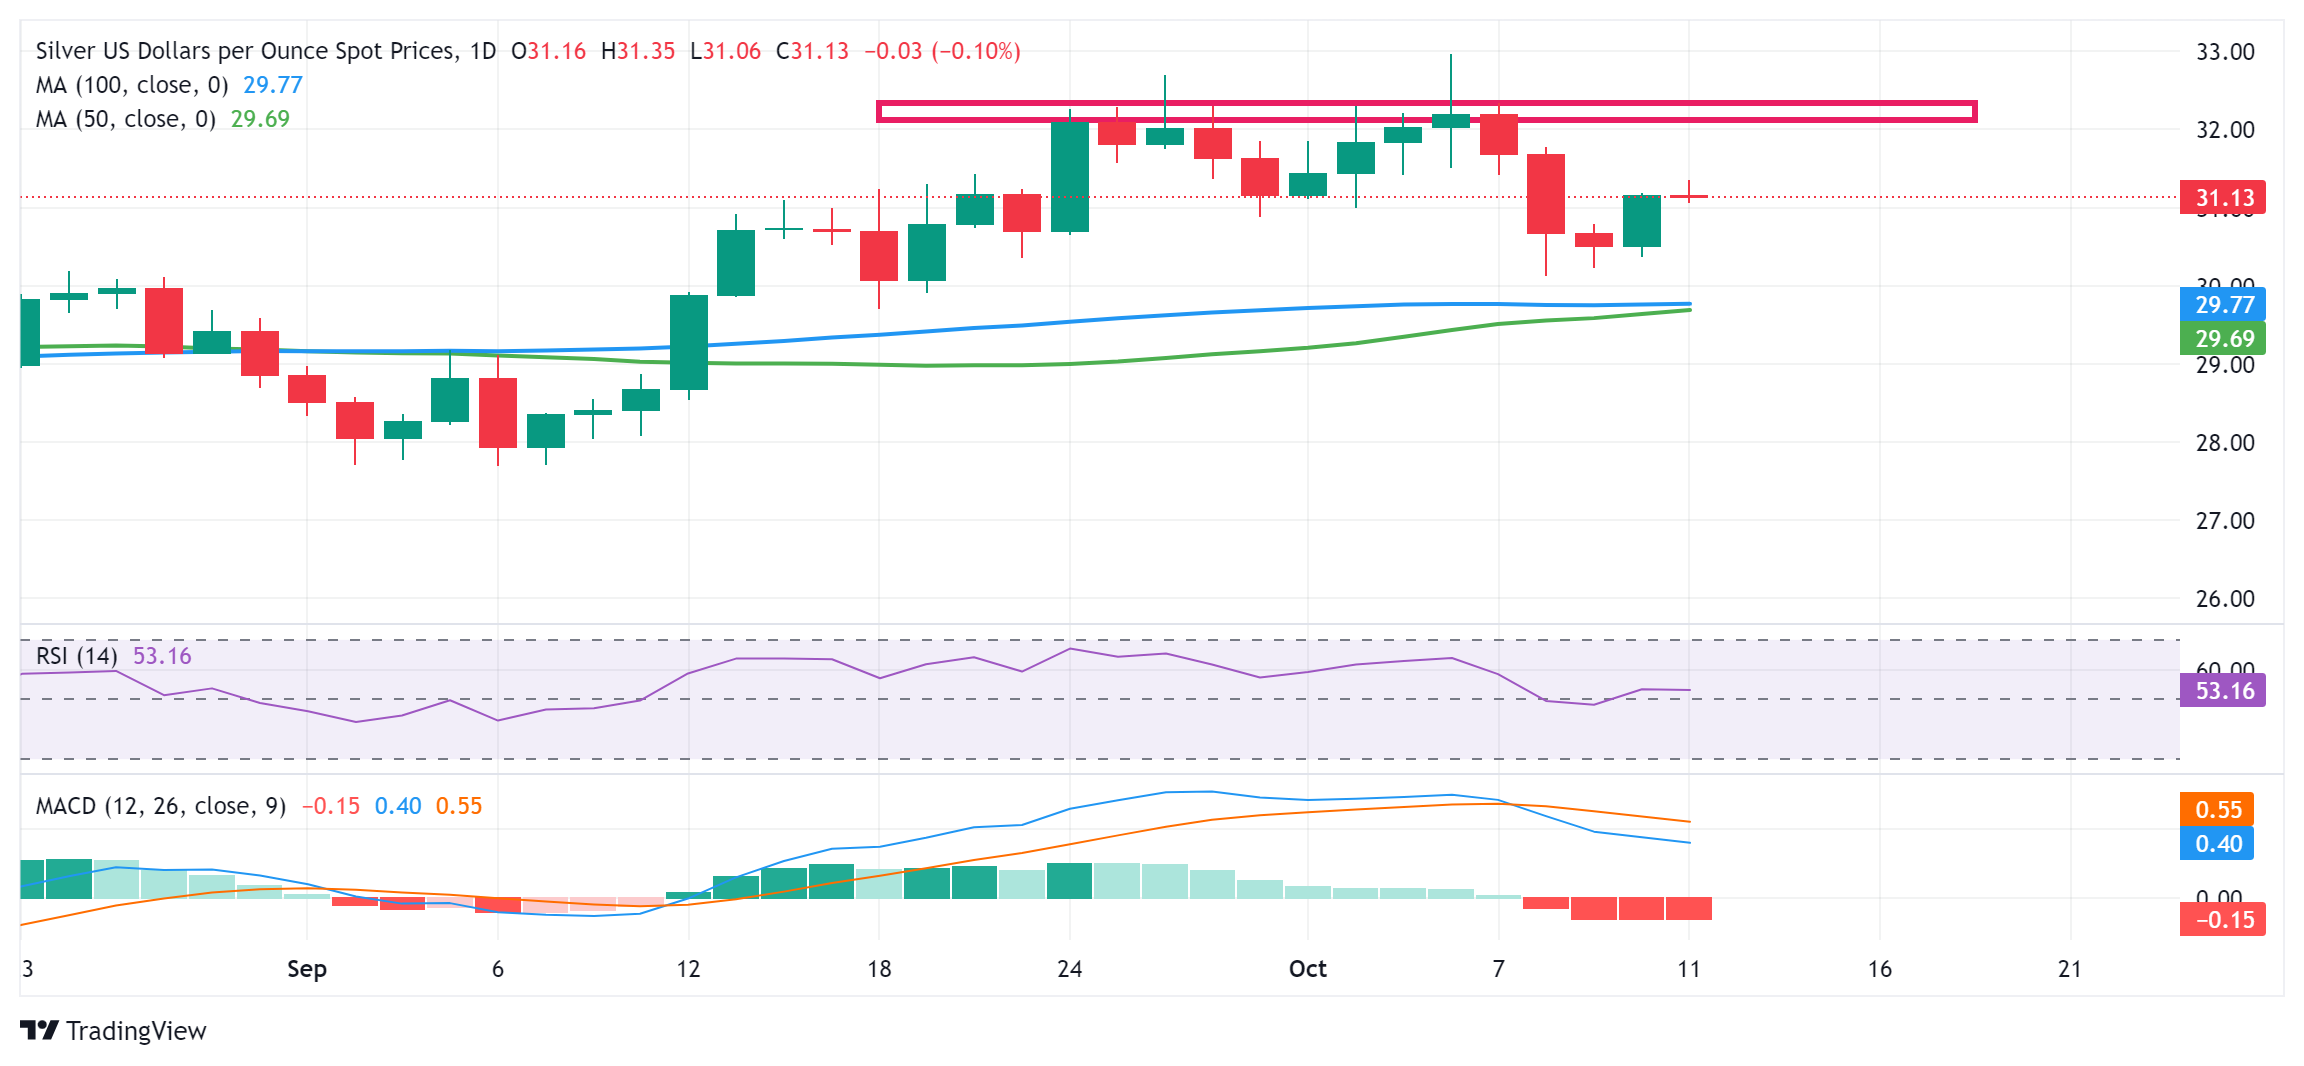
- The Mexican Peso recovers after the release of fairly benign Banxico minutes improved the outlook.
- President Sheinbaum sends an envoy to meet the “kings” of US finance: Dimon and Fink.
- USD/MXN peaks and pulls back after its mini-rally runs out of steam.
The Mexican Peso (MXN) edges higher in its most-traded pairs on Friday, carrying momentum over from its recovery on the previous day, when it found a floor and rose following the release of the Bank of Mexico (Banxico) meeting minutes.
In their discussions, Banxico officials painted an overall benign picture of the Mexican economy, with inflation “improving”, a “stable” labor market, and high demand for exports but also a loss of “dynamism” and “productive activity” in the domestic economy.
The Peso may be garnering further support as political risks ease following meetings with the CEOs of US finance giants JP Morgan Chase and Blackrock, and pivot back to the US elections.
Mexican Peso rises after release of Banxico Minutes
The Mexican Peso appreciated following the release of the Banxico September meeting Minutes on Thursday, at which the bank decided by a majority vote to lower the target for the Overnight Interbank Interest Rate by 25 basis points (bps) to 10.50%. There was one dissenter, Jonathan Ernest Heath Constable. Below are ten key takeaways from the Minutes:
- Most noted the inflation outlook in Mexico has been improving.
- Forecasts for headline and core were adjusted slightly downward for some quarters in the near term.
- In the last reading, food commodity inflation was 3.95%, while non-food was 1.69%, in both cases clearly below their respective historical averages.
- All agreed services inflation continues to show persistence.
- The balance of risks with respect to the expected trajectory of inflation over the forecast horizon remains skewed to the upside.
- All members indicated that the labor market remains solid.
- The yield curve of government securities showed downward movements, especially in the short maturities.
- Most noted a contraction in consumption of imported goods, whilst the value of manufacturing exports – both automotive and non-automotive – recorded some reactivation during July.
- All agreed that domestic productive activity is going through a period of weakness, and most agreed that there has been a visible loss of dynamism since the last quarter of 2023.
- The information available for the beginning of the third quarter shows some rebound regarding domestic demand.
Sheinbaum administration courts US investors
Despite investor concerns regarding the political outlook for Mexico after the Morena-led coalition victory in June, there appear to be signs the new Sheinbaum administration is attempting to build bridges with some of the big players in global finance.
On Thursday, the Mexican Secretary of Finance, Rogelio Ramírez de la O, separately met with the CEO of Blackrock, Larry Fink, and JP Morgan Chase’s CEO, Jamie Dimon, reports El Financiero. Although no details of the meetings have been made public, the move could be interpreted as part of a charm offensive by the Mexican government to win back the confidence of investors.
“Before the election turmoil, Dimon said last November that he saw a “huge” opportunity in Mexico, amid a boom in factories moving to the country to be closer to the United States, as part of a business trend known as nearshoring,” said El Financiero.
Perhaps of greater concern to investors now is the outcome of the US presidential election in November. JP Morgan strategists downgraded their bullish stance on the Mexican Peso on Thursday due to the risks of a “highly unpredictable” US presidential election result.
Technical Analysis: USD/MXN retreats after peaking
USD/MXN bottomed out at the base of its long-term rising channel and recovered on October 4. However, its nascent uptrend has reversed after peaking at 19.62 on Thursday. Prices are now pulling back down towards the base of the channel and the 50-day Simple Moving Average (SMA) again.
USD/MXN Daily Chart
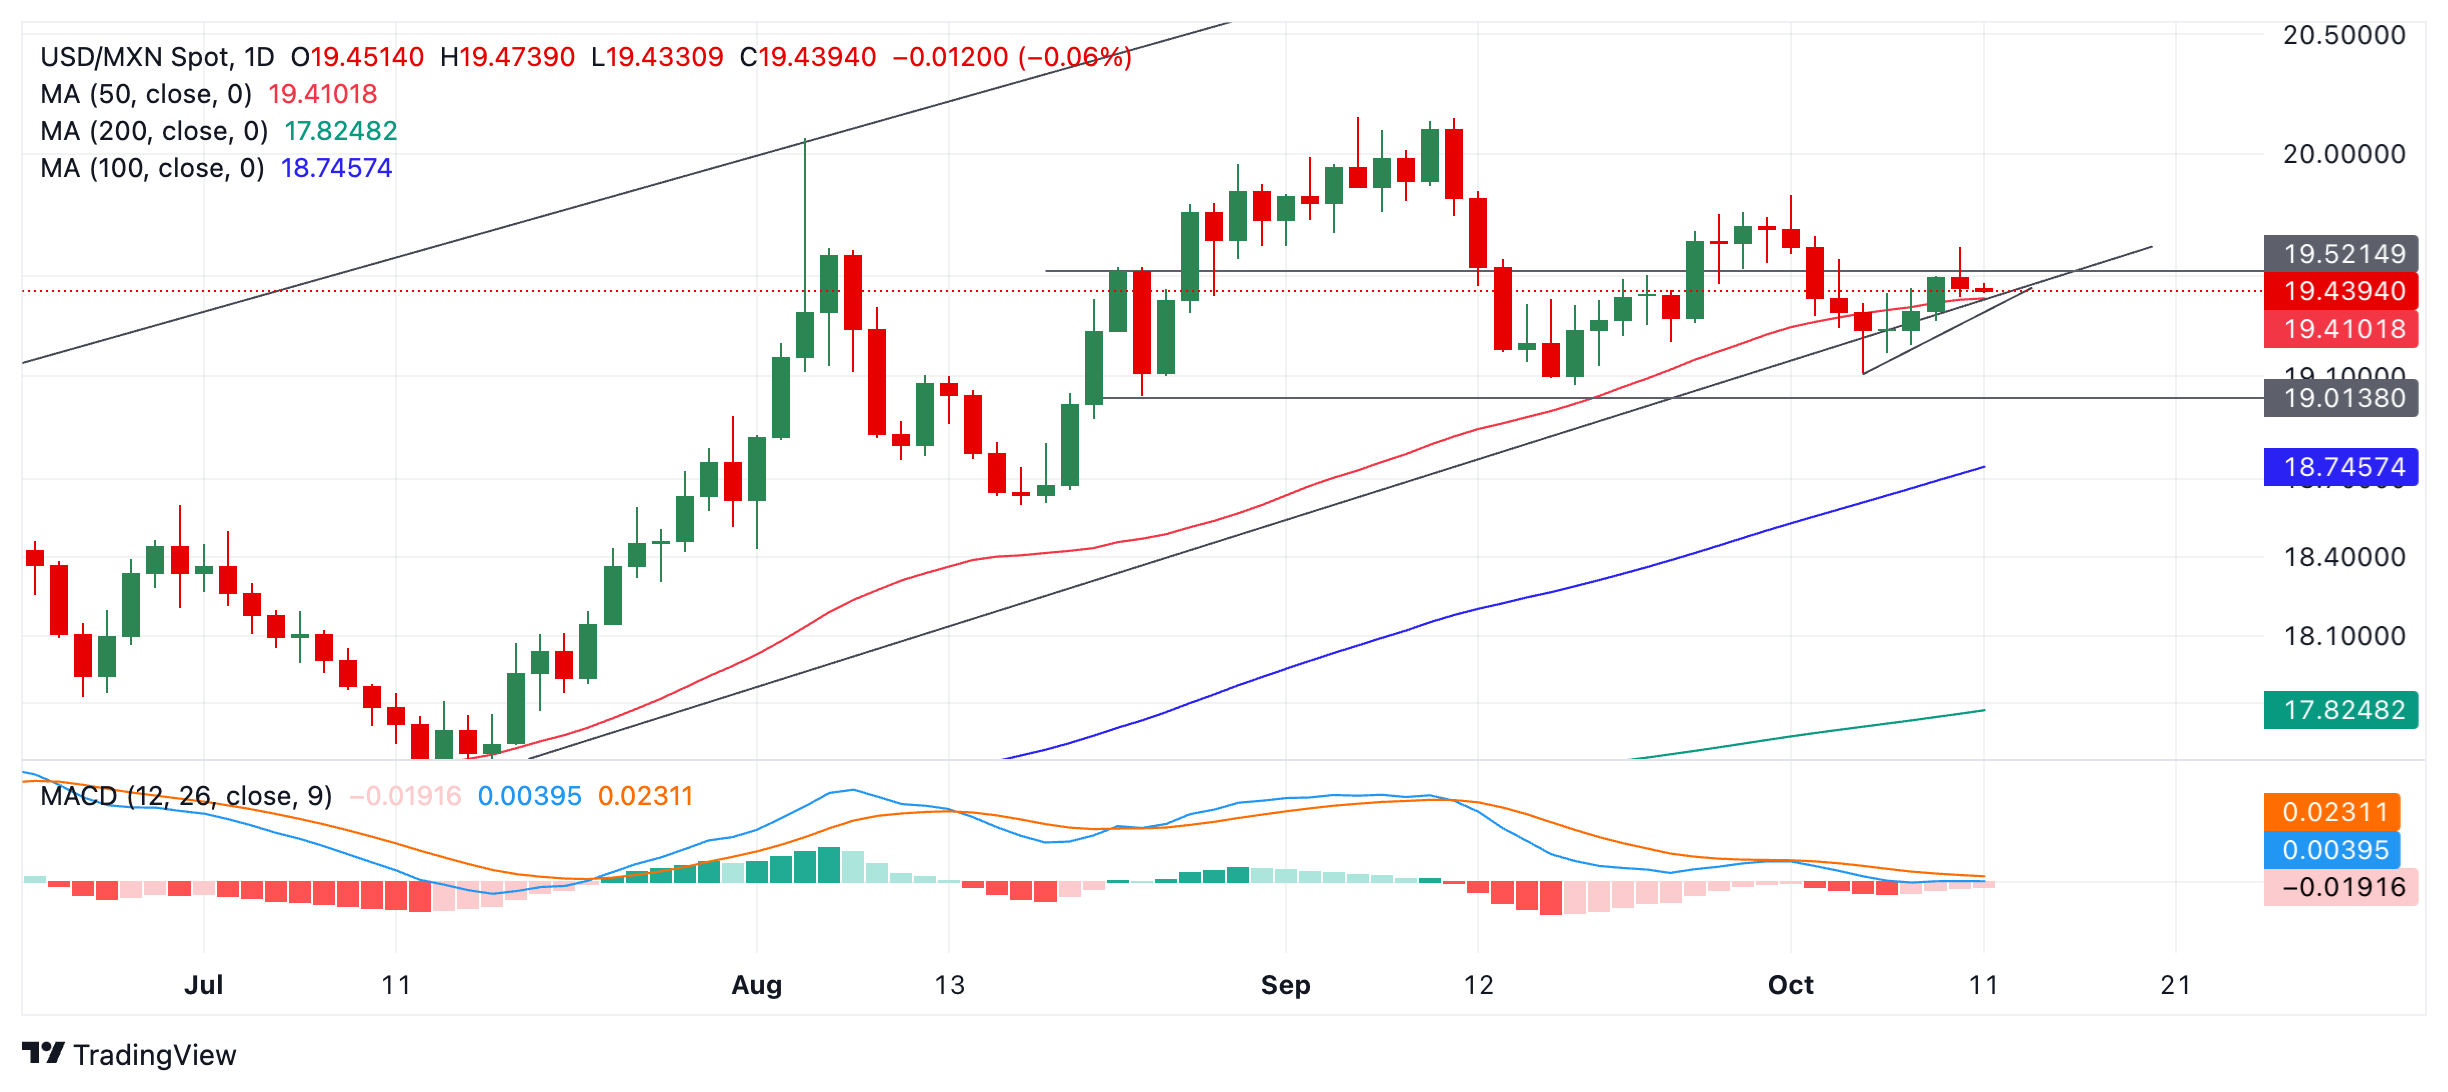
That said, USD/MXN’s new short-term uptrend is still probably intact, and prices could still recover and continue rising within the ascending channel. In addition, the medium and longer-term trends remain bullish, and given the technical analysis principle that “the trend is your friend,” this favors an eventual continuation higher when the longer bullish cycles kick in.
A break above the 19.62 high would see USD/MXN resume its uptrend and continue up to the next target at 19.83 (October 1 high).
A break below 19.31 (October 9 low), however, would be a bearish sign indicating the possibility the short-term uptrend had ended and either a sideways or more bearish trend was evolving instead.
Economic Indicator
Central Bank Interest Rate
The Bank of Mexico announces a key interest rate which affects the whole range of interest rates set by commercial banks, building societies and other institutions for their own savers and borrowers. Generally speaking, if the central bank is hawkish about the inflationary outlook of the economy and rises the interest rates it is positive, or bullish, for the Mexican Peso.
Read more.Last release: Thu Sep 26, 2024 19:00
Frequency: Irregular
Actual: 10.5%
Consensus: 10.5%
Previous: 10.75%
Source: Banxico
Here is what you need to know on Friday, October 11:
Following Thursday's volatile action, markets seems to have stabilized to begin the last trading day of the week. The US economic calendar will feature Producer Price Index (PPI) data for September and the University of Michigan's Consumer Sentiment Survey for October. In the early American session, Statistics Canada will publish the labor market data for September.
US Dollar PRICE This week
The table below shows the percentage change of US Dollar (USD) against listed major currencies this week. US Dollar was the strongest against the Canadian Dollar.
| USD | EUR | GBP | JPY | CAD | AUD | NZD | CHF | |
|---|---|---|---|---|---|---|---|---|
| USD | 0.25% | 0.33% | 0.04% | 1.35% | 0.74% | 0.98% | -0.21% | |
| EUR | -0.25% | 0.14% | -0.16% | 1.12% | 0.46% | 0.71% | -0.51% | |
| GBP | -0.33% | -0.14% | -0.35% | 0.99% | 0.32% | 0.60% | -0.54% | |
| JPY | -0.04% | 0.16% | 0.35% | 1.32% | 0.70% | 0.90% | -0.23% | |
| CAD | -1.35% | -1.12% | -0.99% | -1.32% | -0.57% | -0.38% | -1.56% | |
| AUD | -0.74% | -0.46% | -0.32% | -0.70% | 0.57% | 0.29% | -0.91% | |
| NZD | -0.98% | -0.71% | -0.60% | -0.90% | 0.38% | -0.29% | -1.17% | |
| CHF | 0.21% | 0.51% | 0.54% | 0.23% | 1.56% | 0.91% | 1.17% |
The heat map shows percentage changes of major currencies against each other. The base currency is picked from the left column, while the quote currency is picked from the top row. For example, if you pick the US Dollar from the left column and move along the horizontal line to the Japanese Yen, the percentage change displayed in the box will represent USD (base)/JPY (quote).
Inflation in the US, as measured by the change in the Consumer Price Index (CPI), declined to 2.4% on a yearly basis in September from 2.5% in August, the US Bureau of Labor Statistics (BLS) reported on Thursday. Other details of the report showed that the core CPI, which excludes volatile food and energy prices, rose 3.3% on a yearly basis, coming in above the August reading and the market forecast of 3.2%. The monthly core CPI was up 0.3% in September. The US Dollar (USD) failed to benefit from these readings as the weekly Initial Jobless Claims came in at 258,000 in the week ending October 5, up sharply from 225,000 in the previous week. After reaching its highest level in nearly a month at around 103.20 on Thursday, the USD Index closed the day flat and went into a consolidation phase below 103.00 early Friday.
The data published by the UK's Office for National Statistics showed on Friday that the Gross Domestic Product expanded by 0.2% on a monthly basis in August, matching the market estimate. In the same period, Industrial Production and Manufacturing Production increased by 0.5% and 1.1%, respectively. Although GBP/USD edged slightly higher on the upbeat data, it remains well below 1.3100 in the European session.
EUR/USD closed flat on Thursday as the USD lost its strength in the second half of the day. The pair struggles to gather recovery momentum and trades in a narrow channel slightly below 1.0950 in the European morning. Germany's Destatis reaffirmed on Friday that the annual CPI rose 1.6% on a yearly basis in September, matching the initial estimate.
USD/CAD extended its uptrend on Thursday and closed the seventh consecutive day in positive territory. Ahead of the Canadian jobs data, the pair trades marginally higher on the day near 1.3750.
USD/JPY closed in the red on Thursday after reversing from the multi-month high it set above 149.60. The pair stays relatively quiet and moves up and down in a tight band below 149.00.
Gold gathered recovery momentum and snapped a six-day losing streak on Thursday. XAU/USD continues to edge higher toward $2,650 on Friday.
Inflation FAQs
Inflation measures the rise in the price of a representative basket of goods and services. Headline inflation is usually expressed as a percentage change on a month-on-month (MoM) and year-on-year (YoY) basis. Core inflation excludes more volatile elements such as food and fuel which can fluctuate because of geopolitical and seasonal factors. Core inflation is the figure economists focus on and is the level targeted by central banks, which are mandated to keep inflation at a manageable level, usually around 2%.
The Consumer Price Index (CPI) measures the change in prices of a basket of goods and services over a period of time. It is usually expressed as a percentage change on a month-on-month (MoM) and year-on-year (YoY) basis. Core CPI is the figure targeted by central banks as it excludes volatile food and fuel inputs. When Core CPI rises above 2% it usually results in higher interest rates and vice versa when it falls below 2%. Since higher interest rates are positive for a currency, higher inflation usually results in a stronger currency. The opposite is true when inflation falls.
Although it may seem counter-intuitive, high inflation in a country pushes up the value of its currency and vice versa for lower inflation. This is because the central bank will normally raise interest rates to combat the higher inflation, which attract more global capital inflows from investors looking for a lucrative place to park their money.
Formerly, Gold was the asset investors turned to in times of high inflation because it preserved its value, and whilst investors will often still buy Gold for its safe-haven properties in times of extreme market turmoil, this is not the case most of the time. This is because when inflation is high, central banks will put up interest rates to combat it. Higher interest rates are negative for Gold because they increase the opportunity-cost of holding Gold vis-a-vis an interest-bearing asset or placing the money in a cash deposit account. On the flipside, lower inflation tends to be positive for Gold as it brings interest rates down, making the bright metal a more viable investment alternative.
- The Pound Sterling slightly recovers against its major peers after the UK ONS reported robust factory data and expected GDP growth in August.
- Traders expect the BoE to cut interest rates in at least one of its two policy meetings remaining this year.
- Investors await the US PPI data for fresh cues on the Fed’s interest rate outlook.
The Pound Sterling (GBP) moves lower against its major peers in Friday’s London session after the release of the UK data. The initial reaction from the British currency was positive, however, it failed to capitalize on the same despite the data came in better than expected, and the Gross Domestic Product (GDP) grew expectedly in August.
The Office for National Statistics (ONS) reported that the economy grew by 0.2%, as expected, after remaining flat in July. Month-on-month Manufacturing and Industrial Production rose at a robust pace of 1.1% and 0.5%, respectively, while economists expected them to grow by 0.2%.
Annually, Manufacturing and Industrial Production contracted by 0.3% and 1.6%, respectively. However, the pace at which both economic data declined was slower than in July.
Upbeat monthly factory data and an expected GDP growth have improved the UK economic outlook. This would allow the Bank of England (BoE) policymakers to follow a shallow policy-easing cycle. Financial market participants expect the BoE to cut interest rates only once in the remaining two policy meetings this year.
Going forward, the next trigger for the Pound Sterling will be the UK Employment data for the three months ending August and the Consumer Price Index (CPI) report for September, which will be published on Tuesday and Wednesday, respectively. The economic data will significantly influence market expectations for BoE’s likely interest rate action in November.
Daily digest market movers: Pound Sterling remains weak against US Dollar ahead of US PPI
- The Pound Sterling edges lower against the US Dollar (USD) on Friday. The GBP/USD pair trades slightly above the monthly low of 1.3010, but the outlook is cautious as the Greenback remains firm. The US Dollar Index (DXY), which tracks the Greenback’s value against six major currencies, holds onto gains near 103.00.
- The US Dollar clings to gains as hotter-than-expected United States (US) Consumer Price Index (CPI) data for September kept the scope of the Federal Reserve (Fed) to reduce interest rates by 50 basis points (bps) again in the November meeting off the table.
- Thursday’s CPI report showed that the annual core inflation – which excludes volatile food and energy prices – accelerated to 3.3%. The headline inflation rose by 2.4%, faster than estimates of 2.3% but slower than the August print of 2.5%.
- However, traders are confident that the Fed will cut interest rates next month but at a gradual pace of 25 bps, according to the CME FedWatch tool. Also, a majority of Fed policymakers see more rate cuts as appropriate.
- On Thursday, New York Fed Bank President John Williams said at an event at Binghamton University, "Based on my current forecast for the economy, I expect that it will be appropriate to continue the process of moving the stance of monetary policy to a more neutral setting over time."
- On the economic data front, investors will focus on the US Producer Price Index (PPI) data for September, which will be published at 12:30 GMT. The annual headline PPI is estimated to have decelerated to 1.6% from 1.7% in August. On the contrary, the core PPI – which strips off volatile food and energy prices – is expected to have accelerated at a faster pace to 2.7% from 2.4% in August.
Technical Analysis: Pound Sterling stays below 20- and 50-day EMAs
The Pound Sterling remains under pressure near the monthly low of 1.3010 against the US Dollar. The outlook of the GBP/USD pair is vulnerable as it has stabilized below the upward-sloping trendline plotted from the 28 December 2023 high of 1.2827.
The near-term trend of the Cable has become bearish as it trades below the 20- and 50-day Exponential Moving Averages (EMAs), which trade around 1.3167 and 1.3106, respectively.
The 14-day Relative Strength Index (RSI) declines to near 40.00. More downside would appear if the momentum oscillator falls below the above-mentioned level.
Looking up, the round-level resistance of 1.3100 and the 20-day EMA near 1.3170 will be a major barricade for Pound Sterling bulls. On the downside, the Pound Sterling would find support near the psychological figure of 1.3000.
Pound Sterling FAQs
The Pound Sterling (GBP) is the oldest currency in the world (886 AD) and the official currency of the United Kingdom. It is the fourth most traded unit for foreign exchange (FX) in the world, accounting for 12% of all transactions, averaging $630 billion a day, according to 2022 data. Its key trading pairs are GBP/USD, also known as ‘Cable’, which accounts for 11% of FX, GBP/JPY, or the ‘Dragon’ as it is known by traders (3%), and EUR/GBP (2%). The Pound Sterling is issued by the Bank of England (BoE).
The single most important factor influencing the value of the Pound Sterling is monetary policy decided by the Bank of England. The BoE bases its decisions on whether it has achieved its primary goal of “price stability” – a steady inflation rate of around 2%. Its primary tool for achieving this is the adjustment of interest rates. When inflation is too high, the BoE will try to rein it in by raising interest rates, making it more expensive for people and businesses to access credit. This is generally positive for GBP, as higher interest rates make the UK a more attractive place for global investors to park their money. When inflation falls too low it is a sign economic growth is slowing. In this scenario, the BoE will consider lowering interest rates to cheapen credit so businesses will borrow more to invest in growth-generating projects.
Data releases gauge the health of the economy and can impact the value of the Pound Sterling. Indicators such as GDP, Manufacturing and Services PMIs, and employment can all influence the direction of the GBP. A strong economy is good for Sterling. Not only does it attract more foreign investment but it may encourage the BoE to put up interest rates, which will directly strengthen GBP. Otherwise, if economic data is weak, the Pound Sterling is likely to fall.
Another significant data release for the Pound Sterling is the Trade Balance. This indicator measures the difference between what a country earns from its exports and what it spends on imports over a given period. If a country produces highly sought-after exports, its currency will benefit purely from the extra demand created from foreign buyers seeking to purchase these goods. Therefore, a positive net Trade Balance strengthens a currency and vice versa for a negative balance.
- EUR/GBP gains traction to near 0.8380 in Friday’s early Asian session, up 0.11% on the day.
- The German HICP inflation remained steady at 1.8% YoY in September, as expected.
- The UK GDP expanded 0.2% MoM in August, matched estimates.
The EUR/GBP cross trades on a stronger note around 0.8380 on Friday during the early European trading hours. The Euro (EUR) remains firm after the release of German inflation data and UK growth numbers. Traders will shift their attention to the UK employment data next week.
Data released by Destatis on Friday showed that the German Harmonized Index of Consumer Prices (HICP) rose 1.8% YoY in September, compared to the previous reading and the expectations of 1.8%. The German inflation data continues to support the Euro, while investors were digesting the ECB's cautious tone on economic growth.
The meeting account published on Thursday showed that the ECB remains confident that inflation is on track to hit the 2% target. The ECB policymakers see the cut rates by 25 basis points (bps) in September as appropriate due to disinflation and a fragile recovery.
The ECB signaled that any further policy easing would be gradual and data-dependent. The ECB is anticipated to cut the deposit rate to 3.5% next week. More than 90% of economists polled by Reuters expect a reduction next week, with a similar majority betting on a follow-up move in December.
On the UK’s front, the Office for National Statistics (ONS) showed on Friday that the UK economy grew by 0.2% over the month in August. The reading matched the market consensus of 0.2% growth in the reported period.
Meanwhile, further delay on rate cuts by the Bank of England (BoE) might cap the downside for the Pound Sterling (GBP) in the near term. The BoE chief economist Huw Pill warned against cutting the base rate “too far or too fast” last week. Investors expect the UK central bank to cut the rate by a total of 0.5% to 4.5% in two of its last three meetings before the end of the year.
Pound Sterling FAQs
The Pound Sterling (GBP) is the oldest currency in the world (886 AD) and the official currency of the United Kingdom. It is the fourth most traded unit for foreign exchange (FX) in the world, accounting for 12% of all transactions, averaging $630 billion a day, according to 2022 data. Its key trading pairs are GBP/USD, also known as ‘Cable’, which accounts for 11% of FX, GBP/JPY, or the ‘Dragon’ as it is known by traders (3%), and EUR/GBP (2%). The Pound Sterling is issued by the Bank of England (BoE).
The single most important factor influencing the value of the Pound Sterling is monetary policy decided by the Bank of England. The BoE bases its decisions on whether it has achieved its primary goal of “price stability” – a steady inflation rate of around 2%. Its primary tool for achieving this is the adjustment of interest rates. When inflation is too high, the BoE will try to rein it in by raising interest rates, making it more expensive for people and businesses to access credit. This is generally positive for GBP, as higher interest rates make the UK a more attractive place for global investors to park their money. When inflation falls too low it is a sign economic growth is slowing. In this scenario, the BoE will consider lowering interest rates to cheapen credit so businesses will borrow more to invest in growth-generating projects.
Data releases gauge the health of the economy and can impact the value of the Pound Sterling. Indicators such as GDP, Manufacturing and Services PMIs, and employment can all influence the direction of the GBP. A strong economy is good for Sterling. Not only does it attract more foreign investment but it may encourage the BoE to put up interest rates, which will directly strengthen GBP. Otherwise, if economic data is weak, the Pound Sterling is likely to fall.
Another significant data release for the Pound Sterling is the Trade Balance. This indicator measures the difference between what a country earns from its exports and what it spends on imports over a given period. If a country produces highly sought-after exports, its currency will benefit purely from the extra demand created from foreign buyers seeking to purchase these goods. Therefore, a positive net Trade Balance strengthens a currency and vice versa for a negative balance.
- UK GDP expands 0.2% MoM in August, matches estimates
- GBP/USD battles 1.3050 after the UK data.
The UK economy expanded by 0.2% over the month in August, having stagnated for the second consecutive month in July, the latest data published by the Office for National Statistics (ONS) showed on Friday. The reading matched the market consensus of 0.2% growth in the reported period.
Meanwhile, the Index of services (August) arrived at 0.1% 3M/3M vs. July’s 0.6% print and 0.3% expected.
Other data from the UK showed that the monthly Industrial Production and Manufacturing Production rose 0.5% and 1.1%, respectively, in August. Both readings bettered market expectations.
Separately, the UK Goods Trade Balance came in at GBP-15.06 billion MoM in August vs. GBP-19.30 billion expected and GBP-18.871 billion previous.
Market reaction to the UK data
The UK economic data have little to no impact on the Pound Sterling. At the press time, GBP/USD is trading 0.07% lower on the day, keeping its range near 1.3050.
British Pound PRICE Today
The table below shows the percentage change of British Pound (GBP) against listed major currencies today. British Pound was the weakest against the New Zealand Dollar.
| USD | EUR | GBP | JPY | CAD | AUD | NZD | CHF | |
|---|---|---|---|---|---|---|---|---|
| USD | -0.02% | 0.10% | 0.15% | 0.13% | 0.04% | -0.01% | 0.14% | |
| EUR | 0.02% | 0.06% | 0.11% | 0.09% | 0.04% | -0.04% | 0.11% | |
| GBP | -0.10% | -0.06% | 0.04% | 0.03% | -0.02% | -0.11% | 0.04% | |
| JPY | -0.15% | -0.11% | -0.04% | -0.02% | -0.10% | -0.17% | -0.10% | |
| CAD | -0.13% | -0.09% | -0.03% | 0.02% | -0.07% | -0.14% | 0.02% | |
| AUD | -0.04% | -0.04% | 0.02% | 0.10% | 0.07% | -0.10% | 0.04% | |
| NZD | 0.01% | 0.04% | 0.11% | 0.17% | 0.14% | 0.10% | 0.16% | |
| CHF | -0.14% | -0.11% | -0.04% | 0.10% | -0.02% | -0.04% | -0.16% |
The heat map shows percentage changes of major currencies against each other. The base currency is picked from the left column, while the quote currency is picked from the top row. For example, if you pick the British Pound from the left column and move along the horizontal line to the US Dollar, the percentage change displayed in the box will represent GBP (base)/USD (quote).
FX option expiries for Oct 11 NY cut at 10:00 Eastern Time, via DTCC, can be found below.
EUR/USD: EUR amounts
- 1.0880 833m
- 1.0900 1.4b
- 1.0930 1.6b
- 1.0950 1.5b
- 1.0960 912m
- 1.1000 3.2b
- 1.1045 1.4b
- 1.1050 1.2b
- 1.1100 1.1b
USD/JPY: USD amounts
- 148.00 1b
- 149.00 405m
- 150.00 595m
- 150.10 645m
AUD/USD: AUD amounts
- 0.6670 594m
- 0.6765 753m
- 0.6800 1.2b
- 0.6830 742m
USD/CAD: USD amounts
- 1.3600 1.3b
- 1.3700 1.5b
- 1.3705 711m
- EUR/USD trades with mild losses near 1.0935 in Friday’s early European session.
- A warmer US inflation reading supports Fed hawks' call for gradual interest rate cuts.
- The ECB is expected to deliver a cut to the 3.5% deposit rate next week.
The EUR/USD pair remains on the defensive around 1.0935 during the early European session on Friday. The hotter-than-expected US inflation reading on Thursday has provided some support to the Greenback and caps the upside for the pair.
The warmer US Consumer Price Index (CPI) reading coupled with the stronger-than-expected September jobs report strengthens the chance that any future rate cuts by the US Federal Reserve (Fed) should be gradual. The CME FedWatch Tool showed investors boost the odds that the Fed will trim its policy rate by 25 basis points (bps) in November to 83.3% following the CPI release.
Market players will take more cues from the US Producer Price Index (PPI) for September, along with the preliminary reading of the Michigan Consumer Sentiment Index for October, which is due on Friday. The headline PPI is expected to show an increase of 1.6% YoY in September, while the core PPI is estimated to see a rise of 2.7% YoY in the same reported period. Nonetheless, if the report shows a softer outcome, this could undermine the US Dollar (USD) against the shared currency.
The European Central Bank (ECB) policymakers support a rate cut amid the economic slowdown, which might exert some selling pressure on the Euro (EUR). The ECB is anticipated to lower rates twice this year and a cut to the 3.5% deposit rate next week. More than 90% of economists polled by Reuters expect a reduction next week, with a similar majority betting on a follow-up move in December.
The Harmonized Index of Consumer Prices (HICP) inflation data from Germany is due later on Friday, which is expected to hold steady at 1.8% YoY in September.
Euro FAQs
The Euro is the currency for the 19 European Union countries that belong to the Eurozone. It is the second most heavily traded currency in the world behind the US Dollar. In 2022, it accounted for 31% of all foreign exchange transactions, with an average daily turnover of over $2.2 trillion a day. EUR/USD is the most heavily traded currency pair in the world, accounting for an estimated 30% off all transactions, followed by EUR/JPY (4%), EUR/GBP (3%) and EUR/AUD (2%).
The European Central Bank (ECB) in Frankfurt, Germany, is the reserve bank for the Eurozone. The ECB sets interest rates and manages monetary policy. The ECB’s primary mandate is to maintain price stability, which means either controlling inflation or stimulating growth. Its primary tool is the raising or lowering of interest rates. Relatively high interest rates – or the expectation of higher rates – will usually benefit the Euro and vice versa. The ECB Governing Council makes monetary policy decisions at meetings held eight times a year. Decisions are made by heads of the Eurozone national banks and six permanent members, including the President of the ECB, Christine Lagarde.
Eurozone inflation data, measured by the Harmonized Index of Consumer Prices (HICP), is an important econometric for the Euro. If inflation rises more than expected, especially if above the ECB’s 2% target, it obliges the ECB to raise interest rates to bring it back under control. Relatively high interest rates compared to its counterparts will usually benefit the Euro, as it makes the region more attractive as a place for global investors to park their money.
Data releases gauge the health of the economy and can impact on the Euro. Indicators such as GDP, Manufacturing and Services PMIs, employment, and consumer sentiment surveys can all influence the direction of the single currency. A strong economy is good for the Euro. Not only does it attract more foreign investment but it may encourage the ECB to put up interest rates, which will directly strengthen the Euro. Otherwise, if economic data is weak, the Euro is likely to fall. Economic data for the four largest economies in the euro area (Germany, France, Italy and Spain) are especially significant, as they account for 75% of the Eurozone’s economy.
Another significant data release for the Euro is the Trade Balance. This indicator measures the difference between what a country earns from its exports and what it spends on imports over a given period. If a country produces highly sought after exports then its currency will gain in value purely from the extra demand created from foreign buyers seeking to purchase these goods. Therefore, a positive net Trade Balance strengthens a currency and vice versa for a negative balance.
Gold prices rose in India on Friday, according to data compiled by FXStreet.
The price for Gold stood at 7,143.14 Indian Rupees (INR) per gram, up compared with the INR 7,101.15 it cost on Thursday.
The price for Gold increased to INR 83,318.09 per tola from INR 82,826.47 per tola a day earlier.
| Unit measure | Gold Price in INR |
|---|---|
| 1 Gram | 7,143.14 |
| 10 Grams | 71,433.03 |
| Tola | 83,318.09 |
| Troy Ounce | 222,176.70 |
FXStreet calculates Gold prices in India by adapting international prices (USD/INR) to the local currency and measurement units. Prices are updated daily based on the market rates taken at the time of publication. Prices are just for reference and local rates could diverge slightly.
Gold FAQs
Gold has played a key role in human’s history as it has been widely used as a store of value and medium of exchange. Currently, apart from its shine and usage for jewelry, the precious metal is widely seen as a safe-haven asset, meaning that it is considered a good investment during turbulent times. Gold is also widely seen as a hedge against inflation and against depreciating currencies as it doesn’t rely on any specific issuer or government.
Central banks are the biggest Gold holders. In their aim to support their currencies in turbulent times, central banks tend to diversify their reserves and buy Gold to improve the perceived strength of the economy and the currency. High Gold reserves can be a source of trust for a country’s solvency. Central banks added 1,136 tonnes of Gold worth around $70 billion to their reserves in 2022, according to data from the World Gold Council. This is the highest yearly purchase since records began. Central banks from emerging economies such as China, India and Turkey are quickly increasing their Gold reserves.
Gold has an inverse correlation with the US Dollar and US Treasuries, which are both major reserve and safe-haven assets. When the Dollar depreciates, Gold tends to rise, enabling investors and central banks to diversify their assets in turbulent times. Gold is also inversely correlated with risk assets. A rally in the stock market tends to weaken Gold price, while sell-offs in riskier markets tend to favor the precious metal.
The price can move due to a wide range of factors. Geopolitical instability or fears of a deep recession can quickly make Gold price escalate due to its safe-haven status. As a yield-less asset, Gold tends to rise with lower interest rates, while higher cost of money usually weighs down on the yellow metal. Still, most moves depend on how the US Dollar (USD) behaves as the asset is priced in dollars (XAU/USD). A strong Dollar tends to keep the price of Gold controlled, whereas a weaker Dollar is likely to push Gold prices up.
(An automation tool was used in creating this post.)
- GBP/USD draws support from subdued USD demand, though bulls remain on the sidelines.
- Expectations for more aggressive BoE policy easing undermine the GBP and cap the major.
- Traders now look to the UK data dump for short-term impetus ahead of the US PPI report.
The GBP/USD pair struggles to capitalize on the previous day's modest bounce from the 1.3020 area or a one-month low and oscillates in a narrow band during the Asian session on Friday. Spot prices currently hover around mid-1.3000s, unchanged for the day, and seem vulnerable to prolonging the recent retracement slide from the highest level since March 2022 touched last month.
The US Initial Jobless Claims data released on Thursday pointed to signs of weakness in the US labor market and suggested that the Federal Reserve (Fed) will continue cutting interest rates. This keeps the US Dollar (USD) on the defensive below its highest level since mid-August and lends some support to the GBP/USD pair. That said, investors now seem to have fully priced out the possibility of a more aggressive policy easing by the Fed. The expectations were reaffirmed by the September FOMC meeting minutes and the stronger-than-expected US consumer inflation figures.
Apart from this, persistent geopolitical risks stemming from the ongoing conflicts in the Middle East act as a tailwind for the safe-haven Greenback and cap the upside for the GBP/USD pair. In the latest development, Israel's army said that it has killed the top commander of the Palestinian militant group Islamic Jihad in the Nur Shams refugee camp in the occupied West Bank. This, along with the market conviction that the Bank of England (BoE) might be heading towards speeding up its rate-cutting cycle, might continue to undermine the British Pound and keep a lid on the currency pair.
Market participants now look forward to the UK macro data dump, including the monthly GDP print, for some impetus. The focus, however, will remain on the US Producer Price Index (PPI), due later during the North American session. Apart from this, the US economic docket features the release of the Preliminary Michigan Consumer Sentiment Index and Inflation Expectations. This, along with speeches by influential FOMC members, will drive the USD demand and allow traders to grab short-term opportunities around the GBP/USD pair on the last day of the week.
Economic Indicator
Gross Domestic Product (MoM)
The Gross Domestic Product (GDP), released by the Office for National Statistics on a monthly and quarterly basis, is a measure of the total value of all goods and services produced in the UK during a given period. The GDP is considered as the main measure of UK economic activity. The MoM reading compares economic activity in the reference month to the previous month. Generally, a rise in this indicator is bullish for the Pound Sterling (GBP), while a low reading is seen as bearish.
Read more.Next release: Fri Oct 11, 2024 06:00
Frequency: Monthly
Consensus: 0.2%
Previous: 0%
Source: Office for National Statistics
- Gold price attracts some follow-through buyers for the second successive day on Friday.
- Fed rate cut bets keep the USD on the defensive and lend support to the precious metal.
- Diminishing odds for a more aggressive Fed easing might cap gains ahead of the US PPI.
Gold price (XAU/USD) builds on the previous day's mixed US macro data-inspired recovery from the $2,600 neighborhood or a nearly three-week low and gains positive traction for the second straight day on Friday. US data published on Thursday showed that the annual rise in the headline US Consumer Price Index (CPI) was the lowest since February 2021 and a surge in the weekly jobless claims. This, in turn, suggested that the Federal Reserve (Fed) will continue cutting interest rates, which keeps the US Dollar (USD) bulls on the defensive below the highest level since mid-August and benefits the non-yielding yellow metal.
Meanwhile, the markets now seem to have fully priced out the possibility of a more aggressive easing by the Fed and another oversized interest rate cut in November. The expectations were reaffirmed by the September FOMC meeting minutes, which, in turn, acts as a tailwind for the Greenback and might cap the Gold price. This, along with hopes that China will announce more fiscal stimulus measures on Saturday to boost growth in the world’s second-largest economy, might keep a lid on the safe-haven precious metal. This, in turn, warrants some caution for aggressive bullish traders ahead of the release of the US Producer Price Index (PPI).
Daily Digest Market Movers: Gold price is underpinned by bets for more interest rate cuts by Fed, subdued USD demand
- The US Labor Department reported on Thursday that the headline Consumer Price Index rose 2.4% in the 12 months through September, while the core gauge, which excludes food and energy prices, climbed 3.3%.
- The stronger US consumer inflation data fueled speculations about a slower pace of rate cuts by the Federal Reserve and lifted the US Dollar to a nearly two-month top, though the initial reaction faded rather quickly.
- The number of Americans seeking unemployment benefits increased by 33,000, to a seasonally adjusted 258,000 in the week ended October 5 vs. 230,000 expected and pointed to signs of weakness in the US labor market.
- Given that the Fed has shifted its focus on obtaining maximum sustainable employment, the mixed data suggests that the US central bank will continue cutting interest rates and continue to benefit the non-yielding Gold price.
- Meanwhile, the yield on the benchmark 10-year US government bond manages to hold above the 4% threshold, which acts as a tailwind for the Greenback and might keep a lid on any further gains for the XAU/USD.
- China's finance ministry will hold a briefing on Saturday and release more details of fiscal stimulus measures, underpinning the risk sentiment and contributing to capping any meaningful upside for the commodity.
- Traders now look forward to the release of the US Producer Price Index (PPI) report, which will drive the USD demand and produce short-term opportunities around the precious metal heading into the weekend.
Technical Outlook: Gold price seems poised to appreciate further and aim to challenge all-time high near 2,685-2,685 area
From a technical perspective, the overnight goodish rebound from the vicinity of the $2,600 mark and the subsequent move back above the $2,630 static support breakpoint-turned-resistance favors bullish traders. Moreover, oscillators on the daily chart hold in positive territory and suggest that the path of least resistance for the Gold price is to the upside. Hence, some follow-through strength towards the $2,657-2,658 horizontal barrier, en route to the $2,670-$2,672 supply zone, looks like a distinct possibility. The momentum could eventually lift the XAU/USD to an all-time high, around the $2,685-2,686 region touched in September. This is closely followed by the $2,700 mark, which if cleared will set the stage for an extension of a well-established multi-month-old uptrend.
On the flip side, the Asian session low, around the $2,630-2,628 region, now seems to protect the immediate downside, below which the Gold price could challenge the $2,600 pivotal support. A convincing break below the latter will be seen as a fresh trigger for bearish traders and pace the way for deeper losses. The XAU/USD might then extend the corrective decline towards the next relevant support near the $2,560 zone en route to the $2,535-2,530 region before eventually dropping to the $2,500 psychological mark.
Gold FAQs
Gold has played a key role in human’s history as it has been widely used as a store of value and medium of exchange. Currently, apart from its shine and usage for jewelry, the precious metal is widely seen as a safe-haven asset, meaning that it is considered a good investment during turbulent times. Gold is also widely seen as a hedge against inflation and against depreciating currencies as it doesn’t rely on any specific issuer or government.
Central banks are the biggest Gold holders. In their aim to support their currencies in turbulent times, central banks tend to diversify their reserves and buy Gold to improve the perceived strength of the economy and the currency. High Gold reserves can be a source of trust for a country’s solvency. Central banks added 1,136 tonnes of Gold worth around $70 billion to their reserves in 2022, according to data from the World Gold Council. This is the highest yearly purchase since records began. Central banks from emerging economies such as China, India and Turkey are quickly increasing their Gold reserves.
Gold has an inverse correlation with the US Dollar and US Treasuries, which are both major reserve and safe-haven assets. When the Dollar depreciates, Gold tends to rise, enabling investors and central banks to diversify their assets in turbulent times. Gold is also inversely correlated with risk assets. A rally in the stock market tends to weaken Gold price, while sell-offs in riskier markets tend to favor the precious metal.
The price can move due to a wide range of factors. Geopolitical instability or fears of a deep recession can quickly make Gold price escalate due to its safe-haven status. As a yield-less asset, Gold tends to rise with lower interest rates, while higher cost of money usually weighs down on the yellow metal. Still, most moves depend on how the US Dollar (USD) behaves as the asset is priced in dollars (XAU/USD). A strong Dollar tends to keep the price of Gold controlled, whereas a weaker Dollar is likely to push Gold prices up.
| Raw materials | Closed | Change, % |
|---|---|---|
| Silver | 31.144 | 2.14 |
| Gold | 262.943 | 0.83 |
| Palladium | 1070.97 | 2.95 |
- The Indian Rupee edges lower in Friday’s Asian session.
- Indian foreign outflows, rising crude oil prices weigh on the INR; likely RBI’s intervention might cap its downside.
- The US PPI and preliminary reading of the Michigan Consumer Sentiment Index data will be the highlights on Friday.
The Indian Rupee (INR) weakens on Friday amid the firmer US Dollar (USD). Furthermore, sustained Indian foreign fund outflows and elevated crude oil prices continue to undermine the local currency. The hotter-than-expected US inflation data and hawkish comments by Federal Reserve (Fed) officials lift the Greenback and also contribute to the INR’s downside.
Nonetheless, the possible foreign exchange intervention from the Reserve Bank of India (RBI) helps limit the INR’s losses. Looking ahead, market players will shift their attention to the US Producer Price Index (PPI) for September, along with the preliminary reading of the Michigan Consumer Sentiment Index for October. On the Indian docket, the Industrial Production and Manufacturing Output will be released on Friday.
Daily Digest Market Movers: Indian Rupee remains sensitive to multiple headwinds
- FTSE Russell said on Tuesday that Indian sovereign bonds will be added to its Emerging Markets Government Bond Index (EMGBI), following a similar move by JP Morgan and Bloomberg Index Services.
- The US Consumer Price Index (CPI) for September rose by 2.4% YoY, compared to 2.5% in August, exceeding estimates of 2.3%. Core CPI climbed by 3.3% YoY in September, surpassing forecasts and August's 3.2%.
- New York Fed President John C. Williams said on Thursday that the monetary policy will continue to shift towards a more neutral stance in the coming months, aligning with ongoing progress toward price stability.
- Chicago Fed President Austan Goolsbee noted on Thursday that he was not overly concerned with a higher-than-expected September inflation report and stuck by his view that the Fed has moved past its singular focus on price pressures.
- Atlanta Fed President Raphael Bostic stated that the Fed could stand pat at an upcoming policy meeting if the data warrants. "I am totally comfortable with skipping a meeting if the data suggests that's appropriate," said Bostic.
Technical Analysis: USD/INR maintains the bullish trend in the longer term
The Indian Rupee trades on a softer note on the day. The constructive outlook of the USD/INR pair remains in play as the pair holds above the descending trend line and the key 100-day Exponential Moving Average (EMA) on the daily timeframe. The upward momentum is supported by the 14-day Relative Strength Index (RSI), which stands above the midline near 59.15, supporting the buyers in the near term.
The 84.00 psychological level acts as a key resistance level for USD/INR. A decisive break above this level could lead the way to the all-time high of 84.15, en route to 84.50.
On the downside, the initial support level emerges near the resistance-turned-support level at 83.90. The next contention level is located around the 100-day EMA at 83.68. The additional downside filter to watch is 83.00, representing the round mark and the low of May 24.
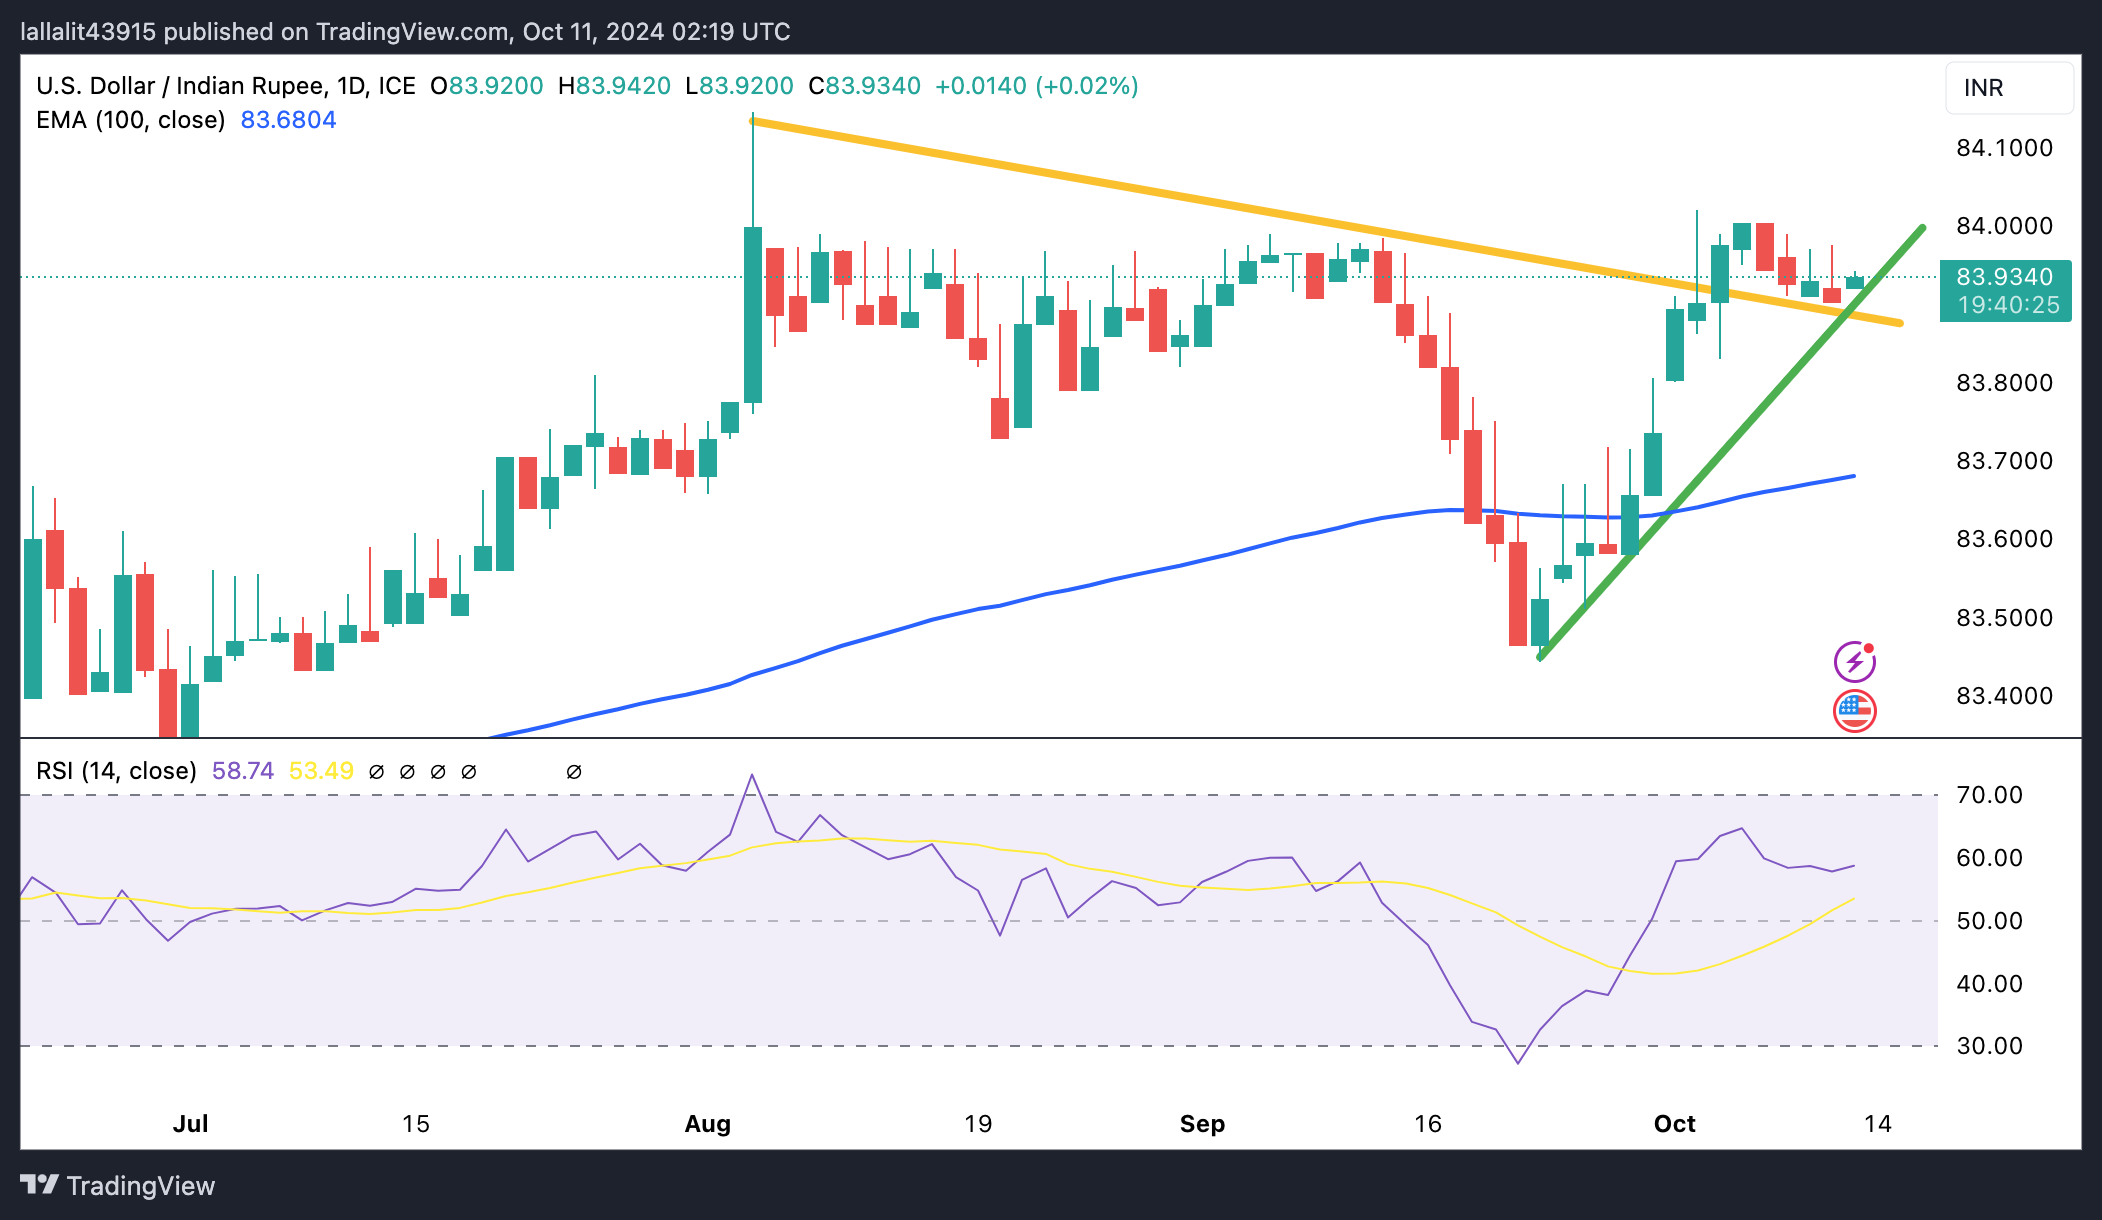
Indian Rupee FAQs
The Indian Rupee (INR) is one of the most sensitive currencies to external factors. The price of Crude Oil (the country is highly dependent on imported Oil), the value of the US Dollar – most trade is conducted in USD – and the level of foreign investment, are all influential. Direct intervention by the Reserve Bank of India (RBI) in FX markets to keep the exchange rate stable, as well as the level of interest rates set by the RBI, are further major influencing factors on the Rupee.
The Reserve Bank of India (RBI) actively intervenes in forex markets to maintain a stable exchange rate, to help facilitate trade. In addition, the RBI tries to maintain the inflation rate at its 4% target by adjusting interest rates. Higher interest rates usually strengthen the Rupee. This is due to the role of the ‘carry trade’ in which investors borrow in countries with lower interest rates so as to place their money in countries’ offering relatively higher interest rates and profit from the difference.
Macroeconomic factors that influence the value of the Rupee include inflation, interest rates, the economic growth rate (GDP), the balance of trade, and inflows from foreign investment. A higher growth rate can lead to more overseas investment, pushing up demand for the Rupee. A less negative balance of trade will eventually lead to a stronger Rupee. Higher interest rates, especially real rates (interest rates less inflation) are also positive for the Rupee. A risk-on environment can lead to greater inflows of Foreign Direct and Indirect Investment (FDI and FII), which also benefit the Rupee.
Higher inflation, particularly, if it is comparatively higher than India’s peers, is generally negative for the currency as it reflects devaluation through oversupply. Inflation also increases the cost of exports, leading to more Rupees being sold to purchase foreign imports, which is Rupee-negative. At the same time, higher inflation usually leads to the Reserve Bank of India (RBI) raising interest rates and this can be positive for the Rupee, due to increased demand from international investors. The opposite effect is true of lower inflation.
- WTI consolidates the overnight gains and oscillates in a narrow band on Friday.
- Geopolitical tensions and supply distortion concerns offer support to Oil prices.
- The recent USD bullish run keeps a lid on any further gains for the commodity.
West Texas Intermediate (WTI) US crude Oil prices struggle to capitalize on the previous day's strong move up and oscillate in a narrow band, around the $75.00/barrel mark during the Asian session on Friday.
The markets remained concerned about a potential Israeli attack on Iranian oil infrastructure, which keeps the geopolitical risk premium in play and acts as a tailwind for the black liquid. In fact, Israeli Defence Minister Yoav Gallant promised earlier this week that any strike against Iran would be "lethal, precise and surprising". Apart from this, worries about supply disruptions caused by Hurricane Milton in the United States (US), along with the upbeat demand outlook, further lend support to Crude Oil prices.
Investors turned optimistic that China's massive stimulus measures will ignite a lasting recovery in the world's second-largest economy and lift fuel demand in the world's largest oil importer. Moreover, the markets seem confident that further interest rate cuts by the Federal Reserve (Fed) will boost economic activity and demand for oil. That said, stronger-than-expected US inflation data sparked some doubts over how much rates will fall in the coming months, which, in turn, caps the upside for Crude Oil prices.
Apart from this, the recent US Dollar (USD) rally to its highest level since mid-August, bolstered by diminishing odds for a more aggressive Fed policy easing, acts as a headwind for the commodity. Nevertheless, Crude Oil prices remain on track to register gains for the second straight week. That said, a sharp pullback from the vicinity of the $78.00 mark, or a nearly two-month high touched on Tuesday, warrants caution before positioning for an extension of the recovery from the year-to-day (YTD) low touched in September.
WTI Oil FAQs
WTI Oil is a type of Crude Oil sold on international markets. The WTI stands for West Texas Intermediate, one of three major types including Brent and Dubai Crude. WTI is also referred to as “light” and “sweet” because of its relatively low gravity and sulfur content respectively. It is considered a high quality Oil that is easily refined. It is sourced in the United States and distributed via the Cushing hub, which is considered “The Pipeline Crossroads of the World”. It is a benchmark for the Oil market and WTI price is frequently quoted in the media.
Like all assets, supply and demand are the key drivers of WTI Oil price. As such, global growth can be a driver of increased demand and vice versa for weak global growth. Political instability, wars, and sanctions can disrupt supply and impact prices. The decisions of OPEC, a group of major Oil-producing countries, is another key driver of price. The value of the US Dollar influences the price of WTI Crude Oil, since Oil is predominantly traded in US Dollars, thus a weaker US Dollar can make Oil more affordable and vice versa.
The weekly Oil inventory reports published by the American Petroleum Institute (API) and the Energy Information Agency (EIA) impact the price of WTI Oil. Changes in inventories reflect fluctuating supply and demand. If the data shows a drop in inventories it can indicate increased demand, pushing up Oil price. Higher inventories can reflect increased supply, pushing down prices. API’s report is published every Tuesday and EIA’s the day after. Their results are usually similar, falling within 1% of each other 75% of the time. The EIA data is considered more reliable, since it is a government agency.
OPEC (Organization of the Petroleum Exporting Countries) is a group of 12 Oil-producing nations who collectively decide production quotas for member countries at twice-yearly meetings. Their decisions often impact WTI Oil prices. When OPEC decides to lower quotas, it can tighten supply, pushing up Oil prices. When OPEC increases production, it has the opposite effect. OPEC+ refers to an expanded group that includes ten extra non-OPEC members, the most notable of which is Russia.
- The Japanese Yen fails to build on the overnight strength amid the BoJ rate hike uncertainty.
- A positive risk tone also undermines the JPY, though subdued USD demand helps limit losses.
- The fundamental backdrop suggests that the path of least hurdle for the JPY is to the downside.
The Japanese Yen (JPY) struggles to attract any meaningful buyers during the Asian session on Friday, with the USD/JPY pair holding just below its highest level since early August touched the previous day. A drop in Japan's real wages for the first time in three months, a decline in household spending and signs that price pressures from raw material costs were subsiding raised doubts about the Bank of Japan's (BoJ) rate hike plans. This continues to undermine the JPY ahead of Japan's snap election on October 27 and turns out to be a key factor acting as a tailwind for the currency pair.
Meanwhile, the initial market reaction to the hotter-than-expected US consumer inflation figures released on Thursday turned out to be short-lived amid indications of labor market weakness. Given that the Federal Reserve (Fed) has shifted its focus on obtaining maximum sustainable employment, a surge in the US jobless claims suggested that the US central bank will continue cutting interest rates. This keeps the US Dollar (USD) bulls on the defensive, below a nearly two-month top set the previous day, and caps the USD/JPY pair as traders await the release of the US Producer Price Index (PPI).
Daily Digest Market Movers: Japanese Yen draws support from subdued USD price action, not out of the woods yet
- Expectations that the Bank of Japan will be in no rush to lift borrowing costs fail to assist the Japanese Yen to capitalize on its modest recovery against the US Dollar, from over a two-month low touched on Thursday.
- Furthermore, political uncertainty ahead of a snap election on October 27 in Japan, along with a generally positive risk tone, could undermine demand for the JPY and continue to act as a tailwind for the USD/JPY pair.
- The US Dollar shot to its highest level since mid-August after the US Labor Department reported that the core Consumer Price Index, which excludes food and energy prices, rose 3.3% on a yearly basis in September.
- Meanwhile, the headline CPI climbed 2.4% in the 12 months through September vs. 2.3% expected. This, however, was lower than the 2.5% in August and also the smallest year-on-year rise since February 2021.
- Furthermore, the number of Americans seeking unemployment benefits surged 33,000, to a seasonally adjusted 258,000 for the week ended October 5 and pointed to initial signs of weakness in the US labor market.
- Investors now seem convinced that the Federal Reserve will continue cutting interest rates, which keeps the USD bulls on the defensive ahead of the release of the US Producer Price Index (PPI), due later this Friday.
Technical Outlook: USD/JPY seems poised to resume its recent uptrend and aim to reclaim the 150.00 psychological mark
From a technical perspective, last week's move beyond the 50-day Simple Moving Average (SMA) for the first time since mid-July and acceptance above the 38.2% Fibonacci retracement level of the July-September downfall favors bulls. Moreover, oscillators on the daily chart have been gaining positive traction and are far from being in the overbought territory, suggesting that the path of least resistance for the USD/JPY pair is to the upside. Hence, any subsequent fall is more likely to attract fresh buyers and should remain limited near the 148.00 mark.
The latter should act as a key pivotal point, which if broken might prompt some technical selling and drag the USD/JPY pair to the 147.35 intermediate support en route to the 147.00 mark and the 146.50 area. On the flip side, the 149.00 round figure now seems to act as an immediate hurdle ahead of the overnight swing high, around the 149.55-149.60 region, above which bulls might aim to reclaim the 150.00 psychological mark. The momentum could extend further towards the 50% Fibo. level, around the 150.75-150.80 region.
Japanese Yen FAQs
The Japanese Yen (JPY) is one of the world’s most traded currencies. Its value is broadly determined by the performance of the Japanese economy, but more specifically by the Bank of Japan’s policy, the differential between Japanese and US bond yields, or risk sentiment among traders, among other factors.
One of the Bank of Japan’s mandates is currency control, so its moves are key for the Yen. The BoJ has directly intervened in currency markets sometimes, generally to lower the value of the Yen, although it refrains from doing it often due to political concerns of its main trading partners. The BoJ ultra-loose monetary policy between 2013 and 2024 caused the Yen to depreciate against its main currency peers due to an increasing policy divergence between the Bank of Japan and other main central banks. More recently, the gradually unwinding of this ultra-loose policy has given some support to the Yen.
Over the last decade, the BoJ’s stance of sticking to ultra-loose monetary policy has led to a widening policy divergence with other central banks, particularly with the US Federal Reserve. This supported a widening of the differential between the 10-year US and Japanese bonds, which favored the US Dollar against the Japanese Yen. The BoJ decision in 2024 to gradually abandon the ultra-loose policy, coupled with interest-rate cuts in other major central banks, is narrowing this differential.
The Japanese Yen is often seen as a safe-haven investment. This means that in times of market stress, investors are more likely to put their money in the Japanese currency due to its supposed reliability and stability. Turbulent times are likely to strengthen the Yen’s value against other currencies seen as more risky to invest in.
- The Australian Dollar trades in positive territory for the second consecutive day in Friday’s Asian session.
- Reduced bets of deeper Fed rate cuts support the USD and weigh on the pair.
- Investors brace for the US PPI data, which is due on Friday.
The Australian Dollar (AUD) gains ground on Friday. Nonetheless, the lower odds of aggressive interest rate cuts from the US Federal Reserve (Fed) after the hotter-than-expected inflation data might lift the US Dollar (USD) and cap the upside for the pair.
In the absence of top-tier economic data releases from the Australia on Friday, the USD price dynamic will be the main driver for the AUD/USD. Investors will monitor the release of US Producer Price Index (PPI), which is due on Friday. The headline PPI is expected to show an increase of 1.6% YoY in September, while the core PPI is estimated to see a rise of 2.7% YoY during the same period. If the reports shows softer than expected outcome, this could weigh on the USD and acts as a tailwind for AUD/USD. Additionally, the preliminary of the Michigan Consumer Sentiment Index will be released later in the day.
Daily Digest Market Movers: Australian Dollar extends its recovery ahead of another US inflation data
- RBA Minutes from the September meeting showed board members overlooked the warning that there would be no rate cuts in the near future. The Australian central bank wants to keep its options open, watching whether the economy starts to pick up in the second half of the year.
- The US Consumer Price Index (CPI) rose 2.4% YoY in September, compared to 2.5% in August, above the consensus of 2.3%, the US Department of Labor Statistics showed Thursday. The core CPI, excluding food and energy, climbed 3.3% YoY in September, above forecast and the previous reading of 3.2%.
- The US Initial Jobless Claims for the week ending October 4 rose to 258K, up from the previous week's 225K. The figure was above the initial consensus of 230K.
- New York Fed President John Williams said on Thursday that he expects more rate cuts lie ahead as inflation pressures continue to moderate and the economy remains solid.
- Chicago Fed President Austan Goolsbee noted he sees a series of rate reductions over the next year to year and a half, noting that inflation is now near the Fed's 2% target and the economy is about at full employment.
- Atlanta Fed President Raphael Bostic is open to the idea of skipping a rate cut in November if economic data still hasn't aligned with the Fed's target figures in time.
Technical Analysis: Australian Dollar maintains a positive stance in the longer term
The Australian Dollar trades stronger on the day. According to the daily chart, the AUD/USD pair keeps the bullish vibe as the price is well-supported above the lower limit of the ascending trend channel and the key 100-day Exponential Moving Average (EMA). However, the further downside cannot be ruled out as the 14-day Relative Strength Index (RSI) is located below the midline near 44.70.
The first upside barrier emerges near the high of September 6 at 0.6767. Extended gains could pave the way to 0.6823, the high of August 29. Any follow-through buying above the mentioned level could see a rally to 0.6942, the high of September 30.
On the flip side, the key support level is seen at 0.6700, representing the lower limit of the trend channel, the 100-day EMA, and the psychological level. A breach of this level could expose 0.6622, the low of September 11.
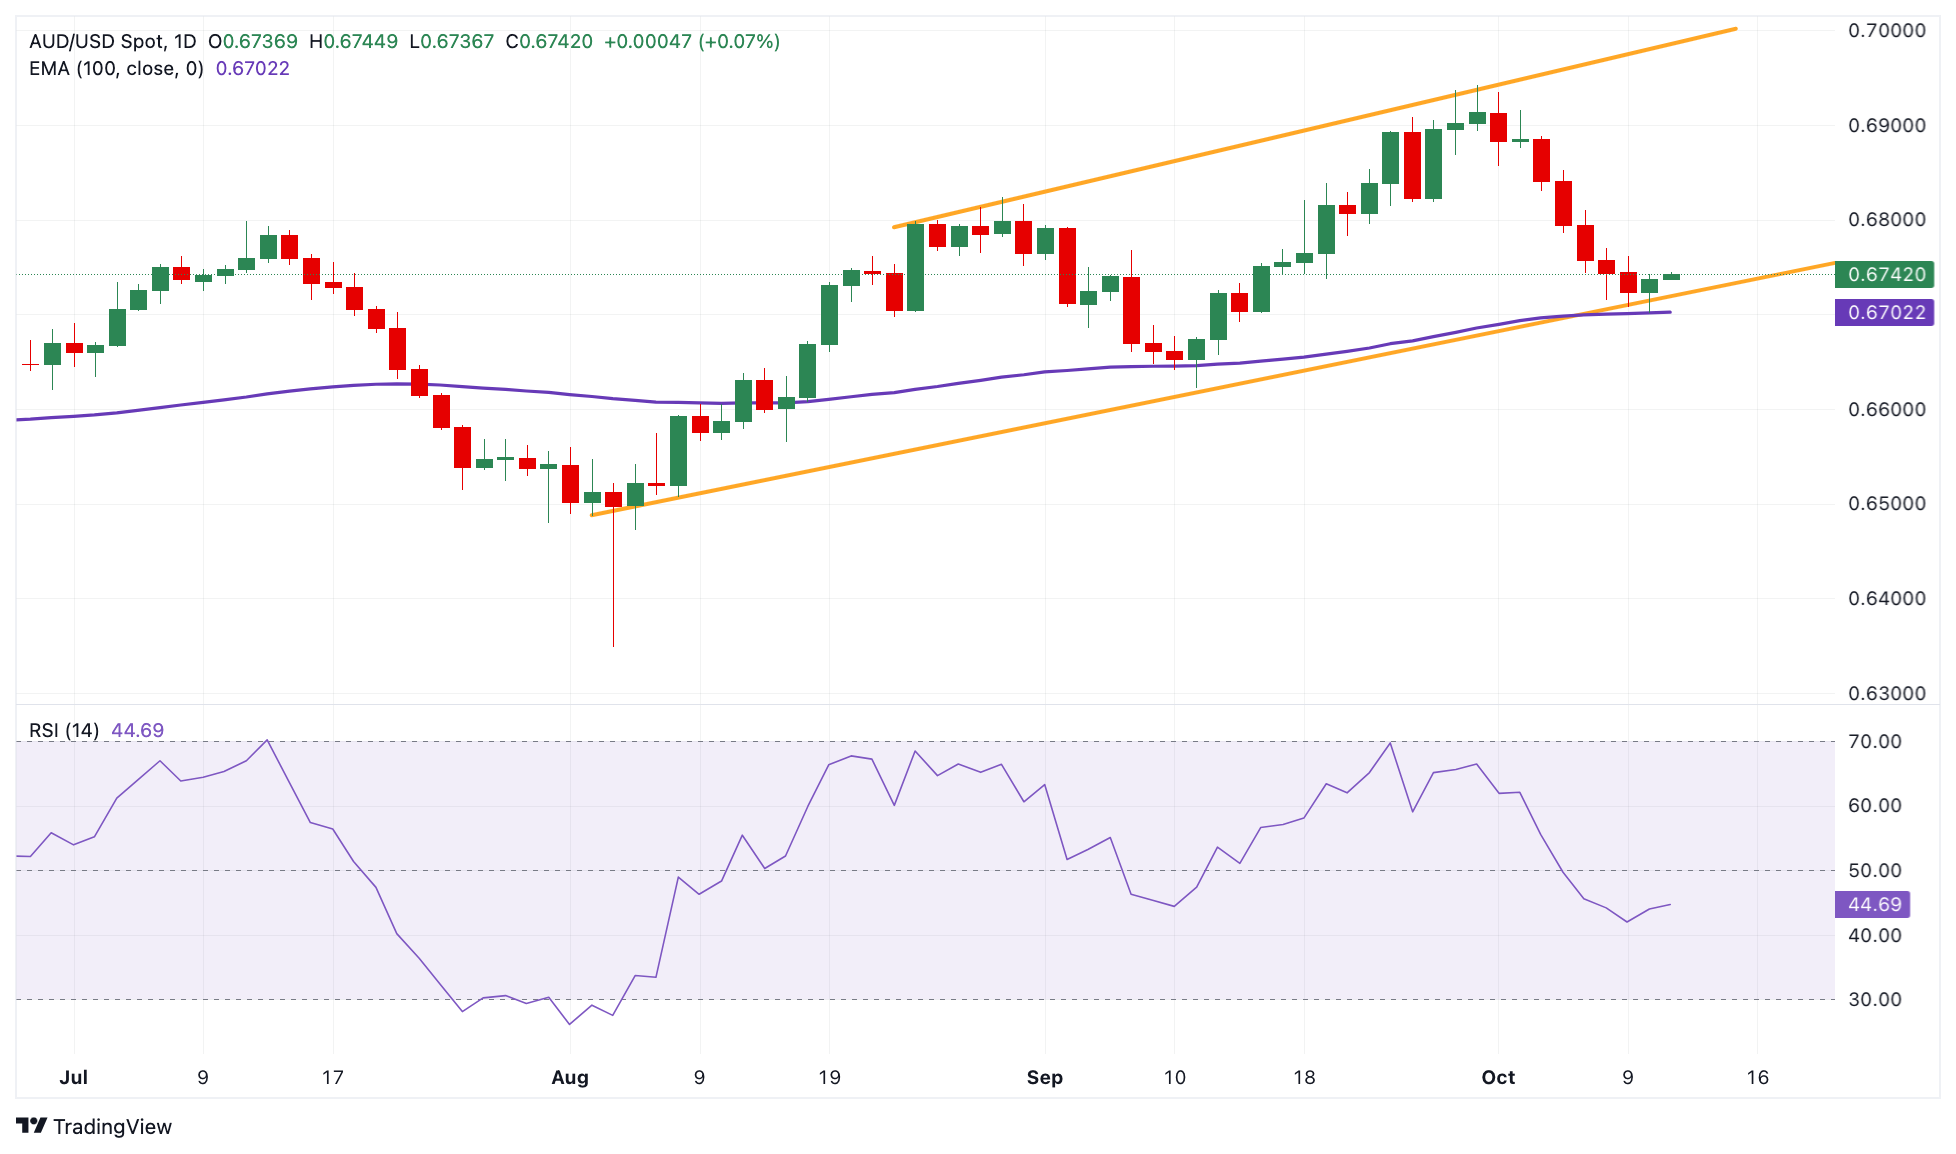
Australian Dollar FAQs
One of the most significant factors for the Australian Dollar (AUD) is the level of interest rates set by the Reserve Bank of Australia (RBA). Because Australia is a resource-rich country another key driver is the price of its biggest export, Iron Ore. The health of the Chinese economy, its largest trading partner, is a factor, as well as inflation in Australia, its growth rate and Trade Balance. Market sentiment – whether investors are taking on more risky assets (risk-on) or seeking safe-havens (risk-off) – is also a factor, with risk-on positive for AUD.
The Reserve Bank of Australia (RBA) influences the Australian Dollar (AUD) by setting the level of interest rates that Australian banks can lend to each other. This influences the level of interest rates in the economy as a whole. The main goal of the RBA is to maintain a stable inflation rate of 2-3% by adjusting interest rates up or down. Relatively high interest rates compared to other major central banks support the AUD, and the opposite for relatively low. The RBA can also use quantitative easing and tightening to influence credit conditions, with the former AUD-negative and the latter AUD-positive.
China is Australia’s largest trading partner so the health of the Chinese economy is a major influence on the value of the Australian Dollar (AUD). When the Chinese economy is doing well it purchases more raw materials, goods and services from Australia, lifting demand for the AUD, and pushing up its value. The opposite is the case when the Chinese economy is not growing as fast as expected. Positive or negative surprises in Chinese growth data, therefore, often have a direct impact on the Australian Dollar and its pairs.
Iron Ore is Australia’s largest export, accounting for $118 billion a year according to data from 2021, with China as its primary destination. The price of Iron Ore, therefore, can be a driver of the Australian Dollar. Generally, if the price of Iron Ore rises, AUD also goes up, as aggregate demand for the currency increases. The opposite is the case if the price of Iron Ore falls. Higher Iron Ore prices also tend to result in a greater likelihood of a positive Trade Balance for Australia, which is also positive of the AUD.
The Trade Balance, which is the difference between what a country earns from its exports versus what it pays for its imports, is another factor that can influence the value of the Australian Dollar. If Australia produces highly sought after exports, then its currency will gain in value purely from the surplus demand created from foreign buyers seeking to purchase its exports versus what it spends to purchase imports. Therefore, a positive net Trade Balance strengthens the AUD, with the opposite effect if the Trade Balance is negative.
The People’s Bank of China (PBoC) set the USD/CNY central rate for the trading session ahead on Friday at 7.0731, as compared to the previous day's fix of 7.0742 and 7.0737 Reuters estimates.
| Index | Change, points | Closed | Change, % |
|---|---|---|---|
| NIKKEI 225 | 102.93 | 39380.89 | 0.26 |
| Hang Seng | 614.74 | 21251.98 | 2.98 |
| KOSPI | 4.8 | 2599.16 | 0.19 |
| ASX 200 | 35.6 | 8223 | 0.43 |
| DAX | -44.03 | 19210.9 | -0.23 |
| CAC 40 | -18.5 | 7541.59 | -0.24 |
| Dow Jones | -57.88 | 42454.12 | -0.14 |
| S&P 500 | -11.99 | 5780.05 | -0.21 |
| NASDAQ Composite | -9.57 | 18282.05 | -0.05 |
| Pare | Closed | Change, % |
|---|---|---|
| AUDUSD | 0.6739 | 0.37 |
| EURJPY | 162.414 | -0.5 |
| EURUSD | 1.09349 | -0.05 |
| GBPJPY | 193.892 | -0.55 |
| GBPUSD | 1.30557 | -0.09 |
| NZDUSD | 0.60932 | 0.53 |
| USDCAD | 1.37403 | 0.23 |
| USDCHF | 0.85614 | -0.51 |
| USDJPY | 148.524 | -0.45 |
- NZD/USD edges higher to near 0.6095 in Friday’s early Asian session.
- The US CPI inflation was higher than forecast in September, while jobless claims posted an unexpected rise.
- The dovish stance of the RBNZ might cap the pair’s upside.
The NZD/USD pair holds positive ground around 0.6095 during the early Asian session on Friday. However, the upside of the pair might be limited as firmer US September inflation lowers the odds of aggressive US Federal Reserve (Fed) cuts, which lift the Greenback. Investors await the Producer Price Index (PPI) and the preliminary Michigan Consumer Sentiment Index data, which are due later on Friday.
The US inflation surprised on the upside in September, with the Consumer Price Index (CPI) rising 2.4% YoY in September, compared to 2.5% in the previous month. Meanwhile, the core CPI, Ex-food & energy price growth, jumped 3.3% YoY in September versus 3.2% prior, hotter than the 3.2% expected. The higher-than-expected inflation report might boost the Greenback and cap the upside for NZD/USD.
The small upward surprise in September price growth is unlikely to prevent the Fed from additional interest rate cuts this year, but the odds of a 50 basis points (bps) reduction fell significantly after September's strong US Nonfarm Payrolls report last week. The markets are now pricing in nearly 83.3% possibility of 25 basis points (bps) Fed rate cuts in November, according to the CME FedWatch Tool.
New York Fed President John Williams said on Thursday that he expects more rate cuts lie ahead as inflation pressures continue to moderate and the economy remains solid. Meanwhile, Chicago Fed President Austan Goolsbee noted he sees a series of rate reductions over the next year to year and a half, noting that inflation is now near the Fed's 2% target, the economy is about at full employment, and the Fed's goal is to freeze those conditions in place.
However, Atlanta Fed President Raphael Bostic is open to the idea of skipping a rate cut in November if economic data still hasn't aligned with the Fed's target figures in time.
On the Kiwi front, the dovish stance of the Reserve Bank of New Zealand (RBNZ) might cap the pair’s upside in the near term. The markets bet on more aggressive easing in November. Swaps imply there are a further 45 bps of easing to come at the RBNZ's November meeting. However, the positive development surrounding the Chinese economy could lift the China-proxy New Zealand Dollar (NZD) as China is a major trading partner to New Zealand.
New Zealand Dollar FAQs
The New Zealand Dollar (NZD), also known as the Kiwi, is a well-known traded currency among investors. Its value is broadly determined by the health of the New Zealand economy and the country’s central bank policy. Still, there are some unique particularities that also can make NZD move. The performance of the Chinese economy tends to move the Kiwi because China is New Zealand’s biggest trading partner. Bad news for the Chinese economy likely means less New Zealand exports to the country, hitting the economy and thus its currency. Another factor moving NZD is dairy prices as the dairy industry is New Zealand’s main export. High dairy prices boost export income, contributing positively to the economy and thus to the NZD.
The Reserve Bank of New Zealand (RBNZ) aims to achieve and maintain an inflation rate between 1% and 3% over the medium term, with a focus to keep it near the 2% mid-point. To this end, the bank sets an appropriate level of interest rates. When inflation is too high, the RBNZ will increase interest rates to cool the economy, but the move will also make bond yields higher, increasing investors’ appeal to invest in the country and thus boosting NZD. On the contrary, lower interest rates tend to weaken NZD. The so-called rate differential, or how rates in New Zealand are or are expected to be compared to the ones set by the US Federal Reserve, can also play a key role in moving the NZD/USD pair.
Macroeconomic data releases in New Zealand are key to assess the state of the economy and can impact the New Zealand Dollar’s (NZD) valuation. A strong economy, based on high economic growth, low unemployment and high confidence is good for NZD. High economic growth attracts foreign investment and may encourage the Reserve Bank of New Zealand to increase interest rates, if this economic strength comes together with elevated inflation. Conversely, if economic data is weak, NZD is likely to depreciate.
The New Zealand Dollar (NZD) tends to strengthen during risk-on periods, or when investors perceive that broader market risks are low and are optimistic about growth. This tends to lead to a more favorable outlook for commodities and so-called ‘commodity currencies’ such as the Kiwi. Conversely, NZD tends to weaken at times of market turbulence or economic uncertainty as investors tend to sell higher-risk assets and flee to the more-stable safe havens.


© 2000-2026. Sva prava zaštićena.
Sajt je vlasništvo kompanije Teletrade D.J. LLC 2351 LLC 2022 (Euro House, Richmond Hill Road, Kingstown, VC0100, St. Vincent and the Grenadines).
Svi podaci koji se nalaze na sajtu ne predstavljaju osnovu za donošenje investicionih odluka, već su informativnog karaktera.
The company does not serve or provide services to customers who are residents of the US, Canada, Iran, The Democratic People's Republic of Korea, Yemen and FATF blacklisted countries.
Izvršenje trgovinskih operacija sa finansijskim instrumentima upotrebom marginalne trgovine pruža velike mogućnosti i omogućava investitorima ostvarivanje visokih prihoda. Međutim, takav vid trgovine povezan je sa potencijalno visokim nivoom rizika od gubitka sredstava. Проведение торговых операций на финанcовых рынках c маржинальными финанcовыми инcтрументами открывает широкие возможноcти, и позволяет инвеcторам, готовым пойти на риcк, получать выcокую прибыль, но при этом неcет в cебе потенциально выcокий уровень риcка получения убытков. Iz tog razloga je pre započinjanja trgovine potrebno odlučiti o izboru odgovarajuće investicione strategije, uzimajući u obzir raspoložive resurse.
Upotreba informacija: U slučaju potpunog ili delimičnog preuzimanja i daljeg korišćenja materijala koji se nalazi na sajtu, potrebno je navesti link odgovarajuće stranice na sajtu kompanije TeleTrade-a kao izvora informacija. Upotreba materijala na internetu mora biti praćena hiper linkom do web stranice teletrade.org. Automatski uvoz materijala i informacija sa stranice je zabranjen.
Ako imate bilo kakvih pitanja, obratite nam se pr@teletrade.global.
транcфери