- Analiza
- Novosti i instrumenti
- Vesti sa tržišta
Forex-novosti i prognoze od 11-07-2024
- USD/CAD weakens around 1.3630 in Friday’s early Asian session.
- The softer US June inflation readings increased Fed rate cut bets.
- The recovery of crude oil prices might cap the pair’s upside.
The USD/CAD pair trades with mild losses near 1.3630 after bouncing off the two-month lows around 1.3588 during the early Asian session on Friday. The pair edges lower after the softer-than-expected US inflation readings in June have fueled the expectation of a Federal Reserve (Fed) rate cut in September, which weighs on the Greenback.
US inflation, as measured by the Consumer Price Index (CPI), declined 0.1% MoM in June, the lowest level in more than three years, the Labor Department reported Thursday. The headline CPI increased 3.0% on a yearly basis in June, compared to a rise of 3.3% in May, below the market consensus of 3.1%. The core CPI, which excludes volatile food and energy prices, rose 3.3% YoY in June compared to May's increase and expectation of 3.4%
In response to the data, investors in the fed funds futures market increased their bets that the US Fed would lower rates starting in September. According to CME Group’s FedWatch Tool, markets are now pricing in nearly 89% odds of a September Fed meeting rate cut, up from 73% on Wednesday.
Furthermore, the US weekly Initial Jobless Claims for the week ending July 6 increased by 222,000, compared to the previous week's 239,000, the lowest level since June 1. This figure came in better than the expectations of 236,000.
On the Loonie front, Canada’s Unemployment Rate rose to 6.4% and the economy lost 1,400 jobs in June, prompting a higher probability that the Bank of Canada (BoC) would cut further interest rates. The weaker Canada’s June labour market data might undermine the Canadian Dollar (CAD) and create a tailwind for USD/CAD. However, the rebound of crude oil prices might help limit the CAD’s losses, as Canada is the major crude oil exporter to the United States.
Canadian Dollar FAQs
The key factors driving the Canadian Dollar (CAD) are the level of interest rates set by the Bank of Canada (BoC), the price of Oil, Canada’s largest export, the health of its economy, inflation and the Trade Balance, which is the difference between the value of Canada’s exports versus its imports. Other factors include market sentiment – whether investors are taking on more risky assets (risk-on) or seeking safe-havens (risk-off) – with risk-on being CAD-positive. As its largest trading partner, the health of the US economy is also a key factor influencing the Canadian Dollar.
The Bank of Canada (BoC) has a significant influence on the Canadian Dollar by setting the level of interest rates that banks can lend to one another. This influences the level of interest rates for everyone. The main goal of the BoC is to maintain inflation at 1-3% by adjusting interest rates up or down. Relatively higher interest rates tend to be positive for the CAD. The Bank of Canada can also use quantitative easing and tightening to influence credit conditions, with the former CAD-negative and the latter CAD-positive.
The price of Oil is a key factor impacting the value of the Canadian Dollar. Petroleum is Canada’s biggest export, so Oil price tends to have an immediate impact on the CAD value. Generally, if Oil price rises CAD also goes up, as aggregate demand for the currency increases. The opposite is the case if the price of Oil falls. Higher Oil prices also tend to result in a greater likelihood of a positive Trade Balance, which is also supportive of the CAD.
While inflation had always traditionally been thought of as a negative factor for a currency since it lowers the value of money, the opposite has actually been the case in modern times with the relaxation of cross-border capital controls. Higher inflation tends to lead central banks to put up interest rates which attracts more capital inflows from global investors seeking a lucrative place to keep their money. This increases demand for the local currency, which in Canada’s case is the Canadian Dollar.
Macroeconomic data releases gauge the health of the economy and can have an impact on the Canadian Dollar. Indicators such as GDP, Manufacturing and Services PMIs, employment, and consumer sentiment surveys can all influence the direction of the CAD. A strong economy is good for the Canadian Dollar. Not only does it attract more foreign investment but it may encourage the Bank of Canada to put up interest rates, leading to a stronger currency. If economic data is weak, however, the CAD is likely to fall.
- EUR/USD rallied to a five-week peak after US CPI inflation flattened the Greenback.
- Pullback from daily highs leaves the Fiber poised for a fresh turnaround into the low end.
- US PPI wholesale inflation on the docket for Friday.
EUR/USD tested into a fresh five-week high on Thursday, bolstered by a broad-market selloff of the US Dollar after US Consumer Price Index (CPI) inflation figures softened to the slowest pace of price growth since late 2021. Rising market hopes for an accelerated pace of rate cuts has left market sentiment on the high side heading into the Friday market session. However, an expected uptick in US Producer Price Index (PPI) wholesale inflation could spoil the fun for bulls. European data did little to galvanize Euro traders on Thursday, with final German Harmonized Index of Consumer Prices (HICP) inflation printing exactly as expected at 2.5% YoY.
Forex Today: Focus remains on US inflation
In June, US CPI inflation fell below expectations. The annualized headline CPI inflation decreased to 3.0% YoY from the previous 3.3%, surpassing the forecasted 3.1%. Additionally, CPI inflation dropped by -0.1% MoM in June, down from the previous month’s 0.0% and below the anticipated 0.1%.
For the week ending July 5, US Initial Jobless Claims decreased to 222K, down from the revised 239K of the previous week and outperforming the forecasted 236K. This decline in jobless claims reduced the four-week average to 233.5K from the previous 238.75K.
Due to the rapid slowdown in US CPI inflation, market expectations for a rate hike from the Federal Reserve (Fed) now indicate the possibility of three quarter-point rate cuts in 2024. The CME's FedWatch Tool shows a 95% increase in the likelihood of a rate cut in September.
With US CPI data out of the way, all that's left for the week is Friday’s US Producer Price Index (PPI) wholesale inflation print, which could disrupt the plans for rate-cut hopefuls. Core PPI for the year ended in June is expected to rise to 2.5% from the previous 2.3% due to businesses facing higher cost pressures than the Fed would like to see.
Euro PRICE Today
The table below shows the percentage change of Euro (EUR) against listed major currencies today. Euro was the strongest against the US Dollar.
| USD | EUR | GBP | JPY | CAD | AUD | NZD | CHF | |
|---|---|---|---|---|---|---|---|---|
| USD | -0.06% | -0.08% | -0.44% | -0.05% | -0.17% | -0.01% | -0.01% | |
| EUR | 0.06% | -0.02% | -0.31% | 0.00% | -0.13% | 0.04% | 0.03% | |
| GBP | 0.08% | 0.02% | -0.31% | 0.02% | -0.12% | 0.05% | 0.04% | |
| JPY | 0.44% | 0.31% | 0.31% | 0.28% | 0.18% | 0.33% | 0.33% | |
| CAD | 0.05% | -0.00% | -0.02% | -0.28% | -0.12% | 0.03% | 0.02% | |
| AUD | 0.17% | 0.13% | 0.12% | -0.18% | 0.12% | 0.16% | 0.15% | |
| NZD | 0.01% | -0.04% | -0.05% | -0.33% | -0.03% | -0.16% | 0.00% | |
| CHF | 0.00% | -0.03% | -0.04% | -0.33% | -0.02% | -0.15% | -0.00% |
The heat map shows percentage changes of major currencies against each other. The base currency is picked from the left column, while the quote currency is picked from the top row. For example, if you pick the Euro from the left column and move along the horizontal line to the US Dollar, the percentage change displayed in the box will represent EUR (base)/USD (quote).
EUR/USD technical outlook
The Fiber’s Friday bull run dragged the pair into a fresh near-term peak, testing the 1.0900 handle before paring back on exhaustion towards 1.0870. EUR/USD has broken above a technical technical consolidation point near 1.0805, and the next challenge will be building out a base without backsliding below technical barriers near the 200-hour Exponential Moving Average (EMA) near 1.0808.
Despite a firm push into topside territory, the Fiber remains hampered by a rough descending channel, and daily candlesticks are poised for a bearish turnaround as EUR/USD waffles just beneath 1.0900.
EUR/USD hourly chart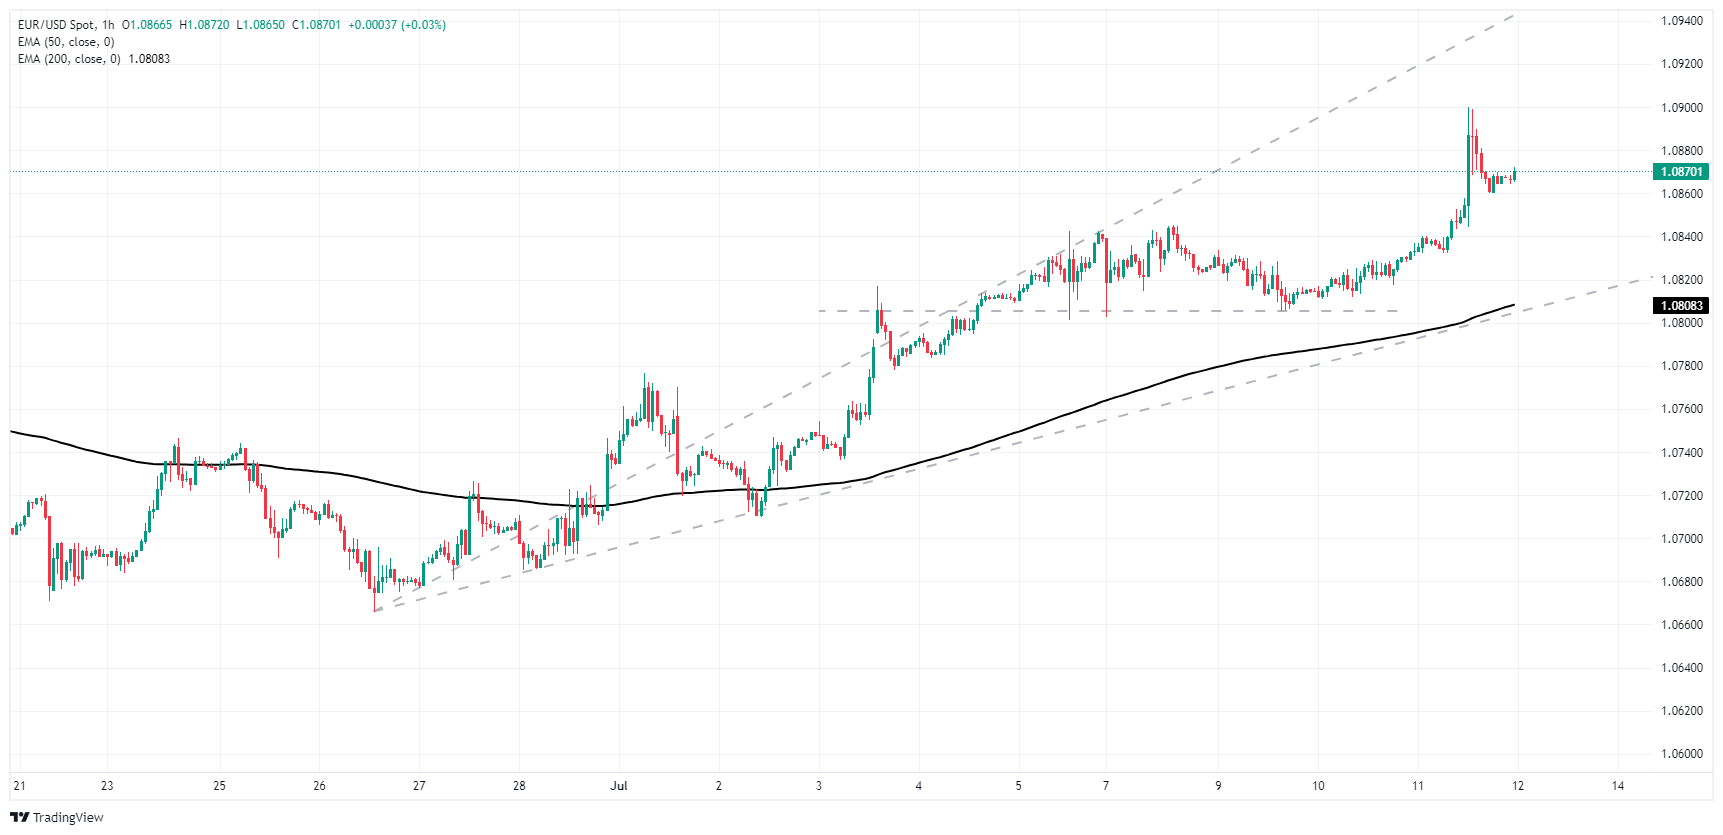
EUR/USD daily chart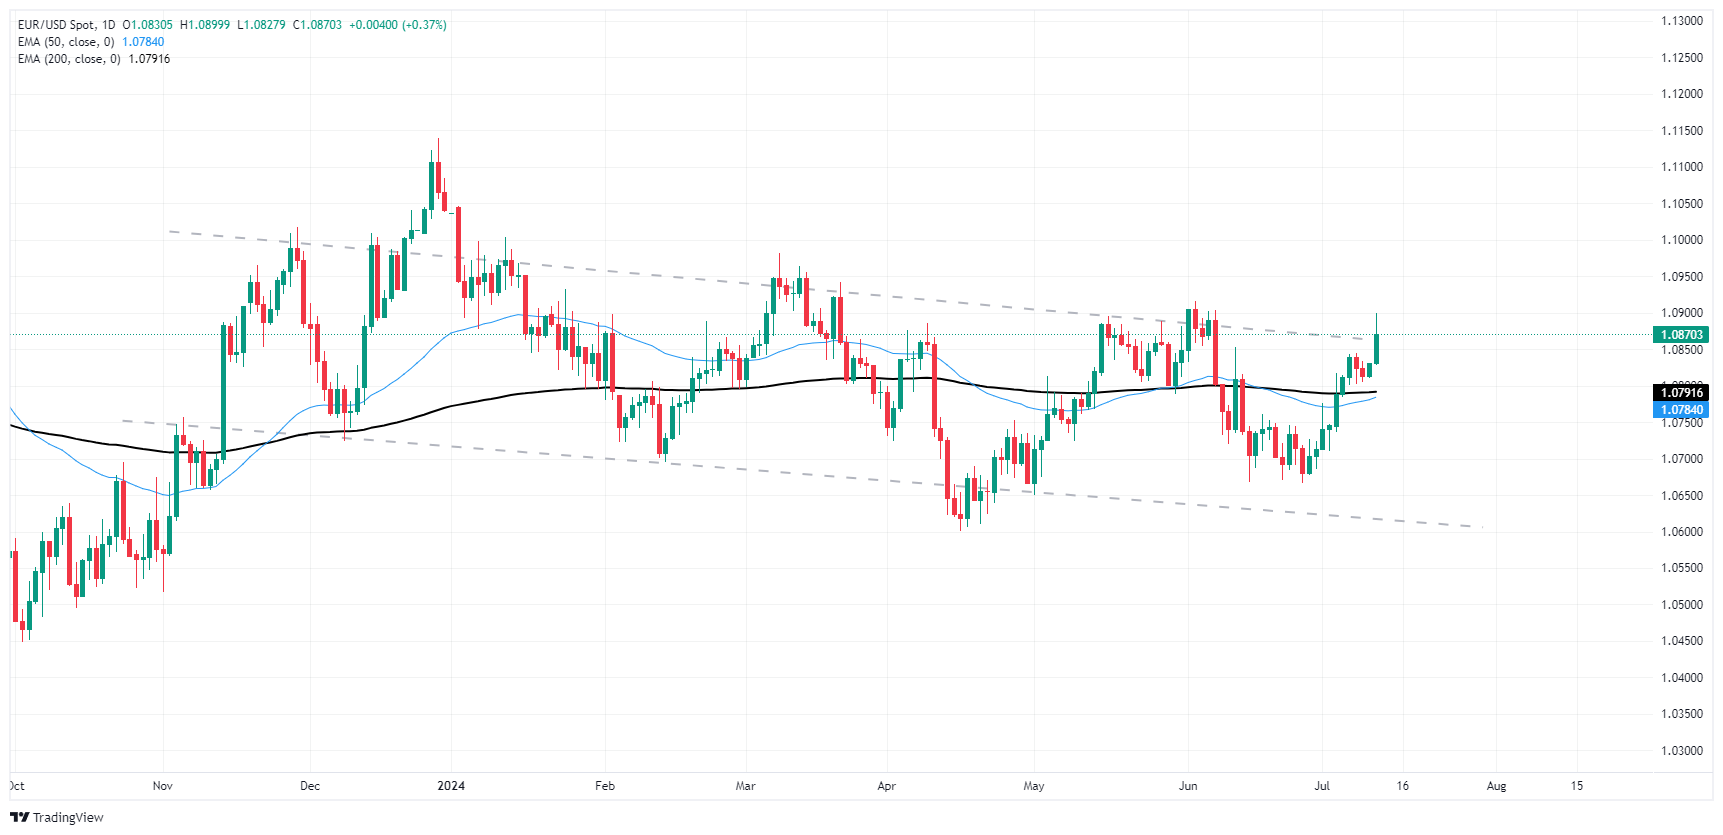
Euro FAQs
The Euro is the currency for the 20 European Union countries that belong to the Eurozone. It is the second most heavily traded currency in the world behind the US Dollar. In 2022, it accounted for 31% of all foreign exchange transactions, with an average daily turnover of over $2.2 trillion a day. EUR/USD is the most heavily traded currency pair in the world, accounting for an estimated 30% off all transactions, followed by EUR/JPY (4%), EUR/GBP (3%) and EUR/AUD (2%).
The European Central Bank (ECB) in Frankfurt, Germany, is the reserve bank for the Eurozone. The ECB sets interest rates and manages monetary policy. The ECB’s primary mandate is to maintain price stability, which means either controlling inflation or stimulating growth. Its primary tool is the raising or lowering of interest rates. Relatively high interest rates – or the expectation of higher rates – will usually benefit the Euro and vice versa. The ECB Governing Council makes monetary policy decisions at meetings held eight times a year. Decisions are made by heads of the Eurozone national banks and six permanent members, including the President of the ECB, Christine Lagarde.
Eurozone inflation data, measured by the Harmonized Index of Consumer Prices (HICP), is an important econometric for the Euro. If inflation rises more than expected, especially if above the ECB’s 2% target, it obliges the ECB to raise interest rates to bring it back under control. Relatively high interest rates compared to its counterparts will usually benefit the Euro, as it makes the region more attractive as a place for global investors to park their money.
Data releases gauge the health of the economy and can impact on the Euro. Indicators such as GDP, Manufacturing and Services PMIs, employment, and consumer sentiment surveys can all influence the direction of the single currency. A strong economy is good for the Euro. Not only does it attract more foreign investment but it may encourage the ECB to put up interest rates, which will directly strengthen the Euro. Otherwise, if economic data is weak, the Euro is likely to fall. Economic data for the four largest economies in the euro area (Germany, France, Italy and Spain) are especially significant, as they account for 75% of the Eurozone’s economy.
Another significant data release for the Euro is the Trade Balance. This indicator measures the difference between what a country earns from its exports and what it spends on imports over a given period. If a country produces highly sought after exports then its currency will gain in value purely from the extra demand created from foreign buyers seeking to purchase these goods. Therefore, a positive net Trade Balance strengthens a currency and vice versa for a negative balance.
- GBP/USD found the gas pedal and extended into a two-day bull run.
- US CPI inflation cooled in June, and reigniting rate-cut bets.
- US PPI wholesale inflation on the docket for Friday.
GBP/USD extended into a second day of a topside run, breaking through a firm supply zone and setting a fresh peak for 2024 near 1.2950. The pair set a new 50-week high as the Greenback tumbled across the board after US Consumer Price Index (CPI) inflation cooled to its lowest levels since 2021.
Forex Today: Focus remains on US inflation
In June, US CPI inflation was lower than expected. The annualized headline CPI inflation dropped to 3.0% YoY from the previous 3.3%, lower than the forecasted 3.1%. Additionally, CPI inflation decreased by -0.1% MoM in June, down from the previous month’s 0.0% and below the expected 0.1%.
For the week ending July 5, US Initial Jobless Claims decreased to 222K, down from the revised 239K of the previous week and better than the forecasted 236 K. This decline in jobless claims reduced the four-week average to 233.5K from the previous 238.75 K.
Due to the accelerated cooling of US CPI inflation, market expectations for a rate hike from the Federal Reserve (Fed) are now indicating the possibility of three quarter-point rate cuts in 2024. The CME’s FedWatch Tool is showing a 95% increase in the likelihood of a rate cut in September.
With US CPI data out of the way, all that’s left for the week is Friday’s US Producer Price Index (PPI) wholesale inflation print, which could throw a wrench in the works for rate-cut hopefuls. Core PPI for the year ended in June is expected to tick upwards to 2.5% from the previous 2.3% as businesses continue to face higher cost pressures than the Fed would like to see.
British Pound PRICE Today
The table below shows the percentage change of British Pound (GBP) against listed major currencies today. British Pound was the strongest against the Japanese Yen.
| USD | EUR | GBP | JPY | CAD | AUD | NZD | CHF | |
|---|---|---|---|---|---|---|---|---|
| USD | 0.00% | -0.01% | 0.32% | 0.00% | -0.06% | 0.14% | 0.07% | |
| EUR | -0.01% | -0.02% | 0.36% | -0.01% | -0.08% | 0.12% | 0.04% | |
| GBP | 0.01% | 0.02% | 0.37% | 0.00% | -0.07% | 0.14% | 0.05% | |
| JPY | -0.32% | -0.36% | -0.37% | -0.37% | -0.41% | -0.23% | -0.29% | |
| CAD | -0.01% | 0.00% | -0.01% | 0.37% | -0.07% | 0.12% | 0.04% | |
| AUD | 0.06% | 0.08% | 0.07% | 0.41% | 0.07% | 0.20% | 0.13% | |
| NZD | -0.14% | -0.12% | -0.14% | 0.23% | -0.12% | -0.20% | -0.07% | |
| CHF | -0.07% | -0.04% | -0.05% | 0.29% | -0.04% | -0.13% | 0.07% |
The heat map shows percentage changes of major currencies against each other. The base currency is picked from the left column, while the quote currency is picked from the top row. For example, if you pick the British Pound from the left column and move along the horizontal line to the US Dollar, the percentage change displayed in the box will represent GBP (base)/USD (quote).
GBP/USD technical outlook
The Cable’s Thursday bull run dragged the pair into a 50-week peak just shy of 1.2950, and the pair is up 2.65% from July’s early swing low near 1.2615.
Daily candlesticks have resumed a near-term topside run, closing in the green for all but two of the last eleven consecutive trading days. It’s the bulls’ game to lose as a bearish turnaround from here will drag GBP/USD back into major technical levels near the 200-day Exponential Moving Average (EMA) at 1.2606.
GBP/USD hourly chart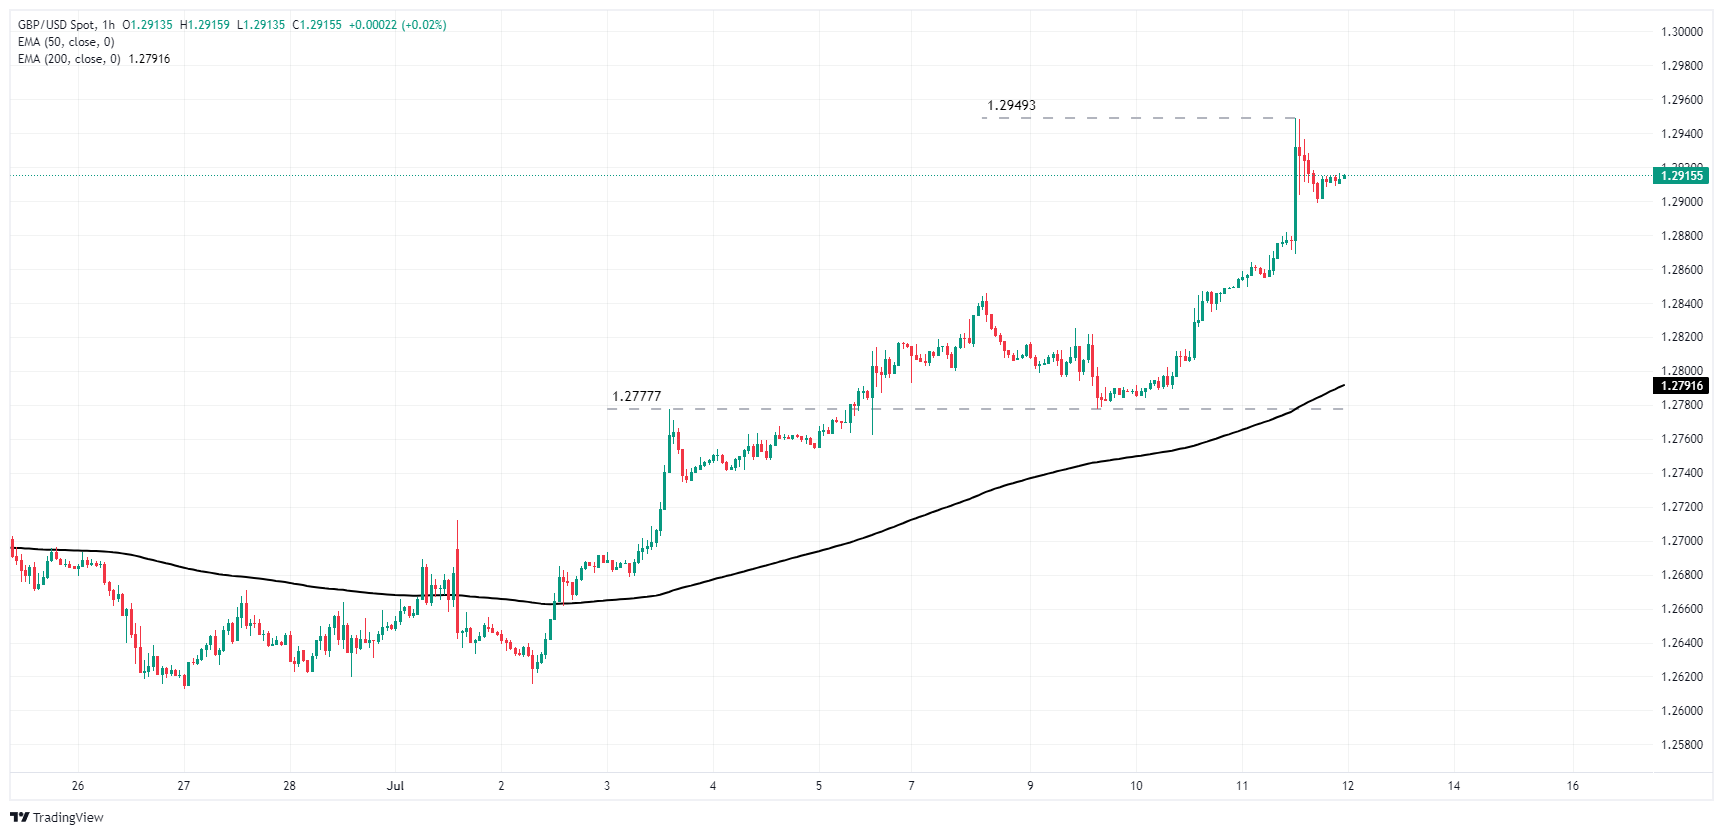
GBP/USD daily chart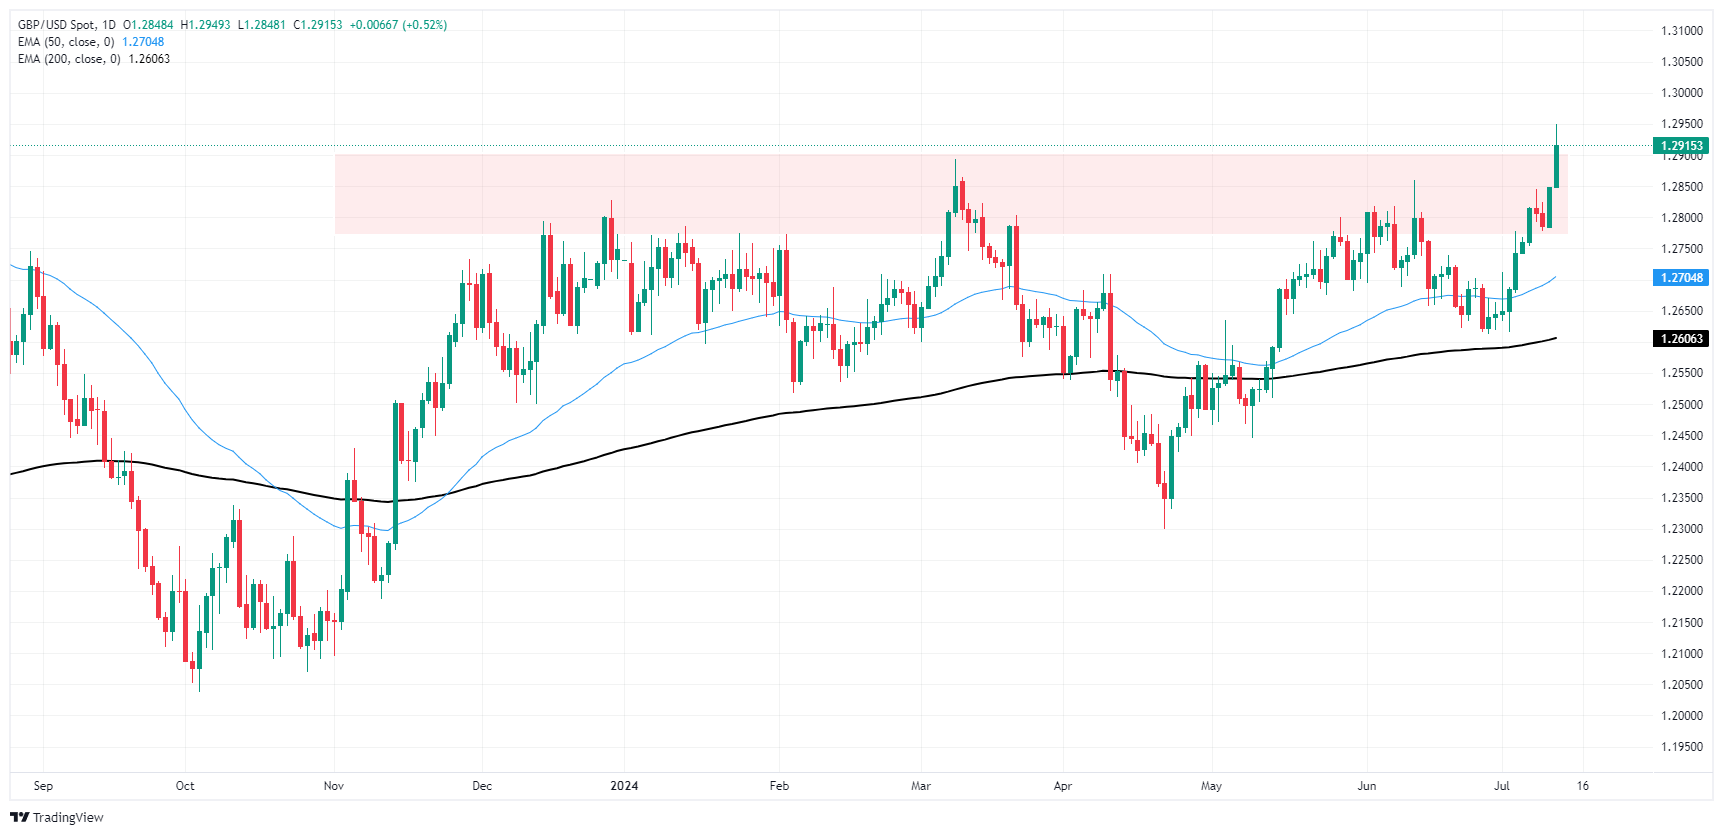
Pound Sterling FAQs
The Pound Sterling (GBP) is the oldest currency in the world (886 AD) and the official currency of the United Kingdom. It is the fourth most traded unit for foreign exchange (FX) in the world, accounting for 12% of all transactions, averaging $630 billion a day, according to 2022 data. Its key trading pairs are GBP/USD, aka ‘Cable’, which accounts for 11% of FX, GBP/JPY, or the ‘Dragon’ as it is known by traders (3%), and EUR/GBP (2%). The Pound Sterling is issued by the Bank of England (BoE).
The single most important factor influencing the value of the Pound Sterling is monetary policy decided by the Bank of England. The BoE bases its decisions on whether it has achieved its primary goal of “price stability” – a steady inflation rate of around 2%. Its primary tool for achieving this is the adjustment of interest rates. When inflation is too high, the BoE will try to rein it in by raising interest rates, making it more expensive for people and businesses to access credit. This is generally positive for GBP, as higher interest rates make the UK a more attractive place for global investors to park their money. When inflation falls too low it is a sign economic growth is slowing. In this scenario, the BoE will consider lowering interest rates to cheapen credit so businesses will borrow more to invest in growth-generating projects.
Data releases gauge the health of the economy and can impact the value of the Pound Sterling. Indicators such as GDP, Manufacturing and Services PMIs, and employment can all influence the direction of the GBP. A strong economy is good for Sterling. Not only does it attract more foreign investment but it may encourage the BoE to put up interest rates, which will directly strengthen GBP. Otherwise, if economic data is weak, the Pound Sterling is likely to fall.
Another significant data release for the Pound Sterling is the Trade Balance. This indicator measures the difference between what a country earns from its exports and what it spends on imports over a given period. If a country produces highly sought-after exports, its currency will benefit purely from the extra demand created from foreign buyers seeking to purchase these goods. Therefore, a positive net Trade Balance strengthens a currency and vice versa for a negative balance.
- NZD/USD trades on a weaker note around 0.6090 in Friday’s early Asian session.
- Odds of Fed rate cuts are growing after the softer-than-expected June US CPI inflation report.
- The RBNZ's dovish monetary policy statement undermines the Kiwi against the USD.
The NZD/USD pair trims gains near 0.6090 during the early Asian session on Friday. The pair loses traction after retreating from the previous session high of nearly 0.6135. Later on Friday, investors will keep an eye on the US June Producer Price Index (PPI) and the preliminary Michigan Consumer Sentiment gauge.
Data released by the US Bureau of Labor Statistics (BLS) on Thursday showed that the US Consumer Price Index (CPI) rose 3.0% on a yearly basis in June, compared to a rise of 3.3% in May. This reading came in below the market consensus of 3.1%. Meanwhile, the annual core CPI, which excludes volatile food and energy prices, climbed 3.3% YoY in June, below the forecast and May's increase of 3.4%. On a monthly basis, the CPI declined 0.1%, while the core CPI was up 0.1%.
The softer US inflation data has triggered the expectation that the US Federal Reserve (Fed) would lower its borrowing costs this year, which might weigh on the US Dollar (USD) in the near term. Investors are now pricing in a nearly 89% chance of a September Fed meeting rate cut, from 73% on Wednesday and around 50% a week ago, according to CME Group’s FedWatch Tool.
On the other hand, a less hawkish stance of the Reserve Bank of New Zealand (RBNZ) is likely to exert some selling pressure on the New Zealand Dollar (NZD) for the time being. The central bank left its Official Cash Rate (OCR) unchanged for the eighth consecutive meeting at 5.5% on Wednesday, as expected but hinted at possible rate cuts in August if inflation decreases as expected.
New Zealand Dollar FAQs
The New Zealand Dollar (NZD), also known as the Kiwi, is a well-known traded currency among investors. Its value is broadly determined by the health of the New Zealand economy and the country’s central bank policy. Still, there are some unique particularities that also can make NZD move. The performance of the Chinese economy tends to move the Kiwi because China is New Zealand’s biggest trading partner. Bad news for the Chinese economy likely means less New Zealand exports to the country, hitting the economy and thus its currency. Another factor moving NZD is dairy prices as the dairy industry is New Zealand’s main export. High dairy prices boost export income, contributing positively to the economy and thus to the NZD.
The Reserve Bank of New Zealand (RBNZ) aims to achieve and maintain an inflation rate between 1% and 3% over the medium term, with a focus to keep it near the 2% mid-point. To this end, the bank sets an appropriate level of interest rates. When inflation is too high, the RBNZ will increase interest rates to cool the economy, but the move will also make bond yields higher, increasing investors’ appeal to invest in the country and thus boosting NZD. On the contrary, lower interest rates tend to weaken NZD. The so-called rate differential, or how rates in New Zealand are or are expected to be compared to the ones set by the US Federal Reserve, can also play a key role in moving the NZD/USD pair.
Macroeconomic data releases in New Zealand are key to assess the state of the economy and can impact the New Zealand Dollar’s (NZD) valuation. A strong economy, based on high economic growth, low unemployment and high confidence is good for NZD. High economic growth attracts foreign investment and may encourage the Reserve Bank of New Zealand to increase interest rates, if this economic strength comes together with elevated inflation. Conversely, if economic data is weak, NZD is likely to depreciate.
The New Zealand Dollar (NZD) tends to strengthen during risk-on periods, or when investors perceive that broader market risks are low and are optimistic about growth. This tends to lead to a more favorable outlook for commodities and so-called ‘commodity currencies’ such as the Kiwi. Conversely, NZD tends to weaken at times of market turbulence or economic uncertainty as investors tend to sell higher-risk assets and flee to the more-stable safe havens.
- NZD/JPY ended Thursday's session with a significant decline.
- The bears successfully pushed the pair below the crucial 20-day SMA, signaling a shift in command.
In Thursday's trading session, the NZD/JPY pair dropped substantially, losing 1.40% to land at 96.80. The pair slipped below the 20-day Simple Moving Average (SMA) of 97.70, indicating a negative outlook in the short-term as the outlook is now somewhat bearish at least for the short-term.
On the daily chart, the Relative Strength Index (RSI) plummeted to 44. This swift shift towards negative territory suggests a decline in market momentum, and it is important to note that the RSI shifted from nearly overbought terrain to below the middle point. The Moving Average Convergence Divergence (MACD) also adds weight to this bearish scenario, registering rising red bars indicative of decreased buying momentum.
NZD/JPY daily chart
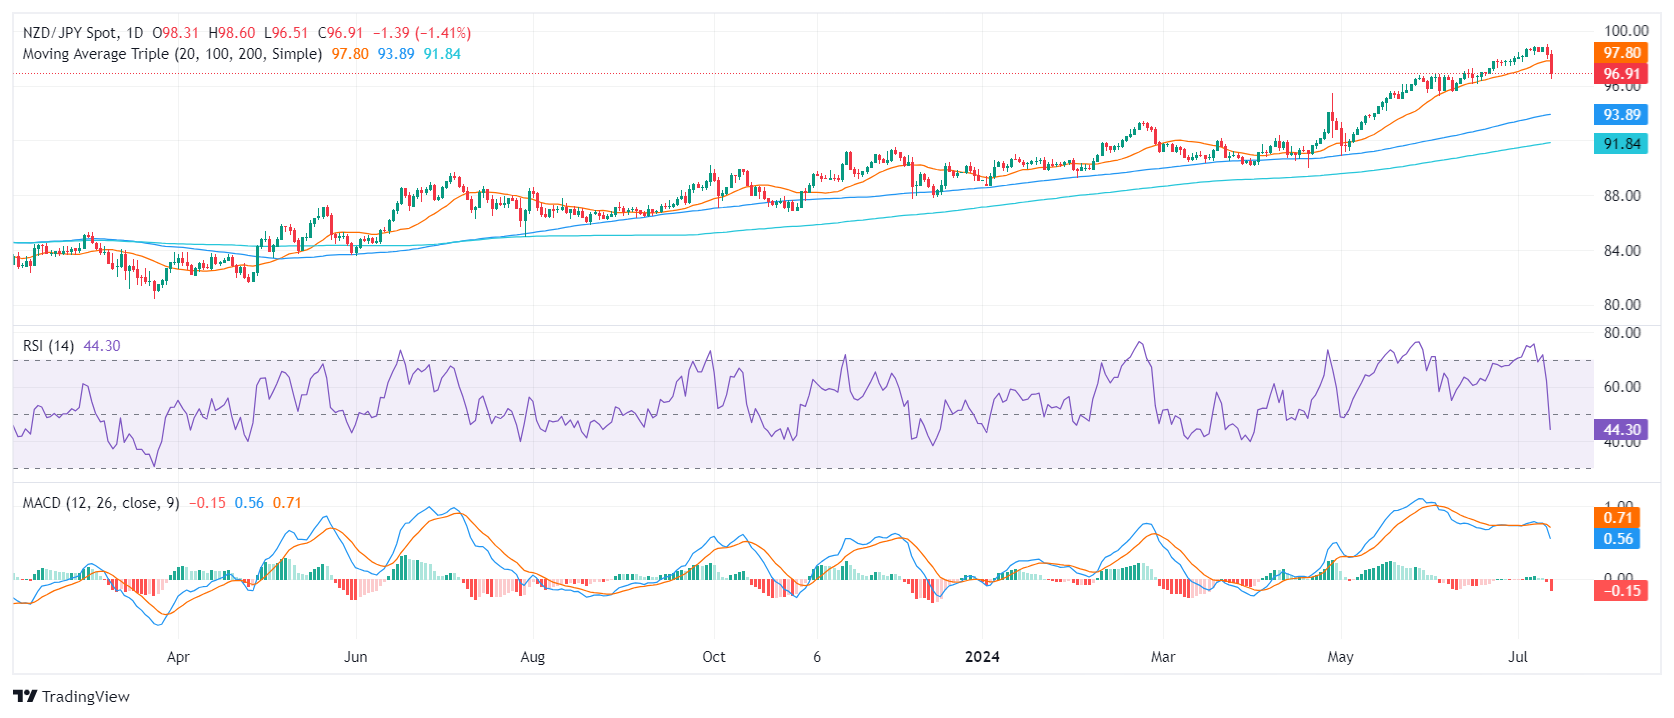
In light of the bearish turn, immediate support levels are now set at 96.50, 96.00, and further down to 95.00. In contrast, resistance is now likely to be encountered at previous support levels of 97.00, 97.70 (20-day SMA), and 98.00.
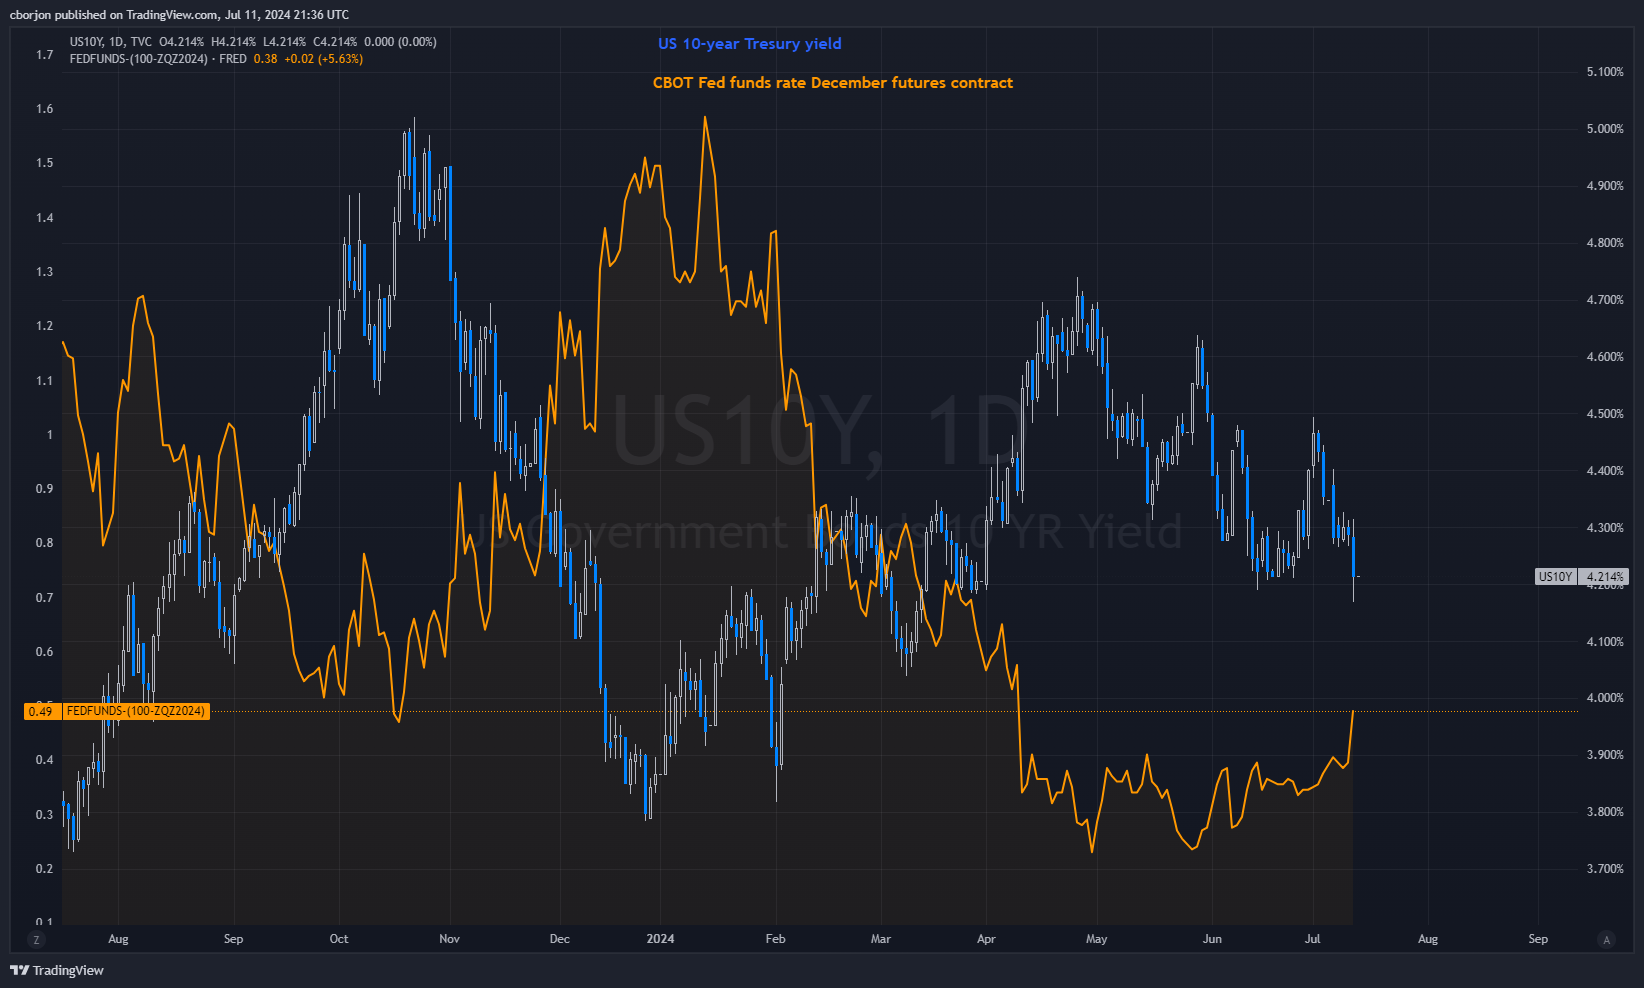
- US 10-year Treasury yield drops to 4.214% following unexpected -0.1% MoM contraction in June CPI.
- Core CPI increases by just 0.1% MoM, bolstering predictions for Fed rate cuts beginning September 2024.
- Gold exceeds $2,400 and Silver ascends past $31.00 as traders forecast 49 bps of easing by December 2024.
US Treasury bond yields tanked on Thursday after the US Bureau of Labor Statistics (BLS) revealed a surprise fall in inflation before Wall Street opened. This reinforced speculation that the Federal Reserve could start lowering interest rates in 2024, and according to data, traders target September as the first cut.
US CPI drop boosts Gold and Silver prices amid strengthening rate cut bets
The Consumer Price Index (CPI) for June contracted by -0.1% Month over Month, below estimates of a 0.1% increase. Underlying inflation, as measured by Core CPI, rose by 0.1% Month over Month, also beneath the consensus and May’s data.
Annual readings were also lower, as CPI fell from 3.3% to 3%, while core inflation dipped from 3.4% to 3.3%.
Other data showed the labor market remains robust as Initial Jobless Claims for the week ending July 6 came in better than expected at 222K, below the consensus of 236K and the previous reading of 239K. This highlights the labor market's strength, though data released during the day reaffirmed a Goldilocks scenario.
After the data, the odds of a September Fed rate cut have increased to 84%, up from 72% on Wednesday, via the CME FedWatch Tool,
The US 10-year Treasury bond yield plunged seven and a half basis points to 4.214%, though it hit its lowest level since March earlier at 4.168%. This pushed Gold prices above $2,400 and Silver above $31.00 a troy ounce, each.
Data from the Chicago Board of Trade (CBOT) shows that traders expect 49 basis points (bps) of easing, according to December’s 2024 fed funds rate futures contract.
Fed FAQs
Monetary policy in the US is shaped by the Federal Reserve (Fed). The Fed has two mandates: to achieve price stability and foster full employment. Its primary tool to achieve these goals is by adjusting interest rates. When prices are rising too quickly and inflation is above the Fed’s 2% target, it raises interest rates, increasing borrowing costs throughout the economy. This results in a stronger US Dollar (USD) as it makes the US a more attractive place for international investors to park their money. When inflation falls below 2% or the Unemployment Rate is too high, the Fed may lower interest rates to encourage borrowing, which weighs on the Greenback.
The Federal Reserve (Fed) holds eight policy meetings a year, where the Federal Open Market Committee (FOMC) assesses economic conditions and makes monetary policy decisions. The FOMC is attended by twelve Fed officials – the seven members of the Board of Governors, the president of the Federal Reserve Bank of New York, and four of the remaining eleven regional Reserve Bank presidents, who serve one-year terms on a rotating basis.
In extreme situations, the Federal Reserve may resort to a policy named Quantitative Easing (QE). QE is the process by which the Fed substantially increases the flow of credit in a stuck financial system. It is a non-standard policy measure used during crises or when inflation is extremely low. It was the Fed’s weapon of choice during the Great Financial Crisis in 2008. It involves the Fed printing more Dollars and using them to buy high grade bonds from financial institutions. QE usually weakens the US Dollar.
Quantitative tightening (QT) is the reverse process of QE, whereby the Federal Reserve stops buying bonds from financial institutions and does not reinvest the principal from the bonds it holds maturing, to purchase new bonds. It is usually positive for the value of the US Dollar.
- USD/JPY plummeted 2.6% top-to-bottom after US CPI inflation eased in June.
- Strong signs of direct market invention in Yen markets, but no confirmation.
- Market anticipation for a September Fed rate cut is pinned to the ceiling.
USD/JPY plummeted on Thursday, declining 2.6% in a sharp reaction to cooling US Consumer Price Index (CPI) inflation and a broadly suspected “Yentervention” by the Bank of Japan (BoJ) to prop up the floundering JPY.
June’s US CPI inflation broadly fell below forecasts, with annualized headline CPI inflation easing to 3.0% YoY from the previous 3.3% and falling even lower than the forecast 3.1%. CPI inflation actually contracted -0.1% MoM in June, falling back from the previous month’s flat 0.0% and below the forecast 0.1%.
US Initial Jobless Claims fell to 222K for the week ended July 5, down from the previous week’s revised 239K and improving from the forecast 236K. Thursday’s Initial Jobless Claims figure helped to push the four-week average down to 233.5K from the previous 238.75K.
With US CPI inflation cooling at an accelerated pace, market expectations for a rate hike from the Federal Reserve (Fed) are pricing in the possibility of three quarter-point rate cuts in 2024. According to the CME’s FedWatch Tool, rate market bets of a September rate cut have soared to 95%.
According to unconfirmed rumors citing unnamed officials within the Japanese government, a ‘Yentervention’ was timed with the release of US CPI inflation figures, sending the Yen broadly higher across the board on Thursday. In a repeat of previous Yenterventions, any official confirmation or denial is unlikely to come from BoJ or Ministry of Finance officials for several weeks.
USD/JPY technical outlook
USD/JPY took a steep dive on Thursday, briefly testing below the 50-day Exponential Moving Average (EMA) at 157.97 before a half-hearted recovery. The pair is still sharply down from the day’s opening bids, but a long-running bull trend that has dragged USD/JPY to multi-decade highs has left the pair buried deep in bull country.
USD/JPY is still trading well above the 200-day EMA at 151.81, and Thursday’s bearish plunge is unlikely to cause a meaningful shift in the long-term trend.
USD/JPY daily chart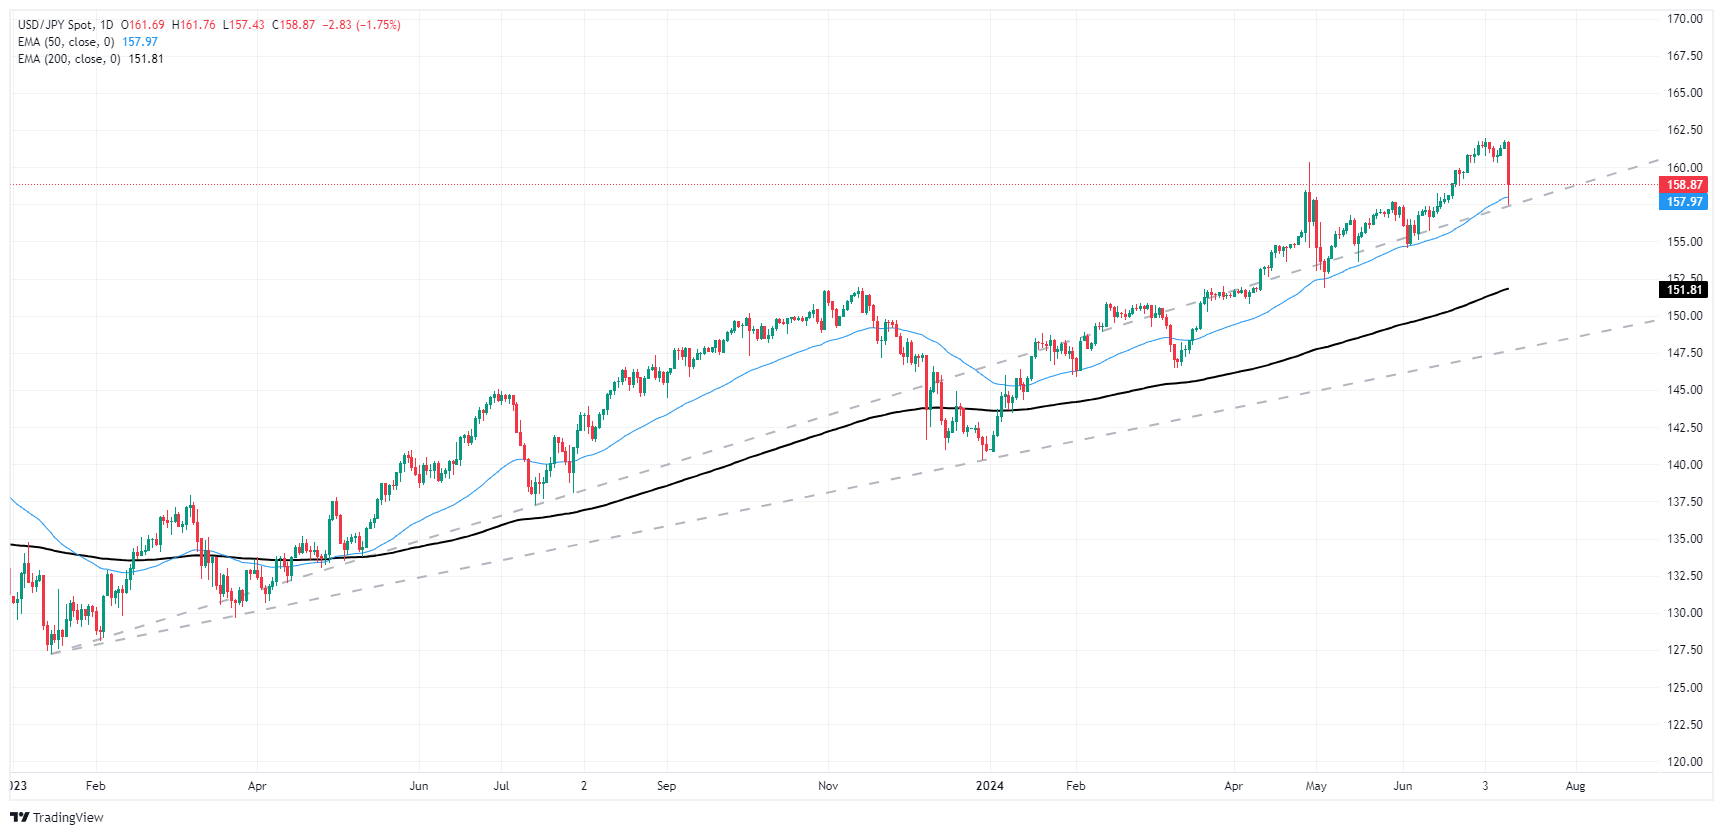
Japanese Yen FAQs
The Japanese Yen (JPY) is one of the world’s most traded currencies. Its value is broadly determined by the performance of the Japanese economy, but more specifically by the Bank of Japan’s policy, the differential between Japanese and US bond yields, or risk sentiment among traders, among other factors.
One of the Bank of Japan’s mandates is currency control, so its moves are key for the Yen. The BoJ has directly intervened in currency markets sometimes, generally to lower the value of the Yen, although it refrains from doing it often due to political concerns of its main trading partners. The current BoJ ultra-loose monetary policy, based on massive stimulus to the economy, has caused the Yen to depreciate against its main currency peers. This process has exacerbated more recently due to an increasing policy divergence between the Bank of Japan and other main central banks, which have opted to increase interest rates sharply to fight decades-high levels of inflation.
The BoJ’s stance of sticking to ultra-loose monetary policy has led to a widening policy divergence with other central banks, particularly with the US Federal Reserve. This supports a widening of the differential between the 10-year US and Japanese bonds, which favors the US Dollar against the Japanese Yen.
The Japanese Yen is often seen as a safe-haven investment. This means that in times of market stress, investors are more likely to put their money in the Japanese currency due to its supposed reliability and stability. Turbulent times are likely to strengthen the Yen’s value against other currencies seen as more risky to invest in.
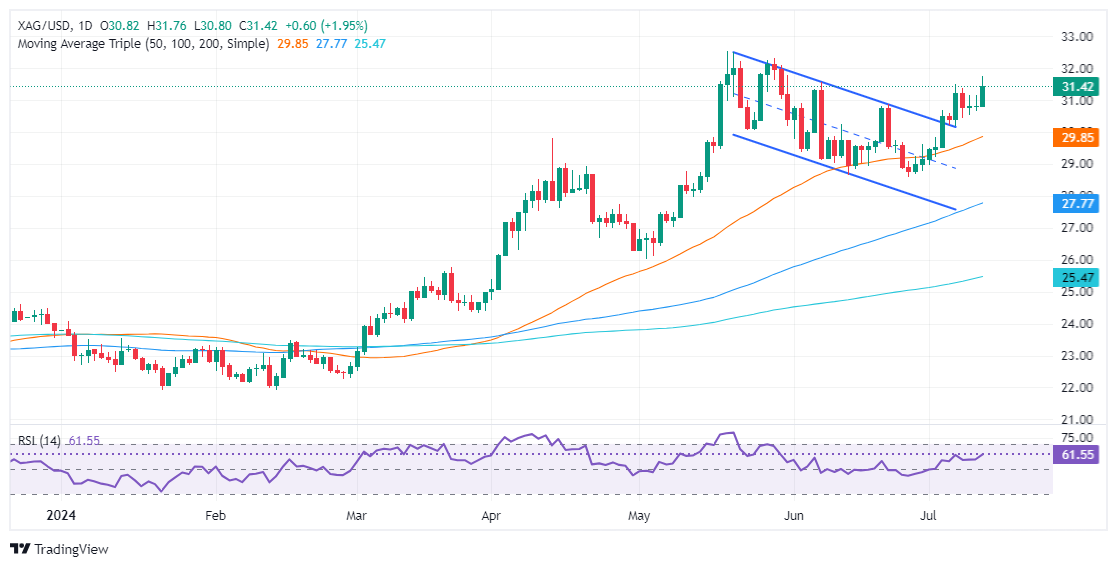
- Silver breaks $30.73 neckline, surges past $31.00 to trade at $31.40.
- Bullish momentum affirmed by RSI, with resistance at $31.75, $32.00, and $32.51 (YTD high).
- Key support levels: $31.00, $30.73 (June 21 high), and $29.82/79 (50-DMA) for potential pullbacks.
Silver price confirmed a ‘double bottom’ chart pattern, sponsored by weaker than expected US inflation data, that puts back into the table discussion about when the Federal Reserve would begin to ease monetary policy. Therefore, the XAG/USD trades at $31.40, moving up more than 2%.
XAG/USD Price Analysis: Technical outlook
The grey metal finally cleared the ‘double bottom’ neckline at $30.73, which opened the door for Thursday’s rally above the $31.00 figure. It hit a six-week high of $31.75 before settling at around current spot prices.
Momentum shows buyers are regaining control, as depicted in the Relative Strength Index (RSI). This opens the door for further upside in the XAG/USD.
Silver’s next resistance would be $31.75, followed by the $32.00 psychological figures. Once surpassed, the May 29 peak of $32.15 emerges, ahead of the year-to-date (YTD) high at $32.51. Further gains are seen above the latter.
Conversely, if XAG/USD spot price tumbles beneath $31.00, that could exacerbate a pullback. The next demand zone will be the June 21 high at $30.73, followed by the $30.00 mark. Up next, sellers will test the confluence of the April 12 high and the 50-day moving average (DMA) at $29.82/79.
XAG/USD Price Action – Daily Chart
Silver FAQs
Silver is a precious metal highly traded among investors. It has been historically used as a store of value and a medium of exchange. Although less popular than Gold, traders may turn to Silver to diversify their investment portfolio, for its intrinsic value or as a potential hedge during high-inflation periods. Investors can buy physical Silver, in coins or in bars, or trade it through vehicles such as Exchange Traded Funds, which track its price on international markets.
Silver prices can move due to a wide range of factors. Geopolitical instability or fears of a deep recession can make Silver price escalate due to its safe-haven status, although to a lesser extent than Gold's. As a yieldless asset, Silver tends to rise with lower interest rates. Its moves also depend on how the US Dollar (USD) behaves as the asset is priced in dollars (XAG/USD). A strong Dollar tends to keep the price of Silver at bay, whereas a weaker Dollar is likely to propel prices up. Other factors such as investment demand, mining supply – Silver is much more abundant than Gold – and recycling rates can also affect prices.
Silver is widely used in industry, particularly in sectors such as electronics or solar energy, as it has one of the highest electric conductivity of all metals – more than Copper and Gold. A surge in demand can increase prices, while a decline tends to lower them. Dynamics in the US, Chinese and Indian economies can also contribute to price swings: for the US and particularly China, their big industrial sectors use Silver in various processes; in India, consumers’ demand for the precious metal for jewellery also plays a key role in setting prices.
Silver prices tend to follow Gold's moves. When Gold prices rise, Silver typically follows suit, as their status as safe-haven assets is similar. The Gold/Silver ratio, which shows the number of ounces of Silver needed to equal the value of one ounce of Gold, may help to determine the relative valuation between both metals. Some investors may consider a high ratio as an indicator that Silver is undervalued, or Gold is overvalued. On the contrary, a low ratio might suggest that Gold is undervalued relative to Silver.
- AUD/JPY sharply declined by more than 1.50%.
- The RSI fell non-stop from the deep overbought region near its middle point.
During Thursday's trading session, the AUD/JPY pair witnessed sharp losses towards 107.30. Overall, the pair is generally taking a pause as buyers hold off, and given the pair's status in the multi-year, the probability of further corrections is imminent. However, indicators scaped overbought conditions which is healthy for the pair.
On the daily view, the Relative Strength Index (RSI) for AUDJPY plunged to nearly 56, non-stop from the 70 threshold. Concurrently, the Moving Average Convergence Divergence (MACD) portrays a declining green bars scenario, mimicking a tapering off of the existing bullish momentum.
AUD/JPY daily chart
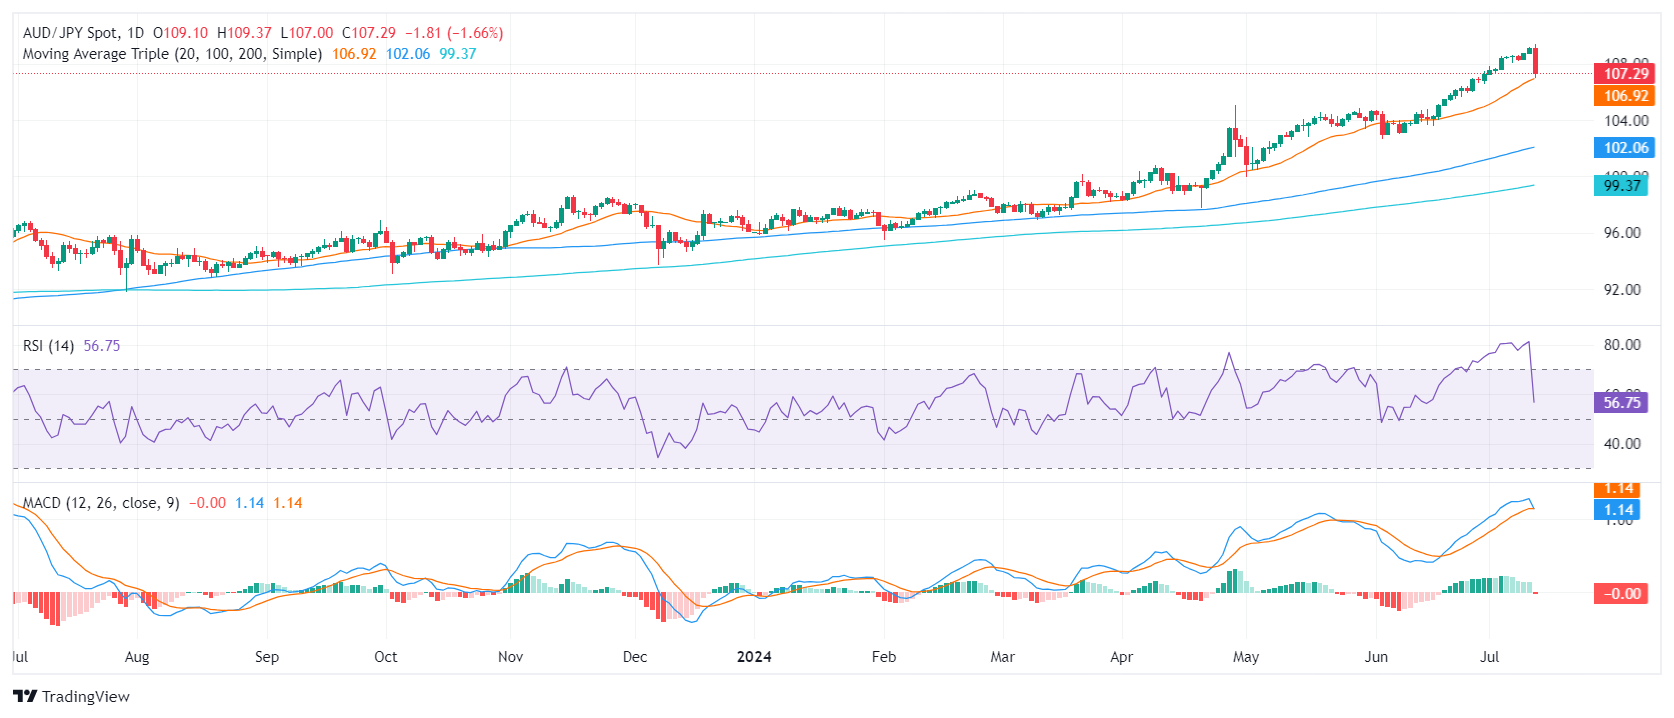
From the broader perspective, the AUD/JPY pair continues to exhibit signs of a potent bullish sentiment backed by its position in multi-year highs and above its main Simple Moving Averages (SMAs). In case of further pullbacks, several key supports line up below 107.00 where the 20-day SMA converges. The 106.50 and 106.00 could come into play to limit losses. However, should the pair sustain buyer interest, the pair might seek a retest around the 107.00-109.00 area.
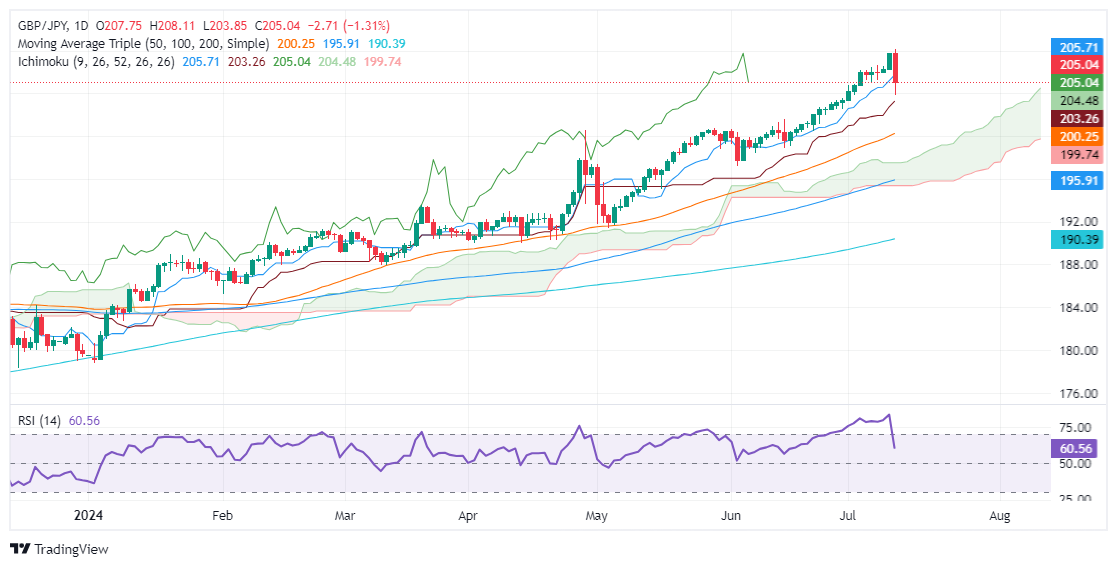
- GBP/JPY experiences volatility, peaking at 208.11, then dips to 203.82, settling at 204.99.
- Downward momentum observed; support at 203.25 (Kijun-Sen) and 200.16 (50-DMA).
- Resistance positioned at 205.00 and 205.64 (Tenkan-Sen); breach could signal recovery.
The Pound-Yen pair witnessed a volatile session amid speculation of Japanese authorities' intervention after the latest US inflation report announcement. The GBP/JPY traveled 425 pips in the session, hitting a high of 208.11 before plummeting toward 203.82. Since then, the cross stabilized at around the 204.99 mark, sustaining more than 1.20% losses.
GBP/JPY Price Analysis: Technical outlook
The GBP/JPY daily chart shows the pair as upward biased, even though it cleared the Tenkan-Sen level at 205.64, which accelerated the pair’s fall underneath the Senkou Span A at 204.45. Nevertheless, it has recovered some ground, though in the near term, momentum supports sellers.
The Relative Strength Index (RSI) remains bullish but shows a steeper slope to the downside at the time of writing, hinting that bears loom.
In a bearish continuation, sellers must push the prices below the abovementioned Senkou Span A, which could pave the way to test the Kijun-Sen at 203.25. A further downside is seen at the 50-day moving average (DMA) at 200.16, ahead of the Senkou Span B at 199.3.
Conversely, if GBP/JPY recovers some ground and clears 205.00, further gains lie ahead. The cross could aim towards the Tenkan-Sen at 205.64 before challenging 206.00.
GBP/JPY Price Action – Daily Chart
Pound Sterling FAQs
The Pound Sterling (GBP) is the oldest currency in the world (886 AD) and the official currency of the United Kingdom. It is the fourth most traded unit for foreign exchange (FX) in the world, accounting for 12% of all transactions, averaging $630 billion a day, according to 2022 data. Its key trading pairs are GBP/USD, aka ‘Cable’, which accounts for 11% of FX, GBP/JPY, or the ‘Dragon’ as it is known by traders (3%), and EUR/GBP (2%). The Pound Sterling is issued by the Bank of England (BoE).
The single most important factor influencing the value of the Pound Sterling is monetary policy decided by the Bank of England. The BoE bases its decisions on whether it has achieved its primary goal of “price stability” – a steady inflation rate of around 2%. Its primary tool for achieving this is the adjustment of interest rates. When inflation is too high, the BoE will try to rein it in by raising interest rates, making it more expensive for people and businesses to access credit. This is generally positive for GBP, as higher interest rates make the UK a more attractive place for global investors to park their money. When inflation falls too low it is a sign economic growth is slowing. In this scenario, the BoE will consider lowering interest rates to cheapen credit so businesses will borrow more to invest in growth-generating projects.
Data releases gauge the health of the economy and can impact the value of the Pound Sterling. Indicators such as GDP, Manufacturing and Services PMIs, and employment can all influence the direction of the GBP. A strong economy is good for Sterling. Not only does it attract more foreign investment but it may encourage the BoE to put up interest rates, which will directly strengthen GBP. Otherwise, if economic data is weak, the Pound Sterling is likely to fall.
Another significant data release for the Pound Sterling is the Trade Balance. This indicator measures the difference between what a country earns from its exports and what it spends on imports over a given period. If a country produces highly sought-after exports, its currency will benefit purely from the extra demand created from foreign buyers seeking to purchase these goods. Therefore, a positive net Trade Balance strengthens a currency and vice versa for a negative balance.
The Greenback collapsed in response to the softer-than-expected US inflation readings in June, at the time when investors now see the Fed cutting rates as soon as at its September gathering.
Here is what you need to know on Friday, July 12:
The USD Index (DXY) deflated to multi-week lows and visited the 104.00 region in the wake of disappointing US CPI data and declining US yields. Producer Prices and the preliminary Michigan Consumer Sentiment gauge will take centre stage on July 12.
EUR/USD rose further and managed to finally retest the 1.0900 region, although that move fizzled out somewhat afterwards. German Wholesale Prices and Current Account results are expected on July 12.
GBP/USD advanced to levels last seen a year ago near 1.2950 following the sell-off in the Greenback. There are no scheduled releases in the UK on July 12.
USD/JPY receded to monthly lows and approached the 157.00 zone following another suspected FX intervention move by Japanese officials. The final Industrial Production results will be released on July 12.
AUD/USD extended its monthly recovery and climbed to levels just pips away from the 0.6800 hurdle. The Australian calendar will be empty on July 12.
The weaker Dollar and market chatter around rate cuts by the Fed prompted prices of WTI to add to Wednesday’s gains beyond the $83.00 mark per barrel.
Prices of Gold advanced markedly and surpassed the $2,420 mark per ounce troy amidst the Dollar’s sell-off, diminishing yields and increasing rate cut bets. By the same token, Silver improved to the vicinity of the $32.00 mark per ounce, or six-week highs.
- Gold skyrockets above $2,400 after softer US CPI sparks hopes for Fed rate cuts in 2024.
- US 10-year Treasury yield drops 10 basis points to 4.187%, boosting Gold’s appeal.
- CME FedWatch Tool shows 85% odds for September rate cut; US Dollar Index falls to 104.48.
Gold prices skyrocketed sharply during Thursday’s North American session after the release of the Consumer Price Index (CPI) in the United States opened the door for the Federal Reserve (Fed) to lower borrowing costs. Hence, US Treasury yields tanked, a tailwind for the precious metal. The XAU/USD trades at $2,414, up more than 1.80% after bouncing off daily lows of $2,371.
Market sentiment shifted sour as the S&P 500 and the Nasdaq 100 sank sharply, while the Dow Jones Industrial advanced. US yields are collapsing with the 10-year Treasury note yield down 10 basis points to 4.187%.
Data from the US Bureau of Labor Statistics (BLS) revealed that consumer prices deflated in June. Excluding volatile items like food and energy, the so-called core dipped as well, reigniting hopes that the Fed could cut rates in 2024.
The CME FedWatch Tool shows 85% odds for a quarter-point percentage rate cut in September, up from Wednesday’s 70% chances.
The December 2024 fed funds rate futures contract implies that the Fed will ease policy by 49 basis points (bps) toward the end of the year, up from 39 a day ago.
Other data showed the labor market remains robust as the number of Americans filing for unemployment benefits missed the consensus and came in lower than the previous reading.
Today's US data presents a balanced Goldilocks scenario: inflation is decreasing while employment remains strong, with no signs of an impending recession.
Meanwhile, the US Dollar Index (DXY), which tracks the value of a basket of six currencies against the US Dollar, plummeted more than 0.40% and is down at 104.48.
Ahead of the week, the US economic schedule will feature the Producer Price Index (PPI) for June and the University of Michigan Consumer Sentiment survey for the same period.
Daily digest market movers: Gold soars due to Fed rate cut hopes
- June US Consumer Price Index (CPI) contracted by -0.1% MoM, missing the forecast of a 0.1% increase. Core CPI also ticked lower from 0.2% in May to 0.1% in June, aligned with estimates.
- Over the 12 months to June, headline US inflation dropped to 3%, down from 3.3%, while core inflation slumped to 3.3%, below estimates and down from the previous month's 3.4%.
- Initial Jobless Claims for the week ending July 6 came in better than expected at 222K, below the consensus of 236K and the previous reading of 239K.
- According to the CME FedWatch Tool, odds of a September rate cut have increased to 84%, up from 72% on Wednesday.
- Bullion prices retreated somewhat due to the People’s Bank of China’s (PBoC) decision to halt Gold purchases in June as it did in May. China held 72.80 million troy ounces of the precious metal at the end of June.
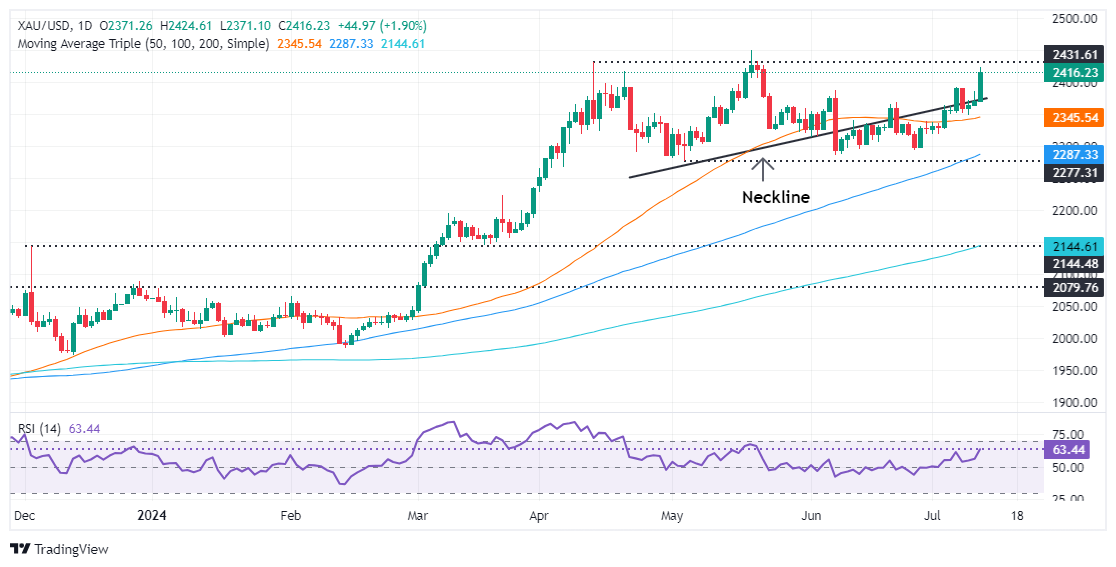
Technical analysis: Gold price climbs above $2,400, invalidates Head-and-Shoulders
Gold price resumed its aggressive uptrend and decisively broke the Head-and-Shoulders neckline, invalidating the chart pattern and opening the door for higher prices. Momentum remains on the buyers' side, with the Relative Strength Index (RSI) finally showing signs of direction, trending up.
That said, the path of least resistance is to the upside. The XAU/USD first resistance would be the year-to-date high of $2,450, ahead of the $2,500 mark. Conversely, if Gold slides below the $2,400 figure, the next demand zone will be the July 5 high at $2,392. If cleared, XAU/USD would continue to $2,350
Gold FAQs
Gold has played a key role in human’s history as it has been widely used as a store of value and medium of exchange. Currently, apart from its shine and usage for jewelry, the precious metal is widely seen as a safe-haven asset, meaning that it is considered a good investment during turbulent times. Gold is also widely seen as a hedge against inflation and against depreciating currencies as it doesn’t rely on any specific issuer or government.
Central banks are the biggest Gold holders. In their aim to support their currencies in turbulent times, central banks tend to diversify their reserves and buy Gold to improve the perceived strength of the economy and the currency. High Gold reserves can be a source of trust for a country’s solvency. Central banks added 1,136 tonnes of Gold worth around $70 billion to their reserves in 2022, according to data from the World Gold Council. This is the highest yearly purchase since records began. Central banks from emerging economies such as China, India and Turkey are quickly increasing their Gold reserves.
Gold has an inverse correlation with the US Dollar and US Treasuries, which are both major reserve and safe-haven assets. When the Dollar depreciates, Gold tends to rise, enabling investors and central banks to diversify their assets in turbulent times. Gold is also inversely correlated with risk assets. A rally in the stock market tends to weaken Gold price, while sell-offs in riskier markets tend to favor the precious metal.
The price can move due to a wide range of factors. Geopolitical instability or fears of a deep recession can quickly make Gold price escalate due to its safe-haven status. As a yield-less asset, Gold tends to rise with lower interest rates, while higher cost of money usually weighs down on the yellow metal. Still, most moves depend on how the US Dollar (USD) behaves as the asset is priced in dollars (XAU/USD). A strong Dollar tends to keep the price of Gold controlled, whereas a weaker Dollar is likely to push Gold prices up.
- AUD continued its upswing on Thursday against USD.
- Markets adjust their stance on the Federal Reserve following US inflation figures.
- RBA's reluctance to initiate rate cuts due to stubbornly high inflation provides stable support for Aussie.
The Australian Dollar (AUD) carried on with its positive trend against the USD on Thursday, rising to 0.6780 after hitting a high of 0.6798. Despite an empty Australian financial calendar this week with no significant events, the pair still holds its ground with the AUD resuming its recent gains. Market participants are adjusting their bets on the next moves from the Federal Reserve (Fed) following the release of US inflation data.
The Reserve Bank of Australia (RBA) is gearing to be among the last G10 nations' central banks to initiate rate cuts, a factor that may extend the AUD's gains. High inflation within Australia is prompting the RBA to postpone rate cuts, which may limit the downside for the AUD.
Daily market movers: AUD holds as markets adjust to US inflation figures
- US inflation, measured by the annual change in the Consumer Price Index (CPI), fell to 3% in June from 3.3% in May, as reported by the US Bureau of Labor Statistics (BLS) on Wednesday, lower than expected.
- Core measure also came in below the market's forecast at 3.3% YoY.
- This validates the market's prediction of an earlier cut in September, and as RBA and Fed policies diverge, the upside for the pair is open-ended.
- Fed Chair Jerome Powell on Thursday kept a cautious tone on inflation during his testimony before the House Financial Services Committee. He reaffirmed that while inflation does not need to fall below the 2% mark to begin rate cuts, Fed still lacks firm confidence to lower rates soon.
- While RBA considers a hike and the market braces for a Fed cut, Aussie might see additional gains.
Technical analysis: AUD/USD’s rising streak continues, consolidation anticipated
The AUD/USD remains on a bullish path, resulting in the pair making gains on Thursday. The outlook remains positive, with indicators including the Relative Strength Index (RSI) and Moving Average Convergence Divergence (MACD) staying strong in deeply positive territory. While consolidation is possible, the pair may have some room left to continue rising before correcting.
The support levels to monitor in case of a pullback are 0.6670, 0.6650 and 0.6630 in case of a correction. The 0.6760-0.6780 range is the aspirational target for buyers, with the region beyond 0.6800 also in sight.
Australian Dollar FAQs
One of the most significant factors for the Australian Dollar (AUD) is the level of interest rates set by the Reserve Bank of Australia (RBA). Because Australia is a resource-rich country another key driver is the price of its biggest export, Iron Ore. The health of the Chinese economy, its largest trading partner, is a factor, as well as inflation in Australia, its growth rate and Trade Balance. Market sentiment – whether investors are taking on more risky assets (risk-on) or seeking safe-havens (risk-off) – is also a factor, with risk-on positive for AUD.
The Reserve Bank of Australia (RBA) influences the Australian Dollar (AUD) by setting the level of interest rates that Australian banks can lend to each other. This influences the level of interest rates in the economy as a whole. The main goal of the RBA is to maintain a stable inflation rate of 2-3% by adjusting interest rates up or down. Relatively high interest rates compared to other major central banks support the AUD, and the opposite for relatively low. The RBA can also use quantitative easing and tightening to influence credit conditions, with the former AUD-negative and the latter AUD-positive.
China is Australia’s largest trading partner so the health of the Chinese economy is a major influence on the value of the Australian Dollar (AUD). When the Chinese economy is doing well it purchases more raw materials, goods and services from Australia, lifting demand for the AUD, and pushing up its value. The opposite is the case when the Chinese economy is not growing as fast as expected. Positive or negative surprises in Chinese growth data, therefore, often have a direct impact on the Australian Dollar and its pairs.
Iron Ore is Australia’s largest export, accounting for $118 billion a year according to data from 2021, with China as its primary destination. The price of Iron Ore, therefore, can be a driver of the Australian Dollar. Generally, if the price of Iron Ore rises, AUD also goes up, as aggregate demand for the currency increases. The opposite is the case if the price of Iron Ore falls. Higher Iron Ore prices also tend to result in a greater likelihood of a positive Trade Balance for Australia, which is also positive of the AUD.
The Trade Balance, which is the difference between what a country earns from its exports versus what it pays for its imports, is another factor that can influence the value of the Australian Dollar. If Australia produces highly sought after exports, then its currency will gain in value purely from the surplus demand created from foreign buyers seeking to purchase its exports versus what it spends to purchase imports. Therefore, a positive net Trade Balance strengthens the AUD, with the opposite effect if the Trade Balance is negative.
- Dow Jones stuck to Thursday’s opening range after CPI inflation cools.
- Rate cut expectations pinned to the ceiling as price pressures ease.
- Market-wide pivot out of tech stocks limits gains from rate cut hopes.
The Dow Jones Industrial Average (DJIA) mostly stuck to familiar territory on Thursday, clipping into the high end after US Consumer Price Index (CPI) inflation came in below expectations and sparking an uptick in broad-market rate cut expectations in 2024. Despite easing inflation, a pivot out of tech stocks kept equity indexes pinned close to flat during Thursday’s American market session.
June’s US CPI inflation broadly fell below forecasts, with annualized headline CPI inflation easing to 3.0% YoY from the previous 3.3% and falling even lower than the forecast 3.1%. CPI inflation actually contracted -0.1% MoM in June, falling back from the previous month’s flat 0.0% and below the forecast 0.1%.
US Initial Jobless Claims fell to 222K for the week ended July 5, down from the previous week’s revised 239K and improving from the forecast 236K. Thursday’s Initial Jobless Claims figure helped to push the four-week average down to 233.5K from the previous 238.75K.
With US CPI inflation cooling at an accelerated pace, market expectations for a rate hike from the Federal Reserve (Fed) are pricing in the possibility of three quarter-point rate cuts in 2024. According to the CME’s FedWatch Tool, rate market bets of a September rate cut have soared to 95%.
Dow Jones news
The Dow Jones looked for gains on Thursday, but topside momentum remained crimped as tech stocks declined. While the Dow Jones was up around a fifth of a percent on the day overall, concentrated losses in familiar technology names kept a lid on gains. 3M Co. (MMM) and Home Depot Inc. (HD) rose around 2.5% on Thursday, rising to $104.20 and $352.60 per share, respectively.
Intel Corp. saw a -4.24% decline, falling to $33.38 per share while Amazon.com Inc (AMZN) also backslid -3.0%, declining to $193.76 per share.
Dow Jones technical outlook
Dow Jones found slim gains on Thursday, but momentum remains stilted as the index tests the water of a supply zone priced in near the 40,000.00 major price handle. The Dow Jones has been slowly battling back into reach of all-time high bids sets just north of 40,000.00 back in May, recovering nearly 5% from the post-peak swing low towards 38,000.00.
Dow Jones five minute chart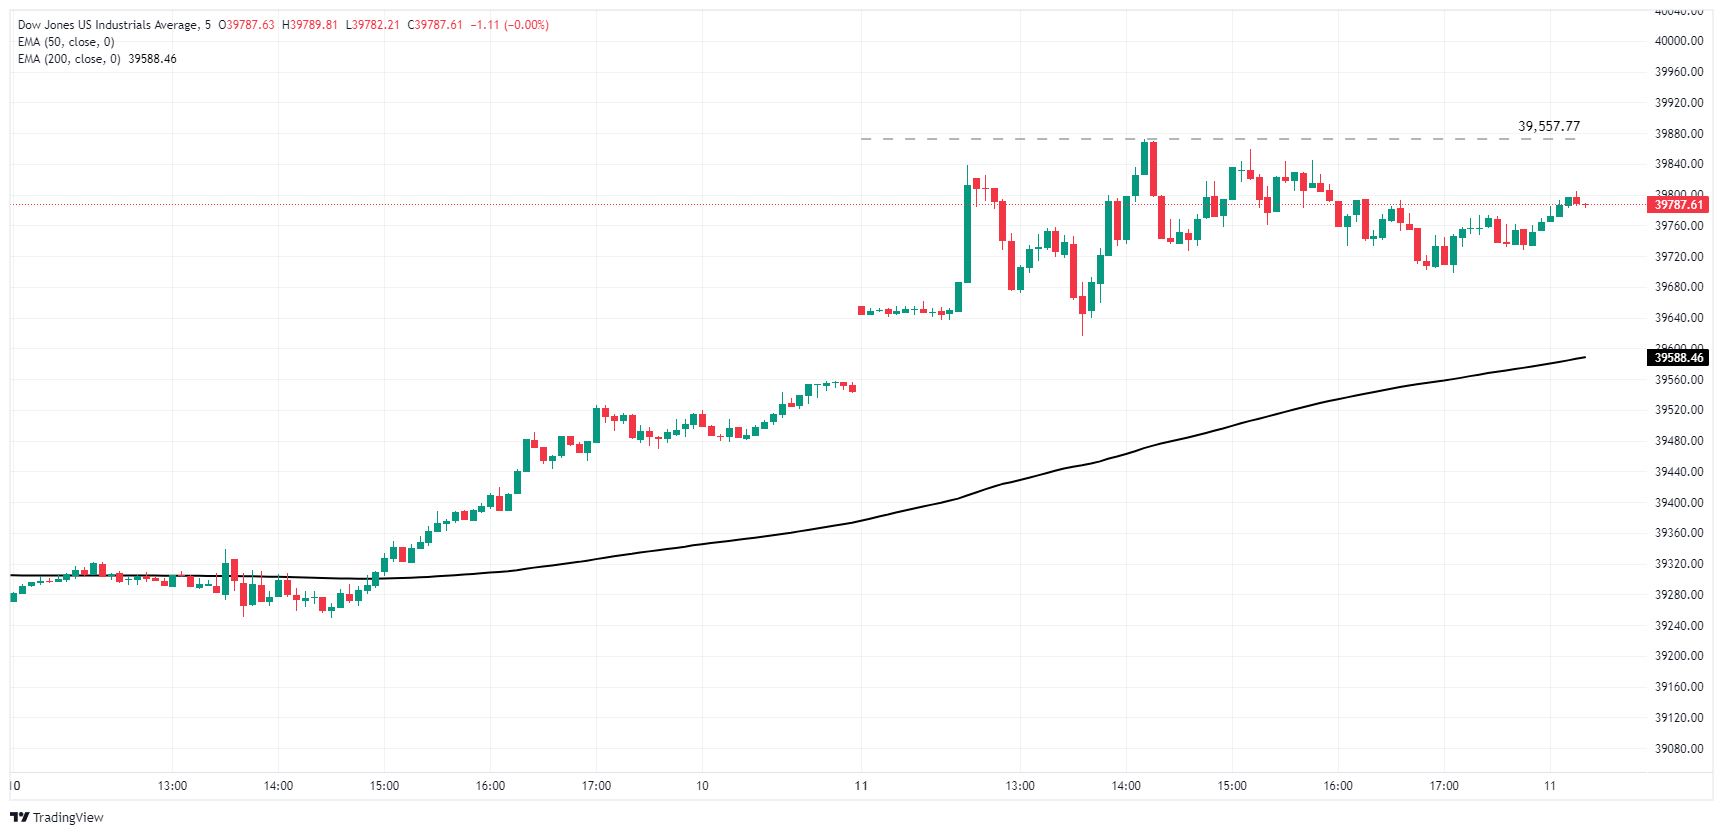
Dow Jones daily chart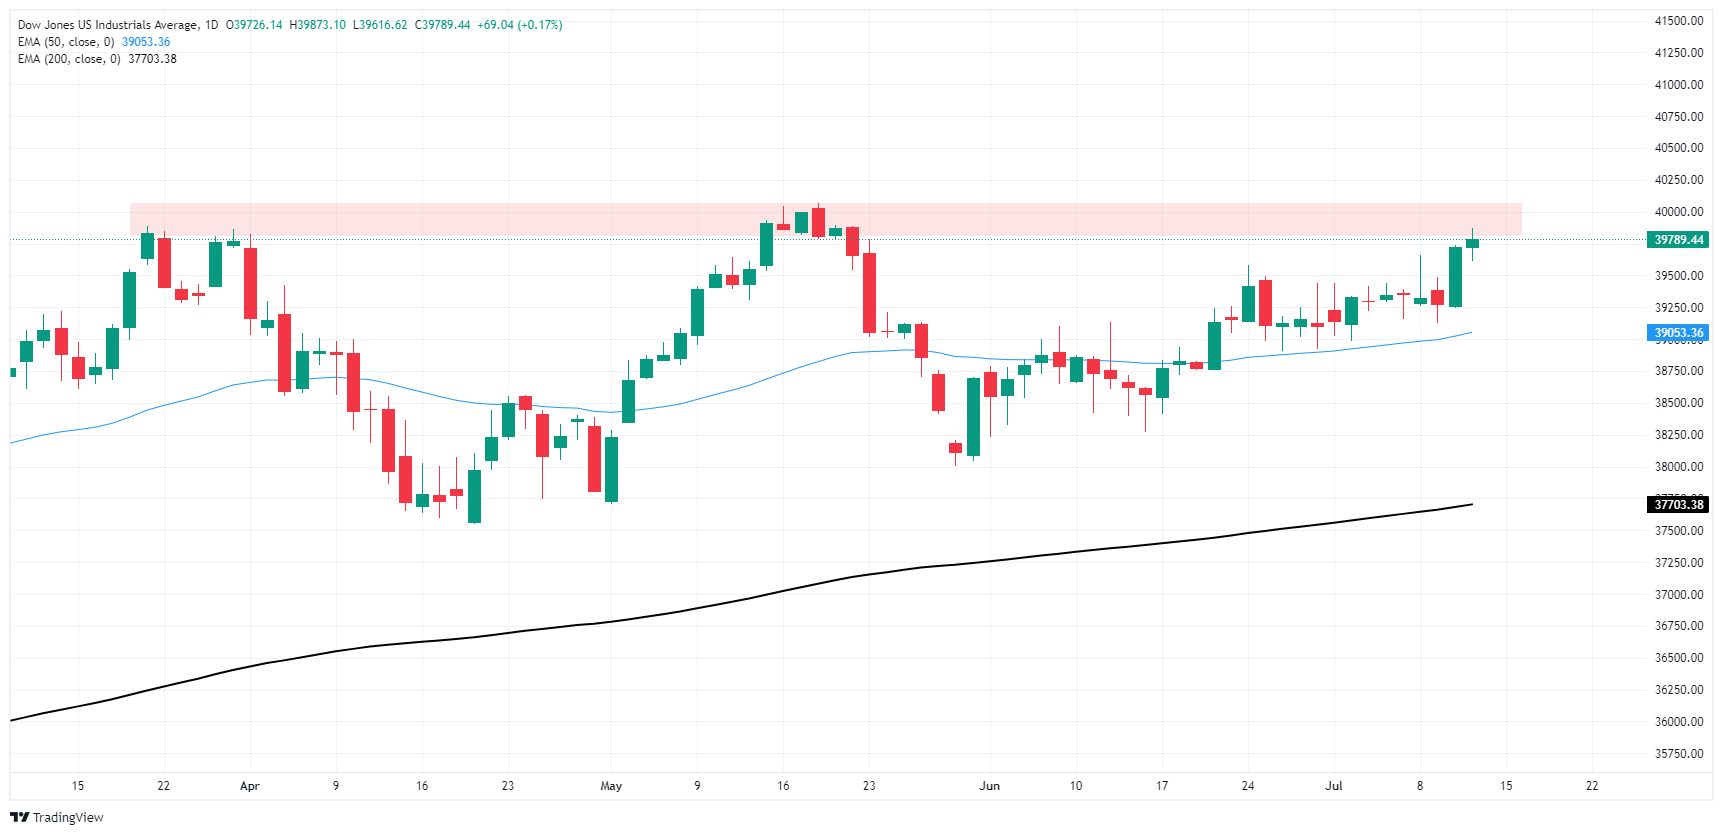
Dow Jones FAQs
The Dow Jones Industrial Average, one of the oldest stock market indices in the world, is compiled of the 30 most traded stocks in the US. The index is price-weighted rather than weighted by capitalization. It is calculated by summing the prices of the constituent stocks and dividing them by a factor, currently 0.152. The index was founded by Charles Dow, who also founded the Wall Street Journal. In later years it has been criticized for not being broadly representative enough because it only tracks 30 conglomerates, unlike broader indices such as the S&P 500.
Many different factors drive the Dow Jones Industrial Average (DJIA). The aggregate performance of the component companies revealed in quarterly company earnings reports is the main one. US and global macroeconomic data also contributes as it impacts on investor sentiment. The level of interest rates, set by the Federal Reserve (Fed), also influences the DJIA as it affects the cost of credit, on which many corporations are heavily reliant. Therefore, inflation can be a major driver as well as other metrics which impact the Fed decisions.
Dow Theory is a method for identifying the primary trend of the stock market developed by Charles Dow. A key step is to compare the direction of the Dow Jones Industrial Average (DJIA) and the Dow Jones Transportation Average (DJTA) and only follow trends where both are moving in the same direction. Volume is a confirmatory criteria. The theory uses elements of peak and trough analysis. Dow’s theory posits three trend phases: accumulation, when smart money starts buying or selling; public participation, when the wider public joins in; and distribution, when the smart money exits.
There are a number of ways to trade the DJIA. One is to use ETFs which allow investors to trade the DJIA as a single security, rather than having to buy shares in all 30 constituent companies. A leading example is the SPDR Dow Jones Industrial Average ETF (DIA). DJIA futures contracts enable traders to speculate on the future value of the index and Options provide the right, but not the obligation, to buy or sell the index at a predetermined price in the future. Mutual funds enable investors to buy a share of a diversified portfolio of DJIA stocks thus providing exposure to the overall index.
Federal Reserve (Fed) Bank of St. Louis President Alberto Musalem noted on Thursday that while the disinflation process is ongoing, the Fed policymaker would like to see more progress and highlighted that recession risks remain low.
Key highlights
High interest rates are pressuring parts of the economy.
The disinflation process is ongoing.
I see the economy growing between 1.5% and 2% this year.
I don't think recession risks are high right now.
I don't see a recession as likely, I see around 20% odds.
The current unemployment rate is still low despite the recent rise.
I supported Fed's rate decision at June meeting.
Companies are still facing cost pressures, but workers are easier to find.
Companies saying wage growth returning to pre-pandemic levels.
- Mexican Peso fluctuates amid volatile session influenced by US data.
- Banxico minutes reveal potential for interest rate adjustments as inflation is expected to converge by Q4 2025.
- US inflation data misses estimate, pushing US Treasury yields and USDollar Index lower.
- Mixed US data and strong carry trade demand keeping Peso resilient against weakening Greenback.
The Mexican Peso stood firm against the US Dollar after the Bank of Mexico (Banxico) revealed its last meeting minutes. Additionally, US inflation data came in softer than expected, opening the door for the Fed to lower borrowing costs. The USD/MXN trades at 17.83, virtually unchanged.
Banxico’s June minutes showed that the board foresees an inflationary environment that may allow for discussing adjustments to interest rates. They acknowledged that the labor market remains robust, yet growth has shown signs of moderation.
Some members project growth to be lower than expected as Mexico’s economic activity has been weak since the end of 2023. Most policymakers mentioned that inflation will converge toward the target in the last quarter of 2025.
Across the border, US Treasury bond yields and the Greenback tanked as US inflation was softer than expected, while the number of Americans filing for unemployment claims came below estimates and the previous reading.
The US Dollar Index (DXY), which tracks the value of a basket of six currencies against the US Dollar, tanks more than 0.50% and is down at 104.41. The US 10-year Treasury note is slipping more than 10 basis points (bps) at 4.17%, a level last seen on March 13, 2024.
Mixed US data helped to cap American currency losses against the Peso, which had remained one of the most sought carry-trade currencies.
Daily digest market movers: Mexican Peso hurt by Banxico minutes
- Banxico’s board members added that services inflation does not show a clear downward trend, which was one of the reasons for keeping rates unchanged at the June meeting.
- They commented that trading conditions experienced significant disruptions and added that the Mexican Peso depreciated considerably.
- Mexico’s June inflation figures were higher than expected due to a rise in food prices when most economists expect Banxico to resume lowering interest rates.
- June US Consumer Price Index (CPI) contracted -0.1% MoM, below estimates of a 0.1% increase. Core CPI ticked lower, down a tenth from 0.2% in May, and the consensus was 0.1% MoM in June.
- In the 12 months to June, headline CPI was 3%, down from 3.3%, and underlying inflation was below estimates, and the previous month's 3.4% came at 3.3%.
- Initial Jobless Claims for the week ending July 6 missed the mark and came in better than the consensus of 236K at 222K, lower than the previous reading of 239K.
- According to the CME FedWatch Tool data, odds for a September cut are 84%, up from 72% on Wednesday.
Technical analysis: Mexican Peso edges higher but floats around 17.80
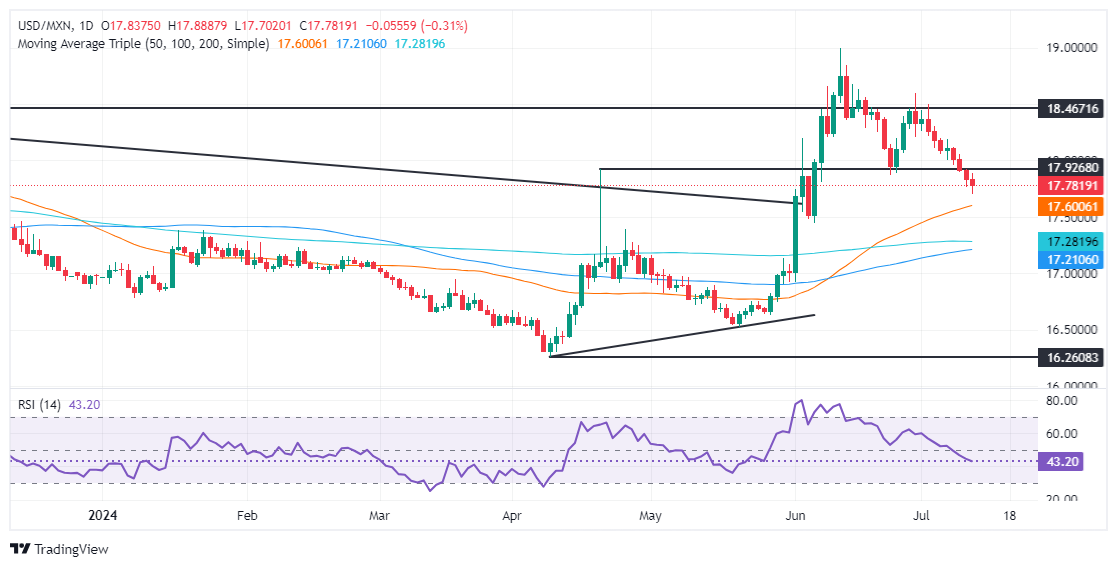
The USD/MXN downtrend remains in play, though Thursday’s price action has seen some consolidation within the 17.70-17.90 area. Even though momentum remains bearish, the Relative Strength Index (RSI) flipped flat at bearish territory, hinting that sellers are taking a respite.
In the event of a bearish continuation, bears need to clear the 17.70 mark. Once surpassed, the next stop would be the confluence of the December 5 high and the 50-day Simple Moving Average (SMA) near 17.56/57, followed by the 200-day SMA at 17.26. The next floor level would be the 100-day SMA at 17.19.
Conversely, USD/MXN buyers need to clear the June 24 cycle low of 17.87 turned resistance before challenging the psychological 18.00 figure. Further upside is seen above the July 5 high at 18.19, followed by the June 28 high of 18.59, allowing buyers to challenge the YTD high of 18.99.
Mexican Peso FAQs
The Mexican Peso (MXN) is the most traded currency among its Latin American peers. Its value is broadly determined by the performance of the Mexican economy, the country’s central bank’s policy, the amount of foreign investment in the country and even the levels of remittances sent by Mexicans who live abroad, particularly in the United States. Geopolitical trends can also move MXN: for example, the process of nearshoring – or the decision by some firms to relocate manufacturing capacity and supply chains closer to their home countries – is also seen as a catalyst for the Mexican currency as the country is considered a key manufacturing hub in the American continent. Another catalyst for MXN is Oil prices as Mexico is a key exporter of the commodity.
The main objective of Mexico’s central bank, also known as Banxico, is to maintain inflation at low and stable levels (at or close to its target of 3%, the midpoint in a tolerance band of between 2% and 4%). To this end, the bank sets an appropriate level of interest rates. When inflation is too high, Banxico will attempt to tame it by raising interest rates, making it more expensive for households and businesses to borrow money, thus cooling demand and the overall economy. Higher interest rates are generally positive for the Mexican Peso (MXN) as they lead to higher yields, making the country a more attractive place for investors. On the contrary, lower interest rates tend to weaken MXN.
Macroeconomic data releases are key to assess the state of the economy and can have an impact on the Mexican Peso (MXN) valuation. A strong Mexican economy, based on high economic growth, low unemployment and high confidence is good for MXN. Not only does it attract more foreign investment but it may encourage the Bank of Mexico (Banxico) to increase interest rates, particularly if this strength comes together with elevated inflation. However, if economic data is weak, MXN is likely to depreciate.
As an emerging-market currency, the Mexican Peso (MXN) tends to strive during risk-on periods, or when investors perceive that broader market risks are low and thus are eager to engage with investments that carry a higher risk. Conversely, MXN tends to weaken at times of market turbulence or economic uncertainty as investors tend to sell higher-risk assets and flee to the more-stable safe havens.
- The Canadian Dollar eased lower across the board on Thursday.
- Canada remains absent from the economic calendar this week.
- US CPI inflation contracted in June, sparking fresh rate cut bets.
The Canadian Dollar (CAD) fell against all of its major currency peers on Thursday as an empty economic release calendar left CAD at the mercy of broader market forces. US Consumer Price Index (CPI) inflation eased faster than expected in June, reigniting investor expectations for an increased pace of rate cuts in 2024.
Canada will continue to provide no meaningful economic data for CAD traders until the next iteration of Canada’s own CPI inflation print, slated for next Tuesday and released side-by-side with US Retail Sales figures. In the meantime, US Producer Price Index (PPI) wholesale inflation is due on Friday, and is still expected to tick upwards on an annualized basis.
Daily digest market movers: Canadian Dollar softens, gets left behind by broad-market risk bid
- US CPI inflation fell in June, printing a -0.1% contraction versus the expected 0.1% uptick from the previous 0.0%.
- Core US CPI inflation also ticked down to 3.3% YoY compared to the forecast hold at 3.4%.
- Cooling inflation data has reignited broad-market hopes for an accelerated pace of rate cuts from the Fed.
- Rate markets have priced in 95% odds of at least a quarter-point rate cut when the Federal Open Market Committee (FOMC) meets on September 18.
- Read more: US CPI inflation drops to 3% in June vs. 3.1% expected
Canadian Dollar PRICE Today
The table below shows the percentage change of Canadian Dollar (CAD) against listed major currencies today. Canadian Dollar was the strongest against the US Dollar.
| USD | EUR | GBP | JPY | CAD | AUD | NZD | CHF | |
|---|---|---|---|---|---|---|---|---|
| USD | -0.33% | -0.47% | -1.90% | 0.09% | -0.28% | -0.38% | -0.62% | |
| EUR | 0.33% | -0.13% | -1.59% | 0.43% | 0.05% | -0.04% | -0.28% | |
| GBP | 0.47% | 0.13% | -1.45% | 0.56% | 0.19% | 0.09% | -0.14% | |
| JPY | 1.90% | 1.59% | 1.45% | 2.03% | 1.65% | 1.52% | 1.32% | |
| CAD | -0.09% | -0.43% | -0.56% | -2.03% | -0.39% | -0.48% | -0.71% | |
| AUD | 0.28% | -0.05% | -0.19% | -1.65% | 0.39% | -0.10% | -0.33% | |
| NZD | 0.38% | 0.04% | -0.09% | -1.52% | 0.48% | 0.10% | -0.23% | |
| CHF | 0.62% | 0.28% | 0.14% | -1.32% | 0.71% | 0.33% | 0.23% |
The heat map shows percentage changes of major currencies against each other. The base currency is picked from the left column, while the quote currency is picked from the top row. For example, if you pick the Canadian Dollar from the left column and move along the horizontal line to the US Dollar, the percentage change displayed in the box will represent CAD (base)/USD (quote).
Technical analysis: CAD softens despite Greenback weakness, dataless slump continues
The Canadian Dollar (CAD) was down across the board on Thursday, tumbling 2% against the Japanese Yen (JPY) and falling over half a percent against the Pound Sterling (GBP) and Swiss Franc (CHF). Despite broad-market weakness in the US Dollar (USD), the Canadian Dollar still shed one-tenth of one percent against the USD.
USD/CAD kicked off the American trading session with a quick plunge to its lowest bids since mid-April, but firm CAD selling pressure gave the Greenback a leg up. Short momentum could not keep up the pressure, and USD/CAD has rebounded from the 200-day Exponential Moving Average (EMA) near the 1.3600 handle. Despite the intraday turnaround, the pair remains swamped out as USD/CAD grinds sideways in congestion that has mired the daily candlesticks since April.
USD/CAD hourly chart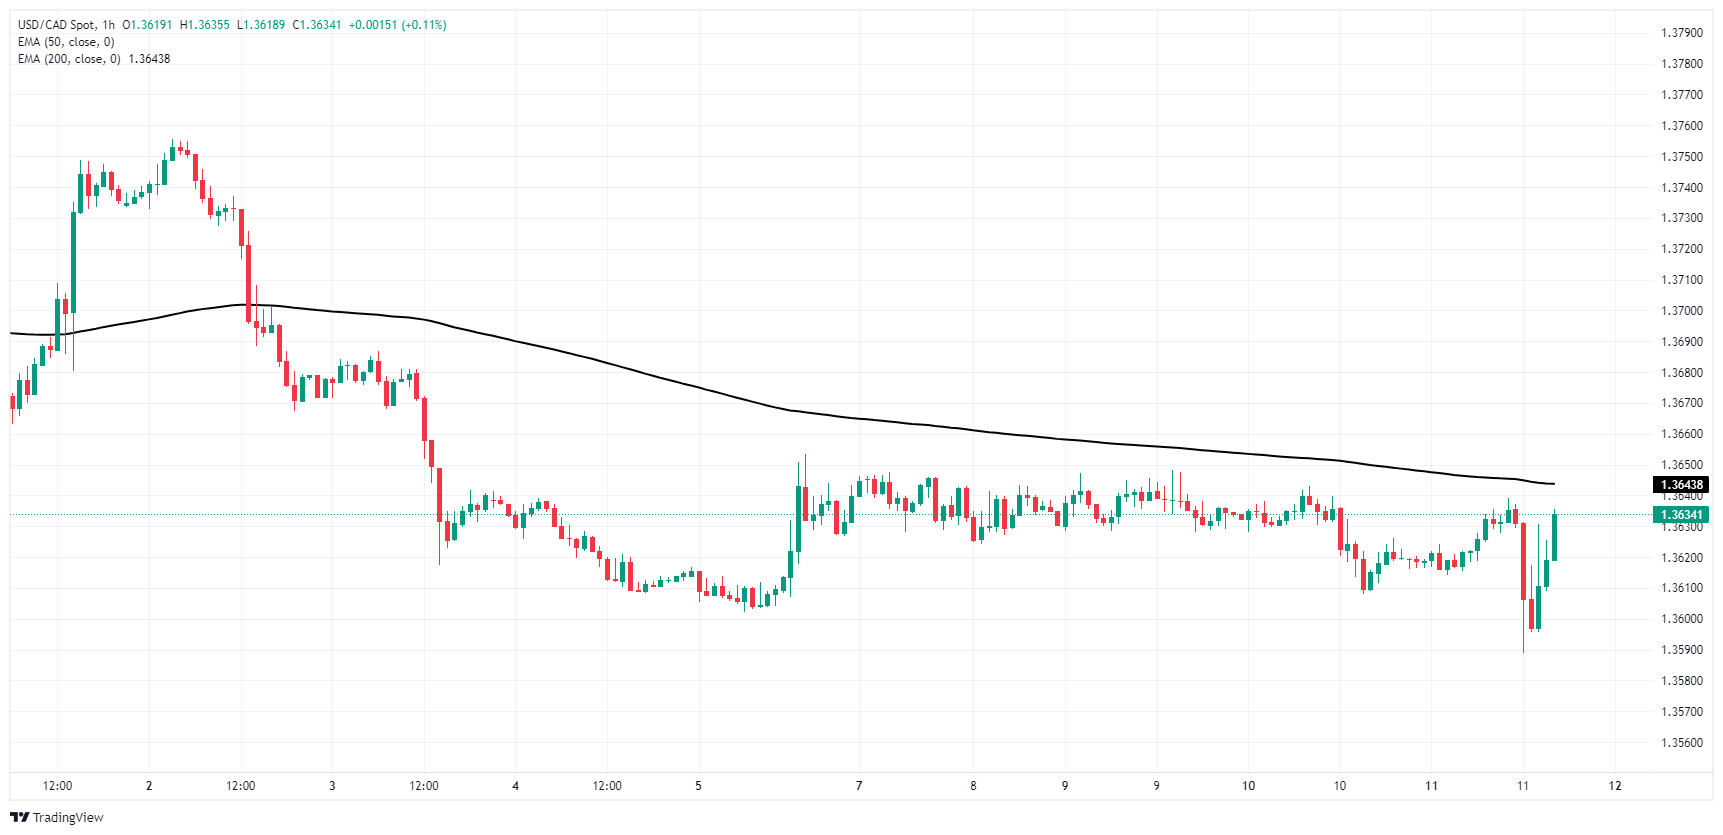
USD/CAD daily chart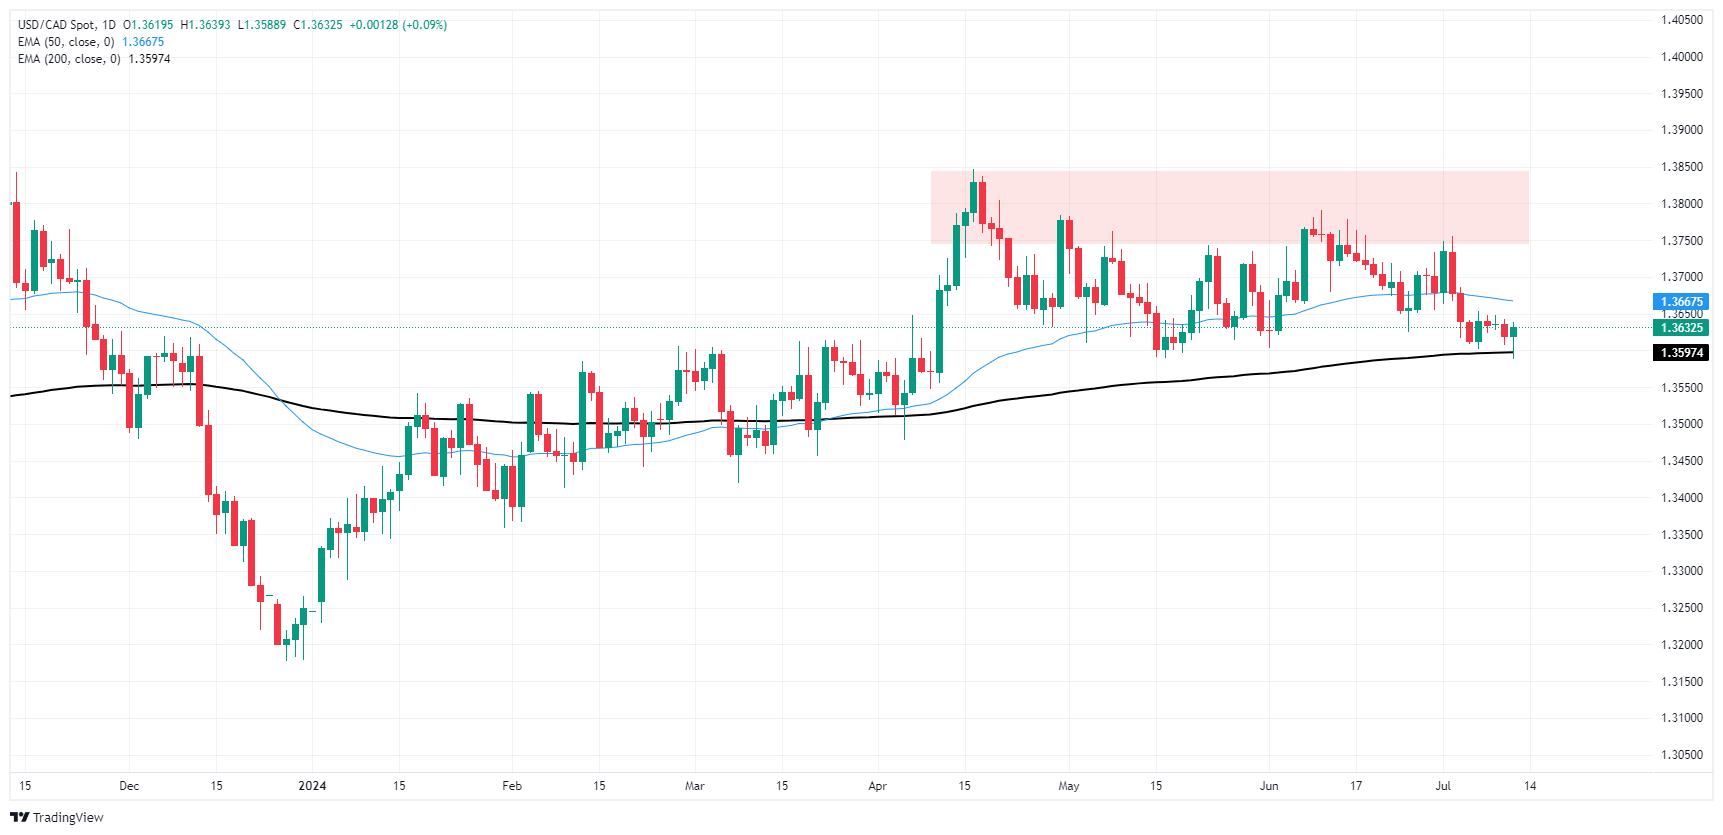
Canadian Dollar FAQs
The key factors driving the Canadian Dollar (CAD) are the level of interest rates set by the Bank of Canada (BoC), the price of Oil, Canada’s largest export, the health of its economy, inflation and the Trade Balance, which is the difference between the value of Canada’s exports versus its imports. Other factors include market sentiment – whether investors are taking on more risky assets (risk-on) or seeking safe-havens (risk-off) – with risk-on being CAD-positive. As its largest trading partner, the health of the US economy is also a key factor influencing the Canadian Dollar.
The Bank of Canada (BoC) has a significant influence on the Canadian Dollar by setting the level of interest rates that banks can lend to one another. This influences the level of interest rates for everyone. The main goal of the BoC is to maintain inflation at 1-3% by adjusting interest rates up or down. Relatively higher interest rates tend to be positive for the CAD. The Bank of Canada can also use quantitative easing and tightening to influence credit conditions, with the former CAD-negative and the latter CAD-positive.
The price of Oil is a key factor impacting the value of the Canadian Dollar. Petroleum is Canada’s biggest export, so Oil price tends to have an immediate impact on the CAD value. Generally, if Oil price rises CAD also goes up, as aggregate demand for the currency increases. The opposite is the case if the price of Oil falls. Higher Oil prices also tend to result in a greater likelihood of a positive Trade Balance, which is also supportive of the CAD.
While inflation had always traditionally been thought of as a negative factor for a currency since it lowers the value of money, the opposite has actually been the case in modern times with the relaxation of cross-border capital controls. Higher inflation tends to lead central banks to put up interest rates which attracts more capital inflows from global investors seeking a lucrative place to keep their money. This increases demand for the local currency, which in Canada’s case is the Canadian Dollar.
Macroeconomic data releases gauge the health of the economy and can have an impact on the Canadian Dollar. Indicators such as GDP, Manufacturing and Services PMIs, employment, and consumer sentiment surveys can all influence the direction of the CAD. A strong economy is good for the Canadian Dollar. Not only does it attract more foreign investment but it may encourage the Bank of Canada to put up interest rates, leading to a stronger currency. If economic data is weak, however, the CAD is likely to fall.
Federal Reserve (Fed) Bank of San Francisco President Mary C. Daly acknowledged improving inflation figures on Thursday but warned that shelter inflation and labor remain sticking points, and that expectations of three rate cuts may be an overreaction.
Key highlights
The economy looks to be on a path where one or two rate cuts this year would be more or less the appropriate path.
My expectation is that inflation will come down gradually, the labor market is gradually slowing.
Recent inflation prints are a relief, but progress is bumpy.
It is likely some policy adjustments will be warranted.
The labor market has softened but is still solid.
We are at the point where additional labor market slowing is more likely to result in a rise in unemployment.
The decline in super-core ex-housing inflation is welcome.
Shelter prices are coming down, but the lack of supply means the process is slower than it has been in history.
It's a fairly big signal from the Fed that so many of us are talking about the labor market.
- US Dollar loses momentum on decelerating CPI figures.
- Markets now are more certain of September cut.
- US Treasury yields fall, making traders lose interest in USD.
The US Dollar measured by the DXY index slipped further on Thursday, mainly due to the decelerating inflation figures from the US Consumer Price Index (CPI), which makes an even better case for a September interest rate cut by the Federal Reserve (Fed).
Though markets are getting increasingly confident about the rate cut, Fed officials remain cautious and have indicated that they are not in a hurry to implement changes without studying data-driven indicators thoroughly.
Daily digest market movers: DXY under stress as inflation softens and markets expect a rate cut
- Keeping with his earlier stance, Fed Chair Powell reiterated that the Fed's job is not yet done when it comes to managing inflation and even suggested the Fed has more work to do.
- He indicated that the confidence to lower rates based solely on inflation is not sufficient yet, but also pointed out that the Fed doesn’t need inflation to be under 2% before rate cuts begin.
- On the data front, the US Consumer Price Index (CPI) for June reported a decline to 3% YoY from 3.3% in May as per the US Bureau of Labor Statistics (BLS), below the market's expectations. The core measure rose by 3.3% YoY, lower than the 3.4% expected.
- Amid continued signs of inflation softening, market participants' confidence in a potential rate cut in September strengthens, placing downward pressure on USD.
DXY technical outlook: Negative outlook intensifies as DXY loses 100-day SMA
The DXY index losing its 10-day Simple Moving Average (SMA) has stirred up a negative outlook for the USD with both the Relative Strength Index (RSI) and the Moving Average Convergence Divergence (MACD) indicators swinging into negative trajectory.
The 100-day SMA threshold has been breached, intensifying the bearish tone. The next potential backstop for further declines could be noted at the 200-day SMA level, providing a critical bottom for the market.
US Dollar FAQs
The US Dollar (USD) is the official currency of the United States of America, and the ‘de facto’ currency of a significant number of other countries where it is found in circulation alongside local notes. It is the most heavily traded currency in the world, accounting for over 88% of all global foreign exchange turnover, or an average of $6.6 trillion in transactions per day, according to data from 2022. Following the second world war, the USD took over from the British Pound as the world’s reserve currency. For most of its history, the US Dollar was backed by Gold, until the Bretton Woods Agreement in 1971 when the Gold Standard went away.
The most important single factor impacting on the value of the US Dollar is monetary policy, which is shaped by the Federal Reserve (Fed). The Fed has two mandates: to achieve price stability (control inflation) and foster full employment. Its primary tool to achieve these two goals is by adjusting interest rates. When prices are rising too quickly and inflation is above the Fed’s 2% target, the Fed will raise rates, which helps the USD value. When inflation falls below 2% or the Unemployment Rate is too high, the Fed may lower interest rates, which weighs on the Greenback.
In extreme situations, the Federal Reserve can also print more Dollars and enact quantitative easing (QE). QE is the process by which the Fed substantially increases the flow of credit in a stuck financial system. It is a non-standard policy measure used when credit has dried up because banks will not lend to each other (out of the fear of counterparty default). It is a last resort when simply lowering interest rates is unlikely to achieve the necessary result. It was the Fed’s weapon of choice to combat the credit crunch that occurred during the Great Financial Crisis in 2008. It involves the Fed printing more Dollars and using them to buy US government bonds predominantly from financial institutions. QE usually leads to a weaker US Dollar.
Quantitative tightening (QT) is the reverse process whereby the Federal Reserve stops buying bonds from financial institutions and does not reinvest the principal from the bonds it holds maturing in new purchases. It is usually positive for the US Dollar.
Precious metals rally started after below expected US inflation data hit the market. Asian demand for Gold (XAU/USD) and Silver (XAG/USD) goes up, TDS senior commodity strategist Ryan McKay notes.
Asian demand is set to remain strong
“Below expected inflation data is compounding the precious metals rally after softer employment data had already bolstered expectations of a September start to the Federal Reserve (Fed) cutting cycle. In this sense, a key macro cohort that has been on the sidelines thus far is increasingly likely to regain interest in Gold.”
“Indeed, the first evidence of renewed interest is starting to show as ETF positions continue to rise in July, after June saw the first monthly increase since May 2023. Furthermore, while Chinese Gold reserves were flat for a second consecutive month, top traders on the Shanghai Futures Exchange (SHFE) have added back to their net positions, highlighting Asian demand is set to remain strong.”
“Silver is also surging as Chinese interest has ramped up in recent weeks, with traders adding roughly +20k SHFE lots to their net position in July.”
The industrial metals complex remains in the crosshairs for Commodity Trading Advisors (CTAs), TDS senior commodity strategist Ryan McKay notes.
Base metals remain on demand
“With the upcoming plenum in China gaining plenty of market focus, base metals have held strong as stimulus optimism gets baked in. However, our gauge of global commodity demand continues to weaken, while depressed premiums and surging inventories in the Middle Kingdom argue against fundamental tightness in Copper.”
“With still bloated money manager positioning on Comex and LME, the lack of evidence supporting current physical tightness, or a disappointment on potential Chinese stimulus, can continue to see these positions unwind. Indeed, speculators on the Shanghai Futures Exchange (SHFE) hold only modest positions across the base metals complex.”
“In this sense, as upside momentum fails to manifest, CTAs have turned into sellers of the Red Metal. However, funds could halt their selling if prices move back above $9,760/t, while further downside toward $9,142/t would be needed to fuel additional liquidations.”
- The GBP/USD climbs sharply as US inflation disappoints; UK economy exceeds expectations.
- Technical outlook remains bullish with RSI near overbought, signaling potential for further gains.
- Key resistance levels: 1.2950, 1.2995, and 1.3142; support at 1.2894, 1.2860, and 1.2800 if pullback occurs.
The Pound Sterling extended its gains on Thursday following better-than-expected data from the UK as the economy expanded above estimates. US inflation missed the mark, coming softer a headwind for the Greenback. Therefore, the GBP/USD trades at 1.2927, up 0.62%.
GBP/USD Price Analysis: Technical outlook
From a technical standpoint, the GBP/USD uptrend remains intact. The pair hit a new year-to-date (YTD) high after clearing the March 8 high of 1.2894.
Momentum favors buyers as the Relative Strength Index (RSI) stands bullish, slightly beneath overbought conditions.
Therefore, if GBP/USD pushes above 1.2950, that could pave the way for testing the July 27, 2023, peak of 1.2995, ahead of testing 1.3000. Further upside is seen once cleared on July 14, 2023, at a high of 1.3142.
On the flip side, if GBP/USD tumbles below 1.2900, the pair could be set for a pullback. The next support would be 1.2894, followed by the June 12 high turned support at 1.2860 and the 1.2800 mark.
GBP/USD Price Action – Daily Chart
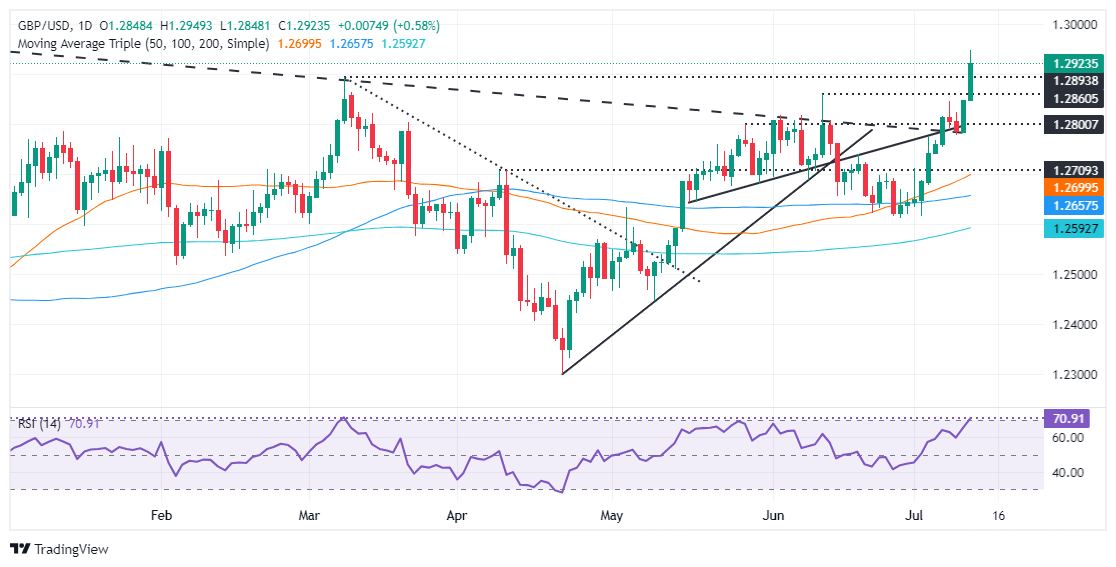
British Pound PRICE Today
The table below shows the percentage change of British Pound (GBP) against listed major currencies today. British Pound was the strongest against the US Dollar.
| USD | EUR | GBP | JPY | CAD | AUD | NZD | CHF | |
|---|---|---|---|---|---|---|---|---|
| USD | -0.45% | -0.58% | -1.95% | -0.08% | -0.54% | -0.59% | -0.67% | |
| EUR | 0.45% | -0.12% | -1.50% | 0.37% | -0.09% | -0.13% | -0.22% | |
| GBP | 0.58% | 0.12% | -1.39% | 0.50% | 0.03% | -0.02% | -0.09% | |
| JPY | 1.95% | 1.50% | 1.39% | 1.87% | 1.42% | 1.34% | 1.29% | |
| CAD | 0.08% | -0.37% | -0.50% | -1.87% | -0.48% | -0.51% | -0.59% | |
| AUD | 0.54% | 0.09% | -0.03% | -1.42% | 0.48% | -0.04% | -0.12% | |
| NZD | 0.59% | 0.13% | 0.02% | -1.34% | 0.51% | 0.04% | -0.07% | |
| CHF | 0.67% | 0.22% | 0.09% | -1.29% | 0.59% | 0.12% | 0.07% |
The heat map shows percentage changes of major currencies against each other. The base currency is picked from the left column, while the quote currency is picked from the top row. For example, if you pick the British Pound from the left column and move along the horizontal line to the US Dollar, the percentage change displayed in the box will represent GBP (base)/USD (quote).
NZD/USD declined 0.6% after the RBNZ stating that it expects inflation to return to the 1-3% target range in 2H. The RBNZ is also diverging from the RBA, where markets still see a risk of another rate hike due to stubborn inflation, DBS FX & Credit Strategist Chang Wei Liang notes.
A RBNZ rate cut in August increasingly possible
“NZD/USD declined 0.6% after the RBNZ surprised markets by stating that it expects inflation to return to the 1-3% target range in 2H, adding that it could temper monetary restraint with a decline in inflation. Markets are now pricing in a 44% chance of a rate cut in August.”
“The RBNZ is also diverging from the RBA, where markets still see a risk of another rate hike due to stubborn inflation. AUD/NZD has leapt towards 1.11, supported by widening short-term AUD-NZD rate differentials.”
In June, headline CPI growth in the U.S. edged down to 3% from 3.3% in May. That’s below consensus expectations and marked another downside surprise after May, Rabobank macro strategists note.
The odds are tilting towards a September Fed rate cut
“That closely watched supercore measure posted a second consecutive outright decline (-0.04% in May and -0.05% in June) to leave the three-month annualized basis down to 1.3% in June. That's the slowest reading since October 2021 and just half of the pre-pandemic run rate of 2.6%. The easing among core services components was also widespread, with transport and education services seeing monthly declines from May.”
“Energy CPI dropped lower to 1% in June upon a second monthly decline in gasoline prices. Food CPI was little changed at 2.2%, as slower reading for grocery CPI (1.1%) continued to balance off still elevated inflation for dining out (4.1%). The broader ‘core’ CPI excluding food and energy also dropped to 3.3% above last year after a smaller 0.1% monthly increase from May.”
“A second U.S. CPI downside in a row in June has added to market odds for a first rate cut from the Federal Reserve (Fed) this September. After today's CPI report, we think an interest rate cut at the Fed’s next meeting in July is still unlikely but the odds are tilting towards a September cut.”
- AUD/USD jumps to near 0.6800 as soft US inflation boosts Fed rate-cut bets.
- US annual headline and core inflation decelerated sharply in June.
- The RBA may cut interest rates next year.
The AUD/USD pair jumps close to the crucial resistance of 0.6800 in Thursday’s American session. The Aussie asset strengthens as the US Dollar (USD) plunges after the United States (US) Consumer Price Index (CPI) report showed that inflationary pressures cool down again in June. This has prompted expectations for the Federal Reserve (Fed) to start reducing interest rates from the September meeting.
The US Dollar Index (DXY), which tracks the Greenback’s value against six major currencies, tumbles to near 104.00.
US annual core inflation, which excludes volatile food and energy prices, came in lower at 3.3% than estimates and May’s reading of 3.4%. In the same period, the headline inflation decelerated at a faster pace to 3.0% from expectations of 3.1% and the former release of 3.3%.
On month, headline inflation deflated by 0.1% and the core CPI grew at a slower pace of 0.2%. Soft inflation figures would deliver more confidence to Fed policymakers to discuss on an early return to the policy normalization process.
According to the CME FedWatch tool, 30-day Federal Fund Futures price data indicates that a rate-cut in September is a done deal. The probability for Fed rate cuts has increased to 89% from 74.4% recorded a week ago.
On the Asia-Pacific front, growing speculation that the Reserve Bank of Australia (RBA) will not cut interest rates this year has kept the near-term outlook of the Australian Dollar firm. The RBA would be one of the last to join the global rate-cut cycle as price pressures have revamped in Australia.
Australian Dollar FAQs
One of the most significant factors for the Australian Dollar (AUD) is the level of interest rates set by the Reserve Bank of Australia (RBA). Because Australia is a resource-rich country another key driver is the price of its biggest export, Iron Ore. The health of the Chinese economy, its largest trading partner, is a factor, as well as inflation in Australia, its growth rate and Trade Balance. Market sentiment – whether investors are taking on more risky assets (risk-on) or seeking safe-havens (risk-off) – is also a factor, with risk-on positive for AUD.
The Reserve Bank of Australia (RBA) influences the Australian Dollar (AUD) by setting the level of interest rates that Australian banks can lend to each other. This influences the level of interest rates in the economy as a whole. The main goal of the RBA is to maintain a stable inflation rate of 2-3% by adjusting interest rates up or down. Relatively high interest rates compared to other major central banks support the AUD, and the opposite for relatively low. The RBA can also use quantitative easing and tightening to influence credit conditions, with the former AUD-negative and the latter AUD-positive.
China is Australia’s largest trading partner so the health of the Chinese economy is a major influence on the value of the Australian Dollar (AUD). When the Chinese economy is doing well it purchases more raw materials, goods and services from Australia, lifting demand for the AUD, and pushing up its value. The opposite is the case when the Chinese economy is not growing as fast as expected. Positive or negative surprises in Chinese growth data, therefore, often have a direct impact on the Australian Dollar and its pairs.
Iron Ore is Australia’s largest export, accounting for $118 billion a year according to data from 2021, with China as its primary destination. The price of Iron Ore, therefore, can be a driver of the Australian Dollar. Generally, if the price of Iron Ore rises, AUD also goes up, as aggregate demand for the currency increases. The opposite is the case if the price of Iron Ore falls. Higher Iron Ore prices also tend to result in a greater likelihood of a positive Trade Balance for Australia, which is also positive of the AUD.
The Trade Balance, which is the difference between what a country earns from its exports versus what it pays for its imports, is another factor that can influence the value of the Australian Dollar. If Australia produces highly sought after exports, then its currency will gain in value purely from the surplus demand created from foreign buyers seeking to purchase its exports versus what it spends to purchase imports. Therefore, a positive net Trade Balance strengthens the AUD, with the opposite effect if the Trade Balance is negative.
- EUR/GBP is falling to its next downside target at the June 14 low.
- It is in a short and medium term downtrend with odds favoring a continuation lower.
EUR/GBP is steadily falling in a short-term downtrend. Given “the trend is your friend” it will probably continue until it reaches its next downside target at the level of the June 14 low at 0.8398.
EUR/GBP Daily Chart
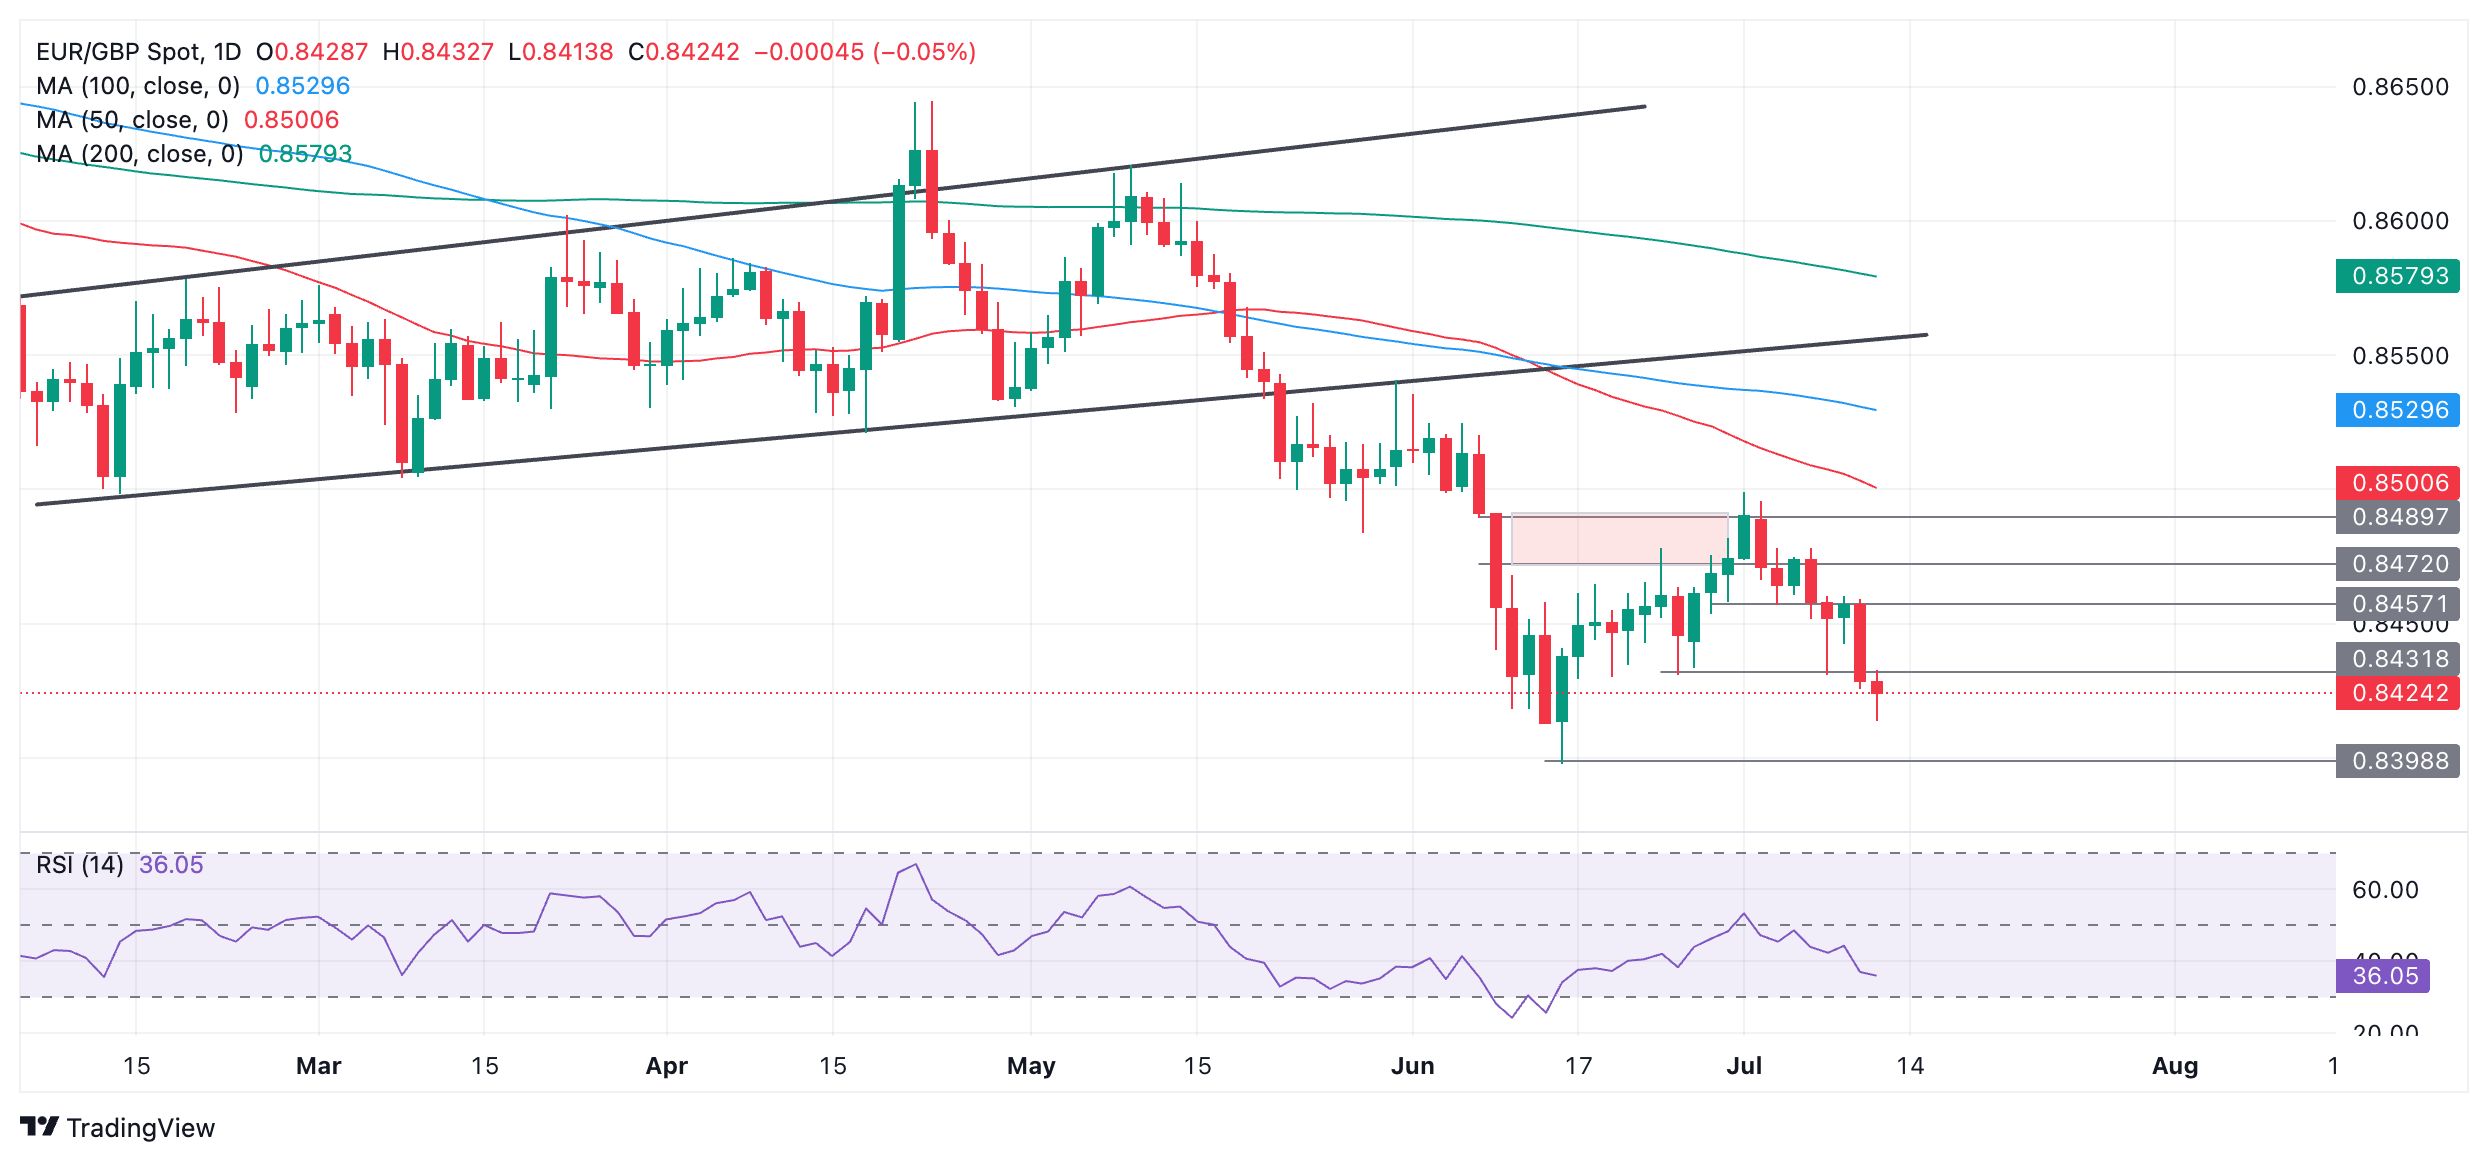
The medium-term trend is also bearish after the break below the trendline in late May decisively reversed the trend which had hitherto been sideways.
A break below Thursday’s low at 0.8414 would add confirmation of a decline towards 0.8398. At that key support level the pair could potentially bounce – although it is at risk of going even lower after any pullback higher has run its course.
- USD/JPY declines over 2.0% after US CPI data misses estimates.
- The data means US inflation is a step closer to the Fed’s 2.0% target.
- This increases the likelihood of the Fed cutting interest rates in the near term weakening the US Dollar in the process.
USD/JPY is in freefall, trading over 2.0% lower, in the 157.90s, after the release of US Consumer Price Index (CPI) for June showed a cooling down of inflationary pressures in the US economy.
The CPI data brings US inflation a step closer to the Federal Reserve’s (Fed) 2.0% target and makes it more likely the central bank will reduce interest rates in the near-term. This in turn is negative for the US Dollar (USD) (and the USD/JPY) since lower interest rates attract less foreign capital inflows.
The Japanese Yen (JPY) meanwhile, finds support after Japanese factory-gate inflation data showed a sharp rise in June. PPI rose 2.9% year-over-year in June, beating the previous month’s 2.6% reading and in line with consensus expectations. It was the fifth consecutive month of increasing gains for the indicator, the 41st consecutive month of PPI inflation, and the highest reading since August 2023.
USD/JPY Daily Chart
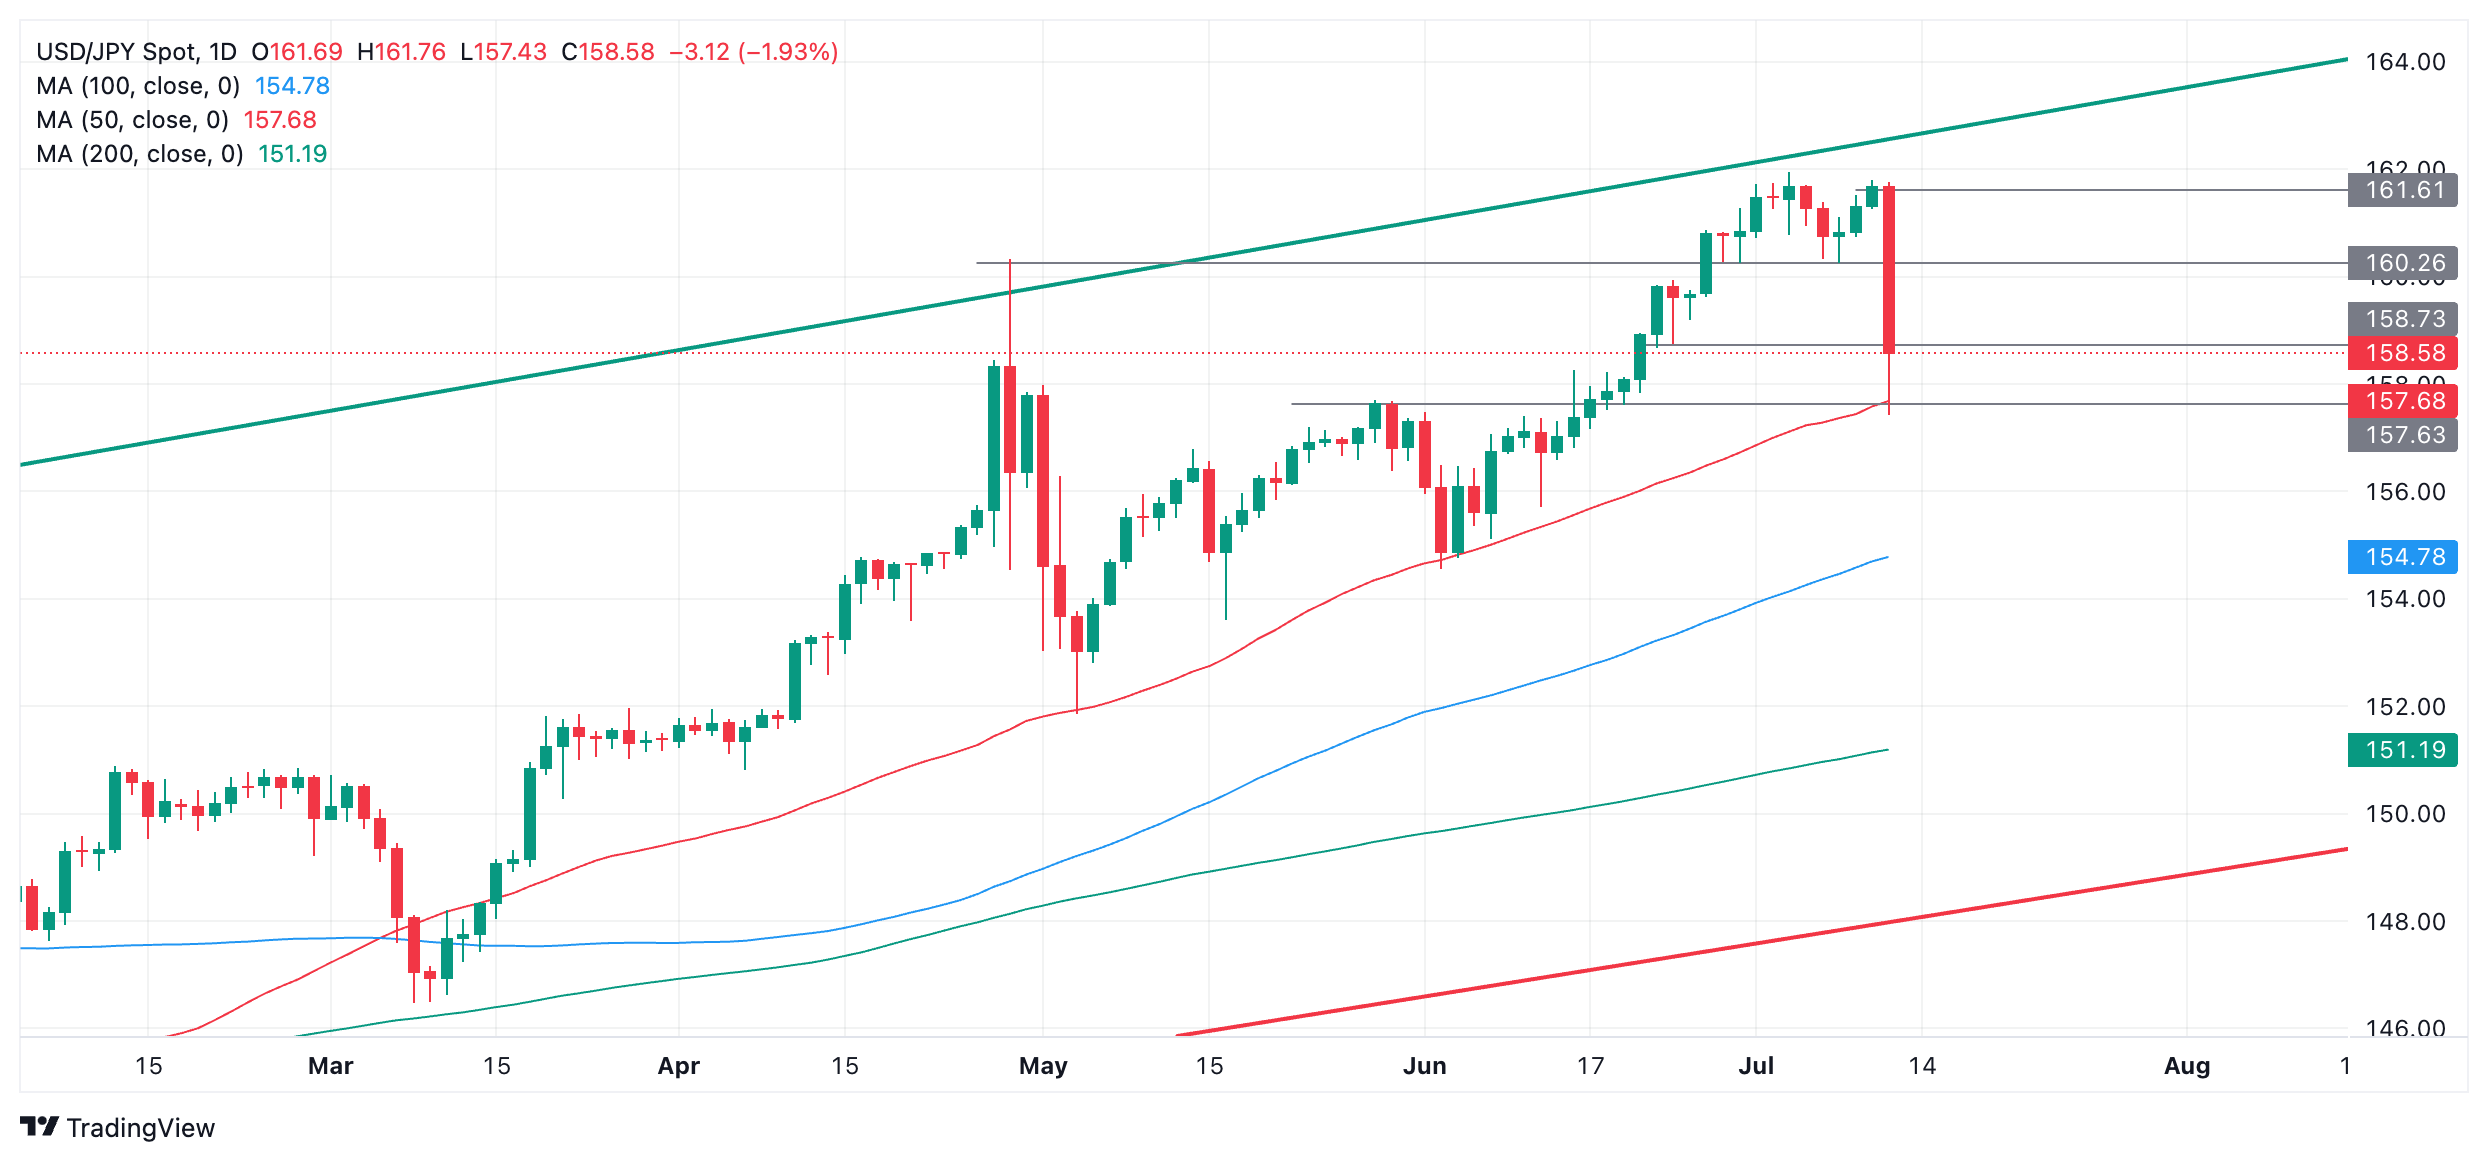
USD/JPY drops like a knife after US CPI data undershoots
USD/JPY is sinking rapidly after the release of US CPI revealed prices rose 3.0% year-on-year in June, which was below estimates of 3.1% and the previous month's 3.3%.
CPI declined 0.1% on a month-over-month basis in June, when economists had expected a 0.1% rise from 0.0% in May.
Core CPI, which excludes volatile food and energy components, cooled to 3.3% YoY, falling below expectations of 3.4% and the previous month’s 3.4%. On a monthly basis core CPI rose 0.1%, which was below the 0.2% forecast and 0.2% of May.
The data makes it more likely the Fed will begin cutting interest rates in the near-term – a negative for the US Dollar. Current market-based gauges suggest a circa 70% probability of a cut in September, according to the CME FedWatch tool.
Downside could be limited by outlook for Yen
Despite the decline in USD/JPY on the back of the lower US inflation reading and its contrast to higher Japanese PPI inflation data for the same period, the downside for the USD/JPY pair may be limited as the prospects of the Bank of Japan (BoJ) lifting interest rates substantially remain low.
Although the chances of the BoJ raising interest rates by 0.25% at its July meeting are high and this is supporting the Yen (negative for USD/JPY), the BoJ is not expected to begin an aggressive tightening cycle in which it ratchets up interest rates in meeting after meeting. Rather it is only expected to make 0.35% of interest-rate hikes in the next 12 months according to Dr. Win Thin, Global Head of Markets Strategy at Brown Brothers Harriman, so “upwards pressure” is likely to persist in Yen pairs.
USD/JPY faces a further risk of “stealth intervention” by the Japanese authorities, according to Sagar Dua, Editor at FXStreet. In late April and early May 2024, the Bank of Japan (BoJ) undertook direct market interventions to buttress the Yen. A too-weak Yen is seen as a financial stability risk for importers and encourages the “wrong kind” of inflation in the economy, according to Japanese policymakers, who have been warning of further interventions if the Yen continues depreciating. This continues to be a risk factor for USD/JPY.
- Initial Jobless Claims rose by 222K vs. the previous week.
- Continuing Jobless Claims increased by around 1.850M.
US citizens that applied for unemployment insurance benefits increased by 222K in the week ending July 6 according to the US Department of Labor (DoL) on Thursday. The prints came in below initial estimates (236K) and were lower than the previous weekly gain of 239K (revised from 238K).
Further details of the publication revealed that the advance seasonally adjusted insured unemployment rate was 1.2% and the 4-week moving average was 233.50K, a drop of 5.250K from the previous week's revised average.
In addition, Continuing Claims decreased by 4K to 1.852M in the week ended June 29.
Market reaction
The US Dollar Index (DXY) breaks below 105.00 and plummets to fresh lows near 104.20 against the backdrop of an equally strong retracement in US yields across the curve.
- GBP/JPY rallies to a new high above 208 after the release of better-than-expected UK GDP data supports GBP.
- The data could lead the BoE to take a more cautious approach to cutting interest rates, supporting GBP.
- Japanese PPI inflation data rose strongly in June but BoJ is still not expected to aggressively raise rates, weighing on JPY.
GBP/JPY has reached a new 16-year high of 208.11 on Thursday, driven by an appreciating Pound Sterling (GBP) after the release of better-than-expected Gross Domestic Product (GDP) data for the United Kingdom, in May.
GBP/JPY Daily Chart
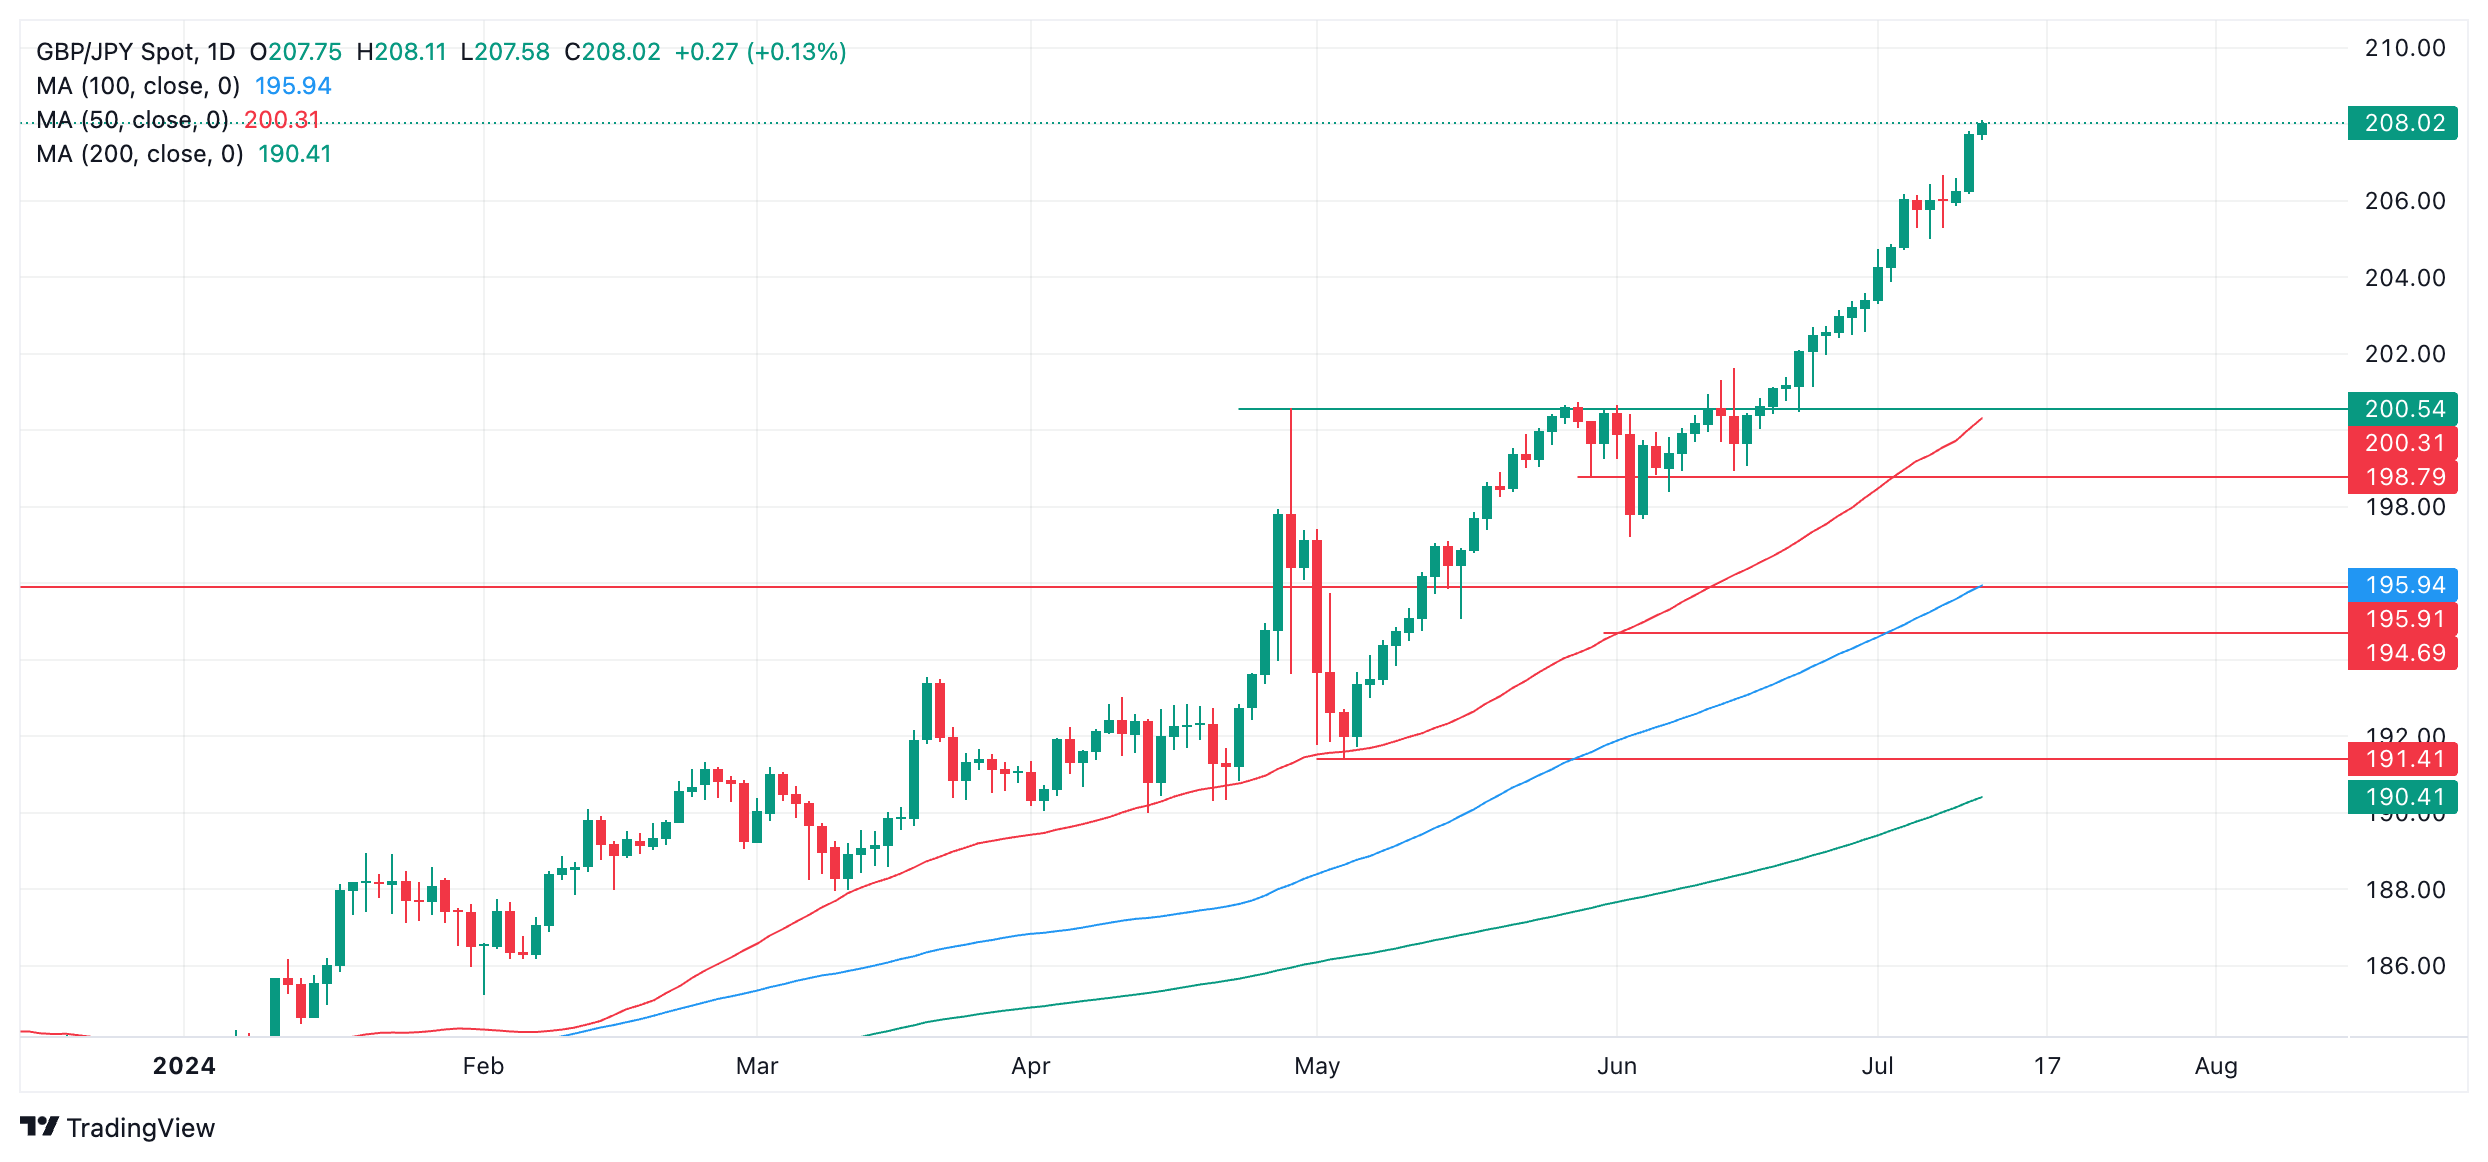
The UK economy grew at a pace of 0.4% month-over-month in May, higher than economists’ consensus estimates of 0.2% and April’s 0.0%, according to data from the Office of National Statistics (ONS), released on Thursday.
“Many retailers and wholesalers had a good month, with both bouncing back from a weak April. Construction grew at its fastest rate in almost a year after recent weakness, with house building and infrastructure projects boosting the industry”, said Liz McKeown, Director of Economic Statistics at the ONS.
The stronger growth data for May suggests UK GDP growth in Q2 could come out at 0.7% quarter-over-quarter, which is higher than the Bank of England’s (BoE) forecast of 0.5%, according to Capital Economics.
“At the margin this may mean the Bank (BoE) doesn’t need to rush to cut interest rates. We still think the Bank will cut interest rates from 5.25% to 5.00% at the next policy meeting in August, although the timing of the first cut will be heavily influenced by June’s inflation and May’s labour market data releases next week,” says Ashley Webb, UK Economist at Capital Economics.
Though still unlikely, a delay in the timing of the BoE’s first rate cut would lead to a stronger Pound Sterling. More probable is that the BoE reduces interest rates at a slower pace. This too would support GBP, however, since higher interest rates are positive for currencies as they attract greater inflows of foreign capital. It would also probably push GBP/JPY higher. That said, expectations remain elevated the BoE will pull the trigger and cut rates in August.
“We believe it is a done deal (August rate cut), as there is simply no reason to wait until September 19. Inflation is already at the 2% target, while the economic data have clearly softened in recent months,” said Dr. Win Thin, Global Head of Markets Strategy at Brown Brothers Harriman (BBH).
GBP/JPY upside capped by hot Japanese inflation
GBP/JPY upside may be tempered, however, after recent hotter-than-expected Producer Price Index (PPI) data from Japan. PPI measures “factory gate price” inflation which is often a precursor to inflation in the wider economy. PPI in June came out at 2.9% year-over-year, beating the previous month’s 2.6% YoY reading and in line with consensus expectations. It was the fifth consecutive month of increasing gains for the indicator, the 41st consecutive month of PPI inflation, and the highest reading since August 2023.
Despite the higher inflation data the Bank of Japan (BoJ) is still not expected to begin an aggressive tightening cycle in which it ratchets up interest rates in meeting after meeting. Rather it is only expected to make 0.35% of interest-rate hikes in the next 12 months according to BBH, so “upwards pressure” is likely to persist in Yen pairs.
GBP/JPY faces a further risk of “stealth intervention” by the Japanese authorities to prop up the Japanese Yen (JPY), according to Sagar Dua, Editor at FXStreet. In late April and early May 2024, the Bank of Japan (BoJ) undertook direct market interventions to buttress the Yen when it was at lower levels. A too-weak Yen is seen as a financial stability risk for importers and encourages the “wrong kind” of inflation in the economy, according to Japanese policy makers and currency czars.
DXY is trading lower for the second straight day near 104.842. More Federal Reserve (Fed) officials are voicing concern about labor market weakness, but this week’s developments highlight the fact that weaker data in many of the major economies will feed into more dovish central banks, BBH macro strategists note.
CPI data is key in setting near-term Fed expectations
“The Dollar Index (DXY) is trading lower for the second straight day near 104.87 as markets await key inflation data. EUR/USD is trading higher near $1.0852, and GBP/USD is trading higher near $1.2875 after stronger than expected data and cautious BOE comments. USD/JPY is trading lower near 161.60.”
“Recent softness in the U.S. data is challenging our view that the backdrop of persistent inflation and robust growth in the U.S. remains largely in place. Indeed, more Federal Reserve (Fed) officials are voicing concern about labor market weakness.”
“However, this week’s developments highlight the fact that weaker data in many of the major economies will feed into more dovish central banks, underscoring that the relative story should continue to support the dollar. Today’s CPI data will be key in setting near-term Fed expectations.”
If England reaching the Euro 2024 final wasn’t enough positive news, the UK posted stronger than expected growth numbers for May Thursday morning. The monthly GDP indicator rose 0.4% MoM, doubling expectations and showing a healthy rebound from April’s 0.0%, ING’s FX strategist Francesco Pesole notes.
GBP remains surprisingly bullish
“The impact on the Pound Sterling (GBP) from GDP data was muted, but GBP remains the best performing G10 currency this week, largely on the back of some hawkish narrative from Bank of England (BoE) speakers following a quiet period around the election.”
“We were not surprised to hear the two most hawkish MPC members, Jonathan Haskel and Catherine Mann, sound the alarm on risks of easing too early – but Chief Economist Huw Pill’s comments did matter to a greater extent, as he is a more accurate benchmark for consensus within the committee. Pill’s comments yesterday mostly stressed the persistence and upside risks in services inflation, shedding light on greater doubts about an August cut.”
“The market’s dovish bets have been trimmed, with now only 14bp priced in for the 1st August BoE meeting, and 47bp in total for the year. It will take some convincing developments in UK prices to convince markets an August cut is possible. That remains our base case anyway, so we believe that GBP strength will be short-lived. For now, EUR/GBP bulls like us will be happy with the pair not slipping below June’s 0.8400 lows.”
The Euro (EUR) is enjoying some “silence” on French politics, which is making investors comfortable so far with EUR/USD drifting slightly higher from the 1.0800-1.0830 anchor, ING’s FX strategist Francesco Pesole notes.
EUR/USD eyes 1.0900 in the short run
“If you read French news, you would get anything but a sense of silence, but global markets inherently filter out noise to prioritise major developments, and so far there have been none on coalition talks. President Emmanuel Macron joined the NATO meeting leaving French parties from the left working on a strategy to secure key government seats.”
“Interestingly, the option of a deal between Macron’s party and the moderate right-wing Republicans is gaining some momentum. Former prime minister Edouard Philippe (who is part of Macron’s alliance) is attempting to broker the deal. This would, however, only guarantee a relative majority.”
“The OAT-Bund 10-year spread has been stabilising around 65bp, and while we continue to see a risk of rewidening as markets may grow impatient with the political gridlock, the rest of this week should see a shift of focus towards US macro developments. As discussed above, the US Dollar may soften today and EUR/USD could eye 1.0900. The eurozone calendar is empty.”
- Natural Gas dips again on Thursday, testing vital support before a steep decline.
- Traders see demand in Europe soar again, while the June US CPI release holds a grip on US Gas prices.
- The US Dollar index eases and trades below 105.00 on concerns over President Biden staying in the race.
Natural Gas price (XNG/USD) ticks down on Thursday for the third day in a row this week, with mounting pressure on critical support that stands before a possible steep decline. The US Consumer Price Index (CPI) release later in the day is keeping a grip on the US Gas prices, where a further disinflationary print could mean a near certainty that a Federal Reserve’s (Fed) interest rate cut in September is coming. Lower interest rates would boost demand, with a positive outlook for the next quarters in terms of demand for Natural Gas.
Meanwhile, the US Dollar Index (DXY), which tracks the Greenback’s value against six major currencies, edges lower ahead of the US CPI release, while important public figures such as Nancy Pelosi and Georges Clooney are calling for President Joe Biden to make way for a better candidate on the presidential ballot, weighing on the US Dollar. Markets are holding their breath until the CPI data comes out at 12:30 GMT because it is vital. Should the CPI data be a surprise hotter-than-expected inflation, any possibility for a rate cut in September would be whipped out, with markets repricing a push towards either December or even only at the start of 2025 for the Fed to start lowering borrowing costs.
Natural Gas is trading at $2.34 per MMBtu at the time of writing.
Natural Gas news and market movers: CPI footprint
- Expect substantial market volatility on Thursday around 12:30 GMT, when the US Consumer Price Index numbers for June will be released, even in Gas prices.
- The Karsto plant in Norway faces maintenance until July 13 following another extension earlier, according to network operator Gassco AS, Bloomberg reports.
- Woodside Energy in Australia has signed a deal with Taiwan for LONG deliveries, Reuters reports.
- The gas premium spread in Europe is widening between the southern peripheral countries and mainland Europe. Elevated temperatures across Spain, Portugal, and Italy are triggering a short-term tightness with elevated demand over steady supply, Bloomberg reports.
Natural Gas Technical Analysis: CPI catalyst underway
Natural Gas price stabilizes near the crucial support area at $2.30 ahead of June’s US CPI release. It becomes clear that commodity traders seek an outside catalyst to move price action in either direction. Should the CPI release be binary, expect to see a substantial move either way in Gas price on the back of the CPI outcome confirming or denying a September rate cut.
The 200-day SMA is the first force to reckon with on the upside, near $2.51, closely followed by the 55-day SMA at $2.63. Once back above, the pivotal level near $3.08 (March 6, 2023, high) remains key resistance after its false break last week.
On the downside, the support level, which could mean some buying opportunities, is $2.30, the 100-day SMA that falls in line with the ascending trend line since mid-February. In case that level does not hold as support, look for the pivotal level near $2.13, which has acted as a cap and floor in the past.
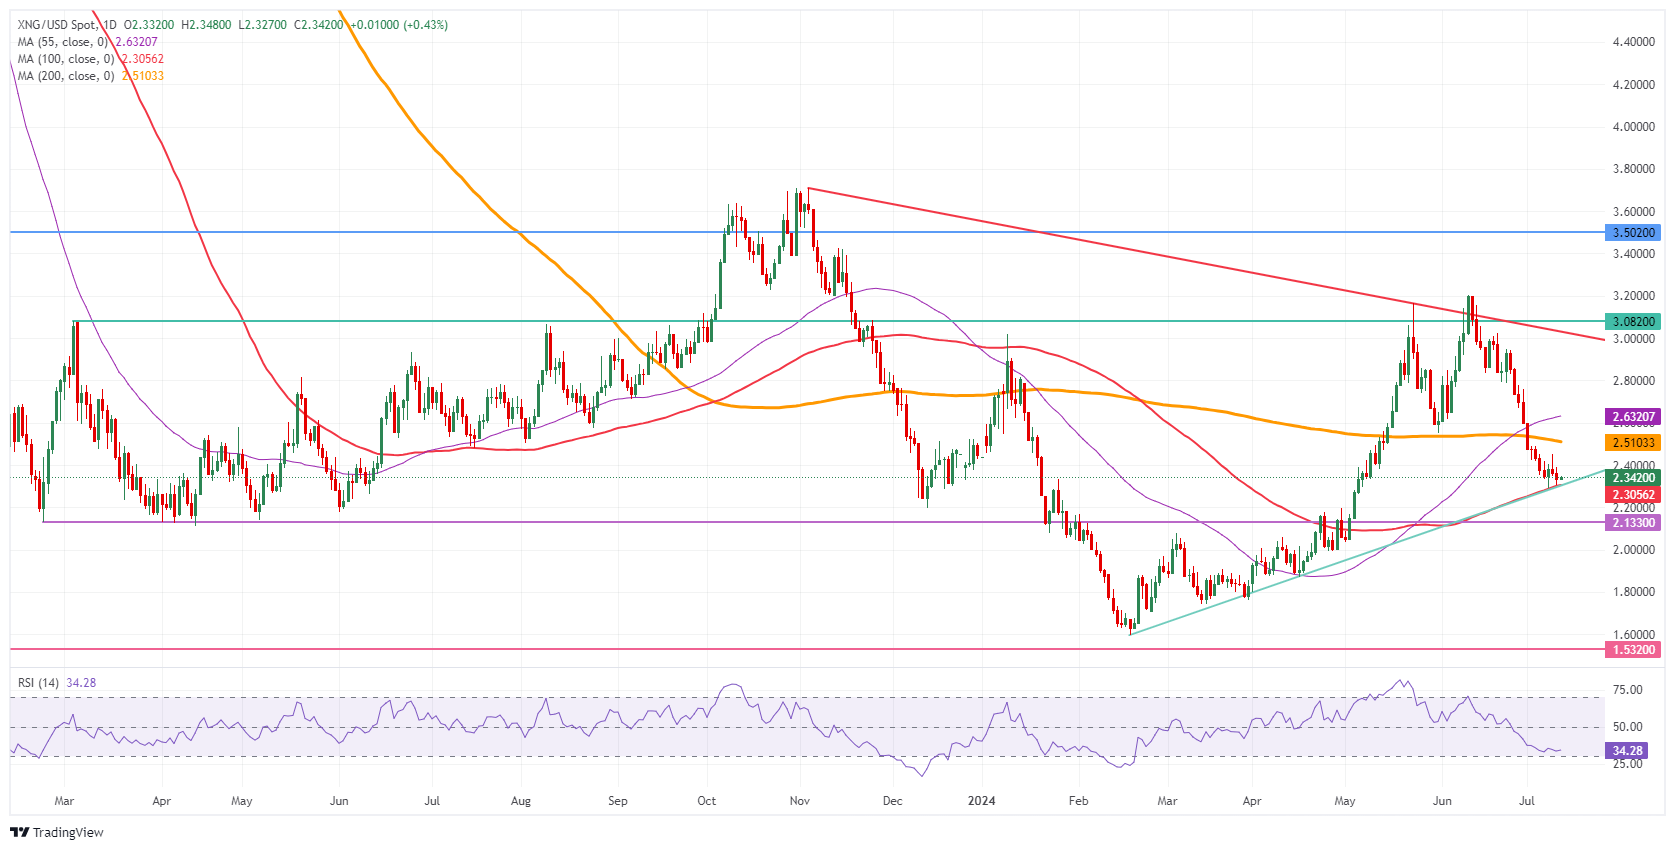
Natural Gas: Daily Chart
Natural Gas FAQs
Supply and demand dynamics are a key factor influencing Natural Gas prices, and are themselves influenced by global economic growth, industrial activity, population growth, production levels, and inventories. The weather impacts Natural Gas prices because more Gas is used during cold winters and hot summers for heating and cooling. Competition from other energy sources impacts prices as consumers may switch to cheaper sources. Geopolitical events are factors as exemplified by the war in Ukraine. Government policies relating to extraction, transportation, and environmental issues also impact prices.
The main economic release influencing Natural Gas prices is the weekly inventory bulletin from the Energy Information Administration (EIA), a US government agency that produces US gas market data. The EIA Gas bulletin usually comes out on Thursday at 14:30 GMT, a day after the EIA publishes its weekly Oil bulletin. Economic data from large consumers of Natural Gas can impact supply and demand, the largest of which include China, Germany and Japan. Natural Gas is primarily priced and traded in US Dollars, thus economic releases impacting the US Dollar are also factors.
The US Dollar is the world’s reserve currency and most commodities, including Natural Gas are priced and traded on international markets in US Dollars. As such, the value of the US Dollar is a factor in the price of Natural Gas, because if the Dollar strengthens it means less Dollars are required to buy the same volume of Gas (the price falls), and vice versa if USD strengthens.
- USD/JPY hovers below 161.50 as the US Dollar declines ahead of US Inflation data.
- The US inflation will influence market speculation for Fed rate cuts.
- Fears of Japan’s intervention have intensified.
The USD/JPY pair consolidates in a tight range near 161.50 in Thursday’s European session. The asset trades back and forth as investors have shifted to sidelines ahead of the United States (US) Consumer Price Index (CPI) data for June, which will be published at 12:30 GMT.
Economists expect that annual headline inflation decelerated to 3.1% from May’s reading of 3.3%. In the same period, the core CPI, which strips off volatile food and energy prices, is estimated to have grown steadily by 3.4%. On the month, the headline inflation grew at a meager pace of 0.1% after remaining unchanged, with core CPI rising steadily by 0.2%.
The inflation data will significantly impact firm speculation for the Federal Reserve (Fed) to begin lowering interest rates in September. Ahead of the US Inflation data, the US Dollar (USD) faces severe selling pressure as comments from Fed Chair Jerome Powell in his testimony before Congress signaled that the US economic growth has lost momentum.
Fed Powell said "Labor market conditions have cooled considerably compared to where they were two years ago," and added that the US “is no longer an overheated economy.”
Market sentiment remains cautious amid uncertainty ahead of US inflation data. S&P 500 futures have posted some losses in European trading hours. The US Dollar Index (DXY), which tracks the Greenback’s value against six major currencies, hovers near a four-week low around 104.85.
Meanwhile, in Asia, the Japanese Yen remains weak despite growing speculation of Japan’s stealth intervention. The Japanese Yen is close to a multi-decade low near 162.00 against the US Dollar amid uncertainty over room for further policy tightening by the Bank of Japan (BoJ).
Japanese Yen FAQs
The Japanese Yen (JPY) is one of the world’s most traded currencies. Its value is broadly determined by the performance of the Japanese economy, but more specifically by the Bank of Japan’s policy, the differential between Japanese and US bond yields, or risk sentiment among traders, among other factors.
One of the Bank of Japan’s mandates is currency control, so its moves are key for the Yen. The BoJ has directly intervened in currency markets sometimes, generally to lower the value of the Yen, although it refrains from doing it often due to political concerns of its main trading partners. The current BoJ ultra-loose monetary policy, based on massive stimulus to the economy, has caused the Yen to depreciate against its main currency peers. This process has exacerbated more recently due to an increasing policy divergence between the Bank of Japan and other main central banks, which have opted to increase interest rates sharply to fight decades-high levels of inflation.
The BoJ’s stance of sticking to ultra-loose monetary policy has led to a widening policy divergence with other central banks, particularly with the US Federal Reserve. This supports a widening of the differential between the 10-year US and Japanese bonds, which favors the US Dollar against the Japanese Yen.
The Japanese Yen is often seen as a safe-haven investment. This means that in times of market stress, investors are more likely to put their money in the Japanese currency due to its supposed reliability and stability. Turbulent times are likely to strengthen the Yen’s value against other currencies seen as more risky to invest in.
Our call is for a consensus 0.2% MoM core CPI in the US on Thursday. But markets should react to the decimal places before rounding, and the distribution of economists’ estimates suggests expectations may be slightly skewed towards a higher number, ING’s FX strategist Francesco Pesole notes.
Short-term risks for DXY appear skewed to 104.50
“Risk sentiment has improved into Thursday’s US June CPI report, perhaps as markets expect the figures to keep the Federal Reserve on track for a September rate cut, which is 20bp priced in. As usual, the market-moving sub-index will be the month-on-month CPI excluding food and energy, which we forecast at 0.2% in line with consensus.”
“The distribution of economists' estimates has a fatter right-end tail, meaning actual expectations are closer to 0.24% than 0.15% (both would be rounded to 0.2%). In year-on-year terms, the consensus number is 3.4% for core inflation, and headline CPI is expected to slow further from 3.3% to 3.1% YoY.”
“We have a slight bias for a weaker US Dollar (USD) today given the market’s recent dovish tendency despite inconclusive evidence for a September cut just yet. We still believe the Euro-heavy DXY index may not show the full extent of a softening of the USD that should primarily benefit high-beta currencies. Still, risks for DXY appear skewed to 104.50 in the very short term.”
We have US June consumer price inflation data. Federal Reserve Chair Powell thinks this matters, because politicians think this matters, and Powell thinks politicians are important. Economists, who are actually important, tend to regard headline US consumer price data as a rather poor-quality statistic, UBS macro strategist Paul Donovan suggests.
All attention to US CPI data
“The US CPI data details offer insight. Excluding the fantasy owners’ equivalent rent gives a better idea of middle-class US households’ spending power. Focusing on the real world, genuine service prices give some sense of cost pressures. Durable goods price deflation (prices are 5.3% below their highs) has been more pronounced.”
“The UK’s May monthly GDP data was quite strong, but is also not really market moving. The numbers are too unreliable to be seen as changing Bank of England policy—and something as simple as better weather can have an impact on monthly numbers.”
“Politicians are politicking. Markets ignore this because markets do not care much about politicians. The debate over US President Biden’s re-election bid is only likely to matter if probabilities around election outcomes and policies shift meaningfully. French President Macron tried being presidential and called for a broad ‘governing pact.’ Markets are skeptical.”

Source: The Wall Street Journal
- The Mexican Peso trades lower in its key pairs ahead of the release of Banxico’s June meeting Minutes.
- Uncertainty over the trajectory of future monetary policy in Mexico is making traders hesitant to place bets.
- The Peso weakens the most against the Pound after the release of better-than-expected UK GDP data.
The Mexican Peso (MXN) trades mixed in its key pairs on Thursday – rising versus the US Dollar (USD) but falling against the Pound Sterling (GBP) and the Euro (EUR). MXN’s weakness versus the Pound can be attributed to the release of better-than-expected UK Gross Domestic Product (GDP) data for May, which came out at 0.4% month-over-month, roundly beating economist’s estimates of 0.2%.
Traders are also hesitating ahead of the release of the Minutes of the Bank of Mexico’s (Banxico) last policy meeting. Uncertainty regarding the trajectory of interest rates has increased after the release of higher-than-expected headline Mexican inflation data for June. The impact of the Peso’s devaluation following the June election and the imported disinflation thus anticipated, are further factors complicating the outlook.
At the time of writing, one US Dollar (USD) buys 17.86 Mexican Pesos, EUR/MXN trades at 19.37, and GBP/MXN at 23.00.
Mexican Peso lower ahead of Banxico Minutes
The Mexican Peso is edging down on Thursday after rallying for roughly the last nine days – especially against the US Dollar. Traders are wary of placing bullish bets ahead of the release of the Minutes of Banxico’s June meeting, scheduled for 15:00 GMT.
The Minutes ought to provide more information on the Banxico’s stance in terms of the economy and the direction of future policy. These, in turn, could influence the Peso.
“We expect the minutes to elaborate on both disinflation forces and some of the upside risks embedded in the ongoing MXN re-adjustment, and the forces behind growth disappointments,” say analysts at JP Morgan.
Banxico’s board is expected to acknowledge the “underwhelming growth dynamics and downgrade its growth outlook — now openly underscoring downside risks to economic activity,” they added.
If accurate, JP Morgan’s preview suggests the Peso is at risk of weakening following the release, since a downgrade in the growth outlook will put more pressure on Banxico to cut interest rates despite the above-consensus rise in the June headline inflation data. Lower interest rates are negative for a currency as they reduce foreign capital inflows.
Mixed reaction to inflation data causes uncertainty
The 12-month inflation rate in June came out at 4.98%, which was higher than the 4.84% expected by economists and the 4.69% previously, according to data from INEGI.
Banxico Deputy Governor Jonathan Heath wrote on X that June’s inflation data was “very worrying.” Heath is seen as a monetary “hawk” of the Banxico board – in favor of higher interest rates – similar to Deputy Governor Irene Espinosa.
“Headline inflation reached 4.98% in June, the highest inflation rate in the last 12 months. On the margin, the annual rate for the second half of June registered 5.17%. Very worrisome,” wrote Heath.
This comes after Heath’s comments comparing his stance to that of the Chairman of the Federal Reserve, Jerome Powell, in terms of its data dependency. The effect of his words was to lower rate-cut bets and further fuel the rally in the Peso.
Deputy Governor of the Bank of Mexico Galia Borja urged caution in recent remarks.
“It's prudent not to make hasty decisions” regarding monetary policy, Borja said, adding that officials must be patient and current policy was “undoubtedly restrictive.”
Slowdown in core inflation could be key – Capital Economics
Whilst headline inflation in Mexico rose in June, core inflation, which excludes volatile food and energy components, came out below expectations at 0.22%, when economists had estimated 0.24%. Nevertheless, the June reading was above the 0.17% in May.
The slower increase in core inflation, however, makes economists at Capital Economics less concerned about the rise in headline inflation.
“Core inflation edged down last month. While there’s still a lot of uncertainty around the next rate decision in August, we think that the easing of core price pressures, alongside the weak run of activity data and the rebound in the Peso leave an August rate cut in play,” says Kimberley Sperrfechter, Emerging Markets Economist at Capital Economics.
Assuming Banxico does go ahead and cut interest rates in August, this could have a negative impact on the Peso.
Technical Analysis: USD/MXN possible in ABC correction
USD/MXN is possibly falling in the wave C of an ABC correction that started after the June 12 high. The short-term trend is bearish, and given “the trend is your friend” the odds favor more downside.
USD/MXN Daily Chart
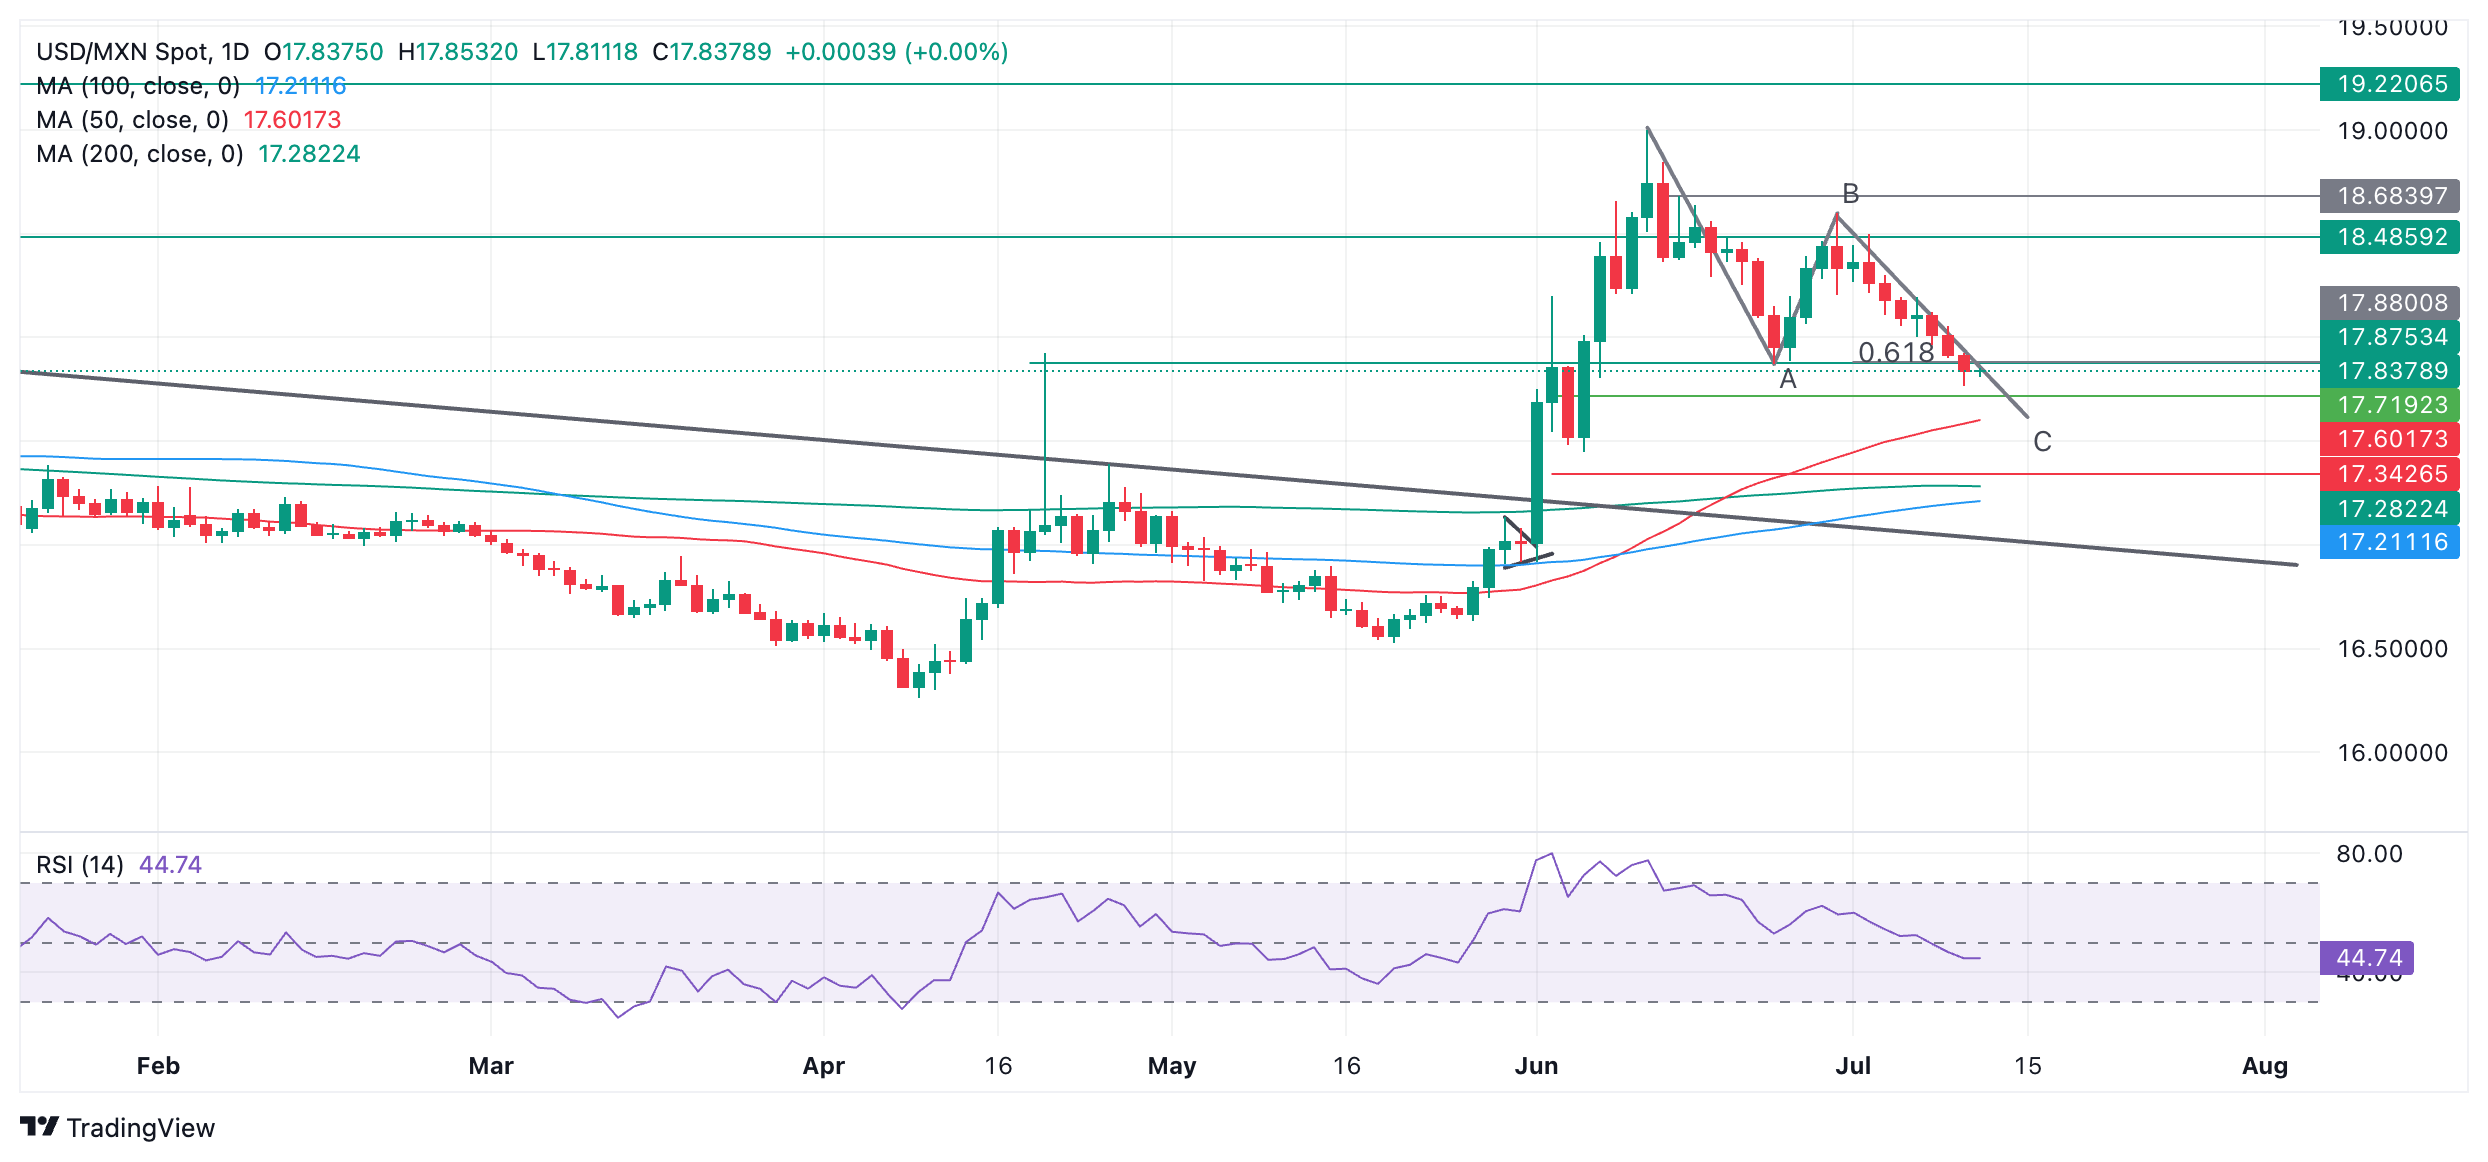
USD/MXN has broken support at the 17.87 (June 24 low), however, the break was not decisive, indicating the possibility it may be false and the pair could recover.
USD/MXN has also fallen to the conservative target for wave C, which is measured by taking the 0.618 Fibonacci ratio of wave A as a guide since C is often equal to A or a Fibonacci ratio of it. Given that the pair has reached this lesser target, there is a further risk of a recovery evolving.
If USD/MXN breaks below Wednesday’s low at 17.76, however, it would reinvigorate bears and probably lead to a move down to the target at the end of wave C, at roughly the level of the 50-day Simple Moving Average (SMA) situated at 17.60.
Meanwhile, the direction of the medium and long-term trends remain in doubt.
Economic Indicator
Core Inflation
The core inflation index released by the Bank of Mexico is a measure of price movements by the comparison between the retail prices of a representative shopping basket of goods and services, excluding taxes and energy. The purchase power of Mexican Peso is dragged down by inflation. The inflation index is a key indicator since it is used by the central bank to set interest rates. Generally speaking, a high reading is seen as positive (or bullish) for the Mexican Peso, while a low reading is seen as negative (or Bearish).
Read more.Last release: Tue Jul 09, 2024 12:00
Frequency: Monthly
Actual: 0.22%
Consensus: 0.24%
Previous: 0.17%
Source: National Institute of Statistics and Geography of Mexico
- The US Dollar eases ahead of a packed data release on Thursday.
- President Biden faces setbacks from famous supporters calling for him to step down.
- The US Dollar index hovers around 105.00, though tilted to the downside.
The US Dollar (USD) edges lower for a second day in a row when measured by the US Dollar Index. The Greenback does not have much reason to rally firmly, with uncertainty creeping in its valuation after big names such as Nancy Pelosi and actor George Clooney came out on social media asking for President Joe Biden to drop out of the race and pave the way for a better candidate. It is a big blow for the current ruling President as concerns keep biting away at the polling numbers.
On the economic front, only one element counts on Thursday: the US Consumer Price Index (CPI) in all its forms and colours. Traders will want to see at least the disinflationary nature of the numbers being confirmed, which should keep markets on track for an interest rate cut in September. Add in the weekly Jobless Claims data, and the US Dollar might be easing a bit further on the back of any upticks in the Jobless numbers.
Daily digest market movers: Finally, some moves to come
- At 12:30 GMT, different economic data will be released at the same moment. Let us walk you through the main numbers to focus on:
- US CPI for June:
- Monthly headline CPI is expected to tick up marginally by 0.1% from 0.0%.
- Monthly core CPI should remain stable at 0.2%.
- Annual headline CPI should increase at a slower pace of 3.1% from 3.3% in May.
- Annual core CPI is expected to grow steadily at 3.4%.
- Weekly Jobless Claims for the week of July 5:
- Initial Claims are expected to head to 236,000 from 238,000.
- Continuing Claims are seen heading to 1.860 million from 1.858 million.
- US CPI for June:
- At 15:30 GMT, President of Federal Reserve Bank of Atlanta Raphael Bostic participates in a moderated conversation at the NCUA's Diversity, Equity, and Inclusion Summit in Minneapolis, United States.
- Equity markets are gearing up for the next earnings season, which gets underway with earnings from Pepsico and Delta before the opening bell on Thursday. Equities overall are in a good mood with solid gains in Asia and positive returns in Europe, while US futures are lagging a touch.
- The CME Fedwatch Tool is broadly backing a rate cut in September despite recent comments from Fed officials. The odds now stand at 70.0% for a 25-basis-point cut. A rate pause stands at a 26.7% chance, while a 50-basis-point rate cut has a slim 3.3% possibility.
- The US 10-year benchmark rate trades at 4.28% and remains near the lower level for the week.
US Dollar Index Technical Analysis: Make or break for September
The US Dollar Index (DXY) faces a key pivotal moment with the US Consumer Price Index release for June. This is the make-or-break moment for September rate cut prospects, with any uptick snapping the disinflationary trajectory that would mean that September meeting is off the table. So, expect markets to give a more significant probability of a further easing of the DXY than a stronger US Dollar.
On the upside, the 55-day Simple Moving Average (SMA) at 105.14 remains the first resistance. Should that level be reclaimed again, 105.53 and 105.89 are the following nearby pivotal levels. The red descending trend line in the chart below at around 106.23 and April’s peak at 106.52 could come into play should the Greenback rally substantially.
On the downside, the risk of a nosedive move is increasing, with only the double support at 104.81, which is the confluence of the 100-day SMA and the green ascending trend line from December 2023, still in place. Should that double layer give way, the 200-day SMA at 104.41 is the gatekeeper that should catch the DXY and avoid further declines. Further down, the correction could head to 104.00 as an initial stage.
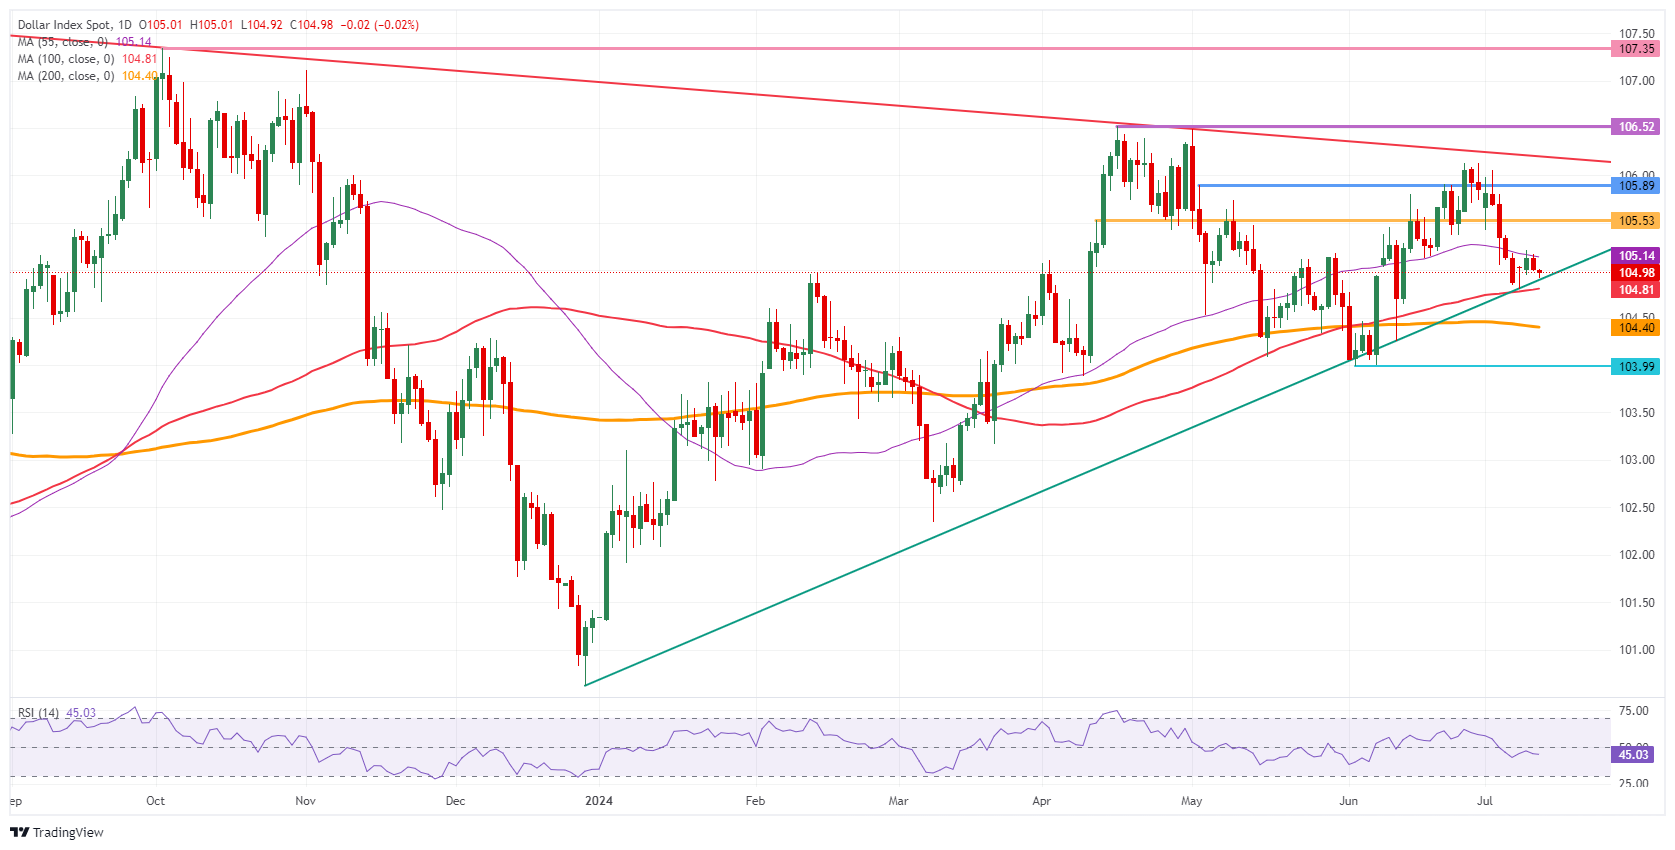
US Dollar Index: Daily Chart
Inflation FAQs
Inflation measures the rise in the price of a representative basket of goods and services. Headline inflation is usually expressed as a percentage change on a month-on-month (MoM) and year-on-year (YoY) basis. Core inflation excludes more volatile elements such as food and fuel which can fluctuate because of geopolitical and seasonal factors. Core inflation is the figure economists focus on and is the level targeted by central banks, which are mandated to keep inflation at a manageable level, usually around 2%.
The Consumer Price Index (CPI) measures the change in prices of a basket of goods and services over a period of time. It is usually expressed as a percentage change on a month-on-month (MoM) and year-on-year (YoY) basis. Core CPI is the figure targeted by central banks as it excludes volatile food and fuel inputs. When Core CPI rises above 2% it usually results in higher interest rates and vice versa when it falls below 2%. Since higher interest rates are positive for a currency, higher inflation usually results in a stronger currency. The opposite is true when inflation falls.
Although it may seem counter-intuitive, high inflation in a country pushes up the value of its currency and vice versa for lower inflation. This is because the central bank will normally raise interest rates to combat the higher inflation, which attract more global capital inflows from investors looking for a lucrative place to park their money.
Formerly, Gold was the asset investors turned to in times of high inflation because it preserved its value, and whilst investors will often still buy Gold for its safe-haven properties in times of extreme market turmoil, this is not the case most of the time. This is because when inflation is high, central banks will put up interest rates to combat it. Higher interest rates are negative for Gold because they increase the opportunity-cost of holding Gold vis-a-vis an interest-bearing asset or placing the money in a cash deposit account. On the flipside, lower inflation tends to be positive for Gold as it brings interest rates down, making the bright metal a more viable investment alternative.
- Silver price’s upside remains capped near $31.00 with a focus on the US Inflation.
- The US Dollar remains on the backfoot amid firm Fed rate-cut bets.
- Fed Powell sees cracks in US labor market strength.
Silver price (XAG/USD) consolidates in a tight range for the last four trading sessions. The upside in the Silver price remains limited to around $31.00 as investors await the United States (US) Consumer Price Index (CPI) data for June, which will be published at 12:30 GMT.
The inflation data will significantly influence market speculation for Federal Reserve (Fed) rate cuts this year. According to the CME FedWatch tool, traders expect that the central bank will choose the September meeting as the earliest point for pivoting to policy normalization. The tool also shows that there will be two rate cuts instead of one as signaled by officials in the latest dot plot.
Meanwhile, the US CPI report is expected to show that the core consumer inflation, which strips off volatile food and energy prices, grew steadily, while annual headline figure declined to 3.1% from May’s reading of 3.3%.
Market expectations for Fed rate cuts strengthened on widening cracks in the US labor market due to the maintenance of a restrictive interest rate stance. In the semi-annual Congressional testimony, Fed Chair Jerome Powell admitted that the economy is no longer overheated, with cooling job market conditions. He added that the labor market has moderated to where it was before pandemic-era.
Firm rate-cut speculation weighs on the US Dollar (USD). The US Dollar Index (DXY), which tracks the Greenback’s value against six major currencies, appears to be vulnerable near a four-week low around 104.85
Silver technical analysis
Silver price trades sideways in a narrow range around $31.00, suggesting a sharp volatility contraction. The overall trend remains bullish as it has turned sideways after a decisive breakout of the Bullish Flag chart formation on a four-hour timeframe. The asset trades close to the 20-period Exponential Moving Average (EMA) near $31.00, suggesting indecisiveness ahead of US inflation data.
The 14-period Relative Strength Index (RSI) hovers near 60.00. A decisive break above the same would push the momentum toward the upside.
Silver four-hour chart
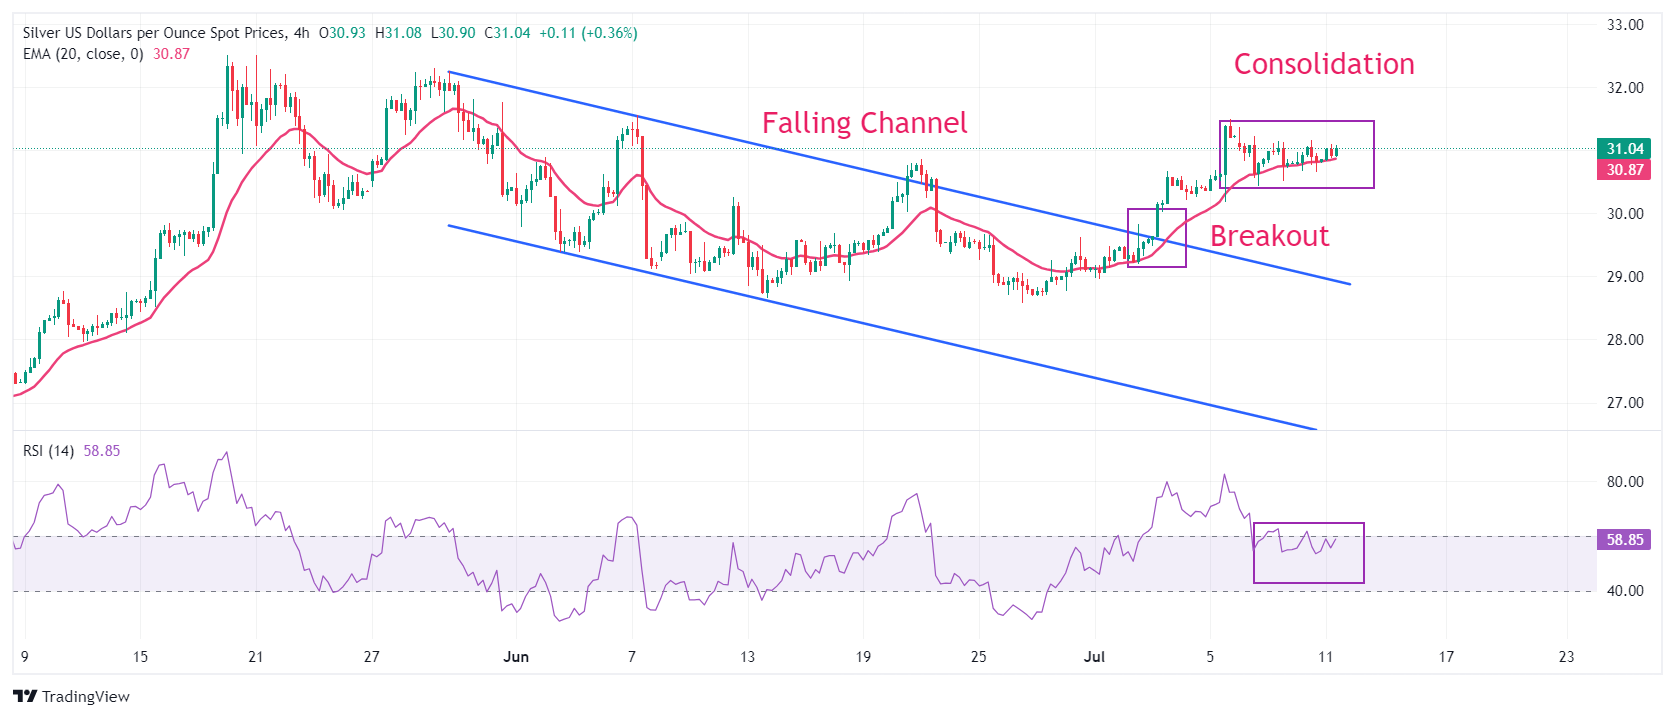
Economic Indicator
Consumer Price Index (YoY)
Inflationary or deflationary tendencies are measured by periodically summing the prices of a basket of representative goods and services and presenting the data as The Consumer Price Index (CPI). CPI data is compiled on a monthly basis and released by the US Department of Labor Statistics. The YoY reading compares the prices of goods in the reference month to the same month a year earlier.The CPI is a key indicator to measure inflation and changes in purchasing trends. Generally speaking, a high reading is seen as bullish for the US Dollar (USD), while a low reading is seen as bearish.
Read more.Next release: Thu Jul 11, 2024 12:30
Frequency: Monthly
Consensus: 3.1%
Previous: 3.3%
Source: US Bureau of Labor Statistics
The US Federal Reserve has a dual mandate of maintaining price stability and maximum employment. According to such mandate, inflation should be at around 2% YoY and has become the weakest pillar of the central bank’s directive ever since the world suffered a pandemic, which extends to these days. Price pressures keep rising amid supply-chain issues and bottlenecks, with the Consumer Price Index (CPI) hanging at multi-decade highs. The Fed has already taken measures to tame inflation and is expected to maintain an aggressive stance in the foreseeable future.
- EUR/USD rose to a fresh one-month high near 1.0850 amid weakness in the US Dollar ahead of the US inflation data for June.
- The US Dollar declines as Fed’s Powell took away fears of inflation remaining persistent.
- The Euro capitalizes on easing fears of a widening French financial crisis and diminishing ECB rate cut prospects.
EUR/USD posts a fresh one-month high at around 1.0850 in Thursday’s European session. The major currency pair strengthens as the US Dollar (USD) is facing selling pressure due to firm expectations that the Federal Reserve (Fed) will start reducing interest rates in September. The US Dollar Index (DXY), which tracks the Greenback’s value against six major currencies, edges lower to near 104.90.
Market speculation for Fed rate cuts in September increased as comments from Fed Chair Jerome Powell, in the semi-annual Congressional testimony, indicated that the central bank has made quite a bit of progress in inflation and that labor market strength appears to have eased. Powell refrained from announcing a victory on inflation and said rate cuts would be appropriate when policymakers gain confidence that inflation will return to the desired rate of 2%.
For meaningful guidance on the interest rate outlook, investors await the US Consumer Price Index (CPI) data for June, which will be published at 12:30 GMT. The CPI report is expected to show that the core inflation, which strips off volatile food and energy items, grew steadily by 0.2% and 3.4% on monthly and annual basis, respectively. Annual headline inflation is estimated to have decelerated to 3.1% from May’s reading of 3.3%, while the monthly figure is expected to have barely grown after remaining unchanged in May.
A scenario in which price pressures remain sticky or hotter-than-expected would force trades to pare bets of rate cuts in September. On the contrary, soft numbers will be favorable for lowering borrowing costs. A decline in the US inflation would also increase confidence that the disinflation process has resumed and high price pressures recorded in the first quarter were mere a short-term blip.
Daily digest market movers: EUR/USD rises as prospects of ECB’s subsequent rate cuts wane
- EUR/USD moves higher to 1.0850 as concerns over the widening French financial crisis ease as Marine Le Pen’s far-right National Rally failed to maintain dominance over French President Emmanuel Macron's centrist alliance and the left-wing coalition, also known as New Popular Front, led by Jean-Luc Melenchon.
- Economists were worried about the far right coming to power, which was expected to steer fiscal expansion. Currently, the centrist alliance is expected to join hands with the left wing to form a coalition government.
- Apart from diminishing fears of French financial crisis, easing expectations of subsequent rate cuts by the European Central Bank (ECB) have also brought stability to the Euro’s appeal.
- Traders pare bets favoring ECB’s back-to-back rate cuts as ECB policymakers hesitate to commit to a specific rate-cut path. ECB officials worry that an aggressive approach could revamp price pressures again. However, they are comfortable with expectations of more rate cuts this year.
- Meanwhile, revised estimates for the German Harmonized Index of Consumer Prices (HICP) confirmed that price pressures decelerated in June. Annual HICP grew at a slower pace of 2.5% from May’s reading of 2.8%.
Technical Analysis: EUR/USD delivers Bullish Flag breakout
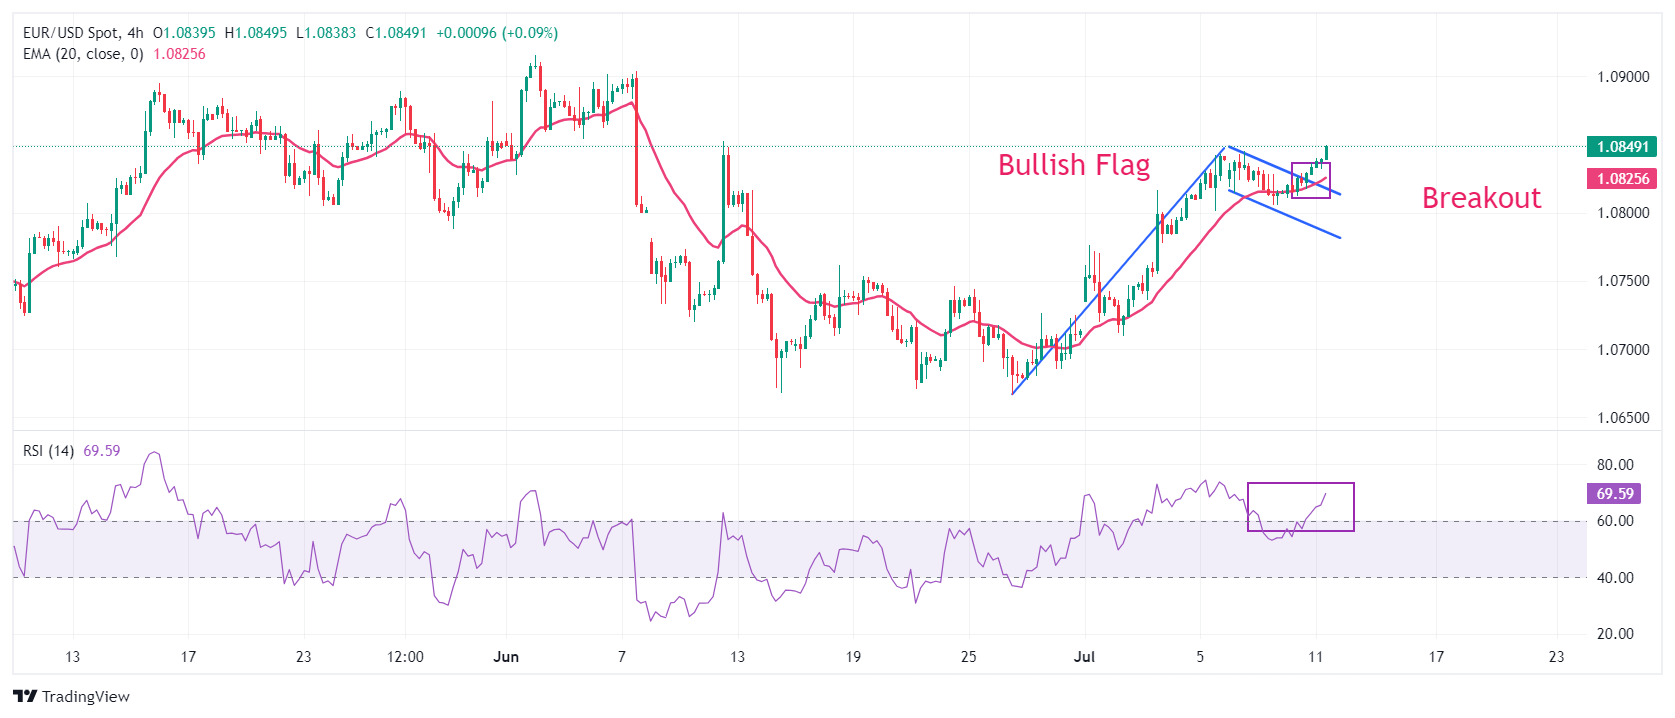
EUR/USD strengthens after delivering a breakout of the Bullish Flag formation in a 4-hour timeframe. A breakout of the above-mentioned chart pattern results in a continuation of the trend, which in this case is bullish.
The 20-period Exponential Moving Average (EMA) near 1.0825 continues to support the Euro bulls.
The 14-day Relative Strength Index (RSI) establishes into the bullish range of 60.00-80.00, indicating that momentum has leaned to the upside.
Going forward, the psychological figure of 1.0900 will be a key target for the Euro bulls. On the downside, the June 19 high at around 1.0750 will be a major support zone.
Euro FAQs
The Euro is the currency for the 20 European Union countries that belong to the Eurozone. It is the second most heavily traded currency in the world behind the US Dollar. In 2022, it accounted for 31% of all foreign exchange transactions, with an average daily turnover of over $2.2 trillion a day. EUR/USD is the most heavily traded currency pair in the world, accounting for an estimated 30% off all transactions, followed by EUR/JPY (4%), EUR/GBP (3%) and EUR/AUD (2%).
The European Central Bank (ECB) in Frankfurt, Germany, is the reserve bank for the Eurozone. The ECB sets interest rates and manages monetary policy. The ECB’s primary mandate is to maintain price stability, which means either controlling inflation or stimulating growth. Its primary tool is the raising or lowering of interest rates. Relatively high interest rates – or the expectation of higher rates – will usually benefit the Euro and vice versa. The ECB Governing Council makes monetary policy decisions at meetings held eight times a year. Decisions are made by heads of the Eurozone national banks and six permanent members, including the President of the ECB, Christine Lagarde.
Eurozone inflation data, measured by the Harmonized Index of Consumer Prices (HICP), is an important econometric for the Euro. If inflation rises more than expected, especially if above the ECB’s 2% target, it obliges the ECB to raise interest rates to bring it back under control. Relatively high interest rates compared to its counterparts will usually benefit the Euro, as it makes the region more attractive as a place for global investors to park their money.
Data releases gauge the health of the economy and can impact on the Euro. Indicators such as GDP, Manufacturing and Services PMIs, employment, and consumer sentiment surveys can all influence the direction of the single currency. A strong economy is good for the Euro. Not only does it attract more foreign investment but it may encourage the ECB to put up interest rates, which will directly strengthen the Euro. Otherwise, if economic data is weak, the Euro is likely to fall. Economic data for the four largest economies in the euro area (Germany, France, Italy and Spain) are especially significant, as they account for 75% of the Eurozone’s economy.
Another significant data release for the Euro is the Trade Balance. This indicator measures the difference between what a country earns from its exports and what it spends on imports over a given period. If a country produces highly sought after exports then its currency will gain in value purely from the extra demand created from foreign buyers seeking to purchase these goods. Therefore, a positive net Trade Balance strengthens a currency and vice versa for a negative balance.
The Reserve Bank of New Zealand (RBNZ) has decided to leave its official cash rate (OCR) unchanged at 5.50% in Jul for an eighth straight meeting. The RBNZ’s tone was a lot less hawkish than in May, UOB Group economist Lee Sue Ann notes.
RBNZ leaves its official cash rate unchanged
“RBNZ has decided to leave its official cash rate (OCR) unchanged at 5.50% in Jul for an eighth straight meeting. The decision made on Wednesday, 10 Jul, was an interim review, and hence there was no Monetary Policy Statement, updated economic forecasts nor press conference by RBNZ Governor Adrian Orr.”
“The RBNZ’s tone was a lot less hawkish than in May, when policymakers discussed the case to raise rates further while signaling that a rate cut was unlikely before 3Q25. Instead, there was no mention of a rate hike, and the RBNZ highlighted that ‘restrictive monetary policy has significantly reduced consumer price inflation’.”
“We are currently maintaining our view for the first rate cut to occur in 4Q24, as recent economic data shows the service and manufacturing sectors softening and business confidence falling. All eyes will now turn to 2Q24 CPI data on 17 Jul, while the next monetary policy meeting will be on 14 Aug.”
- WTI price depreciates as the IEA expects global Oil demand growth to slow in 2024 and 2025.
- IEA stated that China’s share of global demand will decline to around 40% from last year’s 70%.
- US Crude Oil Stocks declined by 3.443 million barrels, against the expected decline of 3.0 million barrels.
West Texas Intermediate (WTI) Oil price retraces gains from the previous session, trading around $81.40 per barrel during European hours on Thursday. Crude Oil prices are under pressure as the International Energy Agency (IEA) reported that global Oil demand growth is expected to slow to just under a million barrels per day (bpd) in 2024 and 2025, according to Reuters.
In its monthly Oil report, the IEA noted that global demand in the second quarter increased by 710,000 bpd year-on-year, marking the smallest quarterly rise in over a year. This slowdown is attributed to reduced Chinese consumption amid economic challenges. The IEA stated, "China’s pre-eminence is fading. Last year the country accounted for 70% of global demand gains; this will decline to around 40% in 2024 and 2025."
Traders await the upcoming US Consumer Price Index (CPI) data for June, set to be released on Thursday, for more insights into the Federal Reserve's (Fed) monetary policy direction. Higher interest rates affect the US economy, the largest Oil consumer in the world, which in turn impacts crude Oil demand.
Oil prices found some support due to a larger-than-expected drawdown in US crude inventories. The Energy Information Administration (EIA) reported a decline of 3.443 million barrels in US Crude Oil Stocks for the week ended July 5, surpassing the expected decrease of 3.0 million barrels.
WTI Oil FAQs
WTI Oil is a type of Crude Oil sold on international markets. The WTI stands for West Texas Intermediate, one of three major types including Brent and Dubai Crude. WTI is also referred to as “light” and “sweet” because of its relatively low gravity and sulfur content respectively. It is considered a high quality Oil that is easily refined. It is sourced in the United States and distributed via the Cushing hub, which is considered “The Pipeline Crossroads of the World”. It is a benchmark for the Oil market and WTI price is frequently quoted in the media.
Like all assets, supply and demand are the key drivers of WTI Oil price. As such, global growth can be a driver of increased demand and vice versa for weak global growth. Political instability, wars, and sanctions can disrupt supply and impact prices. The decisions of OPEC, a group of major Oil-producing countries, is another key driver of price. The value of the US Dollar influences the price of WTI Crude Oil, since Oil is predominantly traded in US Dollars, thus a weaker US Dollar can make Oil more affordable and vice versa.
The weekly Oil inventory reports published by the American Petroleum Institute (API) and the Energy Information Agency (EIA) impact the price of WTI Oil. Changes in inventories reflect fluctuating supply and demand. If the data shows a drop in inventories it can indicate increased demand, pushing up Oil price. Higher inventories can reflect increased supply, pushing down prices. API’s report is published every Tuesday and EIA’s the day after. Their results are usually similar, falling within 1% of each other 75% of the time. The EIA data is considered more reliable, since it is a government agency.
OPEC (Organization of the Petroleum Exporting Countries) is a group of 13 Oil-producing nations who collectively decide production quotas for member countries at twice-yearly meetings. Their decisions often impact WTI Oil prices. When OPEC decides to lower quotas, it can tighten supply, pushing up Oil prices. When OPEC increases production, it has the opposite effect. OPEC+ refers to an expanded group that includes ten extra non-OPEC members, the most notable of which is Russia.
In its monthly oil market report published on Thursday, the International Energy Agency (IEA) maintained the 2024 global oil demand growth forecast at 970,000 barrels per day (bpd).
Additional takeaways
2025 global supply growth will reach 1.8 mln bpd, with US, Canada, Guyana and Brazil leading gains.
Oil supply growth in 2024 to hit 770,000 bpd, boosting oil supply to a record 103 mln bpd.
Sees Q3 call on OPEC+ crude 800,000 bpd higher than June output.
Subpar economic growth, greater efficiencies and vehicle electrification to hit demand in 2024, 2025.
China accounted for 70% of global demand gains in 2023 but just around 40% in 2024 and 2025.
Chinese consumption contracted as post-pandemic rebound has run its course.
Oil demand growth slowed to 710,000 in 2024, the lowest quarterly increase in over a year.
Lowers 2025 oil demand growth outlook by 50,000 bpd to 980,000 bpd.
Market reaction
At the time of writing, WTI is holding steady at around $81.50.
WTI Oil FAQs
WTI Oil is a type of Crude Oil sold on international markets. The WTI stands for West Texas Intermediate, one of three major types including Brent and Dubai Crude. WTI is also referred to as “light” and “sweet” because of its relatively low gravity and sulfur content respectively. It is considered a high quality Oil that is easily refined. It is sourced in the United States and distributed via the Cushing hub, which is considered “The Pipeline Crossroads of the World”. It is a benchmark for the Oil market and WTI price is frequently quoted in the media.
Like all assets, supply and demand are the key drivers of WTI Oil price. As such, global growth can be a driver of increased demand and vice versa for weak global growth. Political instability, wars, and sanctions can disrupt supply and impact prices. The decisions of OPEC, a group of major Oil-producing countries, is another key driver of price. The value of the US Dollar influences the price of WTI Crude Oil, since Oil is predominantly traded in US Dollars, thus a weaker US Dollar can make Oil more affordable and vice versa.
The weekly Oil inventory reports published by the American Petroleum Institute (API) and the Energy Information Agency (EIA) impact the price of WTI Oil. Changes in inventories reflect fluctuating supply and demand. If the data shows a drop in inventories it can indicate increased demand, pushing up Oil price. Higher inventories can reflect increased supply, pushing down prices. API’s report is published every Tuesday and EIA’s the day after. Their results are usually similar, falling within 1% of each other 75% of the time. The EIA data is considered more reliable, since it is a government agency.
OPEC (Organization of the Petroleum Exporting Countries) is a group of 13 Oil-producing nations who collectively decide production quotas for member countries at twice-yearly meetings. Their decisions often impact WTI Oil prices. When OPEC decides to lower quotas, it can tighten supply, pushing up Oil prices. When OPEC increases production, it has the opposite effect. OPEC+ refers to an expanded group that includes ten extra non-OPEC members, the most notable of which is Russia.
Silver prices (XAG/USD) rose on Thursday, according to FXStreet data. Silver trades at $31.01 per troy ounce, up 0.62% from the $30.82 it cost on Wednesday.
Silver prices have increased by 30.32% since the beginning of the year.
| Unit measure | Silver Price Today in USD |
|---|---|
| Troy Ounce | 31.01 |
| 1 Gram | 1.00 |
The Gold/Silver ratio, which shows the number of ounces of Silver needed to equal the value of one ounce of Gold, stood at 76.82 on Thursday, down from 76.95 on Wednesday.
Silver FAQs
Silver is a precious metal highly traded among investors. It has been historically used as a store of value and a medium of exchange. Although less popular than Gold, traders may turn to Silver to diversify their investment portfolio, for its intrinsic value or as a potential hedge during high-inflation periods. Investors can buy physical Silver, in coins or in bars, or trade it through vehicles such as Exchange Traded Funds, which track its price on international markets.
Silver prices can move due to a wide range of factors. Geopolitical instability or fears of a deep recession can make Silver price escalate due to its safe-haven status, although to a lesser extent than Gold's. As a yieldless asset, Silver tends to rise with lower interest rates. Its moves also depend on how the US Dollar (USD) behaves as the asset is priced in dollars (XAG/USD). A strong Dollar tends to keep the price of Silver at bay, whereas a weaker Dollar is likely to propel prices up. Other factors such as investment demand, mining supply – Silver is much more abundant than Gold – and recycling rates can also affect prices.
Silver is widely used in industry, particularly in sectors such as electronics or solar energy, as it has one of the highest electric conductivity of all metals – more than Copper and Gold. A surge in demand can increase prices, while a decline tends to lower them. Dynamics in the US, Chinese and Indian economies can also contribute to price swings: for the US and particularly China, their big industrial sectors use Silver in various processes; in India, consumers’ demand for the precious metal for jewellery also plays a key role in setting prices.
Silver prices tend to follow Gold's moves. When Gold prices rise, Silver typically follows suit, as their status as safe-haven assets is similar. The Gold/Silver ratio, which shows the number of ounces of Silver needed to equal the value of one ounce of Gold, may help to determine the relative valuation between both metals. Some investors may consider a high ratio as an indicator that Silver is undervalued, or Gold is overvalued. On the contrary, a low ratio might suggest that Gold is undervalued relative to Silver.
(An automation tool was used in creating this post.)
The US Dollar (USD) is expected to trade between 7.2700 and 7.3100 for the time being, UOB Group FX analysts Quek Ser Leang and Peter Chia note.
Rangebound between 7.2700 and 7.3100
24-HOUR VIEW: “USD continues to trade in a quiet manner yesterday, between 7.2885 and 7.2939. The traded range was narrower than our expected range of 7.2820/7.2950. The quiet price action provides no fresh clues. Today, we continue to expect USD to trade in a range between 7.2820 and 7.2950.”
1-3 WEEKS VIEW: “Last Thursday (04 Jul, spot at 7.3000), we highlighted that the recent buildup of upward momentum had largely dissipated. We were of the view that the current price movements are likely part of a consolidation, and we expected USD to trade between 7.2700 and 7.3100 or the time being. There is no change in our view.”
Instead of continuing to rise, the US Dollar (USD) is likely to trade in a sideways range of 161.25/161.80. Upward momentum is building, but USD has to break and close above 162.00 before a sustained advance is likely, UOB Group FX analysts Quek Ser Leang and Peter Chia note.
A break above 162.00 is not ruled out
24-HOUR VIEW: “We highlighted yesterday that USD ‘is likely to edge higher.’ However, we were of the view that ‘any advance is unlikely to break above the major resistance at 161.80.’ USD rose more than expected, reaching a high of 161.82. The advance appears to be running ahead of itself, and instead of continuing to rise, USD is likely to trade in a sideways range of 161.25/161.80.”
1-3 WEEKS VIEW: “On Monday (08 Jul, spot at 160.65), we indicated that the USD strength from the middle of last month has come to an end. We also indicated that ‘the current price movements are likely part of a range trading phase, and USD is likely to trade between 159.40 and 161.80.’ Yesterday, USD rose a couple of pips above 161.80. Upward momentum appears to be building, but at this time, it is not sufficiently strong to suggest a resumption of USD strength. USD has to break and close above 162.00 before a sustained advance is likely. The likelihood of USD breaking clearly above 162.00 is not high for now, but it will remain intact as long as 160.60 is not breached.”
The New Zealand Dollar (NZD) is likely to trade in a range, probably between 0.6070 and 0.6115. But NZD could also edge lower; the prospect of it breaking below 0.6045 is not high for now, UOB Group FX analysts Quek Ser Leang and Peter Chia note.
The prospect of breaking below 0.6045 is not high
24-HOUR VIEW: “The sharp drop in NZD that reached a low of 0.6060 was surprising (we were expected consolidation). The sharp drop appears to be overdone, and NZD is unlikely to weaken further. Today, NZD is more likely to trade in a range, probably between 0.6070 and 0.6115.”
1-3 WEEKS VIEW: “Last Thursday (04 Jul, spot at 0.6105), we held the view that the recovery in NZD has potential to extend to 0.6150. After NZD rose, we highlighted on Monday (08 Jul, spot at 0.6145) that ‘the risk is for further NZD strength, and the levels to watch are 0.6180 and 0.6200.’ NZD subsequently rose to 0.6171. Yesterday, it fell and broke below our ‘strong support’ level of 0.6100. Not only has upward momentum faded, but downward momentum has also increased somewhat. From here, NZD could edge lower, but at this time, the prospect of it breaking the major support at 0.6045 is not high. Should NZD break above 0.6130, it would mean that downward momentum has eased.”
Mild upward momentum is likely to lead to the Australian Dollar (AUD) edging higher. Any advance is unlikely to reach the major resistance at 0.6800, but nevertheless increasing upward momentum suggests AUD is likely to continue to rise to 0.6800, UOB Group FX analysts Quek Ser Leang and Peter Chia note.
The next major resistance is at 0.6800
24-HOUR VIEW: “Yesterday, we indicated that ‘further range trading seems likely, probably in a range of 0.6725/0.6755.’ AUD subsequently traded between 0.6733 and 0.6752, closing largely unchanged at 0.6747 (+0.09%). Upward momentum seems to be building, albeit tentatively. Today, AUD is likely to edge higher. Given the mild upward momentum, any advance is unlikely to reach 0.6800. There is another resistance level at 0.6775. Support is at 0.6735; a breach of 0.6725 would mean that the mild upward pressure has faded.”
1-3 WEEKS VIEW: “We continue to hold the same as Monday (08 Jul, spot at 0.6745). As highlighted, increasing upward momentum suggests AUD is likely to continue to rise to 0.6800. Overall, only a breach of 0.6700 (‘strong support’ level previously at 0.6690) would indicate that the AUD strength that started early last week has come to an end.”
Price action continues to suggest upside risk, so there’s room for the Pound Sterling (GBP) to grow towards the next major resistance at 1.2900, UOB Group FX analysts Quek Ser Leang and Peter Chia note.
The next level to watch is at 1.2900
24-HOUR VIEW: “Our expectation for GBP to trade in a sideways range of 1.2770/1.2820 yesterday was incorrect. Instead of trading sideways, GBP rose sharply to a high of 1.2849. Upward momentum is building, and today GBP broke above 1.2860, so the next major resistance is at 1.2900. To maintain the momentum buildup, GBP must not break below 1.2805, with minor support at 1.2825.”
1-3 WEEKS VIEW: “On Monday (08 Jul, spot at 1.2805), we indicated that ‘the risk for GBP remains on the upside, and the level to watch is 1.2860.’ We added, ‘if GBP breaks below 1.2750, it would mean that the upside risk from last Thursday has faded.’ Yesterday, GBP rose and closed at a 4-month high of 1.2849 (+0.48%). The price action continues to suggest upside risk. The next level to monitor is 1.2900. On the downside, the ‘strong support’ level has moved higher to 1.2775 from 1.2750.”
- AUD/USD may test the upper boundary of the ascending channel around the level of 0.6785.
- The 14-day RSI is positioned slightly below the 70 level, indicating potential overbought conditions and a forthcoming correction.
- The key support appears at the lower boundary of the ascending channel around 0.6675 level.
AUD/USD extends its losses for the third successive day, trading around 0.6760 during the European hours on Thursday. The analysis of the daily chart shows that the AUD/USD pair consolidates within an ascending channel, indicating a bullish bias in the pair's price action.
Additionally, the 14-day Relative Strength Index (RSI) is positioned slightly below the 70 level, indicating confirmation of the bullish trend while also suggesting potential overbought conditions. A breach above this level could signal a need for caution, possibly indicating a forthcoming correction.
Furthermore, the momentum indicator Moving Average Convergence Divergence (MACD) line is above the centerline, suggesting upward price movement. Divergence above the signal line further confirms this bullish trend, as it indicates increasing positive momentum.
The AUD/USD pair may test the upper boundary of the ascending channel at approximately 0.6785. If it breaks through this level, the pair could target the psychological level of 0.6800.
On the downside, the AUD/USD pair may find support around the lower boundary of the ascending channel at the 0.6675 level, with additional support near the 50-day Exponential Moving Average (EMA) at 0.6651. A break below this level could push the pair toward the throwback support around 0.6590.
AUD/USD: Daily Chart
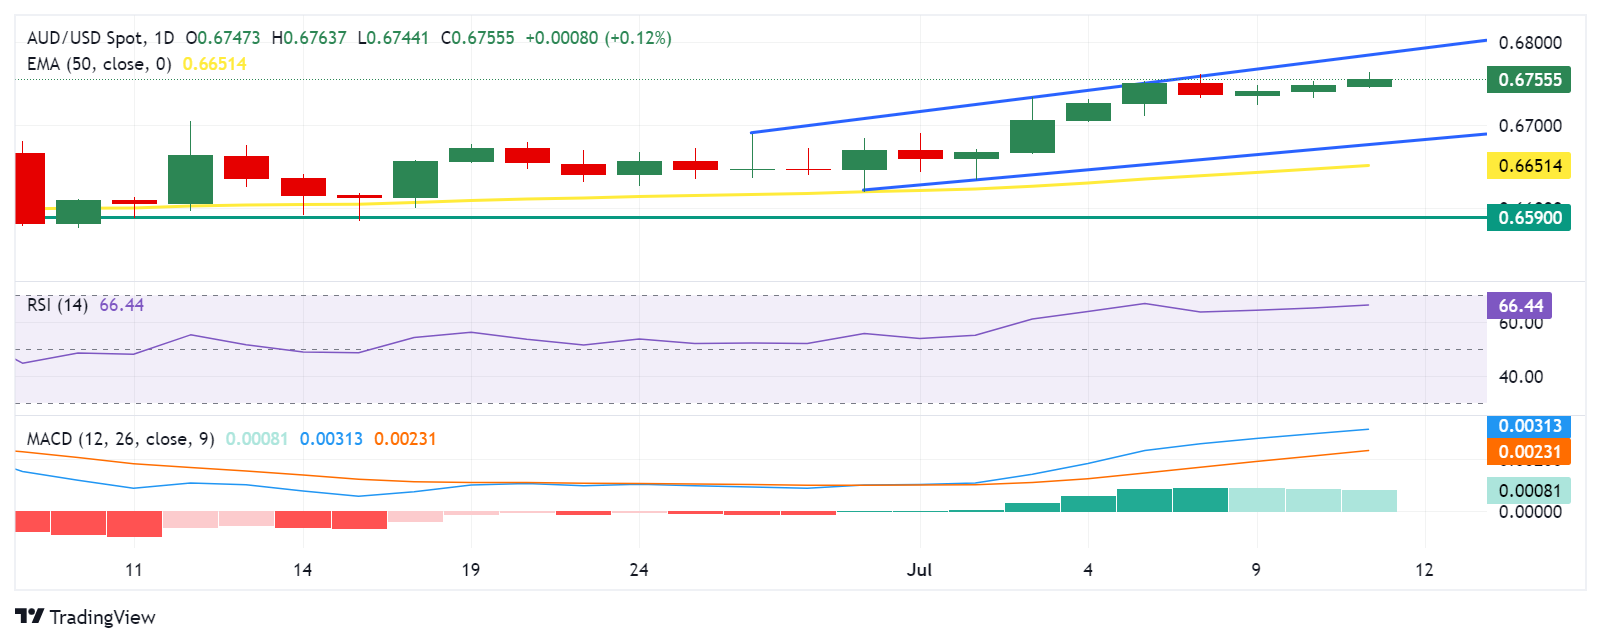
Australian Dollar PRICE Today
The table below shows the percentage change of Australian Dollar (AUD) against listed major currencies today. Australian Dollar was the strongest against the Canadian Dollar.
| USD | EUR | GBP | JPY | CAD | AUD | NZD | CHF | |
|---|---|---|---|---|---|---|---|---|
| USD | -0.08% | -0.16% | -0.06% | 0.10% | -0.13% | -0.11% | -0.10% | |
| EUR | 0.08% | -0.07% | 0.04% | 0.21% | -0.03% | -0.02% | -0.01% | |
| GBP | 0.16% | 0.07% | 0.10% | 0.28% | 0.04% | 0.04% | 0.07% | |
| JPY | 0.06% | -0.04% | -0.10% | 0.15% | -0.07% | -0.09% | -0.04% | |
| CAD | -0.10% | -0.21% | -0.28% | -0.15% | -0.25% | -0.22% | -0.21% | |
| AUD | 0.13% | 0.03% | -0.04% | 0.07% | 0.25% | 0.00% | 0.04% | |
| NZD | 0.11% | 0.02% | -0.04% | 0.09% | 0.22% | -0.01% | 0.03% | |
| CHF | 0.10% | 0.01% | -0.07% | 0.04% | 0.21% | -0.04% | -0.03% |
The heat map shows percentage changes of major currencies against each other. The base currency is picked from the left column, while the quote currency is picked from the top row. For example, if you pick the Australian Dollar from the left column and move along the horizontal line to the US Dollar, the percentage change displayed in the box will represent AUD (base)/USD (quote).
Risk appears to be tilted to the upside; it remains to be seen if it can break clearly above 1.0850. Risk of the Euro (EUR) breaking above 1.0850 has increased, albeit moderately, UOB Group FX analysts Quek Ser Leang and Peter Chia note.
A break above 1.0850 is highly likely
24-HOUR VIEW: “EUR traded between 1.0809 and 1.0830 yesterday, narrower than our expected range of 1.0800/1.0840. Despite the relatively quiet price action, upward momentum appears to be building, albeit tentatively. The risk for today appears to be tilted to the upside, but it remains to be seen if EUR can break clearly above the major resistance at 1.0850. However, if there is a clear break of 1.0850, EUR could continue to rise. That said, the next major resistance at 1.0915 is unlikely to come into view for now. On the downside, support levels are at 1.0815 and 1.0800.”
1-3 WEEKS VIEW: “Last Thursday (04 Jul, spot at 1.0785), we indicated that ‘while the increase in momentum suggests further EUR strength, it is too early to determine if it can reach the major resistance at 1.0850.’ After EUR rose, we indicated on Monday (08 Jul, spot at 1.0825) that ‘the risk of EUR breaking above 1.0850 has increased, albeit moderately.’ We continue to hold the same view. Looking ahead, if EUR breaks clearly above 1.0850, the next level to focus on is 1.0915. Overall, only a breach of 1.0780 (‘strong support’ level previously at 1.0770) would indicate that the current upward pressure has faded.”
- NZD/USD rebounds ahead of US Consumer Price Index (CPI) data scheduled for Thursday.
- The US core CPI is expected to remain steady at 3.4% year-over-year in June.
- The New Zealand Dollar may limit its upside due to dovish sentiment surrounding the RBNZ.
NZD/USD recovers its recent losses, trading around 0.6090 during the European session on Thursday. Traders await the release of the upcoming US Consumer Price Index (CPI) data for June, scheduled for release on Thursday, for more clarity on the Federal Reserve's (Fed) monetary policy direction.
Market forecasts generally predict that the annualized US core CPI for the year ending in June will remain steady at 3.4%. Meanwhile, headline CPI inflation is expected to increase to 0.1% month-over-month in June, compared to the previous flat reading of 0.0%.
Meanwhile, on Wednesday, Federal Reserve (Fed) Chairman Jerome Powell underscored the importance of closely monitoring the labor market, highlighting its significant deterioration. Additionally, Powell expressed confidence in the downward trend of inflation, following his remarks on Tuesday that emphasized the necessity of further data to strengthen confidence in the inflation outlook.
The New Zealand Dollar (NZD) faced pressure following the Reserve Bank of New Zealand's (RBNZ) dovish monetary policy statement. The central bank held its cash rate steady at 5.5% on Wednesday as expected but hinted at possible rate cuts in August if inflation decreases as anticipated.
ING’s FX strategist Francesco Pesole observed, "The Bank displayed greater confidence in disinflation in the statement, noting that 'restrictive monetary policy has significantly reduced consumer price inflation.”
Read the full article: A surprise dovish tilt by the RBNZ – ING
Economic Indicator
Consumer Price Index ex Food & Energy (YoY)
Inflationary or deflationary tendencies are measured by periodically summing the prices of a basket of representative goods and services and presenting the data as the Consumer Price Index (CPI). CPI data is compiled on a monthly basis and released by the US Department of Labor Statistics. The YoY reading compares the prices of goods in the reference month to the same month a year earlier. The CPI Ex Food & Energy excludes the so-called more volatile food and energy components to give a more accurate measurement of price pressures. Generally speaking, a high reading is bullish for the US Dollar (USD), while a low reading is seen as bearish.
Read more.Next release: Thu Jul 11, 2024 12:30
Frequency: Monthly
Consensus: 3.4%
Previous: 3.4%
Source: US Bureau of Labor Statistics
The US Federal Reserve has a dual mandate of maintaining price stability and maximum employment. According to such mandate, inflation should be at around 2% YoY and has become the weakest pillar of the central bank’s directive ever since the world suffered a pandemic, which extends to these days. Price pressures keep rising amid supply-chain issues and bottlenecks, with the Consumer Price Index (CPI) hanging at multi-decade highs. The Fed has already taken measures to tame inflation and is expected to maintain an aggressive stance in the foreseeable future.
Here is what you need to know on Thursday, July 11:
The action in foreign exchange markets remain subdued in the second half of the week following Federal Reserve Chairman Jerome Powell's two-day Congressional testimony. Thursday's economic calendar will feature the US Consumer Price Index (CPI) data for June, which have the potential to ramp up the volatility. Weekly Initial Jobless Claims from the US will also be watched closely by participants.
US Dollar PRICE This week
The table below shows the percentage change of US Dollar (USD) against listed major currencies this week. US Dollar was the weakest against the British Pound.
| USD | EUR | GBP | JPY | CAD | AUD | NZD | CHF | |
|---|---|---|---|---|---|---|---|---|
| USD | 0.00% | -0.40% | 0.57% | -0.10% | -0.10% | 0.74% | 0.33% | |
| EUR | -0.00% | -0.20% | 0.91% | 0.22% | 0.07% | 1.08% | 0.66% | |
| GBP | 0.40% | 0.20% | 1.06% | 0.44% | 0.27% | 1.29% | 0.86% | |
| JPY | -0.57% | -0.91% | -1.06% | -0.65% | -0.63% | 0.34% | -0.19% | |
| CAD | 0.10% | -0.22% | -0.44% | 0.65% | -0.03% | 0.84% | 0.44% | |
| AUD | 0.10% | -0.07% | -0.27% | 0.63% | 0.03% | 1.01% | 0.60% | |
| NZD | -0.74% | -1.08% | -1.29% | -0.34% | -0.84% | -1.01% | -0.41% | |
| CHF | -0.33% | -0.66% | -0.86% | 0.19% | -0.44% | -0.60% | 0.41% |
The heat map shows percentage changes of major currencies against each other. The base currency is picked from the left column, while the quote currency is picked from the top row. For example, if you pick the US Dollar from the left column and move along the horizontal line to the Japanese Yen, the percentage change displayed in the box will represent USD (base)/JPY (quote).
Fed Chairman Powell repeated his prepared statement before the US House Financial Services Committee on Wednesday and refrained from delivering any fresh clues regarding the timing of the interest rate reduction. Nevertheless, Wall Street's main indexes registered strong gains midweek and made it difficult for the US Dollar (USD) to gather strength against its major rivals. After posting small losses on Wednesday, the USD Index holds steady at around 105.00 early Thursday. On a yearly basis, the CPI is forecast to rise 3.1%, while the core CPI is seen increasing 3.4%.
Economic Indicator
Consumer Price Index ex Food & Energy (YoY)
Inflationary or deflationary tendencies are measured by periodically summing the prices of a basket of representative goods and services and presenting the data as the Consumer Price Index (CPI). CPI data is compiled on a monthly basis and released by the US Department of Labor Statistics. The YoY reading compares the prices of goods in the reference month to the same month a year earlier. The CPI Ex Food & Energy excludes the so-called more volatile food and energy components to give a more accurate measurement of price pressures. Generally speaking, a high reading is bullish for the US Dollar (USD), while a low reading is seen as bearish.
Read more.Next release: Thu Jul 11, 2024 12:30
Frequency: Monthly
Consensus: 3.4%
Previous: 3.4%
Source: US Bureau of Labor Statistics
The US Federal Reserve has a dual mandate of maintaining price stability and maximum employment. According to such mandate, inflation should be at around 2% YoY and has become the weakest pillar of the central bank’s directive ever since the world suffered a pandemic, which extends to these days. Price pressures keep rising amid supply-chain issues and bottlenecks, with the Consumer Price Index (CPI) hanging at multi-decade highs. The Fed has already taken measures to tame inflation and is expected to maintain an aggressive stance in the foreseeable future.
The data published by the UK's Office for National Statistics showed in the European Morning that the Gross Domestic Product expanded by 0.4% on a monthly basis in May. This reading came in better than the market expectation for an expansion of 0.2%. After closing in positive territory on Wednesday, GBP/USD continues to push higher and was last seen trading at its strongest level since early March above 1.2850.
EUR/USD benefited from the modest selling pressure surrounding the USD late Wednesday and closed the day in positive territory. The pair holds its ground on Thursday and edges higher toward 1.0850.
The Melbourne Institute reported in the Asian session that the Consumer Inflation Expectation ticked down to 4.3% in July from 4.4%. AUD/USD largely ignored this data and the pair was last seen trading marginally higher on the day slightly above 0.6750.
USD/JPY stays in a consolidation phase above 161.50 after closing the first three days of the week in positive territory. The data from Japan showed that that Machinery Orders declined by 3.2% on a monthly basis in May.
Gold rose toward $2,390 on Wednesday but erased a large portion of its daily gains during the American trading hours. XAU/USD struggles to gather bullish momentum but sticks to modest daily gains near $2,380 in the early European session.
Inflation FAQs
Inflation measures the rise in the price of a representative basket of goods and services. Headline inflation is usually expressed as a percentage change on a month-on-month (MoM) and year-on-year (YoY) basis. Core inflation excludes more volatile elements such as food and fuel which can fluctuate because of geopolitical and seasonal factors. Core inflation is the figure economists focus on and is the level targeted by central banks, which are mandated to keep inflation at a manageable level, usually around 2%.
The Consumer Price Index (CPI) measures the change in prices of a basket of goods and services over a period of time. It is usually expressed as a percentage change on a month-on-month (MoM) and year-on-year (YoY) basis. Core CPI is the figure targeted by central banks as it excludes volatile food and fuel inputs. When Core CPI rises above 2% it usually results in higher interest rates and vice versa when it falls below 2%. Since higher interest rates are positive for a currency, higher inflation usually results in a stronger currency. The opposite is true when inflation falls.
Although it may seem counter-intuitive, high inflation in a country pushes up the value of its currency and vice versa for lower inflation. This is because the central bank will normally raise interest rates to combat the higher inflation, which attract more global capital inflows from investors looking for a lucrative place to park their money.
Formerly, Gold was the asset investors turned to in times of high inflation because it preserved its value, and whilst investors will often still buy Gold for its safe-haven properties in times of extreme market turmoil, this is not the case most of the time. This is because when inflation is high, central banks will put up interest rates to combat it. Higher interest rates are negative for Gold because they increase the opportunity-cost of holding Gold vis-a-vis an interest-bearing asset or placing the money in a cash deposit account. On the flipside, lower inflation tends to be positive for Gold as it brings interest rates down, making the bright metal a more viable investment alternative.
- Gold rises as Powell sets a cautiously optimistic tone on his second day of testimony to lawmakers in Washington.
- Although he did not state when the Fed would propose to cut interest rates, he indicated it might be soon.
- Market-based gauges continue to show a high probability of a rate cut in September – a positive for Gold.
Gold (XAU/USD) trades up almost half a percent in the $2,380s on Thursday as markets continue to foresee interest-rate cuts coming down the track. In his second day of testimony to US lawmakers, Federal Reserve (Fed) Chairman Jerome Powell steered a middle way between cautious optimism that inflation would come down without causing too many job losses – achieving what economists call a “soft-landing” – while retaining a data-dependent vigilant approach to inflation.
His comments supported Gold, which performs better when interest rates are expected to fall, since lower interest rates increase the asset’s attractiveness to investors by reducing the opportunity cost of holding it.
Gold is also benefiting from further emerging data showing that central banks are continuing to hoard all over the world. This comes despite the news on Sunday that the largest consumer of Gold, the People’s Bank of China (PBoC), stopped buying the precious metal for the second month running in June, following an 18-month buying bonanza.
Gold rises as Powell steers middle-way, markets see cuts coming
Gold gained on Wednesday after markets assessed Fed Chairman Jerome Powell as cautiously optimistic in his second day of testimony to US lawmakers in Washington.
In comments to the House Financial Services Committee Powell said that “We see current Fed policy as restrictive," indicating that at their current level, interest rates were successfully doing the job of bringing inflation back down to the Fed’s 2.0% target.
When asked about the timing of future Fed interest-rate cuts and whether he would wait for the Fed’s preferred gauge of inflation, the Personal Consumption Expenditures (PCE) Price Index, to fall below the Fed’s target before pulling the trigger, Powell said that he would not, because, “inflation has a certain momentum,” and “you don’t want to wait until inflation gets all the way down to 2.0%.” At its last reading, both headline and core PCE fell to 2.6%, suggesting the Fed might not be that far away from making rate cuts.
This reinforced current market-based barometers of when the Fed will cut interest rates. The CME FedWatch tool continues to see a high 70% probability of a 0.25% cut in the Fed Funds rate – the Fed’s primary policy interest rate – in September. Such a cut would bring the policy rate down to an upper bound of 5.25%. The CME FedWatch tool bases its probability on the price of 30-day Fed Funds futures prices.
Although investors had been hoping for more concrete details of when the Fed would cut interest rates, Powell’s overall optimism about achieving a “soft-landing” for the economy – when inflation falls back to target without unemployment rising too high – buoyed sentiment. That said, Friday’s official jobs report, the Nonfarm Payrolls release, reported the US Unemployment Rate rising to 4.1% from 4.0%, when no rise had been expected. It was the third month of increase in a row.
Gold buoyed by central bank buying
Gold makes further gains on Thursday due to the emergence of data showing central banks around the world are still hoarding Gold despite the news that the largest consumer, the People’s Bank of China (PBoC), has ceased Gold purchases for two months running in June.
Despite the PBoC’s absence from the market, which accounts for over a quarter of buying, the Bank of India (BOI) bought nine tons of Gold in June, the National Bank of Poland four tons, and the Czech National Bank two tons, according to TD Securities.
Analysts at Citibank remain optimistic about central-bank demand, which they see rising in the second half of the year to reach a total of around 1,100 tons in 2024, a 5.8% increase from the previous year. They put the gains down to an increasing likelihood of trade wars and concerns about US fiscal policies.
To that end, Citibank’s official forecast is for Gold to hit $2,600 by the end of 2024.
Meanwhile, Bert Melek, Head of Commodity Strategy at TD Securities, forecasts Gold to hit $2,475 in Q1 of 2025.
Technical Analysis: Gold rising for third day in a row
Gold makes gains for the third day in a row following the formation of a bearish Two-Bar reversal pattern (green-shaded rectangle in the chart below) at the top of the early July up move. This pattern forms after a long green-up day is followed by a long red-down day of a similar length and size. It can be a sign of a short-term reversal. In the case of Gold this has not played out.
XAU/USD Daily Chart
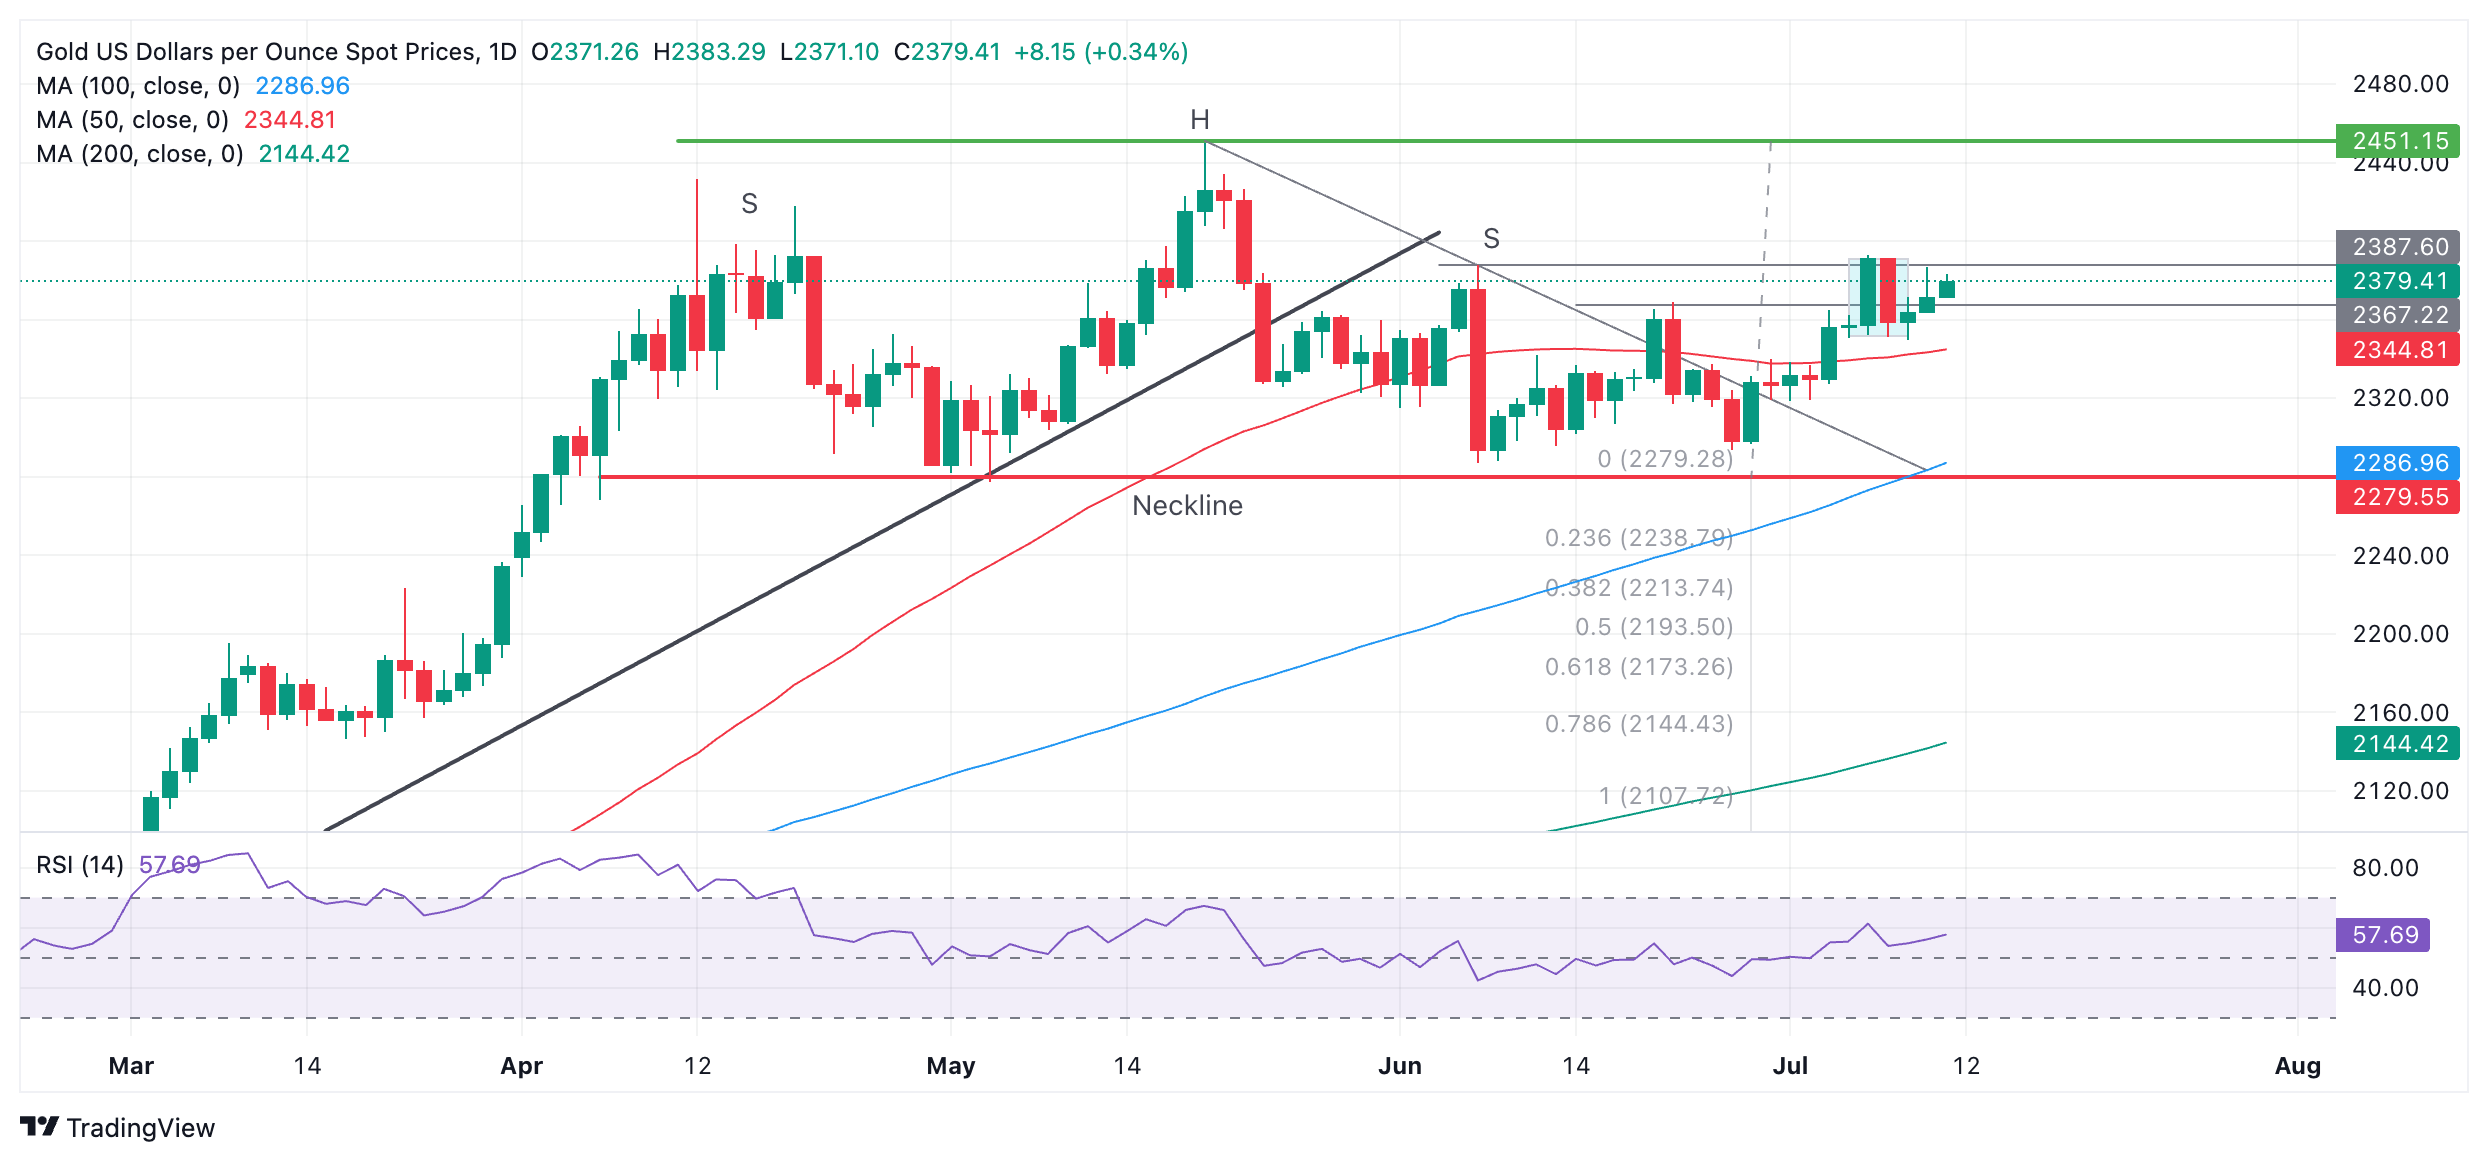
The outlook is unclear. There is still a risk Gold could pull back to the 50-day Simple Moving Average (SMA) at $2,344, fulfilling the negative implications of the Two-Bar pattern. At the same time, the recovery after its formation has partially invalidated it and suggests the price could go higher.
A break above the high of the pattern and Friday’s peak at $2,393 would provide strong bullish confirmation of a continuation higher. This would probably also unlock the next target at the $2,451 all-time high.
The bearish Head & Shoulders (H&S) topping pattern that formed from April to June has been invalidated by the recent recovery. However, there is still a chance – albeit much reduced – that a more complex topping pattern may have formed instead.
If a complex pattern has formed in place of the H&S, and the price breaks below the pattern’s neckline at $2,279, a reversal lower may still be possible with a conservative target at $2,171, the 0.618 ratio of the height of the pattern extrapolated lower.
The trend is now sideways in both the short and medium term. In the long term, Gold remains in an uptrend.
Economic Indicator
Unemployment Rate
The Unemployment Rate, released by the US Bureau of Labor Statistics (BLS), is the percentage of the total civilian labor force that is not in paid employment but is actively seeking employment. The rate is usually higher in recessionary economies compared to economies that are growing. Generally, a decrease in the Unemployment Rate is seen as bullish for the US Dollar (USD), while an increase is seen as bearish. That said, the number by itself usually can't determine the direction of the next market move, as this will also depend on the headline Nonfarm Payroll reading, and the other data in the BLS report.
Read more.
- USD/CAD stays sideways near 1.3600 with US inflation in focus.
- The core CPI is estimated to have grown steadily by 3.4% on monthly as well as annual basis.
- Easing Canadian labor market conditions boost BoC’s rate-cut prospects.
The USD/CAD pair consolidates in a tight range above the round-level support of 1.3600 in Thursday’s European session. The Loonie asset turns sideways as investors await the United States (US) consumer inflation data for June, which will be published at 12:30 GMT.
The US Consumer Price Index (CPI) report is expected to show that annual and monthly core inflation, which excludes volatile food and energy prices, grew steadily by 3.4% and 0.2%, respectively. Annual headline inflation is estimated to have decelerated to 3.1% from 3.3% in May.
The inflation data will exhibit the strength in the market speculation for the Federal Reserve (Fed) to begin reducing interest rates from the September meeting. Ahead of the US inflation data, the US Dollar Index (DXY), which tracks the Greenback’s value against six major currencies, remains on the backfoot around 105.00.
Meanwhile, the Canadian Dollar is under pressure amid growing speculation that the Bank of Canada (BoE) will deliver subsequent rate cuts. Deteriorating Canadian labor market conditions have boosted expectations of more rate cuts by the BoE.
USD/CAD exhibits a sheer volatility contraction, trading in a limited range of 1.3600-1.3780 for more than two months. A volatility contraction suggests lower volume and small ticks, while a breakout in the same results in wider ticks and heavy volume.
The asset trades below the 20-day Exponential Moving Average (EMA) near 1.3663, suggesting that the near-term outlook is bearish.
The 14-period Relative Strength Index (RSI) oscillates inside the 40.00-60.00 range, indicating indecisiveness among market participants.
A decisive breakdown below May 3 low around 1.3600 will expose the asset to April 9 low around 1.3547 and the psychological support of 1.3500.
On the flip side, a fresh buying opportunity would emerge if the asset breaks above June 11 high near 1.3800. This would drive the asset towards April 17 high at 1.3838, followed by 1 November 2023 high at 1.3900.
USD/CAD daily chart
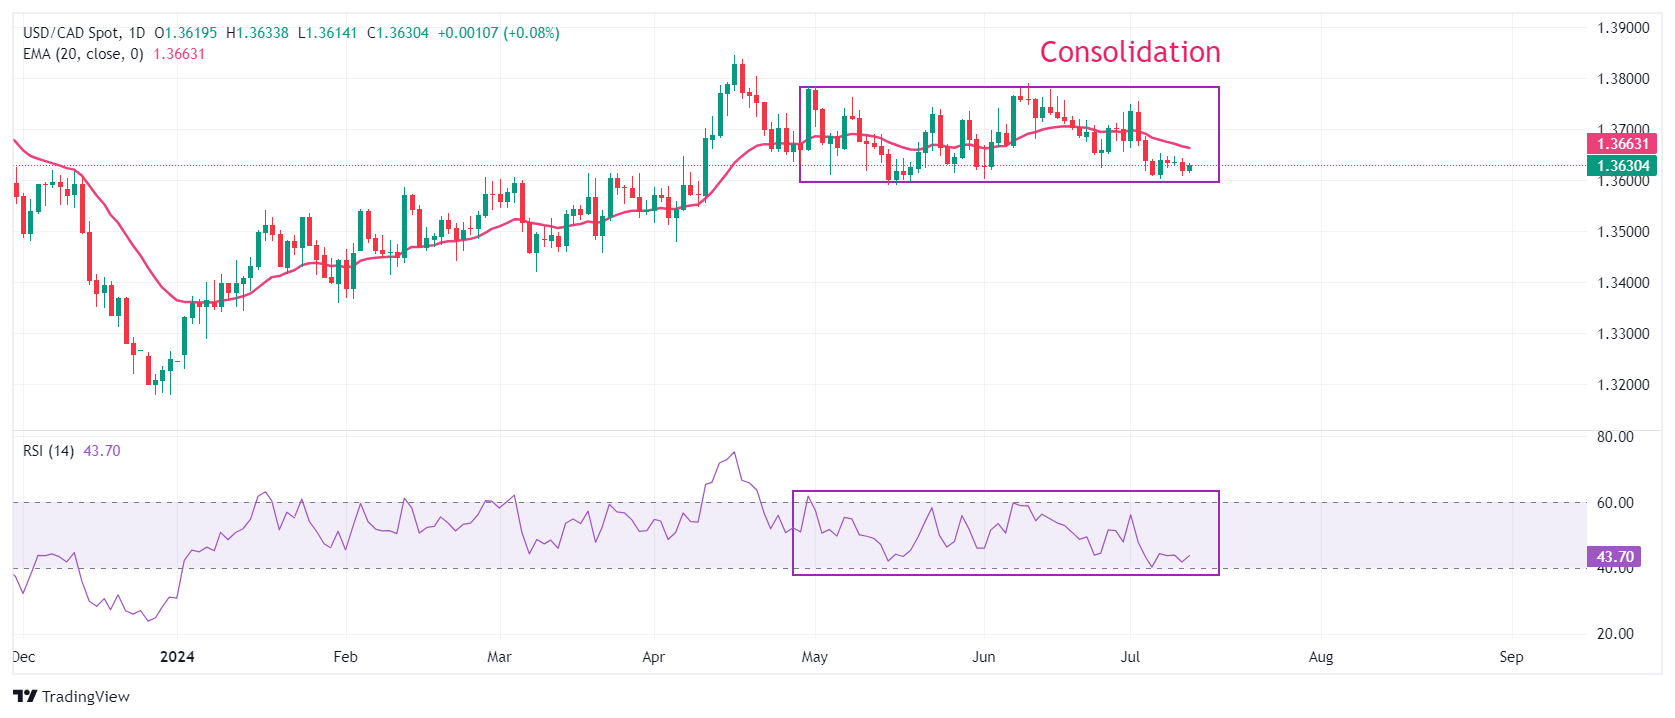
Economic Indicator
Consumer Price Index (YoY)
Inflationary or deflationary tendencies are measured by periodically summing the prices of a basket of representative goods and services and presenting the data as The Consumer Price Index (CPI). CPI data is compiled on a monthly basis and released by the US Department of Labor Statistics. The YoY reading compares the prices of goods in the reference month to the same month a year earlier.The CPI is a key indicator to measure inflation and changes in purchasing trends. Generally speaking, a high reading is seen as bullish for the US Dollar (USD), while a low reading is seen as bearish.
Read more.Next release: Thu Jul 11, 2024 12:30
Frequency: Monthly
Consensus: 3.1%
Previous: 3.3%
Source: US Bureau of Labor Statistics
The US Federal Reserve has a dual mandate of maintaining price stability and maximum employment. According to such mandate, inflation should be at around 2% YoY and has become the weakest pillar of the central bank’s directive ever since the world suffered a pandemic, which extends to these days. Price pressures keep rising amid supply-chain issues and bottlenecks, with the Consumer Price Index (CPI) hanging at multi-decade highs. The Fed has already taken measures to tame inflation and is expected to maintain an aggressive stance in the foreseeable future.
- The Pound Sterling performs strongly against the US Dollar and other currencies on faster UK GDP growth and a decline in BoE rate-cut prospects.
- The UK economy expanded at a faster pace of 0.4% in May, beating an estimate of 0.2%.
- Investors await the US inflation data for fresh guidance on the Fed's interest rates path.
The Pound Sterling (GBP) rallies to near 1.2870 and approaches the year-to-date high against the US Dollar (USD) in Thursday’s London session. The GBP/USD pair strengthens due to multiple tailwinds, such as weakness in the US Dollar due to firm speculation that the Federal Reserve (Fed) will begin reducing interest rates in September and an upbeat outlook for the British currency amid easing Bank of England’s (BoE) early rate cut bets and strong United Kingdom (UK) Gross Domestic Product (GDP) report for May.
The US Dollar Index (DXY), which tracks the Greenback’s value against six major currencies, falls back after failing to extend recovery above the immediate resistance of 105.20.
The Greenback comes under pressure as Fed Chair Jerome Powell signalled some disinflation progress in his semi-annual Congressional testimony comments. Powell refrained from announcing a victory over inflation but assured that policymakers are very focused on the path toward price stability.
In Thursday’ session, investors will keenly focus on the United States (US) Consumer Price Index (CPI) for June, which will provide cues about potential market expectations for Fed rate cuts in September. Economists expect that the core inflation, which excludes volatile food and energy items, grew steadily by 0.2% and 3.4% on monthly and annual basis, respectively. Annual headline inflation is estimated to have decelerated to 3.1% from May’s reading of 3.3%, while the monthly figure is expected to have grown by 0.1% after remaining unchanged previously.
Daily digest market movers: Pound Sterling outperforms US Dollar ahead of US Inflation
- The Pound Sterling outperforms its major peers on Thursday as the UK economy grew at a faster pace in May and the maintenance of a hawkish stance by BoE policymakers. UK’s Office for National Statistics (ONS) has reported that the economy expanded strongly by 0.4% from the estimates of 0.2% and a stagnant performance recorded in April.
- The UK ONS also showed that monthly Industrial and Manufacturing Production grew in line with expectations after contracting in April, while annual figures missed estimates. Monthly Industrial and Manufacturing Production rose by 0.2% and 0.4%, respectively. Annually, Industrial and Manufacturing Production grew at a slower pace of 0.4% and 0.6%, respectively. The factory data has returned to a positive trajectory after contracting at a stronger pace in April, suggesting a strong recovery in the domestic and overall demand for factory products.
- Meanwhile, Bank of England (BoE) policymakers have pushed back expectations of rate cuts in August. On Wednesday, BoE policymaker Catherine Mann warned that the decline in annual headline inflation to the 2% target was merely a “touch and go”. Mann added that price pressures could rise again and remain above the required rate for the rest of the year. She indicated that her stance would remain hawkish until she sees a sustained decline in service inflation and wage growth.
- This week, BoE policymaker Jonathan Haskel also maintained hawkish guidance on interest rates due to sticky wage growth. Haskel said: "I would rather hold rates until there is more certainty that underlying inflationary pressures have subsided sustainably", Reuters reported.
Technical Analysis: Pound Sterling close to 52-week high near 1.2870
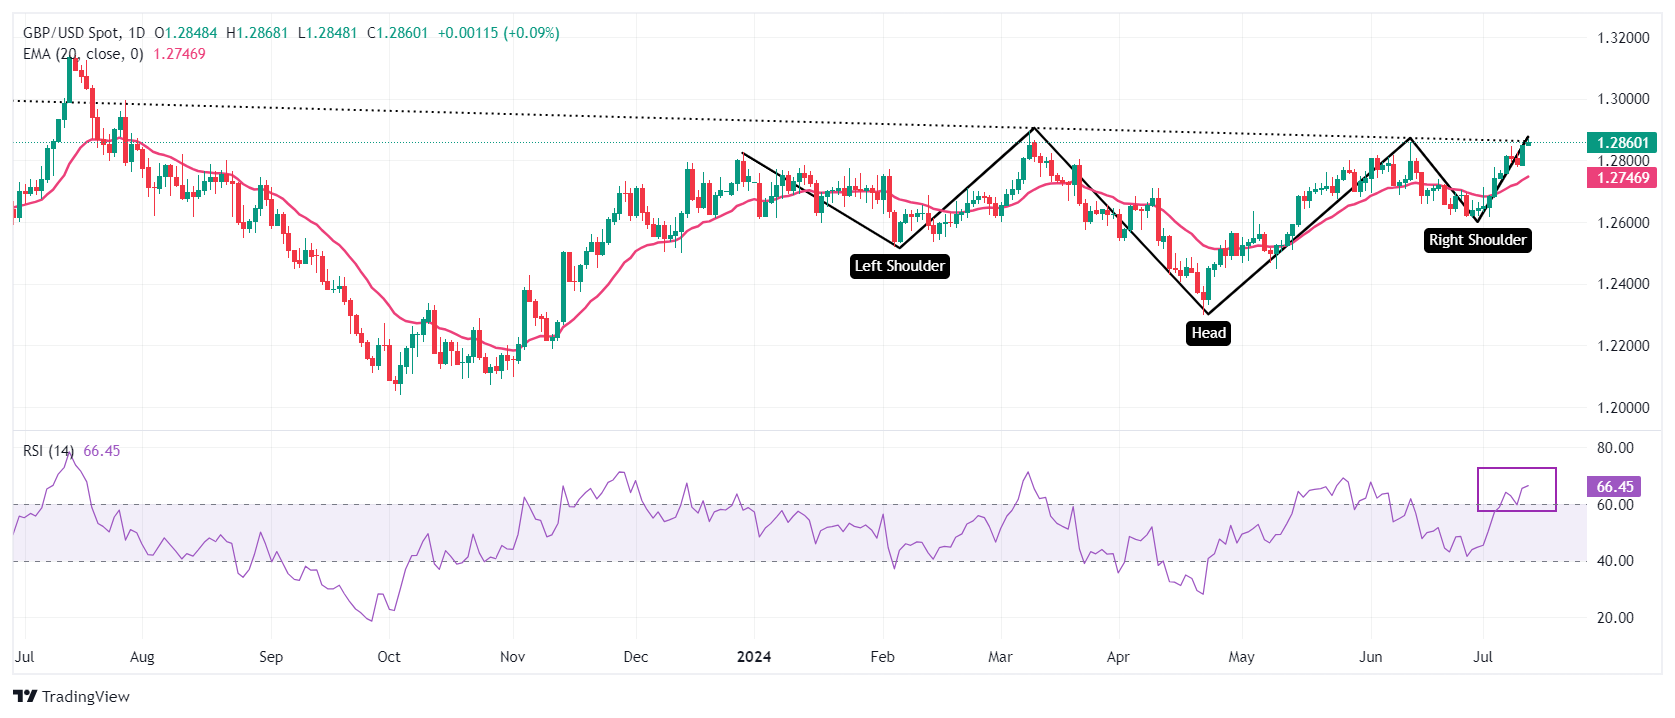
The Pound Sterling approaches a fresh annual high against the US Dollar near 1.2870. The GBP/USD pair is expected to extend its upside as it is on the verge of an inverted Head and Shoulder (H&S) breakout. The neckline of the above-mentioned chart pattern is plotted near 1.2850, and a breakout of the H&S formation results in a bullish reversal.
Advancing 20-day Exponential Moving Average (EMA) near 1.2747 suggests that the near-term trend is bullish.
The 14-day Relative Strength Index (RSI) established into the bullish range of 60.00-80.00, indicating that the momentum has leaned to the upside.
Pound Sterling FAQs
The Pound Sterling (GBP) is the oldest currency in the world (886 AD) and the official currency of the United Kingdom. It is the fourth most traded unit for foreign exchange (FX) in the world, accounting for 12% of all transactions, averaging $630 billion a day, according to 2022 data. Its key trading pairs are GBP/USD, aka ‘Cable’, which accounts for 11% of FX, GBP/JPY, or the ‘Dragon’ as it is known by traders (3%), and EUR/GBP (2%). The Pound Sterling is issued by the Bank of England (BoE).
The single most important factor influencing the value of the Pound Sterling is monetary policy decided by the Bank of England. The BoE bases its decisions on whether it has achieved its primary goal of “price stability” – a steady inflation rate of around 2%. Its primary tool for achieving this is the adjustment of interest rates. When inflation is too high, the BoE will try to rein it in by raising interest rates, making it more expensive for people and businesses to access credit. This is generally positive for GBP, as higher interest rates make the UK a more attractive place for global investors to park their money. When inflation falls too low it is a sign economic growth is slowing. In this scenario, the BoE will consider lowering interest rates to cheapen credit so businesses will borrow more to invest in growth-generating projects.
Data releases gauge the health of the economy and can impact the value of the Pound Sterling. Indicators such as GDP, Manufacturing and Services PMIs, and employment can all influence the direction of the GBP. A strong economy is good for Sterling. Not only does it attract more foreign investment but it may encourage the BoE to put up interest rates, which will directly strengthen GBP. Otherwise, if economic data is weak, the Pound Sterling is likely to fall.
Another significant data release for the Pound Sterling is the Trade Balance. This indicator measures the difference between what a country earns from its exports and what it spends on imports over a given period. If a country produces highly sought-after exports, its currency will benefit purely from the extra demand created from foreign buyers seeking to purchase these goods. Therefore, a positive net Trade Balance strengthens a currency and vice versa for a negative balance.
- EUR/GBP extends the downside near 0.8425 in Thursday’s early European session.
- The UK GDP grew 0.4% MoM in May after stagnating in April, better than expected.
- Higher bets on the ECB rate cuts weigh on the Euro and cap the cross’s upside.
The EUR/GBP cross remains on the defensive around 0.8425 during the early European session on Thursday. The cross trades with mild losses after the monthly UK Gross Domestic Product (GDP) data.
The UK economy grew more than expected in May after stagnating in April, with the GDP expanding at 0.4% MoM. This figure beat market expectations of 0.2% in the reported period, according to National Statistics (ONS) on Thursday. The Pound Sterling (GBP) attracts modest sellers in response to the stronger UK data.
The uncertainty surrounding the Bank of England's (BoE) decision to begin lowering its borrowing costs from the August meeting has risen. The BoE policymaker Catherine Mann signals caution on rate cuts, warning of a resurgence in UK inflation and rapid increases in service prices. Mann added that uncertainty about wage behaviour in the UK is unlikely to disappear soon, and policy decisions need to be robust to this.
Meanwhile, BoE policymaker Jonathan Haskell said that he does not want to cut interest rates as inflationary pressures remain in the job market and it is unclear how rapidly they will fade. Investors are now pricing in nearly 60% odds that the BoE will cut interest rates on August 1, the first time since 2020.
On the Euro front, the European Central Bank (ECB) governing council member Fabio Panett said on Tuesday that the ECB can continue to lower interest rates, adding that wage growth, a central driver of inflation, was “not warranted.” Traders raise their bets on an ECB rate cut this year, which might cap the cross’s upside in the near term.
GDP FAQs
A country’s Gross Domestic Product (GDP) measures the rate of growth of its economy over a given period of time, usually a quarter. The most reliable figures are those that compare GDP to the previous quarter e.g Q2 of 2023 vs Q1 of 2023, or to the same period in the previous year, e.g Q2 of 2023 vs Q2 of 2022. Annualized quarterly GDP figures extrapolate the growth rate of the quarter as if it were constant for the rest of the year. These can be misleading, however, if temporary shocks impact growth in one quarter but are unlikely to last all year – such as happened in the first quarter of 2020 at the outbreak of the covid pandemic, when growth plummeted.
A higher GDP result is generally positive for a nation’s currency as it reflects a growing economy, which is more likely to produce goods and services that can be exported, as well as attracting higher foreign investment. By the same token, when GDP falls it is usually negative for the currency. When an economy grows people tend to spend more, which leads to inflation. The country’s central bank then has to put up interest rates to combat the inflation with the side effect of attracting more capital inflows from global investors, thus helping the local currency appreciate.
When an economy grows and GDP is rising, people tend to spend more which leads to inflation. The country’s central bank then has to put up interest rates to combat the inflation. Higher interest rates are negative for Gold because they increase the opportunity-cost of holding Gold versus placing the money in a cash deposit account. Therefore, a higher GDP growth rate is usually a bearish factor for Gold price.
FX option expiries for July 11 NY cut at 10:00 Eastern Time, via DTCC, can be found below
- EUR/USD: EUR amounts
- 1.0650 1.5b
- 1.0700 2.8b
- 1.0745 1.5b
- 1.0770 1.8b
- 1.0815 758m
- 1.0860 989m
- 1.0900 1.3b
- USD/JPY: USD amounts
- 159.50 455m
- 160.00 567m
- 160.20 832m
- 161.00 1.5b
- 161.50 901m
- 162.35 690m
- USD/CHF: USD amounts
- 0.8935 696m
- 0.8950 1.8b
- AUD/USD: AUD amounts
- 0.6610 2.2b
- 0.6620 567m
- 0.6635 752m
- 0.6730 513m
- 0.6760 633m
USD/CAD: USD amounts
- 1.3650 634m
- 1.3775 1.1b
- NZD/USD: NZD amounts
- 0.6125 1.6b
- 0.6150 1.7b
- EUR/GBP: EUR amounts
- 0.8350 1.1b
- 0.8455 1.4b
- 0.8530 750m
- UK GDP arrived at 0.4% MoM in May vs. 0.2% estimate.
- GBP/USD remains above 1.2850 after the UK data.
The UK economy grew 0.4% over the month in May after stagnating in April, the latest data published by the Office for National Statistics (ONS) showed on Thursday. The data beat market expectations of 0.2% in the reported period.
Meanwhile, the Index of services (May) came in at 1.1% 3M/3M vs. April’s 0.9% print and 1.0% forecast.
Other data from the UK showed that the monthly Industrial Production and Manufacturing Production rebounded 0.2% and 0.4%, respectively, in May. Both readings matched the consensus forecast.
Separately, the UK Goods Trade Balance came in at GBP-17.9717 billion MoM in May vs. GBP-16.18 billion expected and GBP-19.442 billion prior.
Market reaction to the UK data
The Pound Sterling is unfazed by the UK economic data. At the press time, GBP/USD is trading 0.15% higher on the day at 1.2861.
British Pound PRICE Today
The table below shows the percentage change of British Pound (GBP) against listed major currencies today. British Pound was the strongest against the Japanese Yen.
| USD | EUR | GBP | JPY | CAD | AUD | NZD | CHF | |
|---|---|---|---|---|---|---|---|---|
| USD | -0.06% | -0.10% | 0.02% | -0.01% | -0.20% | -0.22% | -0.06% | |
| EUR | 0.06% | -0.03% | 0.09% | 0.07% | -0.13% | -0.14% | 0.02% | |
| GBP | 0.10% | 0.03% | 0.12% | 0.10% | -0.10% | -0.12% | 0.06% | |
| JPY | -0.02% | -0.09% | -0.12% | -0.04% | -0.23% | -0.28% | -0.08% | |
| CAD | 0.01% | -0.07% | -0.10% | 0.04% | -0.22% | -0.22% | -0.05% | |
| AUD | 0.20% | 0.13% | 0.10% | 0.23% | 0.22% | -0.03% | 0.16% | |
| NZD | 0.22% | 0.14% | 0.12% | 0.28% | 0.22% | 0.03% | 0.18% | |
| CHF | 0.06% | -0.02% | -0.06% | 0.08% | 0.05% | -0.16% | -0.18% |
The heat map shows percentage changes of major currencies against each other. The base currency is picked from the left column, while the quote currency is picked from the top row. For example, if you pick the British Pound from the left column and move along the horizontal line to the US Dollar, the percentage change displayed in the box will represent GBP (base)/USD (quote).
- USD/CHF loses momentum around 0.8995 in Thursday’s early European session.
- Fed’s Powell said the case for interest rate cuts is becoming stronger as inflation data showed some modest further progress.
- Political uncertainty in Europe and globally might boost the safe-haven flows, benefiting the CHF.
The USD/CHF pair trades with mild losses near 0.8995, snapping the three-day winning streak during the early European session on Thursday. The rising Federal Reserve (Fed) rate cut bets drag the pair lower. Traders await the US June Consumer Price Index (CPI) inflation data on Thursday, which is expected to show an increase of 3.1% YoY in June.
The Fed Chair Jerome Powell's comments continue to undermine the Greenback as traders see the US central bank begin its rate-cutting cycle in September. Powell said in testimony Tuesday to Congress that the case for interest rate cuts is becoming stronger as the most recent inflation data showed some modest further progress. He further stated that "more good data" could open the door to interest rate cuts.
However, the softer CPI inflation data for June could fuel the expectation of September rate cuts, which might exert some selling pressure on the Greenback. Financial markets are now pricing in less than a 10% chance of a Fed July rate cut, while the expectation for a September cut stood at 73%, according to the CME FedWatch Tool.
On the Swiss front, the speculation that the Swiss National Bank will cut further interest rates might weigh on the CHF. Kyle Chapman, FX markets analyst at Ballinger Group said "I expect the SNB to follow up with a third cut next quarter, and there is potential for a fourth in December if there is still high conviction in the restrictive level of monetary policy. The dovish outlook puts the franc in a vulnerable position over the coming quarters and could hinder any further recovery, particularly if the ECB takes its time in bringing rates down.” Elsewhere, political uncertainty in Europe and elsewhere might boost the Swiss Franc (CHF), which is a safe-haven currency.
Swiss Franc FAQs
The Swiss Franc (CHF) is Switzerland’s official currency. It is among the top ten most traded currencies globally, reaching volumes that well exceed the size of the Swiss economy. Its value is determined by the broad market sentiment, the country’s economic health or action taken by the Swiss National Bank (SNB), among other factors. Between 2011 and 2015, the Swiss Franc was pegged to the Euro (EUR). The peg was abruptly removed, resulting in a more than 20% increase in the Franc’s value, causing a turmoil in markets. Even though the peg isn’t in force anymore, CHF fortunes tend to be highly correlated with the Euro ones due to the high dependency of the Swiss economy on the neighboring Eurozone.
The Swiss Franc (CHF) is considered a safe-haven asset, or a currency that investors tend to buy in times of market stress. This is due to the perceived status of Switzerland in the world: a stable economy, a strong export sector, big central bank reserves or a longstanding political stance towards neutrality in global conflicts make the country’s currency a good choice for investors fleeing from risks. Turbulent times are likely to strengthen CHF value against other currencies that are seen as more risky to invest in.
The Swiss National Bank (SNB) meets four times a year – once every quarter, less than other major central banks – to decide on monetary policy. The bank aims for an annual inflation rate of less than 2%. When inflation is above target or forecasted to be above target in the foreseeable future, the bank will attempt to tame price growth by raising its policy rate. Higher interest rates are generally positive for the Swiss Franc (CHF) as they lead to higher yields, making the country a more attractive place for investors. On the contrary, lower interest rates tend to weaken CHF.
Macroeconomic data releases in Switzerland are key to assessing the state of the economy and can impact the Swiss Franc’s (CHF) valuation. The Swiss economy is broadly stable, but any sudden change in economic growth, inflation, current account or the central bank’s currency reserves have the potential to trigger moves in CHF. Generally, high economic growth, low unemployment and high confidence are good for CHF. Conversely, if economic data points to weakening momentum, CHF is likely to depreciate.
As a small and open economy, Switzerland is heavily dependent on the health of the neighboring Eurozone economies. The broader European Union is Switzerland’s main economic partner and a key political ally, so macroeconomic and monetary policy stability in the Eurozone is essential for Switzerland and, thus, for the Swiss Franc (CHF). With such dependency, some models suggest that the correlation between the fortunes of the Euro (EUR) and the CHF is more than 90%, or close to perfect.
Gold prices rose in India on Thursday, according to data compiled by FXStreet.
The price for Gold stood at 6,395.47 Indian Rupees (INR) per gram, up compared with the INR 6,366.80 it cost on Wednesday.
The price for Gold increased to INR 74,595.51 per tola from INR 74,261.05 per tola a day earlier.
| Unit measure | Gold Price in INR |
|---|---|
| 1 Gram | 6,395.47 |
| 10 Grams | 63,954.71 |
| Tola | 74,595.51 |
| Troy Ounce | 198,921.50 |
FXStreet calculates Gold prices in India by adapting international prices (USD/INR) to the local currency and measurement units. Prices are updated daily based on the market rates taken at the time of publication. Prices are just for reference and local rates could diverge slightly.
Gold FAQs
Gold has played a key role in human’s history as it has been widely used as a store of value and medium of exchange. Currently, apart from its shine and usage for jewelry, the precious metal is widely seen as a safe-haven asset, meaning that it is considered a good investment during turbulent times. Gold is also widely seen as a hedge against inflation and against depreciating currencies as it doesn’t rely on any specific issuer or government.
Central banks are the biggest Gold holders. In their aim to support their currencies in turbulent times, central banks tend to diversify their reserves and buy Gold to improve the perceived strength of the economy and the currency. High Gold reserves can be a source of trust for a country’s solvency. Central banks added 1,136 tonnes of Gold worth around $70 billion to their reserves in 2022, according to data from the World Gold Council. This is the highest yearly purchase since records began. Central banks from emerging economies such as China, India and Turkey are quickly increasing their Gold reserves.
Gold has an inverse correlation with the US Dollar and US Treasuries, which are both major reserve and safe-haven assets. When the Dollar depreciates, Gold tends to rise, enabling investors and central banks to diversify their assets in turbulent times. Gold is also inversely correlated with risk assets. A rally in the stock market tends to weaken Gold price, while sell-offs in riskier markets tend to favor the precious metal.
The price can move due to a wide range of factors. Geopolitical instability or fears of a deep recession can quickly make Gold price escalate due to its safe-haven status. As a yield-less asset, Gold tends to rise with lower interest rates, while higher cost of money usually weighs down on the yellow metal. Still, most moves depend on how the US Dollar (USD) behaves as the asset is priced in dollars (XAU/USD). A strong Dollar tends to keep the price of Gold controlled, whereas a weaker Dollar is likely to push Gold prices up.
(An automation tool was used in creating this post.)
- Silver price holds gains as investors exercise caution ahead of US Consumer Price Index (CPI) data due on Thursday.
- Fed Powell's neutral remarks on Wednesday provided support for non-yielding Silver.
- Renewed Israeli attacks could hinder efforts to negotiate a ceasefire agreement and bolster the demand for the safe-haven Silver.
Silver price (XAG/USD) gains ground for the third successive session, trading around $31.00 per troy ounce during the Asian hours on Thursday. This upside could be attributed to investors’ caution ahead of the release of the upcoming US Consumer Price Index (CPI) data for June, scheduled for release on Thursday, for more clarity on the Federal Reserve's (Fed) monetary policy direction. The higher interest rates negatively impact the demand for non-yielding assets like Silver.
Market forecasts generally predict that the annualized US core CPI for the year ending in June will remain steady at 3.4%. Meanwhile, headline CPI inflation is expected to increase to 0.1% month-over-month in June, compared to the previous flat reading of 0.0%.
Meanwhile, on Wednesday, Federal Reserve (Fed) Chairman Jerome Powell underscored the importance of closely monitoring the labor market, highlighting its significant deterioration. Additionally, Powell expressed confidence in the downward trend of inflation, following his remarks on Tuesday that emphasized the necessity of further data to strengthen confidence in the inflation outlook.
Additionally, Fed Chair Powell emphasized on Tuesday that a "policy rate cut is inappropriate until the Fed gains greater confidence that inflation is headed sustainably toward 2%." He also noted that "first-quarter data did not support the greater confidence in the inflation path that the Fed needs to cut rates."
On the geopolitical front, Israeli forces carried out an offensive in northern and central Gaza on Tuesday, which included an airstrike on a tent encampment, as reported by Reuters. Palestinian officials reported that at least 29 people, mostly women and children, were killed in the strike. The incident occurred as spectators gathered at a school grounds in Abassan, east of Khan Younis, where vendors were selling smoothies and biscuits.
This development has raised concerns about a possible escalation in the Middle East conflict and bolstered the appeal of safe-haven assets like Silver. Hamas, the militant group, warned that renewed Israeli attacks could disrupt efforts to negotiate a ceasefire in the Gaza conflict, with discussions slated to resume in Doha on Wednesday.
Silver FAQs
Silver is a precious metal highly traded among investors. It has been historically used as a store of value and a medium of exchange. Although less popular than Gold, traders may turn to Silver to diversify their investment portfolio, for its intrinsic value or as a potential hedge during high-inflation periods. Investors can buy physical Silver, in coins or in bars, or trade it through vehicles such as Exchange Traded Funds, which track its price on international markets.
Silver prices can move due to a wide range of factors. Geopolitical instability or fears of a deep recession can make Silver price escalate due to its safe-haven status, although to a lesser extent than Gold's. As a yieldless asset, Silver tends to rise with lower interest rates. Its moves also depend on how the US Dollar (USD) behaves as the asset is priced in dollars (XAG/USD). A strong Dollar tends to keep the price of Silver at bay, whereas a weaker Dollar is likely to propel prices up. Other factors such as investment demand, mining supply – Silver is much more abundant than Gold – and recycling rates can also affect prices.
Silver is widely used in industry, particularly in sectors such as electronics or solar energy, as it has one of the highest electric conductivity of all metals – more than Copper and Gold. A surge in demand can increase prices, while a decline tends to lower them. Dynamics in the US, Chinese and Indian economies can also contribute to price swings: for the US and particularly China, their big industrial sectors use Silver in various processes; in India, consumers’ demand for the precious metal for jewellery also plays a key role in setting prices.
Silver prices tend to follow Gold's moves. When Gold prices rise, Silver typically follows suit, as their status as safe-haven assets is similar. The Gold/Silver ratio, which shows the number of ounces of Silver needed to equal the value of one ounce of Gold, may help to determine the relative valuation between both metals. Some investors may consider a high ratio as an indicator that Silver is undervalued, or Gold is overvalued. On the contrary, a low ratio might suggest that Gold is undervalued relative to Silver.
- AUD/JPY continues scaling higher for the third straight day and climbs to a fresh multi-decade high.
- The risk-on mood undermines the safe-haven JPY and lends support amid hawkish RBA expectations.
- Speculations that the BoJ may act soon in response to the weakening JPY and cap any further gains.
The AUD/JPY cross gains positive traction for the third successive day and climbs to its highest level since May 1991, around the 109.35 area during the Asian session on Thursday. The momentum is sponsored by a combination of factors, though speculations that the Bank of Japan (BoJ) may raise interest rates in response to a weakening Japanese Yen (JPY) might cap any further gains.
Moreover, a Bloomberg report on Tuesday said that the BoJ is conducting three in-person meetings with banks, securities firms, and financial institutions to assess a feasible pace for scaling back its purchases of Japanese Government Bonds. Meanwhile, Reuters reported on Wednesday – citing unnamed sources – that the BoJ will likely trim this year's economic growth forecast and project inflation will stay around its 2% target in coming years at its meeting later this month. Adding to this, the prevalent risk-on environment, which tends to undermine the safe-haven JPY and benefit risk-sensitive Aussie, is seen acting as a tailwind for the AUD/JPY cross.
The strong move up could further be attributed to bets that the Reserve Bank of Australia (RBA) could possibly be raising interest rates again. That said, speculations that Japanese authorities will eventually intervene to prop up the domestic currency might hold back traders from placing fresh bullish bets around the AUD/JPY cross. Market participants, however, now see the 165.00 mark for the USD/JPY pair as a new line in the sand for intervention. This, in turn, might do little to inspire the JPY bulls, which, along with this week's breakout through the 108.60 horizontal resistance, suggests that the path of least resistance for the AUD/JPY cross is to the upside.
Japanese Yen FAQs
The Japanese Yen (JPY) is one of the world’s most traded currencies. Its value is broadly determined by the performance of the Japanese economy, but more specifically by the Bank of Japan’s policy, the differential between Japanese and US bond yields, or risk sentiment among traders, among other factors.
One of the Bank of Japan’s mandates is currency control, so its moves are key for the Yen. The BoJ has directly intervened in currency markets sometimes, generally to lower the value of the Yen, although it refrains from doing it often due to political concerns of its main trading partners. The current BoJ ultra-loose monetary policy, based on massive stimulus to the economy, has caused the Yen to depreciate against its main currency peers. This process has exacerbated more recently due to an increasing policy divergence between the Bank of Japan and other main central banks, which have opted to increase interest rates sharply to fight decades-high levels of inflation.
The BoJ’s stance of sticking to ultra-loose monetary policy has led to a widening policy divergence with other central banks, particularly with the US Federal Reserve. This supports a widening of the differential between the 10-year US and Japanese bonds, which favors the US Dollar against the Japanese Yen.
The Japanese Yen is often seen as a safe-haven investment. This means that in times of market stress, investors are more likely to put their money in the Japanese currency due to its supposed reliability and stability. Turbulent times are likely to strengthen the Yen’s value against other currencies seen as more risky to invest in.
- The US Dollar Index (DXY) loses ground near 104.95
- Fed rate cut bets continue to undermine the DXY.
- The cautious mood and safe-haven flows might cap the USD Index’s downside.
The US Dollar Index (DXY) trades in negative territory for the second consecutive day around 104.95 during the Asian session on Thursday. The DXY edges lower despite the cautious stance of the US Federal Reserve (Fed) Chair Jerome Powell. Investors will watch the US June Consumer Price Index (CPI) inflation data for fresh impetus, along with the weekly Initial Jobless Claims and speeches by the Federal Reserve’s (Fed) Raphael Bostic.
Fed’s Powell said on Wednesday before the US House Financial Services Committee that the US central bank will make interest rate decisions based on the data, the incoming data, the evolving outlook, and the balance of risks, and not in consideration of political factors. Powell added that it would not be appropriate to cut the policy rate until they gain greater confidence in inflation heading sustainably towards the Fed’s 2% target.
Meanwhile, Fed Governor Lisa Cook said on Thursday that US inflation should continue to fall without a significant further rise in the Unemployment Rate. The Fed’s cautious stance failed to boost the Greenback as traders await the US key inflation report, which is due on Thursday. The US CPI is expected to show an increase of 3.1% YoY in June, while core inflation is forecast to remain steady at 3.4% YoY.
In case the report shows softer-than-expected inflation readings, this could further weigh on the DXY. The markets have priced in less than 10% odds of a Fed July rate cut, while the expectation for a September cut stood at 73%, according to the CME FedWatch Tool.
On the other hand, the risk-off mood ahead of the key economic data, along with the political uncertainties in Europe and geopolitical risks in the Middle East might provide some support to the safe-haven US Dollar.
US Dollar FAQs
The US Dollar (USD) is the official currency of the United States of America, and the ‘de facto’ currency of a significant number of other countries where it is found in circulation alongside local notes. It is the most heavily traded currency in the world, accounting for over 88% of all global foreign exchange turnover, or an average of $6.6 trillion in transactions per day, according to data from 2022. Following the second world war, the USD took over from the British Pound as the world’s reserve currency. For most of its history, the US Dollar was backed by Gold, until the Bretton Woods Agreement in 1971 when the Gold Standard went away.
The most important single factor impacting on the value of the US Dollar is monetary policy, which is shaped by the Federal Reserve (Fed). The Fed has two mandates: to achieve price stability (control inflation) and foster full employment. Its primary tool to achieve these two goals is by adjusting interest rates. When prices are rising too quickly and inflation is above the Fed’s 2% target, the Fed will raise rates, which helps the USD value. When inflation falls below 2% or the Unemployment Rate is too high, the Fed may lower interest rates, which weighs on the Greenback.
In extreme situations, the Federal Reserve can also print more Dollars and enact quantitative easing (QE). QE is the process by which the Fed substantially increases the flow of credit in a stuck financial system. It is a non-standard policy measure used when credit has dried up because banks will not lend to each other (out of the fear of counterparty default). It is a last resort when simply lowering interest rates is unlikely to achieve the necessary result. It was the Fed’s weapon of choice to combat the credit crunch that occurred during the Great Financial Crisis in 2008. It involves the Fed printing more Dollars and using them to buy US government bonds predominantly from financial institutions. QE usually leads to a weaker US Dollar.
Quantitative tightening (QT) is the reverse process whereby the Federal Reserve stops buying bonds from financial institutions and does not reinvest the principal from the bonds it holds maturing in new purchases. It is usually positive for the US Dollar.
- EUR/USD gains positive traction for the second successive day amid a softer USD.
- The technical setup favors bullish traders and supports prospects for further gains.
- Political uncertainty in France might cap gains ahead of the crucial US CPI report.
The EUR/USD pair attracts buyers for the second successive day on Thursday and moves back closer to a nearly four-week high touched on Monday. Spot prices, however, remain below mid-1.0800s as traders await the release of the US consumer inflation figures before placing fresh directional bets.
Heading into the key data risk, growing acceptance that the Federal Reserve (Fed) will start cutting interest rates in September keeps the US Dollar (USD) bulls on the defensive and continues to lend some support to the EUR/USD pair. That said, the poll results of the second round of the French parliamentary elections raise the possibility of a hung parliament. This could act as a headwind for the shared currency and keep a lid on any further appreciating move for the major.
From a technical perspective, the recent breakout through the 1.0800 confluence hurdle – comprising 50-day, 100-day and 200-day Simple Moving Averages (SMAs) favor bullish traders. Moreover, oscillators on the daily chart have been gaining positive traction and suggest that the path of least resistance for the EUR/USD pair is to the upside. That said, any subsequent move-up is likely to confront stiff resistance near a downward-sloping line, currently around the 1.0880 area.
That said, a sustained strength beyond will be seen as a fresh trigger for bullish traders and pave the way for additional gains. Some follow-through buying beyond the 1.0900 mark will reaffirm the constructive outlook and lift the EUR/USD pair to the next relevant resistance near the 1.0960-1.0965 region. The momentum could extend beyond the March swing high, around the 1.0880 area, and allow spot prices to reclaim the 1.1000 psychological mark for the first time since early January.
On the flip side, any meaningful dip is likely to attract fresh buyers near the 1.0800 confluence resistance breakpoint turned support. This should help limit the downside for the EUR/USD pair near the 1.0755-1.0750 horizontal zone. Failure to defend the said support levels, however, might prompt some technical selling and drag spot prices further below the 1.0700 mark, towards challenging June monthly swing low, around the 1.0665 region.
EUR/USD daily chart
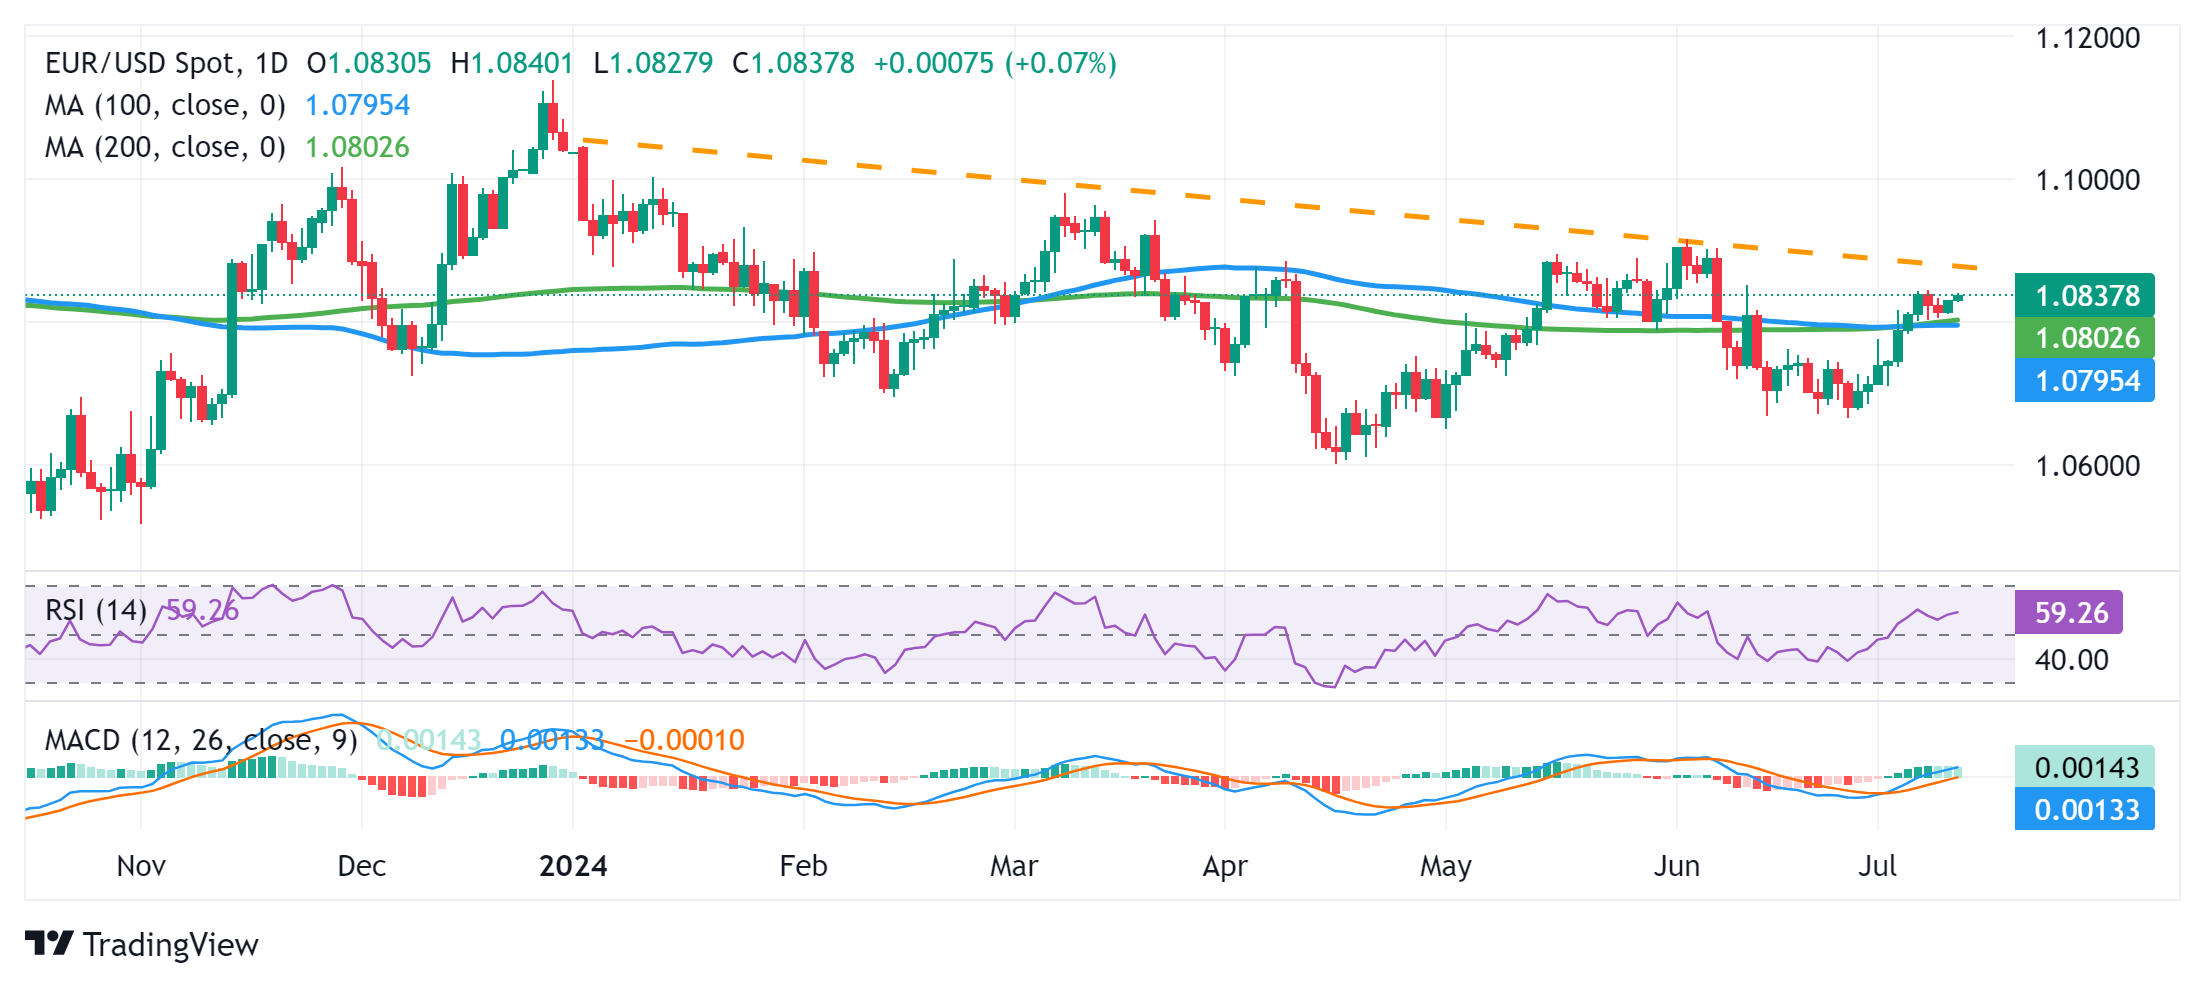
Euro FAQs
The Euro is the currency for the 20 European Union countries that belong to the Eurozone. It is the second most heavily traded currency in the world behind the US Dollar. In 2022, it accounted for 31% of all foreign exchange transactions, with an average daily turnover of over $2.2 trillion a day. EUR/USD is the most heavily traded currency pair in the world, accounting for an estimated 30% off all transactions, followed by EUR/JPY (4%), EUR/GBP (3%) and EUR/AUD (2%).
The European Central Bank (ECB) in Frankfurt, Germany, is the reserve bank for the Eurozone. The ECB sets interest rates and manages monetary policy. The ECB’s primary mandate is to maintain price stability, which means either controlling inflation or stimulating growth. Its primary tool is the raising or lowering of interest rates. Relatively high interest rates – or the expectation of higher rates – will usually benefit the Euro and vice versa. The ECB Governing Council makes monetary policy decisions at meetings held eight times a year. Decisions are made by heads of the Eurozone national banks and six permanent members, including the President of the ECB, Christine Lagarde.
Eurozone inflation data, measured by the Harmonized Index of Consumer Prices (HICP), is an important econometric for the Euro. If inflation rises more than expected, especially if above the ECB’s 2% target, it obliges the ECB to raise interest rates to bring it back under control. Relatively high interest rates compared to its counterparts will usually benefit the Euro, as it makes the region more attractive as a place for global investors to park their money.
Data releases gauge the health of the economy and can impact on the Euro. Indicators such as GDP, Manufacturing and Services PMIs, employment, and consumer sentiment surveys can all influence the direction of the single currency. A strong economy is good for the Euro. Not only does it attract more foreign investment but it may encourage the ECB to put up interest rates, which will directly strengthen the Euro. Otherwise, if economic data is weak, the Euro is likely to fall. Economic data for the four largest economies in the euro area (Germany, France, Italy and Spain) are especially significant, as they account for 75% of the Eurozone’s economy.
Another significant data release for the Euro is the Trade Balance. This indicator measures the difference between what a country earns from its exports and what it spends on imports over a given period. If a country produces highly sought after exports then its currency will gain in value purely from the extra demand created from foreign buyers seeking to purchase these goods. Therefore, a positive net Trade Balance strengthens a currency and vice versa for a negative balance.
- GBP/USD moves upward within an ascending channel, signaling a bullish bias.
- The 14-day RSI is positioned just below the 70 level, indicating potential overbought conditions in the pair.
- A break above the pullback resistance at the 1.2860 level could lead the pair to test the upper boundary.
GBP/USD continues to advance for the second consecutive session, trading around 1.2860 during Asian hours on Thursday. The analysis of the daily chart shows that the pair is moving upward within an ascending channel, which indicates a bullish bias in the pair's price action.
Additionally, the 14-day Relative Strength Index (RSI) is positioned slightly below the 70 level, indicating confirmation of the bullish trend while also suggesting potential overbought conditions. A breach above this level could signal a need for caution, possibly indicating a forthcoming correction.
Furthermore, the Moving Average Convergence Divergence (MACD) momentum indicator indicates bullish momentum in the short term. This is evidenced by the MACD line being above the centerline and showing divergence above the signal line.
In terms of resistance, the GBP/USD pair tests pullback resistance near the 1.2860 level. A successful breakthrough above this barrier could potentially push the pair higher to test the upper boundary of the ascending channel around the 1.2870 level.
On the downside, the GBP/USD pair could encounter significant support near the 14-day Exponential Moving Average (EMA) at the 1.2763 level. If this level is breached, it may lead to increased selling pressure, potentially testing the lower boundary of the ascending channel around 1.2740. Further support could be found around the throwback support level of 1.2615.
GBP/USD: Daily Chart
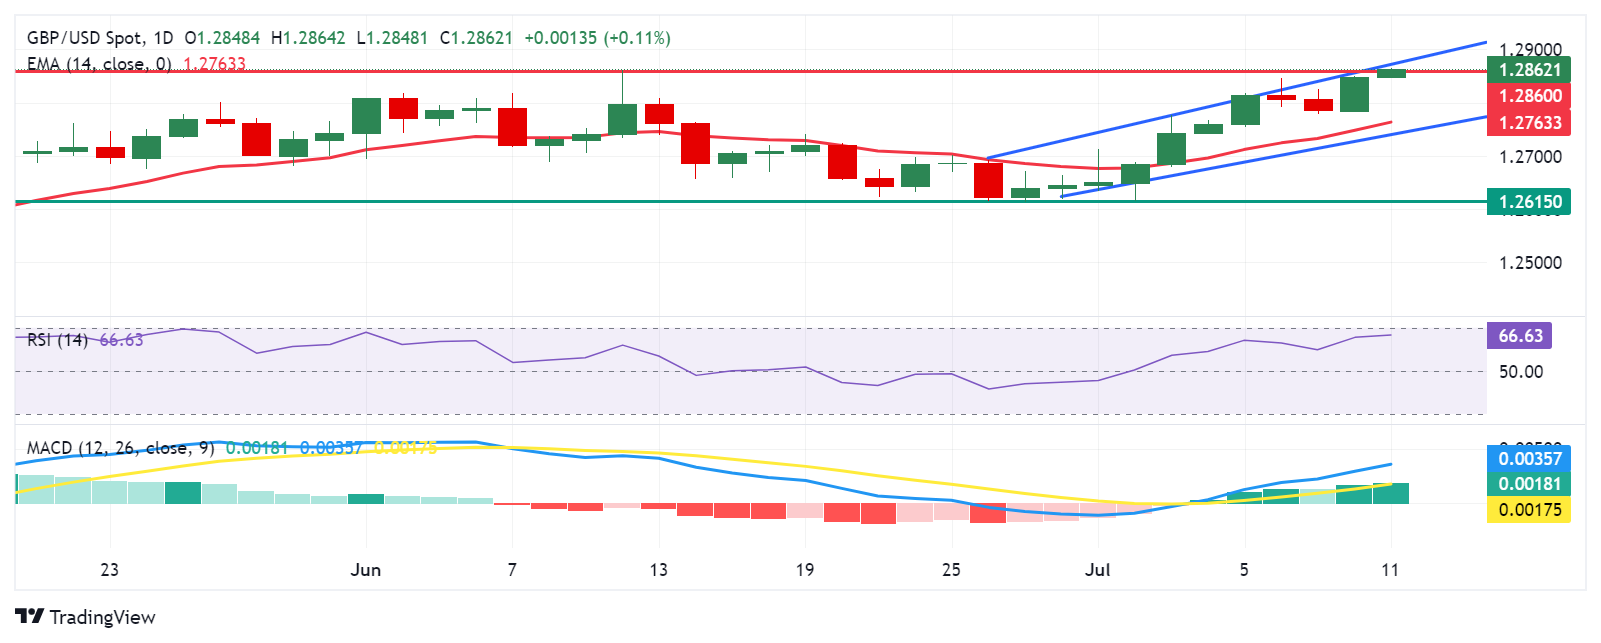
British Pound PRICE Today
The table below shows the percentage change of British Pound (GBP) against listed major currencies today. British Pound was the strongest against the US Dollar.
| USD | EUR | GBP | JPY | CAD | AUD | NZD | CHF | |
|---|---|---|---|---|---|---|---|---|
| USD | -0.07% | -0.10% | -0.03% | -0.03% | -0.21% | -0.27% | -0.04% | |
| EUR | 0.07% | -0.02% | 0.04% | 0.05% | -0.13% | -0.19% | 0.00% | |
| GBP | 0.10% | 0.02% | 0.06% | 0.07% | -0.11% | -0.16% | 0.05% | |
| JPY | 0.03% | -0.04% | -0.06% | -0.01% | -0.19% | -0.28% | -0.04% | |
| CAD | 0.03% | -0.05% | -0.07% | 0.00% | -0.20% | -0.25% | -0.03% | |
| AUD | 0.21% | 0.13% | 0.11% | 0.19% | 0.20% | -0.07% | 0.16% | |
| NZD | 0.27% | 0.19% | 0.16% | 0.28% | 0.25% | 0.07% | 0.22% | |
| CHF | 0.04% | -0.01% | -0.05% | 0.04% | 0.03% | -0.16% | -0.22% |
The heat map shows percentage changes of major currencies against each other. The base currency is picked from the left column, while the quote currency is picked from the top row. For example, if you pick the British Pound from the left column and move along the horizontal line to the US Dollar, the percentage change displayed in the box will represent GBP (base)/USD (quote).
- WTI attracts buyers for the second straight day and draws support from a combination of factors.
- A drop in US inventories, supply disruption worries and a softer USD act as a tailwind for Oil prices.
- China’s economic woes might cap any further gains ahead of the crucial US CPI report later today.
West Texas Intermediate (WTI) US crude Oil prices build on the overnight recovery from the vicinity of the $80.00 mark, or a two-week low and gain some follow-through positive traction during the Asian session on Thursday. The uptick is supported by a combination of factors and lifts the commodity to a multi-day peak, around the $82.00 round figure in the last hour.
The Organization of the Petroleum Exporting Countries (OPEC) maintained its forecast for relatively strong growth in global Oil demand this year and next. Adding to this, the US Energy Information Administration (EIA) reported that crude inventories fell by 3.4 million barrels to 445.1 million barrels in the week ended July 5, far exceeding analysts' expectations. This is seen underpinning Crude Oil prices amid a modest US Dollar (USD) weakness.
Federal Reserve (Fed) Chair Jerome Powell, during the Congressional testimony, said that the US remained on a path to stable prices and continued low unemployment. The comments reaffirmed market expectations that the Fed will lower borrowing costs in September and cut interest rates again in December. The outlook keeps the USD bulls on the defensive and seems to benefit the USD-denominated commodities, including Crude Oil prices.
Furthermore, concerns about supply disruptions stemming from the ongoing conflicts in the Middle East turn out to be another factor lending some support to the black liquid. Meanwhile, weak inflation data from China – the world's top Oil importer – might cap the upside for Crude Oil prices. Traders might also prefer to wait for the release of the US consumer inflation figures before positioning for the next leg of a directional move.
WTI Oil FAQs
WTI Oil is a type of Crude Oil sold on international markets. The WTI stands for West Texas Intermediate, one of three major types including Brent and Dubai Crude. WTI is also referred to as “light” and “sweet” because of its relatively low gravity and sulfur content respectively. It is considered a high quality Oil that is easily refined. It is sourced in the United States and distributed via the Cushing hub, which is considered “The Pipeline Crossroads of the World”. It is a benchmark for the Oil market and WTI price is frequently quoted in the media.
Like all assets, supply and demand are the key drivers of WTI Oil price. As such, global growth can be a driver of increased demand and vice versa for weak global growth. Political instability, wars, and sanctions can disrupt supply and impact prices. The decisions of OPEC, a group of major Oil-producing countries, is another key driver of price. The value of the US Dollar influences the price of WTI Crude Oil, since Oil is predominantly traded in US Dollars, thus a weaker US Dollar can make Oil more affordable and vice versa.
The weekly Oil inventory reports published by the American Petroleum Institute (API) and the Energy Information Agency (EIA) impact the price of WTI Oil. Changes in inventories reflect fluctuating supply and demand. If the data shows a drop in inventories it can indicate increased demand, pushing up Oil price. Higher inventories can reflect increased supply, pushing down prices. API’s report is published every Tuesday and EIA’s the day after. Their results are usually similar, falling within 1% of each other 75% of the time. The EIA data is considered more reliable, since it is a government agency.
OPEC (Organization of the Petroleum Exporting Countries) is a group of 13 Oil-producing nations who collectively decide production quotas for member countries at twice-yearly meetings. Their decisions often impact WTI Oil prices. When OPEC decides to lower quotas, it can tighten supply, pushing up Oil prices. When OPEC increases production, it has the opposite effect. OPEC+ refers to an expanded group that includes ten extra non-OPEC members, the most notable of which is Russia.
- The US Consumer Price Index is forecast to rise 3.1% YoY in June, at a softer pace than May’s 3.3% increase.
- Annual core CPI inflation is expected to hold steady at 3.4%.
- The inflation data could confirm or deny a Fed rate cut in September and drive the US Dollar valuation.
The Bureau of Labor Statistics (BLS) will publish the highly anticipated Consumer Price Index (CPI) inflation data from the United States (US) for June on Wednesday at 12:30 GMT.
The US Dollar (USD) braces for intense volatility, as any surprises from the US inflation report could significantly impact the market’s pricing of the Federal Reserve (Fed) interest rate cut expectations in September.
What to expect in the next CPI data report?
Inflation in the US, as measured by the CPI, is expected to increase at an annual rate of 3.1% in June, down from the 3.3% rise reported in May. The core CPI inflation, which excludes volatile food and energy prices, is seen holding steady at 3.4% in the same period.
Meanwhile, the US CPI is set to rise 0.1% MoM in June after staying unchanged in May. Finally, the monthly core CPI inflation is forecast to rise 0.2% to match the previous increase.
Federal Reserve (Fed) Chairman Jerome Powell delivered the Semi-Annual Monetary Policy Report and testified before US Congress earlier in the week. In his prepared remarks, Powell reiterated that it will not be appropriate to cut the policy rate until they gain greater confidence in inflation heading sustainably toward 2%. When asked about the latest developments in the jobs market, "the most recent labor market data sent a pretty clear signal that the labor market has cooled considerably," he noted. In the end, his remarks failed to move the needle with respect to market pricing of a Fed rate cut in September. According to the CME FedWatch Tool, the probability of the Fed leaving the policy rate unchanged in September stands at around 26%, virtually unchanged from where it stood before this event.
Previewing the June inflation data, “we expect the June CPI report to show that core prices remained largely under control after posting a surprisingly soft 0.16% gain in May,” said TD Securities analysts in a weekly report.
“Headline inflation likely printed flat m/m again (-0.01%) as energy prices continue to provide large relief. Note that our unrounded core CPI forecast at 0.18% m/m suggests larger risks for another dovish surprise to a rounded 0.1% increase,” analysts added.
How could the US Consumer Price Index report affect EUR/USD?
Investors remain optimistic about a Fed rate cut in September, but the market positioning suggests they are not fully convinced yet. Hence, a smaller-than-forecast increase in the monthly core CPI, a reading of 0.1% or smaller, could confirm a policy pivot in September. In this scenario, the US Dollar could come under selling pressure with the immediate reaction.
On the other hand, an increase of 0.3% or bigger could highlight a lack of progress in disinflation and cause market participants to reassess the probability of an interest rate reduction in September. In this case, investors could price in a widening policy gap between the European Central Bank (ECB) and the Fed, opening the door for a sharp decline in EUR/USD in the near term.
Eren Sengezer, European Session Lead Analyst at FXStreet, offers a brief technical outlook for EUR/USD and explains: “EUR/USD holds above the 100-day and the 200-day Simple Moving Averages (SMA) following the pullback seen earlier in the week, reflecting sellers’ hesitancy. Additionally, the Relative Strength Index (RSI) indicator on the daily chart holds above 50 ahead of the US inflation data, indicating a slightly bullish bias in the short term.”
“The Fibonacci 23.6% retracement level of the mid-April-June uptrend forms interim resistance at 1.0850. Once EUR/USD clears this level, it could face next resistance at 1.0900-1.0915 (psychological level, June 4 high) before targeting 1.1000. On the downside, technical sellers could take action and force EUR/USD to stretch lower if the pair drops below 1.0800 (100-day SMA, 200-day SMA) and starts using this level as resistance. In this scenario, 1.0750 (20-day SMA) could be seen as the next support before 1.0680 (Fibonacci 78.6% retracement).”
Fed FAQs
Monetary policy in the US is shaped by the Federal Reserve (Fed). The Fed has two mandates: to achieve price stability and foster full employment. Its primary tool to achieve these goals is by adjusting interest rates. When prices are rising too quickly and inflation is above the Fed’s 2% target, it raises interest rates, increasing borrowing costs throughout the economy. This results in a stronger US Dollar (USD) as it makes the US a more attractive place for international investors to park their money. When inflation falls below 2% or the Unemployment Rate is too high, the Fed may lower interest rates to encourage borrowing, which weighs on the Greenback.
The Federal Reserve (Fed) holds eight policy meetings a year, where the Federal Open Market Committee (FOMC) assesses economic conditions and makes monetary policy decisions. The FOMC is attended by twelve Fed officials – the seven members of the Board of Governors, the president of the Federal Reserve Bank of New York, and four of the remaining eleven regional Reserve Bank presidents, who serve one-year terms on a rotating basis.
In extreme situations, the Federal Reserve may resort to a policy named Quantitative Easing (QE). QE is the process by which the Fed substantially increases the flow of credit in a stuck financial system. It is a non-standard policy measure used during crises or when inflation is extremely low. It was the Fed’s weapon of choice during the Great Financial Crisis in 2008. It involves the Fed printing more Dollars and using them to buy high grade bonds from financial institutions. QE usually weakens the US Dollar.
Quantitative tightening (QT) is the reverse process of QE, whereby the Federal Reserve stops buying bonds from financial institutions and does not reinvest the principal from the bonds it holds maturing, to purchase new bonds. It is usually positive for the value of the US Dollar.
- The Japanese Yen strengthens as overseas investors anticipate the BoJ raising rates in July.
- The Japanese government's 10-year JGB yield remains stable at around 1.09%, close to its recent high of 1.10%.
- Fed Chair Powell highlighted the urgent need to monitor the deteriorating labor market.
The Japanese Yen (JPY) halts its three-day losing streak on Thursday. This upside is possibly driven by the rising speculation that the Bank of Japan (BoJ) might raise interest rates at its upcoming July meeting. This development supported the JPY while weakening the USD/JPY pair.
The Japanese government's 10-year JGB yield holds steady at approximately 1.09%, near its peak of 1.1% recorded on July 3. The stability comes amidst selling pressure on Japanese government bonds, reflecting overseas investors' anticipation that the Bank of Japan may raise interest rates in response to a weakening Japanese Yen, as reported by Nikkei Asia.
The US Dollar (USD) weakened, likely impacted by lower US Treasury yields. Fed Chair Jerome Powell highlighted the urgent need to monitor the deteriorating labor market on Wednesday while expressing optimism about the downward trajectory of inflation.
Traders are now eyeing the upcoming US Consumer Price Index (CPI) data for June, scheduled for release on Thursday, for more clarity on the Federal Reserve's (Fed) monetary policy direction.
Daily Digest Market Movers: Japanese Yen improves amid hawkish sentiment surrounding the BoJ
- Peter Boockvar, chief financial officer at US-based Bleakley Financial Group, said that the Yen's weakness will trigger the BoJ to "react sooner rather than later," per Reuters.
- Reuters reported on Wednesday, citing unnamed sources, the Bank of Japan will likely trim this year's economic growth forecast and project inflation will stay around its 2% target in coming years at its meeting this month.
- Fed Chair Jerome Powell stated in his Congressional testimony on Tuesday, "More good data would strengthen our confidence in inflation." Powell emphasized that a "Policy rate cut is not appropriate until the Fed gains greater confidence that inflation is headed sustainably toward 2%." He also noted that "first-quarter data did not support the greater confidence in the inflation path that the Fed needs to cut rates."
- According to a Bloomberg report on Tuesday, the Bank of Japan is conducting three in-person meetings with banks, securities firms, and financial institutions over the next few days. The purpose of these meetings is to assess a feasible pace for scaling back its purchases of Japanese Government Bonds.
- On Tuesday, Japan's Finance Minister Shunichi Suzuki underscored the significance of maintaining fiscal discipline to bolster confidence in long-term fiscal health. Suzuki also mentioned monitoring closely the discussions at the BoJ meeting concerning the bond market, as reported by Reuters.
- The Japanese Yen may struggle due to overseas asset purchases by Japanese individuals through the newly revamped tax-free investment scheme, the Nippon Individual Savings Account (NISA) program. According to Nikkei Asia, the scale of these purchases is expected to exceed the country's trade deficit during the first half of this year.
- Japan’s Ministry of Finance reported on Monday that Japanese investment trust management companies and asset management firms bought ¥6.16 trillion ($38 billion) more in offshore equities and investment fund shares than they sold during the first six months of the year.
Technical Analysis: USD/JPY hovers around 161.50
USD/JPY trades around 161.60 on Thursday, maintaining an upward trajectory within an ascending channel pattern, indicating a bullish bias according to daily chart analysis. Supporting this outlook, the 14-day Relative Strength Index (RSI) sits just below the 70 level, suggesting potential overbought conditions. A breach above this level could signal a need for caution and a possible correction.
The USD/JPY pair may aim for psychological resistance near 163.00, located at the upper boundary of the ascending channel. A successful breakout above this level could reinforce bullish sentiment, potentially pushing the pair toward significant resistance around 163.50.
Conversely, initial support is expected around the 21-day Exponential Moving Average (EMA) at 160.13. A drop below this level might trigger selling pressure, testing the lower boundary of the ascending channel near the psychological level of 160.00. A further decline below this channel support could see the pair revisiting June's low around 154.55.
USD/JPY: Daily Chart
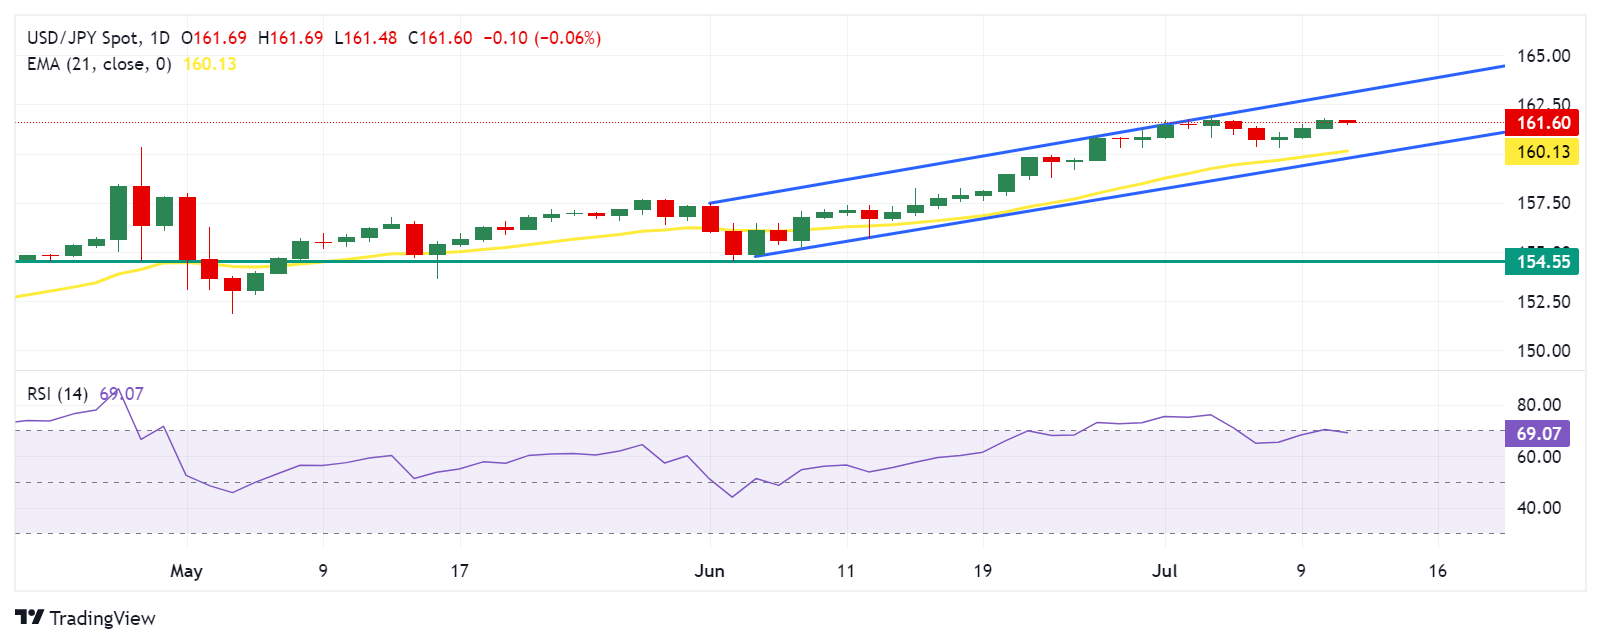
Japanese Yen PRICE Today
The table below shows the percentage change of Japanese Yen (JPY) against listed major currencies today. Japanese Yen was the strongest against the US Dollar.
| USD | EUR | GBP | JPY | CAD | AUD | NZD | CHF | |
|---|---|---|---|---|---|---|---|---|
| USD | -0.08% | -0.11% | -0.08% | -0.04% | -0.23% | -0.23% | -0.10% | |
| EUR | 0.08% | -0.02% | 0.00% | 0.08% | -0.14% | -0.15% | -0.01% | |
| GBP | 0.11% | 0.02% | 0.04% | 0.08% | -0.12% | -0.13% | 0.03% | |
| JPY | 0.08% | 0.00% | -0.04% | 0.03% | -0.16% | -0.21% | -0.02% | |
| CAD | 0.04% | -0.08% | -0.08% | -0.03% | -0.22% | -0.22% | -0.06% | |
| AUD | 0.23% | 0.14% | 0.12% | 0.16% | 0.22% | -0.02% | 0.14% | |
| NZD | 0.23% | 0.15% | 0.13% | 0.21% | 0.22% | 0.02% | 0.16% | |
| CHF | 0.10% | 0.01% | -0.03% | 0.02% | 0.06% | -0.14% | -0.16% |
The heat map shows percentage changes of major currencies against each other. The base currency is picked from the left column, while the quote currency is picked from the top row. For example, if you pick the Japanese Yen from the left column and move along the horizontal line to the US Dollar, the percentage change displayed in the box will represent JPY (base)/USD (quote).
Bank of Japan FAQs
The Bank of Japan (BoJ) is the Japanese central bank, which sets monetary policy in the country. Its mandate is to issue banknotes and carry out currency and monetary control to ensure price stability, which means an inflation target of around 2%.
The Bank of Japan has embarked in an ultra-loose monetary policy since 2013 in order to stimulate the economy and fuel inflation amid a low-inflationary environment. The bank’s policy is based on Quantitative and Qualitative Easing (QQE), or printing notes to buy assets such as government or corporate bonds to provide liquidity. In 2016, the bank doubled down on its strategy and further loosened policy by first introducing negative interest rates and then directly controlling the yield of its 10-year government bonds.
The Bank’s massive stimulus has caused the Yen to depreciate against its main currency peers. This process has exacerbated more recently due to an increasing policy divergence between the Bank of Japan and other main central banks, which have opted to increase interest rates sharply to fight decades-high levels of inflation. The BoJ’s policy of holding down rates has led to a widening differential with other currencies, dragging down the value of the Yen.
A weaker Yen and the spike in global energy prices have led to an increase in Japanese inflation, which has exceeded the BoJ’s 2% target. Still, the Bank judges that the sustainable and stable achievement of the 2% target has not yet come in sight, so any sudden change in the current policy looks unlikely.
- Gold price ticks higher for the third straight day on Thursday, albeit lacking bullish conviction.
- Fed rate cut bets keep the USD bulls on the defensive and continue to lend some support.
- The risk-on mood caps the upside as traders keenly await the release of the US CPI report.
Gold price (XAU/USD) attracts some buyers for the third successive day on Thursday, albeit it lacks follow-through and trades below the weekly top during the Asian session. Traders now seem reluctant and prefer to wait for the release of the latest consumer inflation figures from the United States (US) before positioning for a firm near-term direction. The key US CPI report will be looked upon for more cues on interest rate cuts by the Federal Reserve (Fed), which, in turn, should drive the US Dollar (USD) demand and provide some meaningful impetus to the non-yielding yellow metal.
Heading into the key data risk, comments from Fed Chair Jerome Powell reaffirmed market expectations that the central bank will lower borrowing costs in September and again in December. This keeps the USD bulls on the defensive and continues to act as a tailwind for the Gold price. Apart from this, sustained central bank buying, macroeconomic uncertainties, and geopolitical risks lend support to the XAU/USD. That said, the prevalent risk-on environment is holding back bullish traders from placing fresh bets and capping any further gains for the safe-haven precious metal.
Daily Digest Market Movers: Gold price continues to draw support from rising Fed rate cut bets
- Firming acceptance that the Federal Reserve (Fed) will begin its rate-cutting cycle in September and lower borrowing costs again in December continues to undermine the US Dollar, lending some support to the Gold price.
- The bets were lifted by Fed Chair Jerome Powell's comments, saying that the US remained on a path back to stable prices and that the central bank will consider neutral rates later in 2024 once inflation makes more progress.
- Powell acknowledged some cooling in the US economy, though he said that he continues to see a soft landing, boosting investors' appetite for riskier assets, which, in turn, is seen capping the upside for the safe-haven XAU/USD.
- Powell also reiterated that the Fed remained committed to its 2% inflation target, making the release of the latest US consumer inflation more relevant and holding back traders from placing fresh bullish bets around the metal.
- The headline CPI is estimated to have risen by 0.1% in June and the yearly rate decelerated from 3.3% to 3.1%, while the Core CPI (excluding Food and Energy prices) is expected to remain sticky and come in at a 3.4% YoY rate.
- The crucial inflation data will set the stage for the Fed's rate-cut path, which, in turn, should influence the USD price dynamics and help in determining the next leg of a directional move for the non-yielding yellow metal.
Technical Analysis: Gold price could aim to reclaim the $2,400 mark and retest the all-time peak
From a technical perspective, last week's sustained breakout through the 50-day Simple Moving Average (SMA) and a subsequent move beyond the $2,365 supply zone was seen as a fresh trigger for bullish traders. Moreover, oscillators on the daily chart have been gaining positive traction and suggest that the path of least resistance for the Gold price is to the upside. This, in turn, supports prospects for some follow-through strength towards reclaiming the $2,400 mark with some intermediate hurdle near the overnight swing high, around the $2,386-2,387 zone, and the $2,393 area, over a one-month top touched last week.
On the flip side, any corrective slide is likely to find some support near the $2,360-2,358 region ahead of the 50-day SMA, currently pegged near the $2,345 area. A convincing break below the latter has the potential to drag the Gold price to the $2,319-2,318 support en route to the $2,300 mark and the $2,285 horizontal zone. The latter now coincides with the 100-day SMA, which, if broken, decisively might shift the near-term bias in favor of bearish traders. The XAU/USD might then slide to the $2,258 intermediate support before dropping to the $2,225-2,220 area and the $2,200 round-figure mark.
Gold FAQs
Gold has played a key role in human’s history as it has been widely used as a store of value and medium of exchange. Currently, apart from its shine and usage for jewelry, the precious metal is widely seen as a safe-haven asset, meaning that it is considered a good investment during turbulent times. Gold is also widely seen as a hedge against inflation and against depreciating currencies as it doesn’t rely on any specific issuer or government.
Central banks are the biggest Gold holders. In their aim to support their currencies in turbulent times, central banks tend to diversify their reserves and buy Gold to improve the perceived strength of the economy and the currency. High Gold reserves can be a source of trust for a country’s solvency. Central banks added 1,136 tonnes of Gold worth around $70 billion to their reserves in 2022, according to data from the World Gold Council. This is the highest yearly purchase since records began. Central banks from emerging economies such as China, India and Turkey are quickly increasing their Gold reserves.
Gold has an inverse correlation with the US Dollar and US Treasuries, which are both major reserve and safe-haven assets. When the Dollar depreciates, Gold tends to rise, enabling investors and central banks to diversify their assets in turbulent times. Gold is also inversely correlated with risk assets. A rally in the stock market tends to weaken Gold price, while sell-offs in riskier markets tend to favor the precious metal.
The price can move due to a wide range of factors. Geopolitical instability or fears of a deep recession can quickly make Gold price escalate due to its safe-haven status. As a yield-less asset, Gold tends to rise with lower interest rates, while higher cost of money usually weighs down on the yellow metal. Still, most moves depend on how the US Dollar (USD) behaves as the asset is priced in dollars (XAU/USD). A strong Dollar tends to keep the price of Gold controlled, whereas a weaker Dollar is likely to push Gold prices up.
| Raw materials | Closed | Change, % |
|---|---|---|
| Silver | 30.805 | 0.07 |
| Gold | 237.142 | 0.33 |
| Palladium | 989.02 | 0.67 |
- The Indian Rupee edges higher in Thursday’s Asian session.
- The persistent Indian foreign inflows and a fall in crude oil prices support the INR.
- The US June Consumer Price Index (CPI) inflation data will be the highlight on Thursday.
The Indian Rupee (INR) strengthens on the softer US Dollar (USD) on Thursday. Additionally, the sustained inflow of foreign funds into Indian markets and the decline of crude oil prices all contribute to the INR's upside. The upside of the pair remains capped amid the potential rate cuts by the US Federal Reserve (Fed), even though Fed Chair Jerome Powell said the labor market was better balanced and acknowledged progress on cooling inflation without committing to rate cuts.
Nonetheless, the renewed Greenback demand from importers due to high oil price pressures might undermine the local currency as India is the third largest consumer of crude oil in the world, after the United States and China. Later on Thursday, investors will closely monitor the release of the US Consumer Price Index (CPI) inflation data for June. Further progress on inflation could lead to key changes in their policy statement that pave the way for a September rate cut.
Daily Digest Market Movers: Indian Rupee rebounds amid Indian foreign inflows and lower crude oil prices
- The Indian Rupee is expected to trade with a slight bearish bias on weakness in the domestic market and a positive tone in the US Dollar, said Anuj Choudhary, Research Analyst at Sharekhan by BNP Paribas.
- The Fed Chair Jerome Powell responded to questions before the House Financial Services Committee on Wednesday, saying that the Fed will make interest rate decisions based on the data, the incoming data, the evolving outlook, and the balance of risks, and not in consideration of political factors.
- Powell further stated that it would not be appropriate to cut the policy rate until they gain greater confidence in inflation heading sustainably towards the Fed’s 2% target.
- Fed Governor Lisa Cook said on Thursday that US inflation should continue to fall without a significant further rise in the Unemployment Rate, per Reuters.
- The probability of the Fed leaving the policy rate unchanged in September stood at nearly 25% following this event, according to the CME FedWatch Tool.
- The US CPI is projected to show an increase of 3.1% YoY in June, while core inflation is projected to remain steady at 3.4% YoY.
Technical analysis: USD/INR extends consolidation in the near term
The Indian Rupee trades on a positive note on the day. The USD/INR pair maintains its uptrend on the daily chart, with the pair holding above the key 100-day Exponential Moving Average (EMA).
In the near term, further consolidation remains in play as the pair has traded within a familiar trading range since March 21. The neutral momentum is also supported by the 14-day Relative Strength Index (RSI), which hovers around the 50-midline.
Sustained trading above the upper boundary of the trading range at 83.65 will pave the way to the all-time high of 83.75. Further north, the next hurdle is seen at the 84.00 psychological barrier.
On the other hand, a decisive break below the 100-day EMA at 83.36 could draw in enough bearish demand to the 83.00 round mark. The additional downside filter to watch is 82.82, a low of January 12.
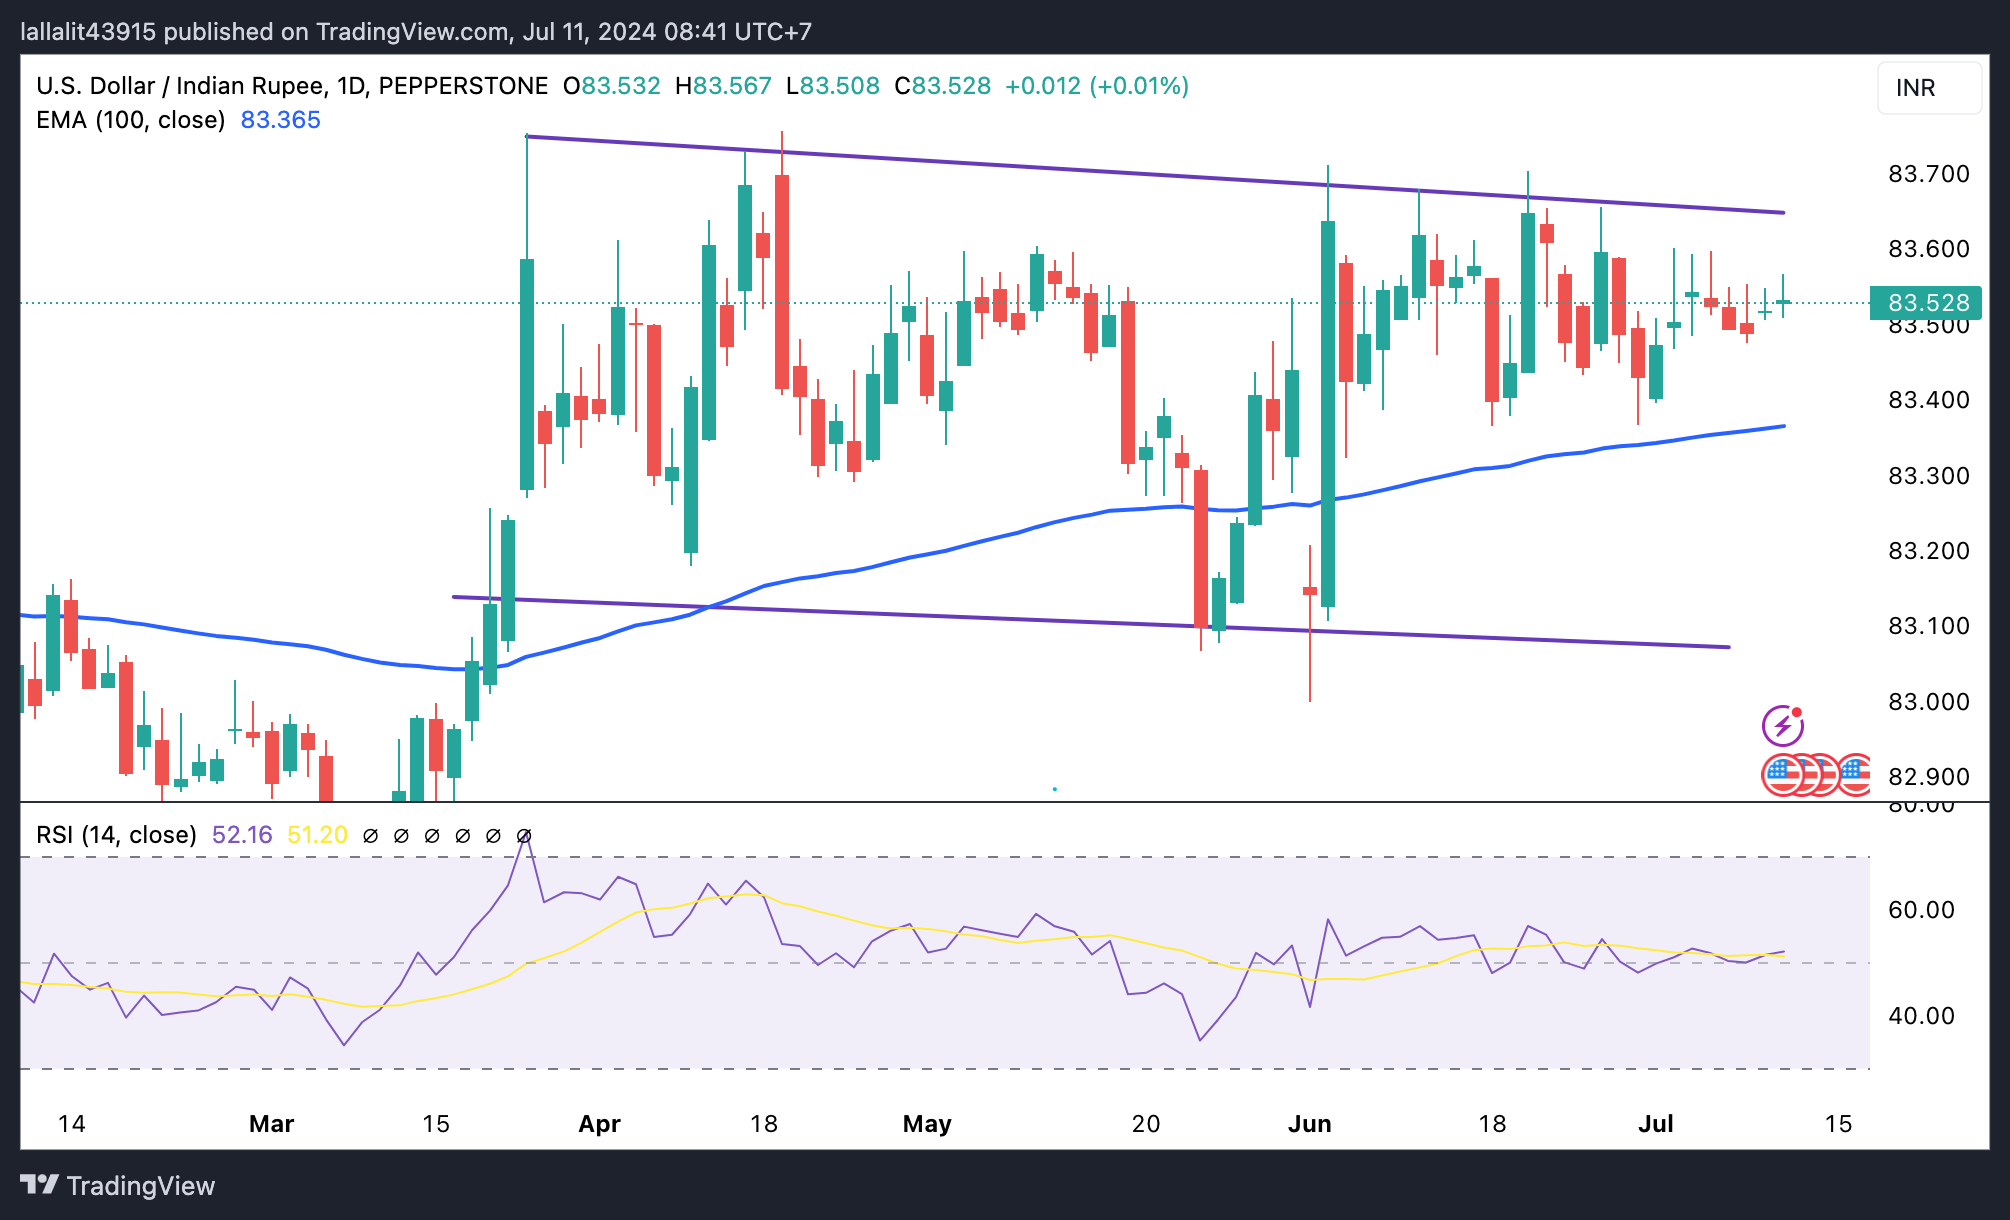
US Dollar price today
The table below shows the percentage change of US Dollar (USD) against listed major currencies today. US Dollar was the weakest against the Australian Dollar.
| USD | EUR | GBP | CAD | AUD | JPY | NZD | CHF | |
| USD | -0.05% | -0.04% | -0.01% | -0.09% | -0.01% | -0.07% | -0.07% | |
| EUR | 0.06% | 0.01% | 0.04% | -0.05% | 0.05% | -0.01% | 0.01% | |
| GBP | 0.05% | -0.01% | 0.05% | -0.06% | 0.03% | -0.02% | -0.02% | |
| CAD | 0.01% | -0.05% | -0.05% | -0.09% | 0.01% | -0.06% | -0.04% | |
| AUD | 0.09% | 0.05% | 0.05% | 0.09% | 0.07% | 0.05% | 0.05% | |
| JPY | 0.01% | -0.03% | -0.04% | 0.00% | -0.08% | -0.06% | -0.04% | |
| NZD | 0.07% | 0.01% | 0.01% | 0.08% | -0.04% | 0.06% | 0.01% | |
| CHF | 0.06% | -0.02% | 0.01% | 0.05% | -0.05% | 0.02% | 0.00% |
The heat map shows percentage changes of major currencies against each other. The base currency is picked from the left column, while the quote currency is picked from the top row. For example, if you pick the Euro from the left column and move along the horizontal line to the Japanese Yen, the percentage change displayed in the box will represent EUR (base)/JPY (quote).
Indian Rupee FAQs
The Indian Rupee (INR) is one of the most sensitive currencies to external factors. The price of Crude Oil (the country is highly dependent on imported Oil), the value of the US Dollar – most trade is conducted in USD – and the level of foreign investment, are all influential. Direct intervention by the Reserve Bank of India (RBI) in FX markets to keep the exchange rate stable, as well as the level of interest rates set by the RBI, are further major influencing factors on the Rupee.
The Reserve Bank of India (RBI) actively intervenes in forex markets to maintain a stable exchange rate, to help facilitate trade. In addition, the RBI tries to maintain the inflation rate at its 4% target by adjusting interest rates. Higher interest rates usually strengthen the Rupee. This is due to the role of the ‘carry trade’ in which investors borrow in countries with lower interest rates so as to place their money in countries’ offering relatively higher interest rates and profit from the difference.
Macroeconomic factors that influence the value of the Rupee include inflation, interest rates, the economic growth rate (GDP), the balance of trade, and inflows from foreign investment. A higher growth rate can lead to more overseas investment, pushing up demand for the Rupee. A less negative balance of trade will eventually lead to a stronger Rupee. Higher interest rates, especially real rates (interest rates less inflation) are also positive for the Rupee. A risk-on environment can lead to greater inflows of Foreign Direct and Indirect Investment (FDI and FII), which also benefit the Rupee.
Higher inflation, particularly, if it is comparatively higher than India’s peers, is generally negative for the currency as it reflects devaluation through oversupply. Inflation also increases the cost of exports, leading to more Rupees being sold to purchase foreign imports, which is Rupee-negative. At the same time, higher inflation usually leads to the Reserve Bank of India (RBI) raising interest rates and this can be positive for the Rupee, due to increased demand from international investors. The opposite effect is true of lower inflation.
The People’s Bank of China (PBOC) set the USD/CNY central rate on Thursday at 7.1300, as against the previous day's fix of 7.1342 and 7.2730 Reuters estimates.
- The Australian Dollar gains ground due to the hawkish sentiment surrounding the RBA.
- Australia's Consumer Inflation Expectations for July posted a reading of 4.3%, slightly lower than June’s 4.4% reading.
- The US Dollar declines due to the lower Treasury yields ahead of Consumer Price Index data for June.
The Australian Dollar (AUD) holds gains on Thursday after the release of soft Consumer Inflation Expectations for July by the Melbourne Institute, which presents consumer expectations for inflation over the next 12 months.
The AUD/USD pair receives support from increasing expectations that the Reserve Bank of Australia (RBA) may delay in the global rate-cutting cycle or possibly raise interest rates again. Recent data showed a decline in Australian consumer confidence in July, contrasted by a surge in business sentiment, reaching a 17-month high in June.
The US Dollar (USD) loses ground, potentially influenced by the lower US Treasury yields. Traders are looking to the upcoming US Consumer Price Index (CPI) data for June, due on Thursday, for further insights into the Federal Reserve’s (Fed) monetary policy stance.
Market forecasts generally predict that the annualized US core CPI for the year ending in June will remain steady at 3.4%. Meanwhile, headline CPI inflation is expected to increase to 0.1% month-over-month in June, compared to the previous flat reading of 0.0%.
Daily Digest Market Movers: Australian Dollar improves due to hawkish sentiment surrounding the RBA
- Australia's Consumer Inflation Expectations for July came in at 4.3%, slightly lower than the previous reading of 4.4%.
- Federal Reserve Board Governor Lisa Cook stated on Wednesday, "My baseline forecast...is that inflation will continue to move toward target over time, without much further rise in unemployment," according to Reuters.
- On Wednesday, Fed Chair Jerome Powell emphasized the need to closely monitor the labor market, noting that it has significantly deteriorated. Additionally, Powell expressed confidence in the downward movement of inflation.
- Consumer Price Index (CPI) in China, a close trade partner of Australia, rose at an annual rate of 0.2% in June, down from a 0.3% rise in May. The market had forecasted a 0.4% increase for the period. Monthly, Chinese CPI inflation declined by 0.2% in June, compared to a 0.1% decline in May, which came in below the expected decline of 0.1%.
- On Tuesday, Fed Chair Jerome Powell answered questions before the Senate Banking Committee on the first day of his Congressional testimony. Powell stated, "More good data would strengthen our confidence in inflation." He emphasized that a "policy rate cut is inappropriate until the Fed gains greater confidence that inflation is headed sustainably toward 2%." He also noted that "first-quarter data did not support the greater confidence in the inflation path that the Fed needs to cut rates."
- On Tuesday, Australia's Westpac Consumer Confidence dropped by 1.1% in July, reversing the 1.7% increase seen in June. This marks the fifth decline in 2024, driven by ongoing worries about high inflation, elevated interest rates, and a sluggish economy.
Technical Analysis: Australian Dollar maintains position around 0.6750
The Australian Dollar trades around 0.6750 on Thursday. The Analysis of the daily chart shows that the AUD/USD pair consolidates within an ascending channel, indicating a bullish bias. Additionally, the 14-day Relative Strength Index (RSI) remains above the 50 level, confirming the bullish momentum.
The AUD/USD pair may test the upper boundary of the ascending channel at approximately 0.6785. If it breaks through this level, the pair could target the psychological level of 0.6800.
On the downside, the AUD/USD pair may find support around the lower boundary of the ascending channel at 0.6675, with additional support near the 50-day Exponential Moving Average (EMA) at 0.6646. A break below this level could push the pair toward the throwback support around 0.6590.
AUD/USD: Daily Chart
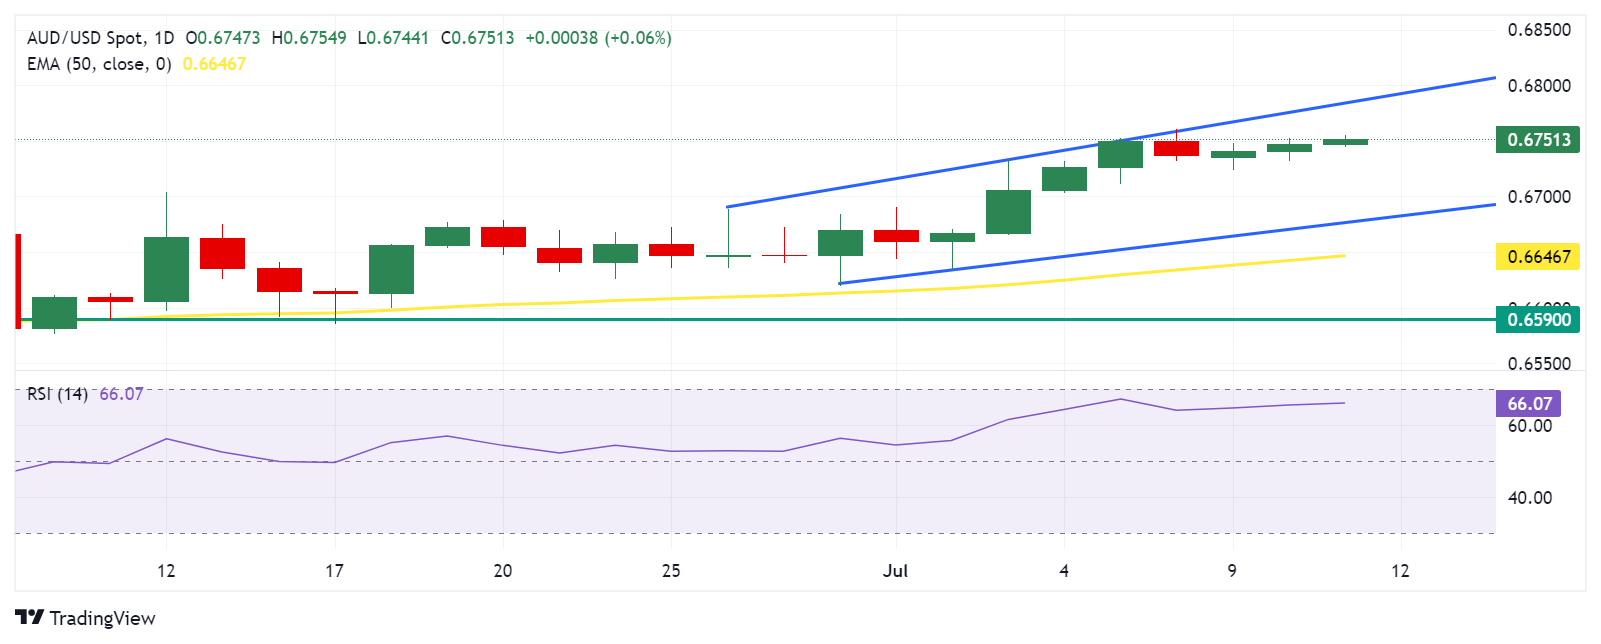
Australian Dollar PRICE Today
The table below shows the percentage change of Australian Dollar (AUD) against listed major currencies today. Australian Dollar was the strongest against the Canadian Dollar.
| USD | EUR | GBP | JPY | CAD | AUD | NZD | CHF | |
|---|---|---|---|---|---|---|---|---|
| USD | -0.03% | -0.03% | -0.03% | 0.03% | -0.05% | -0.08% | -0.07% | |
| EUR | 0.03% | 0.01% | 0.02% | 0.06% | -0.00% | -0.03% | -0.03% | |
| GBP | 0.03% | -0.01% | -0.02% | 0.05% | -0.02% | -0.05% | -0.02% | |
| JPY | 0.03% | -0.02% | 0.02% | 0.04% | -0.02% | -0.09% | -0.03% | |
| CAD | -0.03% | -0.06% | -0.05% | -0.04% | -0.09% | -0.10% | -0.08% | |
| AUD | 0.05% | 0.00% | 0.02% | 0.02% | 0.09% | -0.04% | -0.01% | |
| NZD | 0.08% | 0.03% | 0.05% | 0.09% | 0.10% | 0.04% | 0.03% | |
| CHF | 0.07% | 0.03% | 0.02% | 0.03% | 0.08% | 0.00% | -0.03% |
The heat map shows percentage changes of major currencies against each other. The base currency is picked from the left column, while the quote currency is picked from the top row. For example, if you pick the Australian Dollar from the left column and move along the horizontal line to the US Dollar, the percentage change displayed in the box will represent AUD (base)/USD (quote).
RBA FAQs
The Reserve Bank of Australia (RBA) sets interest rates and manages monetary policy for Australia. Decisions are made by a board of governors at 11 meetings a year and ad hoc emergency meetings as required. The RBA’s primary mandate is to maintain price stability, which means an inflation rate of 2-3%, but also “..to contribute to the stability of the currency, full employment, and the economic prosperity and welfare of the Australian people.” Its main tool for achieving this is by raising or lowering interest rates. Relatively high interest rates will strengthen the Australian Dollar (AUD) and vice versa. Other RBA tools include quantitative easing and tightening.
While inflation had always traditionally been thought of as a negative factor for currencies since it lowers the value of money in general, the opposite has actually been the case in modern times with the relaxation of cross-border capital controls. Moderately higher inflation now tends to lead central banks to put up their interest rates, which in turn has the effect of attracting more capital inflows from global investors seeking a lucrative place to keep their money. This increases demand for the local currency, which in the case of Australia is the Aussie Dollar.
Macroeconomic data gauges the health of an economy and can have an impact on the value of its currency. Investors prefer to invest their capital in economies that are safe and growing rather than precarious and shrinking. Greater capital inflows increase the aggregate demand and value of the domestic currency. Classic indicators, such as GDP, Manufacturing and Services PMIs, employment, and consumer sentiment surveys can influence AUD. A strong economy may encourage the Reserve Bank of Australia to put up interest rates, also supporting AUD.
Quantitative Easing (QE) is a tool used in extreme situations when lowering interest rates is not enough to restore the flow of credit in the economy. QE is the process by which the Reserve Bank of Australia (RBA) prints Australian Dollars (AUD) for the purpose of buying assets – usually government or corporate bonds – from financial institutions, thereby providing them with much-needed liquidity. QE usually results in a weaker AUD.
Quantitative tightening (QT) is the reverse of QE. It is undertaken after QE when an economic recovery is underway and inflation starts rising. Whilst in QE the Reserve Bank of Australia (RBA) purchases government and corporate bonds from financial institutions to provide them with liquidity, in QT the RBA stops buying more assets, and stops reinvesting the principal maturing on the bonds it already holds. It would be positive (or bullish) for the Australian Dollar.
- NZD/USD rebounds to 0.6090 in Thursday’s early Asian session.
- The RBNZ held its policy rate at its July meeting and delivered a less hawkish tone.
- Fed’s Powell said central bank will make interest rate decisions based on data, not in consideration of political factors.
The NZD/USD pair trades on a stronger note around 0.6090 during the early Asian session on Thursday. The pair recovers some lost ground on the weaker US Dollar (USD) after retreating from the weekly high of nearly 0.6155. The release of the US Consumer Price Index (CPI) data for June will be in the spotlight on Thursday.
On Wednesday, the Reserve Bank of New Zealand (RBNZ) decided to hold its Official Cash Rate (OCR) for the eighth consecutive meeting at 5.5%, the highest since December 2008. The board notes a risk that domestically driven inflation could be more persistent in the near term. The central bank expected headline inflation to return to within the 1 to 3% target range in the second half of this year. A less hawkish view on inflation is likely to exert some selling pressure on the Kiwi for the time being.
On the USD’s front, Federal Reserve (Fed) Chair Jerome Powell said on Wednesday that the US central bank would make interest rate decisions based on the data, the incoming data, the evolving outlook, and the balance of risks, and not in consideration of political factors.
Furthermore, Powell emphasized that the Fed will not be appropriate to cut the policy rate until they gain greater confidence in inflation heading sustainably towards the Fed’s 2% target. The cautious stance from the Fed might lift the Greenback in the near term. However, investors will take more cues from the key US inflation report later in the day. The softer CPI inflation reading could trigger the expectation of the Fed rate cuts this year and might weigh on the US Dollar (USD) against the NZD.
New Zealand Dollar FAQs
The New Zealand Dollar (NZD), also known as the Kiwi, is a well-known traded currency among investors. Its value is broadly determined by the health of the New Zealand economy and the country’s central bank policy. Still, there are some unique particularities that also can make NZD move. The performance of the Chinese economy tends to move the Kiwi because China is New Zealand’s biggest trading partner. Bad news for the Chinese economy likely means less New Zealand exports to the country, hitting the economy and thus its currency. Another factor moving NZD is dairy prices as the dairy industry is New Zealand’s main export. High dairy prices boost export income, contributing positively to the economy and thus to the NZD.
The Reserve Bank of New Zealand (RBNZ) aims to achieve and maintain an inflation rate between 1% and 3% over the medium term, with a focus to keep it near the 2% mid-point. To this end, the bank sets an appropriate level of interest rates. When inflation is too high, the RBNZ will increase interest rates to cool the economy, but the move will also make bond yields higher, increasing investors’ appeal to invest in the country and thus boosting NZD. On the contrary, lower interest rates tend to weaken NZD. The so-called rate differential, or how rates in New Zealand are or are expected to be compared to the ones set by the US Federal Reserve, can also play a key role in moving the NZD/USD pair.
Macroeconomic data releases in New Zealand are key to assess the state of the economy and can impact the New Zealand Dollar’s (NZD) valuation. A strong economy, based on high economic growth, low unemployment and high confidence is good for NZD. High economic growth attracts foreign investment and may encourage the Reserve Bank of New Zealand to increase interest rates, if this economic strength comes together with elevated inflation. Conversely, if economic data is weak, NZD is likely to depreciate.
The New Zealand Dollar (NZD) tends to strengthen during risk-on periods, or when investors perceive that broader market risks are low and are optimistic about growth. This tends to lead to a more favorable outlook for commodities and so-called ‘commodity currencies’ such as the Kiwi. Conversely, NZD tends to weaken at times of market turbulence or economic uncertainty as investors tend to sell higher-risk assets and flee to the more-stable safe havens.
| Index | Change, points | Closed | Change, % |
|---|---|---|---|
| NIKKEI 225 | 251.82 | 41831.99 | 0.61 |
| Hang Seng | -51.56 | 17471.67 | -0.29 |
| KOSPI | 0.61 | 2867.99 | 0.02 |
| ASX 200 | -12.9 | 7816.8 | -0.16 |
| DAX | 171.03 | 18407.22 | 0.94 |
| CAC 40 | 64.89 | 7573.55 | 0.86 |
| Dow Jones | 429.39 | 39721.36 | 1.09 |
| S&P 500 | 56.93 | 5633.91 | 1.02 |
| NASDAQ Composite | 218.16 | 18647.45 | 1.18 |
| Pare | Closed | Change, % |
|---|---|---|
| AUDUSD | 0.67461 | 0.07 |
| EURJPY | 174.98 | 0.32 |
| EURUSD | 1.08279 | 0.13 |
| GBPJPY | 207.579 | 0.64 |
| GBPUSD | 1.28479 | 0.47 |
| NZDUSD | 0.608 | -0.74 |
| USDCAD | 1.36185 | -0.11 |
| USDCHF | 0.89922 | 0.18 |
| USDJPY | 161.565 | 0.17 |


© 2000-2026. Sva prava zaštićena.
Sajt je vlasništvo kompanije Teletrade D.J. LLC 2351 LLC 2022 (Euro House, Richmond Hill Road, Kingstown, VC0100, St. Vincent and the Grenadines).
Svi podaci koji se nalaze na sajtu ne predstavljaju osnovu za donošenje investicionih odluka, već su informativnog karaktera.
The company does not serve or provide services to customers who are residents of the US, Canada, Iran, The Democratic People's Republic of Korea, Yemen and FATF blacklisted countries.
Izvršenje trgovinskih operacija sa finansijskim instrumentima upotrebom marginalne trgovine pruža velike mogućnosti i omogućava investitorima ostvarivanje visokih prihoda. Međutim, takav vid trgovine povezan je sa potencijalno visokim nivoom rizika od gubitka sredstava. Проведение торговых операций на финанcовых рынках c маржинальными финанcовыми инcтрументами открывает широкие возможноcти, и позволяет инвеcторам, готовым пойти на риcк, получать выcокую прибыль, но при этом неcет в cебе потенциально выcокий уровень риcка получения убытков. Iz tog razloga je pre započinjanja trgovine potrebno odlučiti o izboru odgovarajuće investicione strategije, uzimajući u obzir raspoložive resurse.
Upotreba informacija: U slučaju potpunog ili delimičnog preuzimanja i daljeg korišćenja materijala koji se nalazi na sajtu, potrebno je navesti link odgovarajuće stranice na sajtu kompanije TeleTrade-a kao izvora informacija. Upotreba materijala na internetu mora biti praćena hiper linkom do web stranice teletrade.org. Automatski uvoz materijala i informacija sa stranice je zabranjen.
Ako imate bilo kakvih pitanja, obratite nam se pr@teletrade.global.
транcфери