- Analiza
- Novosti i instrumenti
- Vesti sa tržišta
Forex-novosti i prognoze od 10-09-2024
- German HICP inflation falls to 2%, increasing the likelihood of further ECB rate cuts and downward revisions to growth forecasts.
- ECB expected to lower rates by 25 bps while maintaining a restrictive policy stance to combat inflation risks.
- US CPI data could influence Fed rate expectations, with a 70% chance of a 25 bps cut and 30% for a 50 bps cut.
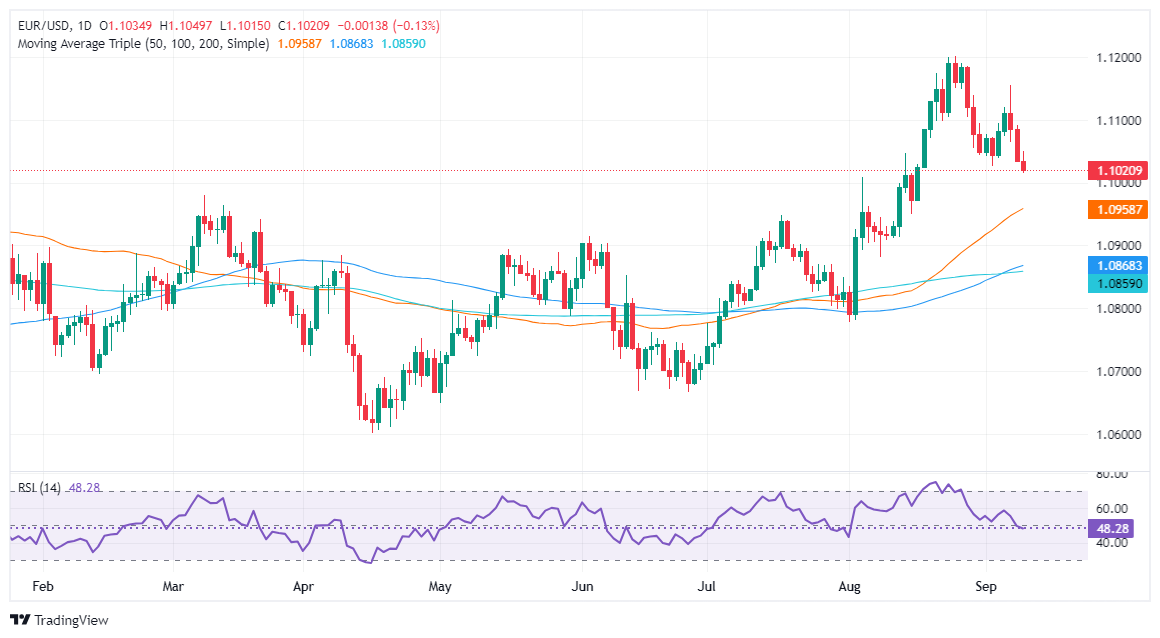
The EUR/USD retreated on Tuesday after the latest inflation report in Germany, which increased the likelihood of another interest rate cut by the European Central Bank (ECB). At the time of writing, the EUR/USD trades at 1.1021, virtually unchanged, as Wednesday’s Asian session begins.
EUR/USD retreats to 1.1021 as lower German inflation fuels expectations of a 25 bps ECB rate cut on Thursday
Wall Street ended the session with decent gains, while the Greenback is almost flat. Data during the European session witnessed German inflation falling to its lowest level in over three years as the Harmonized Index of Consumer Prices (HICP) hit 2%, the ECB’s goal.
On Thursday, the ECB is expected to lower interest rates by a quarter of a percentage point, yet according to analysts at BBH, the central bank would emphasize that “it will keep policy sufficiently restrictive for as long as necessary."
Besides that, the ECB is expected to update its economic projections, which include a downward revision of economic growth and inflation. Money market traders continue to price in 50 to 75 basis points of cuts toward the end of the year.
Ahead of the week, August's US Consumer Price Index (CPI) is expected to dip towards the Fed’s 2% goal. A lower-than-expected CPI report could increase the odds of the Federal Reserve easing rates by 50 basis points, though most analysts expect the Fed to adjust policy gradually.
The CME FedWatch Tool shows that the odds for a 25 bps rate cut are 70%, while for a 50 bps rate cut, they are 30%.
EUR/USD Price Forecast: Technical outlook
From a technical standpoint, the EUR/USD remains neutral with an upward bias. However, a decisive break below the September 3 low of 1.1026 could open the door to further downside. Key support levels, such as the 1.1000 mark, will be exposed, followed by the 50-day moving average (DMA) at 1.0958. A breach of this level could lead to a test of the confluence of the 100 and 200-DMAs around 1.0867/58, before targeting the August 1 swing low at 1.0777.
For a bullish resumption, buyers would need to lift the pair above the September 9 high at 1.1091.
Euro FAQs
The Euro is the currency for the 20 European Union countries that belong to the Eurozone. It is the second most heavily traded currency in the world behind the US Dollar. In 2022, it accounted for 31% of all foreign exchange transactions, with an average daily turnover of over $2.2 trillion a day. EUR/USD is the most heavily traded currency pair in the world, accounting for an estimated 30% off all transactions, followed by EUR/JPY (4%), EUR/GBP (3%) and EUR/AUD (2%).
The European Central Bank (ECB) in Frankfurt, Germany, is the reserve bank for the Eurozone. The ECB sets interest rates and manages monetary policy. The ECB’s primary mandate is to maintain price stability, which means either controlling inflation or stimulating growth. Its primary tool is the raising or lowering of interest rates. Relatively high interest rates – or the expectation of higher rates – will usually benefit the Euro and vice versa. The ECB Governing Council makes monetary policy decisions at meetings held eight times a year. Decisions are made by heads of the Eurozone national banks and six permanent members, including the President of the ECB, Christine Lagarde.
Eurozone inflation data, measured by the Harmonized Index of Consumer Prices (HICP), is an important econometric for the Euro. If inflation rises more than expected, especially if above the ECB’s 2% target, it obliges the ECB to raise interest rates to bring it back under control. Relatively high interest rates compared to its counterparts will usually benefit the Euro, as it makes the region more attractive as a place for global investors to park their money.
Data releases gauge the health of the economy and can impact on the Euro. Indicators such as GDP, Manufacturing and Services PMIs, employment, and consumer sentiment surveys can all influence the direction of the single currency. A strong economy is good for the Euro. Not only does it attract more foreign investment but it may encourage the ECB to put up interest rates, which will directly strengthen the Euro. Otherwise, if economic data is weak, the Euro is likely to fall. Economic data for the four largest economies in the euro area (Germany, France, Italy and Spain) are especially significant, as they account for 75% of the Eurozone’s economy.
Another significant data release for the Euro is the Trade Balance. This indicator measures the difference between what a country earns from its exports and what it spends on imports over a given period. If a country produces highly sought after exports then its currency will gain in value purely from the extra demand created from foreign buyers seeking to purchase these goods. Therefore, a positive net Trade Balance strengthens a currency and vice versa for a negative balance.
- USD/CAD climbs above 1.3588, fueled by BoC Governor Macklem's dovish comments and falling oil prices from Tropical Storm Francine.
- BoC hints at more aggressive rate cuts as Canadian economy slows and unemployment hits a seven-year peak.
- Investors anticipate US CPI data, which could bolster expectations for a Fed rate cut at the upcoming September 17-18 meeting.
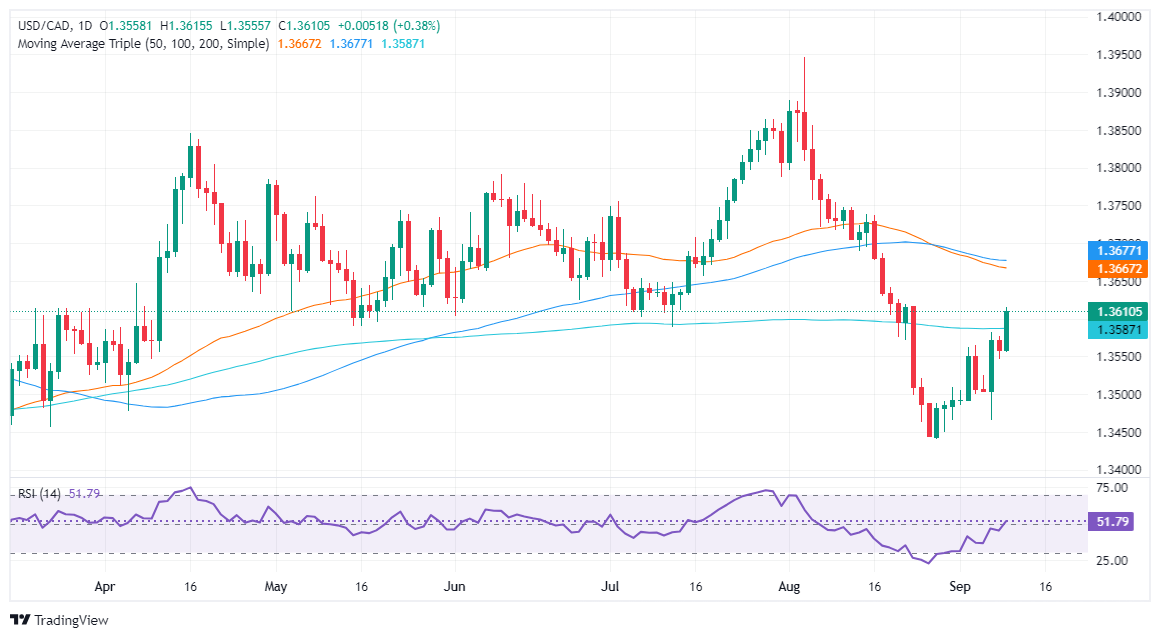
The USD/CAD rallied to a three-week high above the 200-day moving average (DMA) of 1.3588, gaining 0.36% after bouncing off the daily lows of 1.3553. The rally was weighed by the dovish comments of Bank of Canada (BoC) Governor Tiff Macklem and the drop in oil prices. At the time of writing, the pair trades at 1.3608.
USD/CAD climbs and surpasses 200-DMA, on BoC comments
Wall Street ended Tuesday’s session with gains, while the US Dollar clings to minimal gains of 0.06%, according to the US Dollar Index (DXY), trading at 101.67.
BoC’s Governor Macklem stated that deeper rate cuts could be appropriate and added that shifts in global trade may drive up prices.
In the meantime, the impact of tropical storm Francine sponsored a leg-down in oil prices as oil and gas producers shut off most installations as the storm advanced toward landfall in Louisiana.
The Canadian Dollar weakened since the Bank of Canada (BoC) was the first major central bank to slash rates amid fears of an economic slowdown. Last week, Canada’s unemployment rate climbed to 6.6%, the highest in seven years, excluding the two years of the COVID-19 pandemic.
On the US front, investors are eyeing the release of the Consumer Price Index (CPI) in August, which is expected to confirm that the Federal Reserve might begin to cut rates at the upcoming September 17-18 monetary policy meeting.
USD/CAD Price Forecast: Technical outlook
From a technical perspective, the USD/CAD remains neutral biased, even though the pair has cracked the 200-day moving average (DMA) at 1.3589 and achieved a daily close above the latter.
Short term, momentum is tilted to the upside, though for a bullish continuation, the USD/CAD must clear key resistance levels. The next ceiling level will be August 22 and 23 highs at 1.3618, followed by the confluence of the 50 and 100-DMAs around 1.3667/75.
On the downside, the path of least resistance sees the first support at 1.3550. A breach of this level would expose 1.3500, followed by the September 6 low at 1.3465.
Canadian Dollar FAQs
The key factors driving the Canadian Dollar (CAD) are the level of interest rates set by the Bank of Canada (BoC), the price of Oil, Canada’s largest export, the health of its economy, inflation and the Trade Balance, which is the difference between the value of Canada’s exports versus its imports. Other factors include market sentiment – whether investors are taking on more risky assets (risk-on) or seeking safe-havens (risk-off) – with risk-on being CAD-positive. As its largest trading partner, the health of the US economy is also a key factor influencing the Canadian Dollar.
The Bank of Canada (BoC) has a significant influence on the Canadian Dollar by setting the level of interest rates that banks can lend to one another. This influences the level of interest rates for everyone. The main goal of the BoC is to maintain inflation at 1-3% by adjusting interest rates up or down. Relatively higher interest rates tend to be positive for the CAD. The Bank of Canada can also use quantitative easing and tightening to influence credit conditions, with the former CAD-negative and the latter CAD-positive.
The price of Oil is a key factor impacting the value of the Canadian Dollar. Petroleum is Canada’s biggest export, so Oil price tends to have an immediate impact on the CAD value. Generally, if Oil price rises CAD also goes up, as aggregate demand for the currency increases. The opposite is the case if the price of Oil falls. Higher Oil prices also tend to result in a greater likelihood of a positive Trade Balance, which is also supportive of the CAD.
While inflation had always traditionally been thought of as a negative factor for a currency since it lowers the value of money, the opposite has actually been the case in modern times with the relaxation of cross-border capital controls. Higher inflation tends to lead central banks to put up interest rates which attracts more capital inflows from global investors seeking a lucrative place to keep their money. This increases demand for the local currency, which in Canada’s case is the Canadian Dollar.
Macroeconomic data releases gauge the health of the economy and can have an impact on the Canadian Dollar. Indicators such as GDP, Manufacturing and Services PMIs, employment, and consumer sentiment surveys can all influence the direction of the CAD. A strong economy is good for the Canadian Dollar. Not only does it attract more foreign investment but it may encourage the Bank of Canada to put up interest rates, leading to a stronger currency. If economic data is weak, however, the CAD is likely to fall.
- GBP/USD remains under pressure near 1.3050 as cautious market sentiment overshadows the brief recovery sparked by UK employment data.
- US CPI data will be Wednesday’s highlight.
- Markets will also follow Tuesday’s US presidential debate.
The GBP/USD pair remains on the defensive, slipping toward 1.3050 during the American session. Despite a temporary boost from positive UK employment data earlier in the day, the pair struggles to hold its ground amid a cautious market atmosphere.
On Tuesday, the UK's Office for National Statistics (ONS) revealed that the ILO Unemployment Rate slightly decreased to 4.1% for the three months ending in July, down from 4.2%, aligning with market expectations. Employment figures showed significant improvement, with an increase of 265,000 jobs during the same period, compared to the previous rise of 97,000. Meanwhile, annual wage growth, as indicated by the Average Earnings Excluding Bonus, slowed to 5.1% from 5.4%.
The upcoming US inflation data will be in focus this week, with the August Consumer Price Index (CPI) set to be released on Wednesday. Headline inflation is anticipated to ease to 2.6% YoY, down from 2.9% in July, while core inflation is expected to hold steady at 3.2% YoY. On Thursday, Producer Price Index (PPI) data is expected to show a decrease in headline inflation to 1.7% YoY, compared to 2.2% in July. Meanwhile, expectations for Federal Reserve easing have stabilized, with the likelihood of a 50 basis point rate cut this month dropping to 20-25%. The market continues to anticipate 100-125 basis points of easing by the end of the year, with no Fed speakers scheduled until Chair Powell’s press conference on September 18.
GBP/USD Technical Outlook
The GBP/USD has fallen below the 20-day Simple Moving Average which paints the outlook with bearishness, at least for the short-term. However, as the pair holds the 100 and 200-day SMAs the overall outlook remains positive.
In the meantime, indicators including the Relative Strength Index (RSI) and the Moving Average Convergence Divergence (MACD) flattened in negative areas, suggesting that the current bearish pressure is not a threat.
GBP/USD Daily chart

- Gold price increases as US Treasury yields drop and the US Dollar weakens.
- Traders await US CPI data; Fed rate cut odds are 67% for a 25 bps reduction and 33% for 50 bps.
- Focus shifts to the first US presidential debate, potentially impacting market sentiment ahead of election.
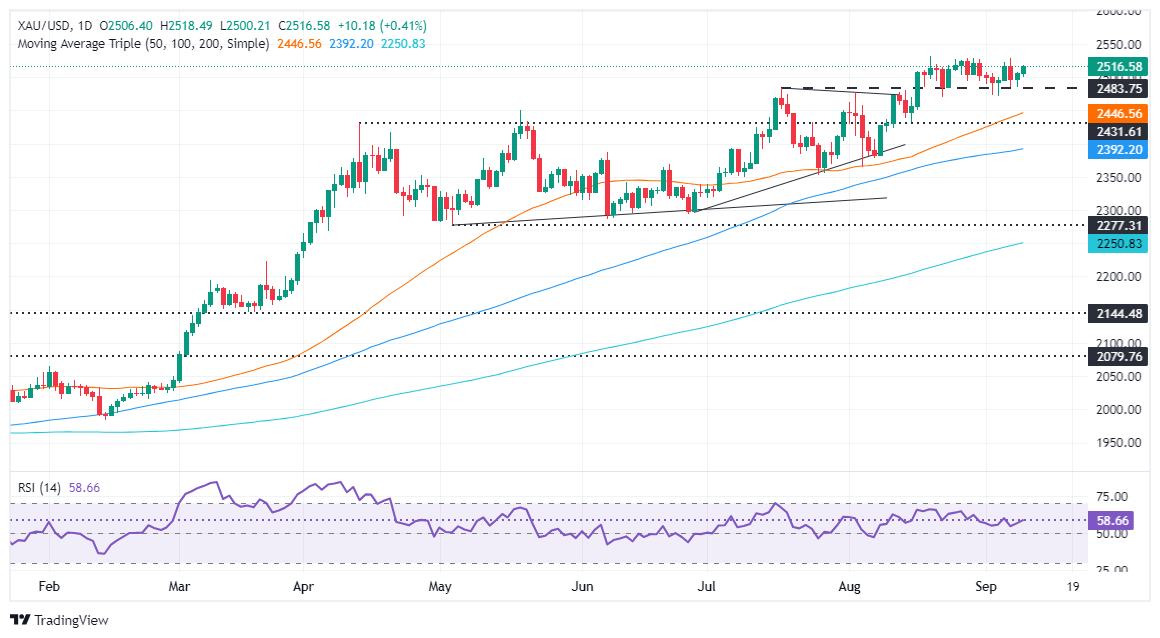
Gold prices advanced in the mid-North American session on Tuesday, gaining some 0.30% as traders braced for the crucial August inflation report from the United States (US). This, along with the first presidential debate between Vice President Kamala Harris and former President Donald Trump, could influence the financial markets. The XAU/USD trades at $2,514, bouncing off daily lows of $2,500.
The market mood has slightly improved, while the Greenback pared some of its earlier gains, a tailwind for the golden metal. US Treasury bond yields fell ahead of the latest Consumer Price Index (CPI) reading. Figures are expected to justify the Federal Reserve's (Fed) dovish stance toward beginning a rate cutting cycle amid fears that the labor market could weaken.
The latest US jobs report revealed that the economy added fewer people to the workforce than expected, but the Unemployment Rate ticked lower, a relief for Fed policymakers.
Meanwhile, the swaps market shows the odds for a 50 bps cut have increased to 33%, while they stand at 67% for 25 bps, according to the CME FedWatch Tool. Earlier, a Reuters poll revealed that 92 of 101 economists expect the Federal Reserve (Fed) to lower interest rates by 25 basis points (bps) at the September 17-18 meeting.
Political developments should begin to gain attention before the US Presidential Election on November 5. Vice President Kamala Harris and Donald Trump will meet for their first debate on Tuesday at 21:00 ET (01:00 GMT) via ABC.
Daily digest market moves: Gold price climbs as traders eye US CPI
- Gold price advances on Tuesday as the Greenback erases its earlier gains. The US Dollar Index (DXY), which tracks the buck's performance against six currencies, is virtually unchanged at 101.62.
- US 10-year T-note yield drops five basis points to 3.648%, reflecting traders' positioning ahead of September 18-19.
- US August CPI is expected to decline from 2.9% to 2.6% YoY, while core CPI is projected to remain at 3.2%.
- Last week’s NFP report revealed the economy added over 142K employees to the workforce but missed consensus of 160K. However, the dip in the Unemployment Rate lent a lifeline to the Greenback.
- Last Friday, Fed officials were dovish. New York Fed President John Williams said that cutting rates will help keep the labor market balanced, while Governor Christopher Waller said that “the time has come” to ease policy.
- Chicago Fed President Austan Goolsbee was dovish, saying policymakers have an “overwhelming” consensus to reduce borrowing costs.
- It is worth noting that Fed officials entered their blackout period ahead of the Federal Open Market Committee (FOMC) monetary policy meeting.
- Data from the Chicago Board of Trade (CBOT) indicates that the Fed is anticipated to cut at least 108 basis points (bps) this year, based on the fed funds rate futures contract for December 2024.
Technical outlook: Gold price holds gains above $2,500
From a technical standpoint, XAU/USD climbs steadily yet cannot break above the all-time high of $2,531 as traders brace for a critical data release on Wednesday. Momentum shows Gold should remain trading sideways, based on the Relative Strength Index (RSI), which is almost flat.
If Gold clears the ATH, the next resistance would be the $2,550 mark. Once hurdled, the next stop would be the psychological $2,600 figure.
Conversely, if Gold price slides below $2,500, the next support would be the August 22 low at $2,470. On further weakness, the next demand zone would be the confluence of the May 20 high, which turned into support, and the 50-day Simple Moving Average (SMA) between $2,450 and $2,440.
Gold FAQs
Gold has played a key role in human’s history as it has been widely used as a store of value and medium of exchange. Currently, apart from its shine and usage for jewelry, the precious metal is widely seen as a safe-haven asset, meaning that it is considered a good investment during turbulent times. Gold is also widely seen as a hedge against inflation and against depreciating currencies as it doesn’t rely on any specific issuer or government.
Central banks are the biggest Gold holders. In their aim to support their currencies in turbulent times, central banks tend to diversify their reserves and buy Gold to improve the perceived strength of the economy and the currency. High Gold reserves can be a source of trust for a country’s solvency. Central banks added 1,136 tonnes of Gold worth around $70 billion to their reserves in 2022, according to data from the World Gold Council. This is the highest yearly purchase since records began. Central banks from emerging economies such as China, India and Turkey are quickly increasing their Gold reserves.
Gold has an inverse correlation with the US Dollar and US Treasuries, which are both major reserve and safe-haven assets. When the Dollar depreciates, Gold tends to rise, enabling investors and central banks to diversify their assets in turbulent times. Gold is also inversely correlated with risk assets. A rally in the stock market tends to weaken Gold price, while sell-offs in riskier markets tend to favor the precious metal.
The price can move due to a wide range of factors. Geopolitical instability or fears of a deep recession can quickly make Gold price escalate due to its safe-haven status. As a yield-less asset, Gold tends to rise with lower interest rates, while higher cost of money usually weighs down on the yellow metal. Still, most moves depend on how the US Dollar (USD) behaves as the asset is priced in dollars (XAU/USD). A strong Dollar tends to keep the price of Gold controlled, whereas a weaker Dollar is likely to push Gold prices up.
- Australian Dollar declines amid recession fears
- Consumer and business sentiment in Australia continues to deteriorate, dragging down the Australian Dollar amid recession fears
- RBA maintains its hawkish stance with rate cuts unlikely in the near term despite global easing trends
- China's trade data shows mixed results with strong exports but weak imports, indicating ongoing economic challenges
The AUD/USD declined by 0.10% to 0.6660 in Tuesday's session, impacted by weak Australian data and a steady US Dollar.
Amidst uncertainty in the Australian economy and concerns over persistent inflation, financial markets anticipate a modest interest rate cut of only 0.25% in 2024. This is in line with the Reserve Bank of Australia's (RBA) firm stance on inflation, which has led to a relatively hawkish outlook for monetary policy.
Daily digest market movers: Australian Dollar declines as data raises recession fears
- Australian Dollar falls against US Dollar following weak consumer and business confidence data
- Westpac Consumer Sentiment Index dipped 0.5% in August, aligning with elevated concerns about the economic and employment outlook
- Business confidence and conditions deteriorated in August as per NAB's Business Confidence Index, reaching their lowest levels since November and January 2022, respectively
- Despite the Reserve Bank of Australia's firm stance against rate cuts due to inflationary concerns, analysts predict a shift toward an easing cycle with a rate cut anticipated by December
- On the data front, China's August exports surpassed expectations by growing 8.7% YoY, largely influenced by favorable base effects
- Import growth, however, was weaker than anticipated at 0.5%, indicating limited progress in boosting domestic demand
- All economic news in China is closely followed by Aussie traders as it is a close trading partner from Australia
AUD/USD technical outlook: Bearish momentum continues with bulls nowhere to be found
In the last several sessions, the AUD/USD pair has created lower highs and lower lows, suggesting that the overall outlook is bearish. Tuesday's decline of around 0.1% continues this trend and reinforces the bearish outlook. The Relative Strength Index (RSI) is currently at 42, which is in the negative area and suggests that selling pressure is rising.
The Moving Average Convergence Divergence (MACD) is also bearish with the histogram turning red and rising.
Australian Dollar FAQs
One of the most significant factors for the Australian Dollar (AUD) is the level of interest rates set by the Reserve Bank of Australia (RBA). Because Australia is a resource-rich country another key driver is the price of its biggest export, Iron Ore. The health of the Chinese economy, its largest trading partner, is a factor, as well as inflation in Australia, its growth rate and Trade Balance. Market sentiment – whether investors are taking on more risky assets (risk-on) or seeking safe-havens (risk-off) – is also a factor, with risk-on positive for AUD.
The Reserve Bank of Australia (RBA) influences the Australian Dollar (AUD) by setting the level of interest rates that Australian banks can lend to each other. This influences the level of interest rates in the economy as a whole. The main goal of the RBA is to maintain a stable inflation rate of 2-3% by adjusting interest rates up or down. Relatively high interest rates compared to other major central banks support the AUD, and the opposite for relatively low. The RBA can also use quantitative easing and tightening to influence credit conditions, with the former AUD-negative and the latter AUD-positive.
China is Australia’s largest trading partner so the health of the Chinese economy is a major influence on the value of the Australian Dollar (AUD). When the Chinese economy is doing well it purchases more raw materials, goods and services from Australia, lifting demand for the AUD, and pushing up its value. The opposite is the case when the Chinese economy is not growing as fast as expected. Positive or negative surprises in Chinese growth data, therefore, often have a direct impact on the Australian Dollar and its pairs.
Iron Ore is Australia’s largest export, accounting for $118 billion a year according to data from 2021, with China as its primary destination. The price of Iron Ore, therefore, can be a driver of the Australian Dollar. Generally, if the price of Iron Ore rises, AUD also goes up, as aggregate demand for the currency increases. The opposite is the case if the price of Iron Ore falls. Higher Iron Ore prices also tend to result in a greater likelihood of a positive Trade Balance for Australia, which is also positive of the AUD.
The Trade Balance, which is the difference between what a country earns from its exports versus what it pays for its imports, is another factor that can influence the value of the Australian Dollar. If Australia produces highly sought after exports, then its currency will gain in value purely from the surplus demand created from foreign buyers seeking to purchase its exports versus what it spends to purchase imports. Therefore, a positive net Trade Balance strengthens the AUD, with the opposite effect if the Trade Balance is negative.
- US Dollar is rising ahead of the presidential debate, continuing its strength despite ongoing dovish Fed easing expectations.
- Outcome of tonight's debate between Vice President Harris and former President Trump might shake the USD’s ground.
- Dovish bets on the Fed might limit the USD’s upside.
The US Dollar Index, a measure of the USD’s value against six other currencies, is firm ahead of tonight’s presidential debate. Markets are likely to react to the debate outcome, with analysts expecting volatility in currency markets depending on the perceived winner. Market focus is set on Wednesday’s Consumer Price Index (CPI) inflation figures.
Despite positive economic indicators, the market may be exaggerating its expectations for aggressive monetary policy easing. The current growth rate exceeds the long-term trend, signaling that markets may be overestimating the need for such measures. However, a 25 bps cut would seem to be a done deal.
Daily digest market movers: US Dollar firm on quiet Tuesday ahead of CPI figures despite steady dovish bets
- US Dollar continues to rise despite expectations of continued easing by the Fed.
- Traders are currently pricing in nearly 125 bps of easing by year-end, suggesting 50 bps cuts at the November and December meetings.
- Market also sees 225 bps of easing over the next 12 months.
- US presidential debate will be held Tuesday night and could provide more insights on how financial markets would perform under a Trump or Harris presidency.
- Perceived debate winner might set the pace of the Greenback’s dynamics. In addition, CPI figures on Wednesday will also be important.
DXY technical outlook: DXY sentiment slightly improves, indicator shift suggests momentum uptrend
Technical analysis for the DXY indicates a slight improvement in sentiment. Indicators, including the Relative Strength Index (RSI) and the Moving Average Convergence Divergence (MACD), are still in negative territory but recovering, suggesting a potential shift in momentum. The DXY index recently reclaimed the 20-day Simple Moving Average (SMA) near 101.60, providing support to the short-term outlook.
To maintain this uptrend, buyers must continue to hold above this level. Key support levels to watch include 101.60, 101.30 and 101.00, while resistance levels lie at 101.80, 102.00 and 102.30.
The Greenback added to the ongoing uptrend, although it seems to have run out of some upside impetus on Tuesday amidst the broad-based cautious stance ahead of the release of key US CPI readings on Wednesday.
Here is what you need to know on Wednesday, September 11:
The US Dollar Index (DXY) managed well to maintain business in the upper end of the range near 101.70 prior to key data releases on Wednesday. The release of the Inflation Rate tracked by the CPI will be the salient event on September 11, seconded by the weekly MBA Mortgage Applications, and the EIA’s weekly report on crude oil inventories.
EUR/USD could not help retreating for the third consecutive day, approaching the key support area near 1.1000. The next risk event in the euro area will be the ECB’s interest rate decision on September 12.
GBP/USD alternated gains with losses within a tight range against the backdrop of the generalized prudent tone in the FX universe. On September 11, the UK docket will feature GDP figures, Balance of Trade results, Construction Output, Industrial and Manufacturing Production, and the NIESR Monthly GDP Tracker.
USD/JPY resumed its downtrend and broke below the 143.00 support, shifting its attention to recent lows in the sub-142.00 region. The BoJ’s Nakagawa is due to speak on September 11.
AUD/USD retreated for the third consecutive day, although it seems to have met some decent contention in the 0.6650-0.6640 band for the time being. Consumer Inflation Expectations and the speech by the RBA’s Hunter are expected on September 11.
Persistent demand concerns and a disheartening OPEC report sent WTI prices to the vicinity of the $65.00 mark per barrel for the first time since early May 2023.
Prices of Gold added to Monday’s uptick amidst marginal gains in the greenback and declining US yields prior to the release of the US CPI on Wednesday. Silver prices posted humble losses around the $28.30 zone following an earlier uptick to two-day highs.
- Mexican Peso dips over 1%; USD/MXN rises from 19.86 as Senate nears judicial reform vote.
- Foreign institutions and ratings agencies suggest economic risks and potential downgrade if reform is approved.
- Weaker-than-forecast inflation raises likelihood of Banxico rate cut on September 26; US Fed anticipated to cut rates by 25 bps soon.
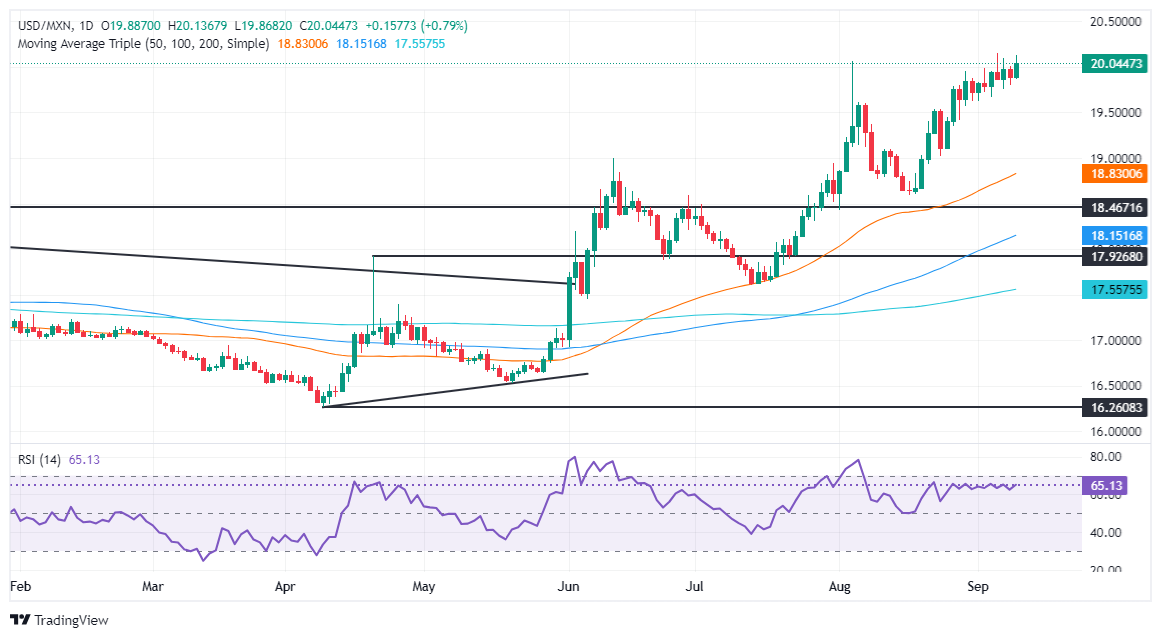
The Mexican Peso depreciated over 1% against the American Dollar on Tuesday amid increasing tensions surrounding the Senate's approval of judicial reform. At the time of writing, the USD/MXN trades at 20.07 after bouncing off a daily low of 19.86.
The Mexican currency will remain volatile throughout the week as the Senate discusses the judicial reform. On Monday, a news article in El Sol de Mexico said Miguel Angel Yunez Marquez, Senator of the opposition party Partido Accion Nacional (PAN), would be the vote needed to approve the reform.
The Senate will begin formally reading the judicial bill at around 19:00 GMT. It’s expected that it will be voted on Wednesday or Thursday.
Foreign institutions had expressed that the reform could deteriorate the state of law and the country's credibility. Julius Baer warned that ratings agencies could change Mexico’s creditworthiness. They added their name to Morgan Stanley, Bank of America, JP Morgan, Citibanamex and Fitch by warning of the economic and financial impact regarding the approval of judicial reform.
Data-wise, the latest Consumer Price Index (CPI) reported on Monday showed that Mexican inflation was softer than expected, increasing the chances that the Bank of Mexico (Banxico) will cut interest rates at the September 26 meeting.
Kimberley Sperrfechter, an analyst at Capital Economics, commented that the latest inflation report and the likelihood of a Fed rate cut next week “mean that Banxico is on track to lower its policy rate by another 25 [basis points] at its meeting this month.”
Across the border, a Reuters poll revealed that 92 of 101 economists expect the Federal Reserve (Fed) to lower interest rates by 25 basis points (bps) at the September 17-18 meeting. The US economic docket has been scarce through the first couple of days, yet traders are eyeing the release of the latest inflation report. The data is expected to reassure investors that the Fed will cut rates at the upcoming meeting.
Daily digest market movers: Mexican Peso weakens on judicial reform expected vote
- Mexico’s inflation in August dipped below 5% on headline figures on an annual basis, while core inflation stood firm near 4% YoY.
- Mexico’s economic docket will gain traction on Wednesday, September 11, with the release of Industrial Production data. Later, the Senate is expected to approve the judiciary reform.
- September’s Citibanamex Survey showed that Banxico is expected to lower rates to 10.25% in 2024 and to 8.25% in 2025. The USD/MXN exchange rate is forecast to end 2024 at 19.50 and 2025 at 19.85.
- US CPI is expected to dip from 2.9% to 2.6% YoY in August, while core CPI is projected to remain at 3.2%.
- Data from the Chicago Board of Trade (CBOT) suggests the Fed will cut at least 108 basis points this year, up from 104.5 a day ago, according to the fed funds rate futures contract for December 2024.
USD/MXN technical outlook: Mexican Peso tumbles as USD/MXN rises above 20.00
The USD/MXN uptrend has extended above the 20.00 figure, with the exotic pair meandering around the figure after reaching a daily high of 20.13. Momentum hints that buyers are stepping in, as depicted by the Relative Strength Index (RSI) aiming upward and cracking the latest peak.
If the USD/MXN holds to gains above 20.00, the next ceiling level would be the YTD high at 20.22. On further strength, the pair could challenge the daily high of September 28, 2022, at 20.57. If those two levels are surrendered, the next stop would be the swing high at 20.82 on August 2, 2022, ahead of 21.00.
Conversely, if USD/MXN weakens further, the first support would be 19.50. A breach of the latter will expose the August 23 swing low of 19.02 before giving way to sellers eyeing a test of the 50-day Simple Moving Average (SMA) at 18.65.
Mexican Peso FAQs
The Mexican Peso (MXN) is the most traded currency among its Latin American peers. Its value is broadly determined by the performance of the Mexican economy, the country’s central bank’s policy, the amount of foreign investment in the country and even the levels of remittances sent by Mexicans who live abroad, particularly in the United States. Geopolitical trends can also move MXN: for example, the process of nearshoring – or the decision by some firms to relocate manufacturing capacity and supply chains closer to their home countries – is also seen as a catalyst for the Mexican currency as the country is considered a key manufacturing hub in the American continent. Another catalyst for MXN is Oil prices as Mexico is a key exporter of the commodity.
The main objective of Mexico’s central bank, also known as Banxico, is to maintain inflation at low and stable levels (at or close to its target of 3%, the midpoint in a tolerance band of between 2% and 4%). To this end, the bank sets an appropriate level of interest rates. When inflation is too high, Banxico will attempt to tame it by raising interest rates, making it more expensive for households and businesses to borrow money, thus cooling demand and the overall economy. Higher interest rates are generally positive for the Mexican Peso (MXN) as they lead to higher yields, making the country a more attractive place for investors. On the contrary, lower interest rates tend to weaken MXN.
Macroeconomic data releases are key to assess the state of the economy and can have an impact on the Mexican Peso (MXN) valuation. A strong Mexican economy, based on high economic growth, low unemployment and high confidence is good for MXN. Not only does it attract more foreign investment but it may encourage the Bank of Mexico (Banxico) to increase interest rates, particularly if this strength comes together with elevated inflation. However, if economic data is weak, MXN is likely to depreciate.
As an emerging-market currency, the Mexican Peso (MXN) tends to strive during risk-on periods, or when investors perceive that broader market risks are low and thus are eager to engage with investments that carry a higher risk. Conversely, MXN tends to weaken at times of market turbulence or economic uncertainty as investors tend to sell higher-risk assets and flee to the more-stable safe havens.
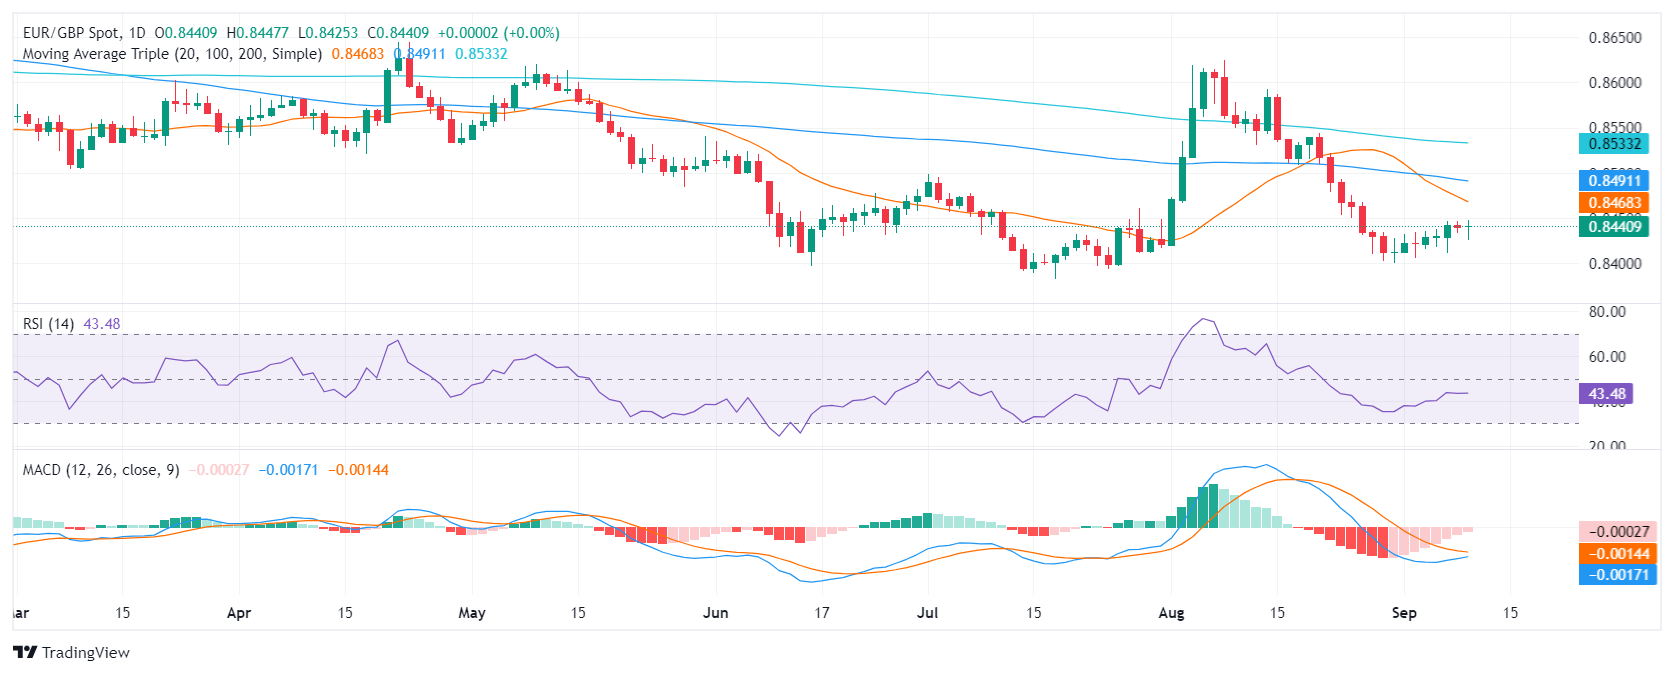
- A bearish outlook remains, with RSI below 50 and MACD.
- Selling pressure is declining, indicated by decreasing red MACD bars.
In Tuesday's session, the EUR/GBP pair mildly rose to 0.8440 and is showing that the technical outlook remains mixed. Bears seem to be taking a breather after shedding more than 1% in August, but the overall technical outlook is still pointing at a bearish market.
The Relative Strength Index (RSI) remains in negative territory, around 44, with a mildly neutral slope, signaling flattening bearish momentum. The Moving Average Convergence Divergence (MACD) prints decreasing red bars, further reinforcing the flattening bearish traction.
The EUR/GBP pair continues consolidating above 0.8400, which serves as immediate support following the sharp declines in August. Resistance is found at 0.8440, and a break above this level could lead to further gains towards 0.8450 and 0.8470.
EUR/GBP daily chart
Oil prices slumped in the past trading week, Commerzbank’s Commodity Analyst Carsten Fritsch notes.
Oil prices fall sharply
“Brent fell to $70.6 per barrel on Friday, its lowest level since March 2023, and closed at its lowest level since December 2021. WTI hit a 14-month low of $67.2. Brent lost almost 10% week-on-week, with the decline exacerbated by the contract rollover at the turn of the month. When excluding this factor, the drop amounts to 7.6%, which is the sharpest weekly decline since October 2023.”
“The weekly loss for WTI was 8%, which was also last seen around 11 months ago. The time spreads, i.e. the price differentials along the forward curves, also narrowed noticeably, although the narrowing was much more pronounced for Brent. On Friday, there were only 35 US cents between the first two Brent forward contracts and less than $1 between the nearest contract and the contract expiring six months later.”
“The premiums for oil with short-term delivery have never been lower this year. Market participants are therefore much more relaxed about the oil market than they were just a few weeks ago. This is also reflected in the behavior of speculative financial investors, who significantly reduced their net long positions in Brent and WTI in the week ending September 3. According to ICE and CFTC data, these fell combined to their lowest level this year in the last reporting week.”
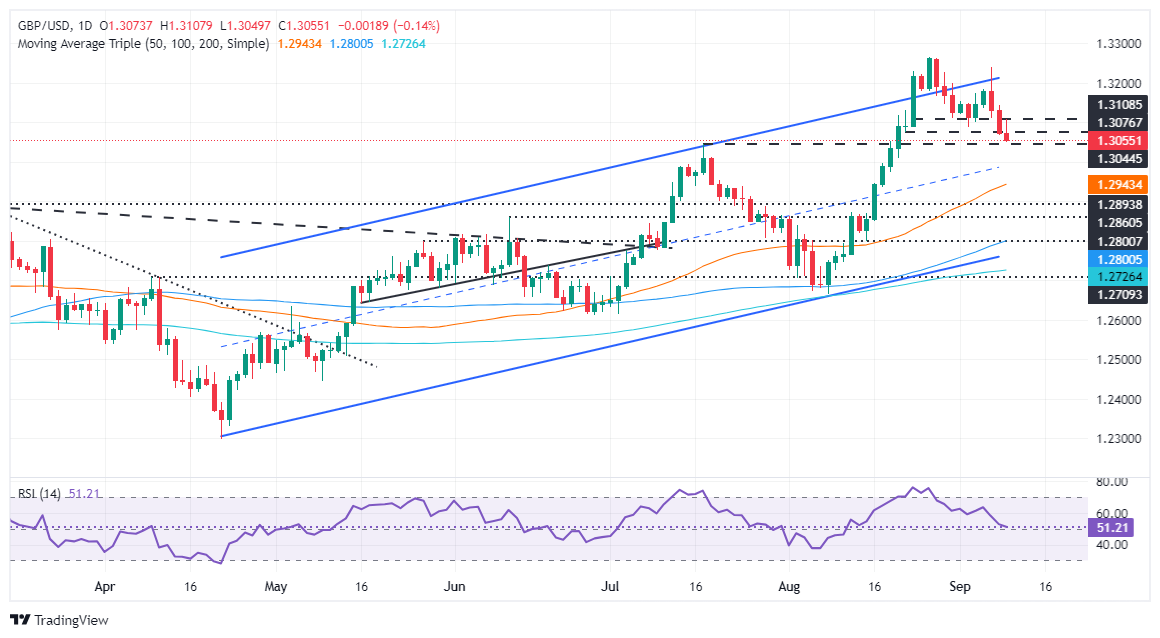
- GBP/USD slips towards key support at 1.3044, with momentum favoring further downside in the short term.
- RSI is turning bearish, signaling potential losses, with next support at 1.3000 and the 50-DMA at 1.2940.
- For buyers to regain control, GBP/USD must clear resistance at 1.3143 and push towards 1.3200.
The GBP/USD is on the backfoot after spiking to a daily high of 1.3107 after a solid UK jobs report, though it has retreated below the 1.31 handle as traders await the release of US inflation data. At the time of writing, the pair trades at 1.3052, down 0.17%
GBP/USD Price Forecast: Technical outlook
The GBP/USD fall toward the July 17 peak at 1.3044 could exert downward pressure on the pair and pave the way for further losses.
Momentum favors sellers in the short term. The Relative Strength Index (RSI) remains bullish, though its slope is aiming down and about to turn bearish, which could accelerate Sterling’s fall against the Greenback.
In that scenario, the GBP/USD path of least resistance is tilted to the downside. The first support would be 1.3044, followed by the psychological figure of 1.3000. A breach or the latter will expose the 50-day moving average (DMA) at 1.2940, ahead of the 1.2900 mark.
Conversely, if buyers would like to regain control, they must clear the September 9 high at 1.3143 before having the chance of challenging the 1.3200 figure.
GBP/USD Price Action – Daily Chart
British Pound PRICE Today
The table below shows the percentage change of British Pound (GBP) against listed major currencies today. British Pound was the strongest against the Canadian Dollar.
| USD | EUR | GBP | JPY | CAD | AUD | NZD | CHF | |
|---|---|---|---|---|---|---|---|---|
| USD | 0.14% | 0.14% | -0.40% | 0.35% | 0.24% | -0.03% | -0.23% | |
| EUR | -0.14% | 0.00% | -0.52% | 0.20% | 0.09% | -0.22% | -0.38% | |
| GBP | -0.14% | 0.00% | -0.52% | 0.17% | 0.11% | -0.21% | -0.36% | |
| JPY | 0.40% | 0.52% | 0.52% | 0.71% | 0.62% | 0.32% | 0.15% | |
| CAD | -0.35% | -0.20% | -0.17% | -0.71% | -0.12% | -0.38% | -0.56% | |
| AUD | -0.24% | -0.09% | -0.11% | -0.62% | 0.12% | -0.29% | -0.46% | |
| NZD | 0.03% | 0.22% | 0.21% | -0.32% | 0.38% | 0.29% | -0.17% | |
| CHF | 0.23% | 0.38% | 0.36% | -0.15% | 0.56% | 0.46% | 0.17% |
The heat map shows percentage changes of major currencies against each other. The base currency is picked from the left column, while the quote currency is picked from the top row. For example, if you pick the British Pound from the left column and move along the horizontal line to the US Dollar, the percentage change displayed in the box will represent GBP (base)/USD (quote).
This skeptical assessment is primarily due to growing demand concerns after economic data from the three most important oil demand regions – the US, China and Europe – disappointed and led to an increase in risk aversion, Commerzbank’s Commodity Analyst Carsten Fritsch notes.
The extent of the price decline seems to be exaggerated
“As a result, the stock markets and other cyclical commodities such as base metals also came under pressure. There are growing doubts as to whether oil demand will actually increase noticeably in the second half of the year, as had previously been expected. But there were also headwinds on the supply side. The decision by OPEC+ to postpone the production increases planned for October by two months was only taken under the massive pressure of falling oil prices.”
“OPEC+'s reluctant stance rather gives the impression that the cartel members still want to increase production. The diminishing willingness to maintain the current production cuts is also fueled by the continued overproduction of individual members such as Iraq and Kazakhstan. Thus, in two months at the latest, there is a risk of a repeat, although there will no longer be any scope for an increase in production in view of the implicit market balances for 2025.”
“The prospect of an oversupply caused by OPEC+ in the coming year should prevent a significant price recovery, although we consider the extent of the price decline to be exaggerated.”
- AUD/USD falls to near 0.6650 as the US Dollar rises further ahead of the US inflation data for August.
- Investors see the US core PCI to have grown steadily by 3.2%.
- Australian Westpac consumer sentiment declined in September after expanding previously.
The AUD/USD pair falls to near 0.6650 in Tuesday’s North American session. The Aussie asset drops as the US Dollar (USD) extends its recovery, with investors focusing on the United States (US) Presidential debate between Vice President Kamala Harris and former President Donald Trump over the November elections. The Harris-Trump presidential debate will have a significant impact on the US Dollar.
The US Dollar Index (DXY), which tracks the Greenback’s value against six major currencies, rises to near 101.70 and approaches a two-week high of 102.00.
The appeal of the US Dollar would strengthen further if the outcome of the presidential debate shows signs of Trump winning the elections. Donald Trump is known for advocating raising tariffs and higher fiscal spending, which would be favorable for the US Dollar.
Market participants will keenly focus on the US inflation data as it would influence expectations for the Federal Reserve (Fed) interest rate decision next week. The Fed is widely anticipated to start reducing interest rates but investors remain uncertain over the potential interest rate cut size.
According to the estimates, the annual headline CPI rose at a slower pace of 2.6% from 2.9% in July. In the same period, the core inflation-which excludes volatile food and energy prices- grew steadily by 3.2%. Signs of price pressures remaining sticky would weaken expectations for Fed large interest rate cuts, while soft figures would strengthen them.
In the Asia-Pacific region, worsening consumer sentiment has weighed on the Australian Dollar (AUD). Australian Westpac-Melbourne Institute consumer sentiment index, released in Tuesday’s Asian trading hours, fell to 0.5% in September after increasing 2.8% in August. Australian consumer sentiment is expected to have declined due to persistent price pressures and higher interest rates by the Reserve Bank of Australia (RBA).
The consumer sentiment could weaken further as the RBA is unlikely to start reducing its key Official Cash Rate (OCR) this year.
Australian Dollar FAQs
One of the most significant factors for the Australian Dollar (AUD) is the level of interest rates set by the Reserve Bank of Australia (RBA). Because Australia is a resource-rich country another key driver is the price of its biggest export, Iron Ore. The health of the Chinese economy, its largest trading partner, is a factor, as well as inflation in Australia, its growth rate and Trade Balance. Market sentiment – whether investors are taking on more risky assets (risk-on) or seeking safe-havens (risk-off) – is also a factor, with risk-on positive for AUD.
The Reserve Bank of Australia (RBA) influences the Australian Dollar (AUD) by setting the level of interest rates that Australian banks can lend to each other. This influences the level of interest rates in the economy as a whole. The main goal of the RBA is to maintain a stable inflation rate of 2-3% by adjusting interest rates up or down. Relatively high interest rates compared to other major central banks support the AUD, and the opposite for relatively low. The RBA can also use quantitative easing and tightening to influence credit conditions, with the former AUD-negative and the latter AUD-positive.
China is Australia’s largest trading partner so the health of the Chinese economy is a major influence on the value of the Australian Dollar (AUD). When the Chinese economy is doing well it purchases more raw materials, goods and services from Australia, lifting demand for the AUD, and pushing up its value. The opposite is the case when the Chinese economy is not growing as fast as expected. Positive or negative surprises in Chinese growth data, therefore, often have a direct impact on the Australian Dollar and its pairs.
Iron Ore is Australia’s largest export, accounting for $118 billion a year according to data from 2021, with China as its primary destination. The price of Iron Ore, therefore, can be a driver of the Australian Dollar. Generally, if the price of Iron Ore rises, AUD also goes up, as aggregate demand for the currency increases. The opposite is the case if the price of Iron Ore falls. Higher Iron Ore prices also tend to result in a greater likelihood of a positive Trade Balance for Australia, which is also positive of the AUD.
The Trade Balance, which is the difference between what a country earns from its exports versus what it pays for its imports, is another factor that can influence the value of the Australian Dollar. If Australia produces highly sought after exports, then its currency will gain in value purely from the surplus demand created from foreign buyers seeking to purchase its exports versus what it spends to purchase imports. Therefore, a positive net Trade Balance strengthens the AUD, with the opposite effect if the Trade Balance is negative.
While Gold continues to hover near all-time highs, price action is actually weakening uptrend signals' strength, and thereby lowering the bar for CTA trend followers to liquidate their length, TDS Senior Commodity Strategist Daniel Ghali notes.
Price action is weakening uptrend signals' strength
“A break below the $2,490/oz range can now catalyze selling activity that could ultimately result in liquidations totaling -25% of algos' current long positions. In the current context, which features extreme positioning, the first to blink could snowball subsequent liquidations from other cohorts.”
“We reiterate that our gauge of macro fund positioning is at its highest levels since the Brexit referendum in 2016, the ‘stealth QE’ narrative in 2019, and the depths of the pandemic in Mar2020. Election risks are a potential catalyst, with rising odds of a Trump presidency now likely to be tied to a higher USD and lower Gold prices.”
There are currently not so many arguments in favor of the forint. Growth was disappointing in the second quarter, while at the same time the cutting cycle paused at 6.75% after inflation surprisingly rose to over 4% again in July. Core inflation has also risen back to 4.7% and is the worst performer among the CE3, Commerzbank’s FX analyst Antje Praefcke notes.
Forint is likely to remain under pressure
“Inflation is likely to have fallen again slightly in August, as the data due to be published today should show. But the job remains challenging for the central bank (MNB). According to reports, there is a risk for an expansionary fiscal policy since President Victor Orban could apparently change his plans for budget consolidation in order to put together large spending packages in the run-up to the 2026 elections.”
“According to the Ministry of Finance, the budget deficit, which had risen to 7.6% of GDP during the pandemic, was planned to fall to 2.9% in 2026. The new draft budget will be presented in November and could render these plans moot.”
“The market does not like such prospects at all. After all, Hungary's rating, which is already low, could be at risk if the promised budget consolidation falls by the wayside in view of the 2026 elections. Therefore, the cand EUR/HUF could head back towards 400 if the data and news remain gloomy.”
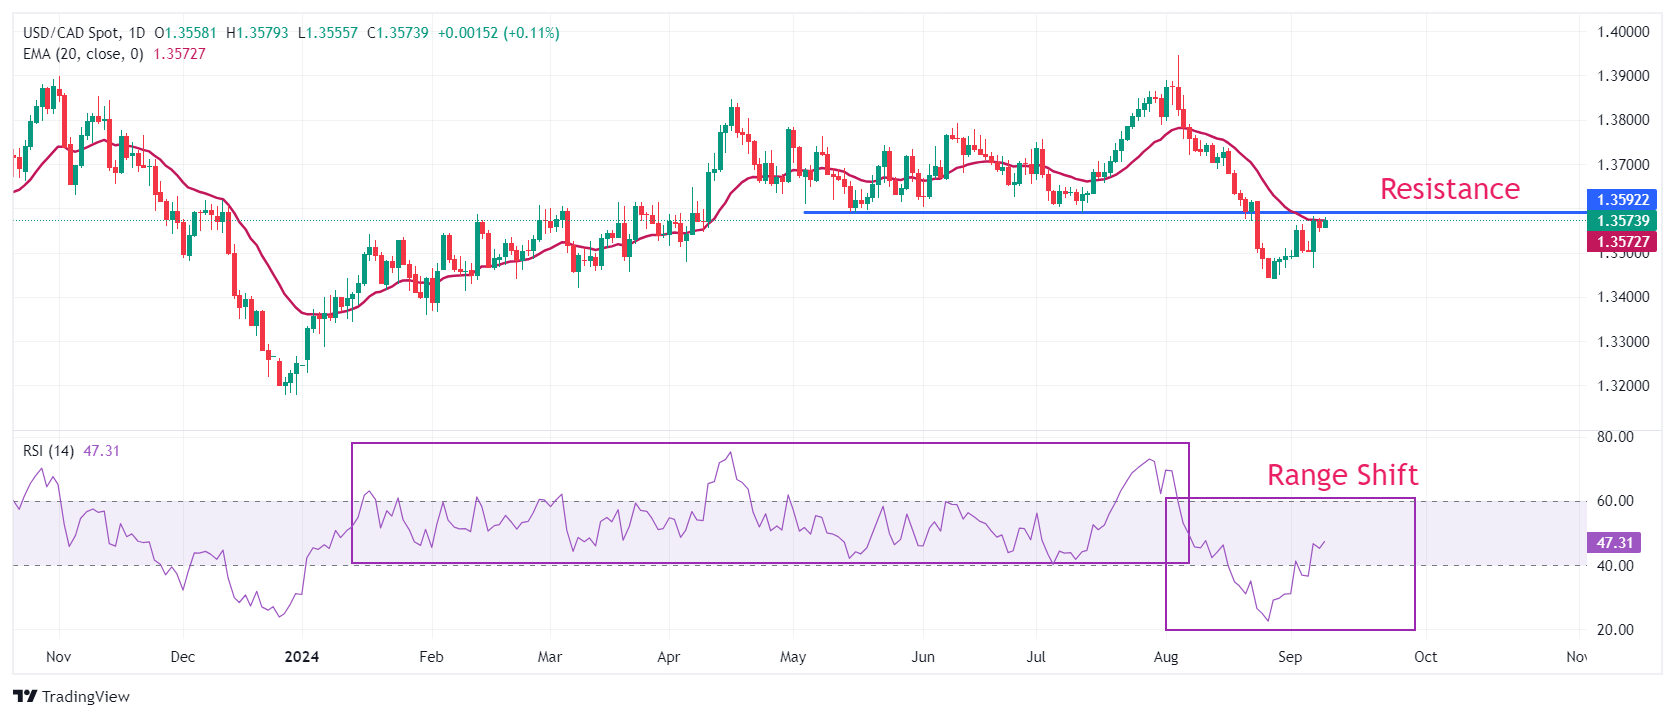
- USD/CAD remains firm above 1.3550 with US CPI, Presidential debate taking centre stage.
- Investors see the US annual headline CPI declining to 2.6%.
- USD/CAD delivers a mean-reversion move to near 20-day EMA.
The USD/CAD pair holds into gains near 1.3550 in Tuesday’s North American session. The Loonie asset remains firm as the US Dollar (USD) clings to gains amid uncertainty ahead of the United States (US) presidential debate and the Consumer Price Index (CPI) data for August, which will be published on Wednesday.
The US Dollar Index (DXY), which tracks the Greenback’s value against six major currencies, trades close to Monday’s high of 101.60.
Investors will keenly focus on presidential debate between current Vice President Kamala Harris and former US President Donald Trump over November elections. Signs of Trump gaining majority over Harris for winning elections could strengthen the US Dollar (USD) as he is known for favoring high fiscal spending and raising tarrifs.
The US annual headline CPI is estimated to have grown by 2.6%, slower than 2.9% in August, with core inflation rising steadily by 3.2%. The inflation data will significantly influence market speculation for Federal Reserve (Fed) interest rate cut path.
Meanwhile, the Canadian Dollar (CAD) remains under pressure as the Bank of Canada (BoC) is expected to cut interest rates further in the last quarter of the year.
USD/CAD delivers a pullback move to near the 20-day Exponential Moving Average (EMA), which trades around 1.3570. The near-term outlook of the pair appears to be bearish as the 14-day Relative Strength Index (RSI) has shifted into the bearish range of 20.00-60.00 from 40.00-80.00.
The horizontal resistance plotted from May 15 low of 1.3590 will be a major barricade for the US Dollar bulls.
A further pullback move to near the May 15 low of 1.3590 will likely be a selling opportunity for market participants, which would drag the asset towards the April 5 low of 1.3540, followed by the psychological support of 1.3500.
On the flip side, an upside recovery above August 21 high of 1.3626 would drive the asset towards 19 August high of 1.3687 and August 15 high of 1.3738.
USD/CAD daily chart
Canadian Dollar FAQs
The key factors driving the Canadian Dollar (CAD) are the level of interest rates set by the Bank of Canada (BoC), the price of Oil, Canada’s largest export, the health of its economy, inflation and the Trade Balance, which is the difference between the value of Canada’s exports versus its imports. Other factors include market sentiment – whether investors are taking on more risky assets (risk-on) or seeking safe-havens (risk-off) – with risk-on being CAD-positive. As its largest trading partner, the health of the US economy is also a key factor influencing the Canadian Dollar.
The Bank of Canada (BoC) has a significant influence on the Canadian Dollar by setting the level of interest rates that banks can lend to one another. This influences the level of interest rates for everyone. The main goal of the BoC is to maintain inflation at 1-3% by adjusting interest rates up or down. Relatively higher interest rates tend to be positive for the CAD. The Bank of Canada can also use quantitative easing and tightening to influence credit conditions, with the former CAD-negative and the latter CAD-positive.
The price of Oil is a key factor impacting the value of the Canadian Dollar. Petroleum is Canada’s biggest export, so Oil price tends to have an immediate impact on the CAD value. Generally, if Oil price rises CAD also goes up, as aggregate demand for the currency increases. The opposite is the case if the price of Oil falls. Higher Oil prices also tend to result in a greater likelihood of a positive Trade Balance, which is also supportive of the CAD.
While inflation had always traditionally been thought of as a negative factor for a currency since it lowers the value of money, the opposite has actually been the case in modern times with the relaxation of cross-border capital controls. Higher inflation tends to lead central banks to put up interest rates which attracts more capital inflows from global investors seeking a lucrative place to keep their money. This increases demand for the local currency, which in Canada’s case is the Canadian Dollar.
Macroeconomic data releases gauge the health of the economy and can have an impact on the Canadian Dollar. Indicators such as GDP, Manufacturing and Services PMIs, employment, and consumer sentiment surveys can all influence the direction of the CAD. A strong economy is good for the Canadian Dollar. Not only does it attract more foreign investment but it may encourage the Bank of Canada to put up interest rates, leading to a stronger currency. If economic data is weak, however, the CAD is likely to fall.
- GBP/MXN has corrected back after breaking out of a bullish Pennant pattern.
- Further weakness could bring into doubt the validity of the pattern, whilst strength could still see it hit the target.
GBP/MXN formed a bullish Pennant continuation pattern between August 28 and September 4, during its uptrend within a rising channel.
Price broke out of the top of the pattern and was expected to reach an upside target of 27.11, the 0.618 ratio of the length of the “pole” – the steep rise which preceded the formation of the pennant – extrapolated higher.
GBP/MXN 4-hour Chart
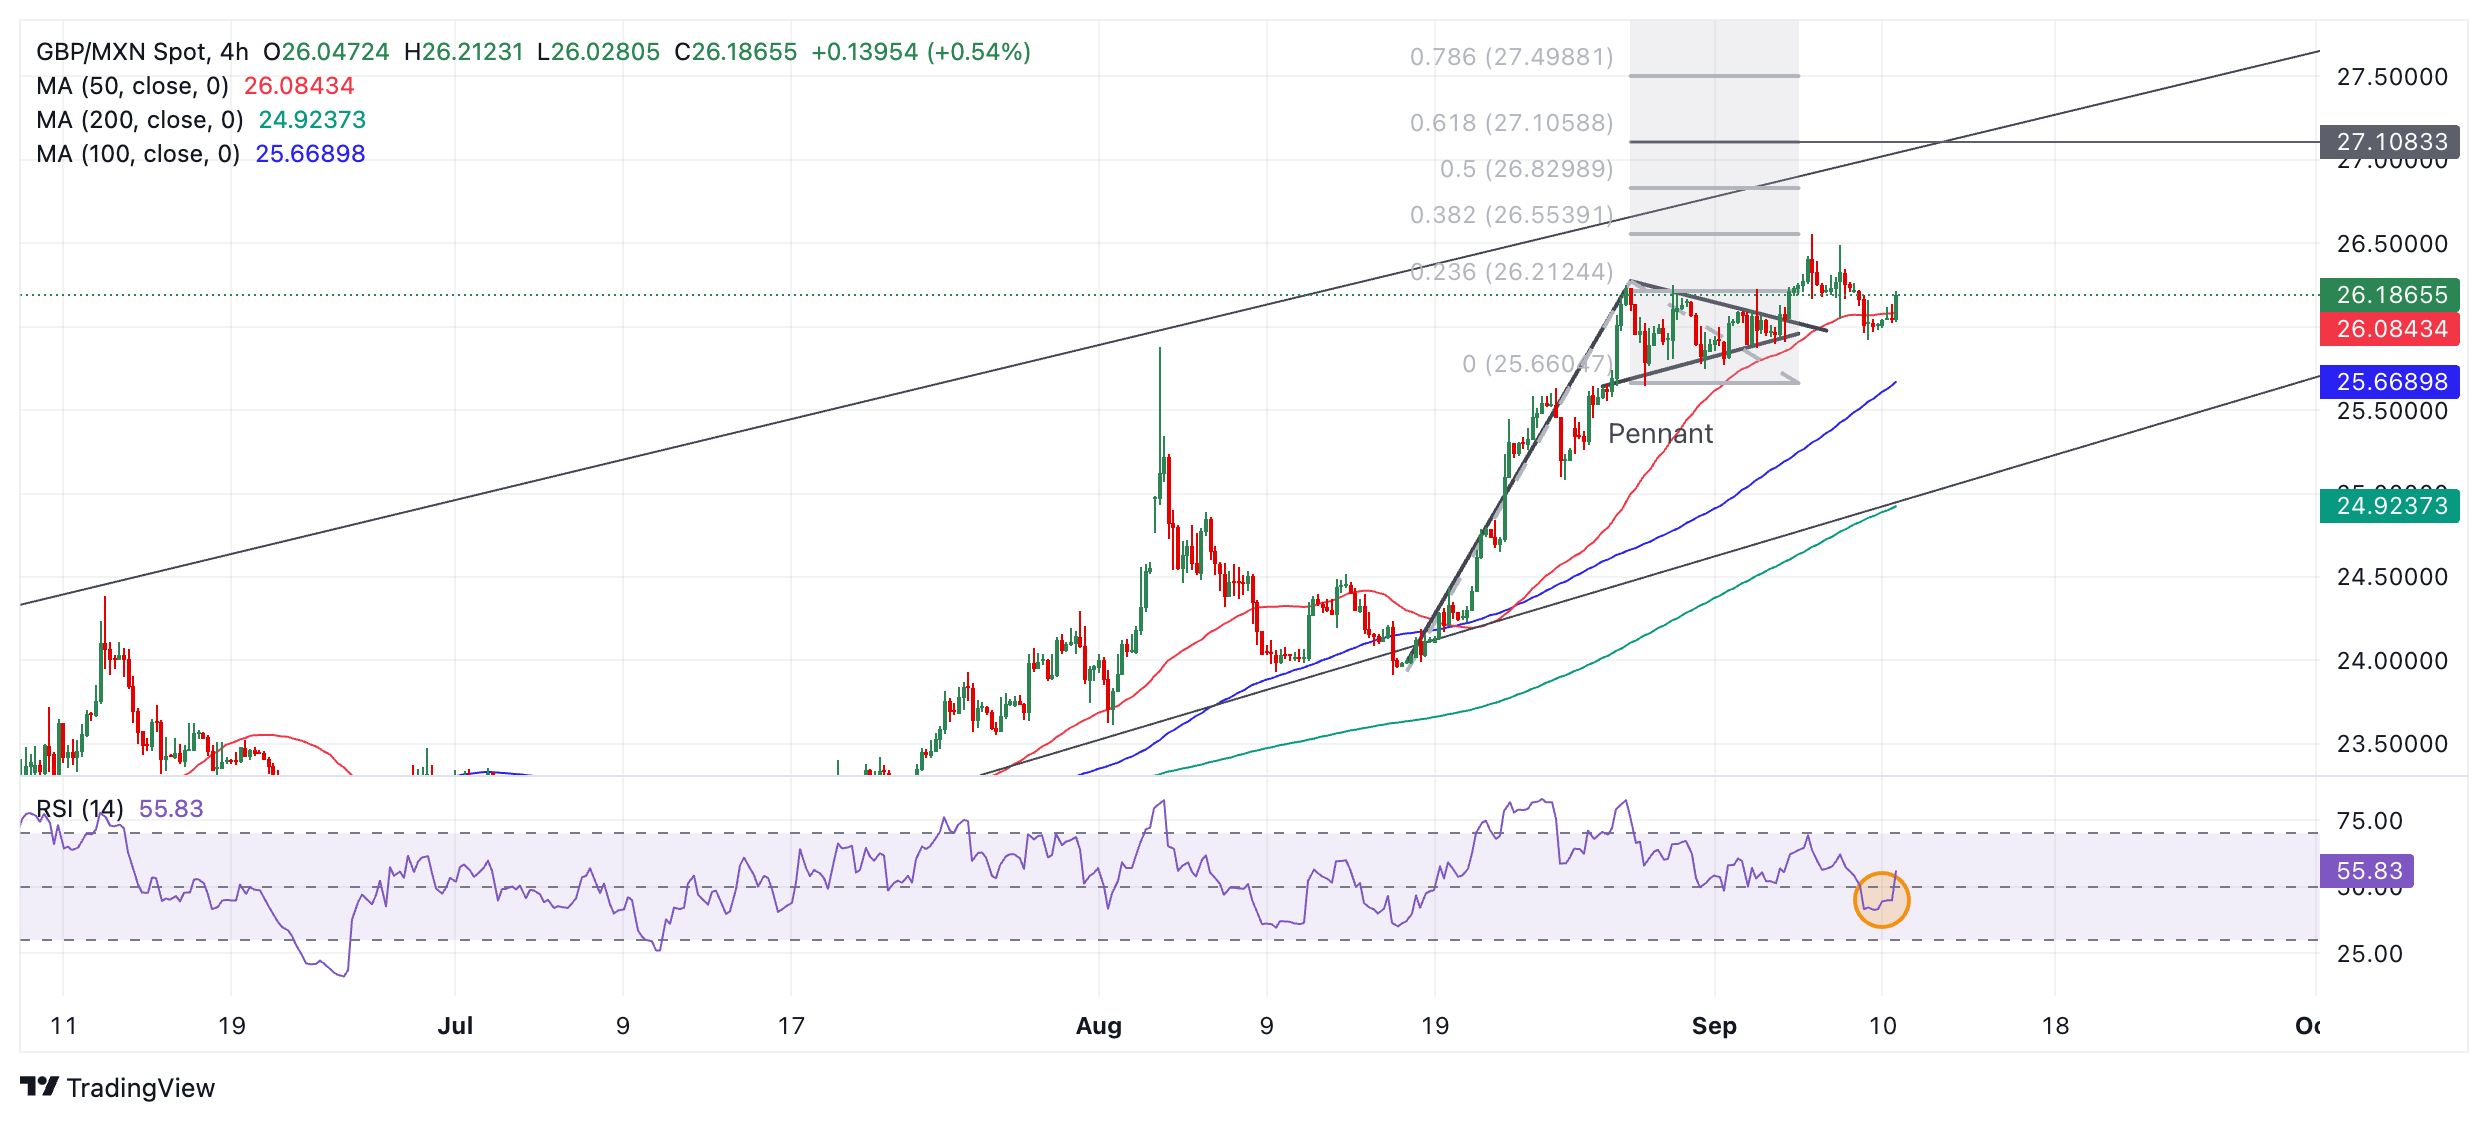
Price failed to reach its target, however, and has since fallen back down to trade in the lower 26.00s.
It is now at a critical point. Further weakness could invalidate the Pennant pattern, whilst a recovery could see it eventually reach its upside target.
The Relative Strength Index (RSI) momentum indicator has fallen to quite a deep bottom during the last sell-off (shaded orange circle) when compared to when price was at a similar levels previously. This suggests quite strong bearish momentum.
However, the trend both in the short, medium and long-term for GBP/MXN is bullish, and given “the trend is your friend” this suggests the odds favor more upside.
A close below 25.90 would probably invalidate the Pennant, whilst a recovery above 26.56 would provide confirmation the pair was rising up towards the pattern’s original target of 27.11.
The Pound Sterling (GBP) has crept a little higher over the course of the trading day so far. UK data showed in line with expectations wage growth (4.0% Y/Y for Average Weekly Earnings in the July quarter, 5.1% for ex-bonus pay) and a marginal fall in the unemployment rate (4.1%, from 4.2%) over the same period,
Intraday trend signals are neutral
“Policymakers will welcome slower wage growth but gains are still too rich to be compatible with the BoE’s inflation target. Swaps are pricing in marginally less risk of an already unlikely BoE cut next week as a result (4bps of easing versus 5-6bps yesterday).”
“Like other pairs, there are negative daily and weekly prints on the GBP charts which suggest downside risks in the near-term. Like other pairs though, the GBP/USD charts also reflect a lot of residual bullish momentum via oscillator studies which are curbing downside impulses for now.”
“Short-term patterns on the GBP/USD look corrective after the August rally in the pound. c, suggesting more range trading with a mild downside bias for now. Support is 1.3050/60. Resistance is 1.3110 and 1.3145/50.”
The last important data are due today before next week's Norges Bank meeting: Inflation figures for August, Commerzbank’s FX analyst Antje Praefcke notes.
Norges Bank is unlikely to bring forward first rate cuts
“The underlying trend, especially for core inflation, is still quite high. The annual rates were 2.8% for the headline rate in July and 3.3% for the core rate, i.e. well above the target of 2%. This is unlikely to have changed much in August.”
“At its meeting in August, Norges Bank noted that inflation had slowed considerably. However, inflation is still above target, and some factors could contribute to keeping inflation elevated ahead. For Norges Bank, one of these factors is the depreciation of the krone. After all, the weak krone implies inflation risks, but cannot be definitively explained even by Norges Bank.”
“The market sees the possibility that Norges Bank, contrary to its projections, could lower the policy rate before the end of the year. These expectations could gain momentum if the inflation figures surprise to the downside today. However, I would be cautious about jumping on this bandwagon. Because as long as the NOK is trading weakly and is repeatedly coming under downward pressure, Norges Bank is unlikely to bring forward first rate cuts.”
The Canadian Dollar (CAD) is little changed and continues to hold close to the levels seen in late trade Friday in the upper 1.35s. Governor Macklem is speaking in London this morning at 8.25ET, Scotiabank’s Chief FX Strategist Shaun Osborne notes.
CAD holds tight range below key resistance at 1.3585/95
“Comments drop at 8.10ET and there will be a press conference after the event. The speech will cover global trade and remarks that do stray into the policy outlook are likely to reflect the tone of his comments after the last policy decision.”
“Mark Carney is dipping his toe into federal politics after all. He has been appointed as an economic advisor to the Liberal Party (so not, apparently a government position) yesterday with a brief to develop plans to boost growth and productivity.”
“Solid gains for the USD last week still lend a positive tone to the longer-term chart but the short-term picture is neutral, with the USD capped below noted resistance around 1.3585/95 still (200-day MA and USD range lows from earlier in the year). A push through 1.36 should see spot gains extend deeper into the 1.36s. Support is 1.3550 and 1.3470.”
- GBP/CHF trades marginally lower as the Pound weakens against the Franc.
- UK employment data was robust and led to GBP rising in its key pairs.
- GBP/CHF fell, however, due to the resilience of the Swiss Franc.
GBP/CHF edges lower on Tuesday, trading in the 1.1090s as it continues rolling over from the 1.1237 August 19 high.
The pair weakens despite the Pound Sterling (GBP) strengthening in most of its pairs after the release of UK employment data. Although UK wages softened in July, they remained relatively high at 5.1% (excluding bonuses) and 4.0% (including bonuses).
In addition the UK Unemployment Rate remains at 4.1% which is below the Bank of England’s (BoE) 4.4% forecast. The Claimant Count fell, showing less people signed on for benefits. Although wages shrank, they remained above inflation. According to some economists the data might have made it slightly harder for the BoE to ease policy, normally a negative factor for the currency.
“GBP is firmer versus EUR and USD. The UK July labor market data should keep the BoE cautious from easing too aggressively,” said Brown Brothers Harriman in a note after the release. “The policy-relevant private sector average weekly earnings ex-bonuses fell four ticks to a 26-month low at 4.9% y/y but still tracking a little above the BoE’s Q3 projection of 4.8% y/y. ..The swaps market continues to imply almost 50 bps of BOE rate cut by year-end, which seems about right,” the note went on.
Against the Franc, however, Sterling fell as the Swiss currency retains its strength. A combination of safe-haven flows because CHF is viewed as a solid store of value, a favorable trade surplus, and an all-round strong Swiss economy are all factors supporting the Franc. Swiss Gross Domestic Product (GDP) saw a quarterly rise of 0.7% in the second quarter, beating market forecasts of 0.5% and Q1’s 0.5%. It was the highest such rise since Q2 of 2022.
The Swiss Franc continues rising even though the Swiss National Bank (SNB) was the first major central bank to cut interest rates in this easing cycle. It cut once in March and again in June, with speculation it could cut again because of continued cooling of inflation.
Complaints from Swiss exporters who claim the strength of CHF is making them uncompetitive have put pressure on the SNB to directly intervene in FX markets to weaken the CHF. Last week data revealed that the SNB’s Foreign Currency Reserves fell to CHF 694 billion in August, down from CHF 704 billion in July. This marks the fourth consecutive decline, suggesting the SNB continues selling the Franc to dampen its value.
The landing of the US economy can be soft, medium or hard. Despite the weakening of the labor market, our economists continue to think that the US economy can avoid a recession, even if the risks of this have of course increased. An impending hard landing would be the only main reason for the Fed to cut interest rates by 50 basis points in September, Commerzbank’s FX analyst Antje Praefcke notes.
EUR/USD to trade sideways for the time being
“At the moment, it does not look like a soft landing, but a medium one. A few stronger effects here and there, but all in all still bearable for the economy. The economy has cooled down, but is proving relatively resilient, as is the labor market. At the same time, inflation is rapidly approaching the inflation target. This also explains why the market currently considers a rate cut of more than 25 basis points for September to be possible, but does not want to bet fully on 50 basis points.”
“The market is still expecting roughly 100 basis points of rate cuts by the end of the year with three FOMC meetings remaining. But the data was not so bad that the Fed would have to rush ahead and cut rates by 50 basis points in September. Rather, in my view, it can continue to monitor the development of inflation and, above all, the labor market in the coming weeks and months and react accordingly if there are signs of a stronger slowdown on the labor market, which could make a 50-basis point cut necessary from its point of view.”
“Until the Fed meeting on September 18, there is only one important data point left that could shift market expectations: the inflation data for August tomorrow. The monthly seasonally adjusted rates of change in the headline and core rates are likely to be between 0.1% and 0.2% and thus in line the inflation target of 2%. Inflation data would have to surprise significantly tomorrow in order to push interest rate expectations further. Therefore, the market will probably quickly shift its focus to the ECB meeting on Thursday and trade EUR/USD sideways for the time being.”
The World Platinum Investment Council (WPIC) published new forecasts for the Platinum market this morning. These are based on data from Metals Focus, a research company specializing in precious metals, Commerzbank’s Commodity Analyst Carsten Fritsch notes.
Platinum supply deficit goes upwards
“The supply deficit this year is expected to be more than twice as high as previously expected, reaching a record level of just over 1 million ounces. This would also be the second deficit in a row, after demand already exceeded supply by 731 thousand ounces in the previous year. The significantly higher deficit is due to a marked upward revision of the demand forecast, which is expected to be 530 thousand ounces higher than previously anticipated.”
“The majority of the revision is attributable to investment demand. The WPIC has added demand for larger Platinum bars in China as a new investment category, which is expected to be quite robust this year. The WPIC also assumes that Platinum ETFs will record net inflows this year and not net outflows as previously assumed. Furthermore, industrial demand excluding the automotive sector is expected to be stronger than previously anticipated. Demand from the automotive industry, on the other hand, has been revised downwards slightly.”
“On the supply side, a slight upward revision in mine production was more than offset by a downward revision in recycling supply, meaning that overall supply is expected to be slightly lower than in the previous forecast. The Platinum price has not yet been able to benefit from the tight market. Although it has recovered somewhat from last week's low, it is still trading well below USD 1,000 per troy ounce. The price discount to Gold is currently $1,560. We remain convinced that the Platinum price has considerable upside potential.”
Bank of Canada (BoC) Governor Tiff Macklem said on Tuesday that trade disruptions may mean larger deviations in inflation from the BoC's 2% target, per Reuters.
Key takeaways
"We have to focus on risk management, balancing upside risks to inflation with downside risks to economic growth."
"Trade disruptions may also increase the variability of inflation."
"Cost of global goods may not fall as fast as globalization, and that could put more upward pressure on inflation."
"Pandemic showed that when an economy is already overheated, supply disruptions can have an outsized effect on inflation."
"The growth we are seeing in trade is shifting from goods to services; pandemic may have provided a more durable boost to trade in services."
"Global trade has slowed and that is a big concern for Canada."
"Security risks are real and need to be addressed, but it is important they not become a pretext for inefficient protectionism."
"Seemingly vast potential of digitalization suggests future growth in trade will tilt to services."
"Canada needs to build better trade relationships and produce the products people want to buy."
Market reaction
These comments failed to trigger a noticeable reaction in USD/CAD. At the time of press, the pair was up 0.1% on the day at 1.3575.
EURUSD is all but unchanged, Scotiabank’s Chief FX Strategist Shaun Osborne notes.
US event risk and ECB dull interest
“Spot levels have held close to yesterday’s closing rate with no incentive to extend ranges ahead of US event risks and the ECB on Thursday. Germany released final August CPI data which was unchanged from the preliminary data (1.9% Y/Y). A 25bps cut is widely expected Thursday and fully priced in. President Lagarde may be reluctant to give much at all away in terms of the outlook for further easing at this point.”
“Negative daily and weekly price signals in EURUSD over the past couple of weeks have negated the positive undertone in spot but, with trend momentum signals s till leaning bullish, these developments have not triggered any significant reversal in the EUR—at least not yet.”
“That is clearly a risk but, for now, the EUR is well-supported in the low 1.10s, close to the 1.1040 level which is the 38.2% retracement of the August rally. A clearer push below here targets the mid/upper 1.09s. Resistance is 1.1075/85.”
The US Dollar (USD) is opening a little softer overall but movement is limited across the major currencies and there is a sense of markets marking time ahead of tomorrow’s US CPI data—and perhaps tonight’s US presidential debate, Scotiabank’s Chief FX Strategist Shaun Osborne notes.
USD drifts in featureless trade as markets await debate, CPI
“The NOK and NZD are leading intraday gains for the currencies while the MXN is a relative underperformer, along with the ZAR. European stocks are mixed and US equity futures are flat. Bonds are not showing much interest in moving either. There are no major data reports today. The Fed’s Barr (on Basel III) and Bowman (stress testing) are speaking but the FOMC blackout is in effect, meaning no comments on the policy outlook.”
“The DXY is consolidating on the short-term charts and is still trying to take fuller advantage of the rebound in price seen at the end of August which signaled a potential recovery. Dollar index option pricing suggests a moderation in bearish sentiment as short-term risk reversal trade around neutral levels.”
“Swaps have priced out some risk of a 50bps cut from the Fed next week but still reflect the small chance that a larger cut could emerge—which is not an unreasonable position, in my view. Look for more range trading in the majors for now. DXY gains above 102 may signal scope for a little more strength. Support for the index sits at 100.5.”
EUR/GBP decline has stalled after forming interim trough near 0.8400 recently, Société Generale FX strategists note.
A fall towards 0.8350/0.8340 is possible
“Daily MACD has been posting positive divergence denoting receding downward momentum, but signals of a meaningful rebound are not yet visible. The 50-DMA near 0.8465 is first layer of resistance; this must be overcome to confirm a larger bounce. Inability could mean risk of deeper pullback.”
“Break below 0.8400 can result in next leg of down move towards 0.8380 and perhaps even towards next projections at 0.8350/0.8340.”
The Aug US employment report was slightly disappointing but did not point to a dire outlook to the US labor market, UOB Group Senior Economist Alvin Liew notes.
Jobless rate improves and wage growth reaccelerates
“Job creation was below expectations at 142,000, but more damaging was the sharp downward revision to Jun/Jul numbers. Unemployment rate eased to 4.2% as unemployed numbers fell by -48,000 while participation rate stayed steady at 62.7%. Wage growth reaccelerated above forecast to 0.4% m/m, 3.8% y/y in Aug, inflation worries not yet over.”
“Job creation in the first 8 months was clearly on a moderating trend (compared to the prior three years), which also continued to feature a narrowing base of job creation among the sectors in Jul with manufacturing, retail trade and information services sectors losing jobs.”
“The headline job number while slightly disappointing, did not justify calls for a bigger rate cut, in our view, especially if we consider the improvement in unemployment rate and the pickup in wage growth. We keep to our forecast of a 25 bps Fed rate cut in Sep, but we acknowledge the balance of risk has skewed towards more and deeper cuts.”
- The US Dollar trades flat in the European trading session ahead of some lower-tier economic data.
- All eyes are on the first debate between Trump and Harris on Tuesday night in Philadelphia.
- The US Dollar Index halts its rally ahead of testing a vital resistance level.
The US Dollar (USD) is sidetracking on Tuesday, away from being data-driven on riding the US Federal Reserve (Fed) comments for a brief moment. All eyes on Tuesday will be on the clash between former US President Donald Trump and Vice President Kamala Harris in their race for the White House. It will be the first – and possibly the only time – that the two candidates will get to debate each other in an attempt to win more votes as polls suggest that Trump has regained some ground compared to where things stood after the Democratic convention.
On the economic data front, the economic calendar doesn’t offer much market-moving numbers to digest on Tuesday. Even the speech from Federal Reserve Vice Chair for Supervision Michael Barr is not expected to have any impact as the Fed is already within its blackout period ahead of the Federal Open Market Committee (FOMC) gathering on September 17 and 18. It looks like markets will have a dull day ahead if no comments or major headlines emerge.
Daily digest market movers: Yawn
- The NFIB Business Optimism Index for August came in at 91.2, below the 93.6 expected and down from 93.7 previously.
- The Organization of the Petroleum Exporting Countries (OPEC) is set to release its monthly Oil Market Report at around 12:00 GMT.
- Federal Reserve Vice Chair for Supervision Michael Barr speaks at a Brookings Institution event in Washington about the Basel III Endgame regulatory framework. Barr isn't expected to talk about monetary policy because the Fed is within its blackout period ahead of its meeting on September 17-18.
- The US Treasury is set to distribute a 3-year note around 17:00 GMT.
- Equities trade mixed after US indices were able to close off Monday on a positive note. Some small profit-taking is taking place in Europe and in US futures during the European trading hours.
- The CME Fedwatch Tool shows a 73.0% chance of a 25 basis points (bps) interest rate cut by the Fed on September 18 against a 27.0% chance for a 50 bps cut. For the meeting on November 7, another 25 bps cut (if September is a 25 bps cut) is expected in November by 31.9%, while there is a 52.9% chance that rates will be 75 bps (25 bps + 50 bps) and a 15.2% probability of rates being 100 (25 bps + 75 bps) basis points lower.
- The US 10-year benchmark rate trades at 3.71%, off the low from Monday, when T-notes hit 3.69%.
US Dollar Index Technical Analysis: Range trading
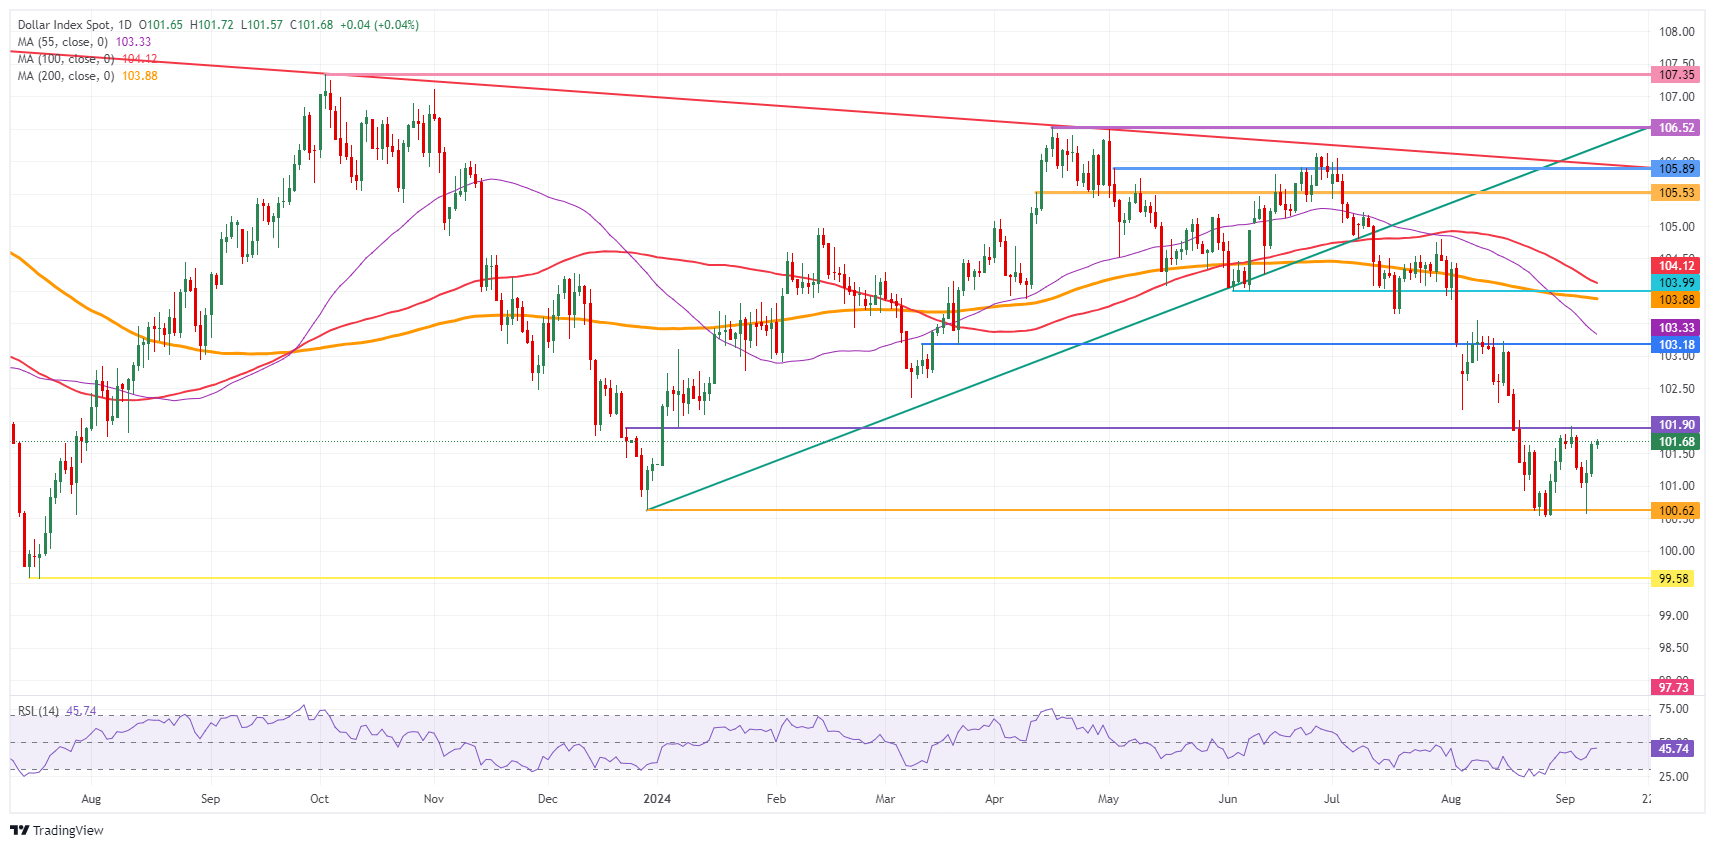
The US Dollar Index (DXY) is letting loose this Tuesday after its rally on Monday, when the DXY was able to cross to the higher level of the range it has been trading since mid-August. The light data calendar makes the US Dollar range trade for now, awaiting either more clear data to confirm what kind of interest-rate cut markets will get next week from the Fed or any geopolitical catalysts
The first resistance at 101.90 is getting ready for a second test after its rejection last week. Further up, a steep 2% uprising would be needed to get the index to 103.18. The next tranche up is a very misty one, with the 55-day Simple Moving Average (SMA) at 103.40, followed by the 200-day SMA at 103.89, just ahead of the big 104.00 round level.
On the downside, 100.62 (the low from December 28) holds strong and has already made the DXY rebound four times in recent weeks. Should it break, the low from July 14, 2023, at 99.58, will be the ultimate level to look out for. Once that level gives way, early levels from 2023 are coming in near 97.73.
US Dollar Index: Daily Chart
US Dollar FAQs
The US Dollar (USD) is the official currency of the United States of America, and the ‘de facto’ currency of a significant number of other countries where it is found in circulation alongside local notes. It is the most heavily traded currency in the world, accounting for over 88% of all global foreign exchange turnover, or an average of $6.6 trillion in transactions per day, according to data from 2022. Following the second world war, the USD took over from the British Pound as the world’s reserve currency. For most of its history, the US Dollar was backed by Gold, until the Bretton Woods Agreement in 1971 when the Gold Standard went away.
The most important single factor impacting on the value of the US Dollar is monetary policy, which is shaped by the Federal Reserve (Fed). The Fed has two mandates: to achieve price stability (control inflation) and foster full employment. Its primary tool to achieve these two goals is by adjusting interest rates. When prices are rising too quickly and inflation is above the Fed’s 2% target, the Fed will raise rates, which helps the USD value. When inflation falls below 2% or the Unemployment Rate is too high, the Fed may lower interest rates, which weighs on the Greenback.
In extreme situations, the Federal Reserve can also print more Dollars and enact quantitative easing (QE). QE is the process by which the Fed substantially increases the flow of credit in a stuck financial system. It is a non-standard policy measure used when credit has dried up because banks will not lend to each other (out of the fear of counterparty default). It is a last resort when simply lowering interest rates is unlikely to achieve the necessary result. It was the Fed’s weapon of choice to combat the credit crunch that occurred during the Great Financial Crisis in 2008. It involves the Fed printing more Dollars and using them to buy US government bonds predominantly from financial institutions. QE usually leads to a weaker US Dollar.
Quantitative tightening (QT) is the reverse process whereby the Federal Reserve stops buying bonds from financial institutions and does not reinvest the principal from the bonds it holds maturing in new purchases. It is usually positive for the US Dollar.
A break above the major resistance at 7.1330 is not ruled out; a sustained rise above this level seems unlikely for now. In the longer run, there has been an increase in momentum, but the US Dollar (USD) has to break and remain above 7.1350 before a sustained rise is likely, UOB Group FX strategists Quek Ser Leang and Peter Chia note.
Bulls are set to push towards 7.1330
24-HOUR VIEW: “While we expected USD to edge higher yesterday, we were of the view that ‘any advance is part of a higher trading range of 7.0850/7.1150.’ However, USD rose more than expected to 7.1250, closing on a firm note at 7.1220 (+0.35%). The increase in momentum is likely to lead to further USD strength. A break above the major resistance at 7.1330 is not ruled out, but a sustained rise above this level seems unlikely for now. Support levels are at 7.1140 and 7.1000.”
1-3 WEEKS VIEW: “Yesterday, when USD was at 7.1020, we indicated that ‘the current price movements are likely part of a sideways trading phase.’ We expect USD ‘to trade between 7.0650 and 7.1350 for the time being.’ USD then rose to 7.1250. There has been an increase in momentum, but not sufficiently enough to suggest the start of a sustained advance. USD has to break and remain above 7.1350 before a sustained rise is likely. The likelihood of USD breaking clearly above 7.1350 is high for now, but it will improve as long as 7.0800 is not taken out. Looking ahead, the next resistance above 7.1350 is at 7.1700.”
- EUR/GBP is declining within an ascending channel that has been rising since the end of August.
- The short-term trend is unclear although price continues respecting the boundaries of the channel.
EUR/GBP is falling within a shallow ascending recovery channel that began at the August 30 lows and the overall short-term trend is unclear.
The pair recently touched the top of the channel before pulling back down to the level of the 50-period Simple Moving Average (SMA).
EUR/GBP 4-hour Chart
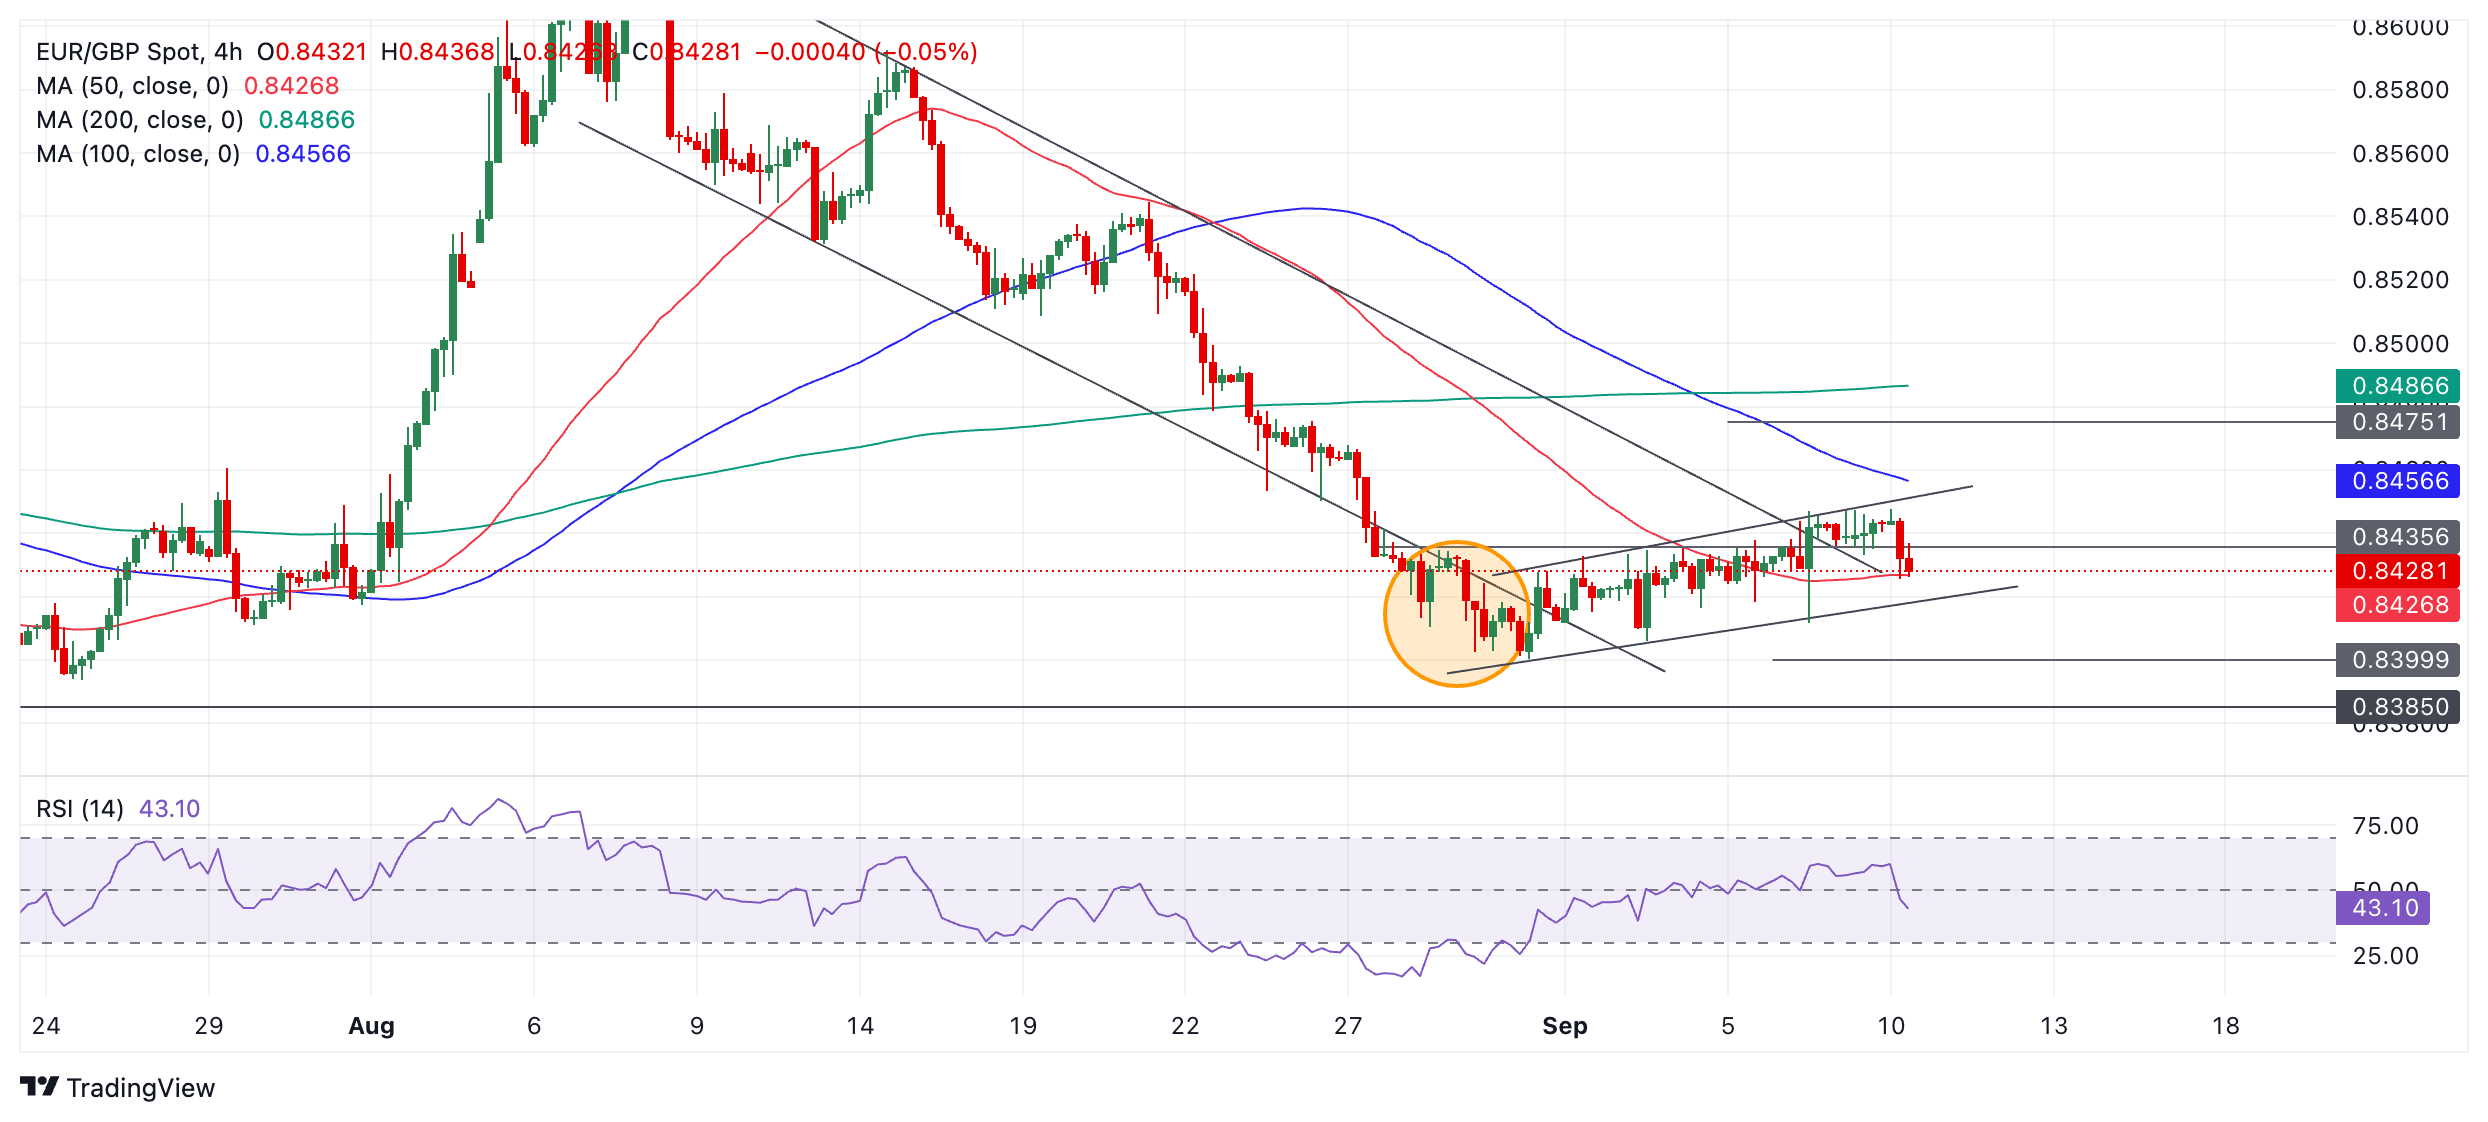
EUR/GBP is respecting the guard rails of the channel and it will probably find support at the lower channel line at roughly 0.8420 before rotating higher again and extending the channel steadily higher.
The medium-term trend is probably still bearish, however, suggesting a risk of price breaking out lower.
A break below 0.8406 (September 3 low) would pave the way for further weakness to a downside target at 0.8385 (July 17 lows).
The break above the 50-period SMA was a bullish sign as was the breakout from the falling channel during August (orange shaded circle) when it accelerated to the downside. This could have been an exhaustion break. If so, it would be a bullish sign as these patterns usually happen at the end of trends and are a sign of reversal.
A clear break above the top of the shallow rising channel at roughly 0.8455 would be required to confirm a bullish reversal. Such a move could be expected to reach 0.8470-80 as an initial target zone.
- USD/JPY trades sideways near 143.00 with a focus on the US inflation data for August.
- The US inflation data will influence market expectations for the Fed interest rate cut path.
- Investors see the BoJ hiking interest rates further in the remainder of the year.
The USD/JPY pair steadies near 143.00 in Tuesday’s European session, holding gains generated after rebounding from the Year-to-date (YTD) low of 141.70 on Monday. The asset is expected to trade sideways as investors have sidelined ahead of the United States (US) Consumer Price Index (CPI) data for August, which will be published on Wednesday.
The market sentiment appears to be cautious as the US inflation data is expected to significantly influence market speculation for the Federal Reserve (Fed) interest rate cut path. S&P 500 futures have posted nominal losses in European trading hours. The US Dollar Index (DXY), which tracks the Greenback’s value against six major currencies, clings to gains near 101.60.
Investors see the US annual headline CPI decelerating to 2.6%, the lowest since March 2021, from 2.9% in July. The core inflation-which excludes volatile food and energy prices- is expected to have grown steadily by 3.2%. The significance of the inflation data has increased as the US Nonfarm Payrolls (NFP) data for August failed to provide a precise case about whether the Fed will start the policy-easing cycle aggressively or gradually.
Soft inflation figures would prompt market expectations for the Fed to cut interest rates by 50 basis points (bps) in the monetary policy meeting next week. The confusion over Fed’s likely interest rate cut size would deepen if the figures remain hot or sticky.
Meanwhile, the overall outlook of the Japanese Yen (JPY) remains firm as the Bank of Japan (BoJ) is expected to tighten its monetary policy further amid persistent inflationary pressures. Traders continue to bet for BoJ’s policy-tightening despite Japan’s Q2 Gross Domestic Product (GDP) data coming in lower than projected. Japan’s annualized GDP unexpectedly grew at a slower pace of 2.9%. Investors forecasted Japan’s economy to have expanded at a faster pace of 3.2% from the former release of 3.1%.
Japanese Yen FAQs
The Japanese Yen (JPY) is one of the world’s most traded currencies. Its value is broadly determined by the performance of the Japanese economy, but more specifically by the Bank of Japan’s policy, the differential between Japanese and US bond yields, or risk sentiment among traders, among other factors.
One of the Bank of Japan’s mandates is currency control, so its moves are key for the Yen. The BoJ has directly intervened in currency markets sometimes, generally to lower the value of the Yen, although it refrains from doing it often due to political concerns of its main trading partners. The current BoJ ultra-loose monetary policy, based on massive stimulus to the economy, has caused the Yen to depreciate against its main currency peers. This process has exacerbated more recently due to an increasing policy divergence between the Bank of Japan and other main central banks, which have opted to increase interest rates sharply to fight decades-high levels of inflation.
The BoJ’s stance of sticking to ultra-loose monetary policy has led to a widening policy divergence with other central banks, particularly with the US Federal Reserve. This supports a widening of the differential between the 10-year US and Japanese bonds, which favors the US Dollar against the Japanese Yen.
The Japanese Yen is often seen as a safe-haven investment. This means that in times of market stress, investors are more likely to put their money in the Japanese currency due to its supposed reliability and stability. Turbulent times are likely to strengthen the Yen’s value against other currencies seen as more risky to invest in.
The US Dollar (USD) is likely to trade in a range between 142.40 and 144.00. In the longer run, USD is likely to trade with a downward bias; the probability of it breaking the significant support at 140.80 is not high, UOB Group FX strategists Quek Ser Leang and Peter Chia note.
Probability of breaking below 140.80 is not high
24-HOUR VIEW: “We expected USD to trade in a range between 142.00 and 143.50 yesterday. USD then traded in a wider range than expected (141.94/143.79), closing at 143.17. The price action provides no fresh clues. Today, we continue to expect USD to trade in a range, likely between 142.40 and 144.00.”
1-3 WEEKS VIEW: “Our update from yesterday (09 Sep, spot at 142.65) is still valid. As highlighted, we expect USD to trade with a downward bias. However, given the tentative buildup in momentum, the probability of USD breaking the significant support level at 140.80 is not high. To maintain the buildup in momentum, USD must not breach the ‘strong resistance’ at 144.00 (no change in level).”
The Dollar Index (DXY) consolidates near the top end of its three-week range (100.5 and 101.9), DBS FX strategist Philip Wee notes.
DXY is near the top of a three-week range
“DXY may consolidate following a two-day rebound near the top end of its three-week range (100.5 and 101.9).”
“The US Treasury 2Y yield rose by 2.3 bps to 3.67% after four consecutive sessions of declines. Overnight, the Dow, S&P 500, and Nasdaq Composite indices each gained 1.2%, stabilizing after their worst weekly sell-off this year.”
“The futures market believes that the Fed needs to act more forcefully with a 50-bps cut at next week’s FOMC meeting to counter US recession fears tied to a cooling labour market.”
- Crude Oil resides near the low for this year after being unable to significantly bounce higher on Monday.
- Markets gear up for the monthly OPEC report, with expectations that it will disappoint markets.
- The US Dollar Index trades above 101.50, easing a touch after Monday’s rally.
Crude Oil steadies near $68.00 on Tuesday ahead of the publication of the monthly OPEC report, a key market-moving event for Oil prices. Taking into consideration the recent comments from commodity leading experts and analysts, the report should bear either a very bullish outlook or set forth some additional interventions by the OPEC cartel to prevent any further downturn in prices. The risk is that the report does not hold any measures or comments on the matter, triggering another leg down for Oil prices.
The US Dollar Index (DXY), which tracks the performance of the US Dollar (USD) against a basket of currencies, is easing a touch on Tuesday ahead of a very light US calendar. The main event will be after US markets have closed, with the first and possibly only debate between former US President Donald Trump and Vice President Kamala Harris in their race to the White House.
At the time of writing, Crude Oil (WTI) trades at $67.94 and Brent Crude at $71.46.
Oil news and market movers: China imports could drop further
The OPEC monthly Market Report is expected to be published at 12:00 GMT.
- Bloomberg reports that Tropical Storm Francine, which is moving towards the Gulf of Mexico, is gaining strength. Oil drillers in the area are evacuating crews and halting offshore crude production.
- Hungarian energy company Mol Group will take over the Russian oil flow at the Belarusian-Ukrainian border in order to guarantee maintenance and safe flow into Hungary, running over Ukrainian land. The company was forced to do so after Ukraine sanctioned Russian company Lukoil, which was initially responsible for the maintenance and securing the transition on Ukrainian soil, Reuters reports.
- Bloomberg reports that Liao Na, the chief consultant of energy and chemicals at Mysteel OilChem, said that China’s crude imports could drop another 1.2% year over year.
- The American Petroleum Institute (API) is due to release its weekly numbers on the US Crude stockpile changes. In the previous week, there was a drawdown of over 7.8 million barrels. No forecast is available for this week’s number, which is expected at 20:30 GMT.
Oil Technical Analysis: Just be done with it
Crude Oil could get a final blow which might see prices drop further towards $65.00 or even $60.00, depending on how markets interpret the upcoming monthly OPEC report. OPEC is the only market player that could impact prices very quickly. The unofficial central bank of Oil could easily bring prices back up to $70.00 if it commits to more production cuts, although the ununified group appears not able to act decisively to support Oil prices.
On the upside, the $75.27 will be the first level to head back to. Next, the $77.43 level aligns with both a descending trendline and the 200-day Simple Moving Average (SMA). In case bulls can break above it, the 100-day SMA at $77.71 could trigger a rejection.
On Friday, the $67.11 key level broke very briefly. For now, the current range between $67.11 and the $68.00 big figure is to be watched. Next level further down the line is $64.38, the low from March and May 2023.
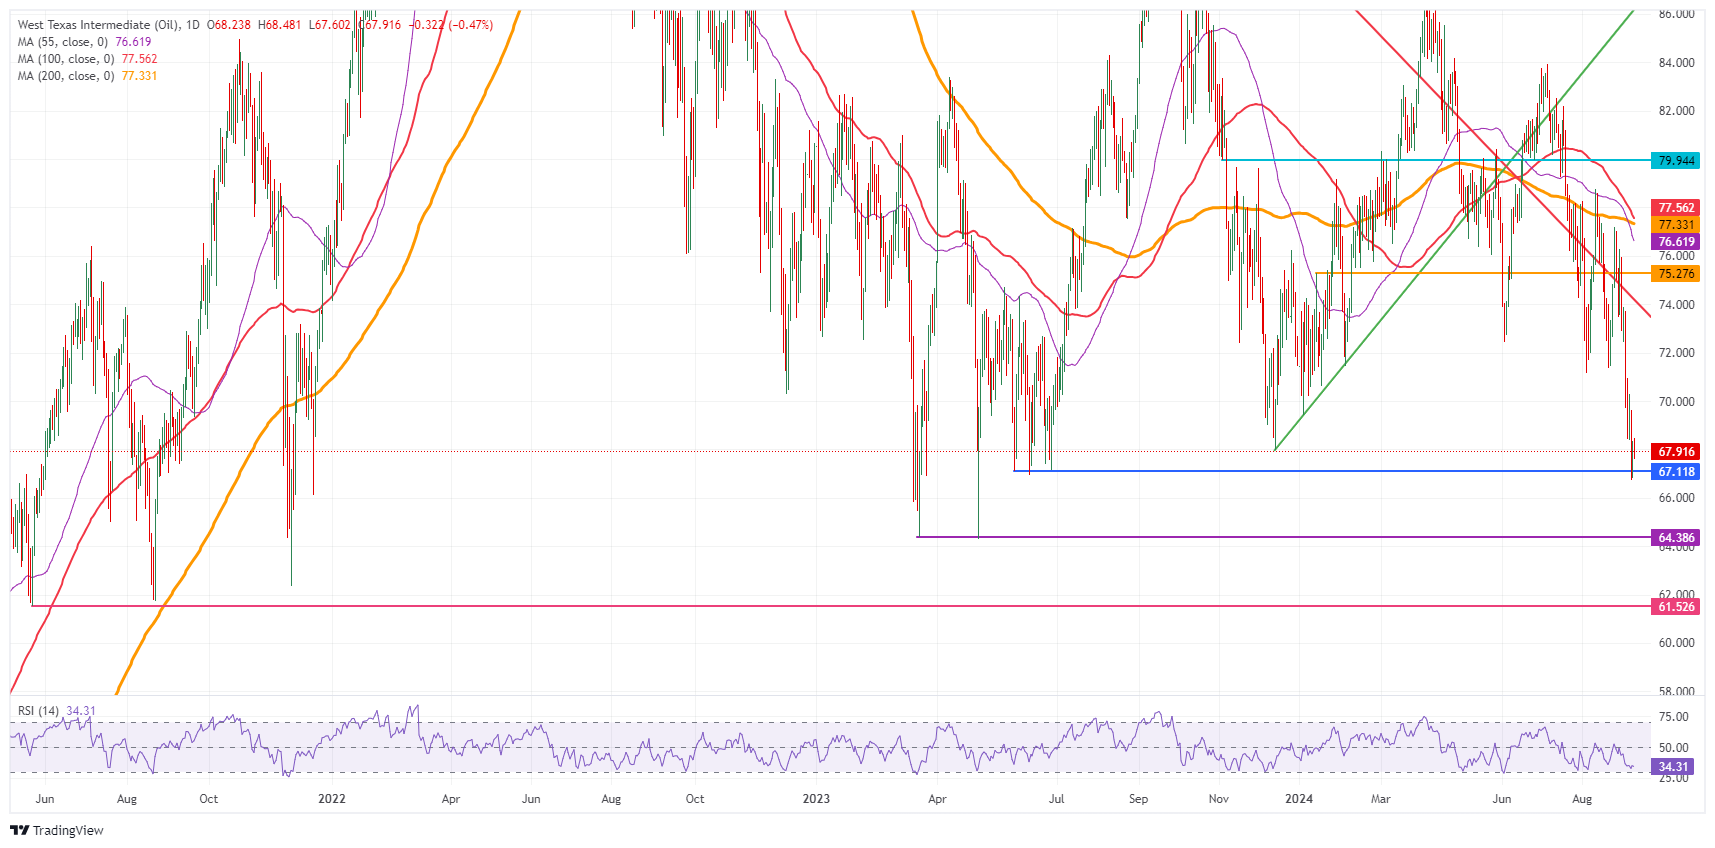
US WTI Crude Oil: Daily Chart
WTI Oil FAQs
WTI Oil is a type of Crude Oil sold on international markets. The WTI stands for West Texas Intermediate, one of three major types including Brent and Dubai Crude. WTI is also referred to as “light” and “sweet” because of its relatively low gravity and sulfur content respectively. It is considered a high quality Oil that is easily refined. It is sourced in the United States and distributed via the Cushing hub, which is considered “The Pipeline Crossroads of the World”. It is a benchmark for the Oil market and WTI price is frequently quoted in the media.
Like all assets, supply and demand are the key drivers of WTI Oil price. As such, global growth can be a driver of increased demand and vice versa for weak global growth. Political instability, wars, and sanctions can disrupt supply and impact prices. The decisions of OPEC, a group of major Oil-producing countries, is another key driver of price. The value of the US Dollar influences the price of WTI Crude Oil, since Oil is predominantly traded in US Dollars, thus a weaker US Dollar can make Oil more affordable and vice versa.
The weekly Oil inventory reports published by the American Petroleum Institute (API) and the Energy Information Agency (EIA) impact the price of WTI Oil. Changes in inventories reflect fluctuating supply and demand. If the data shows a drop in inventories it can indicate increased demand, pushing up Oil price. Higher inventories can reflect increased supply, pushing down prices. API’s report is published every Tuesday and EIA’s the day after. Their results are usually similar, falling within 1% of each other 75% of the time. The EIA data is considered more reliable, since it is a government agency.
OPEC (Organization of the Petroleum Exporting Countries) is a group of 13 Oil-producing nations who collectively decide production quotas for member countries at twice-yearly meetings. Their decisions often impact WTI Oil prices. When OPEC decides to lower quotas, it can tighten supply, pushing up Oil prices. When OPEC increases production, it has the opposite effect. OPEC+ refers to an expanded group that includes ten extra non-OPEC members, the most notable of which is Russia.
- USD/CAD trades sideways above 1.3550, with investors focusing on BoC’s Macklem speech and the US CPI data for August.
- BoC Macklem is expected to deliver a dovish interest rate guidance.
- The risk profile is cautious ahead of the US inflation data.
The USD/CAD pair stays in a tight range above 1.3550 in Tuesday’s European session. The Loonie asset struggles for direction as investors have sidelined ahead of the Bank of Canada (BoC) Governor Tiff Macklem’s speech, which is scheduled at 12:25 GMT.
Tiff Macklem is expected to provide guidance about the likely monetary policy action in the last quarter of the year. The interest rate guidance from BoC Macklem is expected to be dovish as the Canadian economy is going through a rough phase due to subdued demand environment. Canadian Unemployment Rate rose at a faster-than-expected pace to 6.6% in August from the estimates of 6.5% and the July’s release of 6.4%.
The BoC has already reduced interest rates by 75 basis points (bps) to 4.25% since June. Financial market participants expect the BoC to cut its borrowing rates further to boost the economic growth.
Meanwhile, the overall market mood is quite cautious as investors await the United States (US) Consumer Price Index (CPI) data for August, which will be published on Wednesday. S&P 500 futures have posted decent losses in the European session. The US Dollar Index (DXY), which tracks the Greenback’s value against six major currencies, holds onto gains near 101.60.
The US inflation data will significantly influence market speculation for Federal Reserve (Fed) likely interest rate cut size this month. Recent commentary from Fed officials has indicated that the central bank is more focused on preventing job losses as they are confident that inflation is on track to return to the desired rate of 2%. However, the significance of the inflation data has increased as the US Nonfarm Payrolls (NFP) data for August failed to provide a clear case for Fed’s potential interest rate cut size.
Canadian Dollar FAQs
The key factors driving the Canadian Dollar (CAD) are the level of interest rates set by the Bank of Canada (BoC), the price of Oil, Canada’s largest export, the health of its economy, inflation and the Trade Balance, which is the difference between the value of Canada’s exports versus its imports. Other factors include market sentiment – whether investors are taking on more risky assets (risk-on) or seeking safe-havens (risk-off) – with risk-on being CAD-positive. As its largest trading partner, the health of the US economy is also a key factor influencing the Canadian Dollar.
The Bank of Canada (BoC) has a significant influence on the Canadian Dollar by setting the level of interest rates that banks can lend to one another. This influences the level of interest rates for everyone. The main goal of the BoC is to maintain inflation at 1-3% by adjusting interest rates up or down. Relatively higher interest rates tend to be positive for the CAD. The Bank of Canada can also use quantitative easing and tightening to influence credit conditions, with the former CAD-negative and the latter CAD-positive.
The price of Oil is a key factor impacting the value of the Canadian Dollar. Petroleum is Canada’s biggest export, so Oil price tends to have an immediate impact on the CAD value. Generally, if Oil price rises CAD also goes up, as aggregate demand for the currency increases. The opposite is the case if the price of Oil falls. Higher Oil prices also tend to result in a greater likelihood of a positive Trade Balance, which is also supportive of the CAD.
While inflation had always traditionally been thought of as a negative factor for a currency since it lowers the value of money, the opposite has actually been the case in modern times with the relaxation of cross-border capital controls. Higher inflation tends to lead central banks to put up interest rates which attracts more capital inflows from global investors seeking a lucrative place to keep their money. This increases demand for the local currency, which in Canada’s case is the Canadian Dollar.
Macroeconomic data releases gauge the health of the economy and can have an impact on the Canadian Dollar. Indicators such as GDP, Manufacturing and Services PMIs, employment, and consumer sentiment surveys can all influence the direction of the CAD. A strong economy is good for the Canadian Dollar. Not only does it attract more foreign investment but it may encourage the Bank of Canada to put up interest rates, leading to a stronger currency. If economic data is weak, however, the CAD is likely to fall.
For the second time this summer, the Norwegian krone is experiencing a major selloff without a clear catalyst. The thinner liquidity conditions of the NOK market compared to other G10 currencies make it quite vulnerable to speculative selling, ING’s FX strategist Francesco Pesole notes.
Norges Bank has no rush to turn dovish just yet
“This morning, Norway released CPI figures for August. Headline inflation came in at 2.6% YoY versus 2.8% consensus and the underlying rate was on consensus at 3.2% YoY. We believe that the currency situation is more relevant than inflation data for Norges Bank at this stage. Governor Ida Wolden Bache has been repeatedly vocal about the risks of a weak NOK and we believe Norges Bank has no rush to turn dovish just yet.”
“We expect another hawkish statement at next week’s meeting, to discourage further NOK selling. EUR/NOK is expensive by any measure at these levels. We expect a decline to start at any point now, but we cannot exclude that EUR/NOK may be pushed beyond 12.00 before opportunistic selling takes over.”
The New Zealand Dollar (NZD) could break below 0.6115; the support at 0.6085 is highly unlikely to come into view, UOB Group FX strategists Quek Ser Leang and Peter Chia note.
Bears target 0.6115 in the sort term
24-HOUR VIEW: “We indicated yesterday that ‘provided that NZD remains below 0.6220, it could break below 0.6150.’ We added, ‘the major support at 0.6115 is highly unlikely to come into view today.’ Our view turned out to be correct, as NZD fell to a low of 0.6132. The price action suggests NZD could break below 0.6115 today. This time around, the support at 0.6085 is highly unlikely to come into view. Resistance levels are at 0.6160 and 0.6175.”
1-3 WEEKS VIEW: “The following is from our update yesterday (09 Sep, spot at 0.6170): The current price action is likely part of a corrective pullback that could potentially reach the major support at 0.6115. A break of this level is not ruled out, but as downward momentum is only beginning to build, the chance of a sustained drop below this level is low for now. On the upside, should NZD break above 0.6250, it would mean that the buildup in momentum has faded. NZD then fell, reaching a low of 0.6132. We continue to expect NZD to pullback. The increase in momentum suggests a break of 0.6115 could lead a deeper pullback towards 0.6085. To maintain the momentum, NZD must not break above 0.6205 (‘strong resistance’ level was at 0.6250 yesterday).”
EUR/GBP has come off this morning after the latest batch of UK jobs data was slightly better than expected, ING’s FX strategist Chris Turner notes.
EUR/GBP can drift towards 0.8400
“While July's average earnings figures were on consensus, employment growth in July was much stronger than expected. And the jobless claims rise in August was much lower than expected. While these jobs figures are notoriously volatile, they can probably maintain the wedge between the expected Bank of England and Fed easing cycles.”
“For the remainder of this year, markets price 107bp of Fed cuts versus just 48bp for the BoE. EUR/GBP can drift towards 0.8400 – but may struggle to break that level given that we think the euro could derive some support from the ECB meeting this Thursday.”
The Australian Dollar (AUD) is likely to weaken further; the support at 0.6620 is likely out of reach today, UOB Group FX strategists Quek Ser Leang and Peter Chia note.
AUD to fall below 0.6620
24-HOUR VIEW: “AUD plummeted and closed sharply lower last Friday. Yesterday, we indicated that ‘while the sharp drop appears to be overdone, there is scope for AUD to dip to 0.6650 before a rebound is likely.’ We also indicated that ‘the next support at 0.6620 is unlikely to come under threat.’ In line with our view, AUD dipped to a low of 0.6648. However, there is no sign of a rebound yet. In other words, AUD is likely to weaken further today, even though the major support at 0.6620 is likely out of reach. Resistance is at 0.6675, followed by 0.6690.”
1-3 WEEKS VIEW: “When AUD was trading at 0.6675 yesterday, we highlighted that AUD ‘is likely to edge lower to 0.6620.’ We added, ‘to keep the momentum going, AUD must remain below the ‘strong resistance’ level, currently at 0.6770.’ AUD then fell to a low of 0.6648, closing at 0.6661 (- 0.15%). We continue to hold the same view as long as 0.6715 (‘strong resistance’ level was at 0.6770) is not breached. Looking ahead, a clear break below 0.6620 will shift the focus to 0.6580.”
The highlight of yesterday's European session was Mario Draghi's release of the report, The Future of European Competitiveness, ING’s FX strategist Chris Turner notes.
A drift to 1.1000 looks like the risk today
“His recommendations will be pored over for many months and probably years – especially the call for joint EU debt issuance to finance the €800bn or so annual investment required for the EU to play catch-up with the US and China.”
“Clearly, northern Europe and populist governments will struggle to embrace his calls for joint debt issuance, and financial markets look unlikely to move on this until the EU attempts to embrace any of these recommendations in future budgets.”
“In the meantime, EUR/USD is treading water ahead of Thursday's ECB meeting. A drift to 1.1000 looks like the risk today as investors absorb weak China demand data and strong US credit data.”
Silver prices (XAG/USD) fell on Tuesday, according to FXStreet data. Silver trades at $28.31 per troy ounce, down 0.14% from the $28.35 it cost on Monday.
Silver prices have increased by 18.98% since the beginning of the year.
| Unit measure | Silver Price Today in USD |
|---|---|
| Troy Ounce | 28.31 |
| 1 Gram | 0.91 |
The Gold/Silver ratio, which shows the number of ounces of Silver needed to equal the value of one ounce of Gold, stood at 88.41 on Tuesday, broadly unchanged from 88.40 on Monday.
Silver FAQs
Silver is a precious metal highly traded among investors. It has been historically used as a store of value and a medium of exchange. Although less popular than Gold, traders may turn to Silver to diversify their investment portfolio, for its intrinsic value or as a potential hedge during high-inflation periods. Investors can buy physical Silver, in coins or in bars, or trade it through vehicles such as Exchange Traded Funds, which track its price on international markets.
Silver prices can move due to a wide range of factors. Geopolitical instability or fears of a deep recession can make Silver price escalate due to its safe-haven status, although to a lesser extent than Gold's. As a yieldless asset, Silver tends to rise with lower interest rates. Its moves also depend on how the US Dollar (USD) behaves as the asset is priced in dollars (XAG/USD). A strong Dollar tends to keep the price of Silver at bay, whereas a weaker Dollar is likely to propel prices up. Other factors such as investment demand, mining supply – Silver is much more abundant than Gold – and recycling rates can also affect prices.
Silver is widely used in industry, particularly in sectors such as electronics or solar energy, as it has one of the highest electric conductivity of all metals – more than Copper and Gold. A surge in demand can increase prices, while a decline tends to lower them. Dynamics in the US, Chinese and Indian economies can also contribute to price swings: for the US and particularly China, their big industrial sectors use Silver in various processes; in India, consumers’ demand for the precious metal for jewellery also plays a key role in setting prices.
Silver prices tend to follow Gold's moves. When Gold prices rise, Silver typically follows suit, as their status as safe-haven assets is similar. The Gold/Silver ratio, which shows the number of ounces of Silver needed to equal the value of one ounce of Gold, may help to determine the relative valuation between both metals. Some investors may consider a high ratio as an indicator that Silver is undervalued, or Gold is overvalued. On the contrary, a low ratio might suggest that Gold is undervalued relative to Silver.
(An automation tool was used in creating this post.)
- AUD/USD has extended its downtrend to the 200-period SMA.
- It is biased to fall further although RSI is mildly oversold.
AUD/USD extends the short-term downtrend it began after rolling over at the August 29 highs.
According to technical analysis theory, “the trend is your friend” which suggests the odds favor AUD/USD further extending its downtrend to lower lows.
AUD/USD 4-hour Chart
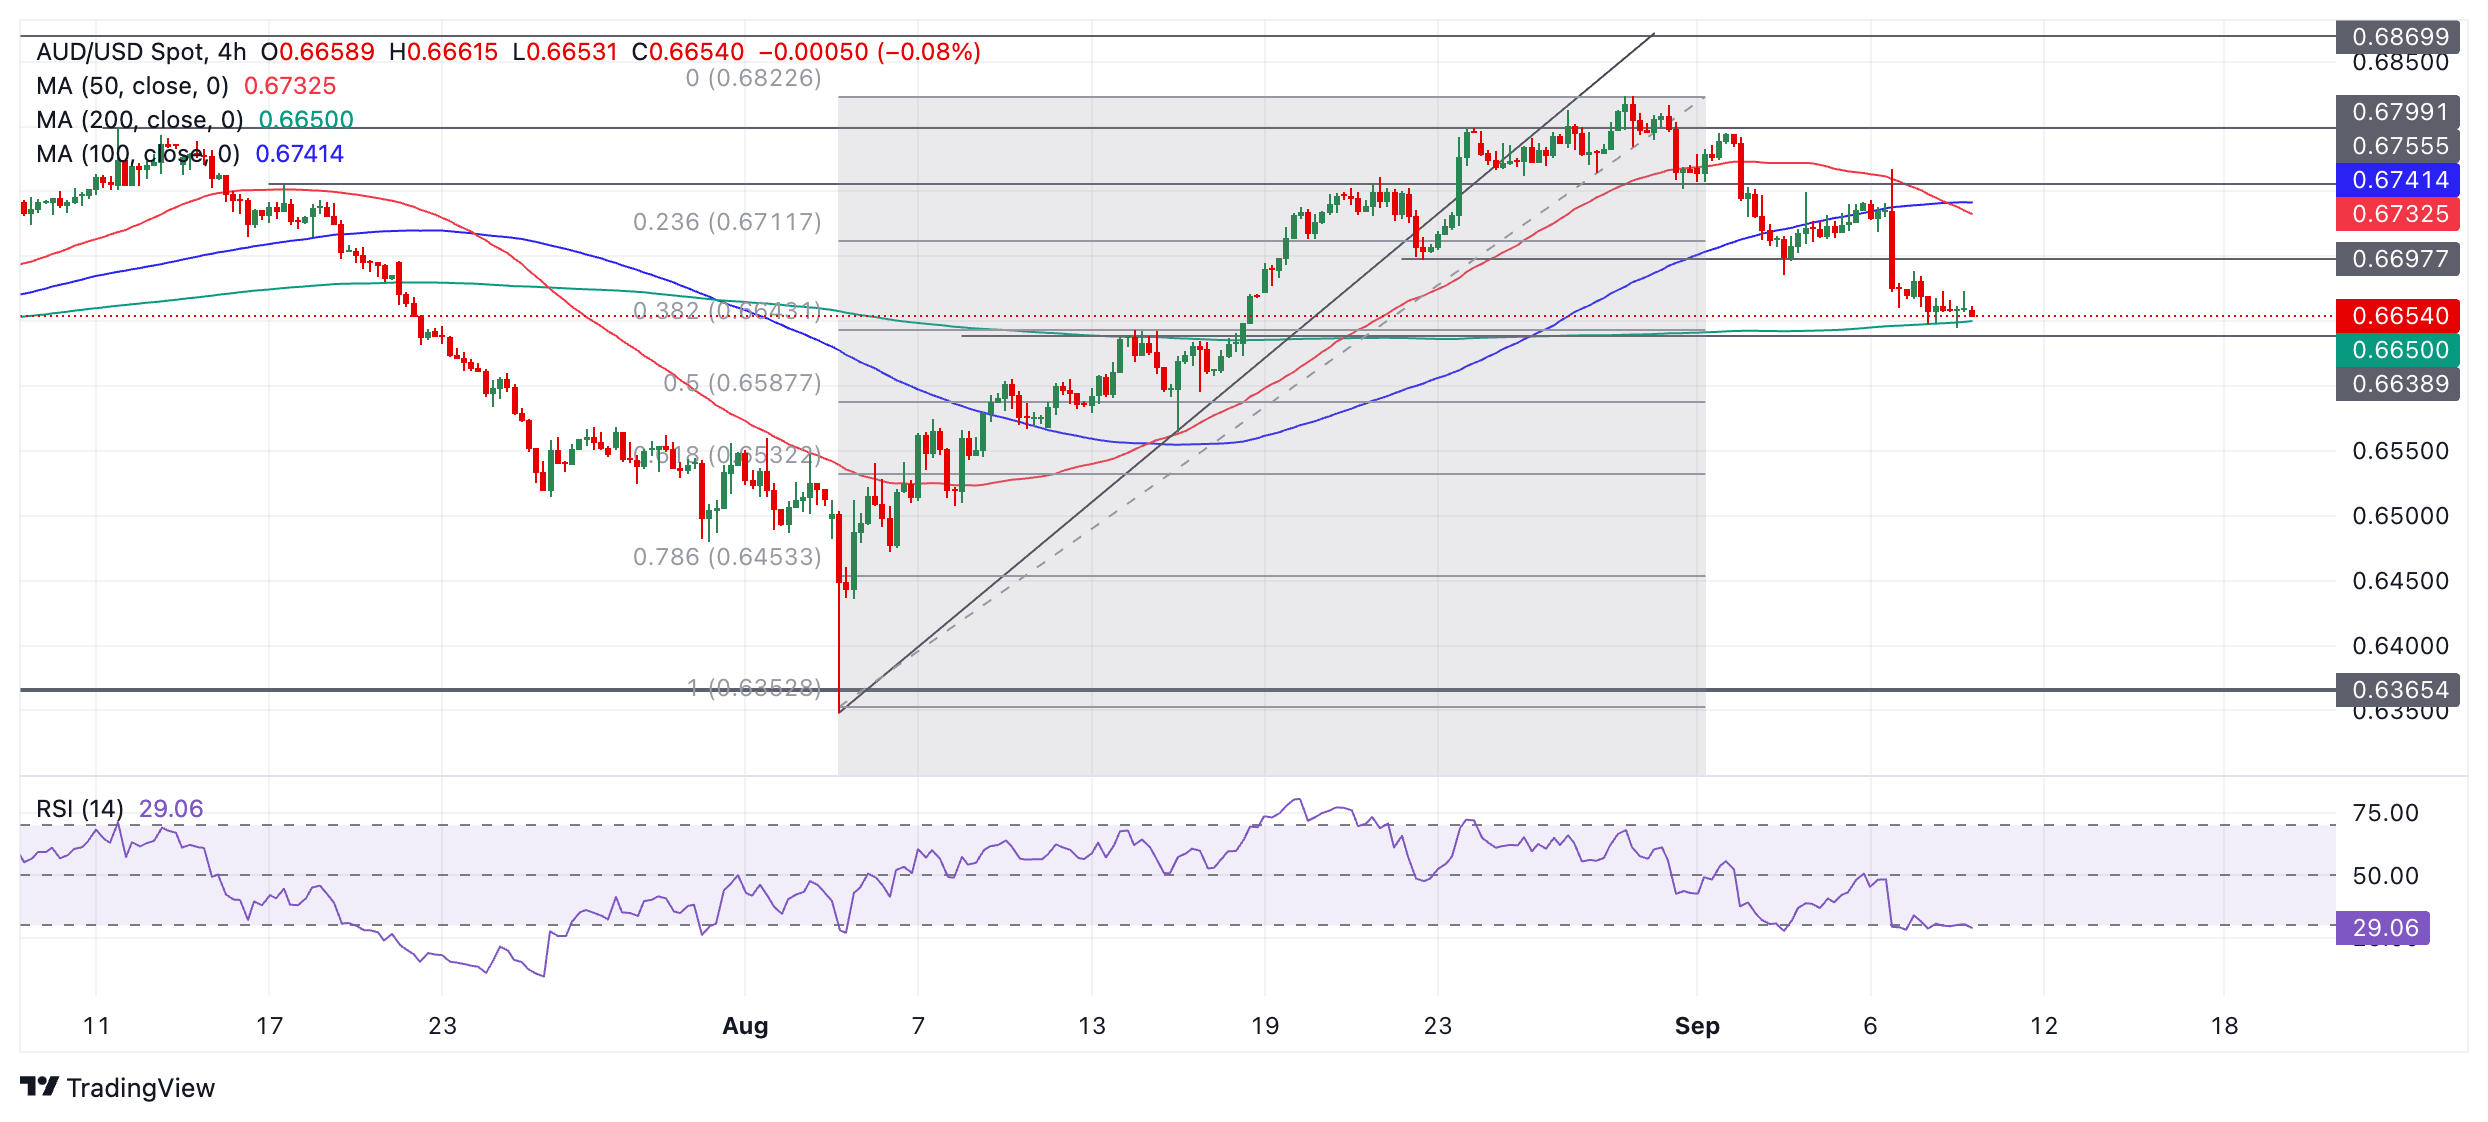
AUD/USD has met the next downside target at 0.6645 and is finding support at the 200-period Simple Moving Average (SMA). If it can close below 200 SMA and 0.6645 it will indicate the downtrend is probably falling further, with the next target at 0.6587, the 0.50 Fibonacci ratio retracement level of the August rally.
The Relative Strength Index (RSI) momentum indicator is mildly oversold, advising traders not to add to their short positions. There is a risk of a correction, but for this to gain credence the RSI would need to recover firmly back into neutral territory.
Further weakness could see AUD/USD fall to 0.6565 (August 15 low), followed by 0.6532, the 0.618 ration Fibonacci retracement of the August rally. At that level it will probably encounter firmer support.
- NZD/USD trades in a tight range as investors turn cautious ahead of US inflation data.
- The US inflation data will influence market speculation for Fed’s interest rate cut size this month.
- China’s weak deflation data weighs on antipodeans.
The NZD/USD pair edges higher to near 0.6150 but trades inside Monday’s trading range in Tuesday’s European session. The near-term outlook of the Kiwi asset remains uncertain as the United States (US) Consumer Price Index (CPI) data for August takes center stage, which will be published on Wednesday.
Economists estimate the annual headline inflation to have decelerated to 2.6% from 2.9% in July. This would be the lowest reading since March 2021, which will boost market speculation for the Federal Reserve (Fed) to start the policy-easing process this month with a large interest rate cut. In the same period, the core inflation -which excludes volatile food and energy prices- is estimated to have risen steadily by 3.2%.
Meanwhile, growing concerns over China’s economic outlook have weighed on the New Zealand Dollar (NZD), given that the Kiwi economy is one of the leading trading partners of the world’s second-largest nation. China’s producer inflation deflated at a faster-than-expected pace in August, which increased evidence of diminishing pricing power at the hands of factory owners due to sluggish household demand.
NZD/USD witnesses a steep fall after a breakdown of the Rising Wedge chart formation on a four-hour timeframe, which results in a bearish reversal. The 20-period Exponential Moving Average (EMA) at 0.6190 starts declining, suggesting the onset of a bearish trend in the short term.
The 14-period Relative Strength Index (RSI) shifts into the bearish range of 20.00-40.00, indicating that a bearish momentum has been triggered.
More downside would appear if the asset decisively breaks the July 17 high near 0.6100. This would push the asset lower to the May 3 high at 0.6046 and the psychological support of 0.6000.
In an alternate scenario, an upside move above the September 6 high of 0.6250 would drive the asset toward the September 2 high of 0.6300, followed by this year's high of 0.6330.
NZD/USD four-hour chart
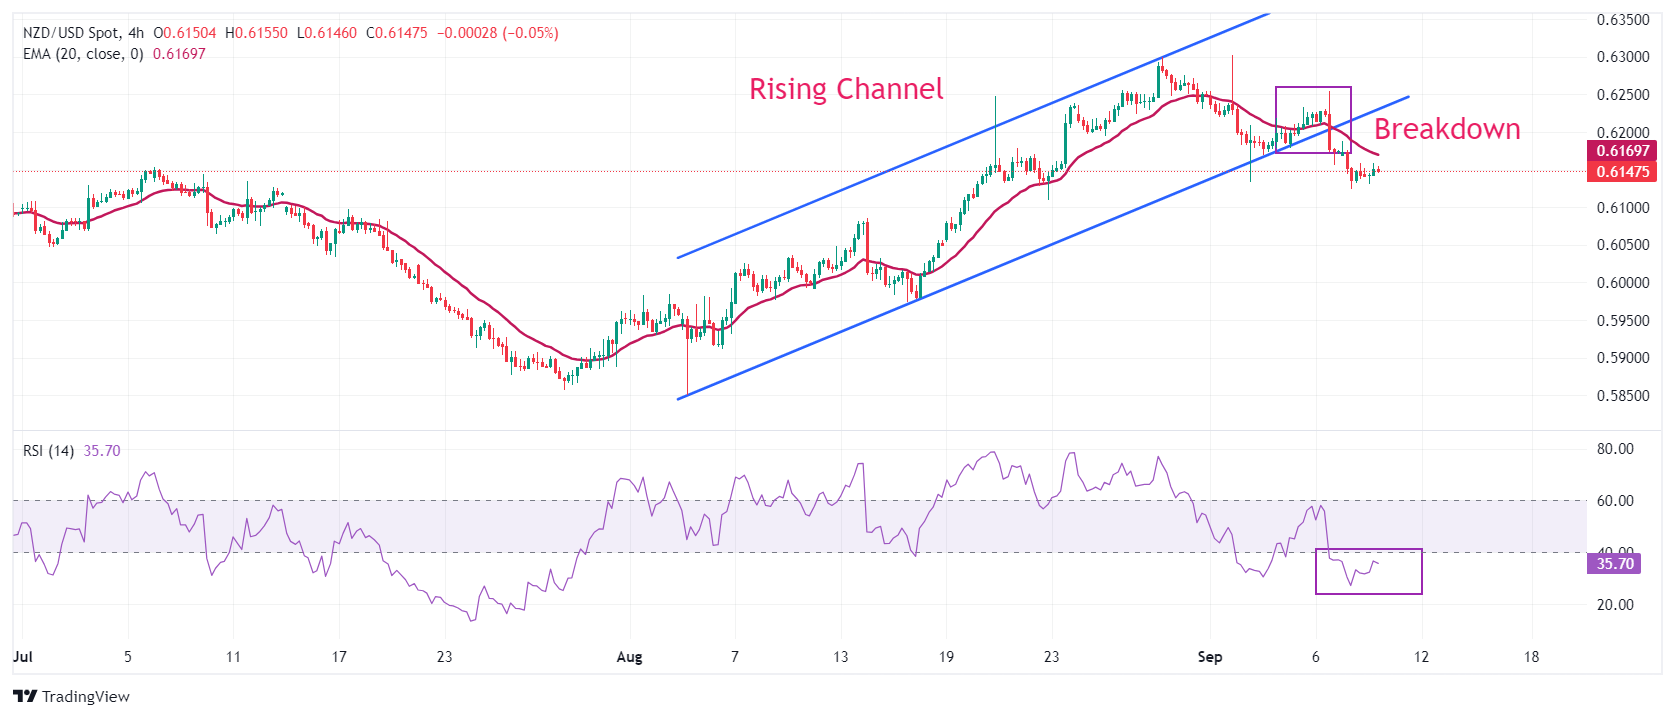
New Zealand Dollar FAQs
The New Zealand Dollar (NZD), also known as the Kiwi, is a well-known traded currency among investors. Its value is broadly determined by the health of the New Zealand economy and the country’s central bank policy. Still, there are some unique particularities that also can make NZD move. The performance of the Chinese economy tends to move the Kiwi because China is New Zealand’s biggest trading partner. Bad news for the Chinese economy likely means less New Zealand exports to the country, hitting the economy and thus its currency. Another factor moving NZD is dairy prices as the dairy industry is New Zealand’s main export. High dairy prices boost export income, contributing positively to the economy and thus to the NZD.
The Reserve Bank of New Zealand (RBNZ) aims to achieve and maintain an inflation rate between 1% and 3% over the medium term, with a focus to keep it near the 2% mid-point. To this end, the bank sets an appropriate level of interest rates. When inflation is too high, the RBNZ will increase interest rates to cool the economy, but the move will also make bond yields higher, increasing investors’ appeal to invest in the country and thus boosting NZD. On the contrary, lower interest rates tend to weaken NZD. The so-called rate differential, or how rates in New Zealand are or are expected to be compared to the ones set by the US Federal Reserve, can also play a key role in moving the NZD/USD pair.
Macroeconomic data releases in New Zealand are key to assess the state of the economy and can impact the New Zealand Dollar’s (NZD) valuation. A strong economy, based on high economic growth, low unemployment and high confidence is good for NZD. High economic growth attracts foreign investment and may encourage the Reserve Bank of New Zealand to increase interest rates, if this economic strength comes together with elevated inflation. Conversely, if economic data is weak, NZD is likely to depreciate.
The New Zealand Dollar (NZD) tends to strengthen during risk-on periods, or when investors perceive that broader market risks are low and are optimistic about growth. This tends to lead to a more favorable outlook for commodities and so-called ‘commodity currencies’ such as the Kiwi. Conversely, NZD tends to weaken at times of market turbulence or economic uncertainty as investors tend to sell higher-risk assets and flee to the more-stable safe havens.
- Gold trades within the guard rails of a familiar range around the key $2,500 barrier.
- Traders are weighing up the possibility of the Fed going ahead with a larger-than-usual 50 bps cut to interest rates.
- Such a cut would be bullish for Gold given it is a non-interest paying asset.
Gold (XAU/USD) is exchanging hands at around the $2,500 mark on Tuesday, sticking within its familiar range of the last few weeks as traders assess the outlook for monetary policy and the future path of interest rates in the US, a key performance indicator for Gold.
Recent mixed US jobs’ data brought into doubt market expectations of the Federal Reserve (Fed) making an above-standard 0.50% (50 bps) cut to its fed funds rate at the September 18 meeting. This, in turn, had a negative impact on Gold, which tends to appreciate the more interest rates fall because that increases its attractiveness to investors as a non-interest paying asset.
Gold: Focus on US inflation and geopolitics
Gold rose then fell after the Nonfarm Payrolls report on Friday, as although the headline figure showed the US economy added fewer jobs than expected in August, the Unemployment Rate fell to 4.2% from 4.3% as anticipated, and wage growth increased above forecasts.
Taken as a whole, the report indicated that the labor market was not in as bad shape as first thought and that wage inflation was rising. As a result, market-based probabilities of the Fed cutting interest rates by 0.50% actually fell from around 40% to around 30%.
After an initial spike, Gold quickly rolled over and ended the week back down at around the $2,500 mark before inching slightly lower into the $2,490s on Monday. On Tuesday, Gold has edged back just above $2,500.
Investors now await US Consumer Price Index (CPI) and Producer Price Index (PPI) data for August, which will be out on Wednesday and Thursday, respectively, for more intel on the outlook for interest rates. Although analysts are mixed as to how much of an impact inflation data will now have on policy expectations, some, such as Deutsche Bank’s Head of Macro Research, Jim Reid, play down the importance of inflation compared to employment data.
“Wednesday's US CPI and Thursday's PPI will probably help move that debate on, but it seems employment is more important at the moment and Friday's mixed employment report had arguments for both sides, so the swing factor is probably how the committee view labor markets rather than inflation,” said Reid in his “Early Morning Reid” macro note.
On the geopolitical risk front, the war in Gaza escalates after the Israelis bombed a displaced civilian camp in southern Gaza, killing 33 people in a single day, according to Al Jazeera News. US efforts at brokering a ceasefire deal now seem even less likely to succeed than a few days ago.
Meanwhile, in the other geopolitical hotspot of Ukraine, Russian forces continue to close in on the key logistics hub city of Pokrovsk despite gains by Ukraine in Russia’s Kursk region.
Overall, the heightening tensions are probably supporting Gold, given its safe-haven status.
Technical Analysis: In the middle of the range, holding at around $2,500
Gold (XAU/USD) continues trading in a sideways range between the all-time highs of $2,531 and a floor at around the $2,475 level. It is currently exchanging hands more or less in the middle of that range.
XAU/USD 4-hour Chart
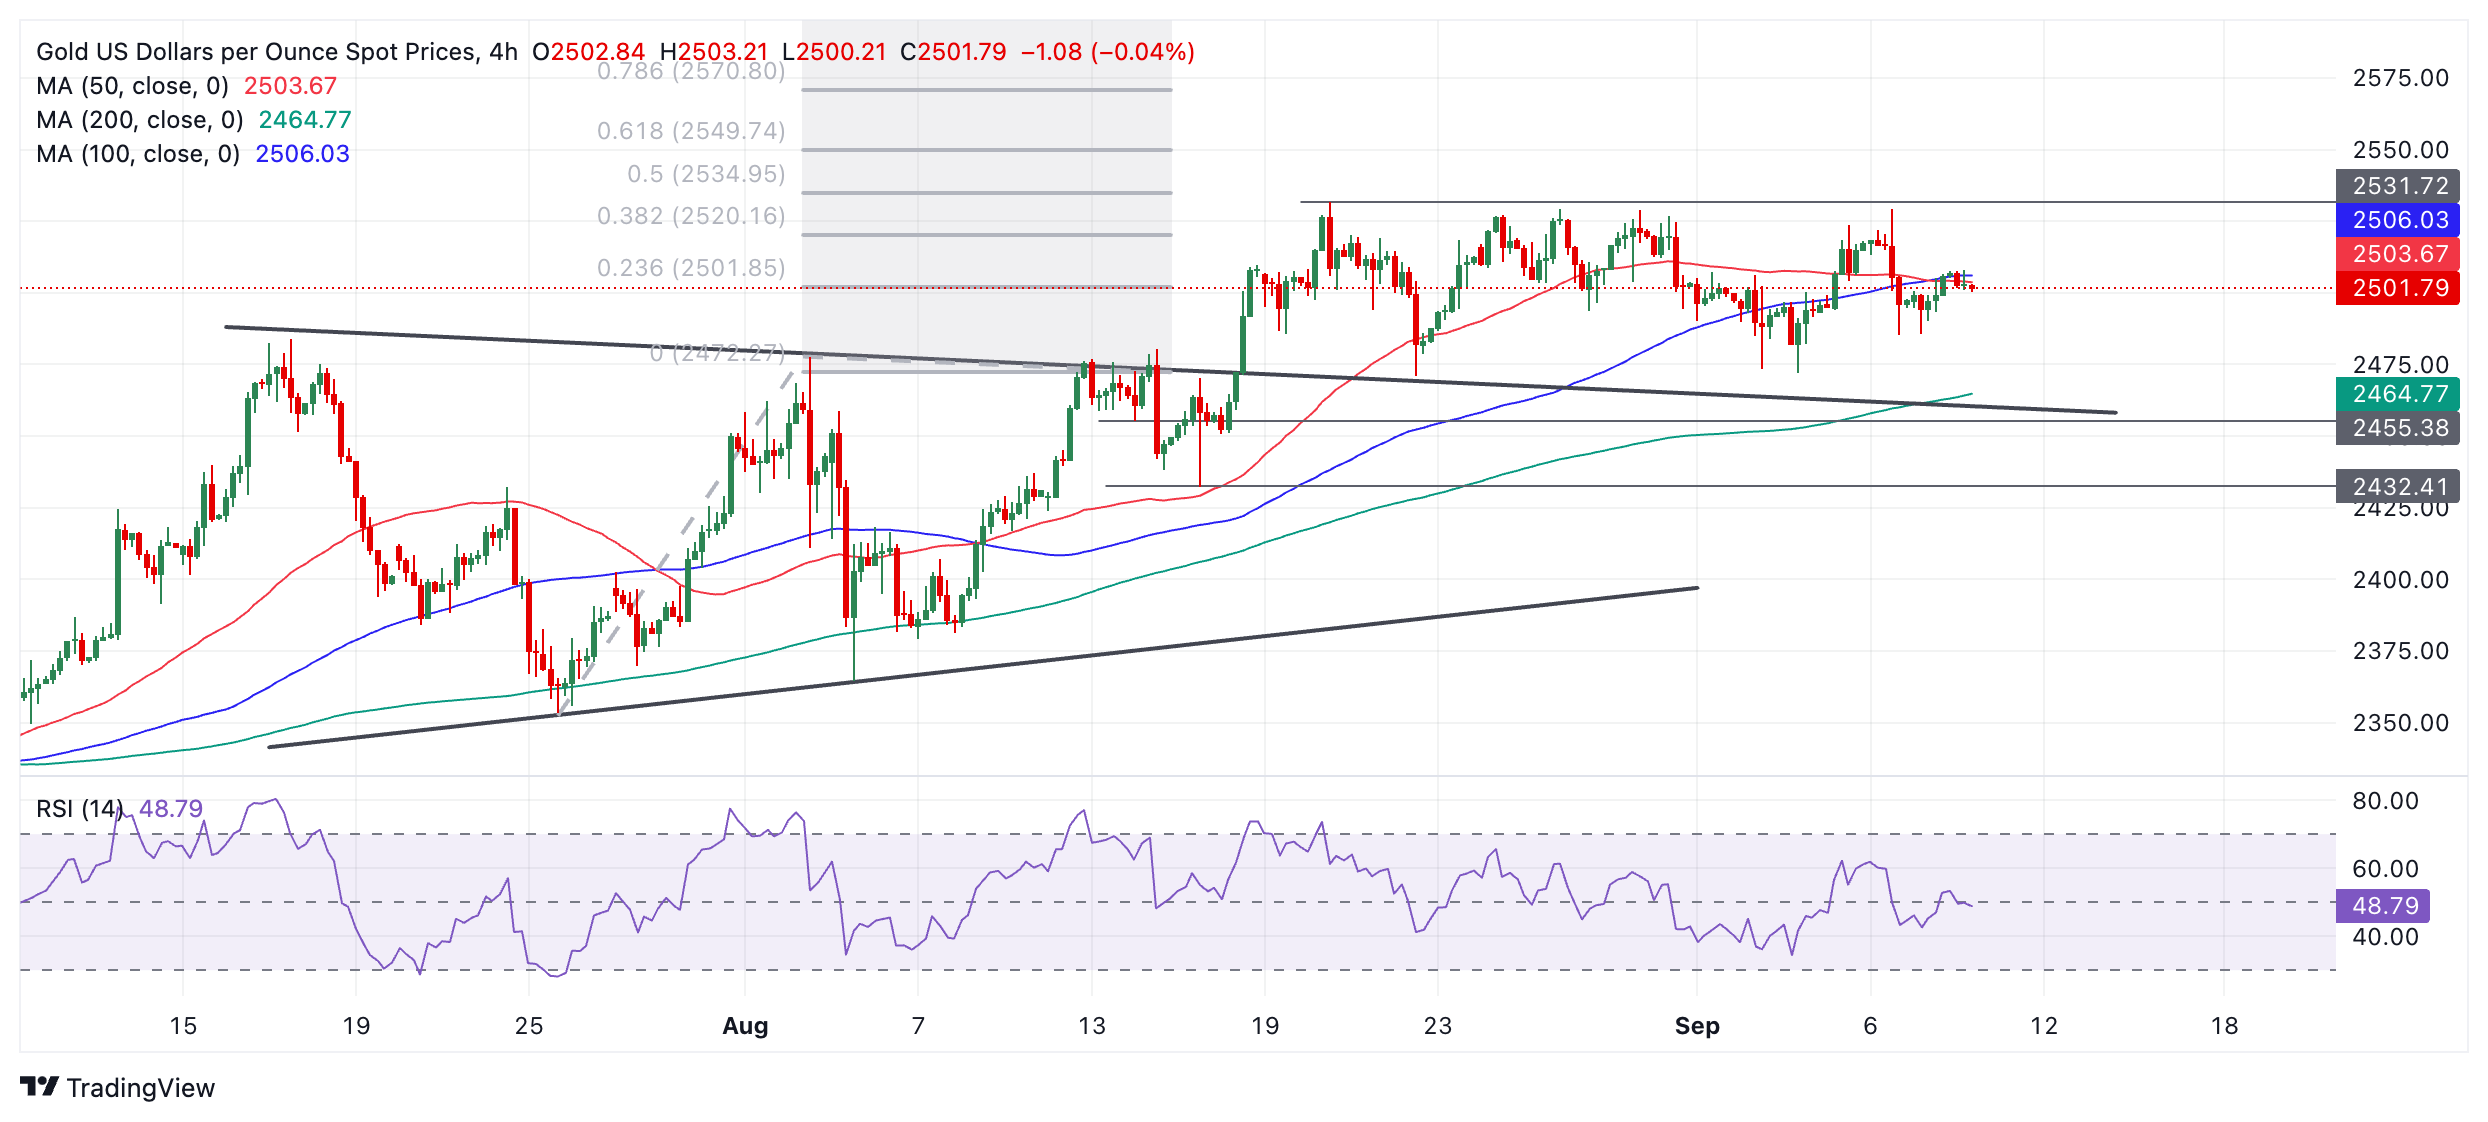
The yellow metal will probably continue trading up and down within this range until it breaks decisively out of one side or another.
A decisive break would be one accompanied by a long green or red candle that broke clearly through the top or bottom of the range and then closed near its highs or lows, or three candles in a row of the same color that pierced through the level.
Gold’s longer-term trend is bullish, however, slightly enhancing the odds of an upside breakout. Gold has an as-yet unreached bullish target at $2,550, generated after the original breakout from the July-August range on August 14. It will probably finally reach its goal in the end, assuming the uptrend survives.
A break above the August 20 all-time high of $2,531 would provide more confirmation of a continuation higher toward the $2,550 target.
If Gold continues steadily weakening, however, a decisive break below the range floor and a close below $2,460 would change the picture and suggest that the commodity might be starting a more pronounced downtrend.
Economic Indicator
Consumer Price Index (YoY)
Inflationary or deflationary tendencies are measured by periodically summing the prices of a basket of representative goods and services and presenting the data as The Consumer Price Index (CPI). CPI data is compiled on a monthly basis and released by the US Department of Labor Statistics. The YoY reading compares the prices of goods in the reference month to the same month a year earlier.The CPI is a key indicator to measure inflation and changes in purchasing trends. Generally speaking, a high reading is seen as bullish for the US Dollar (USD), while a low reading is seen as bearish.
Read more.Next release: Wed Sep 11, 2024 12:30
Frequency: Monthly
Consensus: 2.6%
Previous: 2.9%
Source: US Bureau of Labor Statistics
The US Federal Reserve has a dual mandate of maintaining price stability and maximum employment. According to such mandate, inflation should be at around 2% YoY and has become the weakest pillar of the central bank’s directive ever since the world suffered a pandemic, which extends to these days. Price pressures keep rising amid supply-chain issues and bottlenecks, with the Consumer Price Index (CPI) hanging at multi-decade highs. The Fed has already taken measures to tame inflation and is expected to maintain an aggressive stance in the foreseeable future.
- EUR/JPY gains positive traction for the second straight day, albeit the upside seems limited.
- The divergent ECB-BoJ policy expectations might keep a lid on any further appreciating move.
- Traders might also prefer to move to the sidelines ahead of the ECB meeting on Thursday.
The EUR/JPY cross attracts some buyers for the second straight day on Tuesday and steadily climbs back to the mid-158.00s during the first half of the European session. The fundamental backdrop, however, warrants some before confirming that spot prices have formed a near-term bottom and positioning for any meaningful recovery from a one-month low touched on Monday.
Data published on Monday showed that Japan's economy grew at a slightly slower pace than initially reported in the second quarter. This, along with a stable performance around the equity markets, is seen undermining the Japanese Yen (JPY) and lending some support to the EUR/JPY cross higher. That said, the divergent European Central Bank (ECB)-Bank of Japan (BoJ) policy expectations might hold back traders from placing aggressive bullish bets and cap the upside.
The ECB is almost certain to lower interest rates again at its September policy meeting this Thursday in the wake of declining inflation in the Eurozone, which dropped to the lowest level in over three years in August. In contrast, the markets have been pricing in the possibility of another BoJ interest rate hike by the end of this year. This makes it prudent to wait for strong follow-through buying before confirming that the EUR/JPY cross has bottomed out and positioning for further gains.
Traders might also prefer to wait for the ECB's newest batch of economic forecasts, which will play a key role in influencing the Euro price dynamics in the near term and provide a fresh directional impetus to the EUR/JPY cross. Nevertheless, the aforementioned fundamental backdrop seems tilted in favor of bearish traders, suggesting that any subsequent move up might still be seen as a selling opportunity and runs the risk of fizzling out rather quickly.
Economic Indicator
ECB Monetary Policy Statement
At each of the European Central Bank’s (ECB) eight governing council meetings, the ECB releases a short statement explaining its monetary policy decision, in light of its goal of meeting its inflation target. The statement may influence the volatility of the Euro (EUR) and determine a short-term positive or negative trend. A hawkish view is considered bullish for EUR, whereas a dovish view is considered bearish.
Read more.Next release: Thu Sep 12, 2024 12:15
Frequency: Irregular
Consensus: -
Previous: -
Source: European Central Bank
The Pound Sterling (GBP) is expected to continue weaken, potentially to 1.3035. The major support at 1.3000 is unlikely to come under threat, UOB Group FX strategists Quek Ser Leang and Peter Chia note.
Falling below 1.3035 may target 1.3000
24-HOUR VIEW: “When GBP was at 1.3130 yesterday, we noted that ‘there has been a slight increase in downward momentum.’ We were of the view that GBP could dip below 1.3100 but we indicated that ‘any decline is not expected to reach 1.3060.’ While our view of a lower GBP was correct, it fell more than expected to 1.3068. Not unexpectedly, the decline has led to an increase in momentum, and today, we continue to expect GBP to weaken, potentially to 1.3035. The major support at 1.3000 is unlikely to come under threat. To keep the momentum going, GBP must remain below 1.3115 with minor resistance at 1.3090.”
1-3 WEEKS VIEW: “Yesterday (09 Sep, spot at 1.3130), we noted that ‘the recent price action has resulted in a modest increase in downward momentum.’ We highlighted that ‘as long as 1.3250 is not breached, we expect GBP to drift lower, possibly reaching 1.3050.’ We added, ‘the likelihood of GBP breaking clearly below this level seems low for now.’ We did not expect GBP to drop as much and as quickly as it fell to a low of 1.3068 in NY trade. From here, we continue to expect GBP to weaken. The next level to watch is 1.3000. We will hold the same view provided that 1.3140 (‘strong resistance’ level was at 1.3250 yesterday) is not breached.”
- EUR/GBP remains subdued following the inflation data release from Germany.
- German Harmonized Index of Consumer Prices maintained a 2.0% YoY increase in August, as expected.
- The ILO UK Unemployment Rate eased to 4.1% in the three months leading up to July, down from 4.2% in June.
EUR/GBP depreciates for the second successive session, trading around 0.8440 during Tuesday’s European hours. The Euro faces challenges against the Pound Sterling (GBP) following the inflation data from Germany.
Germany's Harmonized Index of Consumer Prices (HICP) maintained a 2.0% year-on-year increase in August, in line with expectations. The monthly index showed a steady decline of 0.2%, also as forecasted. Similarly, the Consumer Price Index (CPI) remained stable at 1.9% year-on-year in August, meeting market expectations.
The recent headline inflation from the Eurozone remains near 2%, coupled with mixed Gross Domestic Product (GDP) data has reinforced expectations of a potential rate cut by the European Central Bank (ECB) at upcoming Thursday's policy meeting.
The Pound Sterling receives support from the mixed employment data from the United Kingdom (UK). ILO Unemployment Rate eased to 4.1% in the three months to July, following June’s 4.2% print, the data published by the Office for National Statistics (ONS).
UK Claimant Count Change showed that the change in the number of unemployed people fell to 23.7K in August, falling short of the market expectations of 95.5K and the previous 102.3K readings. Average Earnings Including Bonus (3Mo/Yr) came in at 4.0% in July, against the expected 4.1% and prior 4.6% readings.
Bank of England (BoE) policymakers remain concerned about persistent inflation, particularly within the services sector. A slowdown in wage growth would ease these concerns and likely increase market speculation about potential interest rate cuts by the BoE in September. The focus now turns to UK GDP numbers due on Wednesday.
Inflation FAQs
Inflation measures the rise in the price of a representative basket of goods and services. Headline inflation is usually expressed as a percentage change on a month-on-month (MoM) and year-on-year (YoY) basis. Core inflation excludes more volatile elements such as food and fuel which can fluctuate because of geopolitical and seasonal factors. Core inflation is the figure economists focus on and is the level targeted by central banks, which are mandated to keep inflation at a manageable level, usually around 2%.
The Consumer Price Index (CPI) measures the change in prices of a basket of goods and services over a period of time. It is usually expressed as a percentage change on a month-on-month (MoM) and year-on-year (YoY) basis. Core CPI is the figure targeted by central banks as it excludes volatile food and fuel inputs. When Core CPI rises above 2% it usually results in higher interest rates and vice versa when it falls below 2%. Since higher interest rates are positive for a currency, higher inflation usually results in a stronger currency. The opposite is true when inflation falls.
Although it may seem counter-intuitive, high inflation in a country pushes up the value of its currency and vice versa for lower inflation. This is because the central bank will normally raise interest rates to combat the higher inflation, which attract more global capital inflows from investors looking for a lucrative place to park their money.
Formerly, Gold was the asset investors turned to in times of high inflation because it preserved its value, and whilst investors will often still buy Gold for its safe-haven properties in times of extreme market turmoil, this is not the case most of the time. This is because when inflation is high, central banks will put up interest rates to combat it. Higher interest rates are negative for Gold because they increase the opportunity-cost of holding Gold vis-a-vis an interest-bearing asset or placing the money in a cash deposit account. On the flipside, lower inflation tends to be positive for Gold as it brings interest rates down, making the bright metal a more viable investment alternative.
FX markets are marking out ranges as they wait for fresh inputs. Overnight we saw some better Chinese trade data, where exports surprised on the upside and imports disappointed as expected. While the large trade surplus might be good for the GDP figure, the fact that China's demand remains weak remains a problem for the rest of the world. Indeed, industrial metals remain under pressure and it looks like OPEC+ might be running out of ideas when it comes to stabilizing oil prices, ING’s Chris Turner notes.
Quiet day of FX trading ahead of the debate
“The US calendar is light today – just the NFIB small business optimism number and US data released late yesterday saw some exceptionally strong consumer credit readings for July. The credit readings serve as a reminder that, so far, the US consumer is alive and well and that the Fed may not have the data it needs to ‘front-load’ the easing cycle with a 50bp rate cut later this month.”
“Moving on to the main event for FX markets, tomorrow morning at 0300CET, 2100ET sees a 90-minute presidential debate between Harris and Trump. As more of the unknown entity, Kamala Harris arguably has more to prove to the US electorate. Currently, opinion polls across the nation, especially in swing states, have the pair neck-and-neck.”
“Should a clear winner emerge from the debate, expect the FX market to start ‘front-loading’ positions it would have taken after the election result in November. To that end, our Election Guide for FX Markets published yesterday should help determine which currencies outperform and underperform. Expect a quiet day of FX trading ahead of the debate.”
The Euro (EUR) could break 1.1025; the next support at 1.0995 could be out of reach for now. In the longer run, if EUR breaks below 1.1025, it could decline further to 1.0995, UOB Group FX strategists Quek Ser Leang and Peter Chia note.
Below 1.1025 EUR may test 1.0995
24-HOUR VIEW: “Last Friday, EUR traded choppily. Yesterday, we indicated that ‘despite the choppy price movements, the underlying tone seems to have softened somewhat.’ We expected EUR to ‘edge lower, possibly testing the 1.1055 level.’ However, we pointed out that ‘last week’s low of 1.1025 is unlikely to come into view.’ Our expectations were not wrong, even though EUR fell more than expected, reaching a low of 1.1033. Given that downward momentum has increased further, EUR is likely to break 1.1025 today. The next support at 1.0995 could be out of reach for now. Resistance levels are at 1.1055 and 1.1075.”
1-3 WEEKS VIEW: “The following is from our update yesterday (09 Sep, spot at 1.1085): EUR seems to be under mild downward pressure, and there is room for it to retest last week’s low of 1.1025. At this time, the chance of a sustained break below this level is not high. The mild downward pressure is intact provided that 1.1160 is not breached. EUR subsequently fell to a low of 1.1033, closing on a soft note at 1.1034 (-0.44%). The price action has resulted in a further increase in downward pressure. From here, if EUR breaks below 1.1025, it could decline further to 1.0995. On the upside, the ‘strong resistance’ level has moved lower to 1.1105 from 1.1160.”
- EUR/USD remains below 1.1050 as investors turn cautious ahead of the US inflation for August and the ECB policy announcement.
- The ECB is expected to cut its key borrowing rates by 25 basis points (bps).
- US inflation data will influence market speculation for the Fed’s potential interest rate cut size.
EUR/USD struggles to gain ground near its weekly low of 1.1030 in Tuesday’s European session. The major currency pair remains under pressure as investors turn cautious ahead of the United States (US) Consumer Price Index (CPI) data for August and the European Central Bank’s interest rate policy, which will be published on Wednesday and announced on Thursday, respectively.
Investors will keenly focus on the US consumer inflation data as it is just a week before the Federal Reserve’s (Fed) monetary policy meeting. The inflation data will provide fresh cues about whether the Fed will start its policy-easing process gradually or aggressively. The importance of the inflation data in getting more insights about the magnitude of the Fed interest rate cut has increased significantly as the US Nonfarm Payrolls (NFP) data for August failed to make a clear case for the Fed’s likely interest rate cut size.
Earlier, market participants remained worried that the Fed could opt for a large interest rate cut in September due to a sharp slowdown in the US job growth, indicated by the US NFP report for July, which prompted fears for the economy entering a recession. However, Friday’s NFP report showed that the labor market health is not as bad as it appeared last month.
Economists expect the annual headline CPI to have grown at a slower pace of 2.6%, the lowest since March 2021, from July’s reading of 2.9%. The core inflation – which excludes volatile food and energy prices – is expected to have risen steadily by 3.2%. Both monthly headline and core inflation are projected to have increased by 0.2%.
Later this week, investors will focus on the US Producer Price Index (PPI) data for August, which will be published on Thursday.
Daily digest market movers: EUR/USD trades with caution as ECB policy takes centre stage
- EUR/USD trades cautiously as the Euro (EUR) exhibits a subdued performance, with investors focusing on the ECB’s interest rate policy. The ECB is widely anticipated to cut interest rates by 25 basis points (bps) on Thursday. This will be the second interest rate cut decision by the ECB in its current policy-easing cycle, which the bank started in June but left borrowing rates unchanged in July.
- Though investors seem confident about the ECB resuming its policy-easing process, market participants will majorly focus on the monetary policy statement and ECB President Christine Lagarde’s press conference to get cues about the likely policy action for the remainder of the year.
- Lagarde is expected to deliver a dovish interest rate guidance as the annual Harmonized Index of Consumer Prices (HICP) of the Eurozone’s largest nation, Germany, has returned to the bank’s target of 2% in August. Also, German economic growth is vulnerable due to the poor demand environment. The scenario of declining inflation and worsening economic conditions paves the way for an expansionary monetary policy stance.
- Currently, financial market participants expect that the ECB will cut interest rates one more time in the last quarter of this year.
Technical Analysis: EUR/USD trades below 1.1050
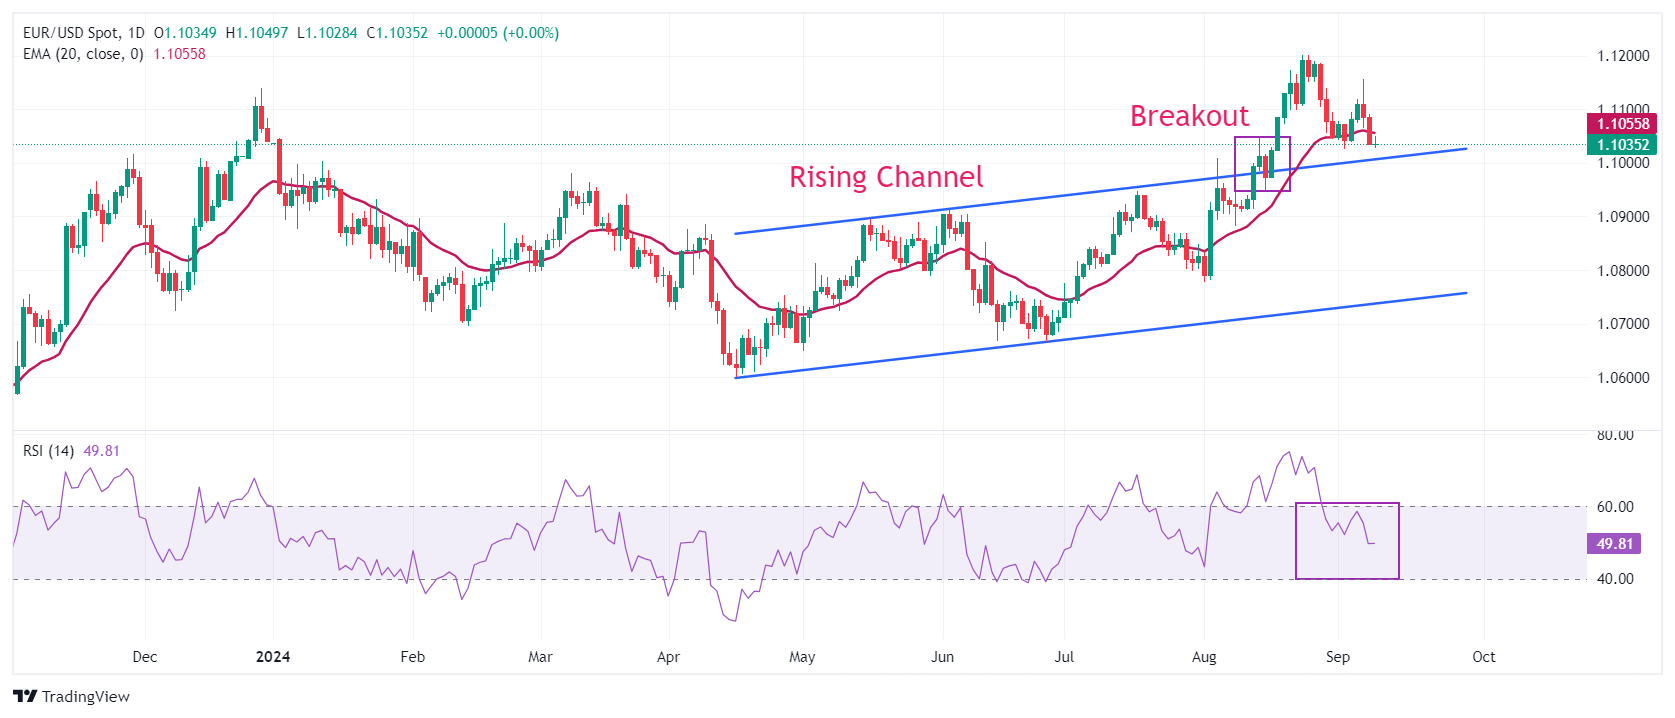
EUR/USD steadies below 1.1050 in Tuesday’s European trading hours. The major currency pair has come under pressure after failing to sustain above the crucial resistance of 1.1100. The near-term outlook of the shared currency pair is uncertain as it continues to trade below the 20-day Exponential Moving Average (EMA), which trades around 1.1060.
The 14-day Relative Strength Index (RSI) falls further to 50.00, suggesting a lack of momentum and a sideways trend.
The pair is expected to find support near the psychological level of 1.1000. On the upside, last week’s high of 1.1155 and the round-level resistance of 1.1200 will act as major barricades for the Euro bulls.
Euro FAQs
The Euro is the currency for the 20 European Union countries that belong to the Eurozone. It is the second most heavily traded currency in the world behind the US Dollar. In 2022, it accounted for 31% of all foreign exchange transactions, with an average daily turnover of over $2.2 trillion a day. EUR/USD is the most heavily traded currency pair in the world, accounting for an estimated 30% off all transactions, followed by EUR/JPY (4%), EUR/GBP (3%) and EUR/AUD (2%).
The European Central Bank (ECB) in Frankfurt, Germany, is the reserve bank for the Eurozone. The ECB sets interest rates and manages monetary policy. The ECB’s primary mandate is to maintain price stability, which means either controlling inflation or stimulating growth. Its primary tool is the raising or lowering of interest rates. Relatively high interest rates – or the expectation of higher rates – will usually benefit the Euro and vice versa. The ECB Governing Council makes monetary policy decisions at meetings held eight times a year. Decisions are made by heads of the Eurozone national banks and six permanent members, including the President of the ECB, Christine Lagarde.
Eurozone inflation data, measured by the Harmonized Index of Consumer Prices (HICP), is an important econometric for the Euro. If inflation rises more than expected, especially if above the ECB’s 2% target, it obliges the ECB to raise interest rates to bring it back under control. Relatively high interest rates compared to its counterparts will usually benefit the Euro, as it makes the region more attractive as a place for global investors to park their money.
Data releases gauge the health of the economy and can impact on the Euro. Indicators such as GDP, Manufacturing and Services PMIs, employment, and consumer sentiment surveys can all influence the direction of the single currency. A strong economy is good for the Euro. Not only does it attract more foreign investment but it may encourage the ECB to put up interest rates, which will directly strengthen the Euro. Otherwise, if economic data is weak, the Euro is likely to fall. Economic data for the four largest economies in the euro area (Germany, France, Italy and Spain) are especially significant, as they account for 75% of the Eurozone’s economy.
Another significant data release for the Euro is the Trade Balance. This indicator measures the difference between what a country earns from its exports and what it spends on imports over a given period. If a country produces highly sought after exports then its currency will gain in value purely from the extra demand created from foreign buyers seeking to purchase these goods. Therefore, a positive net Trade Balance strengthens a currency and vice versa for a negative balance.
- The Mexican Peso is edging lower amid investor concerns the government will pass through a controversial judicial reform bill.
- Rumors an opposition senator has crossed the floor and will vote with the government are weighing.
- USD/MXN continues rising in a bullish channel.
The Mexican Peso (MXN) trades marginally lower on Tuesday, maintaining the steady bear trend established in its key pairs since April. The Peso is weakening amid investor concerns the government will successfully vote through a controversial judicial reform bill in the country’s upper house, the Senate.
MXN is also facing pressure following the release of lower inflation data for August, which increases the chances the Bank of Mexico (Banxico) will cut interest rates at its next meeting. This would be negative for the Peso as lower interest rates reduce foreign capital inflows.
On the upside, the Peso could be finding support from long-term geopolitical shifts amid deeper global trade fragmentation, after former President Donald Trump threatened to impose tariffs on countries who refuse to trade in the US Dollar (USD) if he is elected as President. Such a move, however, could place Mexico in a strong position as an intermediary.
Over recent days, Trump has recovered after lagging in opinion polls ahead of a key televised presidential debate with rival US Vice President Kamala Harris, scheduled for Tuesday.
Mexican Peso faces heat on rumors opposition senator could dissent
The Mexican Peso is under pressure as the Mexican government gets closer to voting through a bill of reforms to the judiciary that will allow judges to be elected rather than appointed. Most investors view these reforms as potentially negative for inbound investment and the economy.
The bill is now being debated in the Senate, where the government is one seat short of the majority necessary to vote it through. However, rumors that a member of the (PAN) opposition party, Miguel Angel Yunes, is considering crossing the floor to vote alongside the government suggest there is a good chance the reforms will pass, according to El Financiero. Lawmakers will vote on the bill either on Tuesday or Wednesday. The result is likely to impact the Mexican Peso.
Several big-name investors have come out against the reforms, including US investment banking giant Morgan Stanley. More recently, Julius Baer warned that rating agencies could change Mexico’s creditworthiness as soon as next year if the judicial reform is approved. Erini Tsekeridou, a fixed-income analyst, said, “although the economic impact is not yet fully clear, markets are concerned about the potential weakening of the rule of law and the concentration of judicial and executive power, which would reduce oversight and accountability,” according to Christian Borjon Valencia, Analyst at FXStreet.
“Julius Baer added their name to Morgan Stanley, Bank of America, JP Morgan, Citibanamex and Fitch ratings warnings of the economic and financial impact regarding the approval of judicial reform,” added Borjon Valencia in his report.
August Mexican inflation data shows price gains cooling more than expected
The Mexican Peso is further weighed after data out on Monday showed 12-month headline inflation in Mexico fell to 4.99% in August from 5.57% in July, according to INEGI. The result was below economists' forecasts of 5.09%.
Core Inflation, meanwhile, fell to 4.00% from 4.05% over the same period.
The data reinforces expectations that Banxico will cut interest rates by 0.25% at its next meeting, bringing the official bank rate down to 10.50%.
“The larger-than-expected fall in Mexico’s headline inflation rate, to 5.0% y/y in August, alongside the likelihood of a Fed rate cut next week, mean that Banxico is on track to lower its policy rate by another 25bp at its meeting later this month,” said Kimberley Sperrfechter, Emerging Markets Economist at Capital Economics.
At the time of writing, one US Dollar (USD) buys 19.90 Mexican Pesos, EUR/MXN trades at 21.97, and GBP/MXN at 26.06.
Technical Analysis: USD/MXN rising in a bullish channel
USD/MXN is trading within the bounds of a gently ascending mini-channel, which itself lies within a broader rising channel that began in April.
USD/MXN Daily Chart
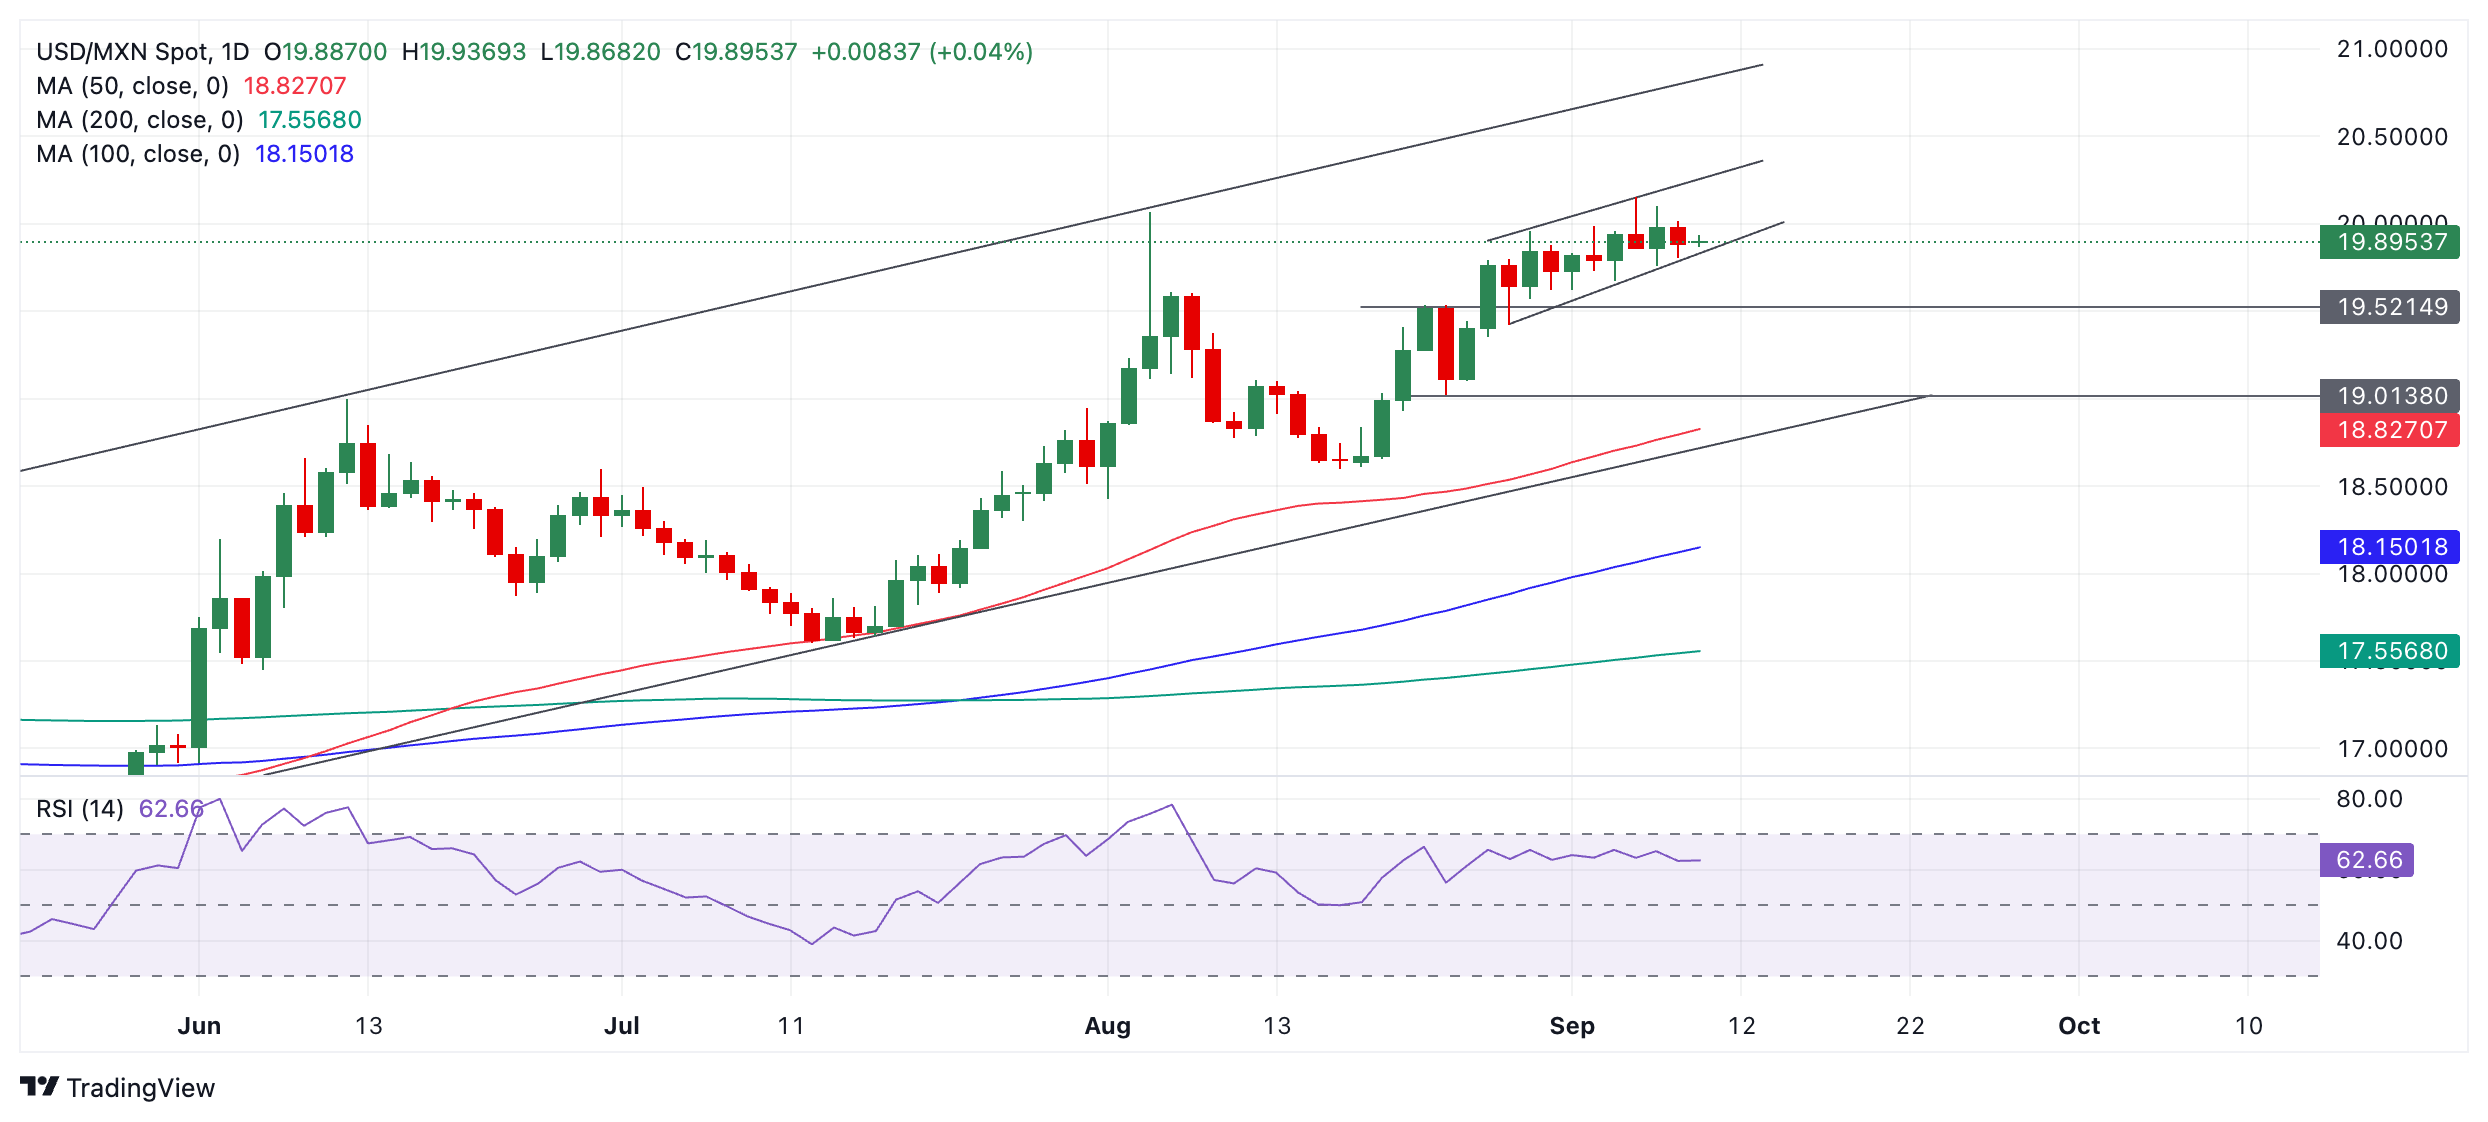
The overall trend is bullish, and since, according to technical analysis theory, “the trend is your friend,” this favors more upside. As such, any weakness may be temporary before the pair rallies again.
A break above the top of the mini-channel and year-to-date high at 20.15 would provide added confirmation of a continuation of the bull trend, with the next target at the upper channel line in the 20.60s.
It would require a decisive breakout below the mini-channel lows to bring into doubt the short-term uptrend bias.
Economic Indicator
12-Month Inflation
The 12-month inflation index released by the Bank of Mexico is a measure of price movements by the comparison between the retail prices of a representative shopping basket of goods and services. The purchase power of Mexican Peso is dragged down by inflation. The inflation index is a key indicator since it is used by the central bank to set interest rates. Generally speaking, a high reading is seen as positive (or bullish) for the Mexican Peso, while a low reading is seen as negative (or Bearish).
Read more.Last release: Mon Sep 09, 2024 12:00
Frequency: Monthly
Actual: 4.99%
Consensus: 5.09%
Previous: 5.57%
Source: National Institute of Statistics and Geography of Mexico
- USD/CHF loses ground as market caution emerges due to looming US CPI data.
- The improved US Treasury yields provide support to limit the downside of the US Dollar.
- The latest Swiss Foreign Currency Reserves indicates continuing intervention by the Swiss National Bank to support the Swiss Franc.
USD/CHF inches lower to near 0.8480 during the European hours on Tuesday. This downside could be attributed to the US Dollar (USD) paring its intraday gains, possibly driven by improved risk sentiment. However, the improved US Treasury yields provide support to limit the downside of the Greenback.
The US Dollar Index (DXY), which measures the value of the US Dollar against six other major currencies, holds minor gains for the third successive day, trading around 101.70 with 2-year and 10-year yields on US Treasury bonds standing at 3.69% and 3.72%, respectively, at the time of writing.
Additionally, the US Dollar received support as the recent US labor market report raised uncertainty over the likelihood of an aggressive interest rate cut by the Federal Reserve (Fed) at its September meeting.
According to the CME FedWatch Tool, markets are fully anticipating at least a 25 basis point (bps) rate cut by the Federal Reserve at its September meeting. The likelihood of a 50 bps rate cut has slightly decreased to 29.0%, down from 30.0% a week ago.
In Switzerland, traders are expected to closely monitor any speeches from Swiss National Bank (SNB) members this week, as there are no major economic releases scheduled. Recently, Swiss inflation fell to a five-month low, increasing speculation about the possibility of another rate cut by the SNB in the near future.
Last week, the Swiss National Bank's (SNB) Foreign Currency Reserves fell to CHF 694 billion in August, down from CHF 704 billion in July. This marks the fourth consecutive decline, suggesting continued intervention by the Swiss National Bank (SNB) in currency markets to support the Swiss Franc (CHF).
Swiss Franc FAQs
The Swiss Franc (CHF) is Switzerland’s official currency. It is among the top ten most traded currencies globally, reaching volumes that well exceed the size of the Swiss economy. Its value is determined by the broad market sentiment, the country’s economic health or action taken by the Swiss National Bank (SNB), among other factors. Between 2011 and 2015, the Swiss Franc was pegged to the Euro (EUR). The peg was abruptly removed, resulting in a more than 20% increase in the Franc’s value, causing a turmoil in markets. Even though the peg isn’t in force anymore, CHF fortunes tend to be highly correlated with the Euro ones due to the high dependency of the Swiss economy on the neighboring Eurozone.
The Swiss Franc (CHF) is considered a safe-haven asset, or a currency that investors tend to buy in times of market stress. This is due to the perceived status of Switzerland in the world: a stable economy, a strong export sector, big central bank reserves or a longstanding political stance towards neutrality in global conflicts make the country’s currency a good choice for investors fleeing from risks. Turbulent times are likely to strengthen CHF value against other currencies that are seen as more risky to invest in.
The Swiss National Bank (SNB) meets four times a year – once every quarter, less than other major central banks – to decide on monetary policy. The bank aims for an annual inflation rate of less than 2%. When inflation is above target or forecasted to be above target in the foreseeable future, the bank will attempt to tame price growth by raising its policy rate. Higher interest rates are generally positive for the Swiss Franc (CHF) as they lead to higher yields, making the country a more attractive place for investors. On the contrary, lower interest rates tend to weaken CHF.
Macroeconomic data releases in Switzerland are key to assessing the state of the economy and can impact the Swiss Franc’s (CHF) valuation. The Swiss economy is broadly stable, but any sudden change in economic growth, inflation, current account or the central bank’s currency reserves have the potential to trigger moves in CHF. Generally, high economic growth, low unemployment and high confidence are good for CHF. Conversely, if economic data points to weakening momentum, CHF is likely to depreciate.
As a small and open economy, Switzerland is heavily dependent on the health of the neighboring Eurozone economies. The broader European Union is Switzerland’s main economic partner and a key political ally, so macroeconomic and monetary policy stability in the Eurozone is essential for Switzerland and, thus, for the Swiss Franc (CHF). With such dependency, some models suggest that the correlation between the fortunes of the Euro (EUR) and the CHF is more than 90%, or close to perfect.
- USD/JPY gains positive traction for the second straight day, albeit lacks bullish conviction.
- The formation of a descending channel points to a well-established short-term uptrend.
- A move beyond the 144.00 mark is needed to support prospects for further appreciation.
The USD/JPY pair attracts some buyers for the second straight day on Tuesday and trades around mid-143.00s during the first half of the European session. Spot prices, however, lack bullish conviction and remain below the overnight swing high as traders prefer to wait on the sidelines ahead of the crucial US inflation figures this week.
In the meantime, a downward revision of the second quarter Gross Domestic Product (GDP) print continues to undermine the Japanese Yen (JPY) and acts as a tailwind for the USD/JPY pair amid a modest US Dollar (USD) uptick. That said, the divergent Federal Reserve (Fed)-Bank of Japan (BoJ) policy expectations hold back investors from placing aggressive bullish bets and cap the upside for the currency pair.
From a technical perspective, the recent downfall witnessed over the past four weeks or so has been along a descending channel. This points to a well-established short-term downtrend and supports prospects for the emergence of fresh selling at higher levels. The negative outlook is reinforced by the fact that oscillators on the daily chart are holding deep in negative territory and are still away from being in the oversold zone.
Hence, any subsequent move up might still be seen as a selling opportunity and remain capped near the 144.00 mark. That said, some follow-through buying could trigger a short-covering rally and lift the USD/JPY pair to the next relevant hurdle around the 144.55 region. The momentum could extend further towards reclaiming the 145.00 psychological mark before spot prices climb further toward the 145.60 resistance zone.
On the flip side, the 143.20 area is likely to protect the immediate downside ahead of the 143.00 mark and the Asian session low, around the 142.85 region. Failure to defend the said support levels will reaffirm the negative bias and expose the 142.00 round figure and a seven-month low, around the 141.70-141.65 region touched in August.
USD/JPY 4-hour chart
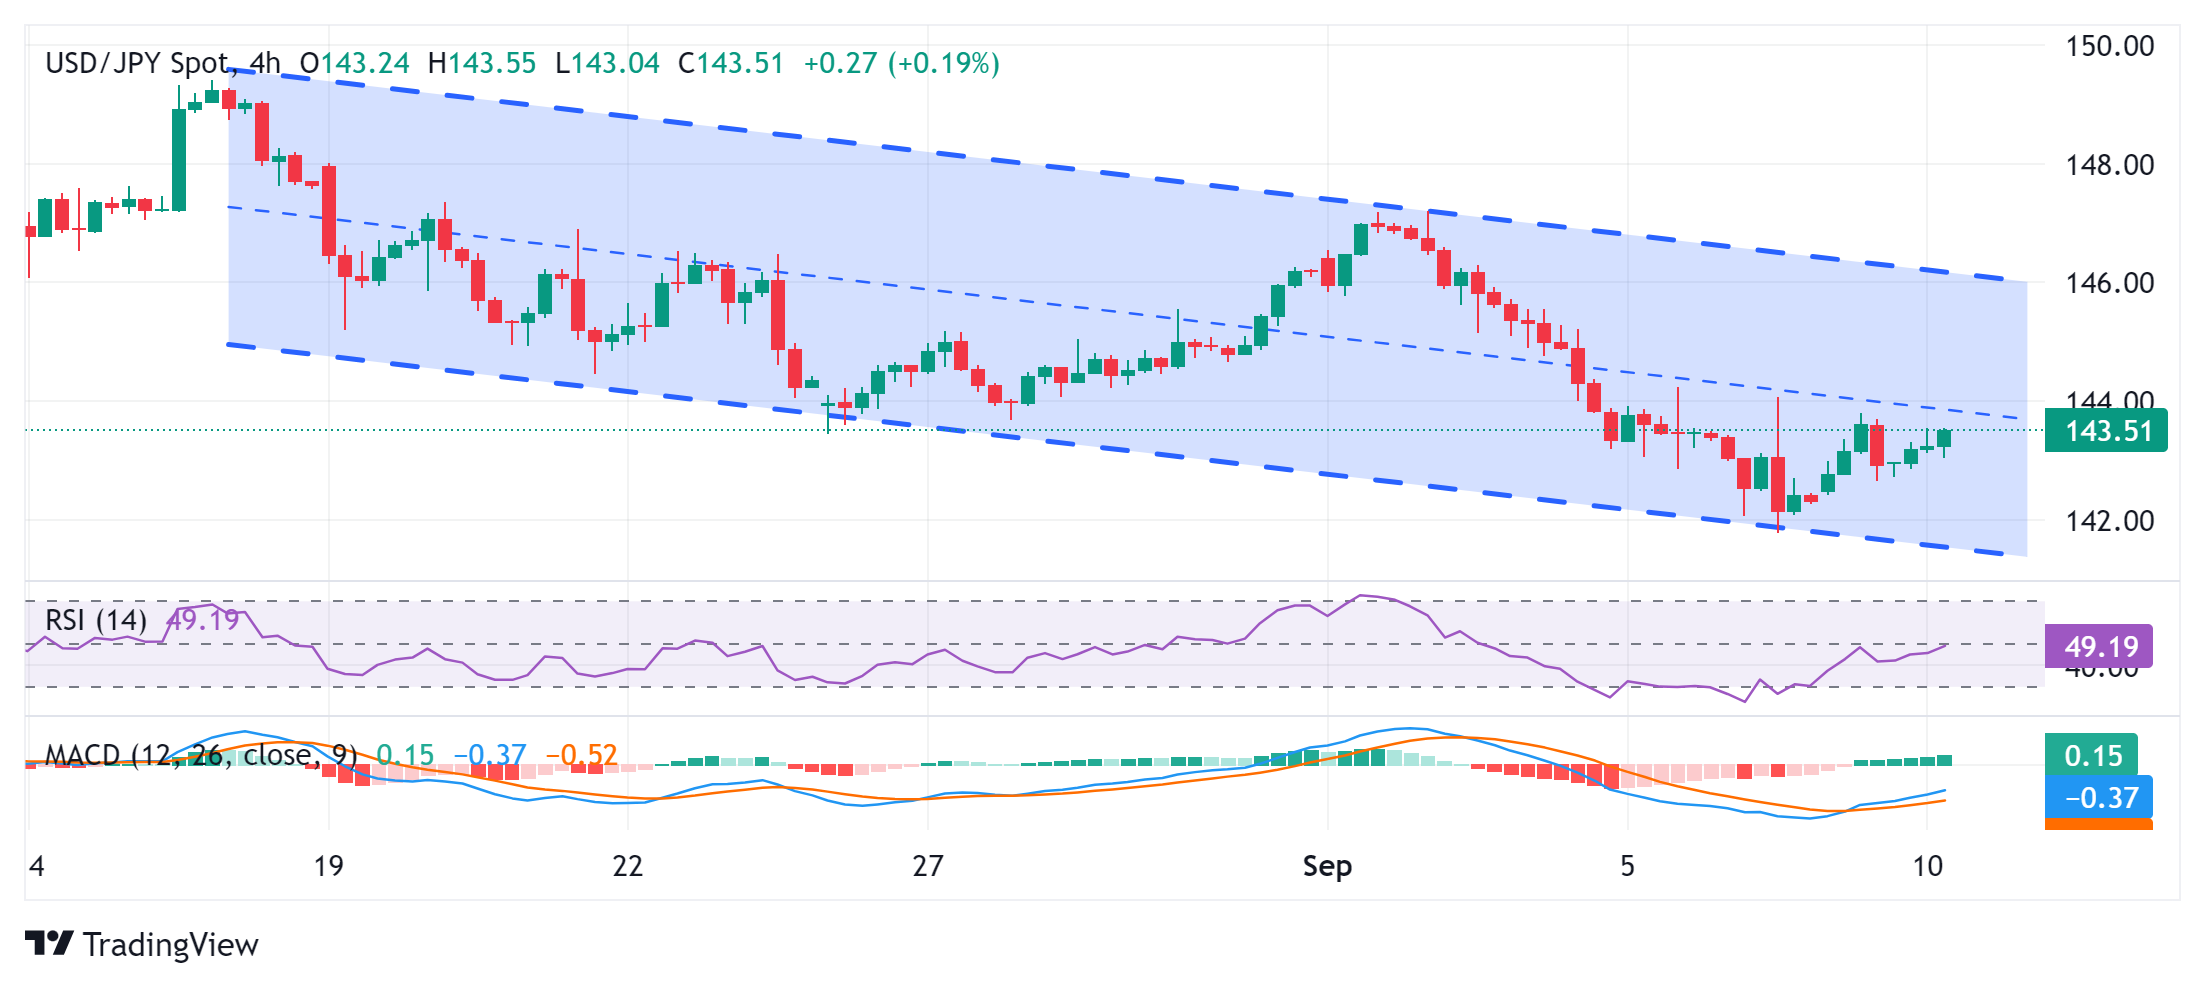
Japanese Yen FAQs
The Japanese Yen (JPY) is one of the world’s most traded currencies. Its value is broadly determined by the performance of the Japanese economy, but more specifically by the Bank of Japan’s policy, the differential between Japanese and US bond yields, or risk sentiment among traders, among other factors.
One of the Bank of Japan’s mandates is currency control, so its moves are key for the Yen. The BoJ has directly intervened in currency markets sometimes, generally to lower the value of the Yen, although it refrains from doing it often due to political concerns of its main trading partners. The current BoJ ultra-loose monetary policy, based on massive stimulus to the economy, has caused the Yen to depreciate against its main currency peers. This process has exacerbated more recently due to an increasing policy divergence between the Bank of Japan and other main central banks, which have opted to increase interest rates sharply to fight decades-high levels of inflation.
The BoJ’s stance of sticking to ultra-loose monetary policy has led to a widening policy divergence with other central banks, particularly with the US Federal Reserve. This supports a widening of the differential between the 10-year US and Japanese bonds, which favors the US Dollar against the Japanese Yen.
The Japanese Yen is often seen as a safe-haven investment. This means that in times of market stress, investors are more likely to put their money in the Japanese currency due to its supposed reliability and stability. Turbulent times are likely to strengthen the Yen’s value against other currencies seen as more risky to invest in.
Here is what you need to know on Tuesday, September 10:
The US Dollar (USD) struggles to preserve its strength early Tuesday after outperforming its major rivals on Monday. The USD Index holds steady above 101.50 following Monday's 0.4% gain, while the benchmark 10-year US Treasury bond yield fluctuates slightly above 3.7%. NFIB Business Optimism Index for August will be the only data featured in the US economic docket ahead of Wednesday's highly-anticipated Consumer Price Index (CPI) readings.
US Dollar PRICE This week
The table below shows the percentage change of US Dollar (USD) against listed major currencies this week. US Dollar was the strongest against the Japanese Yen.
| USD | EUR | GBP | JPY | CAD | AUD | NZD | CHF | |
|---|---|---|---|---|---|---|---|---|
| USD | 0.33% | 0.24% | 0.79% | -0.01% | -0.00% | 0.31% | 0.45% | |
| EUR | -0.33% | -0.15% | 0.52% | -0.33% | -0.38% | -0.01% | 0.10% | |
| GBP | -0.24% | 0.15% | 0.55% | -0.18% | -0.24% | 0.12% | 0.24% | |
| JPY | -0.79% | -0.52% | -0.55% | -0.77% | -0.76% | -0.48% | -0.13% | |
| CAD | 0.00% | 0.33% | 0.18% | 0.77% | 0.04% | 0.30% | 0.61% | |
| AUD | 0.00% | 0.38% | 0.24% | 0.76% | -0.04% | 0.35% | 0.47% | |
| NZD | -0.31% | 0.00% | -0.12% | 0.48% | -0.30% | -0.35% | 0.13% | |
| CHF | -0.45% | -0.10% | -0.24% | 0.13% | -0.61% | -0.47% | -0.13% |
The heat map shows percentage changes of major currencies against each other. The base currency is picked from the left column, while the quote currency is picked from the top row. For example, if you pick the US Dollar from the left column and move along the horizontal line to the Japanese Yen, the percentage change displayed in the box will represent USD (base)/JPY (quote).
The data from China showed in the Asian session that the trade surplus widened to $91.02 billion in August from $84.65 billion. Exports increased by 8.7% on a yearly basis, while Imports grew by 0.5%. AUD/USD largely ignored these figures and the pair was last seen trading modestly higher on the day near 0.6670.
The UK's Office for National Statistics (ONS) reported early Tuesday that the ILO Unemployment Rate edged lower to 4.1% in the three months to July from 4.2%, as expected. The Employment Change came in at 265K in the same period, up from 97K, and the annual wage inflation, as measured by the Average Earnings Excluding Bonus, softened to 5.1% from 5.4%, matching analysts' estimates. GBP/USD recovered toward 1.3100 after these figures from the multi-week low it touched near 1.3050 earlier in the day.
Germany's Destatis confirmed that the CPI rose by 1.9% on a yearly basis in August. This reading matched the initial estimate and the market expectation. After closing the second consecutive trading day in negative territory on Monday, EUR/USD holds steady at around 1.1050 in the European morning on Tuesday.
USD/JPY gained traction and closed in the green on Monday, snapping a four-day losing streak. The pair continues to push higher early Tuesday and was last seen trading near 143.50.
Following a quiet start to the week, Gold gained traction amid retreating US yields in the American session and closed above $2,500 on Monday. XAU/USD trades in a narrow channel in the European morning on Tuesday.
Risk sentiment FAQs
In the world of financial jargon the two widely used terms “risk-on” and “risk off'' refer to the level of risk that investors are willing to stomach during the period referenced. In a “risk-on” market, investors are optimistic about the future and more willing to buy risky assets. In a “risk-off” market investors start to ‘play it safe’ because they are worried about the future, and therefore buy less risky assets that are more certain of bringing a return, even if it is relatively modest.
Typically, during periods of “risk-on”, stock markets will rise, most commodities – except Gold – will also gain in value, since they benefit from a positive growth outlook. The currencies of nations that are heavy commodity exporters strengthen because of increased demand, and Cryptocurrencies rise. In a “risk-off” market, Bonds go up – especially major government Bonds – Gold shines, and safe-haven currencies such as the Japanese Yen, Swiss Franc and US Dollar all benefit.
The Australian Dollar (AUD), the Canadian Dollar (CAD), the New Zealand Dollar (NZD) and minor FX like the Ruble (RUB) and the South African Rand (ZAR), all tend to rise in markets that are “risk-on”. This is because the economies of these currencies are heavily reliant on commodity exports for growth, and commodities tend to rise in price during risk-on periods. This is because investors foresee greater demand for raw materials in the future due to heightened economic activity.
The major currencies that tend to rise during periods of “risk-off” are the US Dollar (USD), the Japanese Yen (JPY) and the Swiss Franc (CHF). The US Dollar, because it is the world’s reserve currency, and because in times of crisis investors buy US government debt, which is seen as safe because the largest economy in the world is unlikely to default. The Yen, from increased demand for Japanese government bonds, because a high proportion are held by domestic investors who are unlikely to dump them – even in a crisis. The Swiss Franc, because strict Swiss banking laws offer investors enhanced capital protection.
- The Pound Sterling adds nominal gains against the US Dollar after the release of mixed UK labor market data.
- An expected decline in the UK wage growth would prompt BoE interest rate cut prospects for this month.
- Investors await the US inflation data for fresh guidance on the Fed interest rate cut path.
The Pound Sterling (GBP) trades slightly higher against its major peers in Tuesday’s London session after the release of the mixed United Kingdom (UK) Employment report for the three months ending in July. The British currency strengthens as the UK Office for National Statistics (ONS) reported a robust labor demand, while the wage growth eased broadly in line with expectations.
The agency reported that the ILO Unemployment Rate expectedly declined to 4.1% from the prior release of 4.2%. UK employers hired 265K new workers, significantly higher than the former release of 97K. Historically, robust job growth boosts hawkish Bank of England (BoE) bets. Still, it is less likely to be in this scenario as Average Earnings data, a wage growth measure that drives inflation in the service sector, has decelerated expectedly.
BoE policymakers have remained worried about persistent inflation due to high inflation in the services sector. A slowdown in the wage growth momentum would relieve them and boost market speculation for BoE interest rate cuts this month.
Average Earnings Excluding Bonuses came in at 5.1%, as expected, lower than the former release of 5.4%. The wage growth data, including bonuses, decelerated faster than expected to 4%, from estimates of 4.1% and the prior reading of 4.6%, upwardly revised from 4.5%.
Daily digest market movers: Pound Sterling gains slightly against US Dollar
- The Pound Sterling edges higher but remains below the crucial resistance of 1.3100 against the US Dollar (USD) in Tuesday’s European session. The GBP/USD pair gains slightly, but its near-term outlook remains uncertain as the US Dollar holds Monday’s gains.
- The US Dollar Index (DXY), which tracks the Greenback’s value against six major currencies, clings to gains near 101.60, with investors focusing on the United States (US) Consumer Price Index (CPI) data for August, which will be published on Wednesday.
- Though the Fed is almost certain to start reducing interest rates this month, the inflation data will influence market speculation for the likely interest rate cut size. According to the CME FedWatch tool, the possibility for the Fed reducing interest rates by 50 basis points (bps) to 4.75%-5.00% in September is 29%, while the rest favors a 25-bps interest rate cut.
- The likelihood of a Fed's large interest rate cut has somewhat declined since the release of the US Nonfarm Payrolls (NFP) data for August on Friday, which indicated that the slowdown in the job growth was not as bad as it appeared in the July data.
- Meanwhile, economists estimate the annual headline US CPI to have decelerated to 2.6%, the lowest since March 2021, from July’s reading of 2.9%. The core inflation – which excludes volatile food and energy prices – is expected to have grown steadily by 3.2%. Both monthly headline and core inflation are projected to have risen 0.2%.
- Softer-than-expected US inflation data would prompt market expectations for the Fed to begin the policy-easing process aggressively. On the contrary, sticky or hot CPI figures would weaken them.
Technical Analysis: Pound Sterling hovers below 1.3100
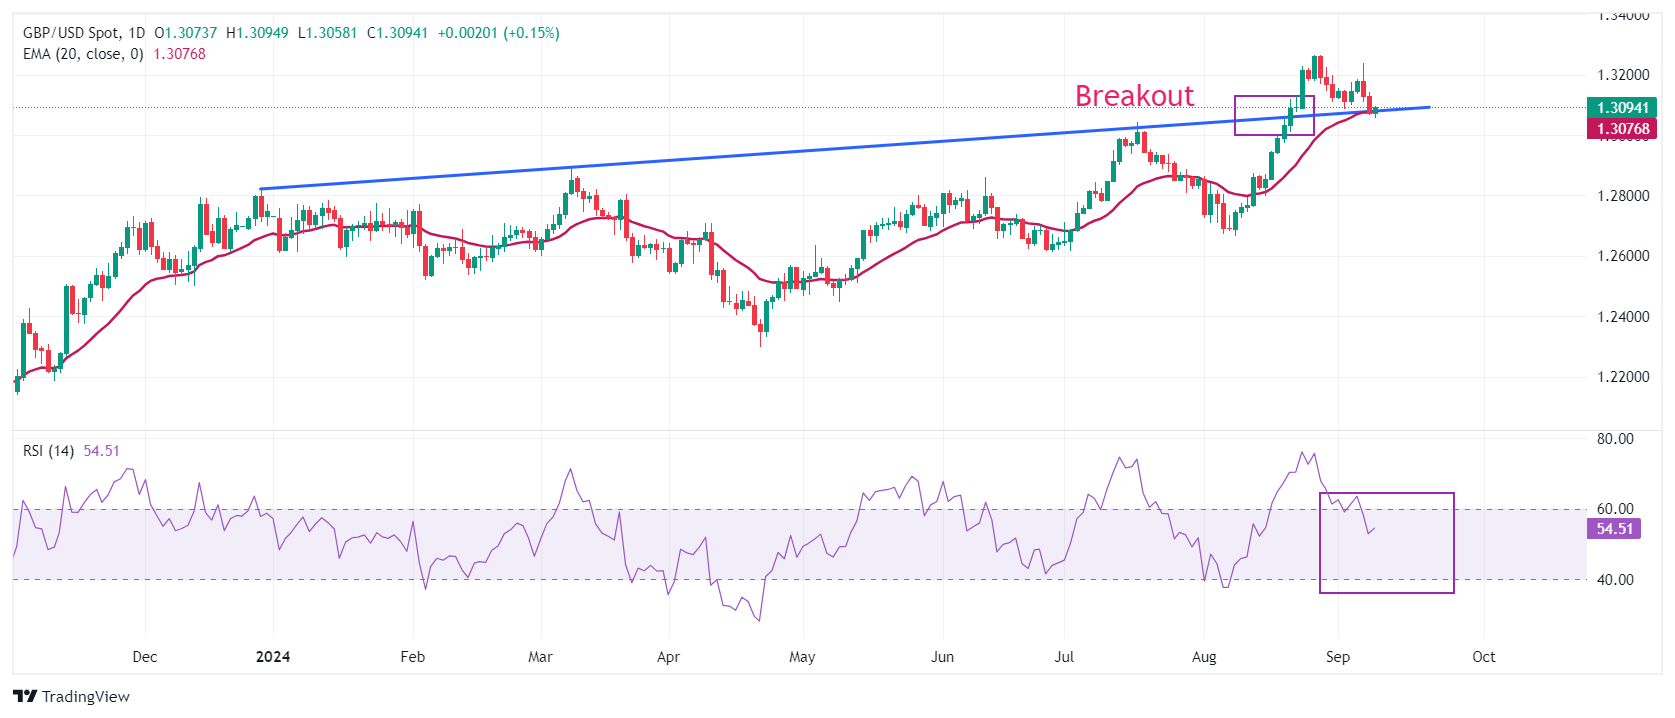
The Pound Sterling trades in a tight range and remains vulnerable near the round-level resistance of 1.3100 against the US Dollar. The GBP/USD pair is at a make or a break as it hovers near the trendline plotted from the December 28, 2023, high of 1.2828. On August 21, the Cable delivered a sharp upside move after a breakout of the trendline mentioned above. The pair has found an intermediate cushion near the 20-day Exponential Moving Average (EMA), which trades around 1.3075.
The 14-day Relative Strength Index (RSI) declines into the 40.00-60.00 range, suggesting that the bullish momentum has concluded for now. However, the bullish trend remains intact.
Looking up, the Cable will face resistance near the round-level resistance of 1.3200 and the psychological level of 1.3500. On the downside, the psychological level of 1.3000 emerges as crucial support for the Pound Sterling bulls.
Pound Sterling FAQs
The Pound Sterling (GBP) is the oldest currency in the world (886 AD) and the official currency of the United Kingdom. It is the fourth most traded unit for foreign exchange (FX) in the world, accounting for 12% of all transactions, averaging $630 billion a day, according to 2022 data. Its key trading pairs are GBP/USD, aka ‘Cable’, which accounts for 11% of FX, GBP/JPY, or the ‘Dragon’ as it is known by traders (3%), and EUR/GBP (2%). The Pound Sterling is issued by the Bank of England (BoE).
The single most important factor influencing the value of the Pound Sterling is monetary policy decided by the Bank of England. The BoE bases its decisions on whether it has achieved its primary goal of “price stability” – a steady inflation rate of around 2%. Its primary tool for achieving this is the adjustment of interest rates. When inflation is too high, the BoE will try to rein it in by raising interest rates, making it more expensive for people and businesses to access credit. This is generally positive for GBP, as higher interest rates make the UK a more attractive place for global investors to park their money. When inflation falls too low it is a sign economic growth is slowing. In this scenario, the BoE will consider lowering interest rates to cheapen credit so businesses will borrow more to invest in growth-generating projects.
Data releases gauge the health of the economy and can impact the value of the Pound Sterling. Indicators such as GDP, Manufacturing and Services PMIs, and employment can all influence the direction of the GBP. A strong economy is good for Sterling. Not only does it attract more foreign investment but it may encourage the BoE to put up interest rates, which will directly strengthen GBP. Otherwise, if economic data is weak, the Pound Sterling is likely to fall.
Another significant data release for the Pound Sterling is the Trade Balance. This indicator measures the difference between what a country earns from its exports and what it spends on imports over a given period. If a country produces highly sought-after exports, its currency will benefit purely from the extra demand created from foreign buyers seeking to purchase these goods. Therefore, a positive net Trade Balance strengthens a currency and vice versa for a negative balance.
- GBP/JPY receives minor support from mixed UK employment figures released on Tuesday.
- ILO UK Unemployment Rate eased to 4.1% in the three months to July, following June’s 4.2% print.
- The Japanese Yen may appreciate as recent economic data continue to bolster expectations of the BoJ increasing rates further.
GBP/JPY maintains its position above 187.00 during the Asian hours on Tuesday. The Pound Sterling (GBP) receives minor support from the mixed employment data from the United Kingdom (UK). ILO Unemployment Rate eased to 4.1% in the three months to July, following June’s 4.2% print, the data published by the Office for National Statistics (ONS).
UK Claimant Count Change showed that the change in the number of unemployed people fell to 23.7K in August, falling short of the market expectations of 95.5K and the previous 102.3K readings. Average Earnings Including Bonus (3Mo/Yr) came in at 4.0% in July, against the expected 4.1% and prior 4.6% readings.
On Monday, the GBP/JPY cross found support as the Japanese Yen (JPY) struggled following weaker-than-expected Gross Domestic Product (GDP) data from Japan. Despite this, strong economic growth, rising wages, and ongoing inflationary pressures continue to bolster expectations that the Bank of Japan (BoJ) may raise interest rates further, which has helped limit the downside for the Yen.
Japan's GDP Annualized expanded by 2.9% in the second quarter, slightly below the preliminary estimate of 3.1% and the market forecast of 3.2%. Nonetheless, this figure represents the strongest yearly growth since Q1 2023. On a quarter-on-quarter basis, GDP grew by 0.7% in Q2, falling short of the market prediction of 0.8%, but still marking the strongest quarterly growth since Q2 2023.
Shigeru Ishiba, the former Japanese defense minister and a candidate in the ruling Liberal Democratic Party's leadership race, stated on Tuesday that achieving a complete exit from deflation is a critical task for Japan, according to Reuters. Ishiba also noted, "I don't think private consumption has recovered strongly yet despite some signs of improvement."
Inflation FAQs
Inflation measures the rise in the price of a representative basket of goods and services. Headline inflation is usually expressed as a percentage change on a month-on-month (MoM) and year-on-year (YoY) basis. Core inflation excludes more volatile elements such as food and fuel which can fluctuate because of geopolitical and seasonal factors. Core inflation is the figure economists focus on and is the level targeted by central banks, which are mandated to keep inflation at a manageable level, usually around 2%.
The Consumer Price Index (CPI) measures the change in prices of a basket of goods and services over a period of time. It is usually expressed as a percentage change on a month-on-month (MoM) and year-on-year (YoY) basis. Core CPI is the figure targeted by central banks as it excludes volatile food and fuel inputs. When Core CPI rises above 2% it usually results in higher interest rates and vice versa when it falls below 2%. Since higher interest rates are positive for a currency, higher inflation usually results in a stronger currency. The opposite is true when inflation falls.
Although it may seem counter-intuitive, high inflation in a country pushes up the value of its currency and vice versa for lower inflation. This is because the central bank will normally raise interest rates to combat the higher inflation, which attract more global capital inflows from investors looking for a lucrative place to park their money.
Formerly, Gold was the asset investors turned to in times of high inflation because it preserved its value, and whilst investors will often still buy Gold for its safe-haven properties in times of extreme market turmoil, this is not the case most of the time. This is because when inflation is high, central banks will put up interest rates to combat it. Higher interest rates are negative for Gold because they increase the opportunity-cost of holding Gold vis-a-vis an interest-bearing asset or placing the money in a cash deposit account. On the flipside, lower inflation tends to be positive for Gold as it brings interest rates down, making the bright metal a more viable investment alternative.
- The UK Unemployment Rate edged lower to 4.1% in three months to July.
- The Claimant Count Change for Britain came in at 23.7K in August.
- GBP/USD picks up fresh bids toward 1.3100 after mixed UK employment data.
The United Kingdom’s (UK) ILO Unemployment Rate eased to 4.1% in the three months to July, following June’s 4.2% print, the data published by the Office for National Statistics (ONS) showed on Tuesday. Markets expected a reading of 4.1% in the reported period.
Additional details of the report showed that the number of people claiming jobless benefits increased by 23.7K in August, compared with a revised gain of 102.3K in July, coming in below the expected 95.5K figure by a wide margin.
The Employment Change data for July arrived at 265K, as against June’s 24K.
Meanwhile, Average Earnings excluding Bonus in the UK climbed 5.1% 3M YoY in July versus a 5.4% growth seen in June. The reading aligned with the expectations of a 5.1% increase.
Another measure of wage inflation, Average Earnings including Bonus also increased by 4.0% in the same period after reporting a 4.6% growth in the quarter through June. The market forecast was for +4.1%.
GBP/USD reaction to the UK employment report
GBP/USD picks up fresh bids in a knee-jerk reaction to the mixed UK employment data. The pair is trading 0.07% higher on the day at 1.3080, as of writing.
British Pound PRICE Today
The table below shows the percentage change of British Pound (GBP) against listed major currencies today. British Pound was the strongest against the Canadian Dollar.
| USD | EUR | GBP | JPY | CAD | AUD | NZD | CHF | |
|---|---|---|---|---|---|---|---|---|
| USD | -0.03% | -0.04% | -0.10% | 0.05% | -0.09% | -0.10% | -0.12% | |
| EUR | 0.03% | -0.00% | 0.02% | 0.08% | -0.06% | -0.12% | -0.09% | |
| GBP | 0.04% | 0.00% | 0.02% | 0.05% | -0.05% | -0.10% | -0.07% | |
| JPY | 0.10% | -0.02% | -0.02% | 0.05% | -0.08% | -0.12% | -0.11% | |
| CAD | -0.05% | -0.08% | -0.05% | -0.05% | -0.15% | -0.16% | -0.17% | |
| AUD | 0.09% | 0.06% | 0.05% | 0.08% | 0.15% | -0.03% | -0.02% | |
| NZD | 0.10% | 0.12% | 0.10% | 0.12% | 0.16% | 0.03% | 0.00% | |
| CHF | 0.12% | 0.09% | 0.07% | 0.11% | 0.17% | 0.02% | -0.01% |
The heat map shows percentage changes of major currencies against each other. The base currency is picked from the left column, while the quote currency is picked from the top row. For example, if you pick the British Pound from the left column and move along the horizontal line to the US Dollar, the percentage change displayed in the box will represent GBP (base)/USD (quote).
FX option expiries for Sept 10 NY cut at 10:00 Eastern Time, via DTCC, can be found below.
EUR/USD: EUR amounts
- 1.0860 1.1b
- 1.0920 1.7b
- 1.0935 849m
- 1.1000 1.9b
- 1.1040 804m
- 1.1050 829m
- 1.1100 1.7b
- 1.1025 2.1b
- 1.1175 974m
- 1.1200 2.1b
USD/JPY: USD amounts
- 143.00 400m
USD/CHF: USD amounts
- 0.8615 421m
- 0.8620 799m
AUD/USD: AUD amounts
- 0.6690 633m
- 0.6595 1.3b
- 0.6800 1.7b
USD/CAD: USD amounts
- 1.3450 720m
- 1.3510 952m
EUR/GBP: EUR amounts
- 0.8470 613m
- EUR/USD ticks higher following an intraday dip to a one-week low, albeit lacks follow-through.
- Reduced bets for a 50 bps Fed rate cut continue to underpin the USD and act as a headwind.
- Dovish ECB expectations further cap gains ahead of the key US data/central bank event risks.
The EUR/USD pair recovers a few pips from a one-week low, around the 1.1030-1.1025 area touched during the Asian session on Tuesday and for now, seems to have snapped a two-day losing streak. Any meaningful appreciating move, however, still seems elusive in the wake of some follow-through US Dollar (USD) buying.
Investors have been scaling back their bets for a larger, 50 basis points (bps) interest rate cut by the Federal Reserve (Fed) in September following the release of mixed US jobs report on Friday. This assists the Greenback in attracting some buyers for the third successive day and climbing back closer to the monthly peak touched last week, which, in turn, is seen acting as a headwind for the EUR/USD pair.
The shared currency's relative underperformance could further be attributed to growing market expectations that the European Central Bank (ECB) will cut interest rates again in September in the wake of declining inflation in the Eurozone. This might further contribute to capping the EUR/USD pair, though the downside is likely to remain cushioned ahead of this week's key data/central bank event risks.
The latest US consumer inflation figures are due for release on Wednesday, followed by the US Producer Price Index (PPI) on Thursday. This will play a key role in influencing market expectations about the size of the Fed rate cut move later this month, which, in turn, will drive the USD demand. Apart from this, the crucial ECB policy decision on Thursday will provide a fresh directional impetus to the EUR/USD pair.
In the absence of any relevant market-moving economic releases on Tuesday, either from the Eurozone or the US, the aforementioned fundamental backdrop warrants caution for bulls. Hence, it will be prudent to wait for strong follow-through buying before confirming that the recent corrective pullback from the 1.1200 round-figure mark, or over a one-year high touched in August has run its course.
Economic Indicator
ECB Main Refinancing Operations Rate
One of the three key interest rates set by the European Central Bank (ECB), the main refinancing operations rate is the interest rate the ECB charges to banks for one-week long loans. It is announced by the European Central Bank at its eight scheduled annual meetings. If the ECB expects inflation to rise, it will increase its interest rates to bring it back down to its 2% target. This tends to be bullish for the Euro (EUR), since it attracts more foreign capital inflows. Likewise, if the ECB sees inflation falling it may cut the main refinancing operations rate to encourage banks to borrow and lend more, in the hope of driving economic growth. This tends to weaken the Euro as it reduces its attractiveness as a place for investors to park capital.
Read more.Next release: Thu Sep 12, 2024 12:15
Frequency: Irregular
Consensus: 4%
Previous: 4.25%
Source: European Central Bank
Gold prices fell in India on Tuesday, according to data compiled by FXStreet.
The price for Gold stood at 6,752.67 Indian Rupees (INR) per gram, down compared with the INR 6,766.24 it cost on Monday.
The price for Gold decreased to INR 78,761.77 per tola from INR 78,920.15 per tola a day earlier.
| Unit measure | Gold Price in INR |
|---|---|
| 1 Gram | 6,752.67 |
| 10 Grams | 67,526.66 |
| Tola | 78,761.77 |
| Troy Ounce | 210,031.50 |
FXStreet calculates Gold prices in India by adapting international prices (USD/INR) to the local currency and measurement units. Prices are updated daily based on the market rates taken at the time of publication. Prices are just for reference and local rates could diverge slightly.
Gold FAQs
Gold has played a key role in human’s history as it has been widely used as a store of value and medium of exchange. Currently, apart from its shine and usage for jewelry, the precious metal is widely seen as a safe-haven asset, meaning that it is considered a good investment during turbulent times. Gold is also widely seen as a hedge against inflation and against depreciating currencies as it doesn’t rely on any specific issuer or government.
Central banks are the biggest Gold holders. In their aim to support their currencies in turbulent times, central banks tend to diversify their reserves and buy Gold to improve the perceived strength of the economy and the currency. High Gold reserves can be a source of trust for a country’s solvency. Central banks added 1,136 tonnes of Gold worth around $70 billion to their reserves in 2022, according to data from the World Gold Council. This is the highest yearly purchase since records began. Central banks from emerging economies such as China, India and Turkey are quickly increasing their Gold reserves.
Gold has an inverse correlation with the US Dollar and US Treasuries, which are both major reserve and safe-haven assets. When the Dollar depreciates, Gold tends to rise, enabling investors and central banks to diversify their assets in turbulent times. Gold is also inversely correlated with risk assets. A rally in the stock market tends to weaken Gold price, while sell-offs in riskier markets tend to favor the precious metal.
The price can move due to a wide range of factors. Geopolitical instability or fears of a deep recession can quickly make Gold price escalate due to its safe-haven status. As a yield-less asset, Gold tends to rise with lower interest rates, while higher cost of money usually weighs down on the yellow metal. Still, most moves depend on how the US Dollar (USD) behaves as the asset is priced in dollars (XAU/USD). A strong Dollar tends to keep the price of Gold controlled, whereas a weaker Dollar is likely to push Gold prices up.
(An automation tool was used in creating this post.)
- Silver price inches lower as traders adopt caution ahead of the US inflation data release on Wednesday.
- The non-yielding Silver faces minor challenges due to the uncertainty over the scale of a Fed interest rate cut.
- The CME FedWatch Tool suggests that the likelihood of a 50 bps rate cut has slightly decreased to 29.0%.
Silver price (XAG/USD) edges lower to near $28.30 per troy ounce during Tuesday’s Asian hours. Traders adopt caution ahead of the US inflation report scheduled to be released on Wednesday to gain insights regarding the potential magnitude of the Federal Reserve's (Fed) interest rate cut in September. Changes in interest rates tend to impact non-yielding assets like Silver.
Last week, US labor data raised uncertainty over the scale of a Fed interest rate cut. The US Nonfarm Payrolls (NFP) added 142,000 jobs in August, below the forecast of 160,000 but an improvement from July’s downwardly revised figure of 89,000. Meanwhile, the Unemployment Rate fell to 4.2%, as expected, down from 4.3% in the previous month.
According to the CME FedWatch Tool, markets are fully anticipating at least a 25 basis point (bps) rate cut by the Federal Reserve at its September meeting. The likelihood of a 50 bps rate cut has slightly decreased to 29.0%, down from 30.0% a week ago.
Chicago Fed President Austan Goolsbee remarked on Friday that Fed officials are starting to align with the broader market's sentiment that a policy rate adjustment by the US central bank is imminent, according to CNBC. FXStreet’s FedTracker, which uses a custom AI model to evaluate Fed officials' speeches on a dovish-to-hawkish scale from 0 to 10, rated Goolsbee's comments as dovish, assigning them a score of 3.2.
Silver FAQs
Silver is a precious metal highly traded among investors. It has been historically used as a store of value and a medium of exchange. Although less popular than Gold, traders may turn to Silver to diversify their investment portfolio, for its intrinsic value or as a potential hedge during high-inflation periods. Investors can buy physical Silver, in coins or in bars, or trade it through vehicles such as Exchange Traded Funds, which track its price on international markets.
Silver prices can move due to a wide range of factors. Geopolitical instability or fears of a deep recession can make Silver price escalate due to its safe-haven status, although to a lesser extent than Gold's. As a yieldless asset, Silver tends to rise with lower interest rates. Its moves also depend on how the US Dollar (USD) behaves as the asset is priced in dollars (XAG/USD). A strong Dollar tends to keep the price of Silver at bay, whereas a weaker Dollar is likely to propel prices up. Other factors such as investment demand, mining supply – Silver is much more abundant than Gold – and recycling rates can also affect prices.
Silver is widely used in industry, particularly in sectors such as electronics or solar energy, as it has one of the highest electric conductivity of all metals – more than Copper and Gold. A surge in demand can increase prices, while a decline tends to lower them. Dynamics in the US, Chinese and Indian economies can also contribute to price swings: for the US and particularly China, their big industrial sectors use Silver in various processes; in India, consumers’ demand for the precious metal for jewellery also plays a key role in setting prices.
Silver prices tend to follow Gold's moves. When Gold prices rise, Silver typically follows suit, as their status as safe-haven assets is similar. The Gold/Silver ratio, which shows the number of ounces of Silver needed to equal the value of one ounce of Gold, may help to determine the relative valuation between both metals. Some investors may consider a high ratio as an indicator that Silver is undervalued, or Gold is overvalued. On the contrary, a low ratio might suggest that Gold is undervalued relative to Silver.
- The Indian Rupee maintains its position as traders expect RBI to intervene to support the domestic currency.
- The USD/INR pair could appreciate if Asian markets experience a decline due to rising concerns about the US economy.
- The US Dollar receives support due to rising doubts on the scale of the Fed rate cut in September.
The Indian Rupee (INR) holds steady against the US Dollar (USD) on Tuesday, with traders speculating that the Reserve Bank of India (RBI) likely intervened in the foreign exchange market to support the domestic currency and prevent it from weakening beyond the 84.00 level.
The USD/INR pair could appreciate in the near term as a broader decline in Asian equities and currencies emerges, fueled by rising concerns about a potential slowdown in the US economy. However, lower Oil prices may help ease downward pressure on the INR, as India, being the world's third-largest oil consumer and importer, stands to benefit from reduced import costs.
The US Dollar appreciates due to the reduced likelihood of an aggressive interest rate cut by the Federal Reserve (Fed) at its September meeting. According to the CME FedWatch Tool, the likelihood of a 50 bps rate cut has slightly decreased to 29.0%, down from 30.0% a week ago.
Daily Digest Market Movers: Indian Rupee holds ground due to potential RBI intervention
- Chicago Fed President Austan Goolsbee remarked on Friday that Fed officials are starting to align with the broader market's sentiment that a policy rate adjustment by the US central bank is imminent, according to CNBC. FXStreet’s FedTracker, which uses a custom AI model to evaluate Fed officials' speeches on a dovish-to-hawkish scale from 0 to 10, rated Goolsbee's comments as dovish, assigning them a score of 3.2.
- India's FX Reserves reached a record high of $683.99 billion as of August 30, up from $681.69 billion previously. This surge is largely due to a substantial influx of foreign exchange into the Indian economy, spurred by robust economic growth and the long-anticipated inclusion of Indian assets in JPMorgan's major emerging market debt index, which has enhanced foreign investment.
- ADP Employment Change showed on Thursday that private-sector employment increased by 99,000 in August, following July’s increase of 111,000 and below the estimate of 145,000. Meanwhile, the weekly US Initial Jobless Claims rose to 227,000 for the week ending August 30, compared to the previous reading of 232,000 and below the initial consensus of 230,000.
- “The Composite PMI for India continued to show strong growth in August, driven by accelerated business activity in the service sector, which experienced its fastest expansion since March. This growth was largely fuelled by an increase in new orders, particularly domestic orders,” said Pranjul Bhandari, Chief India Economist at HSBC.
- The World Bank has raised India's growth forecast to 7% for the current financial year (FY25), up from an earlier projection of 6.6%.
Technical Analysis: USD/INR stays below 84.00, testing support at nine-day EMA
The Indian Rupee trades around 84.00 on Tuesday. A review of the daily chart shows that the USD/INR pair is consolidating within a symmetrical triangle pattern, signaling reduced volatility and a phase of consolidation. Despite this, the 14-day Relative Strength Index (RSI) remains above 50, indicating the bullish trend is still intact.
On the downside, the nine-day Exponential Moving Average (EMA) at 83.91 serves as immediate support, aligned with the lower boundary of the symmetrical triangle near 83.90. A break below this level could trigger a bearish shift, putting downward pressure on the USD/INR pair and potentially pushing it toward its six-week low around 83.72.
On the resistance side, the USD/INR pair is testing the upper boundary of the symmetrical triangle near the 84.00 level. A breakout above this point could drive the pair toward the all-time high of 84.14, recorded on August 5.
USD/INR: Daily Chart
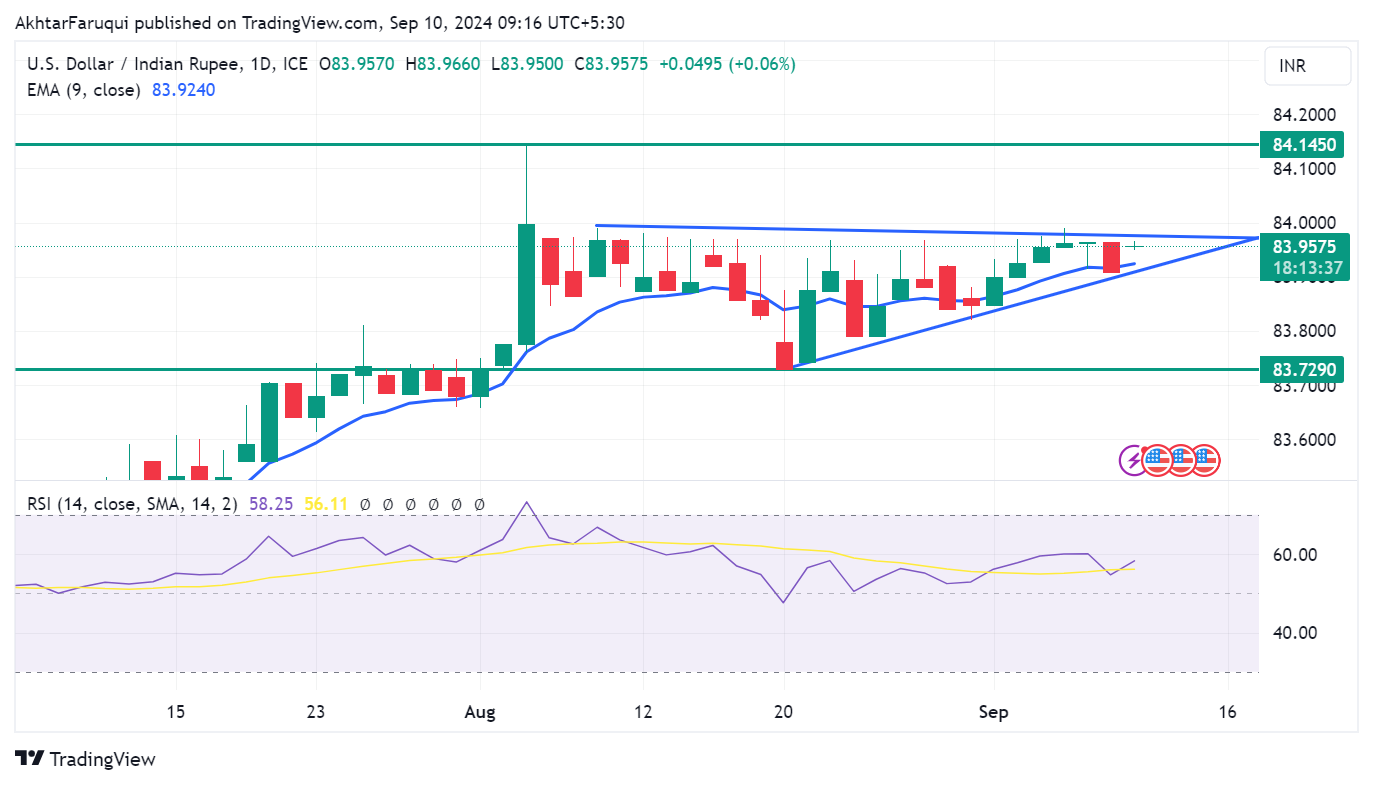
Indian Rupee FAQs
The Indian Rupee (INR) is one of the most sensitive currencies to external factors. The price of Crude Oil (the country is highly dependent on imported Oil), the value of the US Dollar – most trade is conducted in USD – and the level of foreign investment, are all influential. Direct intervention by the Reserve Bank of India (RBI) in FX markets to keep the exchange rate stable, as well as the level of interest rates set by the RBI, are further major influencing factors on the Rupee.
The Reserve Bank of India (RBI) actively intervenes in forex markets to maintain a stable exchange rate, to help facilitate trade. In addition, the RBI tries to maintain the inflation rate at its 4% target by adjusting interest rates. Higher interest rates usually strengthen the Rupee. This is due to the role of the ‘carry trade’ in which investors borrow in countries with lower interest rates so as to place their money in countries’ offering relatively higher interest rates and profit from the difference.
Macroeconomic factors that influence the value of the Rupee include inflation, interest rates, the economic growth rate (GDP), the balance of trade, and inflows from foreign investment. A higher growth rate can lead to more overseas investment, pushing up demand for the Rupee. A less negative balance of trade will eventually lead to a stronger Rupee. Higher interest rates, especially real rates (interest rates less inflation) are also positive for the Rupee. A risk-on environment can lead to greater inflows of Foreign Direct and Indirect Investment (FDI and FII), which also benefit the Rupee.
Higher inflation, particularly, if it is comparatively higher than India’s peers, is generally negative for the currency as it reflects devaluation through oversupply. Inflation also increases the cost of exports, leading to more Rupees being sold to purchase foreign imports, which is Rupee-negative. At the same time, higher inflation usually leads to the Reserve Bank of India (RBI) raising interest rates and this can be positive for the Rupee, due to increased demand from international investors. The opposite effect is true of lower inflation.
- USD/CAD regains some positive traction amid some follow-through USD buying interest.
- Subdued Crude Oil prices undermine the Loonie and further lend support to the major.
- Traders now look to BoC Governor Macklem's speech ahead of the US CPI on Wednesday.
The USD/CAD pair attracts some buyers during the Asian session on Tuesday, albeit lacks follow-through and remains confined in the previous day's trading range. Spot prices currently hover around the 1.3565 region, up less than 0.10% for the day and below the 200-day Simple Moving Average (SMA) before placing fresh bets.
Crude Oil prices struggle to capitalize on the overnight bounce from the lowest level since June 2023 amid concerns about a slowdown in China – the world's largest importer. The worries were fueled by the latest Chinese Trade Balance data, which showed that the country’s imports remained flat in August as compared to the 6.6% growth registered in the previous month, pointing to weak domestic demand. Apart from this, hopes for additional interest rate cuts by the Bank of Canada (BoC), bolstered by Friday's disappointing Canadian jobs data, undermine the commodity-linked Loonie and act as a tailwind for the USD/CAD pair.
The US Dollar (USD), on the other hand, continues to draw support from reduced bets for a larger 50 basis points (bps) interest rate cut by the Federal Reserve (Fed) in September following Friday's release of the mixed US Nonfarm Payrolls (NFP) report. This, in turn, is seen as another factor lending some support to the USD/CAD pair, though the lack of follow-through buying warrants some caution for bulls ahead of BoC Governor Tiff Macklem's speech later during the early North American session. Investors might also prefer to move to the sidelines ahead of the US inflation figures, which will play a key role in influencing the Greenback.
The crucial US Consumer Price Index (CPI) is due for release on Wednesday, followed by the Producer Price Index (PPI) on Thursday. The data will drive market expectations about the size of the Fed's interest rate cut later this month and the USD demand. This, along with Oil price dynamics, should provide some meaningful impetus to the USD/CAD pair and help in determining the next leg of a directional move.
Economic Indicator
BoC's Governor Macklem speech
Tiff Macklem was appointed Governor of the Bank of Canada, effective 3 June 2020. As Governor, he is also Chairman of the Board of Directors of the Bank. Prior to being appointed as BoC chief, Macklem served as the Dean of the Rotman School of Management at the University of Toronto for six years. He had already served as Senior Deputy Governor of the Bank of Canada from July 2010 until May 2014. Macklem also was the first Chair of the Financial Stability Board’s Standing Committee for Standards Implementation from 2009 to 2013, and represented the Bank of Canada at the FSB.
Read more.Next release: Tue Sep 10, 2024 12:25
Frequency: Irregular
Consensus: -
Previous: -
Source: Bank of Canada
China's Trade Balance for August, in Chinese Yuan terms, came in at CNY649.34 billion, expanding from the previous figure of CNY601.98 billion.
Exports rose 8.4% YoY in August vs. 6.5% seen in July. The country’s imports came in at 0% YoY in the same period vs. 6.6% registered previously.
In US Dollar terms, China’s trade surplus widened in August.
Trade Balance came in at +91.02B versus +83.9B expected and +84.65B previous.
Exports (YoY): 8.7% vs. 6.5% expected and 7.0% previous.
Imports (YoY): 0.5% vs. 2.0% expected and 7.2% last.
Additional takeaways
China Jan-August USD-denominated Exports +4.6% YoY.
China Jan-August USD-denominated Imports +2.5% YoY.
China Jan-August USD-denominated Trade Surplus +608.9B.
China Jan-August Trade Surplus with the US arrived at +$224.57B.
China August Trade Surplus with the US was $33.81B vs. $30.84B in July.
FX implications
AUD/USD holds the rebound above 0.6650 after China’s trade surplus expansion. The pair is down 0.05% on the day, trading at 0.6658, at the time of writing.
- NZD/USD struggles to attract any meaningful buyers amid some follow-through USD strength.
- Reduced bets for a 50 bps Fed rate cut in September push the USD closer to the monthly top.
- Traders now look to Chinese trade data, though the focus remains on US CPI on Wednesday.
The NZD/USD pair remains under some selling pressure for the third straight day on Tuesday and currently trades around the 0.6140-0.6135 region, just above a three-week low touched the previous day.
Traders have been scaling back their bets for a larger, 50 basis points (bps) interest rate cut by the Federal Reserve (Fed) in September following the release of mixed US jobs report on Friday. This, in turn, pushes the USD Index (DXY), which tracks the Greenback against a basket of currencies, closer to the monthly peak touched last week and is seen weighing on the NZD/USD pair. That said, bets for an imminent start of the Fed's rate-cutting cycle, along with a positive risk tone, could cap the USD and lend support to the currency pair.
Investors also seem reluctant and prefer to wait for the release of the US inflation figures before placing fresh directional bets around the NZD/USD pair. The crucial US Consumer Price Index (CPI) is due on Wednesday, which, along with the Producer Price Index (PPI) on Thursday, might influence market expectations about the size of the Fed's rate cut move later this month and the future policy path. This, in turn, will play a key role in driving the USD demand and help in determining the near-term trajectory for the currency pair.
In the meantime, traders on Tuesday will take cues from Chinese Trade Balance figures. Any meaningful divergence from the expected figures could have an impact on antipodean currencies, including the New Zealand Dollar (NZD) and produce short-term trading opportunities around the NZD/USD pair. The immediate market reaction, however, is more likely to be limited, warranting some caution before positioning for any meaningful recovery.
New Zealand Dollar FAQs
The New Zealand Dollar (NZD), also known as the Kiwi, is a well-known traded currency among investors. Its value is broadly determined by the health of the New Zealand economy and the country’s central bank policy. Still, there are some unique particularities that also can make NZD move. The performance of the Chinese economy tends to move the Kiwi because China is New Zealand’s biggest trading partner. Bad news for the Chinese economy likely means less New Zealand exports to the country, hitting the economy and thus its currency. Another factor moving NZD is dairy prices as the dairy industry is New Zealand’s main export. High dairy prices boost export income, contributing positively to the economy and thus to the NZD.
The Reserve Bank of New Zealand (RBNZ) aims to achieve and maintain an inflation rate between 1% and 3% over the medium term, with a focus to keep it near the 2% mid-point. To this end, the bank sets an appropriate level of interest rates. When inflation is too high, the RBNZ will increase interest rates to cool the economy, but the move will also make bond yields higher, increasing investors’ appeal to invest in the country and thus boosting NZD. On the contrary, lower interest rates tend to weaken NZD. The so-called rate differential, or how rates in New Zealand are or are expected to be compared to the ones set by the US Federal Reserve, can also play a key role in moving the NZD/USD pair.
Macroeconomic data releases in New Zealand are key to assess the state of the economy and can impact the New Zealand Dollar’s (NZD) valuation. A strong economy, based on high economic growth, low unemployment and high confidence is good for NZD. High economic growth attracts foreign investment and may encourage the Reserve Bank of New Zealand to increase interest rates, if this economic strength comes together with elevated inflation. Conversely, if economic data is weak, NZD is likely to depreciate.
The New Zealand Dollar (NZD) tends to strengthen during risk-on periods, or when investors perceive that broader market risks are low and are optimistic about growth. This tends to lead to a more favorable outlook for commodities and so-called ‘commodity currencies’ such as the Kiwi. Conversely, NZD tends to weaken at times of market turbulence or economic uncertainty as investors tend to sell higher-risk assets and flee to the more-stable safe havens.
| Raw materials | Closed | Change, % |
|---|---|---|
| Silver | 28.34 | 1.33 |
| Gold | 250.572 | 0.35 |
| Palladium | 945.96 | 3.6 |
- Gold price edges lower as USD benefits from reduced expectations of a 50 bps Fed rate cut.
- The downside remains limited as traders look to US inflation numbers for a fresh impetus.
- The technical setup supports prospects for a breakout through a short-term trading range.
Gold price (XAU/USD) struggles to capitalize on the previous day's move up from the $2,485 region and ticks lower during the Asian session on Tuesday amid some follow-through US Dollar (USD) strength. Investors trimmed their bets for a larger interest rate cut by the Federal Reserve (Fed) in September following the release of mixed US monthly jobs report on Friday. This, in turn, lifts the USD Index (DXY), which tracks the Greenback against a basket of currencies, back closer to the monthly peak touched last week and acts as a headwind for the non-yielding yellow metal.
Apart from this, a generally positive tone around the equity markets is seen as another factor undermining demand for the safe-haven Gold price. The XAU/USD, however, remains confined in a multi-week-old trading range as investors await more cues about the size of the Fed rate cut later this month. Hence, the market focus will remain glued to the release of the latest US consumer inflation figures on Wednesday. In the meantime, the prospects for an imminent start of the Fed's rate-cutting cycle might hold back traders from placing aggressive bearish bets around the metal.
Daily Digest Market Movers: Gold price is undermined by modest USD strength, positive risk tone
- Friday's mixed US employment data reduced the likelihood of a 50-basis point rate cut by the Federal Reserve and continues to benefit the US Dollar, acting as a headwind for the Gold price.
- According to the CME Group's FedWatch tool, traders see a 71% chance of a 25-basis-points rate cut at the next FOMC meeting on September 17-18 and a 29% chance of a 50-bp reduction.
- Investors opt to wait for the release of the August US consumer price data on Wednesday, which, along with the Producer Price Index on Thursday, could influence Fed rate cut expectations.
- New York Fed President John Williams said on Friday that inflation expectations remain well anchored and that monetary policy can be moved to a more neutral stance depending on data.
- Separately, Fed Governor Christopher Waller noted that maintaining the economy's forward momentum means the time has come to begin reducing rates and that he is open-minded on the size.
- Adding to this, Chicago Fed President Austan Goolsbee said that officials are finally beginning to catch up with the broader market's view that the time has come for a move on policy rates.
- This suggests that the path of least resistance for the non-yielding XAU/USD remains to the upside and the immediate market reaction to stronger US inflation numbers is more likely to be limited.
Technical Outlook: Gold price extends its consolidative price move around the $2,500 psychological mark
From a technical perspective, the range-bound price action witnessed over the past three weeks or so constitutes the formation of a rectangle on the daily chart. Against the backdrop of the recent rally to the all-time peak, this might still be categorized as a bullish consolidation phase. Moreover, oscillators on the daily chart are holding in the positive territory, validating the near-term positive outlook for the Gold price. That said, it will still be prudent to wait for a sustained breakout through the trading range resistance, or the all-time peak around the $2.530-2,532 region, before positioning for any further appreciating move.
On the flip side, any meaningful slide is likely to find some support near the $2,485 area ahead of the $2,470 horizontal zone. The latter represents the lower boundary of the aforementioned trading range, which if broken decisively might prompt some technical selling and pave the way for deeper losses. The Gold price might then accelerate the fall towards the 50-day Simple Moving Average (SMA) support, currently pegged near the $2,446 area, before eventually dropping to the $2,410-2,400 region.
Gold FAQs
Gold has played a key role in human’s history as it has been widely used as a store of value and medium of exchange. Currently, apart from its shine and usage for jewelry, the precious metal is widely seen as a safe-haven asset, meaning that it is considered a good investment during turbulent times. Gold is also widely seen as a hedge against inflation and against depreciating currencies as it doesn’t rely on any specific issuer or government.
Central banks are the biggest Gold holders. In their aim to support their currencies in turbulent times, central banks tend to diversify their reserves and buy Gold to improve the perceived strength of the economy and the currency. High Gold reserves can be a source of trust for a country’s solvency. Central banks added 1,136 tonnes of Gold worth around $70 billion to their reserves in 2022, according to data from the World Gold Council. This is the highest yearly purchase since records began. Central banks from emerging economies such as China, India and Turkey are quickly increasing their Gold reserves.
Gold has an inverse correlation with the US Dollar and US Treasuries, which are both major reserve and safe-haven assets. When the Dollar depreciates, Gold tends to rise, enabling investors and central banks to diversify their assets in turbulent times. Gold is also inversely correlated with risk assets. A rally in the stock market tends to weaken Gold price, while sell-offs in riskier markets tend to favor the precious metal.
The price can move due to a wide range of factors. Geopolitical instability or fears of a deep recession can quickly make Gold price escalate due to its safe-haven status. As a yield-less asset, Gold tends to rise with lower interest rates, while higher cost of money usually weighs down on the yellow metal. Still, most moves depend on how the US Dollar (USD) behaves as the asset is priced in dollars (XAU/USD). A strong Dollar tends to keep the price of Gold controlled, whereas a weaker Dollar is likely to push Gold prices up.
- WTI price holds its position due to operations closure at Brownsville and other smaller Texas ports on Monday.
- National Hurricane Center’s data indicate that at least 125,000 barrels per day of Oil production is at risk of disruption.
- APPEC conference speakers noted that China’s sluggish economy is slowing Oil demand growth.
West Texas Intermediate (WTI) Oil price remains steady at around $68.00 per barrel during Tuesday's Asian trading session. Crude Oil prices are being bolstered by supply disruptions caused by Tropical Storm Francine. According to a note from ANZ analysts, citing data from the National Hurricane Center (NHC), "At least 125,000 barrels per day (bpd) of Oil production is at risk of disruption."
The US Coast Guard ordered the closure of all operations at Brownsville and other smaller Texas ports on Monday evening as Tropical Storm Francine swept across the Gulf of Mexico. While the port of Corpus Christi remained open, it operated under restrictions, according to Reuters.
Tropical Storm Francine is expected to strengthen into the fourth hurricane of the Atlantic season, which concludes on November 30. The National Hurricane Center predicts Francine could develop into a Category 1 hurricane, with winds reaching up to 85 mph (137 kph), before making landfall on the Louisiana coast by Wednesday evening.
Reuters reported that global commodity traders Gunvor and Trafigura expect Oil prices to range between $60 and $70 per barrel, driven by weakened Chinese demand and ongoing global oversupply. According to speakers at the APPEC conference on Monday, China’s transition toward lower-carbon fuels, combined with a sluggish economy, is slowing Oil demand growth in the world’s largest crude importer.
WTI Oil FAQs
WTI Oil is a type of Crude Oil sold on international markets. The WTI stands for West Texas Intermediate, one of three major types including Brent and Dubai Crude. WTI is also referred to as “light” and “sweet” because of its relatively low gravity and sulfur content respectively. It is considered a high quality Oil that is easily refined. It is sourced in the United States and distributed via the Cushing hub, which is considered “The Pipeline Crossroads of the World”. It is a benchmark for the Oil market and WTI price is frequently quoted in the media.
Like all assets, supply and demand are the key drivers of WTI Oil price. As such, global growth can be a driver of increased demand and vice versa for weak global growth. Political instability, wars, and sanctions can disrupt supply and impact prices. The decisions of OPEC, a group of major Oil-producing countries, is another key driver of price. The value of the US Dollar influences the price of WTI Crude Oil, since Oil is predominantly traded in US Dollars, thus a weaker US Dollar can make Oil more affordable and vice versa.
The weekly Oil inventory reports published by the American Petroleum Institute (API) and the Energy Information Agency (EIA) impact the price of WTI Oil. Changes in inventories reflect fluctuating supply and demand. If the data shows a drop in inventories it can indicate increased demand, pushing up Oil price. Higher inventories can reflect increased supply, pushing down prices. API’s report is published every Tuesday and EIA’s the day after. Their results are usually similar, falling within 1% of each other 75% of the time. The EIA data is considered more reliable, since it is a government agency.
OPEC (Organization of the Petroleum Exporting Countries) is a group of 13 Oil-producing nations who collectively decide production quotas for member countries at twice-yearly meetings. Their decisions often impact WTI Oil prices. When OPEC decides to lower quotas, it can tighten supply, pushing up Oil prices. When OPEC increases production, it has the opposite effect. OPEC+ refers to an expanded group that includes ten extra non-OPEC members, the most notable of which is Russia.
- AUD/USD depreciates following the release of downbeat Westpac Consumer Confidence on Tuesday.
- The Australian Dollar’s downside could be restrained due to the hawkish sentiment surrounding the RBA.
- The US Dollar received support as recent labor data reduced the likelihood of an aggressive Fed rate cut in September.
The AUD/USD pair extends its losses for the third successive day following the downbeat Westpac Consumer Confidence from Australia released on Tuesday. Additionally, the US Dollar received support as a recent US labor market report raised uncertainty over the likelihood of an aggressive interest rate cut by the Federal Reserve (Fed) at its September meeting.
Australia's Westpac Consumer Confidence fell by 0.5% month-on-month in September, swinging from a 2.8% gain in August. Traders await China’s Trade Balance data scheduled to be released later in the day. Given the close trade relationship between Australia and China, any changes in the Chinese economy could have a significant impact on Australian markets.
However, the downside of the Australian Dollar (AUD) could be limited due to the hawkish sentiment surrounding the Reserve Bank of Australia (RBA). The RBA Governor Michele Bullock stated last week that it is too early to consider rate cuts. The board does not anticipate being able to reduce rates in the near term.
Daily Digest Market Movers: Australian Dollar extends decline due to increasing risk aversion
- According to the CME FedWatch Tool, markets are fully anticipating at least a 25 basis point (bps) rate cut by the Federal Reserve at its September meeting. The likelihood of a 50 bps rate cut has slightly decreased to 29.0%, down from 30.0% a week ago.
- China’s Consumer Price Index (CPI) rose by 0.6% year-on-year in August, up from 0.5% in July but below the market consensus of 0.7%. On a monthly basis, CPI inflation increased by 0.4% in August, down from 0.5% in July and worse than the 0.5% estimate.
- RBC Capital Markets now expects the Reserve Bank of Australia to implement a rate cut at its February 2025 meeting, earlier than its previous forecast of May 2025. Despite inflation in Australia remaining elevated above the RBA's target, slower economic growth is not considered a sufficient reason for a rate cut this year.
- The US Bureau of Labor Statistics (BLS) reported that Nonfarm Payrolls (NFP) added 142,000 jobs in August, below the forecast of 160,000 but an improvement from July’s downwardly revised figure of 89,000. Meanwhile, the Unemployment Rate fell to 4.2%, as expected, down from 4.3% in the previous month.
- Federal Reserve (Fed) Bank of Chicago President Austan Goolsbee remarked on Friday that Fed officials are starting to align with the broader market's sentiment that a policy rate adjustment by the US central bank is imminent, according to CNBC. FXStreet’s FedTracker, which uses a custom AI model to evaluate Fed officials' speeches on a dovish-to-hawkish scale from 0 to 10, rated Goolsbee's comments as dovish, assigning them a score of 3.2.
Technical Analysis: Australian Dollar tests 0.6650 near the lower boundary of descending channel
The AUD/USD pair trades around 0.6650 on Tuesday. The daily chart analysis shows that the pair is trekking down along the lower boundary of the descending channel, suggesting the reinforcing of a bearish bias. Additionally, the 14-day Relative Strength Index (RSI) falls below the 50 level, confirming the ongoing bearish trend for the AUD/USD pair.
On the downside, the AUD/USD pair targets the lower boundary of the descending channel around the level of 0.6630. A break below this level could strengthen the bearish bias and lead the pair to navigate the region around the throwback support at 0.6575.
Regarding resistance, the AUD/USD pair may find the barrier around the nine-day Exponential Moving Average (EMA) at the 0.6703 level. A breakthrough above this level could weaken the bearish bias and support the AUD/USD pair to test the upper boundary of the descending channel around the 0.6750 level, followed by a seven-month high of 0.6798, reached on July 11.
AUD/USD: Daily Chart
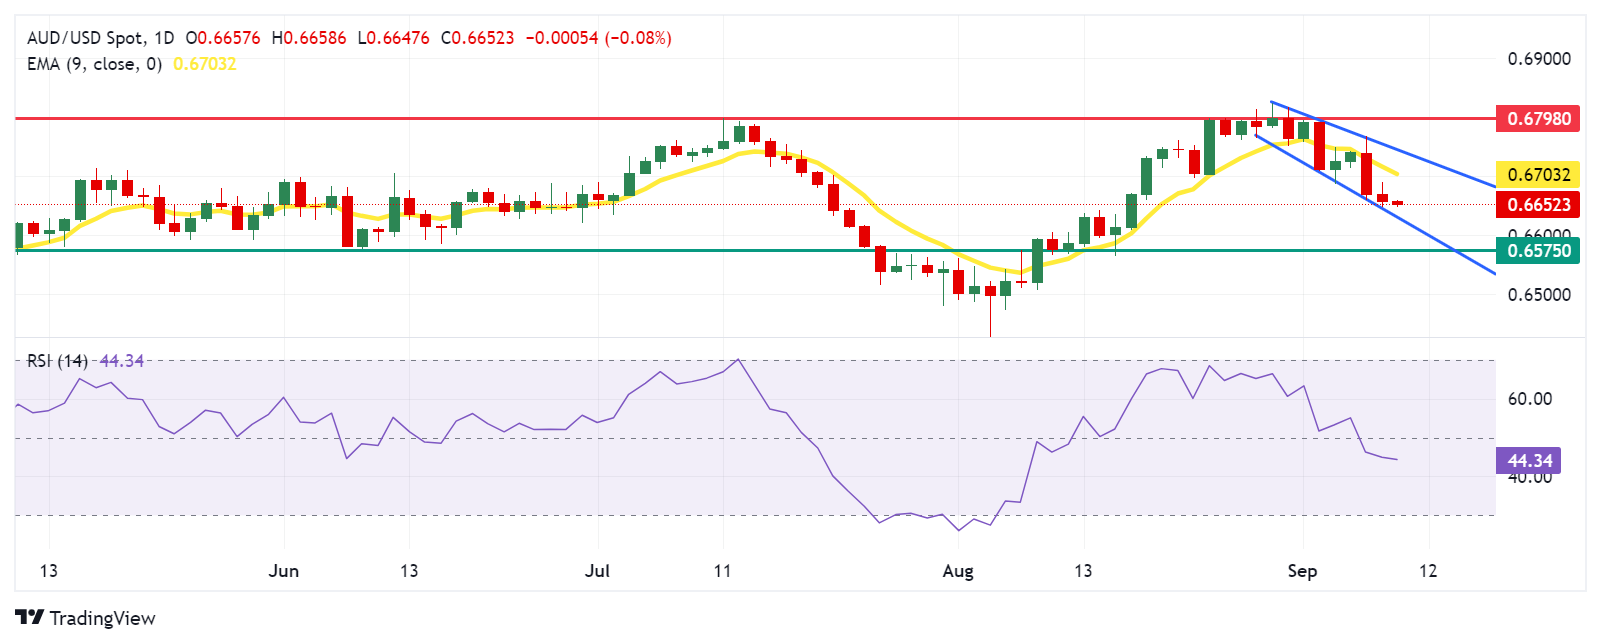
Australian Dollar PRICE Today
The table below shows the percentage change of Australian Dollar (AUD) against listed major currencies today. Australian Dollar was the weakest against the US Dollar.
| USD | EUR | GBP | JPY | CAD | AUD | NZD | CHF | |
|---|---|---|---|---|---|---|---|---|
| USD | 0.00% | 0.06% | 0.17% | 0.07% | 0.13% | 0.19% | 0.02% | |
| EUR | -0.01% | 0.06% | 0.16% | 0.06% | 0.11% | 0.13% | 0.01% | |
| GBP | -0.06% | -0.06% | 0.09% | -0.03% | 0.07% | 0.09% | -0.02% | |
| JPY | -0.17% | -0.16% | -0.09% | -0.12% | -0.05% | -0.02% | -0.15% | |
| CAD | -0.07% | -0.06% | 0.03% | 0.12% | 0.05% | 0.12% | -0.03% | |
| AUD | -0.13% | -0.11% | -0.07% | 0.05% | -0.05% | 0.04% | -0.09% | |
| NZD | -0.19% | -0.13% | -0.09% | 0.02% | -0.12% | -0.04% | -0.13% | |
| CHF | -0.02% | -0.01% | 0.02% | 0.15% | 0.03% | 0.09% | 0.13% |
The heat map shows percentage changes of major currencies against each other. The base currency is picked from the left column, while the quote currency is picked from the top row. For example, if you pick the Australian Dollar from the left column and move along the horizontal line to the US Dollar, the percentage change displayed in the box will represent AUD (base)/USD (quote).
Australian Dollar FAQs
One of the most significant factors for the Australian Dollar (AUD) is the level of interest rates set by the Reserve Bank of Australia (RBA). Because Australia is a resource-rich country another key driver is the price of its biggest export, Iron Ore. The health of the Chinese economy, its largest trading partner, is a factor, as well as inflation in Australia, its growth rate and Trade Balance. Market sentiment – whether investors are taking on more risky assets (risk-on) or seeking safe-havens (risk-off) – is also a factor, with risk-on positive for AUD.
The Reserve Bank of Australia (RBA) influences the Australian Dollar (AUD) by setting the level of interest rates that Australian banks can lend to each other. This influences the level of interest rates in the economy as a whole. The main goal of the RBA is to maintain a stable inflation rate of 2-3% by adjusting interest rates up or down. Relatively high interest rates compared to other major central banks support the AUD, and the opposite for relatively low. The RBA can also use quantitative easing and tightening to influence credit conditions, with the former AUD-negative and the latter AUD-positive.
China is Australia’s largest trading partner so the health of the Chinese economy is a major influence on the value of the Australian Dollar (AUD). When the Chinese economy is doing well it purchases more raw materials, goods and services from Australia, lifting demand for the AUD, and pushing up its value. The opposite is the case when the Chinese economy is not growing as fast as expected. Positive or negative surprises in Chinese growth data, therefore, often have a direct impact on the Australian Dollar and its pairs.
Iron Ore is Australia’s largest export, accounting for $118 billion a year according to data from 2021, with China as its primary destination. The price of Iron Ore, therefore, can be a driver of the Australian Dollar. Generally, if the price of Iron Ore rises, AUD also goes up, as aggregate demand for the currency increases. The opposite is the case if the price of Iron Ore falls. Higher Iron Ore prices also tend to result in a greater likelihood of a positive Trade Balance for Australia, which is also positive of the AUD.
The Trade Balance, which is the difference between what a country earns from its exports versus what it pays for its imports, is another factor that can influence the value of the Australian Dollar. If Australia produces highly sought after exports, then its currency will gain in value purely from the surplus demand created from foreign buyers seeking to purchase its exports versus what it spends to purchase imports. Therefore, a positive net Trade Balance strengthens the AUD, with the opposite effect if the Trade Balance is negative.
The People’s Bank of China (PBOC) set the USD/CNY central rate for the trading session ahead on Tuesday at 7.1136, as against the previous day's fix of 7.0989 and 7.1140 Reuters estimates.
- USD/JPY ticks higher for the second straight day and draws support from a combination of factors.
- A downward revision of Japan’s GDP print and a positive risk tone undermines the safe-haven JPY.
- Reduced bets for a 50 bps Fed rate cut in September push the USD higher and further lend support.
The USD/JPY pair turns positive for the second straight day following an early Asian session dip to the 142.85 region, albeit it lacks bullish conviction. Spot prices currently trade with a mild positive bias just below mid-143.00s and remain well within the striking distance of a one-month low touched last Friday.
The Japanese Yen (JPY) continues to be undermined by data published on Monday, which showed that the economy grew at a slightly slower pace than initially reported in the second quarter. This could possibly complicate the Bank of Japan's (BoJ) plan to hike interest rates further in the coming months. Apart from this, a generally positive risk tone around the equity markets dents demand for the safe-haven JPY and acts as a tailwind for the USD/JPY pair amid some follow-through US Dollar (USD) buying interest.
The USD Index (DXY), which tracks the Greenback against a basket of currencies, climbs to a multi-day peak amid reduced bets for a larger, 50 basis points (bps) interest rate cut by the Federal Reserve (Fed) in September. The markets, however, have fully priced in at least a 25 bps Fed rate cut move later this month. In contrast, the BoJ is expected to hike interest rates again by the end of this year. This might hold back bullish traders from placing aggressive bets around the USD/JPY pair and cap gains.
Investors might also prefer to move to the sidelines and wait for the release of the US consumer inflation figures on Wednesday before placing fresh directional bets. Hence, a strong follow-through buying is needed in order to confirm that the USD/JPY pair has formed a near-term bottom and positioning for any meaningful appreciating move amid absent relevant US macro data on Tuesday. That said, speeches by influential FOMC members might provide some impetus later during the US session.
Japanese Yen FAQs
The Japanese Yen (JPY) is one of the world’s most traded currencies. Its value is broadly determined by the performance of the Japanese economy, but more specifically by the Bank of Japan’s policy, the differential between Japanese and US bond yields, or risk sentiment among traders, among other factors.
One of the Bank of Japan’s mandates is currency control, so its moves are key for the Yen. The BoJ has directly intervened in currency markets sometimes, generally to lower the value of the Yen, although it refrains from doing it often due to political concerns of its main trading partners. The current BoJ ultra-loose monetary policy, based on massive stimulus to the economy, has caused the Yen to depreciate against its main currency peers. This process has exacerbated more recently due to an increasing policy divergence between the Bank of Japan and other main central banks, which have opted to increase interest rates sharply to fight decades-high levels of inflation.
The BoJ’s stance of sticking to ultra-loose monetary policy has led to a widening policy divergence with other central banks, particularly with the US Federal Reserve. This supports a widening of the differential between the 10-year US and Japanese bonds, which favors the US Dollar against the Japanese Yen.
The Japanese Yen is often seen as a safe-haven investment. This means that in times of market stress, investors are more likely to put their money in the Japanese currency due to its supposed reliability and stability. Turbulent times are likely to strengthen the Yen’s value against other currencies seen as more risky to invest in.
- GBP/USD depreciates as recent US jobs data reduced the odds of an aggressive Fed rate cut in September.
- The CME FedWatch Tool indicates that the likelihood of a 50 bps rate cut has slightly decreased to 29.0%.
- The upcoming UK labor market report could significantly influence market expectations regarding the BoE’s policy outlook in 2024.
GBP/USD extends its losing streak for the third successive day, trading around 1.3060 during the Asian session on Tuesday. The downside of the pair could be attributed to the improved US Dollar (USD), which received support as recent US labor data raised uncertainty over the likelihood of an aggressive interest rate cut by the Federal Reserve (Fed) at its September meeting.
According to the CME FedWatch Tool, markets are fully anticipating at least a 25 basis point (bps) rate cut by the Federal Reserve at its September meeting. The likelihood of a 50 bps rate cut has slightly decreased to 29.0%, down from 30.0% a week ago.
Federal Reserve (Fed) Bank of Chicago President Austan Goolsbee remarked on Friday that Fed officials are starting to align with the broader market's sentiment that a policy rate adjustment by the US central bank is imminent, according to CNBC.
In the United Kingdom, investors are closely watching the employment data for the quarter ending in July, which is scheduled for release on Tuesday. This labor market report could significantly influence market expectations regarding the Bank of England's (BoE) interest rate decisions for the remainder of the year.
Projections indicate that the ILO Unemployment Rate might edge down to 4.1% from 4.2%. Meanwhile, Average Earnings, including bonuses, are expected to slow to 4.1%, down from the previous 4.5%. A slowdown in wage growth could strengthen expectations for additional interest rate cuts by the Bank of England, as it may signal a potential easing of inflationary pressures in the services sector.
Pound Sterling FAQs
The Pound Sterling (GBP) is the oldest currency in the world (886 AD) and the official currency of the United Kingdom. It is the fourth most traded unit for foreign exchange (FX) in the world, accounting for 12% of all transactions, averaging $630 billion a day, according to 2022 data. Its key trading pairs are GBP/USD, aka ‘Cable’, which accounts for 11% of FX, GBP/JPY, or the ‘Dragon’ as it is known by traders (3%), and EUR/GBP (2%). The Pound Sterling is issued by the Bank of England (BoE).
The single most important factor influencing the value of the Pound Sterling is monetary policy decided by the Bank of England. The BoE bases its decisions on whether it has achieved its primary goal of “price stability” – a steady inflation rate of around 2%. Its primary tool for achieving this is the adjustment of interest rates. When inflation is too high, the BoE will try to rein it in by raising interest rates, making it more expensive for people and businesses to access credit. This is generally positive for GBP, as higher interest rates make the UK a more attractive place for global investors to park their money. When inflation falls too low it is a sign economic growth is slowing. In this scenario, the BoE will consider lowering interest rates to cheapen credit so businesses will borrow more to invest in growth-generating projects.
Data releases gauge the health of the economy and can impact the value of the Pound Sterling. Indicators such as GDP, Manufacturing and Services PMIs, and employment can all influence the direction of the GBP. A strong economy is good for Sterling. Not only does it attract more foreign investment but it may encourage the BoE to put up interest rates, which will directly strengthen GBP. Otherwise, if economic data is weak, the Pound Sterling is likely to fall.
Another significant data release for the Pound Sterling is the Trade Balance. This indicator measures the difference between what a country earns from its exports and what it spends on imports over a given period. If a country produces highly sought-after exports, its currency will benefit purely from the extra demand created from foreign buyers seeking to purchase these goods. Therefore, a positive net Trade Balance strengthens a currency and vice versa for a negative balance.
| Index | Change, points | Closed | Change, % |
|---|---|---|---|
| NIKKEI 225 | -175.72 | 36215.75 | -0.48 |
| Hang Seng | -247.34 | 17196.96 | -1.42 |
| KOSPI | -8.35 | 2535.93 | -0.33 |
| ASX 200 | -25.3 | 7988.1 | -0.32 |
| DAX | 141.66 | 18443.56 | 0.77 |
| CAC 40 | 72.96 | 7425.26 | 0.99 |
| Dow Jones | 484.18 | 40829.59 | 1.2 |
| S&P 500 | 62.63 | 5471.05 | 1.16 |
| NASDAQ Composite | 193.77 | 16884.6 | 1.16 |
| Pare | Closed | Change, % |
|---|---|---|
| AUDUSD | 0.66613 | -0.14 |
| EURJPY | 157.988 | 0.23 |
| EURUSD | 1.10364 | -0.45 |
| GBPJPY | 187.151 | 0.23 |
| GBPUSD | 1.30737 | -0.45 |
| NZDUSD | 0.61444 | -0.46 |
| USDCAD | 1.35548 | -0.09 |
| USDCHF | 0.84925 | 0.72 |
| USDJPY | 143.15 | 0.69 |


© 2000-2026. Sva prava zaštićena.
Sajt je vlasništvo kompanije Teletrade D.J. LLC 2351 LLC 2022 (Euro House, Richmond Hill Road, Kingstown, VC0100, St. Vincent and the Grenadines).
Svi podaci koji se nalaze na sajtu ne predstavljaju osnovu za donošenje investicionih odluka, već su informativnog karaktera.
The company does not serve or provide services to customers who are residents of the US, Canada, Iran, The Democratic People's Republic of Korea, Yemen and FATF blacklisted countries.
Izvršenje trgovinskih operacija sa finansijskim instrumentima upotrebom marginalne trgovine pruža velike mogućnosti i omogućava investitorima ostvarivanje visokih prihoda. Međutim, takav vid trgovine povezan je sa potencijalno visokim nivoom rizika od gubitka sredstava. Проведение торговых операций на финанcовых рынках c маржинальными финанcовыми инcтрументами открывает широкие возможноcти, и позволяет инвеcторам, готовым пойти на риcк, получать выcокую прибыль, но при этом неcет в cебе потенциально выcокий уровень риcка получения убытков. Iz tog razloga je pre započinjanja trgovine potrebno odlučiti o izboru odgovarajuće investicione strategije, uzimajući u obzir raspoložive resurse.
Upotreba informacija: U slučaju potpunog ili delimičnog preuzimanja i daljeg korišćenja materijala koji se nalazi na sajtu, potrebno je navesti link odgovarajuće stranice na sajtu kompanije TeleTrade-a kao izvora informacija. Upotreba materijala na internetu mora biti praćena hiper linkom do web stranice teletrade.org. Automatski uvoz materijala i informacija sa stranice je zabranjen.
Ako imate bilo kakvih pitanja, obratite nam se pr@teletrade.global.
транcфери