- Analiza
- Novosti i instrumenti
- Vesti sa tržišta
Forex-novosti i prognoze od 09-07-2024
- EUR/USD continues to chill after testing above 1.0840 this week.
- Fedspeak from Fed Chair Powell failed to deliver a dovish-enough stance.
- US inflation data to be the key print later in the week.
EUR/USD continues to settle closer to 1.0800 after a misfire in market expectations of Federal Reserve (Fed) Chairman Jerome Powell’s testimony before US Congress on Tuesday. Despite a head nod to improving inflation figures, the Fed is still leaning firmly in a cautionary stance, pulling the rug from beneath markets that were coiled in anticipation of a tonal shift from Fed policymakers.
Forex Today: Focus remains on Powell and Fedspeak
Traders are battening down the hatches for the wait to key US inflation data prints later in the week, with a smattering of Fed speakers and Fed Chair Powell’s second round of testifying due on Wednesday.
US Consumer Price Index (CPI) inflation data slated for Thursday will be the key driver of market volumes in the back half of the trading week. Investors hungry for rate cuts will be looking for CPI inflation to churn lower, but median market forecasting models broadly expect annualized core CPI for the year ended in June to hold steady at 3.4% YoY, while headline CPI inflation is expected to tick upwards to 0.1% MoM in June versus the previous flat print of 0.0%.
Initial Jobless Claims for the week ended July 5 are also on the docket for Thursday, and are forecast to tick down to 236K from the previous 238K.
Finally, German Harmonized Index of Consumer Prices (HICP) inflation figures are due early Thursday, but YoY German inflation in June is expected to hold steady at the previous print of 2.5%.
EUR/USD technical outlook
The Fiber is on a slow grind near 1.0800 after peaking earlier this week just north of 1.0840, and intraday price action is getting squeezed between downside pressure and technical support from the 200-hour Exponential Moving Average (EMA) at 1.0787.
EUR/USD looks set to run out of gas in a near-term bullish push from the last swing low near 1.0660. With momentum draining out of the Fiber, the pair is set for a tumble back below the 200-day EMA at 1.0784.
EUR/USD hourly chart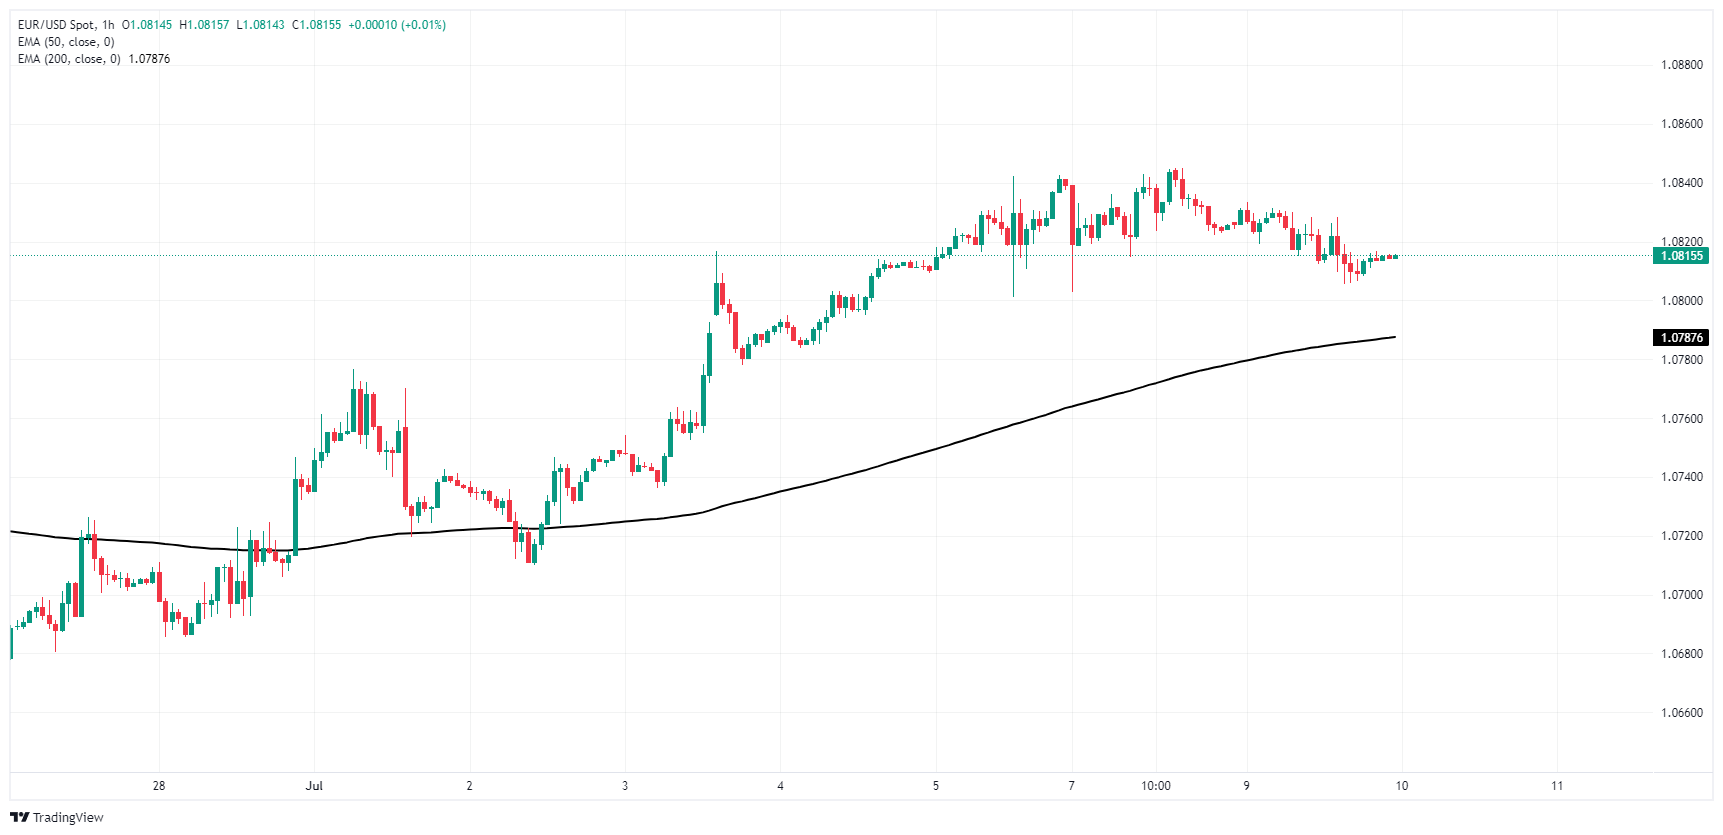
EUR/USD daily chart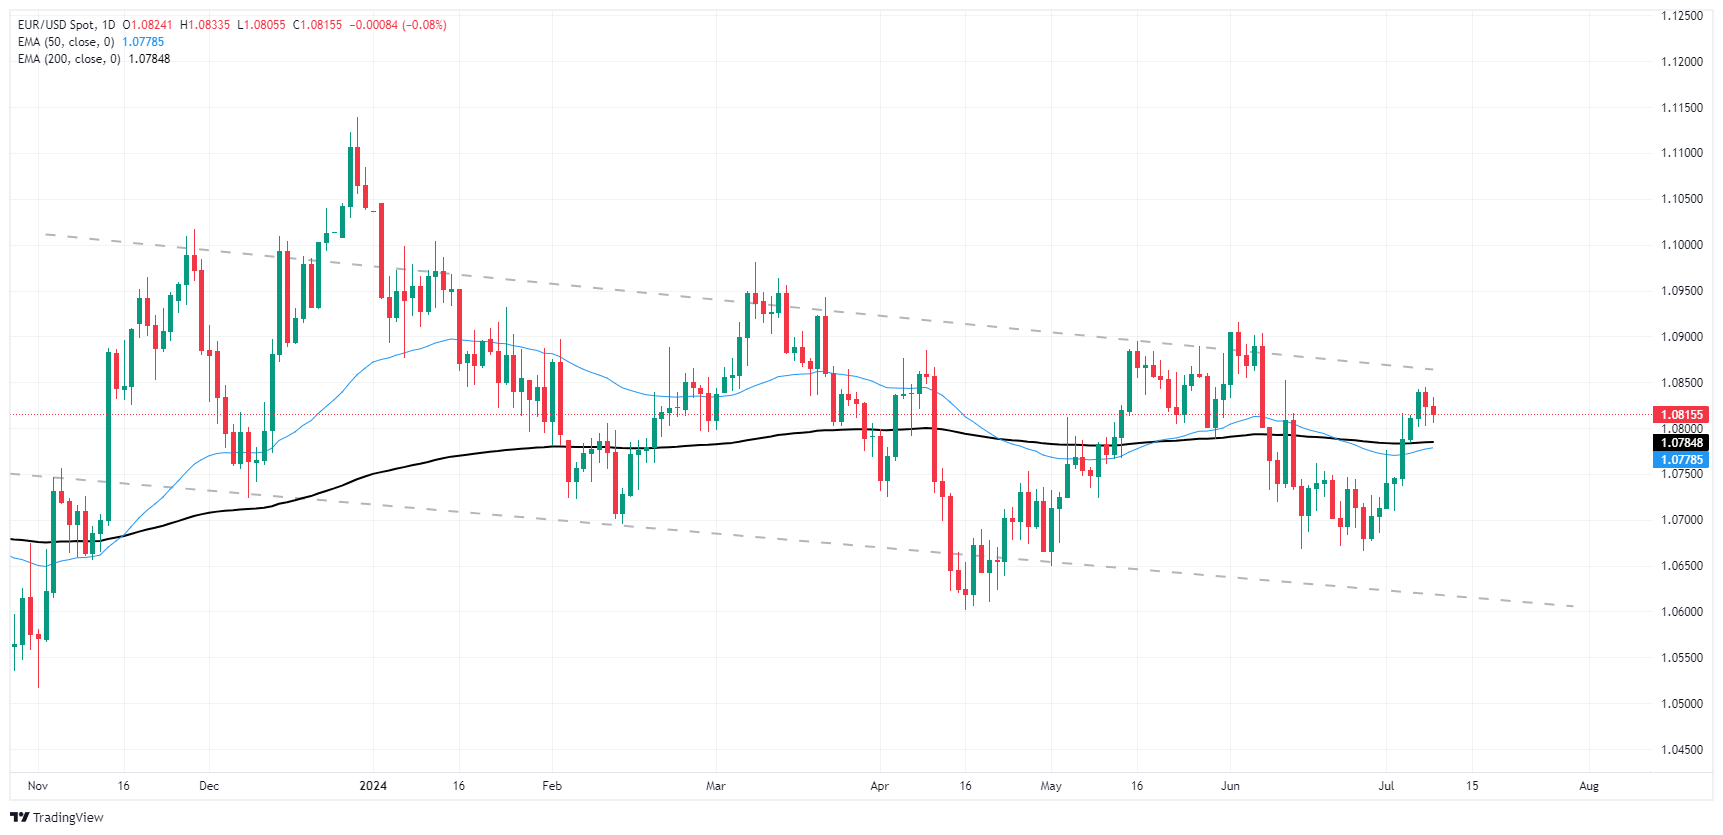
Euro FAQs
The Euro is the currency for the 20 European Union countries that belong to the Eurozone. It is the second most heavily traded currency in the world behind the US Dollar. In 2022, it accounted for 31% of all foreign exchange transactions, with an average daily turnover of over $2.2 trillion a day. EUR/USD is the most heavily traded currency pair in the world, accounting for an estimated 30% off all transactions, followed by EUR/JPY (4%), EUR/GBP (3%) and EUR/AUD (2%).
The European Central Bank (ECB) in Frankfurt, Germany, is the reserve bank for the Eurozone. The ECB sets interest rates and manages monetary policy. The ECB’s primary mandate is to maintain price stability, which means either controlling inflation or stimulating growth. Its primary tool is the raising or lowering of interest rates. Relatively high interest rates – or the expectation of higher rates – will usually benefit the Euro and vice versa. The ECB Governing Council makes monetary policy decisions at meetings held eight times a year. Decisions are made by heads of the Eurozone national banks and six permanent members, including the President of the ECB, Christine Lagarde.
Eurozone inflation data, measured by the Harmonized Index of Consumer Prices (HICP), is an important econometric for the Euro. If inflation rises more than expected, especially if above the ECB’s 2% target, it obliges the ECB to raise interest rates to bring it back under control. Relatively high interest rates compared to its counterparts will usually benefit the Euro, as it makes the region more attractive as a place for global investors to park their money.
Data releases gauge the health of the economy and can impact on the Euro. Indicators such as GDP, Manufacturing and Services PMIs, employment, and consumer sentiment surveys can all influence the direction of the single currency. A strong economy is good for the Euro. Not only does it attract more foreign investment but it may encourage the ECB to put up interest rates, which will directly strengthen the Euro. Otherwise, if economic data is weak, the Euro is likely to fall. Economic data for the four largest economies in the euro area (Germany, France, Italy and Spain) are especially significant, as they account for 75% of the Eurozone’s economy.
Another significant data release for the Euro is the Trade Balance. This indicator measures the difference between what a country earns from its exports and what it spends on imports over a given period. If a country produces highly sought after exports then its currency will gain in value purely from the extra demand created from foreign buyers seeking to purchase these goods. Therefore, a positive net Trade Balance strengthens a currency and vice versa for a negative balance.
- USD/CAD consolidates near 1.3635 in Wednesday’s early Asian session.
- Fed’s Powell said ”more good data" could open the door to rate cuts.
- The weaker Canadian employment data has spurred the BoC rate cuts expectation.
The USD/CAD pair remains capped within a narrow trading range around 1.3635 during the early Asian session on Wednesday. Meanwhile, the USD Index (DXY) consolidates its gains past the 105.00 hurdle as traders await the second semi-annual testimony by Federal Reserve (Fed) Chair Jerome Powell, along with speeches by the Fed’sMichelle Bowman and Austan Goolsbee.
On Tuesday, Fed’s Powell delivered the Semi-Annual Monetary Policy Report and responded to questions before the Senate Banking Committee on the first day of his Congressional testimony. Powell said that holding interest rates too high for too long could affect economic growth. He further stated that "more good data" could open the door to interest rate cuts as recent data indicated that the labor market and inflation are continuing to cool.
The US central bank has kept the Fed's federal fund rate in a range of 5.25%-5.50% since July of 2023, the highest in 23 years after inflation hit its highest level since the early 1980s. According to data from the CME FedWatch Tool, investors are now pricing in 74% odds of a Fed rate cut in September, up from 71% last Friday. However, the Federal Open Market Committee (FOMC) members at their June meeting indicated just one cut this year. The expectation of a Fed rate cut might exert some selling pressure on the US Dollar (USD) in the near term.
On the other hand, the weaker-than-expected Canadian labour market data has triggered speculation about the Bank of Canada (BoC) rate cut. The country’s Unemployment Rate rose to 6.4% in June from 6.2% in May. A National Bank economist said that the Unemployment Rate in Canada might hit or exceed 7% this year if the BoC doesn’t make interest rate cuts “sooner than later.”
Elsewhere, crude oil prices decline for the third consecutive day as hurricane-driven supply concerns dwindled and geopolitical jitters remained subdued. Nonetheless, the rebound of oil prices might lift the commodity-linked Canadian Dollar (CAD) as Canada is the major crude oil exporter to the United States.
Canadian Dollar FAQs
The key factors driving the Canadian Dollar (CAD) are the level of interest rates set by the Bank of Canada (BoC), the price of Oil, Canada’s largest export, the health of its economy, inflation and the Trade Balance, which is the difference between the value of Canada’s exports versus its imports. Other factors include market sentiment – whether investors are taking on more risky assets (risk-on) or seeking safe-havens (risk-off) – with risk-on being CAD-positive. As its largest trading partner, the health of the US economy is also a key factor influencing the Canadian Dollar.
The Bank of Canada (BoC) has a significant influence on the Canadian Dollar by setting the level of interest rates that banks can lend to one another. This influences the level of interest rates for everyone. The main goal of the BoC is to maintain inflation at 1-3% by adjusting interest rates up or down. Relatively higher interest rates tend to be positive for the CAD. The Bank of Canada can also use quantitative easing and tightening to influence credit conditions, with the former CAD-negative and the latter CAD-positive.
The price of Oil is a key factor impacting the value of the Canadian Dollar. Petroleum is Canada’s biggest export, so Oil price tends to have an immediate impact on the CAD value. Generally, if Oil price rises CAD also goes up, as aggregate demand for the currency increases. The opposite is the case if the price of Oil falls. Higher Oil prices also tend to result in a greater likelihood of a positive Trade Balance, which is also supportive of the CAD.
While inflation had always traditionally been thought of as a negative factor for a currency since it lowers the value of money, the opposite has actually been the case in modern times with the relaxation of cross-border capital controls. Higher inflation tends to lead central banks to put up interest rates which attracts more capital inflows from global investors seeking a lucrative place to keep their money. This increases demand for the local currency, which in Canada’s case is the Canadian Dollar.
Macroeconomic data releases gauge the health of the economy and can have an impact on the Canadian Dollar. Indicators such as GDP, Manufacturing and Services PMIs, employment, and consumer sentiment surveys can all influence the direction of the CAD. A strong economy is good for the Canadian Dollar. Not only does it attract more foreign investment but it may encourage the Bank of Canada to put up interest rates, leading to a stronger currency. If economic data is weak, however, the CAD is likely to fall.
- WTI backslid to $81.00 as energy market concerns weigh heavy.
- API reported a second, albeit smaller drawdown in US Crude Oil supplies.
- Chinese demand remains lower than expected in 2024, risk bid from Beryl evaporates.
West Texas Intermediate (WTI) US Crude Oil extended a near term decline on Tuesday, falling to $81.00 per barrel as American Crude Oil markets continue to struggle to find consistent bullish momentum.
The American Petroleum Institute (API) reported another week-on-week decline in US Weekly Crude Oil Stock for the week ended July 5. According to the API, US weekly barrel counts fell by another 1.9 million, adding to the previous week’s sharp decline of 9.163 million and undershooting the forecast -250K barrel drawdown. Crude Oil prices remain tepid to soft on Tuesday as US Distillate Stocks, Crude Oil derivatives primarily used for diesel and home heating and cooling production bounced 2.3 million and entirely missing the forecast decline of -740K drawdown.
Chinese demand continues to undershoot broad market expectations for overall upticks in Asian fossil fuel usage. Crude Oil bullish momentum that hinged on an uptick of demand earlier in the year has thus far not born fruit.
Tropical Storm Beryl, which was downgraded from a category 1 hurricane, also failed to disrupt US Crude Oil markets as much as barrel traders had initially feared, kicking the legs out from underneath a near-term bullish push and keeping WTI bids pinned on the low side.
Economic Indicator
API Weekly Crude Oil Stock
API’s Weekly Statistical Bulletin (WSB) has reported total U.S. and regional data relating to refinery operations and the production of the four major petroleum products: motor gasoline, kerosene jet fuel, distillate (by sulfur content), and residual fuel oil. These products represent more than 85% of total petroleum industry.
Read more.Last release: Tue Jul 09, 2024 20:30
Frequency: Weekly
Actual: -1.9M
Consensus: -0.25M
Previous: -9.163M
Source: American Petroleum Institute
WTI technical outlook
WTI remains mired in near-term technical consolidation, backsliding below previous technical support from $81.50 and slipping beneath the 200-hour Exponential Moving Average (EMA) at $81.96.
Daily candles broke north of a consolidation pattern cooked into the charts from mid-June, but price action has fallen back into technical congestion as bears look set to drag bids down to the 200-day EMA at $79.19.
WTI hourly chart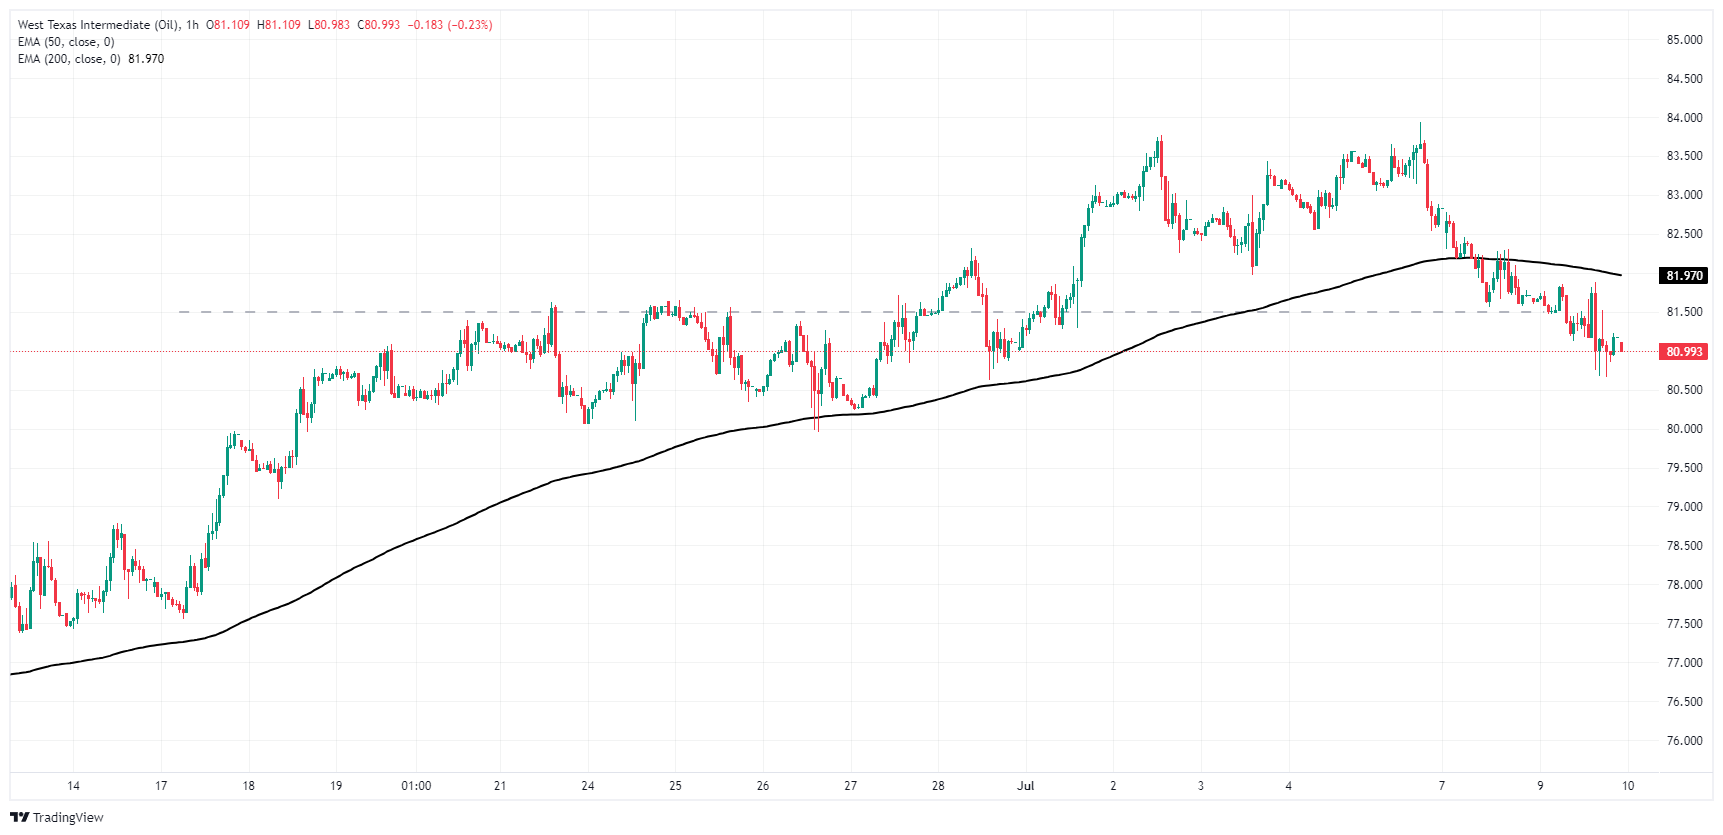
WTI daily chart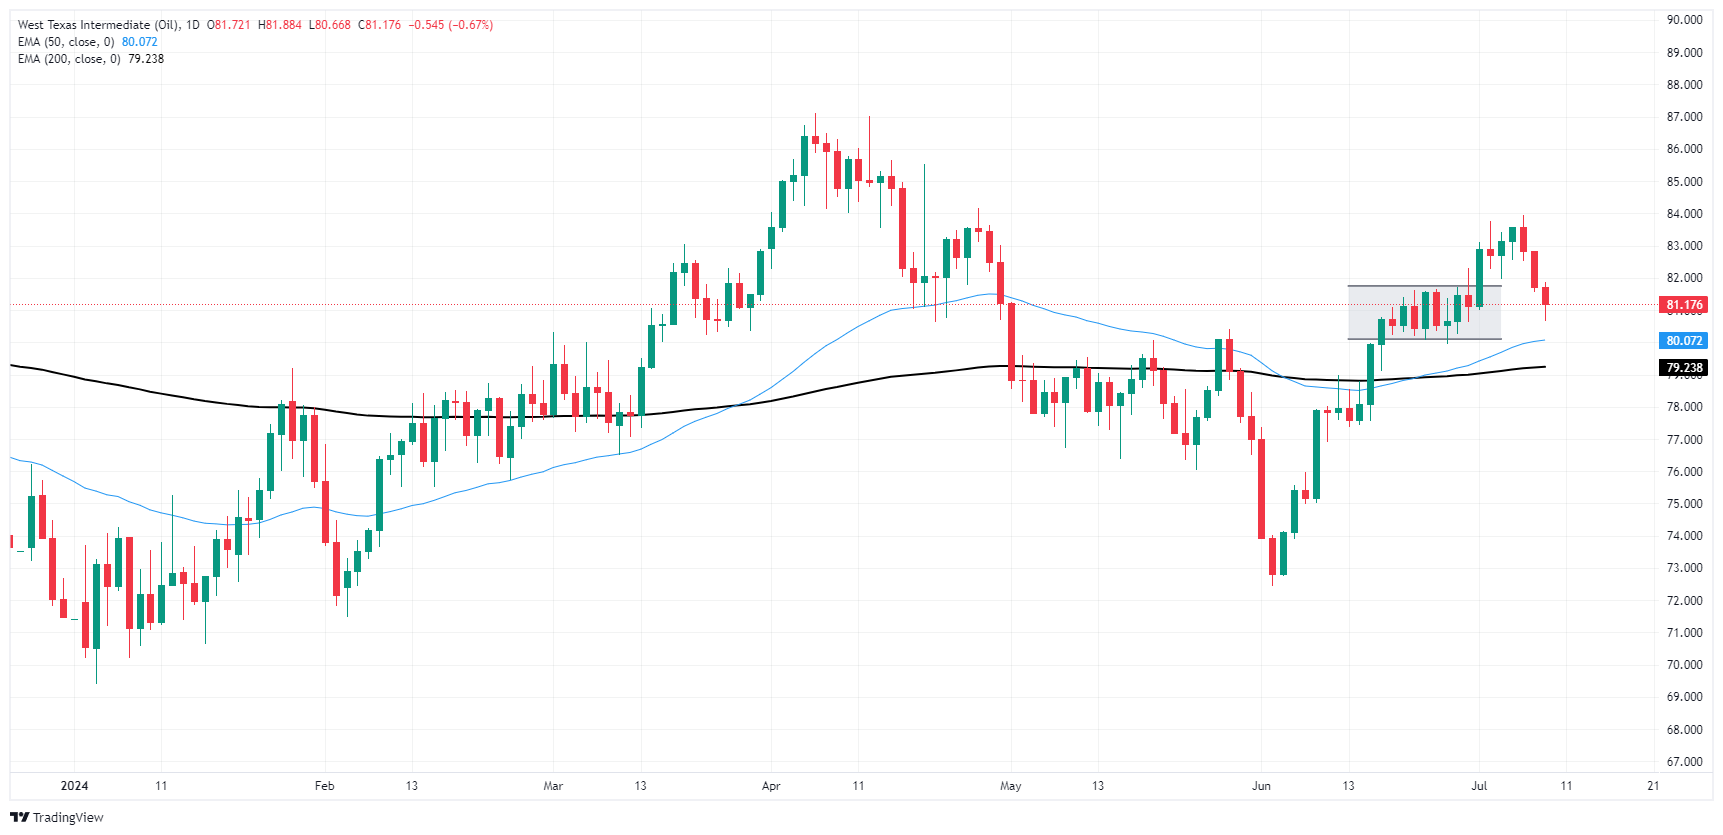
WTI Oil FAQs
WTI Oil is a type of Crude Oil sold on international markets. The WTI stands for West Texas Intermediate, one of three major types including Brent and Dubai Crude. WTI is also referred to as “light” and “sweet” because of its relatively low gravity and sulfur content respectively. It is considered a high quality Oil that is easily refined. It is sourced in the United States and distributed via the Cushing hub, which is considered “The Pipeline Crossroads of the World”. It is a benchmark for the Oil market and WTI price is frequently quoted in the media.
Like all assets, supply and demand are the key drivers of WTI Oil price. As such, global growth can be a driver of increased demand and vice versa for weak global growth. Political instability, wars, and sanctions can disrupt supply and impact prices. The decisions of OPEC, a group of major Oil-producing countries, is another key driver of price. The value of the US Dollar influences the price of WTI Crude Oil, since Oil is predominantly traded in US Dollars, thus a weaker US Dollar can make Oil more affordable and vice versa.
The weekly Oil inventory reports published by the American Petroleum Institute (API) and the Energy Information Agency (EIA) impact the price of WTI Oil. Changes in inventories reflect fluctuating supply and demand. If the data shows a drop in inventories it can indicate increased demand, pushing up Oil price. Higher inventories can reflect increased supply, pushing down prices. API’s report is published every Tuesday and EIA’s the day after. Their results are usually similar, falling within 1% of each other 75% of the time. The EIA data is considered more reliable, since it is a government agency.
OPEC (Organization of the Petroleum Exporting Countries) is a group of 13 Oil-producing nations who collectively decide production quotas for member countries at twice-yearly meetings. Their decisions often impact WTI Oil prices. When OPEC decides to lower quotas, it can tighten supply, pushing up Oil prices. When OPEC increases production, it has the opposite effect. OPEC+ refers to an expanded group that includes ten extra non-OPEC members, the most notable of which is Russia.
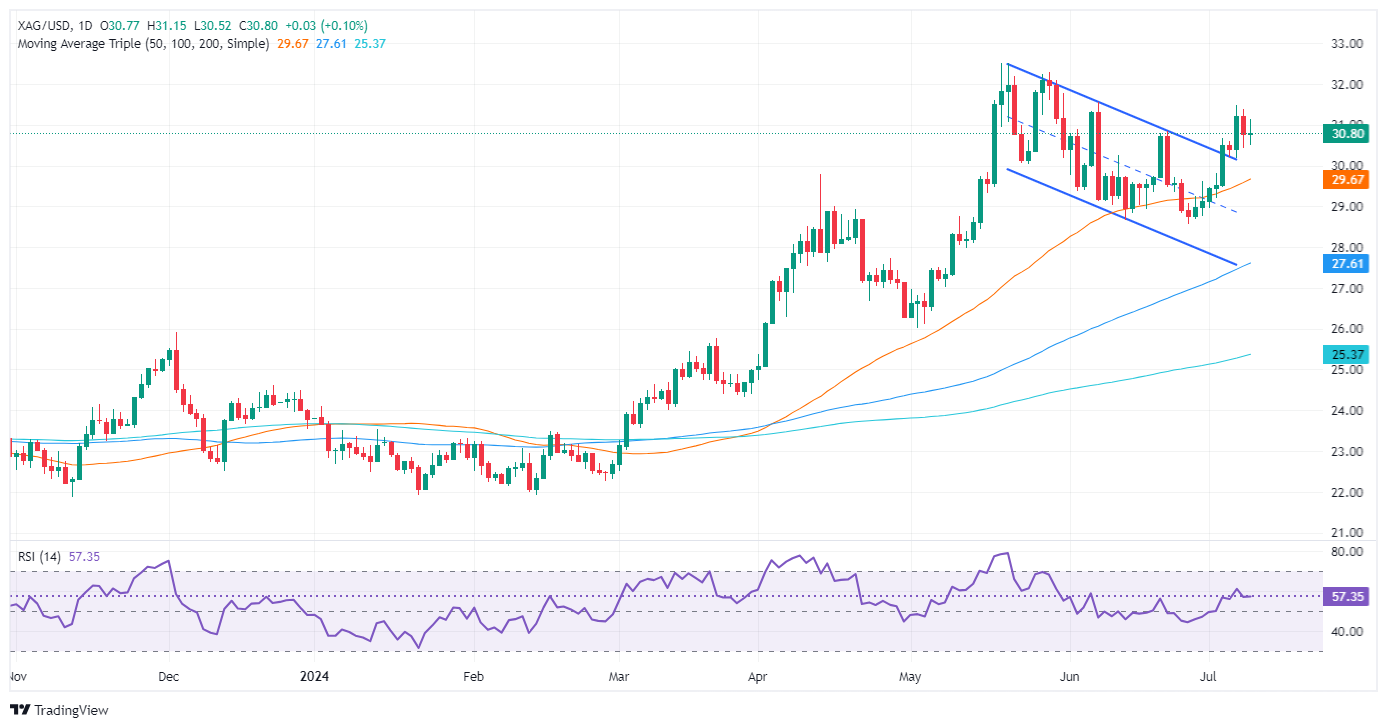
- Silver steadies following Monday’s drop below $31.00, showing slight recovery.
- RSI indicates upward momentum with potential for a ‘double bottom’ breakout if $31.00 is cleared.
- Key resistance at $32.29 and YTD high of $32.51; support at $30.18 and $28.57 if sellers take control.
Silver price stabilizes above the $30.50 area for the second straight day, following Monday’s losses of more than 1.20% that tumbled the grey’s metal price beneath the $31.00 figure. At the time of writing, the XAG/USD traded at $30.79 and gained some 0.03% on Tuesday.
XAG/USD Price Analysis: Technical outlook
Silver remains upward biased, with momentum backing buyers, as shown by the Relative Strength Index (RSI). Further, a ‘double bottom’ looms, though the tug-of-war between bulls and bears around the crucial June 21 high turned support at $30.84 remains, keeping buyers at bay.
However, if they clear the $31.00 mark, the next resistance would be the May 29 high at 32.29, ahead of testing the year-to-date (YTD) high of $32.51. A breach of the latter will expose the psychological $33.00 figure.
Conversely, if sellers drag XAG/USD’s price below the July 5 low of $30.18, that will expose the $30.00 mark. Once hurdle, the next stop would be the June 26 last cycle low at $28.57.
XAG/USD Price Action – Daily Chart
Silver FAQs
Silver is a precious metal highly traded among investors. It has been historically used as a store of value and a medium of exchange. Although less popular than Gold, traders may turn to Silver to diversify their investment portfolio, for its intrinsic value or as a potential hedge during high-inflation periods. Investors can buy physical Silver, in coins or in bars, or trade it through vehicles such as Exchange Traded Funds, which track its price on international markets.
Silver prices can move due to a wide range of factors. Geopolitical instability or fears of a deep recession can make Silver price escalate due to its safe-haven status, although to a lesser extent than Gold's. As a yieldless asset, Silver tends to rise with lower interest rates. Its moves also depend on how the US Dollar (USD) behaves as the asset is priced in dollars (XAG/USD). A strong Dollar tends to keep the price of Silver at bay, whereas a weaker Dollar is likely to propel prices up. Other factors such as investment demand, mining supply – Silver is much more abundant than Gold – and recycling rates can also affect prices.
Silver is widely used in industry, particularly in sectors such as electronics or solar energy, as it has one of the highest electric conductivity of all metals – more than Copper and Gold. A surge in demand can increase prices, while a decline tends to lower them. Dynamics in the US, Chinese and Indian economies can also contribute to price swings: for the US and particularly China, their big industrial sectors use Silver in various processes; in India, consumers’ demand for the precious metal for jewellery also plays a key role in setting prices.
Silver prices tend to follow Gold's moves. When Gold prices rise, Silver typically follows suit, as their status as safe-haven assets is similar. The Gold/Silver ratio, which shows the number of ounces of Silver needed to equal the value of one ounce of Gold, may help to determine the relative valuation between both metals. Some investors may consider a high ratio as an indicator that Silver is undervalued, or Gold is overvalued. On the contrary, a low ratio might suggest that Gold is undervalued relative to Silver.
- The NZD/JPY sees a slight rise, inching towards 98.80.
- Bulls keep getting rejected by the 99.00 area.
- Immediate supports are poised at 98.00 and 97.70, as likely areas for possible downward corrections.
In the Tuesday trading session, the NZD/JPY pair exhibited a minor uptick, hovering near the 99.00 mark. However, it seems to have hit a ceiling at this level and is struggling to break past it.
In terms of the daily chart, the Relative Strength Index (RSI) is currently at 71, a mild increase from Monday's reading. While this increase indicates a slight surge in the bullish momentum, the continued stay of the RSI in the overbought zone may suggest that a pullback is possible. The Moving Average Convergence Divergence (MACD) reflects with decreasing green bars, which may support the perspective of overextended movements and a likely pullback.
NZD/JPY daily chart
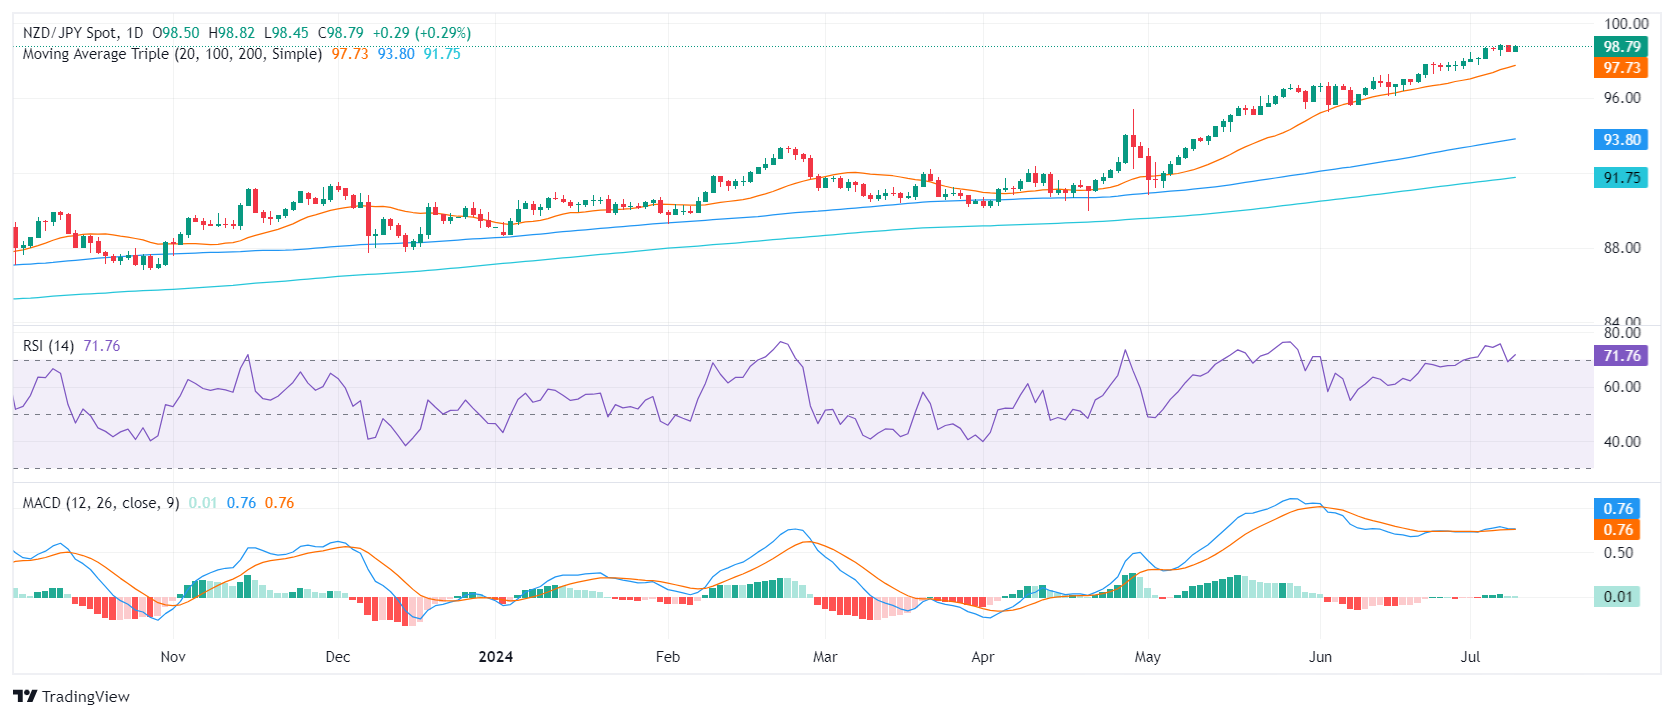
In the event of a downward correction, immediate support is seen around the 98.00, 97.70 (20-day SMA) and 97.00 markers. Buyers need to focus on sustaining these levels before attempting to achieve new highs. If the 97.00 level successfully combats the bearish forces, buyers may seek to retest the 99.00 area, and potentially the 100.00 level.
- GBP/JPY churns the waters just north of 206.00.
- UK and Japan data remain limited this week, market flows set to continue.
- UK industrial and manufacturing output figures due later in the week.
GBP/JPY failed to set a new multi-year high on Tuesday as the pair churns on the high end of the 206.00 handle. Long-running Yen weakness has left the pair stuck in the rafters of its highest prices in 16 years.
Data remains thin this week for the Japanese Yen (JPY), but broader markets continue to keep an eye out for any signs of direct market intervention from the Bank of Japan (BoJ) that have routinely lamented the Yen’s poor performance against the majority of its major currency peers. However, a rock-bottom Japanese reference rate and a still-wide rate differential between the Yen and the rest of the major currency bloc has left the JPY with little direction to move but down.
UK data is strictly mid-tier this week, with GBP traders looking ahead to Industrial and Manufacturing Production figures due in the back half of the trading week on Thursday. A couple of appearances from Bank of England (BoE) policymakers are slated for early Wednesday but are not expected to rock the policy boat.
Thursday’s UK Industrial Production in May is expected to rebound to 0.2% MoM from the previous month’s -0.9% contraction, and UK Manufacturing Production is forecast to recover 0.4% MoM from the previous -1.4% decline.
GBP/JPY technical outlook
GBP/JPY fell away from fresh 16-year highs above 206.50 set earlier in the week, settling back into familiar intraday territory at the 206.00 handle. Technical pressure is still firmly pinned into the bullish side, but topside momentum is showing signs of petering out, and progress in swing highs is slowly rapidly as bidders run out of gas.
Spinning top daily candles are getting priced into the Guppy charts, and traders should be on the lookout for a retreat to the 50-day Exponential Moving Average (EMA) near 200.00. Despite odds of a near-term pullback, the long-term trend heavily favors the bulls, and a rebound from major technical levels could be on the cards looking forward.
GBP/JPY hourly chart
GBP/JPY daily chart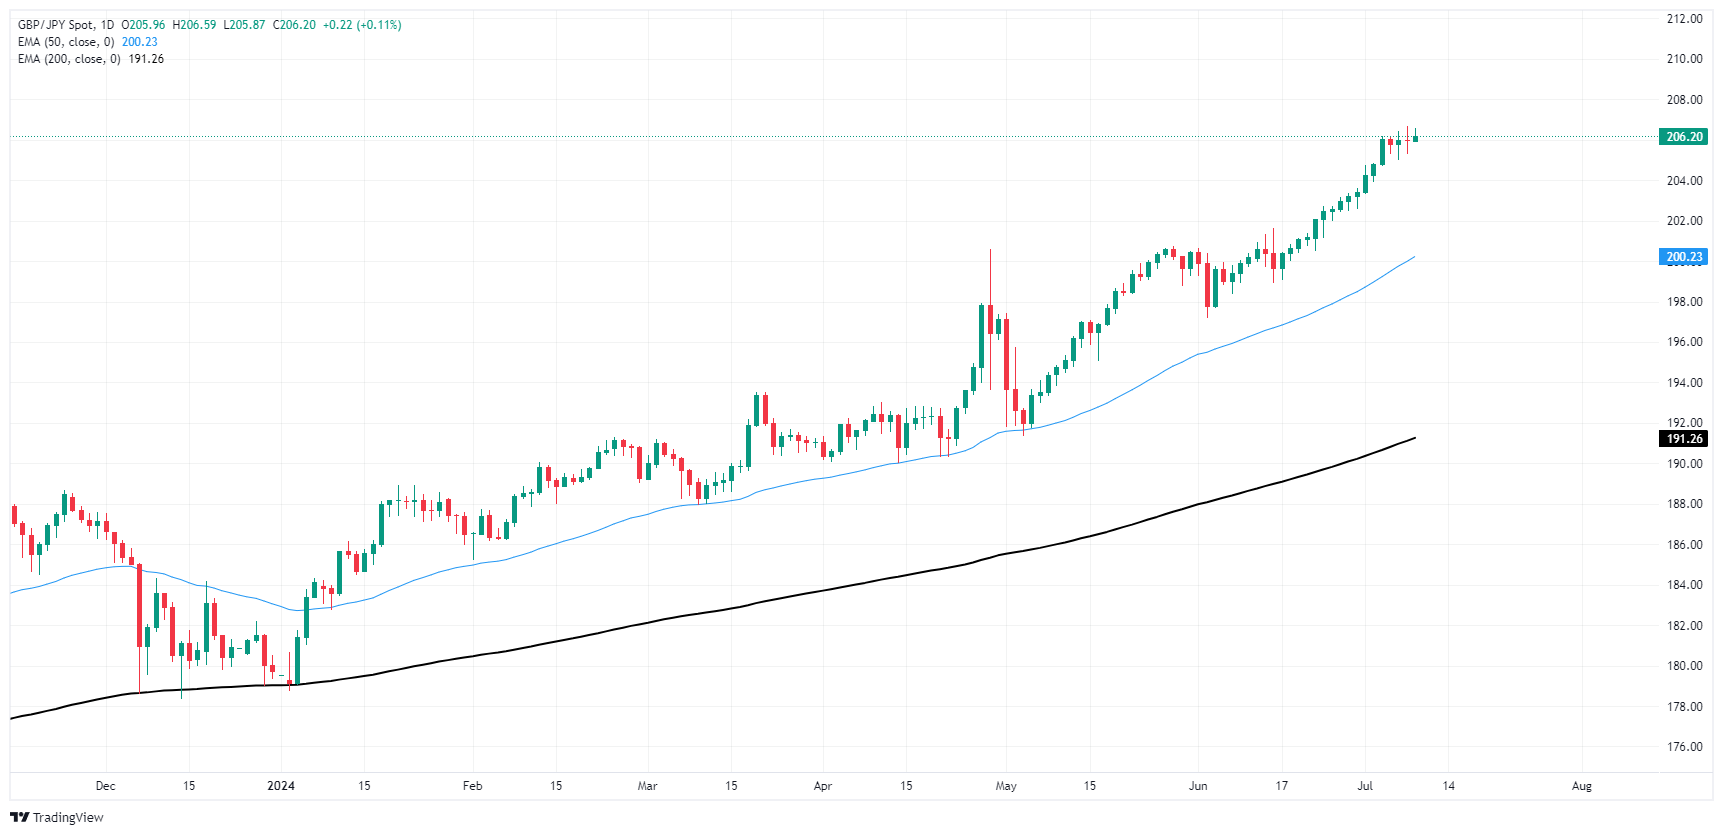
Pound Sterling FAQs
The Pound Sterling (GBP) is the oldest currency in the world (886 AD) and the official currency of the United Kingdom. It is the fourth most traded unit for foreign exchange (FX) in the world, accounting for 12% of all transactions, averaging $630 billion a day, according to 2022 data. Its key trading pairs are GBP/USD, aka ‘Cable’, which accounts for 11% of FX, GBP/JPY, or the ‘Dragon’ as it is known by traders (3%), and EUR/GBP (2%). The Pound Sterling is issued by the Bank of England (BoE).
The single most important factor influencing the value of the Pound Sterling is monetary policy decided by the Bank of England. The BoE bases its decisions on whether it has achieved its primary goal of “price stability” – a steady inflation rate of around 2%. Its primary tool for achieving this is the adjustment of interest rates. When inflation is too high, the BoE will try to rein it in by raising interest rates, making it more expensive for people and businesses to access credit. This is generally positive for GBP, as higher interest rates make the UK a more attractive place for global investors to park their money. When inflation falls too low it is a sign economic growth is slowing. In this scenario, the BoE will consider lowering interest rates to cheapen credit so businesses will borrow more to invest in growth-generating projects.
Data releases gauge the health of the economy and can impact the value of the Pound Sterling. Indicators such as GDP, Manufacturing and Services PMIs, and employment can all influence the direction of the GBP. A strong economy is good for Sterling. Not only does it attract more foreign investment but it may encourage the BoE to put up interest rates, which will directly strengthen GBP. Otherwise, if economic data is weak, the Pound Sterling is likely to fall.
Another significant data release for the Pound Sterling is the Trade Balance. This indicator measures the difference between what a country earns from its exports and what it spends on imports over a given period. If a country produces highly sought-after exports, its currency will benefit purely from the extra demand created from foreign buyers seeking to purchase these goods. Therefore, a positive net Trade Balance strengthens a currency and vice versa for a negative balance.
- The Reserve Bank of New Zealand is expected to keep rates on hold at 5.50% on Wednesday.
- Upside risks to inflation to offset economic concerns, prompting RBNZ to delay any dovish shifts.
- The New Zealand Dollar gears up for intense volatility on the RBNZ policy announcements.
Following its July monetary policy meeting on Wednesday, the Reserve Bank of New Zealand (RBNZ) is set to hold the Official Cash Rate (OCR) at 5.50%, extending the pause into an eighth meeting in a row.
It’s expected to be a straightforward event, with no press conference from RBNZ Governor Adrian Orr and the release of updated economic projections. However, any changes to the RBNZ’s communication could spark a big reaction in the New Zealand Dollar (NZD).
What to expect from the RBNZ interest rate decision?
With discouraging economic performance alongside the persistence of inflation risks, a rates on-hold decision by the RBNZ is widely anticipated by market participants. Therefore, they will look for fresh hints on the timing of the dovish policy pivot in the central bank’s Monetary Policy Statement (MPS).
New Zealand’s annual Consumer Price Index (CPI) increased by 4% in the first quarter, according to data released by Stats NZ, following a 4.7% growth in the 12 months to the December 2023 quarter.
Even though there was progress in disinflation, the non-tradable inflation remained a cause for concern. Non-tradeable inflation was 5.8% in the year to the March quarter, a tad lower than the 5.9% figure seen in the final quarter of 2023.
Meanwhile, Stats NZ showed on June 19 a 0.2% increase in GDP in the first quarter, breaking a streak of quarterly GDP declines that had led to the country's recession in the second half of 2023.
These data sets are likely to support potential delays in the dovish changes to the policy statement's language, despite some analysts arguing against them amidst declining domestic consumer confidence and the deepening contraction in the manufacturing and services sectors.
ANZ - Roy Morgan New Zealand Consumer Confidence fell to 83.0 in June from the previous month's 84.9, sticking close to multi-year lows in the sentiment index. The Business NZ Performance of Services Index (PSI) dropped to 43.0 in May from April’s 46.6 while the Business NZ Performance of Manufacturing Index (PMI) contracted to 47.2 in May, following a 48.8 figure in April.
Previewing the RBNZ policy announcement, analysts at TD Securities noted: “While there are signs of cracks in the economy (e.g., labor market easing, contractionary PMIs), we don't think the RBNZ is in any urgency to ease given the upside risks to inflation, especially from services.”
How will the RBNZ interest decision impact the New Zealand Dollar?
The NZD/USD pair is on the front foot heading into the RBNZ showdown on Wednesday, in the aftermath of the US Dollar (USD) demise induced by Friday’s US labor market data for June. The downward revisions to the April and May employment data prompted investors to ramp up bets that the US Federal Reserve (Fed) will lower interest rates in September.
Furthermore, expectations that the RBNZ will refrain from making any dovish tweaks before the July 16 second-quarter inflation report, help the pair maintain its recent upswing.
“Market has more than fully priced in a November rate cut, with 60% odds of an earlier cut in October,” per BBH Analysts.
If the MPS remains wary of the upside risks to inflation, in the face of sticky non-tradeable goods and services inflation alongside the May Budget release, the Kiwi Dollar could see a fresh leg higher to the June high of 0.6222. On the other hand, NZD/USD is seen falling back toward 0.6000 should the RBNZ do away with its hawkish guidance, hinting at a policy pivot later this year.
Dhwani Mehta, FXStreet’s Senior Analyst, offers a brief technical outlook for trading the New Zealand Dollar on the RBNZ policy announcements: “The NZD/USD pair is consolidating the previous week’s recovery, deriving strength from a bullish 14-day Relative Strength Index (RSI) on the daily time frame.”
“The next bullish target for the Kiwi is seen at the June high of 0.6222, above which the 0.6250 psychological level will challenged. Further up, the 0.6300 threshold will be in sight. Alternatively, a failure to defend the confluence of 100-day and 200-day SMAs at 0.6070 could open the downside toward the 0.6000 level,” Dhwani adds.
Economic Indicator
RBNZ Interest Rate Decision
The Reserve Bank of New Zealand (RBNZ) announces its interest rate decision after its seven scheduled annual policy meetings. If the RBNZ is hawkish and sees inflationary pressures rising, it raises the Official Cash Rate (OCR) to bring inflation down. This is positive for the New Zealand Dollar (NZD) since higher interest rates attract more capital inflows. Likewise, if it reaches the view that inflation is too low it lowers the OCR, which tends to weaken NZD.
Read more.Next release: Wed Jul 10, 2024 02:00
Frequency: Irregular
Consensus: 5.5%
Previous: 5.5%
Source: Reserve Bank of New Zealand
The Reserve Bank of New Zealand (RBNZ) holds monetary policy meetings seven times a year, announcing their decision on interest rates and the economic assessments that influenced their decision. The central bank offers clues on the economic outlook and future policy path, which are of high relevance for the NZD valuation. Positive economic developments and upbeat outlook could lead the RBNZ to tighten the policy by hiking interest rates, which tends to be NZD bullish. The policy announcements are usually followed by Governor Adrian Orr’s press conference.
RBNZ FAQs
The Reserve Bank of New Zealand (RBNZ) is the country’s central bank. Its economic objectives are achieving and maintaining price stability – achieved when inflation, measured by the Consumer Price Index (CPI), falls within the band of between 1% and 3% – and supporting maximum sustainable employment.
The Reserve Bank of New Zealand’s (RBNZ) Monetary Policy Committee (MPC) decides the appropriate level of the Official Cash Rate (OCR) according to its objectives. When inflation is above target, the bank will attempt to tame it by raising its key OCR, making it more expensive for households and businesses to borrow money and thus cooling the economy. Higher interest rates are generally positive for the New Zealand Dollar (NZD) as they lead to higher yields, making the country a more attractive place for investors. On the contrary, lower interest rates tend to weaken NZD.
Employment is important for the Reserve Bank of New Zealand (RBNZ) because a tight labor market can fuel inflation. The RBNZ’s goal of “maximum sustainable employment” is defined as the highest use of labor resources that can be sustained over time without creating an acceleration in inflation. “When employment is at its maximum sustainable level, there will be low and stable inflation. However, if employment is above the maximum sustainable level for too long, it will eventually cause prices to rise more and more quickly, requiring the MPC to raise interest rates to keep inflation under control,” the bank says.
In extreme situations, the Reserve Bank of New Zealand (RBNZ) can enact a monetary policy tool called Quantitative Easing. QE is the process by which the RBNZ prints local currency and uses it to buy assets – usually government or corporate bonds – from banks and other financial institutions with the aim to increase the domestic money supply and spur economic activity. QE usually results in a weaker New Zealand Dollar (NZD). QE is a last resort when simply lowering interest rates is unlikely to achieve the objectives of the central bank. The RBNZ used it during the Covid-19 pandemic.
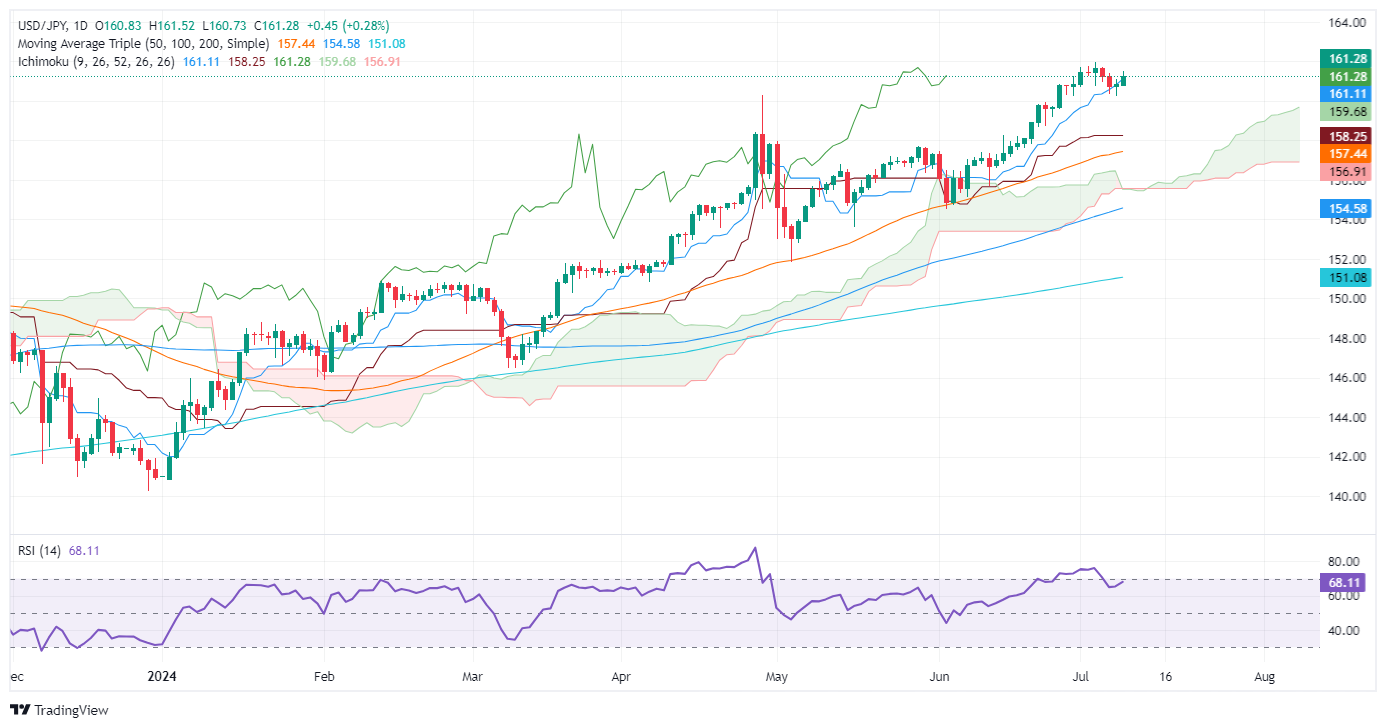
- USD/JPY edges higher eyeing YTD high of 161.95 with strong RSI support.
- Formation of 'morning star' pattern suggests potential for further gains above 162.00.
- Key support at July 8 low of 160.26, with significant resistance at November 1986 high of 164.87.
The USD/JPY advanced for the second straight day and climbed above the 161.00 figure on Tuesday as Fed Chair Jerome Powell remained cautious on rate cuts despite acknowledging that the US central bank's dual mandate risks are more balanced. The pair trades at 161.29 and gains 0.28%.
USD/JPY Price Analysis: Technical outlook
The USD/JPY pair's uptrend is robust, with buyers poised to surpass the year-to-date (YTD) high of 161.95. The bullish Relative Strength Index (RSI) indicates the momentum is in their favor. Despite hovering around overbought conditions, the successive series of higher highs and higher lows justifies another leg up.
The major snapped back-to-back days of losses as a doji emerged on Monday, and today’s price action completed a ‘morning star’ chart pattern, hinting that a higher price loom.
If USD/JPY clears the psychological 161.50, the next resistance would be the YTD high ahead of 162.00. Additional gains lie overhead at the November 1986 high of 164.87.
On the other hand, if sellers step in and drag the USD/JPY exchange rate below the July 8 cycle low of 160.26, that will clear the path to challenging the 160.00 figure.
USD/JPY Price Action – Daily Chart
Japanese Yen FAQs
The Japanese Yen (JPY) is one of the world’s most traded currencies. Its value is broadly determined by the performance of the Japanese economy, but more specifically by the Bank of Japan’s policy, the differential between Japanese and US bond yields, or risk sentiment among traders, among other factors.
One of the Bank of Japan’s mandates is currency control, so its moves are key for the Yen. The BoJ has directly intervened in currency markets sometimes, generally to lower the value of the Yen, although it refrains from doing it often due to political concerns of its main trading partners. The current BoJ ultra-loose monetary policy, based on massive stimulus to the economy, has caused the Yen to depreciate against its main currency peers. This process has exacerbated more recently due to an increasing policy divergence between the Bank of Japan and other main central banks, which have opted to increase interest rates sharply to fight decades-high levels of inflation.
The BoJ’s stance of sticking to ultra-loose monetary policy has led to a widening policy divergence with other central banks, particularly with the US Federal Reserve. This supports a widening of the differential between the 10-year US and Japanese bonds, which favors the US Dollar against the Japanese Yen.
The Japanese Yen is often seen as a safe-haven investment. This means that in times of market stress, investors are more likely to put their money in the Japanese currency due to its supposed reliability and stability. Turbulent times are likely to strengthen the Yen’s value against other currencies seen as more risky to invest in.
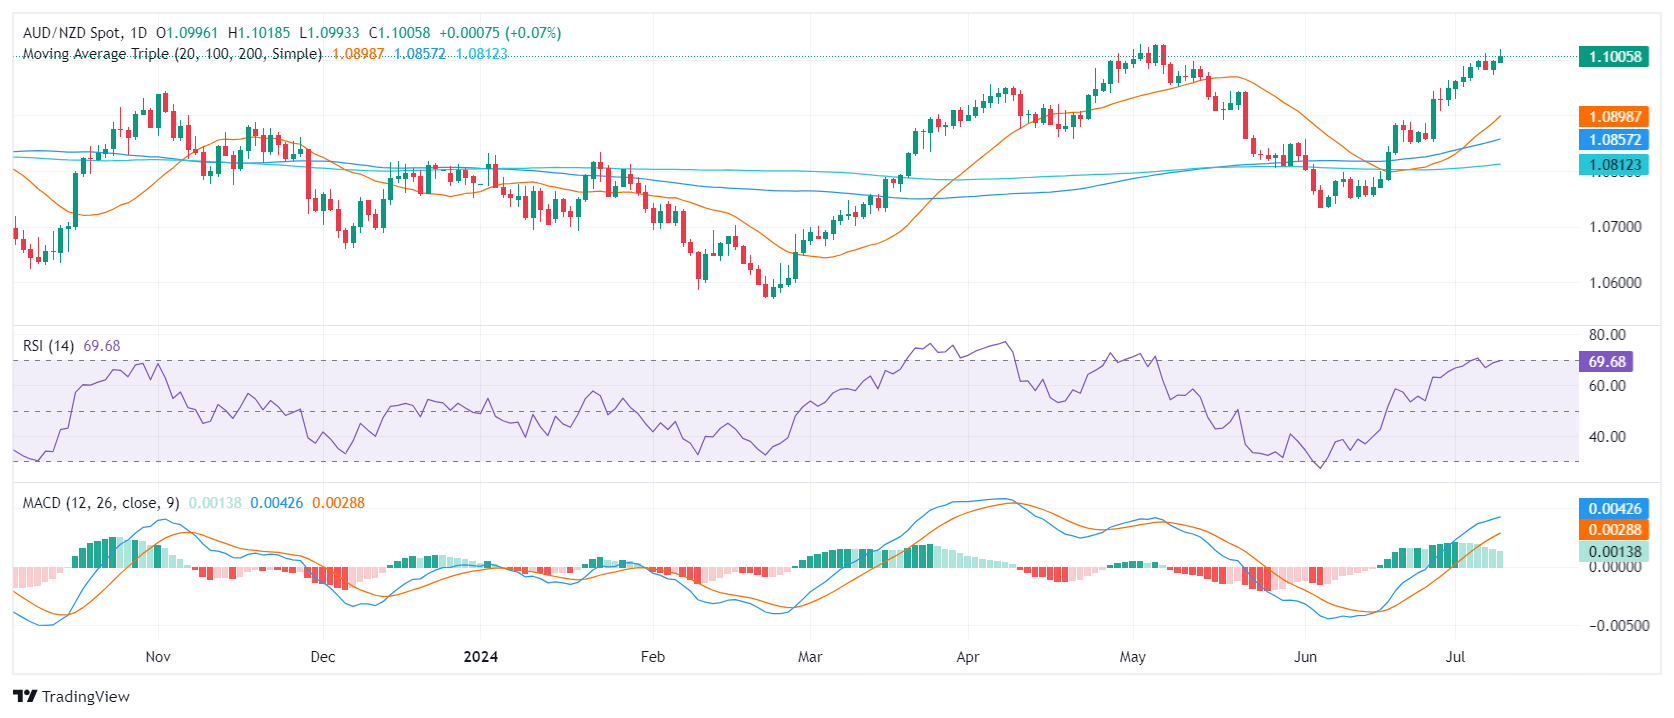
- AUD/NZD saw a mild increase in Tuesday's session but cleared most of its gains.
- RBNZ decision comes up later in the Asian session with a hold priced in.
- The RBA maintains its hawkish tone, promoting a more favorable outlook for the Aussie.
After a climb to the highest level since early May, the AUD/NZD buyers have cleared some gains and the pair faces some consolidation. The market awaits the Reserve Bank of New Zealand (RBNZ) decision later on Tuesday where the Official Cash Rate (OCR) is expected to be maintained at 5.50%.
Despite markets betting on a 60% probability of a rate hike by the end of the year, as suggested in the RBNZ’s May rate path projection, the disinflationary process brought on by New Zealand’s sluggish growth outlook leans the market towards an early rate cut in October, with a November cut fully priced in. In that sense, the Monetary Policy Statement for any possible insights will be closely looked at.
On the other hand, in Australia, the latest hot inflation data has increased market expectations, suggesting high chances of a 25 bps rate hike at the Reserve Bank of Australia (RBA)'s September 24 meeting, which rises to nearly 50% by November 5. Other than the RBNZ decision there won’t be any significant highlight the bank’s decision will dictate the pace of the pair for the rest of the week.
AUD/NZD technical analysis
Short-term, the AUD/NZD maintains a bullish stance clarified by the recent gains. However, nearing overbought conditions suggests the potential for a correction. The Relative Strength Index (RSI) and the Moving Average Convergence Divergence (MACD) both indicate that a correction may be looming as buyers lose steam.
Support levels continue to lie at 1.1000, 1.0950, and 1.0930. The 1.1000 target remains the next task for the buyers to retain.
AUD/NZD daily chart
- Gold prices rise above $2,360 after Powell’s Senate testimony indicates a cautious approach to rate cuts.
- US 10-year Treasury yield edges up to 4.296%, while DXY gains 0.14%.
- World Gold Council reports second month of ETF inflows, contrasting with PBoC’s pause in Gold purchases.
Gold prices edged up during Tuesday’s North American session after Federal Reserve Chair Jerome Powell appeared at the US Senate Banking Committee and stated that inflation is moving toward the Fed’s 2% goal, yet it is not ready to lower borrowing costs. The XAU/USD trades at $2,364, gaining more than 0.25%.
The golden metal recovered slightly amid elevated US Treasury bond yields and a firm US Dollar. The US 10-year benchmark note coupon climbs one-and-a-half basis points (bps) to 4.296%, while the US Dollar Index (DXY) trends steadily above the 105.00 mark, gaining 0.14%.
Fed Chair Powell stated that “elevated inflation is not the only risk we face,” warning that lowering interest rates too little or too soon could put the economy at risk. He added that while it’s possible to hike rates if the data supports it, the most likely direction would be to “begin to loosen policy at the right moment."
Aside from this, the World Gold Council (WGC) revealed that Gold exchange-traded funds (ETFs) experienced a second month of inflows in June. The WGC stated that total fund holdings rose by around 18 tonnes to 3,106 tonnes.
This contrasts with the People’s Bank of China’s (PBoC) decision not to buy Gold in June as it did in May. China held 72.80 million troy ounces of the precious metal at the end of June.
The US economic docket during the week will feature Powell’s speech at the US House of Representatives on Wednesday, followed by the release of inflation figures on the consumer and producer sides. Initial Jobless Claims and the University of Michigan Consumer Sentiment will complement the schedule.
Daily digest market movers: Gold price advances during Powell’s speech
- US CPI is expected to decrease from 3.3% to 3.1% YoY in June, while core inflation is projected to remain steady at 3.4% YoY.
- According to the consensus, Initial Jobless Claims for the week ending July 6 are expected to increase from 238K to 240K.
- July Consumer Sentiment is set to improve to 68.5, up from 68.2 in June, according to the consensus.
- Federal Open Market Committee (FOMC) June Meeting Minutes revealed that most participants believe the current policy is restrictive but are open to further rate increases. Policymakers acknowledged that the economy is cooling and could respond to unexpected economic weaknesses.
- According to data from the CME FedWatch Tool, investors are pricing in 70% odds of a Fed rate cut in September, up from 73% on Monday.
- December 2024 fed funds rate futures contract implies that the Fed will ease policy by 39 basis points (bps) toward the end of the year.
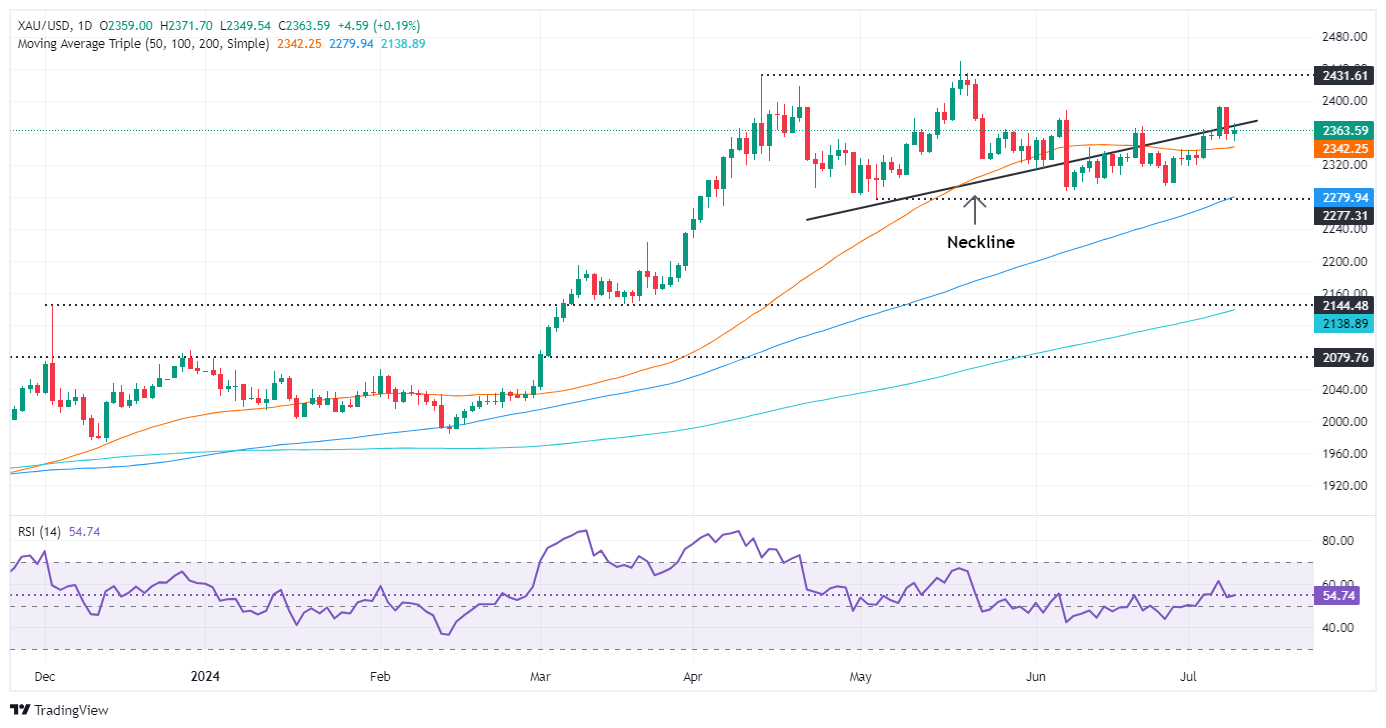
Technical analysis: Gold price hovers around Head-and-Shoulders neckline
Gold price formed a bearish Harami candlestick pattern after breaching the Head-and-Shoulders neckline, which pushed XAU/USD toward the $2,400 figure before tumbling to the current price level.
Buyers are still in charge with the Relative Strength Index (RSI) standing in bullish territory above the 50-neutral line.
Therefore, Gold’s first resistance would be the July 5 high at $2,392, followed by the $2,400 figure. Further upside is seen, with the next resistance lying at the year-to-date high of $2,450, ahead of the $2,500 mark.
Conversely, if XAU/USD slumps below $2,350, the golden metal might decline to the $2,300 level. If this support fails, the next demand zone would be the May 3 low of $2,277, followed by the March 21 high of $2,222.
Gold FAQs
Gold has played a key role in human’s history as it has been widely used as a store of value and medium of exchange. Currently, apart from its shine and usage for jewelry, the precious metal is widely seen as a safe-haven asset, meaning that it is considered a good investment during turbulent times. Gold is also widely seen as a hedge against inflation and against depreciating currencies as it doesn’t rely on any specific issuer or government.
Central banks are the biggest Gold holders. In their aim to support their currencies in turbulent times, central banks tend to diversify their reserves and buy Gold to improve the perceived strength of the economy and the currency. High Gold reserves can be a source of trust for a country’s solvency. Central banks added 1,136 tonnes of Gold worth around $70 billion to their reserves in 2022, according to data from the World Gold Council. This is the highest yearly purchase since records began. Central banks from emerging economies such as China, India and Turkey are quickly increasing their Gold reserves.
Gold has an inverse correlation with the US Dollar and US Treasuries, which are both major reserve and safe-haven assets. When the Dollar depreciates, Gold tends to rise, enabling investors and central banks to diversify their assets in turbulent times. Gold is also inversely correlated with risk assets. A rally in the stock market tends to weaken Gold price, while sell-offs in riskier markets tend to favor the precious metal.
The price can move due to a wide range of factors. Geopolitical instability or fears of a deep recession can quickly make Gold price escalate due to its safe-haven status. As a yield-less asset, Gold tends to rise with lower interest rates, while higher cost of money usually weighs down on the yellow metal. Still, most moves depend on how the US Dollar (USD) behaves as the asset is priced in dollars (XAU/USD). A strong Dollar tends to keep the price of Gold controlled, whereas a weaker Dollar is likely to push Gold prices up.
- Ahead of the much-anticipated US inflation data, the USD/CHF saw a mild rise.
- Fed Chair Jerome Powell's comments to the US Congress dictated market sentiments on Tuesday.
- As expected, the Fed continues to ask for patience and does not fully embrace cuts.
On Tuesday, the USD/CHF found some footing and mildly rose to 0.8980. The pair gained momentum as the Federal Reserve (Fed) Chair Jerome Powell addressed the US Congress and showed himself cautious regarding the bank’s next steps. Beyond this, market participants are eyeing Thursday when the US releases June's inflation figures.
The market's focus on Tuesday was on Jerome Powell's Semiannual Monetary Policy Report. Powell stated that sounder economic data would fortify the Federal Reserve's conviction in tackling inflation. He also noted that more than evidence of inflation moving towards the 2% target before implementing rate cuts is crucial. Finally, he further confirmed that the Fed's decision-making is an ongoing process, considering policies at every meeting.
The highly anticipated June Consumer Price Index (CPI) data from the US will have a pivotal role. June's headline CPI is expected to slow to 3.1%, descending from May's reading of 3.3%, thereby marking the third consecutive monthly slowdown.
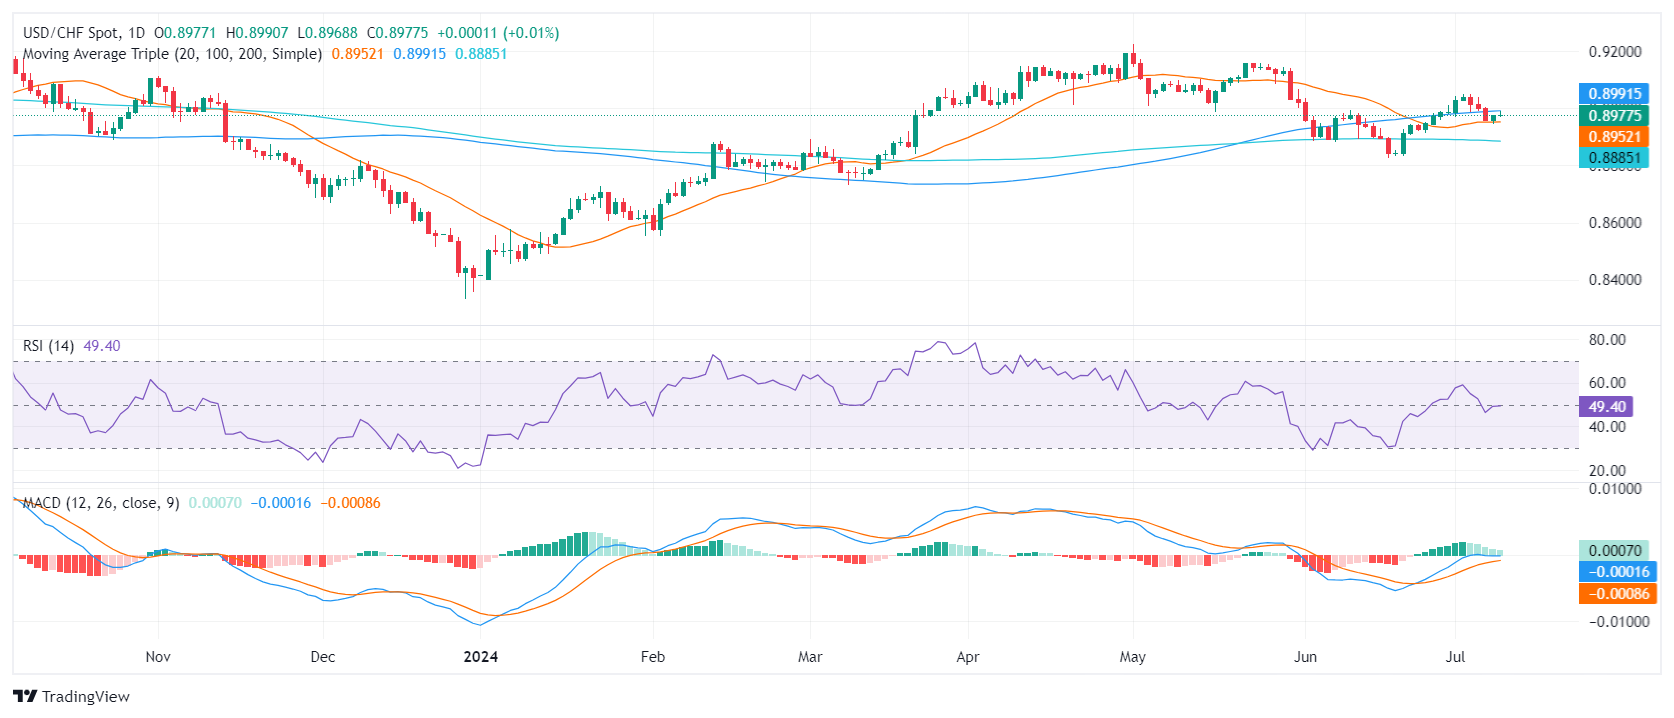
USD/CHF technical analysis
The short-term technical outlook for the pair has somewhat turned negative with the Moving Average Convergence Divergence (MACD) and Relative Strength Index (RSI) indicators having lost significant ground but now lying in neutral terrain.
The focal point now lies in whether the buyers will defend the 20-day Simple Moving Average (SMA) at 0.8950. The pair found resistance at the 100-day SMA at 0.8990, effectively nullifying today's gains. Consequently, the pair may continue trading within the channel demarcated by the 100-day and 20-day SMA.
USD/CHF daily chart
The Greenback maintained its constructive start to the week and lifted the USD Index (DXY) further north of 105.00 as investors digested Powell’s prudent first testimony and maintained their attention on upcoming Fedspeak and key US data.
Here is what you need to know on Wednesday, July 10:
The USD Index (DXY) rose past the 105.00 hurdle and flirted with the interim 55-day SMA amidst a decent uptick in US yields. The second semi-annual testimony by Chair J. Powell to the Congress is due on July 10, along with weekly Mortgage Applications, Wholesale Inventories and speeches by the Fed’s Bowman and Goolsbee.
EUR/USD remained on the defensive and put the 1.0800 region to the test once again amidst further recovery in the Greenback. The euro docket is empty on July 10.
GBP/USD added to Monday’s losses and broke below the key 1.2800 level in response to the modest comeback in the US Dollar. On July 10, the BoE’s Pill is due to speak.
Extra recovery in the US Dollar and the move higher in yields underpinned the daily uptick in USD/JPY to three-day highs near 161.50. Producer Prices will be in the spotlight on July 10 in Japan.
AUD/USD managed to overcome the Dollar’s bounce and advanced marginally, keeping the trade well above 0.6700 the figure. Australian final Building Permits and the speech by the RBA’s Simons are expected on July 10, while Chinese inflation data will also be of interest around AUD.
Prices of WTI dropped for the third session in a row and revisited multi-day lows near the $81.00 mark per barrel, as Hurricane-driven supply concerns dwindled and geopolitical jitters remained subdued.
Prices of Gold clung to daily gains around $2,360 per ounce troy despite the firmer Dollar and higher yields. In the same line, Silver left behind Monday’s marked pullback and regained some composure just past $31.00 per ounce.
- AUD extended its decline on Tuesday against the USD.
- RBA’s hawkish position on policy provides noticeable support to the Aussie.
- Markets are digesting Jerome Powell’s cautious words, which gave the USD some traction.
- Focus this week will be the reveal of US inflation figures on Thursday.
The Australian Dollar (AUD) racked up more losses on Tuesday against the USD, which managed to gain some ground due to cautious remarks by Jerome Powell. Nevertheless, the pair still maintains a strong position at its highest level since January. The downside for the Aussie appears to be limited, due to strong data reported last week and the continued hawkish stance of the Reserve Bank of Australia (RBA).
The RBA is likely to be one of the last G10 countries' central banks to initiate rate cuts, which should continue to work favorably for the AUD through monetary policy divergence.
Updated daily market movers: AUD sees further losses, attention on Powell and US CPI
- Fed Chair Jerome Powell's Semiannual Monetary Policy Report to Congress saw him acknowledging progress on inflation but that the bank needs data to embrace cuts.
- US CPI is set to be reported on Thursday. The headline is expected to decrease slightly to 3.1% YoY, while the core is anticipated to remain steady at 3.4% YoY.
- This week holds no significant events on Australia's calendar, and the AUD is projected to retain its gains against its competitors as long as the RBA sustains its hawkish stance.
- On the Fed's side, there's now less than a 10% chance of a cut for their next meeting at the end of July and around an 80% chance for a cut in September, contingent on future data.
- On the RBA's side, there’s almost a 50% chance of a September or November rate hike, with the market seriously betting on it.
Technical analysis: AUD/USD’s struggle continues, but further correction possible
The AUD/USD continues on its losing path, marking a two-day losing streak on Tuesday, but the overall outlook remains positive. This is backed by deep positive territory on the Relative Strength Index (RSI) and Moving Average Convergence Divergence (MACD). Having reached near-highs since January, the pair's performance last week has signaled a bullish outlook, but buyers seem to be booking profits.
The next bullish targets are set at 0.6730 and 0.6750, while support levels to keep an eye on are at 0.6670, 0.6650 and 0.6630.
Australian Dollar FAQs
One of the most significant factors for the Australian Dollar (AUD) is the level of interest rates set by the Reserve Bank of Australia (RBA). Because Australia is a resource-rich country another key driver is the price of its biggest export, Iron Ore. The health of the Chinese economy, its largest trading partner, is a factor, as well as inflation in Australia, its growth rate and Trade Balance. Market sentiment – whether investors are taking on more risky assets (risk-on) or seeking safe-havens (risk-off) – is also a factor, with risk-on positive for AUD.
The Reserve Bank of Australia (RBA) influences the Australian Dollar (AUD) by setting the level of interest rates that Australian banks can lend to each other. This influences the level of interest rates in the economy as a whole. The main goal of the RBA is to maintain a stable inflation rate of 2-3% by adjusting interest rates up or down. Relatively high interest rates compared to other major central banks support the AUD, and the opposite for relatively low. The RBA can also use quantitative easing and tightening to influence credit conditions, with the former AUD-negative and the latter AUD-positive.
China is Australia’s largest trading partner so the health of the Chinese economy is a major influence on the value of the Australian Dollar (AUD). When the Chinese economy is doing well it purchases more raw materials, goods and services from Australia, lifting demand for the AUD, and pushing up its value. The opposite is the case when the Chinese economy is not growing as fast as expected. Positive or negative surprises in Chinese growth data, therefore, often have a direct impact on the Australian Dollar and its pairs.
Iron Ore is Australia’s largest export, accounting for $118 billion a year according to data from 2021, with China as its primary destination. The price of Iron Ore, therefore, can be a driver of the Australian Dollar. Generally, if the price of Iron Ore rises, AUD also goes up, as aggregate demand for the currency increases. The opposite is the case if the price of Iron Ore falls. Higher Iron Ore prices also tend to result in a greater likelihood of a positive Trade Balance for Australia, which is also positive of the AUD.
The Trade Balance, which is the difference between what a country earns from its exports versus what it pays for its imports, is another factor that can influence the value of the Australian Dollar. If Australia produces highly sought after exports, then its currency will gain in value purely from the surplus demand created from foreign buyers seeking to purchase its exports versus what it spends to purchase imports. Therefore, a positive net Trade Balance strengthens the AUD, with the opposite effect if the Trade Balance is negative.
- Mexican Peso extended its gains as USD/MXN drops deeper beneath 18.00.
- Mexico’s CPI surged close to 5% in June, driven by rising food prices and Peso depreciation.
- Banxico's Deputy Governor Jonathan Heath labels inflation data as “very worrying,” indicating hawkish stance.
The Mexican Peso surged during Tuesday’s North American session as June headline inflation exceeded consensus. This might prevent the Bank of Mexico (Banxico) from slashing interest rates amid a domestic economic slowdown. At the time of writing, the USD/MXN trades at 17.93, down 0.40%.
Mexico’s economic docket featured the Consumer Price Index (CPI), which jumped close to 5% in June due to the rise in food prices, revealed the National Statistics Agency (INEGI). This and the Peso’s more than 6% depreciation in June triggered a price rise. Other data showed that Consumer Confidence slightly improved, while Auto Exports decelerated sharply.
After the data, Banxico Deputy Governor Jonathan Heath wrote on X that June’s inflation data was “very worrying.” Traders should be aware that he leans on the hawkish front of the central bank alongside Deputy Governor Irene Espinosa.
Market participants are eyeing the release of Banxico’s latest monetary policy meetings on Thursday, which are expected to show that the Mexican institution will be patient before lowering borrowing costs.
Across the border, Federal Reserve (Fed) Chair Jerome Powell appeared at the US Senate Banking Committee and stated that the disinflation process is evolving and that the risks of achieving the dual mandate have become more balanced. He added that Fed officials needed more good inflation data to cut interest rates. Nevertheless, an unexpected weakening in the labor market could be another reason for the easing of policy.
Daily digest market movers: Mexican Peso climbs on hot CPI data
- Some analysts in Mexico estimate the economy might slow down but dodge a recession, according to the National Statistics Agency’s (INEGI) Coincident Indicator. Despite that, they said reforms pushed by President Andres Manuel Lopez Obrador (AMLO), particularly the judiciary reform, could affect the country’s creditworthiness.
- Mexico’s CPI rose from 4.69% YoY to 4.98% in June, while core CPI dipped from 4.21% to 4.13% annually, exceeding the estimated 4.15%.
- Auto Exports in June slowed from 13% in May to 3.3% YoY in June, while Auto Production decelerated from 4.9% to 3.8% in June.
- On Monday, the New York Federal Reserve revealed that consumer inflation expectations were lowered from 3.2% to 3% for one year.
- US CPI is foreseen dropping from 3.3% to 3.1% in the 12 months to June, while underlying inflation is projected to stay firm at 3.4% YoY.
- US Dollar Index (DXY), which tracks the value of a basket of six currencies against the US Dollar, advances some 0.16% and is up at 105.17.
- According to the CME FedWatch Tool data, the odds for a September cut are 70%, down from 73% on Monday.
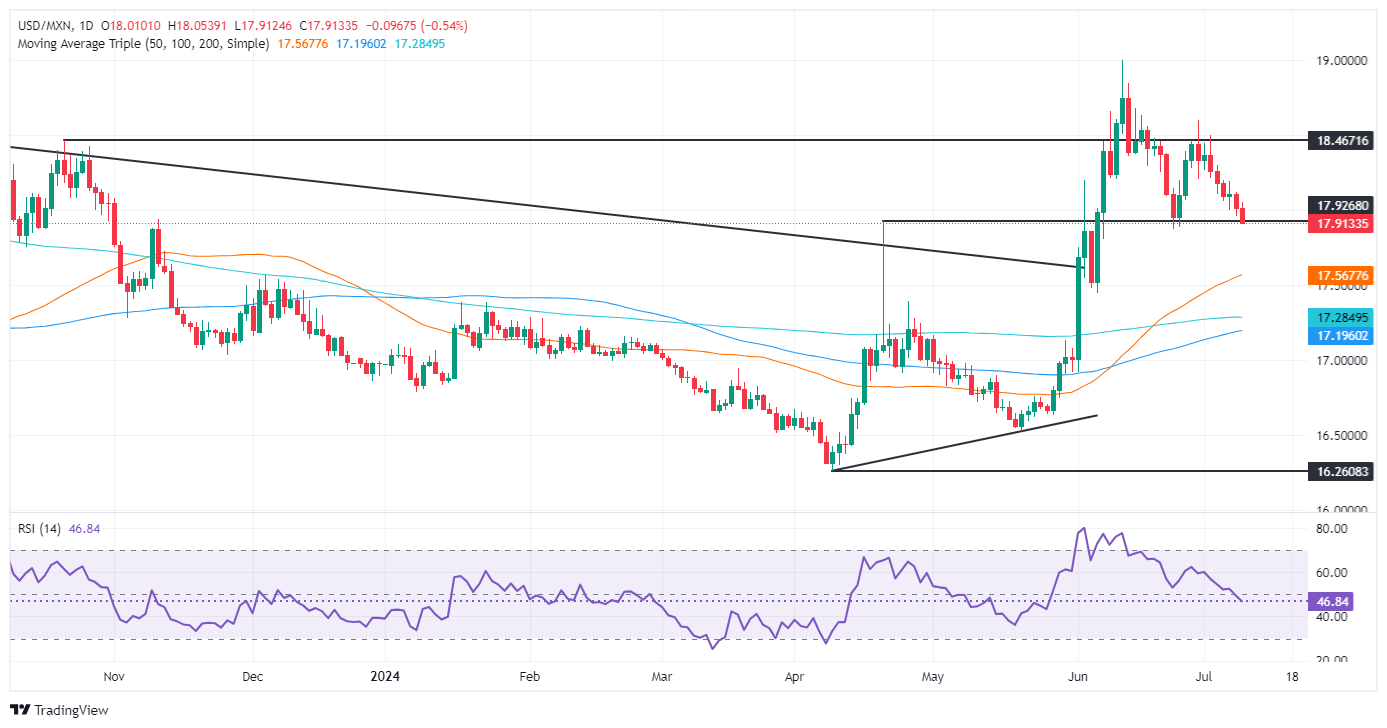
Technical analysis: Mexican Peso counterattacks as USD/MXN dives below 18.00
The USD/MXN has hit a ten-day low of 17.91, yet it remains slightly above the June 24 cycle low of 17.87, which if broken could extend the Greenback’s losses. Momentum favors shorts as the Relative Strength Index (RSI) dropped below the 50-neutral line.
That said, If USD/MXN achieves a daily close below 18.00, the next support would be the June 24 swing low of 17.87. Further losses are seen beneath the 50-day Simple Moving Average (SMA) at 17.56, followed by the 200-day SMA at 17.26. The next floor level would be the 100-day SMA at 17.17.
For a bullish resumption, USD/MXN needs to surpass 18.10, followed by a rally above the June 28 high of 18.59, allowing buyers to challenge the YTD high of 18.99. Conversely, sellers will need to push the pair below 18.00, which could extend the decline toward the December 5 high-turned-support at 17.56, followed by the 50-day SMA at 17.37.
Mexican Peso FAQs
The Mexican Peso (MXN) is the most traded currency among its Latin American peers. Its value is broadly determined by the performance of the Mexican economy, the country’s central bank’s policy, the amount of foreign investment in the country and even the levels of remittances sent by Mexicans who live abroad, particularly in the United States. Geopolitical trends can also move MXN: for example, the process of nearshoring – or the decision by some firms to relocate manufacturing capacity and supply chains closer to their home countries – is also seen as a catalyst for the Mexican currency as the country is considered a key manufacturing hub in the American continent. Another catalyst for MXN is Oil prices as Mexico is a key exporter of the commodity.
The main objective of Mexico’s central bank, also known as Banxico, is to maintain inflation at low and stable levels (at or close to its target of 3%, the midpoint in a tolerance band of between 2% and 4%). To this end, the bank sets an appropriate level of interest rates. When inflation is too high, Banxico will attempt to tame it by raising interest rates, making it more expensive for households and businesses to borrow money, thus cooling demand and the overall economy. Higher interest rates are generally positive for the Mexican Peso (MXN) as they lead to higher yields, making the country a more attractive place for investors. On the contrary, lower interest rates tend to weaken MXN.
Macroeconomic data releases are key to assess the state of the economy and can have an impact on the Mexican Peso (MXN) valuation. A strong Mexican economy, based on high economic growth, low unemployment and high confidence is good for MXN. Not only does it attract more foreign investment but it may encourage the Bank of Mexico (Banxico) to increase interest rates, particularly if this strength comes together with elevated inflation. However, if economic data is weak, MXN is likely to depreciate.
As an emerging-market currency, the Mexican Peso (MXN) tends to strive during risk-on periods, or when investors perceive that broader market risks are low and thus are eager to engage with investments that carry a higher risk. Conversely, MXN tends to weaken at times of market turbulence or economic uncertainty as investors tend to sell higher-risk assets and flee to the more-stable safe havens.
- Dow Jones reversed an early decline and clawed into the green on Tuesday.
- Fed comments came in more hawkish than expected, rattling investor sentiment.
- The long wait to Fed rate cuts continues as US inflation data looms ahead.
The Dow Jones Industrial Average (DJIA) tumbled in early Tuesday trading after Federal Reserve (Fed) Chairman Jerome Powell delivered less-dovish-than-expected talking points while testifying on the Fed’s semiannual Monetary Policy Report in the first of two appearances in as many days. Market sentiment recovered after the fact, and the Dow Jones recovered into the green for the day.
On Tuesday, Fed Chairman Jerome Powell presented the Fed's semiannual Monetary Policy Report to the Senate Committee on Banking, Housing, and Urban Affairs. He emphasized the Fed's commitment to waiting for inflation to ease towards the 2% annual target, which disappointed investors hoping for signs of interest rate cuts. As a result, risk appetite decreased, and the US dollar strengthened.
Powell will deliver the second half of the report to the Congressional House Committee on Financial Services on Wednesday, and no changes in rhetoric or new information are expected.
Later this week, June's US Consumer Price Index (CPI) inflation is scheduled for Thursday, followed by Friday's US Producer Price Index (PPI) wholesale inflation. Core CPI in June is expected to remain at 3.4% YoY, while core PPI for the same period is projected to increase to 2.5% from the previous period's 2.3%. Meeting these forecasts may disappoint markets that are expecting a quarter-point rate cut from the Fed at the September 18 rate call due to the anticipation of slowing inflation.
Dow Jones news
Despite over half of the Dow Jones index being in the red on Tuesday, strong gains at the top of the board drag the overall equity average higher. Banking stocks are leading the charge higher, with Goldman Sachs Group Inc. (GS) climbing 2.77% to $477.89 per share, followed by JPMorgan Chase & Co. (JPM) climbing nearly 2% over $209.00 per share.
On the low side, Salesforce Inc. (CRM) has fallen back -1.91% on the day, battling with $252.00 per share as the customer tracking software company finds a halting recovery on promises of deeper AI integration into the company’s offerings.
Dow Jones technical outlook
Dow Jones initially plunged on Tuesday, dropping toward 39,120.00 before a sharp recovery rally to set an intraday high of 39,489.00. The DJIA is set to waffle back into Tuesday’s opening bids near 39,360.00.
Daily candles continue to churn in the midrange as price action gets squeezed between the 50-day Exponential Moving Average at 38,998.14 and a supply zone priced in near the 40,000.00 major handle.
Dow Jones five minute chart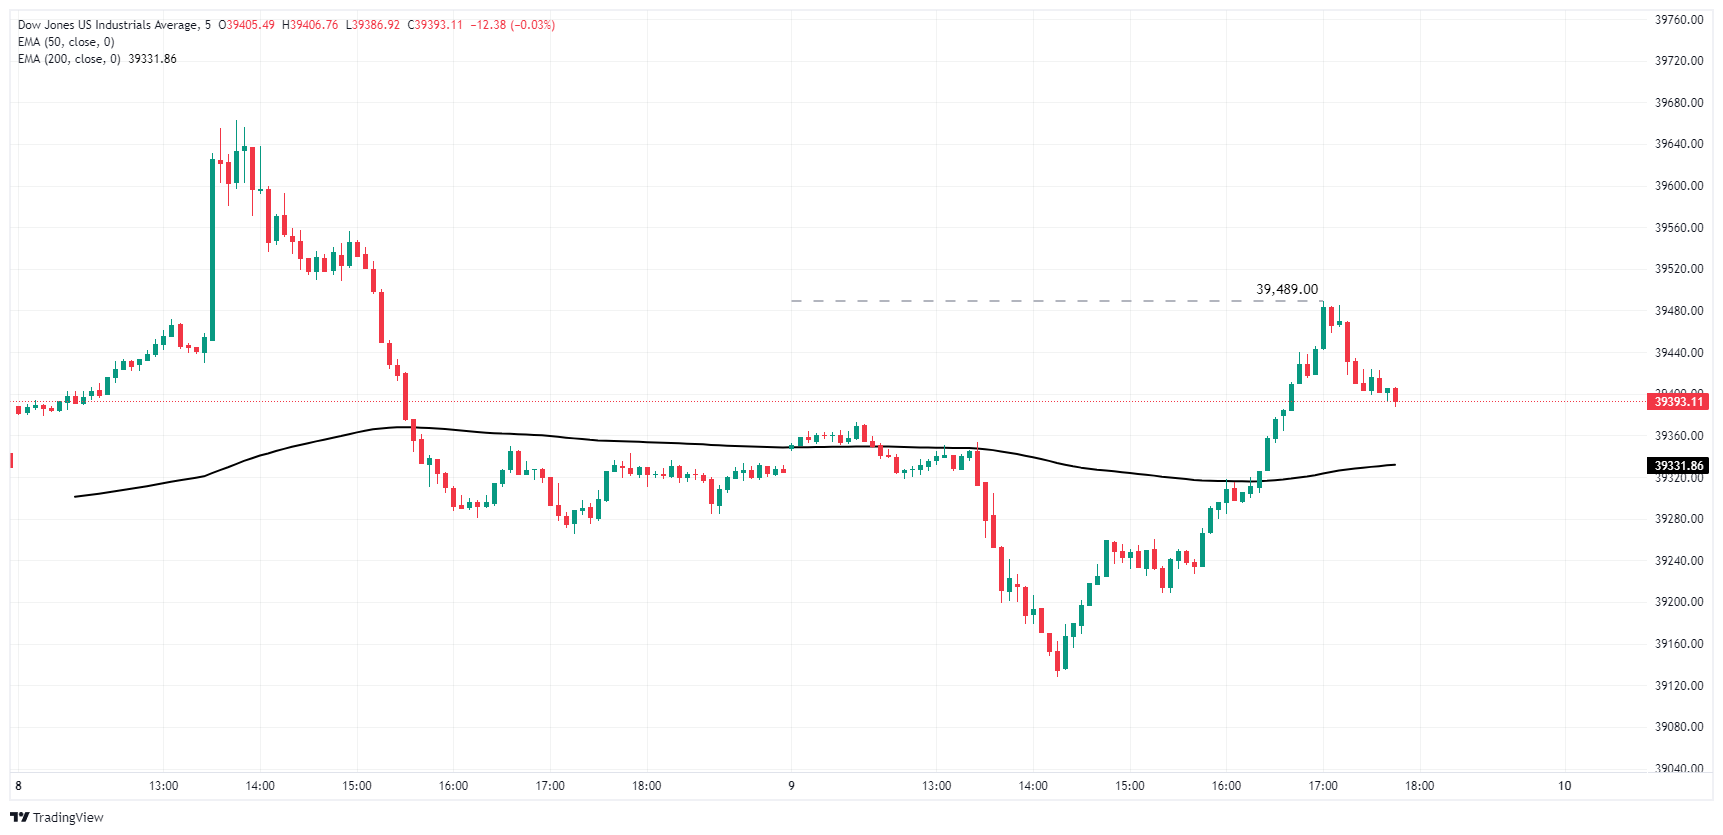
Dow Jones daily chart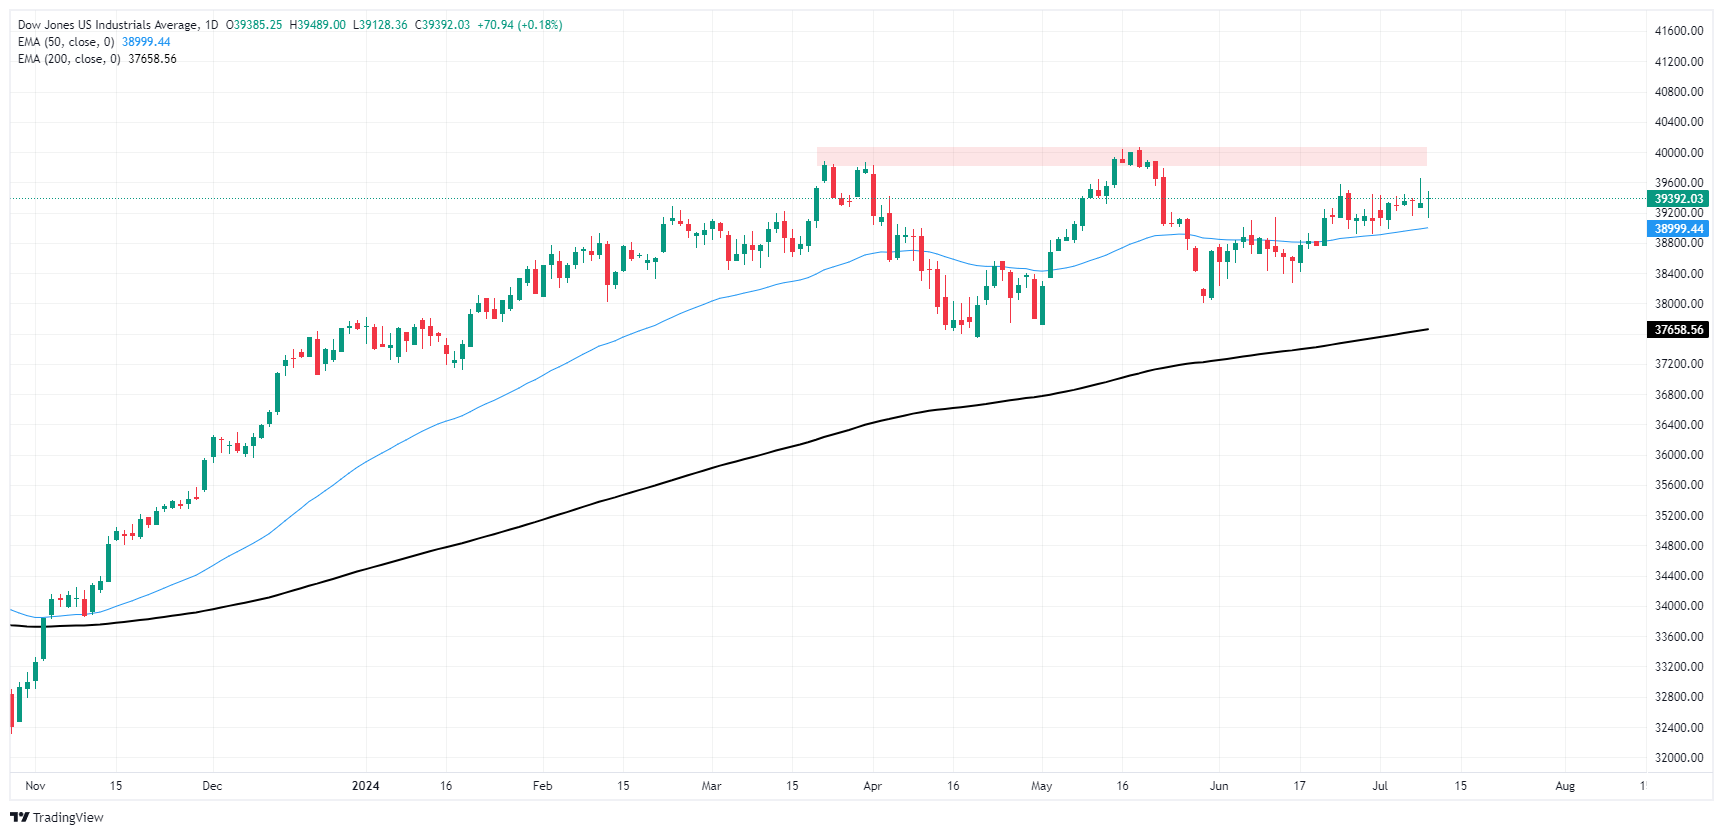
Dow Jones FAQs
The Dow Jones Industrial Average, one of the oldest stock market indices in the world, is compiled of the 30 most traded stocks in the US. The index is price-weighted rather than weighted by capitalization. It is calculated by summing the prices of the constituent stocks and dividing them by a factor, currently 0.152. The index was founded by Charles Dow, who also founded the Wall Street Journal. In later years it has been criticized for not being broadly representative enough because it only tracks 30 conglomerates, unlike broader indices such as the S&P 500.
Many different factors drive the Dow Jones Industrial Average (DJIA). The aggregate performance of the component companies revealed in quarterly company earnings reports is the main one. US and global macroeconomic data also contributes as it impacts on investor sentiment. The level of interest rates, set by the Federal Reserve (Fed), also influences the DJIA as it affects the cost of credit, on which many corporations are heavily reliant. Therefore, inflation can be a major driver as well as other metrics which impact the Fed decisions.
Dow Theory is a method for identifying the primary trend of the stock market developed by Charles Dow. A key step is to compare the direction of the Dow Jones Industrial Average (DJIA) and the Dow Jones Transportation Average (DJTA) and only follow trends where both are moving in the same direction. Volume is a confirmatory criteria. The theory uses elements of peak and trough analysis. Dow’s theory posits three trend phases: accumulation, when smart money starts buying or selling; public participation, when the wider public joins in; and distribution, when the smart money exits.
There are a number of ways to trade the DJIA. One is to use ETFs which allow investors to trade the DJIA as a single security, rather than having to buy shares in all 30 constituent companies. A leading example is the SPDR Dow Jones Industrial Average ETF (DIA). DJIA futures contracts enable traders to speculate on the future value of the index and Options provide the right, but not the obligation, to buy or sell the index at a predetermined price in the future. Mutual funds enable investors to buy a share of a diversified portfolio of DJIA stocks thus providing exposure to the overall index.
- US Dollar regained some ground after Jerome Powell's comments.
- Market retains confidence in a September rate cut.
- Investors await June’s CPI snapshot of US inflation on Thursday.
The US Dollar staged a minor comeback and the DXY rose to 105.20, courtesy of Federal Reserve (Fed) Chairman Jerome Powell's recent congressional comments, which shied away from embracing rate cuts in the immediate future, advocating for patience instead.
Tinged with disinflation indicators, the US economic outlook has raised hopes of a September rate cut. That said, Fed officials are in no rush to implement cuts, choosing instead to rely on data-centric indicators before making such decisions.
Daily digest market movers: DXY up as markets assess Powell’s words
- Fed Chair Jerome Powell's Semiannual Monetary Policy Report to Congress and his testimony before the Senate Banking Committee are the standout events on Tuesday.
- Powell re-emphasized the need for encouraging economic data to shore up the Fed's confidence in managing inflation effectively.
- He underscored that it is not only high inflation that poses a risk but is apprehensive about announcing a rate cut until there is assured evidence that inflation is consistently gravitating toward the 2% target.
- However, he stressed the importance of meeting-by-meeting policy decisions, admitting that while progress has been made toward the 2% inflation goal, the recent data needs to be more encouraging to warrant a rate cut.
- US Consumer Price Index (CPI) arrives on Thursday and will be closely watched by market participants.
- YoY CPI headline inflation is forecasted to decelerate by two points to 3.1%, and the core reading is expected to hold steady at 3.4%.
- As per the CME FedWatch Tool, the probability of a rate cut in July remains below 10% but at approximately 80% for September.
DXY technical outlook: Recovery seems possible as DXY stays above 100-day SMA
While technically speaking the DXY experienced a downturn, losing 0.80% in value and slipping below its 20-day Simple Moving Average (SMA) last week, some recovery is now detected above the 100-day SMA. Both the Relative Strength Index (RSI) and the Moving Average Convergence Divergence (MACD) indicators have retreated into negative territory but are presenting better and gained momentum on Tuesday.
Nevertheless, the 104.78 zone, denoted by the 100-day SMA, has held strong, repelling sellers and thereby reestablishing support. Below there, the 104.50 and 104.30 zones could potentially act as robust backstops against further declines.
US Dollar FAQs
The US Dollar (USD) is the official currency of the United States of America, and the ‘de facto’ currency of a significant number of other countries where it is found in circulation alongside local notes. It is the most heavily traded currency in the world, accounting for over 88% of all global foreign exchange turnover, or an average of $6.6 trillion in transactions per day, according to data from 2022. Following the second world war, the USD took over from the British Pound as the world’s reserve currency. For most of its history, the US Dollar was backed by Gold, until the Bretton Woods Agreement in 1971 when the Gold Standard went away.
The most important single factor impacting on the value of the US Dollar is monetary policy, which is shaped by the Federal Reserve (Fed). The Fed has two mandates: to achieve price stability (control inflation) and foster full employment. Its primary tool to achieve these two goals is by adjusting interest rates. When prices are rising too quickly and inflation is above the Fed’s 2% target, the Fed will raise rates, which helps the USD value. When inflation falls below 2% or the Unemployment Rate is too high, the Fed may lower interest rates, which weighs on the Greenback.
In extreme situations, the Federal Reserve can also print more Dollars and enact quantitative easing (QE). QE is the process by which the Fed substantially increases the flow of credit in a stuck financial system. It is a non-standard policy measure used when credit has dried up because banks will not lend to each other (out of the fear of counterparty default). It is a last resort when simply lowering interest rates is unlikely to achieve the necessary result. It was the Fed’s weapon of choice to combat the credit crunch that occurred during the Great Financial Crisis in 2008. It involves the Fed printing more Dollars and using them to buy US government bonds predominantly from financial institutions. QE usually leads to a weaker US Dollar.
Quantitative tightening (QT) is the reverse process whereby the Federal Reserve stops buying bonds from financial institutions and does not reinvest the principal from the bonds it holds maturing in new purchases. It is usually positive for the US Dollar.
- Canadian Dollar struggled to develop momentum with little of note on the docket.
- Canada is largely absent from the economic calendar this week.
- Fed Chair Powell stuck close to the usual script, giving investors little to work with.
The Canadian Dollar (CAD) found little reason to move in any particular direction on Monday with little meaningful data on the offering and a flubbed US Federal Reserve (Fed) appearance that gave markets nothing to work with.
The only economic datapoint from Canada this week will be May’s Building Permits to be released on Friday, but little market impact is expected. The CAD has pushed into the middle against the US Dollar (USD), and a lack of a meaningful release schedule on the Canadian side exposes the Canadian Dollar to broader market flows.
Fed Chairman Jerome Powell gave the first half of his two-day testimony before US Congressional committees on Tuesday, delivering the Fed’s semiannual Monetary Policy Report to the Senate Committee on Banking, Housing, and Urban Affairs. Fed Chair Powell struck a familiar tone, sticking close to talking points that have been made before and highlighting the Fed’s willingness to wait as long as is necessary for inflation to ease towards the Fed’s 2% annual target. Investors, hoping for further signs of the Fed stepping towards interest rate cuts, interpreted the appearance as more hawkish than hoped, drawing risk appetite down and bolstering the Greenback.
Fed Chair Powell will give the second half of the Fed’s Monetary Policy Report to the Congressional House Committee on Financial Services on Wednesday. No changes in rhetoric or new information are expected in the follow-up presentation heading into the midweek.
Later in the week, June’s US Consumer Price Index (CPI) inflation is scheduled for Thursday, followed by Friday’s US Producer Price Index (PPI) wholesale inflation, also for June. Core CPI in June is expected to hold steady at 3.4% YoY, while core PPI for the same period is expected to tick upwards to 2.5% from the previous period’s 2.3%. In both cases, meeting forecasts will disappoint markets that are overwhelmingly betting on slowing inflation to deliver at least a quarter-point rate cut from the Fed at the September 18 rate call.
USD/CAD technical outlook
USD/CAD is stuck in place near 1.3640, treading water and moving in a tight cycle as the pair remains unable to break above 1.3650. Last week’s rebound from the last swing low towards 1.3600 failed to muscle the pair back above the 200-hour Exponential Moving Average (EMA) at 1.2656, but bidding pressure remains too high to allow a backslide into fresh lows.
USD/CAD daily candlesticks are mired in a technical trap, caught in congestion between the 200-day EMA at 1.3590 and a supply zone priced in above the last peak near 1.3750.
USD/CAD hourly chart
USD/CAD daily chart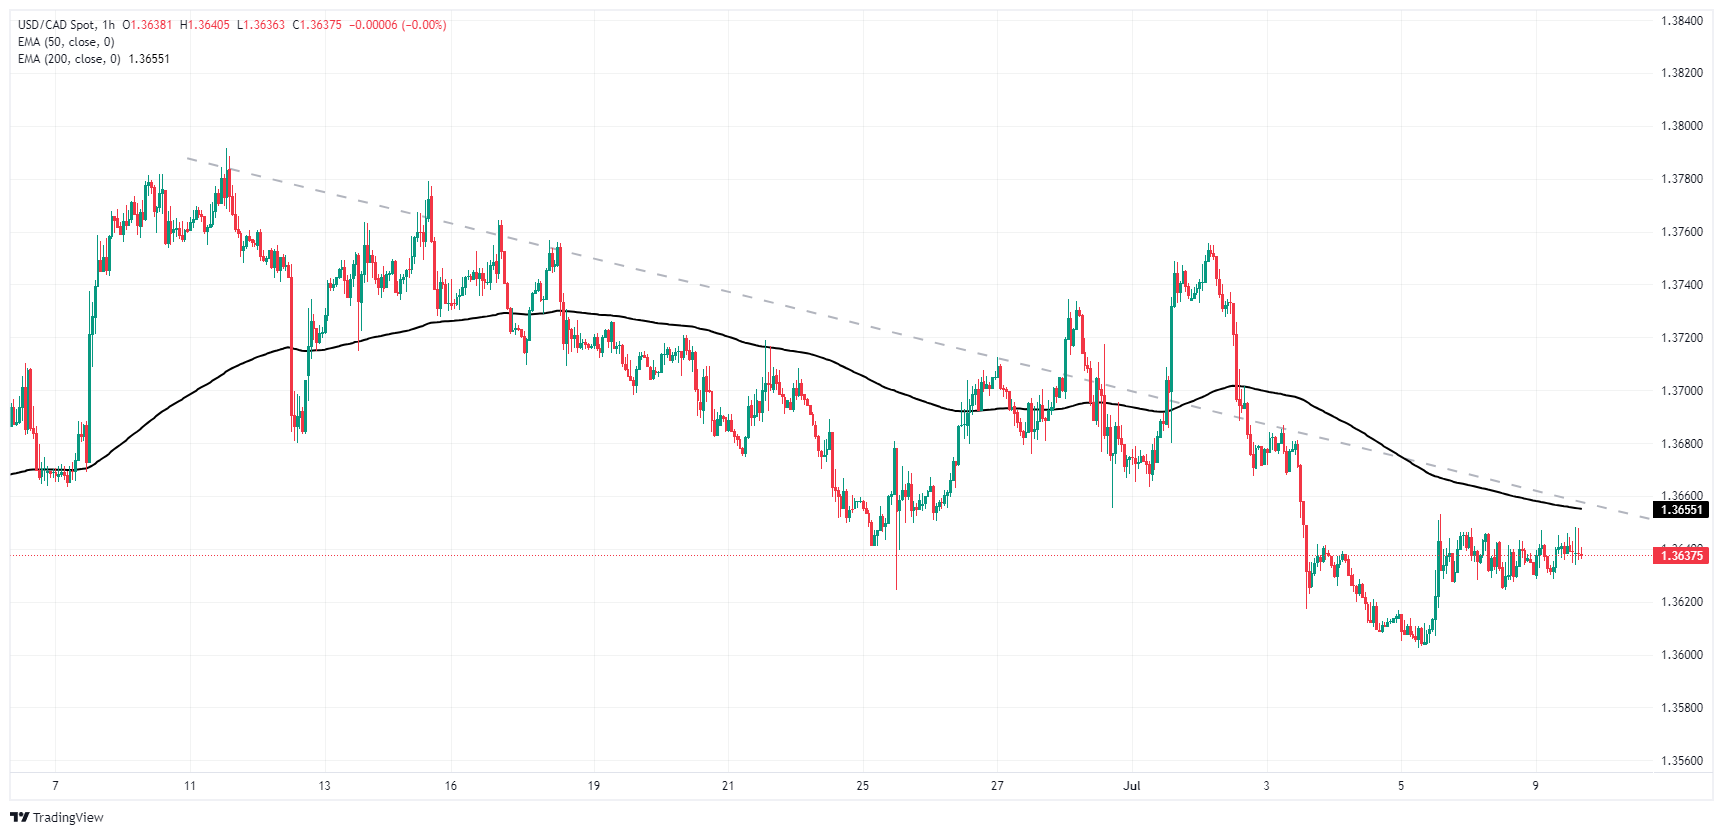
Canadian Dollar FAQs
The key factors driving the Canadian Dollar (CAD) are the level of interest rates set by the Bank of Canada (BoC), the price of Oil, Canada’s largest export, the health of its economy, inflation and the Trade Balance, which is the difference between the value of Canada’s exports versus its imports. Other factors include market sentiment – whether investors are taking on more risky assets (risk-on) or seeking safe-havens (risk-off) – with risk-on being CAD-positive. As its largest trading partner, the health of the US economy is also a key factor influencing the Canadian Dollar.
The Bank of Canada (BoC) has a significant influence on the Canadian Dollar by setting the level of interest rates that banks can lend to one another. This influences the level of interest rates for everyone. The main goal of the BoC is to maintain inflation at 1-3% by adjusting interest rates up or down. Relatively higher interest rates tend to be positive for the CAD. The Bank of Canada can also use quantitative easing and tightening to influence credit conditions, with the former CAD-negative and the latter CAD-positive.
The price of Oil is a key factor impacting the value of the Canadian Dollar. Petroleum is Canada’s biggest export, so Oil price tends to have an immediate impact on the CAD value. Generally, if Oil price rises CAD also goes up, as aggregate demand for the currency increases. The opposite is the case if the price of Oil falls. Higher Oil prices also tend to result in a greater likelihood of a positive Trade Balance, which is also supportive of the CAD.
While inflation had always traditionally been thought of as a negative factor for a currency since it lowers the value of money, the opposite has actually been the case in modern times with the relaxation of cross-border capital controls. Higher inflation tends to lead central banks to put up interest rates which attracts more capital inflows from global investors seeking a lucrative place to keep their money. This increases demand for the local currency, which in Canada’s case is the Canadian Dollar.
Macroeconomic data releases gauge the health of the economy and can have an impact on the Canadian Dollar. Indicators such as GDP, Manufacturing and Services PMIs, employment, and consumer sentiment surveys can all influence the direction of the CAD. A strong economy is good for the Canadian Dollar. Not only does it attract more foreign investment but it may encourage the Bank of Canada to put up interest rates, leading to a stronger currency. If economic data is weak, however, the CAD is likely to fall.
Jerome Powell, Chairman of the US Federal Reserve (Fed), delivers the Semi-Annual Monetary Policy Report and responds to questions before the Senate Banking Committee on the first day of his Congressional testimony.
Key takeaways
"We are looking at where we can be faster and more forceful where appropriate in supervising banks."
"Unemployment is still low by historical standards."
"Job creation is narrowing in the economy."
"Not sending any signals today about timing of future Fed policy actions."
"Banks need to be honestly assessing their risk to manage it."
"Large banks can manage this problem."
"For smaller banks, we are in touch with those banks to make sure they can manage them."
Inflation FAQs
Inflation measures the rise in the price of a representative basket of goods and services. Headline inflation is usually expressed as a percentage change on a month-on-month (MoM) and year-on-year (YoY) basis. Core inflation excludes more volatile elements such as food and fuel which can fluctuate because of geopolitical and seasonal factors. Core inflation is the figure economists focus on and is the level targeted by central banks, which are mandated to keep inflation at a manageable level, usually around 2%.
The Consumer Price Index (CPI) measures the change in prices of a basket of goods and services over a period of time. It is usually expressed as a percentage change on a month-on-month (MoM) and year-on-year (YoY) basis. Core CPI is the figure targeted by central banks as it excludes volatile food and fuel inputs. When Core CPI rises above 2% it usually results in higher interest rates and vice versa when it falls below 2%. Since higher interest rates are positive for a currency, higher inflation usually results in a stronger currency. The opposite is true when inflation falls.
Although it may seem counter-intuitive, high inflation in a country pushes up the value of its currency and vice versa for lower inflation. This is because the central bank will normally raise interest rates to combat the higher inflation, which attract more global capital inflows from investors looking for a lucrative place to park their money.
Formerly, Gold was the asset investors turned to in times of high inflation because it preserved its value, and whilst investors will often still buy Gold for its safe-haven properties in times of extreme market turmoil, this is not the case most of the time. This is because when inflation is high, central banks will put up interest rates to combat it. Higher interest rates are negative for Gold because they increase the opportunity-cost of holding Gold vis-a-vis an interest-bearing asset or placing the money in a cash deposit account. On the flipside, lower inflation tends to be positive for Gold as it brings interest rates down, making the bright metal a more viable investment alternative.
Following the relatively data-insensitive June rate cut, European Central Bank (ECB) speakers have stood firm on the message of data-dependency. Next week’s ECB meeting likely to take stock of the available data and compare it to the latest forecasts, Senior European Economist at Societe Generale Anatoli Annenkov notes.
Possible rate cut in September
“Following the relatively data-insensitive June rate cut, ECB speakers have stood firm on the message of data-dependency. With data having been on the soft side, we believe the odds are for another cut in September. Next week’s ECB meeting is therefore likely to mainly take stock of the available data and compare it to the latest forecasts, with the press conference likely to be the most interesting part.”
“We still believe the risks to inflation are to the upside, possibly forcing the ECB to pause any rate cuts in December. The Governing Council may also have some initial discussions on the upcoming Strategy Review. Comments made at the ECB’s recent annual Sintra conference highlighted that some policymakers feel uneasy about the past QE, urging a review of its benefits and the ECB’s commitment to deploy it.”
“As we have long argued, the support for large-scale QE may be less obvious in hindsight given the relatively small impact on inflation while also having unwelcome side effects. This argues, in our view, for much more targeted and temporary interventions in the future, predominantly aimed at financial stability.”
- GBP/USD trades losses of more than 0.10% during Powell's Senate appearance.
- ‘Shooting star’ pattern hints at further downside if July 8 low of 1.2785 is breached.
- Key support levels at 1.2750/75 and 1.2709, while resistance lies at 1.2845 and 1.2860.
The GBP/USD falls during the North American session as Federal Reserve Chairman Jerome Powell appears at the US Senate Banking Committee. At the time of writing, the pair trades with minimal losses of 0.10%, just below the 1.2800 figure.
GBP/USD Price Analysis: Technical outlook
The GBP/USD uptrend remains intact, but the formation of a ‘shooting star’ on Monday’s price action hints that the pair could aim lower if spot prices tumble below the July 8 low of 1.2785.
Momentum, as measured by the Relative Strength Index (RSI), favors buyers, but they are losing steam as the RSI’s slope aims slightly downward.
Short-term, if GBP/USD achieves a daily close beneath the July 8 low, an ‘evening star’ three-candle bearish chart pattern would emerge, opening the door for further losses. In that outcome, the pair’s first support would be the confluence of two support trends at around 1.2750/75. Once cleared, the Pound Sterling could drop towards April’s 9 high at 1.2709 before challenging 1.2700.
Conversely, if buyers defend 1.2800, it could pave the way for resuming the uptrend. The first ceiling level would be the July 8 high at 1.2845, followed by the June 12 peak at 1.2860. Once those two levels are cleared, buyers can challenge the year-to-date (YTD) high just beneath the 1.2900 figure.
GBP/USD Price Action – Daily Chart
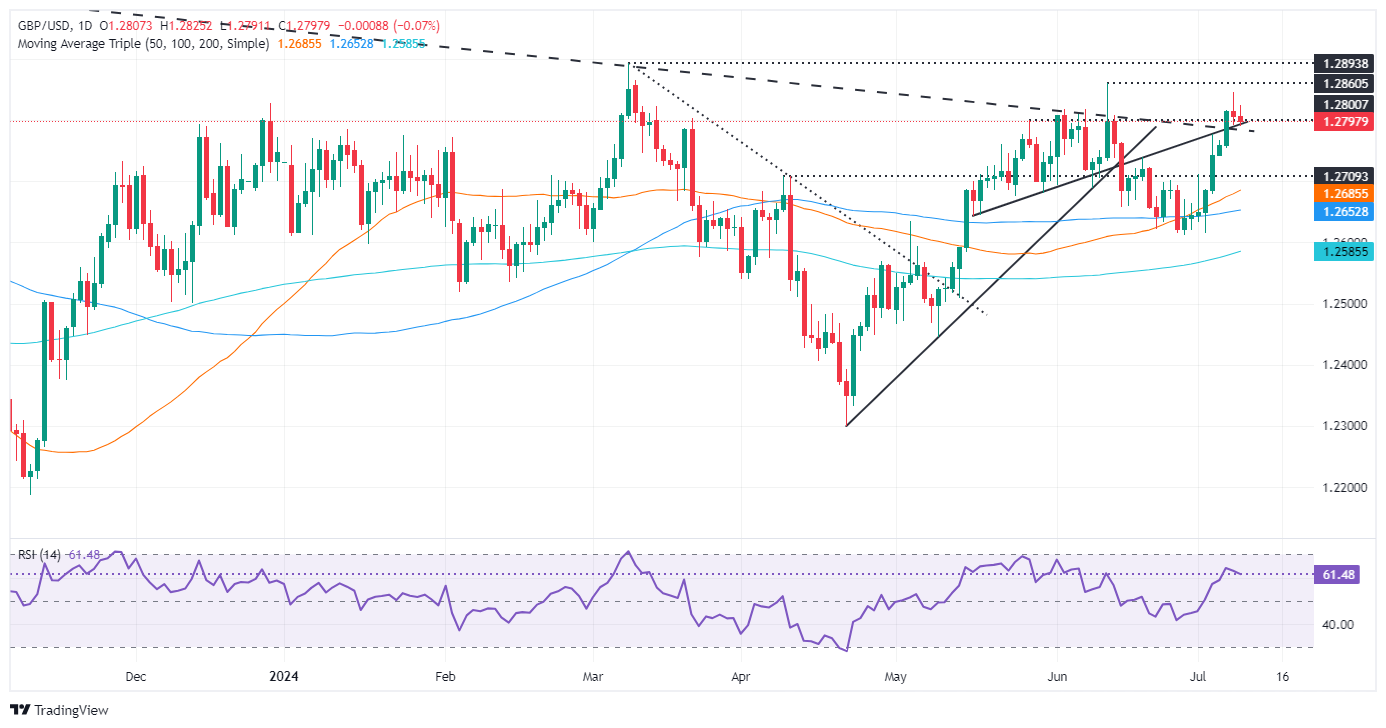
Pound Sterling FAQs
The Pound Sterling (GBP) is the oldest currency in the world (886 AD) and the official currency of the United Kingdom. It is the fourth most traded unit for foreign exchange (FX) in the world, accounting for 12% of all transactions, averaging $630 billion a day, according to 2022 data. Its key trading pairs are GBP/USD, aka ‘Cable’, which accounts for 11% of FX, GBP/JPY, or the ‘Dragon’ as it is known by traders (3%), and EUR/GBP (2%). The Pound Sterling is issued by the Bank of England (BoE).
The single most important factor influencing the value of the Pound Sterling is monetary policy decided by the Bank of England. The BoE bases its decisions on whether it has achieved its primary goal of “price stability” – a steady inflation rate of around 2%. Its primary tool for achieving this is the adjustment of interest rates. When inflation is too high, the BoE will try to rein it in by raising interest rates, making it more expensive for people and businesses to access credit. This is generally positive for GBP, as higher interest rates make the UK a more attractive place for global investors to park their money. When inflation falls too low it is a sign economic growth is slowing. In this scenario, the BoE will consider lowering interest rates to cheapen credit so businesses will borrow more to invest in growth-generating projects.
Data releases gauge the health of the economy and can impact the value of the Pound Sterling. Indicators such as GDP, Manufacturing and Services PMIs, and employment can all influence the direction of the GBP. A strong economy is good for Sterling. Not only does it attract more foreign investment but it may encourage the BoE to put up interest rates, which will directly strengthen GBP. Otherwise, if economic data is weak, the Pound Sterling is likely to fall.
Another significant data release for the Pound Sterling is the Trade Balance. This indicator measures the difference between what a country earns from its exports and what it spends on imports over a given period. If a country produces highly sought-after exports, its currency will benefit purely from the extra demand created from foreign buyers seeking to purchase these goods. Therefore, a positive net Trade Balance strengthens a currency and vice versa for a negative balance.
British Pound PRICE Today
The table below shows the percentage change of British Pound (GBP) against listed major currencies today. British Pound was the strongest against the Japanese Yen.
| USD | EUR | GBP | JPY | CAD | AUD | NZD | CHF | |
|---|---|---|---|---|---|---|---|---|
| USD | 0.08% | 0.09% | 0.32% | 0.03% | 0.05% | 0.04% | -0.01% | |
| EUR | -0.08% | -0.02% | 0.24% | -0.04% | -0.03% | -0.04% | -0.08% | |
| GBP | -0.09% | 0.02% | 0.25% | -0.06% | -0.00% | -0.02% | -0.07% | |
| JPY | -0.32% | -0.24% | -0.25% | -0.31% | -0.28% | -0.29% | -0.33% | |
| CAD | -0.03% | 0.04% | 0.06% | 0.31% | 0.02% | 0.04% | -0.03% | |
| AUD | -0.05% | 0.03% | 0.00% | 0.28% | -0.02% | -0.02% | -0.07% | |
| NZD | -0.04% | 0.04% | 0.02% | 0.29% | -0.04% | 0.02% | -0.04% | |
| CHF | 0.00% | 0.08% | 0.07% | 0.33% | 0.03% | 0.07% | 0.04% |
The heat map shows percentage changes of major currencies against each other. The base currency is picked from the left column, while the quote currency is picked from the top row. For example, if you pick the British Pound from the left column and move along the horizontal line to the US Dollar, the percentage change displayed in the box will represent GBP (base)/USD (quote).
Oil market upside is driven by supply side risk. Meanwhile, the impact to oil supply from hurricane Beryl was less than expected, adding further downward pressure to the market, TDS Senior Commodity Strategist Ryan McKay notes.
CTAs sold 10% of their max WTI crude position
“Oil market upside was being driven by supply side risk and the rally was extended via Commodity Trading Advisor (CTA) buying flows.”
“However, we highlight that the risk premia associated with Middle East tensions tends to quickly erode without an escalation to a broader conflict, and with systematic flows hitting elevated long levels, the lack of persistent buying is likely to soon weigh on the market.”
“Indeed, CTAs sold roughly 10% of their max WTI crude position to start this week, and additional selling could take place should prices sink below $81.30/bbl.”
Jerome Powell, Chairman of the US Federal Reserve (Fed), delivers the Semi-Annual Monetary Policy Report and responds to questions before the Senate Banking Committee on the first day of his Congressional testimony.
Key takeaways
"We have significant housing issues in the country."
"Pandemic has created new distortions in housing."
"Our tighter policy is having an effect on activity in housing sector."
"For housing supply, best thing we can do is get inflation down."
"Record is clear that central bank operational independence serves public well."
"This is a choice we make as a country and it's a good choice."
"Our economy has been exceptional compared to global peers."
US Dollar FAQs
The US Dollar (USD) is the official currency of the United States of America, and the ‘de facto’ currency of a significant number of other countries where it is found in circulation alongside local notes. It is the most heavily traded currency in the world, accounting for over 88% of all global foreign exchange turnover, or an average of $6.6 trillion in transactions per day, according to data from 2022. Following the second world war, the USD took over from the British Pound as the world’s reserve currency. For most of its history, the US Dollar was backed by Gold, until the Bretton Woods Agreement in 1971 when the Gold Standard went away.
The most important single factor impacting on the value of the US Dollar is monetary policy, which is shaped by the Federal Reserve (Fed). The Fed has two mandates: to achieve price stability (control inflation) and foster full employment. Its primary tool to achieve these two goals is by adjusting interest rates. When prices are rising too quickly and inflation is above the Fed’s 2% target, the Fed will raise rates, which helps the USD value. When inflation falls below 2% or the Unemployment Rate is too high, the Fed may lower interest rates, which weighs on the Greenback.
In extreme situations, the Federal Reserve can also print more Dollars and enact quantitative easing (QE). QE is the process by which the Fed substantially increases the flow of credit in a stuck financial system. It is a non-standard policy measure used when credit has dried up because banks will not lend to each other (out of the fear of counterparty default). It is a last resort when simply lowering interest rates is unlikely to achieve the necessary result. It was the Fed’s weapon of choice to combat the credit crunch that occurred during the Great Financial Crisis in 2008. It involves the Fed printing more Dollars and using them to buy US government bonds predominantly from financial institutions. QE usually leads to a weaker US Dollar.
Quantitative tightening (QT) is the reverse process whereby the Federal Reserve stops buying bonds from financial institutions and does not reinvest the principal from the bonds it holds maturing in new purchases. It is usually positive for the US Dollar.
Jerome Powell, Chairman of the US Federal Reserve (Fed), delivers the Semi-Annual Monetary Policy Report and responds to questions before the Senate Banking Committee on the first day of his Congressional testimony.
Key takeaways
"Most recent labor market data sent a pretty clear signal that the labor market has cooled considerably."
"Labor market is more or less back to pre-pandemic levels.
"We are well aware we now face two-sided risks."
"Labor market is fully back in balance now."
"If we move too quickly or slowly on rate cuts, there are risks on both sides."
"We are very much balancing those two risks these days."
"Not likely next policy move would be a rate hike."
Fed FAQs
Monetary policy in the US is shaped by the Federal Reserve (Fed). The Fed has two mandates: to achieve price stability and foster full employment. Its primary tool to achieve these goals is by adjusting interest rates. When prices are rising too quickly and inflation is above the Fed’s 2% target, it raises interest rates, increasing borrowing costs throughout the economy. This results in a stronger US Dollar (USD) as it makes the US a more attractive place for international investors to park their money. When inflation falls below 2% or the Unemployment Rate is too high, the Fed may lower interest rates to encourage borrowing, which weighs on the Greenback.
The Federal Reserve (Fed) holds eight policy meetings a year, where the Federal Open Market Committee (FOMC) assesses economic conditions and makes monetary policy decisions. The FOMC is attended by twelve Fed officials – the seven members of the Board of Governors, the president of the Federal Reserve Bank of New York, and four of the remaining eleven regional Reserve Bank presidents, who serve one-year terms on a rotating basis.
In extreme situations, the Federal Reserve may resort to a policy named Quantitative Easing (QE). QE is the process by which the Fed substantially increases the flow of credit in a stuck financial system. It is a non-standard policy measure used during crises or when inflation is extremely low. It was the Fed’s weapon of choice during the Great Financial Crisis in 2008. It involves the Fed printing more Dollars and using them to buy high grade bonds from financial institutions. QE usually weakens the US Dollar.
Quantitative tightening (QT) is the reverse process of QE, whereby the Federal Reserve stops buying bonds from financial institutions and does not reinvest the principal from the bonds it holds maturing, to purchase new bonds. It is usually positive for the value of the US Dollar.
- EUR/GBP is falling towards its next downside target at the July 8 low.
- The pair is in a short and medium-term downtrend with odds favoring a continuation.
EUR/GBP is steadily falling step-by-step in a short-term downtrend that began after the pair filled the gap created on June 10 and rolled over. Given “the trend is your friend” it will probably continue. The medium-term trend is also bearish after the break below the trendline in late May.
EUR/GBP 4-hour Chart
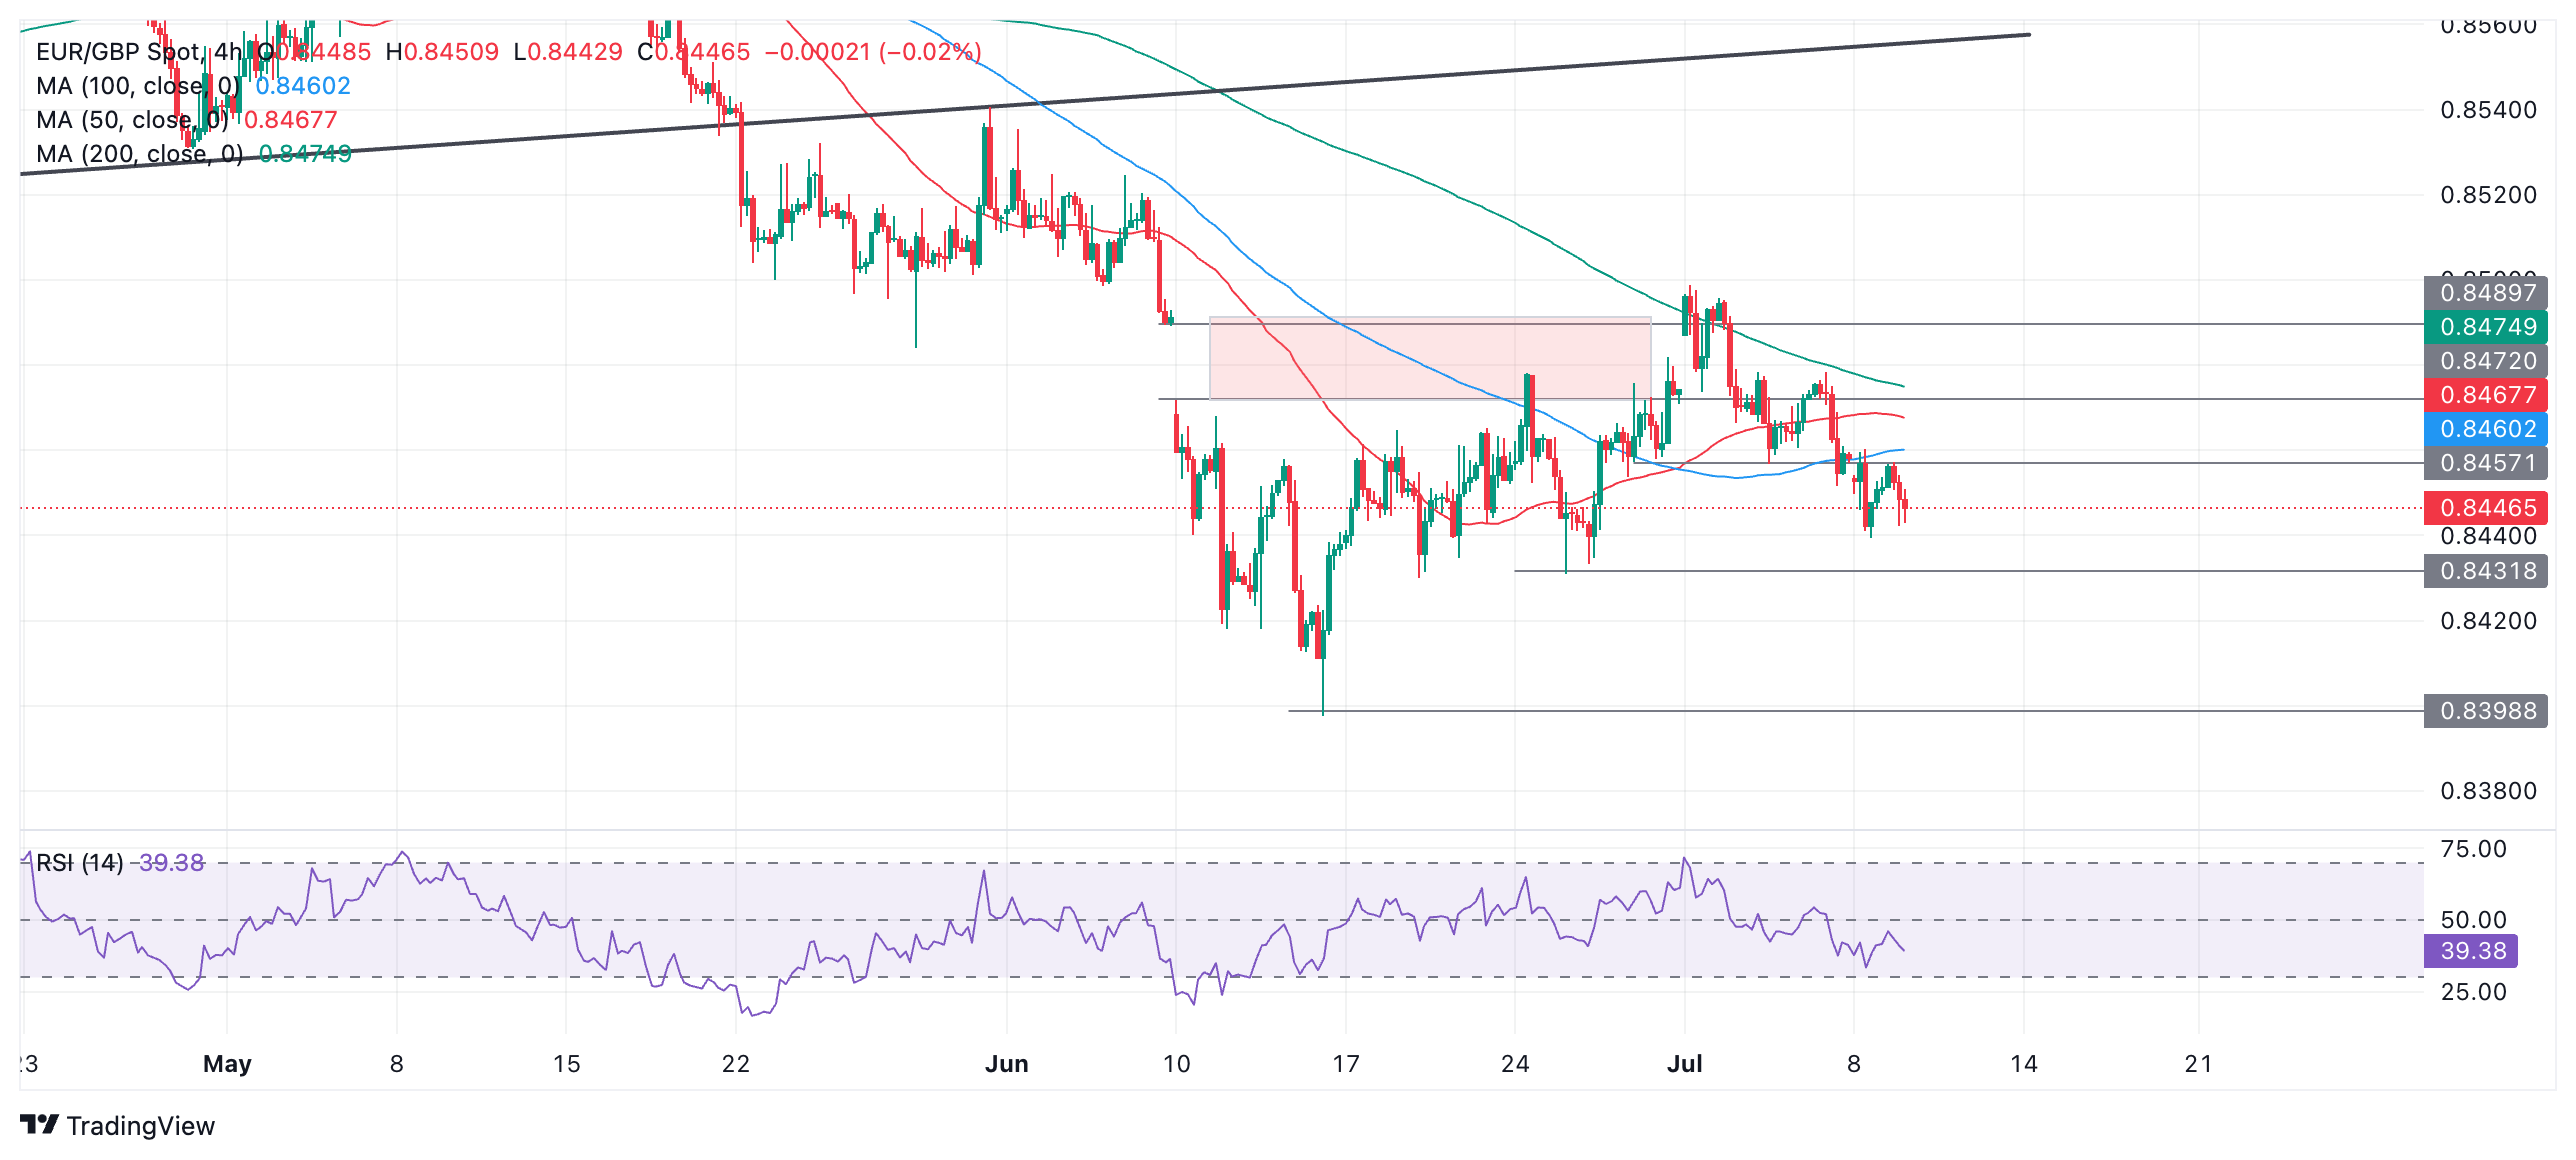
The next stop lower is 0.8431 (July 8 low), and a break below that would provide added bearish confirmation of an extension of the downtrend lower to the next target at 0.8399, the June 14 low.
China's third plenum on the radar in the coming weeks, and markets are keenly focused on the potential for fresh stimulus in the country, TD Securities Senior Commodity Strategist Ryan McKay notes.
China's third plenum coming, Copper trending weak
“With China's third plenum on the radar in the coming weeks, markets are keenly focused on the potential for fresh stimulus in the Middle Kingdom that could drive commodity demand. Any announcements regarding investment in the grid and clean energy, along with additional support to the property market, are key areas of focus for the market.”
“While investor appetite for Copper in the Middle Kingdom has been muted, top Shanghai Futures Exchange (SHFE) traders have covered their recent shorts heading into the plenum. Furthermore, while the nearest CTA trigger remains to the downside, there is a more of a margin of safety with the trigger sitting at $9,472/t.”
“However, with our gauge of global commodity demand continuing to weaken, while depressed premiums and surging inventories in the Middle Kingdom argue against fundamental tightness, there are plenty of potential catalysts that could still see prices ease once again.”
Gold is trading upwards ahead of Chair Powell's testimony before Congress on Tuesday, TD Securities Senior Commodity Strategist Ryan McKay notes.
Traders watch for clues from Powell's testimony
“Precious metals are holding strong as weaker employment data bolsters the odds of a September start to Federal Reserve (Fed) cuts. In this sense, traders are watching for any hints from Chair Powell's testimony before Congress today.”
“As the dust settles with regard to Fed timing, macro interest may be starting to pick up in Gold as ETF positions continue to rise in July, after June saw the first monthly increase since May 2023.”
“Furthermore, while Chinese Gold reserves were flat for a second consecutive month amid their noted pause in buying, top traders on the Shanghai Futures Exchange (SHFE) have added back to their net positions, highlighting Asian demand is set to remain strong.”
- Silver is consolidating within the third and final up leg of a price pattern.
- The price will probably continue up to a target in the upper $32.00s.
- Silver has broken out of a falling channel and above a four-year resistance level.
Silver (XAG/USD) consolidates after breaking out of a falling channel and above a four-year old resistance level. It is probably in the process of rising up in the final wave C of a three-wave Measured Move (MM), with a final price target substantially higher than the current market level.
Silver Daily Chart
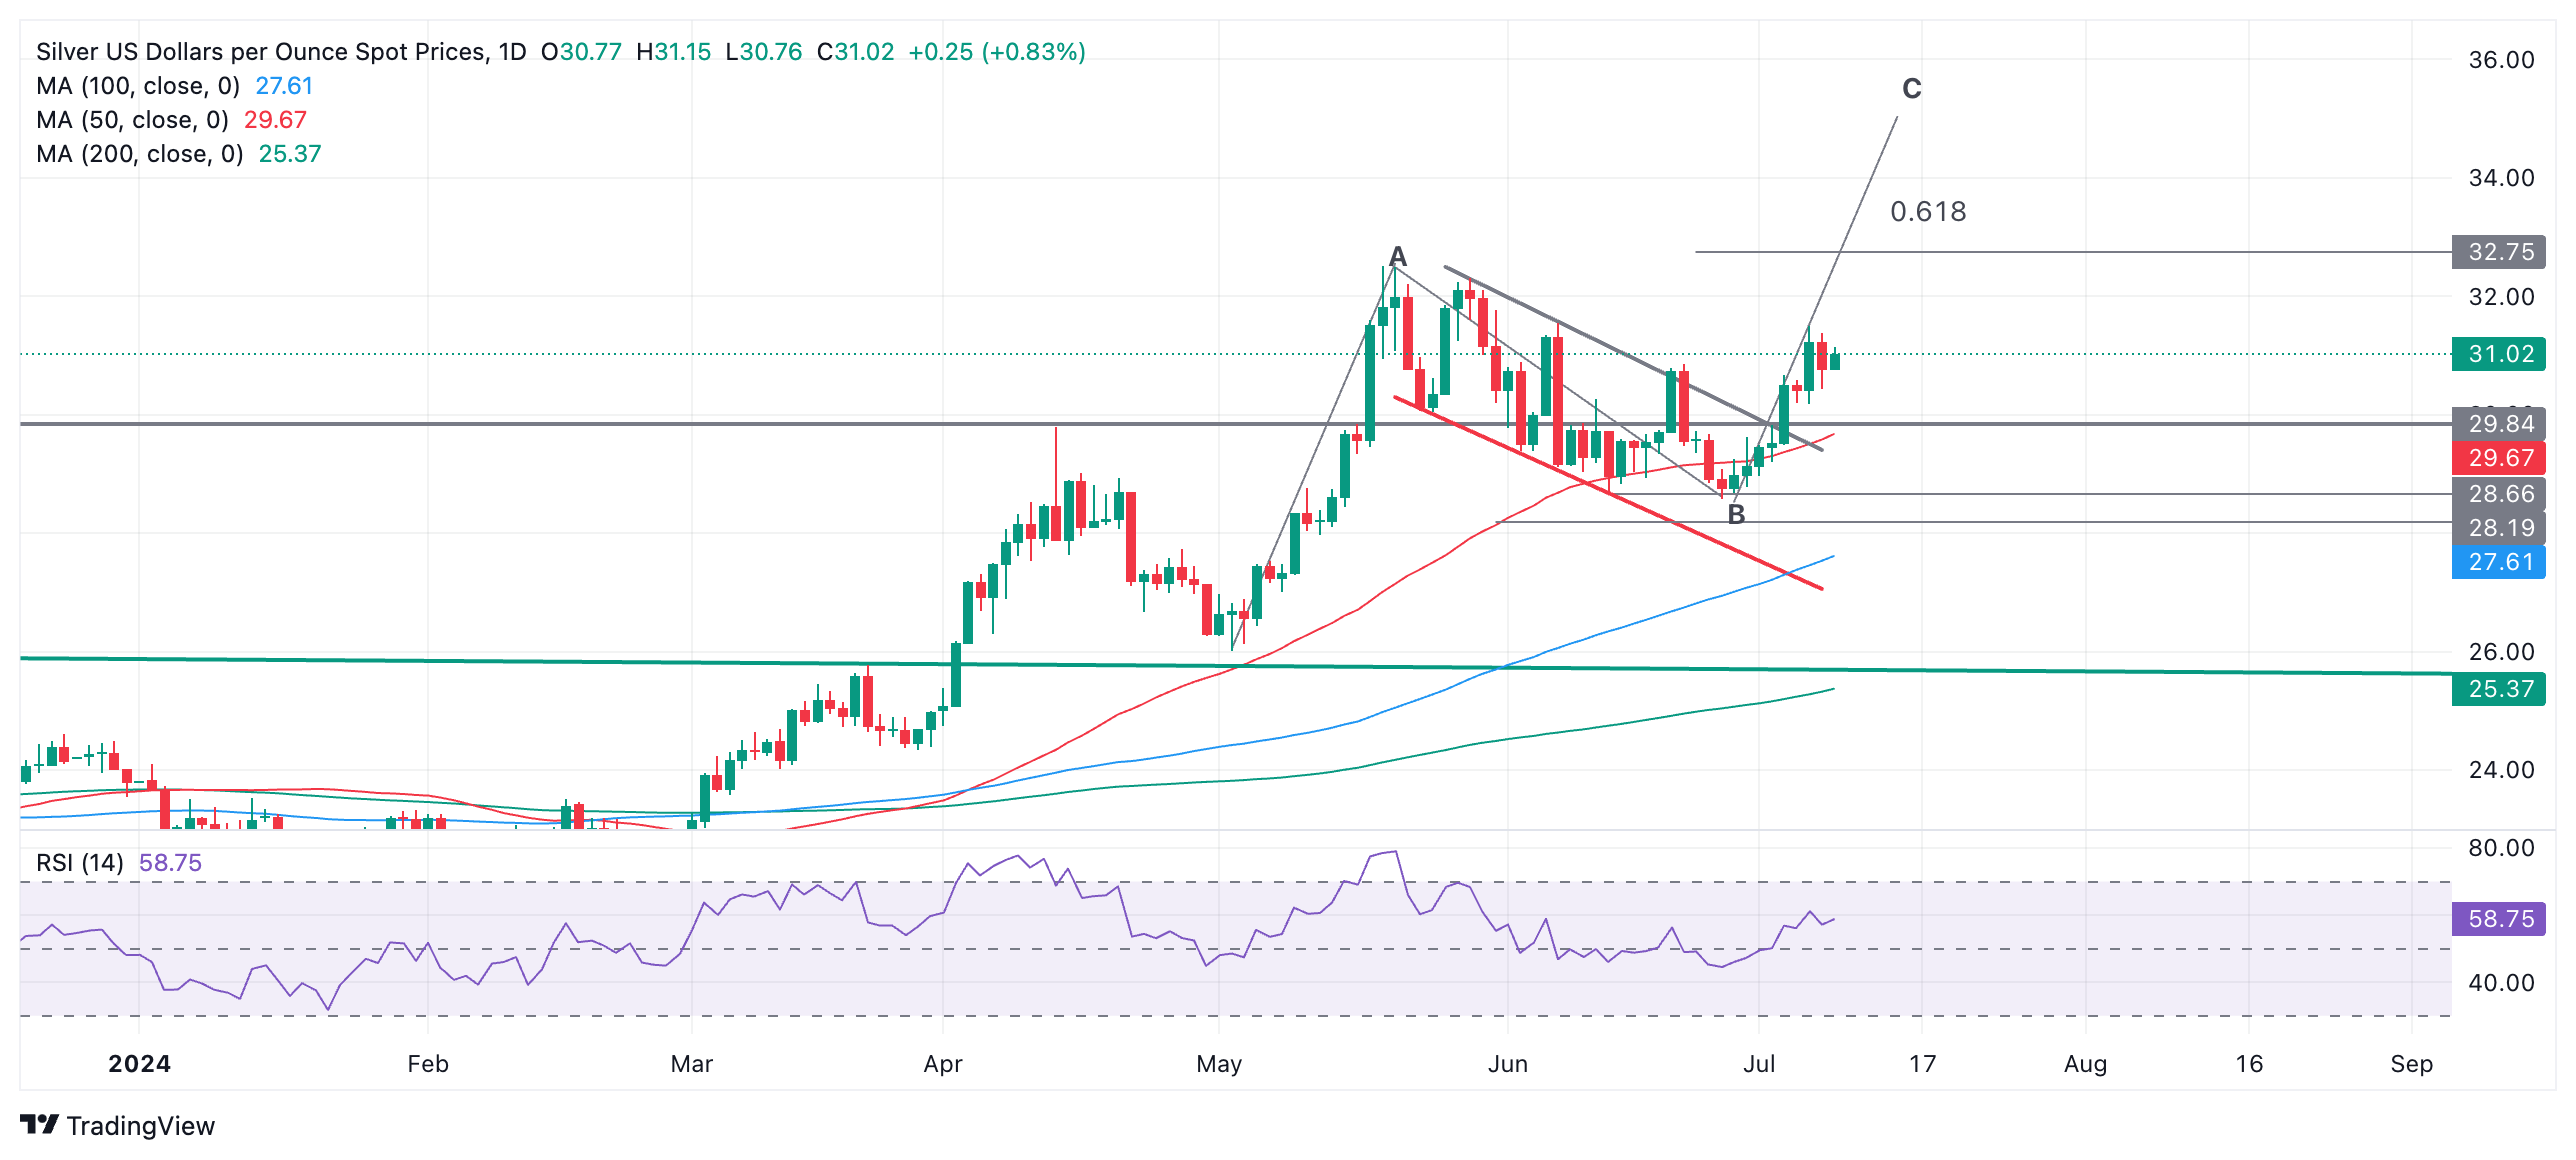
MMs are like large zig-zags composed of three waves, sometimes labeled A,B and C.
Wave C will probably reach the 0.618 extrapolation of wave A at $32.75, as a minimum expectation. If wave C is the same length as A – as is often the case – then it could reach $35.00.
A break above $31.49 would provide confirmation of the next leg higher.
- The Oil price falls further as the minimal impact of Hurricane Beryl eases supply concerns.
- Fed Powell may provide cues about when the central bank will deliver rate cuts.
- This week, investors will focus on CPI reports for June from China and the US.
West Texas Intermediate (WTI), futures on NYMEX, extend its correction to near $81.00 in Tuesday’s early American session. The Oil price faces selling pressure as supply concerns ease after meteorological department showed that the Hurricane Beryl weakened into a tropical storm after hitting the Texas coast.
Before that, major oil-shipping ports near the Gulf of Mexico, such as Corpus Christi, Galveston, and Houston, were shut to any major damage to infrastructure from Hurricane Beryl.
On the geopolitical front, rising expectations of a ceasefire between Israel and Palestine have also eased risks of supply chain disruptions.
Meanwhile, investors await the Federal Reserve (Fed) Chair Jerome Powell’s semi-annual Congressional testimony, which is scheduled at 14:00 GMT. Investors will look for cues about when the Fed will start reducing interest rates this year. Powell is less likely to provide a concrete timeframe for rate cuts as policymakers doubt whether the disinflation process has resumed after stalling in the first quarter.
This week, investors will keenly focus on the Consumer Price Index (CPI) reports from China and the United States (US), which will be published on Wednesday and Thursday, respectively.
The Oil price will be significantly influenced by the China’s inflation data as the nation is world’s largest importer of Oil. China’s annual consumer inflation is expected to grow at a faster pace of 0.4%. Annual Producer Price Index (PPI) is estimated to have contracted at a slower pace of 0.8%.
Investors will keenly focus on the US inflation data to know whether the disinflation process has resumed.
Brent Crude Oil FAQs
Brent Crude Oil is a type of Crude Oil found in the North Sea that is used as a benchmark for international Oil prices. It is considered ‘light’ and ‘sweet’ because of its high gravity and low sulfur content, making it easier to refine into gasoline and other high-value products. Brent Crude Oil serves as a reference price for approximately two-thirds of the world's internationally traded Oil supplies. Its popularity rests on its availability and stability: the North Sea region has well-established infrastructure for Oil production and transportation, ensuring a reliable and consistent supply.
Like all assets supply and demand are the key drivers of Brent Crude Oil price. As such, global growth can be a driver of increased demand and vice versa for weak global growth. Political instability, wars, and sanctions can disrupt supply and impact prices. The decisions of OPEC, a group of major Oil-producing countries, is another key driver of price. The value of the US Dollar influences the price of Brent Crude Oil, since Oil is predominantly traded in US Dollars, thus a weaker US Dollar can make Oil more affordable and vice versa.
The weekly Oil inventory reports published by the American Petroleum Institute (API) and the Energy Information Agency (EIA) impact the price of Brent Crude Oil. Changes in inventories reflect fluctuating supply and demand. If the data shows a drop in inventories it can indicate increased demand, pushing up Oil price. Higher inventories can reflect increased supply, pushing down prices. API’s report is published every Tuesday and EIA’s the day after. Their results are usually similar, falling within 1% of each other 75% of the time. The EIA data is considered more reliable, since it is a government agency.
OPEC (Organization of the Petroleum Exporting Countries) is a group of 13 Oil producing nations who collectively decide production quotas for member countries at twice-yearly meetings. Their decisions often impact Brent Crude Oil prices. When OPEC decides to lower quotas, it can tighten supply, pushing up Oil prices. When OPEC increases production, it has the opposite effect. OPEC+ refers to an expanded group that includes ten extra non-OPEC members, the most notable of which is Russia.
- The Mexican Peso recovers a little after the release of more inflationary data from Mexico.
- The data makes it less likely the Bank of Mexico will cut interest rates which supports the currency.
- On the charts, USD/MXN closes in on a key support level at 17.87.
The Mexican Peso (MXN) trades slightly lower in its key pairs on Tuesday, though it has recovered a little in the minutes after the release of more inflationary data from Mexico.
More broadly, the Peso continues to drift higher as carry flows continue to favor the Mexican Peso against its counterparts due to the attractiveness to foreign investors of the relatively high interest rates on offer in Mexico (11.00%).
Given the just-released data is showing inflation edging higher, the likelihood of interest rates falling any time soon is further diminished. This adds even more support to MXN.
At the time of writing, one US Dollar (USD) buys 18.03 Mexican Pesos, EUR/MXN trades at 19.49, and GBP/MXN at 23.07.
Mexican Peso recovers as Banxico less likely to cut interest rates
The Mexican Peso recovers slightly in the minutes following the release of key macroeconomic data for Mexico on Tuesday.
The Headline Inflation rate in Mexico in June came out at 0.38% on a month-on-month basis, beating the 0.24% expected by economists, and higher than the negative 0.19% of the previous month of May, according to data from INEGI.
Core Inflation for June, which takes out volatile food and energy components, gave a reading of 0.22%, falling below the 0.24% estimated by economists, but above the 0.17% in May.
The 12-Month Inflation rate in June, meanwhile, came out at 4.98%, which was higher than the 4.84% expected by economists, and the 4.69% previously.
Mexican Consumer Confidence in June rose to 48.1 in June compared to 46.7 in May.
The data makes it less likely the Bank of Mexico (Banxico) will be in a hurry to cut interest rates anytime soon. It comes after the Deputy Governor of the Banxico Jonathan Heath said he was adopting a data-dependent stance similar to that of Federal Reserve Chairman Jerome Powell in the US.
Technical Analysis: USD/MXN slides lower towards line in the sand
USD/MXN continues steadily declining as it unfolds a short-term downtrend towards the key June 24 line-in-the-sand low at 17.87.
USD/MXN Daily Chart
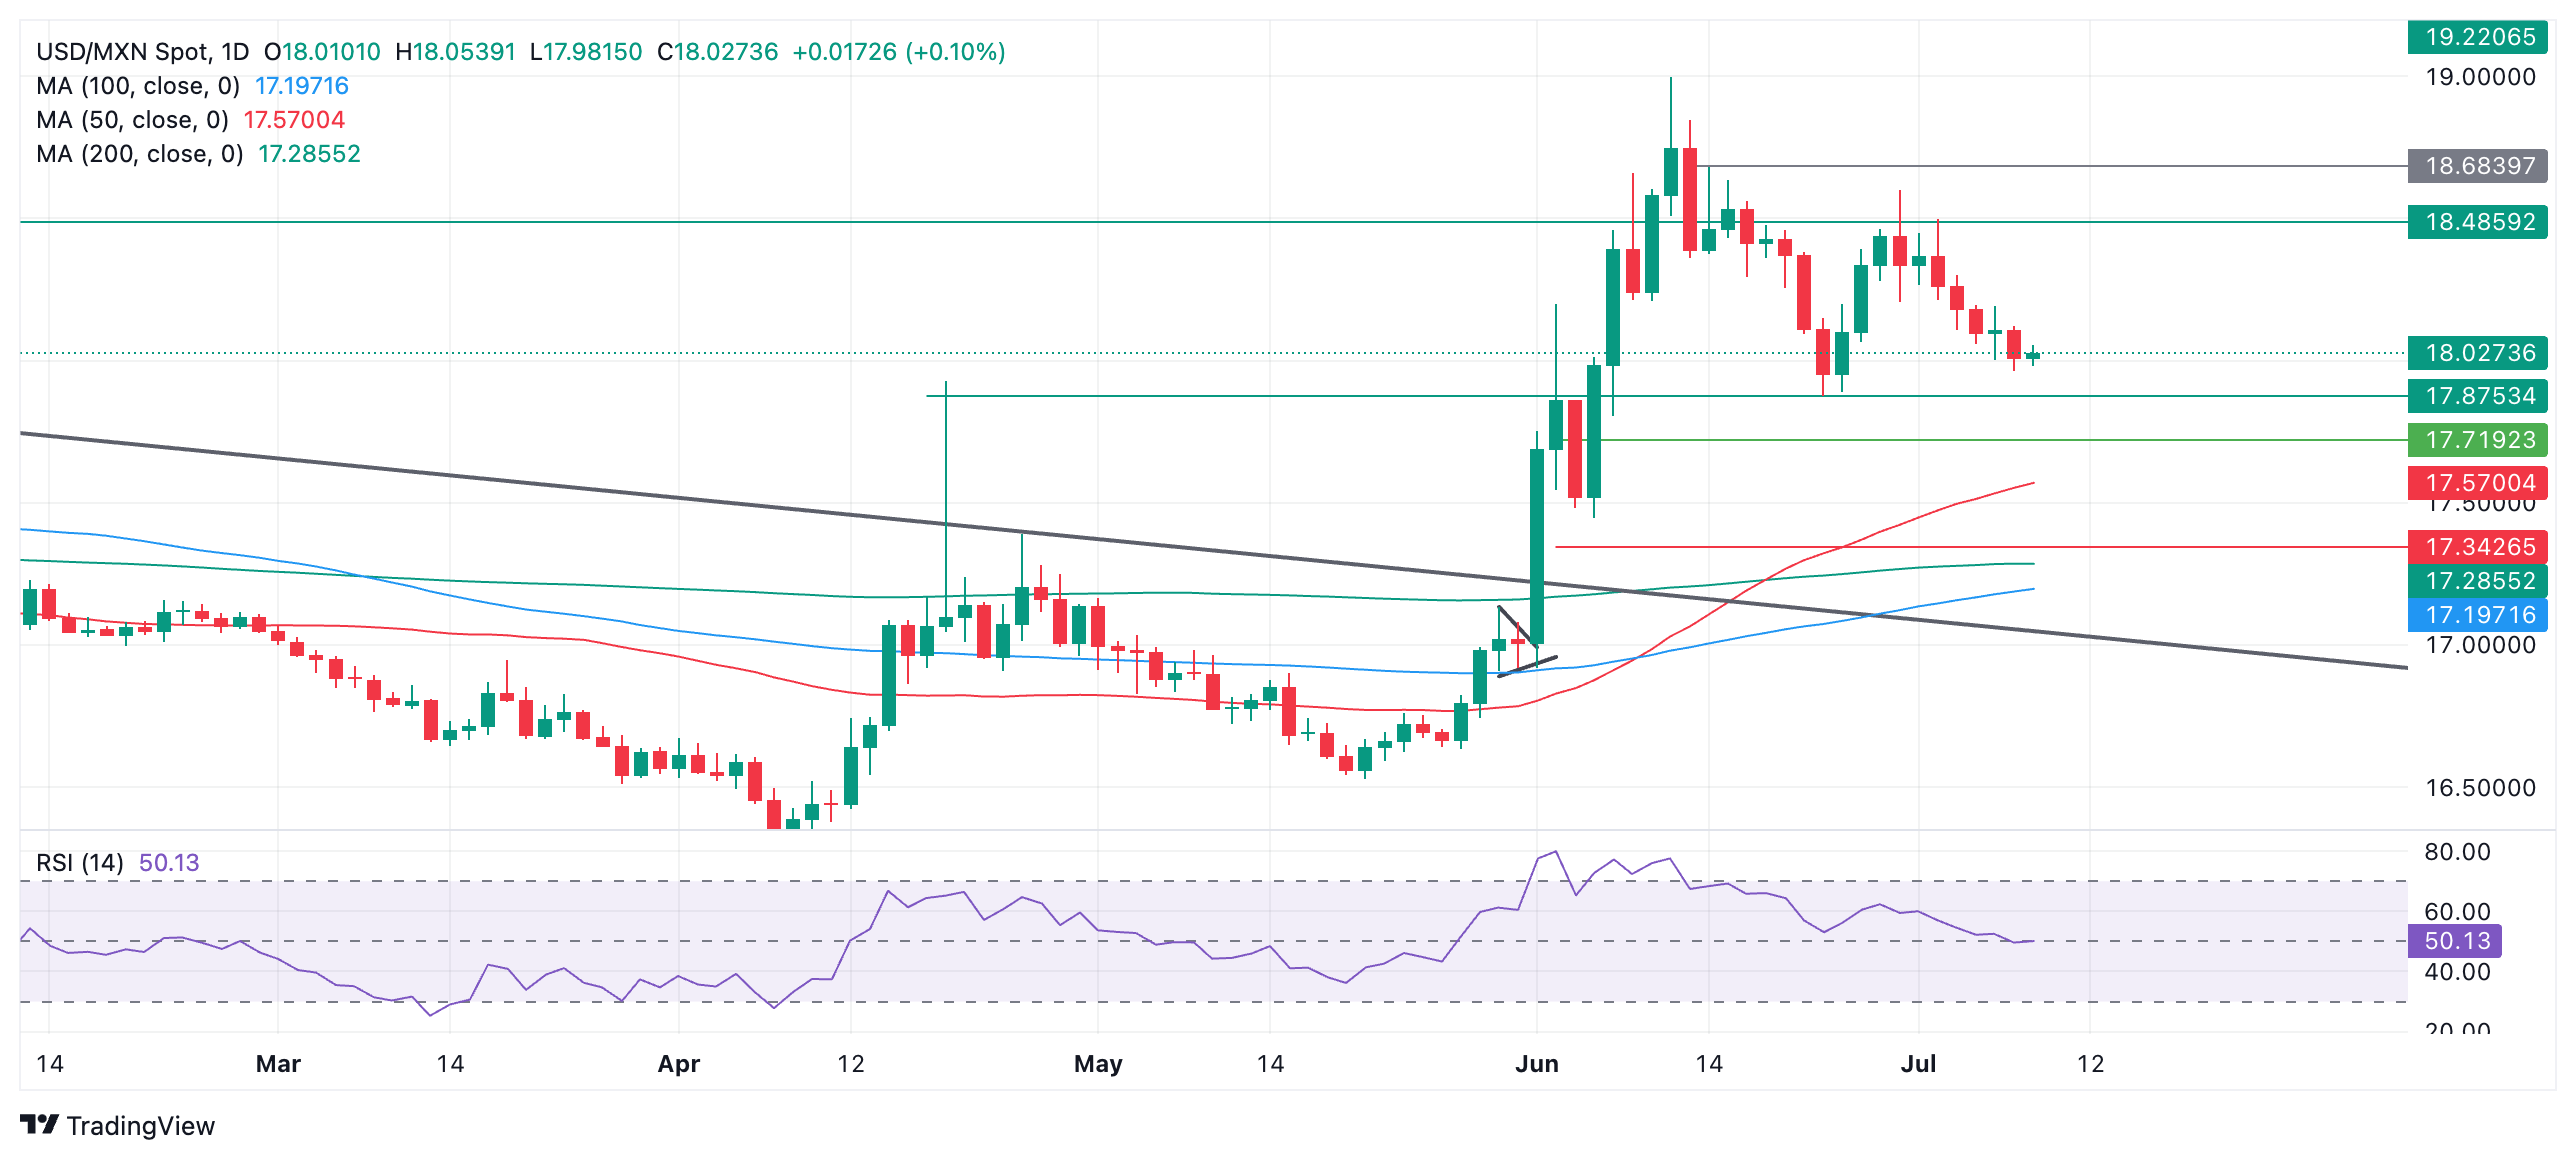
The pair is likely to encounter support at the 17.87 level and could bounce. A decisive break below, however, would reconfirm the downtrending bias, with the next target lying at 17.50 (50-day Simple Moving Average).
It is possible the pair could be about to enter a sideways trend, with the floor at the aforesaid June 24 low and a ceiling at the 18.50 level, although this would require a reversal and rebound higher, and remains a speculative guess.
As things stand the short-term trend is bearish and “the trend is your friend” suggesting it will extend.
The direction of the medium and long-term trends, meanwhile, remain in doubt.
Economic Indicator
12-Month Inflation
The 12-month inflation index released by the Bank of Mexico is a measure of price movements by the comparison between the retail prices of a representative shopping basket of goods and services. The purchase power of Mexican Peso is dragged down by inflation. The inflation index is a key indicator since it is used by the central bank to set interest rates. Generally speaking, a high reading is seen as positive (or bullish) for the Mexican Peso, while a low reading is seen as negative (or Bearish).
Read more.Last release: Tue Jul 09, 2024 12:00
Frequency: Monthly
Actual: 4.98%
Consensus: 4.84%
Previous: 4.69%
Source: National Institute of Statistics and Geography of Mexico
- USD/CAD edges lower as traders await the testimony of Fed Chair Jerome Powell to the US Senate on Tuesday.
- The pair is dominated by the US Dollar as the Canadian data schedule remains uneventful till next week.
- Markets keep betting on the Federal Reserve cutting US interest rates in September, a potential negative for USD/CAD.
USD/CAD edges higher on Tuesday, to trade in the 1.3640s, as it continues its broadly range-bound consolidative market mode of the last three-month period. Most of the emphasis is on the US Dollar side of the pair as traders await Federal Reserve (Fed) Chairman Jerome Powell’s testimony to the Senate Banking Committee, whilst Canada sees no scheduled macroeconomic events until Building Permits are released on Friday.
Fed Chair Powell is expected to chart a conservative line in his testimony to the Senate on Tuesday, more-or-less repeating the message he made when he spoke in at the central-bankers get together in Sintra. There he eased his stance from strictly data-dependent to admitting that there were now welcome signs inflation was falling, but that more evidence was required to establish that it was significant and sustainable. As such, it is expected he will keep markets guessing as to the timing of the Fed’s next policy move.
Markets are less ambivalent. The market-based probabilities of the Fed cutting interest rates by 0.25% to an upper band of 5.25% at the September Fed meeting have steadily risen over the past two weeks amid a negative compounding effect from a stream of not-quite-good-enough data releases. Most recently, ISM Services PMI data for June fell into contraction territory, and labor market data for the same month showed the Unemployment Rate rising to 4.1% – the third monthly increase in a row. Although NonFarm Payrolls beat expectations of 190K to register 206K new jobs added, the previous month was revised drastically down.
Inflation data has also generally come out on the cool side. In the NFP report Average Hourly Earnings remained unchanged from May and met expectations exactly. Prior to that the Fed’s preferred gauge of inflation, the Personal Consumption Expenditures (PCE) Price Index, edged down to 2.6% for both headline and core inflation in May. Before that Consumer Price Index data for May showed prices falling more than expected to 3.3% and core inflation also undershooting to 3.4%. Although both PCE and CPI are still above the Fed’s 2.0% target they are drifting in the right direction.
As far as Canadian data goes, its labor market seems to be suffering more than the US, as revealed in the Canadian version of the NFP report also released on Friday. This showed the Unemployment Rate rising to 6.4%, surpassing forecasts of 6.3% and marking its highest level since January 2022. Canadian payrolls were even worse, showing a 1.4K fall when economists had expected a 22.5K rise. The stresses in the labor market have been blamed on still-high interest rates in Canada stymying companies ability to access credit. This has led to further calls that the Bank of Canada (BoC) should cut interest rates again, after they reduced the policy rate by 0.25% to 4.75% in June – the first change in interest rates since July 2023.
Since lower interest rates or their expectation is generally negative for a currency all eyes will be on Powell’s comments and when the Fed will make its first move. Otherwise the Canadian Dollar looks more vulnerable as the BoC weighs further rate cuts to stimulate its sagging labor market.
- AUD/USD turns sideways near 0.6750 as Fed Powell’s testimony comes under spotlight.
- Increased market speculation for Fed rate cuts in September has improved market sentiment.
- The RBA is expected to raise interest rates further.
The AUD/USD pair turns sideways in Tuesday’s European session after printing a fresh six-month high at 0.6760 on Monday. The Aussie asset consolidates as investors shift to the sidelines ahead of the Federal Reserve (Fed) Chair Jerome Powell’s semi-annual Congressional testimony, which is scheduled at 14:00 GMT.
Investors expect that Fed Powell will argue in favor of keeping interest rates at their current levels until policymakers get evidence that inflation will return to the desired rate of 2%. In his discussions at the European Central Bank (ECB) Forum on the Central Banking last week, Powell said that the central bank has made some progress in inflation and recent data suggests that disinflation has resumed.
For more clarity on the inflation status, investors will focus on the United States (US) Consumer Price Index (CPI) data for June, which will be published on Thursday. Economists have forecasted that the core inflation, which takes out volatile food and energy items, grew steadily by 0.2% and 3.4% on monthly and annual basis, respectively.
Meanwhile, the market sentiment remains upbeat amid firm speculation that the Fed will start reducing interest rates from the September meeting. S&P 500 futures have posted decent gains in European trading hours. The US Dollar Index (DXY), which tracks the Greenback’s value against six major currencies, gains ground near 105.00.
On the Aussie front, investors expect that the Reserve Bank of Australia (RBA) could tighten its policy further as the disinflation process appears to have reversed. Australia’s monthly CPI rose strongly by 4% in May, which pushed back expectations of rate cuts this year.
Going forward, investors will focus on the China’s CPI data for June, which will be published on Wednesday. It is worth noting that Australia is the leading trading partner of China and a significant change in inflationary pressures in the Chinese economy could influence the Australian Dollar’s (AUD) outlook.
Economic Indicator
Fed's Chair Powell testifies
Federal Reserve Chair Jerome Powell testifies before Congress, providing a broad overview of the economy and monetary policy. Powell's prepared remarks are published ahead of the appearance on Capitol Hill.
Read more.Next release: Tue Jul 09, 2024 14:00
Frequency: Irregular
Consensus: -
Previous: -
Source: Federal Reserve
Federal Reserve (Fed) Chair Jerome Powell to deliver his Semiannual Monetary Policy Report to Congress on Tuesday, BBH analysts note.
Powell is expected to continue urging patience
“Fed Chair Powell delivers his Semiannual Monetary Policy Report to Congress. He appears before the Senate Banking Committee today and then before the House Financial Services Committee tomorrow.”
“Powell is expected to continue urging patience before the Fed eases. He noted last week that the latest data ‘do suggest that we’re getting back on a disinflationary path’ and stressed that “the strong economy and job market give us the ability to take time” before starting to cut rates.”
“The U.S. economy, whilst slowing, is still doing whether well and so the Fed will be cautious and remain on hold at the July 30-31 FOMC meeting. The market is pricing in less than 10% odds of a cut then and around 80% in September, virtually unchanged from pre-NFP. Barr and Bowman also speak today.”
- The US Dollar trades flat on Tuesday after a choppy Monday session.
- Focus shifts to Fed Chairman Jerome Powell as French political headlines fade.
- The US Dollar index hovers around 105.00 with a small bounce-off support.
The US Dollar (USD) trades roughly flat in the European session on Tuesday, with the dust settling over the French election outcome. Headlines are fading fast, and markets are digesting the results quite quickly. The main takeaway is that not much will change for France, seeing the near-impossible coalition formation. Traders do not bother any further on Tuesday and instead focus on US Federal Reserve (Fed) Chairman Jerome Powell, who will deliver a testimony at the Congressional Financial Committee on monetary policy and the US economy.
On the economic front, some relatively soft and third-party data come out from the National Federation of Independent Business (NFIB) and the TechnoMetrica Institute of Policy and Politics (TIPP). On the central banking front, as already mentioned, all eyes will be on Fed Chairman Powell. Though Federal Reserve Vice Chair for Supervision Michael Barr and Federal Reserve Governor Michelle Bowman should not be disregarded for possibly delivering some good remarks during the day.
Daily digest market movers: Back to normal programming
- The dust is settling quickly over the French election news. Expect this topic to fade into the background completely, as it will take a long time before any coalition will get formed in France.
- The National Federation of Independent Business (NFIB) already has released its numbers: the monthly Business Optimism Index for June jumped from 90.5 to 91.5, beating the 89.5 estimate.
- At 12:55 GMT, the weekly Redbook Index for the week ending July 5 is expected. The previous week, the number came in at 5.8%.
- At 14:00 GMT, the TechnoMetrica Institute of Policy and Politics (TIPP) will release the Economic Optimism Index for July. The previous reading was at 40.5, with no forecast available.
- The US Treasury will allocate a 52-week bill at 15:30 GMT and a 3-year note at 17:00 GMT.
- Three US Federal Reserve speakers are making their way to the stage on Tuesday:
- At 13:15 GMT, Federal Reserve Vice Chair for Supervision Michael Barr gives a speech titled "Financial Inclusion: Past, Present, and Hopes for the Future" at the Financial Inclusion Practices and Innovation Conference, in Washington, United States.
- Fed Chairman Jerome Powell delivers “The Semiannual Monetary Policy Report" to the US Congress in Washington. His speech will be published in full just minutes before his verbal delivery at Congress begins near 14:00 GMT.
- At 17:30 GMT, Federal Reserve Governor Michelle Bowman delivers a speech titled "Promoting an Inclusive Financial System" at the Financial Inclusion Practices and Innovation Conference, in Washington.
- This morning, equity markets painted a remarkable picture: both Asian and US indices are up, while Europe is lagging, with all major European indices down.
- The CME Fedwatch Tool is broadly backing a rate cut in September despite recent comments from Fed officials. The odds now stand at 73.6% for a 25-basis-point cut. A rate pause stands at a 22.9% chance, while a 50-basis-point rate cut has a slim 3.5% possibility.
- The US 10-year benchmark rate trades at 4.29%, near its weekly low.
US Dollar Index Technical Analysis: Powell to say boring things
The US Dollar Index (DXY) is back to square one this week after the small losses registered on Monday that occurred on the back of the French election outcome in Europe. With a government formation now in total gridlock, markets can write off France for the coming months as no risk anymore and quickly dial in on the speech from US Federal Reserve Chairman Jerome Powell. Expectations are that Powell will repeat that the Fed remains data-dependent, more needs to be done, though that disinflation is on the right trajectory with rates remaining stable, pushing forward any change in monetary stance to the Jackson Hole Symposium by late August.
On the upside, the 55-day Simple Moving Average (SMA) at 105.16 remains the first resistance. Should that level be reclaimed again, 105.53 and 105.89 are the next nearby pivotal levels. In case Fed Chairman Powell delivers some hawkish comments before Congress, the red descending trend line in the chart around 106.23 and April’s peak at 106.52 could come into play.
On the downside, the risk of a nosedive move is increasing, with only the double support at 104.78, which is the confluence of the 100-day SMA and the green ascending trend line from December 2023, still in place. Should that double layer give way, the 200-day SMA at 104.43 is the gatekeeper that should catch the DXY and avoid further declines. Further down, the correction could head to 104.00 as an initial stage.
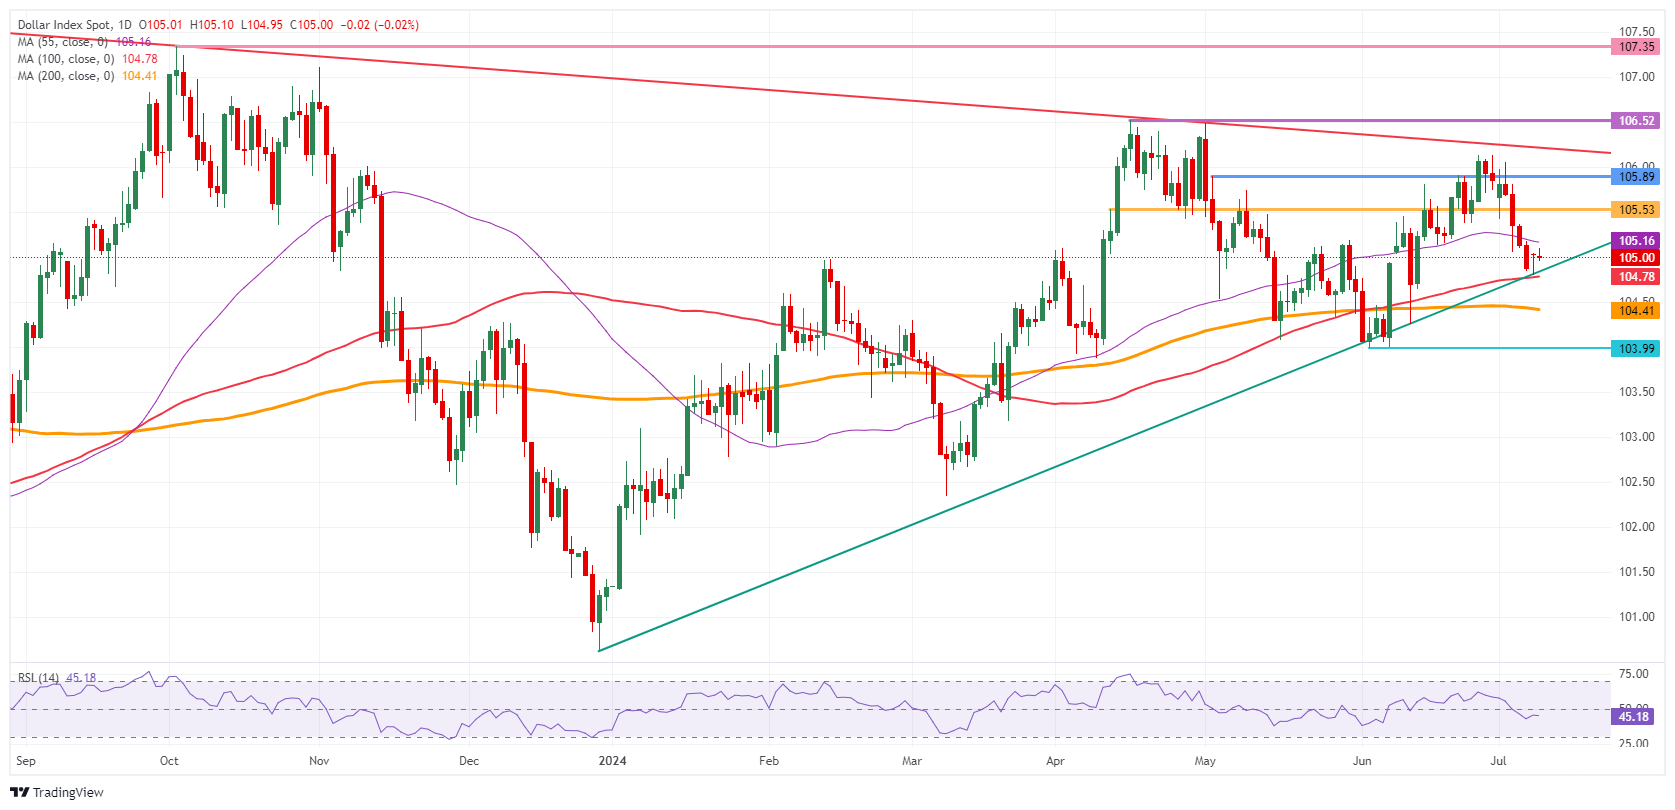
US Dollar Index: Daily Chart
US Dollar FAQs
The US Dollar (USD) is the official currency of the United States of America, and the ‘de facto’ currency of a significant number of other countries where it is found in circulation alongside local notes. It is the most heavily traded currency in the world, accounting for over 88% of all global foreign exchange turnover, or an average of $6.6 trillion in transactions per day, according to data from 2022. Following the second world war, the USD took over from the British Pound as the world’s reserve currency. For most of its history, the US Dollar was backed by Gold, until the Bretton Woods Agreement in 1971 when the Gold Standard went away.
The most important single factor impacting on the value of the US Dollar is monetary policy, which is shaped by the Federal Reserve (Fed). The Fed has two mandates: to achieve price stability (control inflation) and foster full employment. Its primary tool to achieve these two goals is by adjusting interest rates. When prices are rising too quickly and inflation is above the Fed’s 2% target, the Fed will raise rates, which helps the USD value. When inflation falls below 2% or the Unemployment Rate is too high, the Fed may lower interest rates, which weighs on the Greenback.
In extreme situations, the Federal Reserve can also print more Dollars and enact quantitative easing (QE). QE is the process by which the Fed substantially increases the flow of credit in a stuck financial system. It is a non-standard policy measure used when credit has dried up because banks will not lend to each other (out of the fear of counterparty default). It is a last resort when simply lowering interest rates is unlikely to achieve the necessary result. It was the Fed’s weapon of choice to combat the credit crunch that occurred during the Great Financial Crisis in 2008. It involves the Fed printing more Dollars and using them to buy US government bonds predominantly from financial institutions. QE usually leads to a weaker US Dollar.
Quantitative tightening (QT) is the reverse process whereby the Federal Reserve stops buying bonds from financial institutions and does not reinvest the principal from the bonds it holds maturing in new purchases. It is usually positive for the US Dollar.
The Dollar Index (DXY) is trading flat near 105.035 as markets await Fed Chair Powell’s Senate testimony, BBH analysts note.
DXY and EUR trade flat
“DXY is trading flat near 105.035 as markets await Fed Chair Powell’s Senate testimony.”
“The Euro (EUR) is trading flat near $1.0825 while the Pund Sterling (GBP) is trading higher near $1.2812. USD/JPY is trading higher near 161 even as the BOJ prepares to cut its bond-buying.”
“Recent softness in the data is challenging our view that the backdrop of persistent inflation and robust growth in the U.S. remains largely in place. However, we note that weaker data in many of the major economies underscore the fact that the relative story should continue to support the dollar.”
This morning, inflation in Hungary for June showed a drop from 4.0% to 3.7%, roughly in line with the central bank's forecast and ours, but two-tenths below market expectations. The June print is the first inflation number after the National Bank of Hungary announced a pause in its rate cutting cycle, so we expect increased market attention, ING’s FX analyst Frantisek Taborsky notes.
More weakness for HUF
“While on paper we do not expect rate cuts in the second half of the year, it is clear that if conditions allow for it, the NBH will not hesitate to use them. The first inflation print opens the door, but the next few months may be more complicated given our expectation of a pick-up in inflation.”
“Yesterday's budget figures in Hungary showed a further deterioration, but at the same time, the government announced new fiscal tax measures to improve the budget this year and next. In our view, this could cover the fiscal risk we saw earlier and the current official target of a 4.5% of GDP government deficit could be achieved.”
“Yesterday's depreciation of the HUF was triggered more by the announcement of tax changes for banks and the sell-off in the stock market as a result. However, rates were already slowly sliding down yesterday and today's inflation print will very likely increase market bets on rate cuts in second half of the year. And this should result in more HUF weakness.”
Hawkish Bank of England (BoE) MPC member Jonathan Haskel said that he will vote for a hold at his final meeting in August. BoE Chief Economist Huw Pill to speak on Wednesday, ING’s FX strategist Francesco Pesole notes.
BoE speakers to shed light on the current Central Bank stance
“Hawkish MPC member Jonathan Haskel was the first to deliver remarks following the Bank of England's quiet period around the election. He unsurprisingly said that he will vote for a hold at his final meeting in August as he highlighted inflation risks stemming from the tight labour market.”
“That may have helped the Pound Sterling (GBP) trade on the strong side for most of the European session yesterday, but it hardly provides an accurate snapshot of the MPC’s consensus. Tomorrow’s speech by Chief Economist Huw Pill, who is a more neutral member, should shed a brighter light on the current BoE stance ahead of key CPI data next week.”
“The calendar is empty in the UK today, and EUR/GBP held up quite well yesterday after the French vote result. We may be seeing some renewed pressure on the pair on the back of a rewidening in EGB spreads, but rate differentials will continue to point up ahead of the August BoE meeting, in our view.”
The dollar has been modestly stronger since the start of the weekend but there was nothing close to an earthquake in markets following the French election result, and FX volatility has continued to fall from its mid-June peak, ING’s FX strategist Francesco Pesole notes.
DXY hovers around 105.00 ahead of the CPI report Thursday
“Today’s highlight is Federal Reserve (Fed) Chair Jerome Powell’s testimony to the Senate, which will be replicated in the House tomorrow. It won’t be easy to extract relevant policy comments amid the often not so relevant questions by policymakers, and the market impact will be concentrated around the release of opening remarks.
“We stand by our view that if there is any deviation from the recent narrative, it should be on the dovish side, as Powell might see the June Dot Plot revisions as too hawkish and want to fine-tune communication on the back of recent data.”
“On the data side, we’ll keep a close eye on June’s NFIB Small Business Optimism index and on the hiring plans index, which tends to lead the month-on-month change in private payrolls by three months. We see DXY hover around 105.00 into the CPI risk event on Thursday, with any dovish surprises from Powell potentially being offset by EU political concerns.”
The Euro (EUR) appears to be waiting for cues from French coalition talks, with scenarios ranging from a left-wing government to a market-friendly technocrat prime minister. FX volatility has continued to drop in the meantime but EU politics may revamp it, ING FX analyst Francesco Pesole notes.
France faces a rather unusual political stalemate
“The market has been inundated with all sorts of scenario analysis after the French election resulted in a rather unusual political stalemate in France. Many are looking at precedents in the more coalition-prone Italian politics of the past few years for inspiration. That is not too much of a stretch, especially in the instances of a technocrat prime minister solution to coalition impasses.”
“In France, a coalition that includes a technocrat prime minister would likely require the exclusion of the most left-wing factions of the New Popular Front party, and it remains unclear whether this is feasible in terms of parliamentary arithmetics. That would be the most market-friendly scenario in the near term as it would prevent large spending measures.”
“The spectrum of less market-friendly options is rather wide and intricate. For now, it is likely that negotiations will prove anything but easy for President Emmanuel Macron, and markets may grow impatient. A rewidening in the OAT-Bund spread remains a tangible risk, and we see EUR/USD upside capped in the near term.”
- Gold pulls back after the news the PBoC has stopped purchasing Gold for the second month in a row.
- The PBoC is one of the largest consumers of the precious metal and for 18 consecutive months until May accumulated Gold.
- Gold forms a two-bar reversal pattern on the daily chart, which could indicate a short-term pullback.
Gold (XAU/USD) is trading flat in the $2,360s on Tuesday – stabilizing after the heavy sell-off on Monday. Gold’s weakness at the start of the week came after the news that the People’s Bank of China (PBoC), one of the largest consumers of Gold in the world, had not bought any Gold for the second month in a row in June, after 18 consecutive months of reserve-building, according to data from the PBoC.
Gold declines on impact of Trump on bond markets
Gold has also declined as a result of the US Treasury bond market absorbing political risk from an increased chance that former President Donald Trump will win the US presidential election in November.
If Trump wins the presidency, he is expected to cut taxes and borrow, leading to a worsening fiscal position for the US. Critics say his fiscal profligacy will lead to higher inflation, which in turn will keep interest rates high. Gold is falling because it is a non-interest-bearing asset that becomes less attractive to investors when interest rates are high.
The possibility of a Trump presidency is pushing bond prices down and bond yields up, benefiting the US Dollar (USD) because of its high correlation with yields. This, in turn, weighs on the Gold price, which is primarily bought and sold in USD.
After a recent televised debate in Atlanta, in which President Biden struggled to answer several of the questions, critics raised doubts about his cognitive capacity given his advanced years and possible dementia. The upshot is that Trump has increased his lead in opinion polls. Additionally, if Biden steps down, his number two, Kamala Harris, is seen as unlikely to have Biden’s broad appeal.
Trump’s presidential challenge has further gained credibility after the US Supreme Court decided he had partial immunity from any responsibility for the uprising that followed his defeat at the 2020 election and led to his supporters storming Capitol Hill. Prior to the ruling, it was thought Trump’s various indictments might disrupt his campaign or prevent him from taking office.
Technical Analysis: Gold forms a two-bar reversal
Gold has formed a two-bar reversal pattern (green shaded rectangle) after climbing to a major resistance level at the June 7 high at $2,388. This pattern forms after a long green-up day is followed by a long red-down day of a similar length and size. When this occurs at a market top, it can be a short-term reversal sign.
XAU/USD Daily Chart
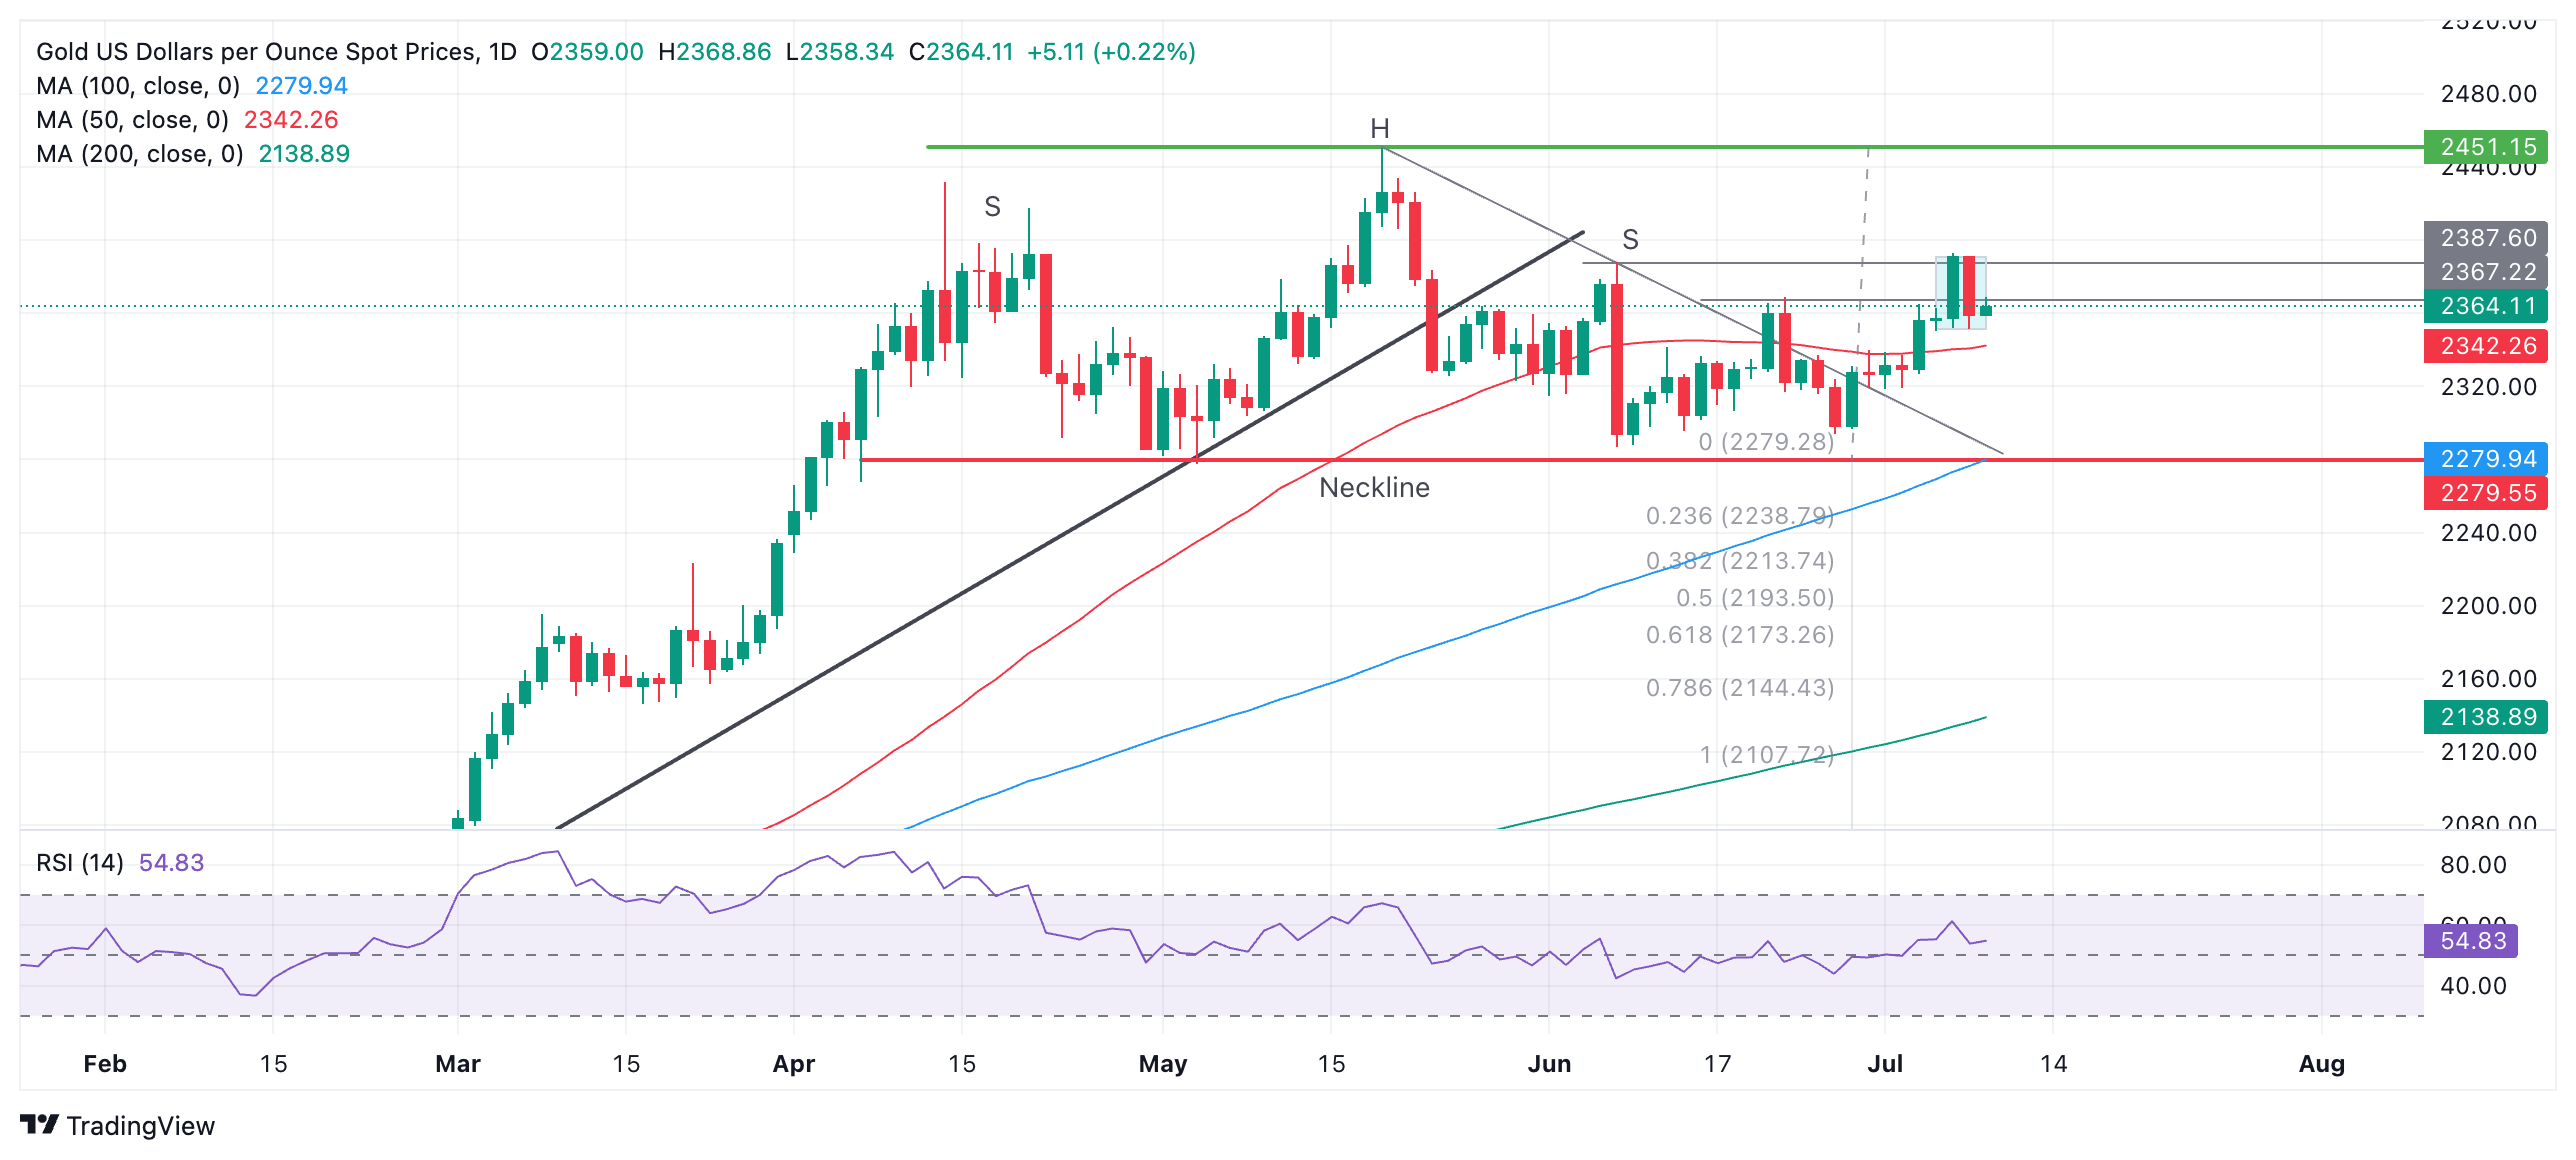
The outlook is unclear, but Gold could pull back now, perhaps falling to the 50-day Simple Moving Average (SMA) at $2,342.
If Gold can break above Friday’s peak of $2,393, it will continue the sequence of higher highs and probably unlock the next target at the $2,451 all-time high.
The bearish Head & Shoulders topping pattern that formed from April to June has been invalidated by the recent recovery. However, there is still a chance – albeit much reduced – that a more complex topping pattern may have formed instead.
If a complex pattern has formed in place of the H&S, and the price breaks below the pattern’s neckline at $2,279, a reversal lower may still be possible with a conservative target at $2,171, the 0.618 ratio of the height of the pattern extrapolated lower.
The trend is now sideways in both the short and medium term. In the long term, Gold remains in an uptrend.
Gold FAQs
Gold has played a key role in human’s history as it has been widely used as a store of value and medium of exchange. Currently, apart from its shine and usage for jewelry, the precious metal is widely seen as a safe-haven asset, meaning that it is considered a good investment during turbulent times. Gold is also widely seen as a hedge against inflation and against depreciating currencies as it doesn’t rely on any specific issuer or government.
Central banks are the biggest Gold holders. In their aim to support their currencies in turbulent times, central banks tend to diversify their reserves and buy Gold to improve the perceived strength of the economy and the currency. High Gold reserves can be a source of trust for a country’s solvency. Central banks added 1,136 tonnes of Gold worth around $70 billion to their reserves in 2022, according to data from the World Gold Council. This is the highest yearly purchase since records began. Central banks from emerging economies such as China, India and Turkey are quickly increasing their Gold reserves.
Gold has an inverse correlation with the US Dollar and US Treasuries, which are both major reserve and safe-haven assets. When the Dollar depreciates, Gold tends to rise, enabling investors and central banks to diversify their assets in turbulent times. Gold is also inversely correlated with risk assets. A rally in the stock market tends to weaken Gold price, while sell-offs in riskier markets tend to favor the precious metal.
The price can move due to a wide range of factors. Geopolitical instability or fears of a deep recession can quickly make Gold price escalate due to its safe-haven status. As a yield-less asset, Gold tends to rise with lower interest rates, while higher cost of money usually weighs down on the yellow metal. Still, most moves depend on how the US Dollar (USD) behaves as the asset is priced in dollars (XAU/USD). A strong Dollar tends to keep the price of Gold controlled, whereas a weaker Dollar is likely to push Gold prices up.
US Dollar (USD) net long positions have decreased for the second week in a row. The Euro (EUR) net short positions have increased, driven by a decrease in long positions. The Pound Sterling (GBP) net longs have increased and the Mexican Peso (MXN) net longs have increased for the second week in a row,
MXN net longs show a significant increase
“USD net long positions have decreased for the second week in a row, driven by an increase in short positions as hopes for a September Fed rate cut are bolstered. On June 27th, personal consumption for Q1 was revised down from 2.0% to 1.5% and continuing jobless claims registered their highest level since November 2021.”
“EUR net short positions have increased, driven by a decrease in long positions. Eurozone CPI inflation for June registered in line with expectations at 0.2% m/m, while the unemployment rate in May stayed steady at 6.4%. Results of the first round of voting in the French parliamentary elections had hinted at a right-wing victory.”
“MXN net longs have increased for the second week in a row, driven by an increase in long positions. The Bank of Mexico released its decision to maintain the overnight rate at 11.00% in a 4-1 split decision.
- EUR/JPY is positioned within a rising wedge pattern, signaling a potential bearish reversal.
- The 14-day RSI indicates the currency asset is in an overbought condition.
- The upper boundary of the rising wedge around the 174.40 level acts as immediate resistance.
EUR/JPY halts its three-day losing streak, trading around 174.30 during the European hours on Tuesday. The analysis of the daily chart shows a rising wedge pattern, indicating a potential bearish reversal. Furthermore, the 14-day Relative Strength Index (RSI) is above the 70 level, suggesting the currency asset is overbought and may face a correction.
The momentum indicator Moving Average Convergence Divergence (MACD) line is currently above both the centerline and the signal line, indicating confirmation of bullish momentum. Traders may anticipate additional movements, watching for potential shifts in momentum in the EUR/JPY cross.
The EUR/JPY cross faces potential resistance near the upper boundary of the rising wedge around the 174.40 level. A successful breakthrough above this level could strengthen the bullish bias and lead the cross toward the psychological level of 175.00.
On the downside, the key support appears around the nine-day Exponential Moving Average (EMA) at 173.52, followed by the lower boundary of the rising wedge around the level of 173.50. A break below the latter could exert downward pressure on the EUR/JPY cross to navigate the region around the psychological level of 170.00
Further decline may increase the selling pressure on the EUR/JPY cross to navigate the vicinity around the throwback support at 167.60.
EUR/JPY: Daily Chart
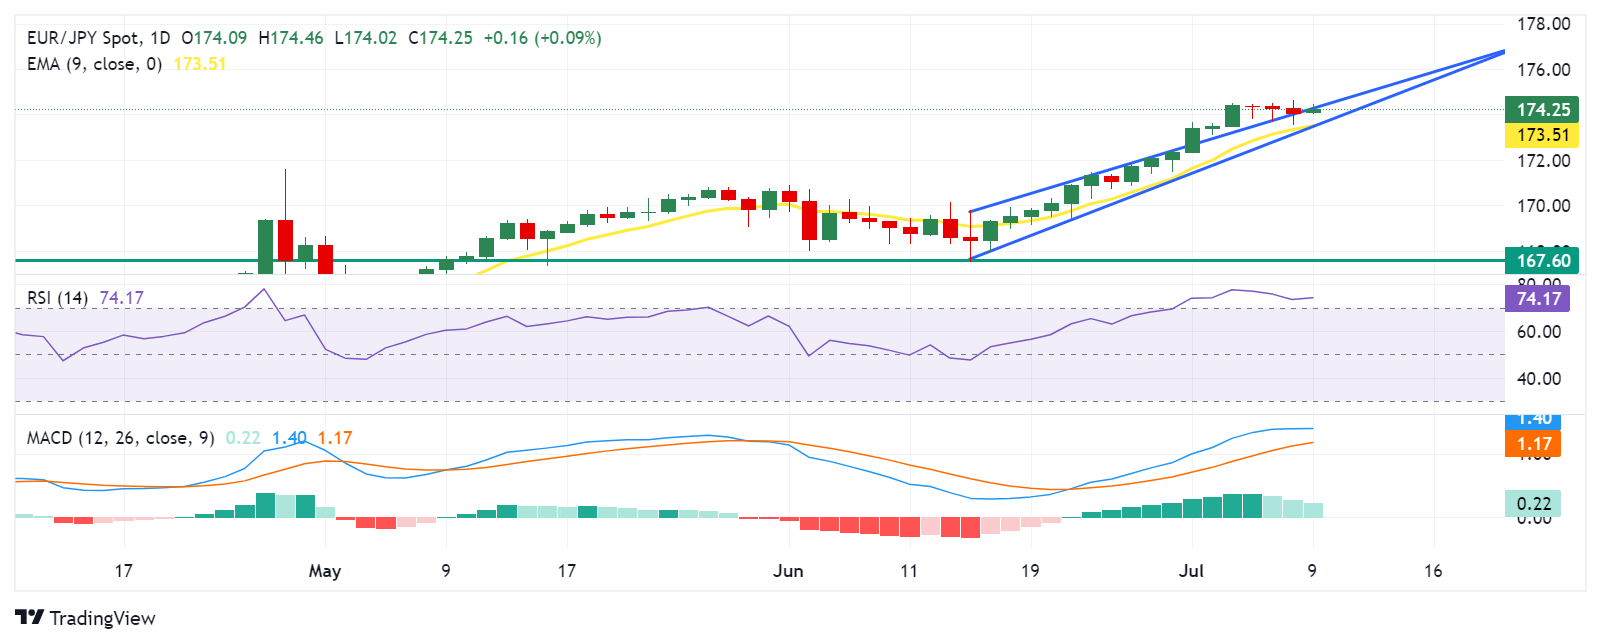
Euro PRICE Today
The table below shows the percentage change of Euro (EUR) against listed major currencies today. Euro was the strongest against the New Zealand Dollar.
| USD | EUR | GBP | JPY | CAD | AUD | NZD | CHF | |
|---|---|---|---|---|---|---|---|---|
| USD | 0.02% | -0.02% | 0.08% | 0.00% | -0.04% | 0.12% | 0.00% | |
| EUR | -0.02% | -0.05% | 0.07% | -0.03% | -0.06% | 0.10% | -0.02% | |
| GBP | 0.02% | 0.05% | 0.12% | 0.02% | 0.01% | 0.15% | 0.02% | |
| JPY | -0.08% | -0.07% | -0.12% | -0.10% | -0.14% | 0.00% | -0.11% | |
| CAD | -0.00% | 0.03% | -0.02% | 0.10% | -0.06% | 0.13% | -0.01% | |
| AUD | 0.04% | 0.06% | -0.01% | 0.14% | 0.06% | 0.14% | 0.00% | |
| NZD | -0.12% | -0.10% | -0.15% | -0.01% | -0.13% | -0.14% | -0.12% | |
| CHF | -0.00% | 0.02% | -0.02% | 0.11% | 0.01% | -0.00% | 0.12% |
The heat map shows percentage changes of major currencies against each other. The base currency is picked from the left column, while the quote currency is picked from the top row. For example, if you pick the Euro from the left column and move along the horizontal line to the US Dollar, the percentage change displayed in the box will represent EUR (base)/USD (quote).
- EUR/USD steadies above 1.0800 as easing US labor market strength weighs on the US Dollar.
- Fed’s Powell may refrain from providing a specific timeframe for rate cuts.
- ECB’s Knot doesn’t see the central bank delivering subsequent rate cuts in July.
EUR/USD clings to gains above the crucial support of 1.0800 in Tuesday’s European session. The major currency pair holds gains as the US Dollar (USD) remains under pressure due to firm market speculation that the Federal Reserve (Fed) will start reducing interest rates in September.
According to the CME FedWatch tool, traders see a 77% chance that interest rates will be lower than current levels in the September meeting, up from 65.6% recorded a week ago. Easing United States (US) labor market strength has prompted expectations for the Fed to pivot to policy normalization in September. The Unemployment Rate rose to its highest in more than two years, and Average Hourly Earnings eased expectedly in June, pointing to moderating labor market conditions.
For fresh guidance on interest rates, investors will shift focus to the Fed Chair Jerome Powell’s semi-annual Congressional testimony, scheduled at 14:00 GMT. Powell is expected to reiterate that interest rates need to be held steady at their current levels until they observe a decline in inflationary pressures for months.
Powell acknowledged, in the European Central Bank (ECB) Forum of Central Banking, that the central bank has made quite a bit of progress on inflation, and recent data shows that the disinflation process has resumed.
For more clarity on disinflation, investors will focus on the US Consumer Price Index (CPI) report for June, which will be published on Thursday. The core CPI data, which excludes volatile food and energy prices, is estimated to have grown steadily, while headline figures are expected to have decelerated.
Daily digest market movers: EUR/USD holds strength above 1.0800 as ECB’s Knot pushes back rate-cut hopes
- EUR/USD turns sideways above 1.0800 after printing a fresh three-week high near 1.0850 on Monday. The major currency pair strengthens as the Euro’s outlook improves after French election polls showed the Marine Le Pen-led-far right National Rally missing an absolute majority. This has reduced the risks of widening France’s debt crisis.
- However, political uncertainty remains intact as no Party gains an outright majority. This leads to the formation of a coalition government that results in a significant delay in fiscal decisions due to divergent opinions. Investors expect that Jean-Luc Mélenchon's left-wing coalition, which unexpectedly gained higher seats than the rest, will join hands with President Emmanuel Macron's centrist alliance to form a new government.
- Meanwhile, easing speculation that the ECB will deliver subsequent rate cuts in the July meeting has supported the downside in the Euro. Officials expect price pressures will not deviate far from their current levels this year, but an aggressive policy easing stance could revamp them.
- On Monday, ECB policymaker and Dutch central bank chief Klaas Knot pushed back expectations of rate cuts in July. Knot said in an interview with Handelsblatt, “I don't see a case for another rate cut in July." However, he remained comfortable with market expectations of more rate cuts this year, and for that, he is open for the September meeting.
Technical Analysis: EUR/USD hovers above 1.0800
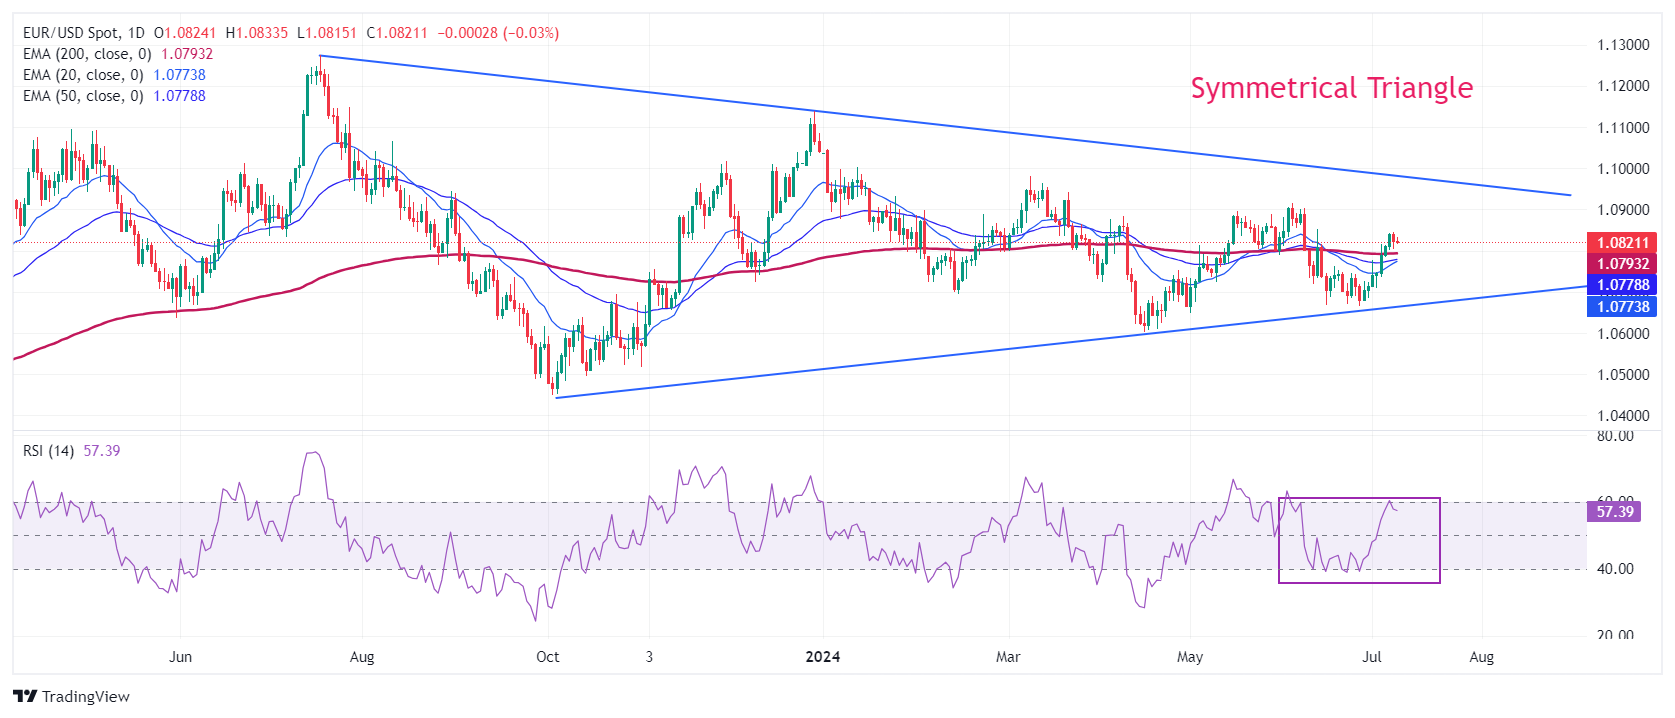
EUR/USD trades inside Monday’s trading range as investors stay on the sidelines ahead of the Fed Powell’s testimony. The major currency pair stabilizes above the 20-day and 50-day Exponential Moving Averages (EMAs), which trade around 1.0750 and 1.0770, respectively. The overall trend of the shared currency pair has also strengthened as it has jumped above the 200-day EMA, which trades around 1.0800.
The Symmetrical Triangle formation on the daily timeframe exhibits a sharp volatility contraction, which indicates low volume and narrow ticks.
The 14-day Relative Strength Index (RSI) reaches 60.00. Should the bullish momentum be triggered if it breaks above 60.00?
Euro FAQs
The Euro is the currency for the 20 European Union countries that belong to the Eurozone. It is the second most heavily traded currency in the world behind the US Dollar. In 2022, it accounted for 31% of all foreign exchange transactions, with an average daily turnover of over $2.2 trillion a day. EUR/USD is the most heavily traded currency pair in the world, accounting for an estimated 30% off all transactions, followed by EUR/JPY (4%), EUR/GBP (3%) and EUR/AUD (2%).
The European Central Bank (ECB) in Frankfurt, Germany, is the reserve bank for the Eurozone. The ECB sets interest rates and manages monetary policy. The ECB’s primary mandate is to maintain price stability, which means either controlling inflation or stimulating growth. Its primary tool is the raising or lowering of interest rates. Relatively high interest rates – or the expectation of higher rates – will usually benefit the Euro and vice versa. The ECB Governing Council makes monetary policy decisions at meetings held eight times a year. Decisions are made by heads of the Eurozone national banks and six permanent members, including the President of the ECB, Christine Lagarde.
Eurozone inflation data, measured by the Harmonized Index of Consumer Prices (HICP), is an important econometric for the Euro. If inflation rises more than expected, especially if above the ECB’s 2% target, it obliges the ECB to raise interest rates to bring it back under control. Relatively high interest rates compared to its counterparts will usually benefit the Euro, as it makes the region more attractive as a place for global investors to park their money.
Data releases gauge the health of the economy and can impact on the Euro. Indicators such as GDP, Manufacturing and Services PMIs, employment, and consumer sentiment surveys can all influence the direction of the single currency. A strong economy is good for the Euro. Not only does it attract more foreign investment but it may encourage the ECB to put up interest rates, which will directly strengthen the Euro. Otherwise, if economic data is weak, the Euro is likely to fall. Economic data for the four largest economies in the euro area (Germany, France, Italy and Spain) are especially significant, as they account for 75% of the Eurozone’s economy.
Another significant data release for the Euro is the Trade Balance. This indicator measures the difference between what a country earns from its exports and what it spends on imports over a given period. If a country produces highly sought after exports then its currency will gain in value purely from the extra demand created from foreign buyers seeking to purchase these goods. Therefore, a positive net Trade Balance strengthens a currency and vice versa for a negative balance.
Federal Reserve (Fed) Chair Powell is testifying to the Senate Banking Committee today. The issue is whether Powell (who is not an economist) will be able to answer any perceptive questions that might be asked, UBS macro strategist Paul Donovan notes.
Powell, policy, and perceptive questions
“The Powell Fed has become more politically sensitive—Powell has tended to focus more on issues politicians care about and less on what an independent central banker should worry about. The best to hope for today is probably recognition of some of the recent data weakness, and retaining the option of a September rate cut.”
“The UK June BRC shop sales index showed a falling value of sales against expectations for an increase. This may be weather related (June has been moderately moist), but as a value measure this might also reflect further price discounting as consumers refuse to accept price increases.”
- USD/CHF recovers to near 0.9000 ahead of Fed Powell’s testimony.
- Investors expect that the Fed will start reducing interest rates from September.
- Market speculation for more rate cuts by the SNB has improved.
The USD/CHF pair rebounds to near the psychological resistance of 0.9000 in Tuesday’s European session. The Swiss Franc asset moves higher as the US Dollar (USD) gains ground ahead of the Federal Reserve (Fed) chair Jerome Powell’s semi-annual Congressional testimony, which is scheduled at 14:00 GMT.
The US Dollar Index (DXY), which tracks the Greenback’s value against six major currencies, steadies after declining to a fresh three-week low near 104.85.
Fed Powell would provide cues about when the central bank will start reducing interest rates. Financial markets currently expect the Fed to begin lowering its key rates from the September meeting. This week, the major trigger for the US Dollar will be the US inflation data for June which will be published on Thursday.
On the Swiss Franc front, investors expect that the Swiss National Bank (SNB) could continue easing its monetary policy as inflation in the Swiss economy has decelerated further. Annual Swiss inflation grew at a slower pace of 1.3% in June from the estimates and the prior release of 1.4%.
USD/CHF trades in a Falling Channel chart pattern on a daily timeframe in which each pullback is considered as selling opportunity by market participants. The Swiss Franc asset finds cushion near 200-day Exponential Moving Average (EMA) around 0.8950, suggesting that a bullish long-trend is intact.
The 14-day Relative Strength Index (RSI) oscillates in the 40.00-60.00 range, suggesting indecisiveness among investors.
Going forward, a decisive upside above June 3 high at 0.9036will drive the asset towards May 28 low at 0.9086, followed by May 30 high at 0.9140.
On the flip side, the asset would expose to downside if it breaks below June 4 low of 0.8900. This would drag the asset towards March 21 low at 0.8840 and the round-level support of 0.8800.
USD/CHF daily chart
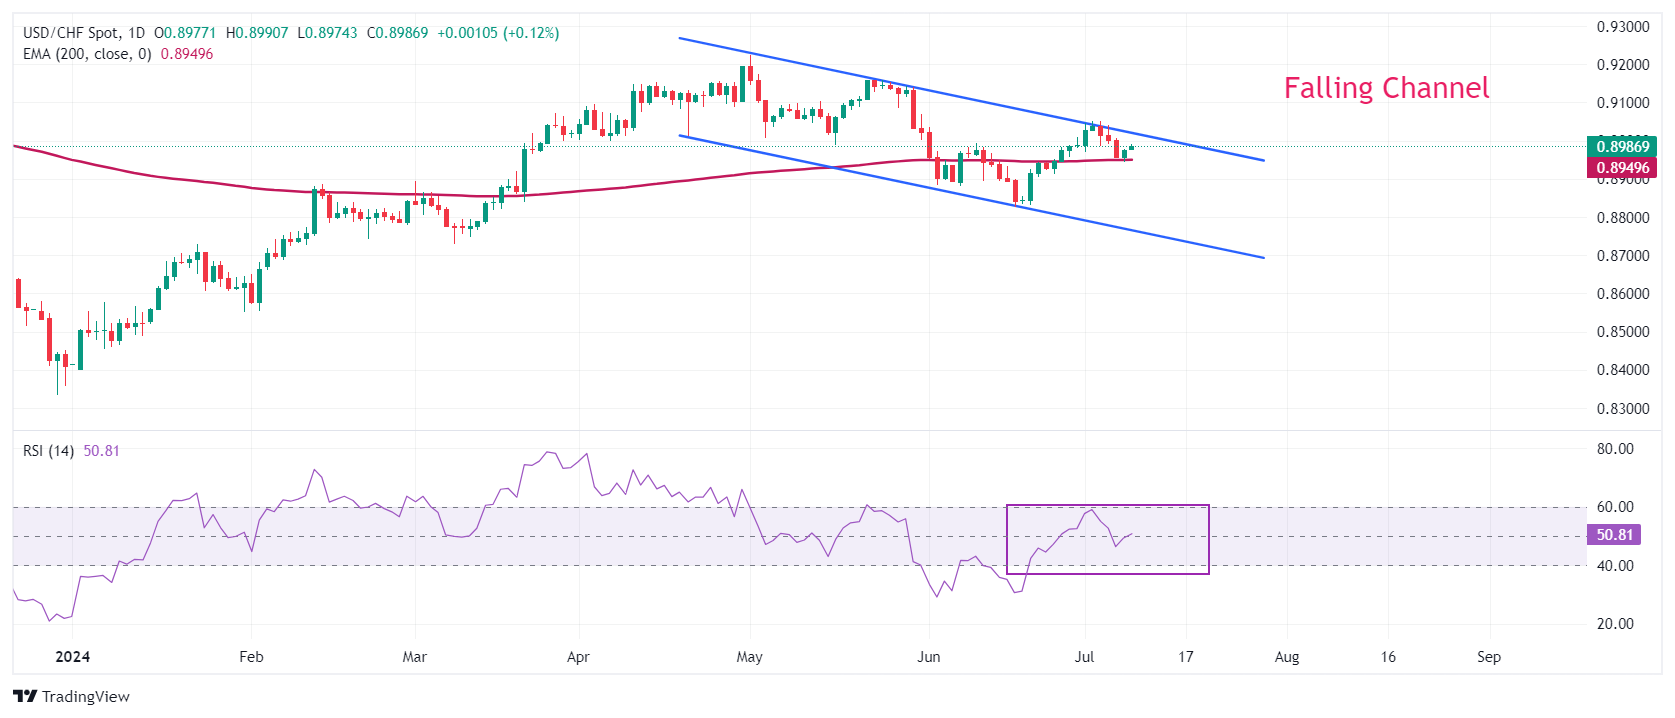
Swiss Franc FAQs
The Swiss Franc (CHF) is Switzerland’s official currency. It is among the top ten most traded currencies globally, reaching volumes that well exceed the size of the Swiss economy. Its value is determined by the broad market sentiment, the country’s economic health or action taken by the Swiss National Bank (SNB), among other factors. Between 2011 and 2015, the Swiss Franc was pegged to the Euro (EUR). The peg was abruptly removed, resulting in a more than 20% increase in the Franc’s value, causing a turmoil in markets. Even though the peg isn’t in force anymore, CHF fortunes tend to be highly correlated with the Euro ones due to the high dependency of the Swiss economy on the neighboring Eurozone.
The Swiss Franc (CHF) is considered a safe-haven asset, or a currency that investors tend to buy in times of market stress. This is due to the perceived status of Switzerland in the world: a stable economy, a strong export sector, big central bank reserves or a longstanding political stance towards neutrality in global conflicts make the country’s currency a good choice for investors fleeing from risks. Turbulent times are likely to strengthen CHF value against other currencies that are seen as more risky to invest in.
The Swiss National Bank (SNB) meets four times a year – once every quarter, less than other major central banks – to decide on monetary policy. The bank aims for an annual inflation rate of less than 2%. When inflation is above target or forecasted to be above target in the foreseeable future, the bank will attempt to tame price growth by raising its policy rate. Higher interest rates are generally positive for the Swiss Franc (CHF) as they lead to higher yields, making the country a more attractive place for investors. On the contrary, lower interest rates tend to weaken CHF.
Macroeconomic data releases in Switzerland are key to assessing the state of the economy and can impact the Swiss Franc’s (CHF) valuation. The Swiss economy is broadly stable, but any sudden change in economic growth, inflation, current account or the central bank’s currency reserves have the potential to trigger moves in CHF. Generally, high economic growth, low unemployment and high confidence are good for CHF. Conversely, if economic data points to weakening momentum, CHF is likely to depreciate.
As a small and open economy, Switzerland is heavily dependent on the health of the neighboring Eurozone economies. The broader European Union is Switzerland’s main economic partner and a key political ally, so macroeconomic and monetary policy stability in the Eurozone is essential for Switzerland and, thus, for the Swiss Franc (CHF). With such dependency, some models suggest that the correlation between the fortunes of the Euro (EUR) and the CHF is more than 90%, or close to perfect.
Silver prices (XAG/USD) rose on Tuesday, according to FXStreet data. Silver trades at $31.01 per troy ounce, up 0.79% from the $30.77 it cost on Monday.
Silver prices have increased by 30.31% since the beginning of the year.
| Unit measure | Silver Price Today in USD |
|---|---|
| Troy Ounce | 31.01 |
| 1 Gram | 1.00 |
The Gold/Silver ratio, which shows the number of ounces of Silver needed to equal the value of one ounce of Gold, stood at 76.17 on Tuesday, down from 76.68 on Monday.
Silver FAQs
Silver is a precious metal highly traded among investors. It has been historically used as a store of value and a medium of exchange. Although less popular than Gold, traders may turn to Silver to diversify their investment portfolio, for its intrinsic value or as a potential hedge during high-inflation periods. Investors can buy physical Silver, in coins or in bars, or trade it through vehicles such as Exchange Traded Funds, which track its price on international markets.
Silver prices can move due to a wide range of factors. Geopolitical instability or fears of a deep recession can make Silver price escalate due to its safe-haven status, although to a lesser extent than Gold's. As a yieldless asset, Silver tends to rise with lower interest rates. Its moves also depend on how the US Dollar (USD) behaves as the asset is priced in dollars (XAG/USD). A strong Dollar tends to keep the price of Silver at bay, whereas a weaker Dollar is likely to propel prices up. Other factors such as investment demand, mining supply – Silver is much more abundant than Gold – and recycling rates can also affect prices.
Silver is widely used in industry, particularly in sectors such as electronics or solar energy, as it has one of the highest electric conductivity of all metals – more than Copper and Gold. A surge in demand can increase prices, while a decline tends to lower them. Dynamics in the US, Chinese and Indian economies can also contribute to price swings: for the US and particularly China, their big industrial sectors use Silver in various processes; in India, consumers’ demand for the precious metal for jewellery also plays a key role in setting prices.
Silver prices tend to follow Gold's moves. When Gold prices rise, Silver typically follows suit, as their status as safe-haven assets is similar. The Gold/Silver ratio, which shows the number of ounces of Silver needed to equal the value of one ounce of Gold, may help to determine the relative valuation between both metals. Some investors may consider a high ratio as an indicator that Silver is undervalued, or Gold is overvalued. On the contrary, a low ratio might suggest that Gold is undervalued relative to Silver.
(An automation tool was used in creating this post.)
- Jerome Powell’s testimony in the US Congress will be a top-tier market-moving event this week.
- New clues on the Federal Reserve interest rate path are awaited.
- US Dollar, stock markets, and other asset classes could see big swings with the Fed Chair’s words.
Jerome Powell, Chairman of the US Federal Reserve (Fed), will deliver the Semi-Annual Monetary Policy Report and testify before the Senate Banking Committee on Tuesday. The hearing, entitled “The Semi-Annual Monetary Policy Report to the Congress,” will start at 14:00 GMT, and it will have the full attention of all financial market players.
Jerome Powell is expected to address the main takeaways of the Fed’s Semi-Annual Federal Reserve Monetary Policy Report, published last Friday. In that report, the Fed noted that they have seen modest further progress on inflation this year but added that they still need greater confidence before moving to rate cuts. "Labor supply and demand resembles period right before the pandemic, when the labor market was relatively tight but not overheated,” the publication read.
US representatives are expected to ask Powell about the interest rate path, inflation developments, and the economic growth outlook in a long Q&A session. However, they could focus on politics because of the upcoming November Presidential election, making it difficult for Powell to respond to questions.
The CME Group FedWatch Tool shows that markets price in only 25% probability that the Fed will leave the policy rate unchanged in September. The latest jobs report showed that US Nonfarm Payrolls (NFP) rose 206,000 in June. This reading came in above the market expectation of 190,000, but the US Bureau of Labor Statistics (BLS) announced that May’s NFP increase was revised down to 218,000 from 272,000. Additionally, the Unemployment Rate edged higher to 4.1% from 4%, while the annual wage inflation, as measured by the change in the Average Hourly Earnings, declined to 3.9% on a yearly basis from 4.1%.
In case Powell adopts an optimistic tone about the inflation outlook and acknowledges loosening conditions in the labor market, investors could remain optimistic about a September rate cut. The market positioning suggests that there is some room for further US Dollar (USD) weakness in this scenario. On the other hand, market participants could reassess the probability of a rate reduction in September and help the USD hold its ground if Powell downplays the gloomy labor market figures and remains cautious about the continuation of disinflation.
About Jerome Powell (via Federalreserve.gov)
"Jerome H. Powell first took office as Chair of the Board of Governors of the Federal Reserve System on February 5, 2018, for a four-year term. He was reappointed to the office and sworn in for a second four-year term on May 23, 2022. Mr. Powell also serves as Chairman of the Federal Open Market Committee, the System's principal monetary policymaking body. Mr. Powell has served as a member of the Board of Governors since taking office on May 25, 2012, to fill an unexpired term. He was reappointed to the Board and sworn in on June 16, 2014, for a term ending January 31, 2028."
Fed FAQs
Monetary policy in the US is shaped by the Federal Reserve (Fed). The Fed has two mandates: to achieve price stability and foster full employment. Its primary tool to achieve these goals is by adjusting interest rates. When prices are rising too quickly and inflation is above the Fed’s 2% target, it raises interest rates, increasing borrowing costs throughout the economy. This results in a stronger US Dollar (USD) as it makes the US a more attractive place for international investors to park their money. When inflation falls below 2% or the Unemployment Rate is too high, the Fed may lower interest rates to encourage borrowing, which weighs on the Greenback.
The Federal Reserve (Fed) holds eight policy meetings a year, where the Federal Open Market Committee (FOMC) assesses economic conditions and makes monetary policy decisions. The FOMC is attended by twelve Fed officials – the seven members of the Board of Governors, the president of the Federal Reserve Bank of New York, and four of the remaining eleven regional Reserve Bank presidents, who serve one-year terms on a rotating basis.
In extreme situations, the Federal Reserve may resort to a policy named Quantitative Easing (QE). QE is the process by which the Fed substantially increases the flow of credit in a stuck financial system. It is a non-standard policy measure used during crises or when inflation is extremely low. It was the Fed’s weapon of choice during the Great Financial Crisis in 2008. It involves the Fed printing more Dollars and using them to buy high grade bonds from financial institutions. QE usually weakens the US Dollar.
Quantitative tightening (QT) is the reverse process of QE, whereby the Federal Reserve stops buying bonds from financial institutions and does not reinvest the principal from the bonds it holds maturing, to purchase new bonds. It is usually positive for the value of the US Dollar.
- The Japanese Yen trades sideways, holding above 160.00 against the US Dollar.
- The BoJ is holding consultation rounds with bond market participants.
- The US Dollar Index hovers around 105.00, with French election euphoria fading fast.
The Japanese Yen (JPY) is afloat and moves sideways above 160.00 against the US Dollar (USD) on Tuesday. Traders are staying out of the Japanese Yen, as the Bank of Japan (BoJ) is holding a consultation round with several bond market participants. The BoJ is exploring ways to best reduce or end its bond-buying program to close off over a decade of a very loose monetary policy regime.
Meanwhile, the US Dollar Index (DXY) – which gauges the value of the US Dollar against a basket of six foreign currencies – took a minor hit on Monday, with markets applauding the outcome of the second round of French elections. With a gridlock verdict regarding government formation, the sigh of relief in markets is fading fast as eyes shift to Capitol Hill, where US Federal Reserve (Fed) Chairman Jerome Powell will testify about the semiannual Monetary Policy Report to the US Congress in Washington. Although nothing new is expected, a chance for any dovish openings or hints toward a September interest rate cut could move markets.
Daily digest market movers: BoJ consults bond traders
- A heat wave in Japan is squeezing the energy grid to its maximum capacity. In Tokyo, regulators are monitoring the situation, industry minister Ken Saito said in a regular briefing on Tuesday, according to Bloomberg.
- The Bank of Japan survey round with bond market participants reveals a wide range of options for bond-cutting, ranging from zero over 2-3 trillion yen to a maximum of 4 million yen in buybacks.
- Japanese equities have had a field day this Tuesday, soaring nearly 1% in both the Topix and the Nikkei. European equities are struggling, while US futures are in the green.
- The CME Fedwatch Tool is broadly backing a rate cut in September despite recent comments from Fed officials. The odds now stand at 73.6% for a 25-basis-point cut. A rate pause stands at a 22.9% chance, while a 50-basis-point rate cut has a slim 3.5% possibility.
- The Overnight indexed Swap curve for Japan shows a 60.1% chance of a rate hike on July 31 and a 35.2% chance for a hike on September 20.
- The US 10-year benchmark rate trades at the lower end of this week’s range near 4.29%.
- The benchmark 10-year Japan Treasury Note (JGB) trades around 1.09%, just a touch away from a fresh high for this week.
USD/JPY Technical Analysis: Holding for now
The Japanese Yen has not been able to use the momentum from late last week after a very soft retreat towards 160.00 against the US Dollar, just enough to push the Relative Strength Index (RSI) out of the overbought area. With the BoJ stepping up its consultations with bond market participants, pressure is building towards the end of July for a rate hike.
On the downside, the pivotal level near 160.32 is working as support and triggered a bounce on Monday. On the upside, 162.00 remains the level to beat before printing again a fresh multi-decade high. In case the bounce fails and starts to test the pivotal support at 160.32 again, a slide lower towards the 55-day Simple Moving Average (SMA) at 157.37 will be the first support to watch on the downside.
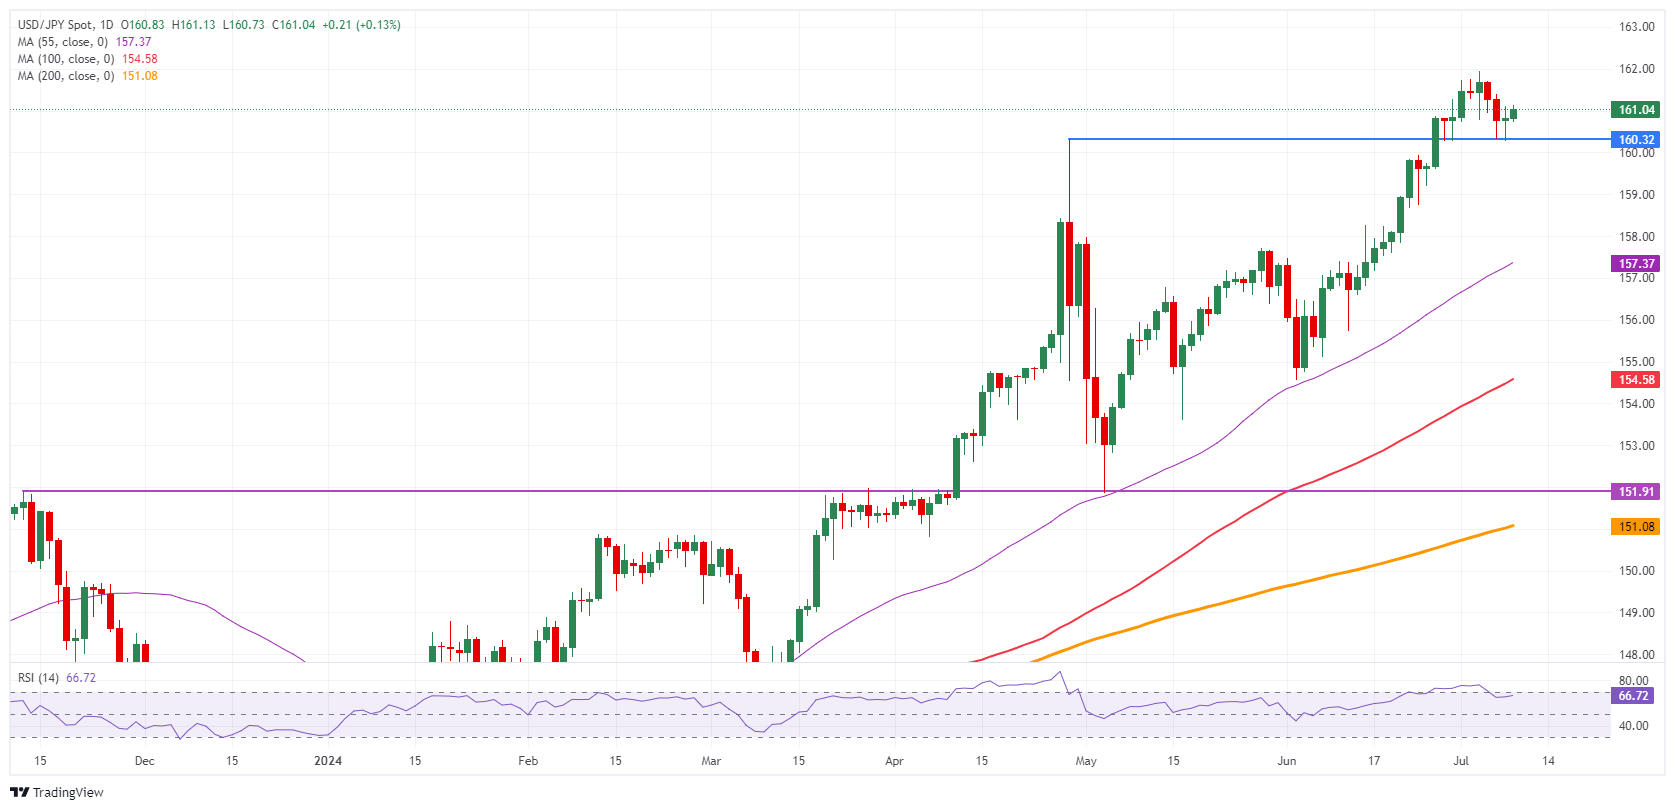
USD/JPY Daily Chart
Japanese Yen FAQs
The Japanese Yen (JPY) is one of the world’s most traded currencies. Its value is broadly determined by the performance of the Japanese economy, but more specifically by the Bank of Japan’s policy, the differential between Japanese and US bond yields, or risk sentiment among traders, among other factors.
One of the Bank of Japan’s mandates is currency control, so its moves are key for the Yen. The BoJ has directly intervened in currency markets sometimes, generally to lower the value of the Yen, although it refrains from doing it often due to political concerns of its main trading partners. The current BoJ ultra-loose monetary policy, based on massive stimulus to the economy, has caused the Yen to depreciate against its main currency peers. This process has exacerbated more recently due to an increasing policy divergence between the Bank of Japan and other main central banks, which have opted to increase interest rates sharply to fight decades-high levels of inflation.
The BoJ’s stance of sticking to ultra-loose monetary policy has led to a widening policy divergence with other central banks, particularly with the US Federal Reserve. This supports a widening of the differential between the 10-year US and Japanese bonds, which favors the US Dollar against the Japanese Yen.
The Japanese Yen is often seen as a safe-haven investment. This means that in times of market stress, investors are more likely to put their money in the Japanese currency due to its supposed reliability and stability. Turbulent times are likely to strengthen the Yen’s value against other currencies seen as more risky to invest in.
The US employment report was again mixed. Continued rise in unemployment rate, benign wage growth and decline in ISM services/factory orders lifted Federal Reserve (Fed) rate cut expectations, UOB Group Senior Economist Alvin Liew notes.
The data lift Fed rate cut expectations
“The US employment report was again mixed, as job creation came in at 206,000 (Bloomberg est 190,000), while wage growth cooled exactly as forecast at 0.3% m/m, 3.9% y/y in Jun (May: 0.4% m/m, 4.1% y/y).”
“Job creation was less broad-based in Jun as bulk of new jobs were concentrated in sectors of health care, government and construction while jobs gains in leisure & hospitality eased. Manufacturing and professional services lost jobs.”
“Continued rise in unemployment rate, benign wage growth and decline in ISM services/factory orders together with the moderating trend and the narrowing base of job creation, lifted Fed rate cut expectations. We keep to our forecast of two 25 bps cuts in Sep and Dec as data still points to possibility of easing in 2H 2024.”
European Central Bank (ECB) executive board member Fabio Panetta said on Tuesday that the ECB “can gradually reduce rates in line with the disinflation process.”
Additional quotes
Should be ready to respond quickly to any shocks in one direction or the other.
Previous rate hikes will continue to dampen demand, output and inflation for months to come.
Wage growth can also be expected to ease.
Market reaction
EUR/USD was last seen trading at 1.0821, flat on the day, ahead of Fed Chairman Jerome Powell’s testimony.
Euro PRICE Today
The table below shows the percentage change of Euro (EUR) against listed major currencies today. Euro was the strongest against the New Zealand Dollar.
| USD | EUR | GBP | JPY | CAD | AUD | NZD | CHF | |
|---|---|---|---|---|---|---|---|---|
| USD | 0.02% | 0.03% | 0.13% | 0.04% | -0.04% | 0.14% | 0.11% | |
| EUR | -0.02% | -0.02% | 0.10% | 0.00% | -0.06% | 0.12% | 0.09% | |
| GBP | -0.03% | 0.02% | 0.12% | 0.02% | -0.03% | 0.13% | 0.10% | |
| JPY | -0.13% | -0.10% | -0.12% | -0.10% | -0.18% | -0.00% | -0.03% | |
| CAD | -0.04% | -0.01% | -0.02% | 0.10% | -0.09% | 0.12% | 0.06% | |
| AUD | 0.04% | 0.06% | 0.03% | 0.18% | 0.09% | 0.17% | 0.12% | |
| NZD | -0.14% | -0.12% | -0.13% | 0.00% | -0.12% | -0.17% | -0.03% | |
| CHF | -0.11% | -0.09% | -0.10% | 0.03% | -0.06% | -0.12% | 0.03% |
The heat map shows percentage changes of major currencies against each other. The base currency is picked from the left column, while the quote currency is picked from the top row. For example, if you pick the Euro from the left column and move along the horizontal line to the US Dollar, the percentage change displayed in the box will represent EUR (base)/USD (quote).
The US Dollar (USD) is expected to trade in a range, probably between 7.2820 and 7.2950, UOB Group analysts Quek Ser Leang and Lee Sue Ann note.
USD is set to break above 7.2950
24-HOUR VIEW: “We expected USD to trade in a 7.2800/7.2970 range yesterday. However, USD traded in a narrower range than expected (7.2848/7.2919). USD closed largely unchanged at 7.2872 (-0.01%). The quiet price action provides no fresh clues, and we continue to expect USD to trade in a range, probably between 7.2820 and 7.2950.”
1-3 WEEKS VIEW: “Last Thursday (04 Jul, spot at 7.3000), we highlighted that the recent buildup of upward momentum had largely dissipated. We were of the view that the current price movements are likely part of a consolidation, and we expected USD to trade between 7.2700 and 7.3100 or the time being. There is no change in our view.”
The US Dollar (USD) is likely to trade in a sideways range between 160.30 and 161.30, because USD strength from the middle of last month has come to an end, UOB Group analysts Quek Ser Leang and Lee Sue Ann note.
USD is set to break above 161.30
24-HOUR VIEW: “After USD fell to a low of 160.33 and rebounded last Friday, we indicated yesterday that ‘provided that USD remains below 161.15, USD could drop further to 160.20 before stabilisation can be expected.’ USD subsequently dropped to 160.25, rebounded to 161.11, and then closed largely unchanged (160.81, +0.06%). Downward pressure is easing, and instead of dropping further, USD is likely to trade in a sideways range between 160.30 and 161.30 today.”
1-3 WEEKS VIEW: “Our update from yesterday (08 Jul, spot at 160.65) still stands. As highlighted, the USD strength from the middle of last month has come to an end. The current price movements are likely part of a range trading phase. For the time being, USD is likely to trade between 159.40 and 161.80.”
The New Zealand Dollar (NZD) is expected to consolidate in a range of 0.6115/0.6145. Risk for further NZD strength; the levels to watch are 0.6180 and 0.6200, UOB Group analysts Quek Ser Leang and Lee Sue Ann note.
Levels to watch are 0.6180 and 0.6200
24-HOUR VIEW: “Last Friday, NZD rose to a high of 0.6149. Yesterday, we indicated that “there is room for NZD to rise, even though the next resistance level at 0.6180 is likely out of reach for now.” NZD then popped briefly to 0.6171, pulling back to close at 0.6127 (-0.31%). NZD appears to have moved into a consolidation phase. Today, we expect NZD to trade between 0.6115 and 0.6145.”
1-3 WEEKS VIEW: “Last Thursday (04 Jul, spot at 0.6105), we held the view that the recovery in NZD has potential to extend to 0.6150. After NZD rose, we highlighted yesterday (08 Jul, spot at 0.6145) that “the risk is for further NZD strength, and the levels to watch are 0.6180 and 0.6200.” There is no change in our view. On the downside, should NZD break below 0.6100 (no change in ‘strong support’ level from yesterday), it would mean that it is not strengthening further.”
- Silver price gains ground as weaker employment data raise the odds of the Fed reducing rates in September.
- The CME's FedWatch Tool indicates that the odds of a Fed rate cut in September have increased to 76.2%, up from 65.5% a week earlier.
- The safe-haven Silver could face challenges due to anticipated progress in ceasefire negotiations in the Gaza war.
Silver price (XAG/USD) recovers its recent losses, trading around $31.00 per troy ounce during the European session on Tuesday. Traders await Federal Reserve Chairman Jerome Powell’s testimony on "The Semi-annual Monetary Policy Report" to the US Congress on Tuesday. Powell could provide a broad overview of the economy and monetary policy, with his prepared remarks being published ahead of his appearance on Capitol Hill.
On Friday, weaker employment data from the United States (US) sparked speculation that the Federal Reserve (Fed) might consider reducing interest rates in September. This continues providing support for non-yielding assets like Silver.
The CME's FedWatch Tool indicates that rate markets price in a 76.2% probability of a rate cut in September, up from 65.5% just a week earlier.
Furthermore, inflation figures from the United States are set to be released on Thursday. The US Core CPI is expected to maintain its year-over-year rate at 3.4% in June, with the monthly Core CPI likely remaining steady at 0.2%.
The safe-haven Silver could face challenges as market participants await progress in ceasefire negotiations in the Middle East. A potential ceasefire agreement in Gaza could alleviate risk sentiment and support the riskier assets.
However, according to the White House, significant differences remain between the parties involved, with Hamas expressing concerns over new Israeli actions in Gaza that could jeopardize the potential for an agreement.
Silver FAQs
Silver is a precious metal highly traded among investors. It has been historically used as a store of value and a medium of exchange. Although less popular than Gold, traders may turn to Silver to diversify their investment portfolio, for its intrinsic value or as a potential hedge during high-inflation periods. Investors can buy physical Silver, in coins or in bars, or trade it through vehicles such as Exchange Traded Funds, which track its price on international markets.
Silver prices can move due to a wide range of factors. Geopolitical instability or fears of a deep recession can make Silver price escalate due to its safe-haven status, although to a lesser extent than Gold's. As a yieldless asset, Silver tends to rise with lower interest rates. Its moves also depend on how the US Dollar (USD) behaves as the asset is priced in dollars (XAG/USD). A strong Dollar tends to keep the price of Silver at bay, whereas a weaker Dollar is likely to propel prices up. Other factors such as investment demand, mining supply – Silver is much more abundant than Gold – and recycling rates can also affect prices.
Silver is widely used in industry, particularly in sectors such as electronics or solar energy, as it has one of the highest electric conductivity of all metals – more than Copper and Gold. A surge in demand can increase prices, while a decline tends to lower them. Dynamics in the US, Chinese and Indian economies can also contribute to price swings: for the US and particularly China, their big industrial sectors use Silver in various processes; in India, consumers’ demand for the precious metal for jewellery also plays a key role in setting prices.
Silver prices tend to follow Gold's moves. When Gold prices rise, Silver typically follows suit, as their status as safe-haven assets is similar. The Gold/Silver ratio, which shows the number of ounces of Silver needed to equal the value of one ounce of Gold, may help to determine the relative valuation between both metals. Some investors may consider a high ratio as an indicator that Silver is undervalued, or Gold is overvalued. On the contrary, a low ratio might suggest that Gold is undervalued relative to Silver.
The Australian Dollar (AUD) is expected to trade in a range between 0.6720 and 0.6755. Increasing upward momentum suggests AUD is likely to continue to rise to 0.6800, UOB Group analysts Quek Ser Leang and Lee Sue Ann note.
AUD is likely to continue to rise to 0.6800
24-HOUR VIEW: “Yesterday, we indicated that ‘while there is room for AUD to rise above 0.6755 today, overbought conditions suggest it might not be able to maintain a foothold above this level.’ We added, ‘the resistance level at 0.6770 is also unlikely to come under threat.’ Our view turned out to be correct, as AUD rose to 0.6762 and then pulled back to close at 0.6737 (-0.16%). AUD appears to have entered a range trading phase. We expect AUD to trade between 0.6720 and 0.6755 today.”
1-3 WEEKS VIEW: “We continue to hold the same as yesterday (08 Jul, spot at 0.6745). As highlighted, increasing upward momentum suggests AUD is likely to continue to rise to 0.6800. Overall, only a breach of 0.6690 (no change in ‘strong support’ level from yesterday) would indicate that the AUD strength that started early last week has come to an end.”
The Pound Sterling (GBP) is likely to trade in a sideways range of 1.2780/1.2840. Risk for GBP remains on the upside, the level to watch is 1.2860, UOB Group analysts Quek Ser Leang and Lee Sue Ann note.
The level to watch is 1.2860
24-HOUR VIEW: “Last Friday, GBP rose sharply to 1.2817. Yesterday (Monday), we indicated that ‘while the rapid rise is approaching overbought levels, further GBP strength is not ruled out.’ We also indicated that ‘the significant resistance at 1.2860 is highly unlikely to come under threat, and that there is another resistance level at 1.2840.’ GBP subsequently rose to a high of 1.2846 before pulling back to close largely unchanged (1.2807, -0.05%). Conditions remain overbought; this, combined with signs of slowing momentum suggests GBP is unlikely to strengthen further. Today, GBP is more likely to trade sideways, probably in a range of 1.2780/1.2840.”
1-3 WEEKS VIEW: “Our update from yesterday (08 Jul, spot at 1.2805) is still valid. As indicated, the risk for GBP remains on the upside, and the level to watch is 1.2860. On the downside if GBP breaks below 1.2750 (‘strong support’ level was at 1.2840 yesterday), it would mean that the upside risk from last Thursday has faded.”
The Euro (EUR) is expected to trade in a 1.0795/1.0845 range. Risk of EUR breaking above 1.0850 has increased, albeit moderately, UOB Group analysts note.
EUR is set to break above 1.0850
24-HOUR VIEW: “After EUR edged higher last Friday, we noted yesterday that ‘upward momentum has not increased much further.’ We indicated that “instead of pulling back, EUR is more likely to trade in a range between 1.0800 and1.0845.” Our view was not wrong, as EUR traded between 1.0800 and 1.0845, closing at 1.0822 (-0.13%). Momentum indicators are turning flat, and we continue to expect EUR to trade in a range today, expected to be between 1.0795 and 1.0845.”
1-3 WEEKS VIEW: “Last Thursday (04 Jul, spot at 1.0785), we indicated that ‘while the increase in momentum suggests further EUR strength, it is too early to determine if it can reach the major resistance at 1.0850.’ After EUR rose, we indicated yesterday (08 Jul, spot at 1.0825) that ‘the risk of EUR breaking above 1.0850 has increased, albeit moderately.’ We continue to hold the same view. Overall, only a breach of 1.0770 (no change in ‘strong support’ level from yesterday) would indicate that the current upward pressure has faded. Looking ahead, the next level to watch above 1.0850 is 1.0915.”
Here is what you need to know on Tuesday, July 9:
The US Dollar stays resilient against its major rivals early Tuesday, with the US Dollar Index moving sideways near 105.00 after posting small gains on Monday. The US economic calendar will feature NFIB Business Optimism Index for June and RealClearMarkets/TIPP Economic Optimism for July. More importantly, Federal Reserve Chairman Jerome Powell will present the Semi-Anual Monetary Policy Report and testify before the Senate Banking Committee.
US Dollar PRICE Last 7 days
The table below shows the percentage change of US Dollar (USD) against listed major currencies last 7 days. US Dollar was the weakest against the Australian Dollar.
| USD | EUR | GBP | JPY | CAD | AUD | NZD | CHF | |
|---|---|---|---|---|---|---|---|---|
| USD | -0.73% | -1.18% | -0.37% | -0.71% | -1.25% | -0.75% | -0.46% | |
| EUR | 0.73% | -0.45% | 0.40% | 0.02% | -0.51% | -0.04% | 0.26% | |
| GBP | 1.18% | 0.45% | 0.87% | 0.49% | -0.08% | 0.43% | 0.70% | |
| JPY | 0.37% | -0.40% | -0.87% | -0.36% | -0.88% | -0.43% | -0.14% | |
| CAD | 0.71% | -0.02% | -0.49% | 0.36% | -0.54% | -0.04% | 0.23% | |
| AUD | 1.25% | 0.51% | 0.08% | 0.88% | 0.54% | 0.49% | 0.76% | |
| NZD | 0.75% | 0.04% | -0.43% | 0.43% | 0.04% | -0.49% | 0.27% | |
| CHF | 0.46% | -0.26% | -0.70% | 0.14% | -0.23% | -0.76% | -0.27% |
The heat map shows percentage changes of major currencies against each other. The base currency is picked from the left column, while the quote currency is picked from the top row. For example, if you pick the US Dollar from the left column and move along the horizontal line to the Japanese Yen, the percentage change displayed in the box will represent USD (base)/JPY (quote).
After opening the week with a bearish gap, EUR/USD staged a rebound and closed marginally higher on Monday. The pair stays relatively quiet in the European morning on Tuesday and fluctuates in a tight range above 1.0800.
GBP/USD touched its highest level since June 12 at 1.2860 on Monday but lost its bullish momentum to end the day virtually unchanged. Early Tuesday, the pair holds steady at around 1.2800.
Following the previous week's rally, NZD/USD lost its traction and registered modest losses on Monday. The Reserve Bank of New Zealand (RBNZ) will announce monetary policy decisions in the Asian session on Wednesday. Markets widely expect the RBNZ to leave the policy rate unchanged at 5.5%. Ahead of this key event, NZD/USD stays in a consolidation phase above 0.6100.
Gold came under heavy bearish pressure and lost over 1% on Monday, erasing all of Friday's gains in the process. Reports of China's central bank pausing Gold purchases for the second straight month in June and growing optimism about a ceasefire-hostage deal between Israel and Hamas caused XAU/USD to stretch lower. Early Tuesday, the pair consolidates its losses near $2,360.
USD/JPY continues to move up and down in a narrow channel at around 161.00 after ending the first trading day of the week virtually unchanged. Following the conclusion of the first day of meeting with market participants, the Bank of Japan (BoJ) said that it “received various views from participants in the survey including idea to reduce monthly buying to around ¥2-3 trillion, or to keep buying around V4 trillion.”
Fed FAQs
Monetary policy in the US is shaped by the Federal Reserve (Fed). The Fed has two mandates: to achieve price stability and foster full employment. Its primary tool to achieve these goals is by adjusting interest rates. When prices are rising too quickly and inflation is above the Fed’s 2% target, it raises interest rates, increasing borrowing costs throughout the economy. This results in a stronger US Dollar (USD) as it makes the US a more attractive place for international investors to park their money. When inflation falls below 2% or the Unemployment Rate is too high, the Fed may lower interest rates to encourage borrowing, which weighs on the Greenback.
The Federal Reserve (Fed) holds eight policy meetings a year, where the Federal Open Market Committee (FOMC) assesses economic conditions and makes monetary policy decisions. The FOMC is attended by twelve Fed officials – the seven members of the Board of Governors, the president of the Federal Reserve Bank of New York, and four of the remaining eleven regional Reserve Bank presidents, who serve one-year terms on a rotating basis.
In extreme situations, the Federal Reserve may resort to a policy named Quantitative Easing (QE). QE is the process by which the Fed substantially increases the flow of credit in a stuck financial system. It is a non-standard policy measure used during crises or when inflation is extremely low. It was the Fed’s weapon of choice during the Great Financial Crisis in 2008. It involves the Fed printing more Dollars and using them to buy high grade bonds from financial institutions. QE usually weakens the US Dollar.
Quantitative tightening (QT) is the reverse process of QE, whereby the Federal Reserve stops buying bonds from financial institutions and does not reinvest the principal from the bonds it holds maturing, to purchase new bonds. It is usually positive for the value of the US Dollar.
Following the conclusion of the first day of meeting with market participants, the Bank of Japan (BoJ) said that it “received various views from participants in the survey including idea to reduce monthly buying to around ¥2-3 trillion, or to keep buying around V4 trillion.”
“Opinions from bond market participants on pace of tapering included idea to taper at set pace swiftly, or taper swiftly at set pace then taper moderately in several stages, or reduce buying gradually over two years,” the BoJ said.
Additional takeaways
Comparing with overseas central banks, a reduction of ¥2-3 trillion is desired.
Bond purchases should ultimately serve as a monetary adjustment tool, indicating a zero purchase amount is crucial.
A gradual reduction aiming for ¥1-2 trillion would be ideal.
Considering the principles of IRRBB, a reduction of ¥4 trillion should be appropriate keeping in mind the limited flexibility in domestic bond operations.
BoJ should aim for a reduction to about ¥5 trillion and if the situation with the bond market stabilises, then additional reductions should be considered.
The BoJ is holding in-person meetings with market participants over the next couple of days. Three meetings are scheduled with banks, securities firms and those buying bonds for financial institutions to discuss the reduction of its Japanese Government Bond (JGB) purchases, which will be announced at the next meeting on July 30 and 31.
Market reaction
Following these headlines from the BoJ, USD/JPY is holding steady at around 160.85, having failed to sustain above 161.00 earlier in the Asian session.
Bank of Japan FAQs
The Bank of Japan (BoJ) is the Japanese central bank, which sets monetary policy in the country. Its mandate is to issue banknotes and carry out currency and monetary control to ensure price stability, which means an inflation target of around 2%.
The Bank of Japan has embarked in an ultra-loose monetary policy since 2013 in order to stimulate the economy and fuel inflation amid a low-inflationary environment. The bank’s policy is based on Quantitative and Qualitative Easing (QQE), or printing notes to buy assets such as government or corporate bonds to provide liquidity. In 2016, the bank doubled down on its strategy and further loosened policy by first introducing negative interest rates and then directly controlling the yield of its 10-year government bonds.
The Bank’s massive stimulus has caused the Yen to depreciate against its main currency peers. This process has exacerbated more recently due to an increasing policy divergence between the Bank of Japan and other main central banks, which have opted to increase interest rates sharply to fight decades-high levels of inflation. The BoJ’s policy of holding down rates has led to a widening differential with other currencies, dragging down the value of the Yen.
A weaker Yen and the spike in global energy prices have led to an increase in Japanese inflation, which has exceeded the BoJ’s 2% target. Still, the Bank judges that the sustainable and stable achievement of the 2% target has not yet come in sight, so any sudden change in the current policy looks unlikely.
- NZD/USD depreciates as traders adopt caution ahead of RBNZ interest rate decision on Wednesday.
- NZIER shadow board members recommend that the RBNZ maintain the OCR at 5.50%.
- The decline in the Treasury yields puts pressure on the US Dollar.
NZD/USD continues to lose ground for the second consecutive day, trading around 0.6120 during the early European hours on Tuesday. This decline could be attributed to the traders’ caution ahead of the Reserve Bank of New Zealand's (RBNZ) interest rate decision on Wednesday.
The Reserve Bank of New Zealand is anticipated to maintain the Official Cash Rate (OCR) at 5.50% during its July meeting on Wednesday, despite indications of a slowing economy in New Zealand. Traders will likely monitor the Monetary Policy Statement for further insights.
The New Zealand Institute of Economic Research (NZIER) shadow board members recommend that the central bank keep the OCR unchanged at the upcoming Monetary Policy meeting. The current weaker growth, slack labor market, and ongoing easing of annual CPI inflation indicate that previous cash rate increases are successfully reducing inflationary pressures in the New Zealand economy.
On the USD’s front, Treasury yields face challenges due to growing speculation that the Federal Reserve (Fed) may cut interest rates in September, potentially capping the upside for the US Dollar. The CME's FedWatch Tool shows that rate markets price in a 76.2% probability of a rate cut in September, up from 65.5% just a week ago.
Federal Reserve Chairman Jerome Powell may deliver "The Semi-annual Monetary Policy Report" to the US Congress on Tuesday. Powell could provide a broad overview of the economy and monetary policy, with his prepared remarks being published ahead of his appearance on Capitol Hill.
Economic Indicator
RBNZ Interest Rate Decision
The Reserve Bank of New Zealand (RBNZ) announces its interest rate decision after its seven scheduled annual policy meetings. If the RBNZ is hawkish and sees inflationary pressures rising, it raises the Official Cash Rate (OCR) to bring inflation down. This is positive for the New Zealand Dollar (NZD) since higher interest rates attract more capital inflows. Likewise, if it reaches the view that inflation is too low it lowers the OCR, which tends to weaken NZD.
Read more.Next release: Wed Jul 10, 2024 02:00
Frequency: Irregular
Consensus: 5.5%
Previous: 5.5%
Source: Reserve Bank of New Zealand
The Reserve Bank of New Zealand (RBNZ) holds monetary policy meetings seven times a year, announcing their decision on interest rates and the economic assessments that influenced their decision. The central bank offers clues on the economic outlook and future policy path, which are of high relevance for the NZD valuation. Positive economic developments and upbeat outlook could lead the RBNZ to tighten the policy by hiking interest rates, which tends to be NZD bullish. The policy announcements are usually followed by Governor Adrian Orr’s press conference.
- USD/CAD trades on a weaker note near 1.3635 in Tuesday’s early European session.
- The pair maintains a negative stance below the 100-period EMA, with the bearish RSI momentum indicator.
- The initial contention level will emerge near 1.3600; the first upside barrier is seen at 1.3650.
The USD/CAD pair remains on the defensive around 1.3635 during the early European session on Tuesday. The Greenback weakens on the back of the potential September rate cut from the US Federal Reserve (Fed) after employment data last week indicated a cooling US labor market.
According to the 4-hour chart, USD/CAD keeps the bearish vibe unchanged below the key 100-period Exponential, Moving Average (EMA). Furthermore, the downward momentum is supported by the Relative Strength Index (RSI), which stands near in the bearish zone near 45.70. This indicates that the path of least resistance level is to the downside.
The potential support level for the pair will emerge near 1.3600, portraying the confluence of the lower limit of the Bollinger Band and the psychological level. A breach of this level will see a drop to 1.3556, a low of April 10. The additional upside filter to watch is 1.3515, a low of April 1.
On the other hand, the immediate resistance level is seen at 1.3650, the upper boundary of the Bollinger Band. A decisive break above this level will pave the way to 1.3672, the 100-period EMA. Any follow-through buying could see a rally to 1.3712, a high of June 27.
USD/CAD 4-hour chart
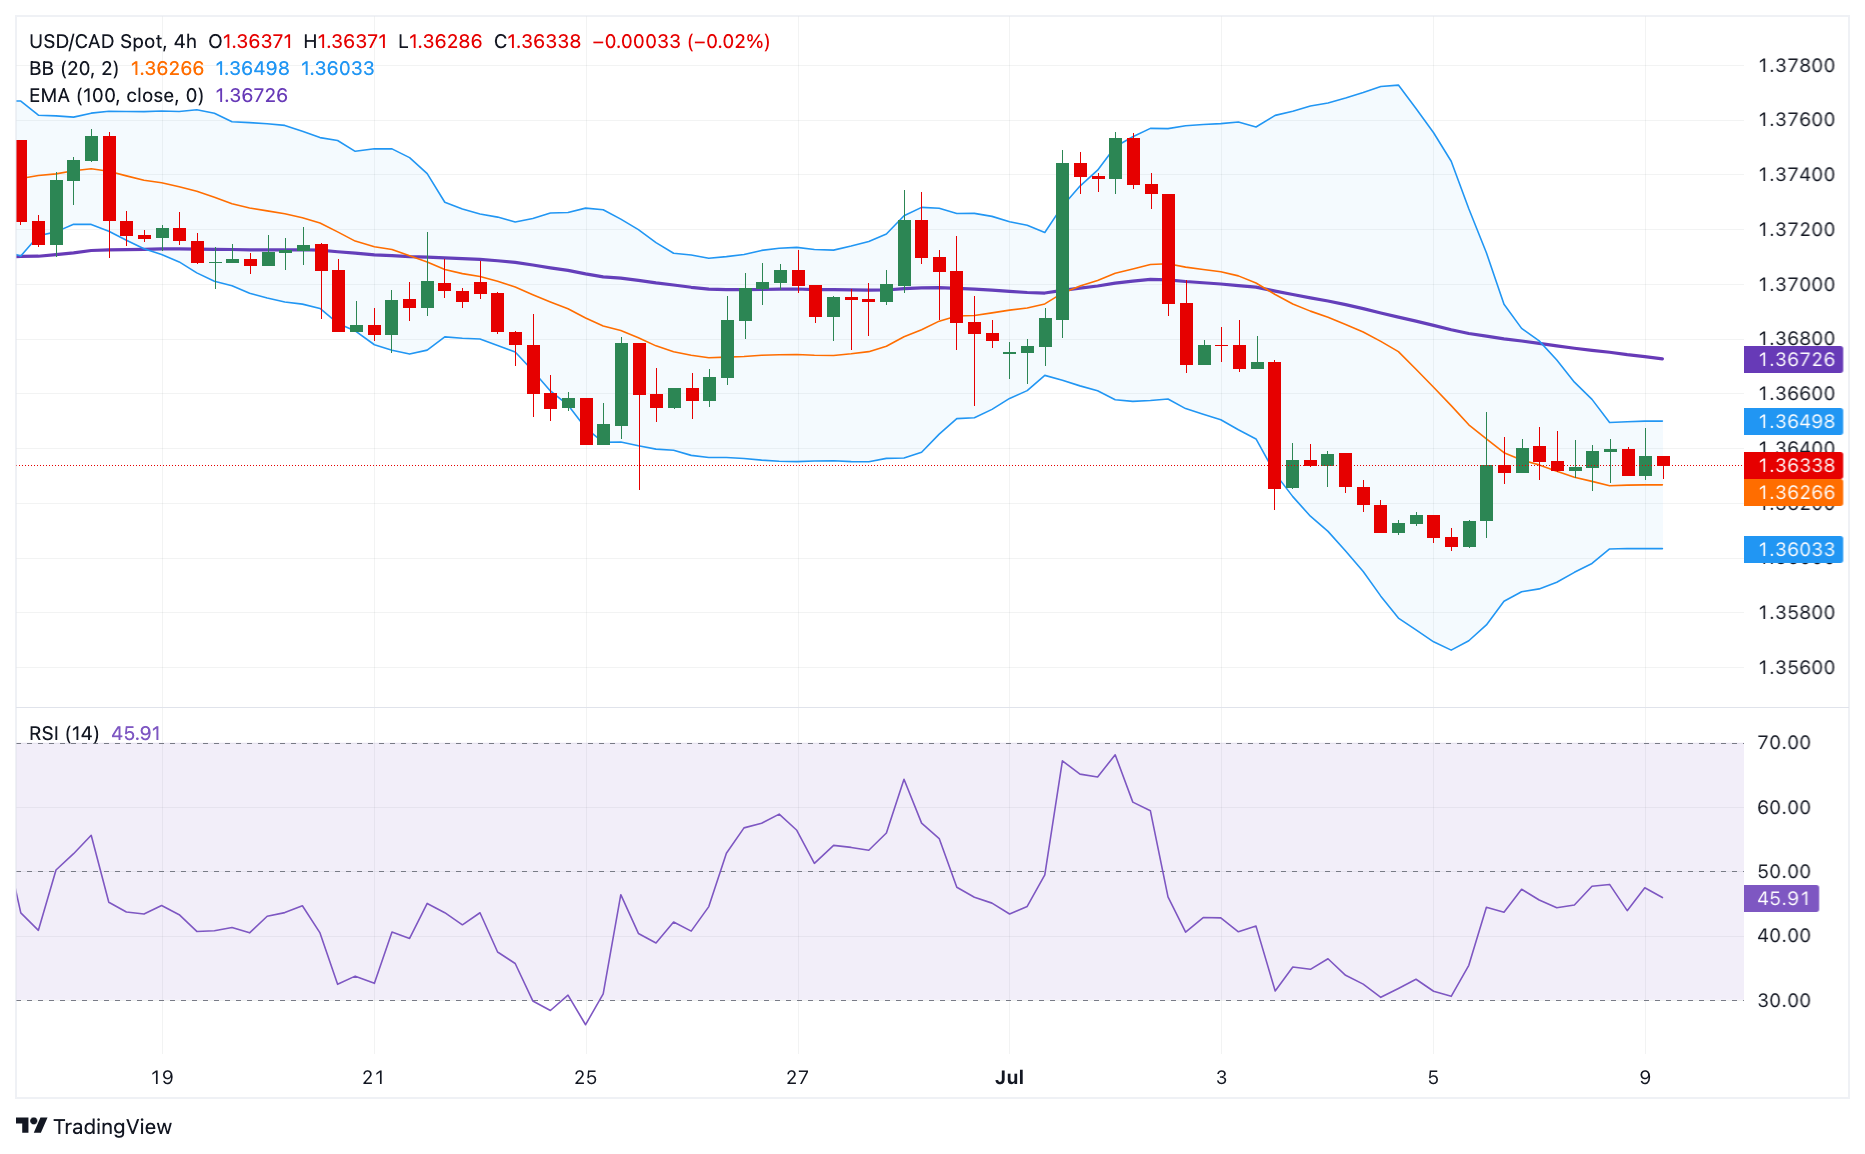
Canadian Dollar FAQs
The key factors driving the Canadian Dollar (CAD) are the level of interest rates set by the Bank of Canada (BoC), the price of Oil, Canada’s largest export, the health of its economy, inflation and the Trade Balance, which is the difference between the value of Canada’s exports versus its imports. Other factors include market sentiment – whether investors are taking on more risky assets (risk-on) or seeking safe-havens (risk-off) – with risk-on being CAD-positive. As its largest trading partner, the health of the US economy is also a key factor influencing the Canadian Dollar.
The Bank of Canada (BoC) has a significant influence on the Canadian Dollar by setting the level of interest rates that banks can lend to one another. This influences the level of interest rates for everyone. The main goal of the BoC is to maintain inflation at 1-3% by adjusting interest rates up or down. Relatively higher interest rates tend to be positive for the CAD. The Bank of Canada can also use quantitative easing and tightening to influence credit conditions, with the former CAD-negative and the latter CAD-positive.
The price of Oil is a key factor impacting the value of the Canadian Dollar. Petroleum is Canada’s biggest export, so Oil price tends to have an immediate impact on the CAD value. Generally, if Oil price rises CAD also goes up, as aggregate demand for the currency increases. The opposite is the case if the price of Oil falls. Higher Oil prices also tend to result in a greater likelihood of a positive Trade Balance, which is also supportive of the CAD.
While inflation had always traditionally been thought of as a negative factor for a currency since it lowers the value of money, the opposite has actually been the case in modern times with the relaxation of cross-border capital controls. Higher inflation tends to lead central banks to put up interest rates which attracts more capital inflows from global investors seeking a lucrative place to keep their money. This increases demand for the local currency, which in Canada’s case is the Canadian Dollar.
Macroeconomic data releases gauge the health of the economy and can have an impact on the Canadian Dollar. Indicators such as GDP, Manufacturing and Services PMIs, employment, and consumer sentiment surveys can all influence the direction of the CAD. A strong economy is good for the Canadian Dollar. Not only does it attract more foreign investment but it may encourage the Bank of Canada to put up interest rates, leading to a stronger currency. If economic data is weak, however, the CAD is likely to fall.
- EUR/GBP lacks the strength to extend its recovery above 0.8450 as France faces political uncertainty.
- ECB Knot supports for keeping interest rates steady in July but is open for the September meeting.
- The Pound Sterling remains firm as UK Keir Starmer’s victory brings political stability.
The EUR/GBP pair struggles to extend recovery above the immediate resistance of 0.8450 in Tuesday’s early European session. The upside in the cross appears to have been limited by French’s political uncertainty as the Left Wing, also known as New Popular Front, led by Jean-Luc Melenchon unexpectedly gained an upper hand with President Emmanuel Macron's centrist alliance and Marine Le Pen-led-Far Right National Rally as runner ups.
Market participants expect that the Central Alliance will join hands with the Left Wing to form a coalition government, which will pass through significant negotiations for distribution of new ministers. While fears of widening French debt crisis have eased as Far Right fails to make an absolute majority, which was expected to have favored expansionary fiscal measures.
On the monetary policy front, the debate about whether the European Central Bank (ECB) will deliver subsequent rate cuts is gaining traction. ECB officials are scheduled to meet on July 18. On Monday, ECB policymaker and Dutch central bank chief Klaas Knot said in an interview with Handelsblatt, I don't see a case for another rate cut in July." However, he said that he is comfortable with market expectations of more rate cuts this year and he is open for the September meeting.
In the United Kingdom region, uncertainty over the Bank of England (BoE) 's decision to begin reducing interest rates from the August meeting has deepened. On Monday, BoE policymaker Jonathan Haskel supported leaving interest rates unchanged for as long as price pressures remain firm in the labor market. The UK’s wage growth is significantly higher than what is required to bring service inflation down.
Meanwhile, the broader appeal of the Pound Sterling remains firm against the Euro. The absolute victory of Keir Starmer's Labour Party against Rishi Sunak's Conservative Party in UK parliamentary elections has brought political stability to the economy, which is favorable for the economy’s financial markets.
Economic Indicator
BoE's Haskel speech
Jonathan Haskel will serve a 3-year term as a Bank of England Monetary Policy Committee member from September 2018, replacing Ian McCafferty. Professor Haskel is currently a Professor of Economics at Imperial College Business School, where he will continue to teach part-time, and prior to that was Head of the Economics Department at Queen Mary, University of London. He is a Non-Executive Director of the UK Statistics Authority and has expertise in productivity growth, and particularly intangible assets.
Read more.Last release: Mon Jul 08, 2024 11:00
Frequency: Irregular
Actual: -
Consensus: -
Previous: -
Source: Bank of England
- The Pound Sterling holds gains against the US Dollar with a focus on Fed Powell’s testimony.
- BoE’s Haskel argued in favor of holding interest rates steady at their current levels.
- This week, investors will pay close attention to the US CPI and UK factory data.
The Pound Sterling (GBP) ranges above 1.2800 against the US Dollar (USD) in Tuesday’s early London session. The GBP/USD pair turns quiet as investors await the Federal Reserve (Fed) Chair Jerome Powell’s semi-annual Congressional testimony, which is scheduled at 14:00 GMT.
Fed Powell is expected to acknowledge some progress made on inflation and will remain data-dependent for rate cuts. Powell could continue to refrain from providing any timeframe for rate cuts and emphasize the need to keep interest rates higher until policymakers see inflation declining for months. However, he could also show some concerns over moderating United States (US) labor market strength
The overall appeal of the Cable is quite firm as market speculation for the Fed to begin reducing interest rates from the September meeting has deepened. According to the CME FedWatch tool, 30-day Federal Funds Futures pricing data shows that the probability of rate cuts in September has improved to 77% from 65.6% recorded a week ago. The expectations for early Fed rate cuts have been prompted by the US Nonfarm Payrolls (NFP) report for June, which indicated that the labor market has lost momentum.
This week, the major trigger for the US Dollar will be the US Consumer Price Index (CPI) data for June, which will be published on Thursday. The US CPI report is expected to show that the core inflation, which strips off volatile food and energy items, grew steadily by 0.2% and 3.4% on a monthly and annual basis, respectively. Signs of stalling progress or reverse in disinflation would dampen market expectations for Fed rate cuts in September, while soft figures will boost them.
Daily Digest Market Movers: Pound Sterling remains firm ahead of UK GDP data
- The Pound Sterling exhibits a quiet performance against its major peers as investors shift focus to the United Kingdom's (UK) monthly Gross Domestic Product (GDP) and the factory data for May, which will be published on Thursday.
- The UK economy is estimated to have expanded by 0.2% after remaining unchanged in April. Also, Manufacturing and Industrial Production are expected to have grown decently after contracting in April.
- On the monetary policy front, Bank of England (BoE) policymaker Jonathan Haskel advocated for holding interest rates at their current levels as price pressures in the job market remain firm. Haskel said, "I would rather hold rates until there is more certainty that underlying inflationary pressures have subsided sustainably," Reuters reported. Haskel remains concerned over high inflation in the labor market due to strong wage growth, which is roughly double what is required to tame price pressures.
- Jonathan Haskel is one of the policymakers who voted longest for tightening the monetary policy further. Contrary to Haskel’s viewpoint, traders expect that the BoE will start reducing interest rates from the August meeting.
- On the political front, the overall outlook of the Pound Sterling has remained firm as an outright majority by Keir Starmer-led Labour Party in UK parliamentary elections has brought political stability in the economy.
Technical Analysis: Pound Sterling aims for firm footing above 1.2800
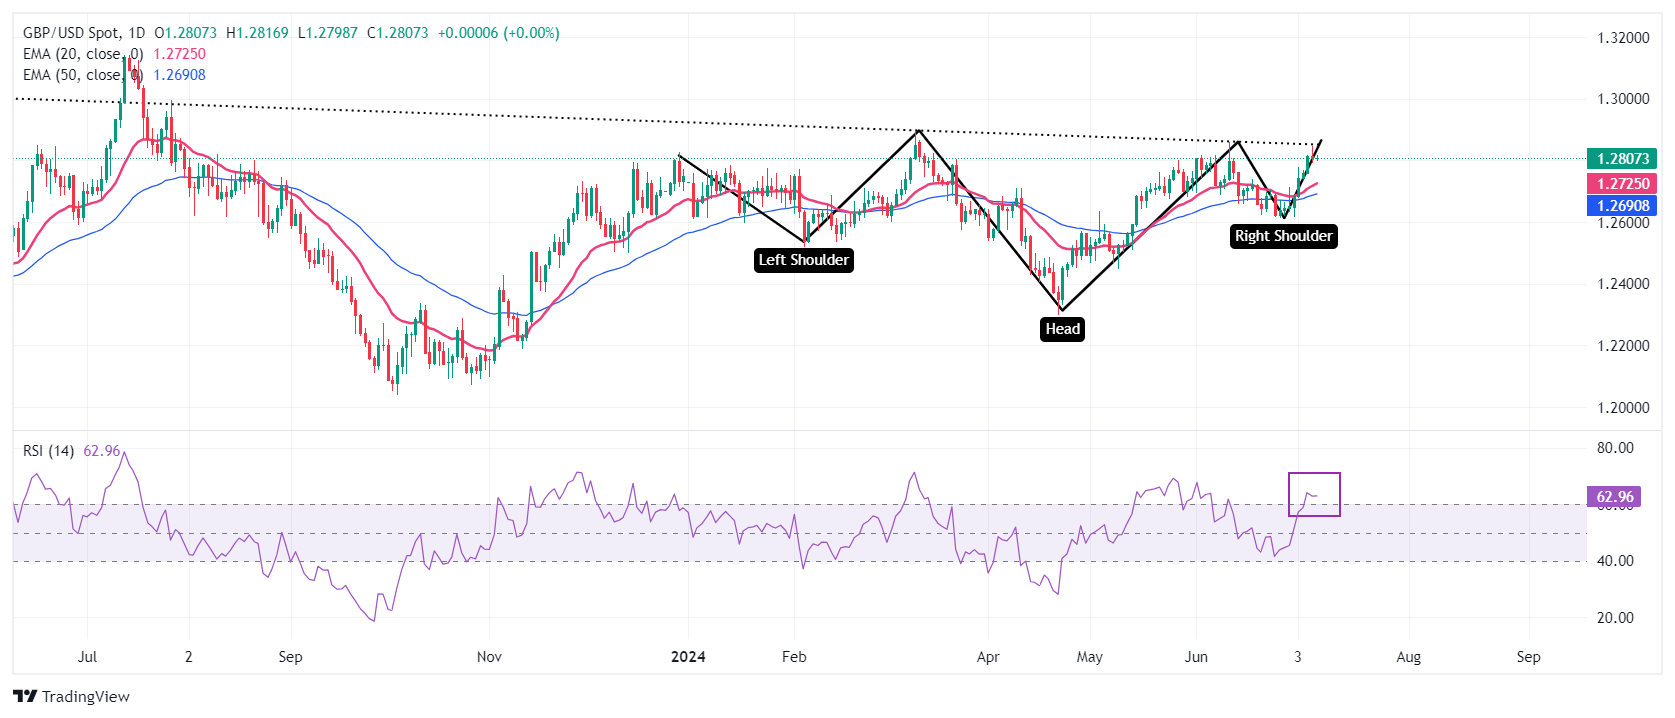
The Pound Sterling trades close to a three-week high above 1.2800 in Tuesday’s late Asian session. The GBP/USD pair forms an inverted Head and Shoulder (H&S) chart pattern on a daily timeframe. The neckline is plotted near 1.2850. A breakout of the H&S formation results in a bullish reversal.
Advancing 20- and 50-day Exponential Moving Averages (EMAs) near 1.2725 and 1.2690, respectively, suggest that the overall trend is bullish.
The 14-day Relative Strength Index (RSI) climbs into the bullish range of 60.00-80.00. A sustained move above the same will keep the momentum towards the upside.
Pound Sterling FAQs
The Pound Sterling (GBP) is the oldest currency in the world (886 AD) and the official currency of the United Kingdom. It is the fourth most traded unit for foreign exchange (FX) in the world, accounting for 12% of all transactions, averaging $630 billion a day, according to 2022 data. Its key trading pairs are GBP/USD, aka ‘Cable’, which accounts for 11% of FX, GBP/JPY, or the ‘Dragon’ as it is known by traders (3%), and EUR/GBP (2%). The Pound Sterling is issued by the Bank of England (BoE).
The single most important factor influencing the value of the Pound Sterling is monetary policy decided by the Bank of England. The BoE bases its decisions on whether it has achieved its primary goal of “price stability” – a steady inflation rate of around 2%. Its primary tool for achieving this is the adjustment of interest rates. When inflation is too high, the BoE will try to rein it in by raising interest rates, making it more expensive for people and businesses to access credit. This is generally positive for GBP, as higher interest rates make the UK a more attractive place for global investors to park their money. When inflation falls too low it is a sign economic growth is slowing. In this scenario, the BoE will consider lowering interest rates to cheapen credit so businesses will borrow more to invest in growth-generating projects.
Data releases gauge the health of the economy and can impact the value of the Pound Sterling. Indicators such as GDP, Manufacturing and Services PMIs, and employment can all influence the direction of the GBP. A strong economy is good for Sterling. Not only does it attract more foreign investment but it may encourage the BoE to put up interest rates, which will directly strengthen GBP. Otherwise, if economic data is weak, the Pound Sterling is likely to fall.
Another significant data release for the Pound Sterling is the Trade Balance. This indicator measures the difference between what a country earns from its exports and what it spends on imports over a given period. If a country produces highly sought-after exports, its currency will benefit purely from the extra demand created from foreign buyers seeking to purchase these goods. Therefore, a positive net Trade Balance strengthens a currency and vice versa for a negative balance.
Gold prices rose in India on Tuesday, according to data compiled by FXStreet.
The price for Gold stood at 6,349.63 Indian Rupees (INR) per gram, up compared with the INR 6,332.50 it cost on Monday.
The price for Gold increased to INR 74,058.93 per tola from INR 73,861.05 per tola a day earlier.
| Unit measure | Gold Price in INR |
|---|---|
| 1 Gram | 6,349.63 |
| 10 Grams | 63,494.66 |
| Tola | 74,058.93 |
| Troy Ounce | 197,495.60 |
FXStreet calculates Gold prices in India by adapting international prices (USD/INR) to the local currency and measurement units. Prices are updated daily based on the market rates taken at the time of publication. Prices are just for reference and local rates could diverge slightly.
Gold FAQs
Gold has played a key role in human’s history as it has been widely used as a store of value and medium of exchange. Currently, apart from its shine and usage for jewelry, the precious metal is widely seen as a safe-haven asset, meaning that it is considered a good investment during turbulent times. Gold is also widely seen as a hedge against inflation and against depreciating currencies as it doesn’t rely on any specific issuer or government.
Central banks are the biggest Gold holders. In their aim to support their currencies in turbulent times, central banks tend to diversify their reserves and buy Gold to improve the perceived strength of the economy and the currency. High Gold reserves can be a source of trust for a country’s solvency. Central banks added 1,136 tonnes of Gold worth around $70 billion to their reserves in 2022, according to data from the World Gold Council. This is the highest yearly purchase since records began. Central banks from emerging economies such as China, India and Turkey are quickly increasing their Gold reserves.
Gold has an inverse correlation with the US Dollar and US Treasuries, which are both major reserve and safe-haven assets. When the Dollar depreciates, Gold tends to rise, enabling investors and central banks to diversify their assets in turbulent times. Gold is also inversely correlated with risk assets. A rally in the stock market tends to weaken Gold price, while sell-offs in riskier markets tend to favor the precious metal.
The price can move due to a wide range of factors. Geopolitical instability or fears of a deep recession can quickly make Gold price escalate due to its safe-haven status. As a yield-less asset, Gold tends to rise with lower interest rates, while higher cost of money usually weighs down on the yellow metal. Still, most moves depend on how the US Dollar (USD) behaves as the asset is priced in dollars (XAU/USD). A strong Dollar tends to keep the price of Gold controlled, whereas a weaker Dollar is likely to push Gold prices up.
(An automation tool was used in creating this post.)
- USD/CHF trades on a stronger note near 0.8980 in Tuesday’s early European session.
- The US Dollar edges lower due to a potential September rate cut from the Fed.
- Political uncertainties both within Europe and globally, might support the CHF.
The USD/CHF pair trades in positive territory for the second consecutive day around 0.8980 on Tuesday during the early European session. Meanwhile, the USD Index (DXY) consolidates near the 105.00 level ahead of Federal Reserve (Fed) Chair Jerome Powell's semi-annual monetary policy testimony on Tuesday.
The rising expectation that the US Fed will start cutting the interest rate earlier than previously expected has dragged the Greenback lower. Fed Powell’s testimony might offer some hints about whether the possibility of a September rate cut has improved with the latest data. If Powell delivers hawkish comments, this might provide some support for the US Dollar (USD). Financial markets are now pricing in a nearly 76% chance of a Fed rate cut in September, up from 71% last Friday, according to the CME FedWatch tool.
Market players will shift their attention to the US Consumer Price Index, which is due on Thursday. The US CPI is estimated to show an increase of 3.1% YoY in June, compared to a 3.3% rise in May. Core inflation is projected to remain steady at 3.4% YoY in June.
On the Swiss front, political uncertainties in both within Europe and globally might boost a safe-haven currency like the Swiss Franc (CHF). However, the cooler inflationary pressures in Switzerland could prompt the Swiss National Bank (SNB) to continue cutting interest rates further. This, in turn, is likely to weigh on the CHF and create a tailwind for USD/CHF in the near term.
Swiss Franc FAQs
The Swiss Franc (CHF) is Switzerland’s official currency. It is among the top ten most traded currencies globally, reaching volumes that well exceed the size of the Swiss economy. Its value is determined by the broad market sentiment, the country’s economic health or action taken by the Swiss National Bank (SNB), among other factors. Between 2011 and 2015, the Swiss Franc was pegged to the Euro (EUR). The peg was abruptly removed, resulting in a more than 20% increase in the Franc’s value, causing a turmoil in markets. Even though the peg isn’t in force anymore, CHF fortunes tend to be highly correlated with the Euro ones due to the high dependency of the Swiss economy on the neighboring Eurozone.
The Swiss Franc (CHF) is considered a safe-haven asset, or a currency that investors tend to buy in times of market stress. This is due to the perceived status of Switzerland in the world: a stable economy, a strong export sector, big central bank reserves or a longstanding political stance towards neutrality in global conflicts make the country’s currency a good choice for investors fleeing from risks. Turbulent times are likely to strengthen CHF value against other currencies that are seen as more risky to invest in.
The Swiss National Bank (SNB) meets four times a year – once every quarter, less than other major central banks – to decide on monetary policy. The bank aims for an annual inflation rate of less than 2%. When inflation is above target or forecasted to be above target in the foreseeable future, the bank will attempt to tame price growth by raising its policy rate. Higher interest rates are generally positive for the Swiss Franc (CHF) as they lead to higher yields, making the country a more attractive place for investors. On the contrary, lower interest rates tend to weaken CHF.
Macroeconomic data releases in Switzerland are key to assessing the state of the economy and can impact the Swiss Franc’s (CHF) valuation. The Swiss economy is broadly stable, but any sudden change in economic growth, inflation, current account or the central bank’s currency reserves have the potential to trigger moves in CHF. Generally, high economic growth, low unemployment and high confidence are good for CHF. Conversely, if economic data points to weakening momentum, CHF is likely to depreciate.
As a small and open economy, Switzerland is heavily dependent on the health of the neighboring Eurozone economies. The broader European Union is Switzerland’s main economic partner and a key political ally, so macroeconomic and monetary policy stability in the Eurozone is essential for Switzerland and, thus, for the Swiss Franc (CHF). With such dependency, some models suggest that the correlation between the fortunes of the Euro (EUR) and the CHF is more than 90%, or close to perfect.
- EUR/USD continues to rise despite the initial surprise from France's election results.
- A leftist alliance unexpectedly took the lead and kept Marine Le Pen's far-right party out of the leadership race.
- Fed Chair Powell will deliver “The Semi-annual Monetary Policy Report" to the US Congress on Tuesday.
EUR/USD continues its winning streak for the sixth day, trading around 1.0830 during the Asian session on Tuesday. The Euro continues to advance as investors digest the initial shock of France's election results. A surprise leftist alliance has taken the lead, preventing Marine Le Pen's far-right party from dominating the leadership race following a significant upset in previous European Parliamentary elections.
OCBC FX analysts Frances Cheung and Christopher Wong observed that the Euro began the week with a slight decline following unexpected results in the second round of elections. They noted, "A leftist-dominated government was the least anticipated and raised concerns due to potential increases in public spending, which could further strain public finances."
Full article: Hung parliament but with surprise twist – OCBC
The EUR/USD pair gains ground as the US Dollar (USD) struggles due to soft US employment data, leading traders to speculate that the Federal Reserve (Fed) might reduce interest rates in September. The CME's FedWatch Tool indicates that rate markets price in a 76.2% probability of a rate cut in September, up from 65.5% just a week earlier.
Federal Reserve Chairman Jerome Powell may deliver "The Semi-annual Monetary Policy Report" to the US Congress on Tuesday. Powell could provide a broad overview of the economy and monetary policy, with his prepared remarks being published ahead of his appearance on Capitol Hill.
On the data front, inflation figures from Germany and the United States (US) are scheduled for publication on Thursday. German Harmonized Index of Consumer Prices (HICP) inflation is anticipated to remain unchanged at 2.5% year-over-year in June. Meanwhile, the US Core CPI is expected to maintain its YoY rate at 3.4%.
Euro FAQs
The Euro is the currency for the 20 European Union countries that belong to the Eurozone. It is the second most heavily traded currency in the world behind the US Dollar. In 2022, it accounted for 31% of all foreign exchange transactions, with an average daily turnover of over $2.2 trillion a day. EUR/USD is the most heavily traded currency pair in the world, accounting for an estimated 30% off all transactions, followed by EUR/JPY (4%), EUR/GBP (3%) and EUR/AUD (2%).
The European Central Bank (ECB) in Frankfurt, Germany, is the reserve bank for the Eurozone. The ECB sets interest rates and manages monetary policy. The ECB’s primary mandate is to maintain price stability, which means either controlling inflation or stimulating growth. Its primary tool is the raising or lowering of interest rates. Relatively high interest rates – or the expectation of higher rates – will usually benefit the Euro and vice versa. The ECB Governing Council makes monetary policy decisions at meetings held eight times a year. Decisions are made by heads of the Eurozone national banks and six permanent members, including the President of the ECB, Christine Lagarde.
Eurozone inflation data, measured by the Harmonized Index of Consumer Prices (HICP), is an important econometric for the Euro. If inflation rises more than expected, especially if above the ECB’s 2% target, it obliges the ECB to raise interest rates to bring it back under control. Relatively high interest rates compared to its counterparts will usually benefit the Euro, as it makes the region more attractive as a place for global investors to park their money.
Data releases gauge the health of the economy and can impact on the Euro. Indicators such as GDP, Manufacturing and Services PMIs, employment, and consumer sentiment surveys can all influence the direction of the single currency. A strong economy is good for the Euro. Not only does it attract more foreign investment but it may encourage the ECB to put up interest rates, which will directly strengthen the Euro. Otherwise, if economic data is weak, the Euro is likely to fall. Economic data for the four largest economies in the euro area (Germany, France, Italy and Spain) are especially significant, as they account for 75% of the Eurozone’s economy.
Another significant data release for the Euro is the Trade Balance. This indicator measures the difference between what a country earns from its exports and what it spends on imports over a given period. If a country produces highly sought after exports then its currency will gain in value purely from the extra demand created from foreign buyers seeking to purchase these goods. Therefore, a positive net Trade Balance strengthens a currency and vice versa for a negative balance.
FX option expiries for July 9 NY cut at 10:00 Eastern Time, via DTCC, can be found below
- EUR/USD: EUR amounts
- 1.0650 937m
- 1.0675 1.1b
- 1.0700 1.1b
- 1.0750 992m
- 1.0800 1.6b
- 1.0850 811m
- 1.0875 1.1b
- 1.0905 967m
- USD/JPY: USD amounts
- 158.85 1.3b
- 160.00 1.9b
- 160.65 896m
- USD/CHF: USD amounts
- 0.9000 550m
- AUD/USD: AUD amounts
- 0.6645 661m
- USD/CAD: USD amounts
- 1.3590 1.4b
- 1.3600 725m
- 1.3750 493m
- NZD/USD: NZD amounts
- 0.6300 448m
- The WTI price struggled as Hurricane Beryl caused less damage than anticipated.
- Saudi Oil exports to China are anticipated to recover in August, potentially reaching a minimum of 44 million barrels.
- Oil prices face challenges as a potential ceasefire agreement in Gaza could alleviate the supply threat.
West Texas Intermediate (WTI) Oil price extends its losses for the third session, trading around $81.50 per barrel during the Asian hours on Tuesday. Crude Oil prices faced pressure after Hurricane Beryl, which struck a key US Oil-producing hub in Texas, caused less damage than anticipated by markets. Despite slowdowns in refining activity and evacuations at production sites, major refineries along the US Gulf Coast reported minimal impact from the hurricane.
This decline would be partly influenced by recent developments involving Saudi Arabia. According to Reuters, Saudi crude Oil exports to China are expected to rebound in August, with shipments reaching at least 44 million barrels, which will bolster demand.
Exports to China from Saudi Arabia are set to increase in August for the first time in four months, rising from approximately 36.00 million barrels in July. This rebound is expected to assist the largest Oil exporter in reclaiming its share in the largest import market. Saudi exports to China had plummeted to 1.12 million barrels per day (bpd) in June, the lowest since March 2020, as Reuters reported data from analytics firm Kpler.
Looking ahead, crude Oil prices might encounter further challenges as market participants await progress in ceasefire negotiations in the Middle East. A potential ceasefire agreement in Gaza could alleviate concerns about global crude supply disruptions. However, according to the White House, significant differences remain between the parties involved, with Hamas expressing concerns over new Israeli actions in Gaza that could jeopardize the potential for an agreement.
WTI Oil FAQs
WTI Oil is a type of Crude Oil sold on international markets. The WTI stands for West Texas Intermediate, one of three major types including Brent and Dubai Crude. WTI is also referred to as “light” and “sweet” because of its relatively low gravity and sulfur content respectively. It is considered a high quality Oil that is easily refined. It is sourced in the United States and distributed via the Cushing hub, which is considered “The Pipeline Crossroads of the World”. It is a benchmark for the Oil market and WTI price is frequently quoted in the media.
Like all assets, supply and demand are the key drivers of WTI Oil price. As such, global growth can be a driver of increased demand and vice versa for weak global growth. Political instability, wars, and sanctions can disrupt supply and impact prices. The decisions of OPEC, a group of major Oil-producing countries, is another key driver of price. The value of the US Dollar influences the price of WTI Crude Oil, since Oil is predominantly traded in US Dollars, thus a weaker US Dollar can make Oil more affordable and vice versa.
The weekly Oil inventory reports published by the American Petroleum Institute (API) and the Energy Information Agency (EIA) impact the price of WTI Oil. Changes in inventories reflect fluctuating supply and demand. If the data shows a drop in inventories it can indicate increased demand, pushing up Oil price. Higher inventories can reflect increased supply, pushing down prices. API’s report is published every Tuesday and EIA’s the day after. Their results are usually similar, falling within 1% of each other 75% of the time. The EIA data is considered more reliable, since it is a government agency.
OPEC (Organization of the Petroleum Exporting Countries) is a group of 13 Oil-producing nations who collectively decide production quotas for member countries at twice-yearly meetings. Their decisions often impact WTI Oil prices. When OPEC decides to lower quotas, it can tighten supply, pushing up Oil prices. When OPEC increases production, it has the opposite effect. OPEC+ refers to an expanded group that includes ten extra non-OPEC members, the most notable of which is Russia.
- Silver price remains firm as US Treasury yields are under pressure fur to rising Fed rate-cut bets.
- Loosening US labor market strength weighs on the US Dollar and bond yields.
- The U Unemployment Rate rose to its highest in more than two years at 4.1%.
Silver price (XAG/USD) trades inside Monday’s trading range near $31.00 in Tuesday’s Asian session. The white metal exhibits sheer strength as a rate cut by the Federal Reserve (Fed) in September appears to be a done deal.
The CME FedWatch tool shows that traders see a 77% chance for rate cuts in September, which has increased from 65.6% recorded a week ago. The reasoning behind growing speculation for rate cuts is moderating United States (US) labor market conditions.
The US Nonfarm Payrolls (NFP) report for June showed that the Unemployment Rate rose to 4.1%, the highest in more than two years. Also, Average Hourly Earnings declined expectedly, which eases fears of inflation remaining stubborn as slower growth in purchasing power would keep a lid over consumer spending.
Increasing expectations for Fed rate cuts in September have limited the upside in the US Dollar (USD) and Treasury yields. The US Dollar Index (DXY), which tracks the Greenback’s value against six major currencies, remains on backfoot around three-week low near 104.85. 10-year US Treasury yields struggle to hold weekly support of 4.28%. Falling yields on interest-bearing assets reduces the opportunity cost of holding an investment in non-yielding assets, such as Silver.
Silver technical analysis
Silver price extends its upside to near $31.00 after a breakout of the Falling Channel formation on a four-hour timeframe. An upside break of the above-mentioned chart pattern results in a bullish reversal. Upward-sloping 20-day Exponential Moving Average (EMA) at $30.70, exhibits a bullish trend.
The 14-period Relative Strength Index (RSI) shifts into the bullish range of 60.00-80.00, indicating that momentum has shifted to the upside.
Silver four-hour chart
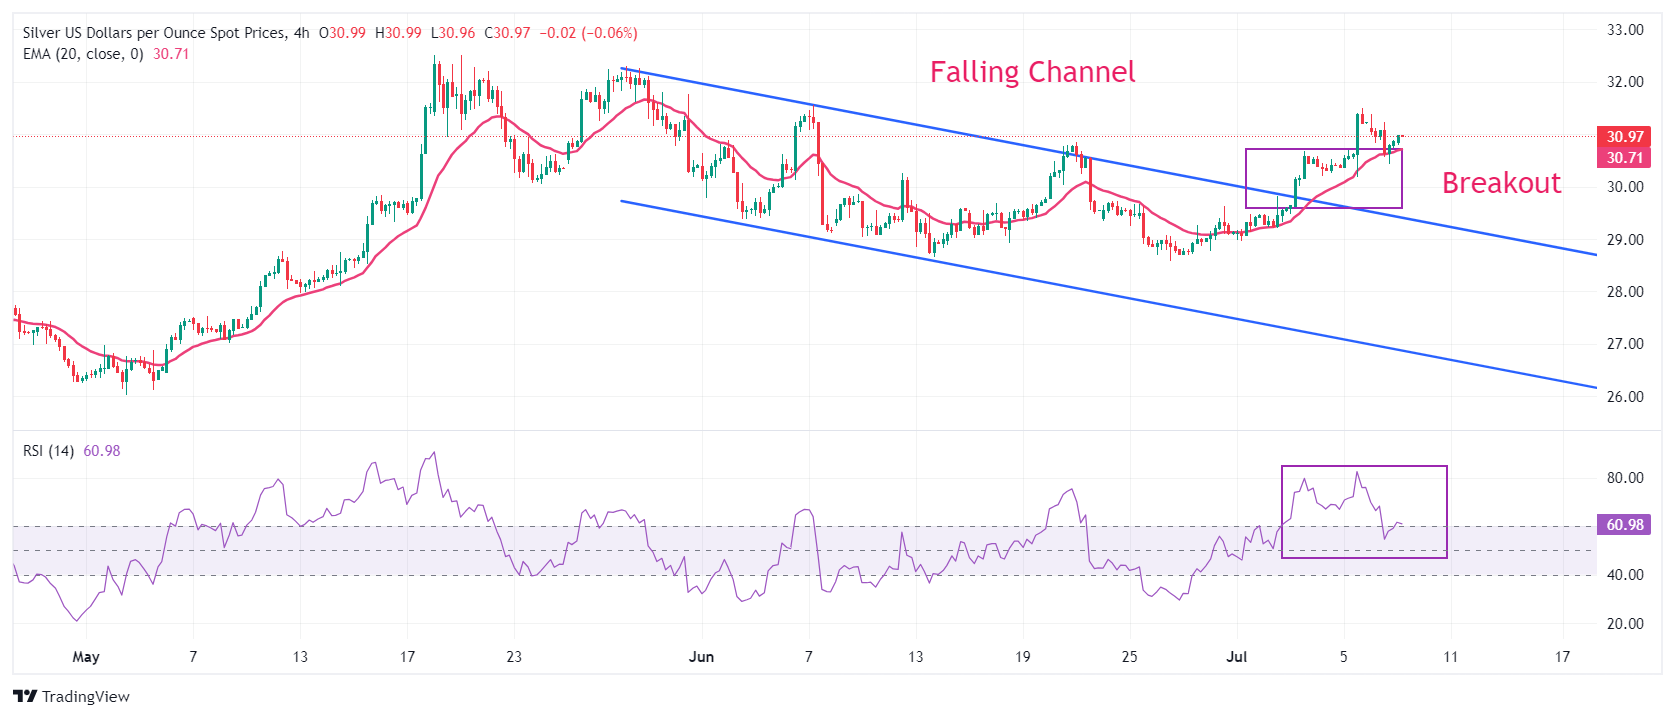
Silver FAQs
Silver is a precious metal highly traded among investors. It has been historically used as a store of value and a medium of exchange. Although less popular than Gold, traders may turn to Silver to diversify their investment portfolio, for its intrinsic value or as a potential hedge during high-inflation periods. Investors can buy physical Silver, in coins or in bars, or trade it through vehicles such as Exchange Traded Funds, which track its price on international markets.
Silver prices can move due to a wide range of factors. Geopolitical instability or fears of a deep recession can make Silver price escalate due to its safe-haven status, although to a lesser extent than Gold's. As a yieldless asset, Silver tends to rise with lower interest rates. Its moves also depend on how the US Dollar (USD) behaves as the asset is priced in dollars (XAG/USD). A strong Dollar tends to keep the price of Silver at bay, whereas a weaker Dollar is likely to propel prices up. Other factors such as investment demand, mining supply – Silver is much more abundant than Gold – and recycling rates can also affect prices.
Silver is widely used in industry, particularly in sectors such as electronics or solar energy, as it has one of the highest electric conductivity of all metals – more than Copper and Gold. A surge in demand can increase prices, while a decline tends to lower them. Dynamics in the US, Chinese and Indian economies can also contribute to price swings: for the US and particularly China, their big industrial sectors use Silver in various processes; in India, consumers’ demand for the precious metal for jewellery also plays a key role in setting prices.
Silver prices tend to follow Gold's moves. When Gold prices rise, Silver typically follows suit, as their status as safe-haven assets is similar. The Gold/Silver ratio, which shows the number of ounces of Silver needed to equal the value of one ounce of Gold, may help to determine the relative valuation between both metals. Some investors may consider a high ratio as an indicator that Silver is undervalued, or Gold is overvalued. On the contrary, a low ratio might suggest that Gold is undervalued relative to Silver.
- The Japanese Yen struggles due to overseas asset purchases by Japanese individuals through the NISA program.
- The BoJ is set to evaluate a viable strategy for reducing its government bond purchases.
- Fed Chair Powell may deliver a comprehensive review of the economy and monetary policy to the US Congress on Tuesday.
The Japanese Yen (JPY) extends its losses for the second successive session on Tuesday. The minor improvement in the US Dollar (USD) underpins the USD/JPY pair. However, the JPY could limit its downside due to fears of intervention by Japanese authorities in the FX markets.
The Japanese Yen also struggles due to overseas asset purchases by Japanese individuals through the newly revamped tax-free investment scheme, the Nippon Individual Savings Account (NISA) program. According to Nikkei Asia, the scale of these purchases is expected to exceed the country's trade deficit during the first half of this year.
US Treasury yields are under pressure amid rising speculation that the Federal Reserve (Fed) may reduce interest rates in September, potentially limiting the upside of the US Dollar. The CME's FedWatch Tool indicates that rate markets price in a 76.2% probability of a rate cut in September, up from 65.5% just a week earlier.
Federal Reserve Chairman Jerome Powell will deliver "The Semiannual Monetary Policy Report" to the US Congress on Tuesday. Powell may provide a broad overview of the economy and monetary policy, with his prepared remarks being published ahead of his appearance on Capitol Hill.
Daily Digest Market Movers: Japanese Yen declines due to foreign outflows
- According to a Bloomberg report on Tuesday, the Bank of Japan is conducting three in-person meetings with banks, securities firms, and financial institutions over the next few days. The purpose of these meetings is to assess a feasible pace for scaling back its purchases of Japanese Government Bonds.
- Japan’s Ministry of Finance reported on Monday that Japanese investment trust management companies and asset management firms bought ¥6.16 trillion ($38 billion) more in offshore equities and investment fund shares than they sold during the first six months of the year.
- Rabobank FX analysts note that they expect USD/JPY to hold around the 160 level over the next month, with the pair easing back to 152 by year-end. "The US Dollar (USD) could remain under pressure in the coming weeks, allowing USD/JPY to stay close to 160."
- On Monday, the Bank of Japan (BOJ) maintained its economic assessment for five of Japan's nine regions in its latest 'Sakura Report'. The assessment for two regions was raised, while it was lowered for another two regions in the report released on Monday. Regarding price trends, the BOJ noted that many regions report wage hikes spreading among smaller firms.
- Japan's Current Account surplus extended its growth streak to the 15th month in May. The Ministry of Finance reported on Monday that the current account increased to ¥2,849.9 billion ($17.78 billion) in May, up from ¥2,050.5 billion in the previous month, surpassing market expectations of ¥2,450.0 billion.
- US Nonfarm Payrolls (NFP) increased by 206,000 in June, following a rise of 218,000 in May. This figure surpassed the market expectation of 190,000.
- The Minutes from the Federal Reserve's June 11-12 monetary policy meeting, released on Wednesday, suggested that Fed officials were in a wait-and-see mode. "Some participants emphasized the Committee’s data-dependent approach, with monetary policy decisions being conditional on the evolution of the economy rather than being on a preset path."
Technical Analysis: USD/JPY rises to near 161.00
USD/JPY trades around 161.00 on Tuesday. The pair remains within an ascending channel pattern, indicating a bullish inclination based on daily chart analysis. Additionally, the momentum indicator, the 14-day Relative Strength Index (RSI), remains above the 50 level, confirming the bullish trend.
The USD/JPY pair could test the key resistance at the upper boundary of the ascending channel near the level of 162.55. A breakout above this level might strengthen bullish sentiment, potentially driving the pair toward psychological resistance at 163.00.
On the downside, the USD/JPY pair may find immediate support around the 21-day Exponential Moving Average (EMA) at 159.78. A break below this level could exert pressure on the pair to test the lower boundary of the ascending channel around 159.40. A further decline below this channel support could lead the pair to navigate the vicinity around June's low at 154.55.
USD/JPY: Daily Chart
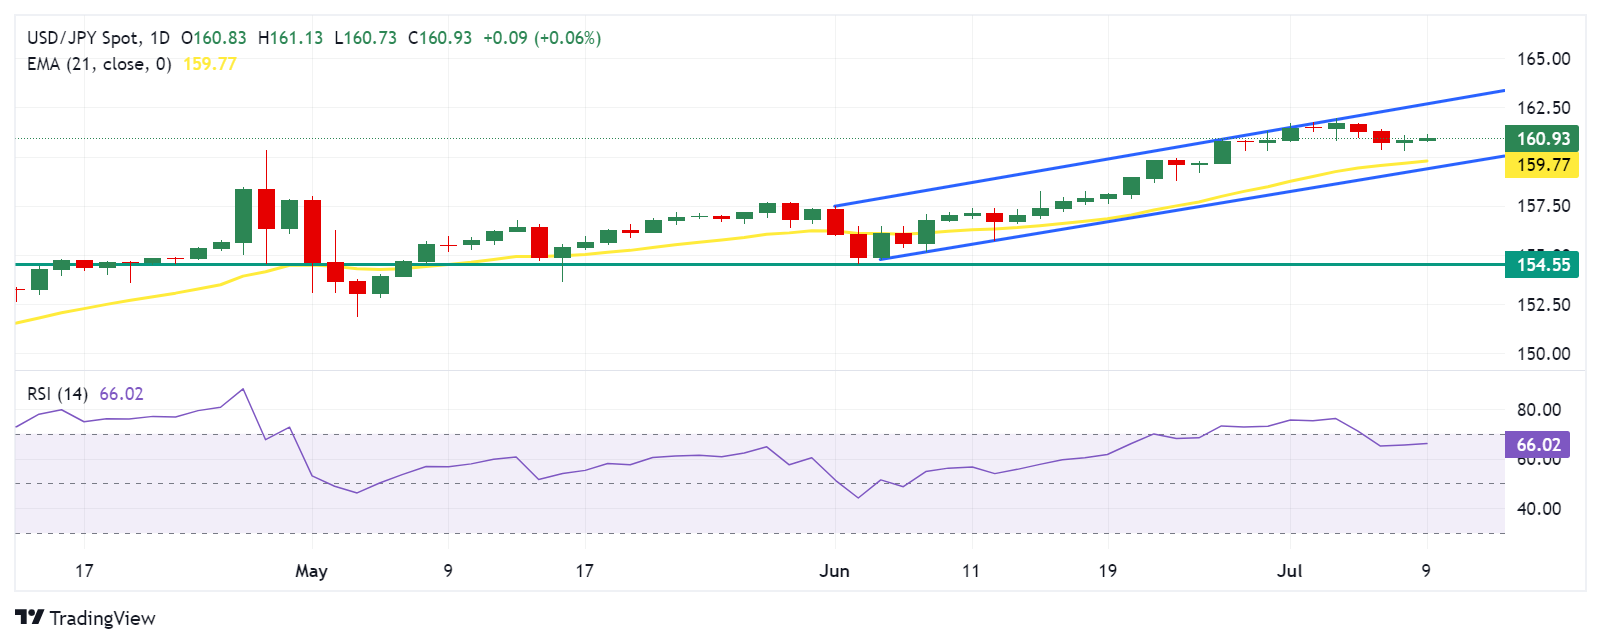
Japanese Yen PRICE Today
The table below shows the percentage change of Japanese Yen (JPY) against listed major currencies today. Japanese Yen was the weakest against the Euro.
| USD | EUR | GBP | JPY | CAD | AUD | NZD | CHF | |
|---|---|---|---|---|---|---|---|---|
| USD | -0.03% | 0.02% | 0.11% | 0.01% | -0.03% | 0.07% | 0.08% | |
| EUR | 0.03% | 0.03% | 0.16% | 0.03% | 0.00% | 0.11% | 0.11% | |
| GBP | -0.02% | -0.03% | 0.10% | -0.00% | -0.01% | 0.08% | 0.07% | |
| JPY | -0.11% | -0.16% | -0.10% | -0.11% | -0.15% | -0.05% | -0.05% | |
| CAD | -0.01% | -0.03% | 0.00% | 0.11% | -0.05% | 0.08% | 0.06% | |
| AUD | 0.03% | -0.01% | 0.01% | 0.15% | 0.05% | 0.09% | 0.08% | |
| NZD | -0.07% | -0.11% | -0.08% | 0.05% | -0.08% | -0.09% | 0.00% | |
| CHF | -0.08% | -0.11% | -0.07% | 0.05% | -0.06% | -0.08% | -0.00% |
The heat map shows percentage changes of major currencies against each other. The base currency is picked from the left column, while the quote currency is picked from the top row. For example, if you pick the Japanese Yen from the left column and move along the horizontal line to the US Dollar, the percentage change displayed in the box will represent JPY (base)/USD (quote).
Bank of Japan FAQs
The Bank of Japan (BoJ) is the Japanese central bank, which sets monetary policy in the country. Its mandate is to issue banknotes and carry out currency and monetary control to ensure price stability, which means an inflation target of around 2%.
The Bank of Japan has embarked in an ultra-loose monetary policy since 2013 in order to stimulate the economy and fuel inflation amid a low-inflationary environment. The bank’s policy is based on Quantitative and Qualitative Easing (QQE), or printing notes to buy assets such as government or corporate bonds to provide liquidity. In 2016, the bank doubled down on its strategy and further loosened policy by first introducing negative interest rates and then directly controlling the yield of its 10-year government bonds.
The Bank’s massive stimulus has caused the Yen to depreciate against its main currency peers. This process has exacerbated more recently due to an increasing policy divergence between the Bank of Japan and other main central banks, which have opted to increase interest rates sharply to fight decades-high levels of inflation. The BoJ’s policy of holding down rates has led to a widening differential with other currencies, dragging down the value of the Yen.
A weaker Yen and the spike in global energy prices have led to an increase in Japanese inflation, which has exceeded the BoJ’s 2% target. Still, the Bank judges that the sustainable and stable achievement of the 2% target has not yet come in sight, so any sudden change in the current policy looks unlikely.
- The Indian Rupee trades in negative territory on Tuesday.
- The local currency declines on the back of a firmer US Dollar and fears of disruption in US oil supply.
- Investors will closely monitor Fed Chair Jerome Powell’s testimony on Tuesday.
The Indian Rupee (INR) weakens on Tuesday amid the recovery of the Greenback. The local currency loses traction as concerns about tropical storm Beryl disrupting US oil supply weigh on sentiment. However, the rising bets on a September rate cut by the US Federal Reserve (Fed) after US employment data on Friday signaled a cooling US labor market, which might undermine the US Dollar (USD).
The Fed Chairman Jerome Powell's semi-annual monetary policy testimony to US lawmakers on Tuesday will be closely watched. This event "could be an opportunity for him to share whether the odds of a September rate cut have improved with the latest data", said an ING Bank analyst. The dovish comments from Chair Powell might drag the Greenback lower and cap the upside for the pair.
Daily Digest Market Movers: Indian Rupee is sensitive to global headwinds
- India will likely peg its FY25 fiscal deficit target at 5.1% of GDP in the upcoming budget, according to Goldman Sachs.
- India’s employment growth rate stood at 6% in this fiscal year versus 3.2% in the previous fiscal year. The total additions to the workforce at 46.7 million were the highest since 1981-1982, the Reserve Bank of India (RBI) report showed on Monday.
- "Bids from state-run banks capped the rupee's gains around 83.44, and they were also on offer near 83.48 in the second half (of the session)," said a foreign exchange trader at a foreign bank.
- According to the CME FedWatch tool, traders are now pricing in nearly 76% odds of a Fed rate cut in September, up from 71% last Friday.
- The US CPI is estimated to show an increase of 3.1% YoY in June, compared to a 3.3% rise in May. Core inflation is projected to remain steady at 3.4% YoY in June.
Technical analysis: USD/INR enters a consolidation phase in the near term
The Indian Rupee edges lower on the day. The USD/INR pair keeps the bullish vibe unchanged above the key 100-day Exponential Moving Average (EMA) on the daily chart.
However, in the shorter term, the pair remains confined within a familiar trading range since March 21, with the 14-day Relative Strength Index (RSI) hovering around the 50-midline. This indicates that further consolidation is in play.
The potential resistance level for the pair will emerge at 83.65, the upper boundary of the trading range. Extended gains could pave the way to the all-time high of 83.75, followed by the 84.00 psychological barrier.
On the downside, the initial support level for USD/INR is located at 83.35, the 100-day EMA. A decisive break below this level will drag the pair lower to the 83.00 round figure. The next contention level to watch is 82.82, a low of January 12.
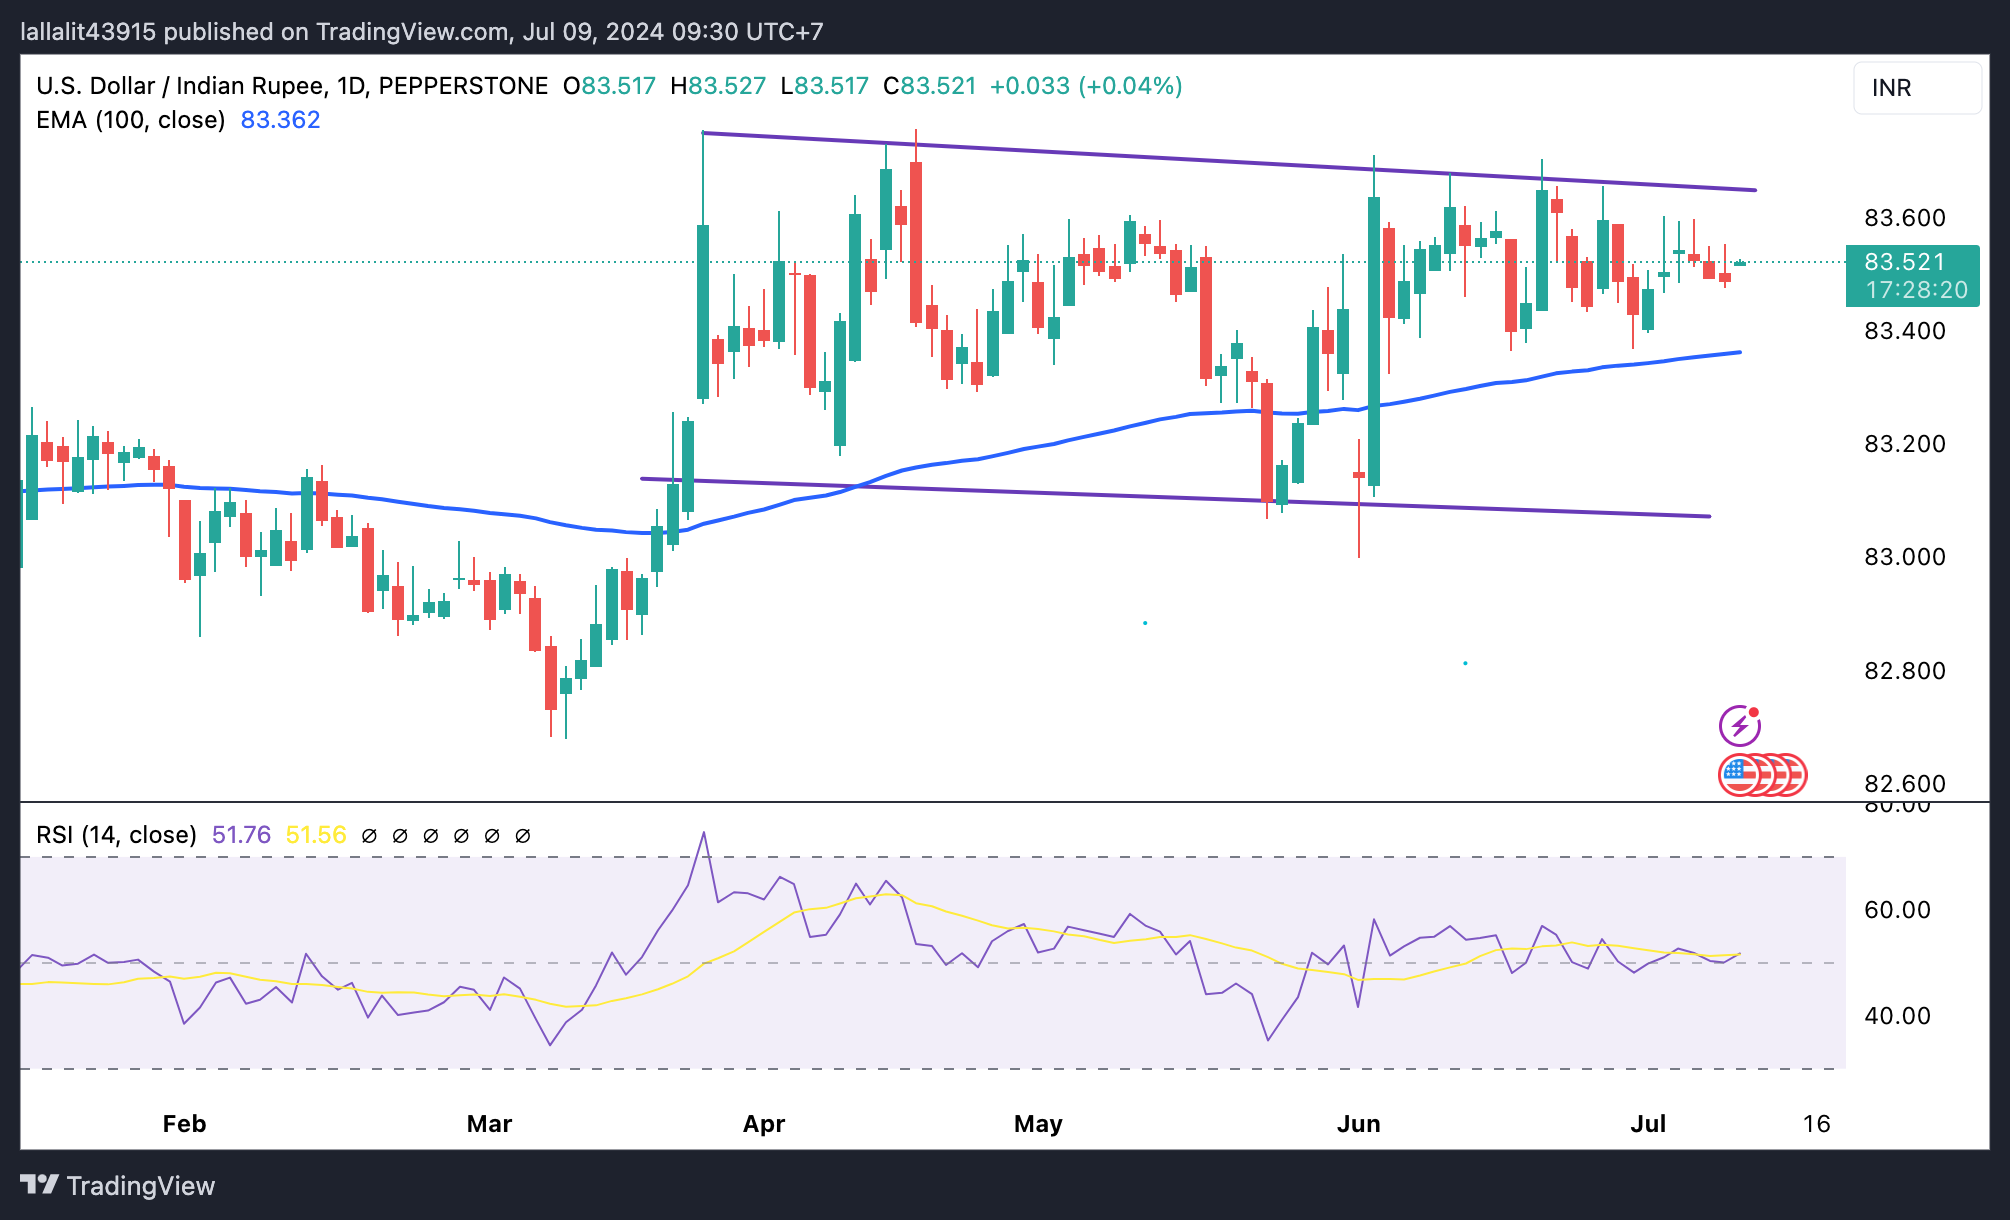
US Dollar price today
The table below shows the percentage change of US Dollar (USD) against listed major currencies today. US Dollar was the strongest against the New Zealand Dollar.
| USD | EUR | GBP | CAD | AUD | JPY | NZD | CHF | |
| USD | 0.03% | 0.08% | 0.07% | 0.12% | 0.08% | 0.21% | 0.08% | |
| EUR | -0.03% | 0.05% | 0.03% | 0.08% | 0.04% | 0.18% | 0.04% | |
| GBP | -0.08% | -0.03% | -0.01% | 0.04% | 0.00% | 0.13% | -0.01% | |
| CAD | -0.07% | -0.04% | 0.01% | 0.05% | 0.01% | 0.14% | 0.01% | |
| AUD | -0.12% | -0.09% | -0.05% | -0.05% | -0.05% | 0.09% | -0.06% | |
| JPY | -0.08% | -0.04% | -0.02% | -0.02% | 0.03% | 0.14% | 0.00% | |
| NZD | -0.23% | -0.20% | -0.13% | -0.15% | -0.09% | -0.13% | -0.14% | |
| CHF | -0.08% | -0.05% | 0.00% | -0.01% | 0.04% | 0.00% | 0.13% |
The heat map shows percentage changes of major currencies against each other. The base currency is picked from the left column, while the quote currency is picked from the top row. For example, if you pick the Euro from the left column and move along the horizontal line to the Japanese Yen, the percentage change displayed in the box will represent EUR (base)/JPY (quote).
Indian Rupee FAQs
The Indian Rupee (INR) is one of the most sensitive currencies to external factors. The price of Crude Oil (the country is highly dependent on imported Oil), the value of the US Dollar – most trade is conducted in USD – and the level of foreign investment, are all influential. Direct intervention by the Reserve Bank of India (RBI) in FX markets to keep the exchange rate stable, as well as the level of interest rates set by the RBI, are further major influencing factors on the Rupee.
The Reserve Bank of India (RBI) actively intervenes in forex markets to maintain a stable exchange rate, to help facilitate trade. In addition, the RBI tries to maintain the inflation rate at its 4% target by adjusting interest rates. Higher interest rates usually strengthen the Rupee. This is due to the role of the ‘carry trade’ in which investors borrow in countries with lower interest rates so as to place their money in countries’ offering relatively higher interest rates and profit from the difference.
Macroeconomic factors that influence the value of the Rupee include inflation, interest rates, the economic growth rate (GDP), the balance of trade, and inflows from foreign investment. A higher growth rate can lead to more overseas investment, pushing up demand for the Rupee. A less negative balance of trade will eventually lead to a stronger Rupee. Higher interest rates, especially real rates (interest rates less inflation) are also positive for the Rupee. A risk-on environment can lead to greater inflows of Foreign Direct and Indirect Investment (FDI and FII), which also benefit the Rupee.
Higher inflation, particularly, if it is comparatively higher than India’s peers, is generally negative for the currency as it reflects devaluation through oversupply. Inflation also increases the cost of exports, leading to more Rupees being sold to purchase foreign imports, which is Rupee-negative. At the same time, higher inflation usually leads to the Reserve Bank of India (RBI) raising interest rates and this can be positive for the Rupee, due to increased demand from international investors. The opposite effect is true of lower inflation.
Japan’s Finance Minister Shunichi Suzuki said on Tuesday that it is “important to keep fiscal discipline to keep confidence in long-term fiscal health.”
He added that he is “closely watching discussions at the Bank of Japan (BoJ) meeting with the bond market.”
Market reaction
USD/JPY is battling 161.00 following these above comments, having hit intraday highs at 161.13 in the last hour. The pair is still up 0.12% on the day.
| Raw materials | Closed | Change, % |
|---|---|---|
| Silver | 30.733 | -1.58 |
| Gold | 235.847 | -1.3 |
| Palladium | 1007.61 | -1.72 |
- The Australian Dollar gains ground due to expectations that the RBA might lag in the global rate-cutting cycle.
- Australia’s 10-year government bond yield rises to near 4.4% as foreign investors seek protection from political uncertainties.
- Fed Chair Powell is scheduled to deliver “The Semiannual Monetary Policy Report" to the US Congress on Tuesday.
The Australian Dollar (AUD) recovers its recent losses, trading near its six-month high of 0.6761 on Tuesday. This upside of the AUD is attributed to the rising expectations that the Reserve Bank of Australia (RBA) might lag in the global rate-cutting cycle or potentially raise interest rates again due to strong inflation data for May.
Australia’s 10-year government bond yield remained steady at around 4.4%, as high yields attract foreign capital from investors seeking protection from political uncertainties in the US and Europe. The RBA’s June Meeting Minutes highlighted policymakers' emphasis on the need to stay vigilant regarding inflation risks. They noted that a significant rise in prices could necessitate substantially higher interest rates.
The AUD/USD pair gains ground as the US Dollar (USD) struggles due to soft US employment data, leading traders to speculate that the Federal Reserve (Fed) might reduce interest rates sooner rather than later. The CME's FedWatch Tool indicates that rate markets price in a 76.2% probability of a rate cut in September, up from 65.5% just a week earlier.
Daily Digest Market Movers: Australian Dollar improves due to hawkish sentiment surrounding RBA
- Australia's Westpac Consumer Confidence dropped by 1.1% in July, reversing the 1.7% increase seen in June. This marks the fifth decline in 2024, driven by ongoing worries about high inflation, elevated interest rates, and a sluggish economy.
- US Nonfarm Payrolls (NFP) increased by 206,000 in June, following a rise of 218,000 in May. This figure surpassed the market expectation of 190,000.
- The US Unemployment Rate edged up to 4.1% in June from 4.0% in May. Meanwhile, Average Hourly Earnings decreased to 3.9% year-over-year in June from the previous reading of 4.1%, aligning with market expectations.
- According to the Australian Bureau of Statistics on Thursday, Australia's trade surplus for May was A$5,773 million ($3,868 million), lower than the expected A$6,678 million and down from the previous reading of A$6,548 million.
- Australia's Retail Sales, a measure of the country's consumer spending, increased by 0.6% MoM in May, up from the previous month's 0.1% rise. This figure exceeded market expectations of a 0.2% increase.
- Federal Reserve Bank of Chicago President Austan Goolsbee stated on BBC Radio on Wednesday that bringing inflation back to 2% will take time and that more economic data are needed. However, on Tuesday, Fed Chair Jerome Powell said that the central bank is getting back on the disinflationary path, per Reuters.
Technical Analysis: Australian Dollar holds ground around 0.6750
The Australian Dollar trades around 0.6740 on Tuesday. The daily chart analysis shows that the AUD/USD pair consolidates within an ascending channel, indicating a bullish bias. Additionally, the 14-day Relative Strength Index (RSI) remains above the 50 level, confirming the bullish momentum.
The AUD/USD pair may test the upper boundary of the ascending channel around 0.6765. A breakthrough above this level could lead the pair to explore the region around the psychological level of 0.6800.
On the downside, the AUD/USD pair may navigate around the lower boundary of the ascending channel at 0.6665, with further support around the 50-day Exponential Moving Average (EMA) at 0.6642.
AUD/USD: Daily Chart
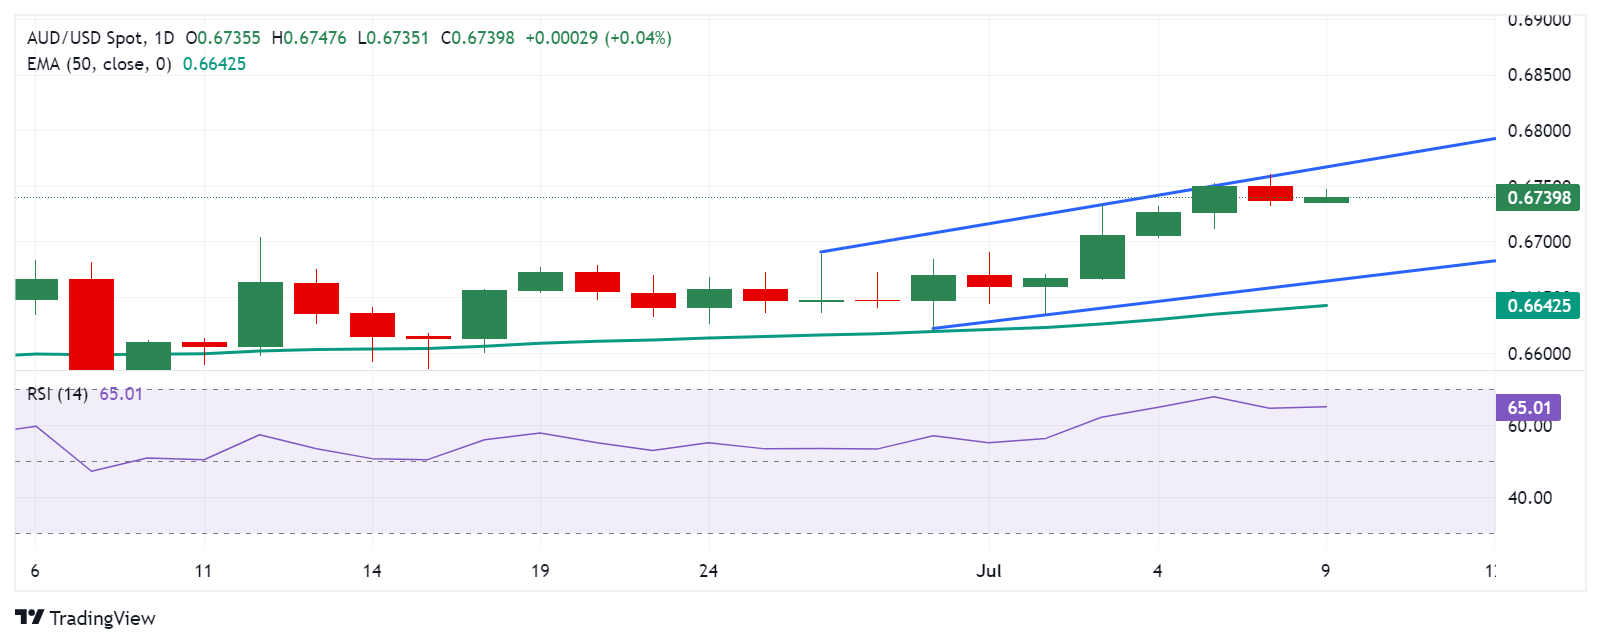
Australian Dollar PRICE Today
The table below shows the percentage change of Australian Dollar (AUD) against listed major currencies today. Australian Dollar was the strongest against the Japanese Yen.
| USD | EUR | GBP | JPY | CAD | AUD | NZD | CHF | |
|---|---|---|---|---|---|---|---|---|
| USD | -0.02% | 0.02% | 0.08% | -0.00% | -0.07% | -0.02% | 0.07% | |
| EUR | 0.02% | 0.03% | 0.10% | 0.00% | -0.05% | 0.00% | 0.09% | |
| GBP | -0.02% | -0.03% | 0.06% | -0.02% | -0.06% | -0.03% | 0.05% | |
| JPY | -0.08% | -0.10% | -0.06% | -0.09% | -0.16% | -0.12% | -0.03% | |
| CAD | 0.00% | -0.00% | 0.02% | 0.09% | -0.08% | 0.00% | 0.06% | |
| AUD | 0.07% | 0.05% | 0.06% | 0.16% | 0.08% | 0.04% | 0.10% | |
| NZD | 0.02% | -0.01% | 0.03% | 0.12% | -0.00% | -0.04% | 0.08% | |
| CHF | -0.07% | -0.09% | -0.05% | 0.03% | -0.06% | -0.10% | -0.08% |
The heat map shows percentage changes of major currencies against each other. The base currency is picked from the left column, while the quote currency is picked from the top row. For example, if you pick the Australian Dollar from the left column and move along the horizontal line to the US Dollar, the percentage change displayed in the box will represent AUD (base)/USD (quote).
RBA FAQs
The Reserve Bank of Australia (RBA) sets interest rates and manages monetary policy for Australia. Decisions are made by a board of governors at 11 meetings a year and ad hoc emergency meetings as required. The RBA’s primary mandate is to maintain price stability, which means an inflation rate of 2-3%, but also “..to contribute to the stability of the currency, full employment, and the economic prosperity and welfare of the Australian people.” Its main tool for achieving this is by raising or lowering interest rates. Relatively high interest rates will strengthen the Australian Dollar (AUD) and vice versa. Other RBA tools include quantitative easing and tightening.
While inflation had always traditionally been thought of as a negative factor for currencies since it lowers the value of money in general, the opposite has actually been the case in modern times with the relaxation of cross-border capital controls. Moderately higher inflation now tends to lead central banks to put up their interest rates, which in turn has the effect of attracting more capital inflows from global investors seeking a lucrative place to keep their money. This increases demand for the local currency, which in the case of Australia is the Aussie Dollar.
Macroeconomic data gauges the health of an economy and can have an impact on the value of its currency. Investors prefer to invest their capital in economies that are safe and growing rather than precarious and shrinking. Greater capital inflows increase the aggregate demand and value of the domestic currency. Classic indicators, such as GDP, Manufacturing and Services PMIs, employment, and consumer sentiment surveys can influence AUD. A strong economy may encourage the Reserve Bank of Australia to put up interest rates, also supporting AUD.
Quantitative Easing (QE) is a tool used in extreme situations when lowering interest rates is not enough to restore the flow of credit in the economy. QE is the process by which the Reserve Bank of Australia (RBA) prints Australian Dollars (AUD) for the purpose of buying assets – usually government or corporate bonds – from financial institutions, thereby providing them with much-needed liquidity. QE usually results in a weaker AUD.
Quantitative tightening (QT) is the reverse of QE. It is undertaken after QE when an economic recovery is underway and inflation starts rising. Whilst in QE the Reserve Bank of Australia (RBA) purchases government and corporate bonds from financial institutions to provide them with liquidity, in QT the RBA stops buying more assets, and stops reinvesting the principal maturing on the bonds it already holds. It would be positive (or bullish) for the Australian Dollar.
The People’s Bank of China (PBOC) set the USD/CNY central rate on Tuesday at 7.1310, as against the previous day's fix of 7.1286 and 7.2676 Reuters estimates.
- NZD/USD holds positive ground near 0.6130 in Tuesday’s early Asian session.
- The New Zealand central bank is expected to keep policy unchanged at its July meeting on Wednesday.
- Rising Fed rate cut bets are likely to weigh on the US Dollar.
The NZD/USD pair trades on a stronger note around 0.6130 on Tuesday during the early Asian trading hours. The US Dollar (USD) consolidates as traders await the Federal Reserve’s (Fed) Jerome Powell’s testimony on Tuesday ahead of the Reserve Bank of New Zealand's (RBNZ) interest rate decision on Wednesday.
The RBNZ is expected to keep the Official Cash Rate (OCR) unchanged at 5.50% at its July meeting on Wednesday, despite signs of weaker economic activity in New Zealand. Traders will take more cues from the Monetary Policy Statement. A hawkish stance by the RBNZ might support the New Zealand Dollar (NZD) in the near term.
On the other hand, the growing speculation that the US Fed will cut the interest rate sooner than expected this year exerts some selling pressure on the Greenback. According to the CME FedWatch tool, traders are now pricing in nearly 76% odds of Fed rate cuts in September, up from 64% recorded a week ago.
On the US docket, the Consumer Price Index (CPI) data for June might offer some hints about the inflation trajectory in the US. The US CPI inflation is forecast to drop to 3.1% YoY in June from 3.3% in May, while core inflation is projected to remain steady at 3.4% YoY in the same reported period. Any signs of softer inflation in the US might drag the USD lower and create a tailwind for the NZD/USD pair.
New Zealand Dollar FAQs
The New Zealand Dollar (NZD), also known as the Kiwi, is a well-known traded currency among investors. Its value is broadly determined by the health of the New Zealand economy and the country’s central bank policy. Still, there are some unique particularities that also can make NZD move. The performance of the Chinese economy tends to move the Kiwi because China is New Zealand’s biggest trading partner. Bad news for the Chinese economy likely means less New Zealand exports to the country, hitting the economy and thus its currency. Another factor moving NZD is dairy prices as the dairy industry is New Zealand’s main export. High dairy prices boost export income, contributing positively to the economy and thus to the NZD.
The Reserve Bank of New Zealand (RBNZ) aims to achieve and maintain an inflation rate between 1% and 3% over the medium term, with a focus to keep it near the 2% mid-point. To this end, the bank sets an appropriate level of interest rates. When inflation is too high, the RBNZ will increase interest rates to cool the economy, but the move will also make bond yields higher, increasing investors’ appeal to invest in the country and thus boosting NZD. On the contrary, lower interest rates tend to weaken NZD. The so-called rate differential, or how rates in New Zealand are or are expected to be compared to the ones set by the US Federal Reserve, can also play a key role in moving the NZD/USD pair.
Macroeconomic data releases in New Zealand are key to assess the state of the economy and can impact the New Zealand Dollar’s (NZD) valuation. A strong economy, based on high economic growth, low unemployment and high confidence is good for NZD. High economic growth attracts foreign investment and may encourage the Reserve Bank of New Zealand to increase interest rates, if this economic strength comes together with elevated inflation. Conversely, if economic data is weak, NZD is likely to depreciate.
The New Zealand Dollar (NZD) tends to strengthen during risk-on periods, or when investors perceive that broader market risks are low and are optimistic about growth. This tends to lead to a more favorable outlook for commodities and so-called ‘commodity currencies’ such as the Kiwi. Conversely, NZD tends to weaken at times of market turbulence or economic uncertainty as investors tend to sell higher-risk assets and flee to the more-stable safe havens.
| Index | Change, points | Closed | Change, % |
|---|---|---|---|
| NIKKEI 225 | -131.67 | 40780.7 | -0.32 |
| Hang Seng | -275.55 | 17524.06 | -1.55 |
| KOSPI | -4.47 | 2857.76 | -0.16 |
| ASX 200 | -59.1 | 7763.2 | -0.76 |
| DAX | -3.4 | 18472.05 | -0.02 |
| CAC 40 | -48.17 | 7627.45 | -0.63 |
| Dow Jones | -33.2 | 39342.67 | -0.08 |
| S&P 500 | 5.66 | 5572.85 | 0.1 |
| NASDAQ Composite | 50.98 | 18403.74 | 0.28 |
- The Gold price posts modest gains in Tuesday’s early Asian session.
- Rising rates cut expectations and safe-haven flows might cap the precious metal’s downside.
- Pausing China's PBoC Gold purchases will likely weigh on XAU/USD in the near term.
The Gold price (XAU/USD) trades with mild gains on the weaker US Dollar (USD) during the early Asian session on Tuesday. The downside for the precious metal might be limited as traders raise their bets that the US Federal Reserve (Fed) would cut interest rates in September following soft US employment data last week. Additionally, the cautious mood amid the political uncertainties in France and geopolitical tensions in the Middle East might boost the Gold price, a traditional safe-haven asset.
Nonetheless, Gold prices might be dragged lower by the People Bank of China’s (PBoC) decision not to buy Gold for a second straight month in June. Gold traders will monitor Fed Chair Jerome Powell's semi-annual Congressional testimony, along with the speeches from Fed’s Michael Barr and Michelle Bowman. On Thursday, the US Consumer Price Index (CPI) inflation data will take center stage.
Daily Digest Market Movers: Gold price remains strong amid rising Fed rate cut bets
- The Chinese central bank kept Gold buying on hold for the second month in June, according to official data released on Sunday.
- China, the world's largest gold consumer, kept its gold holdings unchanged for the second consecutive month in June, after 18 months of purchases. These figures indicated that its reserves remained at 72.8 million ounces, valued at roughly $170 billion.
- "This looks like a lot of profit taking, and the equities are strong, and this morning here, which kind of has a little bit of a competing factor with precious metals," said Bob Haberkorn, senior market strategist at RJO Futures.
- Financial markets have priced in a nearly 76% chance of a Fed rate cut in September, up from 71% last Friday, according to the CME FedWatch tool.
- The US CPI inflation is expected to ease to 3.1% YoY in June from 3.3% in May, while core inflation is estimated to remain steady at 3.4% YoY in the same reported period.
Technical Analysis: Gold price’s bullish bias remains in the longer term
The gold price trades on a positive note on the day. The yellow metal sustains a breakout above a descending trend channel that formed on May 10. According to the daily chart, the precious metal maintains the bullish trend above the key 100-day Exponential Moving Average (EMA), with the 14-day Relative Strength Index (RSI) holding in the bullish zone above the 50-midline. This indicates that the support level is likely to hold rather than break.
The $2,400 psychological level acts as an immediate resistance level for XAU/USD. The next upside barrier to watch is $2,432 (high of April 12) en route to $2,450 (the all-time high).
In the bearish event, the first downside target will emerge at $2,340 (former resistance level). Any follow-through selling below this level will pave the way to $2,273 (100-day EMA).
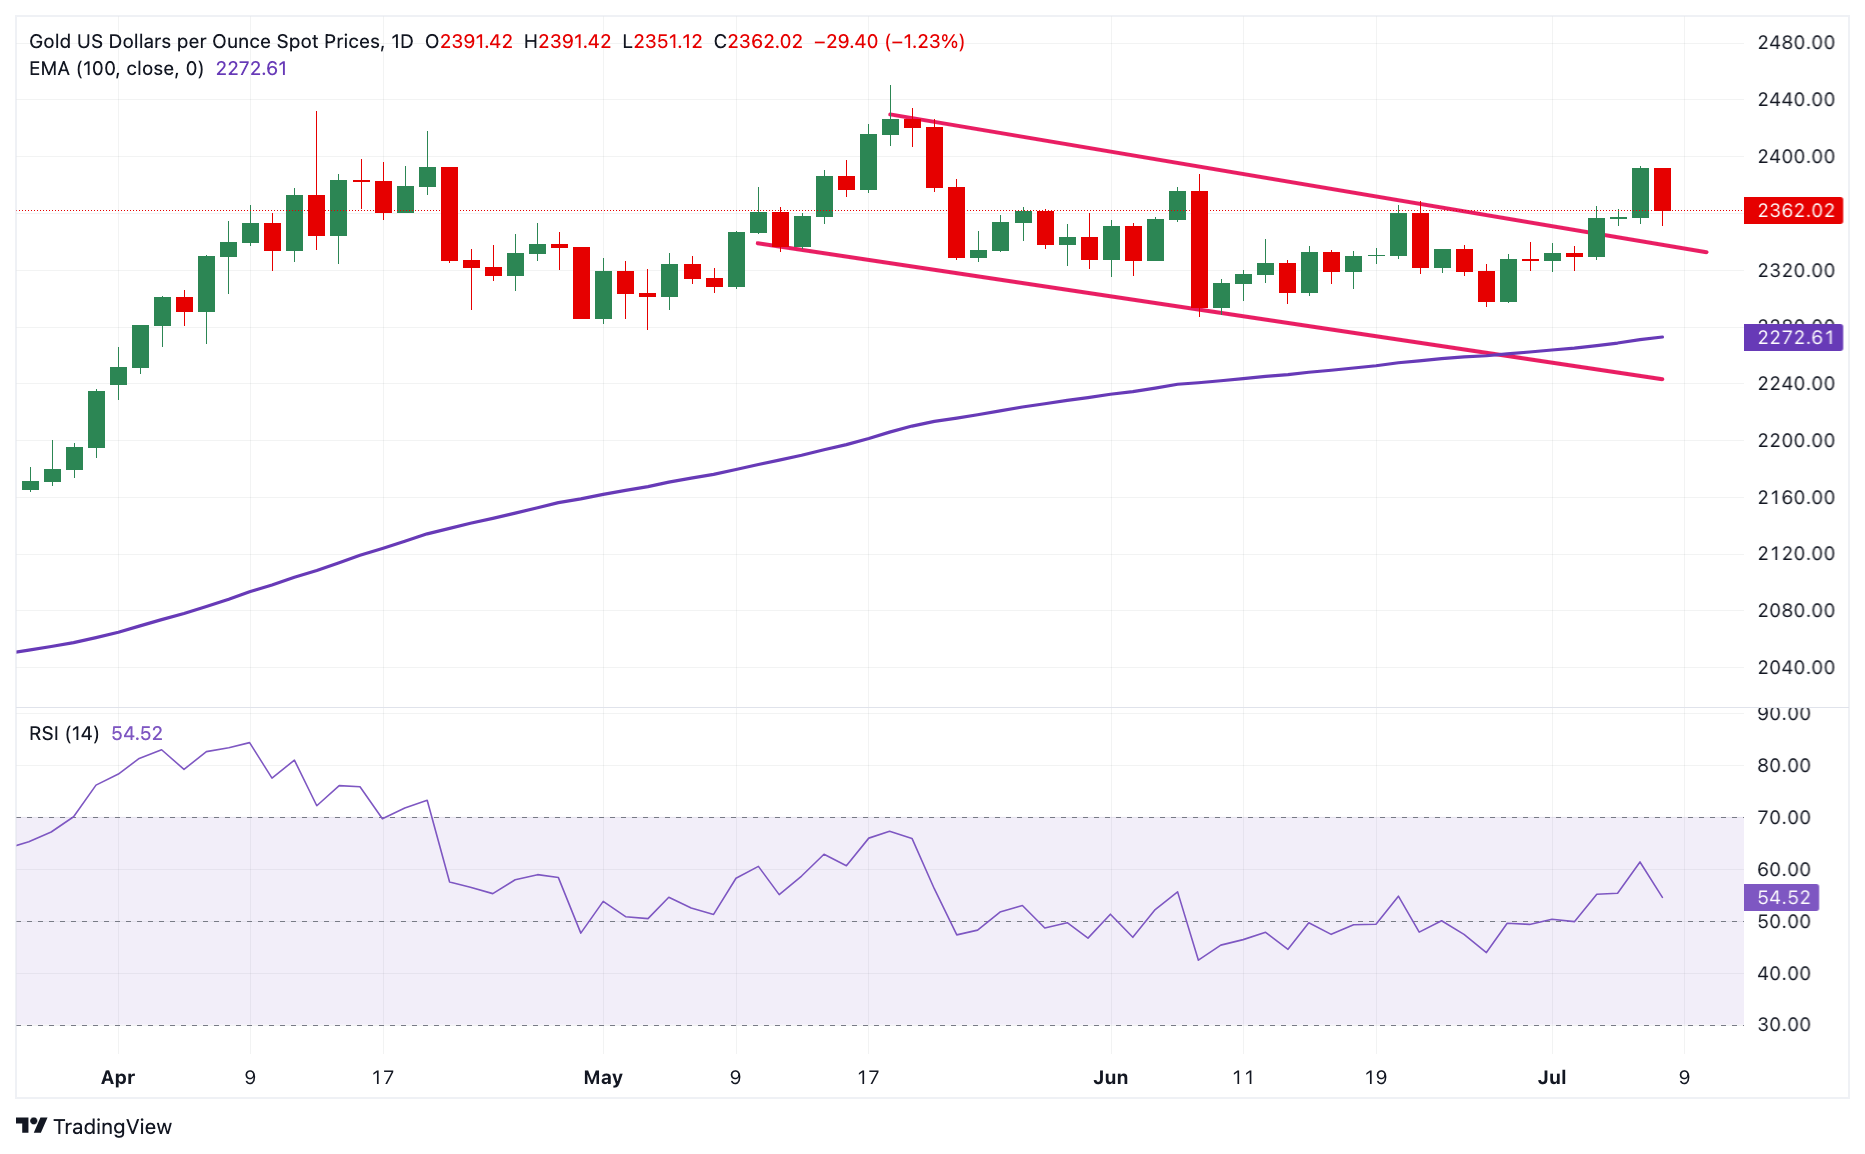
US Dollar price today
The table below shows the percentage change of US Dollar (USD) against listed major currencies today. US Dollar was the weakest against the New Zealand Dollar.
| USD | EUR | GBP | CAD | AUD | JPY | NZD | CHF | |
| USD | 0.00% | 0.00% | 0.01% | -0.01% | 0.00% | 0.00% | 0.00% | |
| EUR | 0.01% | 0.00% | 0.01% | 0.00% | 0.00% | -0.01% | 0.00% | |
| GBP | 0.01% | 0.00% | 0.00% | -0.01% | -0.01% | -0.04% | 0.01% | |
| CAD | -0.01% | -0.01% | -0.02% | -0.02% | 0.00% | -0.02% | -0.01% | |
| AUD | 0.00% | 0.00% | 0.00% | 0.00% | 0.00% | -0.02% | 0.03% | |
| JPY | 0.02% | 0.00% | 0.00% | 0.00% | 0.01% | -0.01% | 0.00% | |
| NZD | 0.03% | 0.04% | 0.02% | 0.01% | 0.03% | 0.03% | 0.03% | |
| CHF | -0.01% | 0.00% | 0.00% | 0.00% | 0.00% | -0.01% | -0.02% |
The heat map shows percentage changes of major currencies against each other. The base currency is picked from the left column, while the quote currency is picked from the top row. For example, if you pick the Euro from the left column and move along the horizontal line to the Japanese Yen, the percentage change displayed in the box will represent EUR (base)/JPY (quote).
Gold FAQs
Gold has played a key role in human’s history as it has been widely used as a store of value and medium of exchange. Currently, apart from its shine and usage for jewelry, the precious metal is widely seen as a safe-haven asset, meaning that it is considered a good investment during turbulent times. Gold is also widely seen as a hedge against inflation and against depreciating currencies as it doesn’t rely on any specific issuer or government.
Central banks are the biggest Gold holders. In their aim to support their currencies in turbulent times, central banks tend to diversify their reserves and buy Gold to improve the perceived strength of the economy and the currency. High Gold reserves can be a source of trust for a country’s solvency. Central banks added 1,136 tonnes of Gold worth around $70 billion to their reserves in 2022, according to data from the World Gold Council. This is the highest yearly purchase since records began. Central banks from emerging economies such as China, India and Turkey are quickly increasing their Gold reserves.
Gold has an inverse correlation with the US Dollar and US Treasuries, which are both major reserve and safe-haven assets. When the Dollar depreciates, Gold tends to rise, enabling investors and central banks to diversify their assets in turbulent times. Gold is also inversely correlated with risk assets. A rally in the stock market tends to weaken Gold price, while sell-offs in riskier markets tend to favor the precious metal.
The price can move due to a wide range of factors. Geopolitical instability or fears of a deep recession can quickly make Gold price escalate due to its safe-haven status. As a yield-less asset, Gold tends to rise with lower interest rates, while higher cost of money usually weighs down on the yellow metal. Still, most moves depend on how the US Dollar (USD) behaves as the asset is priced in dollars (XAU/USD). A strong Dollar tends to keep the price of Gold controlled, whereas a weaker Dollar is likely to push Gold prices up.
| Pare | Closed | Change, % |
|---|---|---|
| AUDUSD | 0.67372 | -0.17 |
| EURJPY | 174.048 | -0.02 |
| EURUSD | 1.08245 | -0.05 |
| GBPJPY | 205.908 | -0.02 |
| GBPUSD | 1.28063 | -0.06 |
| NZDUSD | 0.61254 | -0.33 |
| USDCAD | 1.36335 | -0.04 |
| USDCHF | 0.89759 | 0.29 |
| USDJPY | 160.783 | 0.03 |


© 2000-2026. Sva prava zaštićena.
Sajt je vlasništvo kompanije Teletrade D.J. LLC 2351 LLC 2022 (Euro House, Richmond Hill Road, Kingstown, VC0100, St. Vincent and the Grenadines).
Svi podaci koji se nalaze na sajtu ne predstavljaju osnovu za donošenje investicionih odluka, već su informativnog karaktera.
The company does not serve or provide services to customers who are residents of the US, Canada, Iran, The Democratic People's Republic of Korea, Yemen and FATF blacklisted countries.
Izvršenje trgovinskih operacija sa finansijskim instrumentima upotrebom marginalne trgovine pruža velike mogućnosti i omogućava investitorima ostvarivanje visokih prihoda. Međutim, takav vid trgovine povezan je sa potencijalno visokim nivoom rizika od gubitka sredstava. Проведение торговых операций на финанcовых рынках c маржинальными финанcовыми инcтрументами открывает широкие возможноcти, и позволяет инвеcторам, готовым пойти на риcк, получать выcокую прибыль, но при этом неcет в cебе потенциально выcокий уровень риcка получения убытков. Iz tog razloga je pre započinjanja trgovine potrebno odlučiti o izboru odgovarajuće investicione strategije, uzimajući u obzir raspoložive resurse.
Upotreba informacija: U slučaju potpunog ili delimičnog preuzimanja i daljeg korišćenja materijala koji se nalazi na sajtu, potrebno je navesti link odgovarajuće stranice na sajtu kompanije TeleTrade-a kao izvora informacija. Upotreba materijala na internetu mora biti praćena hiper linkom do web stranice teletrade.org. Automatski uvoz materijala i informacija sa stranice je zabranjen.
Ako imate bilo kakvih pitanja, obratite nam se pr@teletrade.global.
транcфери