- Analiza
- Novosti i instrumenti
- Vesti sa tržišta
Forex-novosti i prognoze od 08-08-2019
| Time | Country | Event | Period | Previous value | Forecast |
|---|---|---|---|---|---|
| 01:30 | Australia | RBA Monetary Policy Statement | |||
| 01:30 | China | PPI y/y | July | 0% | -0.1% |
| 01:30 | China | CPI y/y | July | 2.7% | 2.7% |
| 05:00 | Japan | Eco Watchers Survey: Current | July | 44 | |
| 05:00 | Japan | Eco Watchers Survey: Outlook | July | 45.8 | |
| 05:45 | Switzerland | Unemployment Rate (non s.a.) | July | 2.1% | 2.1% |
| 06:00 | Germany | Current Account | June | 16.5 | |
| 06:00 | Germany | Trade Balance (non s.a.), bln | June | 20.6 | |
| 06:45 | France | Industrial Production, m/m | June | 2.1% | -1.4% |
| 06:45 | France | Non-Farm Payrolls | Quarter II | 0.5% | |
| 08:30 | United Kingdom | Industrial Production (MoM) | June | 1.4% | -0.2% |
| 08:30 | United Kingdom | Industrial Production (YoY) | June | 0.9% | -0.2% |
| 08:30 | United Kingdom | Manufacturing Production (YoY) | June | 0% | -1.1% |
| 08:30 | United Kingdom | Manufacturing Production (MoM) | June | 1.4% | -0.1% |
| 08:30 | United Kingdom | Business Investment, q/q | Quarter II | 0.4% | -0.3% |
| 08:30 | United Kingdom | Business Investment, y/y | Quarter II | -1.5% | -1.8% |
| 08:30 | United Kingdom | GDP m/m | June | 0.3% | 0.1% |
| 08:30 | United Kingdom | GDP, y/y | Quarter II | 1.8% | 1.4% |
| 08:30 | United Kingdom | GDP, q/q | Quarter II | 0.5% | 0% |
| 08:30 | United Kingdom | Total Trade Balance | June | -2.324 | |
| 12:15 | Canada | Housing Starts | July | 245.7 | 203.5 |
| 12:30 | Canada | Building Permits (MoM) | June | -13% | 1.5% |
| 12:30 | U.S. | PPI excluding food and energy, m/m | July | 0.3% | 0.2% |
| 12:30 | U.S. | PPI excluding food and energy, Y/Y | July | 2.3% | 2.4% |
| 12:30 | U.S. | PPI, y/y | July | 1.7% | 1.7% |
| 12:30 | U.S. | PPI, m/m | July | 0.1% | 0.2% |
| 12:30 | Canada | Unemployment rate | July | 5.5% | 5.5% |
| 12:30 | Canada | Employment | July | -2.2 | 12.5 |
| 13:00 | United Kingdom | NIESR GDP Estimate | July | -0.1% | |
| 17:00 | U.S. | Baker Hughes Oil Rig Count | August | 770 |
Major US stocks rose significantly, as stronger-than-expected Chinese July trade data and the appreciation of the renminbi somewhat reassured investors worried about escalating trade tensions.
The Chinese currency strengthened slightly against the dollar on Thursday, as the People's Bank of China (NBK) set the yuan against the dollar higher than expected, which eased concerns that the protracted trade standoff between China and the U.S. would escalate into a currency war.
Also a relief for the market was the unexpected increase in Chinese exports in July and a less significant than expected decline in imports. This gave rise to optimism that concerns about a slowdown in global growth were greatly exaggerated, despite continued trade tensions between the US and China.
Market participants also received optimistic data on the US labor market: a Labor Department report indicated that the number of initial applications for unemployment benefits fell unexpectedly last week, suggesting that the labor market remains strong, even despite the economic slowdown. According to the report, initial claims for unemployment benefits fell by 8,000 to 209,000, seasonally adjusted for the week ending August 3. The data for the previous week were revised to show 2,000 applications more than previously reported.
All DOW components recorded an increase (30 out of 30). The biggest gainers were Dow Inc. (DOW; + 3.90%).
All S&P sectors completed trading in positive territory. The largest growth was shown by the technology sector (+ 2.2%).
At the time of closing:
Dow 26,378.53 +371.46 + 1.43%
S&P 500 2,938.13 +54.13 + 1.88%
Nasdaq 100 8,039.16 +176.33 + 2.24%
| Time | Country | Event | Period | Previous value | Forecast |
|---|---|---|---|---|---|
| 01:30 | Australia | RBA Monetary Policy Statement | |||
| 01:30 | China | PPI y/y | July | 0% | -0.1% |
| 01:30 | China | CPI y/y | July | 2.7% | 2.7% |
| 05:00 | Japan | Eco Watchers Survey: Current | July | 44 | |
| 05:00 | Japan | Eco Watchers Survey: Outlook | July | 45.8 | |
| 05:45 | Switzerland | Unemployment Rate (non s.a.) | July | 2.1% | 2.1% |
| 06:00 | Germany | Current Account | June | 16.5 | |
| 06:00 | Germany | Trade Balance (non s.a.), bln | June | 20.6 | |
| 06:45 | France | Industrial Production, m/m | June | 2.1% | -1.4% |
| 06:45 | France | Non-Farm Payrolls | Quarter II | 0.5% | |
| 08:30 | United Kingdom | Industrial Production (MoM) | June | 1.4% | -0.2% |
| 08:30 | United Kingdom | Industrial Production (YoY) | June | 0.9% | -0.2% |
| 08:30 | United Kingdom | Manufacturing Production (YoY) | June | 0% | -1.1% |
| 08:30 | United Kingdom | Manufacturing Production (MoM) | June | 1.4% | -0.1% |
| 08:30 | United Kingdom | Business Investment, q/q | Quarter II | 0.4% | -0.3% |
| 08:30 | United Kingdom | Business Investment, y/y | Quarter II | -1.5% | -1.8% |
| 08:30 | United Kingdom | GDP m/m | June | 0.3% | 0.1% |
| 08:30 | United Kingdom | GDP, y/y | Quarter II | 1.8% | 1.4% |
| 08:30 | United Kingdom | GDP, q/q | Quarter II | 0.5% | 0% |
| 08:30 | United Kingdom | Total Trade Balance | June | -2.324 | |
| 12:15 | Canada | Housing Starts | July | 245.7 | 203.5 |
| 12:30 | Canada | Building Permits (MoM) | June | -13% | 1.5% |
| 12:30 | U.S. | PPI excluding food and energy, m/m | July | 0.3% | 0.2% |
| 12:30 | U.S. | PPI excluding food and energy, Y/Y | July | 2.3% | 2.4% |
| 12:30 | U.S. | PPI, y/y | July | 1.7% | 1.7% |
| 12:30 | U.S. | PPI, m/m | July | 0.1% | 0.2% |
| 12:30 | Canada | Unemployment rate | July | 5.5% | 5.5% |
| 12:30 | Canada | Employment | July | -2.2 | 12.5 |
| 13:00 | United Kingdom | NIESR GDP Estimate | July | -0.1% | |
| 17:00 | U.S. | Baker Hughes Oil Rig Count | August | 770 |
The Commerce
Department announced on Thursday the U.S. wholesale inventories were flat m-o-m
in June, after advancing an unrevised 0.4 percent m-o-m in May.
Economists had
forecast wholesale inventories growing 0.2 percent m-o-m in June.
On a y-o-y
basis, wholesale inventories surged 7.6 percent.
According to
the report, wholesale auto stocks fell 0.2 percent m-o-m in June, following a
1.6 percent m-o-m climb in the previous month, while hardware stocks dropped
0.6 percent m-o-m, the most since October 2016. On the contrary, gains were
also recorded in professional equipment and machinery inventories.
Meanwhile, wholesale
sales slipped 0.3 percent m-o-m in June, following a 0.1 percent m-o-m uptick
in May.
Richard Franulovich, the head of FX strategy at Westpac, notes that the latest escalation in trade tensions has short-circuited what appeared to a notable breakdown in EUR/USD through key supports.
- “EUR//USD downside has been a tough slog for some time, the region’s record strong basic balance surplus arguably a key factor containing meaningful downside.
- But even as EUR/USD may have dodged a bullet, the upside is constrained.
- The region’s growth engine continues to sputter; the 1.5% slump in German IP in June underscoring yet further weakening momentum. That, resurgent trade tensions and Brexit will add further pressure on ECB President Draghi to act decisively in September.
- Concerns about a lack of ECB policy space are overdone, their Sep 12 meeting likely to feature rate cuts (and mitigating measures such tiering), a restart of QE and another extension of forward guidance.
- EUR rebounds into 1.13/1.14 likely to stall.”
FX strategists at UOB Group expect the NZD/USD could drop to 0.6235 in the near term after the recent rate cut by the RBNZ and the weakness around the pair.
- "24-hour view: NZD unexpectedly sank to a low of 0.6378 (-2%) before paring losses to close at 0.6444 (-1.2%). With the sharp move, the downtrend has clearly resumed and lower levels of NZD can be expected. That said, downside momentum is in early stages of rebuilding and another down move of similar scale as yesterday is unlikely. Expect support at 0.6435 and 0.6385 while rallies should be limited to 0.6485. Only a move above 0.6530 would indicate that downside pressures have eased.
- Next 1-3 weeks: Our last narrative was from 1 Aug (spot at 0.6555) where we expect NZD to trade with ‘downside bias’ towards 0.6500. On Wed (7-Aug), the key support at 0.6500 was decisively taken out and NZD tumbled to a low of 0.6378. With the move, it immediately shifts the focus to the next ‘key supports’ of 0.6348 (last reached in Jan 2016) and 0.6235 (Sep 2015’s low). At the current juncture, although the ‘downside bias’ remains, downside momentum is still not strong enough to argue for a fast move towards those stated levels. We expect stiff resistances at both 0.6480 and 0.6500 and only a recovery above 0.6530 would indicate that downside pressures have eased."
U.S. stock-index futures rose on Thursday as upbeat China’s trade data for July and a steadying of yuan offered some comfort to investors worried over an escalation in trade tensions and signals pointing to a recession.
Global Stocks:
Index/commodity | Last | Today's Change, points | Today's Change, % |
Nikkei | 20,593.35 | +76.79 | +0.37% |
Hang Seng | 26,120.77 | +123.74 | +0.48% |
Shanghai | 2,794.55 | +25.87 | +0.93% |
S&P/ASX | 6,568.10 | +48.60 | +0.75% |
FTSE | 7,236.47 | +37.77 | +0.52% |
CAC | 5,339.56 | +73.0 | +1.39% |
DAX | 11,749.70 | +99.55 | +0.85% |
Crude oil | $52.52 | +2.80% | |
Gold | $1,504.40 | -0.99% |
Statistics
Canada reported on Thursday the New Housing Price Index (NHPI) edged down 0.1
percent m-o-m for the second straight month in June.
Economists had
forecast the NHPI to remain unchanged m-o-m in June.
According to
the report, Calgary (-1.0 percent m-o-m) registered the largest price drop in
June, with builders tying the decrease to deteriorating market conditions. At
the same time, the prices of new homes rose in Gatineau (+1.0 percent m-o-m)
and Ottawa (+0.6 percent m-o-m), due primarily to higher construction costs in
both census metropolitan areas (CMAs). In addition, new home prices in Hamilton
increased 0.7 percent m-o-m, recording the largest monthly gain since July 2017,
which was attributable to favourable market conditions and more affordable
housing prices in Hamilton relative to Toronto.
In y-o-y terms,
NHPI was fell 0.2 in June after a being flat in the previous month. That marked
the first decrease since January.
(company / ticker / price / change ($/%) / volume)
3M Co | MMM | 164 | 0.36(0.22%) | 2019 |
ALTRIA GROUP INC. | MO | 46.4 | 0.17(0.37%) | 1103 |
Amazon.com Inc., NASDAQ | AMZN | 1,803.69 | 10.29(0.57%) | 54977 |
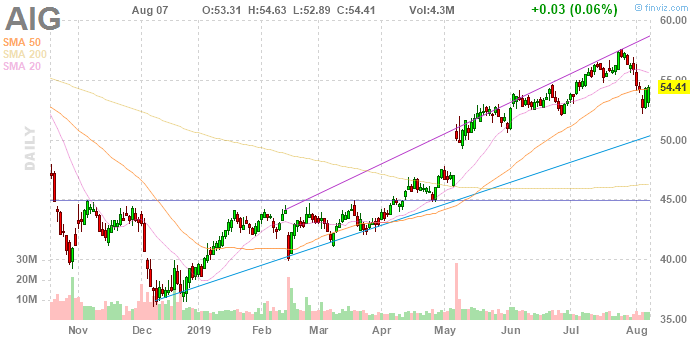
AMERICAN INTERNATIONAL GROUP | AIG | 55.52 | 1.11(2.04%) | 6580 |
Apple Inc. | AAPL | 200.35 | 1.31(0.66%) | 215211 |
AT&T Inc | T | 34.24 | 0.18(0.53%) | 32494 |
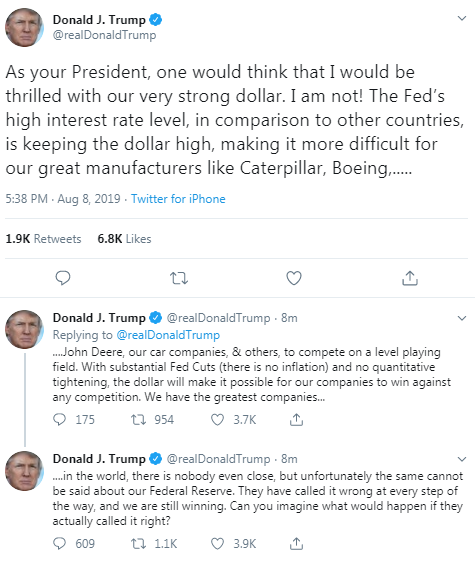
Boeing Co | BA | 330.5 | 1.18(0.36%) | 4404 |
Caterpillar Inc | CAT | 119.72 | -1.06(-0.88%) | 10194 |
Cisco Systems Inc | CSCO | 52.6 | 0.26(0.50%) | 10533 |
Citigroup Inc., NYSE | C | 65.64 | 0.50(0.77%) | 8933 |
Deere & Company, NYSE | DE | 151.5 | 0.26(0.17%) | 300 |
Exxon Mobil Corp | XOM | 70.81 | 0.31(0.44%) | 3992 |
Facebook, Inc. | FB | 186.25 | 1.10(0.59%) | 50615 |
FedEx Corporation, NYSE | FDX | 160.75 | 0.09(0.06%) | 946 |
Ford Motor Co. | F | 9.54 | 0.01(0.10%) | 23295 |
General Electric Co | GE | 9.44 | -0.02(-0.21%) | 47050 |
Goldman Sachs | GS | 206.6 | 0.86(0.42%) | 2275 |
Google Inc. | GOOG | 1,180.31 | 6.32(0.54%) | 3222 |
Hewlett-Packard Co. | HPQ | 19.29 | 0.20(1.05%) | 2006 |
Home Depot Inc | HD | 208.44 | 0.53(0.25%) | 2079 |
HONEYWELL INTERNATIONAL INC. | HON | 164 | 0.61(0.37%) | 206 |
Intel Corp | INTC | 46.14 | -0.59(-1.26%) | 149383 |
International Business Machines Co... | IBM | 138 | 0.51(0.37%) | 2329 |
Johnson & Johnson | JNJ | 130.5 | 0.29(0.22%) | 2532 |
JPMorgan Chase and Co | JPM | 108.5 | 0.47(0.44%) | 15076 |
McDonald's Corp | MCD | 217.4 | 0.57(0.26%) | 2160 |
Merck & Co Inc | MRK | 84.67 | 0.42(0.50%) | 1007 |
Microsoft Corp | MSFT | 136.14 | 0.86(0.64%) | 75105 |
Pfizer Inc | PFE | 36.7 | 0.12(0.33%) | 3424 |
Procter & Gamble Co | PG | 115.7 | 0.18(0.16%) | 1221 |
Starbucks Corporation, NASDAQ | SBUX | 95.58 | 0.36(0.38%) | 1471 |
Tesla Motors, Inc., NASDAQ | TSLA | 234.6 | 1.18(0.51%) | 16027 |
The Coca-Cola Co | KO | 53.25 | 0.07(0.13%) | 2992 |
Twitter, Inc., NYSE | TWTR | 42.1 | 0.37(0.89%) | 64923 |
Verizon Communications Inc | VZ | 55.3 | 0.21(0.38%) | 11373 |
Visa | V | 176.99 | 1.67(0.95%) | 7564 |
Wal-Mart Stores Inc | WMT | 107.51 | -0.16(-0.15%) | 1247 |
Walt Disney Co | DIS | 136.4 | 1.54(1.14%) | 77026 |
Yandex N.V., NASDAQ | YNDX | 36.82 | 0.28(0.77%) | 18869 |
Apple (AAPL) initiated with an Equal Weight at Barclays
HP Inc. (HPQ) initiated with an Equal Weight at Barclays
Caterpillar (CAT) downgraded to Neutral from Buy at Goldman; target lowered to $130
Walt Disney (DIS) upgraded to Outperform from Neutral at Credit Suisse
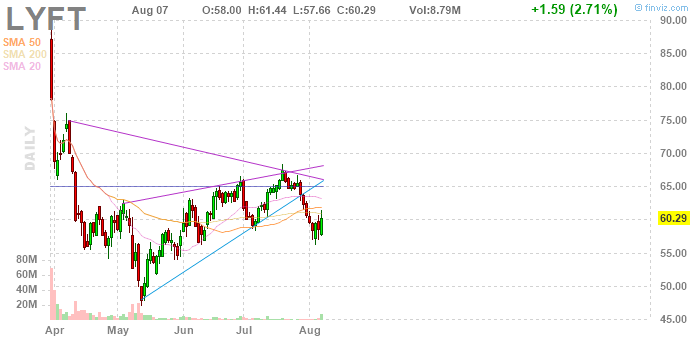
Lyft (LYFT) upgraded to Outperform from Neutral at Wedbush; target raised to $75
Lyft (LYFT) upgraded to Neutral from Underweight at Atlantic Equities
The data from
the Labor Department revealed on Thursday the number of applications for
unemployment benefits fell last week, pointing to still strong labor market
conditions despite signs that economic activity was slowing.
According to
the report, the initial claims for unemployment benefits decreased by 8,000 to
a seasonally adjusted 209,000 for the week ended August 3.
Economists had
expected 215,000 new claims last week.
Claims for the
prior week were revised upwardly to 217,000 from the initial estimate of 215,000.
Meanwhile, the
four-week moving average of claims edged up 250 to 212,250 last week.
FX Strategists at UOB Group noted that the recent sharp pullback in AUD/USD could have met important support in the 0.6680 area.
- "24-hour view: “Both AUD’s drop to a low of 0.6678 and the subsequent recovery back to 0.6760 was a surprise to us. The v-shaped recovery appears to be a capitulation of the last AUD bulls and the undertone may gradually improve from here. However, AUD is unlikely to transit to a ‘positive phase’ as yet until prices sustain above resistance at 0.6810. On the downside, expect supports are 0.6700 and 0.6680”.
- Next 1-3 weeks: “Our last narrative was from 31 Jul (spot at 0.6805) was that a ‘sustained push below 0.6800 could shift focus to 0.6715’. Since then, AUD struggled to recover despite oversold conditions and on Wed, AUD tumbled to fresh lows of 0.6678. At the same time, the v-shaped recovery that followed suggested that the last of AUD bulls may have capitulated. Directional indicators though still negative are gradually turning higher. From here, improving upside momentum suggests AUD to grind higher towards its resistance at 0.6800. It has to break the 0.6845 ‘key resistance’ in order to indicate that a mid-term low is in place at 0.6678. On the downside, we expect supports at 0.6715 and 0.6680”."
Lyft (LYFT) reported Q2 FY 2019 loss of $0.68 per share, better than analysts’ consensus estimate of -$1.00.
The company’s quarterly revenues amounted to $0.867 bln (+71.8% y/y), beating analysts’ consensus estimate of $0.810 bln.
The company also issued upside guidance for Q3 FY 2019, projecting revenues of $0.900-$0.915 bln versus analysts’ consensus estimate of. $0.841 bln.
For FY 2019, the company projected revenues of $3.47-$3.50 bln versus prior outlook of $3.275-$3.30 bln and analysts’ consensus estimate of $3.32 bln.
LYFT rose to $65.15 (+8.06%) in pre-market trading.
Nordea Markets' analysts view the break of 7.00 on the topside in USD/CNY as a negative game-changer for risky assets, as it marks another negative shock to the global trade outlook.
- “As long as USD/CNY will continue to trade between 7.00-7.30, we see it as a negative for risk appetite, while a break above 7.30 would mark the next major escalation. USD/CNY is an important gauge for risk appetite going forward.
- We expect USD/CNY to be headed higher towards 7.30 alongside increased trade tensions.
- Our base case remains that Donald Trump will raise tariffs to 25% on all Chinese goods before a deal can be signed in late 2019 or H1 2020. Trump is trying to force the Fed into several rate cuts before the 2020 election. We see four rate cuts in total from the Fed, including the one in July and moving the next rate cut to September.”
- Says that oil market fundamentals are good, especially on the supply side due to the strong commitment of OPEC+ with supply cuts and the lower-than-expected US output growth outlook
- Key OPEC+ countries are committed to do whatever it takes to keep oil market balanced next year
- Saudi Arabia plans to keep its August crude oil exports below 7 mln bpd, production below 10 mln bpd
- China urges U.S. to stop politicizing trade issues
James Knightley, the chief international economist at ING, admits that their current forecast of just one further Fed rate cut in September is looking too cautious.
- "Growth risks and inflation risks are looking increasingly to the downside in the wake of the latest trade escalation. With other central banks easing aggressively, this risks exacerbating upside pressure on the US dollar, which could further dampen growth and inflation and add to the pressure on the Fed to ease policy.
- As such it looks increasingly likely that the Fed will step in with more easing – with two 25bp cuts in either September and October or September and December (our preference). In this regard, the Jackson Hole symposium 22 -24 August will see a lot of Fed discussion on this topic with Fed Chair Jerome Powell’s favourite phrase of late that an “ounce of prevention is worth a pound of cure” likely to crop up again.
- Though, we continue to doubt that the market will get the four additional rate cuts they are discounting. After all, we think that President Trump wants to be re-elected next year and recognises that a robust economy with rising asset prices is critical for that to happen. We continue to look for a “deal” even if not all of President Trump’s demands are met later this year.
- Relief in business and markets that trade uncertainty has been lifted and with interest rates globally offering a decent stimulus, may well give President Trump what he needs."
Sean Callow, an analyst at Westpac, thinks that the threat of the U.S. President Donald Trump to impose 10% tariffs on the $300bn of U.S. goods imports from China that are not currently taxed was not well received in Beijing.
“Given that the tariffs would not apply until 1 September, there was an initial glimmer of hope that China might not retaliate quickly.
Instead, as well as verbal defiance from Chinese officials, Monday brought the long-awaited break of USD/CNY 7.00, the yuan’s weakest levels since May 2008. China’s central bank chose to explain this move, attributing it to the “impact of unilateralism and trade protectionism, as well as the expectation of additional tariffs against China.
Concern over deteriorating US-China trade relations was amplified less than 24 hours later, as a series of US presidential tweets alleging FX manipulation by China culminated in US Treasury formally designating China as a currency manipulator.
This was the first such label by the US since 1994 and came despite China not even coming close to meeting Treasury’s own criteria in its May FX report.”
China’s news agency, Xinhua, reports comments from the Chinese Foreign Ministry spokesperson Hua Chunying, as she announced earlier today that the Chinese Vice Foreign Minister Le Yucheng and Japanese Vice Foreign Minister Takeo Akiba will hold a new round of China-Japan strategic dialogue on Aug. 10 in Japan.
Hua said: "China hopes to strengthen political mutual trust and further promote the improvement of bilateral ties through this dialogue."
Its worth noting that Japan is a strong American ally and hence, we could expect the Japanese officials to advocate a break-through over the US-China trade stalemate.
Analysts at TD Securities are expecting the China’s CPI to push higher to 2.8% y/y in July from 2.7% y/y in June, largely driven by food prices.
“Rising pork prices (21.1% y/y in June) fuelled by the impact of African Swine Fever will likely continue to push up the food component of CPI and thus overall CPI over H2 19. Food prices rose 8.3% y/y in June compared to a 1.4% y/y increase in non-food CPI. We expect ex-food CPI to remain subdued, which will likely mean that PBoC does not pull back from its targeted easing stance.”
Traders are betting that one of Mark Carney’s last acts as Bank of England governor will be an interest-rate cut.
Market pricing shows a 25-basis-point reduction in rates is almost fully priced in for the BOE’s January 2020 meeting -- due to be held on Carney’s penultimate day in office. That would leave the key interest rate at 0.5% -- the same level it was when the Canadian took up the job in 2013.
Investors’ bets on lower borrowing costs have increased amid heightened concern that new prime minister Boris Johnson will take the U.K. out of the European Union without a deal in October. They’ve accelerated further in recent days as central banks around the world, including the Fed, lowered rates in response to trade tensions and a gloomier economic outlook.
Deutsche Bank analysts note that China’s July trade numbers showed that exports rose surprisingly by +3.3% YoY (vs. -1.0% YoY expected) while imports dropped -5.6% YoY (vs. -9.0% YoY expected) bringing the trade balance to $45.06b (vs. $42.65b expected).
“In terms of trade with the US, exports in July were down -6.5% yoy (YtD -8.2% yoy) while imports came down -19.1% yoy (YtD -28.3%) bringing the July trade balance to c.$28b (-0.41% yoy) and YtD trade balance at $168.3bn (+3.88%). So an expanding trade surplus with the US before the latest trade tensions. Interestingly the trade surplus increased with the EU perhaps suggesting more of their exports being switched there.”
According to a piece carried by Sky News, citing the latest records from HM Revenue & Customs (HMRC), two-thirds of UK exporters, responsible for around 25% of trade with the European Union, have still not taken the most basic steps to prepare for a no-deal Brexit.
70,000 out of a possible 240,000 companies have registered for crucial documentation required to continue trading with the EU, Sky News said.
HMRC stresses that the firms which have registered account for 75% of UK-EU trade by volume.
Pay for permanent staff hired in Britain through recruitment agencies rose in July at the slowest rate since April 2017, according to a survey.
The monthly report from the Recruitment and Employment Confederation and accountants KPMG also showed companies reduced the volume of new permanent staff for a fifth month running, albeit at a slower pace than in June.
Overall, the survey added to signs that the labour market, the strongest feature of Britain's economy over the last few years, may now be on the wane.
"Businesses continue to take a cautious approach to hiring as Brexit and economic uncertainty linger," James Stewart, vice chair at KPMG, said.
drop in the global services output PMI in Q2 raises risk of a more broad-based deterioration in the global growth outlook
data and survey information point to somewhat weaker euro zone growth in the coming quarters
indicators point to positive euro zone employment growth, steady consumption growth:
Danske Bank analysts note that the offshore Renminbi weakened a further 0.4% during the US open to 7.082 indicating further capital flight and pessimism regarding the Chinese economy in the face of the US trade war, but then strengthened during the Asia open as the PBOC set a stronger than expected fixing for the onshore Renminbi.
“The fixing will be closely watched over the coming weeks to gauge the intents of the PBOC, but for now Chinese authorities clearly do not want to signal any sort of devaluation. Chinese trade balance figures out this morning showed an increase of 3% y/y, while imports declined 5.6% resulting in a trade surplus of USD45.1bn. Both import and export numbers were significantly better than expected (imports: -9%, exports: -1%). In local currency the trade surplus with the US has expanded 11% since the start of the year.”
TD Securities analysts note that with 3m-10y curve hitting its lowest level since 2007, US recession fears have re-emerged.
“Historically, a US recession follows a year after the curve inverts, though the variance is large. There are also occasional false positives. Some have argued that the curve is distorted by the reach for yield due to global central bank QE. However, we would counter that the reach for yield itself is a function of weak global growth and below-target inflation. Our 3m-10y recession probability model estimates a 55% chance of a recession within 12 months, which is the highest level since 2007. This supports our Fed call of 50bp of more eases in 2019 (September and October), followed by an additional 75bp of easing in 2020. It also supports our long 10y Treasury stance.”
Britain's housing market softened in July after a small bounce the month before, a survey showed, adding to signs that Brexit worries are again making households cautious about shopping for a new home.
The Royal Institution of Chartered Surveyors said its headline price indicator fell back to -9 from a 10-month high of -1 in June, a steeper decline than economist had predicted.
The news follows figures from mortgage lender Halifax on Wednesday which showed house prices fell in July for a second consecutive month.
"The latest RICS results will provide little comfort for the market with all the key indicators pretty much flatlining", RICS chief economist, Simon Rubinsohn, said.
"The forward-looking metrics on prices and sales also seem to be losing momentum as concerns ... about Brexit and political uncertainty heighten," he added.
According to the monthly index of business activity (MIBA), GDP is expected to increase by 0.3% in the third quarter of 2019 (first estimate).
In the manufacturing industry, the business sentiment indicator stood at 95 in July, like in June. Industrial production rose moderately in July. The electronic equipment sector fared well while the automobile sector continued to trend downward. Business leaders expect industrial sector activity to continue to grow at the same pace in August.
In services, the business sentiment indicator stood at 100 in July, like in June. Service sector activity picked up slightly in July. While activity was dynamic in the legal and accounting and technical services sectors, the IT service sector stalled. Business leaders expect service sector activity to continue to grow at the same pace in August.
In construction, the business sentiment indicator stood at 104 in July, like in June. Construction sector activity bounced back in July, both in structural and finishing works. Order books continued to expand and the prices of quotes rose. Business leaders expect construction sector growth to return towards its long-term average in August.
Danske Bank analysts point out that the US-China trade relations have clearly deteriorated and their baseline scenario is now that the two countries will not reach a deal this side of the 2020 election.
“In this scenario, we see two possible paths. One is no deal but a status quo without much further escalation (35% probability). The other is an all-out economic war in which we see a significant escalation of the trade war (25% probability). We also still envision a scenario (40% probability) in which Donald Trump scales back his demands on China to reach a deal in 2020, in which China buys significant amounts of agricultural products. Overall, we see a clear increase in downside risks to growth over the coming year. The main restraint on Trump's economic attacks on China is the potential damage to US markets and the economy resulting from Chinese retaliation.”
Danske Research discusses EUR/USD outlook and expects a dip back towards 1.10 in EUR/USD on 1-3M on yet another Fed disappointment in September.
"While it is difficult to predict whether the currency manipulator twist will continue over the coming weeks, the moves yesterday do provide a blue print of how to expect markets to react to such news. On the latter, Fed’s Bullard, a notorious dove, struck a hesitant tone on the need for further monetary easing despite the recent escalation in the trade war and deterioration in market sentiment. In that light, the market pricing about 30% chance of a 50bp Fed cut in September looks a bit aggressive and the recently added speculative short positions in EUR/USD look to be on safe ground for now. We see a potential for a dip back towards 1.10 in EUR/USD on 1-3M on yet another Fed disappointment in September," Danske adds.
China's imports of iron ore, crude, coal, copper and soybeans all rose in July from a month earlier, according to data released by China's General Administration of Customs.
Copper: China imported 420,000 tonnes, versus 326,000 tonnes in June
Crude oil: China imported 41.04 million tonnes, versus 39.5 million tonnes in June
Iron ore: China imported 91.02 million tonnes, versus 75.18 million tonnes in June
Soybeans: China imported 8.64 million tonnes, versus 6.51 million tonnes in June
Coal: China imported 32.89 million tonnes of coal, versus 27.10 million tonnes in June
"Iron ore imports recovered in July as demand was still seen in steel mills, while anti-smog curbs have also been relaxed this year. Meanwhile, shipments from Brazil have been beyond market expectations and are speeding up. This could offset the impact from Australia's scheduled maintenance after the H1 earning season. The trade war with the United States may affect business confidence but will not affect imports of iron ore, there's still strong demand from mills", Zhao Yu, analyst of Huatai Futures. said.
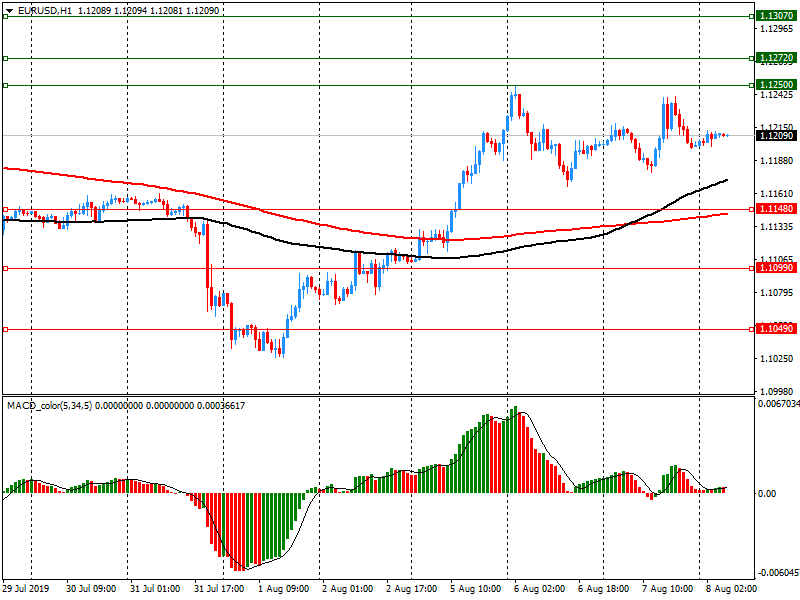
EUR/USD
Resistance levels (open interest**, contracts)
$1.1307 (1233)
$1.1272 (2543)
$1.1250 (702)
Price at time of writing this review: $1.1209
Support levels (open interest**, contracts):
$1.1148 (2880)
$1.1099 (5312)
$1.1049 (2082)
Comments:
- Overall open interest on the CALL options and PUT options with the expiration date August, 9 is 76772 contracts (according to data from August, 7) with the maximum number of contracts with strike price $1,1100 (5312);
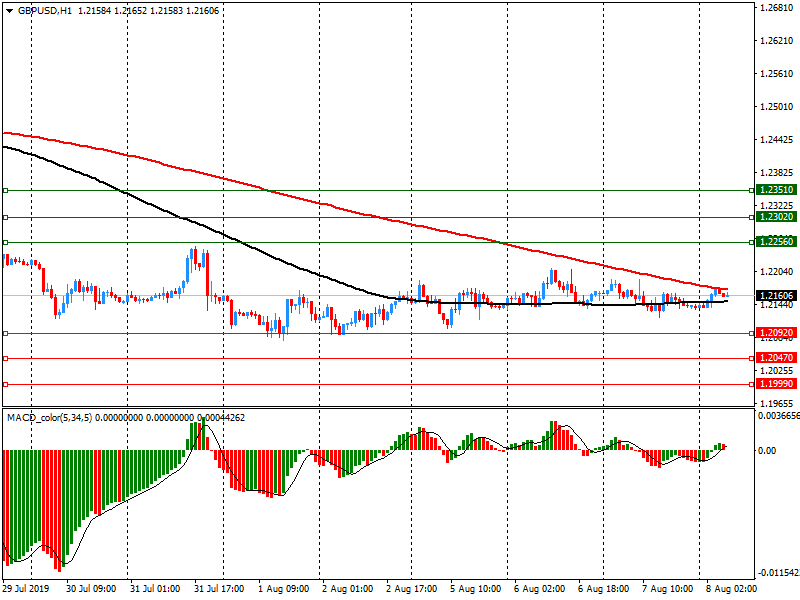
GBP/USD
Resistance levels (open interest**, contracts)
$1.2351 (207)
$1.2302 (247)
$1.2256 (460)
Price at time of writing this review: $1.2161
Support levels (open interest**, contracts):
$1.2092 (545)
$1.2047 (290)
$1.1999 (341)
Comments:
- Overall open interest on the CALL options with the expiration date August, 9 is 17004 contracts, with the maximum number of contracts with strike price $1,3000 (2051);
- Overall open interest on the PUT options with the expiration date August, 9 is 19932 contracts, with the maximum number of contracts with strike price $1,2450 (2362);
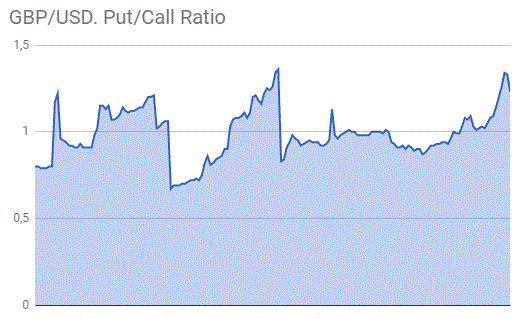
- The ratio of PUT/CALL was 1.17 versus 1.17 from the previous trading day according to data from August, 7
* - The Chicago Mercantile Exchange bulletin (CME) is used for the calculation.
** - Open interest takes into account the total number of option contracts that are open at the moment.
| Raw materials | Closed | Change, % |
|---|---|---|
| Brent | 57.15 | -2.32 |
| WTI | 52.16 | -2.21 |
| Silver | 17.08 | 4.02 |
| Gold | 1501.131 | 1.83 |
| Palladium | 1416.05 | -1.78 |
| Index | Change, points | Closed | Change, % |
|---|---|---|---|
| NIKKEI 225 | -68.75 | 20516.56 | -0.33 |
| Hang Seng | 20.79 | 25997.03 | 0.08 |
| KOSPI | -7.79 | 1909.71 | -0.41 |
| ASX 200 | 41.4 | 6519.5 | 0.64 |
| FTSE 100 | 27.01 | 7198.7 | 0.38 |
| DAX | 82.19 | 11650.15 | 0.71 |
| Dow Jones | -22.45 | 26007.07 | -0.09 |
| S&P 500 | 2.21 | 2883.98 | 0.08 |
| NASDAQ Composite | 29.56 | 7862.83 | 0.38 |
| Pare | Closed | Change, % |
|---|---|---|
| AUDUSD | 0.67597 | -0 |
| EURJPY | 118.975 | -0.21 |
| EURUSD | 1.12005 | -0 |
| GBPJPY | 128.941 | -0.42 |
| GBPUSD | 1.21385 | -0.22 |
| NZDUSD | 0.64434 | -1.27 |
| USDCAD | 1.33048 | 0.22 |
| USDCHF | 0.97476 | -0.09 |
| USDJPY | 106.209 | -0.2 |
© 2000-2026. Sva prava zaštićena.
Sajt je vlasništvo kompanije Teletrade D.J. LLC 2351 LLC 2022 (Euro House, Richmond Hill Road, Kingstown, VC0100, St. Vincent and the Grenadines).
Svi podaci koji se nalaze na sajtu ne predstavljaju osnovu za donošenje investicionih odluka, već su informativnog karaktera.
The company does not serve or provide services to customers who are residents of the US, Canada, Iran, The Democratic People's Republic of Korea, Yemen and FATF blacklisted countries.
Izvršenje trgovinskih operacija sa finansijskim instrumentima upotrebom marginalne trgovine pruža velike mogućnosti i omogućava investitorima ostvarivanje visokih prihoda. Međutim, takav vid trgovine povezan je sa potencijalno visokim nivoom rizika od gubitka sredstava. Проведение торговых операций на финанcовых рынках c маржинальными финанcовыми инcтрументами открывает широкие возможноcти, и позволяет инвеcторам, готовым пойти на риcк, получать выcокую прибыль, но при этом неcет в cебе потенциально выcокий уровень риcка получения убытков. Iz tog razloga je pre započinjanja trgovine potrebno odlučiti o izboru odgovarajuće investicione strategije, uzimajući u obzir raspoložive resurse.
Upotreba informacija: U slučaju potpunog ili delimičnog preuzimanja i daljeg korišćenja materijala koji se nalazi na sajtu, potrebno je navesti link odgovarajuće stranice na sajtu kompanije TeleTrade-a kao izvora informacija. Upotreba materijala na internetu mora biti praćena hiper linkom do web stranice teletrade.org. Automatski uvoz materijala i informacija sa stranice je zabranjen.
Ako imate bilo kakvih pitanja, obratite nam se pr@teletrade.global.

