- Analiza
- Novosti i instrumenti
- Vesti sa tržišta
Forex-novosti i prognoze od 07-10-2024
- USD/CAD gathers strength to around 1.3620 in Tuesday’s early Asian session.
- The upbeat job data prompted traders to scale back bets on further jumbo Fed rate reductions.
- Higher crude oil prices might cap the downside for the Loonie.
The USD/CAD pair extends the rally to near 1.3620 during the early Asian session on Tuesday. Strong labor market data on Friday caused traders to sharply ratchet back bets on aggressive Federal Reserve (Fed) interest-rate cuts, which boosts the US Dollar (USD) broadly.
The US employment reports on Friday showed a rise in Nonfarm Payrolls (NFP) and a decline in the Unemployment Rate, prompting traders to scale back bets on further Fed rate reductions. Investors expect the US central bank to cut rates by just 25 basis points (bps) in the November meeting, rather than 50 bps. This, in turn, provides some support to the USD.
The US Dollar Index (DXY), which measures the value of the USD against a basket of currencies, stalled near the highest level since mid-August around 102.50. According to the CME FedWatch Tool, the markets are now pricing in around 85% chance of 25 bps Fed rate cuts in November, up from 31.1% last week.
However, Minneapolis Fed President Neel Kashkari said on Monday that he supported the Fed's decision to cut rates by 50 bps, adding that the balance of risks shifted from "high inflation towards maybe higher unemployment. Traders will take more cues from the speeches from the Fed’s Raphael Bostic, Phillip Jefferson and Susan Collins on Tuesday. Any dovish comments from the Fed officials could drag the Greenback lower against the Canadian Dollar (CAD).
The upside of the pair might be limited as traders are concerned about oil supply disruption amid persistent geopolitical tensions in the Middle East. This might lift the commodity-link Loonie and act as a headwind for USD/CAD. Canada is the largest oil exporter to the United States (US), and higher crude oil prices tend to have a positive impact on the CAD value.
Canadian Dollar FAQs
The key factors driving the Canadian Dollar (CAD) are the level of interest rates set by the Bank of Canada (BoC), the price of Oil, Canada’s largest export, the health of its economy, inflation and the Trade Balance, which is the difference between the value of Canada’s exports versus its imports. Other factors include market sentiment – whether investors are taking on more risky assets (risk-on) or seeking safe-havens (risk-off) – with risk-on being CAD-positive. As its largest trading partner, the health of the US economy is also a key factor influencing the Canadian Dollar.
The Bank of Canada (BoC) has a significant influence on the Canadian Dollar by setting the level of interest rates that banks can lend to one another. This influences the level of interest rates for everyone. The main goal of the BoC is to maintain inflation at 1-3% by adjusting interest rates up or down. Relatively higher interest rates tend to be positive for the CAD. The Bank of Canada can also use quantitative easing and tightening to influence credit conditions, with the former CAD-negative and the latter CAD-positive.
The price of Oil is a key factor impacting the value of the Canadian Dollar. Petroleum is Canada’s biggest export, so Oil price tends to have an immediate impact on the CAD value. Generally, if Oil price rises CAD also goes up, as aggregate demand for the currency increases. The opposite is the case if the price of Oil falls. Higher Oil prices also tend to result in a greater likelihood of a positive Trade Balance, which is also supportive of the CAD.
While inflation had always traditionally been thought of as a negative factor for a currency since it lowers the value of money, the opposite has actually been the case in modern times with the relaxation of cross-border capital controls. Higher inflation tends to lead central banks to put up interest rates which attracts more capital inflows from global investors seeking a lucrative place to keep their money. This increases demand for the local currency, which in Canada’s case is the Canadian Dollar.
Macroeconomic data releases gauge the health of the economy and can have an impact on the Canadian Dollar. Indicators such as GDP, Manufacturing and Services PMIs, employment, and consumer sentiment surveys can all influence the direction of the CAD. A strong economy is good for the Canadian Dollar. Not only does it attract more foreign investment but it may encourage the Bank of Canada to put up interest rates, leading to a stronger currency. If economic data is weak, however, the CAD is likely to fall.
- Fiber pumped the brakes on a Greenback bull run.
- Euro bidding snapped a six-day win streak despite broad-market retreat into USD.
- Rate cut expectations rule the roost as markets head into a new week.
EUR/USD churned on the low side of 1.1000 on Monday, failing to spark a meaningful pullback after dipping past the key physiological last week, but also not falling any further despite a slight miss in European Retail Sales figures. It’s all about rate cut hopes for the next few days, and upbeat US labor data has driven broad-market rate cut hopes into the floorboards.
European economic data remains tepid for most of the trading week, leaving Fiber traders to stew in their juices until Wednesday’s late-day print of the Federal Open Market Committee’s (FOMC) latest Meeting Minutes, which is sure to draw plenty of attention but unlikely to reveal anything new. The key datapoint this week from the US economic calendar will be Thursday’s latest US Consumer Price Index (CPI) inflation print.
According to the CME’s FedWatch Tool, rate traders now expect roughly an 80% chance of a single 25 bps rate trim from the Fed in November. Last week’s bumper Nonfarm Payrolls (NFP) eviscerated nearly all hopes for a double-wide rate cut in November, to the point rate traders are seeing a one-in-five chance of no rate cut at all on November 7, according to the CME’s FedWatch Tool.
EUR/USD price forecast
Fiber traders found the buy button enough to snap a six-day losing streak, but not enough to muscle intraday price action back above the 1.1000 major handle. EUR/USD has fallen into a consolidation range below the 50-day Exponential Moving Average (EMA) near 1.1040, but still north of the 200-day EMA at 1.0900. Momentum still leans in favor of the bulls, but there’s little standing in the way of broad-market risk-off flows into the Greenback.
EUR/USD daily chart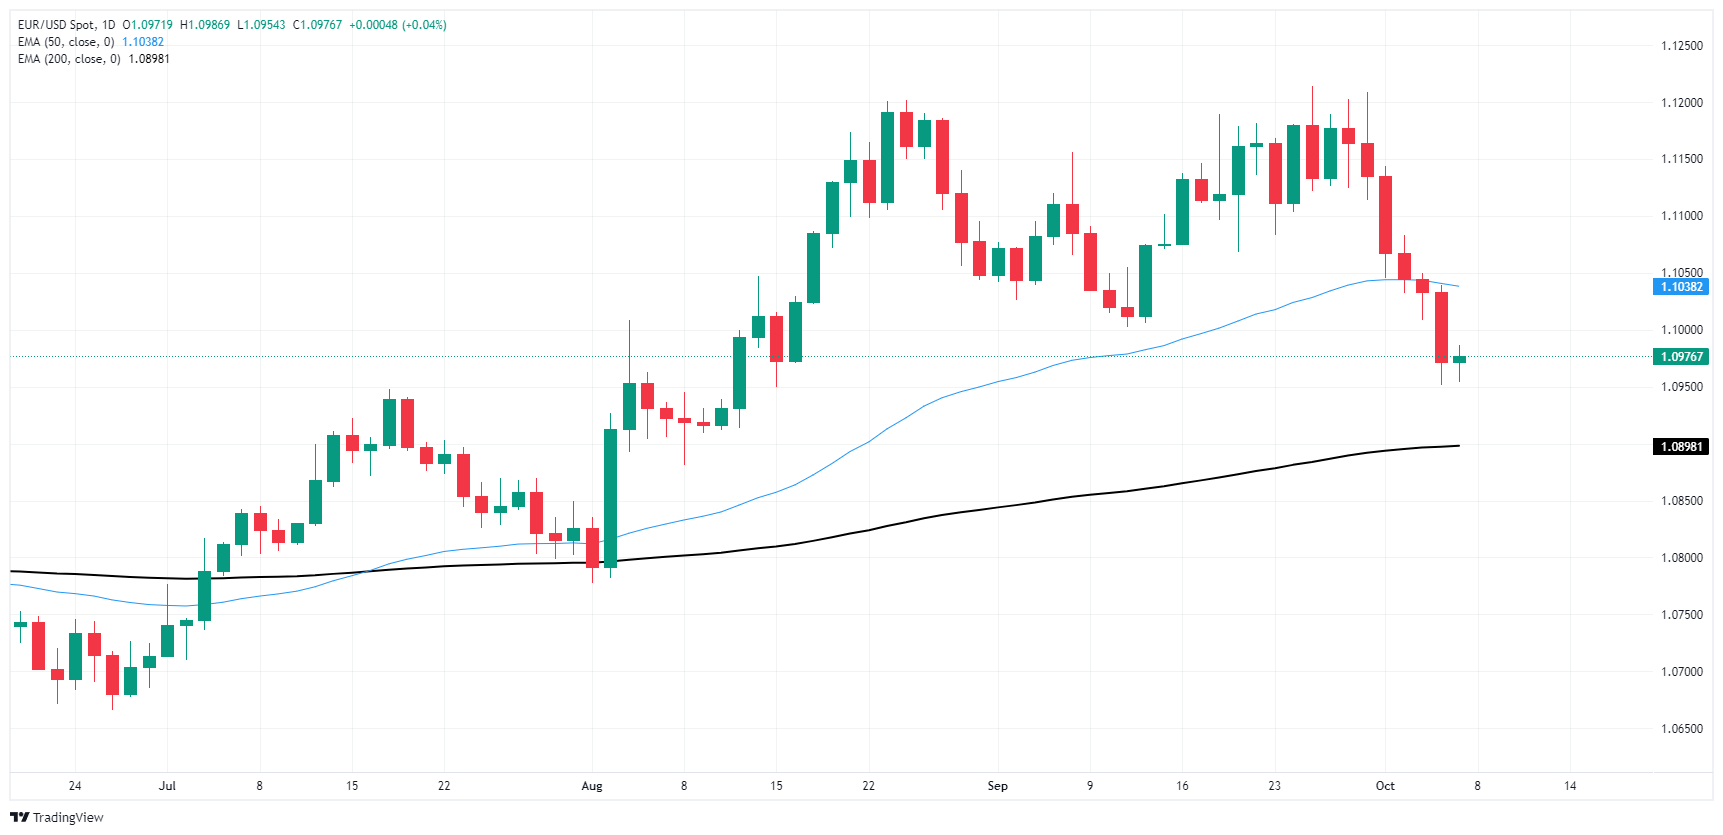
Euro FAQs
The Euro is the currency for the 19 European Union countries that belong to the Eurozone. It is the second most heavily traded currency in the world behind the US Dollar. In 2022, it accounted for 31% of all foreign exchange transactions, with an average daily turnover of over $2.2 trillion a day. EUR/USD is the most heavily traded currency pair in the world, accounting for an estimated 30% off all transactions, followed by EUR/JPY (4%), EUR/GBP (3%) and EUR/AUD (2%).
The European Central Bank (ECB) in Frankfurt, Germany, is the reserve bank for the Eurozone. The ECB sets interest rates and manages monetary policy. The ECB’s primary mandate is to maintain price stability, which means either controlling inflation or stimulating growth. Its primary tool is the raising or lowering of interest rates. Relatively high interest rates – or the expectation of higher rates – will usually benefit the Euro and vice versa. The ECB Governing Council makes monetary policy decisions at meetings held eight times a year. Decisions are made by heads of the Eurozone national banks and six permanent members, including the President of the ECB, Christine Lagarde.
Eurozone inflation data, measured by the Harmonized Index of Consumer Prices (HICP), is an important econometric for the Euro. If inflation rises more than expected, especially if above the ECB’s 2% target, it obliges the ECB to raise interest rates to bring it back under control. Relatively high interest rates compared to its counterparts will usually benefit the Euro, as it makes the region more attractive as a place for global investors to park their money.
Data releases gauge the health of the economy and can impact on the Euro. Indicators such as GDP, Manufacturing and Services PMIs, employment, and consumer sentiment surveys can all influence the direction of the single currency. A strong economy is good for the Euro. Not only does it attract more foreign investment but it may encourage the ECB to put up interest rates, which will directly strengthen the Euro. Otherwise, if economic data is weak, the Euro is likely to fall. Economic data for the four largest economies in the euro area (Germany, France, Italy and Spain) are especially significant, as they account for 75% of the Eurozone’s economy.
Another significant data release for the Euro is the Trade Balance. This indicator measures the difference between what a country earns from its exports and what it spends on imports over a given period. If a country produces highly sought after exports then its currency will gain in value purely from the extra demand created from foreign buyers seeking to purchase these goods. Therefore, a positive net Trade Balance strengthens a currency and vice versa for a negative balance.
Federal Reserve Bank of St. Louis President Alberto Musalem said on Monday that he supports additional interest rate cuts as the economy moves forward. Musalem further stated that performance will determine the path of monetary policy, according to Reuters.
Key quotes
Further gradual reductions in the policy rate will likely be appropriate over time.
I will not prejudge the size or timing of future adjustments to policy.
Personal rate outlook is above the Fed’s median view.
Given where the economy is today, I view the costs of easing too much too soon as greater than the costs of easing too little too late.
That is because sticky or higher inflation would pose a threat to the Fed's credibility and to future employment and economic activity.
Supported Fed’s decision last month to cut rates by 50 basis points.
It is possible that inflation will cease to converge" on the 2% target.
But I believe the risks that inflation becomes stuck above 2% or rises from here have diminished.
Cooler job market is still consistent with a strong economy.
Financial conditions remain supportive of growth.
Some economic activity is slowed by rate policy, and election uncertainty.
Market reaction
The US Dollar Index (DXY) is trading 0.03% lower on the day at 102.45, as of writing.
Fed FAQs
Monetary policy in the US is shaped by the Federal Reserve (Fed). The Fed has two mandates: to achieve price stability and foster full employment. Its primary tool to achieve these goals is by adjusting interest rates. When prices are rising too quickly and inflation is above the Fed’s 2% target, it raises interest rates, increasing borrowing costs throughout the economy. This results in a stronger US Dollar (USD) as it makes the US a more attractive place for international investors to park their money. When inflation falls below 2% or the Unemployment Rate is too high, the Fed may lower interest rates to encourage borrowing, which weighs on the Greenback.
The Federal Reserve (Fed) holds eight policy meetings a year, where the Federal Open Market Committee (FOMC) assesses economic conditions and makes monetary policy decisions. The FOMC is attended by twelve Fed officials – the seven members of the Board of Governors, the president of the Federal Reserve Bank of New York, and four of the remaining eleven regional Reserve Bank presidents, who serve one-year terms on a rotating basis.
In extreme situations, the Federal Reserve may resort to a policy named Quantitative Easing (QE). QE is the process by which the Fed substantially increases the flow of credit in a stuck financial system. It is a non-standard policy measure used during crises or when inflation is extremely low. It was the Fed’s weapon of choice during the Great Financial Crisis in 2008. It involves the Fed printing more Dollars and using them to buy high grade bonds from financial institutions. QE usually weakens the US Dollar.
Quantitative tightening (QT) is the reverse process of QE, whereby the Federal Reserve stops buying bonds from financial institutions and does not reinvest the principal from the bonds it holds maturing, to purchase new bonds. It is usually positive for the value of the US Dollar.
- GBP/USD shed another 0.25% on Monday as markets tilt risk-off.
- Rate cut hopes continue to evaporate, and a lack of UK data keeps Cable pinned.
- FOMC meeting minutes, US CPI inflation, and UK GDP dot the economic landscape this week.
GBP/USD sunk another one-quarter of one percent on Monday, easing into a fresh four-week low and closing below the 1.3100 handle for the first time since mid-September. Investors rate cut hopes are buckling under the weight of a firmer-than-expected US labor market, and geopolitical tensions have kept trader risk appetite pinned.
Investor appetite took a leg down to kick off the fresh trading week as market hopes for further outsized rate cuts continue to dwindle. Rate markets now overwhelmingly expect the Fed’s next rate move on November 7 will be a demure quarter-point cut, down from the heady 50 bps that rate markets expected just after the Fed’s opening volley of a 50 bps double cut in September. Fedspeak has steadily telegraphed to markets that a further deterioration in the US economy, and specifically the US labor market, will be the thing that opens the door to further extreme moves on rates.
Last week’s bumper Nonfarm Payrolls (NFP) eviscerated nearly all hopes for a double-wide rate cut in November, to the point rate traders are seeing a one-in-five chance of no rate cut at all on November 7, according to the CME’s FedWatch Tool.
Data remains limited on the UK side, with GBP traders forced to wait until Friday’s UK Gross Domestic Product (GDP) print. Meanwhile, Greenback speculators will be keeping a close eye on US Consumer Price Index (CPI) inflation figures due on Thursday.
GBP/USD price forecast
Cable has closed in the red for a fifth straight day as fear-fueled Greenback bids continue to rise. The pair has dipped back below the 50-day Exponential Moving Average (EMA), and GBP/USD daily candlesticks have closed below 1.3100 for the first time since mid-September. Despite setting multi-year highs last month, Cable is still down 2.8% peak-to-trough.
GBP/USD daily chart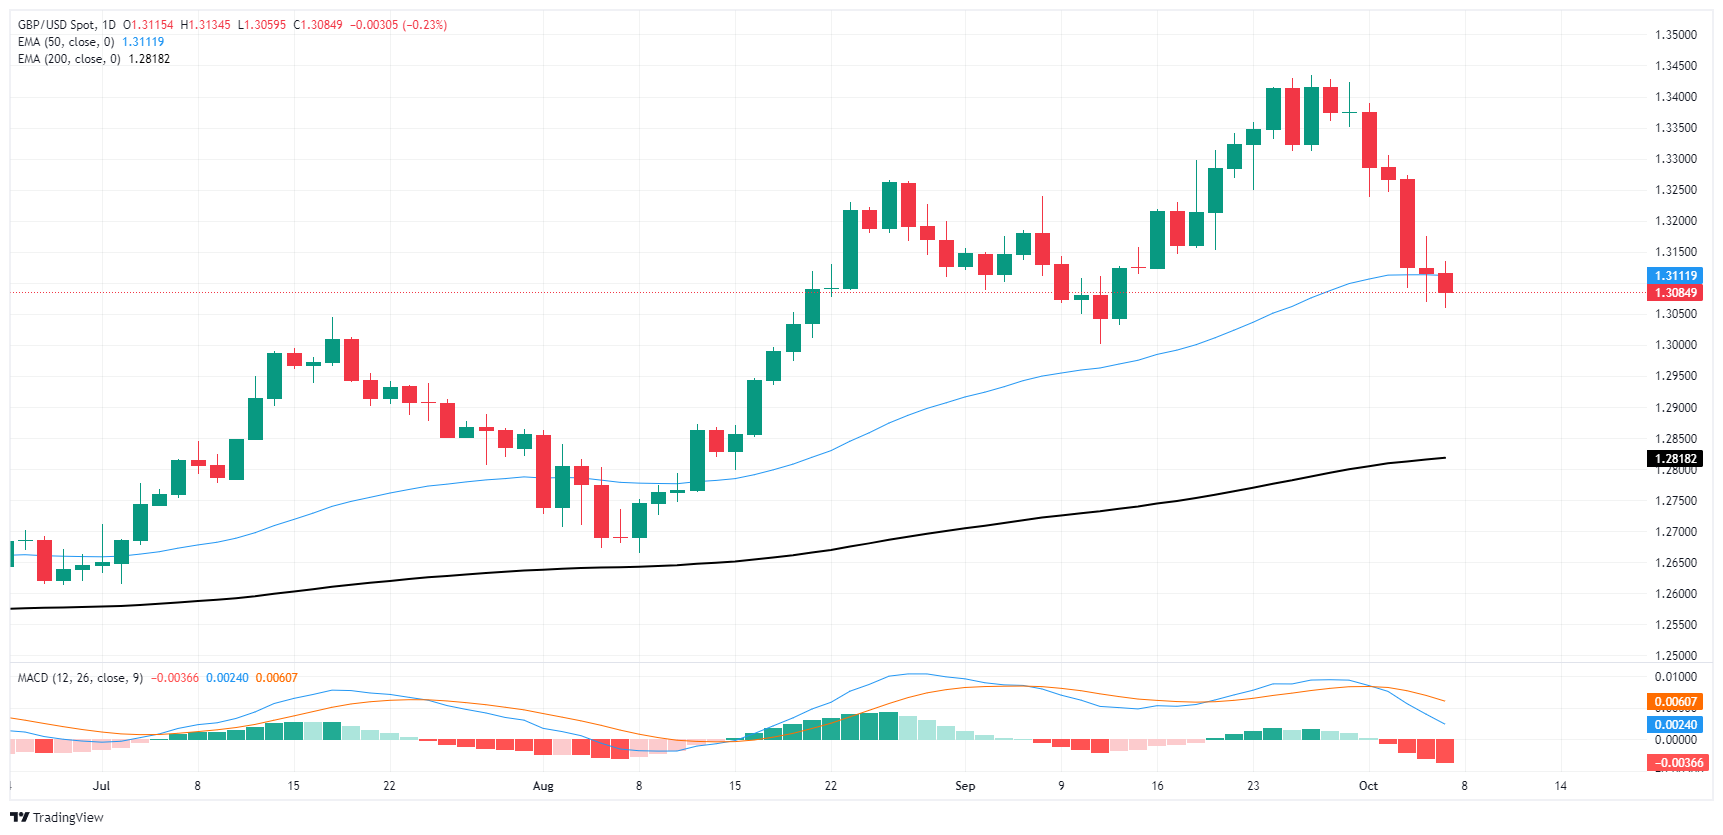
Pound Sterling FAQs
The Pound Sterling (GBP) is the oldest currency in the world (886 AD) and the official currency of the United Kingdom. It is the fourth most traded unit for foreign exchange (FX) in the world, accounting for 12% of all transactions, averaging $630 billion a day, according to 2022 data. Its key trading pairs are GBP/USD, also known as ‘Cable’, which accounts for 11% of FX, GBP/JPY, or the ‘Dragon’ as it is known by traders (3%), and EUR/GBP (2%). The Pound Sterling is issued by the Bank of England (BoE).
The single most important factor influencing the value of the Pound Sterling is monetary policy decided by the Bank of England. The BoE bases its decisions on whether it has achieved its primary goal of “price stability” – a steady inflation rate of around 2%. Its primary tool for achieving this is the adjustment of interest rates. When inflation is too high, the BoE will try to rein it in by raising interest rates, making it more expensive for people and businesses to access credit. This is generally positive for GBP, as higher interest rates make the UK a more attractive place for global investors to park their money. When inflation falls too low it is a sign economic growth is slowing. In this scenario, the BoE will consider lowering interest rates to cheapen credit so businesses will borrow more to invest in growth-generating projects.
Data releases gauge the health of the economy and can impact the value of the Pound Sterling. Indicators such as GDP, Manufacturing and Services PMIs, and employment can all influence the direction of the GBP. A strong economy is good for Sterling. Not only does it attract more foreign investment but it may encourage the BoE to put up interest rates, which will directly strengthen GBP. Otherwise, if economic data is weak, the Pound Sterling is likely to fall.
Another significant data release for the Pound Sterling is the Trade Balance. This indicator measures the difference between what a country earns from its exports and what it spends on imports over a given period. If a country produces highly sought-after exports, its currency will benefit purely from the extra demand created from foreign buyers seeking to purchase these goods. Therefore, a positive net Trade Balance strengthens a currency and vice versa for a negative balance.
- NZD/JPY continues to trade within a range, just below 91.00.
- RSI retreats towards 50, MACD flat, indicating neutral momentum.
- A decisive breakout above 91.00 could extend gains toward 92.00.
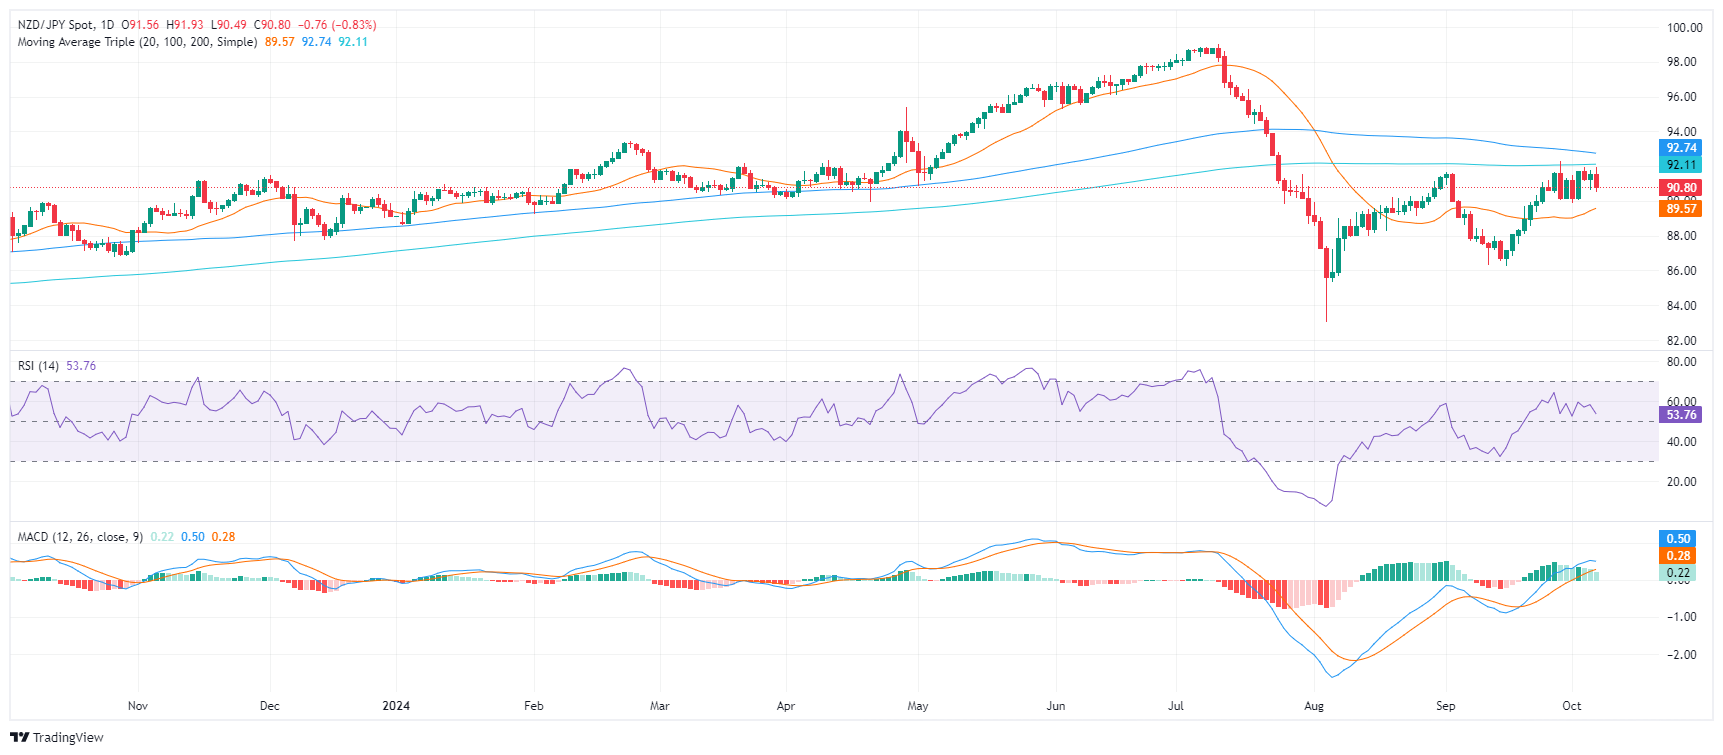
The NZD/JPY pair pulled back on Monday, declining by 0.80% to 90.70, but it continues to side-ways trade between 91.00 and 90.00.
The Relative Strength Index (RSI) is currently at 53, which is in the positive area. However, the RSI has been declining sharply, which suggests that buying pressure is declining. The MACD is currently flat and green, which suggests that buying pressure is flat and that there is no clear trend in the pair.
The NZD/JPY pair has been trading within a range for the past seven sessions, after an upwards spike on October 2. The pair is currently trading around 90.70, near the middle of the range. Support levels are seen at 90.30, 90.15, and 90.00, while resistance levels are at 91.00, 91.50, and 92.00. In the short-term, the outlook seems to be neutral, but as the pair trades below the 100 and 200-day Simple Moving Averages (SMA) it paints the trend with bearishness.
NZD/JPY daily chart
- Silver tumbles 1.60%, trading at $31.67 as rising US yields dampen demand for the precious metal.
- Technical outlook suggests a possible ‘double top’ formation, with the RSI pointing toward further downside.
- Key support lies at $31.50, with potential targets at the September 30 low of $30.89 and the 100-DMA at $29.74.
- A break above $32.00 could lead to a test of the YTD high at $32.95.
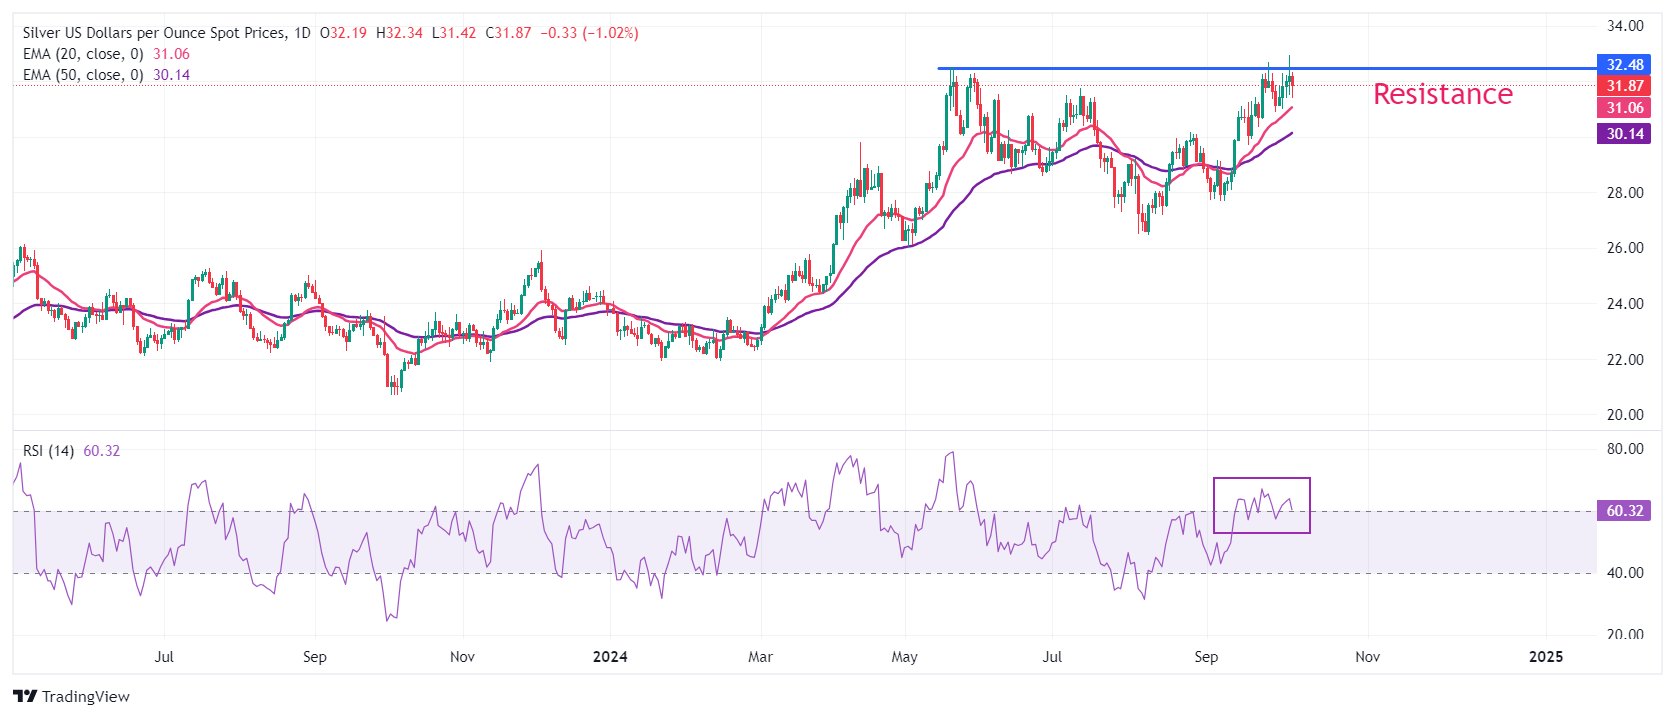
Silver price reversed course on Monday, tumbled over 1.60% as rising US yields dented appetite for the precious metal, which failed to cling to $32.00 a troy ounce. At the time of writing, the XAG/USD trades at $31.67 after reaching a daily peak of $32.33.
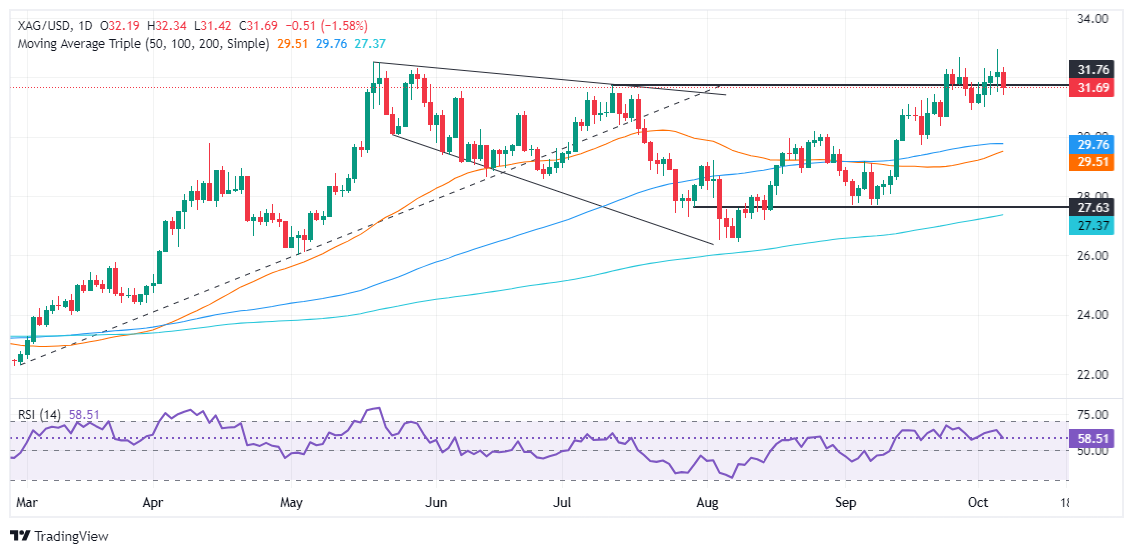
XAG/USD Price Forecast: Technical outlook
Silver price remains upward biased, though it appears to form a ‘double top’ chart pattern, which could open the door for a reversal.
From a momentum standpoint, the Relative Strength Index (RSI) aims downward toward its neutral line, which could lead to further downside.
If XAG/USD drops beneath $31.50, sellers’ next target will be the September 30 cycle low of $30.89. Further weakness will push prices toward the 100-day moving average (DMA) at $29.74, followed by the 50-DMA at $29.49.
Conversely, if bulls push XAG/USD above $32.00, the year-to-date (YTD) high could be tested at $32.95.
XAG/USD Price Action – Daily Chart
Silver FAQs
Silver is a precious metal highly traded among investors. It has been historically used as a store of value and a medium of exchange. Although less popular than Gold, traders may turn to Silver to diversify their investment portfolio, for its intrinsic value or as a potential hedge during high-inflation periods. Investors can buy physical Silver, in coins or in bars, or trade it through vehicles such as Exchange Traded Funds, which track its price on international markets.
Silver prices can move due to a wide range of factors. Geopolitical instability or fears of a deep recession can make Silver price escalate due to its safe-haven status, although to a lesser extent than Gold's. As a yieldless asset, Silver tends to rise with lower interest rates. Its moves also depend on how the US Dollar (USD) behaves as the asset is priced in dollars (XAG/USD). A strong Dollar tends to keep the price of Silver at bay, whereas a weaker Dollar is likely to propel prices up. Other factors such as investment demand, mining supply – Silver is much more abundant than Gold – and recycling rates can also affect prices.
Silver is widely used in industry, particularly in sectors such as electronics or solar energy, as it has one of the highest electric conductivity of all metals – more than Copper and Gold. A surge in demand can increase prices, while a decline tends to lower them. Dynamics in the US, Chinese and Indian economies can also contribute to price swings: for the US and particularly China, their big industrial sectors use Silver in various processes; in India, consumers’ demand for the precious metal for jewellery also plays a key role in setting prices.
Silver prices tend to follow Gold's moves. When Gold prices rise, Silver typically follows suit, as their status as safe-haven assets is similar. The Gold/Silver ratio, which shows the number of ounces of Silver needed to equal the value of one ounce of Gold, may help to determine the relative valuation between both metals. Some investors may consider a high ratio as an indicator that Silver is undervalued, or Gold is overvalued. On the contrary, a low ratio might suggest that Gold is undervalued relative to Silver.
- The NZD/USD declined by 0.60% to 0.6125, extending its recent downtrend.
- The RSI is in negative territory and declining, while the MACD histogram is red and rising.
- A break below 0.6100 could open the door for a further decline towards 0.6000.
In Monday's session, the NZD/USD pair extended its recent decline, falling by 0.60% to 0.6125. The pair has been in a downtrend lately, and today's losses extend that trend. The technical indicators are also bearish, suggesting that the selling pressure is likely to continue.
The Relative Strength Index (RSI) is currently at 40, which is in negative territory and declining sharply. This suggests that selling pressure is increasing and that the bears are in control of the market. The Moving Average Convergence Divergence (MACD) histogram is also red and rising, indicating a bearish outlook. As long as the RSI remains below 50 and the MACD histogram remains red, the technical outlook will remain bearish for the NZD/USD.
NZD/USD daily chart
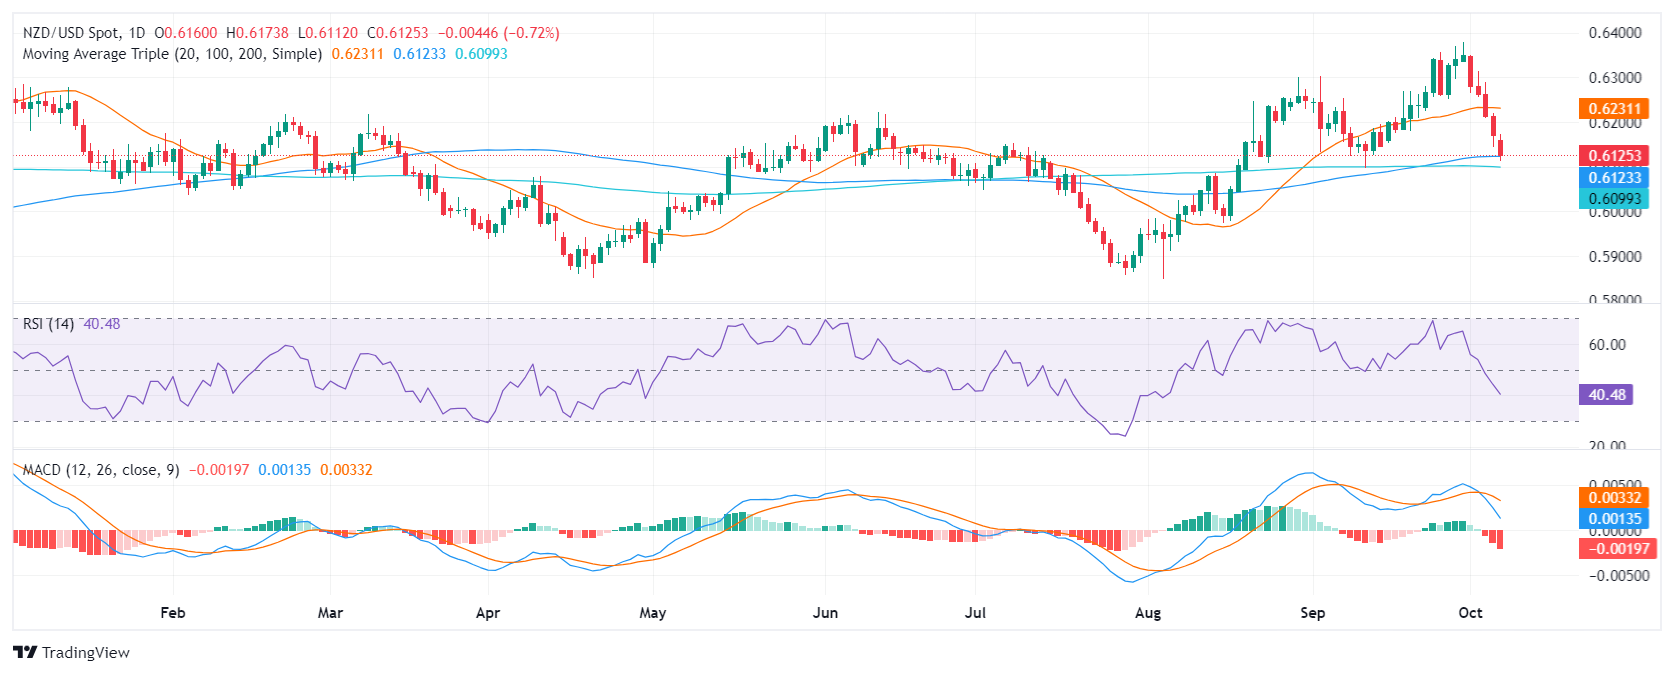
The overall outlook for the NZD/USD is bearish as the pair lost its 20-day Simple Moving Average (SMA). On the bright side, the sellers encountered a barrier at the 100-day SMA at 0.6120 which can mitigate the losses in the near term. That being said, a break below this level could open the door for a further decline towards 0.6000.
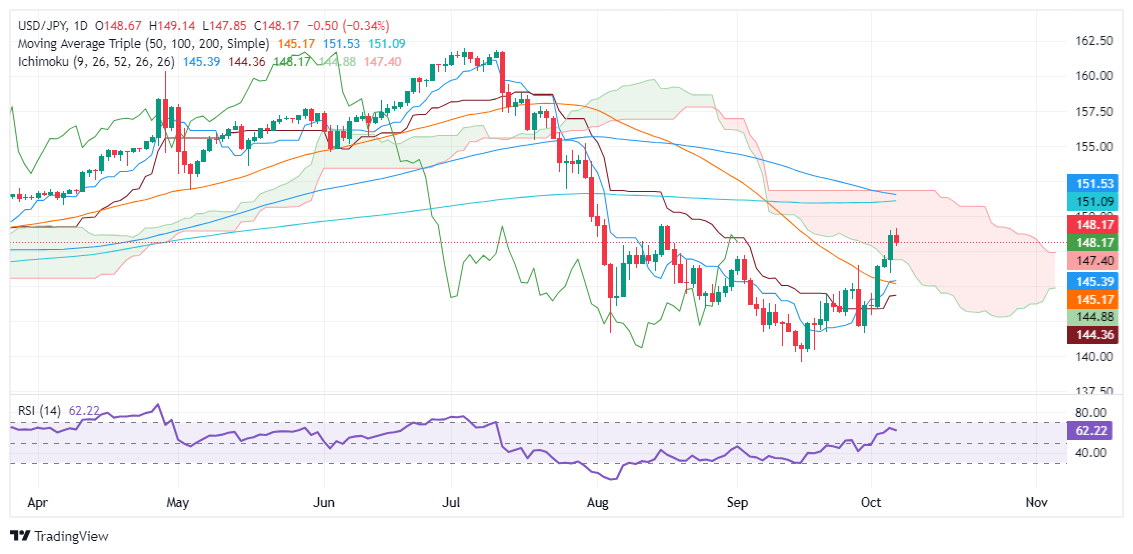
- USD/JPY retreats after failing to extend its rally, despite US 10-year Treasury yield rising five basis points.
- Technical outlook remains upward biased, with buyers eyeing a break above 149.14 and targeting 150.00 in the short term.
- A drop below 148.00 could see further downside, with key support at 147.00 and the bottom of the Ichimoku Cloud at 146.87.
The USD/JPY retreated after rallying for three straight days, even though the US 10-year Treasury noy yield rose five basis points. Risk aversion drives price action as the Middle East war escalates amid an exchange of fire between Israel, Hezbollah, and Hamas. At the time of writing, the pair trades at 148.12 after hitting a daily peak of 149.14.
USD/JPY Price Forecast: Technical outlook
The USD/JPY failed to extend its uptrend after piercing inside the Ichimoku Cloud (Kumo), which opened the door for further upside. Alongside that, the pair cleared the 50-day moving average (DMA) at 145.17, and since then, buyers have set their sights on 150.00.
Bullish momentum has faded, as shown by the Relative Strength Index (RSI) slope’s downward aiming. Still, the USD/JPY is upward biased in the short term.
Given the backdrop, the USD/JPY first resistance will be the 149.14 daily high of October 7. Once surpassed, the next stop would be 150.00. If those levels are surrendered, bulls could challenge the 200-DMA at 151.09.
Conversely, if the pair drops below 148.00, bears can drag the exchange rate towards 147.00 as they would like to drive prices toward the latest key support, the bottom of Kumo at 146.87.
USD/JPY Price Action – Daily Chart
Japanese Yen PRICE Today
The table below shows the percentage change of Japanese Yen (JPY) against listed major currencies today. Japanese Yen was the strongest against the New Zealand Dollar.
| USD | EUR | GBP | JPY | CAD | AUD | NZD | CHF | |
|---|---|---|---|---|---|---|---|---|
| USD | -0.02% | 0.24% | -0.37% | 0.36% | 0.52% | 0.56% | -0.48% | |
| EUR | 0.02% | 0.33% | -0.29% | 0.41% | 0.52% | 0.57% | -0.49% | |
| GBP | -0.24% | -0.33% | -0.68% | 0.10% | 0.20% | 0.28% | -0.70% | |
| JPY | 0.37% | 0.29% | 0.68% | 0.72% | 0.88% | 0.88% | -0.08% | |
| CAD | -0.36% | -0.41% | -0.10% | -0.72% | 0.19% | 0.18% | -0.84% | |
| AUD | -0.52% | -0.52% | -0.20% | -0.88% | -0.19% | 0.09% | -0.97% | |
| NZD | -0.56% | -0.57% | -0.28% | -0.88% | -0.18% | -0.09% | -1.00% | |
| CHF | 0.48% | 0.49% | 0.70% | 0.08% | 0.84% | 0.97% | 1.00% |
The heat map shows percentage changes of major currencies against each other. The base currency is picked from the left column, while the quote currency is picked from the top row. For example, if you pick the Japanese Yen from the left column and move along the horizontal line to the US Dollar, the percentage change displayed in the box will represent JPY (base)/USD (quote).
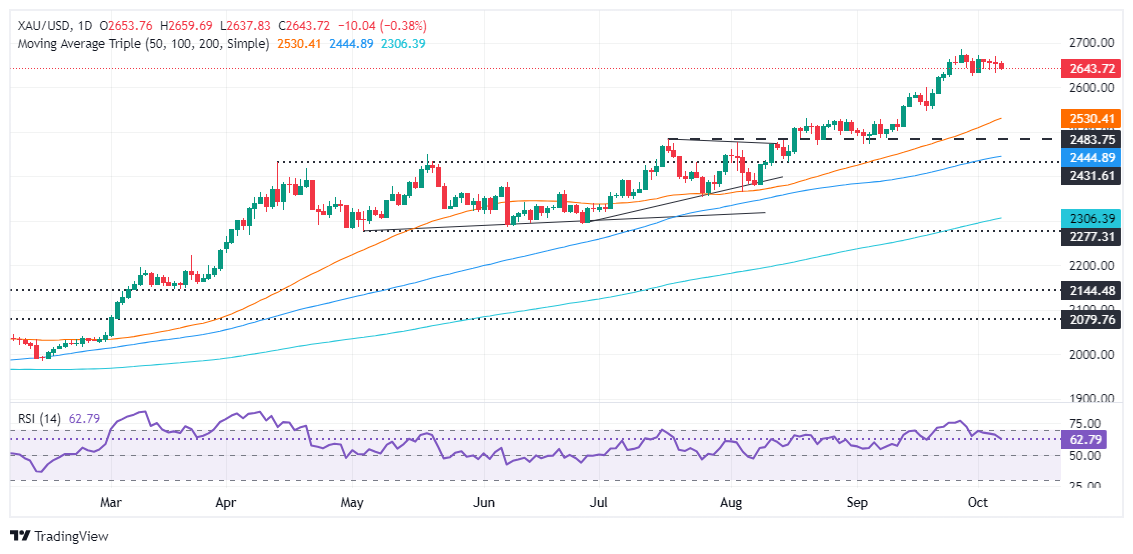
- Gold trades at $2,645, down 0.30%, as US 10-year Treasury yields rise to 4.026%, capping further upside.
- Middle East conflict escalation involving Israel, Hamas, and other groups like Houthis supports Gold amid risk-off sentiment.
- Market expectations of a 25 bps Fed rate cut remain high at 83.5%, while a 50 bps cut is off the table for now.
Gold price edges down during Monday’s North American session, yet it remains within the $2,630 - $2,659 range as US Treasury bond yields capped the yellow metal advance, while the escalation of the Middle East conflict keeps the precious metal from falling further. The XAU/USD trades at $2,645, losses 0.30%.
Market mood has deteriorated due to the war in the Middle East. The exchange of fire prolonged as Israel continued its ground operations in Lebanon, while Hamas launched rockets at Tel-Aviv. Ceasefire hopes faded as the conflict broadened, involving other groups like Houthis attacking ships in the Red Sea.
In the meantime, the latest US stellar Nonfarm Payrolls report in September sparked a jump in US Treasury bond yields.
Traders disregarded a 50 basis point (bps) cut by the Federal Reserve (Fed), according to CME FedWatch Tool data. The odds for a 25 bps Fed rate cut are 83.5%. Meanwhile, the chances of lowering rates by 50 bps are 0%, but they increased to 16.5% for a hold.
The US 10-year Treasury yield jumps over five and a half basis points to 4.026% as traders seem confident the Fed will lower borrowing costs by 25 bps in each of the last two policy meetings in 2024.
In the meantime, the Greenback clings to minimal gains as the US Dollar Index (DXY), which tracks the buck’s value against a basket of six currencies, is at 102.52, virtually unchanged but at levels last seen in August 2024.
Next week, the US docket will feature the release of inflation data, the Fed’s last Meeting Minutes, jobless claims, and the University of Michigan Consumer Sentiment.
Daily digest market movers: Gold price falls amid fading US recession fears
- Following the last US jobs report, recession fears faded. Therefore, most Wall Street banks like Citi, JP Morgan, and Bank of America revised its November Fed call from a 50 to 25 bps rate cut.
- Minneapolis Fed President Neel Kashkari said he doesn’t see signs of “resurgent inflation" and is confident that inflation is returning to 2%.
- Meanwhile, the People’s Bank of China (PBoC) halted its Bullion purchases for the fifth month. China’s reserves were unchanged, as their holdings stood at 72.8 million troy ounces at the end of last month.
XAU/USD technical analysis: Gold price slips as sellers eye support underneath $2,650
Gold price remains capped within a trading range, while the Relative Strength Index (RSI) suggests that a leg down is underway despite printing bullish readings. Still, the slope is accelerating downwards, closing toward the neutral line.
If XAU/USD drops below the September 30 low of $2,624, that could sponsor a leg down toward the $2,600 mark. On further weakness, the following floor will be the 50-day Simple Moving Average (SMA) at $2,531.
On the other hand, if Gold prints a daily close above $2,650, the XAU/USD needs to clear $2,670 to challenge the year-to-date high of $2,685. Up next will be the $2,700 mark.
Gold FAQs
Gold has played a key role in human’s history as it has been widely used as a store of value and medium of exchange. Currently, apart from its shine and usage for jewelry, the precious metal is widely seen as a safe-haven asset, meaning that it is considered a good investment during turbulent times. Gold is also widely seen as a hedge against inflation and against depreciating currencies as it doesn’t rely on any specific issuer or government.
Central banks are the biggest Gold holders. In their aim to support their currencies in turbulent times, central banks tend to diversify their reserves and buy Gold to improve the perceived strength of the economy and the currency. High Gold reserves can be a source of trust for a country’s solvency. Central banks added 1,136 tonnes of Gold worth around $70 billion to their reserves in 2022, according to data from the World Gold Council. This is the highest yearly purchase since records began. Central banks from emerging economies such as China, India and Turkey are quickly increasing their Gold reserves.
Gold has an inverse correlation with the US Dollar and US Treasuries, which are both major reserve and safe-haven assets. When the Dollar depreciates, Gold tends to rise, enabling investors and central banks to diversify their assets in turbulent times. Gold is also inversely correlated with risk assets. A rally in the stock market tends to weaken Gold price, while sell-offs in riskier markets tend to favor the precious metal.
The price can move due to a wide range of factors. Geopolitical instability or fears of a deep recession can quickly make Gold price escalate due to its safe-haven status. As a yield-less asset, Gold tends to rise with lower interest rates, while higher cost of money usually weighs down on the yellow metal. Still, most moves depend on how the US Dollar (USD) behaves as the asset is priced in dollars (XAU/USD). A strong Dollar tends to keep the price of Gold controlled, whereas a weaker Dollar is likely to push Gold prices up.
- US Dollar recovers amid conflict in the Middle East.
- US NFP data last week tempered aggressive easing bets on the Fed.
- Reserve Bank of Australia's Meeting Minutes of September policy meeting might stop the bleeding.
The AUD/USD pair declined by 0.50% to 0.6765 on Monday, pressured by a stronger US Dollar and concerns over geopolitical tensions in the Middle East.
The Australian economy faces an uncertain future amid conflicting economic signals. Despite healthy employment levels and strong consumer spending, inflation remains stubbornly high. The Reserve Bank of Australia (RBA) has adopted a cautious approach. This week’s minutes will be closely followed.
Daily digest market movers: Australian Dollar declines, while US Dollar gains ahead of packed week
- AUD declined amid Middle East tensions, pressuring risk-sensitive currencies due to rising oil prices.
- USD strengthened with the DXY near 102.00, boosted by strong upcoming US Nonfarm Payrolls data and cooling easing bets on the Fed.
- The likelihood of a 50-basis-point reduction in November or December has diminished to zero, while there is only a 90% chance of a 25-basis-point cut next month being factored in.
- Even with robust economic data, the market continues to expect a total easing of 125 basis points over the next year.
- Fed speakers and Consumer Price Index (CPI) data from the US will guide the pair’s trajectory this week.
AUD/USD technical outlook: Pair extends losses, 20-day SMA gone
The AUD/USD extends its losses, and indicators are weak with the Relative Strength Index (RSI) and the Moving Average Convergence Divergence (MACD) deep in negative terrain. In addition, the loss of the 20-day SMA has worsened the outlook for the pair.
Supports line up at 0.6750, 0.6730 and 0.6700, while resistances are seen at 0.6800, 0.6815 and 0.6850.
Australian Dollar FAQs
One of the most significant factors for the Australian Dollar (AUD) is the level of interest rates set by the Reserve Bank of Australia (RBA). Because Australia is a resource-rich country another key driver is the price of its biggest export, Iron Ore. The health of the Chinese economy, its largest trading partner, is a factor, as well as inflation in Australia, its growth rate and Trade Balance. Market sentiment – whether investors are taking on more risky assets (risk-on) or seeking safe-havens (risk-off) – is also a factor, with risk-on positive for AUD.
The Reserve Bank of Australia (RBA) influences the Australian Dollar (AUD) by setting the level of interest rates that Australian banks can lend to each other. This influences the level of interest rates in the economy as a whole. The main goal of the RBA is to maintain a stable inflation rate of 2-3% by adjusting interest rates up or down. Relatively high interest rates compared to other major central banks support the AUD, and the opposite for relatively low. The RBA can also use quantitative easing and tightening to influence credit conditions, with the former AUD-negative and the latter AUD-positive.
China is Australia’s largest trading partner so the health of the Chinese economy is a major influence on the value of the Australian Dollar (AUD). When the Chinese economy is doing well it purchases more raw materials, goods and services from Australia, lifting demand for the AUD, and pushing up its value. The opposite is the case when the Chinese economy is not growing as fast as expected. Positive or negative surprises in Chinese growth data, therefore, often have a direct impact on the Australian Dollar and its pairs.
Iron Ore is Australia’s largest export, accounting for $118 billion a year according to data from 2021, with China as its primary destination. The price of Iron Ore, therefore, can be a driver of the Australian Dollar. Generally, if the price of Iron Ore rises, AUD also goes up, as aggregate demand for the currency increases. The opposite is the case if the price of Iron Ore falls. Higher Iron Ore prices also tend to result in a greater likelihood of a positive Trade Balance for Australia, which is also positive of the AUD.
The Trade Balance, which is the difference between what a country earns from its exports versus what it pays for its imports, is another factor that can influence the value of the Australian Dollar. If Australia produces highly sought after exports, then its currency will gain in value purely from the surplus demand created from foreign buyers seeking to purchase its exports versus what it spends to purchase imports. Therefore, a positive net Trade Balance strengthens the AUD, with the opposite effect if the Trade Balance is negative.
The Greenback alternated gains with losses amidst higher yields on Monday, while investors continued to digest Friday’s Payrolls against the backdrop of steady prudence in response to rising geopolitical jitters in the Middle East.
Here is what you need to know on Tuesday, October 8:
The US Dollar Index (DXY) kicked off the week in an irresolute tone, although it managed to keep the trade near recent peaks well north of the 102.00 barrier. The NFIB Business Optimism Index is due along with Balance of Trade results, the RCM/TIPP Economic Optimism Index, and the API’s weekly report on US crude oil inventories. In addition, the Fed’s Bostic, Musalem, Kugler, and Collins are due to speak.
EUR/USD remained on the defensive for yet another session, putting recent lows near 1.0950 to the test on Monday. Industrial Production in Germany will be published, followed by speeches by the ECB’s Schnabel and McCaul.
GBP/USD extended its decline for the fifth consecutive day and flirted with four-week lows near 1.3060. Next on tap on the docket is the BRC Retail Sales Monitor.
USD/JPY surrendered initial gains to fresh tops past the 149.00 yardstick amidst the vacillating Greenback and higher US yields. Household Spending, the Current Account figures and Average Cash Earnings are all due.
AUD/USD accelerated its monthly retracement and revisited three-week lows near the 0.6740 zone. The publication of the RBA Minutes will take centre stage seconded by the NAB Business Confidence index and the speech by the RBA’s Hauser.
Prices of WTI rose further and flirted with the key 200-day SMA north of the $77.00 mark per barrel, always on the back of persistent geopolitical concerns in the Middle East.
Gold prices extended their leg lower to the $2,640 region per ounce troy following increasing US yields and bets of a smaller rate cut by the Fed. Silver prices tested three-day lows near the $31.40 zone per ounce, reversing four straight days of gains.
- he Canadian Dollar continues to lose ground to the Greenback.
- Markets have tilted into a broadly risk-off stance to kick off the new week.
- Canada remains largely absent from the economic calendar until Friday.
The Canadian Dollar (CAD) backslid into long-term averages against the US Dollar on Monday, with markets opening up the new trading week notably on the back foot. Investors pulled back into the safety of the Greenback, sending the Canadian Dollar skidding into three-week lows.
Meaningful economic data from Canada remains entirely absent from the economic data docket this week, at least until fresh prints in Canadian labor data, due on Friday. Canadian Trade Balance figures are due on Tuesday but are almost guaranteed to have little to no market impact.
Daily digest market movers
- Rising risk-off sentiment pummels the CAD on Monday.
- Markets are facing a lower forecast for the pace of rate cuts than many expected earlier in the year.
- Odds of further outsized rate cuts from the Fed are evaporating as the US labor market remains stubbornly healthy.
- Fed remains tepid on further rate cuts, bets of no rate change in November are on the rise.
- Fed's Kashkari: Balance of risks has tilted toward higher unemployment
Canadian Dollar price forecast
USD/CAD is currently trading at 1.36245, having recently bounced from the 1.3500 level. Notably, price action has moved above the 200-day Exponential Moving Average (EMA), a critical level that often signals a shift in trend direction when breached. The break above this longer-term EMA suggests that bullish momentum may be gaining traction, and this level could act as a new support zone.
Additionally, the 50-day EMA is slightly below the current price, further reinforcing the bullish outlook. The crossing above both the 50-day and 200-day EMAs in quick succession strengthens the case for a potential rally in the coming days, assuming no significant pullback occurs.
The MACD histogram also indicates a bullish shift, as the MACD line (blue) has crossed above the signal line (orange), suggesting an increase in upward momentum. This crossover, along with a steadily rising histogram, points to a potential continuation of the upward movement.
However, it’s important to note that the pair is approaching resistance near the 1.3650 level, which has previously acted as a strong psychological and technical barrier. If USD/CAD manages to break and sustain above this level, it could open the door for further gains, with the next key resistance zone around 1.3800.
USD/CAD daily chart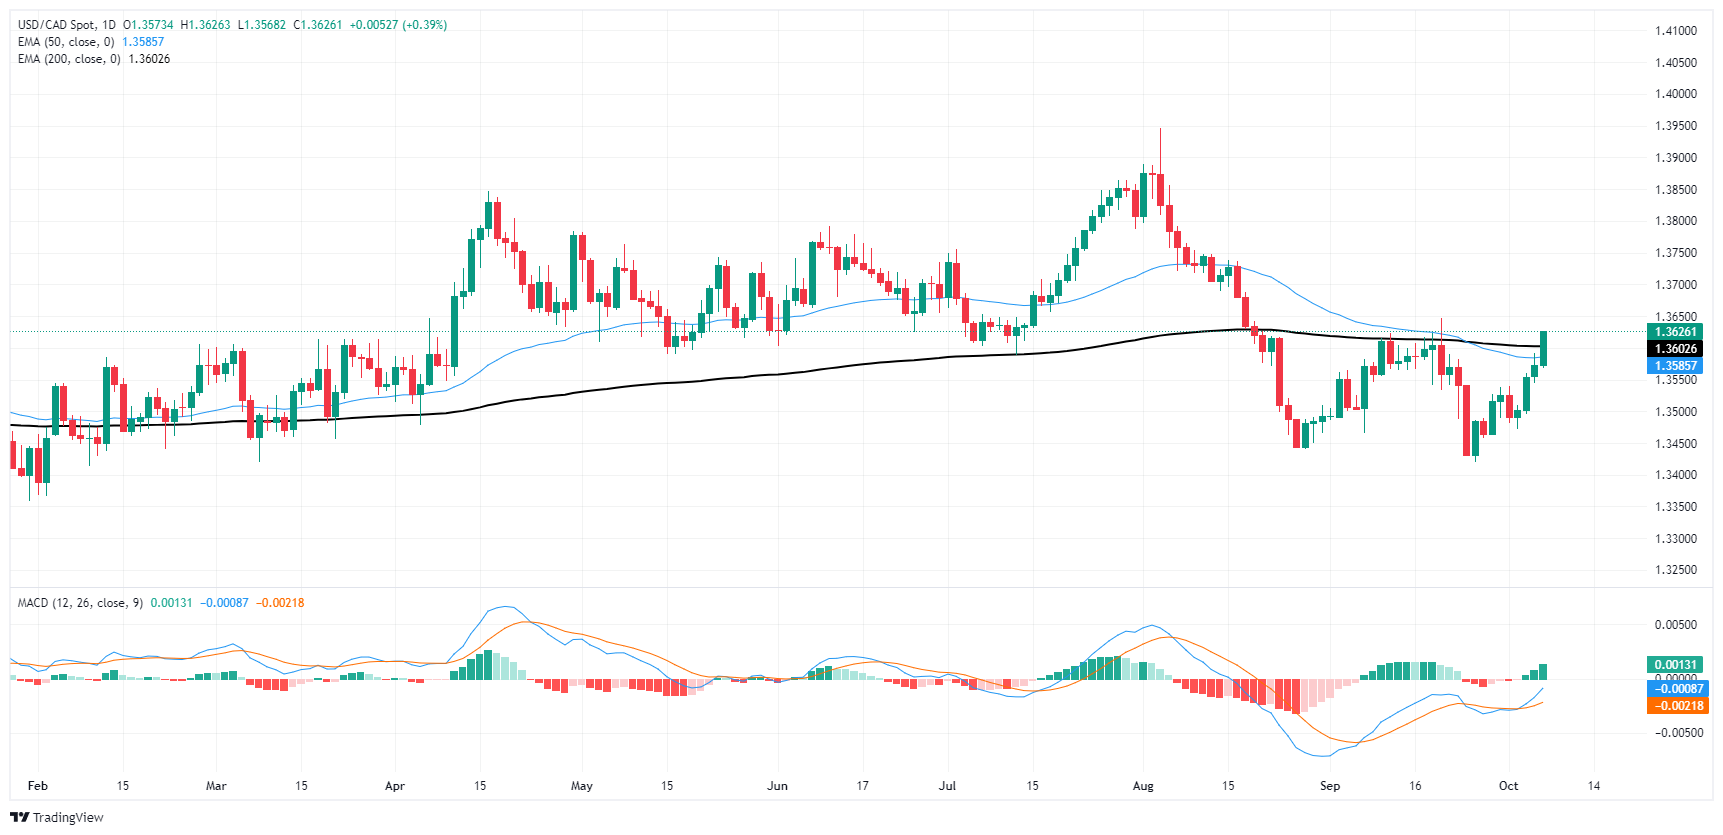
Canadian Dollar FAQs
The key factors driving the Canadian Dollar (CAD) are the level of interest rates set by the Bank of Canada (BoC), the price of Oil, Canada’s largest export, the health of its economy, inflation and the Trade Balance, which is the difference between the value of Canada’s exports versus its imports. Other factors include market sentiment – whether investors are taking on more risky assets (risk-on) or seeking safe-havens (risk-off) – with risk-on being CAD-positive. As its largest trading partner, the health of the US economy is also a key factor influencing the Canadian Dollar.
The Bank of Canada (BoC) has a significant influence on the Canadian Dollar by setting the level of interest rates that banks can lend to one another. This influences the level of interest rates for everyone. The main goal of the BoC is to maintain inflation at 1-3% by adjusting interest rates up or down. Relatively higher interest rates tend to be positive for the CAD. The Bank of Canada can also use quantitative easing and tightening to influence credit conditions, with the former CAD-negative and the latter CAD-positive.
The price of Oil is a key factor impacting the value of the Canadian Dollar. Petroleum is Canada’s biggest export, so Oil price tends to have an immediate impact on the CAD value. Generally, if Oil price rises CAD also goes up, as aggregate demand for the currency increases. The opposite is the case if the price of Oil falls. Higher Oil prices also tend to result in a greater likelihood of a positive Trade Balance, which is also supportive of the CAD.
While inflation had always traditionally been thought of as a negative factor for a currency since it lowers the value of money, the opposite has actually been the case in modern times with the relaxation of cross-border capital controls. Higher inflation tends to lead central banks to put up interest rates which attracts more capital inflows from global investors seeking a lucrative place to keep their money. This increases demand for the local currency, which in Canada’s case is the Canadian Dollar.
Macroeconomic data releases gauge the health of the economy and can have an impact on the Canadian Dollar. Indicators such as GDP, Manufacturing and Services PMIs, employment, and consumer sentiment surveys can all influence the direction of the CAD. A strong economy is good for the Canadian Dollar. Not only does it attract more foreign investment but it may encourage the Bank of Canada to put up interest rates, leading to a stronger currency. If economic data is weak, however, the CAD is likely to fall.
Federal Reserve (Fed) Bank of Minneapolis President Neel Kashkari noted on Monday that the overall balance of risks has tilted slightly into labor headwinds, with progress on inflation continuing.
Key highlights
The balance of risks have shifted away from higher inflation towards maybe higher unemployment.
Overall the US economy is resilient.
The labor market still looks strong, we want to keep it that way.
I am not seeing signs of resurgent inflation.
Reduction in new rents inflation gives us confidence that housing inflation will come down over the next 12-24 months.
- DXY snapped a five-day winning streak and seems to be taking a breather below 103.00
- Fed easing expectations have been tempered following last week’s jobs report
- Fed speakers are expected to reiterate a gradual approach
The US Dollar Index (DXY), which measures the value of the USD against a basket of currencies, witnessed a calm Monday session with mild losses, holding steady despite elevated levels near last week's highs. Amidst ongoing Middle East tensions, market participants await key events this week, including the release of the Federal Reserve's (Fed) Federal Open Market Committee (FOMC) Meeting Minutes and US Consumer Price Index (CPI) data.
While the US economy exhibits moderate deceleration, indications of economic resilience persist. Despite this, the Fed maintains a data-driven approach, emphasizing the significance of incoming economic indicators in determining the pace of interest rate adjustments. In that sense, last week’s jobs report made markets price out a 50 bps cut in November or December.
Daily digest market movers: Falling US Dollar as markets await CPI data
- The probability of a 50 bps cut in November or December is now zero, according to swap markets, and a 25 bps cut next month is only 90% priced in
- Despite strong economic data, the market still anticipates 125 bps of total easing in the next 12 months
- Multiple Fed speakers this week are anticipated to emphasize data-dependency
- This week, headline and core CPI are expected to show a mild deceleration in September, and its outcome might put a stop to the USD’s upwards movement
DXY technical outlook: DXY momentum rests, resistance at 103.00
Indicators are resting after last week's gains, with the index ending a five-day uptrend. The Relative Strength Index (RSI) and Moving Average Convergence Divergence (MACD) are firmly in positive territory with room for further upside.
Supports: 102.30, 102.00, 101.80
Resistances: 103.00, 103.50, 104.00
US Dollar FAQs
The US Dollar (USD) is the official currency of the United States of America, and the ‘de facto’ currency of a significant number of other countries where it is found in circulation alongside local notes. It is the most heavily traded currency in the world, accounting for over 88% of all global foreign exchange turnover, or an average of $6.6 trillion in transactions per day, according to data from 2022. Following the second world war, the USD took over from the British Pound as the world’s reserve currency. For most of its history, the US Dollar was backed by Gold, until the Bretton Woods Agreement in 1971 when the Gold Standard went away.
The most important single factor impacting on the value of the US Dollar is monetary policy, which is shaped by the Federal Reserve (Fed). The Fed has two mandates: to achieve price stability (control inflation) and foster full employment. Its primary tool to achieve these two goals is by adjusting interest rates. When prices are rising too quickly and inflation is above the Fed’s 2% target, the Fed will raise rates, which helps the USD value. When inflation falls below 2% or the Unemployment Rate is too high, the Fed may lower interest rates, which weighs on the Greenback.
In extreme situations, the Federal Reserve can also print more Dollars and enact quantitative easing (QE). QE is the process by which the Fed substantially increases the flow of credit in a stuck financial system. It is a non-standard policy measure used when credit has dried up because banks will not lend to each other (out of the fear of counterparty default). It is a last resort when simply lowering interest rates is unlikely to achieve the necessary result. It was the Fed’s weapon of choice to combat the credit crunch that occurred during the Great Financial Crisis in 2008. It involves the Fed printing more Dollars and using them to buy US government bonds predominantly from financial institutions. QE usually leads to a weaker US Dollar.
Quantitative tightening (QT) is the reverse process whereby the Federal Reserve stops buying bonds from financial institutions and does not reinvest the principal from the bonds it holds maturing in new purchases. It is usually positive for the US Dollar.
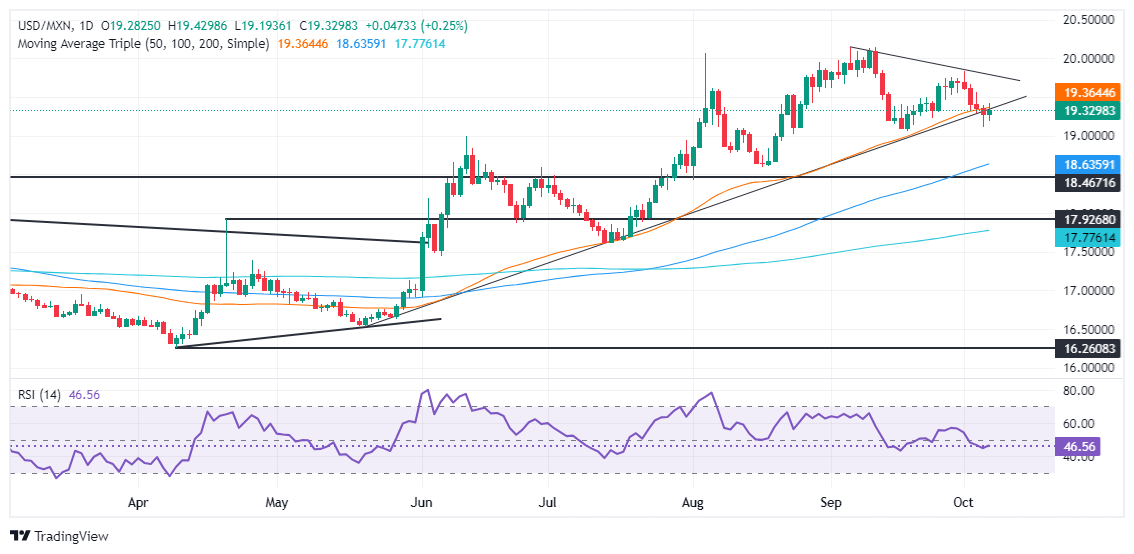
- Mexican Peso slumps after hitting a low of 19.18, driven by risk-on sentiment favoring the US Dollar.
- Mexico's economic docket highlights an increase in the Jobless Rate to 3.0%, with focus turning to upcoming inflation data and Banxico’s September meeting minutes.
- US Nonfarm Payrolls for September exceeded expectations last Friday, adding 254K jobs as the Unemployment Rate fell to 4.1%.
The Mexican Peso begins the week on the back foot and falls some 0.50% against the Greenback amid a risk-on impulse that keeps the US Dollar trading near seven-week highs. Last week’s outstanding US Nonfarm Payrolls (NFP) data boosted the Mexican currency, but fears of an escalation of the Middle East conflict spurred flows to safe-haven currencies. The USD/MXN trades at 19.33 after bouncing off daily lows at 19.18.
On Friday, the US Bureau of Labor Statistics (BLS) revealed that over 254K people were added to the workforce in September, crushing estimates of 140K and August’s upwardly revised figure of 159K. Consequently, the Unemployment Rate edged lower from 4.2% to 4.1%.
Following the data, the USD/MXN dropped to a new monthly low of 19.10, though it closed near last Friday's highs, opening the door for a recovery.
Money markets trimmed the odds for a 50-basis-point (bps) rate cut by the US Federal Reserve (Fed) at the upcoming November meeting. Data from the Chicago Board of Trade (CBOT) via the December fed funds rate futures contract shows investors estimate 49 bps of easing by the Fed toward the end of 2024.
Data-wise, Mexico’s docket revealed that the Jobless Rate increased from 2.9% to 3.0%, while Automobile Production and Exports improved.
On Thursday, Mexico’s Supreme Court voted eight to three “to consider a constitutional challenge to the controversial judicial overhaul enacted last month,” which would allow the election of judges and Supreme Court magistrates via electoral vote.
Ahead of the week, Mexico’s economic docket will feature the release of Inflation data on Wednesday and the meeting minutes from the Bank of Mexico’s (Banxico) September gathering.
In the US, the schedule will feature many speeches by Fed officials, inflation data on the consumer and producer sides, and the University of Michigan (UoM) Consumer Sentiment for October.
Daily digest market movers: Mexican Peso pressured by strong US Dollar, risk aversion
- Banxico’s September poll of analysts and economists revealed that inflation expectations were reviewed to the downside, with headline prices down from 4.69% to 4.48% YoY. Underlying inflation is expected to hit 3.84% from 3.94%.
- The same survey showed the USD/MXN exchange rate is projected to end 2024 at 19.69, while Banxico’s main reference rate is foreseen to end at 10%.
- Mexico’s economy is foreseen to grow by 1.45% in 2024, lower than August’s 1.57%.
- Chicago Fed President Austan Goolsbee said that more job reports like this “will make me more confident we are settling in at full employment.” He said most Fed officials expect rates to decrease heavily over the next 18 months.
- Citi added its name to JPMorgan and Bank of America and changed its November Fed call from a 50 to 25 bps cut.
- Market participants have disregarded a 50 bps cut. The odds of a 25 bps cut are 83.5%, while the chances for holding rates unchanged are at 16.5%, according to the CME FedWatch Tool data.
USD/MXN technical outlook: Mexican Peso drops as USD/MXN jumps above 19.30
On Friday, I wrote, "The USD/MXN uptrend is doubtful as the pair cleared the 50-day Simple Moving Average (SMA) at 19.34, with sellers gathering momentum.” The exotic pair remains below that area, which could pave the way for further downside, despite solid gains on Monday.
In the short term, the Relative Strength Index (RSI) shifted bullish, though it remains in bearish territory. This opens the door for a leg-up before resuming its downtrend.
Therefore, the USD/MXN first resistance would be the 50-day SMA, followed by the 19.50 mark. A breach of the latter will expose the October 1 daily high of 19.82, ahead of 20.00. Up next would be the YTD peak of 20.22.
On the flip side, the USD/MXN's first support would be the September 24 swing low of 19.23. Once surpassed, the next demand area will be the September 18 daily low of 19.06, ahead of the psychological 19.00 figure.
Mexican Peso FAQs
The Mexican Peso (MXN) is the most traded currency among its Latin American peers. Its value is broadly determined by the performance of the Mexican economy, the country’s central bank’s policy, the amount of foreign investment in the country and even the levels of remittances sent by Mexicans who live abroad, particularly in the United States. Geopolitical trends can also move MXN: for example, the process of nearshoring – or the decision by some firms to relocate manufacturing capacity and supply chains closer to their home countries – is also seen as a catalyst for the Mexican currency as the country is considered a key manufacturing hub in the American continent. Another catalyst for MXN is Oil prices as Mexico is a key exporter of the commodity.
The main objective of Mexico’s central bank, also known as Banxico, is to maintain inflation at low and stable levels (at or close to its target of 3%, the midpoint in a tolerance band of between 2% and 4%). To this end, the bank sets an appropriate level of interest rates. When inflation is too high, Banxico will attempt to tame it by raising interest rates, making it more expensive for households and businesses to borrow money, thus cooling demand and the overall economy. Higher interest rates are generally positive for the Mexican Peso (MXN) as they lead to higher yields, making the country a more attractive place for investors. On the contrary, lower interest rates tend to weaken MXN.
Macroeconomic data releases are key to assess the state of the economy and can have an impact on the Mexican Peso (MXN) valuation. A strong Mexican economy, based on high economic growth, low unemployment and high confidence is good for MXN. Not only does it attract more foreign investment but it may encourage the Bank of Mexico (Banxico) to increase interest rates, particularly if this strength comes together with elevated inflation. However, if economic data is weak, MXN is likely to depreciate.
As an emerging-market currency, the Mexican Peso (MXN) tends to strive during risk-on periods, or when investors perceive that broader market risks are low and thus are eager to engage with investments that carry a higher risk. Conversely, MXN tends to weaken at times of market turbulence or economic uncertainty as investors tend to sell higher-risk assets and flee to the more-stable safe havens.
- The Dow Jones shed 250 points to kick off the new trading week.
- Equities are pulling back in the face of lower rate cut expectations.
- Middle East geopolitical tensions are driving risk appetite even lower.
The Dow Jones Industrial Average (DJIA) shed around 250 points on a shaky market Monday, with risk appetite shriveling on the back of decreased rate cut expectations and tensions in the Middle East running on the hot side. Markets expect less than 50 bps in further rate cuts from the Federal Reserve (Fed) for the remainder of the year. Crude Oil prices are rising as commodity traders brace for a spat between Iran and Israel to widen into an outright conflict.
Equities took a hit at the outset of a new trading week, waylaid by crumpling investor hopes for further outsized rate cuts from the Fed through the rest of 2024. According to the CME’s FedWatch Tool, rate traders now expect roughly an 80% chance of a single 25 bps rate trim from the Fed in November. The remaining roughly 20% expect the Fed to stand pat on November 7.
Markets are bracing for an escalation in the newly-sparked conflict between Iran and Israel; commodity investors are worried that Israel is set to lash out at Iran and strike Iran’s Crude Oil industry, a move that could send global energy prices soaring. Iran represents roughly 4% of global Crude Oil production. Israel is expected to deliver some kind of retaliatory attack against Iran, which launched a missile strike against Israel last week in retaliation for Israel invading neighboring Lebanon.
Dow Jones news
A risk-off Monday is weighing down equities across the board, with all but five of the DJIA’s constituent securities dipping into the red for the day. Caterpillar (CAT) still found room to move on the high side, gaining eight-tenths of one percent and trading into record territory above $400 per share.
Insurance provider Travelers Companies (TRV) outran the rest of the Dow Jones losers, tumbling 3.5% to fall below $228 per share. Despite the headline hit on Travelers Companies, the insurance issuer is doing very well for itself, climbing over 55% from a late 2019 low of $99.35.
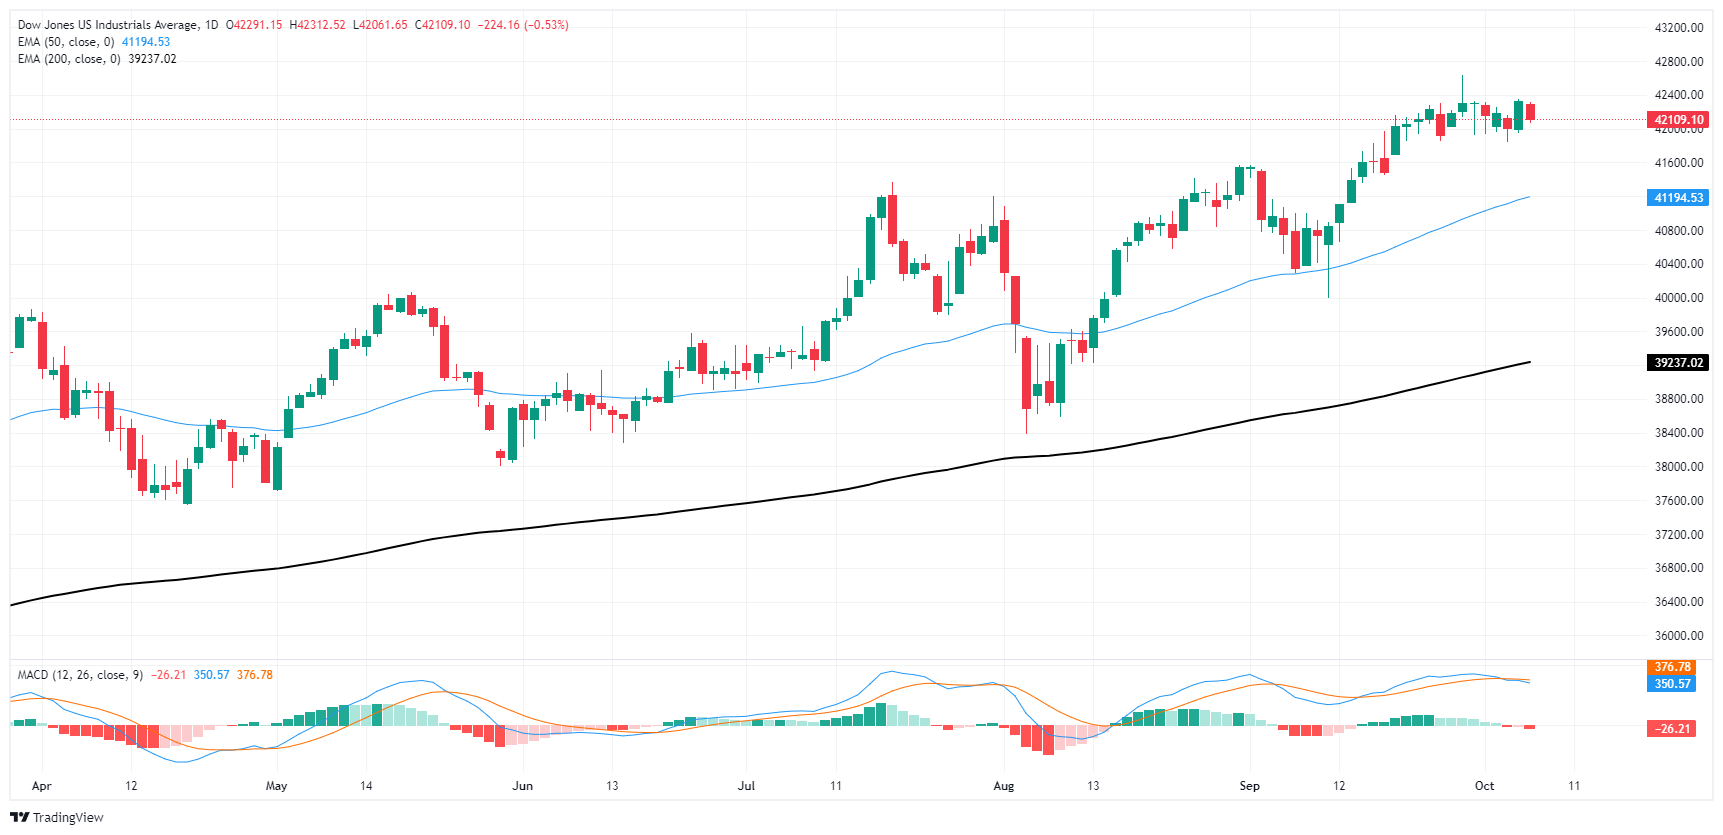
Dow Jones price forecast
Price action on the Dow Jones chart suggests a generally bullish sentiment since May, with the index consistently trading above its 50-day Exponential Moving Average (EMA), indicating that short-term momentum remains strong. The 200-day EMA serves as a significant support level, with the index maintaining a comfortable distance from it, reinforcing the underlying strength of the broader uptrend.
However, more recent sessions show a mild pullback. The DJIA faces resistance at around the 42,300 level, which has acted as a psychological barrier since mid-September. The downward price movement from this resistance, combined with a decline in momentum, is something to monitor closely. The MACD histogram has shifted into the negative zone, while the MACD line has crossed below the signal line, both of which are bearish signals, suggesting that short-term momentum may be slowing down.
Dow Jones daily chart
Dow Jones FAQs
The Dow Jones Industrial Average, one of the oldest stock market indices in the world, is compiled of the 30 most traded stocks in the US. The index is price-weighted rather than weighted by capitalization. It is calculated by summing the prices of the constituent stocks and dividing them by a factor, currently 0.152. The index was founded by Charles Dow, who also founded the Wall Street Journal. In later years it has been criticized for not being broadly representative enough because it only tracks 30 conglomerates, unlike broader indices such as the S&P 500.
Many different factors drive the Dow Jones Industrial Average (DJIA). The aggregate performance of the component companies revealed in quarterly company earnings reports is the main one. US and global macroeconomic data also contributes as it impacts on investor sentiment. The level of interest rates, set by the Federal Reserve (Fed), also influences the DJIA as it affects the cost of credit, on which many corporations are heavily reliant. Therefore, inflation can be a major driver as well as other metrics which impact the Fed decisions.
Dow Theory is a method for identifying the primary trend of the stock market developed by Charles Dow. A key step is to compare the direction of the Dow Jones Industrial Average (DJIA) and the Dow Jones Transportation Average (DJTA) and only follow trends where both are moving in the same direction. Volume is a confirmatory criteria. The theory uses elements of peak and trough analysis. Dow’s theory posits three trend phases: accumulation, when smart money starts buying or selling; public participation, when the wider public joins in; and distribution, when the smart money exits.
There are a number of ways to trade the DJIA. One is to use ETFs which allow investors to trade the DJIA as a single security, rather than having to buy shares in all 30 constituent companies. A leading example is the SPDR Dow Jones Industrial Average ETF (DIA). DJIA futures contracts enable traders to speculate on the future value of the index and Options provide the right, but not the obligation, to buy or sell the index at a predetermined price in the future. Mutual funds enable investors to buy a share of a diversified portfolio of DJIA stocks thus providing exposure to the overall index.
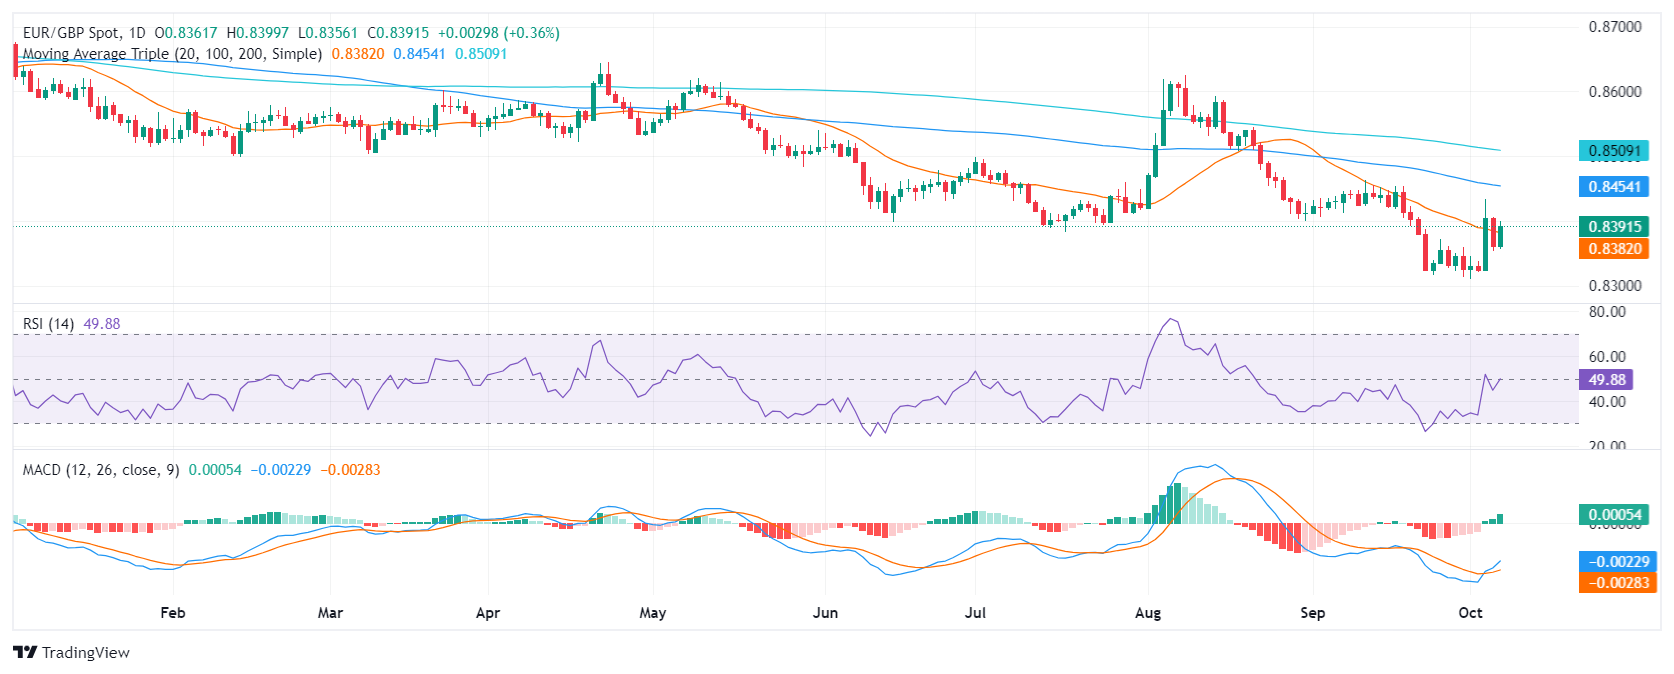
- Technical indicators suggest that buying pressure is rising, supporting the bullish outlook.
- The pair needs to break above 0.8400 to confirm a bullish continuation.
- A consolidation above the 20-day SMA would also favor a promising outlook.
The EUR/GBP pair seems to be consolidating in a sideways range after last week’s sharp gains, and rose by 0.35% on Monday to 0.8395.
The daily Relative Strength Index (RSI) is currently rising near its middle point suggesting that buying pressure is rising. The Moving Average Convergence Divergence (MACD) is also green and rising, further suggesting that the tide is in favor of the bulls.
A break above the 0.8400 resistance level could trigger a bullish continuation and would open the door for further gains towards 0.8450 and 0.8500. A drop below the 0.8320 support level could lead to further declines. Above the 0.8380 line where the 20-day Simple Moving Average (SMA) converges, serves as a strong support which the bulls must hold to continue rising.
EUR/GBP daily chart
Since the last FOMC decision, equity indices remain near their highs, credit spreads at their tights, Gold prices near all-time-highs and yet long-end yields have risen alongside commodities markets, TDS macro analyst Daniel Ghali notes.
No sign of substantial inflows hitting the tapes
“Price action is inconsistent with a Fed that is 'behind the curve', and if anything, last Friday's NFP report marks the first concrete challenge to the market's expected rate cut path. Rates markets have begun to notably reprice the Fed path, but Gold prices have yet to be weighed down by liquidations.
“After all, there is a limit to repricing the easing cycle's path given the Fed's lean, the Yellow Metal still holds a high margin of safety before the first CTA selling program is kicked off, and macro fund inflows continue to support higher prices, albeit at a drip. Interestingly, we still see no sign of substantial inflows hitting the tapes. Contrary to what is implied by price action, the last weeks haven't seen massive inflows into Gold according to our positioning analytics.”
“Our gauge of macro fund positioning is now at its highest levels on record, with our estimates of positioning for this cohort now slightly surpassing levels seen in the weeks that followed the Brexit referendum. Gap risk is elevated, but the repricing in rates markets has thus far failed to catalyze liquidations, suggesting macro funds are still comfortable betting on an 'overly easy' policy nonetheless.”
- EUR/GBP rises over a third of a percent on Monday as traders continue to discount comments from BoE’s Andrew Bailey.
- The bank’s Governor said the BoE was going to get more “activist” about cutting interest rates.
- Upside for the pair is limited, however, as data from the Eurozone reflects a cooling economy.
EUR/GBP exchanges hands in the 0.8390s after gaining over a third of a percent on Monday as the Pound Sterling (GBP) resumes its negative trend of recent days, triggered by remarks from the Governor of the Bank of England (BoE) Andrew Bailey. The pair’s gains are likely to be contained, however, by weak data out of the Eurozone on Monday, which showed consumers tightening their belts and German Factory Orders in decline, which, in turn, undermine the Euro (EUR).
The Euro outperforms the Pound on Monday as markets continue to digest comments from BoE Governor Bailey last Thursday who said that the BoE was going to get more “activist” and “aggressive” about cutting interest rates. His words surprised traders as up until then the BoE had been seen as one of the major central banks least likely to cut interest rates in the near-term. Lower interest rates are negative for the Pound as they reduce foreign capital inflows, and as a consequence Sterling lost over 1.0% against the Euro on the day.
On Friday, the BoE’s Chief Economist, Huw Pill, administered some antidote by arguing the BoE should follow a more cautious approach in cutting interest rates, and Sterling recovered a little strength. Upbeat House Price data from lender Halifax further underpins the Pound on Monday but is not enough to catalyze a rally.
EUR/GBP, however, sees its upside capped as the Euro struggles to gain traction following the release of weak Eurozone Retail Sales data on Monday. The data showed sales rose by only 0.80% annually in August, undershooting the 1.0% expected. Nevertheless, this was higher than the 0.1% decline in July.
The single currency is further hampered by concerns around German manufacturing and this was not helped by German Factory Orders data on Monday, which showed a decline of 5.8% on a seasonally adjusted basis in August. This was well below the 2.0% decline expected and the upwardly-revised 3.9% rise of the previous month. The data adds further veracity to the view that the Eurozone’s largest economy is sliding into a recession.
Falling inflation data in the Eurozone, which fell below the European Central Bank’s (ECB) 2.0% target for the first time in over three years in September when headline inflation hit 1.8%, is further weighing on the Euro. This has increased the chances that the ECB will cut interest rates at its meeting next week. Lower interest rates are usually negative for a currency as they reduce foreign capital inflows.
ECB Governing Council member François Villeroy de Galhau further encouraged speculation on this point overnight when he said that the ECB will “quite probably” cut interest rates at the next meeting. Villeroy added that the ECB has to pay attention to the risk of undershooting its 2.0% inflation target “due to a weak growth and a restrictive monetary policy for too long.” His comments “support market pricing for a total 150 bp of easing over the next 12 months” from the ECB according to analysts at Brown Brothers Harriman (BBH).
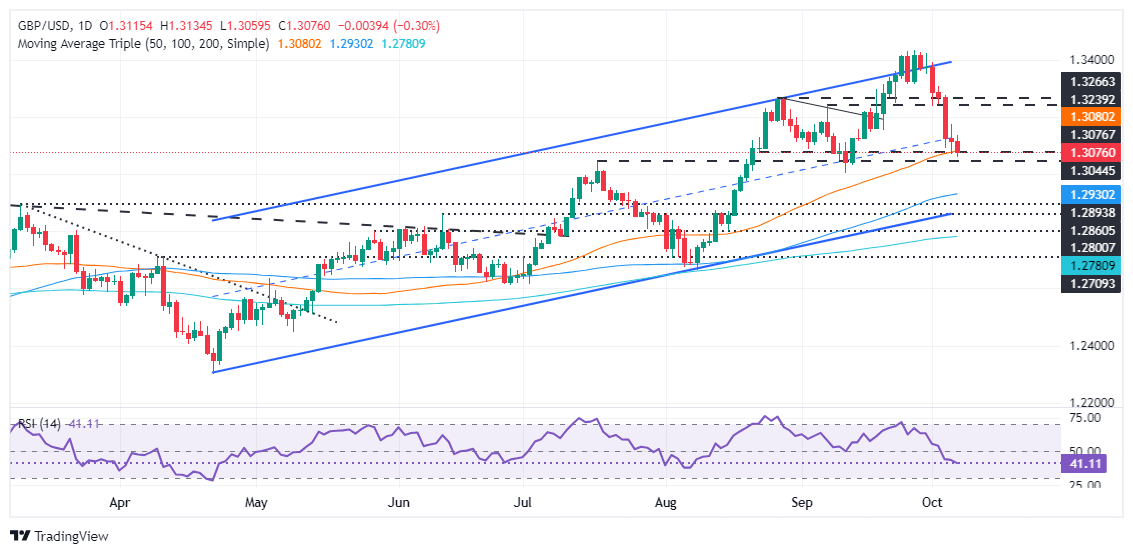
- GBP/USD declines 0.26% to 1.3076, after peaking at 1.3134, influenced by dovish BoE remarks and rising US Treasury yields.
- Bearish RSI indicates seller dominance; key supports are at the 50-DMA of 1.3077, 1.3031, and 1.3001.
- Resistance stands at 1.3100, with additional targets at 1.3134 and the October 4 high of 1.3174.
The Pound Sterling extends its losses against the Greenback in early trading during the North American session, down 0.26%. Dovish remarks by the Bank of England (BoE) Governor Andrew Bailey began Sterling’s downfall last week. Therefore, the GBP/USD trades at 1.3076 after hitting a daily high of 1.3134.
GBP/USD Price Forecast: Technical outlook
During the overnight session for American traders, the GBP/USD hit a three-week low of 1.3058 before recovering some ground. The jump in US Treasury yields bolstered the Greenback, which has risen to a 7-week high above 102.00 yet remains shy of 103.00.
The Relative Strength Index (RSI) shows signs that sellers are in charge after shifting bearish. Given the backdrop, the path of least resistance for the Pound is tilted to the downside.
The first support for GBP/USD would be the 50-day moving average (DMA) at 1.3077. On further weakness, the next support would be the September 12 low of 1.3031, followed by the latest swing low of 1.3001, the September 11 low.
Conversely, if the pair rises above 1.3100, look for a re-test of the day’s high of 1.3134, ahead of challenging 1.3150. Up next will be the October 4 peak at 1.3174 before 1.3200.
GBP/USD Price Action – Daily Chart
British Pound PRICE Today
The table below shows the percentage change of British Pound (GBP) against listed major currencies today. British Pound was the strongest against the New Zealand Dollar.
| USD | EUR | GBP | JPY | CAD | AUD | NZD | CHF | |
|---|---|---|---|---|---|---|---|---|
| USD | -0.03% | 0.30% | -0.39% | 0.32% | 0.42% | 0.58% | -0.35% | |
| EUR | 0.03% | 0.40% | -0.33% | 0.38% | 0.42% | 0.60% | -0.35% | |
| GBP | -0.30% | -0.40% | -0.76% | -0.00% | 0.02% | 0.24% | -0.62% | |
| JPY | 0.39% | 0.33% | 0.76% | 0.70% | 0.78% | 0.91% | 0.07% | |
| CAD | -0.32% | -0.38% | 0.00% | -0.70% | 0.11% | 0.25% | -0.67% | |
| AUD | -0.42% | -0.42% | -0.02% | -0.78% | -0.11% | 0.23% | -0.73% | |
| NZD | -0.58% | -0.60% | -0.24% | -0.91% | -0.25% | -0.23% | -0.89% | |
| CHF | 0.35% | 0.35% | 0.62% | -0.07% | 0.67% | 0.73% | 0.89% |
The heat map shows percentage changes of major currencies against each other. The base currency is picked from the left column, while the quote currency is picked from the top row. For example, if you pick the British Pound from the left column and move along the horizontal line to the US Dollar, the percentage change displayed in the box will represent GBP (base)/USD (quote).
Silver markets are likely to be weighed down by CTA selling activity, TDS macro analyst Daniel Ghali notes.
Fundamental outlook for Silver remains strong
“Current price action is already consistent with a selling program totaling -6% of algos' max size, equivalent to -28% of their current position size. The fundamental outlook for Silver remains strong, with Silver-for-solar continuing to make inroads and progressively capturing a growing share of total Silver demand as next-gen technology adoption continues to beat expectations, with notably higher Silver loadings.”
“Signs that Chinese manufacturers have started to thrift Silver are worth noting for the longer-term outlook, but likely won't make a dent in Silver demand growth for the coming year. Evidence of reflationary trends emerging should also be best expressed in the White Metal, given traditional industrial demand has been the primary concern over the last months in addition to risks emanating from gold positioning.”
- Silver price falls sharply below $32.00 as US bond yields rise further.
- Surprisingly upbeat US NFP data forced traders to pare Fed large rate cut bets.
- Middle East tensions are expected to offer support to the Silver price.
Silver price (XAG/USD) extends its downside below $32.00 in Monday’s European session. The white metal weakens as the US bond yields rise further, given that the likelihood of the Federal Reserve (Fed) delivering another larger-than-usual 50 basis points (bps) interest rate cut in November has gone off the table.
10-year US Treasury yields jump slightly above 4%. Higher yields on interest-bearing assets reduce the opportunity cost of holding an investment in non-yielding assets, such as Silver. The US Dollar Index (DXY), which tracks the Greenback’s value against six major currencies, clings to gains near 102.50.
However, the Silver is unlikely to turn extremely bearish amid growing tensions between Iran and Israel. Historically, geopolitical tensions improve demand for precious metals as a safe haven.
Market speculation for Fed large rate cuts waned after the United States (US) employment report for September showed strong labor demand and robust wage growth. Traders are pricing a Fed 25 bps interest rate cut in November, according to the CME FedWatch tool.
Upbeat labor market data has diminished fears of an economic slowdown, which forced traders to be bet for a second consecutive 50 bps interest rate cut in September.
Going forward, the next move in the Silver price will be influenced by the US Consumer Price Index (CPI) data for September, which will be published on Thursday. Economists expect the core CPI – which excludes volatile food and energy prices – to have grown steadily by 3.2%.
Silver technical analysis
Silver price continues to face pressure near the horizontal resistance plotted from the May 20 high of $32.50 on a daily timeframe. The white metal strives for more upside as the outlook is upbeat due to upward-sloping 20 and 50-day Exponential Moving Averages (EMAs), which trade around $31.00 and $30.00, respectively.
The 14-day Relative Strength Index (RSI) remains in the bullish range of 60.00-80.00, suggesting more upside ahead.
Silver daily chart
Silver FAQs
Silver is a precious metal highly traded among investors. It has been historically used as a store of value and a medium of exchange. Although less popular than Gold, traders may turn to Silver to diversify their investment portfolio, for its intrinsic value or as a potential hedge during high-inflation periods. Investors can buy physical Silver, in coins or in bars, or trade it through vehicles such as Exchange Traded Funds, which track its price on international markets.
Silver prices can move due to a wide range of factors. Geopolitical instability or fears of a deep recession can make Silver price escalate due to its safe-haven status, although to a lesser extent than Gold's. As a yieldless asset, Silver tends to rise with lower interest rates. Its moves also depend on how the US Dollar (USD) behaves as the asset is priced in dollars (XAG/USD). A strong Dollar tends to keep the price of Silver at bay, whereas a weaker Dollar is likely to propel prices up. Other factors such as investment demand, mining supply – Silver is much more abundant than Gold – and recycling rates can also affect prices.
Silver is widely used in industry, particularly in sectors such as electronics or solar energy, as it has one of the highest electric conductivity of all metals – more than Copper and Gold. A surge in demand can increase prices, while a decline tends to lower them. Dynamics in the US, Chinese and Indian economies can also contribute to price swings: for the US and particularly China, their big industrial sectors use Silver in various processes; in India, consumers’ demand for the precious metal for jewellery also plays a key role in setting prices.
Silver prices tend to follow Gold's moves. When Gold prices rise, Silver typically follows suit, as their status as safe-haven assets is similar. The Gold/Silver ratio, which shows the number of ounces of Silver needed to equal the value of one ounce of Gold, may help to determine the relative valuation between both metals. Some investors may consider a high ratio as an indicator that Silver is undervalued, or Gold is overvalued. On the contrary, a low ratio might suggest that Gold is undervalued relative to Silver.
- USD/JPY decisively breaks above a critical level in a bullish sign.
- It may also have completed a three-wave correction of the medium-term downtrend with more bearish implications.
USD/JPY decisively pieces and closes above both its long-term trendline and key upside obstacle in the form of the 147.24 October 3 high. This lends credence to the bullish view and suggests a possible continuation of the short-term uptrend to a tentative target at the next key resistance level of 149.40, the August 15 high.
USD/JPY Daily Chart
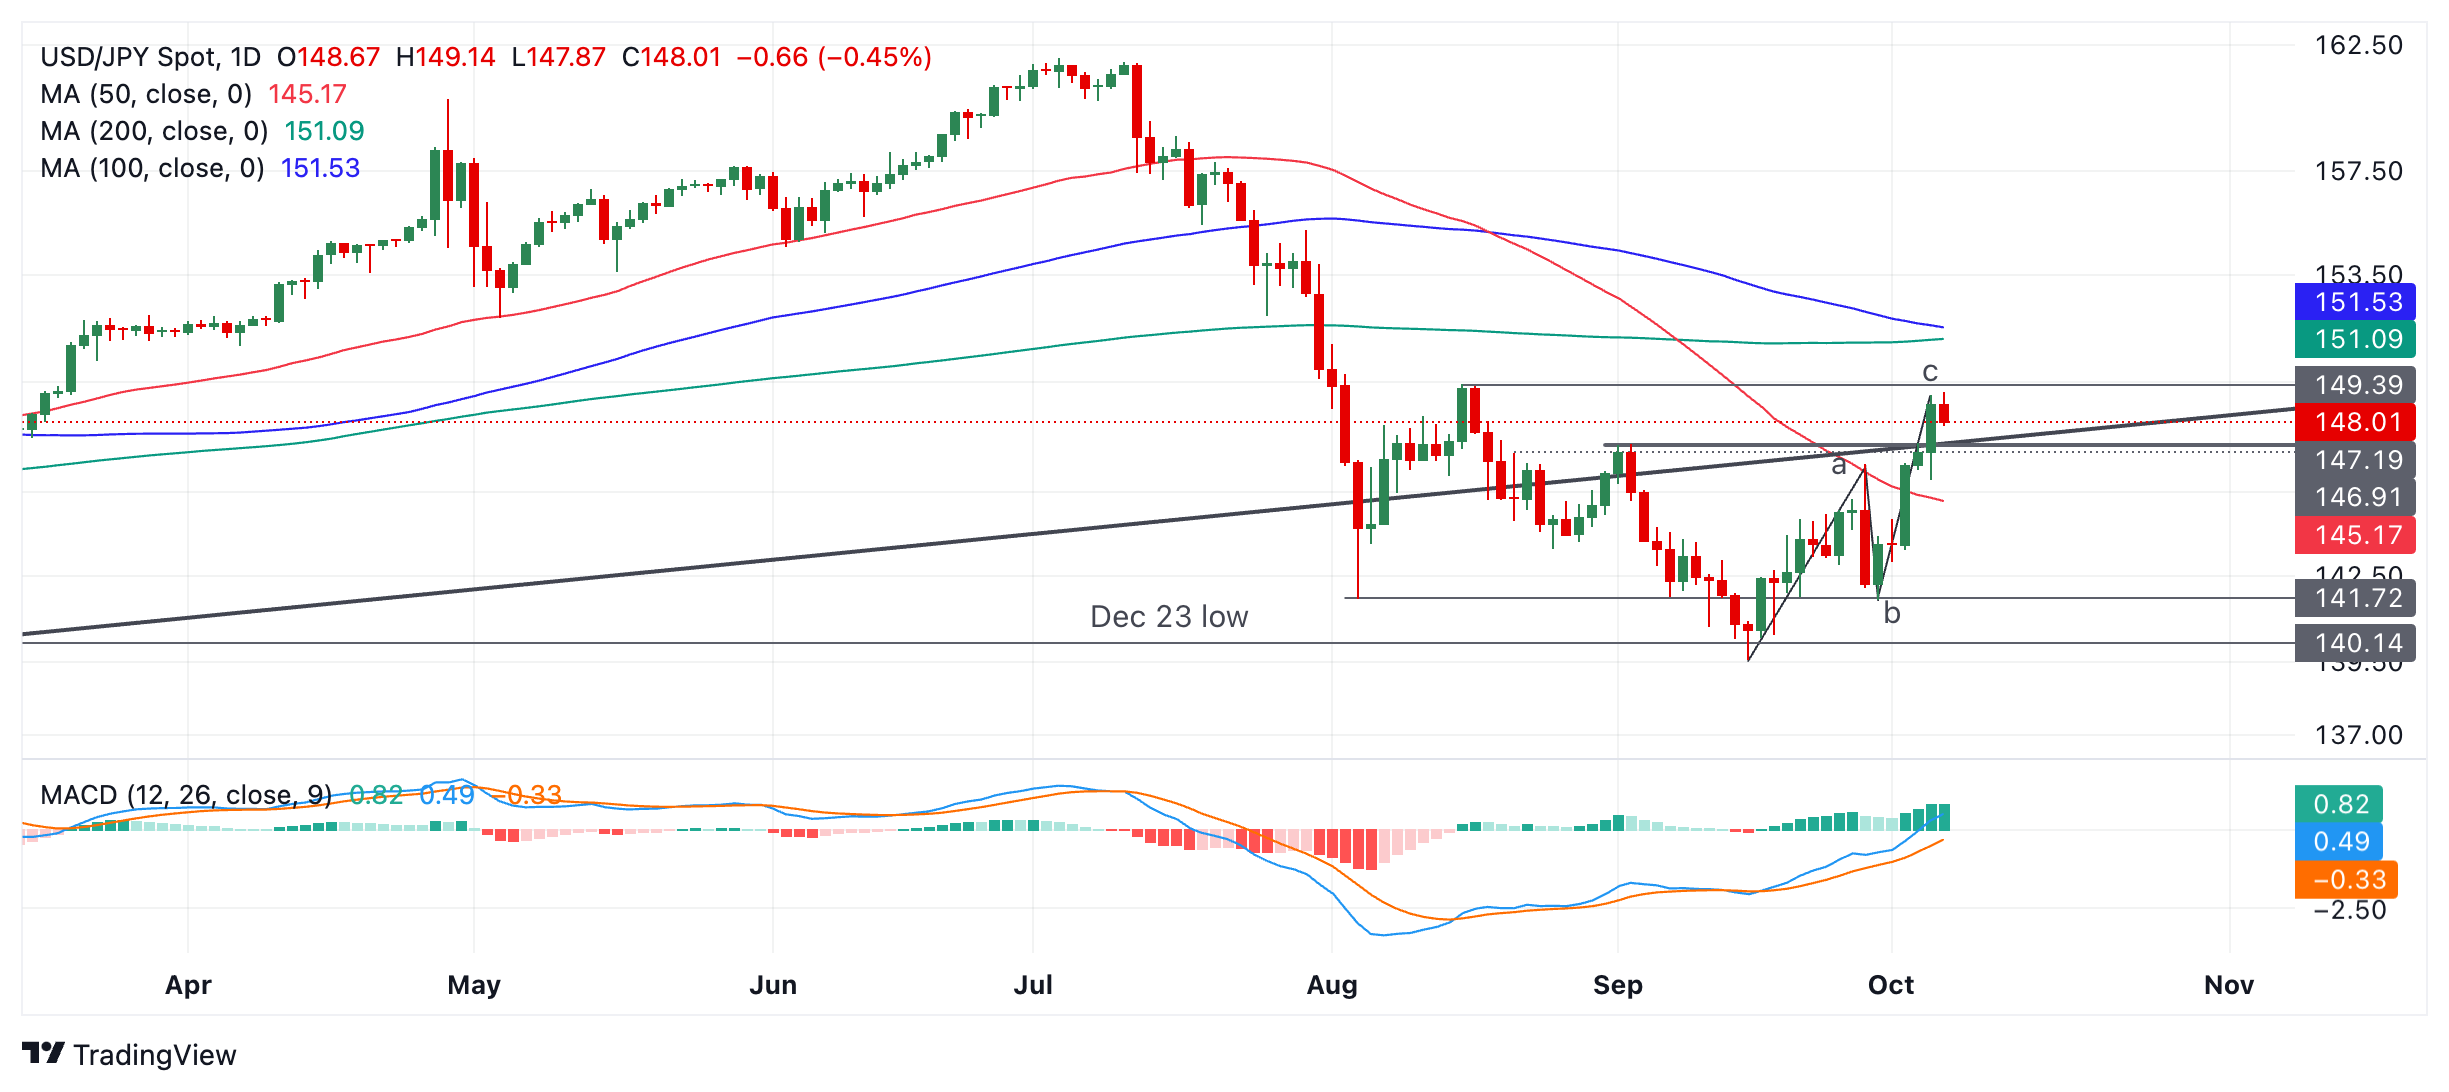
Momentum is broadly bullish since the August bottom and the Moving Average Convergence Divergence (MACD) indicator has consistently converged with price during September, and is now in positive territory.
A close above 149.40 would provide more confirmation of an extension of the short-term uptrend higher, with the next target potentially at 151.09 and the 200-day Simple Moving Average (SMA).
Yet bullish enthusiasm should be tempered by the possibility that USD/JPY may have formed a three-wave “abc” corrective pattern of the medium-term downtrend during July. If so, the pair may start to decline again as the longer-term bearish cycle starts to take hold. However, it is still too early to say with any confidence and price action itself is not evidencing any weakness yet.
A close below the 50-day SMA at 145.24 would probably indicate a resumption of the medium-term downtrend from the summer. Such a move would be expected to reach the wave B lows at around 141.72.
- EUR/JPY declines almost half a percent after the release of weaker-than-expected Retail Sales and Factory Orders.
- Verbal intervention by Japanese officials stems JPY’s slow depreciation and adds to EUR/JPY’s downside.
- A decline in German Factory Orders revives fears the country may be entering a recession.
EUR/JPY trades down almost half a percent in the 162.50s on Monday as it closes in on the ceiling of its multi-week trading range from the early August lows. Bears are driving the Euro (EUR) lower following the release of lackluster macroeconomic data for the region.
The pair faces further headwinds as the Japanese Yen (JPY) firms up following verbal intervention by the Japanese FX diplomat Atsushi Mimura who, seeing the currency’s recent weakness – especially against the US Dollar (USD) – cautioned against speculative moves. Continued demand for the Yen as a safe-haven amid an escalation in geopolitical risk stemming from the conflict in the Middle East further underpins the Japanese currency and adds down-side pressure to EUR/JPY.
Traders opt to sell the Euro on Monday after the release of Eurozone Retail Sales showed only a 0.80% annual rise in August which was weaker than the 1.0% expected, but higher than the 0.1% decline in July. German Factory Orders, meanwhile, declined by 5.8% on a seasonally adjusted basis in August, which was well below the 2.0% decline expected and the upwardly-revised 3.9% rise of the previous month. The data adds further veracity to the view that the country is sliding into a recession.
EUR/JPY is likely to see its untidy progress higher capped by rising expectations that the European Central Bank (ECB) will cut interest rates at its meeting next week. Lower interest rates are usually negative for a currency as they reduce foreign capital inflows.
ECB Governing Council member François Villeroy de Galhau said overnight that the ECB will “quite probably” cut interest rates at the meeting, adding the ECB has to pay attention to the risk of undershooting its 2.0% inflation target “due to a weak growth and a restrictive monetary policy for too long.” His comments “support market pricing for a total 150 bp of easing over the next 12 months” according to analysts at Brown Brothers Harriman (BBH).
Most recently the Eurozone Harmonized Index of Consumer Prices (HICP) showed prices rose by 1.8% in September from 2.2% previously and below the 1.9% forecast, according to Eurostat. Core HICP fell to 2.7% from 2.8% previously and the same expected. The undershooting inflation data backs up comments from the ECB President Christine Lagarde who hinted that inflation was falling back to the central bank’s 2.0% target, as expected. "The latest developments strengthen our confidence that inflation will return to target in a timely manner," she said last week.
EUR/JPY had been on the rise last week after Japan’s new Prime Minister Shigeru Ishiba and his Economy Minister Ryosei Akazawa caution before raising interest rates given the “current economic conditions”. This wrong-footed markets which had expected him to take a neutral approach.
- NZD/USD slides below 0.6150 as investors turn cautious ahead of RBNZ policy decision.
- Middle East tensions have kept the risk-aversion theme intact.
- NZD/USD trades below the 20- and 50-day EMAs.
The NZD/USD pair extends its losing spree for the fifth trading session on Monday. The Kiwi asset weakens on multiple tailwinds: weakens in the New Zealand Dollar (NZD) amid caution ahead of the Reserve Bank of New Zealand’s (RBNZ) monetary policy decision and a firm US Dollar (USD) due to waned Federal Reserve (Fed) large rate cut bets for November.
Market participants expect the RBNZ to cut its Official Cash Rate (OCR) for the second time on Wednesday. However, the rate cut size is expected to be 50 basis points (bps) against 25 bps. The RBNZ is expected to announce a hefty rate cut with the intention of uplifting economic growth. The Kiwi economy is going through a rough phase due to the poor demand environment in the domestic and global markets.
Meanwhile, an all-out war between Israel and Iran has also dampened the appeal of risk-sensitive assets. The S&P 500 opens on a bearish note. The US Dollar Index (DXY), which gauges Greenback’s value against six major currencies, clings to gains near the seven-week high of 102.60.
The expectations for the Fed another 50-bps rate cut in November have been wiped out after the United States (US) Nonfarm Payrolls (NFP) for September surprisingly came in highest at 254K since March. Going forward, investors will focus on the US Consumer Price Index (CPI) data for September, which will be published on Thursday.
NZD/USD faces a sharp sell-off after failing to recapture the yearly high of 0.6410. The Kiwi asset extends its downside below the 20-and 50-day Exponential Moving Averages (EMAs), which trade around 0.6230 and 0.6180, respectively.
The 14-day Relative Strength Index (RSI) declines toward 40.00, suggesting a weakening of momentum.
More downside would appear if the pair breaks below the horizontal support plotted from September 11 low around 0.6100. The asset would decline further towards May 3 high of 0.6046 and the psychological support of 0.6000 if it breaks below September 11 low.
On the flip side, a reversal move above the 20-day EMA at 0.6230 will drive the asset towards September 3 high of 0.6302 and September 30 high near 0.6380.
NZD/USD daily chart
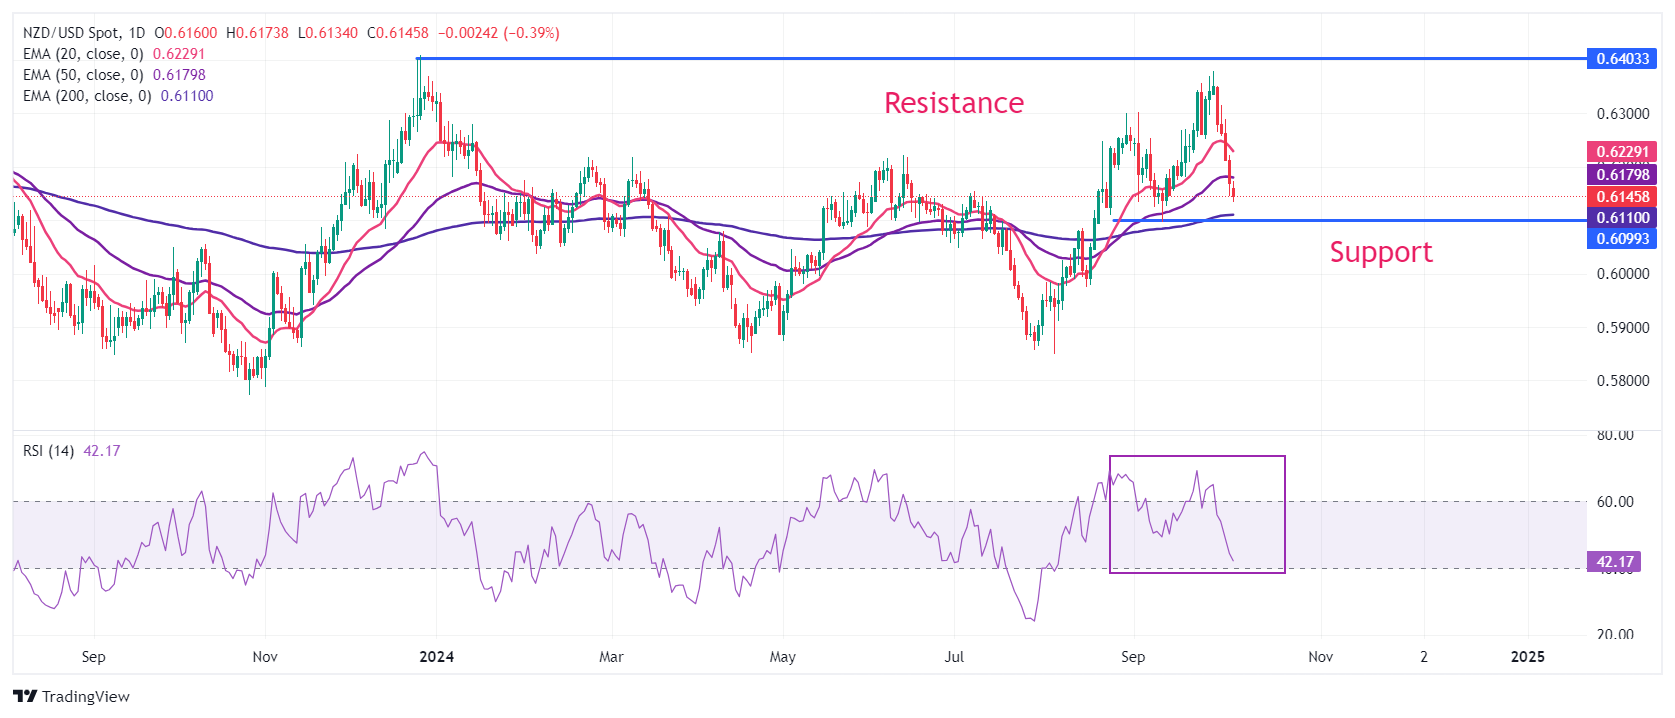
New Zealand Dollar FAQs
The New Zealand Dollar (NZD), also known as the Kiwi, is a well-known traded currency among investors. Its value is broadly determined by the health of the New Zealand economy and the country’s central bank policy. Still, there are some unique particularities that also can make NZD move. The performance of the Chinese economy tends to move the Kiwi because China is New Zealand’s biggest trading partner. Bad news for the Chinese economy likely means less New Zealand exports to the country, hitting the economy and thus its currency. Another factor moving NZD is dairy prices as the dairy industry is New Zealand’s main export. High dairy prices boost export income, contributing positively to the economy and thus to the NZD.
The Reserve Bank of New Zealand (RBNZ) aims to achieve and maintain an inflation rate between 1% and 3% over the medium term, with a focus to keep it near the 2% mid-point. To this end, the bank sets an appropriate level of interest rates. When inflation is too high, the RBNZ will increase interest rates to cool the economy, but the move will also make bond yields higher, increasing investors’ appeal to invest in the country and thus boosting NZD. On the contrary, lower interest rates tend to weaken NZD. The so-called rate differential, or how rates in New Zealand are or are expected to be compared to the ones set by the US Federal Reserve, can also play a key role in moving the NZD/USD pair.
Macroeconomic data releases in New Zealand are key to assess the state of the economy and can impact the New Zealand Dollar’s (NZD) valuation. A strong economy, based on high economic growth, low unemployment and high confidence is good for NZD. High economic growth attracts foreign investment and may encourage the Reserve Bank of New Zealand to increase interest rates, if this economic strength comes together with elevated inflation. Conversely, if economic data is weak, NZD is likely to depreciate.
The New Zealand Dollar (NZD) tends to strengthen during risk-on periods, or when investors perceive that broader market risks are low and are optimistic about growth. This tends to lead to a more favorable outlook for commodities and so-called ‘commodity currencies’ such as the Kiwi. Conversely, NZD tends to weaken at times of market turbulence or economic uncertainty as investors tend to sell higher-risk assets and flee to the more-stable safe havens.
EUR/USD continued its fall below 1.10 but the EUR’s undertone looks soft, Scotiabank’s Chief FX Strategist Shaun Osborne notes.
Dovish ECB and soft techs point to weakness
“EUR/USD losses have steadied below 1.10 but the EUR’s undertone looks soft amid a sharp widening in EZ/US spreads (by around 40bps for 2Y cash bonds) since the middle of September amid weak Eurozone activity and softening inflation. ECB Vice President Villeroy said the central bank will ‘quite probably’ cut rates again this month.”
“The EUR is likely to remain soft ahead of the ECB decision on the 17th. EURUSD losses have slowed around the 1.0950 point and short-term price action suggests a potential (minor) low may be developing.”
“Still, the bigger technical picture suggests that, after repeated failures around the 1.12 area over the past few weeks, the loss of support at the 1.10 point (the low between the tests of 1.12 and now resistance) has triggered an effective double top which points to losses extending to the 1.08 area in the next 1-2 months.”
The European Union (EU) voted last Friday to impose an additional 35% on imports of Chinese electric vehicles (EV).
Chinese market remains closed today
“It comes on top of the existing 10% levy, bringing the total to 45%. It will be effective at the end of this month and last for five years. It follows a year-long investigation by the European Commission into the EV market. It concluded that Chinese EV makers received heavy state subsidies, including their suppliers.”
“Chinese automakers in the European market face a difficult decision, either absorb the tariffs, which will reduce profit margins, or raise prices and risk a decline in demand. Some producers are considering shifting production to Europe to avoid the tariffs. China has already threatened to impose tariffs on European brandy, dairy, pork, and auto imports. Nevertheless, both parties have expressed willingness to continue negotiations for an alternative solution that will adequately address concerns over China’s huge state subsidies.”
“10 member states reportedly voted in favour of the additional tariffs, including France, Italy, and Poland. 5 members, including Germany, Hungary, Slovakia, Slovenia, and Malta, voted against them. China is a major export market for Germany and Hungary who had pushed for a more muted response. The remaining 12 members abstained. The Chinese market remains closed today and will reopen tomorrow.”
The Pound Sterling (GBP) has underperformed over the past few sessions, losing ground to the USD and EUR since Wednesday, Scotiabank’s Chief FX Strategist Shaun Osborne notes.
GBP slips to minor new cycle lows
“EURGBP’s rebound through the 0.84 area appears to have stalled but the rebound in the cross may blunt the sustained run of GBP gains against the EUR in the past few months for now.”
“Bearish—minor new, short-term cycle lows for Cable this morning are keeping the broader GBP tone weak. Losses from the recent peaks just above 1.34 risk extending to test key support at 1.30 amid a pickup in bearish momentum. Resistance is 1.3175.”
- Crude Oil jumps over 2% on Monday after the Biden administration verbally pushed back on targeting Iranian oil fields.
- Markets are pricing in even more risk premium, with uncertainty ruling now over Israel’s next step in this escalation.
- The US Dollar Index steadies near recent highs ahead of a Fed-packed Monday.
Crude Oil is sprinting higher on Monday after Israel got a red light on its request to bomb Iranian oil fields. United States (US) President Joe Biden said on Friday that it was under consideration, suggesting that other targets should be looked for instead. With no headlines that the Biden administration has given the green light, it looks like Israel will revert to other actions, which adds to even more uncertainty.
The US Dollar Index (DXY), which tracks the performance of the Greenback against six other currencies, is trading broadly flat on Monday. All eyes will be on the September’s US Consumer Price Index (CPI) release later this week. In the run-up to those numbers, markets will hear from no less than four Fed officials this Monday.
At the time of writing, Crude Oil (WTI) trades at $75.78 and Brent Crude at $79.53.
Oil news and market movers: Markets unease of Israel’s uncertainty
- Oil production is suspended at Kashagan’s major Gas and Oil field due to the start of scheduled overhaul, the Kazakhstan Ministry of Energy confirms to Interfax.
- A Goldman Sachs note from head analyst Daan Struyven sees Brent hit $90 when Iranian exports would be disrupted, Bloomberg reports.
- Tension in the Middle East remained elevated with over the weekend Israel sending in troops in northern Gaza, while aerial attacks and ground maneuvres in Lebanon were taking place at the same time, Reuters reported.
- Option markets are seeing a wave of buyers coming in with an appetite for call options, sending implied volatility for Brent to the highest level in almost a year, while money managers added more net-long positions to their portfolios, the Chicago Futures Trading Commission reported.
Oil Technical Analysis: There goes $75.00
Crude Oil prices are going through the roof again, with WTI popping above $75.00 for the first time since the end of August. The fact that the Biden administration has not really confirmed or fully rejected the call from Israel to attack Iranian oil fields is creating ever more uncertainty for markets. With uncertainty comes risk premium, which is being priced this Monday.
The current Crude Oil price level, with the red descending trendline and the 100-day Simple Moving Average (SMA) in the chart below at $75.74 just hovering above it, makes that region very difficult to break through. Once snapping above there, the 200-day SMA at $77.12 should refute any further upticks.
On the downside, old resistances have turned into supports. First is the 55-day SMA at $72.73, which acts as a potential first line of defence in case of any retreat. A bit further down, $71.46 comes into play as second support before looking back to the $70.00 big figure and $67.11 as ultimate support for traders to buy the dip.
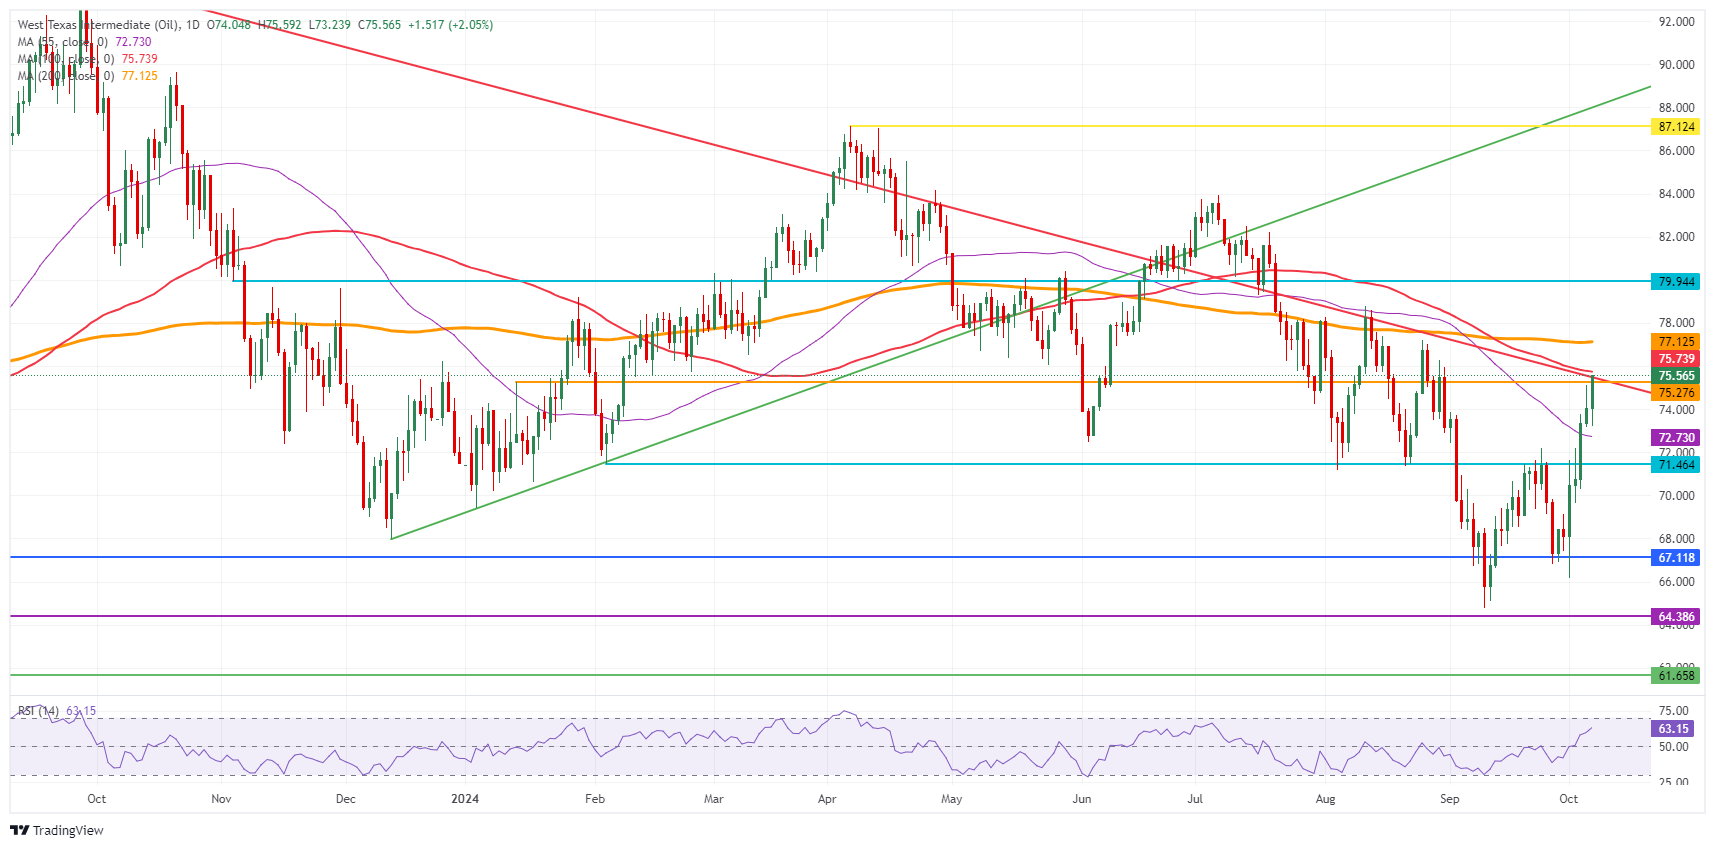
US WTI Crude Oil: Daily Chart
WTI Oil FAQs
WTI Oil is a type of Crude Oil sold on international markets. The WTI stands for West Texas Intermediate, one of three major types including Brent and Dubai Crude. WTI is also referred to as “light” and “sweet” because of its relatively low gravity and sulfur content respectively. It is considered a high quality Oil that is easily refined. It is sourced in the United States and distributed via the Cushing hub, which is considered “The Pipeline Crossroads of the World”. It is a benchmark for the Oil market and WTI price is frequently quoted in the media.
Like all assets, supply and demand are the key drivers of WTI Oil price. As such, global growth can be a driver of increased demand and vice versa for weak global growth. Political instability, wars, and sanctions can disrupt supply and impact prices. The decisions of OPEC, a group of major Oil-producing countries, is another key driver of price. The value of the US Dollar influences the price of WTI Crude Oil, since Oil is predominantly traded in US Dollars, thus a weaker US Dollar can make Oil more affordable and vice versa.
The weekly Oil inventory reports published by the American Petroleum Institute (API) and the Energy Information Agency (EIA) impact the price of WTI Oil. Changes in inventories reflect fluctuating supply and demand. If the data shows a drop in inventories it can indicate increased demand, pushing up Oil price. Higher inventories can reflect increased supply, pushing down prices. API’s report is published every Tuesday and EIA’s the day after. Their results are usually similar, falling within 1% of each other 75% of the time. The EIA data is considered more reliable, since it is a government agency.
OPEC (Organization of the Petroleum Exporting Countries) is a group of 12 Oil-producing nations who collectively decide production quotas for member countries at twice-yearly meetings. Their decisions often impact WTI Oil prices. When OPEC decides to lower quotas, it can tighten supply, pushing up Oil prices. When OPEC increases production, it has the opposite effect. OPEC+ refers to an expanded group that includes ten extra non-OPEC members, the most notable of which is Russia.
- USD/CHF breaks out of range, peaks and corrects.
- It may be forming a Bull Flag pattern with further upside potential.
USD/CHF pulls back after breaking out of its multi-week range and rallying substantially higher on Friday.
Since breaking out, the pair is now in a short-term uptrend and given it is a key tenet of technical analysis theory that “the trend is your friend” the odds favor a continuation higher.
USD/CHF 4-hour Chart
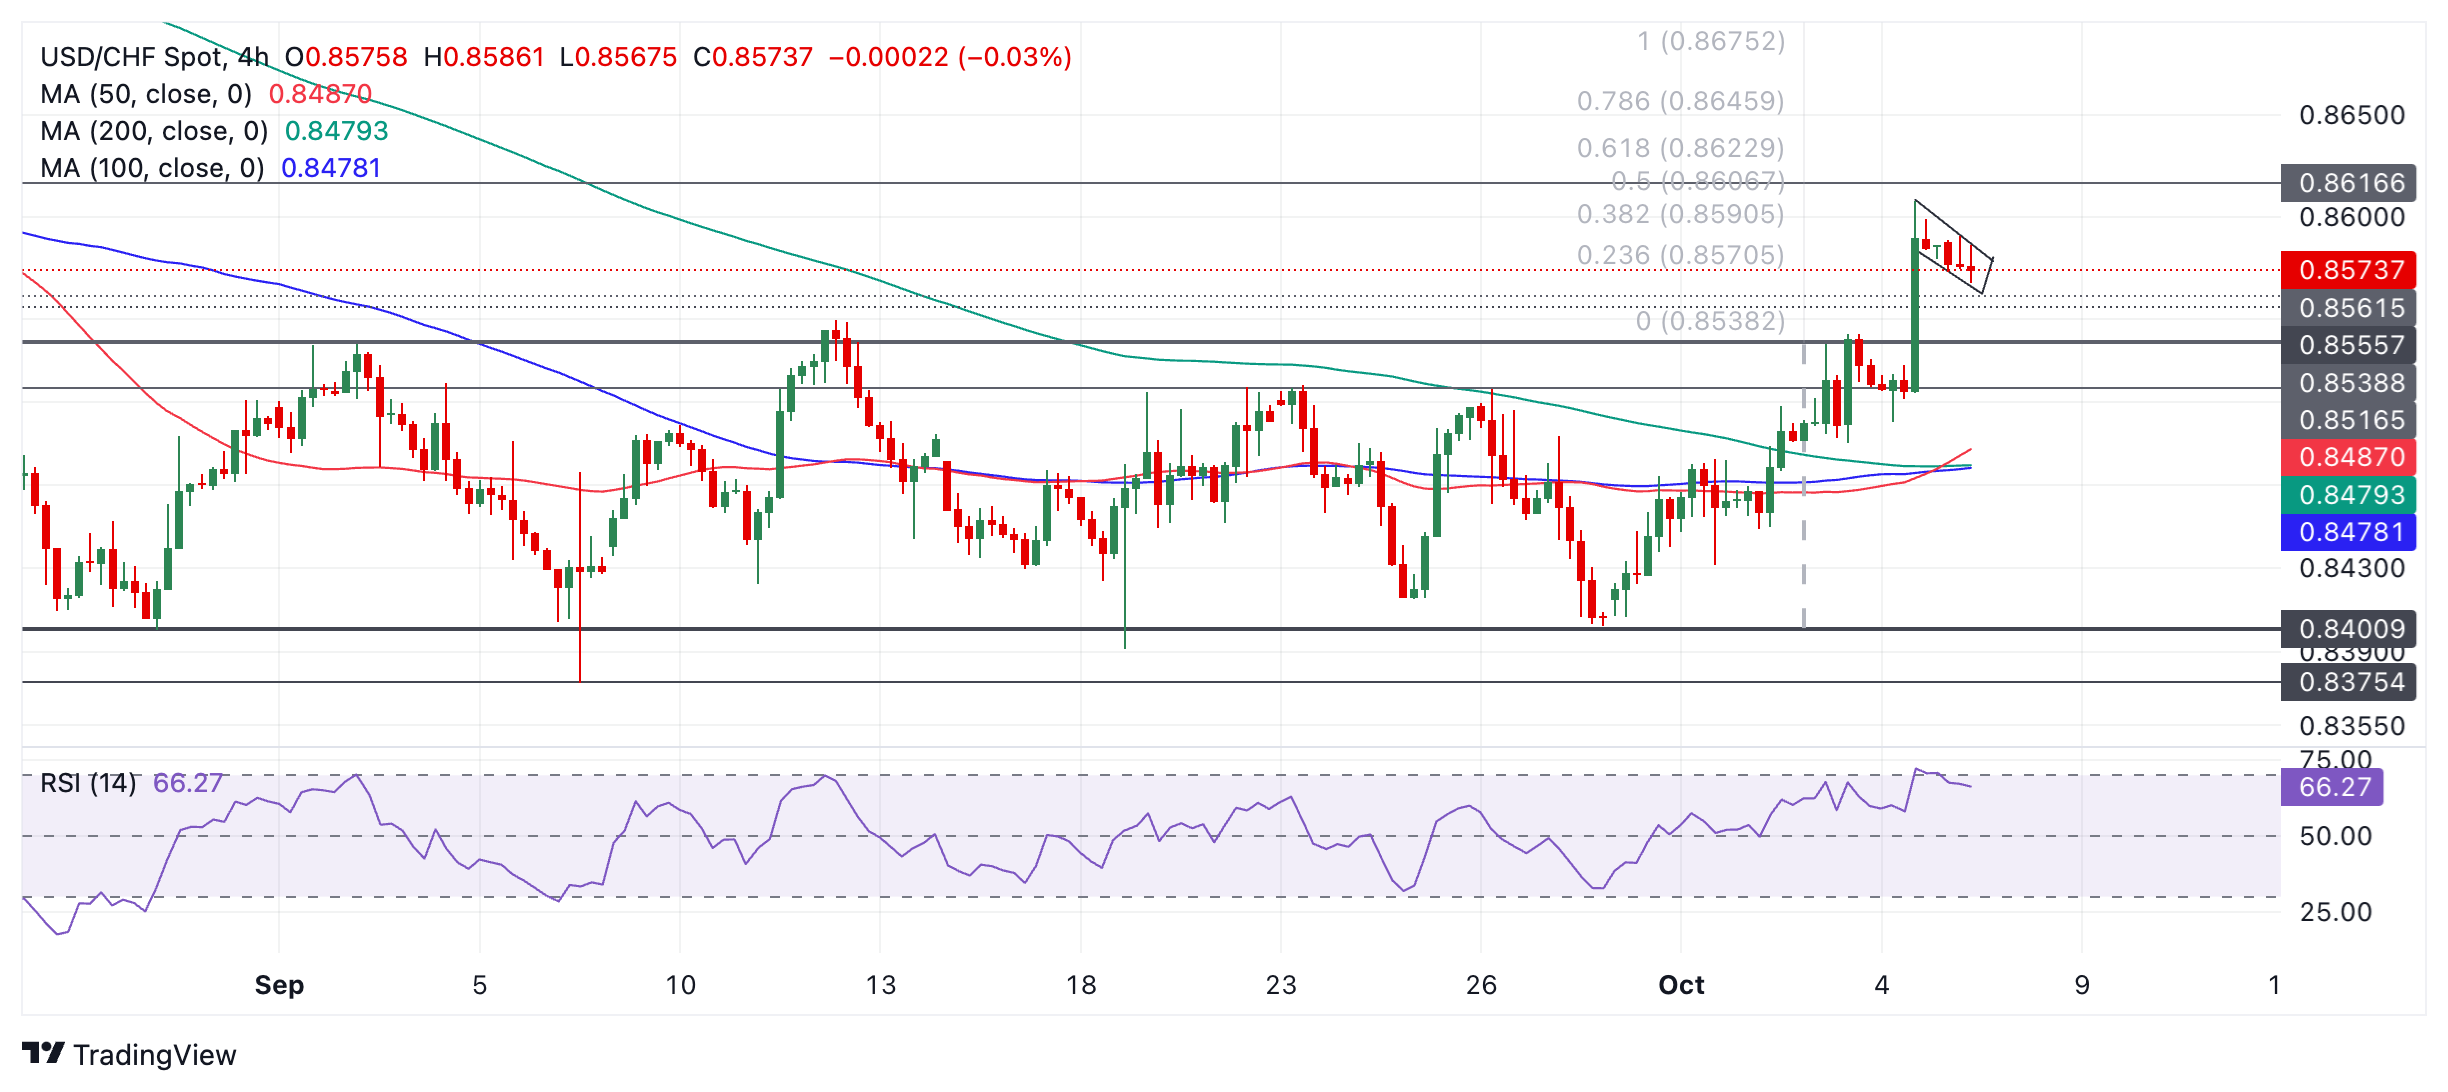
USD/CHF has pulled back over recent periods and in so doing has formed what looks like a Bull Flag pattern. These are composed of a sharp rally called the “pole” and a pullback (the “flag square”). If this is the case then a break above the 0.8607 high of the flag would lead to a rally to around 0.8619 (Fibonacci 61.8% of the pole extrapolated higher) at a minimum and around 0.8650 (100% extrapolation of the pole) as a maximum.
A minimum upside target also lies at 0.8617 (August 14 swing low), or 0.8622 (Fibonacci 61.8% extrapolation of the height of the prior range higher). A really bullish move could reach 0.8675, the 100% extrapolation of the height of the range.
The Relative Strength Index (RSI) moved into overbought territory when the breakout rally peaked. It has since come back down into neutral territory during the pullback in price. This is a bearish sign and suggests a deeper correction may develop. Support lies at 0.8550 (September 12 high) and even tougher support at 0.8540 (the top of the range).
The Canadian Dollar (CAD) has softened against the stronger US Dollar (USD) over the past week but losses are relatively contained, leaving the CAD as the top-performing G10 currency over the past five days with a drop of a little under 0.5% (versus a 3% drop for the JPY and NZD and a 1.8% decline in the AUD), Scotiabank’s Chief FX Strategist Shaun Osborne notes.
CAD softer but holds recent range
The CAD is holding within its recent trading range in effect. US-Canada spreads have widened, supporting the firmer USD tone, but 2Y spreads are also holding within recent ranges.”
“Tensions on the Middle East are supporting firmer crude oil while broader gains in non-energy commodities over the past month are driving a rebound in Canadian terms of trade which should also help limit pressure on the CAD.”
“The USD’s firmer undertone has taken spot back to the 1.36 area and, on the face of it, there is little to suggest that gains won’t extend a little more to retest the September peak just under 1.3650. Little, that is, apart from a cluster of moving average resistance points (50-, 200-day, 50-week) converging around the 1.36 point which may serve as a cap on the USD for now. Support is 1.3550.”
The US Dollar (USD) could strengthen further, but it remains to be seen if it can maintain the rapid pace of advance, UOB Group FX analysts Quek Ser Leang and Peter Chia note.
The level to monitor is 7.1200
24-HOUR VIEW: “Last Friday, we expected USD to edge higher, but we were of the view that ‘any advance is unlikely to reach 7.0710.’ Instead of edging higher, USD surged, reaching a high of 7.1036. The sharp and swift rally appears to be overdone, and USD is unlikely to rise much further. Today, USD is more likely to trade in a range, probably between 7.0700 and 7.1050.”
1-3 WEEKS VIEW: “The level to monitor is 7.1200. Last Thursday (03 Oct, spot at 7.0380), we indicated that ‘the recent USD weakness has stabilised.’ We also indicated that ‘the current price movements are likely part of a range trading phase, probably between 6.9900 and 7.0800.’ On Friday, USD surged above 7.0800 and reached 7.1036. USD closed on a strong note, up by 0.69% (7.0991), its second biggest 1-day gain this year. While further USD strength is not ruled out, it remains to be seen if it can maintain the rapid pace of advance. The level to monitor is 7.1200. In order to maintain the rapid buildup of momentum, USD must not break below 7.0500.”
- Gold finds support from continued safe-haven flows and demand from long-term investors.
- This acts as a counter-weight to pressure from reduced expectations of interest rates being slashed in the US.
- Technically, XAU/USD continues consolidating in a medium and long-term uptrend.
Gold (XAU/USD) continues to bounce down a roughly week-long range between about $2,630 and $2,670 on Monday after the release of negative-for-Gold US employment data gets neutralized by persistent safe-haven demand.
According to data released on Friday, US Nonfarm Payrolls (NFP) beat economists’ expectations by a wide margin, rising by 254K in September when forecasts had only been for a 140K increase. The US Unemployment Rate, meanwhile, fell to 4.1% from 4.2% when markets had feared the opposite, according to data from the Bureau of Labor Statistics (BLS). The release revealed the US economy was in good shape, averting fears of a “hard landing”.
The reason the NFP report is important is because, since August, the labor market has taken over from inflation as the chief concern of the US Federal Reserve (Fed). It was then that Fed Chairman Jerome Powell stated in a pivotal speech that, "We do not seek or welcome further cooling in labor market conditions."
The better-than-expected NFP data significantly reduced the chances of the Fed making another double-dose 50 basis points (bps) (0.50%) rate cut at its November meeting. The probability of such an outcome has fallen to zero on Monday from around 35% prior to the release, with markets now even pricing in over a 10% chance of the Fed not cutting interest rates at all, according to the CME Fedwatch tool.
Consequently, the NFP release pushed the Gold price down to its low of the day at around $2,632 on Friday. This is because the expectation of interest rates remaining elevated reduces the attractiveness of Gold as a non-interest-paying asset and strengthens the US Dollar (USD), adding a further headwind to the yellow metal, which is mainly priced and traded in the currency.
Gold finds support from safe-haven demand
Gold price benefits from continued demand as a safe-haven asset as the conflict in the Middle East worsens and intensifies. According to the latest reports, Israeli forces have blown up a mosque in the southern Lebanese village of Yaroun, says Aljazeera News.
Markets are also on tenterhooks as Israel is widely expected to launch an imminent retaliatory attack on Iran after its rocket attack last week. Iran launched around 200 missiles, many of them ballistic, to avenge the death of Hassan Nasrallah, the head of the Iran-backed group Hezbollah.
The yellow metal is further supported by hopes of a revival in demand from China following the government’s decision to stimulate the economy with a huge package of measures. China constitutes Gold’s largest market, so the health of the Chinese economy can be a key factor that impacts its price.
Further, the overall trend lower in global interest rates – notwithstanding the recalibration of their trajectory in the US – enables Gold to retain its attractiveness as a portfolio asset.
Technical Analysis: Gold range-trade into trendline
Gold extends its narrow sideways move, clearly visible on the 4-hour chart below. It has also reached a key trendline which provides a firm level of support at the lows.
The immediate range is composed of a ceiling at $2,673 (October 1 high) and a floor at $2,632 (October 4 low) – whilst the trendline also offers a rising shelf of support in the mid $2,440s.
The short-term trend is sideways, and given the technical analysis principle that “the trend is your friend,” it is more likely than not to endure with price oscillating between the aforementioned poles.
XAU/USD 4-hour Chart
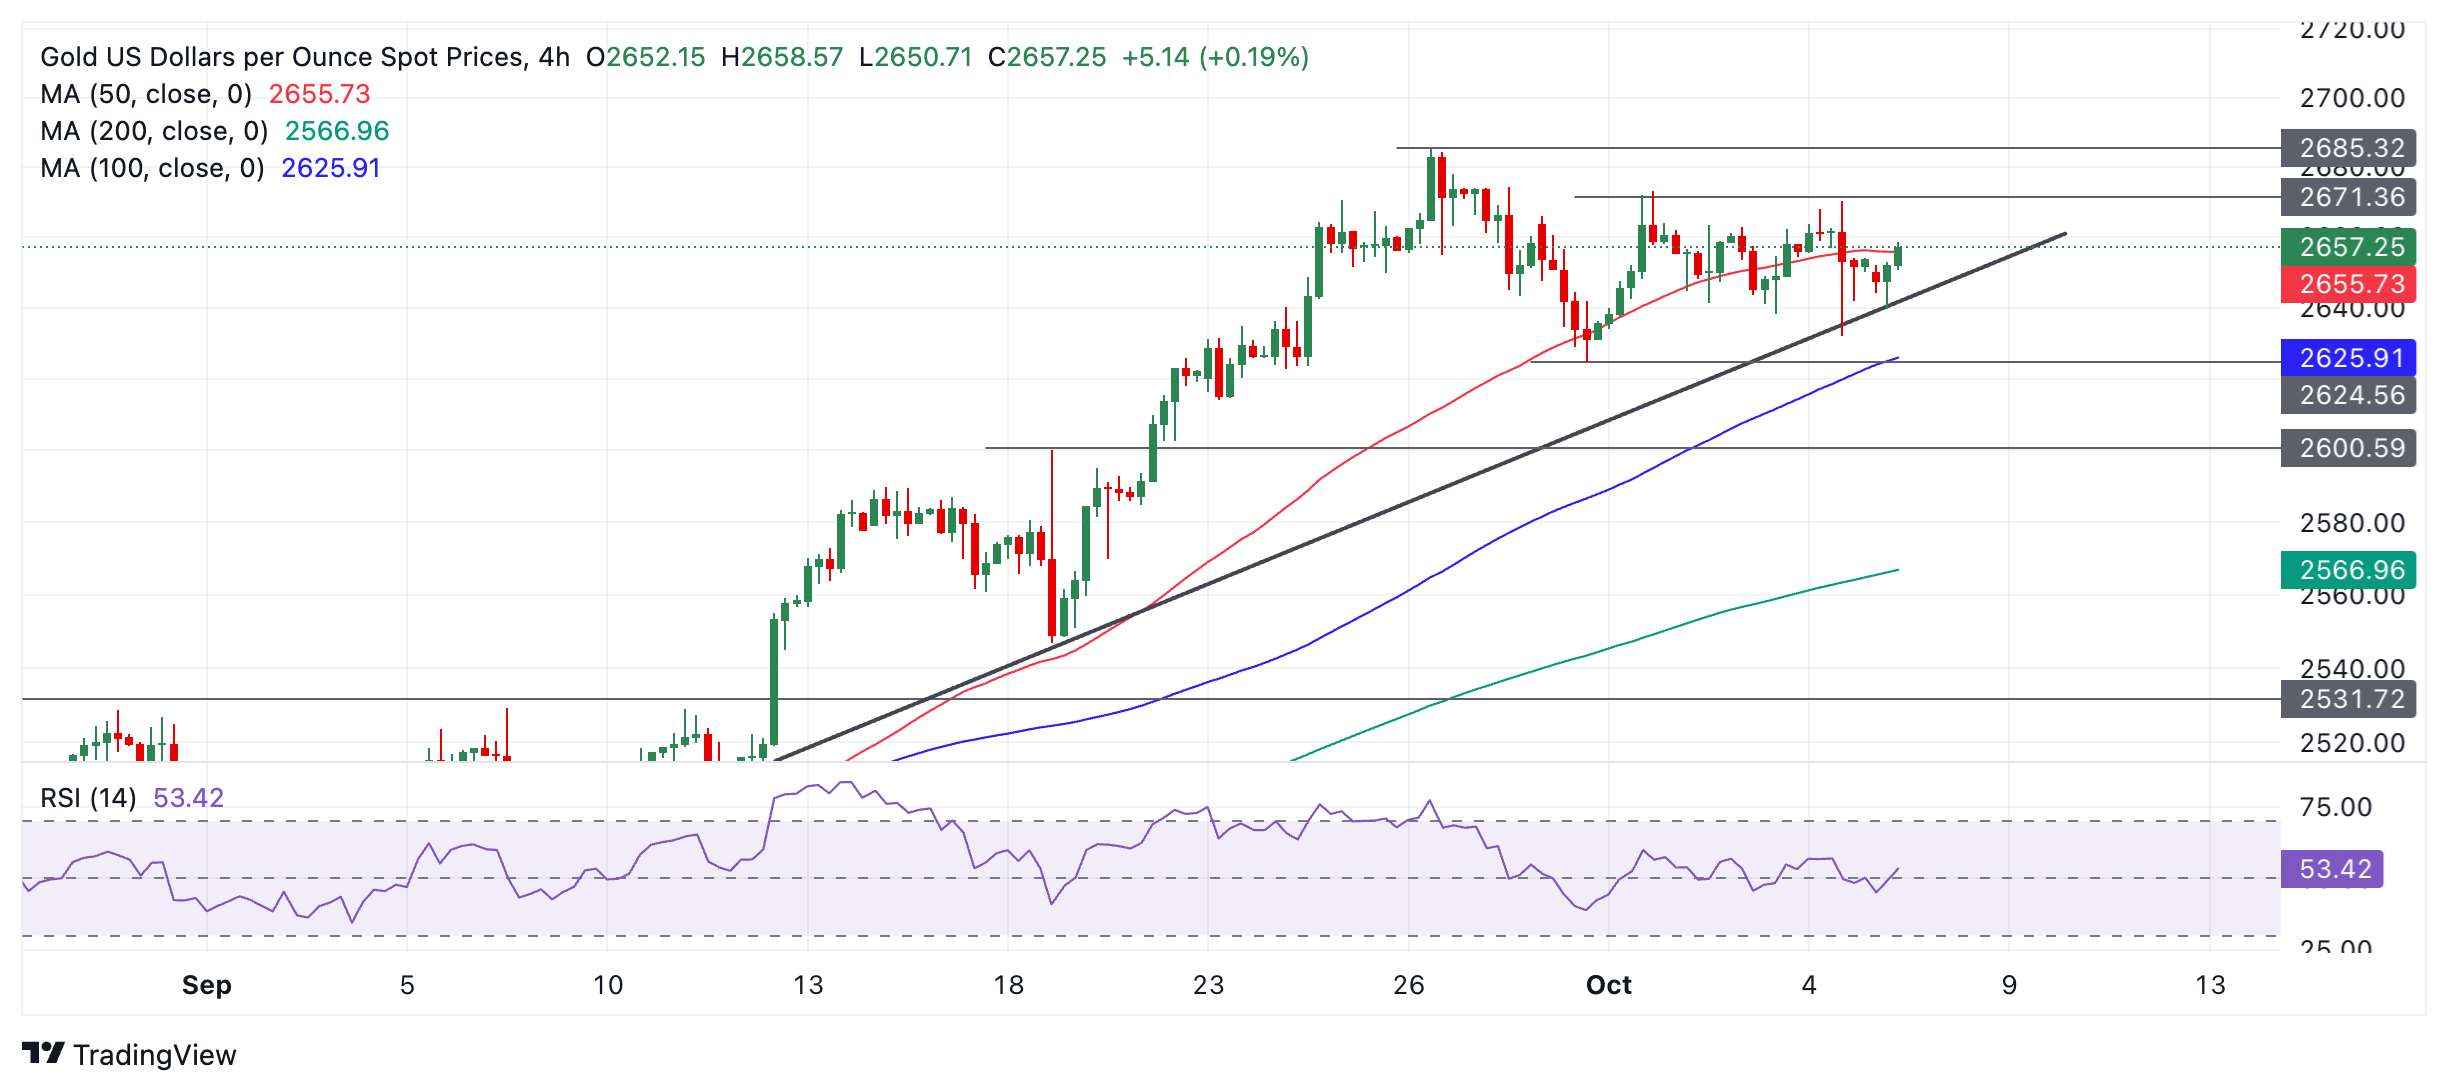
A break above $2,673 would increase the odds of a resumption of the old uptrend, probably leading to a continuation up to the round-number target at $2,700.
A break below $2.632 would lead to a move down to at least the swing low of $2,625 (September 30 low). A break below that level would likely see prices give way to support at $2,600 (August 18 high, round number).
On a medium and long-term basis, Gold remains in an uptrend, with the odds favoring an eventual resumption higher once the current period of consolidation has ended.
It would require a breakout either above the top of the range or below the bottom to confirm a new directional bias.
Economic Indicator
Nonfarm Payrolls
The Nonfarm Payrolls release presents the number of new jobs created in the US during the previous month in all non-agricultural businesses; it is released by the US Bureau of Labor Statistics (BLS). The monthly changes in payrolls can be extremely volatile. The number is also subject to strong reviews, which can also trigger volatility in the Forex board. Generally speaking, a high reading is seen as bullish for the US Dollar (USD), while a low reading is seen as bearish, although previous months' reviews and the Unemployment Rate are as relevant as the headline figure. The market's reaction, therefore, depends on how the market assesses all the data contained in the BLS report as a whole.
Read more.Last release: Fri Oct 04, 2024 12:30
Frequency: Monthly
Actual: 254K
Consensus: 140K
Previous: 142K
Source: US Bureau of Labor Statistics
America’s monthly jobs report is considered the most important economic indicator for forex traders. Released on the first Friday following the reported month, the change in the number of positions is closely correlated with the overall performance of the economy and is monitored by policymakers. Full employment is one of the Federal Reserve’s mandates and it considers developments in the labor market when setting its policies, thus impacting currencies. Despite several leading indicators shaping estimates, Nonfarm Payrolls tend to surprise markets and trigger substantial volatility. Actual figures beating the consensus tend to be USD bullish.
The US Dollar (USD) is consolidating last week’s solid rise, Scotiabank’s Chief FX Strategist Shaun Osborne notes.
USD retains a firm undertone on yields
“After strong gains last week, stocks are starting the week off on a slightly softer note while bonds are broadly weaker. US 10Y yields are trading above the 4% point for the first time in two months after Friday’s US jobs data erased the risk of another jumbo rate cut from the Fed in November. Yield spreads have moved supportively for the DXY and, with perhaps a little more focus on the looming presidential election in the US, the window for the USD to remain firm, or perhaps firm a little more, is clearly open.”
“The rebound in the USD comes a little earlier than the typical seasonal pick up we see in Q4 before a late year fade. The DXY’s performance on the charts is bullish following a positive close on the week through Friday. Intraday patterns suggest a minor consolidation ahead of another push higher, potentially to the 103-104 range in the next couple of weeks. The Fed’s Kashkari, Bostic and Musalem are speaking later today (the latter two after our market close).”
“Japan releases labour cash earnings data for August this evening. July’s numbers were revised down slightly (to 3.4%) from preliminary data but underlying trends in wages are still strong. Another firm gain in pay may not move the dial on low October tightening bets (less than 1bps priced in) for the 31st but should bolster expectations that the BoJ may tighten again at its next meeting on December 19th.”
- AUD/USD returns below 0.6800 as Fed large rate cut bets wane.
- US economic slowdown risks have been shrunk by the upbeat US NFP for September.
- Dismal market sentiment weighs heavily on the Australian Dollar.
The AUD/USD pair retreats after a short-lived pullback move slightly above the crucial resistance of 0.6800 in Monday’s European session. The Aussie asset continues its losing streak as the US Dollar (USD) gains further after the upbeat United States (US) employment data for September forced traders to unwind Federal Reserve (Fed) large rate cuts bets for the upcoming policy meeting in November.
Market participants expect the Fed to cut interest rates further by 25 basis points (bps) to 4.50%-4.75% in November after the US job report pointed a sharp increase in the number of payrolls and a stronger-than-expected wage growth. Before the US Nonfarm Payrolls (NFP) data release, financial markets were anticipating the Fed to continue with the larger-than-usual interest rate cut of 50 bps.
The US Dollar Index (DXY), which tracks the Greenback’s value against six major currencies, rises further to near 102.60.
For more clarity on the Fed’s interest rate action in November, investors will pay close attention to the US Consumer Price Index (CPI) data for September, which will be released on Thursday. The core CPI – which excludes volatile food and energy prices – is estimated to have grown steadily by 3.2%.
Meanwhile, the Australian Dollar (AUD) is under pressure due to risk-off market sentiment, driven by Middle East tensions. Historically, geopolitical risks weaken the appeal of risk-sensitive assets. Going forward, the next move in the AUD will be driven by the Reserve Bank of Australia (RBA) minutes of the September policy meeting. The RBA kept its Official Cash Rate (OCR) unchanged at 4.35% and didn’t offer any timeline to kickstart the rate-cut cycle.
Australian Dollar FAQs
One of the most significant factors for the Australian Dollar (AUD) is the level of interest rates set by the Reserve Bank of Australia (RBA). Because Australia is a resource-rich country another key driver is the price of its biggest export, Iron Ore. The health of the Chinese economy, its largest trading partner, is a factor, as well as inflation in Australia, its growth rate and Trade Balance. Market sentiment – whether investors are taking on more risky assets (risk-on) or seeking safe-havens (risk-off) – is also a factor, with risk-on positive for AUD.
The Reserve Bank of Australia (RBA) influences the Australian Dollar (AUD) by setting the level of interest rates that Australian banks can lend to each other. This influences the level of interest rates in the economy as a whole. The main goal of the RBA is to maintain a stable inflation rate of 2-3% by adjusting interest rates up or down. Relatively high interest rates compared to other major central banks support the AUD, and the opposite for relatively low. The RBA can also use quantitative easing and tightening to influence credit conditions, with the former AUD-negative and the latter AUD-positive.
China is Australia’s largest trading partner so the health of the Chinese economy is a major influence on the value of the Australian Dollar (AUD). When the Chinese economy is doing well it purchases more raw materials, goods and services from Australia, lifting demand for the AUD, and pushing up its value. The opposite is the case when the Chinese economy is not growing as fast as expected. Positive or negative surprises in Chinese growth data, therefore, often have a direct impact on the Australian Dollar and its pairs.
Iron Ore is Australia’s largest export, accounting for $118 billion a year according to data from 2021, with China as its primary destination. The price of Iron Ore, therefore, can be a driver of the Australian Dollar. Generally, if the price of Iron Ore rises, AUD also goes up, as aggregate demand for the currency increases. The opposite is the case if the price of Iron Ore falls. Higher Iron Ore prices also tend to result in a greater likelihood of a positive Trade Balance for Australia, which is also positive of the AUD.
The Trade Balance, which is the difference between what a country earns from its exports versus what it pays for its imports, is another factor that can influence the value of the Australian Dollar. If Australia produces highly sought after exports, then its currency will gain in value purely from the surplus demand created from foreign buyers seeking to purchase its exports versus what it spends to purchase imports. Therefore, a positive net Trade Balance strengthens the AUD, with the opposite effect if the Trade Balance is negative.
Last week was a very difficult one for the Japanese Yen (JPY), Commerzbank’s FX analyst Michael Pfister notes.
Further rate hike by BoJ is not a done deal
“Instead of trading around 142 at the start of the week, USD/JPY broke through 148 on Friday on the back of strong US employment data. However, the move is by no means solely due to USD weakness, as the JPY has depreciated by more than 5% against the USD since mid-September - the most of any major currency. The cause of this correction is likely to be growing evidence that a further rate hike by the Bank of Japan (BoJ) is not a done deal, as many market participants had hoped.”
“Rather, recent statements from officials have tended to suggest that such a move is conditionsbased. The latest such statement came last week from the new Japanese Prime Minister, Shigeru Ishiba, who said that Japan 'is not in environment now to raise rates again'. Ishiba then notably backtracked, stressing that monetary policy is the responsibility of the BoJ.”
“Nevertheless, in our view, the statements make it clear that Japanese officials are well aware that the case for further rate hikes is shaky, both in terms of inflation and the weakening real economy. The tide seems to have turned somewhat recently and perhaps officials feel that the JPY's appreciation has gone a little too far. Of course, the BoJ can change its mind quickly, but in our view, the past few weeks have been a warning shot to those who are overly bullish on the JPY.”
Impulsive momentum indicates further US Dollar (USD) strength; overbought conditions suggest 149.40 is likely out of reach today. In the longer run, USD is expected to continue to rise, potentially breaking above 149.40, UOB Group FX analysts Quek Ser Leang and Peter Chia note.
USD is expected to continue to rise
24-HOUR VIEW: “Our view for USD to trade in a range last Friday was incorrect. In NY trade, USD took off and surged to 149.00, closing on a strong note at 148.71 (+1.22%). The impulsive momentum indicates further USD strength, but severely overbought conditions suggest 149.40 is likely out of reach today. There is another resistance level at 149.00. To keep the momentum going, USD must not break below 147.50 with minor support at 148.10.”
1-3 WEEKS VIEW: “Our most recent narrative was from last Thursday (03 Oct, spot at 146.55), wherein ‘the recent strong advance in USD has resulted in a boost in upward momentum’ and ‘this could lead to USD rising to 148.00.’ Last Friday, USD surged and reached 149.00. We continue to expect USD to rise, potentially breaking above 149.40. Looking ahead, the next resistance level of note above 149.40 is at 150.00. To maintain the momentum, USD must remain above 146.40 (‘strong support’ level previously at 144.80).”
The Dollar Index (DXY) rebounded by 2.1% to 102.52 last week, its first weekly increase in five weeks, DBS’ FX analyst Philip Wee notes.
DXY’s upside limited to around 103
“Following the stronger-than-expected US jobs data last Friday, the futures market rescinded its bet for a second 50 bps rate cut at the FOMC meeting on November 7, opting instead for a reduction of 25 bps.”
“Fed officials speaking this week will welcome September’s nonfarm payrolls rising to 223k from 159k in August and the unemployment rate falling to 4.1% from 4.2%. However, they will caution against reading too much into one month’s data and maintain the path of reducing monetary policy restrictions.”
“Given our view that the Fed Funds Rate will decline another 200 bps through 2025, we see the DXY’s upside limited to around 103 before resuming its depreciation.”
USD/SGD continued to get bumped up for 5 consecutive sessions. Pair was last at 1.304 1 levels, OCBC’s FX analysts Frances Cheung and Christopher Wong note.
MAS may surprise with an earlier easing
“Hotter US payrolls was the trigger, in line with our caution that the corrective rebound can continue. Daily momentum is bullish while rise in RSI moderated near overbought conditions. Resistance at 1.3060 (50 DMA), 1.31 (38.2% fibo retracement of Jul high to Sep low) Support at 1.2980 (23.6% fibo), 1.2940 (21 DMA).
“S$NEER was last estimated at ~1.79% above our modelimplied mid. MAS policy decision will be announced on 14 Oct, alongside 3Q GDP. We expect MAS to maintain policy status quo again at the upcoming Oct MPC meeting as prevailing appreciating path of the S$NEER policy band remains appropriate.
“But we do not rule out an outside chance that the MAS may surprise with an earlier easing, given that MAS adopts a forward-looking approach to monetary policy making and that the core CPI’s disinflation journey remains intact, apart from the slight bump-up in August.”
Price action continues to suggest further New Zealand Dollar (NZD) weakness, albeit likely at a slower pace. The levels to watch are 0.6135 and 0.6105, UOB Group FX analysts Quek Ser Leang and Peter Chia note.
NZD may fall towards 0.6135
24-HOUR VIEW: “While our expectation for NZD to ‘continue to weaken’ last Friday was correct, our view that it ‘is unlikely to break below the significant support at 0.6170’ was not. NZD easily broke below 0.6170, reaching a low of 0.6146. Conditions are severely oversold, and instead of continuing to weaken today, NZD is more likely to trade in a 0.6145/0.6205 range.”
1-3 WEEKS VIEW: “Last Wednesday (02 Oct, spot at 0.6285), we noted that ‘downward momentum has increased slightly.’ We held the view that ‘the pullback in NZD could potentially reach 0.6225.’ After NZD dropped below 0.6225, we indicated last Friday (04 Oct, spot at 0.6215) that, ‘momentum has increased further, and NZD could continue to decline to 0.6170.’ We added, ‘we will expect NZD to weaken as long as it remains below 0.6295 (‘strong resistance’ level).’ In NY trade, NZD fell below 0.6170, reaching a low of 0.6146. Although the price action continues to suggest further NZD weakness, oversold conditions suggest a slower pace of decline. The next levels to watch are 0.6135 and 0.6105. On the upside, the ‘strong resistance’ level has moved lower to 0.6220 from 0.6295.”
It appears that the Bank of England (BoE) is now also beginning to discuss faster interest rate cuts, Commerzbank’s FX analyst Michael Pfister notes.
BoE's next move depends on inflation figures
“On Thursday, BoE Governor Andrew Bailey put the pound under considerable pressure by openly expressing his support for faster interest rate cuts. As a result, the market has priced in a 25bp cut at each of the two remaining meetings this year. On Friday, the BoE's chief economist, Huw Pill, responded with more hawkish comments, stressing that cautious rate cuts would be more appropriate. Naturally, rate expectations have since receded somewhat.”
“However, this is likely to be a temporary lull. The comments clearly show that the Bank of England cannot disassociate itself from the discussions at other central banks, where the pace of rate cuts is set to accelerate as inflationary pressures ease. This is not good news for the pound. After all, much of the pound's strength this year has been based on expectations that the BoE would be more cautious in its rate cuts and that the interest rate differential with other currencies would shift in the pound's favour.”
“Of course, the BoE's next move will also depend on inflation figures. The latest figures suggest that inflationary pressures remain stubborn, which would argue for further pound strength. However, the discussions make it clear that the risks for a further appreciation of the pound are increasing.”
USD/JPY took another leg higher after US payrolls report surprised to the upside. Pair was last at 148.51, OCBC’s FX analysts Frances Cheung and Christopher Wong note.
Immediate next resistance at 149.30
“Bullish momentum on daily chart intact while rise in RSI shows signs of moderation near overbought conditions. Upside risks remain but bias to fade rallies. Immediate next resistance at 149.30, 150.70 (50% fibo retracement of Jul double-top to Sep low) and 151 levels (200 DMA). Support at 148 (38.2% fibo), 147.10 and 145.20 (50 DMA).”
“Finance Minister Kato said that sudden moves in the currency market have negative impacts on companies and households while chief currency official Mimura is watching FX markets with a sense of urgency.”
“Last week, both PM Ishiba and Governor Ueda sent a coherent message that policymakers are in no hurry to normalise policy while former BoJ member Masai spoke about “range of 140 – 150 for USDJPY is comfortable”.”
Last week’s newspaper interview with Bank of England Governor Andrew Bailey – in which he opened the way to ‘a bit more aggressive’ easing – triggered a substantial unwinding of stretched GBP net longs, which amounted to 37% of open interest on 1 October, according to CFTC data, ING’s FX analyst Francesco Pesole notes.
Few more upside risks for the USD
“Chief Economist Huw Pill offered GBP a lifeline on Friday as he warned against cutting too aggressively, but markets are now likely on the lookout for any slight drop in data to price in more easing in the Sonia curve. At the moment, markets factor in 22bp of cuts for November and another 17bp for December, meaning there is some more room for a dovish repricing.”
“However, the data calendar is not particularly busy in the UK this week and only includes monthly GDP and industrial production figures for August. The bulk of market-moving releases is next week, with jobs data on the 15th and the CPI report on the 16th.”
“EUR/GBP has already halved its post-Bailey gains, and we think the pair may stabilise or slip back toward 0.830 before next week’s UK data. We have seen a nice directional move towards our near-term target of 1.300 in Cable. As we see a few more upside risks for the dollar and given that markets may be more inclined to price in BoE cuts after Bailey’s comments, we stick to that call even if the pair might find some modest support in the coming days.”
- The US Dollar steadies on Monday, though still at elevated levels near last week’s high.
- Tensions in the Middle East keep lingering while traders gear up for the Fed Minutes and US CPI release later this week.
- The US Dollar Index trades above 102.00, with traders fretting over whether to send the DXY towards 103.00.
The US Dollar (USD) is steady to sideways on Monday, with the US Dollar Index (DXY), which tracks the Greenback’s value against six major currencies, hovering around 102.50. While traders are bracing for the US Federal Reserve (Fed) Minutes and the US Consumer Price Index (CPI) release for September later this week, no less than four Fed speakers are lined up to guide markets toward November’s rate decision on Monday.
The economic calendar is light on Monday, with only the Consumer Credit Change for August on the docket in terms of numbers. Later this week, the US CPI on Thursday will be the main driver for the US Dollar. Markets are still assessing whether the US economy is in a soft landing, a Goldilocks scenario, or rather in a recession outlook.
Daily digest market movers: US pushes back Israel
- There is no agreement or green light from US President Joe Biden on the question from Israel to attack Iranian oil fields. The Biden administration did not deliver a firm no, but on Friday, President Biden told Bloomberg that he would be thinking about alternatives other than striking oil fields.
- Consumer Credit Change for August is due at 19:00 GMT, with expectations to see a drop to $12 billion from $25.45 billion in July.
- Four Fed speakers are lined up on Monday:
- At 17:00 GMT, Federal Reserve Governor Michelle Bowman participates in a fireside chat about banking regulation at the Independent Bankers Association of Texas (IBAT) annual convention in San Antonio, Texas.
- Near 17:50 GMT, Federal Reserve Bank of Minneapolis President Neel Kashkari participates in a Q&A and moderated discussion at the Bank Holding Company Association's (BHCA) Fall Seminar in Edina, MN.
- At 22:00 GMT, Federal Reserve Bank of Atlanta President Raphael Bostic moderates a conversation about the business of professional spots as part of the Atlanta Fed's Leading Voice series.
- Closing off the Monday, near 22:30 GMT, Federal Reserve Bank of St. Louis President Alberto Musalem delivers a speech about the US economy and monetary policy in a Money Marketeers event at New York University.
- European markets are struggling on Monday, with equity indices dipping lower, while US futures are looking even more sluggish with bigger losses on the day, around 0.50% on average.
- The CME Fedwatch Tool shows a 93.1% chance of a 25 basis point (bps) interest rate cut at the next Fed meeting on November 7, while 6.9% is pricing in no rate cut. Chances for a 50 bps rate cut have been fully priced out now.
- The US 10-year benchmark rate trades at 3.99%, a 30-day high, and flirting with a break above 4.00%.
US Dollar Index Technical Analysis: That went quick
The US Dollar Index (DXY) has sprinted higher at a speed that brings Usain Bolt instantly to mind. With a 50 bps rate cut fully priced out and chances for no rate cut starting to grow in possibility, the pendulum may have swung a bit too far and too quickly. Expect the DXY set to ease a touch and look for support before the next directional move.
The psychological level of 103.00 is the first big number to tackle on the upside. Further up, the chart identifies 103.18 as the very final level for this week. Once above there, a very choppy area emerges with the 100-day Simple Moving Average (SMA) at 103.34, the 200-day SMA at 103.76, and the pivotal 103.99-104.00 levels in play.
On the downside, the 55-day SMA at 102.03 is the first line of defence, backed by the 102.00 round figure and the pivotal 101.90 level as support to catch any bearish pressure and trigger a bounce. If that level does not work out, 100.62 also acts as support. Further down, a test of the year-to-date low of 100.16 should take place before more downside. Finally, and that means giving up the big 100.00 level, the July 14, 2023, low at 99.58 comes into play.
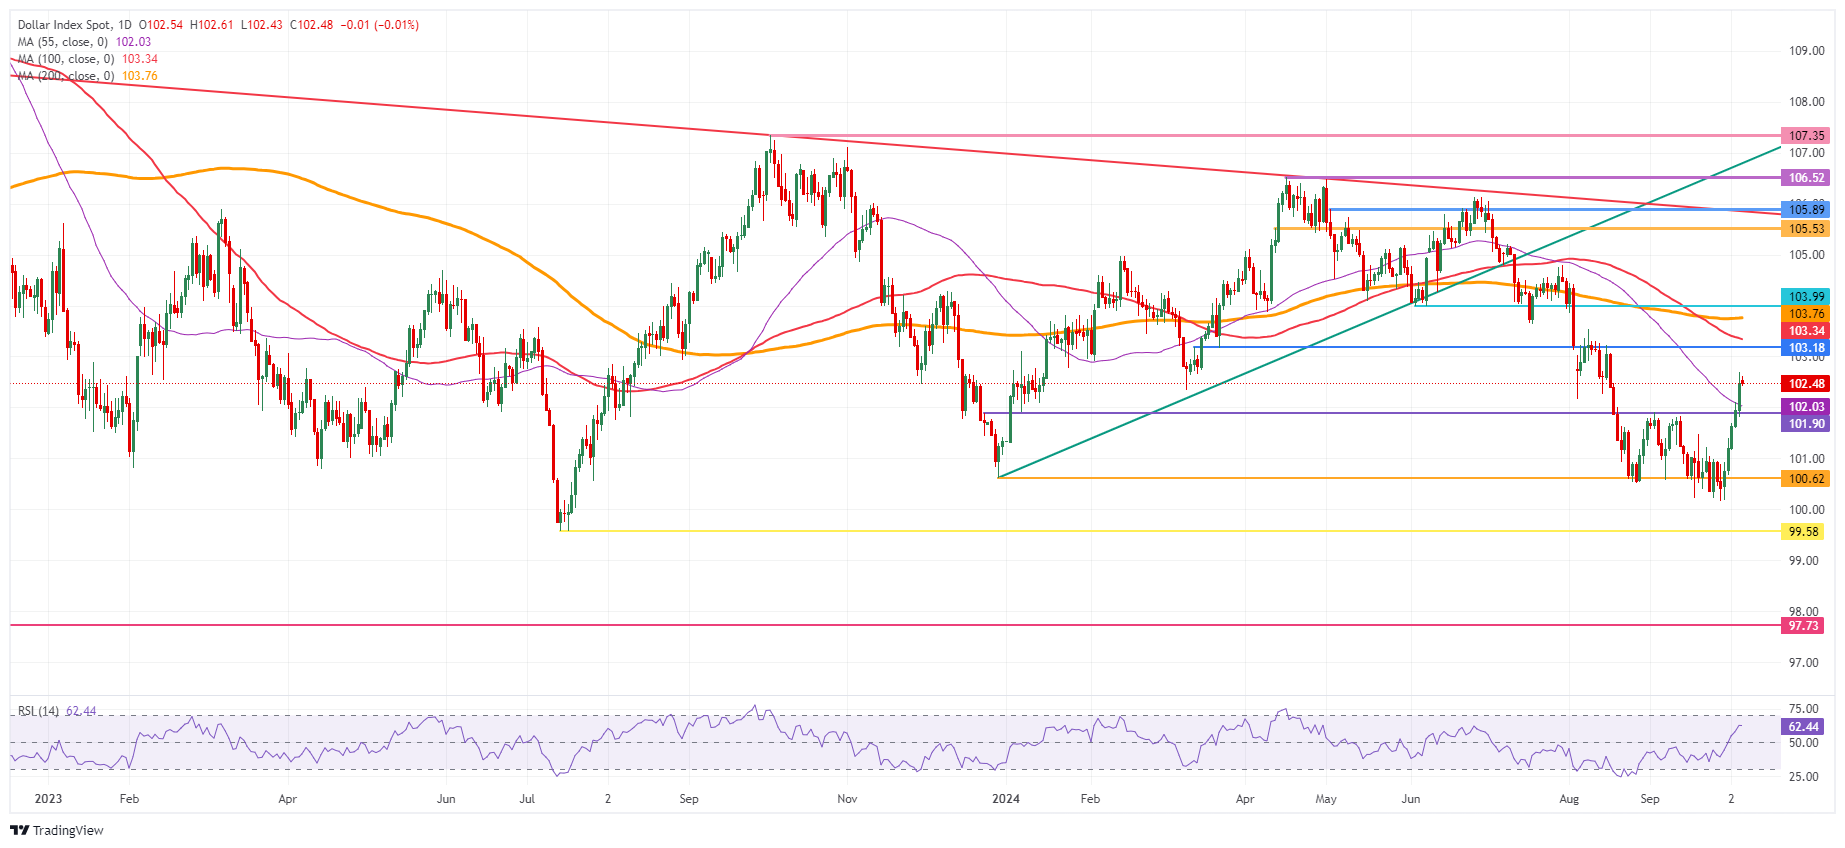
US Dollar Index: Daily Chart
US Dollar FAQs
The US Dollar (USD) is the official currency of the United States of America, and the ‘de facto’ currency of a significant number of other countries where it is found in circulation alongside local notes. It is the most heavily traded currency in the world, accounting for over 88% of all global foreign exchange turnover, or an average of $6.6 trillion in transactions per day, according to data from 2022. Following the second world war, the USD took over from the British Pound as the world’s reserve currency. For most of its history, the US Dollar was backed by Gold, until the Bretton Woods Agreement in 1971 when the Gold Standard went away.
The most important single factor impacting on the value of the US Dollar is monetary policy, which is shaped by the Federal Reserve (Fed). The Fed has two mandates: to achieve price stability (control inflation) and foster full employment. Its primary tool to achieve these two goals is by adjusting interest rates. When prices are rising too quickly and inflation is above the Fed’s 2% target, the Fed will raise rates, which helps the USD value. When inflation falls below 2% or the Unemployment Rate is too high, the Fed may lower interest rates, which weighs on the Greenback.
In extreme situations, the Federal Reserve can also print more Dollars and enact quantitative easing (QE). QE is the process by which the Fed substantially increases the flow of credit in a stuck financial system. It is a non-standard policy measure used when credit has dried up because banks will not lend to each other (out of the fear of counterparty default). It is a last resort when simply lowering interest rates is unlikely to achieve the necessary result. It was the Fed’s weapon of choice to combat the credit crunch that occurred during the Great Financial Crisis in 2008. It involves the Fed printing more Dollars and using them to buy US government bonds predominantly from financial institutions. QE usually leads to a weaker US Dollar.
Quantitative tightening (QT) is the reverse process whereby the Federal Reserve stops buying bonds from financial institutions and does not reinvest the principal from the bonds it holds maturing in new purchases. It is usually positive for the US Dollar.
- USD/CAD aims to break above 1.3600 on upbeat US job data for September.
- Traders see the Fed reducing interest rates gradually.
- The Canadian Dollar remains under pressure despite the Oil price rising to a fresh five-week high.
The USD/CAD pair gathers strength to break above the round-level resistance of 1.3600 in Monday’s European session. The Loonie asset extends its winning streak for the fourth trading session as the US Dollar (USD) gains further on expectations the Federal Reserve (Fed) will not extend its policy-easing spell with an aggressive approach.
US Dollar PRICE Today
The table below shows the percentage change of US Dollar (USD) against listed major currencies today. US Dollar was the strongest against the British Pound.
| USD | EUR | GBP | JPY | CAD | AUD | NZD | CHF | |
|---|---|---|---|---|---|---|---|---|
| USD | 0.07% | 0.35% | -0.19% | 0.13% | 0.06% | 0.26% | -0.16% | |
| EUR | -0.07% | 0.35% | -0.23% | 0.09% | -0.03% | 0.18% | -0.25% | |
| GBP | -0.35% | -0.35% | -0.62% | -0.25% | -0.38% | -0.13% | -0.48% | |
| JPY | 0.19% | 0.23% | 0.62% | 0.32% | 0.24% | 0.40% | 0.08% | |
| CAD | -0.13% | -0.09% | 0.25% | -0.32% | -0.05% | 0.13% | -0.29% | |
| AUD | -0.06% | 0.03% | 0.38% | -0.24% | 0.05% | 0.26% | -0.18% | |
| NZD | -0.26% | -0.18% | 0.13% | -0.40% | -0.13% | -0.26% | -0.38% | |
| CHF | 0.16% | 0.25% | 0.48% | -0.08% | 0.29% | 0.18% | 0.38% |
The heat map shows percentage changes of major currencies against each other. The base currency is picked from the left column, while the quote currency is picked from the top row. For example, if you pick the US Dollar from the left column and move along the horizontal line to the Japanese Yen, the percentage change displayed in the box will represent USD (base)/JPY (quote).
S&P 500 futures have posted significant losses in the European session, exhibiting a dismal market sentiment. The US Dollar Index (DXY), which tracks the Greenback’s value against six major currencies, holds onto gains near 102.50.
Investors expect the Fed to follow a gradual rate-cut cycle as risks of an economic slowdown in the United States (US) economy have ebbed after the Employment report showed that the labor demand remained robust and wage growth was faster than projected in September.
The US economy added 254K in September after an addition of 159K job-seekers in August, according to the Nonfarm Payrolls (NFP). Annual Average Hourly Earnings grew by 4%, faster than the estimates of 3.8%.
This week, investors will pay close attention to the US Consumer Price Index (CPI) data for September, which will be published on Thursday.
Meanwhile, the Canadian Dollar (CAD) underperforms its major peers despite surging Oil prices. The Oil price jumps to a fresh five-week high due to the Israel-Iran war, which has fanned risks of a disruption in the Oil supply chain.
It is worth noting that Canada is the leading exporter of Oil to the US and higher energy prices result in an appreciation in the Canadian Dollar.
European Central Bank (ECB) Governing Council member and Bank of France President, François Villeroy de Galhau, said in an interview with La Repubblica on Monday that the ECB will probably cut interest rates on October 17.
Key quotes
"In the last two years, our main risk was to overshoot our 2% target.”
"Now we must also pay attention to the opposite risk, of undershooting our objective due to a weak growth and a restrictive monetary policy for too long."
"If we are next year sustainably at 2% inflation, and with still a sluggish growth outlook in Europe, there won't be any reason for our monetary policy to remain restrictive, and our rates to be above the neutral rate of interest.”
"The victory against inflation is in sight, but it’s not a reason to become complacent and relax on a preset course.”
Market reaction
EUR/USD is off the highs following mixed Eurozone Retail Sales data, currently trading 0.13% lower on the day at 1.0961.
Instead of continuing to decline, the Australian Dollar (AUD) is more likely to trade in a sideways range between 0.6785 and 0.6825. In the longer run, momentum has increased; AUD is likely to decline further, potentially breaking below 0.6750, UOB Group FX analysts Quek Ser Leang and Peter Chia note.
AUD is likely to decline further
24-HOUR VIEW: “While we expected AUD to continue to weaken last Friday, we indicated that it “it does not seem to have enough momentum to break clearly below the major support at 0.6820.” However, AUD fell more than expected, plummeting to a low of 0.6786. Despite the relatively sharp drop, there has been no significant increase in downward momentum. Today, instead of continuing to decline, AUD is more likely to trade in sideways, probably between 0.6785 and 0.6825.”
1-3 WEEKS VIEW: “Last Wednesday (02 Oct, spot at 0.6880), we highlighted that AUD “has likely entered a range trading phase, and it is expected to trade between 0.6820 and 0.6935 for the time being.” After AUD fell 0.6830, we indicated last Friday (04 Oct, spot at 0.6850) that “there has been a slight increase in downward momentum, and the risk of AUD breaking below 0.6820 has also increased.” We added, “to maintain the current tentative buildup in momentum, AUD must remain below 0.6905 in the next few days.” In NY trade, AUD not only broke below 0.6820, but also another support level at 0.6795, reaching a low of 0.6786. The further increase in momentum suggests AUD is likely to decline further, potentially breaking below 0.6750. On the upside, the ‘strong resistance’ level has moved lower to 0.6855 from 0.6905.”
EUR/USD below 1.10 seemed to be a matter of when rather than if following the rewidening of the USD:EUR short-term rate gap, ING’s FX analyst Francesco Pesole notes.
EUR/USD to explore levels below 1.09
“We think 1.100 would have worked as a sturdier support had we not seen such strong US jobs numbers. Now, we could see some mild support coming the pair’s way in the coming days as the Fed and ECB repricing have both run their course, but we think the risks are still skewed to the downside by the end of October as the ECB should cut, the EUR curve should favour dovish bets, and other factors can support the dollar.”
“The eurozone data calendar is quite quiet this week, so a greater focus will be on ECB speakers. Last week’s comments by prominent hawkish member Isabel Schnabel seemed to suggest that the hawks are also concerned about growth and might ultimately give their go-ahead for an October cut. Over the weekend, dovish member Francois Villeroy said an October cut is likely.”
“Anyway, consensus has already mapped out the easing path ahead for the ECB and markets are now fully aligned with it, pricing in 23bp of easing for next week and another full 25bp cut in December. We struggle to see rate expectations move much before the 17 October meeting – and barring a US data tumble, the USD:EUR 2-year swap rate gap will not retighten materially from the current 125bp. That rate differential is consistent with explorations below 1.09 in EUR/USD.”
Price action suggests further Pound Sterling (GBP) weakness; the next major support at 1.3000 may not come into view so soon, UOB Group FX analysts Quek Ser Leang and Peter Chia note.
Downside risk remains intact below 1.3220
24-HOUR VIEW: “After GBP fell sharply last Thursday, we indicated on Friday that “the weakness has not stabilised.” We also indicated that GBP “could dip to 1.3080 before stabilisation can be expected.” In NY trade, GBP dropped to 1.3070, rebounding quickly to end the day largely unchanged at 1.3123 (-0.03%). The price action is likely part of a sideways trading phase. Today, we expect GBP to trade in a 1.3080/1.3180 range.”
1-3 WEEKS VIEW: “Our update from last Friday (04 Oct, spot at 1.3130) remains valid. As highlighted, although the recent price action suggests further GBP weakness, short-term conditions are severely oversold, and the next major support at 1.3000 may not come into so soon. The downside risk will remain intact provided that GBP does not break above 1.3220 (‘strong resistance’ level was at 1.3255 last Friday).”
- EUR/JPY drops sharply to near 162.70 as swelling ECB rate cut bets weigh on the Euro.
- ECB Villeroy warned about rising risks of Eurozone economic slowdown.
- Middle East tensions led to higher safe flows in favor of the Japanese Yen.
The EUR/JPY pair falls sharply from the seven-week high around 163.50 to near 162.70 in Monday’s European session. The cross weakens as the Euro (EUR) faces pressure amid rising speculation that the European Central Bank (ECB) could cut its key borrowing rates further in its policy meeting on October 17.
Euro PRICE Today
The table below shows the percentage change of Euro (EUR) against listed major currencies today. Euro was the strongest against the British Pound.
| USD | EUR | GBP | JPY | CAD | AUD | NZD | CHF | |
|---|---|---|---|---|---|---|---|---|
| USD | 0.09% | 0.31% | -0.31% | 0.14% | 0.11% | 0.27% | -0.05% | |
| EUR | -0.09% | 0.29% | -0.37% | 0.09% | 0.00% | 0.18% | -0.17% | |
| GBP | -0.31% | -0.29% | -0.70% | -0.19% | -0.28% | -0.07% | -0.37% | |
| JPY | 0.31% | 0.37% | 0.70% | 0.44% | 0.39% | 0.52% | 0.25% | |
| CAD | -0.14% | -0.09% | 0.19% | -0.44% | -0.01% | 0.12% | -0.23% | |
| AUD | -0.11% | -0.00% | 0.28% | -0.39% | 0.01% | 0.22% | -0.16% | |
| NZD | -0.27% | -0.18% | 0.07% | -0.52% | -0.12% | -0.22% | -0.33% | |
| CHF | 0.05% | 0.17% | 0.37% | -0.25% | 0.23% | 0.16% | 0.33% |
The heat map shows percentage changes of major currencies against each other. The base currency is picked from the left column, while the quote currency is picked from the top row. For example, if you pick the Euro from the left column and move along the horizontal line to the US Dollar, the percentage change displayed in the box will represent EUR (base)/USD (quote).
The ECB cut its Rate on Deposit Facility by 25 basis points (bps) to 3.5% on September 12. This was the ECB’s second dovish decision of its current policy-easing cycle. And, now more rate cuts are expected from the ECB this month as officials worry about growing risks of monetary policy remaining restrictive for too long, which suggests weak economic growth with confidence over inflation declining to the bank’s target of 2%.
This weekend, ECB policymaker and French Central Bank Chief François Villeroy de Galhau said in an interview with La Repubblica, "If we are next year sustainably at 2% inflation, and with still a sluggish growth outlook in Europe, there won’t be any reason for our monetary policy to remain restrictive, and our rates to be above the neutral rate of interest."
Meanwhile, a faster-than-expected slump in German Factory Orders in August has also pointed to weakening demand and the need for further policy-easing. Annually, Factory Orders declined by 3.9% after growing by 4.6% in July. Month-on-month new Factory Orders contracted at a faster-than-expected pace of 5.8%.
On the Tokyo front, conflicts between Israel and Iran in the Middle East region have resulted in safe flows to the Japanese Yen (JPY). The Japanese currency is also strengthened by renewed fears of a possible intervention as suggested by Japan's Finance Ministry's Vice Finance Minister for International Affairs Atsushi Mimura’s speech in Monday’s Asian session.
What a US jobs report! Not only was the actual number higher than any of the economists in the Bloomberg survey had expected, but the previous two months were revised sharply higher and the unemployment rate surprisingly fell, Commerzbank’s FX analyst Michael Pfister notes.
US economy is slowing but remains solid
“Average job growth in the final quarter was actually quite a bit higher than the average in the second quarter. And the July jobs report, which sent shock waves through the market in early August, looks less scary after the revision.”
“First, the market reaction was textbook-like: the USD rallied sharply and a 25bp cut was priced out across the curve. The upshot is that interest rate expectations now look much more realistic, i.e. the market seems to be backing our economists' view that the Fed will cut rates by 25 basis points per meeting at the upcoming meetings, rather than the larger pace of 50 basis points.”
“The figures have once again confirmed something crucial: one should simply not over-interpret a single data point from the payrolls at the moment, both in terms of positive and negative surprises. Friday's figure is also likely to be revised several times. More important for the Fed's decisions will be the medium-term trend in the number of jobs created. And this underlying trend tends to confirm the pre-summer view that the US economy is slowing but remains solid. Conversely, one should not bet too heavily against the USD.”
- The Mexican Peso rises after robust US and domestic automobile data suggest a strong export outlook.
- Moves by judges to block contentious reforms to the judiciary further support the MXN.
- USD/MXN breaks below the key 50-day SMA and tests the bottom of a major rising channel.
The Mexican Peso (MXN) strengthens for the sixth day in a row on Monday, gaining in all three of its key pairs (USD/MXN, EUR/MXN, and GBP/MXN). The catalyst for the rise is a mixture of a more benign outlook for its most significant trading partner, the United States (US) – following better-than-expected US employment data – as well as recent robust domestic data from Mexico.
Data out on Friday showed US Nonfarm Payrolls (NFP) beat expectations by a wide margin in September, rising by 254K when economists had only expected a 140K increase, according to data from the Bureau of Labor Statistics (BLS). In addition, the Unemployment Rate fell to 4.1% from 4.2% when markets had feared the opposite. The data overall showed the US economy remains in good shape, averting fears of a “hard landing”.
In Mexico, meanwhile, both Automobile Production and Exports rose in September. Production climbed 11.71% from 8.3% in the previous month, and exports by 4.8%, up from 1.7% in August. That said, Mexico’s Jobless Rate in August hit 3.0%, which was above July’s 2.9%, according to data from the Instituto Nacional de Estadistica y Geografia (INEGI).
Mexican Peso rallies as fears ease about Sheinbaum, Judges block new laws
The Mexican Peso is further supported by easing investor concerns regarding radical reforms proposed by former President Andres Manuel Lopez Obrador (AMLO). Many investors deem the reforms “anti-market”. This caused a sell-off in Mexican financial assets after the re-election of his Morena-led coalition in June. It was also partly responsible for the Peso weakening 10% in the months after the election.
Although the new President Claudia Sheinbaum has said she broadly backs AMLO’s radical reform agenda, markets appear to be more optimistic about their implementation under her tutelage, according to Christian Borjon Valencia, Analyst at FXStreet.
The first key reform was voted through at the tail end of AMLO’s tenure in September. It calls for the election of judges rather than their appointment. It has been heavily criticized for undermining the independence of the judiciary and, as a result, scaring away potential foreign investors key to Mexico’s growth as a nearshoring destination.
The Mexican Peso gained ground at the end of last week, however, after the Mexican Supreme Court voted to delay the implementation of the new judicial reforms, so they could re-examine and possibly make revisions to the new laws. Their move was backed by the legal principle that the laws should not risk undermining the independence of the judiciary.
Over the weekend, the National Electoral Institute (INE) challenged a further brake to the implementation of AMLO’s judicial reforms, this time by several district Judges. The INE made an appeal to the Federal Electoral Court (TEPJF) asking to revoke the block, which seeks to inhibit the elections for new judges scheduled for June 1, 2025, according to El Financiero.
Technical Analysis: USD/MXN breaks below 50-day Moving Average
USD/MXN breaks below the 50-day Simple Moving Average (SMA), a key line in the sand for traders, and tests the bottom of a medium-term rising channel.
USD/MXN Daily Chart
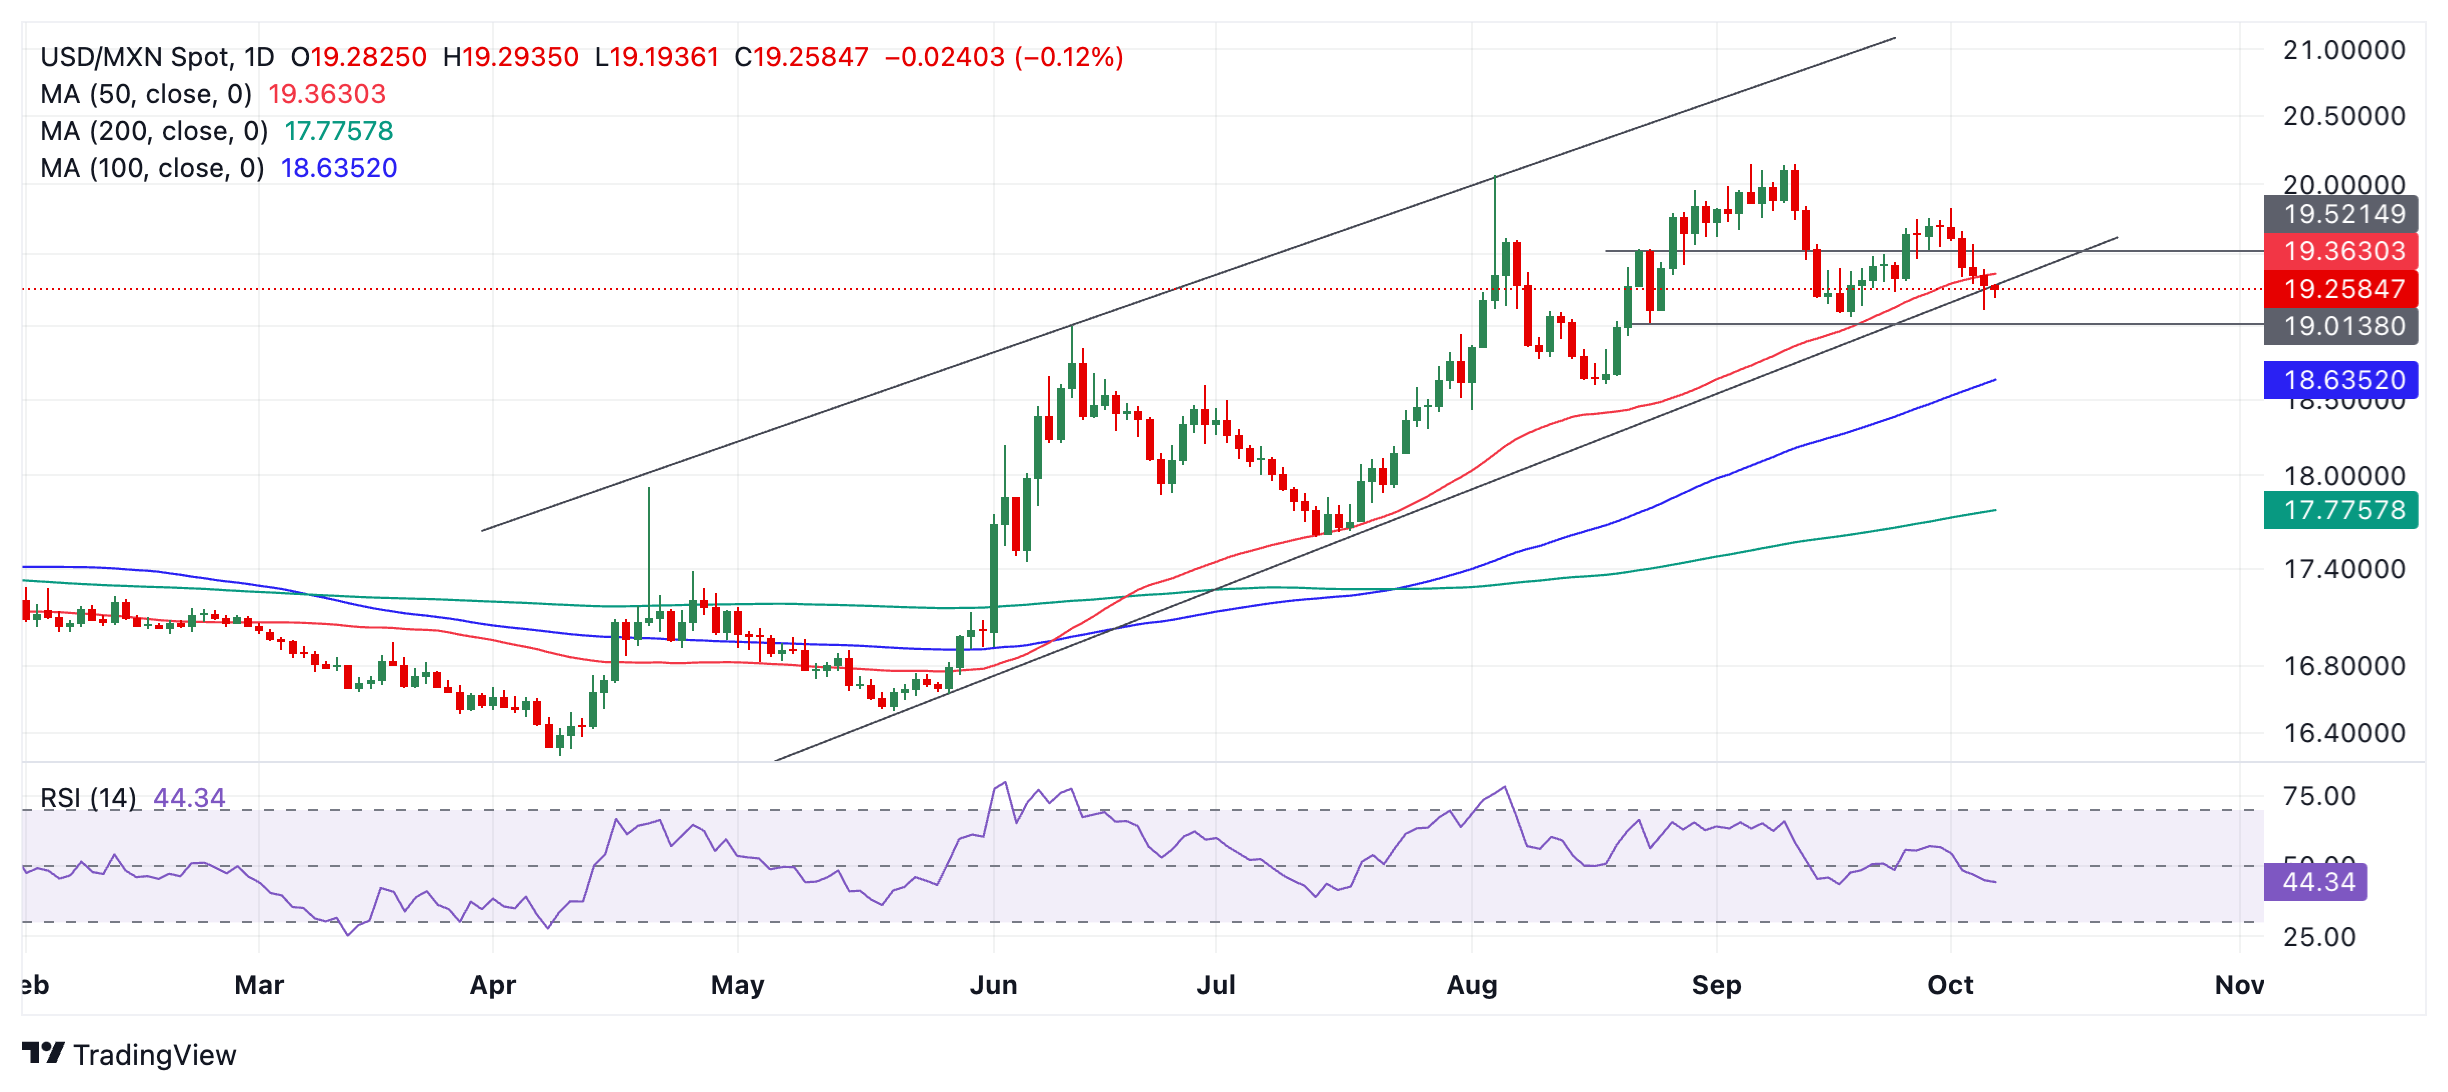
USD/MXN is expected to find support at the base of the channel, and there is a chance it will recover and start to rise again. The medium and longer-term trends are still bullish, and given the technical analysis principle that “the trend is your friend,” the odds favor a recovery and continuation higher.
However, the short-term trend is bearish, and the pair has now broken below the 50-day SMA, a key level and the first obstacle to more downside. A decisive breakout from the channel would risk threatening the medium-term uptrend in the USD/MXN.
A decisive break would be characterized by a longer-than-average bearish candlestick that pierced cleanly below the channel line and closed near its low. Such a break would then probably follow-through lower, to an initial downside target at 19.00 (August 23 low, round number) and then 18.60, the level of the 100-day SMA.
Economic Indicator
Nonfarm Payrolls
The Nonfarm Payrolls release presents the number of new jobs created in the US during the previous month in all non-agricultural businesses; it is released by the US Bureau of Labor Statistics (BLS). The monthly changes in payrolls can be extremely volatile. The number is also subject to strong reviews, which can also trigger volatility in the Forex board. Generally speaking, a high reading is seen as bullish for the US Dollar (USD), while a low reading is seen as bearish, although previous months' reviews and the Unemployment Rate are as relevant as the headline figure. The market's reaction, therefore, depends on how the market assesses all the data contained in the BLS report as a whole.
Read more.Last release: Fri Oct 04, 2024 12:30
Frequency: Monthly
Actual: 254K
Consensus: 140K
Previous: 142K
Source: US Bureau of Labor Statistics
America’s monthly jobs report is considered the most important economic indicator for forex traders. Released on the first Friday following the reported month, the change in the number of positions is closely correlated with the overall performance of the economy and is monitored by policymakers. Full employment is one of the Federal Reserve’s mandates and it considers developments in the labor market when setting its policies, thus impacting currencies. Despite several leading indicators shaping estimates, Nonfarm Payrolls tend to surprise markets and trigger substantial volatility. Actual figures beating the consensus tend to be USD bullish.
The US Dollar (USD) was boosted again for the 5th back-to-back session and this time the trigger came from the blockbuster payrolls report. DXY was last at 102.58, OCBC’s FX analysts Frances Cheung and Christopher Wong note.
Upside risks intact
“The hotter-than-expected jobs report saw further unwinding of dovish bets, adding to the USD’s rebound momentum. Markets are now just eyeing 2 * 25bp cut each for the remainder of the 2 FOMCs in Nov and Dec. With US elections less than 1 month to go, polls still find Trump and Harris neck-and-neck.”
“Further rebalancing in historically low DXY position may imply that USD may stay supported in the interim. Daily momentum remains bullish while RSI rose. Upside risks intact. Resistance at 102.90 (38.2% fibo). Support at 101.80/90 levels (50 DMA, 23.6% fibo retracement of 2023 high to 2024 low). Focus this week on FOMC, CPI data (Thu); PPI (Fri).
The blowout US jobs report on Friday prompted the kind of hawkish repricing in rate expectations we thought would have materialised over a few weeks. Markets no longer have pretext to look through Federal Reserve Chair Jerome Powell’s pushback against 50bp cuts, and are now finally aligned with the Dot Plot projections: 25bp cuts in November and December. Crucially, there may not be any catalyst for a fresh dovish rethink until the end of October, when new jobs and activity indicators are released, ING’s FX analyst Francesco Pesole notes.
DXY to trade around 103.0 at the end of October
“The inflation figures released this week (CPI and PPI) should not really change the picture for Fed pricing and the dollar, as some substantial surprise would be required to draw attention away from the jobs market dynamics. Our economists see September core CPI slowing back to 0.2% month-on-month after the surprising 0.3% in August. That is also the consensus view – but while few economists are calling for another 0.3% print, no one seems to be expecting 0.1%.”
“The FX market has suffered a hard reset as the notion of an aggressively dovish Fed has now evaporated. Coincidentally, there has been more dovish communication from other developed central banks, like the European Central Bank, the Bank of England and the Bank of Japan. We cannot see a driver for rebuilding structural USD short positions in the next couple of weeks.”
“Finally, we are four weeks away from the US presidential elections and there is still a chance markets will favour defensive (USD-positive) positioning ahead of a tight contest. All in all, barring some noise around data releases, geopolitics and US political news, the dollar seems more likely to consolidate recent gains than trend back to mid-September levels. We expect DXY around 103.0 at the end of October.”
Silver prices (XAG/USD) fell on Monday, according to FXStreet data. Silver trades at $31.90 per troy ounce, down 0.91% from the $32.19 it cost on Friday.
Silver prices have increased by 34.06% since the beginning of the year.
| Unit measure | Silver Price Today in USD |
|---|---|
| Troy Ounce | 31.90 |
| 1 Gram | 1.03 |
The Gold/Silver ratio, which shows the number of ounces of Silver needed to equal the value of one ounce of Gold, stood at 83.15 on Monday, up from 82.43 on Friday.
Silver FAQs
Silver is a precious metal highly traded among investors. It has been historically used as a store of value and a medium of exchange. Although less popular than Gold, traders may turn to Silver to diversify their investment portfolio, for its intrinsic value or as a potential hedge during high-inflation periods. Investors can buy physical Silver, in coins or in bars, or trade it through vehicles such as Exchange Traded Funds, which track its price on international markets.
Silver prices can move due to a wide range of factors. Geopolitical instability or fears of a deep recession can make Silver price escalate due to its safe-haven status, although to a lesser extent than Gold's. As a yieldless asset, Silver tends to rise with lower interest rates. Its moves also depend on how the US Dollar (USD) behaves as the asset is priced in dollars (XAG/USD). A strong Dollar tends to keep the price of Silver at bay, whereas a weaker Dollar is likely to propel prices up. Other factors such as investment demand, mining supply – Silver is much more abundant than Gold – and recycling rates can also affect prices.
Silver is widely used in industry, particularly in sectors such as electronics or solar energy, as it has one of the highest electric conductivity of all metals – more than Copper and Gold. A surge in demand can increase prices, while a decline tends to lower them. Dynamics in the US, Chinese and Indian economies can also contribute to price swings: for the US and particularly China, their big industrial sectors use Silver in various processes; in India, consumers’ demand for the precious metal for jewellery also plays a key role in setting prices.
Silver prices tend to follow Gold's moves. When Gold prices rise, Silver typically follows suit, as their status as safe-haven assets is similar. The Gold/Silver ratio, which shows the number of ounces of Silver needed to equal the value of one ounce of Gold, may help to determine the relative valuation between both metals. Some investors may consider a high ratio as an indicator that Silver is undervalued, or Gold is overvalued. On the contrary, a low ratio might suggest that Gold is undervalued relative to Silver.
(An automation tool was used in creating this post.)
Provided that 1.1015 is not breached, the weakness in EUR could extend to 1.0935 before stabilisation can be expected. In the longer run, further EUR weakness appears likely; the next two support levels to monitor are 1.0935 and 1.0900, UOB Group FX analysts Quek Ser Leang and Peter Chia note.
Support levels to monitor are 1.0935 and 1.0900
24-HOUR VIEW: “The sharp selloff that sent EUR plunging to 1.0950 was unexpected (we were expecting range trading). Not surprisingly, after such a sharp decline, conditions are severely oversold. However, provided that 1.1015 (minor resistance is at 1.0995) is not breached, the weakness could extend to 1.0935 before stabilisation can be expected. The major support at 1.0900 is unlikely to come into view.”
1-3 WEEKS VIEW: “Last Wednesday (02 Oct), when EUR was trading at 1.1065, we noted the ‘rapid buildup in downward momentum.’ We were of the view that ‘this is likely to lead to EUR weakness, and the levels to monitor are 1.1030 and 1.1000.’ After EUR fell towards 1.1000, we indicated last Friday (04 Oct, spot at 1.1035) that ‘to continue to decline, EUR not only has to break below 1.1000 but also the next solid support at 1.0980.’ In NY trade, EUR easily broke below both support levels, reaching a low of 1.0950. Although conditions are oversold, further EUR weakness appears likely. The next two support levels to monitor are 1.0935 and 1.0900. On the upside, a breach of 1.1060 (‘strong resistance’ level was at 1.1090 last Friday) would mean that EUR is not weakening further.”
- EUR/USD remains on the backfoot near 1.0950 as the Fed is expected to follow a gradual rate-cut approach.
- US labor demand remained robust and wage growth increased in September.
- ECB’s Villeroy supported another interest rate cut on October 17.
EUR/USD struggles to gain ground near the key support of 1.0950 in Monday’s European session. The major currency pair remains on the backfoot as the US Dollar (USD) clings to gains near a fresh seven-week high, prompted by surprisingly upbeat Friday’s United States (US) labor market data for September.
The US Dollar Index (DXY), which gauges Greenback’s value against six major currencies, trades close to 102.50.
The US employment report showed a resilient labor demand and strong wage growth. As per the report, the economy added 254K non-farm jobs, which was significantly higher than the estimates of 140K and the former release of 159K, upwardly revised from 142K. The Unemployment Rate decelerated to 4.1% from expectations and the August print of 4.2%.
Upbeat employment data forced traders to push back market expectations for the Federal Reserve (Fed) to reduce interest rates by 50 basis points (bps) again in November. The Fed started its policy-easing cycle with a larger-than-usual interest rate cut by 50 bps in September.
Meanwhile, renewed fears of inflation remaining persistent after the release of the hotter-than-expected Average Hourly Earnings for September also expunged Fed large rate cut bets. Average Hourly Earnings, a key measure of wage growth, accelerated at a faster-than-expected pace to 4.0% year-over-year. Month-on-month wage growth measure rose by 0.4%.
For more clarity on the interest rate outlook, investors will focus on the US Consumer Price Index (CPI) data for September, which will be published on Thursday.
Daily digest market movers: EUR/USD remains under pressure due to multiple headwinds
- EUR/USD remains vulnerable near 1.0950 in European trading hours. Apart from the upbeat US Dollar, uncertainty over the Euro’s (EUR) outlook has also kept the pair on the backseat. The Euro’s outlook has become uncertain amid increasing speculation that the European Central Bank (ECB) could cut interest rates again in its monetary policy meeting on October 17.
- Large dovish ECB bets for October have been prompted by growing risks that inflation in the Eurozone could stabilize below the bank’s target of 2%. Annual Eurozone Harmonized Index of Consumer Prices (HICP) decelerated at a faster-than-expected pace to 1.8% in September, according to flash estimates.
- The economic outlook of Germany, the Eurozone’s largest economy, is weak due to soft demand. The German economy is forecasted to have shrunk by 0.2% annually for the current year by the ministry, led by Robert Habeck of the Green party, newspaper Sueddeutsche Zeitung reported on Sunday.
- Meanwhile, ECB policymaker and French Central Bank Chief François Villeroy de Galhau also emphasized the need to cut interest rates again this month, told to La Repubblica over the weekend. Villeroy said, "In the last two years our main risk was to overshoot our 2% target." "Now we must also pay attention to the opposite risk, of undershooting our objective due to weak growth and a restrictive monetary policy for too long," he added.
- On the economic data front, Eurozone Retail Sales expanded but missed expectations in August. Annually, Retail Sales rose by 0.8% after contracting by 0.1% in July. Economists expected Retail Sales to have grown by 1%. Month-on-month Retail Sales rose expectedly by 0.2%.
Technical Analysis: EUR/USD struggles near 1.0950
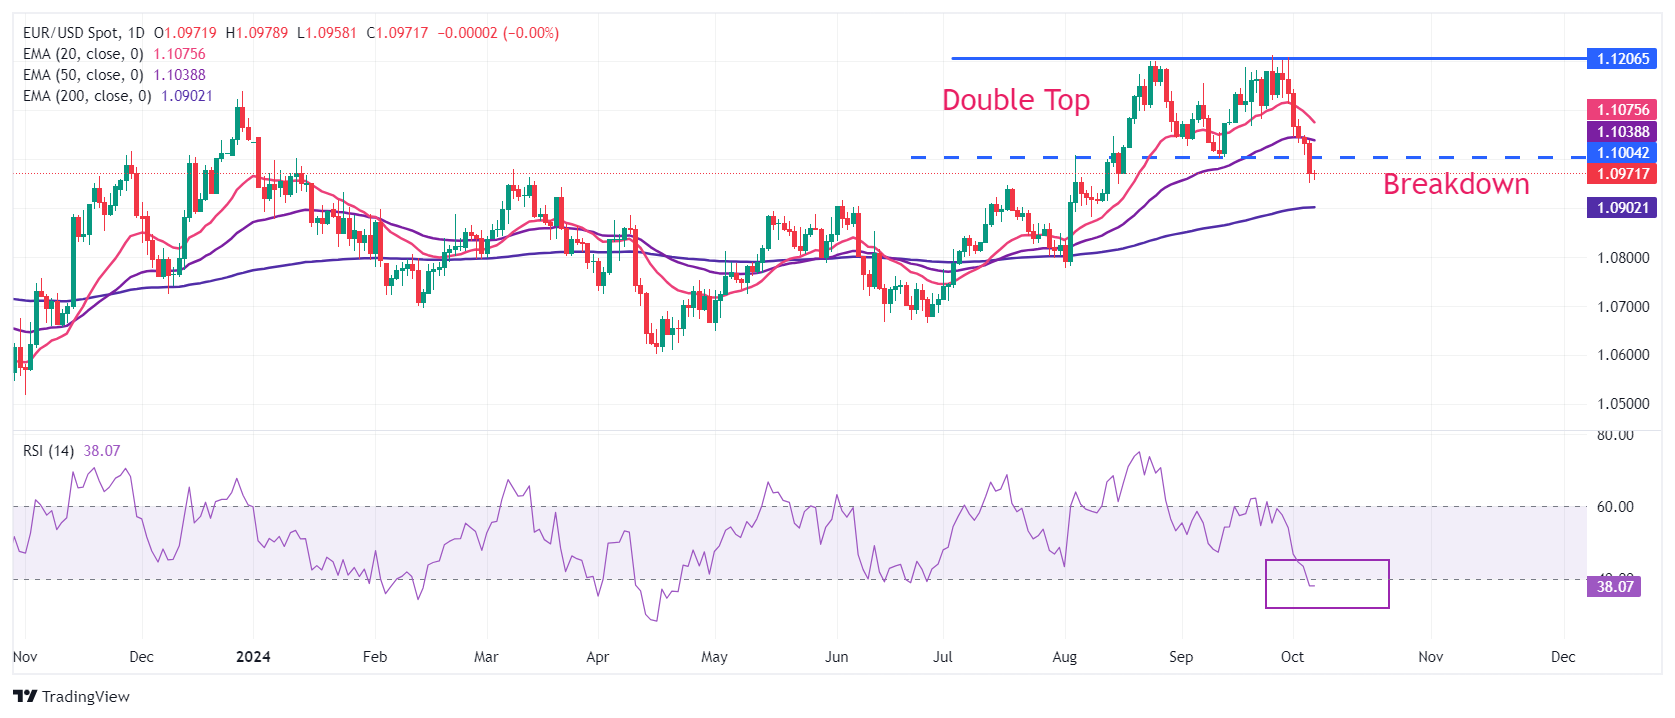
EUR/USD strives for a firm footing near the immediate support of 1.0950. The major currency pair is broadly under pressure as it has delivered a breakdown of the Double Top chart pattern formation on a daily timeframe. The above-mentioned chart pattern was triggered after the shared currency pair broke below the September 11 low of 1.1000.
The 14-day Relative Strength Index (RSI) slides below 40.00. A bearish momentum would trigger if the RSI sustains below the same.
Looking down, the pair is expected to find support near the 200-day Exponential Moving Average (EMA) around 1.0900. On the upside, the 20-day EMA at 1.1075 and the September high around 1.1200 will be major resistance zones.
Euro FAQs
The Euro is the currency for the 19 European Union countries that belong to the Eurozone. It is the second most heavily traded currency in the world behind the US Dollar. In 2022, it accounted for 31% of all foreign exchange transactions, with an average daily turnover of over $2.2 trillion a day. EUR/USD is the most heavily traded currency pair in the world, accounting for an estimated 30% off all transactions, followed by EUR/JPY (4%), EUR/GBP (3%) and EUR/AUD (2%).
The European Central Bank (ECB) in Frankfurt, Germany, is the reserve bank for the Eurozone. The ECB sets interest rates and manages monetary policy. The ECB’s primary mandate is to maintain price stability, which means either controlling inflation or stimulating growth. Its primary tool is the raising or lowering of interest rates. Relatively high interest rates – or the expectation of higher rates – will usually benefit the Euro and vice versa. The ECB Governing Council makes monetary policy decisions at meetings held eight times a year. Decisions are made by heads of the Eurozone national banks and six permanent members, including the President of the ECB, Christine Lagarde.
Eurozone inflation data, measured by the Harmonized Index of Consumer Prices (HICP), is an important econometric for the Euro. If inflation rises more than expected, especially if above the ECB’s 2% target, it obliges the ECB to raise interest rates to bring it back under control. Relatively high interest rates compared to its counterparts will usually benefit the Euro, as it makes the region more attractive as a place for global investors to park their money.
Data releases gauge the health of the economy and can impact on the Euro. Indicators such as GDP, Manufacturing and Services PMIs, employment, and consumer sentiment surveys can all influence the direction of the single currency. A strong economy is good for the Euro. Not only does it attract more foreign investment but it may encourage the ECB to put up interest rates, which will directly strengthen the Euro. Otherwise, if economic data is weak, the Euro is likely to fall. Economic data for the four largest economies in the euro area (Germany, France, Italy and Spain) are especially significant, as they account for 75% of the Eurozone’s economy.
Another significant data release for the Euro is the Trade Balance. This indicator measures the difference between what a country earns from its exports and what it spends on imports over a given period. If a country produces highly sought after exports then its currency will gain in value purely from the extra demand created from foreign buyers seeking to purchase these goods. Therefore, a positive net Trade Balance strengthens a currency and vice versa for a negative balance.
- Eurozone Retail Sales rebound 0.8% YoY in August vs. 1.0% estimate.
- Retail Sales in the bloc arrived at 0.2% MoM in August, as expected.
Eurozone’s annual Retail Sales rose 0.8% in August after dropping by 0.1% in July, the official data released by Eurostat showed on Monday. The data missed the market consensus of +1.0%.
On a monthly basis, Retail Sales in the old continent increased by 0.2% in the same period vs. July’s revised 0%, meeting the estimates of 0.2%.
FX implications
The mixed Eurozone data fails to move the needle around the Euro. At the time of writing, the EUR/USD pair is trading 0.07% lower on the day at 1.0967.
Euro PRICE Today
The table below shows the percentage change of Euro (EUR) against listed major currencies today. Euro was the weakest against the Japanese Yen.
| USD | EUR | GBP | JPY | CAD | AUD | NZD | CHF | |
|---|---|---|---|---|---|---|---|---|
| USD | 0.06% | 0.26% | -0.24% | 0.18% | 0.20% | 0.34% | -0.04% | |
| EUR | -0.06% | 0.26% | -0.26% | 0.15% | 0.12% | 0.28% | -0.12% | |
| GBP | -0.26% | -0.26% | -0.54% | -0.10% | -0.14% | 0.05% | -0.27% | |
| JPY | 0.24% | 0.26% | 0.54% | 0.41% | 0.41% | 0.52% | 0.22% | |
| CAD | -0.18% | -0.15% | 0.10% | -0.41% | 0.05% | 0.16% | -0.22% | |
| AUD | -0.20% | -0.12% | 0.14% | -0.41% | -0.05% | 0.20% | -0.21% | |
| NZD | -0.34% | -0.28% | -0.05% | -0.52% | -0.16% | -0.20% | -0.35% | |
| CHF | 0.04% | 0.12% | 0.27% | -0.22% | 0.22% | 0.21% | 0.35% |
The heat map shows percentage changes of major currencies against each other. The base currency is picked from the left column, while the quote currency is picked from the top row. For example, if you pick the Euro from the left column and move along the horizontal line to the US Dollar, the percentage change displayed in the box will represent EUR (base)/USD (quote).
- USD/JPY corrects from a nearly two-month peak amid renewed intervention fears.
- A turnaround in the risk sentiment further benefits the JPY and weighs on the pair.
- Reduced bets for a 50 bps Fed rate cut next month should limit losses for the major.
The USD/JPY pair retreats after touching its highest level since August 16, around the 149.10-149.15 area and extends the steady intraday descent through the first half of the European session on Monday. Spot prices, for now, seem to have snapped a three-day winning streak and drop to the 148.00 mark, or a fresh daily low in the last hour. albeit recover a few pips thereafter.
The Japanese Yen (JPY) strengthens across the board after comments from Japan's Finance Ministry's Vice Finance Minister for International Affairs Atsushi Mimura fueled speculations about a possible intervention. Apart from this, a turnaround in the global risk sentiment, along with escalating geopolitical tensions in the Middle East, drives some haven flows towards the JPY and exerts some downward pressure on the USD/JPY pair. The fundamental backdrop, however, warrants some caution for bearish traders and positioning for any further depreciating move.
Japan’s new Prime Minister Shigeru Ishiba last week said that the country is not ready for further rate hikes. Adding to this, the Bank of Japan (BoJ) board member offered a similar view last Thursday and raised uncertainty about future rate hikes. This, in turn, might cap the JPY. The US Dollar (USD), on the other hand, remains supported near a seven-week high touched in the reaction to the upbeat US jobs report on Friday, which forced investors to further pare bets for another oversized rate cut by the Federal Reserve (Fed). This could further lend support to the USD/JPY pair.
Traders might also prefer to move to the sidelines ahead of this week's release of the FOMC meeting minutes on Wednesday. Apart from this, the US inflation figures – the Consumer Price Index (CPI) and the Producer Price Index (PPI) on Thursday and Friday, respectively – will be looked upon for cues about the Fed's rate-cut path. This, in turn, will play a key role in influencing the near-term USD price dynamics and provide a fresh impetus to the USD/JPY pair. In the meantime, Fedspeak will be looked upon for short-term opportunities in the absence of any relevant data on Monday.
Bank of Japan FAQs
The Bank of Japan (BoJ) is the Japanese central bank, which sets monetary policy in the country. Its mandate is to issue banknotes and carry out currency and monetary control to ensure price stability, which means an inflation target of around 2%.
The Bank of Japan embarked in an ultra-loose monetary policy in 2013 in order to stimulate the economy and fuel inflation amid a low-inflationary environment. The bank’s policy is based on Quantitative and Qualitative Easing (QQE), or printing notes to buy assets such as government or corporate bonds to provide liquidity. In 2016, the bank doubled down on its strategy and further loosened policy by first introducing negative interest rates and then directly controlling the yield of its 10-year government bonds. In March 2024, the BoJ lifted interest rates, effectively retreating from the ultra-loose monetary policy stance.
The Bank’s massive stimulus caused the Yen to depreciate against its main currency peers. This process exacerbated in 2022 and 2023 due to an increasing policy divergence between the Bank of Japan and other main central banks, which opted to increase interest rates sharply to fight decades-high levels of inflation. The BoJ’s policy led to a widening differential with other currencies, dragging down the value of the Yen. This trend partly reversed in 2024, when the BoJ decided to abandon its ultra-loose policy stance.
A weaker Yen and the spike in global energy prices led to an increase in Japanese inflation, which exceeded the BoJ’s 2% target. The prospect of rising salaries in the country – a key element fuelling inflation – also contributed to the move.
- Eurozone investors’ morale gets a lift in October.
- EUR/USD holds the bounce to near 1.0975 after the upbeat Eurozone data.
The Eurozone Sentix Investor Confidence Index improved from -15.4 in September to -13.8 in October, the latest survey showed on Monday.
The Expectations Index in the Eurozone recovered from September’s -8.0 to -3.8 in October.
The Current Situation gauge for the bloc, however, dropped to -23.3 in the same period from -22.5 in September, hitting the lowest in four months.
Sentix said, "the downward economic trend has been halted for the time being," Sentix said.
"The eurozone economy is thus starting its next attempt to find its way out of recession/stagnation," it added.
Market reaction to the Eurozone Sentix data
EUR/USD is holding the rebound to near 1.0975 after the Eurozone data. As of writing, EUR/USD is trading flat on the day.
- Silver retreats further from its highest level since December 2012 touched on Friday.
- The recent repeated failures to find acceptance above $32.00 warrant caution for bulls.
- Any further slide to $31.65 could be seen as a buying opportunity and remain limited.
Silver (XAG/USD) kicks off the new week on a weaker note and extends Friday's late pullback from the vicinity of the $33.00 mark, or its highest level since December 2012. The white metal remains depressed around the $32.00 round figure during the first half of the European session, though the mixed technical setup warrants some caution before placing aggressive bearish bets.
The recent repeated failures to find acceptance above the $32.00 mark constitute the formation of a bearish multiple-tops pattern on the daily chart. That said, oscillators on the daily chart are holding comfortably in positive territory and support prospects for the emergence of some dip-buying near the $31.65 area. This should limit the downside for the XAG/USD near the $31.40-$31.35 horizontal support.
The subsequent fall has the potential to drag the commodity towards the $31.00 mark. Some follow-through selling below last week's low, around the $30.90-$30.85 area, could make the XAG/USD vulnerable to accelerate the slide further towards the $30.40-$30.35 intermediate support en route to the $30.00 psychological mark and the 50-day Simple Moving Average (SMA), around the $29.55 zone.
Meanwhile, bulls need to wait for acceptance above the $32.00 mark and a sustained strength beyond the $32.25 supply zone before positioning for an extension of a two-month-old uptrend. The XAG/USD might then make a fresh attempt to conquer the $33.00 round figure before climbing further towards the December 2012 swing high, around the $33.85 region.
Silver daily chart
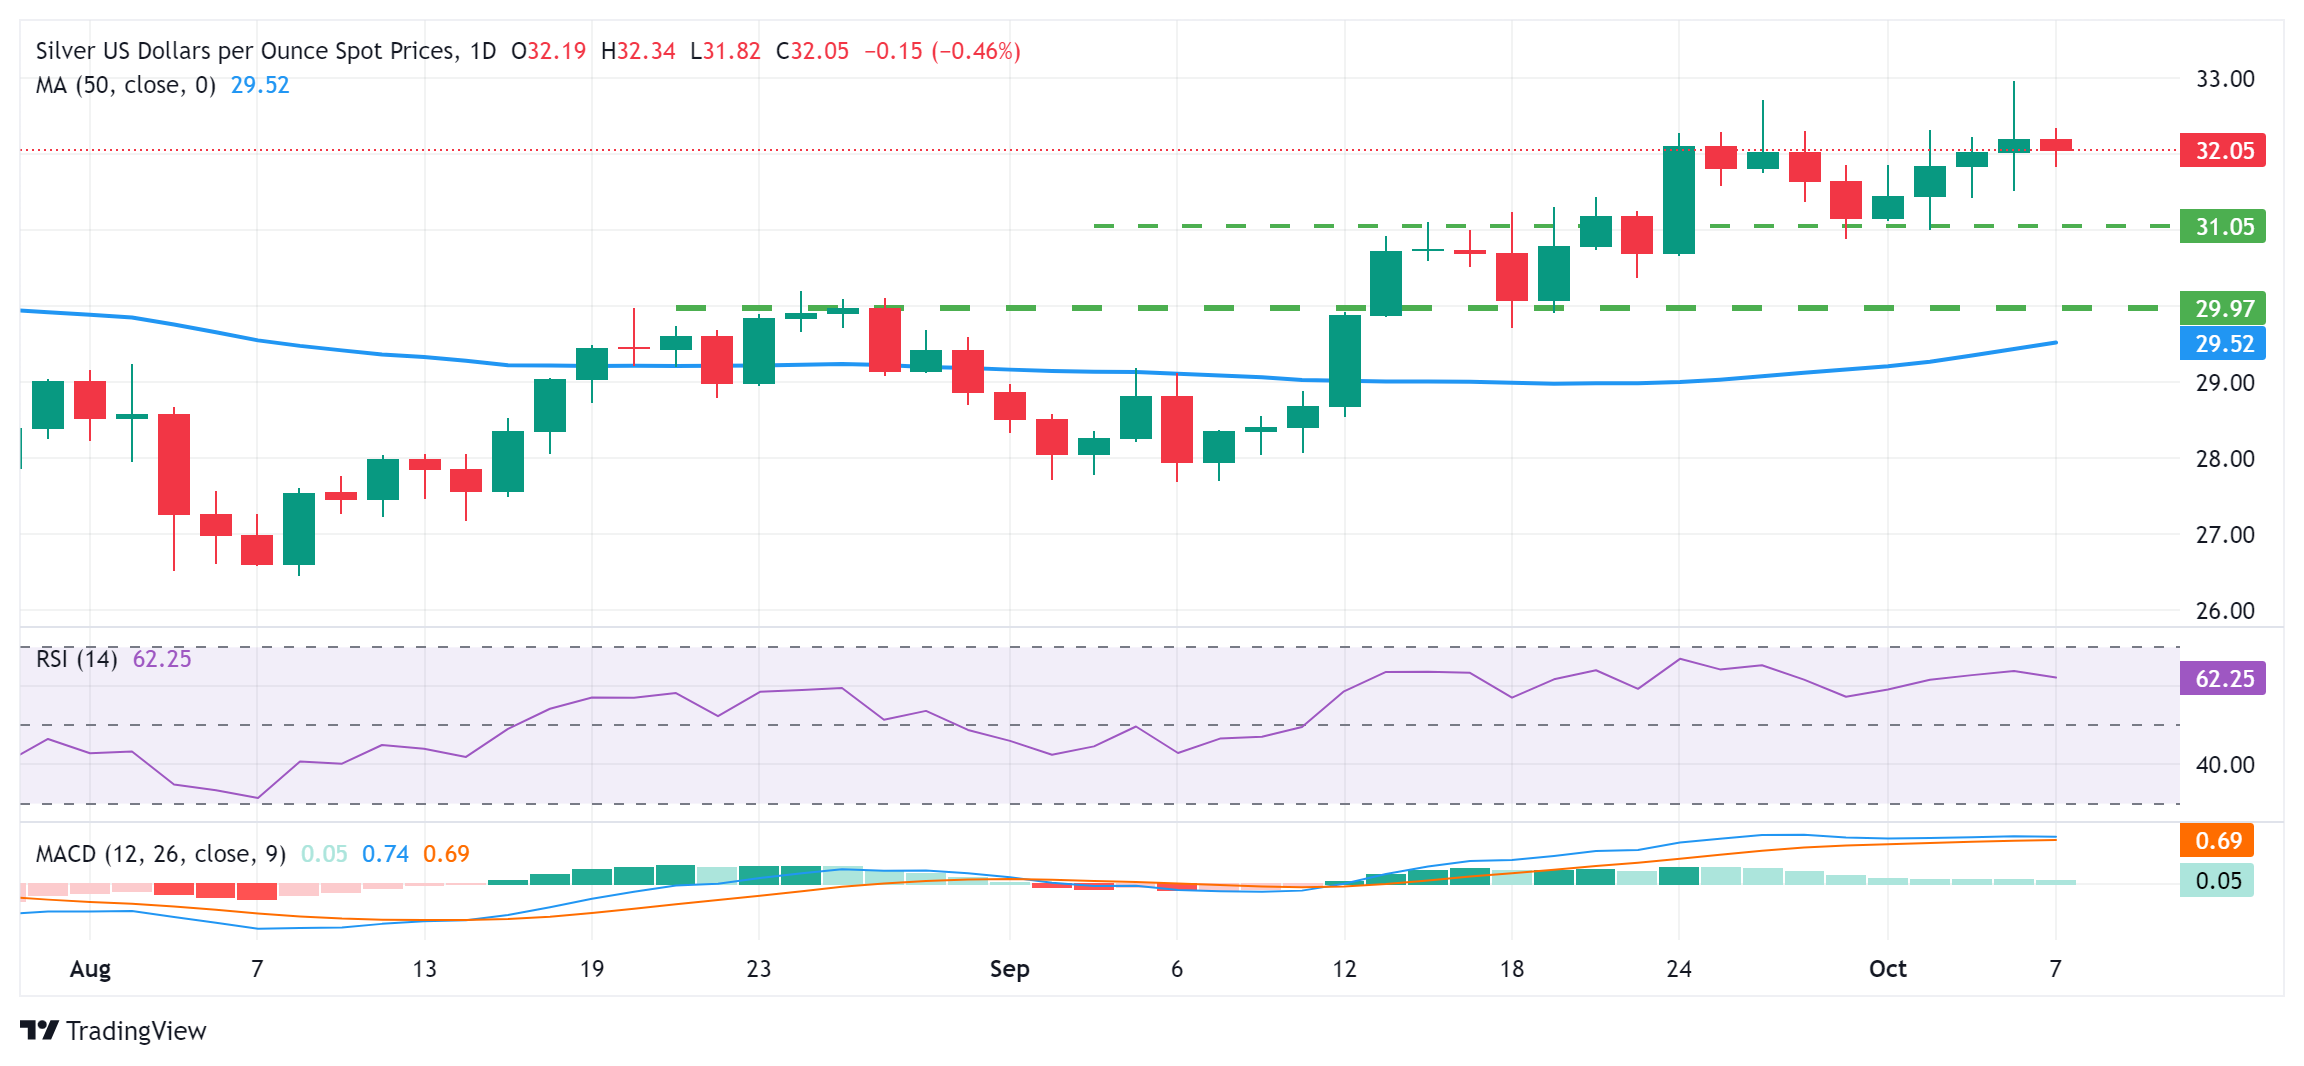
Silver FAQs
Silver is a precious metal highly traded among investors. It has been historically used as a store of value and a medium of exchange. Although less popular than Gold, traders may turn to Silver to diversify their investment portfolio, for its intrinsic value or as a potential hedge during high-inflation periods. Investors can buy physical Silver, in coins or in bars, or trade it through vehicles such as Exchange Traded Funds, which track its price on international markets.
Silver prices can move due to a wide range of factors. Geopolitical instability or fears of a deep recession can make Silver price escalate due to its safe-haven status, although to a lesser extent than Gold's. As a yieldless asset, Silver tends to rise with lower interest rates. Its moves also depend on how the US Dollar (USD) behaves as the asset is priced in dollars (XAG/USD). A strong Dollar tends to keep the price of Silver at bay, whereas a weaker Dollar is likely to propel prices up. Other factors such as investment demand, mining supply – Silver is much more abundant than Gold – and recycling rates can also affect prices.
Silver is widely used in industry, particularly in sectors such as electronics or solar energy, as it has one of the highest electric conductivity of all metals – more than Copper and Gold. A surge in demand can increase prices, while a decline tends to lower them. Dynamics in the US, Chinese and Indian economies can also contribute to price swings: for the US and particularly China, their big industrial sectors use Silver in various processes; in India, consumers’ demand for the precious metal for jewellery also plays a key role in setting prices.
Silver prices tend to follow Gold's moves. When Gold prices rise, Silver typically follows suit, as their status as safe-haven assets is similar. The Gold/Silver ratio, which shows the number of ounces of Silver needed to equal the value of one ounce of Gold, may help to determine the relative valuation between both metals. Some investors may consider a high ratio as an indicator that Silver is undervalued, or Gold is overvalued. On the contrary, a low ratio might suggest that Gold is undervalued relative to Silver.
- The Pound Sterling struggles to gain ground near 1.3100 against the US Dollar as traders pare Fed large rate cut bets.
- US NFP report for September showed a sharp uptick in payrolls and wage growth.
- Growing Middle East tensions weigh heavily on risk-sensitive assets.
The Pound Sterling (GBP) remains on the backfoot near the key level of 1.3100 against the US Dollar (USD) in Monday’s London session. The GBP/USD pair faces pressure as the US Dollar holds gains to near an almost seven-week high, driven by robust growth in the United States (US) Nonfarm Payrolls (NFP) for September, released on Friday. The US Dollar Index (DXY), which tracks the Greenback’s value against six major currencies, extends its winning streak for the sixth trading day on Monday to near 102.50.
All components of the US labor market report for September pointed to a resilient economy. Fresh payrolls came in at 254K, the highest level seen since March, and the Unemployment Rate dropped to 4.1%. Average Hourly Earnings, a key measure of wage growth that drives consumer spending, rose at a robust pace of 4% year-over-year.
Surprisingly upbeat labor market data forced traders to unwind bets supporting a Federal Reserve’s (Fed) larger-than-usual rate cut of 50 basis points (bps) in November. According to the CME FedWatch tool, the Fed's probability of reducing interest rates by 50 bps has been entirely wiped out, and a quarter-to-a-percentage rate cut is now widely anticipated.
On Friday, Chicago Fed Bank President Austan Goolsbee called the latest US employment report "superb". He added, "If we get more reports like this, I'm going to feel a lot more confident that we are, in fact, settling in at full employment," Reuters reported.
Going forward, investors will focus on the US Consumer Price Index (CPI) data for September, which will be published on Thursday. The inflation data will provide more clarity about the Fed’s likely interest rate action in November.
Daily digest market movers: Pound Sterling underperforms on dismal market mood
- The Pound Sterling exhibits a weak performance against its major peers at the start of the week. The British currency faces pressure on dismal market sentiment due to growing tensions between Iran and Israel in the Middle East region. Israel intensified strikes across Beirut and its southern suburbs on Sunday after Israeli Prime Minister Benjamin Netanyahu vowed to win.
- Ongoing tensions in the Middle East region have deepened risks of Oil supply chain reduction, which have resulted in a sharp upside in energy prices. This could lead to a higher foreign outflow from Oil-importing economies.
- Apart from the cautious market mood, rising expectations of the Bank of England (BoE) to cut interest rates again in November have also weighed on the Pound Sterling. Last week, the comments from BoE’s Governor Andrew Bailey in an interview with the Guardian newspaper indicated that the central bank could be a bit more aggressive in its approach to lower interest rates if inflationary pressures continue to decline.
- On the contrary, BoE Chief Economist Huw Pill advised cutting interest rates gradually in his speech at the Institute of Chartered Accountants in England and Wales on Friday. Pill said, "While further cuts in Bank Rate remain in prospect should the economic and inflation outlook evolve broadly as expected, it will be important to guard against the risk of cutting rates either too far or too fast.”
- This week, the major trigger for the Pound Sterling will be the monthly Gross Domestic Product (GDP) and the factory data for August, which will be released on Friday.
Technical Analysis: Pound Sterling oscillates inside Friday’s range
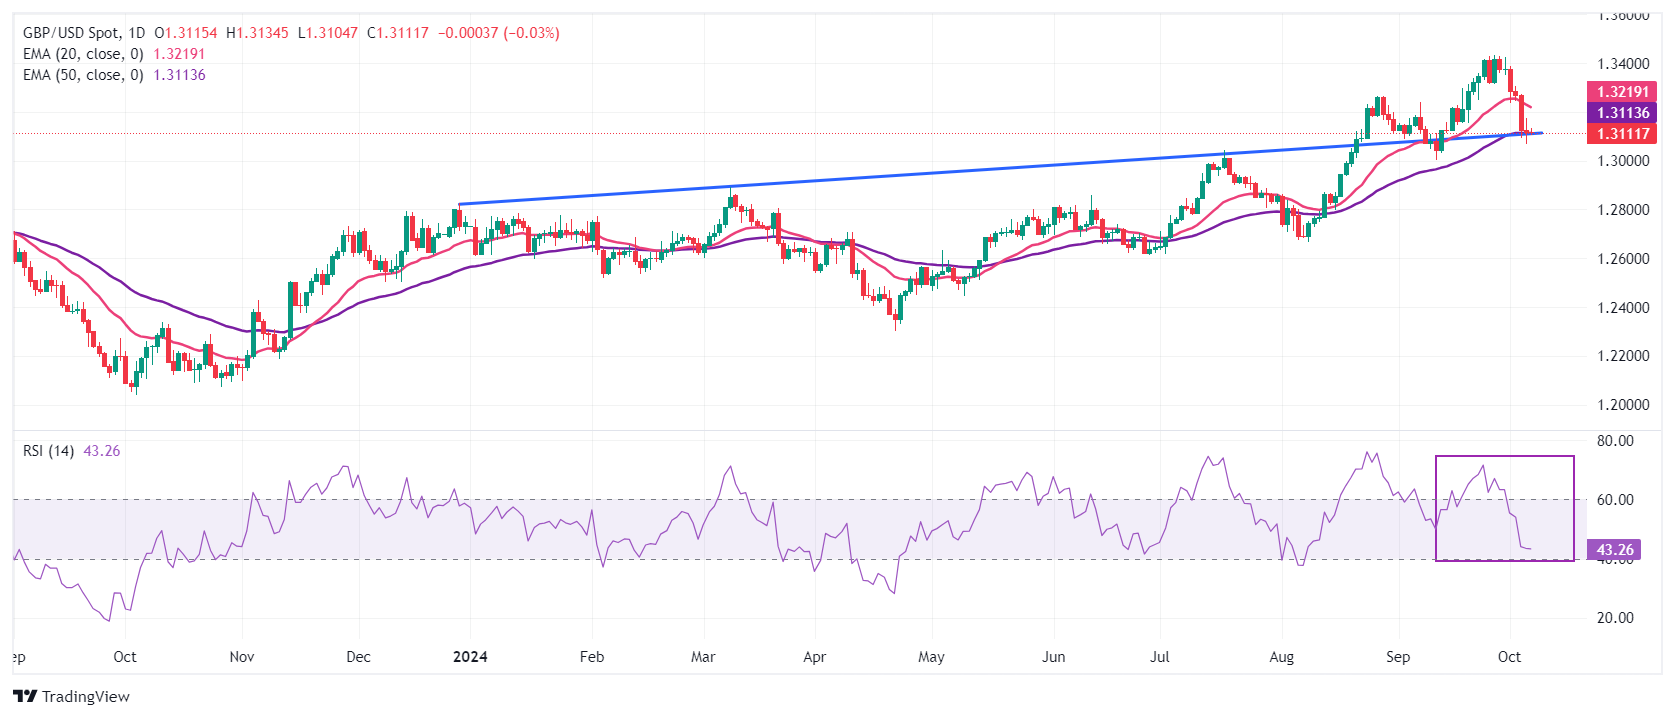
The Pound Sterling trades inside Friday’s trading range, with investors focusing on the US CPI data for September. The GBP/USD pair is expected to remain on the backfoot as it struggles to hold the 50-day Exponential Moving Average (EMA), which trades around 1.3110. The Cable is at make or a break near the upward-sloping trendline from the 28 December 2023 high of 1.2827.
The 14-day Relative Strength Index (RSI) declines inside the 40.00-60.00 range, suggesting a loss of bullish momentum. However, the upside trend remains intact.
Looking up, the 20-day EMA near 1.3234 will be a major barricade for the Pound Sterling bulls. On the downside, the pair would find support near the psychological figure of 1.3000.
Pound Sterling FAQs
The Pound Sterling (GBP) is the oldest currency in the world (886 AD) and the official currency of the United Kingdom. It is the fourth most traded unit for foreign exchange (FX) in the world, accounting for 12% of all transactions, averaging $630 billion a day, according to 2022 data. Its key trading pairs are GBP/USD, also known as ‘Cable’, which accounts for 11% of FX, GBP/JPY, or the ‘Dragon’ as it is known by traders (3%), and EUR/GBP (2%). The Pound Sterling is issued by the Bank of England (BoE).
The single most important factor influencing the value of the Pound Sterling is monetary policy decided by the Bank of England. The BoE bases its decisions on whether it has achieved its primary goal of “price stability” – a steady inflation rate of around 2%. Its primary tool for achieving this is the adjustment of interest rates. When inflation is too high, the BoE will try to rein it in by raising interest rates, making it more expensive for people and businesses to access credit. This is generally positive for GBP, as higher interest rates make the UK a more attractive place for global investors to park their money. When inflation falls too low it is a sign economic growth is slowing. In this scenario, the BoE will consider lowering interest rates to cheapen credit so businesses will borrow more to invest in growth-generating projects.
Data releases gauge the health of the economy and can impact the value of the Pound Sterling. Indicators such as GDP, Manufacturing and Services PMIs, and employment can all influence the direction of the GBP. A strong economy is good for Sterling. Not only does it attract more foreign investment but it may encourage the BoE to put up interest rates, which will directly strengthen GBP. Otherwise, if economic data is weak, the Pound Sterling is likely to fall.
Another significant data release for the Pound Sterling is the Trade Balance. This indicator measures the difference between what a country earns from its exports and what it spends on imports over a given period. If a country produces highly sought-after exports, its currency will benefit purely from the extra demand created from foreign buyers seeking to purchase these goods. Therefore, a positive net Trade Balance strengthens a currency and vice versa for a negative balance.
Here is what you need to know on Monday, October 7:
The US Dollar (USD) Index rose more than 2% in the previous week and registered its largest one-week gain of 2024. The index stays in a consolidation phase at around 102.50 in the European morning on Monday. Later in the session, Eurostat will publish Retail Sales data for August. In the second half of the day, Consumer Credit Change for August will be the only data featured in the US economic docket. During the American trading hours, several Federal Reserve (Fed) policymakers, including Governor Michelle Bowman, will be delivering speeches.
US Dollar PRICE Last 7 days
The table below shows the percentage change of US Dollar (USD) against listed major currencies last 7 days. US Dollar was the strongest against the Japanese Yen.
| USD | EUR | GBP | JPY | CAD | AUD | NZD | CHF | |
|---|---|---|---|---|---|---|---|---|
| USD | 1.87% | 2.09% | 4.27% | 0.58% | 1.63% | 3.08% | 2.03% | |
| EUR | -1.87% | 0.23% | 2.36% | -1.24% | -0.18% | 1.20% | 0.27% | |
| GBP | -2.09% | -0.23% | 2.25% | -1.47% | -0.42% | 0.97% | 0.00% | |
| JPY | -4.27% | -2.36% | -2.25% | -3.49% | -2.60% | -1.13% | -2.10% | |
| CAD | -0.58% | 1.24% | 1.47% | 3.49% | 1.09% | 2.47% | 1.50% | |
| AUD | -1.63% | 0.18% | 0.42% | 2.60% | -1.09% | 1.39% | 0.42% | |
| NZD | -3.08% | -1.20% | -0.97% | 1.13% | -2.47% | -1.39% | -0.98% | |
| CHF | -2.03% | -0.27% | -0.01% | 2.10% | -1.50% | -0.42% | 0.98% |
The heat map shows percentage changes of major currencies against each other. The base currency is picked from the left column, while the quote currency is picked from the top row. For example, if you pick the US Dollar from the left column and move along the horizontal line to the Japanese Yen, the percentage change displayed in the box will represent USD (base)/JPY (quote).
The USD benefited from the upbeat employment data for September on Friday and continued to outperform its major rivals heading into the weekend. The US Bureau of Labor Statistics reported that Nonfarm Payrolls (NFP) rose by 254,000 in September, surpassing the market expectation of 140,000 by a wide margin. Additionally, the Unemployment Rate edged lower to 4.1% from 4.2% in the same period.
EUR/USD extended its weekly downtrend on Friday and touched its lowest level since mid-August near 1.0950. The pair struggles to stage a rebound in the early European session on Monday and trades below 1.1000.
GBP/USD fell below 1.3100 with the immediate reaction to the US labor market data on Friday but managed to erase its losses to end the day flat. The pair holds steady and moves up and down in a narrow band slightly above 1.3100 in the European morning.
In its quarterly report published on Monday, the Bank of Japan (BoJ) raised the assessment for two of Japan's nine regions. "All regions in Japan saw economy recovering moderately, picking up or picking up moderately," the BoJ further noted. After rising more than 1% on Friday, USD/JPY edges lower early Monday and trades below 148.50.
Gold registered small losses in the previous week despite the broad USD strength as the precious metal capitalized on safe-haven demand. XAU/USD stays on the back foot to start the week and trades in negative territory below $2,650.
US Dollar FAQs
The US Dollar (USD) is the official currency of the United States of America, and the ‘de facto’ currency of a significant number of other countries where it is found in circulation alongside local notes. It is the most heavily traded currency in the world, accounting for over 88% of all global foreign exchange turnover, or an average of $6.6 trillion in transactions per day, according to data from 2022. Following the second world war, the USD took over from the British Pound as the world’s reserve currency. For most of its history, the US Dollar was backed by Gold, until the Bretton Woods Agreement in 1971 when the Gold Standard went away.
The most important single factor impacting on the value of the US Dollar is monetary policy, which is shaped by the Federal Reserve (Fed). The Fed has two mandates: to achieve price stability (control inflation) and foster full employment. Its primary tool to achieve these two goals is by adjusting interest rates. When prices are rising too quickly and inflation is above the Fed’s 2% target, the Fed will raise rates, which helps the USD value. When inflation falls below 2% or the Unemployment Rate is too high, the Fed may lower interest rates, which weighs on the Greenback.
In extreme situations, the Federal Reserve can also print more Dollars and enact quantitative easing (QE). QE is the process by which the Fed substantially increases the flow of credit in a stuck financial system. It is a non-standard policy measure used when credit has dried up because banks will not lend to each other (out of the fear of counterparty default). It is a last resort when simply lowering interest rates is unlikely to achieve the necessary result. It was the Fed’s weapon of choice to combat the credit crunch that occurred during the Great Financial Crisis in 2008. It involves the Fed printing more Dollars and using them to buy US government bonds predominantly from financial institutions. QE usually leads to a weaker US Dollar.
Quantitative tightening (QT) is the reverse process whereby the Federal Reserve stops buying bonds from financial institutions and does not reinvest the principal from the bonds it holds maturing in new purchases. It is usually positive for the US Dollar.
- EUR/USD weakens to near 1.0965 in Monday’s early European session.
- The bullish outlook of the pair looks fragile on the daily chart, with the RSI indicator holding below the midline.
- The initial support level is seen at 1.0881; the immediate resistance level is located at 1.1000.
The EUR/USD pair trades in negative territory for the seventh consecutive day around 1.0965 during the early European session on Monday. The major pair remains under selling pressure amid the further upside in the US Dollar (USD). The recent US jobs data released on Friday has prompted traders to pull back expectations for 50 basis points (bps) Fed rate cut at the November meeting.
According to the daily chart, the bullish outlook of EUR/USD looks vulnerable as the major pair hovers around the key 100-day Exponential Moving Averages (EMA). EUR/USD could resume its downside bias if it decisively crosses below the 100-day EMA. Additionally, the downward momentum is supported by the Relative Strength Index (RSI), which stands below the midline near 37.55, suggesting that the path of least resistance is to the downside.
Decisive trading below the 100-day EMA at 1.0970 could see a drop to 1.0881, the low of August 8. The crucial support level for the cross emerges in the 1.0805-1.0800 zone, the low of July 9 and the round mark.
On the upside, the 1.1000 psychological level will be the first upside barrier for the pair. Extended gains could see a rally to 1.1144, the high of October 1. A break above this level could pave the way to 1.1223, the upper boundary of the Bollinger Band.
EUR/USD daily chart
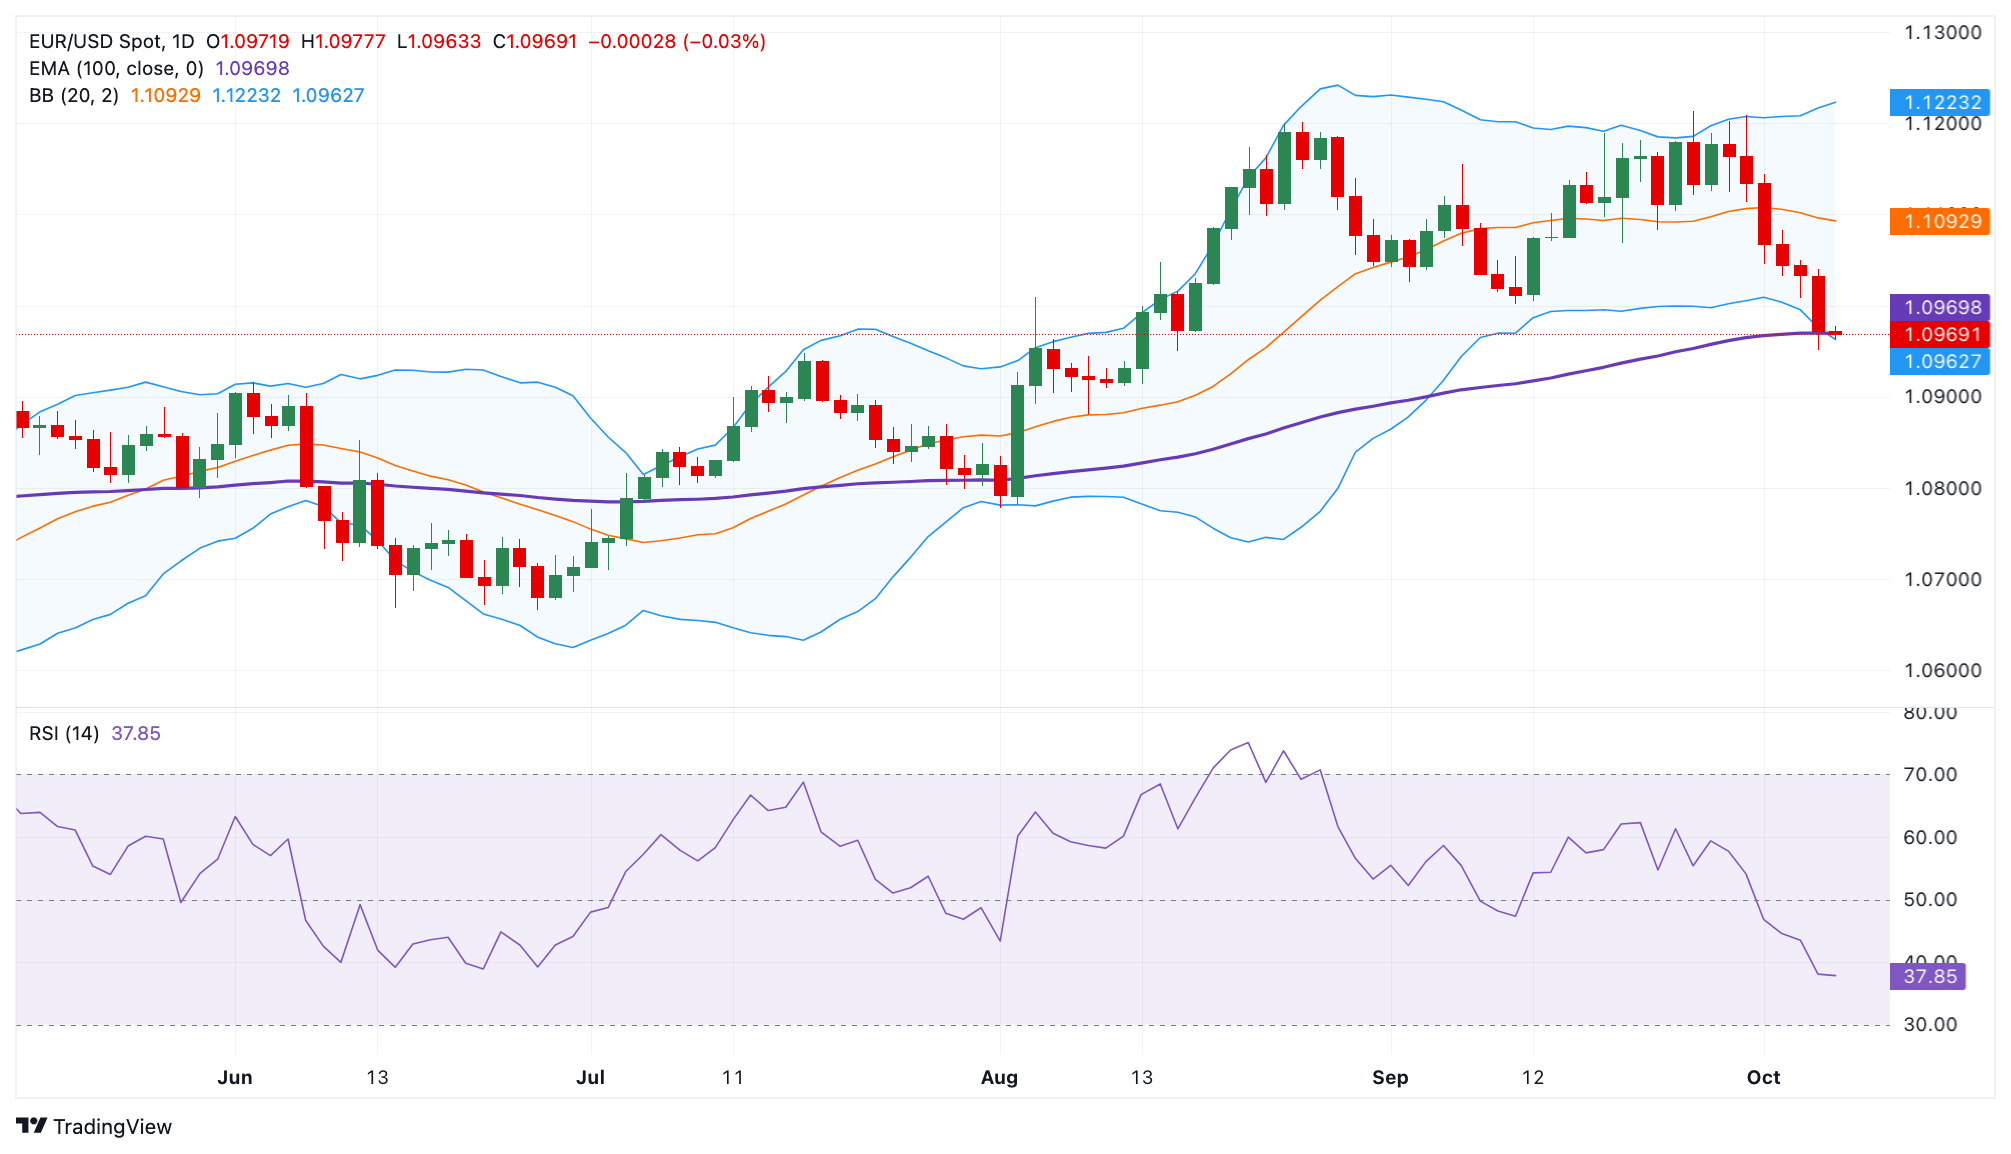
Euro FAQs
The Euro is the currency for the 19 European Union countries that belong to the Eurozone. It is the second most heavily traded currency in the world behind the US Dollar. In 2022, it accounted for 31% of all foreign exchange transactions, with an average daily turnover of over $2.2 trillion a day. EUR/USD is the most heavily traded currency pair in the world, accounting for an estimated 30% off all transactions, followed by EUR/JPY (4%), EUR/GBP (3%) and EUR/AUD (2%).
The European Central Bank (ECB) in Frankfurt, Germany, is the reserve bank for the Eurozone. The ECB sets interest rates and manages monetary policy. The ECB’s primary mandate is to maintain price stability, which means either controlling inflation or stimulating growth. Its primary tool is the raising or lowering of interest rates. Relatively high interest rates – or the expectation of higher rates – will usually benefit the Euro and vice versa. The ECB Governing Council makes monetary policy decisions at meetings held eight times a year. Decisions are made by heads of the Eurozone national banks and six permanent members, including the President of the ECB, Christine Lagarde.
Eurozone inflation data, measured by the Harmonized Index of Consumer Prices (HICP), is an important econometric for the Euro. If inflation rises more than expected, especially if above the ECB’s 2% target, it obliges the ECB to raise interest rates to bring it back under control. Relatively high interest rates compared to its counterparts will usually benefit the Euro, as it makes the region more attractive as a place for global investors to park their money.
Data releases gauge the health of the economy and can impact on the Euro. Indicators such as GDP, Manufacturing and Services PMIs, employment, and consumer sentiment surveys can all influence the direction of the single currency. A strong economy is good for the Euro. Not only does it attract more foreign investment but it may encourage the ECB to put up interest rates, which will directly strengthen the Euro. Otherwise, if economic data is weak, the Euro is likely to fall. Economic data for the four largest economies in the euro area (Germany, France, Italy and Spain) are especially significant, as they account for 75% of the Eurozone’s economy.
Another significant data release for the Euro is the Trade Balance. This indicator measures the difference between what a country earns from its exports and what it spends on imports over a given period. If a country produces highly sought after exports then its currency will gain in value purely from the extra demand created from foreign buyers seeking to purchase these goods. Therefore, a positive net Trade Balance strengthens a currency and vice versa for a negative balance.
- AUD/USD attracts some dip-buyers on Monday, though the uptick lacks bullish conviction.
- The technical setup warrants caution before positioning for any further appreciating move.
- Bearish traders need to wait for a break below the 50% Fibo. level before placing fresh bets.
The AUD/USD pair kicks off the new week on a positive note, snapping a two-day losing streak and stalling its recent pullback from the highest level since February 2023 touched last Monday. Spot prices currently trade just above the 0.6800 mark, up 0.20% for the day, though lack follow-through buying amid a bullish US Dollar (USD).
The upbeat US monthly employment details released on Friday eased concerns about an economic slowdown, which, along with the optimism over China's stimulus, remains supportive of the risk-on mood. Apart from this, the Reserve Bank of Australia's (RBA) hawkish stance benefits the risk-sensitive Aussie. Meanwhile, diminishing odds for a more aggressive policy easing by the Federal Reserve (Fed) and escalating geopolitical tensions in the Middle East assist the safe-haven buck to stand tall near a seven-week high. This, in turn, acts as a headwind for the AUD/USD pair.
From a technical perspective, spot prices on Friday found support near the 0.6785 region, or the 50% Fibonacci retracement level of the September move-up. The subsequent move up favors bullish traders, though the fact that oscillators on the daily chart have just started gaining negative traction warrants some caution before positioning for any further appreciating move. In the meantime, the 0.6820 region, or the 38.2% Fibo. level is likely to act as an immediate hurdle, above which the AUD/USD pair could accelerate the positive move towards the 0.6865-0.6870 region.
The latter near the 23.6% Fibo. level breakpoint, which if cleared will suggest that the corrective slide has run its course and prompt fresh buying. Spot prices might then aim to reclaim the 0.6900 round-figure mark and extend the momentum further towards the 0.6940-0.6945 region, or the year-to-date (YTD) peak touched last week.
On the flip side, bearish traders need to wait for a sustained break and acceptance below the 50% Fibo. level, around the 0.6785 region, before placing fresh bets. The AUD/USD pair might then slide to the 61.8 % Fibo. level, around the 0.6745 region, before eventually dropping en route to sub-0.6700 levels, or the 100-day Simple Moving Average (SMA).
AUD/USD daily chart
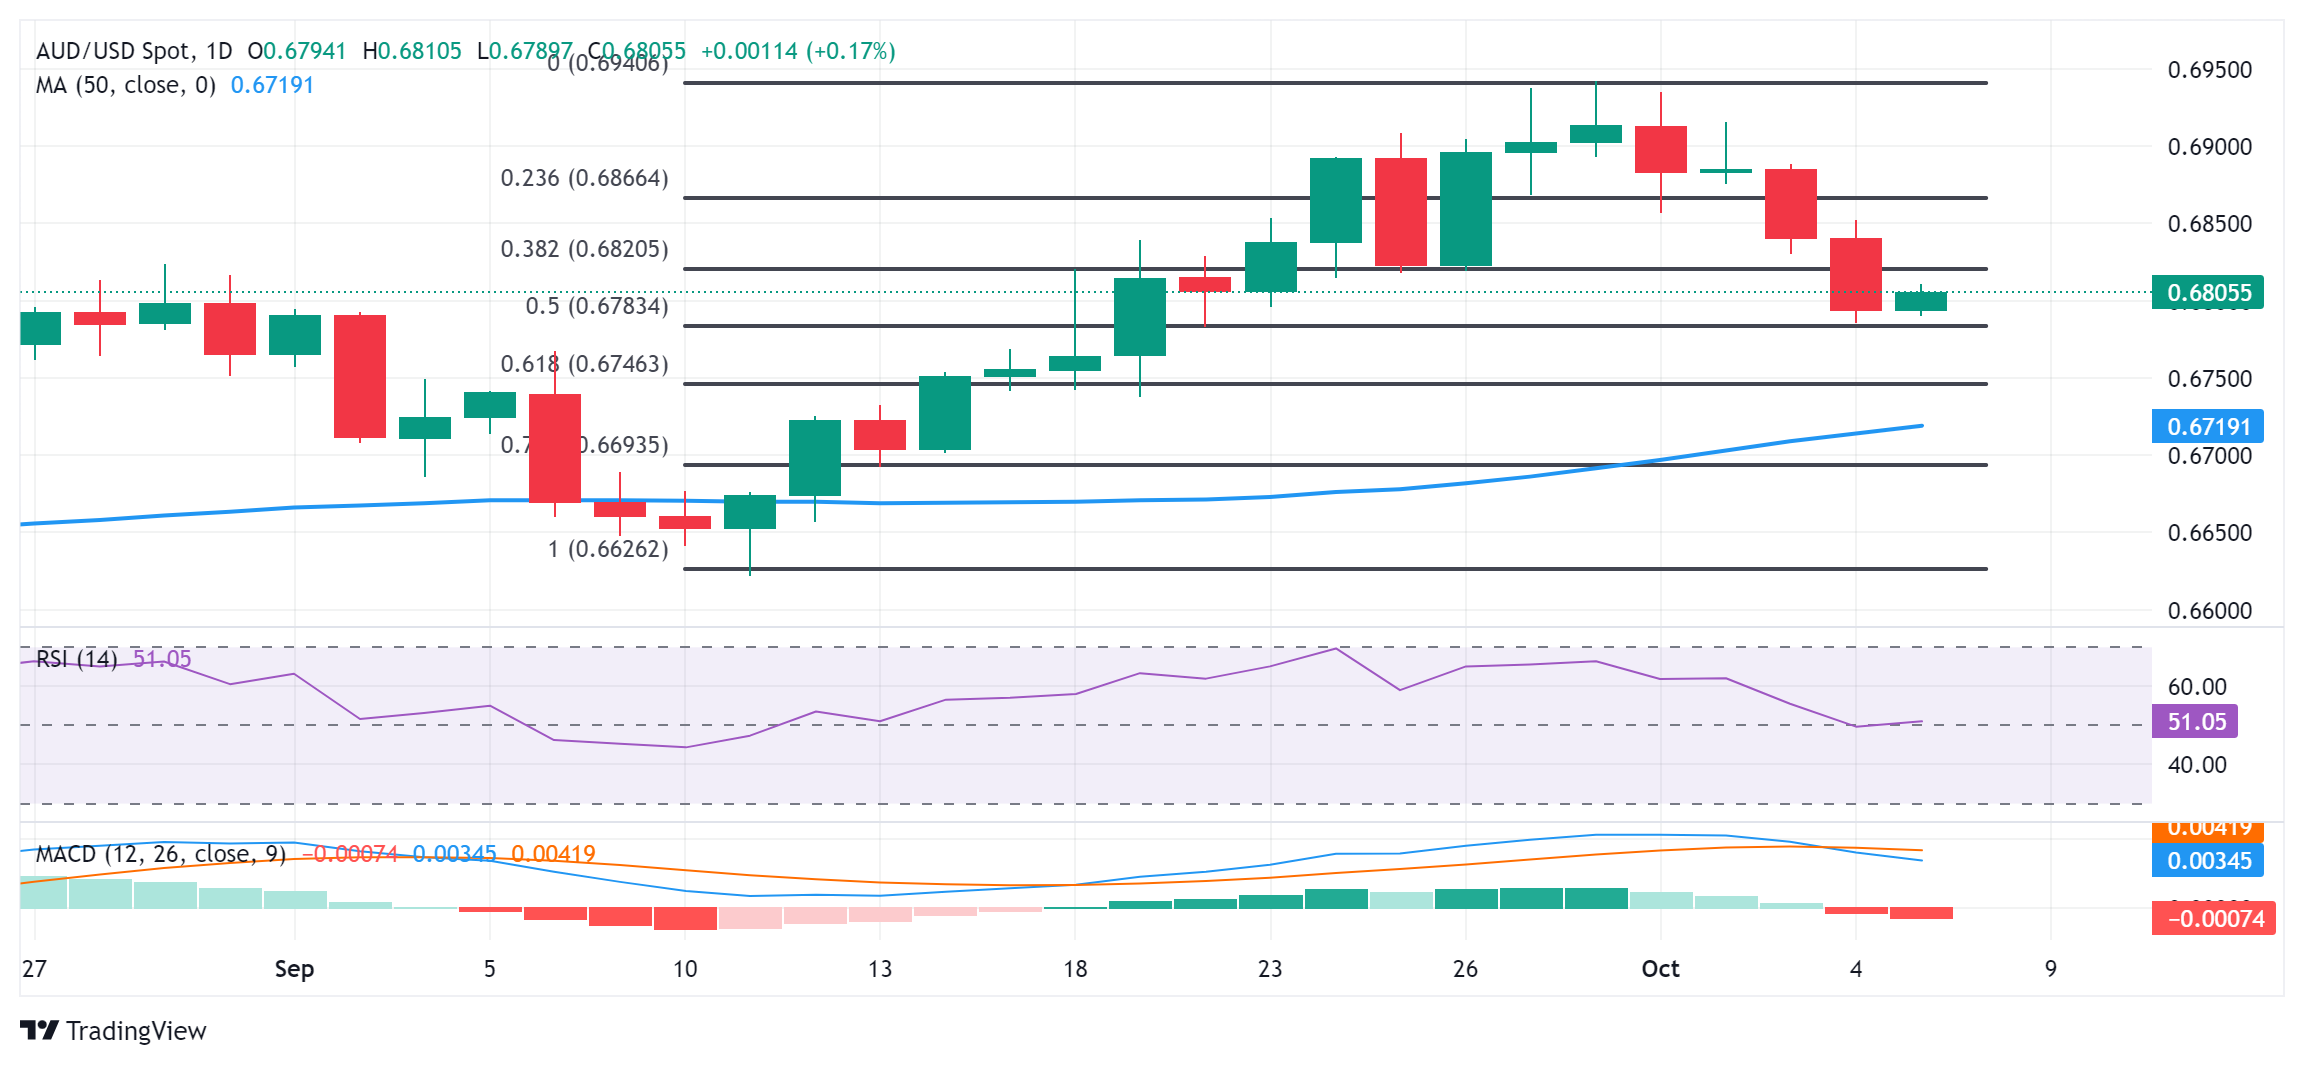
Australian Dollar FAQs
One of the most significant factors for the Australian Dollar (AUD) is the level of interest rates set by the Reserve Bank of Australia (RBA). Because Australia is a resource-rich country another key driver is the price of its biggest export, Iron Ore. The health of the Chinese economy, its largest trading partner, is a factor, as well as inflation in Australia, its growth rate and Trade Balance. Market sentiment – whether investors are taking on more risky assets (risk-on) or seeking safe-havens (risk-off) – is also a factor, with risk-on positive for AUD.
The Reserve Bank of Australia (RBA) influences the Australian Dollar (AUD) by setting the level of interest rates that Australian banks can lend to each other. This influences the level of interest rates in the economy as a whole. The main goal of the RBA is to maintain a stable inflation rate of 2-3% by adjusting interest rates up or down. Relatively high interest rates compared to other major central banks support the AUD, and the opposite for relatively low. The RBA can also use quantitative easing and tightening to influence credit conditions, with the former AUD-negative and the latter AUD-positive.
China is Australia’s largest trading partner so the health of the Chinese economy is a major influence on the value of the Australian Dollar (AUD). When the Chinese economy is doing well it purchases more raw materials, goods and services from Australia, lifting demand for the AUD, and pushing up its value. The opposite is the case when the Chinese economy is not growing as fast as expected. Positive or negative surprises in Chinese growth data, therefore, often have a direct impact on the Australian Dollar and its pairs.
Iron Ore is Australia’s largest export, accounting for $118 billion a year according to data from 2021, with China as its primary destination. The price of Iron Ore, therefore, can be a driver of the Australian Dollar. Generally, if the price of Iron Ore rises, AUD also goes up, as aggregate demand for the currency increases. The opposite is the case if the price of Iron Ore falls. Higher Iron Ore prices also tend to result in a greater likelihood of a positive Trade Balance for Australia, which is also positive of the AUD.
The Trade Balance, which is the difference between what a country earns from its exports versus what it pays for its imports, is another factor that can influence the value of the Australian Dollar. If Australia produces highly sought after exports, then its currency will gain in value purely from the surplus demand created from foreign buyers seeking to purchase its exports versus what it spends to purchase imports. Therefore, a positive net Trade Balance strengthens the AUD, with the opposite effect if the Trade Balance is negative.
Germany’s Factory Orders slumped in August, according to the official data published by the Federal Statistics Office on Monday, suggesting that the German manufacturing sector lost its recovery momentum.
Over the month, contracts for goods ‘Made in Germany’ declined by 5.8% in August after unexpectedly rebounding 3.9% in July. Data missed the estimates of a 2.0% drop.
Germany’s Industrial Orders fell 3.9% in the year through August, as against the previous jump of 4.6%.
FX implications
The Euro remains vulnerable after the disappointing German data, as the EUR/USD loses 0.11% on the day to trade near 1.0965, as of writing.
Euro PRICE Today
The table below shows the percentage change of Euro (EUR) against listed major currencies today. Euro was the weakest against the Japanese Yen.
| USD | EUR | GBP | JPY | CAD | AUD | NZD | CHF | |
|---|---|---|---|---|---|---|---|---|
| USD | 0.05% | -0.00% | -0.18% | 0.09% | -0.11% | 0.02% | -0.09% | |
| EUR | -0.05% | 0.02% | -0.21% | 0.07% | -0.18% | -0.03% | -0.15% | |
| GBP | 0.00% | -0.02% | -0.27% | 0.07% | -0.19% | -0.01% | -0.04% | |
| JPY | 0.18% | 0.21% | 0.27% | 0.26% | 0.05% | 0.14% | 0.15% | |
| CAD | -0.09% | -0.07% | -0.07% | -0.26% | -0.17% | -0.07% | -0.16% | |
| AUD | 0.11% | 0.18% | 0.19% | -0.05% | 0.17% | 0.19% | 0.05% | |
| NZD | -0.02% | 0.03% | 0.01% | -0.14% | 0.07% | -0.19% | -0.06% | |
| CHF | 0.09% | 0.15% | 0.04% | -0.15% | 0.16% | -0.05% | 0.06% |
The heat map shows percentage changes of major currencies against each other. The base currency is picked from the left column, while the quote currency is picked from the top row. For example, if you pick the Euro from the left column and move along the horizontal line to the US Dollar, the percentage change displayed in the box will represent EUR (base)/USD (quote).
- NZD/USD trades on a softer note around 0.6165 in Monday’s Asian session.
- Traders pull back expectations for a 50 bps cut from the Fed at its November meeting after the upbeat NFP data.
- The RBNZ is expected to cut another OCR in its October meeting on Wednesday.
The NZD/USD pair remains on the defensive near 0.6165 during the early Asian session on Monday. The firmer Greenback after the encouraging US employment data exerts some selling pressure on the pair. The Reserve Bank of New Zealand (RBNZ) interest decision will take center stage on Wednesday.
The recent US economic data indicated strength in labor conditions and will likely support the case for the US Federal Reserve's (Fed) rate cuts by 25 basis points (bps) in November and December. Traders are now pricing in around 97.4% possibility of 25 bps Fed rate cuts in September, up from 31.1% before the NFP data, according to the CME Fedwatch Tool. Lower bets of an aggressive Fed rate cut boost the US Dollar (USD) against the Kiwi.
Chicago Fed President Austan Goolsbee emphasized on Friday that the September jobs report doesn't alter the view that interest rates can come down "a lot" over the next year and a half. Goolsbee further stated that the central bank will be careful not to keep rates as "restrictive as they are," even with inflation close to the 2% target and the labor market healthy.
The RBNZ started the easing cycle in August with a 25 basis points (bps) cut to 5.25%, and analysts expect the New Zealand central bank to cut further the Official Cash Rate (OCR) in its October meeting on Wednesday. “We now expect more aggressive rate cuts from the RBNZ with growth under pressure. We see two 50bps cuts in Q4-2024, taking the OCR to 4.25% (4.75% prior) by end-2024. We maintain our view for 125bps of cuts in 2025, and see the OCR at 3% by end-2025 (3.5% prior),” noted Standard Chartered analysts.
RBNZ FAQs
The Reserve Bank of New Zealand (RBNZ) is the country’s central bank. Its economic objectives are achieving and maintaining price stability – achieved when inflation, measured by the Consumer Price Index (CPI), falls within the band of between 1% and 3% – and supporting maximum sustainable employment.
The Reserve Bank of New Zealand’s (RBNZ) Monetary Policy Committee (MPC) decides the appropriate level of the Official Cash Rate (OCR) according to its objectives. When inflation is above target, the bank will attempt to tame it by raising its key OCR, making it more expensive for households and businesses to borrow money and thus cooling the economy. Higher interest rates are generally positive for the New Zealand Dollar (NZD) as they lead to higher yields, making the country a more attractive place for investors. On the contrary, lower interest rates tend to weaken NZD.
Employment is important for the Reserve Bank of New Zealand (RBNZ) because a tight labor market can fuel inflation. The RBNZ’s goal of “maximum sustainable employment” is defined as the highest use of labor resources that can be sustained over time without creating an acceleration in inflation. “When employment is at its maximum sustainable level, there will be low and stable inflation. However, if employment is above the maximum sustainable level for too long, it will eventually cause prices to rise more and more quickly, requiring the MPC to raise interest rates to keep inflation under control,” the bank says.
In extreme situations, the Reserve Bank of New Zealand (RBNZ) can enact a monetary policy tool called Quantitative Easing. QE is the process by which the RBNZ prints local currency and uses it to buy assets – usually government or corporate bonds – from banks and other financial institutions with the aim to increase the domestic money supply and spur economic activity. QE usually results in a weaker New Zealand Dollar (NZD). QE is a last resort when simply lowering interest rates is unlikely to achieve the objectives of the central bank. The RBNZ used it during the Covid-19 pandemic.
In its quarterly report published on Monday, the Bank of Japan (BoJ) raised the assessment for two of Japan's nine regions.
Additional takeaways
BoJ maintains assessment for seven of Japan's nine regions.
All regions in Japan saw economy recovering moderately, picking up or picking up moderately.
Many regions said service consumption remains firm.
Many regions said output increasing due to rebound in global it demand, auto-related output also at high levels.
Many regions saw firms saying they must keep raising wages due to structural labour shortage.
Some small firms continued to complain of severe earnings situation, must be vigilant.
Many regions said price hikes broadening, manufacturers saying they are able to pass on rising costs more smoothly.
Gold prices fell in India on Monday, according to data compiled by FXStreet.
The price for Gold stood at 7,147.46 Indian Rupees (INR) per gram, down compared with the INR 7,163.71 it cost on Friday.
The price for Gold decreased to INR 83,366.52 per tola from INR 83,556.06 per tola on friday.
| Unit measure | Gold Price in INR |
|---|---|
| 1 Gram | 7,147.46 |
| 10 Grams | 71,474.55 |
| Tola | 83,366.52 |
| Troy Ounce | 222,310.90 |
FXStreet calculates Gold prices in India by adapting international prices (USD/INR) to the local currency and measurement units. Prices are updated daily based on the market rates taken at the time of publication. Prices are just for reference and local rates could diverge slightly.
Gold FAQs
Gold has played a key role in human’s history as it has been widely used as a store of value and medium of exchange. Currently, apart from its shine and usage for jewelry, the precious metal is widely seen as a safe-haven asset, meaning that it is considered a good investment during turbulent times. Gold is also widely seen as a hedge against inflation and against depreciating currencies as it doesn’t rely on any specific issuer or government.
Central banks are the biggest Gold holders. In their aim to support their currencies in turbulent times, central banks tend to diversify their reserves and buy Gold to improve the perceived strength of the economy and the currency. High Gold reserves can be a source of trust for a country’s solvency. Central banks added 1,136 tonnes of Gold worth around $70 billion to their reserves in 2022, according to data from the World Gold Council. This is the highest yearly purchase since records began. Central banks from emerging economies such as China, India and Turkey are quickly increasing their Gold reserves.
Gold has an inverse correlation with the US Dollar and US Treasuries, which are both major reserve and safe-haven assets. When the Dollar depreciates, Gold tends to rise, enabling investors and central banks to diversify their assets in turbulent times. Gold is also inversely correlated with risk assets. A rally in the stock market tends to weaken Gold price, while sell-offs in riskier markets tend to favor the precious metal.
The price can move due to a wide range of factors. Geopolitical instability or fears of a deep recession can quickly make Gold price escalate due to its safe-haven status. As a yield-less asset, Gold tends to rise with lower interest rates, while higher cost of money usually weighs down on the yellow metal. Still, most moves depend on how the US Dollar (USD) behaves as the asset is priced in dollars (XAU/USD). A strong Dollar tends to keep the price of Gold controlled, whereas a weaker Dollar is likely to push Gold prices up.
(An automation tool was used in creating this post.)
- USD/CAD draws support from a modest downtick in Oil prices and a bullish USD.
- Reduced bets for a 50 bps Fed rate cut next month continue to benefit the buck.
- Middle East tensions act as a tailwind for the Loonie and cap gains for the major.
The USD/CAD pair oscillates in a narrow range, around the 1.3580 region on the first day of a new week and is currently placed just below a two-week high touched on Friday.
A modest downtick in Crude Oil prices undermines the commodity-linked Loonie amid expectations for a bigger interest rate cut by the Bank of Canada (BoC) later this month. The US Dollar (USD), on the other hand, consolidates last week's strong gains to its highest level since August 16 and remains supported by diminishing odds for a more aggressive policy easing by the Federal Reserve (Fed). This turns out to be a key factors acting as a tailwind for the USD/CAD pair.
The blowout US monthly jobs data released on Friday pointed to a still resilient labor market and suggested that the economy is in a much better shape. This, in turn, forced investors to further scale back their bets for another oversized interest rate cut by the US central bank in November and keep the yield on the benchmark 10-year US government bond close to the 4.0% threshold. Apart from this, persistent geopolitical risks offer additional support to the safe-haven buck.
Meanwhile, fears that escalating tensions in the Middle East could trigger a broader conflict and disrupt supply from the key oil-producing region help limit the downside for the black liquid. This, in turn, holds back bulls from placing fresh bets around the USD/CAD pair. Even from a technical perspective, a sustained strength beyond the very important 200-day Simple Moving Average (SMA) hurdle, near the 1.3600 mark, is needed to support prospects for further gains.
Moving ahead, there isn't any relevant market-moving economic data due for release on Monday, either from the US or Canada. That said, speeches by influential FOMC members will drive the USD demand and provide some impetus to the USD/CAD pair later during the North American session. Apart from this, Oil price dynamics and geopolitical developments should assist traders in grabbing short-term trading opportunities around the currency pair.
Canadian Dollar FAQs
The key factors driving the Canadian Dollar (CAD) are the level of interest rates set by the Bank of Canada (BoC), the price of Oil, Canada’s largest export, the health of its economy, inflation and the Trade Balance, which is the difference between the value of Canada’s exports versus its imports. Other factors include market sentiment – whether investors are taking on more risky assets (risk-on) or seeking safe-havens (risk-off) – with risk-on being CAD-positive. As its largest trading partner, the health of the US economy is also a key factor influencing the Canadian Dollar.
The Bank of Canada (BoC) has a significant influence on the Canadian Dollar by setting the level of interest rates that banks can lend to one another. This influences the level of interest rates for everyone. The main goal of the BoC is to maintain inflation at 1-3% by adjusting interest rates up or down. Relatively higher interest rates tend to be positive for the CAD. The Bank of Canada can also use quantitative easing and tightening to influence credit conditions, with the former CAD-negative and the latter CAD-positive.
The price of Oil is a key factor impacting the value of the Canadian Dollar. Petroleum is Canada’s biggest export, so Oil price tends to have an immediate impact on the CAD value. Generally, if Oil price rises CAD also goes up, as aggregate demand for the currency increases. The opposite is the case if the price of Oil falls. Higher Oil prices also tend to result in a greater likelihood of a positive Trade Balance, which is also supportive of the CAD.
While inflation had always traditionally been thought of as a negative factor for a currency since it lowers the value of money, the opposite has actually been the case in modern times with the relaxation of cross-border capital controls. Higher inflation tends to lead central banks to put up interest rates which attracts more capital inflows from global investors seeking a lucrative place to keep their money. This increases demand for the local currency, which in Canada’s case is the Canadian Dollar.
Macroeconomic data releases gauge the health of the economy and can have an impact on the Canadian Dollar. Indicators such as GDP, Manufacturing and Services PMIs, employment, and consumer sentiment surveys can all influence the direction of the CAD. A strong economy is good for the Canadian Dollar. Not only does it attract more foreign investment but it may encourage the Bank of Canada to put up interest rates, leading to a stronger currency. If economic data is weak, however, the CAD is likely to fall.
- WTI kicks off the new week on a weaker note amid some profit-taking, though it lacks follow-through.
- Middle East tensions, along with optimism over demand recovery, lend support to Crude Oil prices.
- Traders now look to Fedpseak for some impetus, though the focus remains on the Israel-Hamas war.
West Texas Intermediate (WTI) US crude Oil prices kick off the new week on a weaker note and move away from a five-month peak – levels beyond the $75.00 psychological mark touched on Friday. The commodity, however, trims a part of modest Asian session losses and currently trades around the $73.75-$73.80 region, down 0.35% for the day.
The intraday downtick lacks any obvious fundamental catalyst and could be attributed to some profit-taking, especially after last week's strong gains – marking the biggest in over a year. Meanwhile, the Israel-Hamas war showed few signs of cooling, which, along with reports that Israel is considering attacking Iran's oil production facilities, fuel concerns about supply disruptions from the Middle East. This, in turn, is seen as a key factor that acts as a tailwind for crude oil prices.
Furthermore, the upbeat US monthly employment details released on Friday raised hopes that the world's largest economy was more resilient than initially feared. Apart from this, hopes that the recent stimulus bonanza from China will ignite a lasting recovery and lift fuel demand in the world's largest Oil importer. This turns out to be a key factor that acts as a tailwind for Crude Oil prices and warrants caution for bearish traders or positioning for any meaningful slide.
Moving ahead, there isn't any relevant market-moving economic data due for release on Monday from the US. That said, speeches by influential FOMC members will drive the USD demand and provide some impetus to USD-denominated commodities, including Crude Oil prices. Apart from this, geopolitical developments surrounding the ongoing conflicts in the Middle East should contribute to producing short-term trading opportunities around the black liquid.
WTI Oil FAQs
WTI Oil is a type of Crude Oil sold on international markets. The WTI stands for West Texas Intermediate, one of three major types including Brent and Dubai Crude. WTI is also referred to as “light” and “sweet” because of its relatively low gravity and sulfur content respectively. It is considered a high quality Oil that is easily refined. It is sourced in the United States and distributed via the Cushing hub, which is considered “The Pipeline Crossroads of the World”. It is a benchmark for the Oil market and WTI price is frequently quoted in the media.
Like all assets, supply and demand are the key drivers of WTI Oil price. As such, global growth can be a driver of increased demand and vice versa for weak global growth. Political instability, wars, and sanctions can disrupt supply and impact prices. The decisions of OPEC, a group of major Oil-producing countries, is another key driver of price. The value of the US Dollar influences the price of WTI Crude Oil, since Oil is predominantly traded in US Dollars, thus a weaker US Dollar can make Oil more affordable and vice versa.
The weekly Oil inventory reports published by the American Petroleum Institute (API) and the Energy Information Agency (EIA) impact the price of WTI Oil. Changes in inventories reflect fluctuating supply and demand. If the data shows a drop in inventories it can indicate increased demand, pushing up Oil price. Higher inventories can reflect increased supply, pushing down prices. API’s report is published every Tuesday and EIA’s the day after. Their results are usually similar, falling within 1% of each other 75% of the time. The EIA data is considered more reliable, since it is a government agency.
OPEC (Organization of the Petroleum Exporting Countries) is a group of 12 Oil-producing nations who collectively decide production quotas for member countries at twice-yearly meetings. Their decisions often impact WTI Oil prices. When OPEC decides to lower quotas, it can tighten supply, pushing up Oil prices. When OPEC increases production, it has the opposite effect. OPEC+ refers to an expanded group that includes ten extra non-OPEC members, the most notable of which is Russia.
Japan’s newly appointed Finance Minister Katsunobu Kato on Monday that the government “must take action if necessary while monitoring impacts of forex moves on economic and household activities.”
Further comments
Weak Yen has both merits and demerits.
Will need to monitor how excessive forex moves will affect corporate activities and households.
Will leave to the Bank of Japan (BoJ) specific policy steps, when asked whether policy rate should be maintained at 0.25%.
Hope the BoJ will communicate with markets thoroughly and take appropriate policy to achieve 2% inflation target in a stable and sustainable manner.
Market reaction
USD/JPY holds the bounce near 148.50 following these above comments, still down 0.14% on the day.
- Indian Rupee holds positive ground in Monday’s Asian session.
- Firmer USD, foreign outflows and higher crude oil prices might undermine the INR.
- Traders await the Fedspeak later on Monday.
The Indian Rupee (INR) recovers some lost ground on Monday. The stronger US Dollar (USD), heightened fund outflows from local equities and the rise in crude oil prices might weigh on the local currency.
Traders will keep an eye on Fedspeak later on Monday for fresh impetus. Any dovish comments from US Federal Reserve (Fed) officials might drag the Greenback lower and support the INR. On Wednesday, the Reserve Bank of India (RBI) interest rate decision will be in the spotlight. The Indian central bank is unlikely to cut the benchmark interest rate in its forthcoming bi-monthly monetary policy review later in the week as retail inflation remains elevated.
Daily Digest Market Movers: Indian Rupee rebounds, potential upside seems limited
- The HSBC India Services Purchasing Managers Index (PMI) declined to a 10-month low of 57.7 in September from 60.9 in August, below the market consensus of 58.9.
- "The headline business activity index fell below 60 for the first time in 2024, but we note that at 57.7, it was still much above the long-term average," noted Pranjul Bhandari, chief India economist at HSBC.
- The US Nonfarm Payrolls (NFP) climbed by 254,000 in September from August's revised 159,000 and above the market consensus of 140,000, the Bureau of Labor Statistics showed Friday.
- The Unemployment Rate ticks lower to 4.1% in September, down from 4.2% in August. The Average Hourly Earnings rose to 3.8% from 3.6% during the same period.
- Chicago Fed President Austan Goolsbee said on Friday that he thinks the recent employment data was "superb" and noted that additional reports like this would increase his confidence that the US economy has reached full employment with low inflation.
Technical Analysis: USD/INR maintains a positive stance in the longer term
The Indian Rupee trades on a stronger note on the day. The constructive outlook of the USD/INR prevails as the price holds above the key 100-day Exponential Moving Average (EMA). The upward momentum is supported by the 14-day Relative Strength Index (RSI), which is located above the midline near 59.80.
Consistent trading above the key resistance level of 84.00, representing the upper boundary of the rectangle and psychological mark, could help draw in enough buyers to push USD/INR back to the all-time high of 84.15, en route to 84.50.
On the flip side, any follow-through selling below 83.80, the low of October 1, could drag the pair to the 100-day EMA at 83.65. The next downside target emerges at 83.00, representing the round mark and the low of May 24.
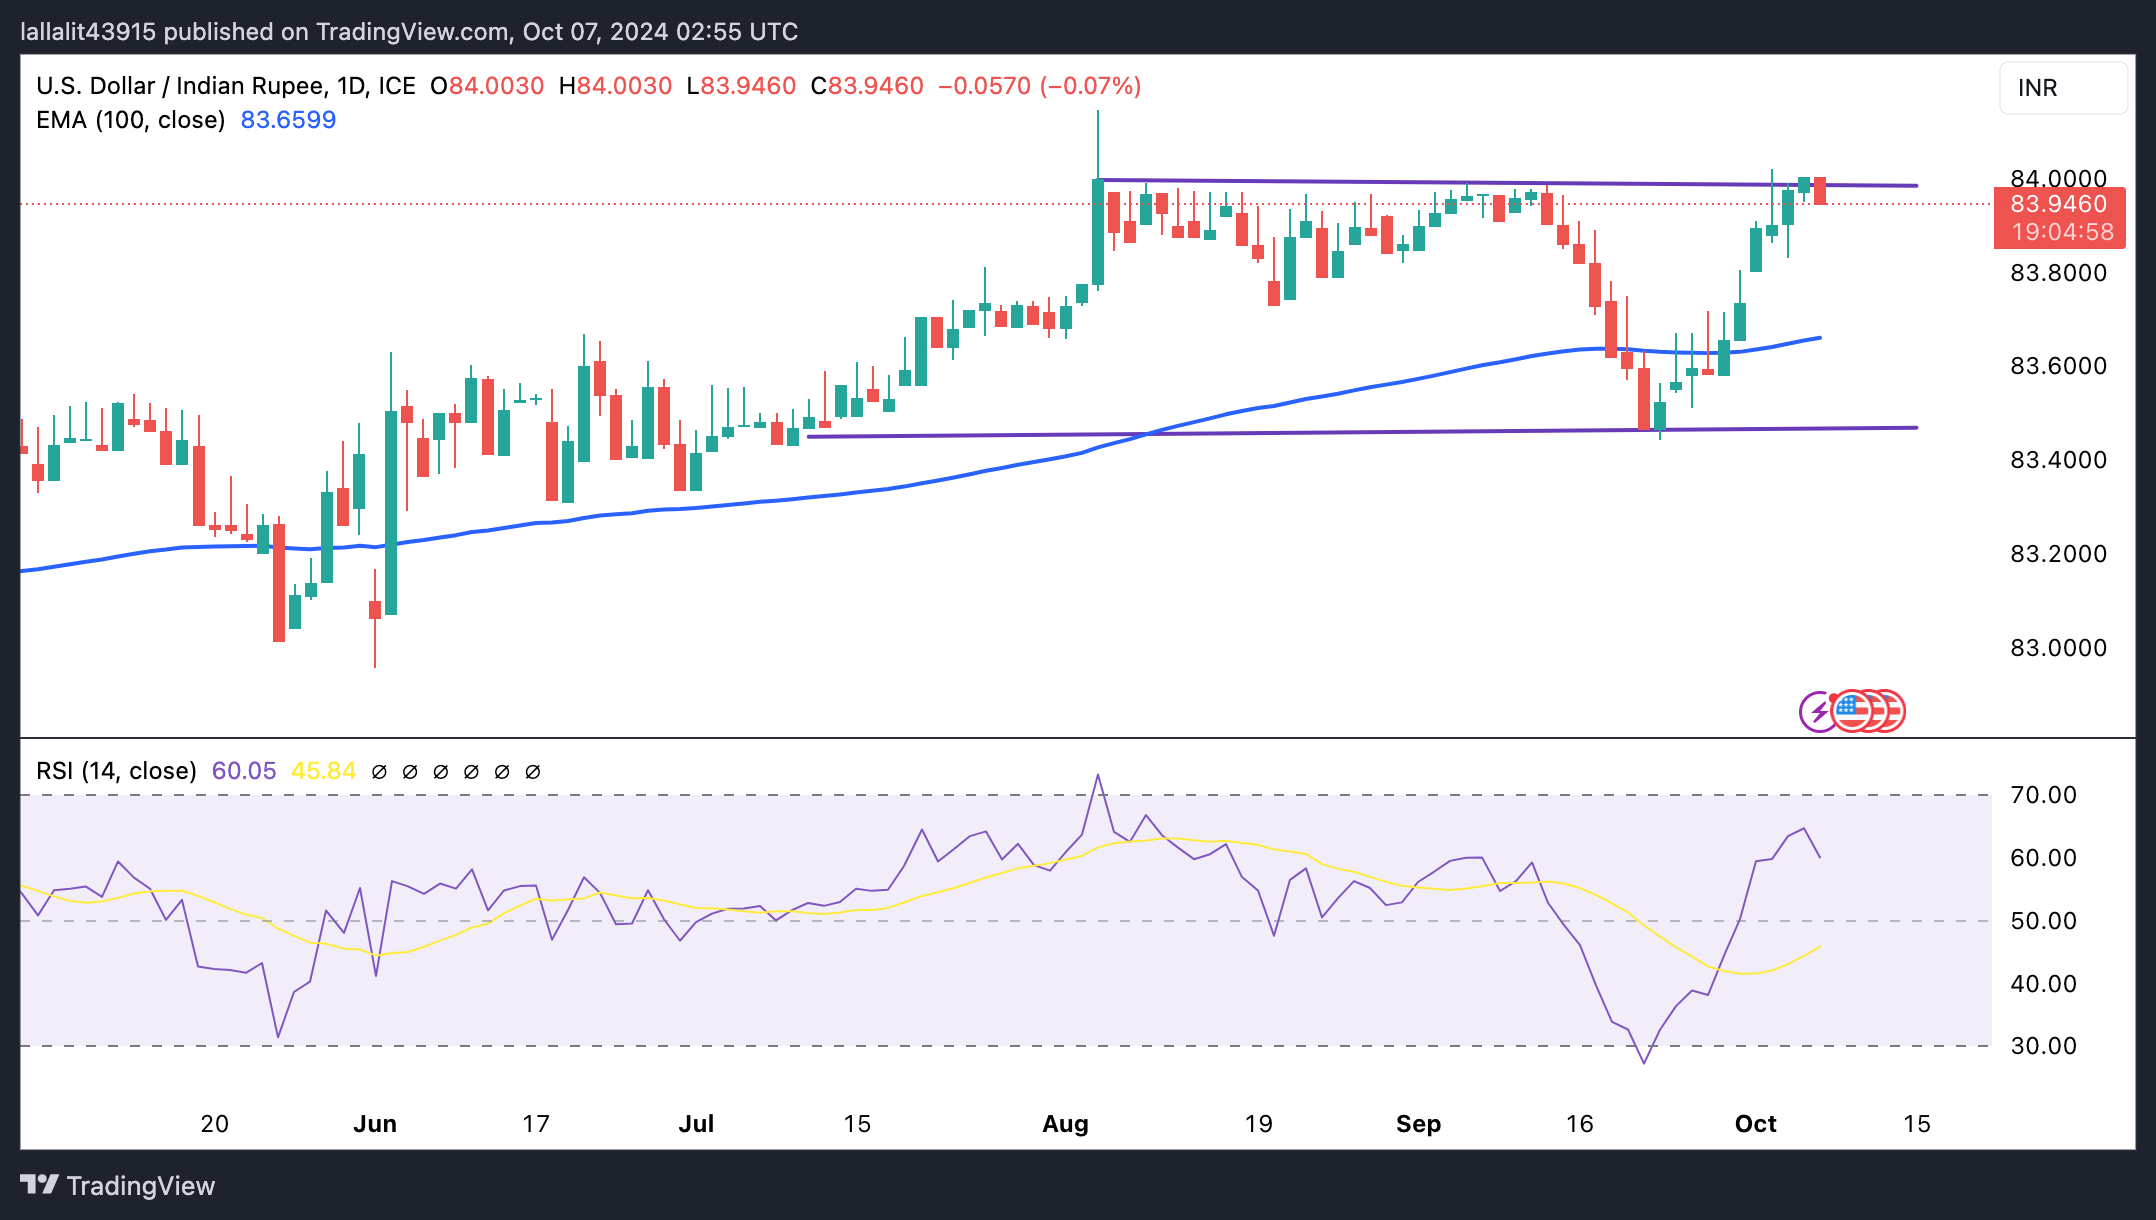
Indian Rupee FAQs
The Indian Rupee (INR) is one of the most sensitive currencies to external factors. The price of Crude Oil (the country is highly dependent on imported Oil), the value of the US Dollar – most trade is conducted in USD – and the level of foreign investment, are all influential. Direct intervention by the Reserve Bank of India (RBI) in FX markets to keep the exchange rate stable, as well as the level of interest rates set by the RBI, are further major influencing factors on the Rupee.
The Reserve Bank of India (RBI) actively intervenes in forex markets to maintain a stable exchange rate, to help facilitate trade. In addition, the RBI tries to maintain the inflation rate at its 4% target by adjusting interest rates. Higher interest rates usually strengthen the Rupee. This is due to the role of the ‘carry trade’ in which investors borrow in countries with lower interest rates so as to place their money in countries’ offering relatively higher interest rates and profit from the difference.
Macroeconomic factors that influence the value of the Rupee include inflation, interest rates, the economic growth rate (GDP), the balance of trade, and inflows from foreign investment. A higher growth rate can lead to more overseas investment, pushing up demand for the Rupee. A less negative balance of trade will eventually lead to a stronger Rupee. Higher interest rates, especially real rates (interest rates less inflation) are also positive for the Rupee. A risk-on environment can lead to greater inflows of Foreign Direct and Indirect Investment (FDI and FII), which also benefit the Rupee.
Higher inflation, particularly, if it is comparatively higher than India’s peers, is generally negative for the currency as it reflects devaluation through oversupply. Inflation also increases the cost of exports, leading to more Rupees being sold to purchase foreign imports, which is Rupee-negative. At the same time, higher inflation usually leads to the Reserve Bank of India (RBI) raising interest rates and this can be positive for the Rupee, due to increased demand from international investors. The opposite effect is true of lower inflation.
- Gold price remains on the defensive amid reduced bets for a 50 bps Fed rate cut in November.
- The USD consolidates last week’s strong gains and also contributes to capping the XAU/USD.
- Geopolitical risks might continue to act as a tailwind and limit losses for the precious metal.
Gold price (XAU/USD) extends its sideways consolidative price move on Monday and remains confined in a familiar range held over the past week or so amid mixed fundamental cues. The upbeat US monthly employment details released on Friday forced investors to price out the possibility of another oversized interest rate cut by the Federal Reserve (Fed) in November. This, in turn, keeps the US Dollar (USD) supported near a seven-week top, which, along with a generally positive risk tone, acts as a headwind for the non-yielding yellow metal.
That said, the risk of a further escalation of geopolitical tensions in the Middle East might continue to offer some support to the safe-haven Gold price and help limit deeper losses. Moreover, the recent range-bound price action points to indecision among traders over the next leg of a directional move. This further makes it prudent to wait for strong follow-through selling before confirming that the XAU/USD has topped out and positioning for any meaningful corrective decline in the absence of any relevant market-moving US macro data.
Daily Digest Market Movers: Gold price is undermined by expectations of a less dovish Fed, bullish USD
- Friday's blowout US employment details temper market expectations for a more aggressive policy easing by the Federal Reserve and continue to undermine demand for the non-yielding Gold price.
- The US Labor Department reported that the economy added 254K jobs in September, beating estimates by a big margin, and the Unemployment Rate unexpectedly dipped to 4.1% from 4.2%.
- Additional details showed that there were 72K more jobs added in July and August than previously reported, pointing to a still resilient labor market and that the economy is in a much better shape.
- According to the CME Group's FedWatch Tool, traders now see a nearly 95% chance that the Fed will lower borrowing costs by 25 basis points at the end of the November policy meeting.
- The yield on the benchmark 10-year US government bond remains close to the 4.0% threshold, while the US Dollar stands tall near a seven-week high and keeps the XAU/USD bulls on the defensive.
- The upbeat US NFP report eased concerns about an economic slowdown, which, along with the optimism over China's stimulus, remains supportive of the upbeat mood around the equity markets.
- Israel carried out intense bombardment in Gaza’s Jabalia refugee camp and launched a new round of airstrikes in Lebanon. In retaliation, Hezbollah attacked Israel's Haifa on Monday morning.
- The developments raise the risk of a full-blown war in the Middle East and might continue to benefit the commodity's safe-haven status, warranting some caution for bearish traders.
- Official data published earlier this Monday showed that China's Gold reserves remained unchanged for the fifth straight month and sat at 72.8 million fine troy ounces at the end of September.
Technical Outlook: Gold price remains confined in a one-week-old range; limited downside potential
From a technical perspective, the range-bound price action might still be categorized as a bullish consolidation phase against the backdrop of the recent strong runup to the record peak. Moreover, oscillators on the daily chart are holding comfortably in positive territory and have also eased from the overbought zone. This, in turn, suggests that the path of least resistance for the Gold price remains to the upside and supports prospects for an eventual break to the upside. That said, it will still be prudent to wait for some follow-through buying above the $2,670-$2,672 hurdle before placing fresh bullish bets. This is followed by the $2,685-2,686 zone, or the all-time high, and the $2,700 mark, which if cleared will set the stage for an extension of a well-established multi-month-old uptrend.
On the flip side, the lower end of the aforementioned trading range, around the $2,630 area, might continue to offer immediate support to the Gold price and act as a key pivotal point for short-term traders. A convincing break below might prompt some technical selling and drag the XAU/USD below the $2,600 mark, towards the next relevant support near the $2,560 zone. The corrective decline could extend further towards the next relevant support near the $2,535-2,530 region en route to the $2,500 psychological mark.
Gold FAQs
Gold has played a key role in human’s history as it has been widely used as a store of value and medium of exchange. Currently, apart from its shine and usage for jewelry, the precious metal is widely seen as a safe-haven asset, meaning that it is considered a good investment during turbulent times. Gold is also widely seen as a hedge against inflation and against depreciating currencies as it doesn’t rely on any specific issuer or government.
Central banks are the biggest Gold holders. In their aim to support their currencies in turbulent times, central banks tend to diversify their reserves and buy Gold to improve the perceived strength of the economy and the currency. High Gold reserves can be a source of trust for a country’s solvency. Central banks added 1,136 tonnes of Gold worth around $70 billion to their reserves in 2022, according to data from the World Gold Council. This is the highest yearly purchase since records began. Central banks from emerging economies such as China, India and Turkey are quickly increasing their Gold reserves.
Gold has an inverse correlation with the US Dollar and US Treasuries, which are both major reserve and safe-haven assets. When the Dollar depreciates, Gold tends to rise, enabling investors and central banks to diversify their assets in turbulent times. Gold is also inversely correlated with risk assets. A rally in the stock market tends to weaken Gold price, while sell-offs in riskier markets tend to favor the precious metal.
The price can move due to a wide range of factors. Geopolitical instability or fears of a deep recession can quickly make Gold price escalate due to its safe-haven status. As a yield-less asset, Gold tends to rise with lower interest rates, while higher cost of money usually weighs down on the yellow metal. Still, most moves depend on how the US Dollar (USD) behaves as the asset is priced in dollars (XAU/USD). A strong Dollar tends to keep the price of Gold controlled, whereas a weaker Dollar is likely to push Gold prices up.
| Raw materials | Closed | Change, % |
|---|---|---|
| Silver | 32.171 | 0.45 |
| Gold | 265.268 | -0.12 |
| Palladium | 1008.49 | 0.65 |
- GBP/USD trades with mild gains to around 1.3130 in Monday’s Asian session.
- The encouraging Nonfarm Payrolls could help limit the USD’s losses.
- The dovish stance of the BoE might undermine the US Dollar.
The GBP/USD pair posts modest gains to near 1.3130, snapping the three-day losing streak during the early Asian session on Monday. However, the upside of the major pair might be limited amid the reduced bets of the Federal Reserve interest rate cuts after the upbeat US Nonfarm Payrolls (NFP) on Friday.
The Fed lowered its cutting cycle by 50 basis points (bps) in September but stronger-than-expected reduced the odds that the larger than “normal” cut will be repeated. According to the CME Fedwatch Tool, financial markets are now pricing in nearly 97.4% chance of 50 basis points (bps) Fed rate cuts in September, up from 31.1% before the NFP data.
The NFP report showed the US economy adding 254K jobs in September versus 159K prior, better than estimations. The Average Hourly Earnings climbed to 3.8% from 3.6% during the same period. Finally, the Unemployment Rate ticks lower to 4.1% in September from 4.2% in August.
The Pound Sterling (GBP) edges higher after the Bank of England (BoE) could take a more aggressive approach to lowering interest rates. Meanwhile, the BoEChief Economist Huw Pil stated that the UK central bank should move only gradually by cutting interest rates. Financial markets are more divided about whether the BoE will follow a rate cut in November with another in December. The BoE has not cut rates at consecutive meetings since 2020.
Pound Sterling FAQs
The Pound Sterling (GBP) is the oldest currency in the world (886 AD) and the official currency of the United Kingdom. It is the fourth most traded unit for foreign exchange (FX) in the world, accounting for 12% of all transactions, averaging $630 billion a day, according to 2022 data. Its key trading pairs are GBP/USD, also known as ‘Cable’, which accounts for 11% of FX, GBP/JPY, or the ‘Dragon’ as it is known by traders (3%), and EUR/GBP (2%). The Pound Sterling is issued by the Bank of England (BoE).
The single most important factor influencing the value of the Pound Sterling is monetary policy decided by the Bank of England. The BoE bases its decisions on whether it has achieved its primary goal of “price stability” – a steady inflation rate of around 2%. Its primary tool for achieving this is the adjustment of interest rates. When inflation is too high, the BoE will try to rein it in by raising interest rates, making it more expensive for people and businesses to access credit. This is generally positive for GBP, as higher interest rates make the UK a more attractive place for global investors to park their money. When inflation falls too low it is a sign economic growth is slowing. In this scenario, the BoE will consider lowering interest rates to cheapen credit so businesses will borrow more to invest in growth-generating projects.
Data releases gauge the health of the economy and can impact the value of the Pound Sterling. Indicators such as GDP, Manufacturing and Services PMIs, and employment can all influence the direction of the GBP. A strong economy is good for Sterling. Not only does it attract more foreign investment but it may encourage the BoE to put up interest rates, which will directly strengthen GBP. Otherwise, if economic data is weak, the Pound Sterling is likely to fall.
Another significant data release for the Pound Sterling is the Trade Balance. This indicator measures the difference between what a country earns from its exports and what it spends on imports over a given period. If a country produces highly sought-after exports, its currency will benefit purely from the extra demand created from foreign buyers seeking to purchase these goods. Therefore, a positive net Trade Balance strengthens a currency and vice versa for a negative balance.
- USD/JPY retreats after touching its highest level since August 16 amid intervention fears.
- Reduced bets for more BoJ rate hikes and an oversized Fed rate cut should lend support.
- Any meaningful corrective slide could be seen as a buying opportunity and remain limited.
The USD/JPY pair struggles to capitalize on a modest Asian session uptick or find acceptance above the 149.00 mark and retreats a few pips from its highest level since August 16 touched this Monday. Spot prices slide below mid-148.00s, or a fresh daily low in the last hour and for now, seem to have snapped a three-day winning streak, though the fundamental backdrop warrants caution for bearish traders.
Japan's Finance Ministry's Vice Finance Minister for International Affairs Atsushi Mimura said that the government will monitor FX moves including speculative movement, fueling speculations about a possible intervention. This, in turn, offers some support to the Japanese Yen (JPY) and attracts some sellers around the USD/JPY pair. That said, diminishing odds for another interest rate hike by the Bank of Japan (BoJ) in 2024 and a more aggressive policy easing by the Federal Reserve (Fed) should continue to act as a tailwind for the currency pair.
New Japanese Prime Minister Shigeru Ishiba stunned markets last week and said that the economy was not ready for further rate hikes. Apart from this, political uncertainty ahead of a general election on October 27 might keep the JPY bulls on the sidelines. Meanwhile, the upbeat US monthly jobs data released on Friday forced investors to further scale back their bets for an oversized rate cut by the Fed in November. This assists the US Dollar (USD) to preserve its recent strong gains to a seven-week top and should act as a tailwind for the USD/JPY pair.
This, in turn, suggests that any subsequent slide might still be seen as a buying opportunity, making it prudent to wait for strong follow-through selling before confirming that a one-week-old uptrend has run out of steam. Moving ahead, there isn't any relevant market-moving economic data due for release on Monday. That said, speeches by influential FOMC members might influence the USD later during the North American session. Apart from this, geopolitical developments should provide short-term impetus to the USD/JPY pair.
Japanese Yen FAQs
The Japanese Yen (JPY) is one of the world’s most traded currencies. Its value is broadly determined by the performance of the Japanese economy, but more specifically by the Bank of Japan’s policy, the differential between Japanese and US bond yields, or risk sentiment among traders, among other factors.
One of the Bank of Japan’s mandates is currency control, so its moves are key for the Yen. The BoJ has directly intervened in currency markets sometimes, generally to lower the value of the Yen, although it refrains from doing it often due to political concerns of its main trading partners. The BoJ ultra-loose monetary policy between 2013 and 2024 caused the Yen to depreciate against its main currency peers due to an increasing policy divergence between the Bank of Japan and other main central banks. More recently, the gradually unwinding of this ultra-loose policy has given some support to the Yen.
Over the last decade, the BoJ’s stance of sticking to ultra-loose monetary policy has led to a widening policy divergence with other central banks, particularly with the US Federal Reserve. This supported a widening of the differential between the 10-year US and Japanese bonds, which favored the US Dollar against the Japanese Yen. The BoJ decision in 2024 to gradually abandon the ultra-loose policy, coupled with interest-rate cuts in other major central banks, is narrowing this differential.
The Japanese Yen is often seen as a safe-haven investment. This means that in times of market stress, investors are more likely to put their money in the Japanese currency due to its supposed reliability and stability. Turbulent times are likely to strengthen the Yen’s value against other currencies seen as more risky to invest in.
Israel bombed targets in Lebanon and the Gaza Strip on Sunday ahead of the one-year anniversary of the October 7 attacks that sparked its war, as Israel's defense minister declared all options were open for retaliation against arch-enemy Iran, per Reuters.
Market reaction
At the time of press, the XAU/USD pair was down 0.14% on the day at $2,650.
Risk sentiment FAQs
In the world of financial jargon the two widely used terms “risk-on” and “risk off'' refer to the level of risk that investors are willing to stomach during the period referenced. In a “risk-on” market, investors are optimistic about the future and more willing to buy risky assets. In a “risk-off” market investors start to ‘play it safe’ because they are worried about the future, and therefore buy less risky assets that are more certain of bringing a return, even if it is relatively modest.
Typically, during periods of “risk-on”, stock markets will rise, most commodities – except Gold – will also gain in value, since they benefit from a positive growth outlook. The currencies of nations that are heavy commodity exporters strengthen because of increased demand, and Cryptocurrencies rise. In a “risk-off” market, Bonds go up – especially major government Bonds – Gold shines, and safe-haven currencies such as the Japanese Yen, Swiss Franc and US Dollar all benefit.
The Australian Dollar (AUD), the Canadian Dollar (CAD), the New Zealand Dollar (NZD) and minor FX like the Ruble (RUB) and the South African Rand (ZAR), all tend to rise in markets that are “risk-on”. This is because the economies of these currencies are heavily reliant on commodity exports for growth, and commodities tend to rise in price during risk-on periods. This is because investors foresee greater demand for raw materials in the future due to heightened economic activity.
The major currencies that tend to rise during periods of “risk-off” are the US Dollar (USD), the Japanese Yen (JPY) and the Swiss Franc (CHF). The US Dollar, because it is the world’s reserve currency, and because in times of crisis investors buy US government debt, which is seen as safe because the largest economy in the world is unlikely to default. The Yen, from increased demand for Japanese government bonds, because a high proportion are held by domestic investors who are unlikely to dump them – even in a crisis. The Swiss Franc, because strict Swiss banking laws offer investors enhanced capital protection.
Atsushi Mimura, Japan’s Vice Finance Minister For International Affairs and top foreign exchange official, on Monday, warned against speculative moves on the foreign exchange (FX) market as the Yen fell below 149 per dollar, per Reuters.
"We will monitor currency market moves including speculative trading with a sense of urgency," said Mimura.
Market reaction
At the time of press, the USD/JPY pair was down 0.14% on the day at 148.51.
Bank of Japan FAQs
The Bank of Japan (BoJ) is the Japanese central bank, which sets monetary policy in the country. Its mandate is to issue banknotes and carry out currency and monetary control to ensure price stability, which means an inflation target of around 2%.
The Bank of Japan embarked in an ultra-loose monetary policy in 2013 in order to stimulate the economy and fuel inflation amid a low-inflationary environment. The bank’s policy is based on Quantitative and Qualitative Easing (QQE), or printing notes to buy assets such as government or corporate bonds to provide liquidity. In 2016, the bank doubled down on its strategy and further loosened policy by first introducing negative interest rates and then directly controlling the yield of its 10-year government bonds. In March 2024, the BoJ lifted interest rates, effectively retreating from the ultra-loose monetary policy stance.
The Bank’s massive stimulus caused the Yen to depreciate against its main currency peers. This process exacerbated in 2022 and 2023 due to an increasing policy divergence between the Bank of Japan and other main central banks, which opted to increase interest rates sharply to fight decades-high levels of inflation. The BoJ’s policy led to a widening differential with other currencies, dragging down the value of the Yen. This trend partly reversed in 2024, when the BoJ decided to abandon its ultra-loose policy stance.
A weaker Yen and the spike in global energy prices led to an increase in Japanese inflation, which exceeded the BoJ’s 2% target. The prospect of rising salaries in the country – a key element fuelling inflation – also contributed to the move.
- EUR/USD enters a bearish consolidation phase after last week’s downfall to mid-1.0900s.
- The USD preserves the post-NFP gains to a multi-week top and caps the upside for the pair.
- Bets for another ECB rate cut in October undermine the Euro and further act as a headwind.
The EUR/USD pair kicks off the new week on a subdued note and consolidates last week's heavy losses to its lowest level since mid-August touched in the aftermath of the upbeat US employment details on Friday. Spot prices currently trade around the 1.0975 region and seem vulnerable to prolong the recent sharp pullback from a 14-month top – levels just above the 1.1200 mark.
The US Dollar (USD) stands tall near a seven-week top as traders further trimmed their bets for another oversized interest rate cut by the Federal Reserve (Fed) in November on the back of surprisingly strong US jobs data. The headline NFP showed that the economy added 254K jobs in September, surpassing consensus estimates by a big margin, and the Unemployment Rate unexpectedly slipped to 4.1%. This provided evidence of a still resilient US labor market, while higher-than-expected growth in the Average Hourly Earnings revived inflation fears, smashing hopes for a more aggressive policy easing by the Fed.
In fact, the current market pricing indicates a nearly 95% chance that the Fed will lower borrowing costs by 25 basis points at the end of a two-day policy meeting on November 7. Adding to this, persistent geopolitical risks stemming from the ongoing conflicts in the Middle East assisted the USD Index (DXY), which tracks the Greenback against a basket of currencies, to register its bets week since September 2022. The shared currency, on the other hand, continues to be undermined by bets that the European Central Bank (ECB) will cut rates again in October on the back of easing inflationary pressures and economic slowdown.
The expectations were reaffirmed by comments from ECB Governing Council member Francois Villeroy de Galhau, saying that the central bank will cut rates in October as weak economic growth raises the risk that inflation will undershoot the 2% target. This, in turn, is seen as another factor acting as a headwind for the EUR/USD pair and supports prospects for a further near-term depreciating move. Hence, any attempted recovery might still be seen as a selling opportunity and runs the risk of fizzling out rather quickly.
Fed FAQs
Monetary policy in the US is shaped by the Federal Reserve (Fed). The Fed has two mandates: to achieve price stability and foster full employment. Its primary tool to achieve these goals is by adjusting interest rates. When prices are rising too quickly and inflation is above the Fed’s 2% target, it raises interest rates, increasing borrowing costs throughout the economy. This results in a stronger US Dollar (USD) as it makes the US a more attractive place for international investors to park their money. When inflation falls below 2% or the Unemployment Rate is too high, the Fed may lower interest rates to encourage borrowing, which weighs on the Greenback.
The Federal Reserve (Fed) holds eight policy meetings a year, where the Federal Open Market Committee (FOMC) assesses economic conditions and makes monetary policy decisions. The FOMC is attended by twelve Fed officials – the seven members of the Board of Governors, the president of the Federal Reserve Bank of New York, and four of the remaining eleven regional Reserve Bank presidents, who serve one-year terms on a rotating basis.
In extreme situations, the Federal Reserve may resort to a policy named Quantitative Easing (QE). QE is the process by which the Fed substantially increases the flow of credit in a stuck financial system. It is a non-standard policy measure used during crises or when inflation is extremely low. It was the Fed’s weapon of choice during the Great Financial Crisis in 2008. It involves the Fed printing more Dollars and using them to buy high grade bonds from financial institutions. QE usually weakens the US Dollar.
Quantitative tightening (QT) is the reverse process of QE, whereby the Federal Reserve stops buying bonds from financial institutions and does not reinvest the principal from the bonds it holds maturing, to purchase new bonds. It is usually positive for the value of the US Dollar.
| Index | Change, points | Closed | Change, % |
|---|---|---|---|
| NIKKEI 225 | 83.56 | 38635.62 | 0.22 |
| Hang Seng | 623.36 | 22736.87 | 2.82 |
| KOSPI | 8.02 | 2569.71 | 0.31 |
| ASX 200 | -55.2 | 8150 | -0.67 |
| DAX | 105.52 | 19120.93 | 0.55 |
| CAC 40 | 63.58 | 7541.36 | 0.85 |
| Dow Jones | 341.16 | 42352.75 | 0.81 |
| S&P 500 | 51.13 | 5751.07 | 0.9 |
| NASDAQ Composite | 219.37 | 18137.85 | 1.22 |
European Central Bank (ECB) Governing Council policymaker and French central bank governor François Villeroy de Galhau said on Sunday that the central bank might cut the interest rate in the October meeting as economic growth is weak.
Key quotes
ECB will probably cut interest rates on October 17.
Economic growth is weak, bringing the risk that inflation will undershoot its 2% target.
In the last two years, our main risk was to overshoot our 2% target, now we must also pay attention to the opposite risk, of undershooting our objective due to weak growth and a restrictive monetary policy for too long.
ECB should be back at the "neutral" rate sometime in 2025.
If we are next year sustainably at 2% inflation, and with still a sluggish growth outlook in Europe, there won’t be any reason for our monetary policy to remain restrictive, and our rates to be above the neutral rate of interest.
Market reaction
At the time of press, the EUR/USD pair was up 0.02% on the day at 1.0972.
Euro FAQs
The Euro is the currency for the 19 European Union countries that belong to the Eurozone. It is the second most heavily traded currency in the world behind the US Dollar. In 2022, it accounted for 31% of all foreign exchange transactions, with an average daily turnover of over $2.2 trillion a day. EUR/USD is the most heavily traded currency pair in the world, accounting for an estimated 30% off all transactions, followed by EUR/JPY (4%), EUR/GBP (3%) and EUR/AUD (2%).
The European Central Bank (ECB) in Frankfurt, Germany, is the reserve bank for the Eurozone. The ECB sets interest rates and manages monetary policy. The ECB’s primary mandate is to maintain price stability, which means either controlling inflation or stimulating growth. Its primary tool is the raising or lowering of interest rates. Relatively high interest rates – or the expectation of higher rates – will usually benefit the Euro and vice versa. The ECB Governing Council makes monetary policy decisions at meetings held eight times a year. Decisions are made by heads of the Eurozone national banks and six permanent members, including the President of the ECB, Christine Lagarde.
Eurozone inflation data, measured by the Harmonized Index of Consumer Prices (HICP), is an important econometric for the Euro. If inflation rises more than expected, especially if above the ECB’s 2% target, it obliges the ECB to raise interest rates to bring it back under control. Relatively high interest rates compared to its counterparts will usually benefit the Euro, as it makes the region more attractive as a place for global investors to park their money.
Data releases gauge the health of the economy and can impact on the Euro. Indicators such as GDP, Manufacturing and Services PMIs, employment, and consumer sentiment surveys can all influence the direction of the single currency. A strong economy is good for the Euro. Not only does it attract more foreign investment but it may encourage the ECB to put up interest rates, which will directly strengthen the Euro. Otherwise, if economic data is weak, the Euro is likely to fall. Economic data for the four largest economies in the euro area (Germany, France, Italy and Spain) are especially significant, as they account for 75% of the Eurozone’s economy.
Another significant data release for the Euro is the Trade Balance. This indicator measures the difference between what a country earns from its exports and what it spends on imports over a given period. If a country produces highly sought after exports then its currency will gain in value purely from the extra demand created from foreign buyers seeking to purchase these goods. Therefore, a positive net Trade Balance strengthens a currency and vice versa for a negative balance.
| Pare | Closed | Change, % |
|---|---|---|
| AUDUSD | 0.67946 | -0.69 |
| EURJPY | 163.136 | 0.68 |
| EURUSD | 1.09749 | -0.52 |
| GBPJPY | 195.033 | 1.18 |
| GBPUSD | 1.31204 | -0.03 |
| NZDUSD | 0.61585 | -0.89 |
| USDCAD | 1.35765 | 0.17 |
| USDCHF | 0.85799 | 0.65 |
| USDJPY | 148.641 | 1.21 |
- Gold price attracts some sellers to $2,650 in Monday’s early Asian session.
- US Nonfarm Payrolls rose by 254,000 in September vs. 159,000 prior, as expected.
- Rising Middle East geopolitical tensions could boost the safe-haven flows, benefiting the Gold.
Gold price (XAU/USD) trades in negative territory for the fourth consecutive day near $2,650 on Monday during the early Asian session. The further upside in the US Dollar (USD) after the upbeat US Nonfarm Payrolls (NFP) on Friday exerts some selling pressure on the yellow metal.
Nonfarm Payrolls (NFP) in the United States climbed by 254,000 in September, according to the Bureau of Labor Statistics on Friday. The figure topped was above August's revised 159,000 and above the market consensus of 140,000. The Unemployment Rate ticks lower to 4.1% in September, down from 2.4% in August. These encouraging US reports dampen the hopes that the US Federal Reserve (Fed) will cut the deeper interest rate, which lifts the Greenback and weighs on the USD-denominated Gold price.
Chicago Federal Reserve Bank President Austan Goolsbee said on Friday that he thinks the recent employment data was "superb" and noted that additional reports like this would increase his confidence that the US economy has reached full employment with low inflation.
On the other hand, the escalating geopolitical tensions in the Middle East might boost the price of gold, a traditional safe-haven asset. Israel struck Hezbollah targets in Lebanon and the Gaza Strip on Sunday ahead of the one-year anniversary of the October 7 attacks that launched the conflict. Israel's defense minister proclaimed all possibilities for reprisal against Iran.
Gold FAQs
Gold has played a key role in human’s history as it has been widely used as a store of value and medium of exchange. Currently, apart from its shine and usage for jewelry, the precious metal is widely seen as a safe-haven asset, meaning that it is considered a good investment during turbulent times. Gold is also widely seen as a hedge against inflation and against depreciating currencies as it doesn’t rely on any specific issuer or government.
Central banks are the biggest Gold holders. In their aim to support their currencies in turbulent times, central banks tend to diversify their reserves and buy Gold to improve the perceived strength of the economy and the currency. High Gold reserves can be a source of trust for a country’s solvency. Central banks added 1,136 tonnes of Gold worth around $70 billion to their reserves in 2022, according to data from the World Gold Council. This is the highest yearly purchase since records began. Central banks from emerging economies such as China, India and Turkey are quickly increasing their Gold reserves.
Gold has an inverse correlation with the US Dollar and US Treasuries, which are both major reserve and safe-haven assets. When the Dollar depreciates, Gold tends to rise, enabling investors and central banks to diversify their assets in turbulent times. Gold is also inversely correlated with risk assets. A rally in the stock market tends to weaken Gold price, while sell-offs in riskier markets tend to favor the precious metal.
The price can move due to a wide range of factors. Geopolitical instability or fears of a deep recession can quickly make Gold price escalate due to its safe-haven status. As a yield-less asset, Gold tends to rise with lower interest rates, while higher cost of money usually weighs down on the yellow metal. Still, most moves depend on how the US Dollar (USD) behaves as the asset is priced in dollars (XAU/USD). A strong Dollar tends to keep the price of Gold controlled, whereas a weaker Dollar is likely to push Gold prices up.


© 2000-2026. Sva prava zaštićena.
Sajt je vlasništvo kompanije Teletrade D.J. LLC 2351 LLC 2022 (Euro House, Richmond Hill Road, Kingstown, VC0100, St. Vincent and the Grenadines).
Svi podaci koji se nalaze na sajtu ne predstavljaju osnovu za donošenje investicionih odluka, već su informativnog karaktera.
The company does not serve or provide services to customers who are residents of the US, Canada, Iran, The Democratic People's Republic of Korea, Yemen and FATF blacklisted countries.
Izvršenje trgovinskih operacija sa finansijskim instrumentima upotrebom marginalne trgovine pruža velike mogućnosti i omogućava investitorima ostvarivanje visokih prihoda. Međutim, takav vid trgovine povezan je sa potencijalno visokim nivoom rizika od gubitka sredstava. Проведение торговых операций на финанcовых рынках c маржинальными финанcовыми инcтрументами открывает широкие возможноcти, и позволяет инвеcторам, готовым пойти на риcк, получать выcокую прибыль, но при этом неcет в cебе потенциально выcокий уровень риcка получения убытков. Iz tog razloga je pre započinjanja trgovine potrebno odlučiti o izboru odgovarajuće investicione strategije, uzimajući u obzir raspoložive resurse.
Upotreba informacija: U slučaju potpunog ili delimičnog preuzimanja i daljeg korišćenja materijala koji se nalazi na sajtu, potrebno je navesti link odgovarajuće stranice na sajtu kompanije TeleTrade-a kao izvora informacija. Upotreba materijala na internetu mora biti praćena hiper linkom do web stranice teletrade.org. Automatski uvoz materijala i informacija sa stranice je zabranjen.
Ako imate bilo kakvih pitanja, obratite nam se pr@teletrade.global.
транcфери