- Analiza
- Novosti i instrumenti
- Vesti sa tržišta
Forex-novosti i prognoze od 07-06-2024
- Kiwi's grip loosens against the Yen on Friday, moving towards the 20-day SMA.
- The cross cruises through a consolidation phase while the stance of the bear is strengthening.
- Defense around the 20-day SMA starts showing signs of weakness, hinting at potential declines.
On Friday, the NZD/JPY pair faced selling pressure, with the cross declining towards the 20-day Simple Moving Average (SMA) at 95.70. It appears that the consolidation phase might have tightened its grip around the pair, restricting the buyers' ability to keep the cross afloat.
The Relative Strength Index (RSI) for NZD/JPY on the daily chart currently stands at 53, reflecting a decrease from the previous session's RSI value of 62. The RSI's movement towards the neutral zone, away from the oversold or overbought regions, hints at a moderation in buying pressure. Meanwhile, the Moving Average Convergence Divergence (MACD) has started to print rising red bars, indicating a growing selling momentum and reinforcing the possibility of extended consolidation or even possible declines.
NZD/JPY daily chart
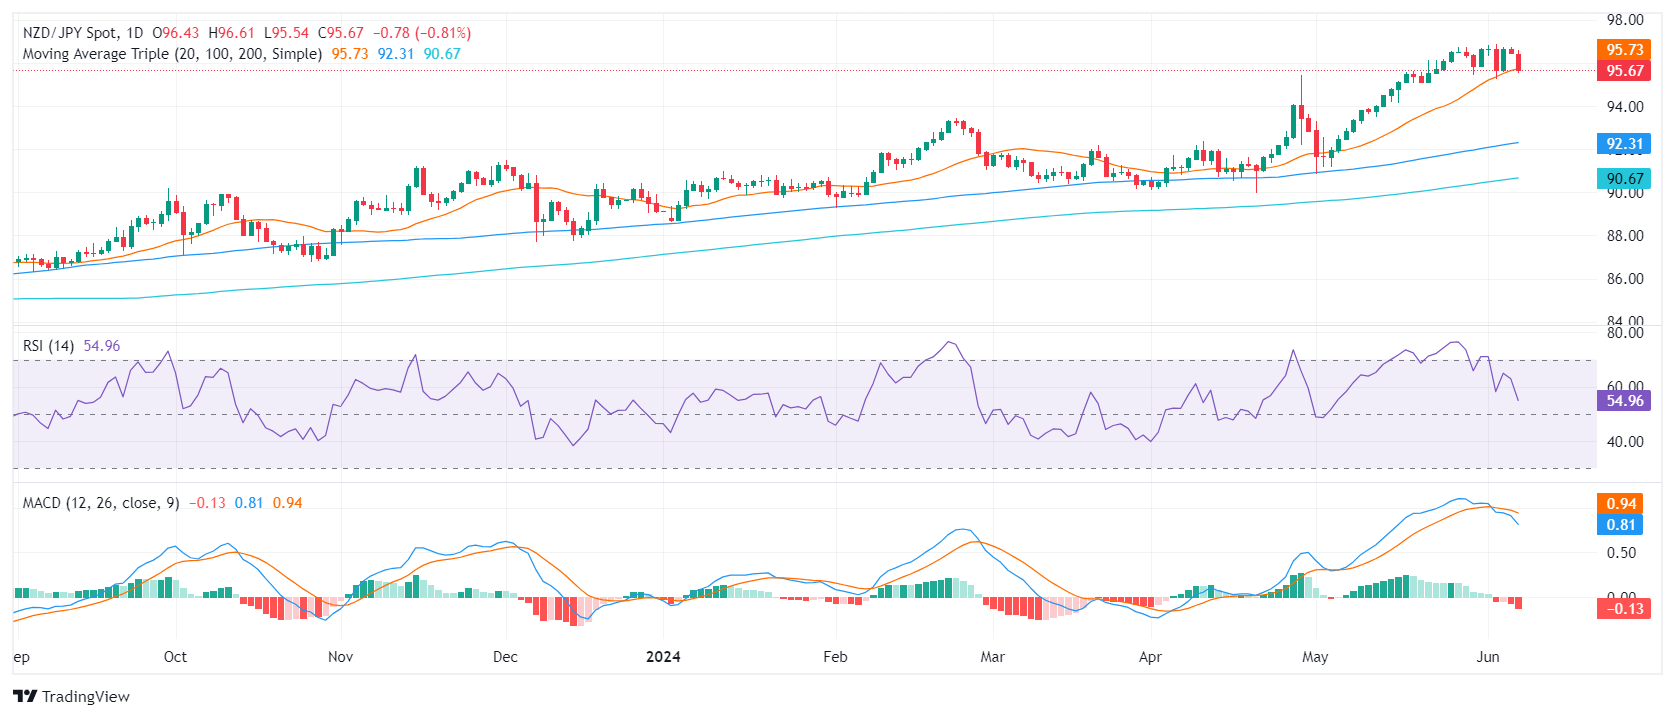
The cross's decline towards 20-day SMA coupled with strengthening selling pressure could potentially disrupt buyers' defense of the mentioned support. Despite the recent jump from around 91.00 to 96.00 since early May, it seems that consolidation has started to reign, marking a pause in the uptrend as gains are consolidated.
- Daily chart indicators reveal a neutral period for the pair; RSI stands at 49, showcasing no strong directional bias.
- Signs of a bearish takeover are emerging, suggesting possible short-term bearish pressure or further consolidation.
- The pair now interacts with the important 20-day SMA at 103.90, which currently serves as resistance to recover.
During the last trading sessions of this week, the AUD/JPY pair is maneuvering around the 103.00 level. This is indicative of an ongoing consolidation period following the impressive rally since early May.
Shifting the attention to the daily Relative Strength Index (RSI) analysis, the index is sitting at 49. When compared to the previous readings, a clear decline suggests that the pair has entered a bearish momentum in the short term. Moreover, the Moving Average Convergence Divergence (MACD) has started printing flat red bars, signaling that the market is experiencing steady selling activity.
AUD/JPY daily chart
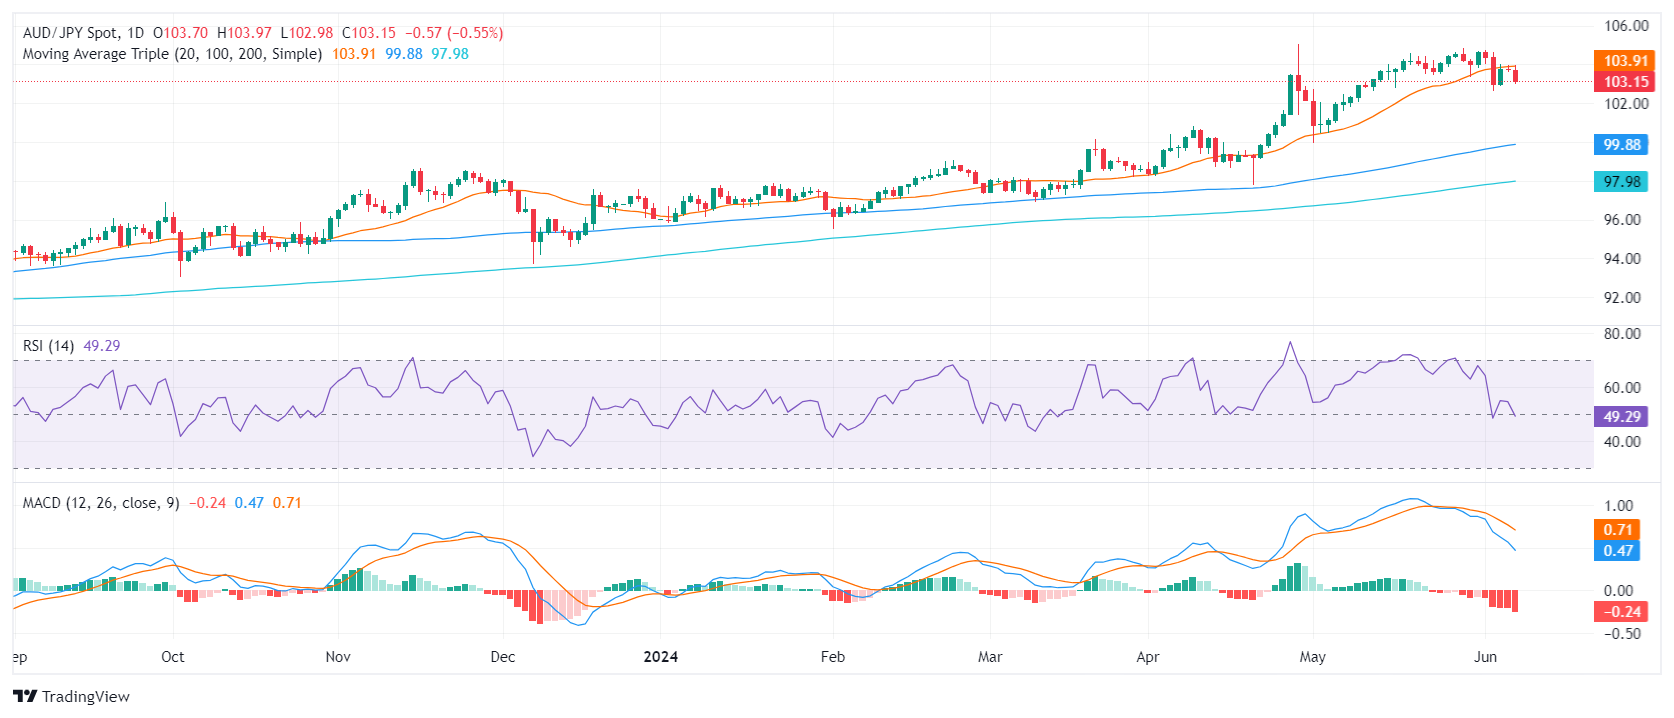
Should the pair suffer further losses, the 100 and 200-day SMAs are readily available as buffering units. These averages are situated at about 99.80 and 97.98, respectively. Conversely, any attempt by the bulls to push the pair above the aforementioned 20-day SMA and further to the 105.00 level will be met with resistance. If these resistance barriers remain unbroken, the AUD/JPY pair might extend its consolidation phase.
- EUR/USD tumbled into 1.0800 once again, trimming the week’s earlier gains.
- US NFP figures came in much higher than expected.
- ECB rate cut unlikely to be chased by a follow-up rate trim.
EUR/USD tumbled sharply on Friday, receding after US Nonfarm Payrolls climbed well above forecasts and European Central Bank (ECB) President Lagarde warned that a follow-up rate cut to June’s quarter-point rate trim may not be on the cards as many investors hope.
US Nonfarm Payrolls added 272K net new jobs in May, well above the 185K forecast while th previous month saw only a slight downside revision to 165K from the initial print of 175K. US Average Hourly Earnings also outpaced expectations as wages grew at a firmer pace than investors had anticipated, growing at a MoM rate of 0.4% versus the forecast uptick to 0.3% from 0.2%.
The US Unemployment Rate ticked higher to 4.0%, but a still-tight US labor market and rising wages threw a large wrench into broad-market rate cut hopes to wrap up the trading week. According to the CME’s FedWatch Tool, rate traders are pricing in 51% odds of no rate cut at all in September, down steeply from 70% odds of at least a quarter-point trim on September 8 that was priced in prior to Friday’s NFP print.
ECB's Lagarde: Still a long way to go on defeating inflation
Despite the ECB delivering a much-sought after rate cut this week, ECB President Christine Lagarde tamped down expectations for a follow-up rate cut in July, noting that progress on inflation has been a choppy affair, and the ECB will need to see firmer progress on disinflation before committing to further rate cuts. A hawkish, or rather, not-dovish showing from the head of the ECB hobbled Euro bulls hoping for a late-session rebound to wrap up the trading week.
Economic Indicator
Nonfarm Payrolls
The Nonfarm Payrolls release presents the number of new jobs created in the US during the previous month in all non-agricultural businesses; it is released by the US Bureau of Labor Statistics (BLS). The monthly changes in payrolls can be extremely volatile. The number is also subject to strong reviews, which can also trigger volatility in the Forex board. Generally speaking, a high reading is seen as bullish for the US Dollar (USD), while a low reading is seen as bearish, although previous months' reviews and the Unemployment Rate are as relevant as the headline figure. The market's reaction, therefore, depends on how the market assesses all the data contained in the BLS report as a whole.
Read more.Last release: Fri Jun 07, 2024 12:30
Frequency: Monthly
Actual: 272K
Consensus: 185K
Previous: 175K
Source: US Bureau of Labor Statistics
America’s monthly jobs report is considered the most important economic indicator for forex traders. Released on the first Friday following the reported month, the change in the number of positions is closely correlated with the overall performance of the economy and is monitored by policymakers. Full employment is one of the Federal Reserve’s mandates and it considers developments in the labor market when setting its policies, thus impacting currencies. Despite several leading indicators shaping estimates, Nonfarm Payrolls tend to surprise markets and trigger substantial volatility. Actual figures beating the consensus tend to be USD bullish.
EUR/USD technical outlook
Friday’s steep tumble has forced the Fiber back into familiar technical congestion, knocking the pair down nearly a full percent peak-to-trough on the day. The pair has fallen from 1.0900 to the 1.0800 handle, with the pair backsliding into the 200-day Exponential Moving Average (EMA).
Bidders will be looking for a technical rebound off of key technical levels next week, but a near-term collapse into a declining trendline setup might see bids slip further towards 1.0750 before buyers can hit the brakes and take another run at the topside.
EUR/USD hourly chart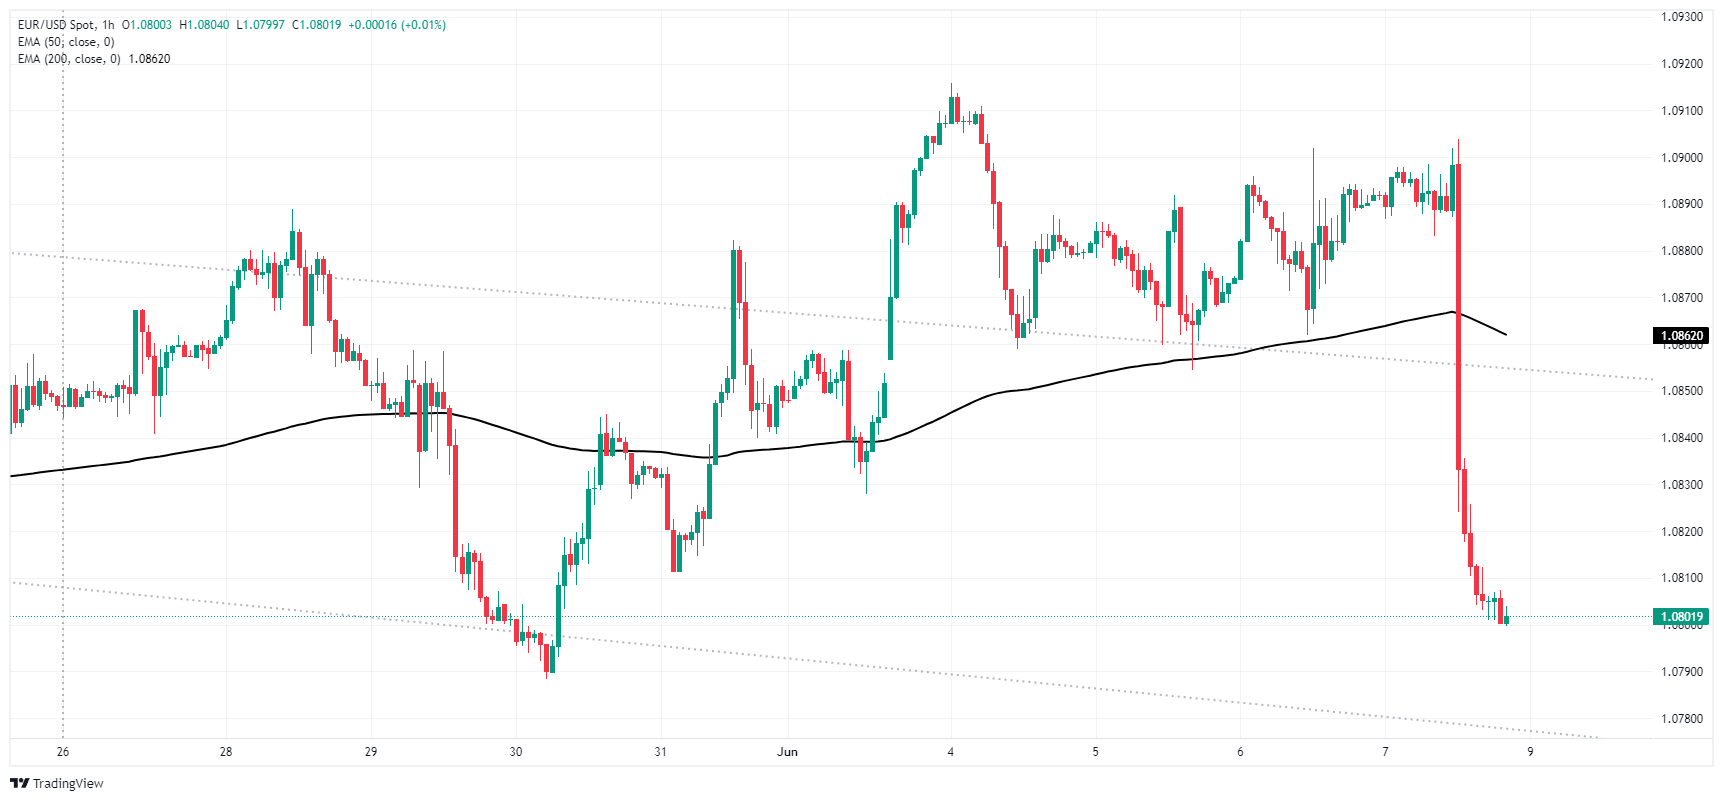
EUR/USD daily chart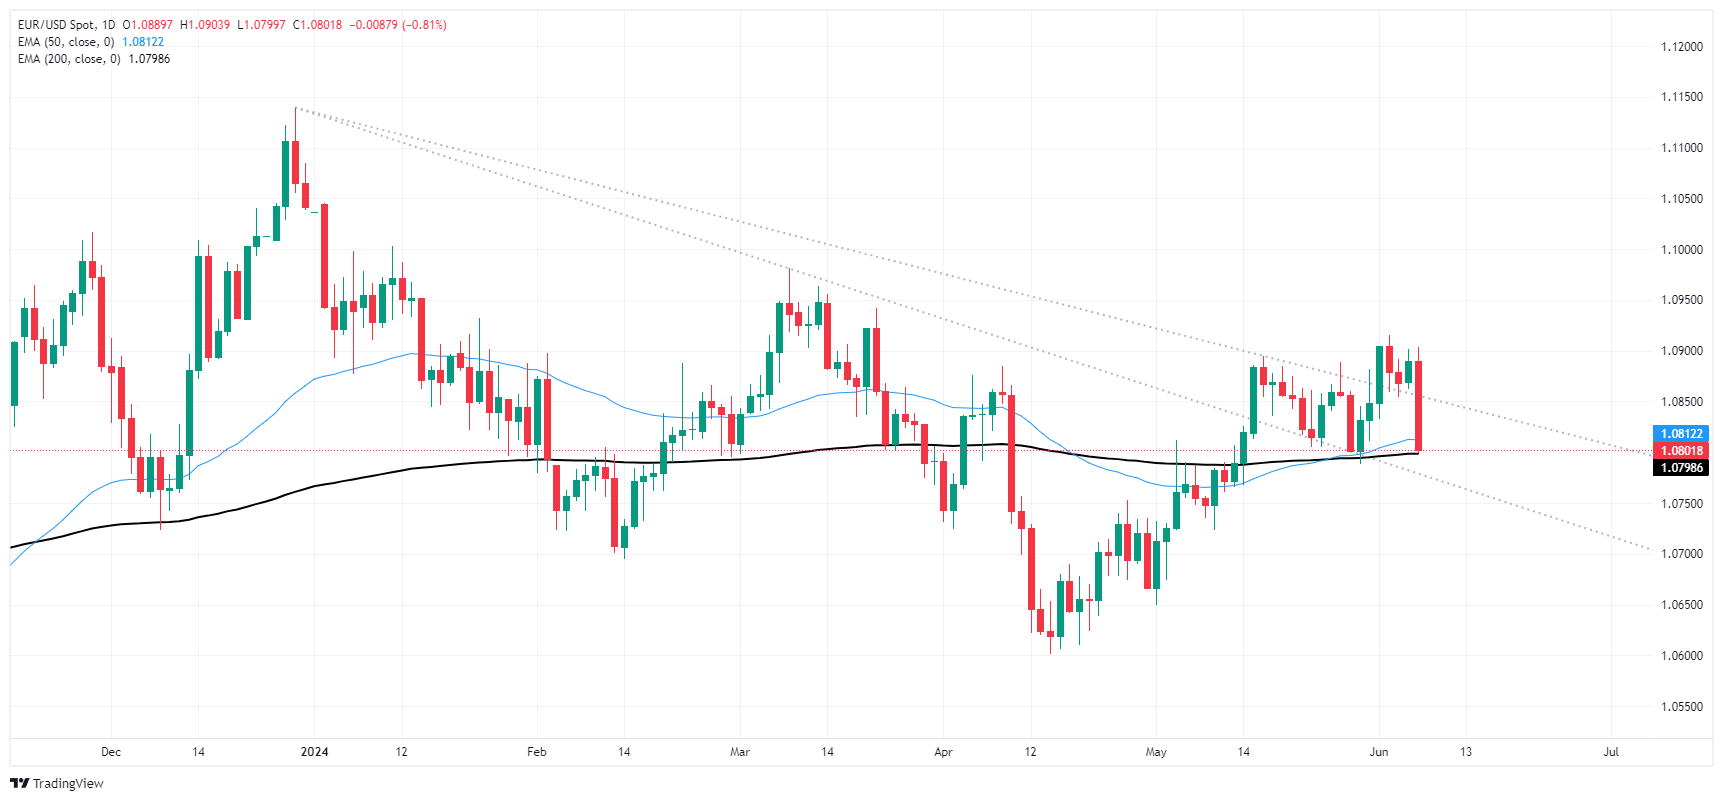
- The daily RSI records a balanced reading at 50, while the MACD bears a bearish crossover.
- The pair stabilize near the 20-day SMA, with buyers trying to avoid losses beneath it.
- The underlying bullish trend remains intact, guarded by the 100- and 200-day SMAs.
In Friday's session, the EUR/JPY pair is seen consolidating after a significant upward wave which took it near multi-year highs around 171.00, oscillating around the crucial 169.00 level. The stabilization at this junction is particularly corroborated by the proximity to the 20-day Simple Moving Average (SMA) near 169.60 which despite falling beneath, the cross will try to defend it as it serves as a strong support.
The Relative Strength Index (RSI) on the daily chart reads a steady 53 now, reflecting balanced market sentiment between the buyers and the sellers. This neutral RSI implies that the market participants are currently eagle-eyeing further direction before making a move. The daily Moving Average Convergence Divergence (MACD) has recently registered a bearish crossover- an occurrence when the MACD line dived under the signal line. This crossover potentially signals ensuing short-term bearish pressure, opening up possibilities of a tempo correction or further consolidation before resuming the upward march.
EUR/JPY daily chart
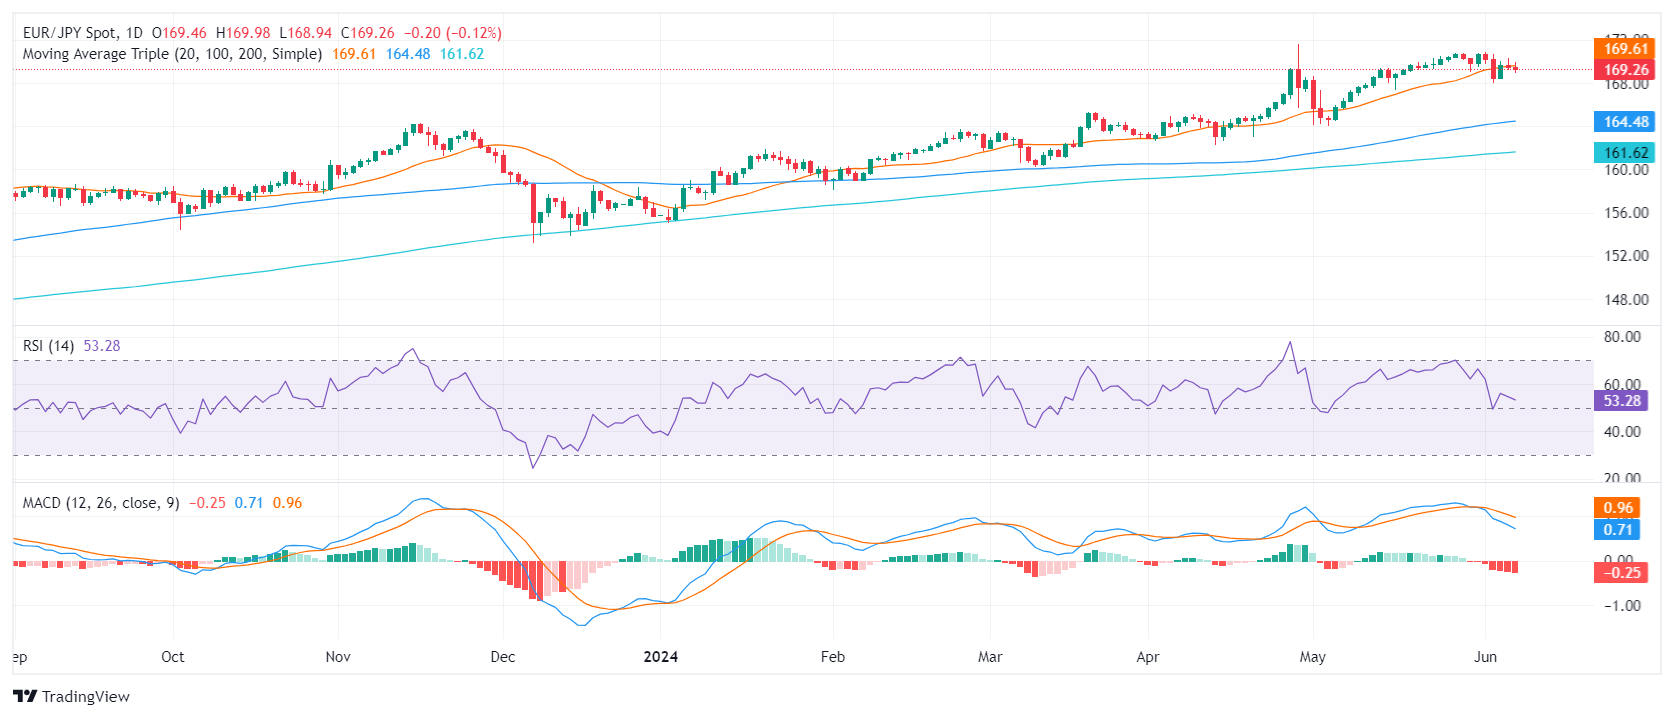
However, the broader bullish trend in the EUR/JPY remains unaffected. The support formed by the 100- and 200-day Simple Moving Averages (SMAs) at around 164.00 and 161.00, respectively, form a major bastion against long-drawn bearish movements. Therefore, while recent sessions brought some hope to bear, these movements should be treated as corrective rather than any structural changes in the trend.
European Central Bank President Christine Lagarde noted on Friday that despite recent progress, the ECB still has plenty of work ahead of it. According to the head of the ECB, President Lagarde noted that follow-up rate cuts to this week's reference rate trim may not be forthcoming as soon as investors had hoped.
Key highlights
The path to 2% won't be entirely smooth ride.
There's still a long way to go until inflation is defeated.
We've made major progress, but the inflation fight is not over.
The ECB still needs to have a foot on the brake for a while.
The ECB still needs vigilance, commitment, perseverance.
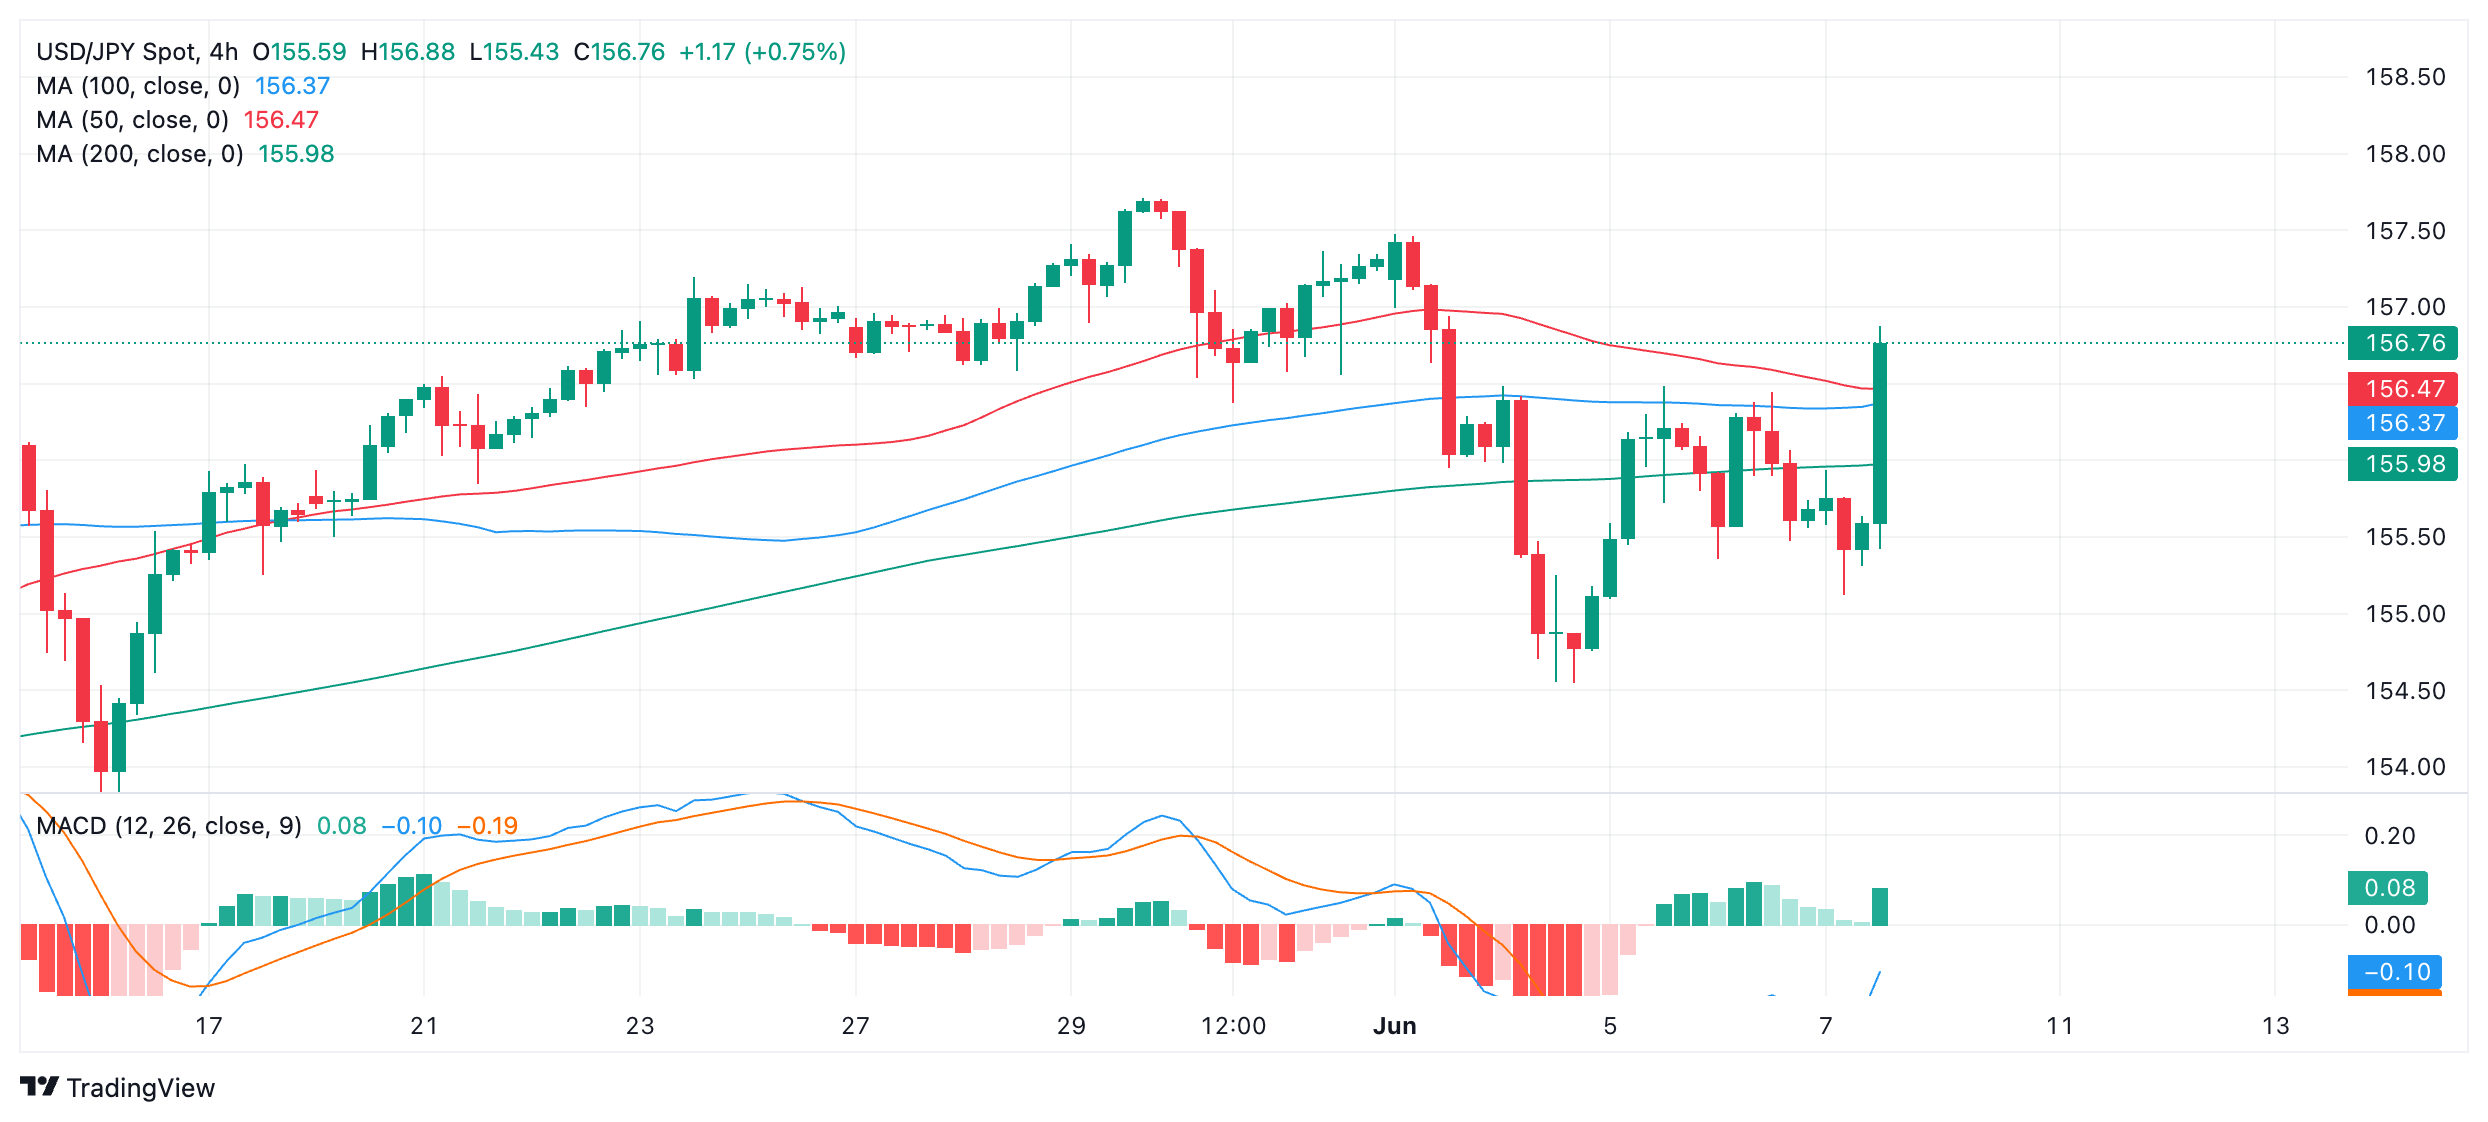
- USD/JPY climbs above 156.50 as buyers push prices above Ichimoku Cloud.
- Resistance at June 4 high (156.48), 157.00, April 26 high (158.44), and YTD high (160.32).
- Supports at Senkou Span A and B (155.52/45), 50-DMA (154.98), and Ichimoku Cloud base (153.40/50).
The USD/JPY registered modest gains of 0.66% on Friday after a stronger-than-expected US employment report, which decreased the chances that the US Federal Reserve could ease policy during the year. Therefore, the pair trades at 156.64 after bouncing off lows of 155.12.
USD/JPY Price Analysis: Technical outlook
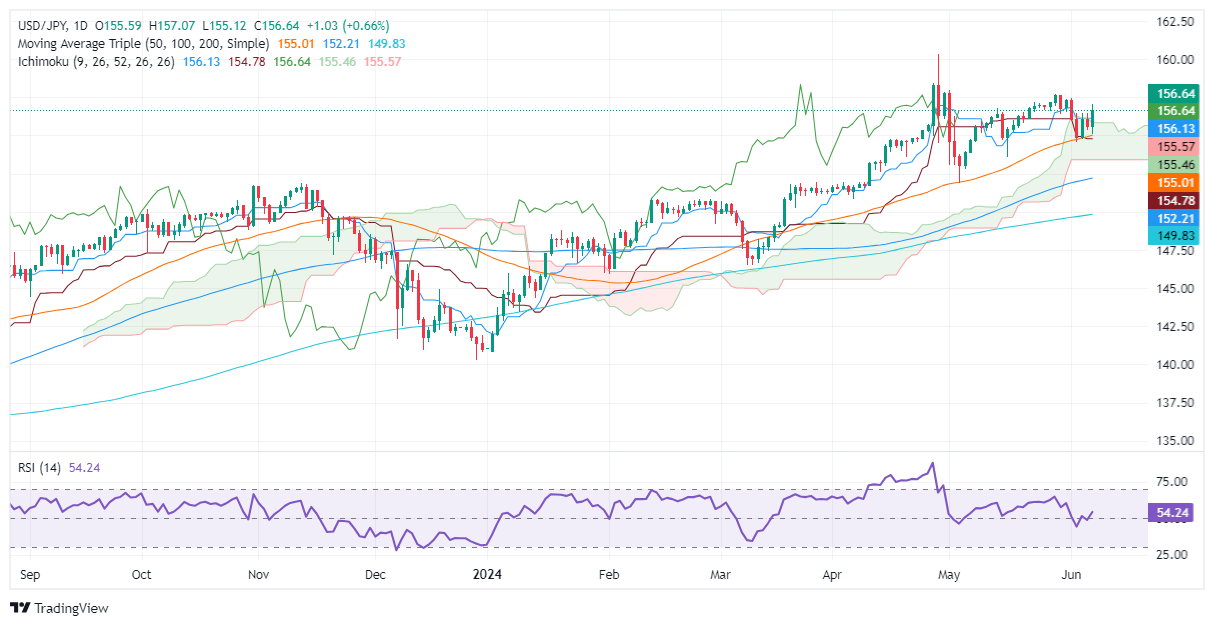
From a daily chart perspective, the USD/JPY continues to remain consolidated, slightly tilted to the upside. The pair climbed above the Ichimoku Cloud (Kumo), an indication of buyers' strength.
Momentum turned bullish, yet the pair could see an increase in volatility due to threats of intervention by Japanese authorities.
Once the USD/JPY cleared the June 4 high of 156.48, that could sponsor a leg-up toward 157.00. On further strength, the next supply zone would be the April 26 high of 158.44, followed by the year-to-date (YTD) high of 160.32.
Conversely, if USD/JPY tumbles below 156.00, the first support would be the confluence of the Senkou Span A and B at around 155.52/45, before testing the 50-day moving average (DMA) at 154.98. A breach of the latter will expose the bottom of the Ichimoku Cloud (Kumo) at around 153.40/50.
USD/JPY Price Action – Daily Chart
Japanese Yen PRICE Today
The table below shows the percentage change of Japanese Yen (JPY) against listed major currencies today. Japanese Yen was the strongest against the New Zealand Dollar.
| USD | EUR | GBP | JPY | CAD | AUD | NZD | CHF | |
|---|---|---|---|---|---|---|---|---|
| USD | 0.82% | 0.53% | 0.67% | 0.62% | 1.27% | 1.47% | 0.81% | |
| EUR | -0.82% | -0.27% | -0.14% | -0.19% | 0.46% | 0.72% | 0.01% | |
| GBP | -0.53% | 0.27% | 0.14% | 0.08% | 0.74% | 0.99% | 0.27% | |
| JPY | -0.67% | 0.14% | -0.14% | -0.05% | 0.59% | 0.81% | 0.15% | |
| CAD | -0.62% | 0.19% | -0.08% | 0.05% | 0.65% | 0.92% | 0.19% | |
| AUD | -1.27% | -0.46% | -0.74% | -0.59% | -0.65% | 0.25% | -0.48% | |
| NZD | -1.47% | -0.72% | -0.99% | -0.81% | -0.92% | -0.25% | -0.71% | |
| CHF | -0.81% | -0.01% | -0.27% | -0.15% | -0.19% | 0.48% | 0.71% |
The heat map shows percentage changes of major currencies against each other. The base currency is picked from the left column, while the quote currency is picked from the top row. For example, if you pick the Japanese Yen from the left column and move along the horizontal line to the US Dollar, the percentage change displayed in the box will represent JPY (base)/USD (quote).
- Gold falls to multi-week low after US labor market data exceeds expectations.
- China’s People’s Bank halts 18-month Gold buying spree, exerts downward pressure on XAU/USD.
- US Treasury yields surge with the 10-year yield up to 4.43%, bolstering the Greenback and pushing Gold’s price lower.
- Traders eye US inflation data and Fed policy meeting next week.
Gold prices plummeted to a four-week low after the US Bureau of Labor Statistics (BLS) revealed that the labor market remained strong, and China halted its purchase of the golden metal. Therefore, with the XAU/USD trading at $2,295, the non-yielding metal dropped by more than 3%.
The latest US Nonfarm Payrolls report for May revealed the labor market added more people to the workforce, smashing estimates. Despite that, the same report revealed an uptick in the Unemployment Rate, while Average Hourly Earnings witnessed a slight increase.
After the data release, XAU/USD extended its fall, which began during Friday’s Asian session. News that the People’s Bank of China paused its 18-month bullion buying spree weighed on the precious metal.
“Holdings of the precious metal by the PBOC held steady at 72.80 million troy ounces for May,” according to MarketWatch.
So far, Gold has traveled from $2,387 to $2,304 and is about to fall beneath the $2,300 mark. In the meantime, US Treasury bond yields are skyrocketing, with the 10-year bond yield climbing 14 basis points to 4.43%, underpinning the Greenback.
The DXY, an index of the US Dollar against six other currencies, increased 0.79% to 104.91.
Market participants turn to next week's US inflation data and the Federal Reserve’s (Fed) monetary policy meeting. The US Consumer Price Index (CPI) is expected to remain steady, but a reacceleration could trigger further losses for the golden metal.
Daily digest market movers: Gold price on the defensive after strong US jobs report
- US Bureau of Labor Statistics reported that May's Nonfarm Payrolls increased by 272,000, surpassing the forecast of 185,000 and April’s figure of 165,000.
- The Unemployment Rate jumped from 3.9% to 4%, while Average Hourly Earnings increased by 4.1% YoY, up from the previous 4%.
- A stronger-than-expected US NFP report sparked speculation that the Fed will keep rates higher for longer.
- After the data release, the December 2024 CBOT fed funds rate futures contract expects 27 basis points (bps) of easing, 12 bps less than on Thursday.
- Odds for a Fed rate cut in September were lowered from 55% to 47%.
Technical analysis: Gold price collapses below $2,300
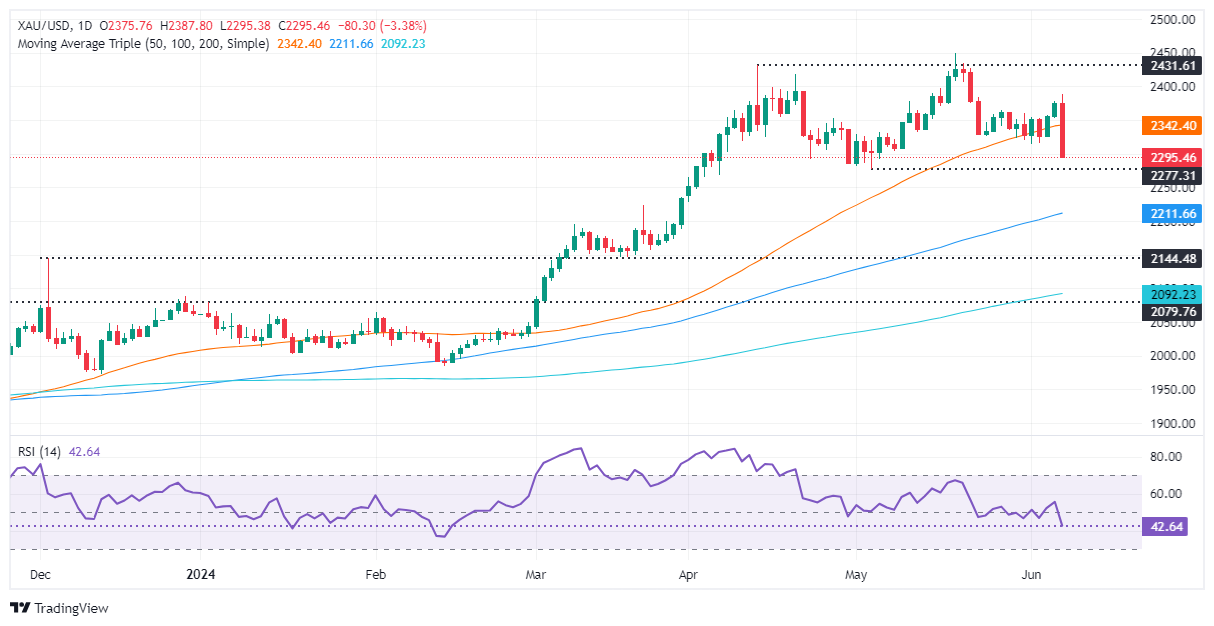
Gold prices retreat sharply and appear to form a Head-and-Shoulders chart pattern, which could lower the price of the yellow metal. Momentum has shifted bearish due to the Relative Strength Index (RSI) piercing below the 50-midline, indicating that sellers are in charge.
Therefore, further Gold weakness and sellers could push the spot price below $2,300. Once cleared, the next stop would be the May 3 low of $2,277, followed by the March 21 high of $2,222. Further losses lie beneath, with buyers’ next line of defense at around the $2,200 figure.
Conversely, if Gold buyers lift prices above $2,350, look for a consolidation in the $2,350-$2,380 area.
Gold FAQs
Gold has played a key role in human’s history as it has been widely used as a store of value and medium of exchange. Currently, apart from its shine and usage for jewelry, the precious metal is widely seen as a safe-haven asset, meaning that it is considered a good investment during turbulent times. Gold is also widely seen as a hedge against inflation and against depreciating currencies as it doesn’t rely on any specific issuer or government.
Central banks are the biggest Gold holders. In their aim to support their currencies in turbulent times, central banks tend to diversify their reserves and buy Gold to improve the perceived strength of the economy and the currency. High Gold reserves can be a source of trust for a country’s solvency. Central banks added 1,136 tonnes of Gold worth around $70 billion to their reserves in 2022, according to data from the World Gold Council. This is the highest yearly purchase since records began. Central banks from emerging economies such as China, India and Turkey are quickly increasing their Gold reserves.
Gold has an inverse correlation with the US Dollar and US Treasuries, which are both major reserve and safe-haven assets. When the Dollar depreciates, Gold tends to rise, enabling investors and central banks to diversify their assets in turbulent times. Gold is also inversely correlated with risk assets. A rally in the stock market tends to weaken Gold price, while sell-offs in riskier markets tend to favor the precious metal.
The price can move due to a wide range of factors. Geopolitical instability or fears of a deep recession can quickly make Gold price escalate due to its safe-haven status. As a yield-less asset, Gold tends to rise with lower interest rates, while higher cost of money usually weighs down on the yellow metal. Still, most moves depend on how the US Dollar (USD) behaves as the asset is priced in dollars (XAU/USD). A strong Dollar tends to keep the price of Gold controlled, whereas a weaker Dollar is likely to push Gold prices up.
- In Friday's session, the USD/CHF recovered surging above the 0.8965 mark.
- Strong Nonfarm Payroll data from the US propelled the USD across the board.
- US Treasury yields increased while the odds of a cut in September by the Fed slightly declined.
The USD/CHF pair is seeing a boost after updated Nonfarm Payroll (NFP) figures from the US were released on Friday, surpassing market expectations. As market bets on the Federal Reserve may turn more hawkish, the divergences with the Swiss National Bank (SNB) might favor the USD.
The newly reported NFP for May expanded to 272K up from 165K (April's revised reading), blowing market estimations of 185K. Strong data such as this has led to a decrease in the odds of a Fed rate cut happening in September. The Unemployment Rate in the US also rose to 4% from the previous 3.9%, with a small decline in the Labor Force Participation Rate, ticking down to 62.5% from the former 62.7%. Concurrently, the Average Hourly Earnings experienced a growth of 4.1% YoY from the revised 4% in April indicating a rise in wage inflation.
Following the release of the data, US Treasury yields spiked with the 2,5 and 10-year rates soaring to 4.80%, 4.44%, and 4.41% making the USD gain interest.
On the other hand, the SNB embarked on an easing cycle in its March meeting, reducing rates by 25 bps to reach 1.5%. As of now, the market predicts 55% odds for another rate cut happening in the upcoming meeting scheduled for June 20.
USD/CHF technical analysis
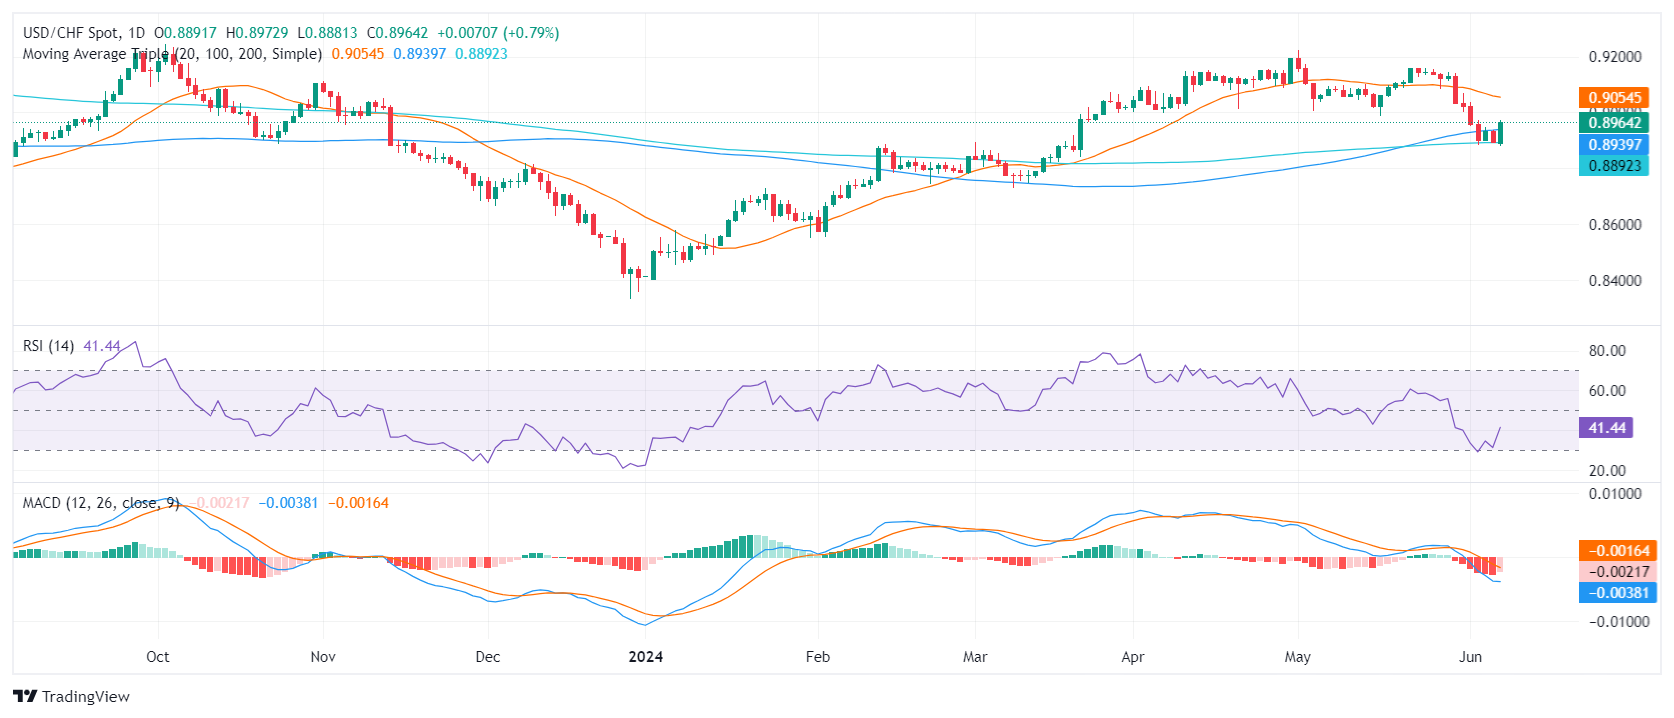
Technically speaking, the pair has recuperated to a more favorable stance, pushing indicators out of the oversold regions. The Relative Strength Index (RSI) now hovers near 50, signaling a more balanced market, and the Moving Average Convergence Divergence (MACD) is reporting smaller red bars. There's a clear sign of the pair regaining positions above the reformed 100 and 200-day SMA barriers, bolstering the short-term bullish outlook. The 200-day SMA also adds additional reinforcement to defend against losses.
USD/CHF daily chart
- Dow Jones grinds into the middle as investors shrug off declining rate cut bets.
- The US added 272K net new jobs in May.
- US wages also climbed faster than expected, crumpling September rate cut hopes.
The Dow Jones Industrial Average (DJIA) shrugged off a forecast-thumping Nonfarm Payrolls (NFP) print on Friday, climbing into a brief 0.2% gain through the US market session before slumping back to the day’s opening bids after a reactionary tumble to better-than-expected jobs additions in May.
US Nonfarm Payrolls delivered its third-best monthly net job gains on Friday, adding 272K new employment positions in May, well above the forecast 185K. The figure handily beat the previous month’s figure, which was revised slightly lower to 165K from 175K.
US Average Hourly Earnings also climbed faster than expected, showing wages increased 0.4% MoM versus the forecast 0.3% and the previous 0.2%. Meanwhile, the US Unemployment Rate also ticked up to its highest level since February 2022, printing at 4.0% versus the expected hold at 3.9%.
With the US economy continuing to outperform investor expectations, broad-market hopes for Federal Reserve (Fed) rate cuts continue to get battered. According to the CME’s FedWatch Tool, rate traders are now pricing in barely 51% odds of a at least a quarter-point rate trim from the Fed on September 8, down significantly from the 70% odds that were priced in until just before Friday’s NFP print.
Dow Jones news
After some initial post-NFP jitters, the DJIA is recovering firmly on Friday. Two-thirds of the major index’s constituent securities are in the green on the day, with gains being led by 3M Co. (MMM), which is up around 3% in Friday’s trading. 3M’s stock was recently upgraded to a “buy” by Bank of America analysts, prompting investors to do just that. 3M crossed over $100 per share on Friday, and is up nearly 12% for the year.
On the low side, Unitedhealth Group Inc. (UNH) fell -1.8% on Friday, falling to $493.00 per share. UNH is down around -6.25% from mid-May’s peak near $525.00 per share, and Friday’s share prices are shedding further weight following the announcement of a shareholder lawsuit against the company for alleged losses stemming from securities fraud committed by the healthcare company between March 2022 and February 2024.
Dow Jones technical outlook
The Dow Jones tested the 39,000.00 handle in an intraday recovery on Friday, but fell back to the day’s opening range near 38,880.00. The index is holding steady after recent recovery bids from a near-term low at the 38,000.00 level, but Friday is shaping up to be another soft day to round out the trading week.
The Dow Jones continues to waffle after falling from record all-time highs above 40,000.00, and still remains down -3% from record peaks in May. A firm demand zone is priced in between 38,000.00 and 37,500.00, and the major equity index is still trading deep into bull country above the 200-day Exponential Moving Average (EMA) at 37,299.82.
Dow Jones five minute chart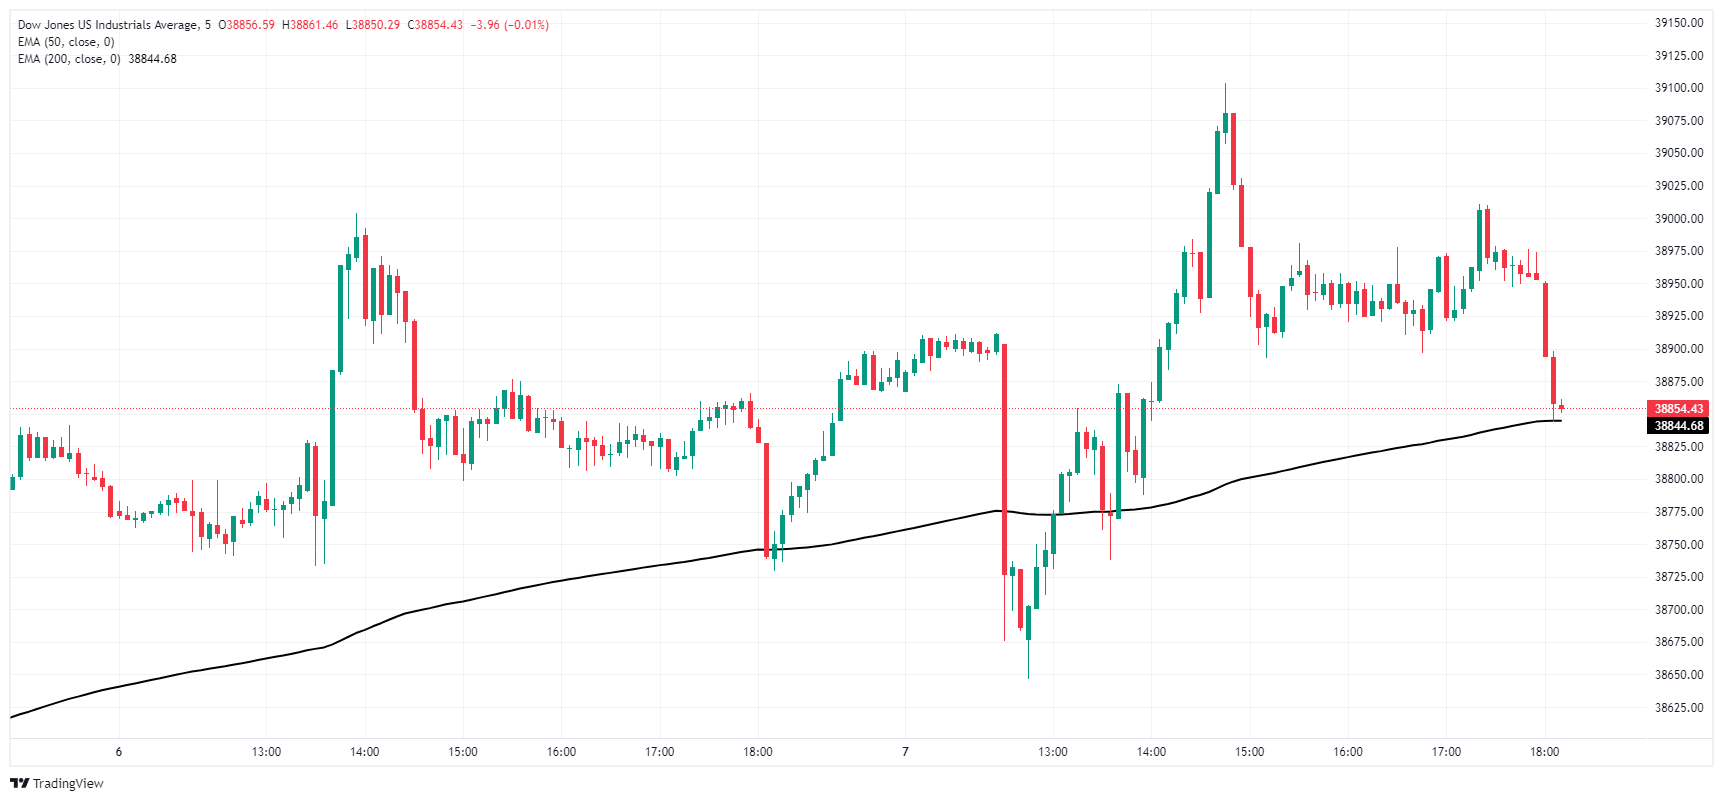
Dow Jones daily chart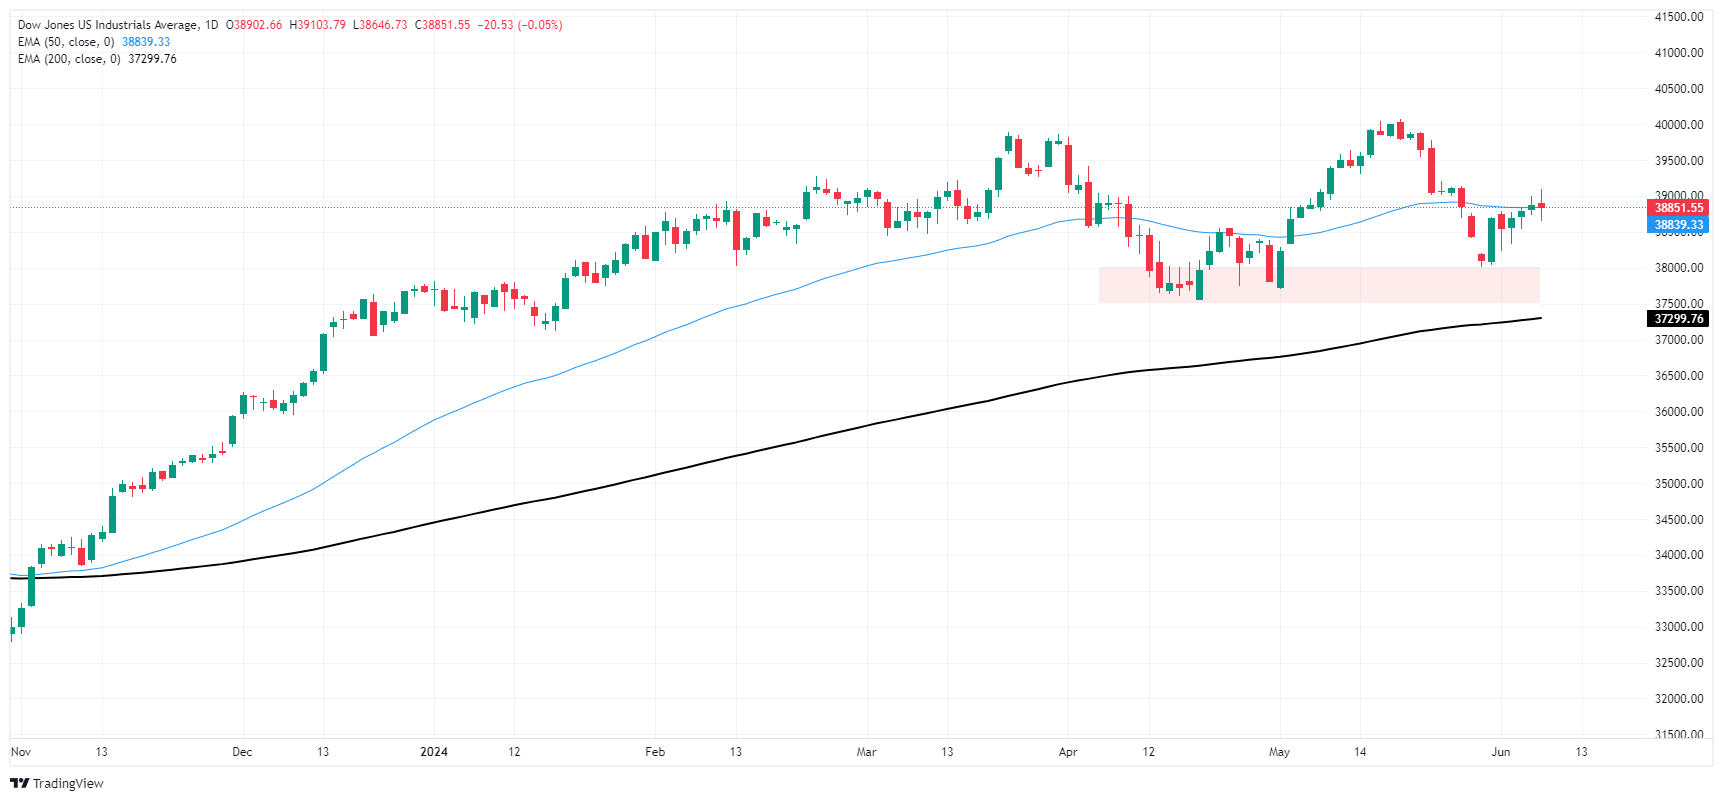
Dow Jones FAQs
The Dow Jones Industrial Average, one of the oldest stock market indices in the world, is compiled of the 30 most traded stocks in the US. The index is price-weighted rather than weighted by capitalization. It is calculated by summing the prices of the constituent stocks and dividing them by a factor, currently 0.152. The index was founded by Charles Dow, who also founded the Wall Street Journal. In later years it has been criticized for not being broadly representative enough because it only tracks 30 conglomerates, unlike broader indices such as the S&P 500.
Many different factors drive the Dow Jones Industrial Average (DJIA). The aggregate performance of the component companies revealed in quarterly company earnings reports is the main one. US and global macroeconomic data also contributes as it impacts on investor sentiment. The level of interest rates, set by the Federal Reserve (Fed), also influences the DJIA as it affects the cost of credit, on which many corporations are heavily reliant. Therefore, inflation can be a major driver as well as other metrics which impact the Fed decisions.
Dow Theory is a method for identifying the primary trend of the stock market developed by Charles Dow. A key step is to compare the direction of the Dow Jones Industrial Average (DJIA) and the Dow Jones Transportation Average (DJTA) and only follow trends where both are moving in the same direction. Volume is a confirmatory criteria. The theory uses elements of peak and trough analysis. Dow’s theory posits three trend phases: accumulation, when smart money starts buying or selling; public participation, when the wider public joins in; and distribution, when the smart money exits.
There are a number of ways to trade the DJIA. One is to use ETFs which allow investors to trade the DJIA as a single security, rather than having to buy shares in all 30 constituent companies. A leading example is the SPDR Dow Jones Industrial Average ETF (DIA). DJIA futures contracts enable traders to speculate on the future value of the index and Options provide the right, but not the obligation, to buy or sell the index at a predetermined price in the future. Mutual funds enable investors to buy a share of a diversified portfolio of DJIA stocks thus providing exposure to the overall index.
- Canadian Dollar tumbles -0.6% against US Dollar on Friday.
- Canada added more jobs than expected but is eclipsed by US NFP.
- Bumper job additions and rising wages crimp rate cut hopes.
The Canadian Dollar (CAD) is giving a mixed performance on Friday, climbing against the majority of its major currency peers but backsliding against the US Dollar (USD). The CAD shed six-tenths of a percent against the Greenback after a bumper US Nonfarm Payrolls (NFP) sent the USD broadly higher as investor hopes for a September rate cut from the Federal Reserve (Fed) wither on the vine.
Canada added more jobs than expected in May, but the figure was still well below previous figures, limiting the CAD’s upside momentum. Hourly wages also gained ground in both Canada and the US, while the US Unemployment Rate ticked higher in a cautionary note to Friday’s otherwise clean beat of market forecasts.
Daily digest market movers: Fresh job additions crimp rate cut bets
- US NFP added 272K net new jobs in May, clobbering the 185K forecast though the previous month’s print was revised lower to 165K from 175K.
- The US Unemployment Rate ticked higher to 4.0% in May, a 28-month high.
- US Average Hourly Earnings rose 0.4% MoM in May, above the forecast 0.3% and doubling the previous 0.2%.
- Canada’s Net Change in Employment rose to 26.7K in May, above the 22.5K forecast but still well below the previous month’s 90.4K.
- According to the CME’s FedWatch Tool, investor hopes for a September rate cut from the Fed were knocked firmly back by US data on Friday. Rate traders are pricing in only a 55% chance of at least a quarter-point cut from the Fed on September 8, down from over 70% before the US NFP print.
Canadian Dollar PRICE Today
The table below shows the percentage change of Canadian Dollar (CAD) against listed major currencies today. Canadian Dollar was the weakest against the US Dollar.
| USD | EUR | GBP | JPY | CAD | AUD | NZD | CHF | |
|---|---|---|---|---|---|---|---|---|
| USD | 0.76% | 0.50% | 0.66% | 0.59% | 1.18% | 1.39% | 0.79% | |
| EUR | -0.76% | -0.24% | -0.14% | -0.17% | 0.42% | 0.69% | 0.01% | |
| GBP | -0.50% | 0.24% | 0.12% | 0.07% | 0.67% | 0.93% | 0.25% | |
| JPY | -0.66% | 0.14% | -0.12% | -0.05% | 0.53% | 0.76% | 0.14% | |
| CAD | -0.59% | 0.17% | -0.07% | 0.05% | 0.59% | 0.87% | 0.18% | |
| AUD | -1.18% | -0.42% | -0.67% | -0.53% | -0.59% | 0.26% | -0.42% | |
| NZD | -1.39% | -0.69% | -0.93% | -0.76% | -0.87% | -0.26% | -0.66% | |
| CHF | -0.79% | -0.01% | -0.25% | -0.14% | -0.18% | 0.42% | 0.66% |
The heat map shows percentage changes of major currencies against each other. The base currency is picked from the left column, while the quote currency is picked from the top row. For example, if you pick the Canadian Dollar from the left column and move along the horizontal line to the US Dollar, the percentage change displayed in the box will represent CAD (base)/USD (quote).
Technical analysis: Canadian Dollar grinds out some gains as US Dollar soars
The Canadian Dollar (CAD) tumbled six-tenths of one percent against the Greenback on Friday, but otherwise stuck to its guns. The CAD rose three-quarters of one percent against the New Zealand Dollar (NZD) and six-tenths of one percent against the Australian Dollar (AUD). The CAD is also in the green within a fifth of a percent against the Euro (EUR) and the Swiss Franc (CHF).
USD/CAD shot to fresh near-term highs above 1.3750 on Friday, bumping into the ceiling of recent consolidation patterns. The pair is set to continue grinding sideways in the medium-term as buying power in the US Dollar evaporates at familiar technical highs.
Daily candlesticks show the pair on pace to see its strongest close in over a month, and bumping into its highest bids since early May. Consolidation remains the name of the game in the long-term, though USD/CAD continues to grind out chart paper north of the 200-day Exponential Moving Average (EMA).
USD/CAD hourly chart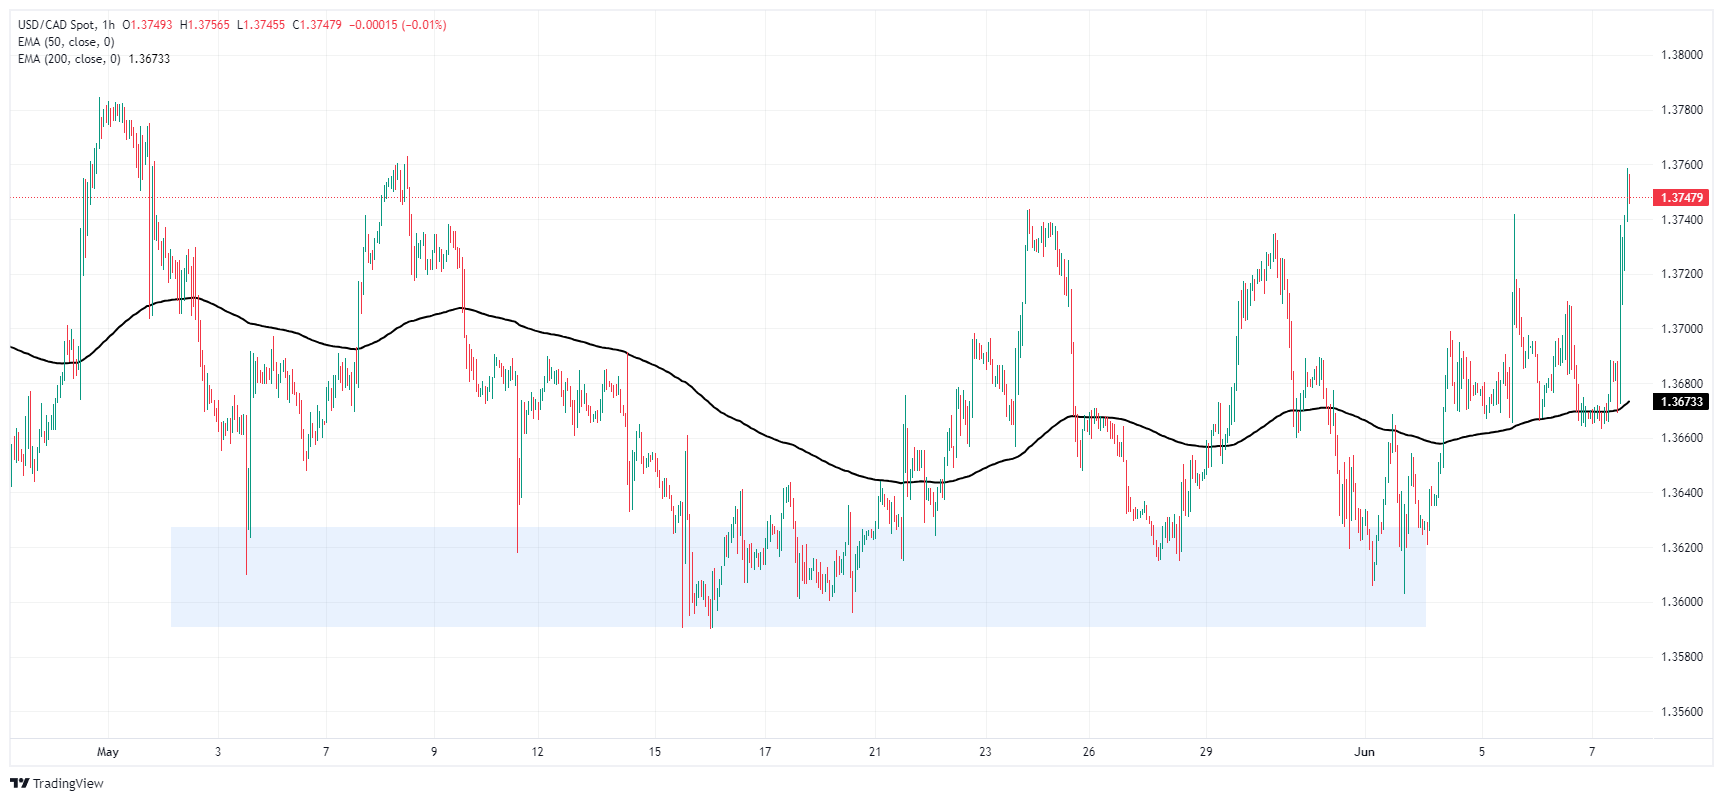
USD/CAD daily chart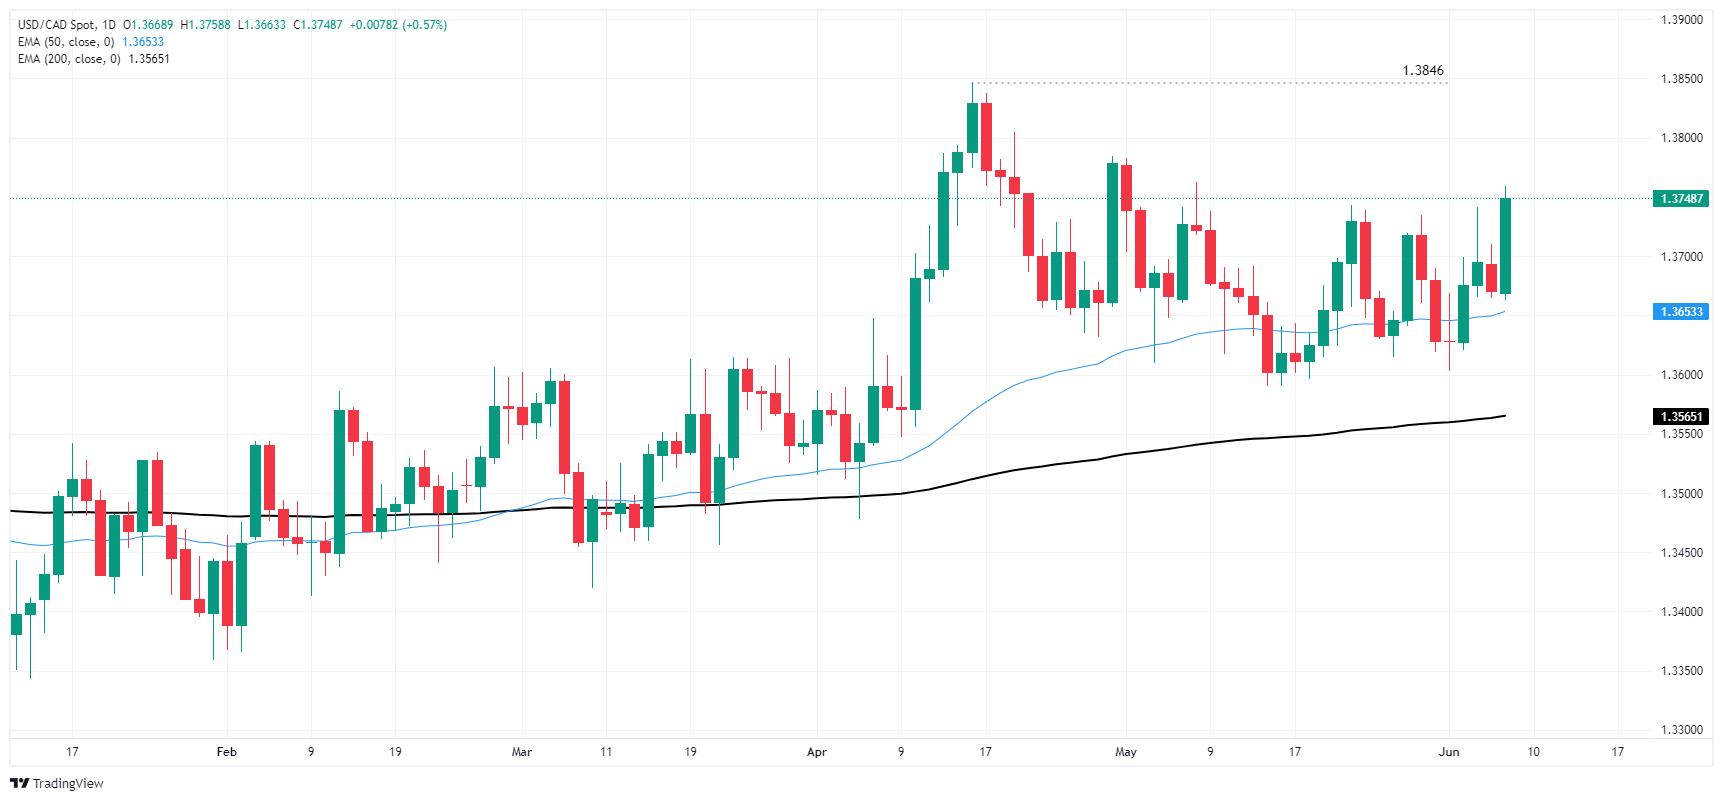
Canadian Dollar FAQs
The key factors driving the Canadian Dollar (CAD) are the level of interest rates set by the Bank of Canada (BoC), the price of Oil, Canada’s largest export, the health of its economy, inflation and the Trade Balance, which is the difference between the value of Canada’s exports versus its imports. Other factors include market sentiment – whether investors are taking on more risky assets (risk-on) or seeking safe-havens (risk-off) – with risk-on being CAD-positive. As its largest trading partner, the health of the US economy is also a key factor influencing the Canadian Dollar.
The Bank of Canada (BoC) has a significant influence on the Canadian Dollar by setting the level of interest rates that banks can lend to one another. This influences the level of interest rates for everyone. The main goal of the BoC is to maintain inflation at 1-3% by adjusting interest rates up or down. Relatively higher interest rates tend to be positive for the CAD. The Bank of Canada can also use quantitative easing and tightening to influence credit conditions, with the former CAD-negative and the latter CAD-positive.
The price of Oil is a key factor impacting the value of the Canadian Dollar. Petroleum is Canada’s biggest export, so Oil price tends to have an immediate impact on the CAD value. Generally, if Oil price rises CAD also goes up, as aggregate demand for the currency increases. The opposite is the case if the price of Oil falls. Higher Oil prices also tend to result in a greater likelihood of a positive Trade Balance, which is also supportive of the CAD.
While inflation had always traditionally been thought of as a negative factor for a currency since it lowers the value of money, the opposite has actually been the case in modern times with the relaxation of cross-border capital controls. Higher inflation tends to lead central banks to put up interest rates which attracts more capital inflows from global investors seeking a lucrative place to keep their money. This increases demand for the local currency, which in Canada’s case is the Canadian Dollar.
Macroeconomic data releases gauge the health of the economy and can have an impact on the Canadian Dollar. Indicators such as GDP, Manufacturing and Services PMIs, employment, and consumer sentiment surveys can all influence the direction of the CAD. A strong economy is good for the Canadian Dollar. Not only does it attract more foreign investment but it may encourage the Bank of Canada to put up interest rates, leading to a stronger currency. If economic data is weak, however, the CAD is likely to fall.
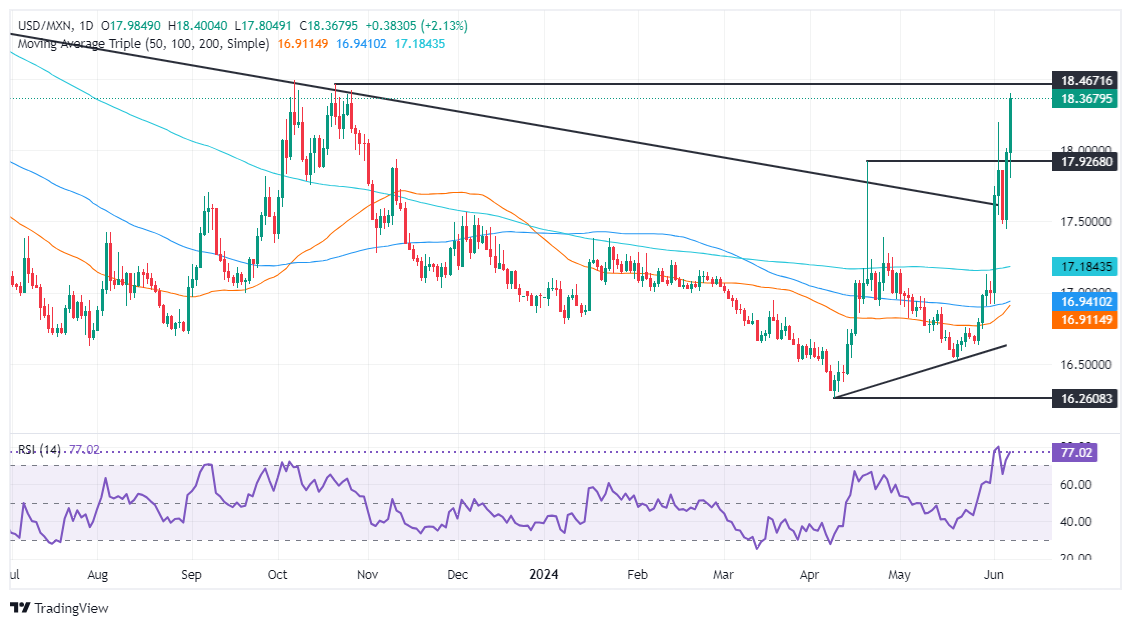
- Mexican Peso collapsed to 18.40 against USD after AMLO's remarks on judicial and transparency reforms.
- AMLO’s comments on judicial reform and dissolution of autonomous bodies spur investor concerns.
- Mexico’s headline inflation rises for third month, while core inflation declines for 16th consecutive month.
- Strong US employment data boosts speculation of prolonged higher Fed rates.
The Mexican Peso sank to a new eight-month low against the Greenback on Friday after Mexican President Andres Manuel Lopez Obrador's (AMLO) comments rattled investors who continued to sell Pesos amid an uncertain outlook. The USD/MXN trades at 18.35, gaining some 2.0% after hitting a multi-month high of 18.39.
In his usual morning press conference, Mexican President AMLO insisted on presenting a judicial reform and another that involves the dissolution of autonomous bodies, like the INAI, the government’s transparency body.
AMLO emphasized his radical rhetoric and stated, “The judicial power is hijacked, the service is taken over by a minority of those at the top. I have already said it here, and they know it very well. It is even shameful, but there are ministers who are like employees of large corporations,” according to El Financiero.
Consequently, the USD/MXN jumped from around 17.95 toward the multi-month high of 18.39 on AMLO’s remarks. Traders should be aware that the Mexican Peso will be extremely sensitive and volatile amid political uncertainty.
Aside from political comments, Mexico’s headline inflation rose for the third straight month, exerting pressure on the Bank of Mexico (Banxico). Nevertheless, underlying inflation, which excludes volatile items and provides a clear view of prices, dropped for the sixteenth consecutive month.
Across the border, the latest US employment report fueled speculation that the Federal Reserve (Fed) would keep rates “higher for longer,” with figures crushing estimates.
Following the data, US Treasury bond yields jumped more than ten basis points (bps), with the 10-year benchmark note rising to 4.414%, up 12.5 bps, and underpinning the Greenback. The US Dollar Index (DXY), which tracks the performance of the American currency against six others, rose 0.74% to 104.86.
Data-wise, Mexican Auto Exports increased in May but less than in April, signaling the economy is feeling the impact of higher borrowing costs set by Banxico.
Daily digest market movers: Mexican Peso landslide continues on investors’ fears
- On Thursday, Morena’s leader at the Congress, Ignacio Mier, commented that they will submit the proposals to the newly established Congress in September.
- Some of the most important proposals include a reform of the Supreme Court, which proposes that the Supreme Court's ministers be elected by popular vote; electoral reform, which seeks to have INE councilors elected by popular vote and reduce multi-membership; and reform of autonomous bodies, which entails the dissolution of INAI, the transparency body.
- Mexico’s Consumer Price Index (CPI) in May was 4.69% YoY, up from 4.65% in April, while core CPI dipped from 4.37% to 4.21%.
- Although this fuels speculations of another Banxico rate cut in June, a further depreciation of the Mexican Peso could prevent the Mexican Central Bank from easing policy.
- Morgan Stanley noted that if Mexico’s upcoming government and Congress adopted an unorthodox agenda, it would undermine Mexican institutions and be bearish for the Mexican Peso, which could weaken to 19.20.
- US Bureau of Labor Statistics (BLS) revealed that May’s Nonfarm Payrolls increased by 272,000, exceeding forecasts of 185,000 and April’s 165,000.
- US Unemployment Rate jumped from 3.9% to 4%, while Average Hourly Earnings (AHE) rose by 4.1% YoY, up from 4%.
- Contrary to Thursday’s expectations that the Fed might cut rates by 39 bps toward the end of the year. However, the latest US jobs report witnessed a fall to just 29 bps of easing, according to the December 2024 CBOT fed funds future rate contract.
Technical analysis: Mexican Peso depreciates sharply as USD/MXN surges above 18.20
From a technical standpoint, the USD/MXN remains bullish and might extend its gains if the pair achieves a fifth daily close above a four-year-old downslope resistance trendline drawn from all-time highs (ATH) at around $25.77, which was broken on Monday. That could be the last nail in the coffin for the Mexican Peso's strength.
The USD/MXN's next resistance would be the October 6 high of 18.48, which could open the door to challenging the psychological 19.00 figure. Once that level is breached, on March 20, 2023, a high of 19.23 would follow. If all those levels are surpassed, the exotic pair could hit 20.00, and reach a new 18-month high.
On the other hand, sellers need to push the USD/MXN back below the April 19 high of 18.15 if they would like to keep the pair within the 18.00-18.15 trading range.
Mexican Peso FAQs
The Mexican Peso (MXN) is the most traded currency among its Latin American peers. Its value is broadly determined by the performance of the Mexican economy, the country’s central bank’s policy, the amount of foreign investment in the country and even the levels of remittances sent by Mexicans who live abroad, particularly in the United States. Geopolitical trends can also move MXN: for example, the process of nearshoring – or the decision by some firms to relocate manufacturing capacity and supply chains closer to their home countries – is also seen as a catalyst for the Mexican currency as the country is considered a key manufacturing hub in the American continent. Another catalyst for MXN is Oil prices as Mexico is a key exporter of the commodity.
The main objective of Mexico’s central bank, also known as Banxico, is to maintain inflation at low and stable levels (at or close to its target of 3%, the midpoint in a tolerance band of between 2% and 4%). To this end, the bank sets an appropriate level of interest rates. When inflation is too high, Banxico will attempt to tame it by raising interest rates, making it more expensive for households and businesses to borrow money, thus cooling demand and the overall economy. Higher interest rates are generally positive for the Mexican Peso (MXN) as they lead to higher yields, making the country a more attractive place for investors. On the contrary, lower interest rates tend to weaken MXN.
Macroeconomic data releases are key to assess the state of the economy and can have an impact on the Mexican Peso (MXN) valuation. A strong Mexican economy, based on high economic growth, low unemployment and high confidence is good for MXN. Not only does it attract more foreign investment but it may encourage the Bank of Mexico (Banxico) to increase interest rates, particularly if this strength comes together with elevated inflation. However, if economic data is weak, MXN is likely to depreciate.
As an emerging-market currency, the Mexican Peso (MXN) tends to strive during risk-on periods, or when investors perceive that broader market risks are low and thus are eager to engage with investments that carry a higher risk. Conversely, MXN tends to weaken at times of market turbulence or economic uncertainty as investors tend to sell higher-risk assets and flee to the more-stable safe havens.
- USD maintains its momentum, rising by more than 0.70% on Friday.
- US Nonfarm Payrolls exceeded market expectations in May, showing a robust recovery in the labor market.
- September odds fall for a Fed rate cut as positive economic signals abound.
On Friday, the US Dollar Index (DXY) expanded its winning streak following stronger-than-forecasted labor market data. The Nonfarm Payrolls, combined with an increase in wage inflation, outline a robust, resilient economy that may justify the delay of rate cuts by the Federal Reserve (Fed).
Attention now turns to future Fed meetings, with the market eyeing any shift in the monetary policy stance following the positive labor data. The odds for cuts for June and July remain low after the strong employment data, falling to around 50% for September.
Daily digest market movers: DXY strengthens, backed by solid economic results
- The Nonfarm Payrolls for May surged 272K, surpassing market projections of 185K and demonstrating substantial growth from April's revised figure of 165K.
- Unemployment Rate slightly crept higher to 4% from 3.9%.
- Wage inflation data, as indicated by the percentage change in Average Hourly Earnings, increased to 4.1% on a yearly basis, bouncing from the revised 4% in April.
- Meanwhile, Treasury yields followed the upward trajectory with the 2, 5 and 10-year rates climbing more than 2% to 4.85%, 4.44%, and 4.41%, respectively.
DXY technical analysis: A bullish reversal sets up as the index recovers key levels
A turnaround in the DXY index's fortune is becoming more apparent as it jumps above the key Simple Moving Averages (SMAs) of 20,100 and 200-days. The Relative Strength Index (RSI) shifted back above 50, signaling a return to bullish momentum, while the Moving Average Convergence Divergence (MACD) continues to print lower red bars, suggesting that buying interest is picking up.
For a sustained bullish outlook, the DXY bulls need to maintain the critical resistance level at 104.40, regained after the strong jobs data.
US Dollar FAQs
The US Dollar (USD) is the official currency of the United States of America, and the ‘de facto’ currency of a significant number of other countries where it is found in circulation alongside local notes. It is the most heavily traded currency in the world, accounting for over 88% of all global foreign exchange turnover, or an average of $6.6 trillion in transactions per day, according to data from 2022. Following the second world war, the USD took over from the British Pound as the world’s reserve currency. For most of its history, the US Dollar was backed by Gold, until the Bretton Woods Agreement in 1971 when the Gold Standard went away.
The most important single factor impacting on the value of the US Dollar is monetary policy, which is shaped by the Federal Reserve (Fed). The Fed has two mandates: to achieve price stability (control inflation) and foster full employment. Its primary tool to achieve these two goals is by adjusting interest rates. When prices are rising too quickly and inflation is above the Fed’s 2% target, the Fed will raise rates, which helps the USD value. When inflation falls below 2% or the Unemployment Rate is too high, the Fed may lower interest rates, which weighs on the Greenback.
In extreme situations, the Federal Reserve can also print more Dollars and enact quantitative easing (QE). QE is the process by which the Fed substantially increases the flow of credit in a stuck financial system. It is a non-standard policy measure used when credit has dried up because banks will not lend to each other (out of the fear of counterparty default). It is a last resort when simply lowering interest rates is unlikely to achieve the necessary result. It was the Fed’s weapon of choice to combat the credit crunch that occurred during the Great Financial Crisis in 2008. It involves the Fed printing more Dollars and using them to buy US government bonds predominantly from financial institutions. QE usually leads to a weaker US Dollar.
Quantitative tightening (QT) is the reverse process whereby the Federal Reserve stops buying bonds from financial institutions and does not reinvest the principal from the bonds it holds maturing in new purchases. It is usually positive for the US Dollar.
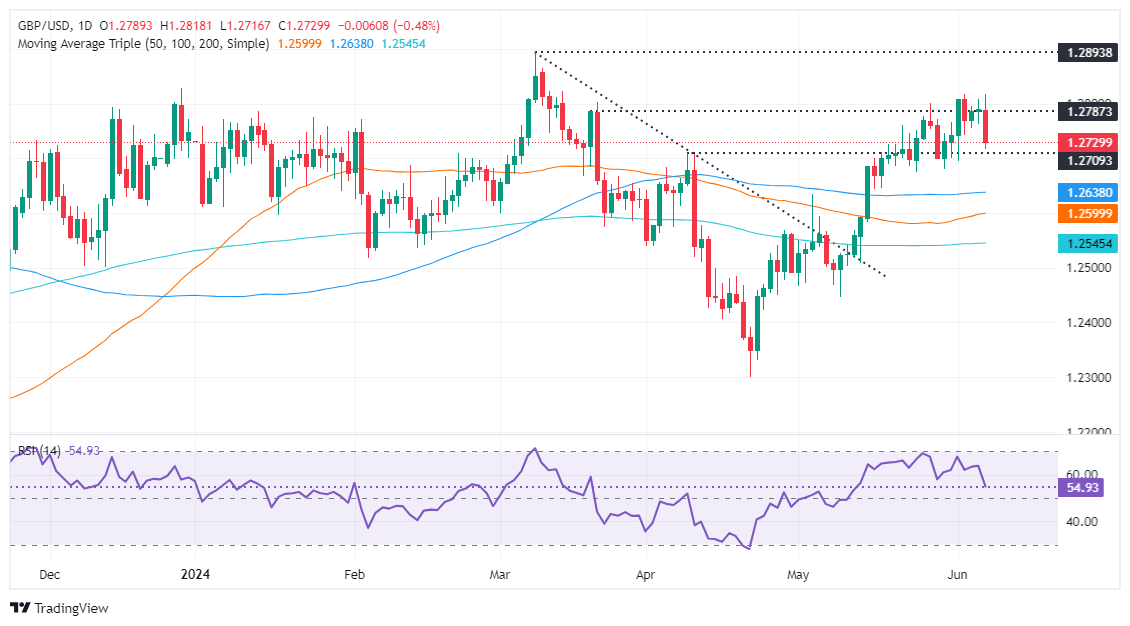
- GBP/USD pukes following stellar US NFP data report.
- The pair trades at around weekly lows, sellers eye 1.2694.
- Near-term momentum favors sellers, as RSI accelerates toward the 50-midline.
The British Pound plunged against the US Dollar after the US Bureau of Labor Statistics (BLS) revealed the US jobs market remains hotter than expected, exceeding the consensus estimates, boosting the Greenback. Therefore, the pair tumbled near the week's lows, with the GBP/USD trading at 1.2722, down 0.53%, at the time of writing.
GBP/USD Price Analysis: Technical outlook
From a technical perspective, the GBP/USD failed to clear strong resistance at the confluence of technical indicators, and sudden US Dollar strength dragged the spot prices below the low of the three-day range of 1.2740.
Momentum has shifted in sellers’ favor in the near term, with the Relative Strength Index (RSI) diving from around 64 to 54.26, about to enter bearish territory.
That said, the first support for GBP/USD would be the 1.2700 figure, followed by last Friday’s low of 1.2694. Further losses are seen beneath at 1.2680, the May 30 low, immediately followed by the May 24 cycle low of 1.2674.
Conversely, if buyers reclaim 1.2740, that could pave the way to keep the pair range-bound at around 1.2750-1.2800.
GBP/USD Price Action – Daily Chart
British Pound PRICE Today
The table below shows the percentage change of British Pound (GBP) against listed major currencies today. British Pound was the strongest against the New Zealand Dollar.
| USD | EUR | GBP | JPY | CAD | AUD | NZD | CHF | |
|---|---|---|---|---|---|---|---|---|
| USD | 0.67% | 0.47% | 0.80% | 0.43% | 1.10% | 1.28% | 0.87% | |
| EUR | -0.67% | -0.18% | 0.14% | -0.24% | 0.43% | 0.66% | 0.20% | |
| GBP | -0.47% | 0.18% | 0.32% | -0.06% | 0.62% | 0.84% | 0.38% | |
| JPY | -0.80% | -0.14% | -0.32% | -0.37% | 0.29% | 0.48% | 0.08% | |
| CAD | -0.43% | 0.24% | 0.06% | 0.37% | 0.67% | 0.91% | 0.44% | |
| AUD | -1.10% | -0.43% | -0.62% | -0.29% | -0.67% | 0.22% | -0.25% | |
| NZD | -1.28% | -0.66% | -0.84% | -0.48% | -0.91% | -0.22% | -0.45% | |
| CHF | -0.87% | -0.20% | -0.38% | -0.08% | -0.44% | 0.25% | 0.45% |
The heat map shows percentage changes of major currencies against each other. The base currency is picked from the left column, while the quote currency is picked from the top row. For example, if you pick the British Pound from the left column and move along the horizontal line to the US Dollar, the percentage change displayed in the box will represent GBP (base)/USD (quote).
- USD/CAD is attempting to break out of a triangle price pattern and push higher.
- A decisive breakout would reaffirm 2024’s uptrend and begin a new more bullish phase.
USD/CAD is pushing up against the upper borderline of a large symmetrical triangle price pattern, threatening to break out to the upside.
USD/CAD Daily Chart
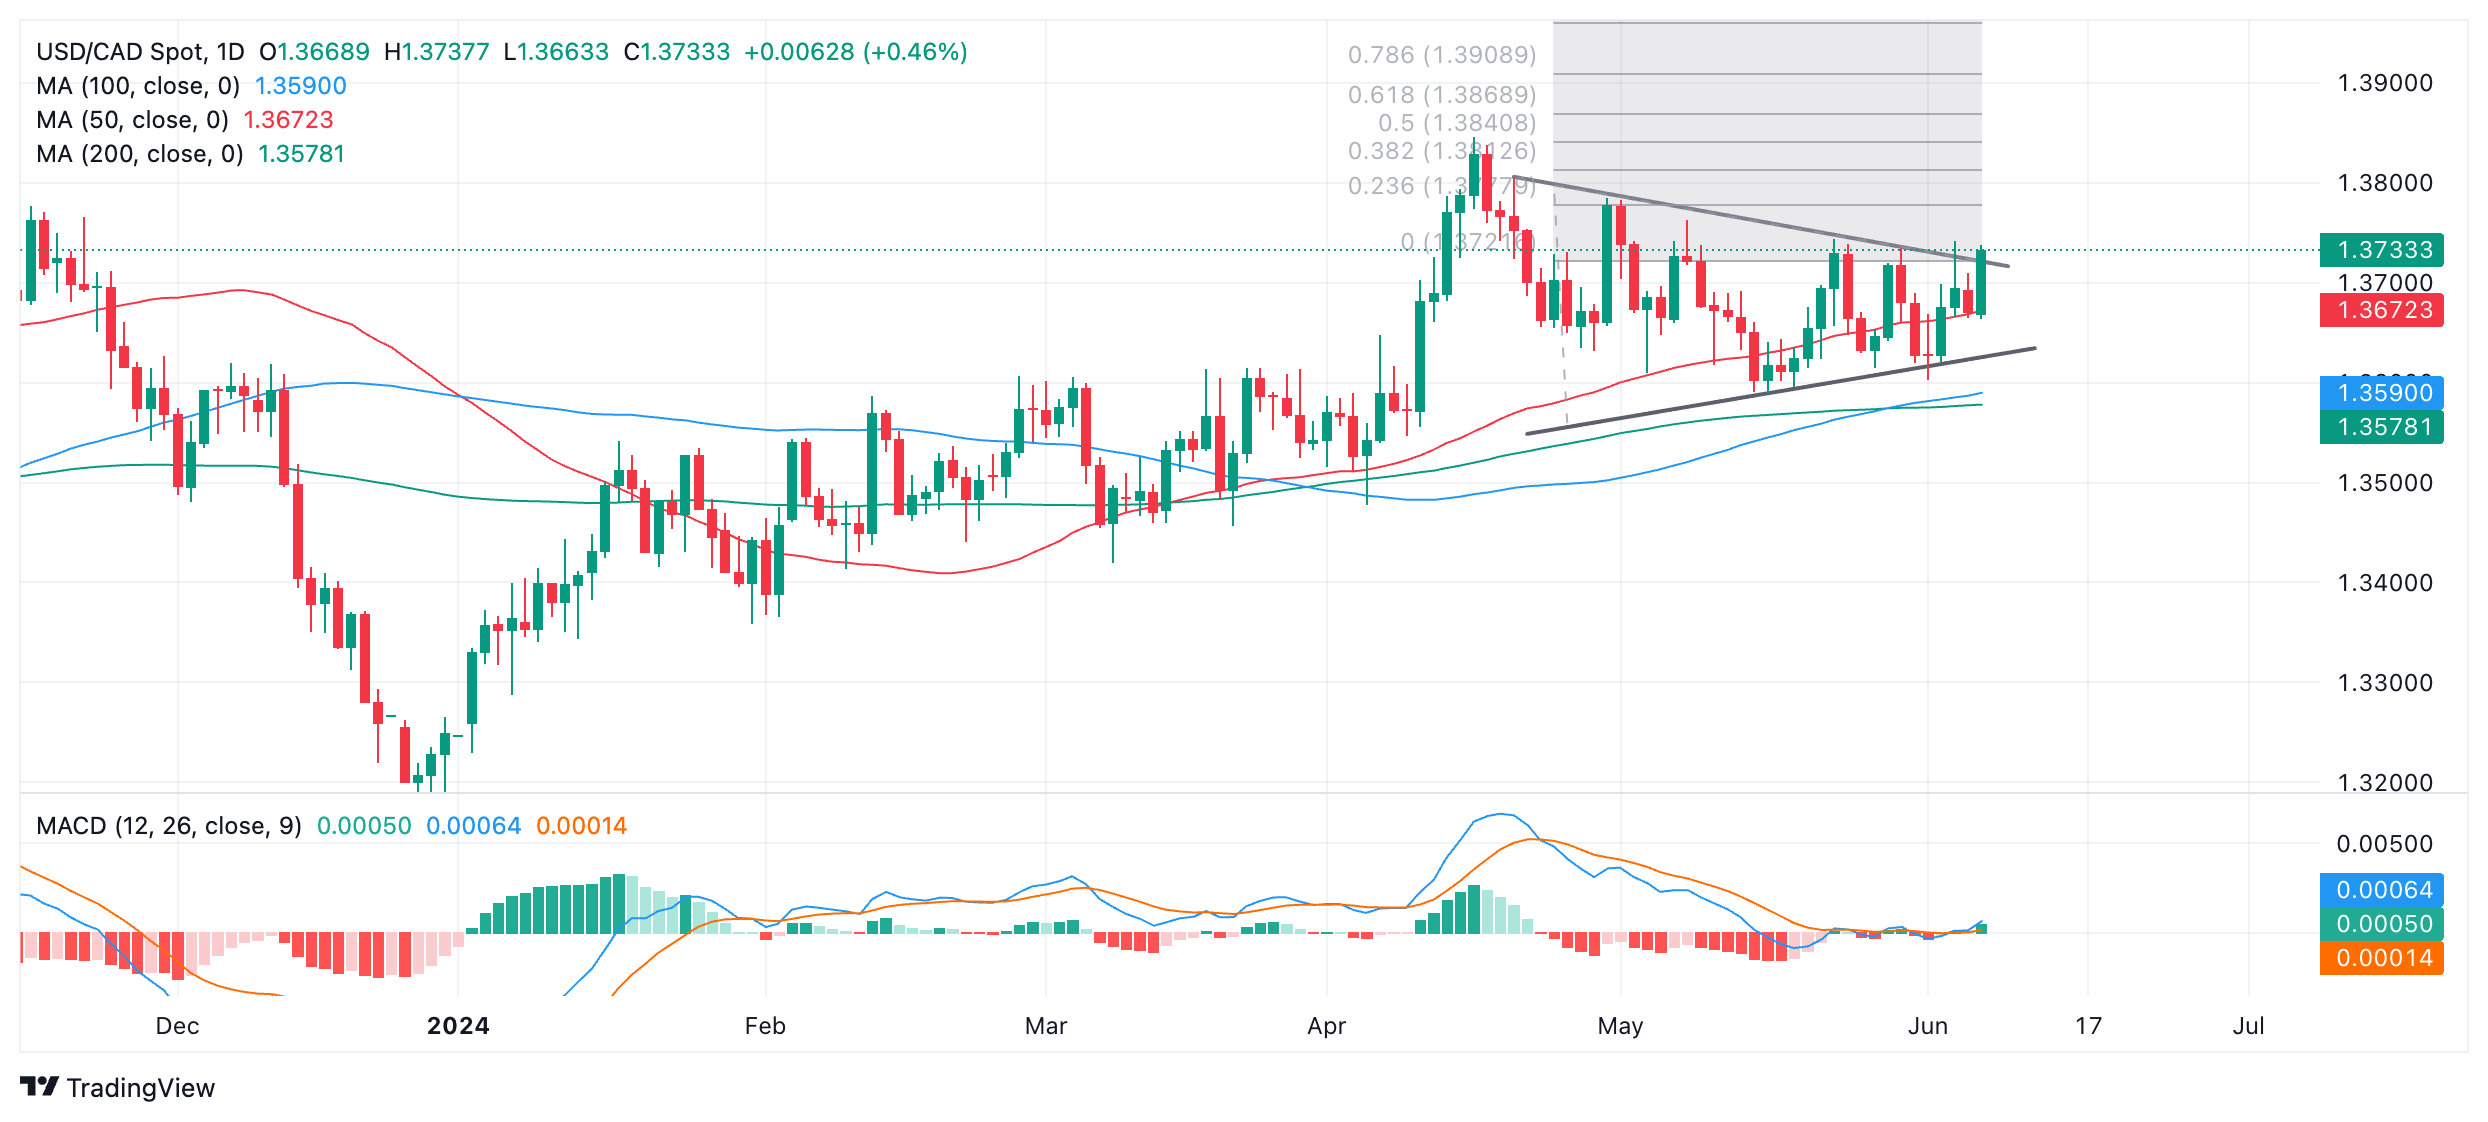
A decisive breakout from the triangle would activate the initial upside target for the pattern at 1.3869, the 0.618 Fibonacci extrapolation of the height of the triangle from the breakout point higher.
A decisive break would be one accompanied by a long green daily candlestick that broke clearly through the level and closed near its high or three green candlesticks in a row that broke through the level.
USD/CAD has broadly-speaking been in an uptrend since the start of 2024. During that time it has risen from the 1.31s to the current 1.37s. Given that “the trend is your friend” the odds favor a continuation of the bull trend.
Since April USD/CAD has been trading sideways in a narrowing range like a triangle. This is a type of continuation pattern. The probabilities favor price breaking out to the upside in line with the prior trend. The pattern has also completed five internal waves which is the minimum requirement for a triangle.
The breakout, when it happens, is likely to be quite volatile. Traders should be warned that false breakouts are quite common. For more confidence a move above 1.3762 (May 8 high) should be used as confirmation.
A decisive breakdown from the triangle would reverse the trend and suggest a move down to an initial target at around 1.3483.
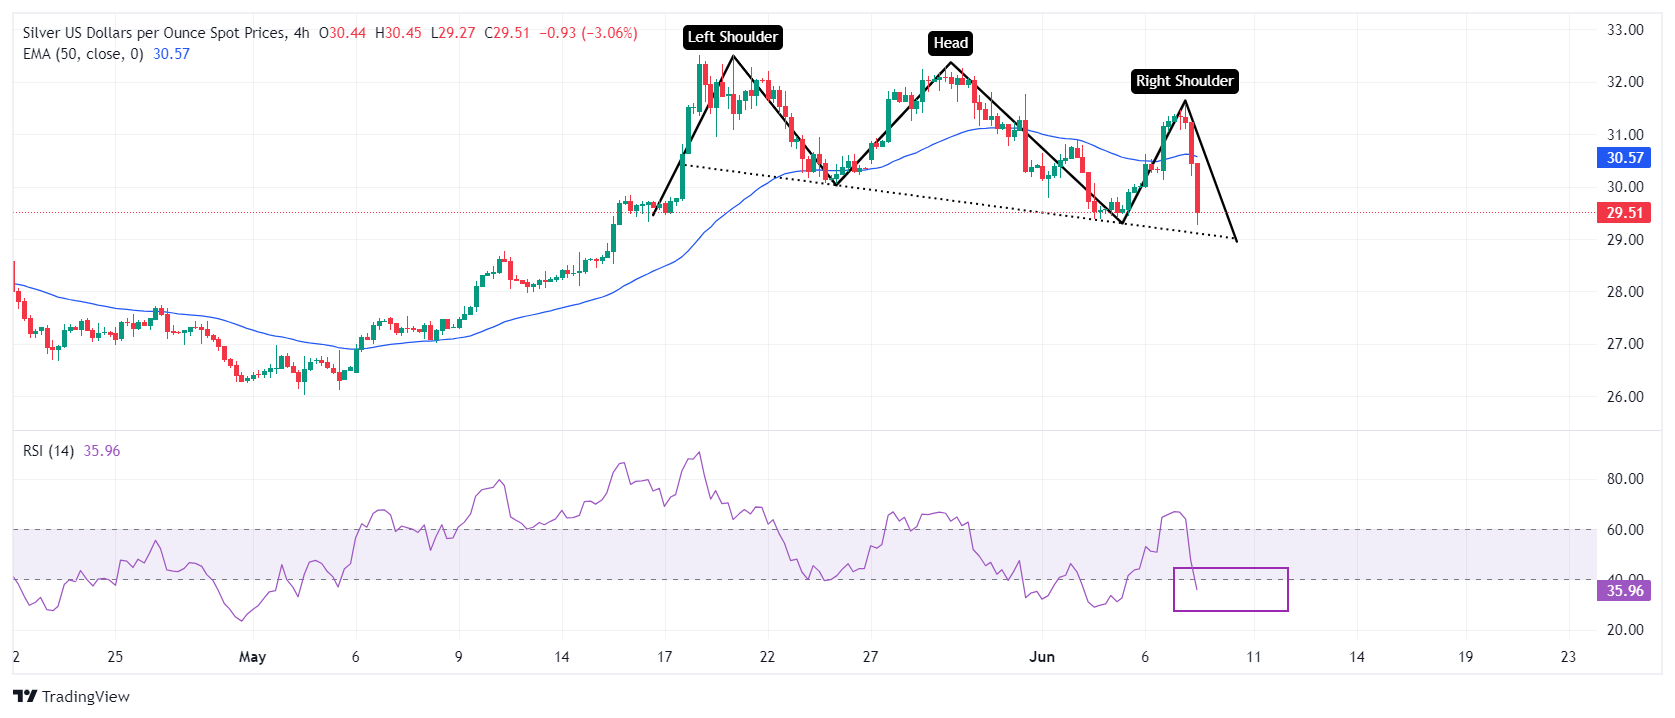
- Silver price drops vertically below $30.00 as US yields soar after upbeat US NFP report for May.
- Both job and wage growth beat estimates.
- Pause in PBoC’s gold-buying also weighed on the Silver price.
Silver price (XAG/USD) plummets below the psychological support of $30.00 in Friday’s New York session. The white metal plunges after the United States Nonfarm Payrolls (NFP) report May showed that labor demand remains robust and the wage growth momentum was stronger than expected.
Fresh payrolls came in higher at 272K than expectations of 185K and the prior release of 165K. Average Hourly Earnings rose strongly by 0.4% from the estimates of 0.3% and the former release of 0.2% on a month-on-month basis. Average Hourly Earnings data is a measure of wage inflation, which directs households’ spendings. Annual wage inflation measure grew by 4.1%, beats the estimate of 3.9% and April’s read of 4.0%.
Strong payrolls and wage growth data prompt the need to maintain a restrictive interest rate framework by the Federal Reserve (Fed) for a longer period, which is a favourable situation for yields on interest-bearing assets and the US Dollar. 10-year US Treasury yields rally 4.43%, up by 3.5% from Thursday’s close. The US Dollar Index (DXY), which tracks the Greenback’s value against six major currencies, jumps to 104.80. Higher yields on interest-bearing assets increase the opportunity cost of holding an investment in non-yielding assets, such as Silver.
The white metal was already under pressure as People’s Bank of China’s (PBoC) gold reserves report for May showed that their 18-month long Gold buying spell paused for a while. The report showed that gold reserves were unchanged at 72.80 million fine troy oz.
Silver technical analysis
Selling pressure in the Silver price indicates that it could deliver a breakdown of the Head and Shoulder chart pattern formed on a four-hour timeframe. The neckline of the above-mentioned chart pattern appears to be around $29.00. A decisive break below the same would result in a bearish reversal.
Spot prices have dropped below the 50-period Exponential Moving Average (EMA) near $30.50, suggesting that the near-term outlook turns bearish.
The 14-period Relative Strength Index (RSI) has slipped below 40.00. A sustained move below the same will push the momentum towards the downside.
Silver four-hour chart
- USD/JPY shoots over half a percent higher following higher-than-expected US payrolls data for May.
- The data also showed a greater-than-experienced increase in wages although unemployment unexpectedly rose.
- The data contrasts with Japanese real wages which fell for the 25th straight month in April.
USD/JPY spikes higher by over half a percent in the minutes following the release of US Nonfarm Payrolls (NFP) data, on Friday. USD/JPY trades in the upper 156s after the US Dollar (USD) strengthens as a result of the better-than-expected results.
US Nonfarm Payrolls showed the number of employed people in the US rose by 272K in May when 185K had been expected, according to data from the US Bureau of Statistics (BLS). The result was higher than the April figure which was revised down to 165K.
USD/JPY Daily Chart
The BLS report showed a rise in Average Hourly Earnings of 4.1% YoY, beating estimates of 3.9% and higher than the revised-up 4.0% in April.
The report showed the Unemployment Rate rose to 4.0%, however, when 3.9% had been forecast from 3.9% previously.
The data overall suggests the US labor market is in better shape than had previously been thought, especially given the lower-than-expected JOLTS Job Openings and ADP payrolls data earlier in the week. The higher-than-expected wage inflation indicates the possibility headline and core inflation might rise as workers spend their increased wages. Higher general inflation could deter the US Federal Reserve (Fed) from lowering interest rates. Prior to the NFP release, the probability of the Fed cutting interest rates in September was roughly 67% – after the NFPs it had fallen to 53%.
Maintaining high interest rates is positive for USD/JPY as it strengthens the US Dollar. A higher interest rate attracts greater inflows of foreign capital, increasing demand for the currency.
USD/JPY further propelled by contrast with Japanese wage data
USD/JPY’s strong move up following the NFP data may be exaggerated because it follows two negative minor US employment reports earlier in the week (JOLTS and ADP) and because of the contrast with similar data from Japan.
Real wages in Japan declined for the 25th straight month in April, as domestic inflation continued to outpace wage growth. The data makes it harder for the Bank of Japan (BoJ) to normalize its monetary policy. The BoJ is the only major central bank still undertaking quantitative easing (QE) and has had to keep interest rates in an ultra-low 0.0% - 0.1% range. This has led to a stark devaluation in the Yen to levels which raise concern among policymakers as they are hampering business activity.
That said, USD/JPY lost ground earlier in the week amid rumors the BoJ was planning to reduce the bond purchases it makes as part of its QE programme. If the BoJ cuts bond purchases it would put upward pressure on Japanese bond yields which are highly correlated to the JPY. It remains to be seen, however, whether the rumors materialize.
USD/JPY upside may be capped by direct intervention from the Japanese authorities to buy the Yen in the FX markets. On Tuesday, Deputy Governor of the BoJ Ryozo Himino repeated concerns about how a weak JPY was negatively impacting the economy and the BoJ needed to be “very vigilant” regarding its effects. His comments suggested the BoJ might be preparing for another direct intervention in Forex markets to prop up JPY (negative for USD/JPY).
According to Himino the weak Yen pushes up inflation, but in a negative way. Although it increases the price of imported goods, continued stagnant wages mean consumers are increasingly being priced out of the market. Himino said he would prefer inflation to come from higher wages, not a weak currency, as this would lead to a more dynamic economy.
- Natural Gas price trades above $2.85 and is set to close the week in green.
- Egypt has issued a bigger than expected tender for more than 15 LNG cargoes.
- The US Dollar Index flirts with a break below 104.00 ahead of the US Employment Report for May.
Natural Gas price (XNG/USD) trades marginally higher above $2.85 on Friday, extending this week’s positive move, with markets ignoring that the Norwegian Gas is flowing again in full volume towards Europe and the UK. Instead, traders are more focused on the surprise tender from Egypt, which exceeded expectations. Initially, the assumption was that Egypt would only issue a tender for less than 10 Liquefied Natural Gas (LNG) cargoes, though the final data on Thursday showed the tender for more than 15 LNG cargoes, according to Reuters.
Meanwhile, the US Dollar Index (DXY), which tracks the Greenback’s value against six major currencies, hovers around 104.00 ahead of the US Employment Report for May, with the Nonfarm Payrolls (NFP) number, Unemployment Rate and the Average Hourly Earnings for the month. Volatility is set to pick up, should the Nonfarm Payrolls number miss expectations, with consensus views titled to a higher number than the previous month. In case of a big miss in the US employment data and a sell-off in the DXY, the Natural Gas price could extend its positive move on Friday.
Natural Gas is trading at $2.87 per MMBtu at the time of writing.
Natural Gas news and market movers: Egypt is buying up
- Reuters reported on Friday that Egypt has released tender details for at least 15 LNG cargoes with deliveries to cover summer demand.
- Taiwan has signed a three-decade-long agreement with Qatar to buy LNG to fill the gap for its missing Nuclear and Coal energy, which is being phased out.
- Bloomberg reports that Gazprom CEO Alexey Miller and Turkey’s Energy Minister Alparslan Bayraktar have discussed further plans for an international Gas hub during a meeting in St. Petersburg.
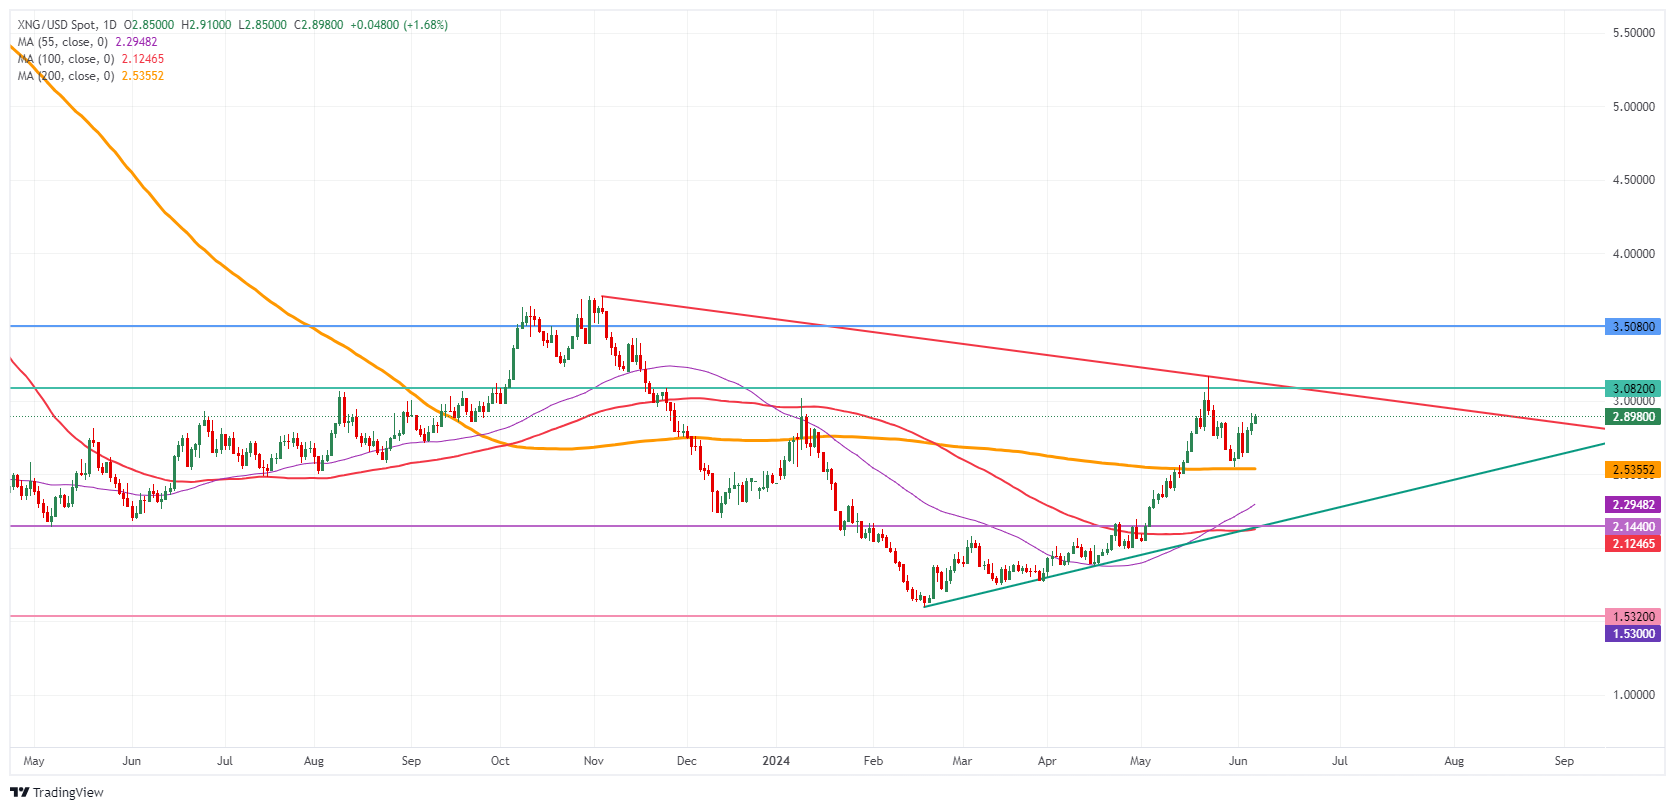
Natural Gas Technical Analysis: A bounce that keeps going
Natural Gas trades higher again after a perfect technical bounce earlier this week against the 200-day Simple Moving Average (SMA) at $2.53. From here on out, the question is whether that bounce is strong enough to head to $3.08 on the upside. Meanwhile, the CME FedWatch Tool suggests a 68% chance that the Federal Reserve’s (Fed) interest rate will be lower than the current level in September, which might boost Gas prices in the idea that an interest rate cut would be good for demand.
On the upside, the $3.00 marker as a big figure was tested in May and remains a first element to watch out for on the upside. The pivotal level near $3.07 ( March 6, 2023, high) remains key as prices failed to post a daily close above it. Further up, the fresh year-to-date high at $3.16 is the level to beat.
On the downside, the 200-day Simple Moving Average (SMA) acts as the first support near $2.53. Should that support area fail to hold, the next target could be the pivotal level near $2.14, with interim support by the 55-day SMA near $2.25. Further down, the biggest support comes at $2.11 with the 100-day SMA.
Natural Gas: Daily Chart
Natural Gas FAQs
Supply and demand dynamics are a key factor influencing Natural Gas prices, and are themselves influenced by global economic growth, industrial activity, population growth, production levels, and inventories. The weather impacts Natural Gas prices because more Gas is used during cold winters and hot summers for heating and cooling. Competition from other energy sources impacts prices as consumers may switch to cheaper sources. Geopolitical events are factors as exemplified by the war in Ukraine. Government policies relating to extraction, transportation, and environmental issues also impact prices.
The main economic release influencing Natural Gas prices is the weekly inventory bulletin from the Energy Information Administration (EIA), a US government agency that produces US gas market data. The EIA Gas bulletin usually comes out on Thursday at 14:30 GMT, a day after the EIA publishes its weekly Oil bulletin. Economic data from large consumers of Natural Gas can impact supply and demand, the largest of which include China, Germany and Japan. Natural Gas is primarily priced and traded in US Dollars, thus economic releases impacting the US Dollar are also factors.
The US Dollar is the world’s reserve currency and most commodities, including Natural Gas are priced and traded on international markets in US Dollars. As such, the value of the US Dollar is a factor in the price of Natural Gas, because if the Dollar strengthens it means less Dollars are required to buy the same volume of Gas (the price falls), and vice versa if USD strengthens.
- WTI Oil is unfolding an up leg within a falling channel.
- It is close to meeting resistance from the upper channel boundary line and the 50 SMA.
- A reversal at this point would probably lead to an extension of the downtrend and the falling channel.
WTI Oil price (OIL) has been trending lower in a channel since the beginning of April. It is in a downtrend on the 4-hour Chart which is used to analyze the short-term trend (up to 6 weeks). Given that “the trend is your friend” this is expected to continue.
More recently, WTI Oil has started a counter-trend recovery rally back up within the falling channel and is now approaching the upper (green) boundary line at roughly $76.20. The 50 Simple Moving Average (SMA) is situated nearby at $76.33. These are likely to present tough obstacles to bulls. Assuming the channel keeps its integrity they may trigger a reversal back down within the channel.
WTI Oil 4-hour Chart
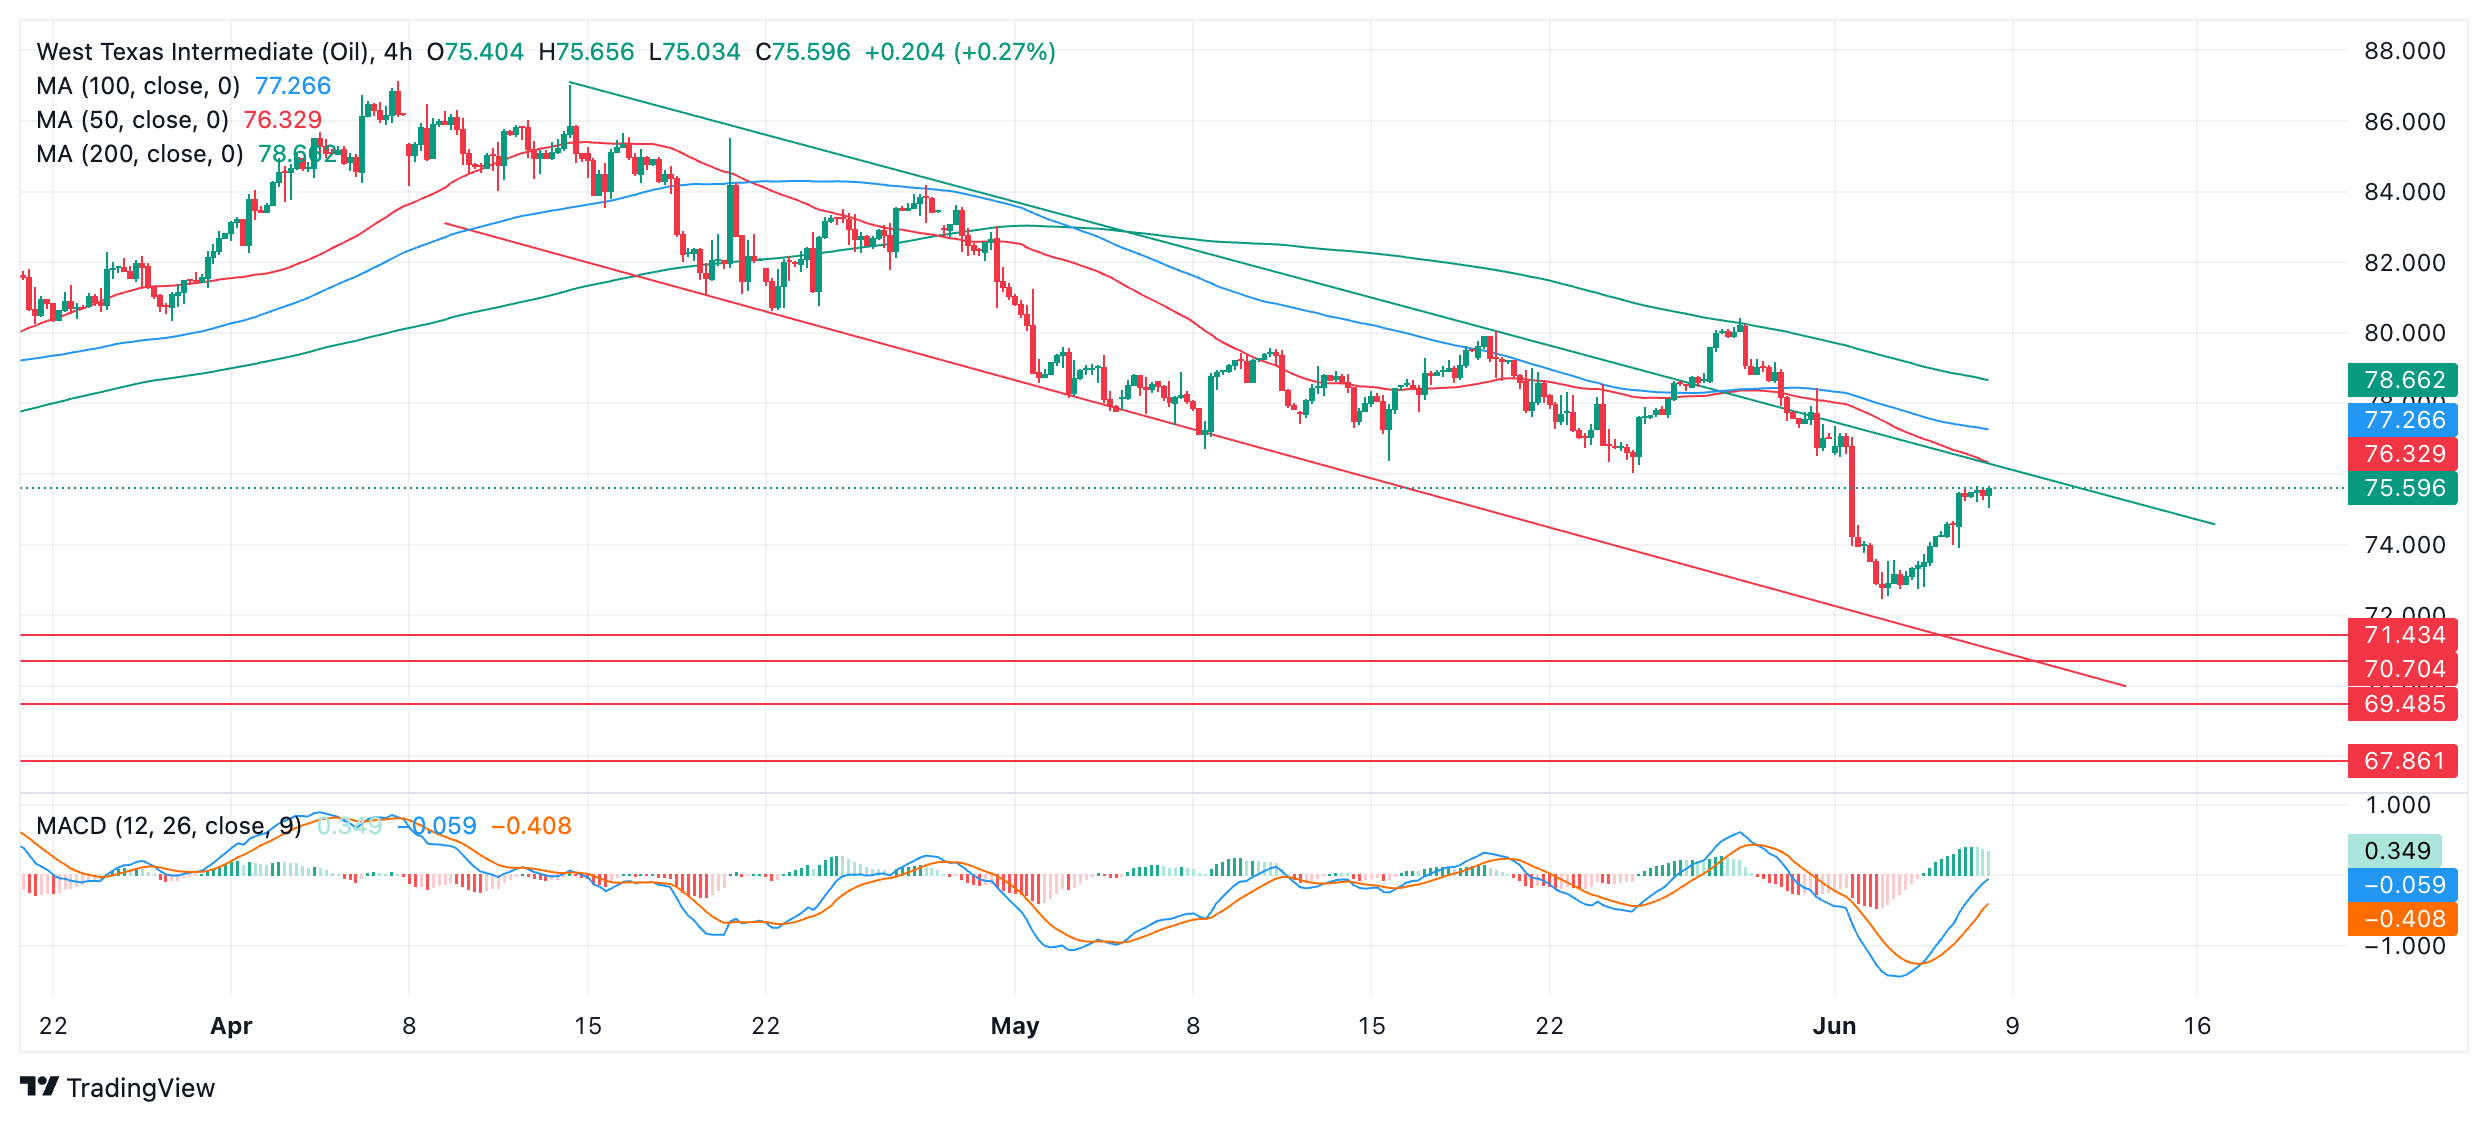
The Moving Average Convergence Divergence (MACD) indicator is in negative territory but rising, it suggests a little more upside is probably on the horizon before the next turn – probably to the aforementioned green channel line.
Key reversals in price as it moves up and down within the channel have corresponded quite reliably with the MACD crossing above and below its red signal line. If the synchronicity continues, it suggests that if price rises up to resistance from the upper channel line and then reverses down, it will be accompanied by a corresponding cross of the MACD below its signal line. Such a cross would provide supporting evidence to back up the idea of a reversal lower in line with the dominant downtrend, especially if it occurs when the MACD is above zero. A bearish candlestick reversal pattern or other similar reversal insignia would also add evidence.
If this scenario plays out, the next down leg of the channel could reach $72.46 (June 4 low) initially, followed by $71.43 (February 5 low) and then $70.70 (January 17 low).
The break above the channel line that occurred during the rally between May 24-29 was a bullish sign, however, and suggests an increased risk price could break above again.
- AUD/USD drops to near 0.6660 as investors are expected to make informed positions after the US NFP report for May.
- The Fed is expected to start reducing interest rates from September.
- Investors see the RBA holding interest rates steady by the year-end.
The AUD/USD pair falls back to 0.6660 while attempting to capture the round-level resistance of 0.6700 in Friday’s London session. The Aussie asset faces pressure as uncertainty ahead of the release of the United States Nonfarm Payrolls (NFP) report for May limits the upside in risk-perceived assets.
The market sentiment turns cautious as the US NFP report is expected to influence market expectations for the Federal Reserve (Fed) rate cuts. S&P 500 futures have turned negative after erasing entire overnight gains, indicating a decline in investors’ risk-appetite. The US Dollar Index (DXY) remains sideways near the crucial support of 104.00.
The US Employment report is expected to show that employers added 185K payrolls, higher than the prior release of 175K. The Unemployment Rate is estimated to have remained steady at 3.9%. Investors will also pay attention to the Average Hourly Earnings data, which gauges wage growth momentum. Annual Average Hourly Earnings are forecasted to have grown steadily by 3.9%. While monthly wage growth is estimated to have risen at a higher pace of 0.3% from the former release of 0.2%.
Upbeat payrolls and wage growth data would diminish hopes of the Fed lowering its interest rates from the current levels. The CME FedWatch tool shows that the Fed would choose the September meeting as the earliest point to start unwinding the restrictive interest rate stance. While soft figures would boost Fed rate-cut expectations for September.
Meanwhile, the Australian Dollar holds gains as the Reserve Bank of Australia (RBA) appears to list as those central banks that are not expected to deliver rate cuts this year. The expectations for RBA rate cuts waned after RBA Governor Michele Bullock delivered hawkish guidance on the interest rate outlook on Wednesday. Bullock indicated that the central bank is prepared to increase interest rates further if inflation doesn’t return to the target range of 1%-3%. Apart from the RBA, the Reserve Bank of New Zealand (RBNZ) is also expected to consider rolling back its tight interest-rate stance next year.
- The US Dollar trades mixed on Friday ahead of key US economic data.
- Markets are still digesting the interest rate cut from the ECB ahead of the US Employment Report.
- The US Dollar Index dips lower and already fell below 104.00 in the early Asian session.
The US Dollar (USD) edges lower on Friday but manages to hold above the 104.00 level ahead of the US Nonfarm Payrolls data for May. The Greenback struggles near weekly lows after the European Central Bank (ECB) delivered a 25 basis points interest rate cut on Thursday, setting the ECB rate on Deposit Facility to 3.75% from 4%. The fact that ECB’s officials gave no forward guidance on interest rates leaves markets feeling that it was a one-and-done, and dampens hopes for further easing.
On the economic front, besides the ECB revaluation, markets are on the lookout for the US Employment Report for May, with the Nonfarm Payrolls number, monthly wage growth and unemployment rate as three main drivers. The consensus for the Nonfarm Payrolls is an increase by 185,000 after the 175,000 seen in April. The range of views varies from 120,000 on the low end to 258,000 on the upside. Most significant market movements are expected should the number come below or above the lower and higher end of the range.
Daily digest market movers: Calm before the storm
- At 12:30 GMT, the US Employment Report for May will be released:
- Nonfarm Payrolls are expected to increase by 185,000 after the 175,000 additions in April.
- Monthly Average Hourly Earnings are expected to tick up to 0.3% in May from 02.% a month before.
- Yearly Average Hourly Earnings should remain stable at 3.9%.
- Unemployment Rate should remain unchanged at 3.9%.
- As always, a number that falls in line with expectations will not have a significant market impact, whereas a print below 120,000 or above 258,000 for the Nonfarm Payrolls figure will see a pickup in volatility.
- Equities are trading with minor losses in Asia and Europe, while US futures are gently heading into the green.
- According to the CME Fedwatch Tool, 30-day Fed Fund futures pricing data suggests a 31.8% chance of keeping rates unchanged in September, against a 55.7% chance of a 25 basis points (bps) rate cut and a 12.3% chance of an even 50 bps rate cut. For the upcoming meeting on June 12, markets are fully pricing that rates will remain at current levels.
- The benchmark 10-year US Treasury Note trades around 4.29%, near its fresh monthly low of 4.27% from Wednesday.
US Dollar Index Technical Analysis: NFP comes at a wrong time
The US Dollar Index (DXY) is flirting with a drop below the 104.00 handle. Some brief excursions below this level have already been made in the past few days, though for now, this area still sees ample amounts of buying interest. The question is how long those buyers will last, and should NFP come in under the weakest projection, something could snap.
On the upside, the DXY first faces a confluence resistance in the 200-day Simple Moving Average (SMA) and the 100-day SMA at 104.44. Further up, the pivotal level near 104.60 comes into play. For now, the topside can be seen around 105.00, with the 55-day SMA coinciding with this round number and the peak from recent weeks at 105.08.
On the downside, the 104.00 big figure looks to be holding. Once through there, another decline to 103.50 and even 103.00 are the levels to watch. With the Relative Strength Index (RSI) still not oversold, more downsides are still under consideration.
Nonfarm Payrolls FAQs
Nonfarm Payrolls (NFP) are part of the US Bureau of Labor Statistics monthly jobs report. The Nonfarm Payrolls component specifically measures the change in the number of people employed in the US during the previous month, excluding the farming industry.
The Nonfarm Payrolls figure can influence the decisions of the Federal Reserve by providing a measure of how successfully the Fed is meeting its mandate of fostering full employment and 2% inflation. A relatively high NFP figure means more people are in employment, earning more money and therefore probably spending more. A relatively low Nonfarm Payrolls’ result, on the either hand, could mean people are struggling to find work. The Fed will typically raise interest rates to combat high inflation triggered by low unemployment, and lower them to stimulate a stagnant labor market.
Nonfarm Payrolls generally have a positive correlation with the US Dollar. This means when payrolls’ figures come out higher-than-expected the USD tends to rally and vice versa when they are lower. NFPs influence the US Dollar by virtue of their impact on inflation, monetary policy expectations and interest rates. A higher NFP usually means the Federal Reserve will be more tight in its monetary policy, supporting the USD.
Nonfarm Payrolls are generally negatively-correlated with the price of Gold. This means a higher-than-expected payrolls’ figure will have a depressing effect on the Gold price and vice versa. Higher NFP generally has a positive effect on the value of the USD, and like most major commodities Gold is priced in US Dollars. If the USD gains in value, therefore, it requires less Dollars to buy an ounce of Gold. Also, higher interest rates (typically helped higher NFPs) also lessen the attractiveness of Gold as an investment compared to staying in cash, where the money will at least earn interest.
Nonfarm Payrolls is only one component within a bigger jobs report and it can be overshadowed by the other components. At times, when NFP come out higher-than-forecast, but the Average Weekly Earnings is lower than expected, the market has ignored the potentially inflationary effect of the headline result and interpreted the fall in earnings as deflationary. The Participation Rate and the Average Weekly Hours components can also influence the market reaction, but only in seldom events like the “Great Resignation” or the Global Financial Crisis.
- Silver price falls vertically to $30.50 after steady PBoC’s Gold reserves data.
- Investors should brace for more volatility ahead of the US NFP report for May.
- Growing speculation for Fed rate cuts in September has limited the US Dollar’s upside.
Silver price (XAG/USD) drops sharply to $30.50 in Friday’s European session. The white metal weakens due to multiple headwinds such as caution among investors ahead of the United States (US) Nonfarm Payrolls (NFP) data for May and unchanged China’s Gold reserves by May end from April.
The US NFP report will indicate labor market’s health of world’s largest nation, which will influence the Federal Reserve’s (Fed) interest rate outlook ahead of the policy meeting on Wednesday. According to the estimates, US employers added 185K payrolls, increased from 175K in April. Average Hourly Earnings, which is a measure of wage inflation grew by 0.3% in month from the 0.2% pace recorded for April. Annually, the wage inflation measure is estimated to have grown steadily by 3.9%.
Signs of strengthening labor market conditions would force traders to pare bets supporting rate cuts by the Fed in September, while soft figures will do the opposite.
The US Dollar Index (DXY) remains sideways around the crucial support of 104.00. This week, the USD Index remains on the backfoot as weak employment-oriented economic indicators boost expectations for Fed rate cuts in September.
Meanwhile, non-yielding assets have also come under pressure as an 18-month-long Gold buying spell by the People’s Bank of China (PBoC) appears to be concluded. The PBoC gold reserves by May end were steady at 72.80 million fine troy oz as seen in April’s report. High investment in non-yielding assets is considered optimal amid high inflation and economic uncertainty.
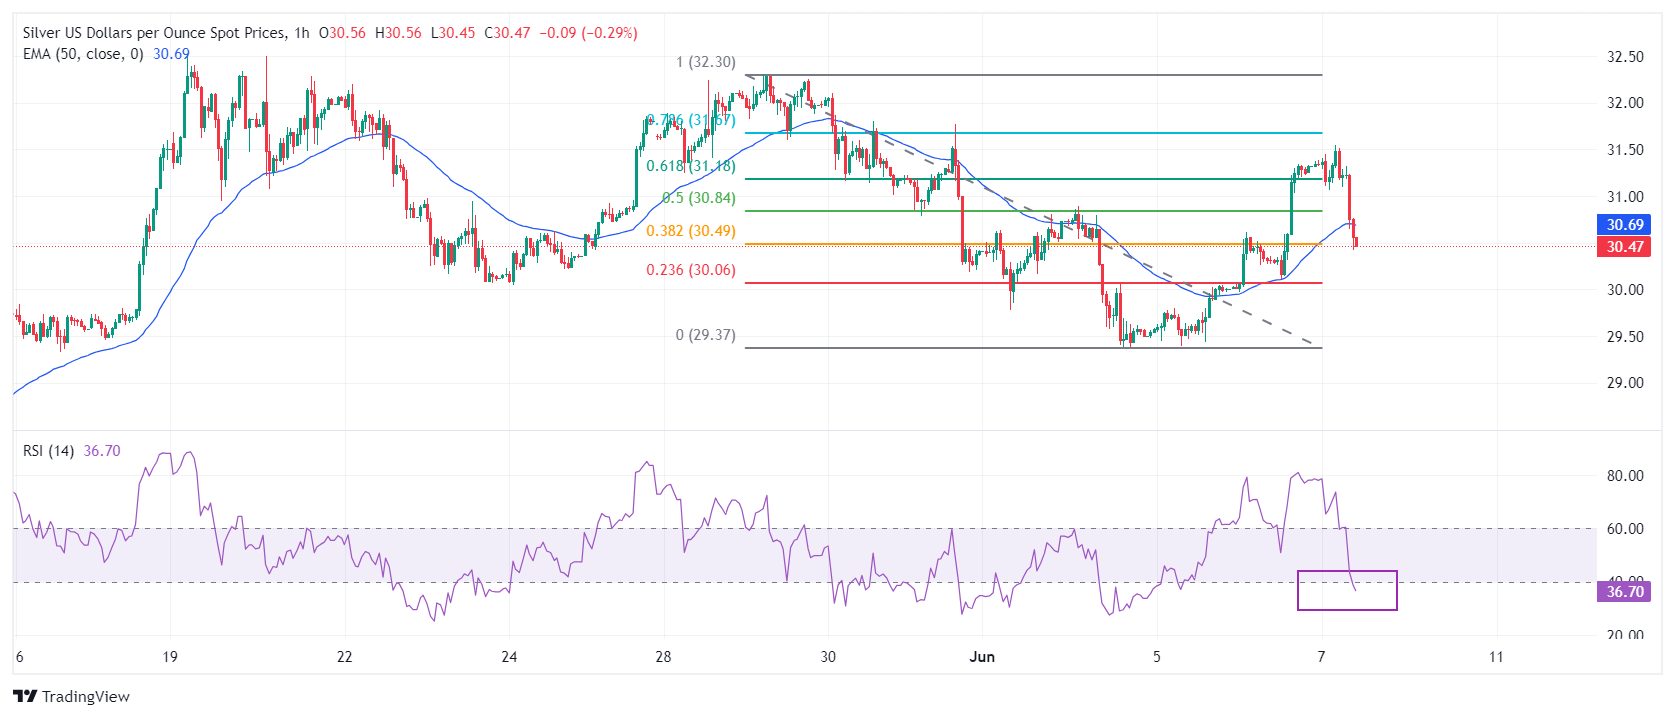
Silver technical analysis
Silver price declines after facing immense selling pressure above the 61.8% Fibonacci retracement (plotted from May 29 high at $32.30 to June 4 low near $29.40) at $31.20. Silver’s near-term outlook appears to be uncertain as spot prices have dropped below the 50-period Exponential Moving Average (EMA), which trades around $30.70.
The 14-period Relative Strength Index (RSI) has slipped below 40.00. A sustained move below the same will push the momentum towards the downside.
Silver hourly chart
- Gold price falls after data unveils PBoC reserves showed no change in May compared to April, ending 18-month buying spree.
- Central bank buying is considered a major driver of Gold price, according to World Gold Council.
- Short-term technical picture remains volatile as Gold whipsaws higher and then lower.
Gold (XAU/USD) is trading over one and a half percentage point lower in the $2,330s on Friday after the news that the People’s Bank of China (PBoC) suddenly halted its Gold purchases in May after an 18-month stretch of buying.
Gold price deflates after People’s Bank of China halts further buying
Gold is trending lower at the end of the week after the news that Gold reserves at the PBoC remained unchanged at 72.8 million troy ounces at the end of May, the exact same figure as at the end of April, according to official data from the PBoC on Friday.
The data follows strong buying in April that saw China Gold reserves at the PBoC hit an all-time high, accounting for 4.9% of total reserves, and following 18 consecutive months of growth.
Central bank buying, especially in Asia, is now a key driver of Gold price. It was probably behind the rally in 2024 which saw Gold reach a record high of $2,450 in May. According to the World Gold Council (WGC) unreported over-the-counter buying (i.e not through exchanges) by central banks was a significant driver of Gold’s strength.
“Looking at our Gold Return Attribution Model (GRAM), there was no single variable that stood out as a key driver in May,” says the WGC report for May. “Momentum and a weaker US Dollar were positive drivers but their impact was marginal. And while the unexplained component of the model shrank considerably in May, it was still the largest factor by far. As we have noted previously, we believe some of this can be attributed to strong over-the-counter buying, including central bank purchases which have been a notable contributor to recent Gold returns.”
Asian and emerging market country central banks have been hoarding Gold reserves as a hedge against the threat of devaluation of their own currencies, especially against the US Dollar (USD). The revision of interest-rate expectations by the Federal Reserve (Fed) in the spring led to a strengthening of USD, which increased the reserve-hoarding trend.
That said, a recent run of poor US data means investors are renewing bets the Fed will start cutting interest rates in September, with the probabilities at around 67%, according to the CME FedWatch tool, which bases its estimates on 30-day US Fed Fund Futures pricing data.
Additionally, at a global level, interest-rate expectations are falling. On Wednesday, the Bank of Canada (BoC) cut its overnight rate to 4.75% from 5.00% and the European Central Bank (ECB) followed the day after. The release of lower inflation data in Switzerland has now prompted speculation the Swiss National Bank (SNB) could also cut interest rates at its June 20 meeting following an earlier cut in March.
Technical Analysis: Gold breaks out of top of range, then dumps
Gold price has broken out of the top of a mini-range, stretching from roughly $2,315 to $2,358, but since reversed course and dumped. It has now fallen back inside the range.
XAU/USD 4-hour Chart
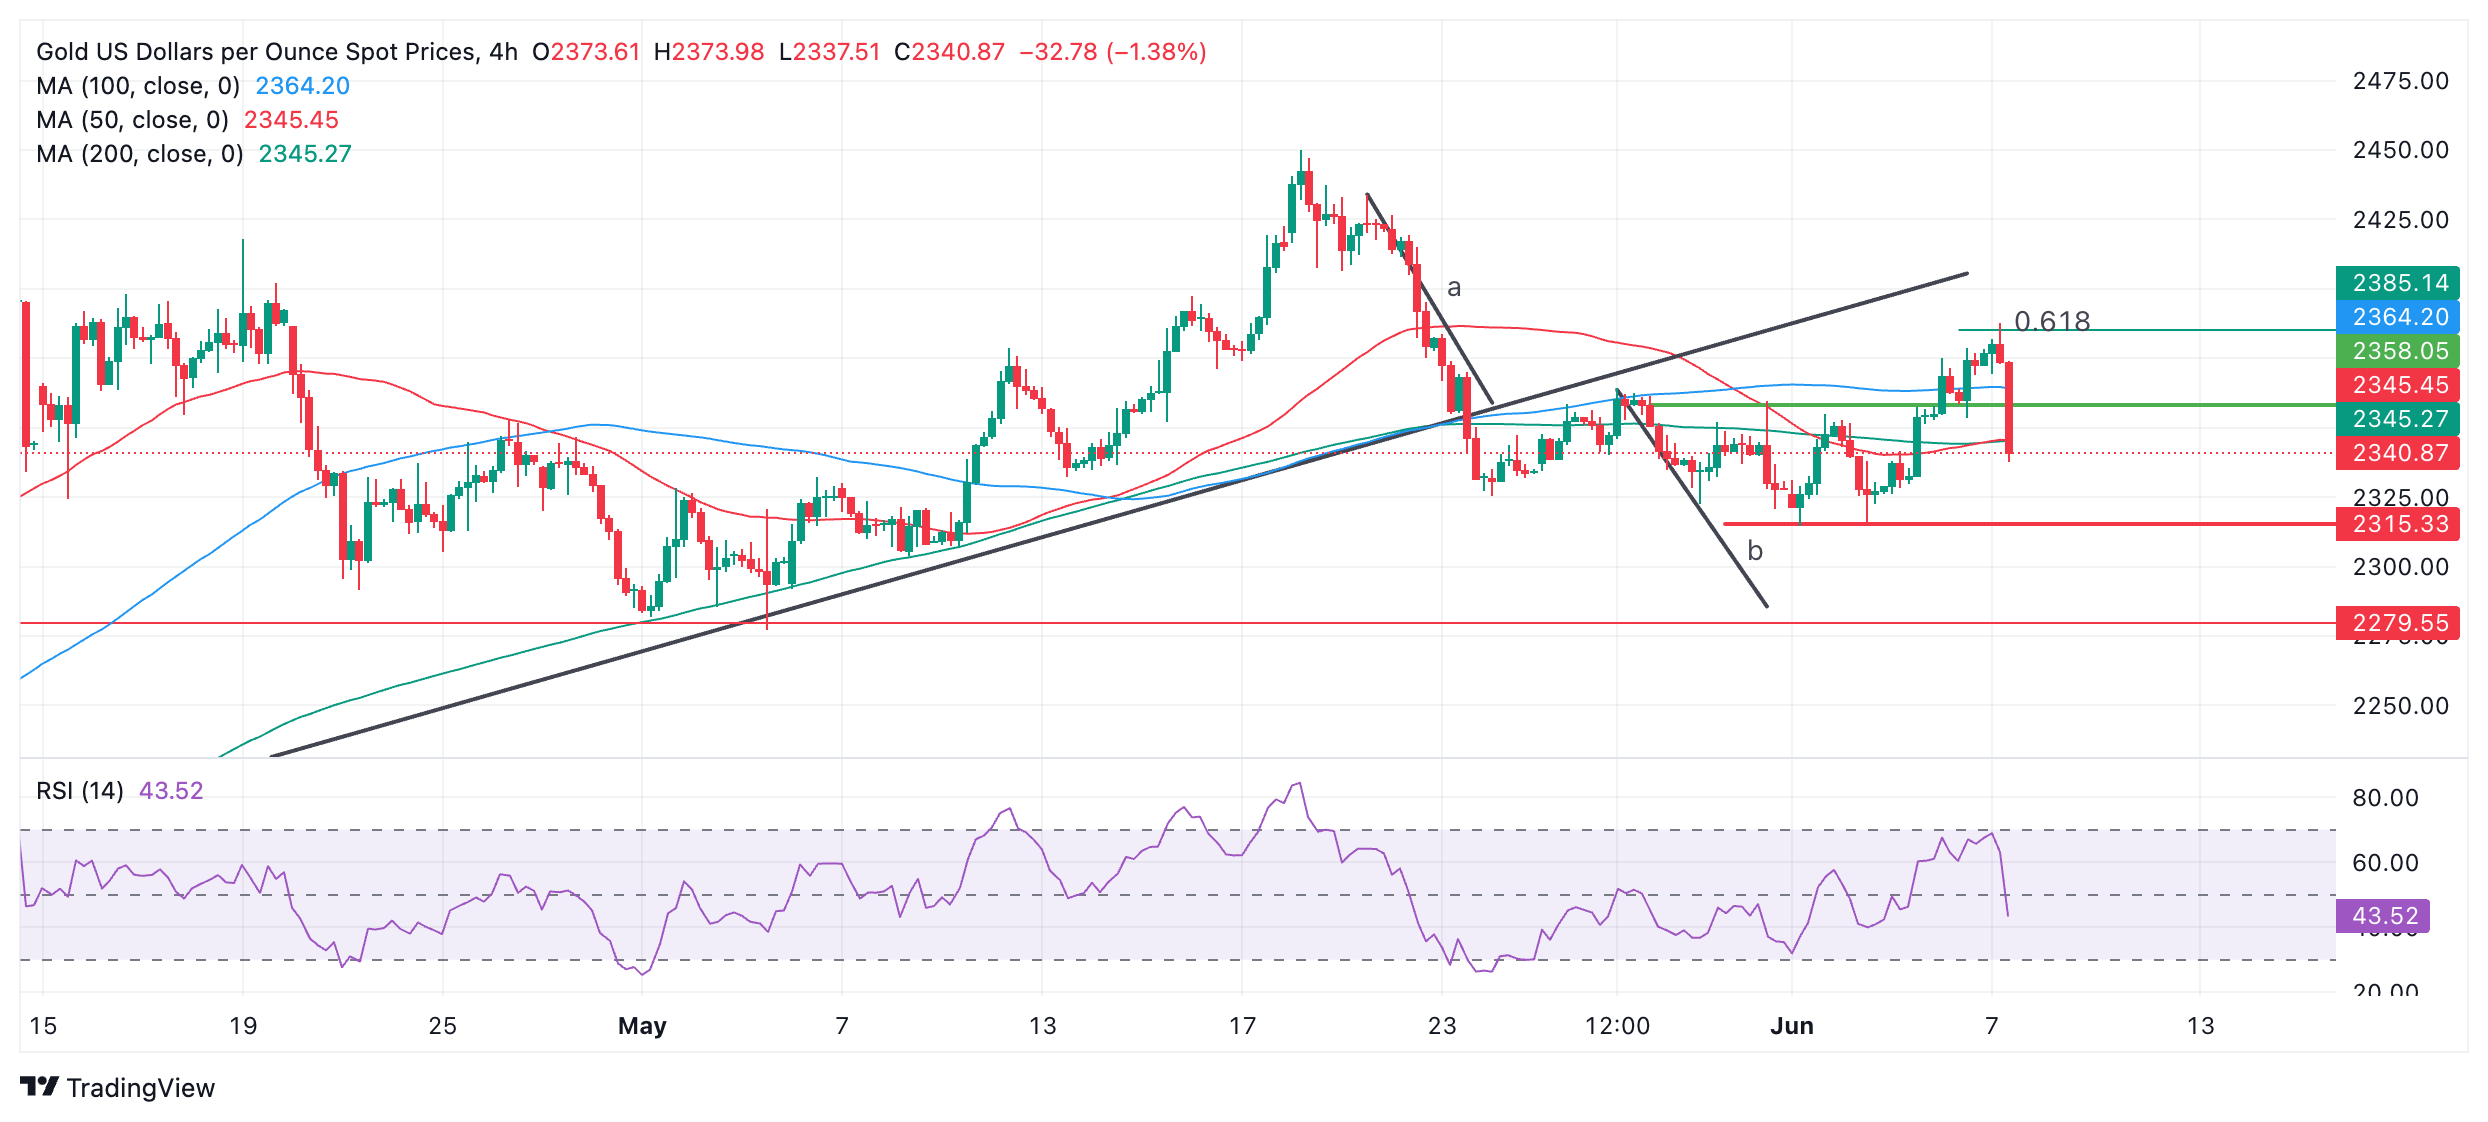
A break below the $2,315 range low would reactivate downside targets generated by the trendline break. The first target for the follow-through is at $2,303 – the 0.618 Fibonacci extrapolation of “a”. A stronger move down could even see Gold reach support at $2,279. The targets are calculated using the length of the move prior to the break as a guide.
On Thursday, Gold broke out of its mini-range and hit an initial target at $2,385, the 0.618 Fibonacci extrapolation of the height of the range from the breakout point higher, before reversing and crashing back down on Friday.
Despite the short-term weakness, the precious metal’s medium and long-term trends are still bullish, and the risk of a recovery remains high.
Gold FAQs
Gold has played a key role in human’s history as it has been widely used as a store of value and medium of exchange. Currently, apart from its shine and usage for jewelry, the precious metal is widely seen as a safe-haven asset, meaning that it is considered a good investment during turbulent times. Gold is also widely seen as a hedge against inflation and against depreciating currencies as it doesn’t rely on any specific issuer or government.
Central banks are the biggest Gold holders. In their aim to support their currencies in turbulent times, central banks tend to diversify their reserves and buy Gold to improve the perceived strength of the economy and the currency. High Gold reserves can be a source of trust for a country’s solvency. Central banks added 1,136 tonnes of Gold worth around $70 billion to their reserves in 2022, according to data from the World Gold Council. This is the highest yearly purchase since records began. Central banks from emerging economies such as China, India and Turkey are quickly increasing their Gold reserves.
Gold has an inverse correlation with the US Dollar and US Treasuries, which are both major reserve and safe-haven assets. When the Dollar depreciates, Gold tends to rise, enabling investors and central banks to diversify their assets in turbulent times. Gold is also inversely correlated with risk assets. A rally in the stock market tends to weaken Gold price, while sell-offs in riskier markets tend to favor the precious metal.
The price can move due to a wide range of factors. Geopolitical instability or fears of a deep recession can quickly make Gold price escalate due to its safe-haven status. As a yield-less asset, Gold tends to rise with lower interest rates, while higher cost of money usually weighs down on the yellow metal. Still, most moves depend on how the US Dollar (USD) behaves as the asset is priced in dollars (XAU/USD). A strong Dollar tends to keep the price of Gold controlled, whereas a weaker Dollar is likely to push Gold prices up.
- EUR/USD trades back and forth near 1.0900 ahead of US NFP data for May.
- The US NFP will indicate whether labor market conditions have started normalizing.
- The ECB commenced its policy easing campaign but refrained from committing to a predefined interest-rate path.
EUR/USD trades sideways near 1.0900 in Friday’s European session. The major currency pair remains broadly steady as traders stay on the sidelines ahead of the United States Nonfarm Payrolls (NFP) data for May, which will be published at 12:30 GMT.
According to the estimates, US employers added 185K payrolls, lower than the 175K increase seen in April. The Unemployment Rate is estimated to have remained stable at 3.9%. Higher-than-expected payroll numbers would likely clear doubts about easing labor demand after recent employment-oriented indicators have suggested that the jobs market is loosening.
The JOLTS Job Openings data for April and ADP Employment Change for May came in weaker than expected. Also, Initial Jobless Claims for the week ending May 31 were higher than estimates, suggesting that some heat has been released from the labor market.
Investors will also pay close attention to the Average Hourly Earnings, which measures wage inflation. On a month-on-month basis, the reading is expected to have ticked up by 0.3% from 0.2%. The annual reading is estimated to have risen steadily by 3.9%.
Daily digest market movers: EUR/USD consolidates as investors seek fresh guidance on ECB’s interest rates
- EUR/USD remains subdued around 1.0900 amid uncertainty ahead of the US Employment data and amid doubts over the European Central Bank’s (ECB) interest-rate path. The bank opted on Thursday to cut interest rates by 25 basis points (bps) as expected.
- The ECB reduced its key borrowing rates for the first time since 2019 as officials were confident over progress in inflation declining towards the desired rate of 2%. However, ECB President Christine Lagarde refused to commit to any specific interest-rate path, saying that the battle against inflation is far from over and price pressures are expected to stay around current levels this year. The ECB will remain data-dependent, she said.
- The latest inflation projections by the ECB staff indicate that the Eurozone's annual core inflation will average 2.8% in 2024, 2.2% in 2025, and 2.0% in 2026, slightly up from the previous forecasts.
- The ECB was expected to remain data-dependent, as the recent Eurozone’s Harmonized Index of Consumer Prices (HICP) report showed that annual headline and core inflation grew more than expected, while economic growth in Q1 was also stronger at 0.3%. This showed that the technical recession in the second half of 2023 was shallow.
- The US NFP data will provide cues about whether the Fed will start reducing interest rates in September. The Fed is managing policy to ensure that inflation returns sustainably to 2% while maintaining full employment. Recently, weak employment-related economic indicators boosted expectations for the Fed to cut rates in September.
- The CME FedWatch tool shows that traders see a 68% chance of rate cuts in September, significantly up from the 54.5% recorded a week ago.
Technical Analysis: EUR/USD trades sideways near 1.0900
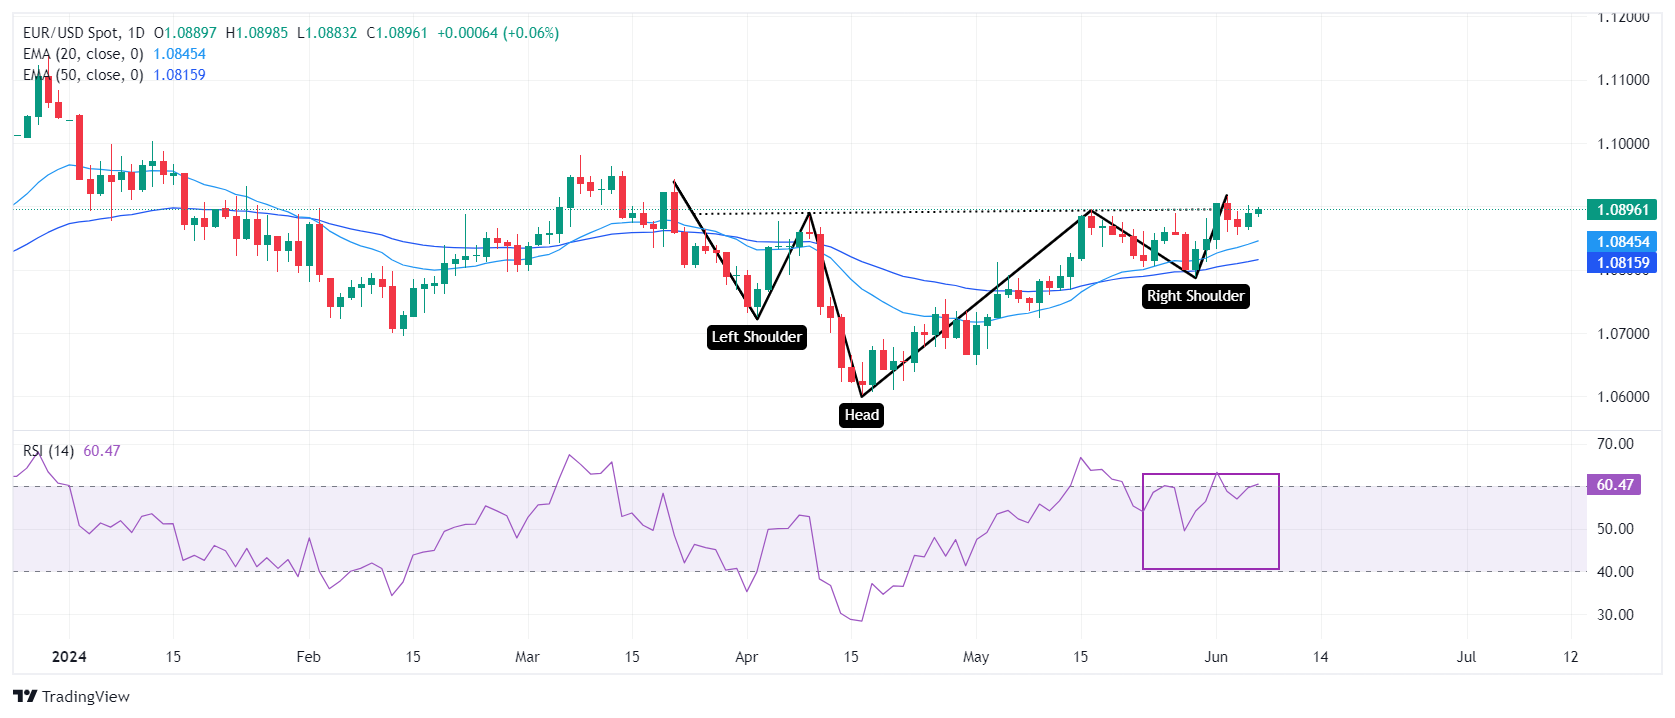
EUR/USD stays quiet near 1.0900 ahead of the US NFP data, trading inside Thursday’s range. The major currency pair trades near the neckline of the Inverted Head and Shoulder (H&S) pattern, which is marked from April 9 high at 1.0885. A breakout of this pattern could result in a bullish reversal.
The near-term outlook remains firm due to a golden cross formation, a bullish crossover of the 50-day and 200-day Exponential Moving Averages (EMAs) near 1.0800.
The 14-period Relative Strength Index (RSI) recovers to 60.00. A decisive move above the same would push the momentum towards the upside.
Looking up, the major currency pair is expected to extend gains towards the March 21 high at around 1.0950 and the psychological resistance of 1.1000 if it decisively breaks above the round-level resistance of 1.0900. However, a downside move below the 200-day EMA at 1.0800 could push it into a bearish trajectory.
`
Euro FAQs
The Euro is the currency for the 20 European Union countries that belong to the Eurozone. It is the second most heavily traded currency in the world behind the US Dollar. In 2022, it accounted for 31% of all foreign exchange transactions, with an average daily turnover of over $2.2 trillion a day. EUR/USD is the most heavily traded currency pair in the world, accounting for an estimated 30% off all transactions, followed by EUR/JPY (4%), EUR/GBP (3%) and EUR/AUD (2%).
The European Central Bank (ECB) in Frankfurt, Germany, is the reserve bank for the Eurozone. The ECB sets interest rates and manages monetary policy. The ECB’s primary mandate is to maintain price stability, which means either controlling inflation or stimulating growth. Its primary tool is the raising or lowering of interest rates. Relatively high interest rates – or the expectation of higher rates – will usually benefit the Euro and vice versa. The ECB Governing Council makes monetary policy decisions at meetings held eight times a year. Decisions are made by heads of the Eurozone national banks and six permanent members, including the President of the ECB, Christine Lagarde.
Eurozone inflation data, measured by the Harmonized Index of Consumer Prices (HICP), is an important econometric for the Euro. If inflation rises more than expected, especially if above the ECB’s 2% target, it obliges the ECB to raise interest rates to bring it back under control. Relatively high interest rates compared to its counterparts will usually benefit the Euro, as it makes the region more attractive as a place for global investors to park their money.
Data releases gauge the health of the economy and can impact on the Euro. Indicators such as GDP, Manufacturing and Services PMIs, employment, and consumer sentiment surveys can all influence the direction of the single currency. A strong economy is good for the Euro. Not only does it attract more foreign investment but it may encourage the ECB to put up interest rates, which will directly strengthen the Euro. Otherwise, if economic data is weak, the Euro is likely to fall. Economic data for the four largest economies in the euro area (Germany, France, Italy and Spain) are especially significant, as they account for 75% of the Eurozone’s economy.
Another significant data release for the Euro is the Trade Balance. This indicator measures the difference between what a country earns from its exports and what it spends on imports over a given period. If a country produces highly sought after exports then its currency will gain in value purely from the extra demand created from foreign buyers seeking to purchase these goods. Therefore, a positive net Trade Balance strengthens a currency and vice versa for a negative balance.
- The Mexican Peso declined on Thursday as a result of investor concerns regarding reforms the government wants to push through.
- Critics say they are anti-democratic and market-negative.
- USD/MXN renews its uptrend after a steep correction midweek.
The Mexican Peso (MXN) pauses its decline on Friday after another bout of selling since the beginning of the week, sparked by investor fears regarding the market impact of radical changes to the Mexican constitution proposed by the country’s recently-re-elected left-wing administration.
USD/MXN is exchanging hands at 17.88 at the time of writing, EUR/MXN is trading at 19.47 and GBP/MXN at 22.86.
Mexican Peso weakens again due to politics
The Mexican Peso’s renewed bout of weakness started following comments from the head of the ruling Morean party in Congress, Ignacio Mier, who said on Thursday that he would be submitting controversial constitutional reforms to a discussion and vote in Congress. The reforms were proposed by outgoing president Andres Manuel Lopez Obrador (AMLO) back in February. Critics say they are anti-democratic and market-unfriendly.
Sunday’s elections saw AMLO’s protege, President-elect Claudia Sheinbaum and her Morena party win a landslide victory. Although not all the votes have been counted yet, it looks like the party has probably won a supermajority (over two-thirds) in the Congress and also possibly in the Senate. If so, this would give it the power to push through AMLO’s radical reforms.
The Peso lost 5% on Monday and Tuesday as early estimates showed the scale of the victory. Midweek it found a floor and recovered after the Mexican Finance Minister tried to reassure investors the government would continue to act with fiscal discipline and be pro-investment. Mier’s comments late Thursday, however, renewed concerns about the proposed constitutional changes.
On the data front, meanwhile, Mexican Auto Exports rose 13.0% year-over-year in May, while Auto Production rose 4.9% for the same period; this was lower than April's 14.4% for exports and 21.7% for production, according to data from INEGI.
Technical Analysis: USD/MXN resumes uptrend
USD/MXN – the value of one US Dollar in Mexican Pesos – resumed its uptrend bias on Thursday and is currently trading back up in the 17.80s. This comes after a decline to a low in the 17.40s on Wednesday.
USD/MXN 4-hour Chart
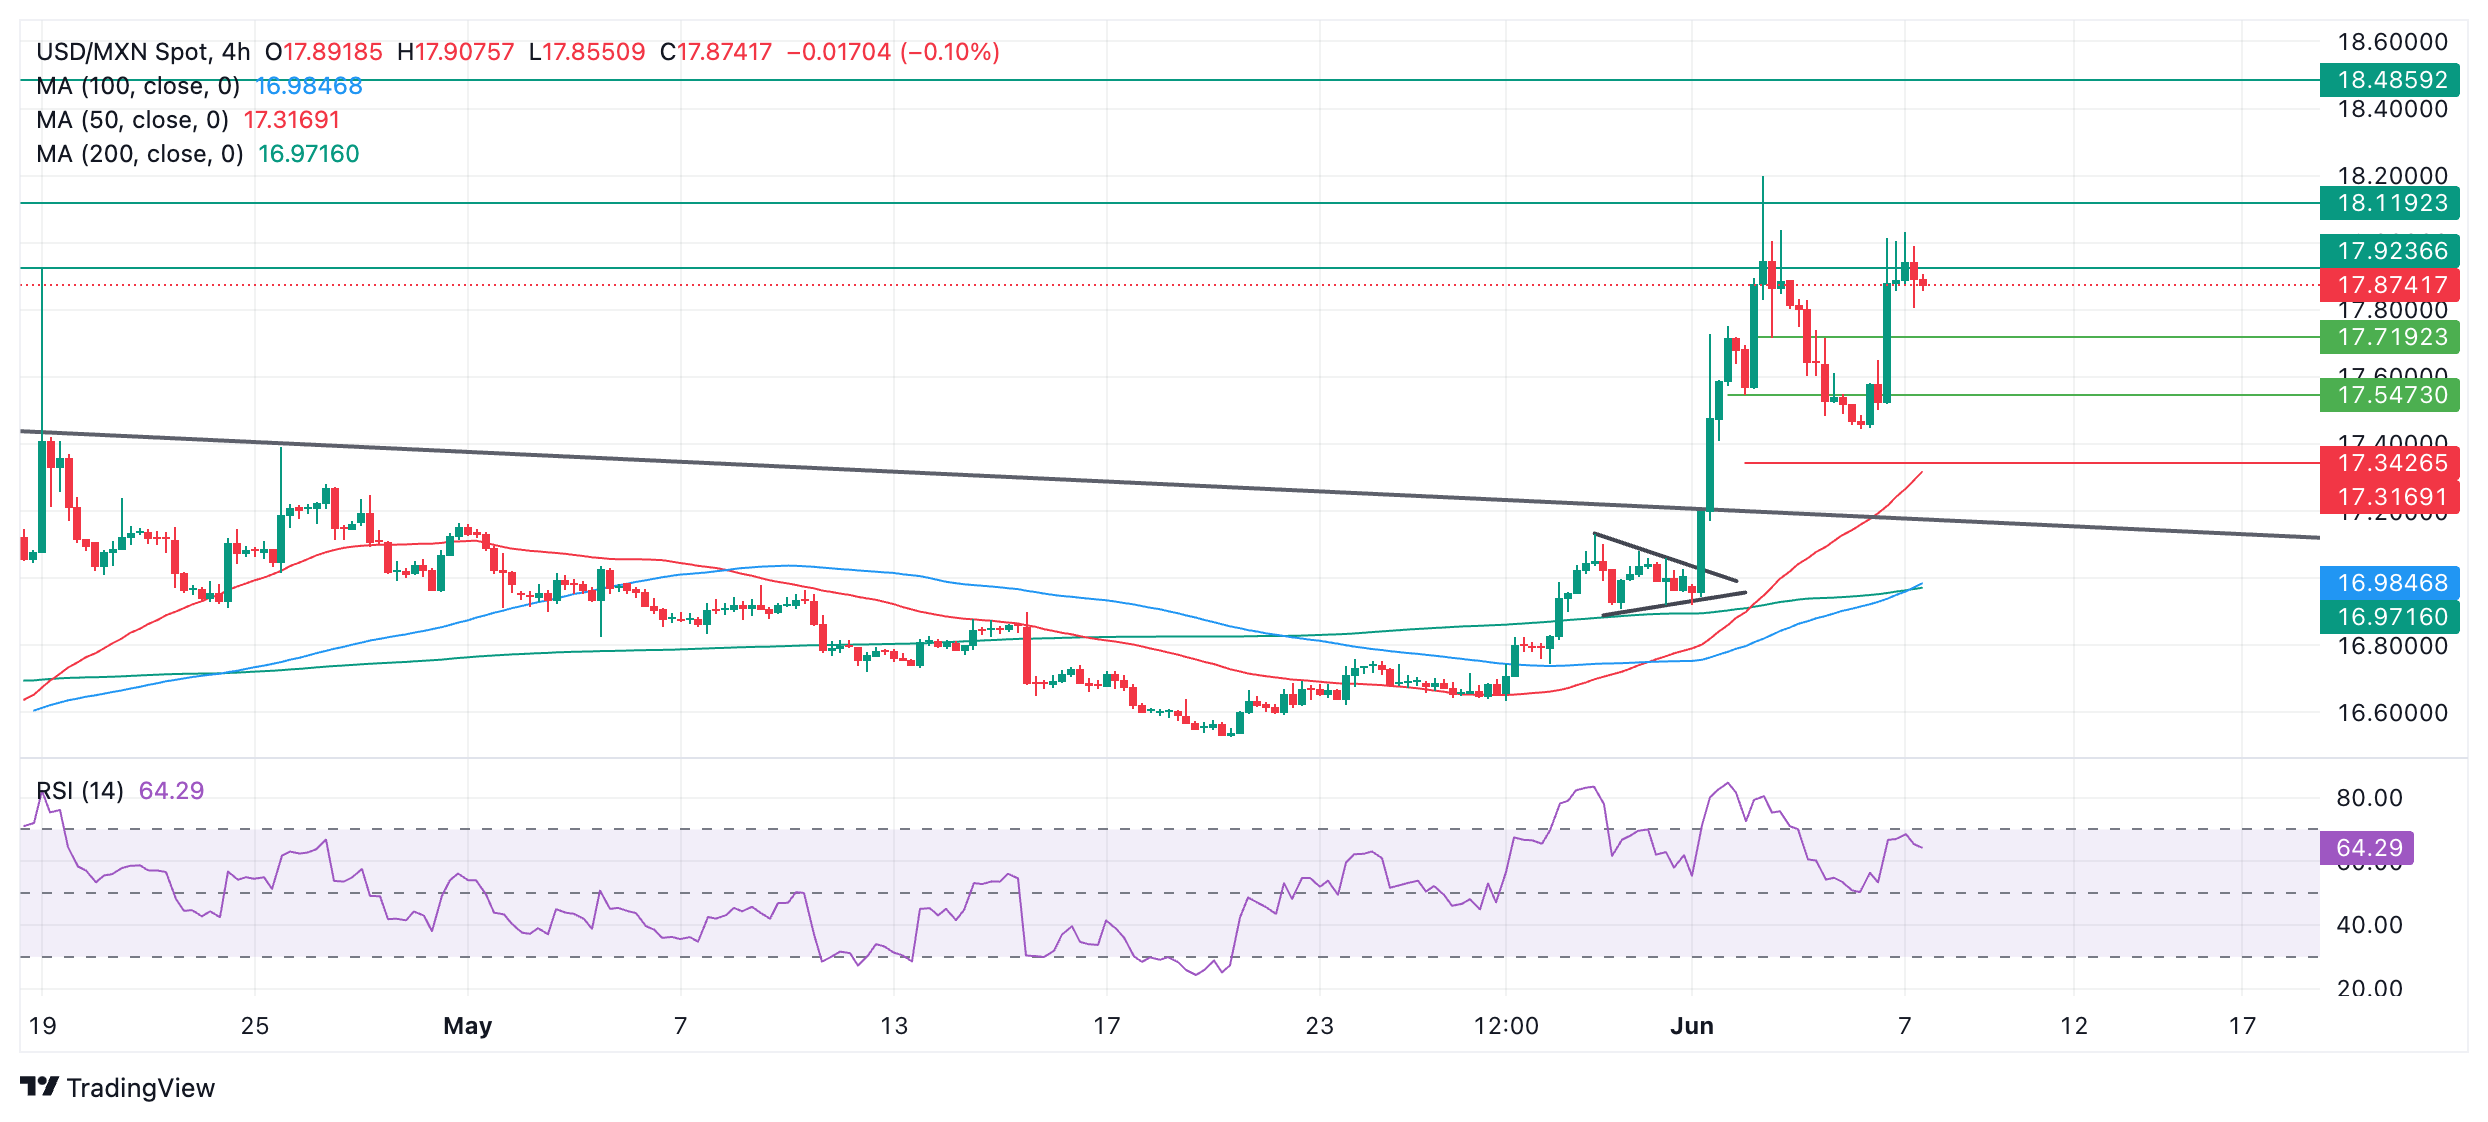
The recovery suggests the short and intermediate-term trends are still bullish, and given that “the trend is your friend”, the odds favor a continuation higher. The fact that bulls have managed to push the price above 17.54 (the last higher low) and another key level at 17.72 marks key victories and indicates lessening bearish pressure.
The pair is now close to touching resistance at 18.20, the June 4 high. A break above that level would add confirmation of a continuation higher to the next target at 18.49 (October 2023 high).
The long-term trend is probably still bearish, suggesting moderate background risks continue.
Mexican Peso FAQs
The Mexican Peso (MXN) is the most traded currency among its Latin American peers. Its value is broadly determined by the performance of the Mexican economy, the country’s central bank’s policy, the amount of foreign investment in the country and even the levels of remittances sent by Mexicans who live abroad, particularly in the United States. Geopolitical trends can also move MXN: for example, the process of nearshoring – or the decision by some firms to relocate manufacturing capacity and supply chains closer to their home countries – is also seen as a catalyst for the Mexican currency as the country is considered a key manufacturing hub in the American continent. Another catalyst for MXN is Oil prices as Mexico is a key exporter of the commodity.
The main objective of Mexico’s central bank, also known as Banxico, is to maintain inflation at low and stable levels (at or close to its target of 3%, the midpoint in a tolerance band of between 2% and 4%). To this end, the bank sets an appropriate level of interest rates. When inflation is too high, Banxico will attempt to tame it by raising interest rates, making it more expensive for households and businesses to borrow money, thus cooling demand and the overall economy. Higher interest rates are generally positive for the Mexican Peso (MXN) as they lead to higher yields, making the country a more attractive place for investors. On the contrary, lower interest rates tend to weaken MXN.
Macroeconomic data releases are key to assess the state of the economy and can have an impact on the Mexican Peso (MXN) valuation. A strong Mexican economy, based on high economic growth, low unemployment and high confidence is good for MXN. Not only does it attract more foreign investment but it may encourage the Bank of Mexico (Banxico) to increase interest rates, particularly if this strength comes together with elevated inflation. However, if economic data is weak, MXN is likely to depreciate.
As an emerging-market currency, the Mexican Peso (MXN) tends to strive during risk-on periods, or when investors perceive that broader market risks are low and thus are eager to engage with investments that carry a higher risk. Conversely, MXN tends to weaken at times of market turbulence or economic uncertainty as investors tend to sell higher-risk assets and flee to the more-stable safe havens.
European Central Bank (ECB) policymaker Robert Holzmann commented on being the only dissenter at the June monetary policy meeting.
Key quotes
I was the only one against a rate cut.
Seeing it as a hawkish cut suggests that we will act more cautiously moving forward.
See little risk of a second wave of inflation.
But inflation is stickier than expected.
Hopefully the future will be data-driven.
Market reaction
EUR/USD was last seen trading flat at 1.0890, unmoved by these above comments.
Euro FAQs
The Euro is the currency for the 20 European Union countries that belong to the Eurozone. It is the second most heavily traded currency in the world behind the US Dollar. In 2022, it accounted for 31% of all foreign exchange transactions, with an average daily turnover of over $2.2 trillion a day. EUR/USD is the most heavily traded currency pair in the world, accounting for an estimated 30% off all transactions, followed by EUR/JPY (4%), EUR/GBP (3%) and EUR/AUD (2%).
The European Central Bank (ECB) in Frankfurt, Germany, is the reserve bank for the Eurozone. The ECB sets interest rates and manages monetary policy. The ECB’s primary mandate is to maintain price stability, which means either controlling inflation or stimulating growth. Its primary tool is the raising or lowering of interest rates. Relatively high interest rates – or the expectation of higher rates – will usually benefit the Euro and vice versa. The ECB Governing Council makes monetary policy decisions at meetings held eight times a year. Decisions are made by heads of the Eurozone national banks and six permanent members, including the President of the ECB, Christine Lagarde.
Eurozone inflation data, measured by the Harmonized Index of Consumer Prices (HICP), is an important econometric for the Euro. If inflation rises more than expected, especially if above the ECB’s 2% target, it obliges the ECB to raise interest rates to bring it back under control. Relatively high interest rates compared to its counterparts will usually benefit the Euro, as it makes the region more attractive as a place for global investors to park their money.
Data releases gauge the health of the economy and can impact on the Euro. Indicators such as GDP, Manufacturing and Services PMIs, employment, and consumer sentiment surveys can all influence the direction of the single currency. A strong economy is good for the Euro. Not only does it attract more foreign investment but it may encourage the ECB to put up interest rates, which will directly strengthen the Euro. Otherwise, if economic data is weak, the Euro is likely to fall. Economic data for the four largest economies in the euro area (Germany, France, Italy and Spain) are especially significant, as they account for 75% of the Eurozone’s economy.
Another significant data release for the Euro is the Trade Balance. This indicator measures the difference between what a country earns from its exports and what it spends on imports over a given period. If a country produces highly sought after exports then its currency will gain in value purely from the extra demand created from foreign buyers seeking to purchase these goods. Therefore, a positive net Trade Balance strengthens a currency and vice versa for a negative balance.
- GBP/JPY depreciated as Japan’s Suzuki mentioned taking action against excessive currency volatility if needed.
- Japan's foreign exchange reserves declined to $1,231 billion in May, reaching their lowest level since February 2023.
- The slower progress in the disinflation process diminishes the likelihood of multiple BoE rate cuts this year.
GBP/JPY extended losses for the second consecutive day, trading around 198.70 during the European hours on Friday. The GBP/JPY cross faced pressure following hawkish comments from Japanese Finance Minister Shunichi Suzuki.
Minister Suzuki stated that he would take action against excessive currency volatility when necessary and would assess the effectiveness of interventions. Suzuki also emphasized the importance of maintaining market trust in public finances and mentioned that there is no fund limit for FX intervention, according to Reuters.
However, the advance of the Japanese Yen (JPY) could have been limited as Japan’s Foreign Reserves, released by the Ministry of Finance for May, showed a significant drop to $1,231 billion from $1,279 billion. This marked the lowest level since February 2023, as the government conducted foreign exchange intervention operations to defend the JPY.
In the United Kingdom (UK), Halifax House Prices (YoY) increased by 1.5% in May, marking the sixth consecutive month of growth and accelerating from a 1.1% rise in April, exceeding forecasts of 1.2%. Traders will likely to focus on the employment data for the February-April period, which will be released on Tuesday.
The UK's number of employed people has declined for three consecutive periods. Indications of further layoffs could negatively impact the Pound Sterling (GBP), as it would increase traders' expectations for early rate cuts by the Bank of England (BoE).
Although UK annual headline inflation dropped significantly to 2.3% in April. BoE policymakers remain concerned about the slower progress in the disinflation process within the services sector, reducing the likelihood of multiple BoE rate cuts this year.
Silver prices (XAG/USD) fell on Friday, according to FXStreet data. Silver trades at $30.81 per troy ounce, down 1.62% from the $31.32 it cost on Thursday.
Silver prices have increased by 20.97% since the beginning of the year.
| Unit measure | Today Price |
|---|---|
| Silver price per troy ounce | $30.81 |
| Silver price per gram | $0.99 |
The Gold/Silver ratio, which shows the number of troy ounces of Silver needed to equal the value of one troy ounce of Gold, stood at 76.26 on Friday, up from 75.86 on Thursday.
Investors might use this ratio to determine the relative valuation of Gold and Silver. Some may consider a high ratio as an indicator that Silver is undervalued – or Gold is overvalued – and might buy Silver or sell Gold accordingly. Conversely, a low ratio might suggest that Gold is undervalued relative to Silver.
Silver FAQs
Silver is a precious metal highly traded among investors. It has been historically used as a store of value and a medium of exchange. Although less popular than Gold, traders may turn to Silver to diversify their investment portfolio, for its intrinsic value or as a potential hedge during high-inflation periods. Investors can buy physical Silver, in coins or in bars, or trade it through vehicles such as Exchange Traded Funds, which track its price on international markets.
Silver prices can move due to a wide range of factors. Geopolitical instability or fears of a deep recession can make Silver price escalate due to its safe-haven status, although to a lesser extent than Gold's. As a yieldless asset, Silver tends to rise with lower interest rates. Its moves also depend on how the US Dollar (USD) behaves as the asset is priced in dollars (XAG/USD). A strong Dollar tends to keep the price of Silver at bay, whereas a weaker Dollar is likely to propel prices up. Other factors such as investment demand, mining supply – Silver is much more abundant than Gold – and recycling rates can also affect prices.
Silver is widely used in industry, particularly in sectors such as electronics or solar energy, as it has one of the highest electric conductivity of all metals – more than Copper and Gold. A surge in demand can increase prices, while a decline tends to lower them. Dynamics in the US, Chinese and Indian economies can also contribute to price swings: for the US and particularly China, their big industrial sectors use Silver in various processes; in India, consumers’ demand for the precious metal for jewellery also plays a key role in setting prices.
Silver prices tend to follow Gold's moves. When Gold prices rise, Silver typically follows suit, as their status as safe-haven assets is similar. The Gold/Silver ratio, which shows the number of ounces of Silver needed to equal the value of one ounce of Gold, may help to determine the relative valuation between both metals. Some investors may consider a high ratio as an indicator that Silver is undervalued, or Gold is overvalued. On the contrary, a low ratio might suggest that Gold is undervalued relative to Silver.
(An automation tool was used in creating this post.)
European Central Bank (ECB) policymaker Isabel Schnabel said on Friday that “we cannot pre-commit to a particular rate path.”
“The future inflation outlook remains uncertain,” she added.
Market reaction
EUR/USD is keeping its range play intact near 1.0900, almost unchanged on the day.
- USD/CAD move sideways within a horizontal channel pattern.
- The technical indicator MACD suggests an emergence of a bullish bias.
- The psychological level of 1.3700 appears as the key resistance level.
USD/CAD retraces its recent losses, trading around 1.3670 during the early European hours on Friday. Analysis of the daily chart suggests a sideways direction for the USD/CAD pair, as it remains within a horizontal channel pattern.
However, the momentum indicator 14-day Relative Strength Index (RSI) is positioned at the 50 level, and further movement may indicate a clear direction.
Additionally, the Moving Average Convergence Divergence (MACD) indicator suggests an emergence of the bullish bias for the USD/CAD pair. While the MACD line is positioned above the centerline, it shows divergence above the signal line.
On the upside, the USD/CAD pair could find the key barrier at the psychological level of 1.3700. A breakthrough above this level could provide support for the pair to test the upper boundary of the horizontal channel around the level of 1.3720, followed by the pullback resistance at 1.3740.
A surpassing of the latter could lead the USD/CAD pair to explore the region around the key level of 1.3800, followed by April’s high of 1.3846.
On the downside, the USD/CAD pair could find key support around the lower threshold of the horizontal channel around the psychological level of 1.3600, aligned with the throwback support at 1.3590.
USD/CAD: Daily Chart
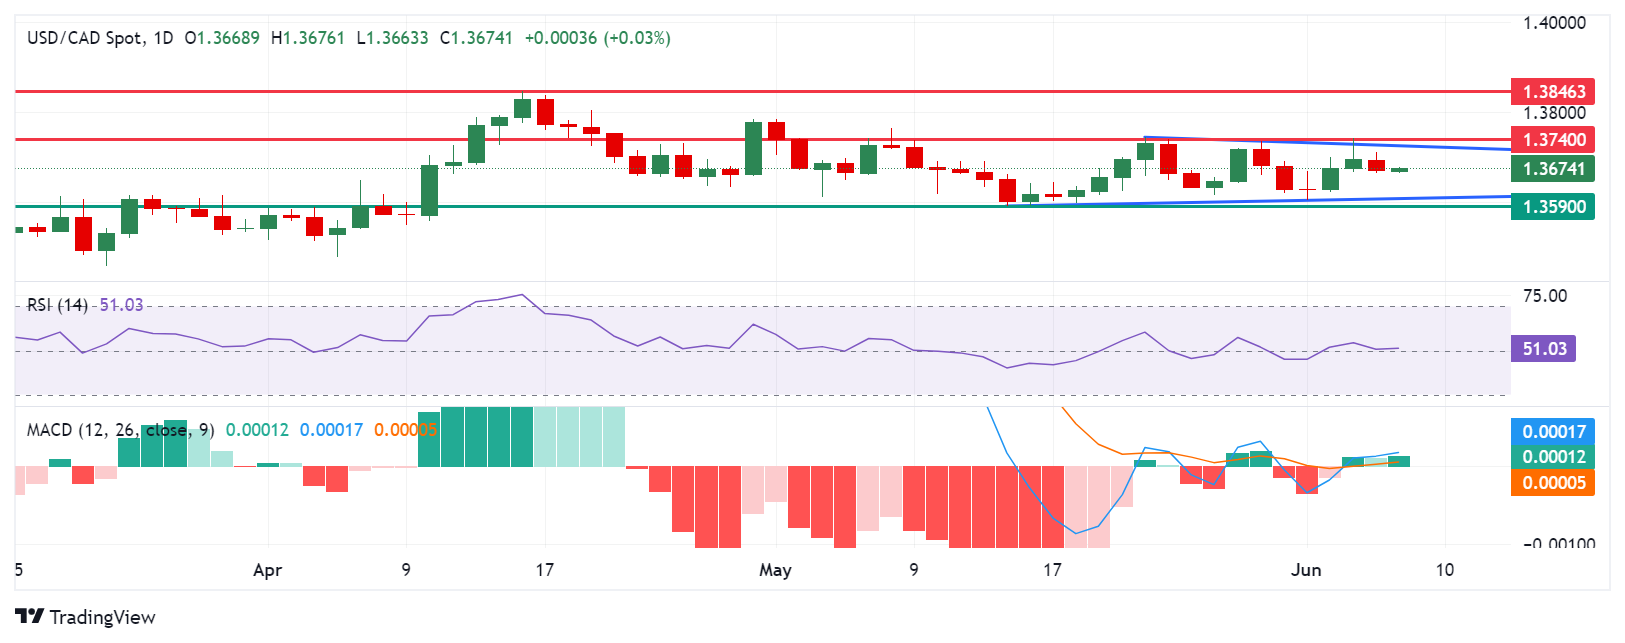
- NZD/USD clings to gains near 0.6200 ahead of US NFP report for May.
- The US Employment data will influence Fed rate-cut bets for September.
- The New Zealand Dollar strengthens amid speculation that the RBNZ will start reducing interest rates next year.
The NZD/USD pair trades inside Thursday’s trading range in Friday’s European session. The Kiwi asset clings to gains near the round-level resistance of 0.6200 amid hopes of interest rate differentials as the Reserve Bank of New Zealand (RBNZ) is expected to keep interest rates steady for the entire year while the Federal Reserve (Fed) is expected to deliver two rate cuts. Investors expect that the September meeting will be the earliest point from which the Fed will commence its policy normalization process.
The New Zealand Dollar has also capitalized on cheerful market mood. However, the market sentiment could become uncertain after the release of the United States (US) Nonfarm Payrolls (NFP) report for May, which will be published at 12:30 GMT. The US NFP report is expected to show that 185K fresh payrolls were added by employers, which were higher than the prior release of 185K.
Investors will also pay attention to the Average Hourly Earnings data for May, which exhibits the pace of the wage growth momentum. Annually, Average Hourly Earnings are estimated to have grown steadily by 3.9%. The US official Employment data that reflects country’s labor market health will significantly influence expectations for Fed interest-rate cuts in September.
NZD/USD rises to the horizontal resistance plotted from February 22 high at 0.6219. The Kiwi asset trades in a Rising Channel chart pattern in which each pullback is considered as buying opportunity by market participants. Upward-sloping 20-and 50-day Exponential Moving Averages (EMAs) near 0.6127 and 0.6079, respectively, suggest that the overall trend is quite bullish.
The 14-period Relative Strength Index (RSI) oscillates in the bullish range of 60.00-80.00, which indicates that momentum has leaned towards the upside.
An upside move above June 6 high at 0.6216 will drive the asset January 15 high near 0.6250, followed by January 12 high near 0.6280.
On the contrary, fresh downside would appear if the asset breaks below April 4 high around 0.6050. This would drag the asset towards the psychological support of 0.6000 and April 25 high at 0.5969.
NZD/USD daily chart
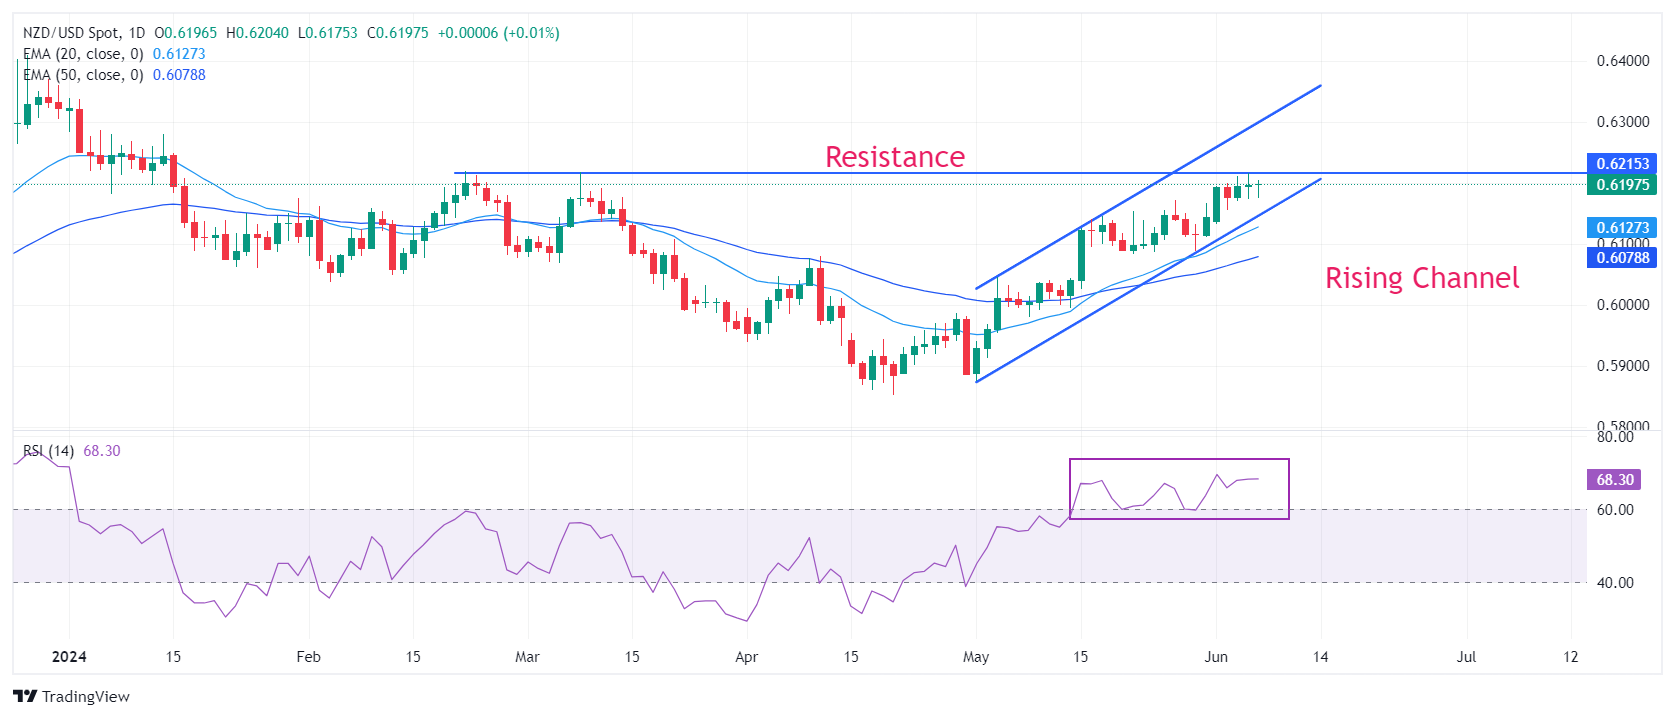
European Central Bank (ECB) Vice President Luis de Guindos said on Friday that “inflation is to be around 2% next year.”
de Guindos said that he “sees huge uncertainty in the economy.”
Separately, ECB policymaker Olli Rehn noted that “inflation will continue to decline and interest rate cuts will also support economic recovery.”
Market reaction
At the time of writing, EUR/USD is holding its grip tightly at around 1.0900, trading 0.06% higher so far.
Here is what you need to know on Friday, June 7:
The US Dollar (USD) is having a tough time staying resilient against its rivals on the last trading day of the week, with the USD Index staying near the multi-week low it set at around 104.00 earlier in the week. The US Bureau of Labor Statistics will release the jobs report for May later in the day, which will feature Nonfarm Payrolls, Unemployment Rate and wage inflation figures.
US Dollar PRICE This week
The table below shows the percentage change of US Dollar (USD) against listed major currencies this week. US Dollar was the weakest against the Swiss Franc.
| USD | EUR | GBP | JPY | CAD | AUD | NZD | CHF | |
|---|---|---|---|---|---|---|---|---|
| USD | -0.45% | -0.45% | -1.24% | 0.28% | -0.37% | -1.00% | -1.62% | |
| EUR | 0.45% | 0.02% | -0.80% | 0.73% | -0.06% | -0.56% | -1.20% | |
| GBP | 0.45% | -0.02% | -0.76% | 0.69% | -0.01% | -0.64% | -1.22% | |
| JPY | 1.24% | 0.80% | 0.76% | 1.51% | 0.94% | 0.40% | -0.21% | |
| CAD | -0.28% | -0.73% | -0.69% | -1.51% | -0.67% | -1.27% | -1.91% | |
| AUD | 0.37% | 0.06% | 0.01% | -0.94% | 0.67% | -0.51% | -1.17% | |
| NZD | 1.00% | 0.56% | 0.64% | -0.40% | 1.27% | 0.51% | -0.68% | |
| CHF | 1.62% | 1.20% | 1.22% | 0.21% | 1.91% | 1.17% | 0.68% |
The heat map shows percentage changes of major currencies against each other. The base currency is picked from the left column, while the quote currency is picked from the top row. For example, if you pick the US Dollar from the left column and move along the horizontal line to the Japanese Yen, the percentage change displayed in the box will represent USD (base)/JPY (quote).
The Unemployment Rate in the US is forecast to hold steady at 3.9% in May, while Nonfarm Payrolls are seen rising 185,000 following the weaker-than-forecast 175,000 increase recorded in April. The annual wage inflation, as measured by the change in the Average Hourly Earnings, is expected to remain unchanged at 3.9%. Ahead of the labor market data, the benchmark 10-year US Treasury bond yield stays flat at around 4.3% and US stock index futures trade modestly higher on the day.
US Nonfarm Payrolls growth set to stabilize in May as signs of cooling labor market mount.
The European Central Bank (ECB) announced on Thursday that it lowered key rates by 25 basis points following the June policy meeting. This decision came in line with the market expectation. In the post-meeting press conference, ECB President Christine Lagarde refrained from confirming further easing in the near term, reiterating the data-dependent approach to policy moving forward. EUR/USD's reaction to the ECB event was relatively muted but the pair managed to edge higher to the 1.0900 area. During the European trading hours, Eurostat will publish revisions to first-quarter Employment Change and Gross Domestic Product data. Meanwhile, Germany's Destatis reported earlier in the day that Industrial Production declined 0.1% on a monthly basis in April.
In the Asian session, the data from China showed that Exports rose 7.6% on a yearly basis in May, surpassing the market expectation for an increase of 6%. In the same period, Imports increased 1.8%. After closing in positive territory on Thursday, AUD/USD stretched higher early Friday and was last seen trading a few pips above 0.6670.
Australian Dollar holds gains after China's Trade Surplus, awaits NFP.
GBP/USD registered small gains on Thursday but failed to gather bullish momentum. The pair trades in a narrow channel at around 1.2800 early Friday.
USD/JPY retreated below 156.00 on Thursday and continued to stretch lower. At the time of press, the pair was trading in negative territory below 155.50.
Japanese Yen consolidates, while Japan Suzuki mentions no fund limit for FX intervention.
Gold extended its weekly uptrend on Thursday and gained nearly 1% on the day. XAU/USD clings to small daily gains early Friday at around $2,380.
Gold price trims gains ahead of US NFP data.
Economic Indicator
Nonfarm Payrolls
The Nonfarm Payrolls release presents the number of new jobs created in the US during the previous month in all non-agricultural businesses; it is released by the US Bureau of Labor Statistics (BLS). The monthly changes in payrolls can be extremely volatile. The number is also subject to strong reviews, which can also trigger volatility in the Forex board. Generally speaking, a high reading is seen as bullish for the US Dollar (USD), while a low reading is seen as bearish, although previous months' reviews and the Unemployment Rate are as relevant as the headline figure. The market's reaction, therefore, depends on how the market assesses all the data contained in the BLS report as a whole.
Read more.Last release: Fri May 03, 2024 12:30
Frequency: Monthly
Actual: 175K
Consensus: 243K
Previous: 303K
Source: US Bureau of Labor Statistics
America’s monthly jobs report is considered the most important economic indicator for forex traders. Released on the first Friday following the reported month, the change in the number of positions is closely correlated with the overall performance of the economy and is monitored by policymakers. Full employment is one of the Federal Reserve’s mandates and it considers developments in the labor market when setting its policies, thus impacting currencies. Despite several leading indicators shaping estimates, Nonfarm Payrolls tend to surprise markets and trigger substantial volatility. Actual figures beating the consensus tend to be USD bullish.
- The Pound Sterling trades sideways near 1.2800 against the US Dollar ahead of the US NFP data for May.
- US NFP will significantly influence expectations for Fed interest-rate cuts in September.
- The UK’s strong wage growth remains a major driver of stubborn service inflation.
The Pound Sterling (GBP) consolidates in a tight range near 1.2800 against the US Dollar (USD) in Friday’s European session. The GBP/USD pair struggles for a direction as investors await the United States (US) Nonfarm Payrolls (NFP) report for May, which will provide new clues about the health of the country’s labor market.
The employment report is expected to show that employers added 185K payrolls, higher than the 175K jobs added in April. The Unemployment Rate is estimated to have remained steady at 3.9%. Investors will also pay attention to the Average Hourly Earnings data, which gauges wage growth momentum. Annual Average Hourly Earnings are forecasted to have grown steadily by 3.9%. On a monthly basis, wage growth is estimated to have risen at a higher pace of 0.3% from the former 0.2% increase.
Stronger-than-expected wage growth and payroll data would weaken expectations for the Federal Reserve (Fed) to start reducing interest rates from the September meeting, while weak numbers will boost them.
Daily digest market movers: Pound Sterling trades back and forth ahead of US NFP
- The Pound Sterling ranges near 1.2800 against the US Dollar ahead of the US NFP report, which will influence market speculation for Fed rate cuts in September. The official employment data will show the impact of the Fed’s restrictive monetary policy framework on labor demand.
- Recently, many labor market-related economic indicators have pointed to normalizing job conditions. The US JOLTS Job Openings data for April and ADP Employment Change for May showed that fresh openings and private payrolls, respectively, were lower than expected. Also, the US Department of Labor said on Thursday that Initial Jobless Claims for the week ending May 31 increased more than expected. This adds to evidence that the labor market is losing strength.
- Rising doubts over the US job market have prompted market speculation for the Fed to begin lowering its key borrowing rates in September. The CME FedWatch tool shows that traders see a 68% chance for rate cuts in that month, up from the 54.5% recorded a week ago.
- In the United Kingdom, the Pound Sterling will be guided by the Employment data for the February-April period, which will be published on Tuesday. The country’s number of employed people has declined for three consecutive times. Indication of more layoffs would hurt the Pound Sterling as it would boost traders’ bets for early rate cuts by the Bank of England (BoE).
- Investors will also focus on the UK Average Earnings data, a measure of wage growth. UK’s strong wage growth momentum has remained a major driver to high service inflation, which has been a barrier for price pressures in returning towards the 2% target.
Technical Analysis: Pound Sterling remains sideways near 1.2800
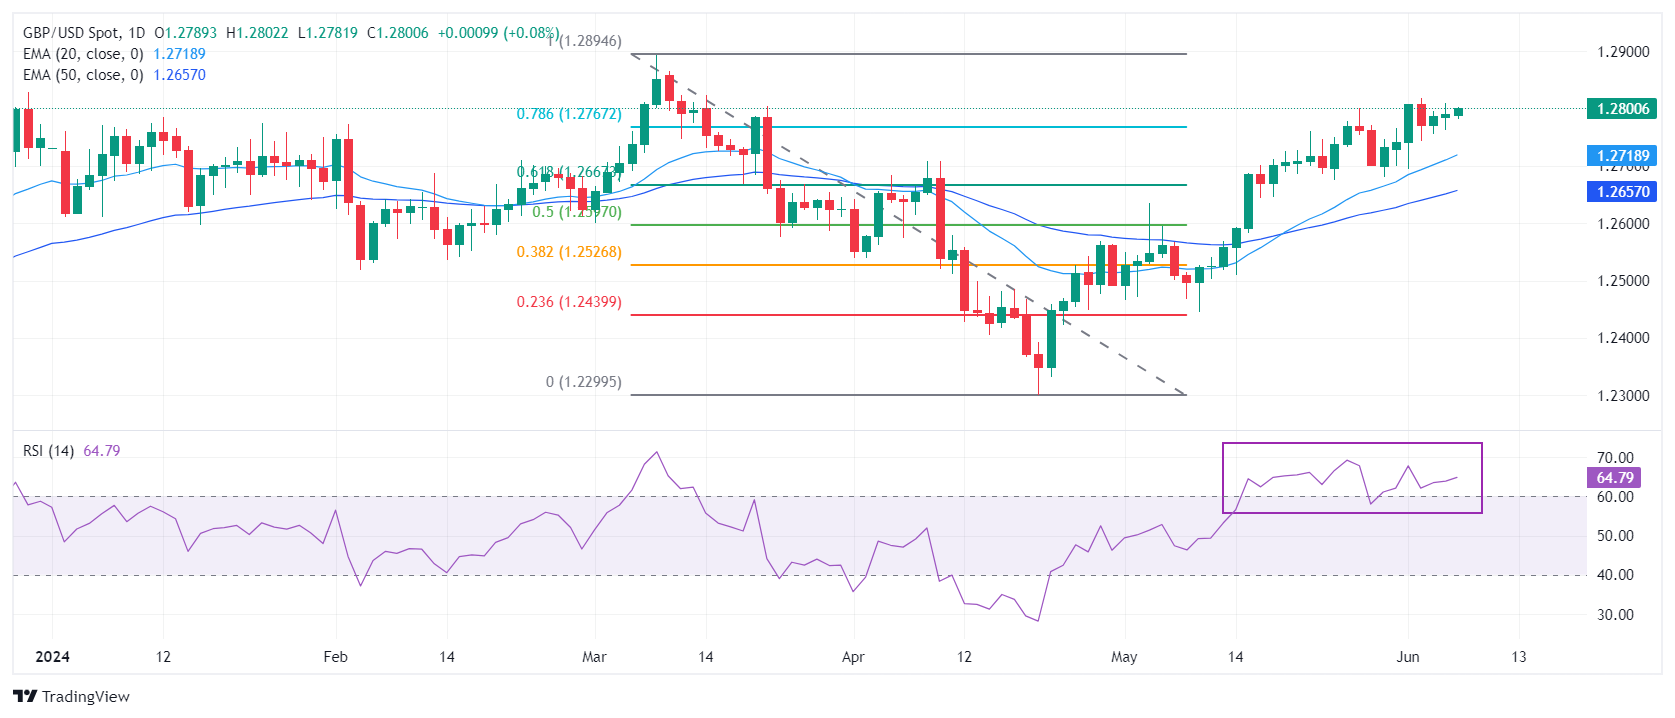
The Pound Sterling trades inside Thursday’s trading range ahead of the US NFP data for May. The GBP/USD pair struggles to break decisively above 1.2800. However, the Cable's near-term outlook remains firm as it trades above 1.2770, the 78.6% Fibonacci retracement support (plotted from the March 8 high of 1.2900 to the April 22 low at 1.2300).
The Cable is expected to remain in the bullish trajectory as the 20-day and 50-day Exponential Moving Average (EMA) at 1.2710 and 1.2650, respectively, are sloping higher, indicating a strong uptrend.
The 14-period Relative Strength Index (RSI) has shifted into the 40.00-60.00 range, suggesting that the momentum has leaned toward the upside.
Pound Sterling FAQs
The Pound Sterling (GBP) is the oldest currency in the world (886 AD) and the official currency of the United Kingdom. It is the fourth most traded unit for foreign exchange (FX) in the world, accounting for 12% of all transactions, averaging $630 billion a day, according to 2022 data. Its key trading pairs are GBP/USD, aka ‘Cable’, which accounts for 11% of FX, GBP/JPY, or the ‘Dragon’ as it is known by traders (3%), and EUR/GBP (2%). The Pound Sterling is issued by the Bank of England (BoE).
The single most important factor influencing the value of the Pound Sterling is monetary policy decided by the Bank of England. The BoE bases its decisions on whether it has achieved its primary goal of “price stability” – a steady inflation rate of around 2%. Its primary tool for achieving this is the adjustment of interest rates. When inflation is too high, the BoE will try to rein it in by raising interest rates, making it more expensive for people and businesses to access credit. This is generally positive for GBP, as higher interest rates make the UK a more attractive place for global investors to park their money. When inflation falls too low it is a sign economic growth is slowing. In this scenario, the BoE will consider lowering interest rates to cheapen credit so businesses will borrow more to invest in growth-generating projects.
Data releases gauge the health of the economy and can impact the value of the Pound Sterling. Indicators such as GDP, Manufacturing and Services PMIs, and employment can all influence the direction of the GBP. A strong economy is good for Sterling. Not only does it attract more foreign investment but it may encourage the BoE to put up interest rates, which will directly strengthen GBP. Otherwise, if economic data is weak, the Pound Sterling is likely to fall.
Another significant data release for the Pound Sterling is the Trade Balance. This indicator measures the difference between what a country earns from its exports and what it spends on imports over a given period. If a country produces highly sought-after exports, its currency will benefit purely from the extra demand created from foreign buyers seeking to purchase these goods. Therefore, a positive net Trade Balance strengthens a currency and vice versa for a negative balance.
European Central Bank (ECB) Governing Council member Gediminas Šimkus said on Friday that “it is possible that there will be more than one rate cut this year.”
Additional comments
Data very clearly shows disinflation.
But the road ahead is bumpy.
Related reads
- ECB’s Nagel: ECB isn't on autopilot on interest-rate cuts
- EUR/JPY extends the decline below 169.50, Eurozone GDP data looms
- EUR/JPY loses traction near 169.20 in Friday’s European session, down 0.18% on the day.
- The German Industrial Production declined 0.1% MoM in April from a 0.4% decrease in March, worse than expected.
- BoJ’s Ueda said inflation expectations are gradually rising but have yet to reach 2%.
The EUR/JPY cross extends the decline towards 169.20 during the early European trading hours on Friday. The cross edges lower after the release of weaker-than-expected German April Industrial Production. Additionally, the verbal intervention from Japanese authorities early Friday continues to support the Japanese Yen (JPY) and weigh on EUR/JPY for the time being.
Industrial production in the German manufacturing sector remained in contraction in April, the country's Federal Statistical Office Destatis reported on Friday. The German Industrial output declined 0.1% MoM in April from a 0.4% decrease in March, worse than the estimation of a 0.3% increase. The Euro (EUR) attracts some sellers following the downbeat German Industrial production and creates a headwind for the cross.
On Thursday, the European Central Bank (ECB) decided to cut interest rates by 25 basis points (bps) at its June meeting, as widely anticipated by markets. ECB policymakers raised their annual average headline inflation outlook for 2024 to 2.5% from 2.3% earlier in its updated macroeconomic projections. Investors await the Eurozone Gross Domestic Product (GDP) for the first quarter (Q1) on Friday for fresh impetus. The GDP number is estimated to grow 0.3% QoQ and 0.4% YoY in Q1, unchanged from the previous reading.
On the JPY’s front, many analysts believe the Bank of Japan (BoJ) will decide to trim its government bond buying when authorities meet next week. About 70% see the odds of such action rising due to the recent weakening of the Japanese Yen, according to a Bloomberg survey. On Thursday, BoJ Governor Kazuo Ueda said that inflation expectations are gradually rising but have yet to reach 2%, adding that they are “still scrutinizing market developments since the March decision”. Meanwhile, the BoJ board member Toyoaki Nakamura stated that it is suitable to maintain the current policy intact for the time being.
Gold prices fell in India on Friday, according to data compiled by FXStreet.
The price for Gold stood at 6,372.52 Indian Rupees (INR) per gram, down INR 0.30 compared with the INR 6,372.81 it cost on Thursday.
The price for Gold decreased to INR 74,328.73 per tola from INR 74,331.23 per tola.
| Unit measure | Gold Price in INR |
|---|---|
| 1 Gram | 6,372.52 |
| 10 Grams | 63,726.25 |
| Tola | 74,328.73 |
| Troy Ounce | 198,207.60 |
FXStreet calculates Gold prices in India by adapting international prices (USD/INR) to the local currency and measurement units. Prices are updated daily based on the market rates taken at the time of publication. Prices are just for reference and local rates could diverge slightly.
Global Market Movers: Comex Gold price turns cautious ahead of key US jobs data
- Growing acceptance that the Federal Reserve will start cutting interest rates later this year amid signs of a slowdown in the US economy continues to lend some support to the non-yielding Comex Gold price.
- The US Department of Labor (DoL) reported on Thursday that the number of Americans applying for unemployment insurance benefits increased more than expected by 229K in the week ending June 1.
- This, along with Wednesday's ADP report on private-sector employment, suggests that the US labor market is cooling, cementing bets for a September Fed rate cut and weighing on the US Treasury bond yields.
- The yield on the benchmark 10-year US government bond languishes near its lowest level in two months, which, in turn, is seen undermining the US Dollar and acting as a tailwind for the yellow metal.
- The underlying strong bullish sentiment across the global equity markets might hold back traders from positioning for any further gains ahead of the release of the crucial US monthly employment details.
- The popularly known Nonfarm Payrolls (NFP) report is expected to show that the US economy added 185K jobs in May as compared to 175K previous and the unemployment rate held steady at 3.9%.
- Apart from this, Average Hourly Earnings will influence the inflation trajectory and the Fed's future policy decision, which, in turn, will help in determining the next leg of a directional move for the XAU/USD.
Gold FAQs
Gold has played a key role in human’s history as it has been widely used as a store of value and medium of exchange. Currently, apart from its shine and usage for jewelry, the precious metal is widely seen as a safe-haven asset, meaning that it is considered a good investment during turbulent times. Gold is also widely seen as a hedge against inflation and against depreciating currencies as it doesn’t rely on any specific issuer or government.
Central banks are the biggest Gold holders. In their aim to support their currencies in turbulent times, central banks tend to diversify their reserves and buy Gold to improve the perceived strength of the economy and the currency. High Gold reserves can be a source of trust for a country’s solvency. Central banks added 1,136 tonnes of Gold worth around $70 billion to their reserves in 2022, according to data from the World Gold Council. This is the highest yearly purchase since records began. Central banks from emerging economies such as China, India and Turkey are quickly increasing their Gold reserves.
Gold has an inverse correlation with the US Dollar and US Treasuries, which are both major reserve and safe-haven assets. When the Dollar depreciates, Gold tends to rise, enabling investors and central banks to diversify their assets in turbulent times. Gold is also inversely correlated with risk assets. A rally in the stock market tends to weaken Gold price, while sell-offs in riskier markets tend to favor the precious metal.
The price can move due to a wide range of factors. Geopolitical instability or fears of a deep recession can quickly make Gold price escalate due to its safe-haven status. As a yield-less asset, Gold tends to rise with lower interest rates, while higher cost of money usually weighs down on the yellow metal. Still, most moves depend on how the US Dollar (USD) behaves as the asset is priced in dollars (XAU/USD). A strong Dollar tends to keep the price of Gold controlled, whereas a weaker Dollar is likely to push Gold prices up.
(An automation tool was used in creating this post.)
European Central Bank (ECB) policymaker and Bundesbank Chief Joachim Nagel said on Friday that “the ECB isn't on autopilot on interest-rate cuts.”
Further comments
Inflation is proving to be stubborn, especially in the case of services.
Negotiated wages are expected to rise particularly sharply this year and continue to see strong growth thereafter.
Private consumption is to gradually pick up and exports are to improve from H2.
Meanwhile, ECB policymaker Vasle said that “we can't predetermine the path of ECB interest rates.”
Euro PRICE Today
The table below shows the percentage change of Euro (EUR) against listed major currencies today. Euro was the strongest against the New Zealand Dollar.
| USD | EUR | GBP | JPY | CAD | AUD | NZD | CHF | |
|---|---|---|---|---|---|---|---|---|
| USD | -0.04% | -0.05% | -0.14% | -0.01% | -0.13% | -0.00% | -0.02% | |
| EUR | 0.04% | 0.00% | -0.12% | 0.03% | -0.08% | 0.10% | 0.02% | |
| GBP | 0.05% | -0.00% | -0.12% | 0.02% | -0.09% | 0.09% | 0.00% | |
| JPY | 0.14% | 0.12% | 0.12% | 0.14% | 0.01% | 0.16% | 0.14% | |
| CAD | 0.01% | -0.03% | -0.02% | -0.14% | -0.12% | 0.07% | -0.01% | |
| AUD | 0.13% | 0.08% | 0.09% | -0.01% | 0.12% | 0.18% | 0.10% | |
| NZD | 0.00% | -0.10% | -0.09% | -0.16% | -0.07% | -0.18% | -0.07% | |
| CHF | 0.02% | -0.02% | -0.01% | -0.14% | 0.01% | -0.10% | 0.07% |
The heat map shows percentage changes of major currencies against each other. The base currency is picked from the left column, while the quote currency is picked from the top row. For example, if you pick the Euro from the left column and move along the horizontal line to the US Dollar, the percentage change displayed in the box will represent EUR (base)/USD (quote).
European Central Bank (ECB) policymaker Martins Kazaks said on Friday that “any further rate cuts should be gradual.”
Additional quotes
Victory over inflation is not yet on hand.
The next steps are data-dependent and will be meeting by meeting.
Meanwhile, his colleague Madis Muller said that the ECB needs to make cautious decisions,” adding that “the ECB shouldn't rush to cut interest rates.”
Market reaction
EUR/USD is little affected by these above comments, holding its range close to 1.0900 heading into the US Nonfarm Payrolls release.
ECB FAQs
The European Central Bank (ECB) in Frankfurt, Germany, is the reserve bank for the Eurozone. The ECB sets interest rates and manages monetary policy for the region. The ECB primary mandate is to maintain price stability, which means keeping inflation at around 2%. Its primary tool for achieving this is by raising or lowering interest rates. Relatively high interest rates will usually result in a stronger Euro and vice versa. The ECB Governing Council makes monetary policy decisions at meetings held eight times a year. Decisions are made by heads of the Eurozone national banks and six permanent members, including the President of the ECB, Christine Lagarde.
In extreme situations, the European Central Bank can enact a policy tool called Quantitative Easing. QE is the process by which the ECB prints Euros and uses them to buy assets – usually government or corporate bonds – from banks and other financial institutions. QE usually results in a weaker Euro. QE is a last resort when simply lowering interest rates is unlikely to achieve the objective of price stability. The ECB used it during the Great Financial Crisis in 2009-11, in 2015 when inflation remained stubbornly low, as well as during the covid pandemic.
Quantitative tightening (QT) is the reverse of QE. It is undertaken after QE when an economic recovery is underway and inflation starts rising. Whilst in QE the European Central Bank (ECB) purchases government and corporate bonds from financial institutions to provide them with liquidity, in QT the ECB stops buying more bonds, and stops reinvesting the principal maturing on the bonds it already holds. It is usually positive (or bullish) for the Euro.
FX option expiries for June 7 NY cut at 10:00 Eastern Time, via DTCC, can be found below
- EUR/USD: EUR amounts
- 1.0750 1b
- 1.0875 1.1b
- 1.0885 1.4b
- 1.0900 1.8b
- 1.0950 704m
- GBP/USD: GBP amounts
- 1.2800 645m
- USD/JPY: USD amounts
- 154.50 1b
- 156.50 861m
- 157.00 1.3b
- 157.75 548m
- USD/CHF: USD amounts
- 0.8900 520m
- 0.8920 1.1b
- 0.9000 846m
- AUD/USD: AUD amounts
- 0.6600 1.2b
- USD/CAD: USD amounts
- 1.3675 596m
- 1.3600 638m
- 1.3720 589m
- 1.3800 2.8b
- NZD/USD: NZD amounts
- 0.6100 510m
- 0.6115 804m
Germany’s industrial sector remained in contraction in April, the latest data published by Destatis showed on Friday.
Industrial output in the Eurozone’s top economy declined 0.1% MoM, the federal statistics authority Destatis said in figures adjusted for seasonal and calendar effects, as against the 0.3% expected and a 0.4% decrease in March.
German Industrial Production fell at an annual rate of 3.9% in April versus the March drop of 3.3%.
EUR/USD reaction to the German Industrial Production data
The downbeat German industrial figures failed to have any impact on the Euro, as EUR/USD trades flat on the day at 1.0890 at the press time.
Euro PRICE Today
The table below shows the percentage change of Euro (EUR) against listed major currencies today. Euro was the strongest against the New Zealand Dollar.
| USD | EUR | GBP | JPY | CAD | AUD | NZD | CHF | |
|---|---|---|---|---|---|---|---|---|
| USD | 0.01% | 0.02% | -0.25% | -0.00% | -0.12% | -0.01% | -0.01% | |
| EUR | -0.01% | 0.02% | -0.29% | -0.01% | -0.12% | 0.04% | -0.02% | |
| GBP | -0.02% | -0.02% | -0.30% | -0.04% | -0.14% | 0.02% | -0.05% | |
| JPY | 0.25% | 0.29% | 0.30% | 0.26% | 0.13% | 0.26% | 0.26% | |
| CAD | 0.00% | 0.00% | 0.04% | -0.26% | -0.12% | 0.06% | -0.01% | |
| AUD | 0.12% | 0.12% | 0.14% | -0.13% | 0.12% | 0.16% | 0.10% | |
| NZD | 0.00% | -0.04% | -0.02% | -0.26% | -0.06% | -0.16% | -0.06% | |
| CHF | 0.01% | 0.02% | 0.05% | -0.26% | 0.01% | -0.10% | 0.06% |
The heat map shows percentage changes of major currencies against each other. The base currency is picked from the left column, while the quote currency is picked from the top row. For example, if you pick the Euro from the left column and move along the horizontal line to the US Dollar, the percentage change displayed in the box will represent EUR (base)/USD (quote).
- EUR/USD holds positive ground near 1.0895 in Friday’s early European session.
- The pair maintains a positive stance on the 4-hour chart above the 100-period EMA, with a bullish RSI indicator.
- The first resistance level is seen in the 1.0900-1.0905 zone; the initial support level is located near 1.0860.
The EUR/USD pair trades in positive territory for the second consecutive day around 1.0895 during the early European session on Friday. The European Central Bank (ECB) decided to cut interest rates by 25 basis points (bps) at its June meeting on Thursday, as widely anticipated by markets. However, traders did not expect a July rate cut, and the rate differential between the Euro and USD is unlikely to widen as much as initial expectations. This, in turn, provides some support to the Euro against the Greenback.
From the technical perspective, EUR/USD keeps the bullish vibe unchanged on the 4-hour chart as the major pair holds above the key 100-period Exponential Moving Average (EMA). Additionally, the upward momentum is supported by the Relative Strength Index (RSI), which stands in the bullish zone near 60, suggesting the path of least resistance is to the upside.
The first upside barrier will emerge at the 1.0900-1.0905 region, representing the upper boundary of the Bollinger Band and psychological level. Further north, the next hurdle is seen near 1.0940, a high of March 21. The additional upside filter to watch is 1.0964 (high of March 13), followed by 1.0981 (high of March 8).
On the flip side, the initial support level for the pair is located around 1.0860, portraying the confluence of a low of June 6 and the lower limit of Bollinger Band. The next contention level to watch is the 100-period EMA at 1.0846. Any follow-through selling below this level will attract some sellers to 1.0811, a low of May 31.
EUR/USD 4-hour chart
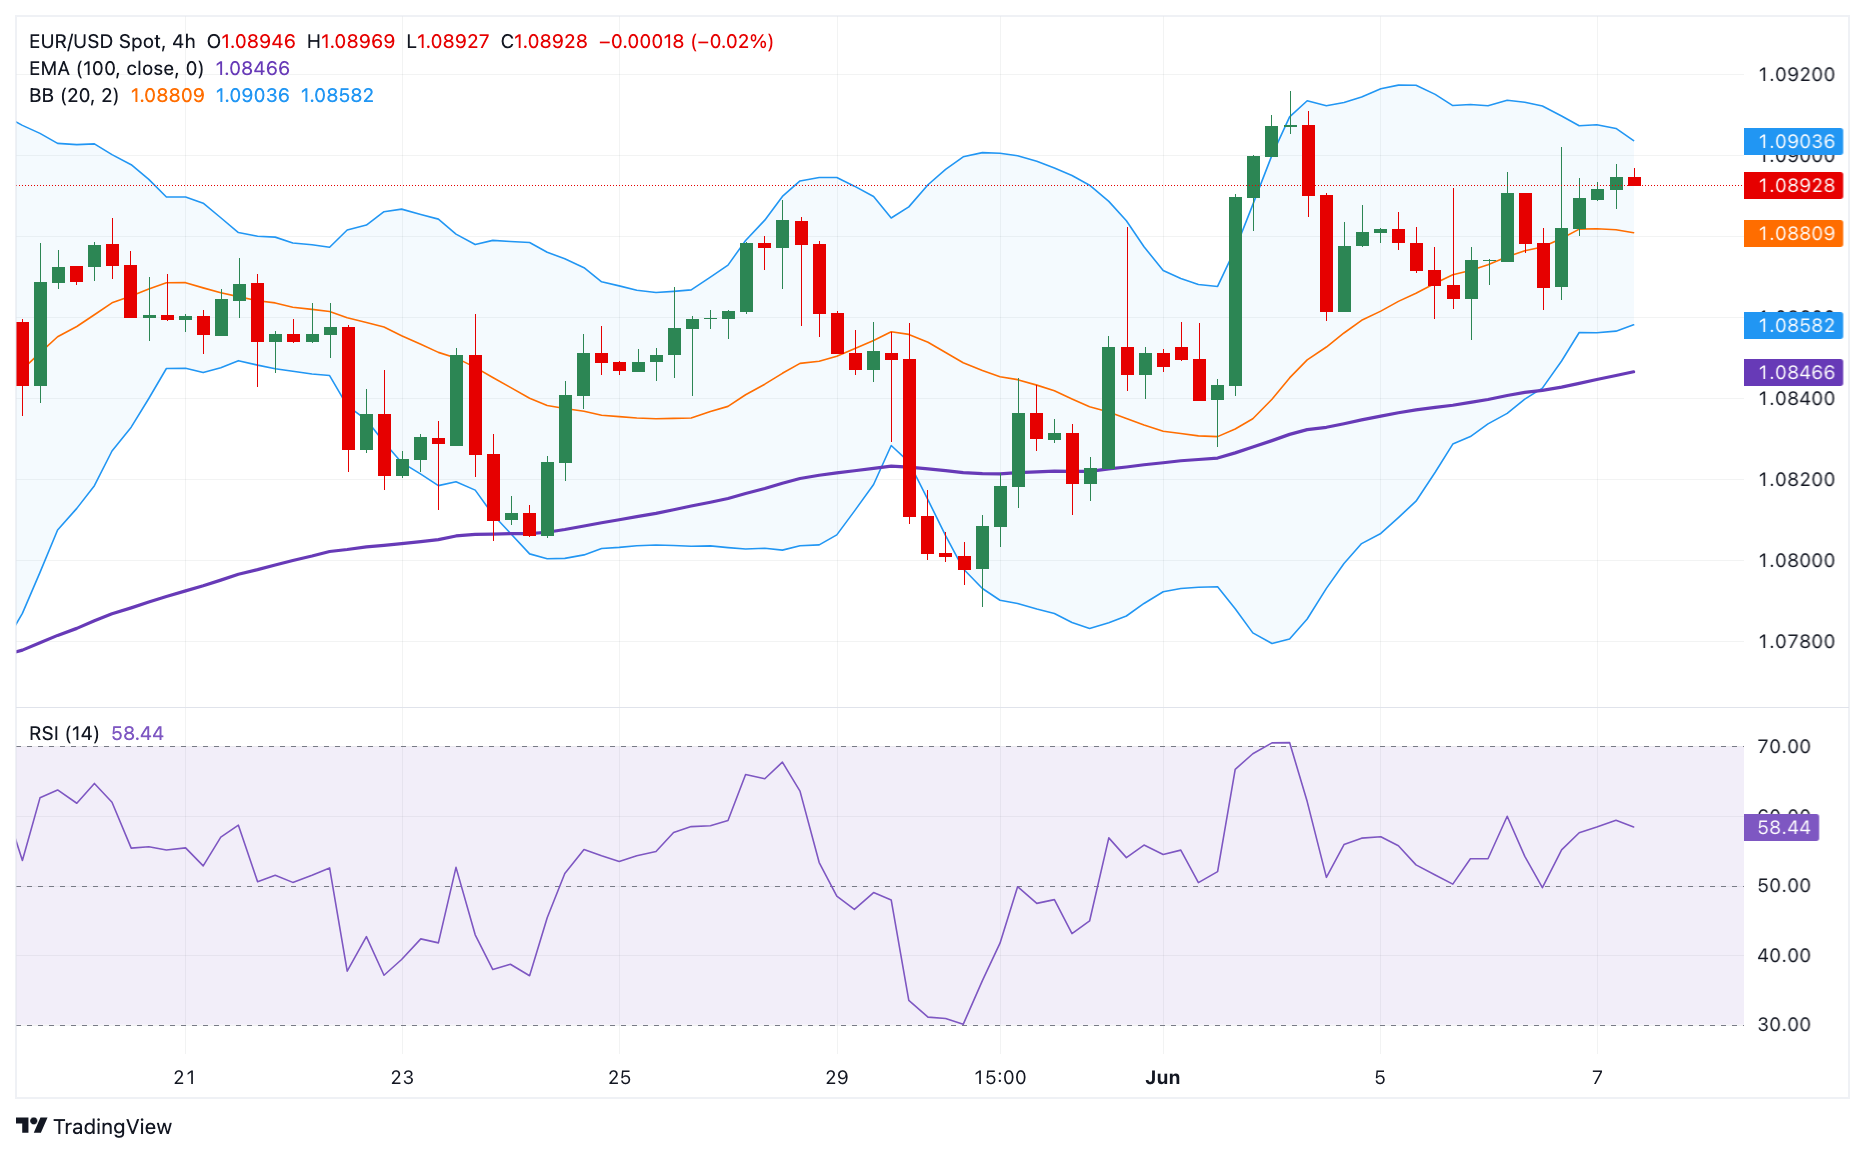
- USD/CHF trades cautiously with a focus on the US NFP.
- Easing US labor market strength has prompted Fed rate-cut prospects.
- The expectations of the SNB intervening in currency markets remain firm.
The USD/CHF pair is slightly positive in Friday’s Asian session but trades close to its crucial support of 0.8883. The Swiss Franc asset remains under pressure in past few trading sessions as the US Dollar struggles to gain ground due to growing speculation that the Federal Reserve (Fed) will start reducing interest rates from the September meeting.
Firm expectations for the Fed reducing interest rates in September have improved appeal for risky assets. S&P 500 futures have posted decent gains in the Tokyo session. The US Dollar Index (DXY) stays on the sidelines near 104.00 ahead of the United States Nonfarm Payrolls (NFP) data for May. 10-year US Treasury yields bounce back to 4.30% but are significantly down from the previous week’s high of 4.62%.
Trades have raised bets in favor of the Fed to start lowering its key borrowing rates from their current levels in September due to normalizing labor market strength. This week, weaker-than-expected JOLTS Job Openings data for April, and ADP Employment Change for May suggested that the labor demand is easing.
Also, a higher number of individuals claiming jobless benefits for the first time for the week ending May 31 at 229K against their estimates of 220K and the prior release of 221K adds to doubts that the labor market strength is easing. In today’s session, the US NFP report will provide significant cues about the US labor market's health.
Meanwhile, the Swiss Franc has performed relatively stronger against the US Dollar in past few trading sessions amid expectations that the Swiss National Bank (SNB) could intervene in currency markets to bolster the currency in way to build pressure on inflation, which has been prompted due to competitive Swiss exports. The demand for Swiss exports strengthened globally due to weak Swiss Franc.
- Silver price gains ground due to rising speculation of a Fed rate cut in September.
- Softer US labor data fueled speculation for two interest rate cuts by the Fed in 2024.
- A Reuters poll has indicated that nearly two-thirds of economists now predict a rate cut in September.
Silver price continues to gain ground for the third successive session, trading around $31.50 during the Asian hours on Friday. The appreciation of the grey metal can be attributed to the rising speculation of an interest rate cut by the US Federal Reserve (Fed) in September. This has followed a 25-basis points rate cut implemented by the European Central Bank (ECB) on Thursday.
The non-yielding assets like Silver could gain demand as the lower US labor data fueled hopes for two interest rate cuts by the Federal Reserve this year. Traders are likely to await further employment data from the US, including Average Hourly Earnings and Nonfarm Payrolls later in the North American session.
Initial Jobless Claims in the US increased by 8,000 to 229,000 for the week ending May 31, surpassing market expectations of 220,000. This marks the highest reading since the eight-month high of 232,000 recorded in early May. Traders await the release of US employment data releases on Friday, including the Average Hourly Earnings and Nonfarm Payrolls.
A Reuters poll conducted from May 31 to June 5 has indicated that nearly two-thirds of economists now predict an interest rate cut in September. Additionally, CME FedWatch Tool suggests the probability of a Fed rate cut in September by at least 25 basis points has increased to nearly 70.0%, up from 51.0% a week earlier.
- US Nonfarm Payrolls are foreseen at 185K in May, data hints at a miss.
- The United States Employment report could impact the Federal Reserve’s decision next week.
- The US Dollar heads into the event with a weak tone, still lacking directional momentum.
The United States (US) will release the May Nonfarm Payrolls (NFP) report on Friday at 12:30 GMT. Ahead of the event, the country released multiple employment-related figures that anticipate a soft NFP headline figure.
Furthermore, the European Central Bank (ECB) announced its decision on monetary policy on Thursday. As widely anticipated, the central bank trimmed interest rates by 25 basis points (bps) each, with the interest rates on the main refinancing operations, the marginal lending facility, and the deposit facility coming down to 4.25%, 4.5%, and 3.75%, respectively. However, European policymakers delivered a quite hawkish statement, limiting EUR/USD slide after such an aggressive decision.
What to expect in the next Nonfarm Payrolls report?
The NFP report is expected to show that the US economy added 185K new jobs in May, above the 175K gained in April. The Unemployment Rate is foreseen stable at 3.9%, while Average Hourly Earnings, a measure of wage inflation, are expected to have ticked up by 0.3% in the month from the previous 0.2%. The annual reading is forecast to remain unchanged at 3.9%.
Throughout the week, the US unveiled the April Job Openings and Labor Turnover Survey (JOLTS), which showed that the number of job openings on the last business day of the month stood at 8.059 million, below the downwardly revised 8.35 million posted in March. Additionally, the Automatic Data Processing (ADP) survey indicated that the private sector created 152K new positions in May, below the 173K anticipated by market players and easing from the previous 188K. More relevant, the ADP report showed annual pay was up 5%.
ADP Chief Economist Nela Richardson said:“Job gains and pay growth are slowing going into the second half of the year. The labor market is solid, but we're monitoring notable pockets of weakness tied to both producers and consumers.”
Finally, Initial Jobless Claims increased by 229K in the week ending May 31, worse than the 220K anticipated and above the previous weekly raise of 221K.
Data released ahead of the NFP report showed that price pressures remain high while the labor market is loosening a bit, not enough to twist Federal Reserve (Fed) officials’ hands.
It is worth reminding that the central bank has a dual mandate to achieve maximum employment and keep prices stable. However, Fed policymakers have stated that a softening labor market would indeed help them move away from the tight monetary policy.
Regarding inflation, the latest Personal Consumption Expenditures (PCE) Price Index report, the Fed’s favorite inflation gauge, showed it held steady at 2.7% YoY in April, according to the US Bureau of Economic Analysis (BEA). On a monthly basis, the PCE Price index was up 0.3%, as expected, although the core monthly figure was slightly lower than anticipated, up 0.2%.
The Federal Open Market Committee (FOMC) is widely anticipated to keep the funds rate unchanged between 5.25% and 5.50%, while speculative interest foresees a rate cut in September at the earliest. The Fed is also expected to begin tapering the pace at which it rolls off assets from its balance sheet.
How will the US May Nonfarm Payrolls report affect EUR/USD?
Generally speaking, a strong headline reading alongside increased wage pressures will be understood as a further delay in interest rate cuts and result in a firmer US Dollar. On the contrary, a highly disappointing report alongside easing wages may result in the USD accelerating its slump, as the market will understand it as a higher chance of a soon-to-come rate cut.
The EUR/USD pair trades just below 1.0900 following the ECB monetary policy decision and ahead of the NFP release. The pair peaked at 1.0915 early in June, steadily meeting sellers on spikes beyond the 1.0900 level since mid-March.
Valeria Bednarik, FXStreet’s Chief Analyst, states: “Market participants seem willing to push EUR/USD higher, but can’t still make up their minds. What seems clear is that interest in buying the US Dollar is quite limited. From a technical point of view, the pair needs to clear the 1.0910 region to extend gains, with an intermediate resistance at around 1.0950 ahead of the 1.1000 price zone. A bearish movement seems more difficult, giving the downside seems more messy, without a clear breakout point until 1.0790. Below the latter, the pair could slide towards 1.0700, yet buying the dips seems to be the name of the game, and further slides seem unclear.”
Economic Indicator
Nonfarm Payrolls
The Nonfarm Payrolls release presents the number of new jobs created in the US during the previous month in all non-agricultural businesses; it is released by the US Bureau of Labor Statistics (BLS). The monthly changes in payrolls can be extremely volatile. The number is also subject to strong reviews, which can also trigger volatility in the Forex board. Generally speaking, a high reading is seen as bullish for the US Dollar (USD), while a low reading is seen as bearish, although previous months' reviews and the Unemployment Rate are as relevant as the headline figure. The market's reaction, therefore, depends on how the market assesses all the data contained in the BLS report as a whole.
Read more.Next release: Fri Jun 07, 2024 12:30
Frequency: Monthly
Consensus: 185K
Previous: 175K
Source: US Bureau of Labor Statistics
America’s monthly jobs report is considered the most important economic indicator for forex traders. Released on the first Friday following the reported month, the change in the number of positions is closely correlated with the overall performance of the economy and is monitored by policymakers. Full employment is one of the Federal Reserve’s mandates and it considers developments in the labor market when setting its policies, thus impacting currencies. Despite several leading indicators shaping estimates, Nonfarm Payrolls tend to surprise markets and trigger substantial volatility. Actual figures beating the consensus tend to be USD bullish.
Fed FAQs
Monetary policy in the US is shaped by the Federal Reserve (Fed). The Fed has two mandates: to achieve price stability and foster full employment. Its primary tool to achieve these goals is by adjusting interest rates. When prices are rising too quickly and inflation is above the Fed’s 2% target, it raises interest rates, increasing borrowing costs throughout the economy. This results in a stronger US Dollar (USD) as it makes the US a more attractive place for international investors to park their money. When inflation falls below 2% or the Unemployment Rate is too high, the Fed may lower interest rates to encourage borrowing, which weighs on the Greenback.
The Federal Reserve (Fed) holds eight policy meetings a year, where the Federal Open Market Committee (FOMC) assesses economic conditions and makes monetary policy decisions. The FOMC is attended by twelve Fed officials – the seven members of the Board of Governors, the president of the Federal Reserve Bank of New York, and four of the remaining eleven regional Reserve Bank presidents, who serve one-year terms on a rotating basis.
In extreme situations, the Federal Reserve may resort to a policy named Quantitative Easing (QE). QE is the process by which the Fed substantially increases the flow of credit in a stuck financial system. It is a non-standard policy measure used during crises or when inflation is extremely low. It was the Fed’s weapon of choice during the Great Financial Crisis in 2008. It involves the Fed printing more Dollars and using them to buy high grade bonds from financial institutions. QE usually weakens the US Dollar.
Quantitative tightening (QT) is the reverse process of QE, whereby the Federal Reserve stops buying bonds from financial institutions and does not reinvest the principal from the bonds it holds maturing, to purchase new bonds. It is usually positive for the value of the US Dollar.
- The Japanese Yen depreciates as investors turn cautious ahead of the US NFP.
- Japan’s Foreign-exchange reserves fell to $1,231 billion in May, marking the lowest level since February 2023.
- The US Dollar struggles due to rising hopes for two interest rate cuts by the Fed in 2024.
The Japanese Yen (JPY) edges lower on Friday, possibly influenced by the reduced Japanese Foreign Reserves released by the Ministry of Finance for May. Foreign exchange reserves dropped significantly to $1,231 billion in May from $1,279 billion, marking the lowest level since February 2023, as the government conducted foreign exchange intervention operations to defend the JPY.
Japanese Finance Minister Shunichi Suzuki stated on Friday that he will take action against excessive currency volatility when necessary and will assess the effectiveness of intervention. Suzuki emphasized the importance of maintaining market trust in public finances, mentioning that there is no fund limit for FX intervention, according to Reuters.
The US Dollar (USD) struggled as the lower employment data from the United States (US) fueled hopes for two interest rate cuts by the US Federal Reserve (Fed) in 2024. A Reuters poll from May 31 to June 5 indicated that nearly two-thirds of economists now predict an interest rate cut in September. Additionally, the CME FedWatch Tool suggests the probability of a Fed rate cut in September by at least 25 basis points has increased to nearly 70.0%, up from 51.0% a week earlier.
Daily Digest Market Movers: Japanese Yen depreciates ahead of US labor data
- Japanese bond yields have pulled back from recent highs, with the benchmark 10-year government bond yield falling below 1% for the first time in two weeks.
- On Thursday, Initial Jobless Claims showed the number of people claiming unemployment benefits in the US increased by 8,000 to 229,000 for the week ending May 31, surpassing market expectations of 220,000.
- According to Reuters, while speaking to parliament on Thursday, Bank of Japan (BoJ) Governor Kazuo Ueda stated that inflation expectations are gradually rising but have yet to reach 2%. Ueda said, "We are still scrutinizing market developments since the March decision. As we proceed in exiting our massive monetary stimulus, it's appropriate to reduce bond purchases." Additionally, the Bank of Japan (BoJ) board member Toyoaki Nakamura remarked that, according to current data, it is suitable to maintain the policy intact for the time being.
- The ISM US Services PMI on Wednesday soared to 53.8 in May, marking its highest level in nine months and significantly surpassing the forecast of 50.8. In contrast, the ADP US Employment Change report showed that 152,000 new workers were added to payrolls in May, the lowest in four months and well below the forecast of 175,000 and the downwardly revised figure of 188,000 for April.
- The Jibun Bank Japan Services PMI was revised higher to 53.8 in May from the previous figure of 53.6. Despite the upward revision, it fell short of April's 8-month peak of 54.3, indicating the softest growth in the service sector since February.
Technical Analysis: USD/JPY holds gains above 155.50
USD/JPY trades around 155.80 on Friday. The daily chart suggests a sideways trend as the pair consolidates within a symmetrical triangle pattern. Additionally, the 14-day Relative Strength Index (RSI) is slightly below the 50 level, indicating a potential for a bearish bias.
Immediate support for the USD/JPY pair could be found at the psychological level of 155.00. Further support appears at the 50-day Exponential Moving Average (EMA) at 154.73. A break below this level could increase pressure on the pair, potentially leading it toward the throwback support region around 151.86.
On the upside, a key barrier is evident at the upper threshold of the symmetrical triangle. If the USD/JPY pair breaks above this level, it would weaken the bearish bias and could lead the pair to test the psychological barrier of 157.00, followed by the level of 160.32, its highest level in over thirty years.
USD/JPY: Daily Chart
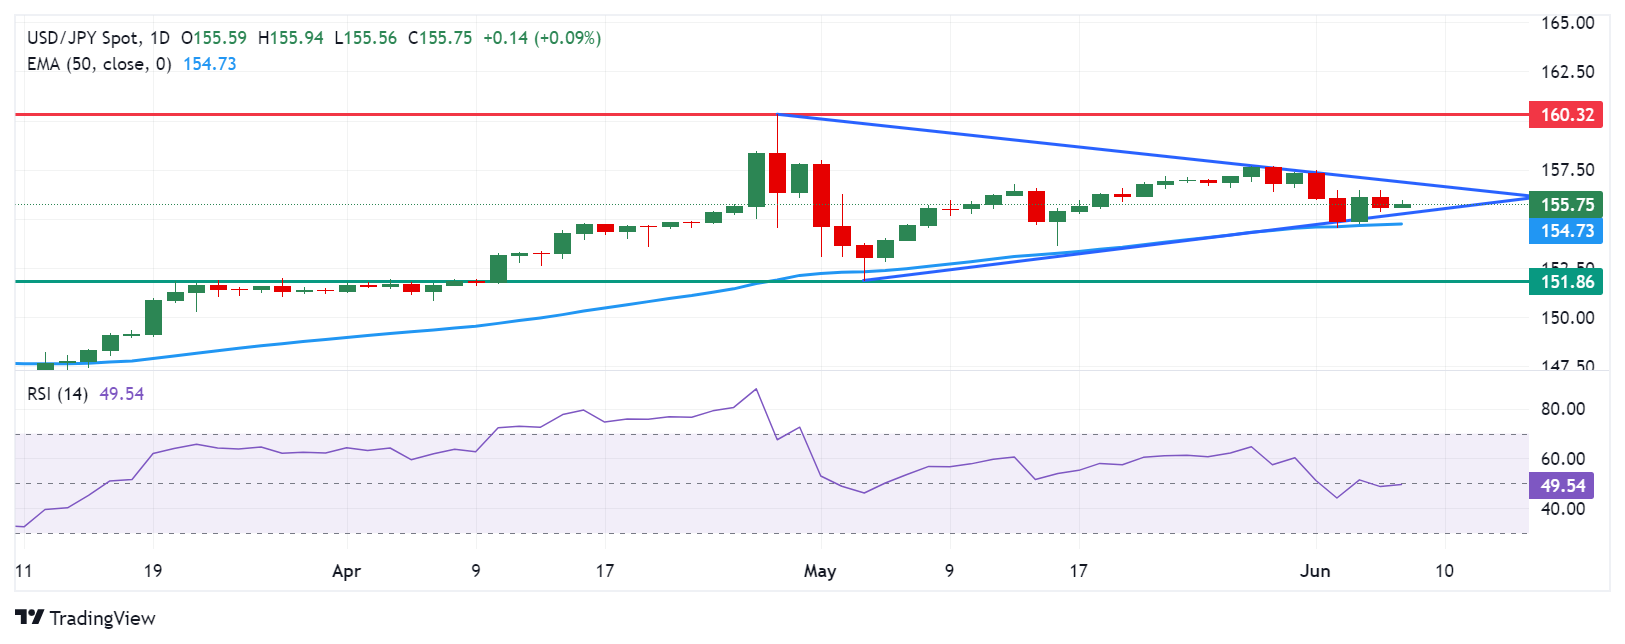
Japanese Yen price today
The table below shows the percentage change of the Japanese Yen (JPY) against listed major currencies today. Japanese Yen was the strongest against the Swiss Franc.
| USD | EUR | GBP | CAD | AUD | JPY | NZD | CHF | |
| USD | -0.02% | 0.03% | 0.00% | -0.02% | 0.03% | -0.01% | 0.07% | |
| EUR | 0.02% | 0.05% | 0.03% | 0.01% | 0.06% | 0.01% | 0.08% | |
| GBP | -0.03% | -0.05% | -0.02% | -0.05% | 0.02% | -0.05% | 0.04% | |
| CAD | 0.00% | -0.02% | 0.03% | -0.02% | 0.05% | -0.02% | 0.07% | |
| AUD | 0.02% | 0.00% | 0.05% | 0.02% | 0.06% | 0.00% | 0.09% | |
| JPY | -0.03% | -0.05% | -0.04% | -0.06% | -0.08% | -0.08% | 0.02% | |
| NZD | 0.01% | 0.01% | 0.04% | 0.02% | 0.00% | 0.05% | 0.08% | |
| CHF | -0.04% | -0.08% | -0.03% | -0.05% | -0.08% | -0.01% | -0.07% |
The heat map shows percentage changes of major currencies against each other. The base currency is picked from the left column, while the quote currency is picked from the top row. For example, if you pick the Euro from the left column and move along the horizontal line to the Japanese Yen, the percentage change displayed in the box will represent EUR (base)/JPY (quote).
Japanese Yen FAQs
The Japanese Yen (JPY) is one of the world’s most traded currencies. Its value is broadly determined by the performance of the Japanese economy, but more specifically by the Bank of Japan’s policy, the differential between Japanese and US bond yields, or risk sentiment among traders, among other factors.
One of the Bank of Japan’s mandates is currency control, so its moves are key for the Yen. The BoJ has directly intervened in currency markets sometimes, generally to lower the value of the Yen, although it refrains from doing it often due to political concerns of its main trading partners. The current BoJ ultra-loose monetary policy, based on massive stimulus to the economy, has caused the Yen to depreciate against its main currency peers. This process has exacerbated more recently due to an increasing policy divergence between the Bank of Japan and other main central banks, which have opted to increase interest rates sharply to fight decades-high levels of inflation.
The BoJ’s stance of sticking to ultra-loose monetary policy has led to a widening policy divergence with other central banks, particularly with the US Federal Reserve. This supports a widening of the differential between the 10-year US and Japanese bonds, which favors the US Dollar against the Japanese Yen.
The Japanese Yen is often seen as a safe-haven investment. This means that in times of market stress, investors are more likely to put their money in the Japanese currency due to its supposed reliability and stability. Turbulent times are likely to strengthen the Yen’s value against other currencies seen as more risky to invest in.
China's Trade Balance for May, in Chinese Yuan terms, came in at CNY586.40 billion, widening from the previous figure of CNY513.45 billion.
Exports jumped by 11.2% YoY in May vs. 5.1% seen in April. The country’s imports rose 5.2% YoY in the same period vs. 12.2% recorded previously.
In US Dollar terms, China’s trade surplus shrank in May.
Trade Balance came in at +82.62B versus +73B expected and +72.35B previous.
Exports (YoY): 7.6% vs. 6.0% expected and 1.5% previous.
Imports (YoY): 1.8% vs. 4.2% expected and 8.4% last.
Additional takeaways
China Jan-May USD-denominated exports +2.7% YoY.
China Jan-May USD-denominated Imports +2.9% YoY.
China May trade surplus with the United States $30.8 billion.
China Jan-May trade surplus with the United States $128.2 billion.
FX implications
AUD/USD is holding higher ground on mostly upbeat China’s trade figures. The pair is up 0.07% on the day, trading at 0.6669, at the time of writing.
Australian Dollar FAQs
One of the most significant factors for the Australian Dollar (AUD) is the level of interest rates set by the Reserve Bank of Australia (RBA). Because Australia is a resource-rich country another key driver is the price of its biggest export, Iron Ore. The health of the Chinese economy, its largest trading partner, is a factor, as well as inflation in Australia, its growth rate and Trade Balance. Market sentiment – whether investors are taking on more risky assets (risk-on) or seeking safe-havens (risk-off) – is also a factor, with risk-on positive for AUD.
The Reserve Bank of Australia (RBA) influences the Australian Dollar (AUD) by setting the level of interest rates that Australian banks can lend to each other. This influences the level of interest rates in the economy as a whole. The main goal of the RBA is to maintain a stable inflation rate of 2-3% by adjusting interest rates up or down. Relatively high interest rates compared to other major central banks support the AUD, and the opposite for relatively low. The RBA can also use quantitative easing and tightening to influence credit conditions, with the former AUD-negative and the latter AUD-positive.
China is Australia’s largest trading partner so the health of the Chinese economy is a major influence on the value of the Australian Dollar (AUD). When the Chinese economy is doing well it purchases more raw materials, goods and services from Australia, lifting demand for the AUD, and pushing up its value. The opposite is the case when the Chinese economy is not growing as fast as expected. Positive or negative surprises in Chinese growth data, therefore, often have a direct impact on the Australian Dollar and its pairs.
Iron Ore is Australia’s largest export, accounting for $118 billion a year according to data from 2021, with China as its primary destination. The price of Iron Ore, therefore, can be a driver of the Australian Dollar. Generally, if the price of Iron Ore rises, AUD also goes up, as aggregate demand for the currency increases. The opposite is the case if the price of Iron Ore falls. Higher Iron Ore prices also tend to result in a greater likelihood of a positive Trade Balance for Australia, which is also positive of the AUD.
The Trade Balance, which is the difference between what a country earns from its exports versus what it pays for its imports, is another factor that can influence the value of the Australian Dollar. If Australia produces highly sought after exports, then its currency will gain in value purely from the surplus demand created from foreign buyers seeking to purchase its exports versus what it spends to purchase imports. Therefore, a positive net Trade Balance strengthens the AUD, with the opposite effect if the Trade Balance is negative.
- USD/CAD fails to lure buyers and remains confined to over a one-month-old range.
- Rising Fed rate cut bets continue to weigh on the USD and cap gains for the major.
- Traders also seem reluctant to place aggressive directional bets ahead of the US NFP.
The USD/CAD pair shows resilience below the 200-hour Simple Moving Average (SMA), albeit seems to struggle to attract any meaningful buyers during the Asian session on Friday. Spot prices currently trade with a mild positive bias, around the 1.3670 area, as traders keenly await the release of the US monthly employment details before placing fresh directional bets.
The popularly known Nonfarm Payrolls (NFP) report is expected to show that the US economy added 185K jobs in May as compared to 175K previous and the unemployment rate held steady at 3.9%. This, along with Average Hourly Earnings, would influence the inflation trajectory and the Fed's future policy decision, which, in turn, will drive the US Dollar (USD) demand and provide a fresh directional impetus to the USD/CAD pair.
Heading into the key data risk, market participants have been pricing in a greater chance that the Federal Reserve (Fed) will start cutting interest rates cut in September in the wake of signs of a slowdown in the US economy. This, in turn, keeps the US Treasury bond yields and the USD depressed. Apart from this, this week's goodish rebound in Crude Oil prices is seen underpinning the commodity-linked Loonie and capping the USD/CAD pair.
Meanwhile, the Bank of Canada (BoC) lowered its benchmark rate for the first time in four years, from a more than two-decade high and signaled concern about slowing economic growth. The central bank also acknowledged improvement in the underlying inflation, fueling speculations about another rate reduction next month. This could cap the upside for the Canadian Dollar (CAD) and act as a tailwind for the USD/CAD pair.
The aforementioned mixed fundamental backdrop further warrants some caution for aggressive traders, suggesting that the USD/CAD pair is more likely to extend its range-bound price action on the last day of the week. Nevertheless, spot prices remain on track to register modest weekly gains, though remain in a familiar range held since early May.
- The Australian Dollar remains steady ahead of a speech from RBA Deputy Governor Andrew Hauser on the economic outlook.
- The Australian equity market appreciates with higher mining and energy stocks due to stronger commodity prices.
- China's Trade Balance could slightly increase to $73.00 billion in May, from the previous balance of $72.35 billion.
- The US Dollar struggles as the lower US labor data sparks hopes for two interest rate cuts by the Fed in 2024.
The Australian Dollar (AUD) remained steady on Friday following gains registered in the previous session. AUD traders adopt a cautious stance ahead of a speech by Andrew Hauser, Deputy Governor of the Reserve Bank of Australia (RBA), on Australia’s economic outlook and the release of China's Trade Balance data later in the day. Attention will also turn toward US employment data releases, including Average Hourly Earnings and Nonfarm Payrolls.
The Australian Dollar received support following the widened Trade Surplus on Thursday. Additionally, the hawkish statement by RBA Governor Michele Bullock on Wednesday reinforced the AUD’s strength and underpinned the AUD/USD pair. Bullock indicated that the central bank is prepared to increase interest rates if the Consumer Price Index (CPI) does not return to the target range of 1%-3%, according to NCA NewsWire.
The US Dollar (USD) struggled as the lower employment data from the United States (US) fueled hopes for two interest rate cuts by the US Federal Reserve (Fed) in 2024. On Thursday, Initial Jobless Claims showed the number of people claiming unemployment benefits in the US increased by 8,000 to 229,000 for the week ending May 31, surpassing market expectations of 220,000. This marks the highest reading since the eight-month high of 232,000 recorded in early May.
Daily Digest Market Movers: Australian Dollar remains steady due to investors’ caution
- The ASX 200 Index advanced toward 7,850 on Friday, with mining and energy stocks driving the market higher due to stronger commodity prices. This upward movement was influenced by signs of a cooling US labor market, which increased the Fed's expectations for two interest rate cuts this year.
- A Reuters poll from May 31 to June 5 indicated that nearly two-thirds of economists now predict an interest rate cut in September. Additionally, the CME FedWatch Tool suggests the probability of a Fed rate cut in September by at least 25 basis points has increased to nearly 70.0%, up from 51.0% a week earlier.
- Australia's Trade Balance widened to 6,548 ($ 4,321.68) million MoM in May, exceeding the expected 5,500 million and April's balance of 5,024 million. Imports plunged by 7.2% MoM in May, swinging from April’s 4.2% increase. Exports shrank 2.5% following the previous decline of 0.6%.
- On Wednesday, the ISM US Services PMI soared to 53.8 in May, marking its highest level in nine months and significantly surpassing the forecast of 50.8. In contrast, the ADP US Employment Change report showed that 152,000 new workers were added to payrolls in May, the lowest in four months and well below the forecast of 175,000 and the downwardly revised figure of 188,000 for April.
- Australia's Gross Domestic Product (GDP) was released on Wednesday, which grew 0.1% in the first quarter, against the expected 0.2% reading. On an annual basis, the economy grew 1.1%, slightly below the expected 1.2%.
Technical Analysis: Australian Dollar maintains its position above 0.6650
The Australian Dollar trades around 0.6660 on Friday. Analysis of the daily chart indicates a bullish bias for the AUD/USD pair as it consolidates within an ascending channel pattern. This bullish bias is further confirmed by the 14-day Relative Strength Index (RSI), which is above the 50 level.
The AUD/USD pair could target the psychological level of 0.6700, followed by May’s high of 0.6714. A breakthrough above this level could lead the pair to approach the upper boundary of the ascending channel around 0.6800.
On the downside, immediate support is at the 21-day Exponential Moving Average (EMA) at 0.6637, which aligns with the lower threshold of the ascending channel. Additional support is found at the psychological level of 0.6600. A further decline could pressure the AUD/USD pair toward the throwback support region at 0.6470.
AUD/USD: Daily Chart
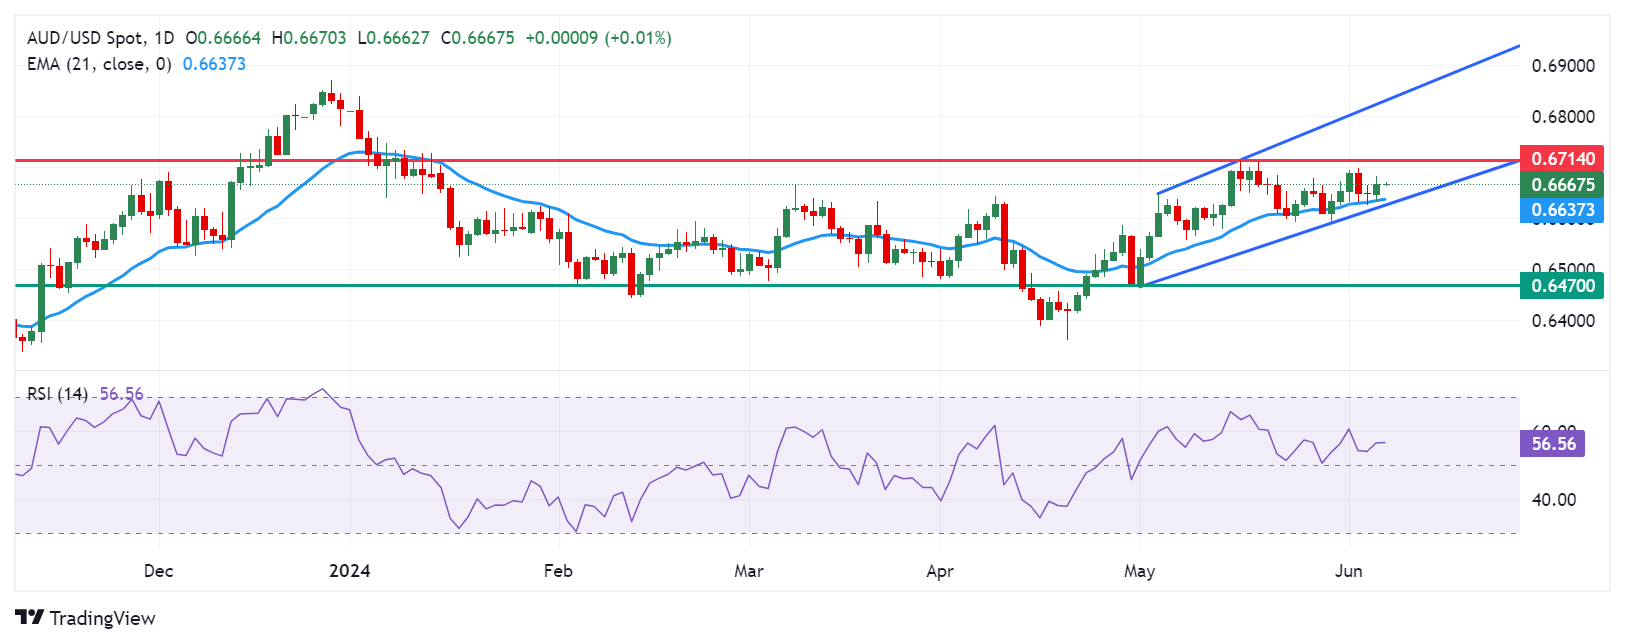
Australian Dollar price today
The table below shows the percentage change of the Australian Dollar (AUD) against listed major currencies today. The Australian Dollar was the strongest against the Swiss Franc.
| USD | EUR | GBP | CAD | AUD | JPY | NZD | CHF | |
| USD | -0.03% | 0.02% | 0.01% | 0.02% | 0.05% | 0.06% | 0.07% | |
| EUR | 0.03% | 0.06% | 0.05% | 0.06% | 0.10% | 0.10% | 0.11% | |
| GBP | -0.02% | -0.06% | 0.00% | 0.00% | 0.05% | 0.04% | 0.05% | |
| CAD | -0.01% | -0.05% | 0.02% | 0.03% | 0.06% | 0.08% | 0.06% | |
| AUD | -0.02% | -0.06% | 0.00% | -0.01% | 0.05% | 0.04% | 0.05% | |
| JPY | -0.05% | -0.10% | -0.06% | -0.07% | -0.05% | -0.02% | 0.00% | |
| NZD | -0.06% | -0.10% | -0.04% | -0.05% | -0.03% | -0.01% | 0.01% | |
| CHF | -0.06% | -0.11% | -0.05% | -0.06% | -0.05% | 0.00% | -0.01% |
The heat map shows percentage changes of major currencies against each other. The base currency is picked from the left column, while the quote currency is picked from the top row. For example, if you pick the Euro from the left column and move along the horizontal line to the Japanese Yen, the percentage change displayed in the box will represent EUR (base)/JPY (quote).
Australian Dollar FAQs
One of the most significant factors for the Australian Dollar (AUD) is the level of interest rates set by the Reserve Bank of Australia (RBA). Because Australia is a resource-rich country another key driver is the price of its biggest export, Iron Ore. The health of the Chinese economy, its largest trading partner, is a factor, as well as inflation in Australia, its growth rate, and Trade Balance. Market sentiment – whether investors are taking on more risky assets (risk-on) or seeking safe havens (risk-off) – is also a factor, with risk-on positive for AUD.
The Reserve Bank of Australia (RBA) influences the Australian Dollar (AUD) by setting the level of interest rates that Australian banks can lend to each other. This influences the level of interest rates in the economy as a whole. The main goal of the RBA is to maintain a stable inflation rate of 2-3% by adjusting interest rates up or down. Relatively high interest rates compared to other major central banks support the AUD, and the opposite for relatively low. The RBA can also use quantitative easing and tightening to influence credit conditions, with the former AUD-negative and the latter AUD-positive.
China is Australia’s largest trading partner so the health of the Chinese economy is a major influence on the value of the Australian Dollar (AUD). When the Chinese economy is doing well it purchases more raw materials, goods and services from Australia, lifting demand for the AUD, and pushing up its value. The opposite is the case when the Chinese economy is not growing as fast as expected. Positive or negative surprises in Chinese growth data, therefore, often have a direct impact on the Australian Dollar and its pairs.
Iron Ore is Australia’s largest export, accounting for $118 billion a year according to data from 2021, with China as its primary destination. The price of Iron Ore, therefore, can be a driver of the Australian Dollar. Generally, if the price of Iron Ore rises, AUD also goes up, as aggregate demand for the currency increases. The opposite is the case if the price of Iron Ore falls. Higher Iron Ore prices also tend to result in a greater likelihood of a positive Trade Balance for Australia, which is also positive of the AUD.
The Trade Balance, which is the difference between what a country earns from its exports versus what it pays for its imports, is another factor that can influence the value of the Australian Dollar. If Australia produces highly sought after exports, then its currency will gain in value purely from the surplus demand created from foreign buyers seeking to purchase its exports versus what it spends to purchase imports. Therefore, a positive net Trade Balance strengthens the AUD, with the opposite effect if the Trade Balance is negative.
- Indian Rupee edges lower on the renewed USD demand on Friday.
- The RBI’s Monetary Policy Committee (MPC) is anticipated to keep the repo rate unchanged at 6.50% at its June meeting.
- The RBI monetary policy meeting and US Nonfarm Payrolls (NFP) data will take centre stage on Friday.
Indian Rupee (INR) weakens on Friday on the modest recovery of the US Dollar (USD). The renewed USD demand from local importers and Indian equity outflows is likely to weigh on the INR in the near term despite the easing political uncertainties following India’s election. On the other hand, the potential intervention from the Reserve Bank of India (RBI) might support the Indian Rupee and cap the upside for the pair.
Investors will closely watch the RBI interest rate decision on Friday, with no change in rate expected. The RBI Monetary Policy Committee (MPC) had last changed the benchmark interest rate in February 2023. On the US docket, the employment data will be closely watched, including the Nonfarm Payrolls (NFP), Unemployment Rate and Average Hourly Earnings for May. Softer-than-expected data might spur the speculation of a Federal Reserve (Fed) rate cut dragging the Greenback and creating a headwind for USD/INR.
Daily Digest Market Movers: Indian Rupee struggles to gain ground ahead of key events
- “Expectations that the central bank will intervene to cap rupee weakness is also likely to spur natural offers (to sell dollars) near 83.50," a foreign exchange trader at a private bank said.
- Modi is set to negotiate terms with alliance members after his Bharatiya Janata Party (BJP) surprisingly failed to win a majority in India's election, per the Independent.
- According to Aljazeera, the BJP and its National Democratic Alliance (NDA), have won a majority despite having a much lower seat count than in the 2019 elections.
- The US weekly Initial Jobless Claims for the week ended May 31 increased by 8K to 229K from the previous week of 221K. This figure came in above the consensus of 220K.
- The four-week moving average of initial unemployment claims rose to 222K from 210K last month to near the highest level in 9 months.
- The NFP figure is projected to see 185,000 job additions in the US economy in May, while the Unemployment Rate is forecast to remain steady at 3.9% in the same report period.
Technical analysis: USD/INR’s positive outlook prevails above the 100-day EMA
The Indian Rupee trades softer on the day. The USD/INR pair maintains the constructive outlook on the daily timeframe as it broke above the descending trend channel that has been established since mid-April and holds above the key 100-day Exponential Moving Average (EMA). However, further consolidation cannot be ruled out since the pair hovers around the 50-midline, indicating a neutral level.
In the bullish event, a high of June 5 at 83.55 acts as an immediate resistance level for USD/INR. The additional upside target to watch is a high of April 17 at 83.72, followed by the 84.00 round mark.
The first downside filter for USD/INR will emerge in the 83.30-83.35 zone, portraying the resistance-turned-support level and the 100-day EMA. The key contention level is seen at the 83.00 psychological level. A break below this level will pave the way to a low of January 15 at 82.78.
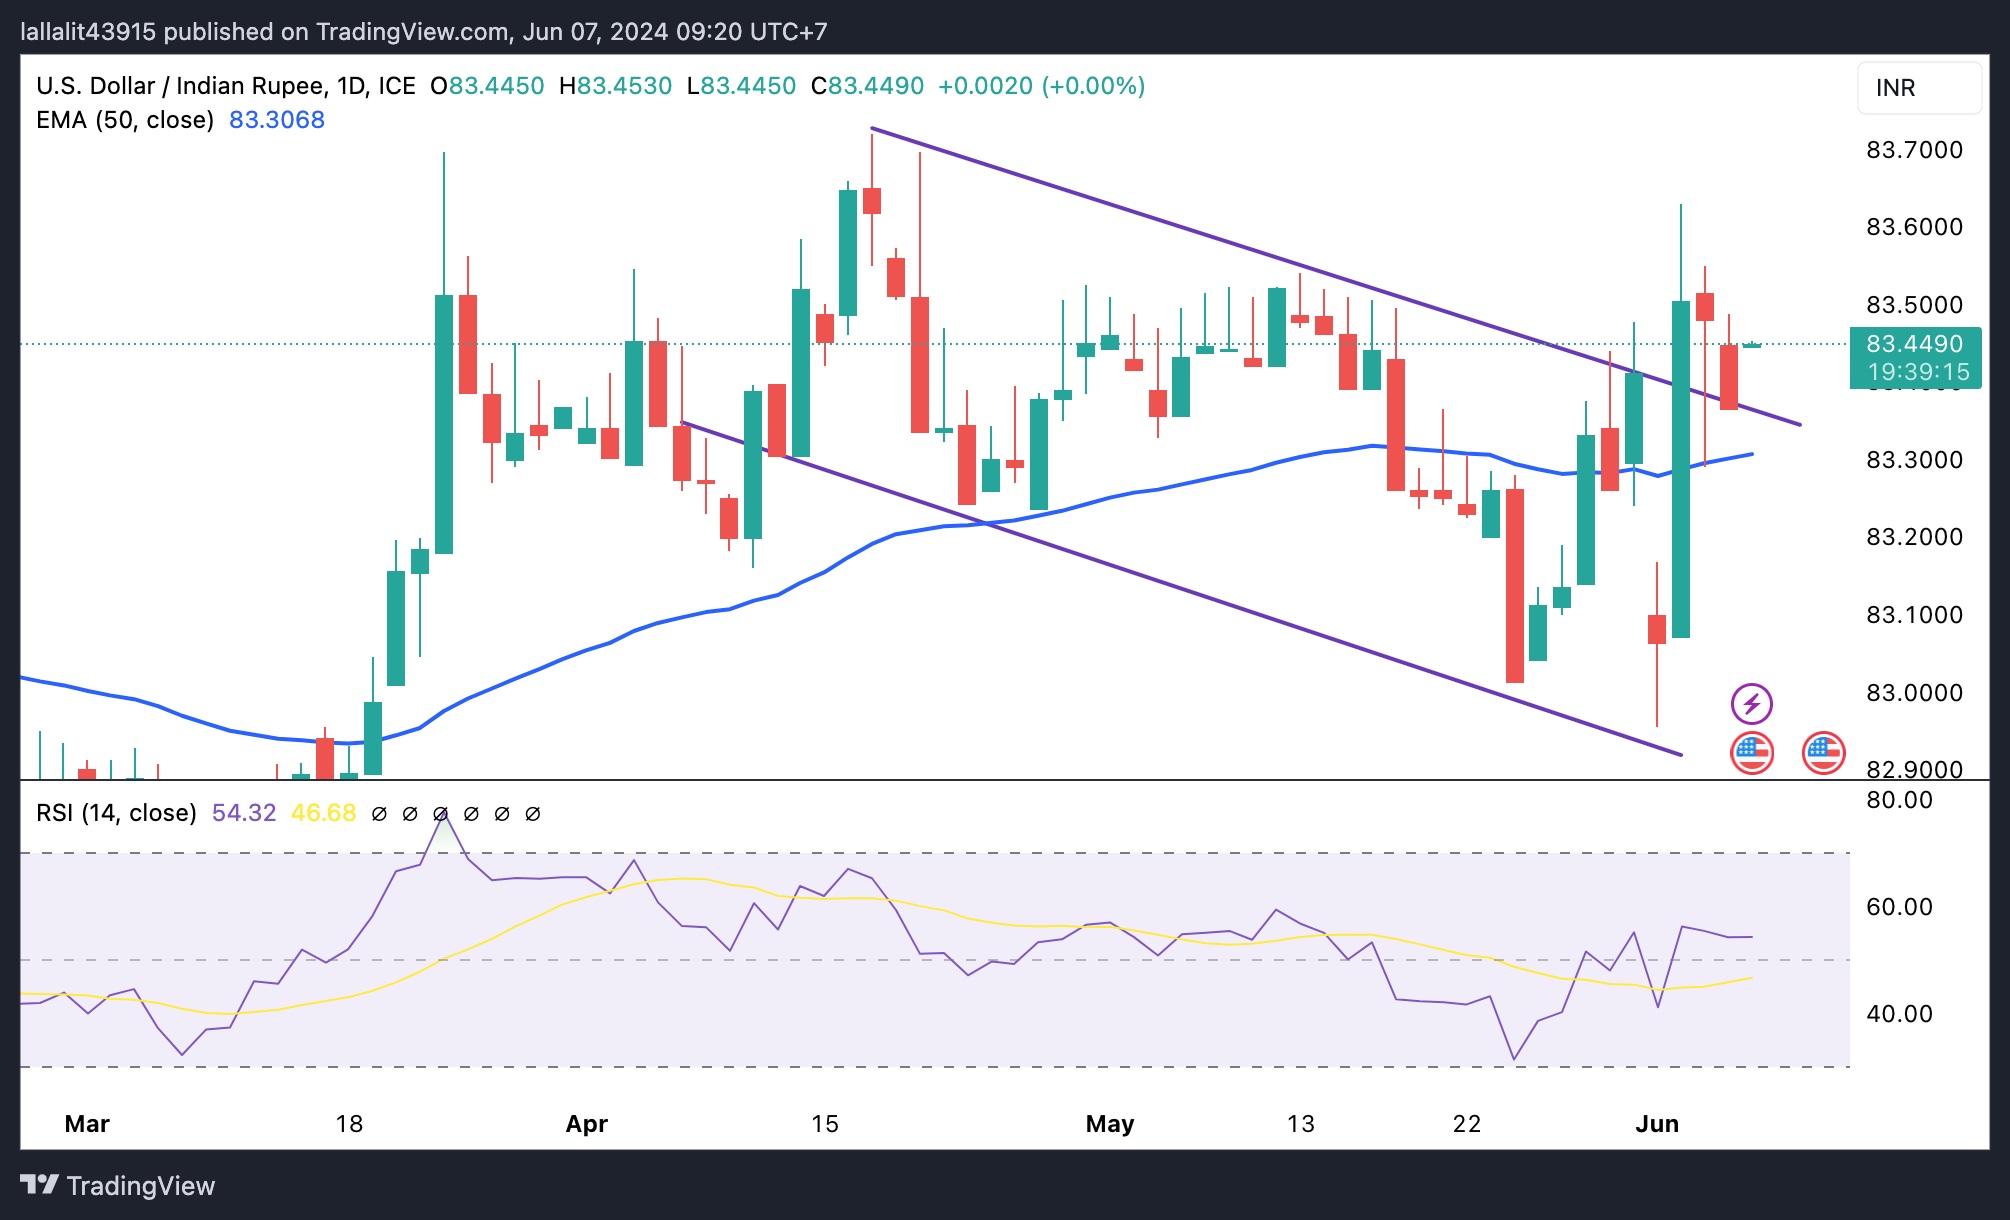
US Dollar price today
The table below shows the percentage change of US Dollar (USD) against listed major currencies today. US Dollar was the strongest against the New Zealand Dollar.
| USD | EUR | GBP | CAD | AUD | JPY | NZD | CHF | |
| USD | -0.02% | 0.02% | 0.01% | 0.05% | 0.02% | 0.09% | 0.08% | |
| EUR | 0.03% | 0.06% | 0.04% | 0.08% | 0.05% | 0.12% | 0.11% | |
| GBP | -0.03% | -0.06% | 0.00% | 0.02% | 0.01% | 0.06% | 0.05% | |
| CAD | -0.01% | -0.04% | 0.02% | 0.04% | 0.02% | 0.08% | 0.08% | |
| AUD | -0.05% | -0.08% | -0.02% | -0.04% | -0.01% | 0.04% | 0.03% | |
| JPY | -0.02% | -0.05% | -0.02% | -0.04% | 0.01% | 0.04% | 0.05% | |
| NZD | -0.09% | -0.12% | -0.06% | -0.08% | -0.04% | -0.07% | -0.01% | |
| CHF | -0.07% | -0.11% | -0.06% | -0.07% | -0.04% | -0.05% | 0.01% |
The heat map shows percentage changes of major currencies against each other. The base currency is picked from the left column, while the quote currency is picked from the top row. For example, if you pick the Euro from the left column and move along the horizontal line to the Japanese Yen, the percentage change displayed in the box will represent EUR (base)/JPY (quote).
Indian Rupee FAQs
The Indian Rupee (INR) is one of the most sensitive currencies to external factors. The price of Crude Oil (the country is highly dependent on imported Oil), the value of the US Dollar – most trade is conducted in USD – and the level of foreign investment, are all influential. Direct intervention by the Reserve Bank of India (RBI) in FX markets to keep the exchange rate stable, as well as the level of interest rates set by the RBI, are further major influencing factors on the Rupee.
The Reserve Bank of India (RBI) actively intervenes in forex markets to maintain a stable exchange rate, to help facilitate trade. In addition, the RBI tries to maintain the inflation rate at its 4% target by adjusting interest rates. Higher interest rates usually strengthen the Rupee. This is due to the role of the ‘carry trade’ in which investors borrow in countries with lower interest rates so as to place their money in countries’ offering relatively higher interest rates and profit from the difference.
Macroeconomic factors that influence the value of the Rupee include inflation, interest rates, the economic growth rate (GDP), the balance of trade, and inflows from foreign investment. A higher growth rate can lead to more overseas investment, pushing up demand for the Rupee. A less negative balance of trade will eventually lead to a stronger Rupee. Higher interest rates, especially real rates (interest rates less inflation) are also positive for the Rupee. A risk-on environment can lead to greater inflows of Foreign Direct and Indirect Investment (FDI and FII), which also benefit the Rupee.
Higher inflation, particularly, if it is comparatively higher than India’s peers, is generally negative for the currency as it reflects devaluation through oversupply. Inflation also increases the cost of exports, leading to more Rupees being sold to purchase foreign imports, which is Rupee-negative. At the same time, higher inflation usually leads to the Reserve Bank of India (RBI) raising interest rates and this can be positive for the Rupee, due to increased demand from international investors. The opposite effect is true of lower inflation.
| Raw materials | Closed | Change, % |
|---|---|---|
| Silver | 31.32 | 4.33 |
| Gold | 2375.85 | 0.85 |
| Palladium | 930.47 | 0.16 |
- Gold price enters a bullish consolidation phase near a two-week high touched on Thursday.
- Traders prefer to wait for the US NFP report before positioning for the near-term trajectory.
- Fed rate cut bets are keeping the US bond yields and the USD depressed, lending some support.
Gold price (XAU/USD) is seen oscillating in a narrow trading range during the Asian session on Friday and consolidating its gains to a two-week high registered over the past two days. Investors now opt to move to the sidelines and wait for the release of the closely-watched monthly employment details from the United States (US). The popularly known Nonfarm Payrolls (NFP) report will play a key role in influencing the Federal Reserve's (Fed) future policy decisions, which, in turn, should provide a fresh impetus to the non-yielding yellow metal.
Heading into the key data risk, rising bets for an imminent interest rate cut by the Fed in September, bolstered by the incoming softer US macro data, might continue to act as a tailwind for the Gold price. Furthermore, dovish Fed expectations keep the US Treasury bond yields and the US Dollar (USD) depressed near a multi-week low, which should further contribute to limiting the downside for the commodity. Apart from this, geopolitical tensions stemming from conflicts in the Middle East suggest that the path of least resistance for the XAU/USD is to the upside.
Daily Digest Market Movers: Gold price bulls turn cautious ahead of the crucial US jobs report
- Growing acceptance that the Federal Reserve will start cutting interest rates later this year amid signs of a slowdown in the US economy continues to lend some support to the non-yielding Gold price.
- The US Department of Labor (DoL) reported on Thursday that the number of Americans applying for unemployment insurance benefits increased more than expected by 229K in the week ending June 1.
- This, along with Wednesday's ADP report on private-sector employment, suggests that the US labor market is cooling, cementing bets for a September Fed rate cut and weighing on the US Treasury bond yields.
- The yield on the benchmark 10-year US government bond languishes near its lowest level in two months, which, in turn, is seen undermining the US Dollar and acting as a tailwind for the yellow metal.
- The underlying strong bullish sentiment across the global equity markets might hold back traders from positioning for any further gains ahead of the release of the crucial US monthly employment details.
- The popularly known Nonfarm Payrolls (NFP) report is expected to show that the US economy added 185K jobs in May as compared to 175K previous and the unemployment rate held steady at 3.9%.
- Apart from this, Average Hourly Earnings will influence the inflation trajectory and the Fed's future policy decision, which, in turn, will help in determining the next leg of a directional move for the XAU/USD.
Technical Analysis: Gold price is likely to confront stiff resistance near the $2,400 round-figure mark
From a technical perspective, Thursday’s sustained move beyond the $2,364 area, or last week's swing high, was seen as a fresh trigger for bullish traders. That said, mixed oscillators on the daily chart warrant some caution before positioning for any further gains. Hence, any subsequent move up is more likely to confront stiff resistance and remain capped near the $2,400 mark. Some follow-through buying, however, has the potential to lift the Gold price to the next relevant hurdle near the $2,425 zone en route to the $2,450 region, or the all-time peak touched in May.
On the flip side, the $2,060 horizontal zone now seems to protect the immediate downside. Any further decline might be seen as a buying opportunity around the $2,340 region. This should help limit the downside for the Gold price near the $2,315-2,314 area or the multi-week low touched on Tuesday. A convincing break below, however, will confirm a breakdown through the 50-day Simple Moving Average (SMA) and pave the way for deeper losses. The XAU/USD might then weaken further below the $2,300 round-figure mark and test the $2,280 support zone.
Gold FAQs
Gold has played a key role in human’s history as it has been widely used as a store of value and medium of exchange. Currently, apart from its shine and usage for jewelry, the precious metal is widely seen as a safe-haven asset, meaning that it is considered a good investment during turbulent times. Gold is also widely seen as a hedge against inflation and against depreciating currencies as it doesn’t rely on any specific issuer or government.
Central banks are the biggest Gold holders. In their aim to support their currencies in turbulent times, central banks tend to diversify their reserves and buy Gold to improve the perceived strength of the economy and the currency. High Gold reserves can be a source of trust for a country’s solvency. Central banks added 1,136 tonnes of Gold worth around $70 billion to their reserves in 2022, according to data from the World Gold Council. This is the highest yearly purchase since records began. Central banks from emerging economies such as China, India and Turkey are quickly increasing their Gold reserves.
Gold has an inverse correlation with the US Dollar and US Treasuries, which are both major reserve and safe-haven assets. When the Dollar depreciates, Gold tends to rise, enabling investors and central banks to diversify their assets in turbulent times. Gold is also inversely correlated with risk assets. A rally in the stock market tends to weaken Gold price, while sell-offs in riskier markets tend to favor the precious metal.
The price can move due to a wide range of factors. Geopolitical instability or fears of a deep recession can quickly make Gold price escalate due to its safe-haven status. As a yield-less asset, Gold tends to rise with lower interest rates, while higher cost of money usually weighs down on the yellow metal. Still, most moves depend on how the US Dollar (USD) behaves as the asset is priced in dollars (XAU/USD). A strong Dollar tends to keep the price of Gold controlled, whereas a weaker Dollar is likely to push Gold prices up.
- WTI price gains ground due to rising speculation of a Fed rate cut in September.
- ECB implemented a 25-basis point rate cut on Thursday.
- Oil prices appreciate as the lower US employment data spark hopes for two rate cuts by the Fed in 2024.
West Texas Intermediate (WTI) Oil price extends its gains for the third session, trading around $75.50 per barrel during the Asian session on Friday. The appreciation in crude Oil prices can be attributed to rising speculation of an interest rate cut by the US Federal Reserve (Fed) in September, following a 25-basis points rate cut implemented by the European Central Bank (ECB) on Thursday.
A Reuters poll conducted from May 31 to June 5 has indicated that nearly two-thirds of economists now predict an interest rate cut in September. Additionally, the CME FedWatch Tool suggests the probability of a Fed rate cut in September by at least 25 basis points has increased to nearly 70.0%, up from 51.0% a week earlier.
The lower employment data from the United States (US) fueled hopes for two interest rate cuts by the US Federal Reserve (Fed) this year. Lower interest rates in the United States (US), the largest Oil consumer country, could stimulate economic activity and boost Oil demand.
The ADP US Employment Change report indicated that 152,000 new workers were added to payrolls in May, the lowest in four months and significantly below the forecast of 175,000 and the downwardly revised figure of 188,000 for April. Initial Jobless Claims in the US increased by 8,000 to 229,000 for the week ending May 31, surpassing market expectations of 220,000. This marks the highest reading since the eight-month high of 232,000 recorded in early May. Traders await the release of US employment data releases on Friday, including the Average Hourly Earnings and Nonfarm Payrolls.
On Sunday, the Organization of the Petroleum Exporting Countries and its allies (OPEC+) agreed to extend most of their supply cuts into 2025. However, the group allowed for voluntary cuts from eight member countries to be gradually unwound starting in October. By December, more than 500,000 barrels per day (bpd) are expected to re-enter the market, with a total of 1.8 million bpd returning by June 2025, according to Reuters.
The People’s Bank of China (PBoC) set the USD/CNY central rate for the trading session ahead on Thursday at 7.1106, as against the previous day's fix of 7.1108 and 7.2430 Reuters estimates.
- NZD/USD gains ground around 0.6195 in Friday’s Asian session.
- The growing speculation of a Fed rate cut this year weighs on the US Dollar.
- The upbeat Chinese May Services PMI data supports the China-proxy NZD.
The NZD/USD pair trades on a stronger note near 0.6195 during the early Asian session on Friday. The weaker US Dollar (USD) amid rising speculation of an interest rate cut from the US Federal Reserve (Fed) this year continues to underpin the NZD/USD pair. The market might turn cautious later on Friday ahead of the release of highly anticipated US Nonfarm Payrolls (NFP) data for May.
The weaker US economic data and softer labour market data this week spur expectations of an interest rate cut from the Fed in September. The US weekly Initial Jobless Claims for the week ended May 31 increased by 8K to 229K from the previous week of 221K. This figure came in above the consensus of 220K. Meanwhile, the 4-week moving average of initial unemployment claims rose to 222K from 210K last month to near the highest level in 9 months. On Wednesday, the US ADP Employment report showed 152K net job additions, down from the previous reading of 188K.
According to Reuters polls conducted between May 31 and June 5, nearly two-thirds of economists now anticipate the Fed to cut interest rates in September. The US May NFP report will be closely watched, which is estimated to see 185K job additions in the US economy in May. The softer-than-expected data could fuel the speculation of Fed rate cuts and undermine the Greenback against the Kiwi.
The encouraging Chinese data lends some support to the New Zealand Dollar (NZD) as China is New Zealand's major trade partner. Data released from Caixin on Wednesday showed that China's Services PMI improved to 54.0 in May from 52.5 in April, above market estimates of 52.6 in the reporting period.
Japanese Finance Minister Shunichi Suzuki said on Friday that he will take action against excessive currency volatility when necessary and will consider the effectiveness of intervention.
Key quotes
Emphasizes importance of maintaining market trust in public finances.
Drop in Japan foreign reserves as of end-May partially reflect FX intervention.
Limit FX intervention use.
To address excessive currency volatility when necessary.
Refrains from commenting on intervention funds.
Proposes limiting tax rebate to this year.
To consider effectiveness of intervention.
No fund limit for FX intervention.
Market determines FX, reflecting fundamental.
Market reaction
At the time of writing, USD/JPY is trading 0.12% higher on the day to trade at 155.80.
Japanese Yen FAQs
The Japanese Yen (JPY) is one of the world’s most traded currencies. Its value is broadly determined by the performance of the Japanese economy, but more specifically by the Bank of Japan’s policy, the differential between Japanese and US bond yields, or risk sentiment among traders, among other factors.
One of the Bank of Japan’s mandates is currency control, so its moves are key for the Yen. The BoJ has directly intervened in currency markets sometimes, generally to lower the value of the Yen, although it refrains from doing it often due to political concerns of its main trading partners. The current BoJ ultra-loose monetary policy, based on massive stimulus to the economy, has caused the Yen to depreciate against its main currency peers. This process has exacerbated more recently due to an increasing policy divergence between the Bank of Japan and other main central banks, which have opted to increase interest rates sharply to fight decades-high levels of inflation.
The BoJ’s stance of sticking to ultra-loose monetary policy has led to a widening policy divergence with other central banks, particularly with the US Federal Reserve. This supports a widening of the differential between the 10-year US and Japanese bonds, which favors the US Dollar against the Japanese Yen.
The Japanese Yen is often seen as a safe-haven investment. This means that in times of market stress, investors are more likely to put their money in the Japanese currency due to its supposed reliability and stability. Turbulent times are likely to strengthen the Yen’s value against other currencies seen as more risky to invest in.
| Index | Change, points | Closed | Change, % |
|---|---|---|---|
| NIKKEI 225 | 213.34 | 38703.51 | 0.55 |
| Hang Seng | 51.84 | 18476.8 | 0.28 |
| ASX 200 | 52.8 | 7821.8 | 0.68 |
| DAX | 76.73 | 18652.67 | 0.41 |
| CAC 40 | 33.55 | 8040.12 | 0.42 |
| Dow Jones | 78.84 | 38886.17 | 0.2 |
| S&P 500 | -1.07 | 5352.96 | -0.02 |
| NASDAQ Composite | -14.78 | 17173.12 | -0.09 |
| Pare | Closed | Change, % |
|---|---|---|
| AUDUSD | 0.66673 | 0.27 |
| EURJPY | 169.458 | -0.1 |
| EURUSD | 1.08898 | 0.18 |
| GBPJPY | 199.026 | -0.27 |
| GBPUSD | 1.27908 | 0.01 |
| NZDUSD | 0.61983 | 0.07 |
| USDCAD | 1.36685 | -0.16 |
| USDCHF | 0.88941 | -0.42 |
| USDJPY | 155.596 | -0.28 |


© 2000-2026. Sva prava zaštićena.
Sajt je vlasništvo kompanije Teletrade D.J. LLC 2351 LLC 2022 (Euro House, Richmond Hill Road, Kingstown, VC0100, St. Vincent and the Grenadines).
Svi podaci koji se nalaze na sajtu ne predstavljaju osnovu za donošenje investicionih odluka, već su informativnog karaktera.
The company does not serve or provide services to customers who are residents of the US, Canada, Iran, The Democratic People's Republic of Korea, Yemen and FATF blacklisted countries.
Izvršenje trgovinskih operacija sa finansijskim instrumentima upotrebom marginalne trgovine pruža velike mogućnosti i omogućava investitorima ostvarivanje visokih prihoda. Međutim, takav vid trgovine povezan je sa potencijalno visokim nivoom rizika od gubitka sredstava. Проведение торговых операций на финанcовых рынках c маржинальными финанcовыми инcтрументами открывает широкие возможноcти, и позволяет инвеcторам, готовым пойти на риcк, получать выcокую прибыль, но при этом неcет в cебе потенциально выcокий уровень риcка получения убытков. Iz tog razloga je pre započinjanja trgovine potrebno odlučiti o izboru odgovarajuće investicione strategije, uzimajući u obzir raspoložive resurse.
Upotreba informacija: U slučaju potpunog ili delimičnog preuzimanja i daljeg korišćenja materijala koji se nalazi na sajtu, potrebno je navesti link odgovarajuće stranice na sajtu kompanije TeleTrade-a kao izvora informacija. Upotreba materijala na internetu mora biti praćena hiper linkom do web stranice teletrade.org. Automatski uvoz materijala i informacija sa stranice je zabranjen.
Ako imate bilo kakvih pitanja, obratite nam se pr@teletrade.global.
транcфери