- Analiza
- Novosti i instrumenti
- Vesti sa tržišta
Forex-novosti i prognoze od 06-06-2024
- AUD/USD posts modest gains around 0.6670 in Friday’s early Asian session.
- The softer US employment data this week triggered the Fed rate cut expectation in September.
- RBA’s Bullock said the central bank won’t hesitate to hike again if inflation remains sticky.
The AUD/USD pair trades with mild gains near 0.6670 on Friday during the early Asian trading hours. The growing speculation about the US Federal Reserve (Fed) rate cut and softer US economic data weigh on the US Dollar (USD) and create a tailwind for AUD/USD. Later on Friday, the US Nonfarm Payrolls (NFP) data for May will be in the spotlight.
The softer US economic data this week spurred the Fed rate cut expectation in September. Traders are now pricing in a nearly 68% odds chance of a rate cut for the September meeting, up from 50% at the beginning of the week, according to the CME FedWatch tool.
The number of Americans claiming jobless benefits for the week ended May 31 rose 8,000 to 229,000 from 221,000 in the previous week, higher than the forecast of 220K, according to the Labour Department on Thursday. Earlier this week, the US Manufacturing PMI came in weaker than the expectation, dropping to 48.7 in May from 49.2 in April.
On the other hand, the hawkish tone from Reserve Bank of Australia (RBA) Governor Michele Bullock on Wednesday has provided some support to the Australian Dollar (AUD). RBA’s Bullock said the central bank Plan A is to remain "data-driven," indicating the RBA will maintain its neutral stance for the time being. However, stickier than expected inflation would prompt the central bank to raise interest rates again.
- GBP/USD holds positive ground near 1.2795 in Friday’s early Asian session.
- Higher Fed rate cut bets weigh on the US Dollar and US bond yields.
- Investors expect the BoE to deliver two rate cuts this year.
The GBP/USD pair trades in positive territory for the third consecutive day around 1.2795 during the early Asian session on Friday. In the absence of key UK economic data releases, the GBP/USD pair will be influenced by the USD. All eyes will be on the US Nonfarm Payrolls (NFP) data for May, which is due later on Friday.
Traders raised their bets that the US Federal Reserve (Fed) would cut interest rates later this year, dragging the US Dollar (USD) and bond yields lower. Meanwhile, the US Dollar Index (DXY), a measure of the value of the USD relative to a basket of foreign currencies, drops to 104.10, while the US 10-year benchmark edges lower to 4.285%. Markets have priced in about 68% odds of a Fed rate cut in September, up from 55% at the beginning of the week, according to the CME FedWatch tool.
On Thursday, the US Department of Labor reported that the US weekly Initial Jobless Claims for the week ending May 31 rose by 229,000 from the previous reading of 221,000, above the market consensus of 220,000. Investors will take more cues from the US May employment data.
The NFP figure is projected to see 185,000 job additions in the US economy in May, while the Unemployment Rate is forecast to remain steady at 3.9% in the same report period. Softer-than-expected employment data might trigger speculation of a Fed rate cut, which further exerts some selling pressure on the Greenback.
On the other hand, the UK Employment data and the monthly Gross Domestic Product (GDP) data for April will be released. These reports might offer some hints about rate cut expectations from the Bank of England (BoE). The markets expect that the UK central bank will deliver two rate cuts this year and will begin easing policy from the August meeting.
- EUR/USD bulls keep bids buoyed on Thursday, but technical ceiling remains.
- Broader markets looking ahead to Friday’s US NFP print.
- Fed rate cut hopes pin into September, ECB unlikely to bring a follow-up cut.
EUR/USD pushed back into near-term highs on Thursday, easing below 1.0870 in early market action before recovering ground and re-pinning into familiar technical levels just below 1.0900 to close out the US market session.
The European Central Bank (ECB) delivered a hotly-anticipated quarter-point rate cut this week, but according to sources within the ECB, it is unlikely that ECB policymakers will be delivering a follow-up cut in July as many investors had widely expected. With markets broadly expecting a quarter-point cut from the Federal Reserve (Fed) in September, it is unlikely that the rate differential between the Euro and Greenback will widen as much as initial expectations.
According to the CME’s FedWatch Tool, rate traders are pricing in 70% odds of at least a 25 basis point trim from the Fed when it gathers in September.
European final Gross Domestic Product (GDP) figures are slated for early Friday, but markets are not expecting any wide swings from preliminary figures. QoQ Q1 pan-EU GDP is expected to print at 0.3% with annualized YoY GDP expected at 0.4%.
US Nonfarm Payrolls (NFP) labor figures will dominate market focus on Friday, and median market forecasts are expecting May’s net US job additions to rise to 185K from the previous month’s 175K. US Average Hourly Earnings are also expected to rise 0.3% MoM compared to the previous 0.2%.
An appearance from ECB President Christine Lagarde, slated to come later in the US market window, will round out the trading week’s key schedule events.
EUR/USD technical outlook
EUR/USD is building out a technical base after breaking through descending trendlines this week, and the pair is poised for an extension after pricing in a bullish rebound from the 200-day Exponential Moving Average (EMA) at 1.0807. The pair is marred in medium-term consolidation patterns, but a pullback towards the 1.0800 handle could see bidders return to the fold as the 50-day EMA crosses over the long-term MA.
EUR/USD daily chart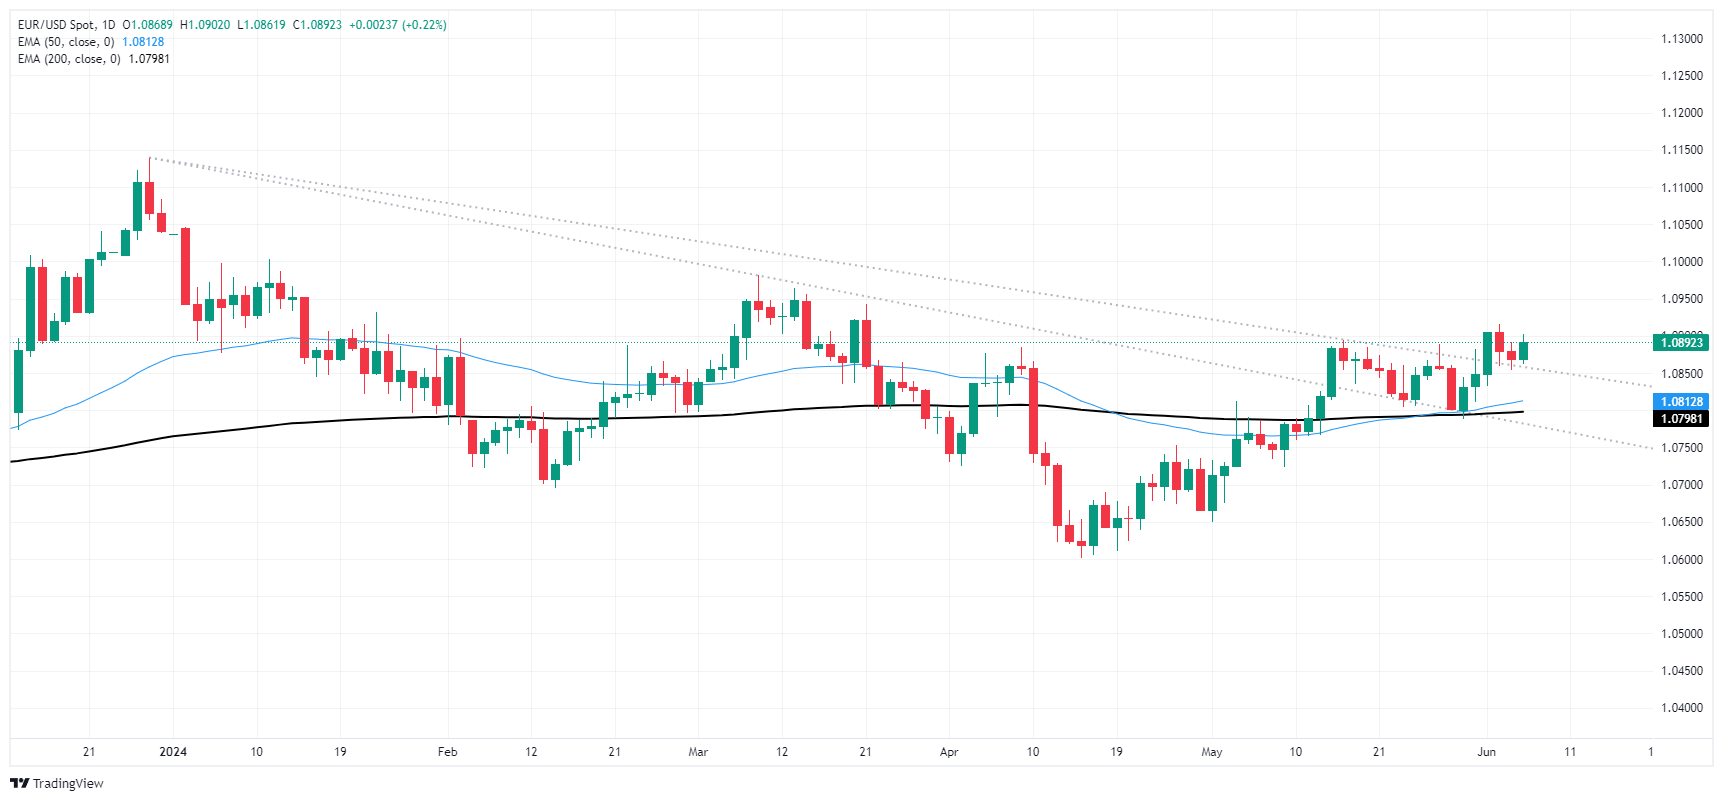
- EUR/JPY trades at 169.46, virtually unchanged, following ECB's interest rate cut.
- Technical outlook indicates consolidation between 169.40 and 170.00, with subdued momentum.
- Key resistance at 170.00, June 3 high of 170.89, and YTD high of 171.58.
- Support levels at 168.50 (Senkou Span A), 167.45 (Kijun-Sen), and 166.90 (Senkou Span B).
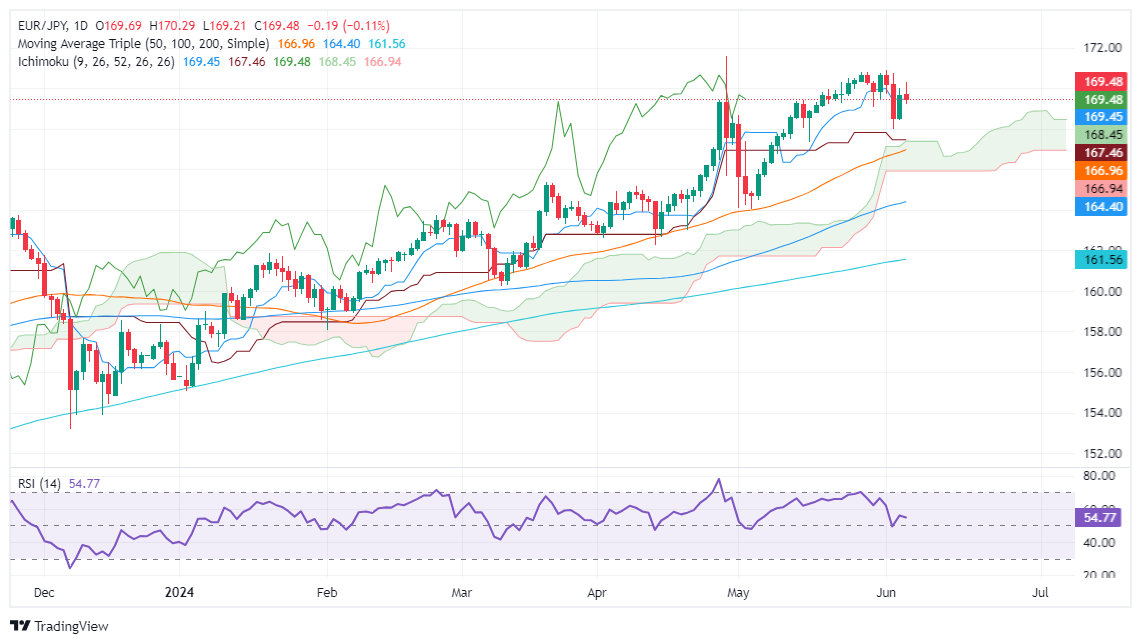
The EUR/JPY registered minimal losses of 0.13% on Thursday after the European Central Bank (ECB) decided to cut interest rates, failing to undermine the Euro. Nevertheless, the cross-pair trades below the 170.00 figure, exchange hands at 169.46, virtually unchanged.
EUR/JPY Price Analysis: Technical outlook
The daily chart hints the pair consolidated at around 169.40-170.00 with momentum set to remain subdued. The Relative Strength Index (RSI) has fluctuated between bullish and bearish momentum, indicating that neither buyers nor sellers are in charge.
However, if the EUR/JPY edges above 170.00, that would exacerbate a rally toward the year-to-date (YTD) high. That said, the next resistance would be the June 3 high of 170.89, followed by the YTD high at 171.58.
Conversely, if EUR/JPY slumps below 169.40, that would exacerbate a drop toward the top of the Ichimoku cloud. Therefore, the first support would be the Senkou Span A at 168.50, followed by the Kiju-Sen at 167.45. Further losses lie beneath at 166.9, the Senkou Span B.
EUR/JPY Price Action – Daily Charts
- WTI continues to recover ground as rate cut hopes bolster appetite.
- Crude Oil markets face further challenges as oversupply risks remain.
- OPEC+ expected to phase out production limits, adding to supply woes.
West Texas Intermediate (WTI) US Crude Oil recovered to $75.50 per barrel in thin market trading on Thursday, regaining recently-lost ground as energy traders try to shake off looming oversupply threats to focus on rising hopes of a Federal Reserve (Fed) rate cut in the third quarter.
The American Petroleum Institute (API) and the Energy Information Administration (EIA) confirmed another sharp buildup in US Crude Oil supplies this week, with barrel counts rising steeply from previous drawdowns that failed to stem the flow of US-produced barrels. Domestic demand, which was broadly expected to rise heading into the Memorial Day holiday driving season, failed to materialize. Consumer markets were broadly unable to sop up excess production at US refining facilities, and refined petroleum products have built up downstream from raw Crude Oil production.
After years of trying to bolster global Crude Oil prices using voluntary production limits, the Organization of the Petroleum Exporting Countries (OPEC) and its extended network of allied non-member states, OPEC+, are poised to phase out voluntary production caps that have kept north of 2.2 million barrels per day out of global supply lines. OPEC+ members that have shouldered the majority of the burden of limiting Crude Oil output rely heavily on selling Crude Oil in order to balance government budgets, and OPEC+ members have grown weary of sacrificing government receipts. OPEC+ assured markets that the phase out would be data dependent, but energy markets still balked at the prospect of additional oversupply in global barrel markets, sending Crude Oil prices into the lowest levels since February.
Broader market sentiment is planted firmly into hopes of rate cuts from the Federal Reserve (Fed). Rate markets are pricing in around 70% odds of at least a single quarter point cut from the Fed in September.
WTI technical outlook
WTI has extended into a two-day recovery, climbing from a near-term bottom of $72.45, but US Crude Oil remains steeply off of recent levels, trading on the low side of the 200-day Exponential Moving Average (EMA) at $78.78.
US Crude Oil bulls are aiming to drag WTI bids back into a recent consolidation zone around the $78.00 handle, though an exhaustion play could be on the cards with the 50-day EMA declining through the long-term MA.
WTI daily chart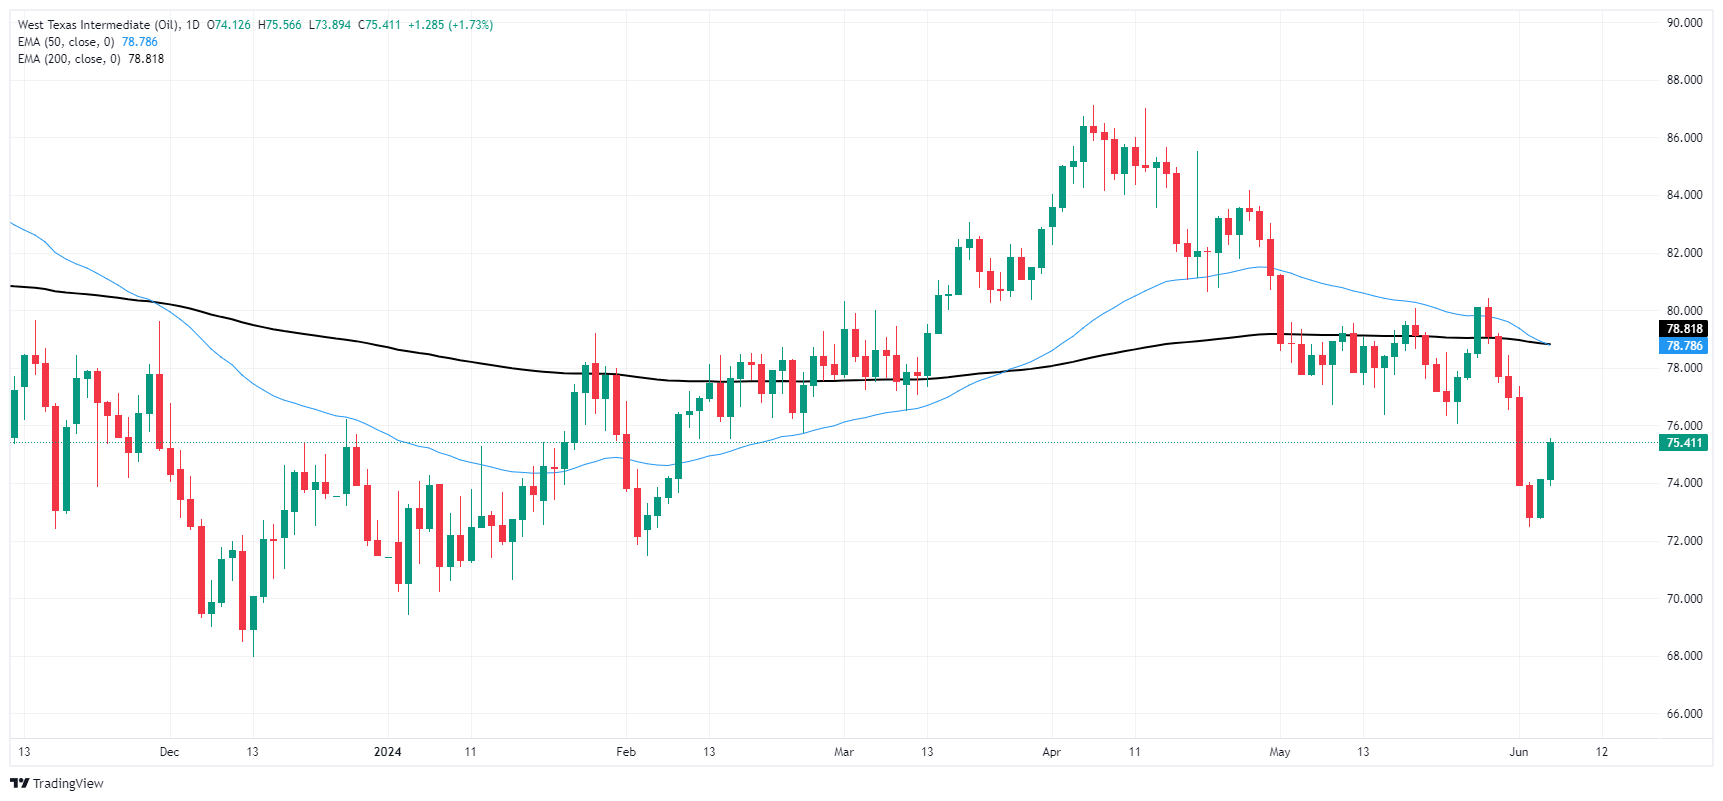
- USD/JPY declines to 155.60 after hitting a high of 156.44, amid cautious market sentiment.
- Mixed signals from US economic data, with JOLTS and ADP reports falling short of expectations, pressuring the pair.
- Technical outlook: First support at 50-DMA (154.98); resistance at June 4 high (156.48), followed by April 26 high (158.44) and YTD high (160.32).
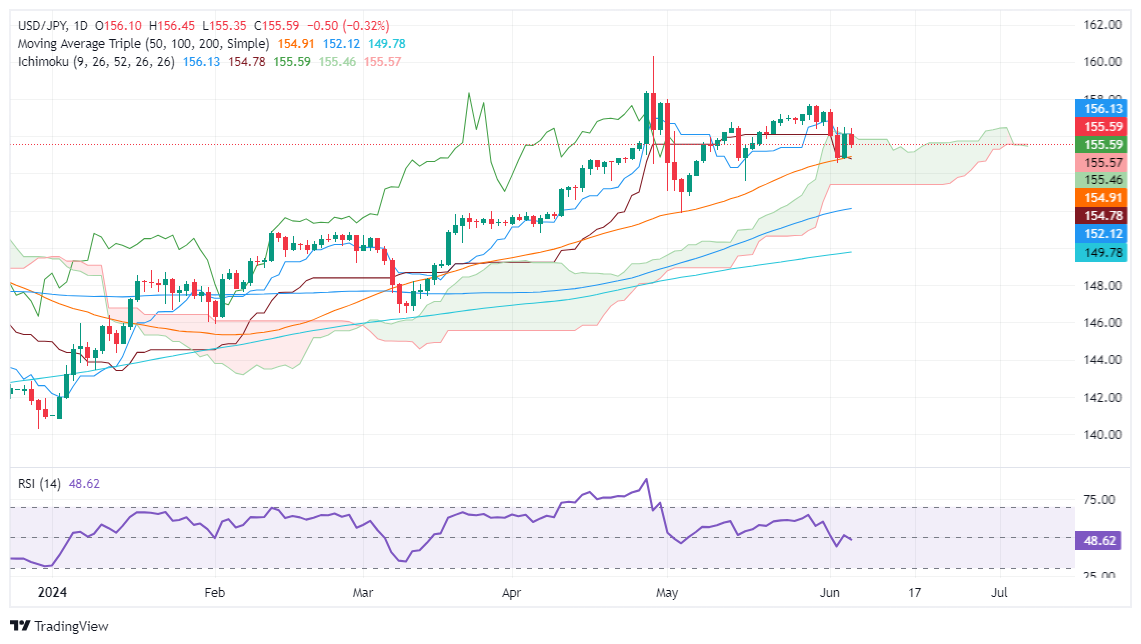
The USD/JPY registered modest losses of 0.30% on Thursday, as the Greenback remains on the backfoot ahead of crucial US jobs data on Friday. Nevertheless, a soft US JOLTS report, followed by ADP Employment Change missing estimates, could be a prelude to May’s Nonfarm Payrolls report. Therefore, the major remained pressured and traded at 155.60 after hitting a high of 156.44.
USD/JPY Price Analysis: Technical outlook
From a daily chart perspective, the pair is neutral to upward biased, but buyers seem to be losing momentum. The Relative Strength Index (RSI) has been seesawing between bullish and bearish territory, yet the near-term suggests that sellers are gathering traction.
That said, the USD/JPY's first support would be the 50-day moving average (DMA) at 154.98. A breach of the latter will expose the bottom of the Ichimoku Cloud (Kumo) at around 153.40/50.
Conversely, if buyers push prices above the June 4 high of 156.48, that could sponsor a leg-up toward 157.00. On further strength, the next supply zone would be the April 26 high of 158.44, followed by the year-to-date (YTD) high of 160.32.
USD/JPY Price Action – Daily Chart
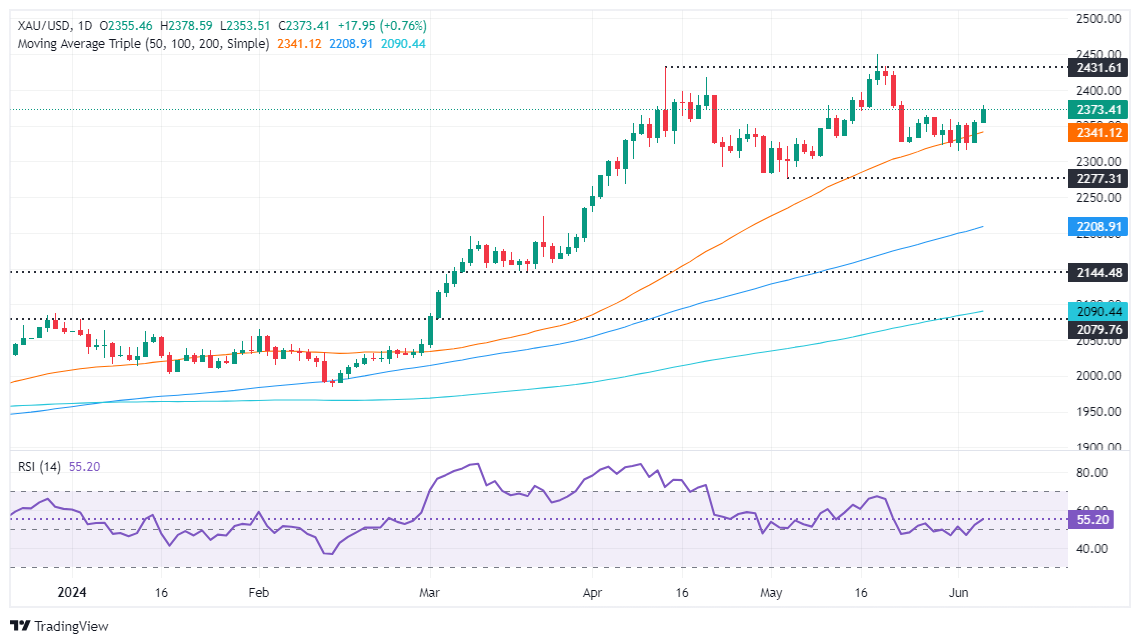
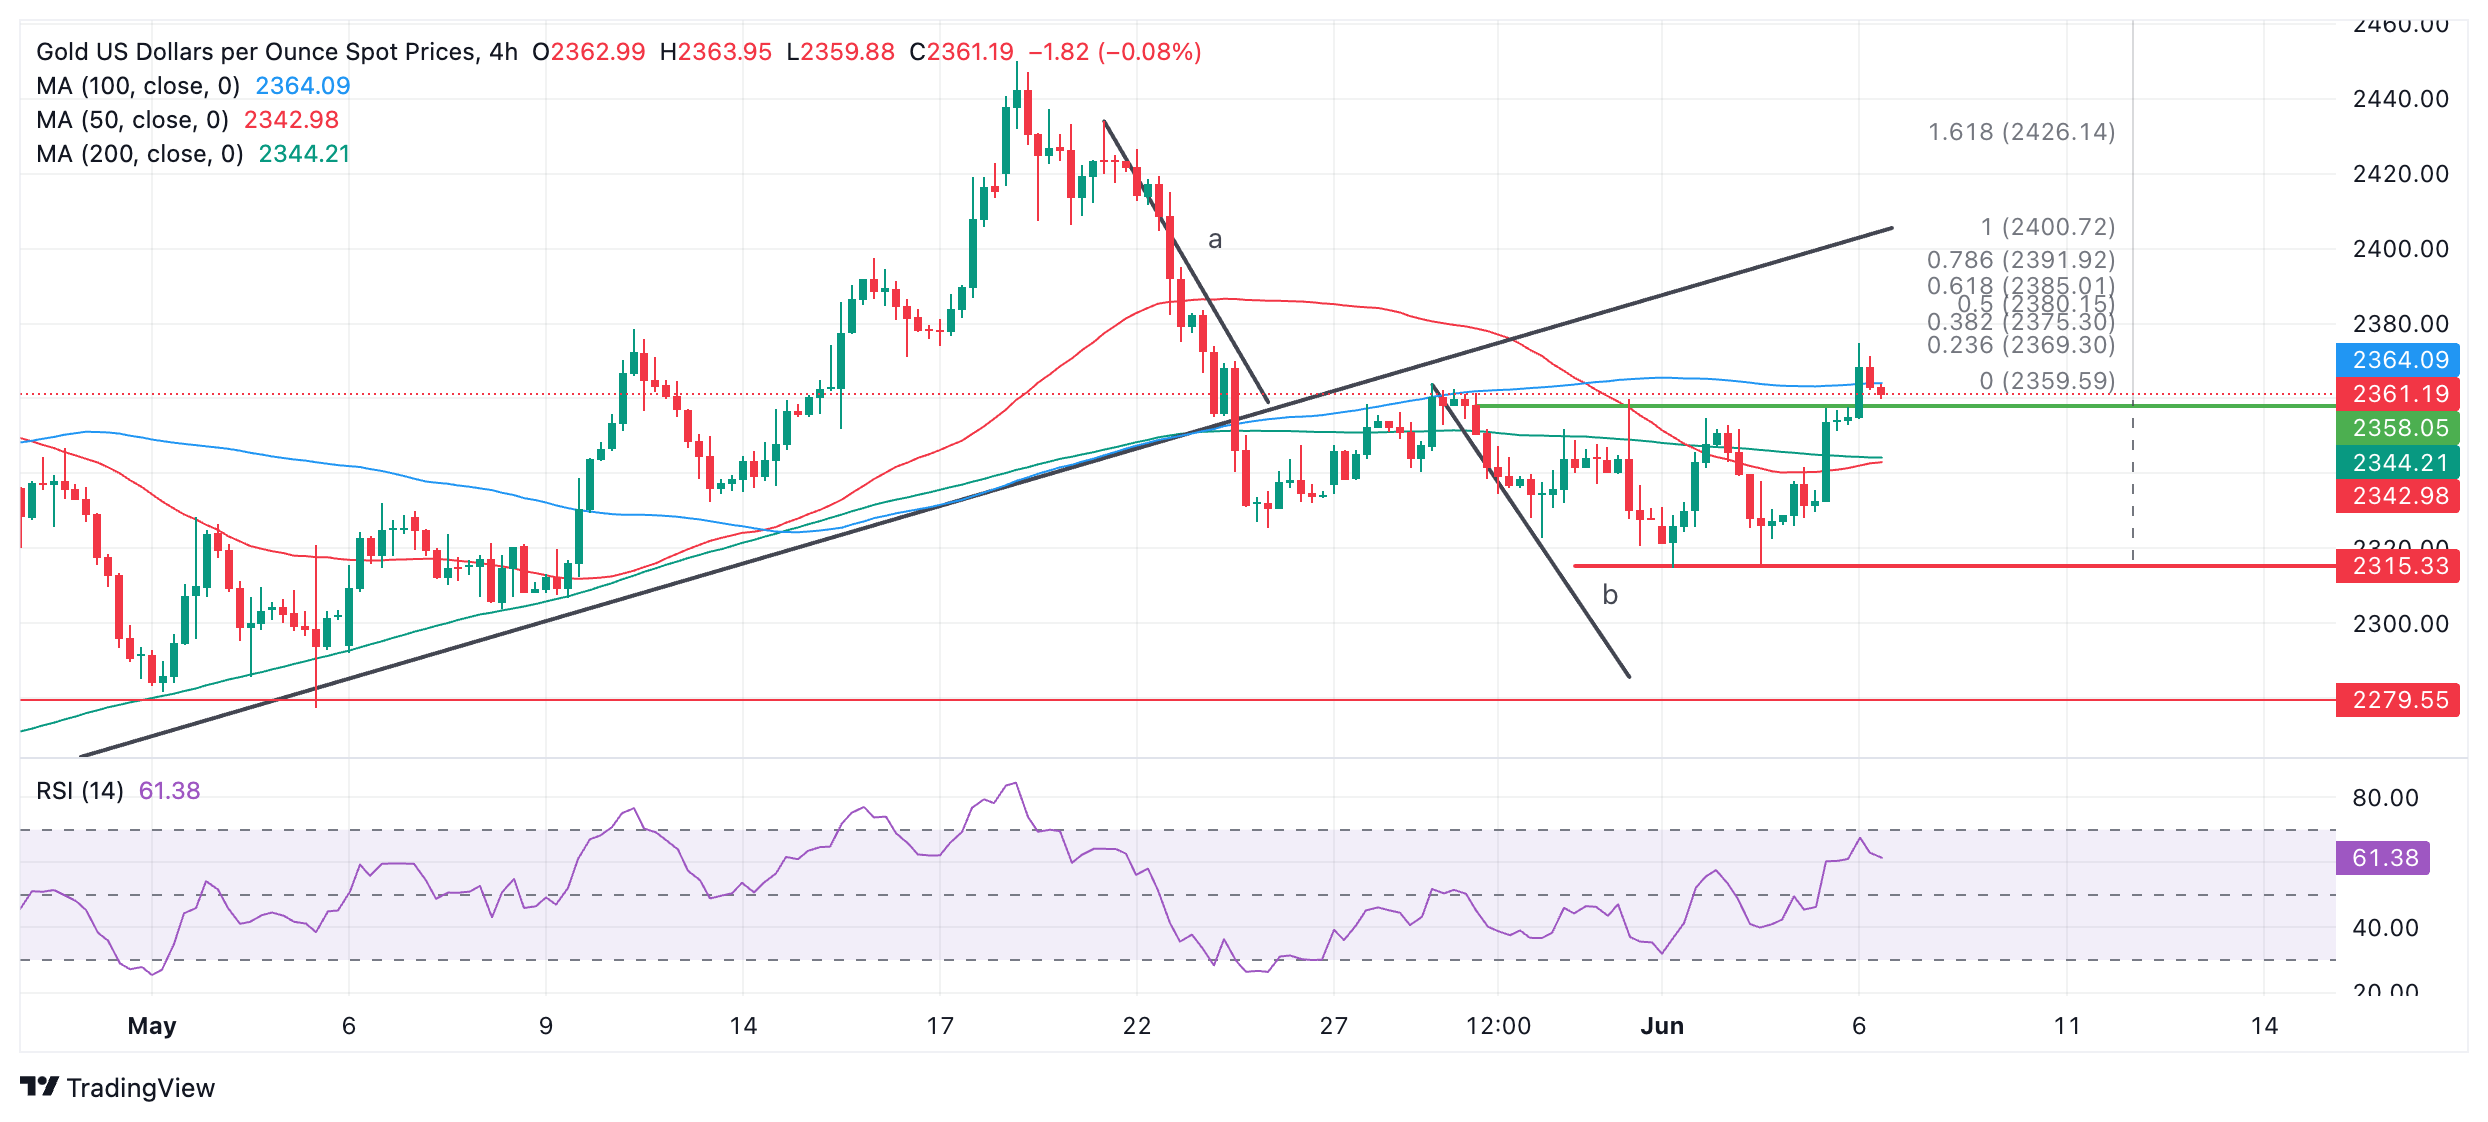
- Gold climbs 0.54% and reaches a two-week high of $2,378.
- Higher-than-expected US jobless claims weaken US Dollar and stabilize Treasury yields.
- Traders focus on upcoming Nonfarm Payrolls; forecasts suggest 185,000 new jobs with a 3.9% Unemployment Rate.
Gold hit a two-week high of $2,378 on Thursday after the US Bureau of Labor Statistics (BLS) announced weaker-than-expected jobs data that kept US Treasury bond yields virtually unchanged, a tailwind for the golden metal. The XAU/USD trades at $2,369, registering a gain of 0.54% after bouncing off weekly lows of $2,320.
US jobs data was one of the main drivers of the day after the BLS revealed that the number of Americans filing for unemployment benefits exceeded the consensus and the previous week's reading. In addition, the European Central Bank (ECB) decided to cut interest rates, which sent US Treasury yields climbing before paring its earlier gains.
The US 10-year benchmark is set to print weekly losses yet retreated from a daily high of 4.32% to 4.285% following the ECB’s decision. In the meantime, the US Dollar Index, which measures the Greenback’s performance against a basket of six currencies, dropped 0.12% to 104.14.
Following the latest US employment data, traders' focus shifts to Friday's May Nonfarm Payrolls report. Estimates suggest the economy will add 185,000 people to the workforce, above April’s 175,000. The Unemployment Rate is expected to be 3.9%, and Average Hourly Earnings are projected to remain unchanged at 3.9%.
Daily digest market movers: Gold price capitalizes on falling US Treasury yields
- US Initial Jobless Claims for the week ending May 31 rose by 229,000, above estimates of 220,000 and the previous reading of 221,000
- ADP Employment Change revealed that private US hiring in May rose by 152K, below estimates of 175K and missing April’s 188K.
- Softer-than-expected Nonfarm Payrolls data could increase the odds of rate cuts by the Federal Reserve.
- Data from the Chicago Board of Trade (CBOT) revealed that traders expect 39 basis points (bps) of interest rate cuts toward the end of 2024 via the December fed funds rate futures contract.
- According to the CME FedWatch Tool, traders are currently pricing in a 57% chance of a rate cut in September.
- Last week, the US Core Personal Consumption Expenditure Price Index (PCE), the Fed’s preferred inflation gauge, stabilized, boosting hopes for potential rate cuts.
Technical analysis: Gold price shedges higher above $2,350
Gold extended its rally after consolidating within the $2,320 to $2,360 region, but buyers cracking the top of the range opened the door for further gains. Momentum remains on the buyers' side as the Relative Strength Index (RSI) remains bullish.
On further strength, XAU/USD's next resistance would be $2,400, followed by the year-to-date high of $2,450. Conversely, if Gold slips below $2,350, the next support would be the 50-day Simple Moving Average (SMA) of $2,337. The next stop would be the May 8 low of $2,303, followed by the May 3 cycle low of $2,277.
Gold FAQs
Gold has played a key role in human’s history as it has been widely used as a store of value and medium of exchange. Currently, apart from its shine and usage for jewelry, the precious metal is widely seen as a safe-haven asset, meaning that it is considered a good investment during turbulent times. Gold is also widely seen as a hedge against inflation and against depreciating currencies as it doesn’t rely on any specific issuer or government.
Central banks are the biggest Gold holders. In their aim to support their currencies in turbulent times, central banks tend to diversify their reserves and buy Gold to improve the perceived strength of the economy and the currency. High Gold reserves can be a source of trust for a country’s solvency. Central banks added 1,136 tonnes of Gold worth around $70 billion to their reserves in 2022, according to data from the World Gold Council. This is the highest yearly purchase since records began. Central banks from emerging economies such as China, India and Turkey are quickly increasing their Gold reserves.
Gold has an inverse correlation with the US Dollar and US Treasuries, which are both major reserve and safe-haven assets. When the Dollar depreciates, Gold tends to rise, enabling investors and central banks to diversify their assets in turbulent times. Gold is also inversely correlated with risk assets. A rally in the stock market tends to weaken Gold price, while sell-offs in riskier markets tend to favor the precious metal.
The price can move due to a wide range of factors. Geopolitical instability or fears of a deep recession can quickly make Gold price escalate due to its safe-haven status. As a yield-less asset, Gold tends to rise with lower interest rates, while higher cost of money usually weighs down on the yellow metal. Still, most moves depend on how the US Dollar (USD) behaves as the asset is priced in dollars (XAU/USD). A strong Dollar tends to keep the price of Gold controlled, whereas a weaker Dollar is likely to push Gold prices up.
- GBP/JPY pumps the brakes as the pair churns near 200.00.
- Thin economic calendar this week allows the Guppy to find balance.
- Hectic data schedule on the cards for next week.
GBP/JPY is cruising through a data-light week, cycling between 200.00 and 199.00 as investors await higher-impact calendar releases from both the UK and Japan. The Volatility-prone pair has found a brief cool spot despite the Guppy holding up over 11% for the year.
This week saw strictly low-impact data releases from the UK and Japan, though investors are keeping a close eye on any statements from the Bank of Japan (BoJ). Policymakers at the Japanese central bank are slowly getting pushed towards making trims to their various easing and bond-buying programs, but a deep-seated fear of a return to stagnant inflation conditions in Japan has kept the BoJ in a hyper-easy policy stance.
A battered Yen has been pushed deeply into the red through 2024 as wide rate differential force the JPY lower across the board, but impending rate cuts from most of the global major central banks is set to ease some pressure and trim the differential, which could give the beleaguered JPY a leg up.
Next week, Japanese Q1 Gross Domestic Product (GDP) figures are due early Tuesday, though investors broadly expect Japanese GDP growth to hold near -0.5% QoQ. On the UK side, fresh labor figures are also due on Tuesday, and the UK is expected to shed -177K jobs in the three months ended April.
GBP/JPY technical outlook
Near-term momentum has drained out of the Guppy as prices slump into the midrange, planted firmly just above the 199.00 handle with the 200-hour Exponential Moving Average (EMA) at 199.33. GBP/JPY hit a record 34-year high at 200.75 in late May, and the pair has steadied after a recent plunge towards 197.00.
GBP/JPY hourly chart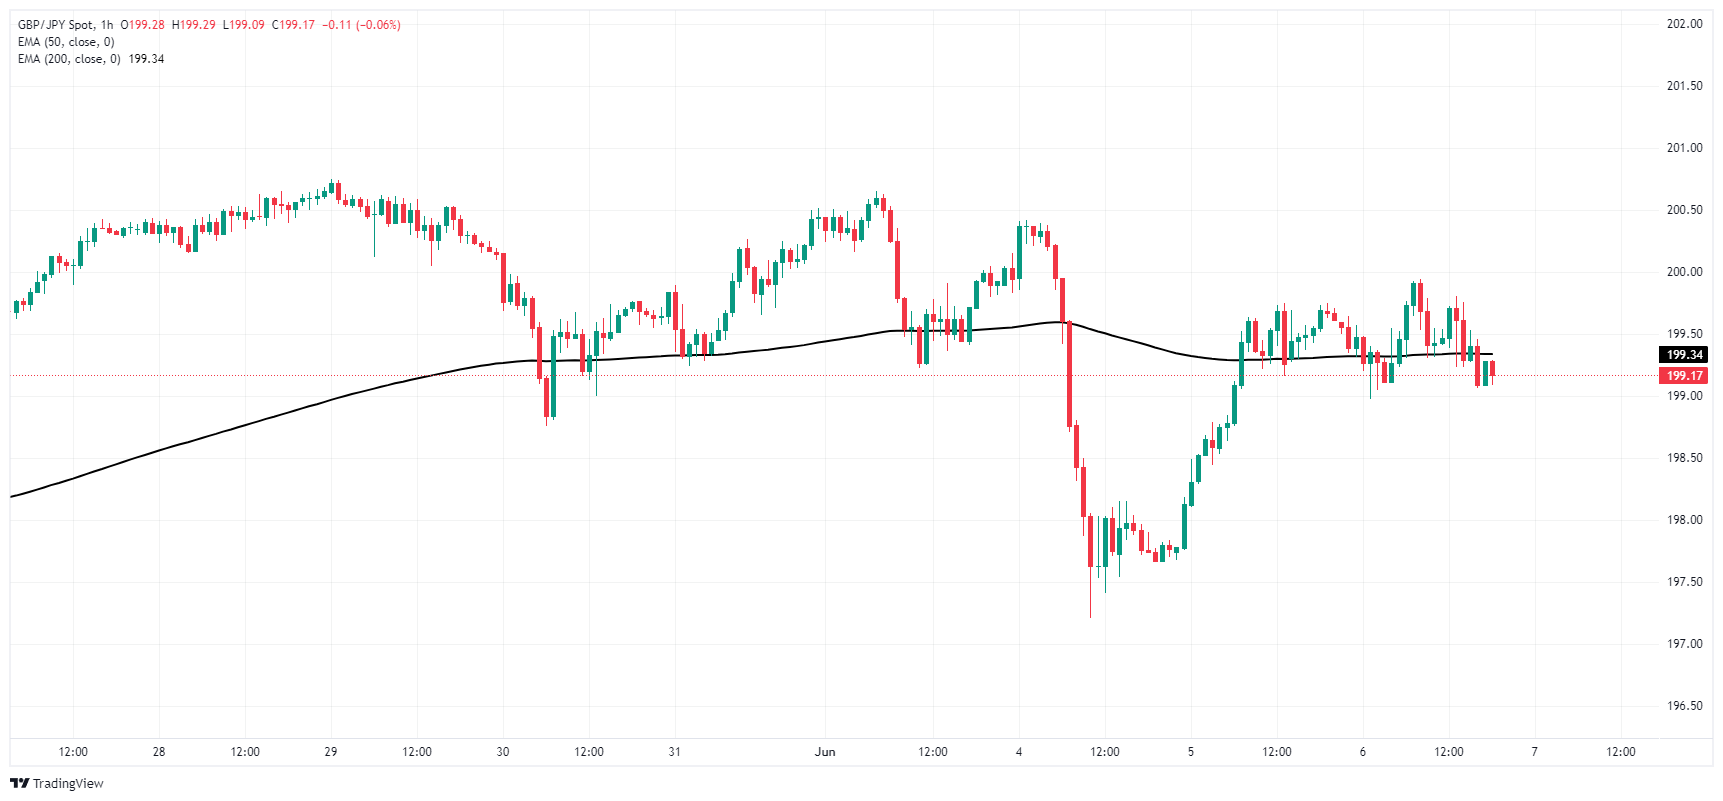
GBP/JPY daily chart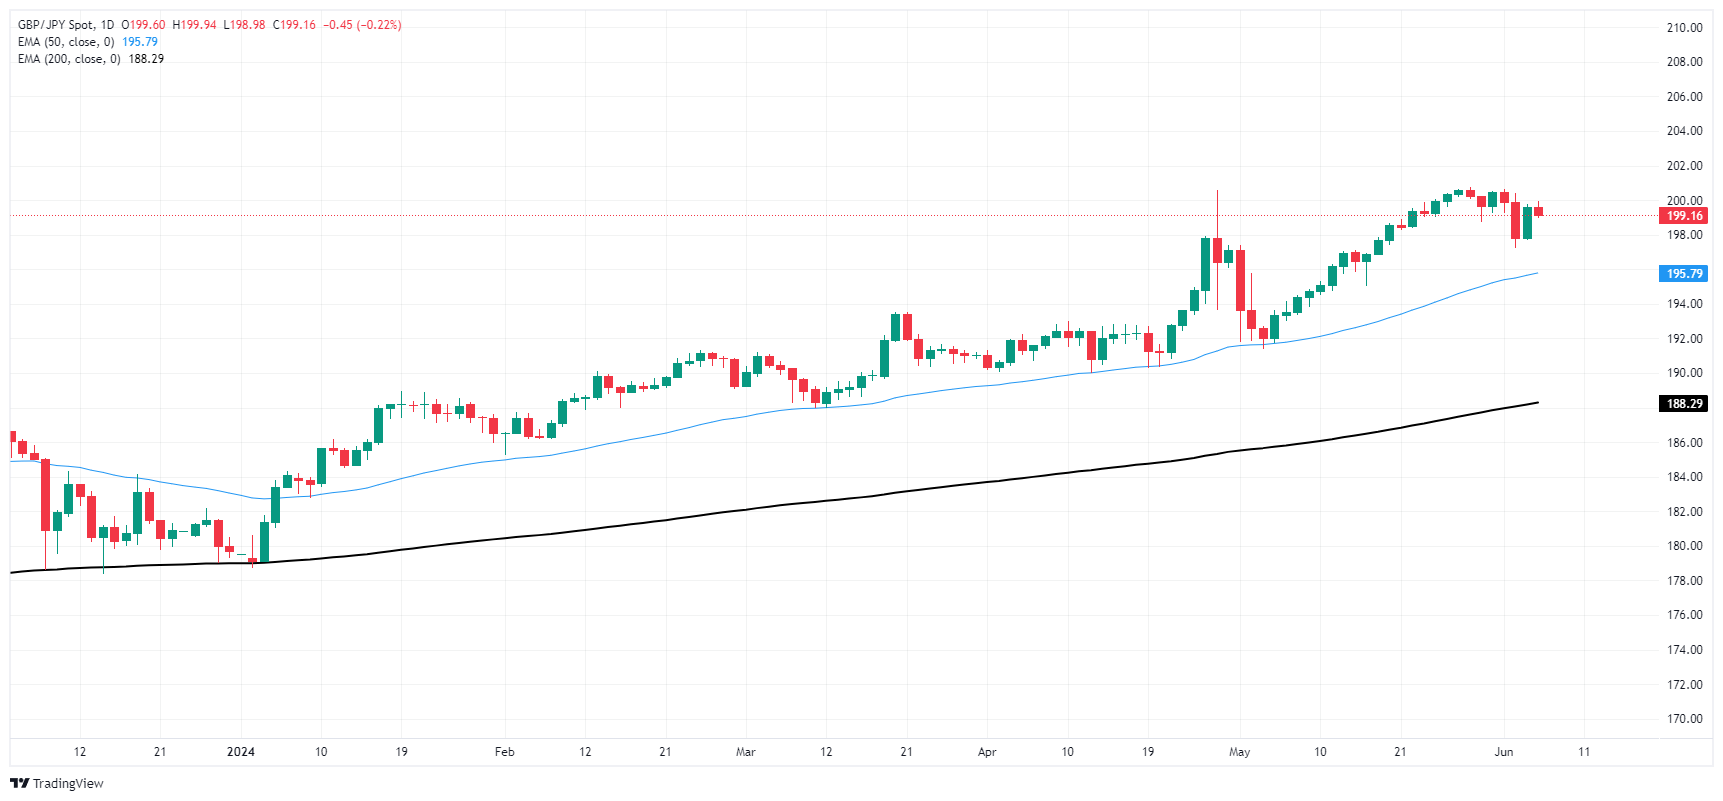
Prudence ahead of the publication of the US labour market report dominated investors’ sentiment on Thursday, leaving price action in the FX universe largely muted. Meanwhile, the ECB reduced its interest rates by 25 bps, as widely anticipated.
Here is what you need to know on Friday, June 7:
The USD Index (DXY) traded on the defensive near the 104.00 region ahead of key US data due on Friday. In fact, the release of Nonfarm Payrolls and the Unemployment Rate will be at the centre of the debate on June 7, seconded by Wholesale Inventories.
EUR/USD regained traction and approached the 1.0900 zone after the cautious cut from the ECB at its event on Thursday. Germany’s Balance of Trade results are due on June 7 along with another estimate of Q1 GDP Growth Rate in the broader Euroland and a speech by the ECB’s Lagarde.
GBP/USD added to Wednesday’s uptick and traded at shouting distance from the key 1.2800 hurdle. June 7 will only see the release of the Halifax House Price Index.
USD/JPY partially faded Wednesday’s firm performance on the back of the weaker dollar and pale US yields. Household Spending, the preliminary Coincident Index and the Leading Economic Index will be unveiled on June 7.
AUD/USD regained its smile and left behind two straight sessions of losses, retesting two-day highs near 0.6680. The Australian docket will be empty on June 7.
Rising optimism among traders pushed WTI prices to three-day peaks near the $76.00 mark per barrel on the back of the ECB rate cut and positive comments from OPEC+ officials, who left the door open to a modification of the latest agreement.
Gold prices advanced to two-week highs near $2,380 per troy ounce following the softer dollar, marginal moves in US yields, and expectations of rate cuts by the Fed sooner than anticipated. Silver extended its gains and climbed to four-day tops beyond the $31.00 mark per ounce.
- Dow Jones remains stubbornly flat in quiet Thursday trading.
- Stocks, bonds, and currencies all go flat as markets await key US data.
- Friday’s NFP to go a long way in confirming market rate cut outlook.
The Down Jones Industrial Average (DJIA) stuck firmly to midrange bets on Thursday as investors knuckle down for the wait to Friday’s US Nonfarm Payrolls (NFP) print. Investors are holding onto hopes for two rate cuts this year from the Federal Reserve (Fed) with the first expected in September. Continued easing in US data will help to confirm a softening economy, increasing the chances that the Fed will get pushed towards a faster pace of rate cuts.
US Initial Jobless Claims rose to 229K for the week ended May 31, jumping over the forecast 220K and the revised previous figure of 221K.
Friday’s US NFP is expected to show 185K net job additions in May, a step higher than the previous month’s 175K. Markets will also keep an eye out for any steep revisions to previous releases.
Dow Jones news
About two-thirds of the Dow Jones index is finding gains on Thursday, but declines in key major equities are keeping bullish momentum hobbled. Intel Corp. (INTC) and Unitedhealth Group Inc. (UNH) are both down around 1% on the day, testing $30.49 and $498.87 per share, respectively. On the high side, Salesforce Inc. (CRM) and Nike Inc (NKE) are both up over 2% during the US market session. CRM is testing back over $240.00 per share while Nike is approaching $100.00 per share.
Dow Jones technicals
The Dow Jones is up around 60 points on Thursday, trading within a fifth of a percent from the day’s opening bids. Buyers have been struggling to haul bids back over the 39,000.00 handle, but the major equity index has recover from a near-term dip to 38,000.00.
The DJIA is still down -3% from all-time peaks above 40,000.00 set in May, but a long-term demand zone from 38,000.00 to 37,500.00 is keeping prices bolstered.
Dow Jones five minute chart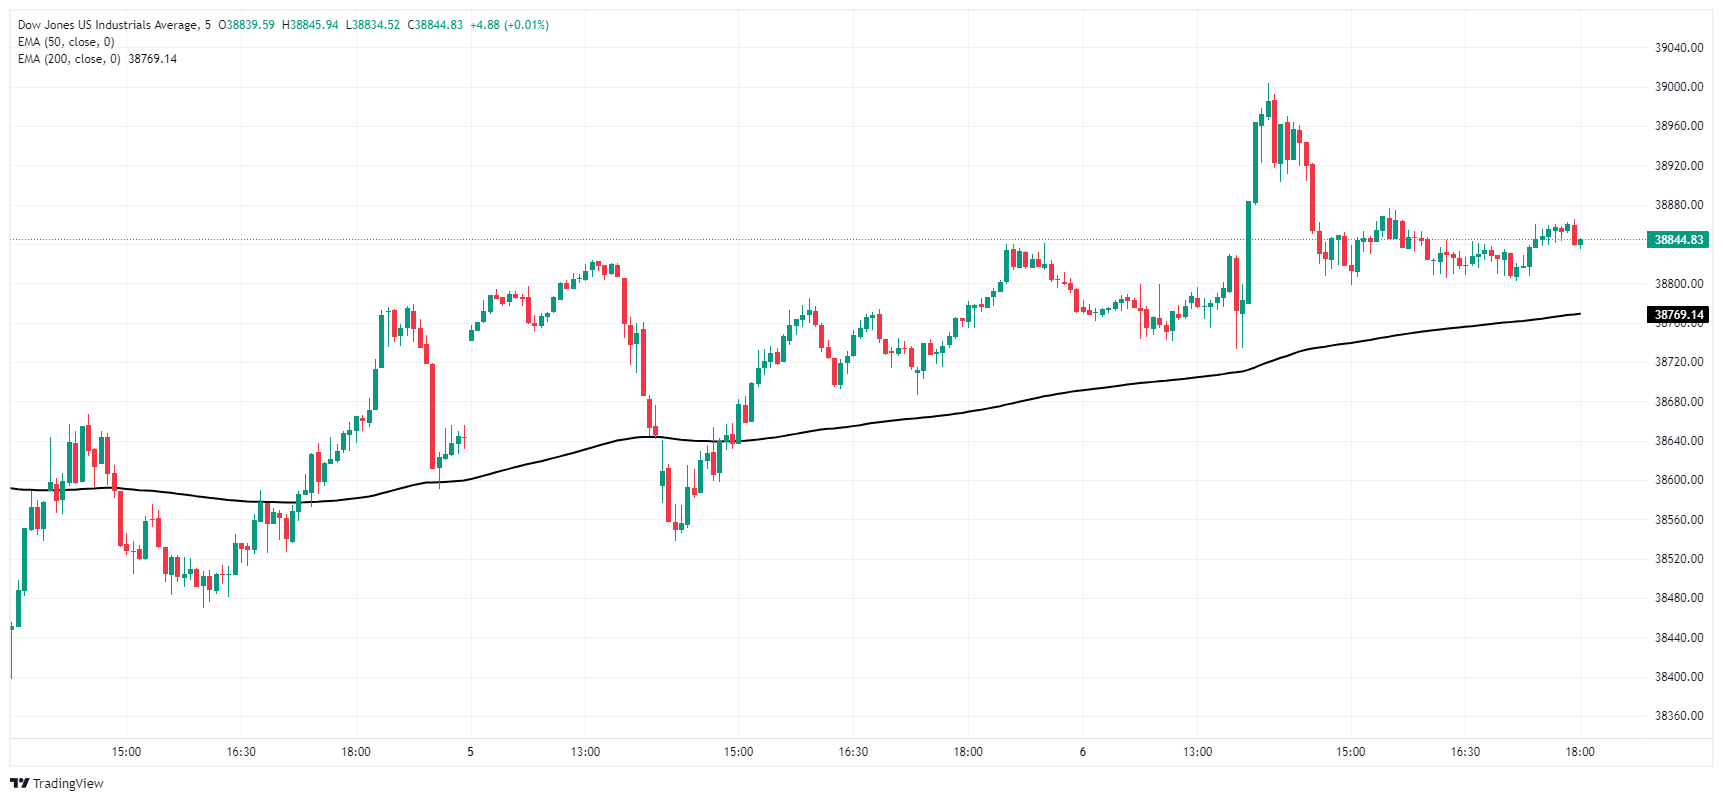
Dow Jones daily chart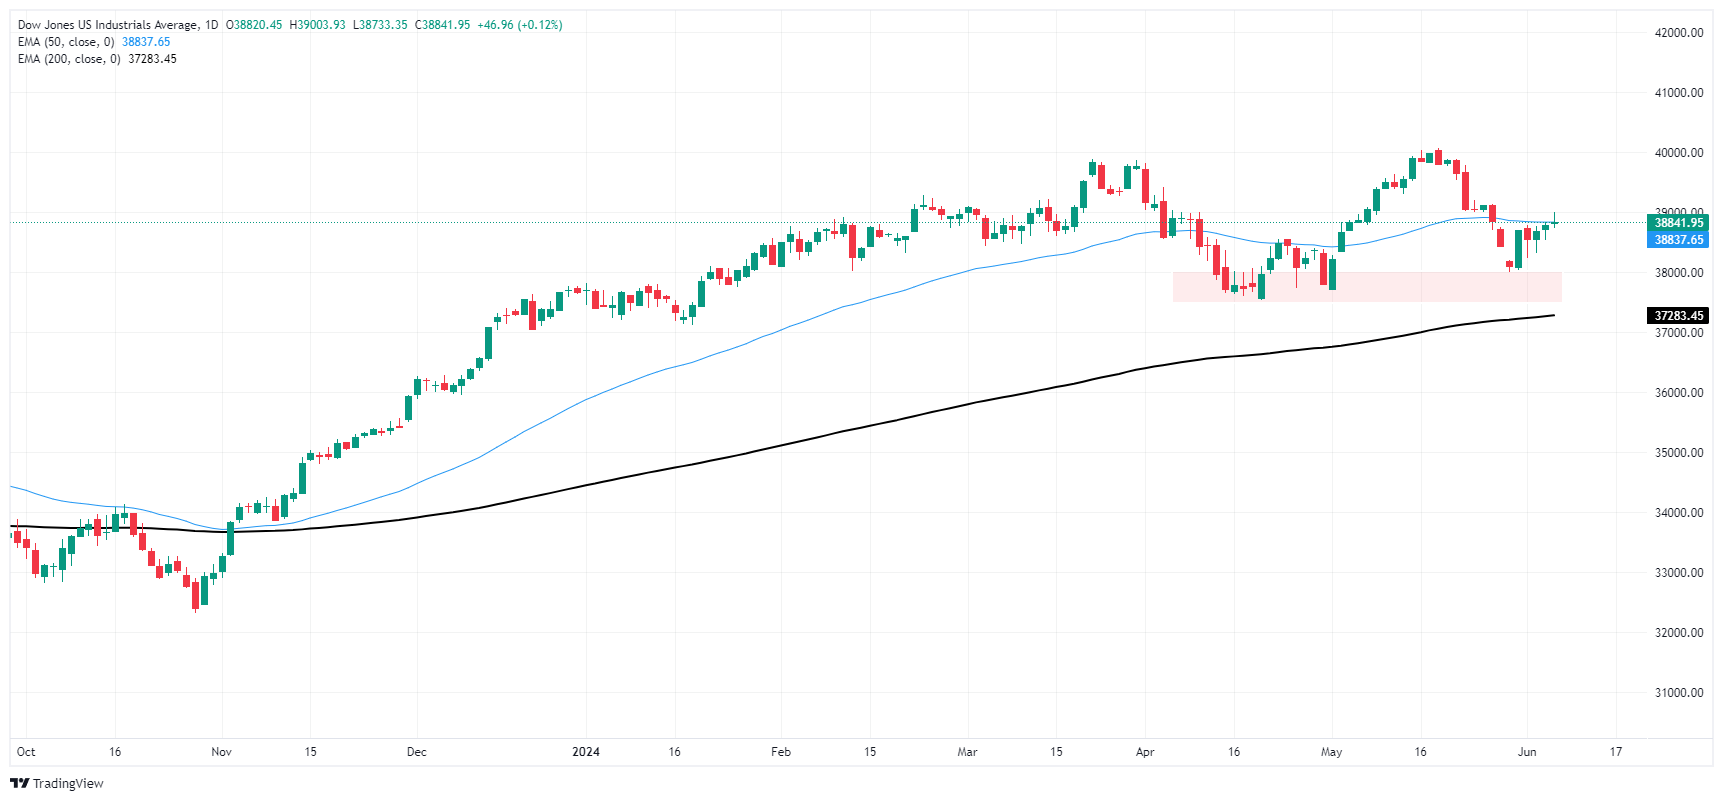
Dow Jones FAQs
The Dow Jones Industrial Average, one of the oldest stock market indices in the world, is compiled of the 30 most traded stocks in the US. The index is price-weighted rather than weighted by capitalization. It is calculated by summing the prices of the constituent stocks and dividing them by a factor, currently 0.152. The index was founded by Charles Dow, who also founded the Wall Street Journal. In later years it has been criticized for not being broadly representative enough because it only tracks 30 conglomerates, unlike broader indices such as the S&P 500.
Many different factors drive the Dow Jones Industrial Average (DJIA). The aggregate performance of the component companies revealed in quarterly company earnings reports is the main one. US and global macroeconomic data also contributes as it impacts on investor sentiment. The level of interest rates, set by the Federal Reserve (Fed), also influences the DJIA as it affects the cost of credit, on which many corporations are heavily reliant. Therefore, inflation can be a major driver as well as other metrics which impact the Fed decisions.
Dow Theory is a method for identifying the primary trend of the stock market developed by Charles Dow. A key step is to compare the direction of the Dow Jones Industrial Average (DJIA) and the Dow Jones Transportation Average (DJTA) and only follow trends where both are moving in the same direction. Volume is a confirmatory criteria. The theory uses elements of peak and trough analysis. Dow’s theory posits three trend phases: accumulation, when smart money starts buying or selling; public participation, when the wider public joins in; and distribution, when the smart money exits.
There are a number of ways to trade the DJIA. One is to use ETFs which allow investors to trade the DJIA as a single security, rather than having to buy shares in all 30 constituent companies. A leading example is the SPDR Dow Jones Industrial Average ETF (DIA). DJIA futures contracts enable traders to speculate on the future value of the index and Options provide the right, but not the obligation, to buy or sell the index at a predetermined price in the future. Mutual funds enable investors to buy a share of a diversified portfolio of DJIA stocks thus providing exposure to the overall index.
- Mexican Peso slops some 0.12% after major central banks cut rates.
- Mexico’s Finance Minister reassures fiscal discipline and Banxico’s autonomy, capping further Peso losses.
- Mixed economic signals: Mexican Auto Exports rise in May; analysts forecast headline inflation to hit 4.82%.
The Mexican Peso depreciated moderately against the US Dollar on Thursday after a major central bank added its name to the list of institutions that began to ease monetary policy as the disinflation process evolved. Meanwhile, Mexico’s election “hang-over” dissipates as the Mexican currency stabilizes after losing 7% during the week. The USD/MXN trades at 17.52, up 0.12%.
Sentiment soured after the European Central Bank (ECB) decided to cut rates by 25 basis points on Thursday, sending global yields up and US equities lower. Therefore, the emerging market currency slipped.
Mexican Finance Minister Rogelio Ramirez de la O capped the Peso’s fall earlier this week by reassuring investors that the upcoming government would be fiscally disciplined and respect the autonomy of the Bank of Mexico (Banxico).
Data-wise, Mexican Auto Exports increased in May but less than in April, signaling the economy is feeling the impact of higher borrowing costs set by Banxico.
According to a Reuters survey, analysts in Mexico expect an increase in headline inflation in May. The median estimates inflation would hit 4.82%, climbing for the third straight month. However, underlying inflation is foreseen settling at 4.29%, its lowest level since April 2021.
Across the border, the US economic docket revealed that the number of Americans filing for unemployment benefits rose above estimates as traders braced for the latest employment report on Friday.
Daily digest market movers: Mexican Peso weakens as election fears wane
- Auto Exports in Mexico increased but trailed April’s 14.4% print, jumping by 13% YoY. Auto Production growth slowed from 21.7% to 4.9% YoY for the same periods.
- Fears that Morena’s majority could push bills that include reducing the number of lawmakers and plans for electing Supreme Court members were the cause behind Mexican Peso’s Black Monday.
- Morgan Stanley noted that if Mexico’s upcoming government and Congress adopted an unorthodox agenda, it would undermine Mexican institutions and be bearish for the Mexican Peso, which could weaken to 19.20.
- Speculation of another Banxico rate cut in June could pave the way for further upside in the USD/MXN.
- The US Bureau of Labor Statistics (BLS) revealed that Initial Jobless Claims for the week ending June 1 were higher than the expected 220K, increasing by 229K above the prior week’s data.
- On Friday, the BLS would feature May’s Nonfarm Payrolls report, which is expected to show the economy added 185K people to the workforce, above the prior month’s 175K.
- The futures market suggests the US Federal Reserve might cut rates by 38 basis points in 2024, according to the December 2024 fed funds future rate contract.
Technical analysis: Mexican Peso stays firm yet weakens as USD/MXN rises above 17.50
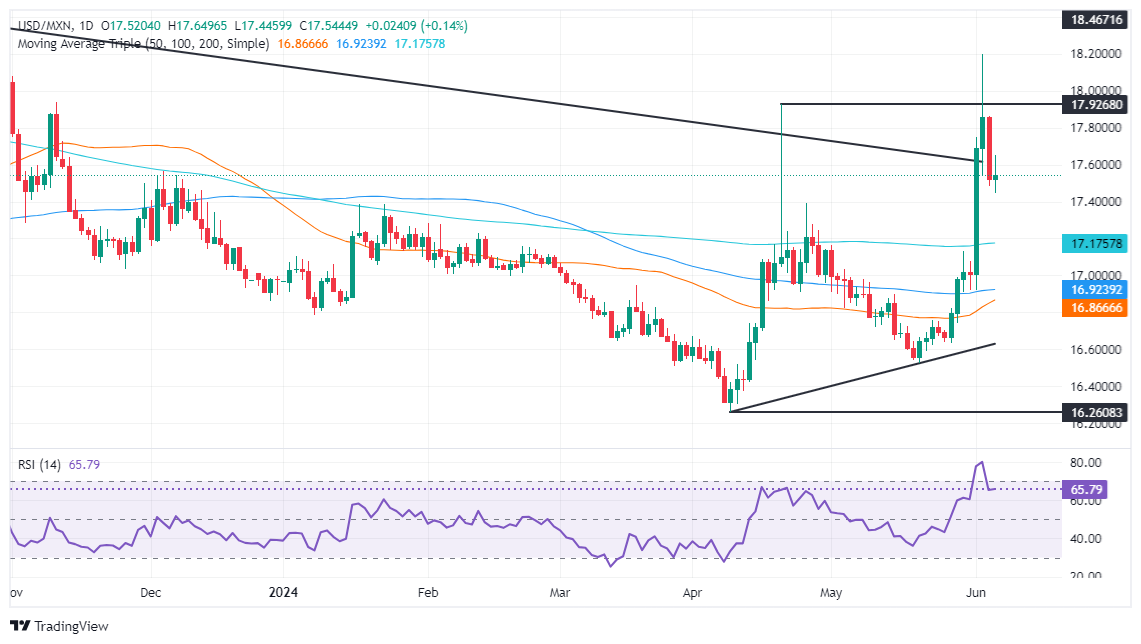
The USD/MXN shifted to a neutral-upward bias, but it could consolidate at around the 17.50 – 18.19 range in the short term. The momentum has changed in favor of US Dollar bulls, as depicted by the Relative Strength Index (RSI) and also by buyers lifting the spot price above the 200-day Simple Moving Average (SMA) of 17.60.
That said, the USD/MXN’s first resistance level would be the June 3 high at 17.74, followed by the 18.00 psychological level. Once surpassed, the next stop would be the year-to-date high of 18.19.
On further weakness, the next support would be the 200-day SMA at 17.16, followed by the 17.00 figure, ahead of the 100-day SMA at 16.91. Once cleared, the 50-day SMA at 16.84 would be next.
Mexican Peso FAQs
The Mexican Peso (MXN) is the most traded currency among its Latin American peers. Its value is broadly determined by the performance of the Mexican economy, the country’s central bank’s policy, the amount of foreign investment in the country and even the levels of remittances sent by Mexicans who live abroad, particularly in the United States. Geopolitical trends can also move MXN: for example, the process of nearshoring – or the decision by some firms to relocate manufacturing capacity and supply chains closer to their home countries – is also seen as a catalyst for the Mexican currency as the country is considered a key manufacturing hub in the American continent. Another catalyst for MXN is Oil prices as Mexico is a key exporter of the commodity.
The main objective of Mexico’s central bank, also known as Banxico, is to maintain inflation at low and stable levels (at or close to its target of 3%, the midpoint in a tolerance band of between 2% and 4%). To this end, the bank sets an appropriate level of interest rates. When inflation is too high, Banxico will attempt to tame it by raising interest rates, making it more expensive for households and businesses to borrow money, thus cooling demand and the overall economy. Higher interest rates are generally positive for the Mexican Peso (MXN) as they lead to higher yields, making the country a more attractive place for investors. On the contrary, lower interest rates tend to weaken MXN.
Macroeconomic data releases are key to assess the state of the economy and can have an impact on the Mexican Peso (MXN) valuation. A strong Mexican economy, based on high economic growth, low unemployment and high confidence is good for MXN. Not only does it attract more foreign investment but it may encourage the Bank of Mexico (Banxico) to increase interest rates, particularly if this strength comes together with elevated inflation. However, if economic data is weak, MXN is likely to depreciate.
As an emerging-market currency, the Mexican Peso (MXN) tends to strive during risk-on periods, or when investors perceive that broader market risks are low and thus are eager to engage with investments that carry a higher risk. Conversely, MXN tends to weaken at times of market turbulence or economic uncertainty as investors tend to sell higher-risk assets and flee to the more-stable safe havens.
- Canadian Dollar treads water as investors buckle down ahead of Friday data.
- Canada will bring wages and labor change to the table on Friday.
- US NFP remains the capstone to the week’s data.
The Canadian Dollar (CAD) settled into a holding pattern on Thursday as markets batten down the hatches ahead of Friday’s key labor data from both the US and Canada. Investors are still leaning into bets of a September rate cut from the US Federal Reserve (Fed), but chances of a push-out to November are still on the cards.
Canada will drop its latest wage growth and labor change figures on Friday, but the releases will be dwarfed by the latest US Nonfarm Payrolls (NFP) data dump. The Canadian Unemployment Rate is expected to tick higher in May, and new Canadian hirings are forecast to recede. On the US side, markets have trimmed expectations of net job additions but still expect a higher print.
Daily digest market movers: Canadian PMIs slip back, US jobless claims rise further
- Canada’s Ivey Purchasing Managers Index (PMI) fell to 52.0 in May on a seasonally-adjusted basis, a sharp pullback from the previous two-year high of 63.0. Median market forecasts had expected an uptick to 65.0.
- US Initial Jobless Claims rose to 229K in the week ended May 31, up from the previous week’s revised 221K. The print missed forecasts of 220K.
- US Labor Costs also eased in the first quarter, growing by 4.0% versus the forecasted uptick to 4.9% from the previous 4.7%.
- With labor costs and activity easing, market hopes for a September rate cut from the Fed are holding on the high side. According to the CME’s FedWatch Tool, rate markets are pricing in around 70% odds of at least a quarter-point trim when the Federal Open Market Committee (FOMC) announces its latest rate call on September 18.
- US NFP looms large on Friday, with median market forecasts now calling for 185K in net new jobs in May versus the previous print of 175K. US Average Hourly Earnings are also expected to tick higher to 0.3% MoM compared to the previous 0.2%.
Canadian Dollar PRICE Today
The table below shows the percentage change of Canadian Dollar (CAD) against listed major currencies today. Canadian Dollar was the strongest against the British Pound.
| USD | EUR | GBP | JPY | CAD | AUD | NZD | CHF | |
|---|---|---|---|---|---|---|---|---|
| USD | -0.11% | 0.05% | -0.17% | -0.07% | -0.20% | -0.01% | -0.22% | |
| EUR | 0.11% | 0.17% | -0.07% | 0.06% | -0.11% | 0.07% | -0.10% | |
| GBP | -0.05% | -0.17% | -0.24% | -0.12% | -0.29% | -0.11% | -0.26% | |
| JPY | 0.17% | 0.07% | 0.24% | 0.12% | -0.02% | 0.10% | -0.03% | |
| CAD | 0.07% | -0.06% | 0.12% | -0.12% | -0.14% | 0.07% | -0.14% | |
| AUD | 0.20% | 0.11% | 0.29% | 0.02% | 0.14% | 0.18% | -0.02% | |
| NZD | 0.00% | -0.07% | 0.11% | -0.10% | -0.07% | -0.18% | -0.18% | |
| CHF | 0.22% | 0.10% | 0.26% | 0.03% | 0.14% | 0.02% | 0.18% |
The heat map shows percentage changes of major currencies against each other. The base currency is picked from the left column, while the quote currency is picked from the top row. For example, if you pick the Canadian Dollar from the left column and move along the horizontal line to the US Dollar, the percentage change displayed in the box will represent CAD (base)/USD (quote).
Technical analysis: Canadian Dollar pulls into the midrange as momentum drains
The Canadian Dollar (CAD) is easing into the middle on Thursday, trading within a tenth of a percent against the majority of its major currency peers. Performance is likewise mixed, with the CAD in the green against a little over half of its counterparts in thin trading.
USD/CAD is seeing chart churn on Thursday, testing the 1.3700 handle in tepid action. The pair is holding on the high side of a demand zone between 1.3630 and 1.3590, but topside momentum remains limited, keeping levels beyond 1.3700 out of reach.
Daily candlesticks continue to tread water within touch range of the 50-day Exponential Moving Average (EMA) at 1.3650. Directional momentum has receded ever since USD/CAD fell away from 2024’s peak bids at 1.3846, but long-term technicals still favor the bulls as the 200-day EMA rises into 1.3560 to put a price floor underneath any bearish declines.
USD/CAD hourly chart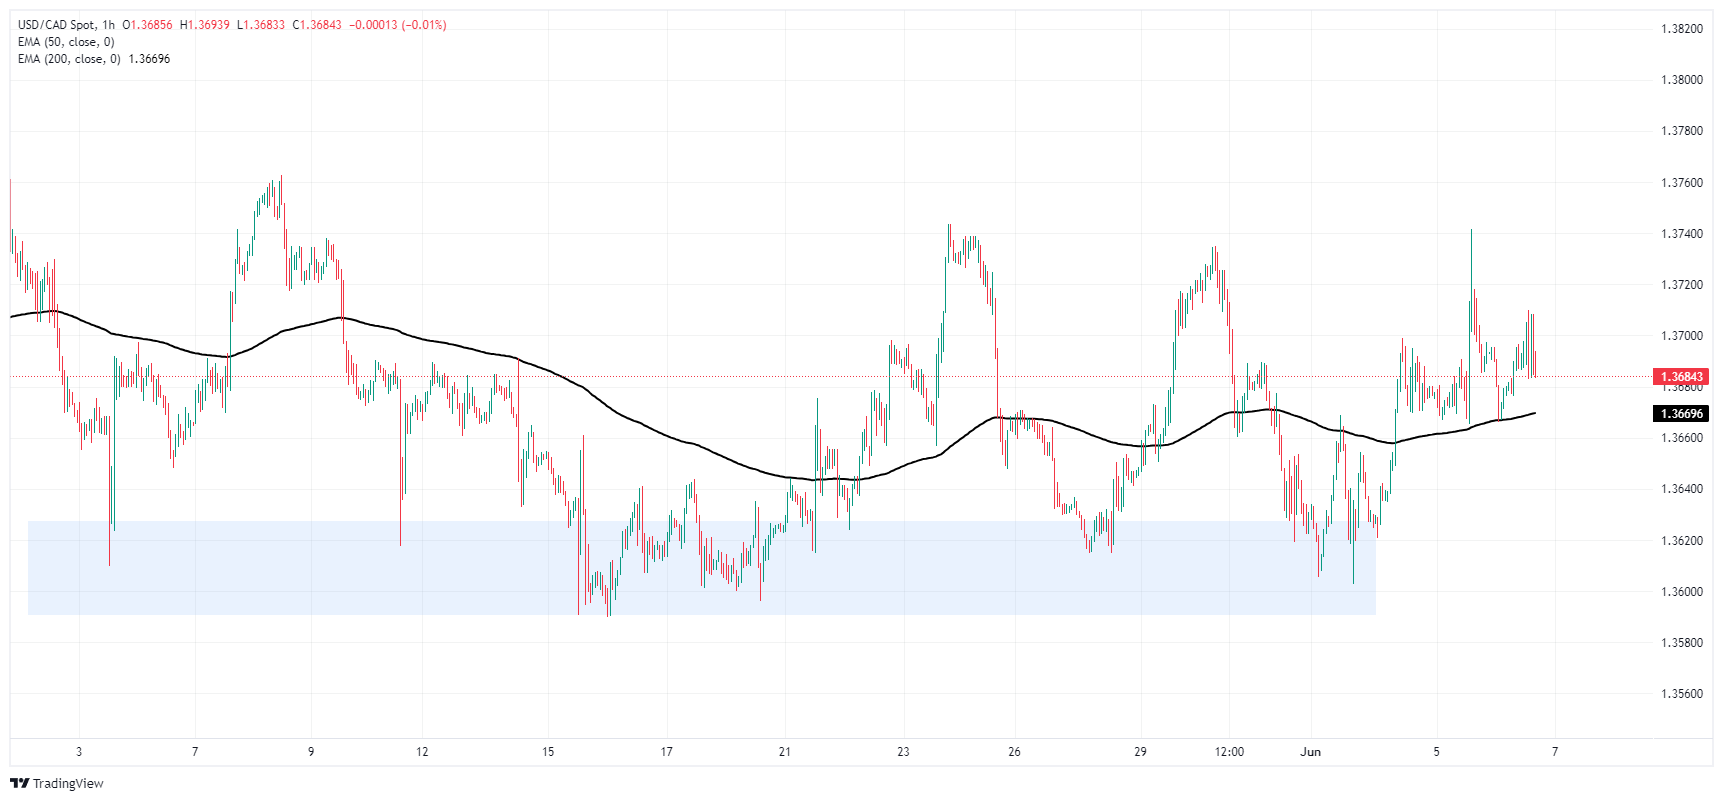
USD/CAD daily chart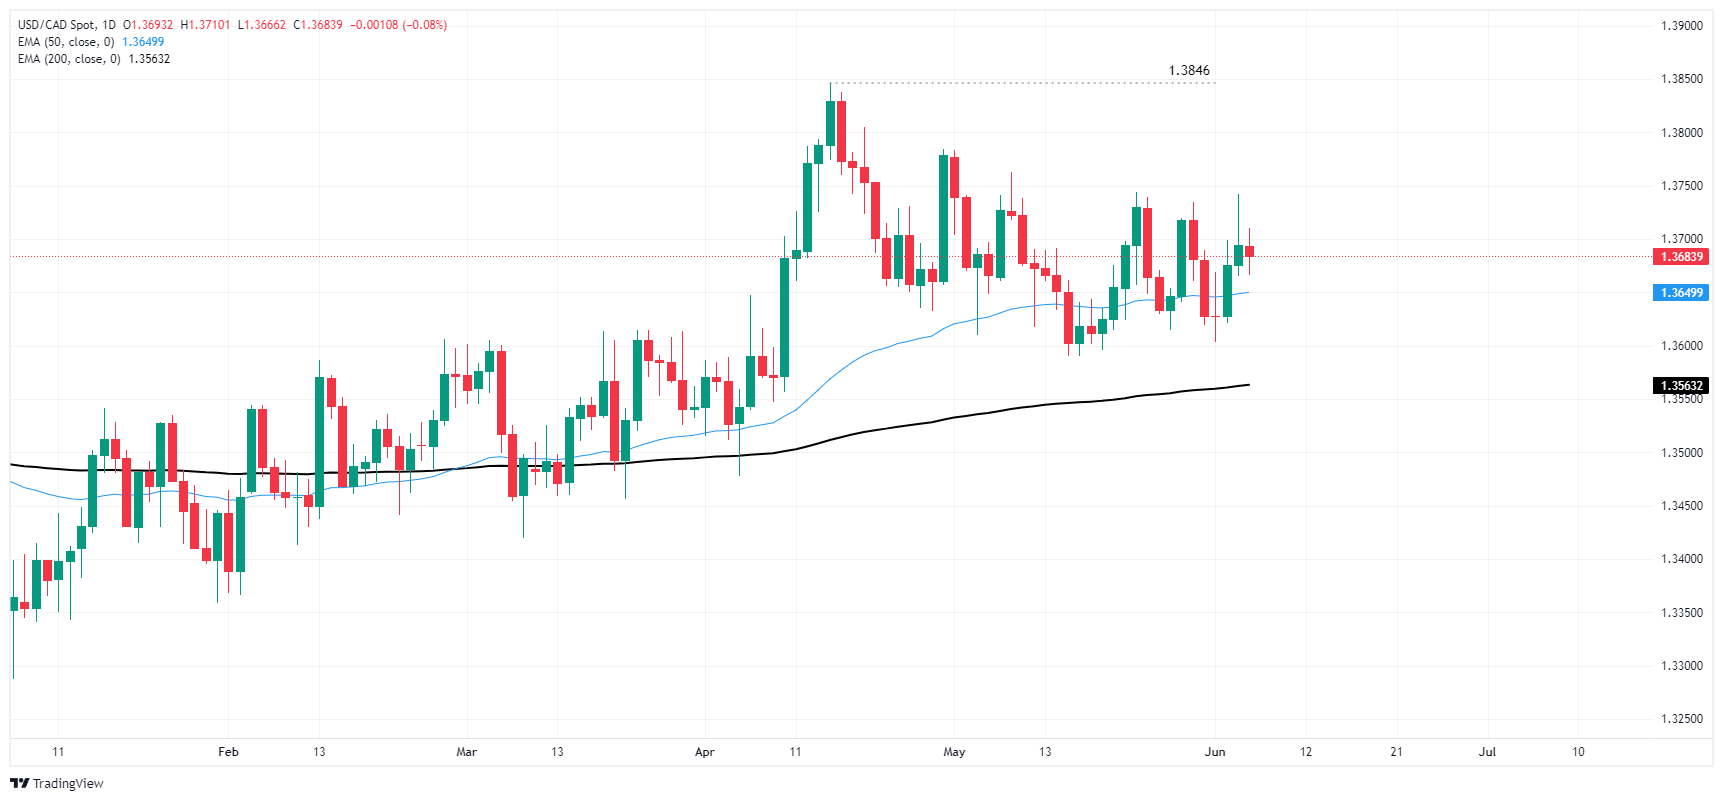
Canadian Dollar FAQs
The key factors driving the Canadian Dollar (CAD) are the level of interest rates set by the Bank of Canada (BoC), the price of Oil, Canada’s largest export, the health of its economy, inflation and the Trade Balance, which is the difference between the value of Canada’s exports versus its imports. Other factors include market sentiment – whether investors are taking on more risky assets (risk-on) or seeking safe-havens (risk-off) – with risk-on being CAD-positive. As its largest trading partner, the health of the US economy is also a key factor influencing the Canadian Dollar.
The Bank of Canada (BoC) has a significant influence on the Canadian Dollar by setting the level of interest rates that banks can lend to one another. This influences the level of interest rates for everyone. The main goal of the BoC is to maintain inflation at 1-3% by adjusting interest rates up or down. Relatively higher interest rates tend to be positive for the CAD. The Bank of Canada can also use quantitative easing and tightening to influence credit conditions, with the former CAD-negative and the latter CAD-positive.
The price of Oil is a key factor impacting the value of the Canadian Dollar. Petroleum is Canada’s biggest export, so Oil price tends to have an immediate impact on the CAD value. Generally, if Oil price rises CAD also goes up, as aggregate demand for the currency increases. The opposite is the case if the price of Oil falls. Higher Oil prices also tend to result in a greater likelihood of a positive Trade Balance, which is also supportive of the CAD.
While inflation had always traditionally been thought of as a negative factor for a currency since it lowers the value of money, the opposite has actually been the case in modern times with the relaxation of cross-border capital controls. Higher inflation tends to lead central banks to put up interest rates which attracts more capital inflows from global investors seeking a lucrative place to keep their money. This increases demand for the local currency, which in Canada’s case is the Canadian Dollar.
Macroeconomic data releases gauge the health of the economy and can have an impact on the Canadian Dollar. Indicators such as GDP, Manufacturing and Services PMIs, employment, and consumer sentiment surveys can all influence the direction of the CAD. A strong economy is good for the Canadian Dollar. Not only does it attract more foreign investment but it may encourage the Bank of Canada to put up interest rates, leading to a stronger currency. If economic data is weak, however, the CAD is likely to fall.
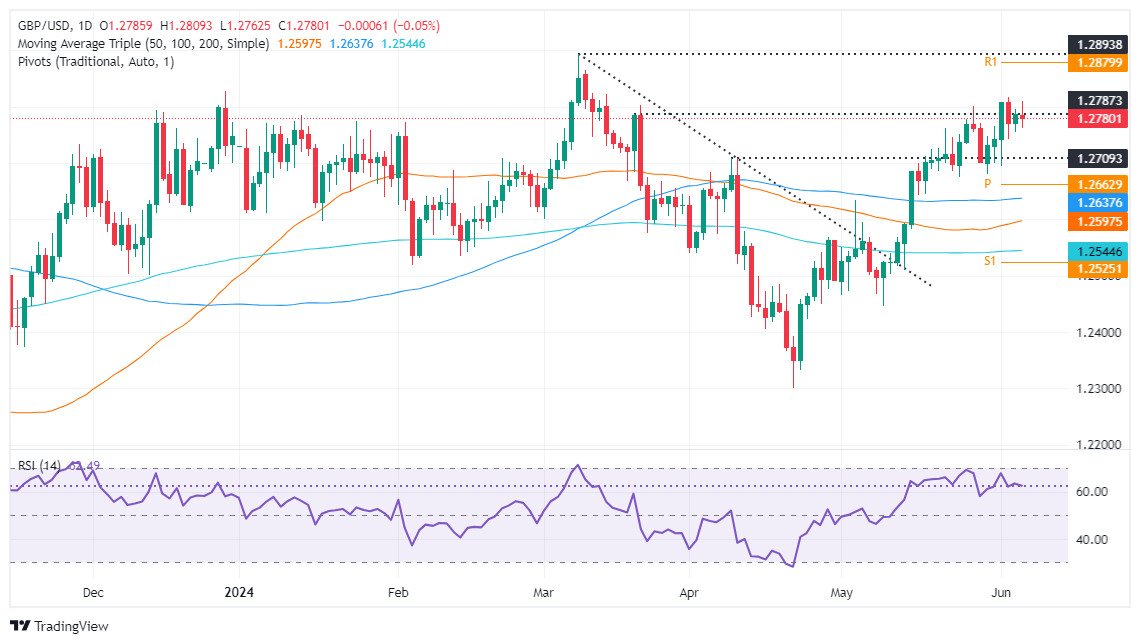
- GBP/USD remains firm below 1.2800, unchanged after reaching a daily high of 1.2809.
- Mixed US jobs data and global rate cuts influence the pair's current spot price.
- Key levels: Support at 1.2755 (June 5 low), 1.2694 (June 3 low); resistance at 1.2800, 1.2817 (June 4 high), and YTD high of 1.2893.
The Pound Sterling stays firm during Thursday’s North American session, yet it remains below 1.2800 after hitting a daily high of 1.2809 against the US Dollar. Another major central bank slashed interest rates, while softer US jobs data keep the pair at around current spot prices. The GBP/USD trades at 1.2772, virtually unchanged.
GBP/USD Price Analysis: Technical outlook
The GBP/USD is consolidated and remains near the weekly highs but beneath 1.2800. Although the pair tested the latter, the pair seems reluctant to a decisive break above that level that could push prices to the year-to-date (YTD) high of 1.2894.
Even though momentum favors buyers, as depicted by the Relative Strength Index (RSI), sellers are gaining traction as the RSI aims downwards.
That said, if GBP/USD drops below the June 5 low of 1.2755, it will expose the next cycle low seen at 1.2694, the June 3 low. On the other hand, if buyers lift the exchange rate past 1.2800, the next resistance would be the June 4 daily high of 1.2817 before testing the year-to-date (YTD) high of 1.2893.
GBP/USD Price Action – Daily Chart
- EUR/AUD trades moderately higher after the ECB goes ahead with an expected interest-rate cut after its June meeting.
- Relatively robust Australian macroeconomic data continues to cap gains for the pair.
- Further, the RBA governor raises the possibility of raising interest rates if inflation fails to fall sustainably.
EUR/AUD is trading up a tenth of a percent in the 1.6360s on Thursday after the European Central Bank (ECB) announces a highly anticipated interest-rate cut of 0.25% at its June policy meeting. This brings the ECB’s main refinancing operations rate down from 4.50% to 4.25%.
Despite lower interest rates usually proving negative for currencies – because they result in lower foreign capital inflows – the Euro rose after the announcement because it had been so widely telegraphed prior to the event. Additionally, the ECB President Christine Lagarde, gave no hints of further cuts, arguing future policy would be data dependent.
During the press conference after the meeting Lagarde said the decision to cut interest rates had been decided on longer-term forecasts that inflation would fall to the ECB’s target in the fourth quarter of 2025.
In the short-term, inflation would remain elevated, Lagarde said, but “will then decline towards target in the second half of 2025."
The decision comes after a string of lower-than-expected macroeconomic releases for the euro area. On Wednesday, Eurozone factory-gate prices fell by 1.0% in May on a month-over-month basis when analysts had expected a more moderate 0.5% decline. Eurozone Retail Sales in April, meanwhile, declined by a greater-than-expected 0.5% versus estimates of minus 0.3%, and the previous month’s figure was revised down.
Whilst in the US, services sector data surprised to the upside, it was a different story in Europe, where May HCOB Services PMI was revised down to 53.2 from the 53.3 initial estimate. High services inflation has been a key reason why the ECB held back from cutting interest rates earlier.
Australian data overall strong, RBA not for cutting
In Australia recent data has been overall strong. Lending data on Thursday showed New Housing Loans rising by 4.8% month-over-month in April when economists had only expected 1.5% rise. The Trade Balance, meanwhile, showed a surplus of 6.548 billion (AUD) in May, beating forecasts of 5.5 billion, and even though Q1 GDP growth undershot estimates of 0.2% MoM and 1.2% YoY, it did so only by one basis point – some economists such as those at Westpac had expected growth to be flat or even negative. The miss, therefore, was not seen as especially negative.
This has overall supported the Australian Dollar (negative for EUR/AUD) as it continues to reinforce the Reserve Bank of Australia’s (RBA) wait-and-see policy stance.
Of all the G10 central banks the RBA is expected to be the last to cut interest rates, thus providing a supportive backdrop for AUD. Recently the RBA Governor Michelle Bullock even stated that the RBA would not hesitate to raise interest rates if inflation did not look like it was falling back down to the RBA’s 1%-3% target in a sustainable manner. The Minutes from the May policy meeting also revealed the RBA governing council openly discussing the possibility of rate hikes in a scenario where inflation remained high.
- AUD/USD bounces back from 0.6630 as higher than expected US weekly jobless claims weigh on the US Dollar.
- Investors look for US NFP data for fresh guidance on interest rates.
- RBA Bullock sees the possibility of further policy tightening if inflation appears to be persistent.
The AUD/USD pair rebounds from 0.6630 in Thursday’s New York session. The Aussie asset recovers as US Dollar (USD) falls back after higher-than-expected weekly United States (US) Initial Jobless Claims for the week ending May 31. Number of individuals claiming jobless benefits for the first time were 229K, higher than estimates of 220K and the prior release of 221K, upwardly revised from 219K.
This adds to doubts that the US labor market is losing strength. This week, JOLTS Job Openings data for April and ADP Employment Change for May missed estimates and deepened fears of normalizing labor market conditions.
Easing US labor market strength have prompted Federal Reserve (Fed) rate-cut bets for the September meeting. The CME FedWatch tool showed that 30-day Fed fund futures pricing in a 68% chance for rate cuts in September, up from 50% recorded a week ago.
Meanwhile, the US Dollar Inde (DXY) has dropped to 104.00. Going forward, the investors will focus on the United States Nonfarm Payrolls (NFP) data for May, which will be published on Friday. According to the estimates, US employers added fresh 185K payrolls, which were lower than the former release of 175K. The Unemployment Rate is estimated to have remained steady at 3.9%.
The Australian Dollar finds bids as Reserve Bank of Australia (RBA) Governor Michele Bullock delivered a hawkish guidance on the interest rate outlook on Wednesday. Bullock indicated that the central bank is prepared to increase interest rates further if inflation doesn’t return to the target range of 1%-3%.
However, slower Australian Q1 Gross Domestic Product (GDP) has raised doubts over its economic outlook. The Australian economy grew meagrely by 0.1%, slower than expectations of 0.2% and the former reading of 0.3%.
Christine Lagarde, President of the European Central Bank (ECB), explains the ECB's decision to cut key rates by 25 basis points in June and responds to questions from the press.
Key quotes
"Wages matter enormously."
"Can't commit to deciding rates only at projection round meetings."
"We have more data at projection round meetings."
"We take inflation fight extremely seriously."
"If neutral rate has increased, we're far away now."
ECB FAQs
The European Central Bank (ECB) in Frankfurt, Germany, is the reserve bank for the Eurozone. The ECB sets interest rates and manages monetary policy for the region. The ECB primary mandate is to maintain price stability, which means keeping inflation at around 2%. Its primary tool for achieving this is by raising or lowering interest rates. Relatively high interest rates will usually result in a stronger Euro and vice versa. The ECB Governing Council makes monetary policy decisions at meetings held eight times a year. Decisions are made by heads of the Eurozone national banks and six permanent members, including the President of the ECB, Christine Lagarde.
In extreme situations, the European Central Bank can enact a policy tool called Quantitative Easing. QE is the process by which the ECB prints Euros and uses them to buy assets – usually government or corporate bonds – from banks and other financial institutions. QE usually results in a weaker Euro. QE is a last resort when simply lowering interest rates is unlikely to achieve the objective of price stability. The ECB used it during the Great Financial Crisis in 2009-11, in 2015 when inflation remained stubbornly low, as well as during the covid pandemic.
Quantitative tightening (QT) is the reverse of QE. It is undertaken after QE when an economic recovery is underway and inflation starts rising. Whilst in QE the European Central Bank (ECB) purchases government and corporate bonds from financial institutions to provide them with liquidity, in QT the ECB stops buying more bonds, and stops reinvesting the principal maturing on the bonds it already holds. It is usually positive (or bullish) for the Euro.
Christine Lagarde, President of the European Central Bank (ECB), explains the ECB's decision to cut key rates by 25 basis points in June and responds to questions from the press.
Key quotes
"Interest rate cut is justified by confidence in the path ahead."
"Robustness of fourth quarter 2025 inflation projection formed basis of rate cut decision."
"Decision and data releases are not perfectly synchronized."
"Not going to tell you until much later in summer if we do something now or at another point in time."
"We will need more data to constantly confirm disinflationary path."
"We're more restrictive in real terms than back in September."
"There will be other bumps on road."
"Some bumps can be anticipated, like base effects."
Economic Indicator
ECB Press Conference
Following the European Central Bank’s (ECB) economic policy decision, the ECB President gives a press conference regarding monetary policy. The president’s comments may influence the volatility of the Euro (EUR) and determine a short-term positive or negative trend. If the president adopts a hawkish tone it is considered bullish for the EUR, whereas if the tone is dovish the result is usually bearish for the Euro.
Read more.Last release: Thu Apr 11, 2024 12:45
Frequency: Irregular
Actual: -
Consensus: -
Previous: -
Source: European Central Bank
Christine Lagarde, President of the European Central Bank (ECB), explains the ECB's decision to cut key rates by 25 basis points in June and responds to questions from the press.
Key quotes
"We expect the economy to continue to recover."
"Recovery to be supported by rising real incomes."
"Surveys point to jobs growth in near term."
"Price pressures are gradually diminishing."
"Wages are rising at an elevated pace."
"Staggered nature of wage adjustment process, labour costs will likely fluctuate in near term."
"Forward looking indicators signal moderating wage grwoth."
"Profits are absorbing parts of rise in unit labour cost."
"Inflation to fluctuate around current levels for rest of year."
"Inflation will then decline towards target in the second half of 2025."
"Risks to growth tilted to the downside over medium term."
"Risks to growth balanced in near term."
ECB FAQs
The European Central Bank (ECB) in Frankfurt, Germany, is the reserve bank for the Eurozone. The ECB sets interest rates and manages monetary policy for the region. The ECB primary mandate is to maintain price stability, which means keeping inflation at around 2%. Its primary tool for achieving this is by raising or lowering interest rates. Relatively high interest rates will usually result in a stronger Euro and vice versa. The ECB Governing Council makes monetary policy decisions at meetings held eight times a year. Decisions are made by heads of the Eurozone national banks and six permanent members, including the President of the ECB, Christine Lagarde.
In extreme situations, the European Central Bank can enact a policy tool called Quantitative Easing. QE is the process by which the ECB prints Euros and uses them to buy assets – usually government or corporate bonds – from banks and other financial institutions. QE usually results in a weaker Euro. QE is a last resort when simply lowering interest rates is unlikely to achieve the objective of price stability. The ECB used it during the Great Financial Crisis in 2009-11, in 2015 when inflation remained stubbornly low, as well as during the covid pandemic.
Quantitative tightening (QT) is the reverse of QE. It is undertaken after QE when an economic recovery is underway and inflation starts rising. Whilst in QE the European Central Bank (ECB) purchases government and corporate bonds from financial institutions to provide them with liquidity, in QT the ECB stops buying more bonds, and stops reinvesting the principal maturing on the bonds it already holds. It is usually positive (or bullish) for the Euro.
- Initial Jobless Claims rose by 229K vs. the previous week.
- Continuing Jobless Claims rose by nearly 1.80M.
US citizens that applied for unemployment insurance benefits increased by 229K in the week ending June 1 according to the US Department of Labor (DoL) on Thursday. The prints surpassed initial estimates (220K) and the previous weekly gain of 221K (revised from 216K).
In addition, Continuing Claims increased by 2K to 1.792M in the week ended May 25.
Market reaction
The US Dollar Index (DXY) reverses two sessions in a row of gains and trades slightly on the back foot following further signs of cooling of the US labour market.
- Silver has been oscillating in a range since mid May.
- More recently it has breached the bottom of the range and looks marginally bearish.
- A re-break of the $29.38 level would confirm more downside back inside familiar levels.
Silver (XAG/USD) has been oscillating between the mid $32s and mid $29s from mid May. More recently, on June 4, Silver decisively broke below multi-year support at the $30.00 mark and fell to a low of $29.38. The break was not sustained, however, as Silver then promptly reversed, broke back up above the level and back into the mid $30s.
Silver 4-hour Chart
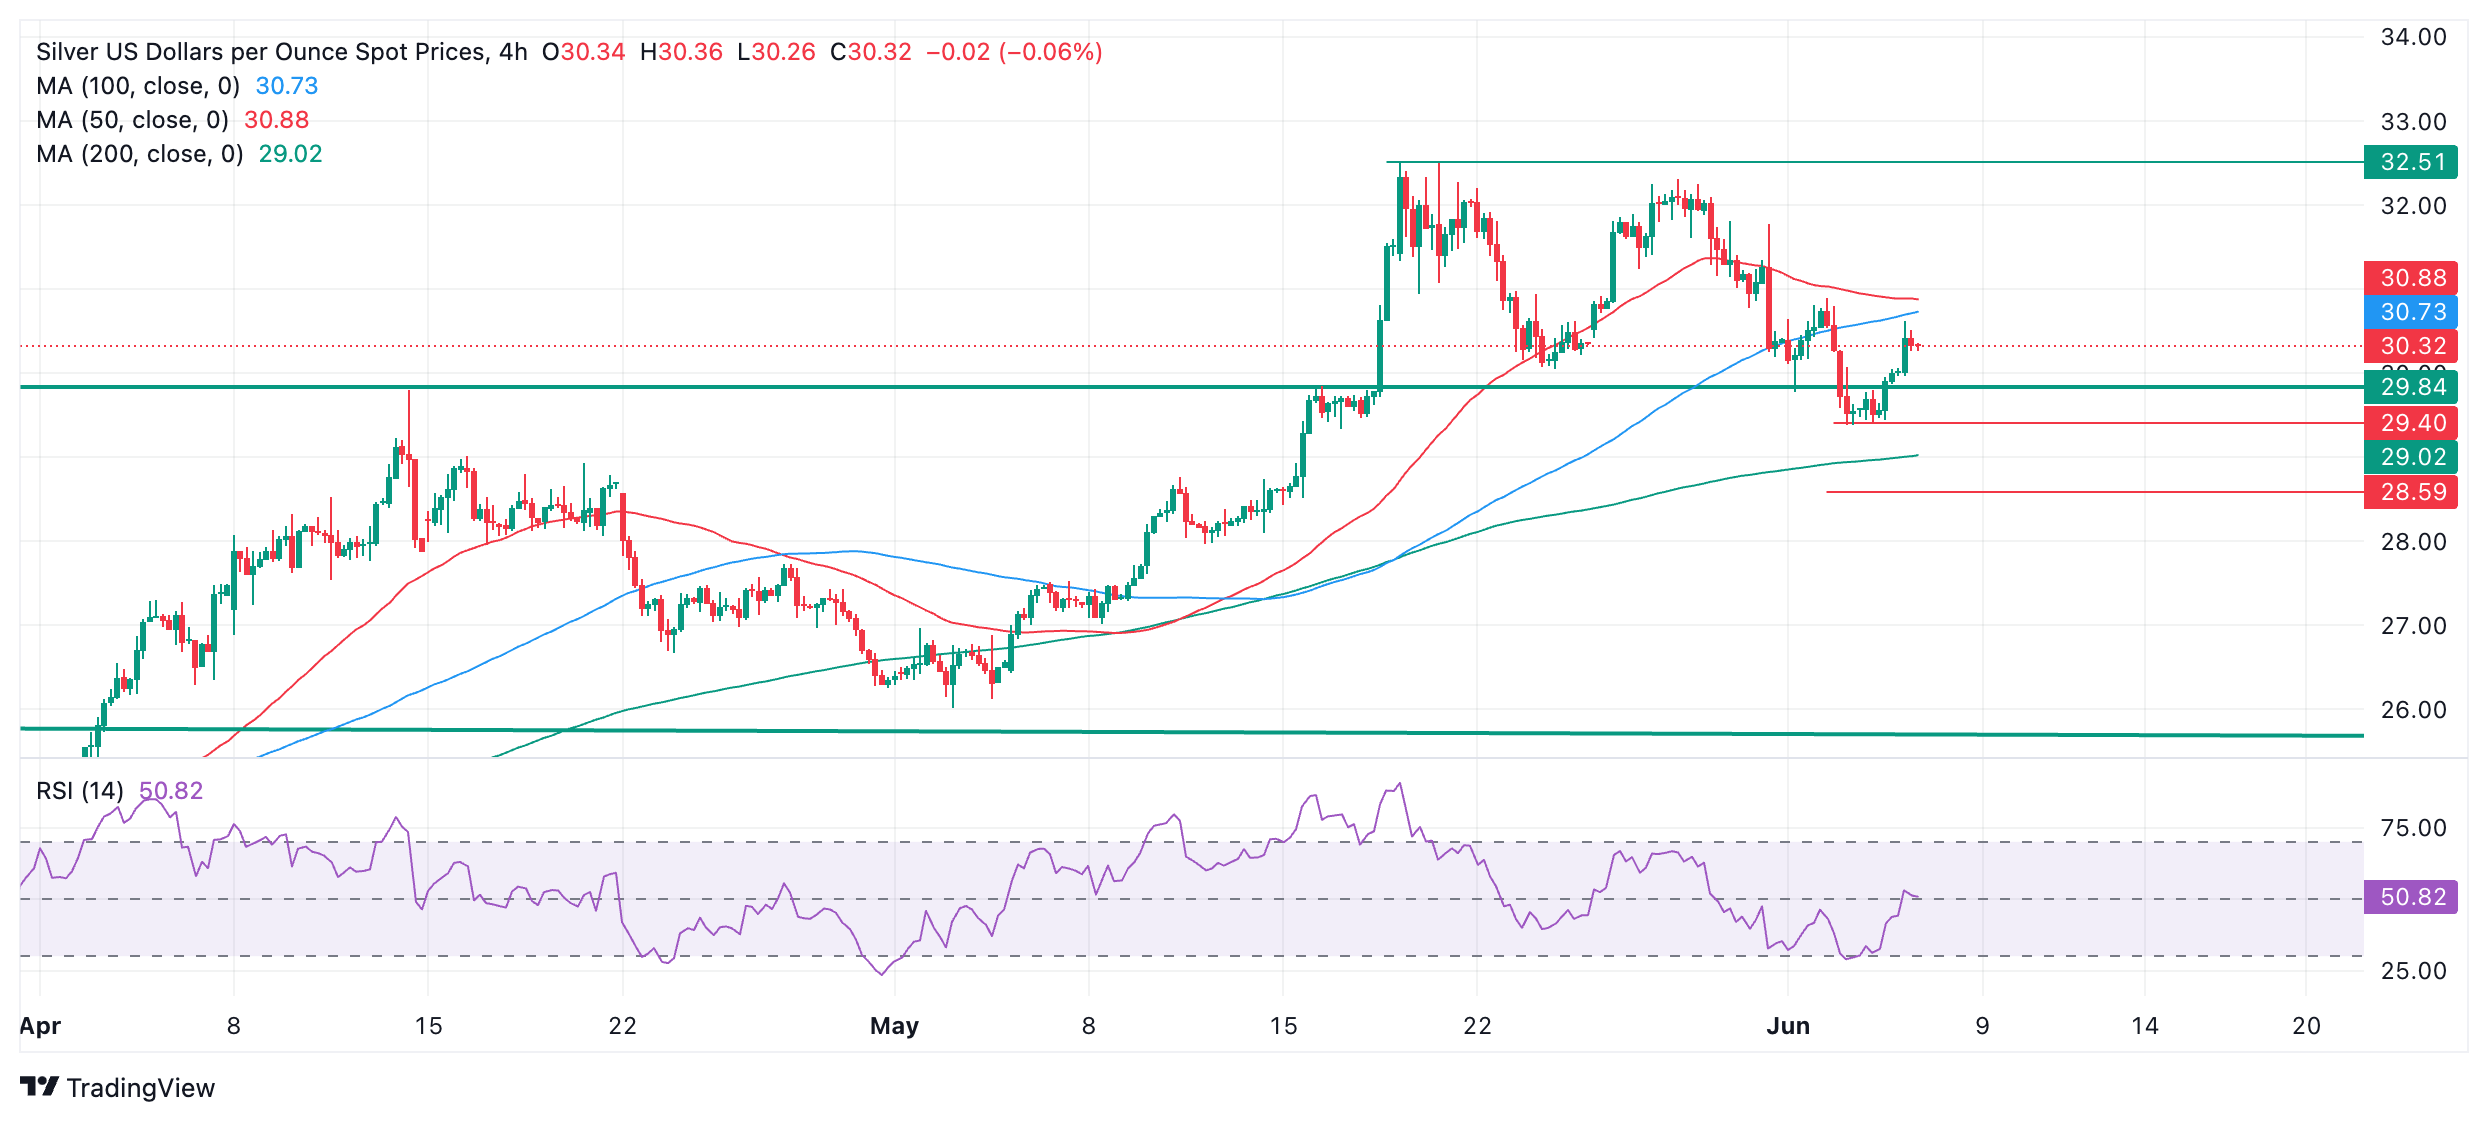
Silver’s tone is marginally bearish. A re-break below the 29.38 June low would provide confirmation of more downside, and probably reverse the trend to bearish in the short-term.
In such a scenario the next target to the downside might be at around 28.59 (50-day SMA).
It would require a move back above $32.51 (May 20 high) and the creation of a new high to reinvigorate the uptrend. Such a break might lead Silver to stretch up to the next target at $35.30 (October 2012 high).
- The US Dollar falls slightly after a risk-on move overnight.
- Markets will be focused on US data and the ECB rate decision.
- The US Dollar Index holds above 104.00 after paring gains on Wednesday.
The US Dollar (USD) edges lower on Thursday as markets brace for the European Central Bank (ECB) policy decision. The ECB is set to make its first rate cut after its hiking cycle started post-pandemic to tame inflation, with traders looking for clues on what this could mean for the US, the Federal Reserve (Fed) and the Greenback. Normally a rate cut would mean devaluation for the local currency, in this for the Euro, though a 'one-and-done' message could form a knee jerk reaction in the markets and be perceived as very hawkish.
On the economic front, besides the ECB meeting, weekly US Jobless Claims are on the forefront ahead of the Nonfarm Payrolls number on Friday. Traders are having difficulties digesting data from the US that point to diverging conclusions after strong Services Purchasing Managers Index numbers (PMI) on Wednesday defied the downbeat Manufacturing data released on Monday. The Challenger Job Cuts report for May might shed some light on how labor demand is holding up.
Daily digest market movers: All eyes on Lagarde
- The Challenger Job Cuts report for May, to be released at 11:30 GMT, kicks-off the data releases. The previous number was 64,789 layoffs
- At 12:15 GMT, the European Central Bank will release its official rate decision and joint statement. Expectations are near 100% for a 25-basis-point rate cut from 4% to 3.75% for the Deposit Facility rate.
- At 12:30 GMT, while markets are still digesting the ECB rate decision, nearly all US data points for this Thursday will be released:
- Initial Jobless Claims are expected to tick up to 220,000 from 219,000. Continuing Claims should ease a little to 1,790,000 from 1,791,000.
- Goods Trade Balance posted a deficit of $99.4 billion in March. Goods and Services Trade deficit should widen to $76.1 billion in April from $69.4 billion in March.
- Nonfarm Productivity in the first quarter should grow by 0.1%, slower than the 0.3% seen in the previous quarter. Growth in Unit Labor Costs is set to accelerate to 4.9% from 4.7%.
- At 12:45 GMT, ECB President Christine Lagarde will comment on the rate decision. Fresh projections on growth and inflation will be released as well.
- Equities trade in a positive tone, having taken over the risk-on vibe from the US at the closing bell on Wednesday.
- According to the CME Fedwatch Tool, Fed Fund futures pricing data suggests a 31.4% chance for keeping rates unchanged in September, against a 56.8% chance for a 25 basis points (bps) rate cut and a 11.3% chance for an even 50 bps rate cut. An interest rate hike is no longer considered an option. For the upcoming meeting on June 12, futures are fully pricing that rates will remain at current levels.
- The benchmark 10-year US Treasury Note trades around 4.3%, near the fresh monthly low from Wednesday at 4.27%.
US Dollar Index Technical Analysis: For once all on ECB
The US Dollar Index (DXY) is set to move, and the bias is to the downside. The main driver will come from comments from the ECB as – although a rate cut is priced in – this does not mean that substantial US Dollar strength might emerge. Should the ECB remain at its stance of being data dependent and push back against odds for another cut in July or September, markets might push the Euro higher, and therefore see the Greenback devalue further.
On the upside, the DXY first faces double resistance in the form of the 200-day Simple Moving Average (SMA) at 104.43 and the 100-day SMA at 104.42. Next up, the pivotal level near 104.60 comes into play. For now, the topside is forming around 105.00, with the 55-day SMA coinciding with this round number and the peak from recent weeks at 105.12.
On the downside, the 104.00 big figure looks to be holding. Once through there, another decline to 103.50 and even 103.00 are the levels to watch. With the Relative Strength Index (RSI) still not oversold, more downsides are still under consideration.
US Dollar FAQs
The US Dollar (USD) is the official currency of the United States of America, and the ‘de facto’ currency of a significant number of other countries where it is found in circulation alongside local notes. It is the most heavily traded currency in the world, accounting for over 88% of all global foreign exchange turnover, or an average of $6.6 trillion in transactions per day, according to data from 2022. Following the second world war, the USD took over from the British Pound as the world’s reserve currency. For most of its history, the US Dollar was backed by Gold, until the Bretton Woods Agreement in 1971 when the Gold Standard went away.
The most important single factor impacting on the value of the US Dollar is monetary policy, which is shaped by the Federal Reserve (Fed). The Fed has two mandates: to achieve price stability (control inflation) and foster full employment. Its primary tool to achieve these two goals is by adjusting interest rates. When prices are rising too quickly and inflation is above the Fed’s 2% target, the Fed will raise rates, which helps the USD value. When inflation falls below 2% or the Unemployment Rate is too high, the Fed may lower interest rates, which weighs on the Greenback.
In extreme situations, the Federal Reserve can also print more Dollars and enact quantitative easing (QE). QE is the process by which the Fed substantially increases the flow of credit in a stuck financial system. It is a non-standard policy measure used when credit has dried up because banks will not lend to each other (out of the fear of counterparty default). It is a last resort when simply lowering interest rates is unlikely to achieve the necessary result. It was the Fed’s weapon of choice to combat the credit crunch that occurred during the Great Financial Crisis in 2008. It involves the Fed printing more Dollars and using them to buy US government bonds predominantly from financial institutions. QE usually leads to a weaker US Dollar.
Quantitative tightening (QT) is the reverse process whereby the Federal Reserve stops buying bonds from financial institutions and does not reinvest the principal from the bonds it holds maturing in new purchases. It is usually positive for the US Dollar.
- Oil steadies near $74.00 after a sizeable decline in the first part of the week.
- OPEC+ pushes against the bearish outlook, warning about the possibility of unwinding the taper of voluntary cuts.
- The US Dollar Index trades just above 104.00 as ECB decision looms.
Oil prices are in repair mode on Thursday after a near 10% decline in just five trading days. The sharp downside move came after the OPEC+ meeting did not hold any measure to further support prices at or around $80.00. With markets disappointed, several central banks added fuel to the fire by suggesting that an aggressive cutting cycle might not take place as disinflation is going too slow. The sell-off in the past days has prompted a response from OPEC+, which said that the organization is ready to do more to support prices when needed.
Meanwhile, the US Dollar Index (DXY) is hovering just above 104.00 after Monday’s downbeat economic data pushed the Greenback to the lower end of the 104.00-105.00 range. With the European Central Bank (ECB) interest-rate decision on the docket for this Thursday and the US Employment Report on Friday, the DXY might be trading in a new range by the closing bell at the end of the week.
At the time of writing, Crude Oil (WTI) trades at $74.23 and Brent Crude at $78.60
Oil news and market movers: OPEC+ lashes out
- Saudi Energy Minister Prince Abdulaziz bin Salman reiterated that the OPEC agreement from Sunday, like every other OPEC+ deal, retains the option to pause or reverse production changes if necessary, Bloomberg reported.
- Citigroup upgraded its outlook forecast on the back of comments from OPEC+, forecasting that the organization might extend their output caps towards the end of the first half of 2025.
- The Citigroup report also forecasts that Oil prices might fall to $70 in 2H 2024 and to $60 per barrel in 2025 if OPEC does not change its production levels.
- Some help for Oil prices could come as US Federal Reserve Funds futures pricing data projects a rate cut in September. Lower interest rates could spark demand for Oil again, Reuters reports.
Oil Technical Analysis: OPEC+ is not the Fed or ECB
Oil prices are still depressed following their near 10% slide lower. The decline is driven by the fact thatOPEC+ is unable and reluctant to take more measures to limit production. It looks increasingly clear that Oil demand will largely depend on what big central banks do as an interest-rate cut cycle wouldspark an economic rally, which will support Oil demand.
Looking up, the pivotal level near $75.27 needs to be recovered first before aiming for the key Simple 100-day and 200-day Simple Moving Averages (SMA) at $79.09 and $79.42, respectively. Next, the 55-day Simple Moving Average (SMA) at $81.13 and the descending trendline at $81.45 are an area with a lot of resistance where any recovery rally could pause. Once broken through there, the road looks quite open to head to $87.12.
The $76.00 marker is now a resistance with the $75.27 level playing a crucial role if traders still want to have an option to head back to $80.00. Risks are skewed towards another leg lower, all the way down to $68.00, below $70.00.

US WTI Crude Oil: Daily Chart
WTI Oil FAQs
WTI Oil is a type of Crude Oil sold on international markets. The WTI stands for West Texas Intermediate, one of three major types including Brent and Dubai Crude. WTI is also referred to as “light” and “sweet” because of its relatively low gravity and sulfur content respectively. It is considered a high quality Oil that is easily refined. It is sourced in the United States and distributed via the Cushing hub, which is considered “The Pipeline Crossroads of the World”. It is a benchmark for the Oil market and WTI price is frequently quoted in the media.
Like all assets, supply and demand are the key drivers of WTI Oil price. As such, global growth can be a driver of increased demand and vice versa for weak global growth. Political instability, wars, and sanctions can disrupt supply and impact prices. The decisions of OPEC, a group of major Oil-producing countries, is another key driver of price. The value of the US Dollar influences the price of WTI Crude Oil, since Oil is predominantly traded in US Dollars, thus a weaker US Dollar can make Oil more affordable and vice versa.
The weekly Oil inventory reports published by the American Petroleum Institute (API) and the Energy Information Agency (EIA) impact the price of WTI Oil. Changes in inventories reflect fluctuating supply and demand. If the data shows a drop in inventories it can indicate increased demand, pushing up Oil price. Higher inventories can reflect increased supply, pushing down prices. API’s report is published every Tuesday and EIA’s the day after. Their results are usually similar, falling within 1% of each other 75% of the time. The EIA data is considered more reliable, since it is a government agency.
OPEC (Organization of the Petroleum Exporting Countries) is a group of 13 Oil-producing nations who collectively decide production quotas for member countries at twice-yearly meetings. Their decisions often impact WTI Oil prices. When OPEC decides to lower quotas, it can tighten supply, pushing up Oil prices. When OPEC increases production, it has the opposite effect. OPEC+ refers to an expanded group that includes ten extra non-OPEC members, the most notable of which is Russia.
- EUR/GBP continues trading below a multi-month range it was in for most of the start of 2024.
- It failed to break back inside at the last retest and there is a risk of more downside evolving.
EUR/GBP continues trading below the base of the multi-month range it broke out of on May 22. After the pair fell to a low of 0.8484 on May 29, it pulled back and retested the base of the range on May 31. The retest failed and since then EUR/GBP has been going down again.
EUR/GBP Daily Chart
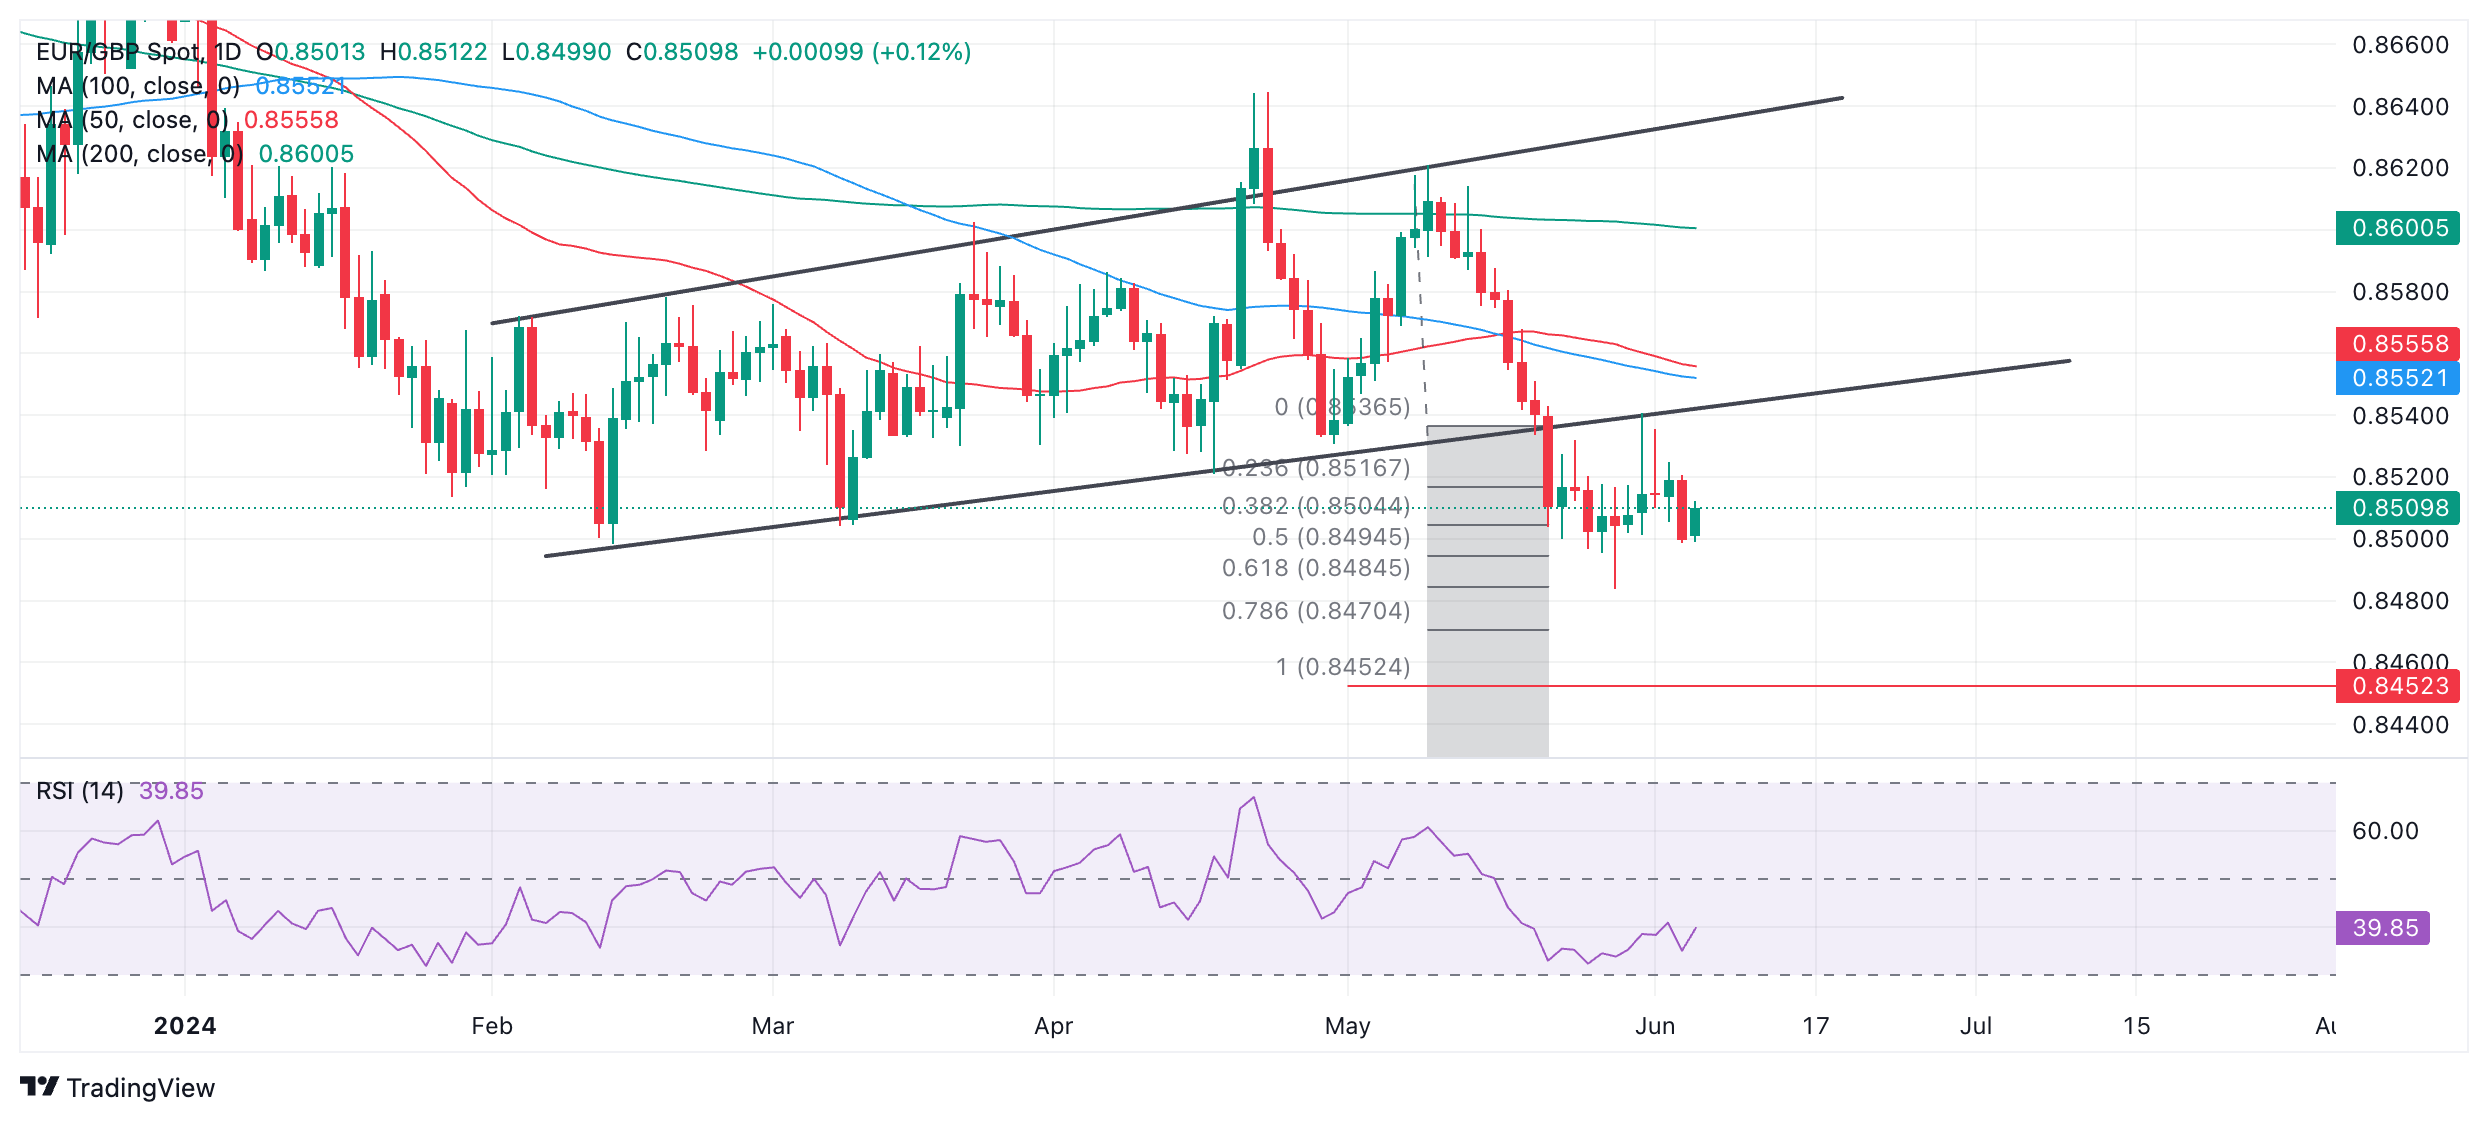
When prices break out below ranges they usually fall to a target that is at least a 0.618 Fibonacci ratio of the height of the range extrapolated lower. This gives a target between 0.8484 and 0.8479 depending on where you measure the height of the range. Price just tipped the top of this target zone at the bottom of the May 29 sell-off.
A break below the 0.8484 low (May 29) would confirm more weakness, probably to a target at around 0.8452, which represents the full height of the range extrapolated lower.
Alternatively a break above the May 31 high at 0.8541 would bring the bearish bias into doubt.
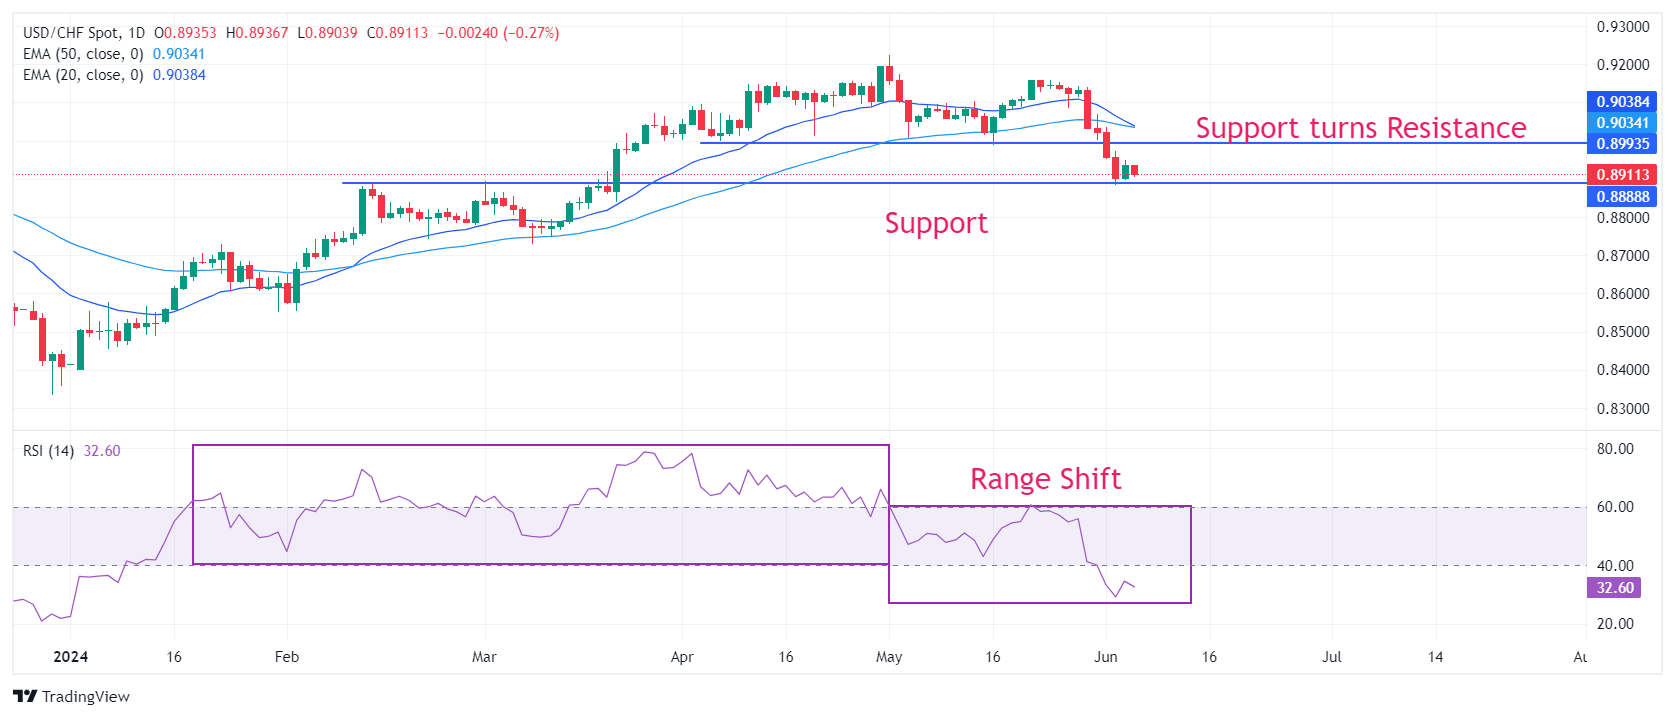
- USD/CHF drops back to 0.8900 as Swiss Franc strengthens amid fears of SNB’s stealth intervention plans.
- A weak Swiss Franc had made Swiss exports competitive in the global market.
- The US Dollar bounces back as investors turn cautious ahead of the US NFP.
The USD/CHF pair retreats while attempting to extend recovery above the immediate resistance of 0.8950 on Thursday. The Swiss Franc asset drops as the Swiss Franc strengthens amid growing speculation that the Swiss National Bank (SNB) will intervene in the currency market to boost the Swiss Franc’s demand.
SNB policymakers worry that Swiss exports have become competitive due to weak currency, which could prompt upside risks to inflation. On the economic front, monthly Swiss Unemployment Rate for May came in at 2.3%, matches estimates and the prior release.
Meanwhile, the US Dollar (USD) recovers intraday losses amid uncertainty ahead of the United States (US) Nonfarm Payrolls (NFP) data for May, which will be published on Friday. The US NFP is estimated to report that the hiring process remains robust as fresh payrolls were 185K, higher than the prior release of 175K. The Unemployment Rate is expected to have remained steady at 3.9%.
Investors will also focus on the Average Hourly Earnings data, which gauges wage growth, that has remained a major driver to persistent price pressures. Annual Average Hourly Earnings are forecasted to have grown steadily by 3.9%.
Temporarily, the USD/CHF pair finds support near the horizontal support plotted from February 14 high at 0.8886. Earlier, the Swiss Franc asset weakened after breaking below the horizontal support marked from April 5 near 0.9000, which has become a major resistance for the US Dollar bulls.
The overall trend is bearish as the 20- and 50-day Exponential Moving Averages (EMAs) appear to deliver a bear cross near 0.9035.
The 14-period Relative Strength Index (RSI) shifts into the bearish range of 20.00-60.00 from the bullish range of 40.00-80.00, indicating a bearish reversal.
More downside would appear if the asset breaks below June 4 low of 0.8900, which will open room for March 21 low at 0.8840 and the round-level support of 0.8800.
On the flip side, a recovery move above the psychological resistance of 0.9000 will drive the asset towards June 3 high at 0.9036, followed by May 28 low at 0.9086.
USD/CHF daily chart
- Gold trades higher as bets the Fed will cut rates in September remain elevated despite strong US service sector data.
- The BoC has cut interest rates, the ECB is likely to on Thursday, the SNB could later in June – all positives for non-yielding Gold.
- Gold breaks out of its range higher, muddying the short-term technical picture.
Gold (XAU/USD) is trading up around a quarter of a percent in the $2,360s on Thursday. The move comes as a result of continued elevated expectations that the Federal Reserve (Fed) will cut interest rates as soon as September, despite the release of higher-than-expected US Institute for Supply Management’s (ISM) Services PMI data on Wednesday.
Gold rises as markets anticipate lower interest rates
Gold pushes higher on Thursday as investors continue to bet on the Fed cutting interest rates, with the probabilities standing at 69% that the rate being lower than the current level in September, based on the CME FedWatch tool, which bases its estimates on 30-day US Fed Fund Futures pricing data. The anticipation of lower interest rates is positive for Gold as it reduces the opportunity cost of holding the non-yielding asset.
Globally, interest rate expectations are falling. On Wednesday, the Bank of Canada (BoC) cut its overnight rate to 4.75% from 5.00%; the European Central Bank (ECB) is widely expected to cut its key interest rate by 0.25% to 4.25% at its policy meeting today (Thursday). After the release of lower inflation data in Switzerland, speculation is also rising for the Swiss National Bank (SNB) to cut its key rate when it makes its decision on June 20.
Service sector data ends poor run, Nonfarm Payrolls eyed
The outlook for the US economy gained a lift on Wednesday after a combination of higher-than-expected ISM Services PMI data for May and tech-sector optimism. The move led to a rebound in the US Dollar (USD).
US employment data on Friday is keenly awaited and could impact Gold price. The US Nonfarm Payrolls (NFP) report is expected to show a rise of 185K in May, however, negative JOLTS Job Openings data and a lower-than-expected ADP Employment Change this week have reduced investor-optimism regarding the US Bureau of Labor Statistics report.
If the NFPs also show weakness, it would probably weigh on the USD and further increase bets the Fed will cut interest rates early, providing a backwind to Gold price.
Technical Analysis: Gold breaks out of range, bringing downtrend into doubt
Gold price has broken out of the mini-range that stretches between $2,315 and $2,358. The upside break brings the short-term downtrend into doubt and could mark a reversal.
XAU/USD’s break above the range high generates a target at $2,385, the 0.618 Fibonacci extrapolation of the height of the range from the breakout point higher. A move above $2,375 would increase confirmation the target will get hit.
XAU/USD 4-hour Chart
The break below the trendline in May generated downside targets. These are now brought into doubt by the upside break, however, a move back inside the range and then a break below the $2,315 range low would reactivate them.
The length of the move prior to a break can be used as a guide to the follow-through move after a break, according to technical analysis. The first target for the follow-through is at $2,303 – the 0.618 Fibonacci extrapolation of “a”. A stronger move down could even see Gold reach support at $2,279.
The precious metal’s medium and long-term trends are still bullish, and the risk of a recovery remains high.
Economic Indicator
ISM Services PMI
The Institute for Supply Management (ISM) Services Purchasing Managers Index (PMI), released on a monthly basis, is a leading indicator gauging business activity in the US services sector, which makes up most of the economy. The indicator is obtained from a survey of supply executives across the US based on information they have collected within their respective organizations. Survey responses reflect the change, if any, in the current month compared to the previous month. A reading above 50 indicates that the services economy is generally expanding, a bullish sign for the US Dollar (USD). A reading below 50 signals that services sector activity is generally declining, which is seen as bearish for USD.
Read more.Last release: Wed Jun 05, 2024 14:00
Frequency: Monthly
Actual: 53.8
Consensus: 50.8
Previous: 49.4
Source: Institute for Supply Management
The Institute for Supply Management’s (ISM) Services Purchasing Managers Index (PMI) reveals the current conditions in the US service sector, which has historically been a large GDP contributor. A print above 50 shows expansion in the service sector’s economic activity. Stronger-than-expected readings usually help the USD gather strength against its rivals. In addition to the headline PMI, the Employment Index and the Prices Paid Index numbers are also watched closely by investors as they provide useful insights regarding the state of the labour market and inflation.
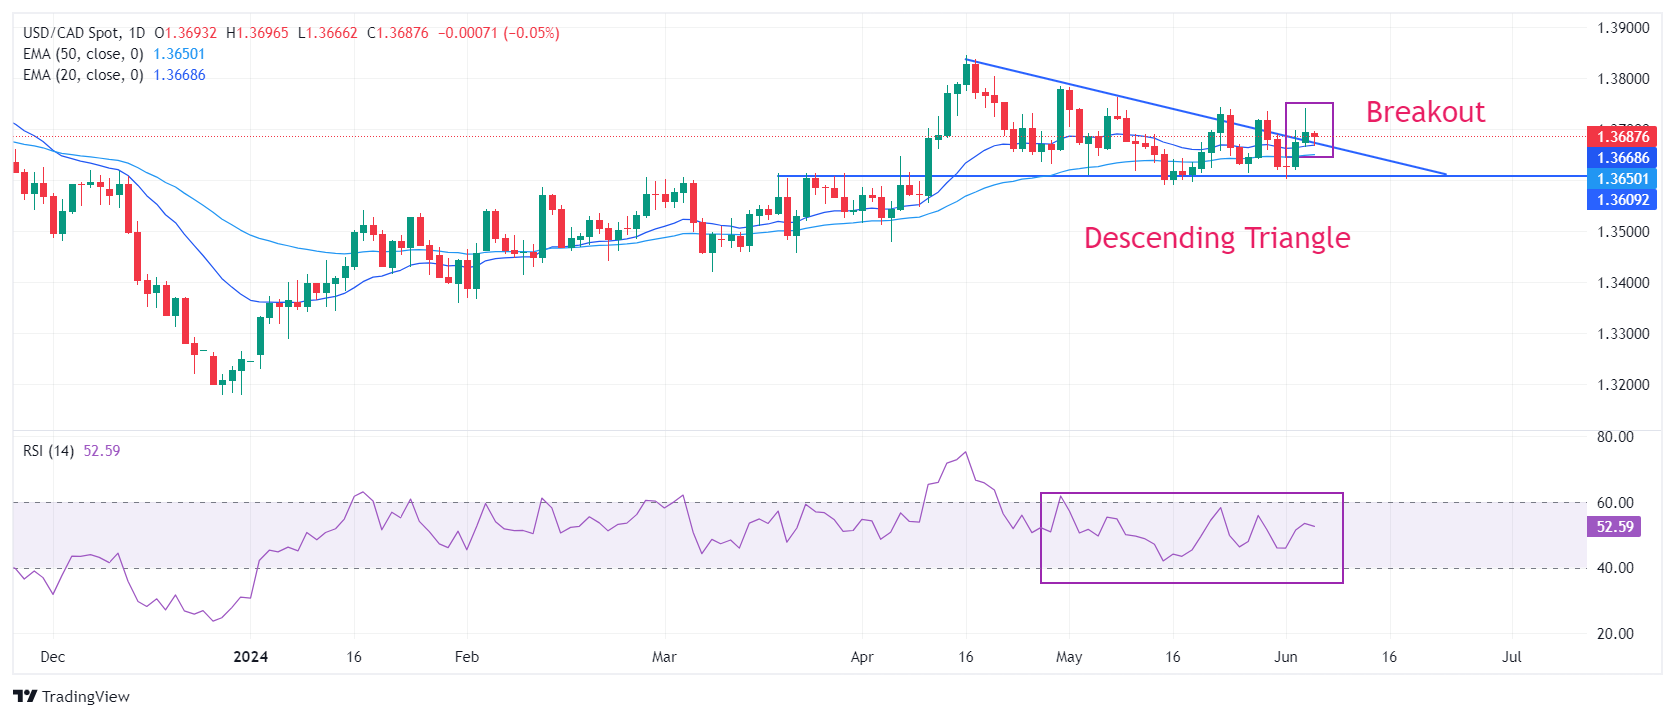
- USD/CAD rebounds from 1.3666 as the US Dollar holds ground ahead of US NFP data.
- The BoC announces a rate cut decision, as expected, and emphasizes a data-centric approach for the interest-rate path.
- USD/CAD holds the Descending Triangle breakout.
The USD/CAD pair bounces back from the day’s low of 1.3666 in Thursday’s London session. The Loonie asset rebounds as the US Dollar recovers intraday losses. The US Dollar Index (DXY) rebounds from the crucial support of 104.00 as investors turn cautious ahead of the United States Nonfarm Payrolls (NFP) report for May, which will be published on Friday.
The US NFP report will impact market speculation for Federal Reserve (Fed) rate cuts, which investors expect that it will start from the September meeting. Higher-than-expected payrolls and wage growth momentum would force traders to push back Fed rate-cut bets while soft numbers will do the opposite.
Meanwhile, the Canadian Dollar is expected to remain on the backfoot as the Bank of Canada (BoC) becomes the first central bank of G-7 nations, which has initiated the rate-cut cycle. The BoC reduced interest rates by 25 basis points (bps) to 4.75% on Wednesday. Investors had already priced in a rate-cut move as Canada’s preferred inflation measure, which is BoC’s core Consumer Price Index (CPI), has already come down below 2%, and the labor market conditions are vulnerable.
Regarding the interest rate outlook, BoC Governor Tiff Macklem commented that if inflation continues to ease and the economy's behaviour remains in line with the bank’s forecast, it would become appropriate to cut interest rates further.
The near-term outlook of the USD/CAD pair remains firm as it holds the breakout of the Descending Triangle chart formation on a daily timeframe. A breakout of the above-mentioned chart pattern results in heavy volume and wider ticks on the upside.
Upward-sloping 20-and 50-day Exponential Moving Average (EMA), which trade around 1.3675 and 1.3650, respectively, suggest that the near-term trend is bullish.
The 14-period Relative Strength Index (RSI) oscillates in the 40.00-60.00 range, indicating indecisiveness among market participants.
Fresh buying opportunity would emerge if the asset breaks above April 30 high at 1.3785. This would drive the asset towards April 17 high at 1.3838, followed by the round-level resistance of 1.3900.
In an alternate scenario, a breakdown below May 3 low around 1.3600 will expose the asset to the April 9 low around 1.3547 and the psychological support of 1.3500.
USD/CAD daily chart
Silver prices (XAG/USD) rose on Thursday, according to FXStreet data. Silver trades at $30.29 per troy ounce, up 0.96% from the $30.00 it cost on Wednesday.
Silver prices have increased by 18.92% since the beginning of the year.
| Unit measure | Today Price |
|---|---|
| Silver price per troy ounce | $30.29 |
| Silver price per gram | $0.97 |
The Gold/Silver ratio, which shows the number of troy ounces of Silver needed to equal the value of one troy ounce of Gold, stood at 77.92 on Thursday, down from 78.51 on Wednesday.
Investors might use this ratio to determine the relative valuation of Gold and Silver. Some may consider a high ratio as an indicator that Silver is undervalued – or Gold is overvalued – and might buy Silver or sell Gold accordingly. Conversely, a low ratio might suggest that Gold is undervalued relative to Silver.
- EUR/JPY exhibits strength ahead of the ECB’s policy decision.
- The ECB is expected to announce a dovish decision but will not commit subsequent rate cuts.
- BoJ Ueda emphasizes reducing bond purchases in a manner to exit from an expansionary policy stance.
The EUR/JPY pair clings to gains near the psychological resistance of 170.00 in Thursday’s European session. The cross holds onto strength ahead of the European Central Bank’s (ECB) monetary policy announcement at 12:15 GMT.
The ECB IS expected to cut its Deposit Facility Rate by 25 basis points (bps) to 3.75%. A rate-cut move by the ECB in June’s meeting appears to be a done deal, as several ECB officials have already communicated. However, the attention of investors will be on the interest-rate outlook. The ECB is expected to state that they intend to remain data-dependent and prefer not to commit to any specific interest-rate path as the battle against inflation has not been won yet.
The reasoning behind abstaining from committing subsequent rate cuts is the higher-than-expected increase in the annual Eurozone’s Harmonized Index of Consumer Prices (HICP) data for May and the return of the old continent to growth after a shallow recession in the second half of 2023.
A slew of ECB policymakers have also warned that premature rate cuts could revamp price pressures again and will offset efforts yet made to bring inflation down to their current levels.
On the economic front, German Factory Orders for April unexpectedly contracted by 0.2%. The economic data declined for the fourth straight time. Investors anticipated them to have grown by 0.3%. Annually, Industrial Orders contracted by 1.6%.
Meanwhile, the Japanese Yen weakened after Bank of Japan (BoJ) Governor Kazuo Ueda commented that inflation expectations are gradually rising but have yet to reach 2%, Reuters reported. Ueda emphasized on reducing bond purchases in a manner to move forward towards their agenda of exiting expansionary policy stance.
Over the policy outlook, BoJ board member Toyoaki Nakamura advised that the current policy framework is appropriate for now as households' purchasing power is weak. Therefore, a solid increase in disposable income is necessary to encourage spending.
- The Pound Sterling hovers near 1.2800 against the US Dollar with a focus on the US NFP data.
- Investors see the BoE delivering two interest-rate cuts this year.
- The USD Index holds the 104.00 support even though traders raise Fed rate-cut bets.
The Pound Sterling (GBP) trades close to a two-month high slightly below the round-level figure of 1.2800 against the US Dollar (USD) in Thursday’s London session. The GBP/USD pair holds strength as the US Dollar weakens due to growing speculation that the Federal Reserve (Fed) will start reducing interest rates from September.
The US Dollar Index (DXY), which tracks the Greenback’s value against six major currencies, falls back to the crucial support of 104.00.
According to the CME FedWatch tool, 30-day Fed Funds futures pricing data suggests a roughly 68% chance of interest rates declining from their current levels in September, higher than the 50% recorded a week ago. Investors are also pricing in two rate cuts by the Fed this year.
Market speculation for Fed rate cuts has strengthened after recent data pointed to a slowdown in the United States (US) economy via easing labor demand and weak factory data. This week, the US JOLTS Job Openings data came in lower than expected for April and the ADP Employment Change failed to beat estimates in May. Also, the US Manufacturing PMI report for May showed that factory activity contracted for the second straight month and the forward demand is vulnerable. This string of weak economic data seems to have offset the upbeat ISM Services PMI released on Wednesday, which signalled that the US services sector swang back to expansion in May.
Daily digest market movers: Pound Sterling hovers around two-month high at 1.2800
- The Pound Sterling trades broadly steady near 1.2800 against the US Dollar as the global rate-cut cycle picks up pace after the Bank of Canada (BoC) announced on Wednesday an interest-rate cut, becoming the first G7 central bank to do so in the current cycle. The BoC reduced interest rates by 25 basis points (bps) as expected. Also, the European Central Bank (ECB) is widely anticipated to reduce its Deposit Facility Rate by 25 bps in Thursday’s late European session. The Bank of England (BoE) and the Fed are expected to follow suit later this year.
- The Fed is expected to start lowering its key borrowing rates from the September meeting. However, expectations could shift significantly once the US Nonfarm Payrolls (NFP) report for May is published on Friday.
- The US NFP is estimated to report that hiring remained robust in May, with employers adding 185K payrolls, higher than the prior release of 175K. The Unemployment Rate is expected to remain steady at 3.9%.
- Investors will also focus on the Average Hourly Earnings data, which gauges wage growth and has remained a major barrier to progress in the disinflation process. Annual Average Hourly Earnings are forecasted to have grown steadily by 3.9%, while on a monthly basis wages are expected to have grown 0.3%, higher than the prior reading of 0.2%. Higher-than-expected payrolls and wage growth would force traders to push back Fed rate-cut bets while soft numbers will do the opposite.
- On the other side of the Atlantic, the United Kingdom’s (UK) economic calendar has nothing much to offer this week. But next week, investors will look into Employment data for the February-April period and the monthly Gross Domestic Product (GDP) data for April. These economic data will significantly impact market expectations for Bank of England (BoE) rate cuts. Currently, investors expect that the BoE will deliver two rate cuts this year and will initiate the policy-easing cycle from the August meeting.
Technical Analysis: Pound Sterling aims to stabilize above 78.6% Fibonacci retracement
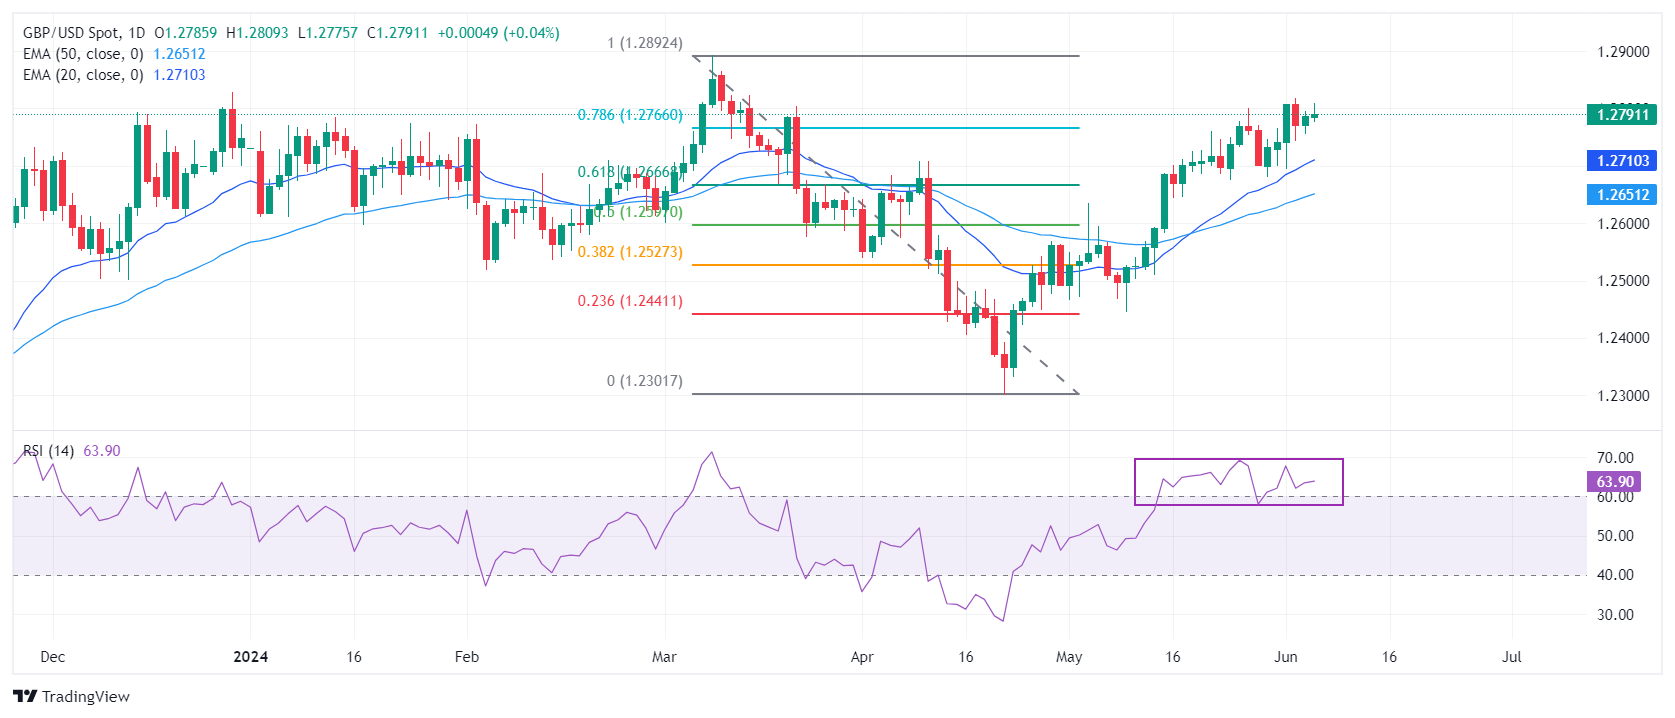
The Pound Sterling trades back and forth around 1.2800 against the US Dollar. The GBP/USD pair struggles to stabilize above 1.2800 ahead of the US NFP data on Friday. The near-term outlook of the Cable remains firm as it trades above 1.2770, the 78.6% Fibonacci retracement support (plotted from the March 8 high of 1.2900 to the April 22 low at 1.2300).
The Cable is expected to remain in the bullish trajectory as the 20-day and 50-day Exponential Moving Averages (EMAs) at 1.2710 and 1.2650, respectively, are sloping higher, indicating a strong uptrend.
The 14-period Relative Strength Index (RSI) has shifted into the 60.00-80.00 range, suggesting that the momentum has leaned toward the upside.
Pound Sterling FAQs
The Pound Sterling (GBP) is the oldest currency in the world (886 AD) and the official currency of the United Kingdom. It is the fourth most traded unit for foreign exchange (FX) in the world, accounting for 12% of all transactions, averaging $630 billion a day, according to 2022 data. Its key trading pairs are GBP/USD, aka ‘Cable’, which accounts for 11% of FX, GBP/JPY, or the ‘Dragon’ as it is known by traders (3%), and EUR/GBP (2%). The Pound Sterling is issued by the Bank of England (BoE).
The single most important factor influencing the value of the Pound Sterling is monetary policy decided by the Bank of England. The BoE bases its decisions on whether it has achieved its primary goal of “price stability” – a steady inflation rate of around 2%. Its primary tool for achieving this is the adjustment of interest rates. When inflation is too high, the BoE will try to rein it in by raising interest rates, making it more expensive for people and businesses to access credit. This is generally positive for GBP, as higher interest rates make the UK a more attractive place for global investors to park their money. When inflation falls too low it is a sign economic growth is slowing. In this scenario, the BoE will consider lowering interest rates to cheapen credit so businesses will borrow more to invest in growth-generating projects.
Data releases gauge the health of the economy and can impact the value of the Pound Sterling. Indicators such as GDP, Manufacturing and Services PMIs, and employment can all influence the direction of the GBP. A strong economy is good for Sterling. Not only does it attract more foreign investment but it may encourage the BoE to put up interest rates, which will directly strengthen GBP. Otherwise, if economic data is weak, the Pound Sterling is likely to fall.
Another significant data release for the Pound Sterling is the Trade Balance. This indicator measures the difference between what a country earns from its exports and what it spends on imports over a given period. If a country produces highly sought-after exports, its currency will benefit purely from the extra demand created from foreign buyers seeking to purchase these goods. Therefore, a positive net Trade Balance strengthens a currency and vice versa for a negative balance.
- The Mexican Peso extends its recovery into a second day supported by broad risk appetite.
- The rebound started following market-soothing comments from the Mexican Finmin that the new government would act responsibly.
- USD/MXN approaches 17.34, a key support level. The short-term directional bias is unclear.
The Mexican Peso (MXN) is up by around a quarter of a percent on Thursday in its key pairs as a positive risk tone prevails and helps support the sentiment-sensitive Peso. MXN continues clawing back losses after the 5% depreciation sparked by the Mexican election on Sunday.
USD/MXN is exchanging hands at 17.46 at the time of writing, EUR/MXN is trading at 19.00 and GBP/MXN at 22.34.
Mexican Peso extends rebound on market optimism
The Mexican Peso rises on Thursday as a wave of risk-on breaks across markets. Wednesday’s US session saw the S&P 500 climb to a new record high of 5,354, the Nasdaq hit a new all-time high of 19,044 and the “magnificent seven” peak after posting 2.24% gains. The surge was driven by a mixture of renewed tech optimism and positive May Institute for Supply Management’s (ISM) Services Purchasing Managers Index (PMI) data for the US.
The positive market mood carried on into the Asian session, with gains for most indices bar the Shanghai Composite. The European bourses are opening on a positive note too, with all major indexes rising off the starting line.
The Mexican Peso’s recovery began late Tuesday after the Mexican Finance Minister Rogelio Ramírez De la O gave an interview in which he sought to calm investor fears about the new left-leaning Morena administration. The party swept to power during Sunday’s elections.
Although not all the votes have been counted – final results are expected on June 8 – estimates suggest Morena has won a supermajority (over two-thirds) in the lower, and possibly the upper, houses of the Mexican parliament. Morena’s new leader Dr. Claudia Sheinbaum has been confirmed as the next president of Mexico.
The Mexican Peso dropped over 5% following the news of Morena’s election victory as investors feared Sheinbaum’s supermajority could enact changes to the constitution that might be market-unfriendly.
On the data front, Mexican Consumer Confidence for May showed a decline to 46.7 – a seven-month low – from a downwardly revised 47.2 in April, on Wednesday, according to data from INEGI.
Technical Analysis: USD/MXN continues correcting down
USD/MXN continues pulling back after soaring to 18.12 (100-week Simple Moving Average) on Tuesday. It is now trading in the 17.40s, close to the first potential key support level at 17.34 – the midpoint of the long green Marubozu Japanese candlestick pattern formed on Monday’s upsurge.
USD/MXN Daily Chart
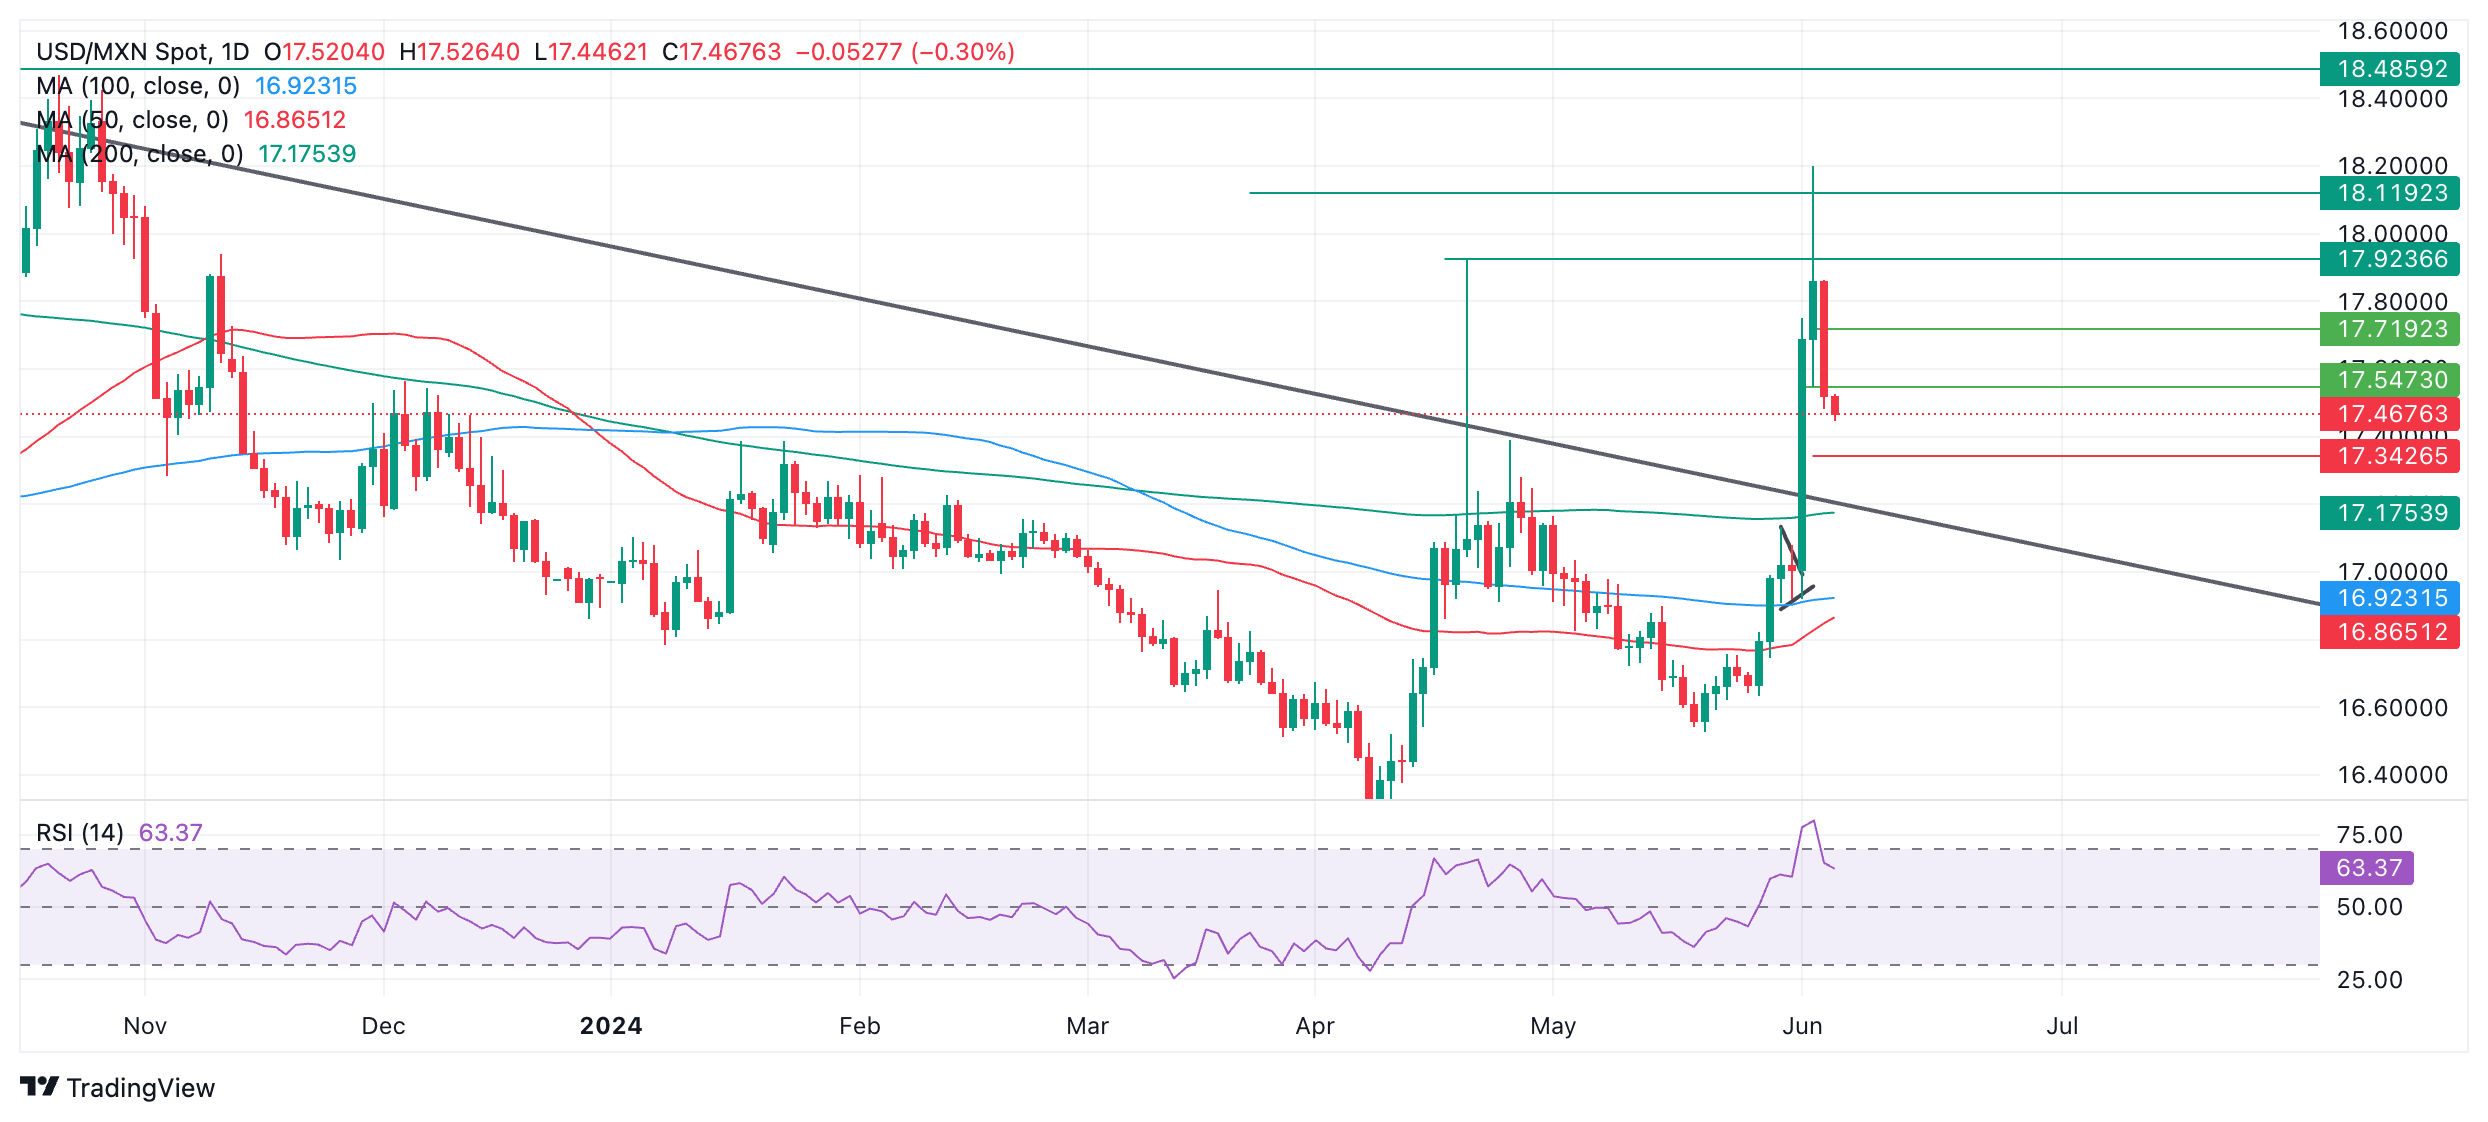
A break below 17.34 would be a bearish sign. The old trendline in the lower 17.00s would then come into view to offer support. If that too was broken, it would confirm a bearish reversal both on a short and intermediate-term basis.
USD/MXN has now moved out of the overbought zone on the Relative Strength Index (RSI), signaling a deeper correction is in play. At the same time, the pair is no longer overbought, which means it could also start rising again.
The deep pullback over the last two days means the short-term bull trend is now doubtful. It is possible to argue that the short-term trend has reversed, however, such was the strength of the moves up on Monday and Tuesday that it could also be argued that bulls continue to have the edge.
What is clear is that there are no signs yet that the correction lower has found a floor.
A key battleground for bulls would be at 17.54, the June 4 higher low, which is known as a “Bearish Breaker”. The future direction of the short-term trend could be decided depending on who prevails at 17.54 assuming bulls mount a recovery attempt.
Assuming bulls succeed, the pair could rise to 17.71, 18.19 (June 4 high) and then 18.49 (October 2023 high).
The intermediate-term trend is still bullish, but the long-term trend is probably still bearish, suggesting moderate background risks continue.
Mexican Peso FAQs
The Mexican Peso (MXN) is the most traded currency among its Latin American peers. Its value is broadly determined by the performance of the Mexican economy, the country’s central bank’s policy, the amount of foreign investment in the country and even the levels of remittances sent by Mexicans who live abroad, particularly in the United States. Geopolitical trends can also move MXN: for example, the process of nearshoring – or the decision by some firms to relocate manufacturing capacity and supply chains closer to their home countries – is also seen as a catalyst for the Mexican currency as the country is considered a key manufacturing hub in the American continent. Another catalyst for MXN is Oil prices as Mexico is a key exporter of the commodity.
The main objective of Mexico’s central bank, also known as Banxico, is to maintain inflation at low and stable levels (at or close to its target of 3%, the midpoint in a tolerance band of between 2% and 4%). To this end, the bank sets an appropriate level of interest rates. When inflation is too high, Banxico will attempt to tame it by raising interest rates, making it more expensive for households and businesses to borrow money, thus cooling demand and the overall economy. Higher interest rates are generally positive for the Mexican Peso (MXN) as they lead to higher yields, making the country a more attractive place for investors. On the contrary, lower interest rates tend to weaken MXN.
Macroeconomic data releases are key to assess the state of the economy and can have an impact on the Mexican Peso (MXN) valuation. A strong Mexican economy, based on high economic growth, low unemployment and high confidence is good for MXN. Not only does it attract more foreign investment but it may encourage the Bank of Mexico (Banxico) to increase interest rates, particularly if this strength comes together with elevated inflation. However, if economic data is weak, MXN is likely to depreciate.
As an emerging-market currency, the Mexican Peso (MXN) tends to strive during risk-on periods, or when investors perceive that broader market risks are low and thus are eager to engage with investments that carry a higher risk. Conversely, MXN tends to weaken at times of market turbulence or economic uncertainty as investors tend to sell higher-risk assets and flee to the more-stable safe havens.
- AUD/JPY extends gains as Australia’s Trade Surplus widens amid lower imports.
- Australia’s Trade Balance rose to A$ 6,548 million MoM in May, surpassing the expected A$ 5,500 million.
- BoJ Governor Kazuo Ueda stated that inflation expectations are gradually rising but have yet to reach 2%.
AUD/JPY continues to gain for the second successive day, trading around 103.90 during the European session on Thursday. The AUD/JPY cross strengthened following the release of Australia's Trade Balance, which widened to A$ 6,548 ($ 4,321.68) million month-over-month in May, exceeding the expected A$ 5,500 million and April's balance of A$ 5,024 million. Australia's imports plunged by 7.2% MoM in May, reversing from April’s 4.2% increase, while exports shrank by 2.5% after a previous decline of 0.6%.
The Australian Dollar could appreciate further due to a hawkish statement by Reserve Bank of Australia (RBA) Governor Michele Bullock on Wednesday. Bullock indicated that the central bank is prepared to increase interest rates if the Consumer Price Index (CPI) does not return to the target range of 1%-3%. She also acknowledged that the labor market is easing on several measures, as reported by NCA NewsWire.
On the JPY front, the benchmark 10-year Japan bond yield fell below 1% for the first time in two weeks. According to Reuters, Bank of Japan (BoJ) Governor Kazuo Ueda, speaking to parliament on Thursday, stated that inflation expectations are gradually rising but have yet to reach 2%. Ueda remarked, "We are still scrutinizing market developments since the March decision. As we proceed in exiting our massive monetary stimulus, it's appropriate to reduce bond purchases."
BoJ board member Toyoaki Nakamura also commented that, based on current data, it is suitable to maintain the policy intact for the time being. Nakamura highlighted the weakness in households' purchasing power and emphasized the necessity of a solid increase in disposable income to encourage spending.
- EUR/USD trades below 1.0900 ahead of the ECB’s monetary policy announcement.
- The ECB is expected to announce a rate cut by 25 bps for the first time in five years.
- The US NFP will significantly influence market speculation for the Fed rate cut in September.
EUR/USD rises in Thursday’s European session but remains broadly sideways below the round-level resistance of 1.0900. The major currency pair is expected to remain quiet ahead of the European Central Bank’s (ECB) monetary policy decision, which will be announced at 12:15 GMT.
The monetary policy decision is expected to deliver changes in the Eurozone’s economic prospects and the Euro’s next move even though ECB policymakers have already communicated their intention to cut the Deposit Facility Rate by 25 basis points (bps) to 3.75%. However, they have been reluctant to suggest a specific policy path beyond June as the battle against inflation has not won yet.
The last mile in the price index returning to the central bank’s desired rate of 2% appears to be stickier than expected due to stubbornly higher service inflation, which is significantly influenced by wage growth, and improved Eurozone’s economic outlook. Service inflation rose to 4.1% in May, the highest in seven months. The Gross Domestic Product (GDP) grew at a higher pace of 0.3% after contracting consecutively for last two quarters of 2023.
Over the interest rate outlook, ECB officials are not expected to commit to any subsequent rate-cut move in July or any other meeting and will remain data-dependent. Currently, financial markets expect the ECB to deliver two more rate cuts this year.
Daily digest market movers: EUR/USD rises as US Dollar retreats
- EUR/USD remains sideways below 1.0900. The major currency pair grinds between uncertainty ahead of the ECB’s interest rate decision and a soft US Dollar (USD). The US Dollar Index (DXY), which tracks the Greenback’s value against six major currencies, retreats while attempting to extend recovery above the crucial resistance of 104.40.
- The USD Index drops to 104.00 as the impact of the strong United States (US) Institute for Supply Management’s (ISM) Services Purchasing Managers Index (PMI) report for May was offset by easing labor market strength.
- The ISM Services PMI, which gauges the service sector activity that accounts for two-thirds of the economy, returned to expansion in May and jumped to 53.8 from the estimates of 50.8 and the prior reading of 49.4. In the same period, the New Orders Index, which reflects forward demand, jumped to 54.1 from the former release of 52.2.
- Meanwhile, US labor market conditions appear to have started normalizing amid the pressure from the Federal Reserve’s (Fed) more than two-year-long restrictive policy framework. The US JOLTS Job Openings data for April and ADP Employment Change for May came out below their forecasts and prior readings.
- Easing labor market strength has also boosted market expectations for the Fed to start reducing interest rates in September. The CME FedWatch tool shows a 68% chance that the interest rate will be lower than the current level in September. The probability has significantly improved from 50% recorded a week ago.
- Going forward, investors will shift focus to the US Nonfarm Payrolls (NFP) data for May, which will be published on Friday. The NFP report is expected to show that employers hired 185K new employees, higher than the prior release of 175K.
Technical Analysis: EUR/USD trades close to 1.0885 resistance
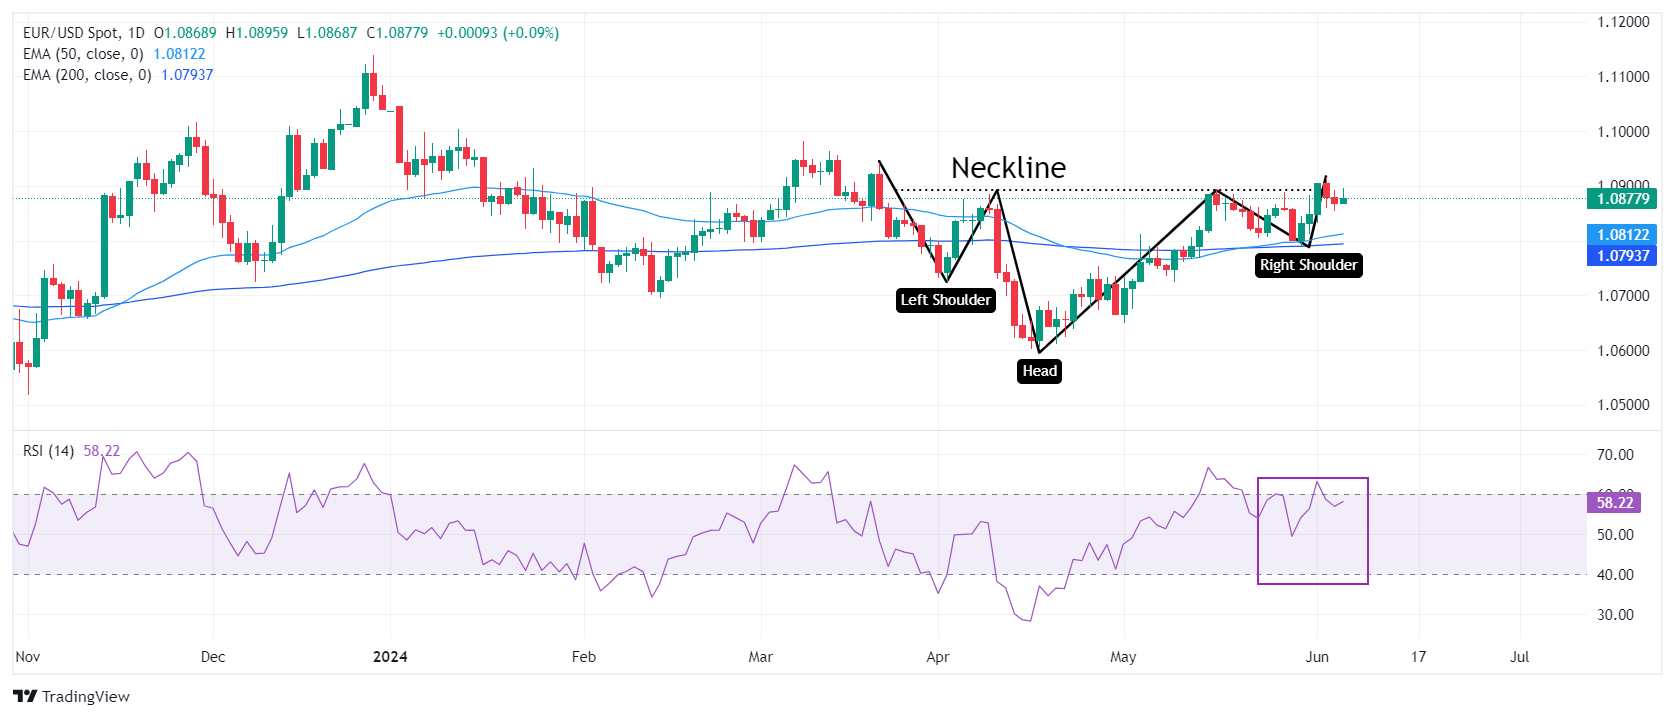
EUR/USD is stuck in a tight range below 1.0900. The major currency pair forms an Inverted Head and Shoulder (H&S) pattern on a daily timeframe, which would result in a bullish reversal after breaking the neckline marked from the April 9 high at 1.0885.
The near-term outlook remains firm due to a golden cross formation amid a bullish crossover of 50-day and 200-day Exponential Moving Averages (EMAs) near 1.0800.
The 14-period Relative Strength Index (RSI) has slipped into the 40.00-60.00 range, suggesting that the momentum, which was leaned toward the upside, has faded for now.
If the major currency pair decisively breaks above the round-level resistance of 1.0900, it is expected to extend its upside towards the March 21 high, around 1.0950, and the psychological resistance of 1.1000. However, a downside move below the 200-day EMA at 1.0800 could push it into a bearish trajectory.
Euro FAQs
The Euro is the currency for the 20 European Union countries that belong to the Eurozone. It is the second most heavily traded currency in the world behind the US Dollar. In 2022, it accounted for 31% of all foreign exchange transactions, with an average daily turnover of over $2.2 trillion a day. EUR/USD is the most heavily traded currency pair in the world, accounting for an estimated 30% off all transactions, followed by EUR/JPY (4%), EUR/GBP (3%) and EUR/AUD (2%).
The European Central Bank (ECB) in Frankfurt, Germany, is the reserve bank for the Eurozone. The ECB sets interest rates and manages monetary policy. The ECB’s primary mandate is to maintain price stability, which means either controlling inflation or stimulating growth. Its primary tool is the raising or lowering of interest rates. Relatively high interest rates – or the expectation of higher rates – will usually benefit the Euro and vice versa. The ECB Governing Council makes monetary policy decisions at meetings held eight times a year. Decisions are made by heads of the Eurozone national banks and six permanent members, including the President of the ECB, Christine Lagarde.
Eurozone inflation data, measured by the Harmonized Index of Consumer Prices (HICP), is an important econometric for the Euro. If inflation rises more than expected, especially if above the ECB’s 2% target, it obliges the ECB to raise interest rates to bring it back under control. Relatively high interest rates compared to its counterparts will usually benefit the Euro, as it makes the region more attractive as a place for global investors to park their money.
Data releases gauge the health of the economy and can impact on the Euro. Indicators such as GDP, Manufacturing and Services PMIs, employment, and consumer sentiment surveys can all influence the direction of the single currency. A strong economy is good for the Euro. Not only does it attract more foreign investment but it may encourage the ECB to put up interest rates, which will directly strengthen the Euro. Otherwise, if economic data is weak, the Euro is likely to fall. Economic data for the four largest economies in the euro area (Germany, France, Italy and Spain) are especially significant, as they account for 75% of the Eurozone’s economy.
Another significant data release for the Euro is the Trade Balance. This indicator measures the difference between what a country earns from its exports and what it spends on imports over a given period. If a country produces highly sought after exports then its currency will gain in value purely from the extra demand created from foreign buyers seeking to purchase these goods. Therefore, a positive net Trade Balance strengthens a currency and vice versa for a negative balance.
- NZD/USD depreciates due to risk aversion as US NFP looms.
- CME FedWatch Tool suggests the probability of a Fed rate cut in September has increased to nearly 70.0%.
- New Zealand’s Finance Minister Nicola Willis insisted that the 2024 budget won't keep interest rates higher for longer.
NZD/USD pulls back from two-month highs, trading around 0.6190 during the European session on Thursday. The US Dollar (USD) gained ground due to higher US Treasury yields. However, the rising speculation of an interest rate cut by the US Federal Reserve (Fed) in September could limit the upside of the Greenback, underpinning the NZD/USD pair. Investors are likely awaiting key US employment data releases on Friday, including Average Hourly Earnings and Nonfarm Payrolls.
On Wednesday, the mixed economic data from the United States (US) fueled interest rate cut speculations by the US Federal Reserve (Fed). The ISM US Services PMI soared to 53.8 in May, marking its highest level in nine months and significantly surpassing the forecast of 50.8. In contrast, the ADP US Employment Change report showed that 152,000 new workers were added to payrolls in May, the lowest in four months and well below the forecast of 175,000 and the downwardly revised figure of 188,000 for April.
A Reuters poll conducted from May 31 to June 5 has indicated that nearly two-thirds of economists now predict an interest rate cut in September. As per the CME FedWatch Tool, the probability of a Fed rate cut in September by at least 25 basis points has increased to nearly 70.0%, up from 47.5% a week earlier.
In New Zealand, the Kiwi Dollar received support from the latest data released by Caixin, which showed that China's Services PMI rose to 54.0 in May from 52.5 in April, significantly beating market expectations of 52.6. Investors turn cautious ahead of Friday's export and import data from China, New Zealand's leading trading partner, for May.
According to the NZ Herald on Wednesday, New Zealand’s Finance Minister Nicola Willis insisted that the 2024 budget won't keep interest rates higher for longer, even as economists warned it may complicate the Reserve Bank of New Zealand’s (RBNZ) efforts to cool inflation.
Gold prices rose in India on Thursday, according to data compiled by FXStreet.
The price for Gold stood at 6,349.30 Indian Rupees (INR) per gram, up INR 28.10 compared with the INR 6,321.20 it cost on Wednesday.
The price for Gold increased to INR 74,056.95 per tola from INR 73,729.23 per tola.
| Unit measure | Gold Price in INR |
|---|---|
| 1 Gram | 6,349.30 |
| 10 Grams | 63,492.97 |
| Tola | 74,056.95 |
| Troy Ounce | 197,485.30 |
FXStreet calculates Gold prices in India by adapting international prices (USD/INR) to the local currency and measurement units. Prices are updated daily based on the market rates taken at the time of publication. Prices are just for reference and local rates could diverge slightly.
Global Market Movers: Comex Gold price draws support from firming Fed rate cut bets, weaker USD
- Mixed US macro data released on Wednesday reaffirmed expectations that the Federal Reserve will start cutting interest rates later this year, dragging the US Treasury bond yields lower and benefiting the non-yielding Gold price.
- The Automatic Data Processing (ADP) reported that private sector employment in the US rose by 152K in May as compared to 173K anticipated and the previous month's downwardly revised reading of 188K (192K reported originally).
- The Institute for Supply Management's (ISM) Services PMI rose to 53.8 in May, registering its highest level since August and surpassing consensus estimates of 50.8, while the Prices Paid sub-component edged lower to 58.1 from 59.2.
- This, along with the softer US Personal Consumption Expenditures (PCE) Price Index on Friday, pointed to easing inflationary pressures and dragged the US Treasury bond yields lower, offering some support to the yellow metal.
- The benchmark 10-year US Treasury yield fell to a two-month low, at 4.28%, and the yield on the rate-sensitive 2-year US government bond slipped to 4.731% amid speculations that the official job data will fall short of expectations.
- The US Dollar did react positively to the data, though a further decline in the US Treasury bond yields offered support to the yellow metal and lifted it to a fresh weekly peak during the Asian session on Thursday.
- Traders now look forward to the release of the Weekly Initial Jobless Claims data from the US for some impetus, though the focus will remain glued to the US monthly employment details, or the Nonfarm Payrolls (NFP) on Friday.
Gold FAQs
Gold has played a key role in human’s history as it has been widely used as a store of value and medium of exchange. Currently, apart from its shine and usage for jewelry, the precious metal is widely seen as a safe-haven asset, meaning that it is considered a good investment during turbulent times. Gold is also widely seen as a hedge against inflation and against depreciating currencies as it doesn’t rely on any specific issuer or government.
Central banks are the biggest Gold holders. In their aim to support their currencies in turbulent times, central banks tend to diversify their reserves and buy Gold to improve the perceived strength of the economy and the currency. High Gold reserves can be a source of trust for a country’s solvency. Central banks added 1,136 tonnes of Gold worth around $70 billion to their reserves in 2022, according to data from the World Gold Council. This is the highest yearly purchase since records began. Central banks from emerging economies such as China, India and Turkey are quickly increasing their Gold reserves.
Gold has an inverse correlation with the US Dollar and US Treasuries, which are both major reserve and safe-haven assets. When the Dollar depreciates, Gold tends to rise, enabling investors and central banks to diversify their assets in turbulent times. Gold is also inversely correlated with risk assets. A rally in the stock market tends to weaken Gold price, while sell-offs in riskier markets tend to favor the precious metal.
The price can move due to a wide range of factors. Geopolitical instability or fears of a deep recession can quickly make Gold price escalate due to its safe-haven status. As a yield-less asset, Gold tends to rise with lower interest rates, while higher cost of money usually weighs down on the yellow metal. Still, most moves depend on how the US Dollar (USD) behaves as the asset is priced in dollars (XAU/USD). A strong Dollar tends to keep the price of Gold controlled, whereas a weaker Dollar is likely to push Gold prices up.
(An automation tool was used in creating this post.)
FX option expiries for June 6 NY cut at 10:00 Eastern Time, via DTCC, can be found below
- EUR/USD: EUR amounts
- 1.0790 694m
- 1.0800 480m
- 1.0835 478m
- 1.0840 569m
- 1.0850 1.2b
- 1.0860 2.2b
- 1.0895 436m
- 1.0900 3.1b
- 1.0905 898m
- 1.0915 2.1b
- GBP/USD: GBP amounts
- 1.2550 1.0b
- USD/JPY: USD amounts
- 154.85 930m
- 155.00 923m
- 155.15 1.2b
- 155.45 1.5b
- 155.50 1.4b
- 156.00 868m
- 157.00 1.5b
- 157.50 1.1b
- 157.85 630m
- 158.00 916m
- 158.25 1.3b
- 158.50 1.1b
- AUD/USD: AUD amounts
- 0.6525 450m
- 0.6700 528m
- 0.6740 592m
- 0.6800 739m
- USD/CAD: USD amounts
- 1.3600 600m
- USD/CHF: USD amounts
- 0.8900 686m
- 0.8905 606m
- 0.8975 400m
- 0.9035 429m
- 0.9075 428m
- NZD/USD: NZD amounts
- 0.6050 518m
- The European Central Bank is set to cut interest rates by 25 bps on Thursday.
- ECB President Christine Lagarde could stick to a data-dependent stance on future rate outlook.
- The Euro’s fate hinges on the ECB’s updated forecasts and Lagarde’s speech.
The European Central Bank (ECB) is set to announce its first interest rate cut since 2019 on Thursday at 12:15 GMT.
The updated staff economic projections will be published alongside the interest rate announcement. ECB President Christine Lagarde’s press conference will follow at 12:45 GMT.
What to expect from the European Central Bank interest rate decision?
A 25 basis points (bps) reduction to the benchmark Deposit Facility Rate is fully baked in, following the conclusion of the Governing Council’s June monetary policy meeting, which will bring down the borrowing cost from a historic high of 4.0% to 3.75%.
Several ECB policymakers have long promised a rate cut in June. Therefore, the main focus will be on the central bank’s communication on the path forward on interest rates. Market participants will closely scrutinize the language in the policy statement, as well as ECB President Christine Lagarde’s words during the press conference to gauge the scope and timing of the next rate cuts this year.
Although the Eurozone’s inflation has come close to the central bank’s 2.0% target, the sticky services inflation (back above 4.0% annually in May) raised expectations that the ECB won’t embark upon an aggressive easing cycle. Meanwhile, Eurozone annual inflation rose from 2.4% in April to 2.6% in May, beating the forecast for a 2.5% increase.
Further, a strong economic recovery and a tight labor market in the old continent will likely compel the ECB to refrain from committing to additional rate cuts in the meetings beyond June.
Lagarde could, therefore, stick to the Bank’s data-dependent stance and avoid providing any guidance on the policy outlook.
"I think they will be far less prescriptive about what comes next than they have been around the June meeting," said BNP Paribas' chief Europe economist Paul Hollingsworth in a research note.
Markets are expecting fewer than 60 bps of cuts this year, implying two moves and less than a 50% chance of a third one. This is down from three rate cuts projected when the ECB last met in April and at least five rate cuts expected in 2024 in January, according to Reuters.
How could the ECB meeting impact EUR/USD?
Heading into the ECB showdown, the Euro is consolidating below a three-month top of 1.0916. The US Dollar (USD) struggles to sustain the upside momentum amid the revival of bets for a Federal Reserve (Fed) interest rate cut in September after weak US ISM Manufacturing PMI data for May.
ECB President Christine Lagarde’s non-commital stance on the timing of the next rate cut could add extra legs to the EUR/USD recovery, as it would imply that the Bank could maintain rates higher for longer amid the persistence of inflation.
On the other hand, if Lagarde dismisses concerns about sticky inflation, it could be read as a bit dovish by market participants, eventually rendering negative for the EUR/USD pair.
Dhwani Mehta, FXStreet’s Senior Analyst, offers a brief technical outlook for trading the Euro on the ECB policy announcements: “EUR/USD extends its battle at around the stiff resistance near 1.0890, suggesting that buyers are gathering strength. The 14-day Relative Strength Index (RSI) holds strongly above the midline, near 60, adding credence to the pair’s upside potential.”
“Acceptance above the 1.0950 level is critical to unleashing further upside towards the 1.1000 psychological level. EUR buyers will then aim for the static resistance at 1.1050. Conversely, the initial demand area is seen around the 21-day Simple Moving Average (SMA) at 1.0833, below which the 1.0800 support could be tested. The 100-day SMA aligns at that level. Further south, the confluence zone of the 50-day SMA and the 200-day SMA near 1.0775 could act as a tough nut to crack for Euro sellers,” Dhwani adds.
Economic Indicator
ECB Rate On Deposit Facility
One of the European Central Bank's three key interest rates, the rate on the deposit facility, is the rate at which banks earn interest when they deposit funds with the ECB. It is announced by the European Central Bank at each of its eight scheduled annual meetings.
Read more.Next release: Thu Jun 06, 2024 12:15
Frequency: Irregular
Consensus: 3.75%
Previous: 4%
Source: European Central Bank
ECB FAQs
The European Central Bank (ECB) in Frankfurt, Germany, is the reserve bank for the Eurozone. The ECB sets interest rates and manages monetary policy for the region. The ECB primary mandate is to maintain price stability, which means keeping inflation at around 2%. Its primary tool for achieving this is by raising or lowering interest rates. Relatively high interest rates will usually result in a stronger Euro and vice versa. The ECB Governing Council makes monetary policy decisions at meetings held eight times a year. Decisions are made by heads of the Eurozone national banks and six permanent members, including the President of the ECB, Christine Lagarde.
In extreme situations, the European Central Bank can enact a policy tool called Quantitative Easing. QE is the process by which the ECB prints Euros and uses them to buy assets – usually government or corporate bonds – from banks and other financial institutions. QE usually results in a weaker Euro. QE is a last resort when simply lowering interest rates is unlikely to achieve the objective of price stability. The ECB used it during the Great Financial Crisis in 2009-11, in 2015 when inflation remained stubbornly low, as well as during the covid pandemic.
Quantitative tightening (QT) is the reverse of QE. It is undertaken after QE when an economic recovery is underway and inflation starts rising. Whilst in QE the European Central Bank (ECB) purchases government and corporate bonds from financial institutions to provide them with liquidity, in QT the ECB stops buying more bonds, and stops reinvesting the principal maturing on the bonds it already holds. It is usually positive (or bullish) for the Euro.
Here is what you need to know on Thursday, June 6:
Following Wednesday's choppy action in foreign exchange markets, investors gear up for key events that could ramp up the volatility. The European Central bank (ECB) will announce monetary policy decisions on Thursday and the US economic calendar will feature weekly Initial Jobless Claims and Unit Labor Costs data for the first quarter ahead of Friday's May jobs report.
The upbeat ISM Services PMI data for May, which came in at 53.8 to beat the market expectation of 50.8, from the US helped the US Dollar (USD) outperform its rivals in the American session. With Wall Street's main indexes gathering bullish momentum, however, the currency struggled to preserve its strength. Early Thursday, the USD Index holds steady above 104.00 and the benchmark 10-year US Treasury bond yield clings to modest recovery gains near 4.3%. Meanwhile, US stock index futures trade virtually unchanged on the day.
US Dollar PRICE This week
The table below shows the percentage change of US Dollar (USD) against listed major currencies this week. US Dollar was the weakest against the Swiss Franc.
| USD | EUR | GBP | JPY | CAD | AUD | NZD | CHF | |
|---|---|---|---|---|---|---|---|---|
| USD | -0.30% | -0.40% | -0.76% | 0.34% | -0.09% | -0.91% | -1.27% | |
| EUR | 0.30% | -0.08% | -0.46% | 0.64% | 0.08% | -0.62% | -0.99% | |
| GBP | 0.40% | 0.08% | -0.32% | 0.71% | 0.24% | -0.59% | -0.93% | |
| JPY | 0.76% | 0.46% | 0.32% | 1.06% | 0.72% | -0.02% | -0.38% | |
| CAD | -0.34% | -0.64% | -0.71% | -1.06% | -0.45% | -1.24% | -1.63% | |
| AUD | 0.09% | -0.08% | -0.24% | -0.72% | 0.45% | -0.71% | -1.12% | |
| NZD | 0.91% | 0.62% | 0.59% | 0.02% | 1.24% | 0.71% | -0.43% | |
| CHF | 1.27% | 0.99% | 0.93% | 0.38% | 1.63% | 1.12% | 0.43% |
The heat map shows percentage changes of major currencies against each other. The base currency is picked from the left column, while the quote currency is picked from the top row. For example, if you pick the US Dollar from the left column and move along the horizontal line to the Japanese Yen, the percentage change displayed in the box will represent USD (base)/JPY (quote).
The ECB is forecast to lower key rates by 25 basis points following the June policy meeting. Following the release of the policy statement, ECB President Christine Lagarde will speak on policy outlook and respond to questions from the press. Ahead of the ECB event, Eurostat will publish Retail Sales data for April. Earlier in the day, Germany's Destatis reported that Factory Orders declined by 0.2% on a monthly basis in April following the 0.8% contraction recorded in March. Ahead of the key ECB event, EUR/USD fluctuates in a narrow channel above 1.0850.
GBP/USD registered small gains on Wednesday and continued to push higher toward 1.2800 during the Asian trading hours on Thursday.
Following a two-day decline, USD/JPY rose nearly 0.8% on Wednesday. In the European morning, the pair stays in a consolidation phase at around 156.00. The Bank of Japan (BoJ) Governor Kazuo Ueda said on Thursday that inflation expectations are gradually rising but yet to reach 2%, adding that the Japanese central bank will move cautiously on interest rates to avoid any big mistakes.
Japanese Yen appreciates due to rising expectations of a Fed rate cut.
The data from Australia showed on Thursday that Exports declined 2.5% on a monthly basis in May while Imports decreased 7.2%. After rising toward 0.6700 in the Asian session, AUD/USD lost its bullish momentum and retreated below 0.6660 by the European morning.
Australian Dollar rebounds on improved risk appetite, US NFP looms.
Gold benefited from falling US Treasury bond yields and gained more than 1% on Wednesday. XAU/USD continued to stretch higher early Thursday and was last seen trading at its highest level in two weeks near $2,370.
Economic Indicator
ECB Monetary Policy Statement
At each of the European Central Bank’s (ECB) eight governing council meetings, the ECB releases a short statement explaining its monetary policy decision, in light of its goal of meeting its inflation target. The statement may influence the volatility of the Euro (EUR) and determine a short-term positive or negative trend. A hawkish view is considered bullish for EUR, whereas a dovish view is considered bearish.
Read more.Last release: Thu Apr 11, 2024 12:15
Frequency: Irregular
Actual: -
Consensus: -
Previous: -
Source: European Central Bank
- USD/CHF attracts some sellers near 0.8920 in Thursday’s early European session, down 0.20% on the day.
- Traders raise their bets on Fed rate cuts this year after the cooler PCE inflation and weaker Manufacturing PMI data.
- The Swiss unemployment rate stood at 2.3% in May, remains unchanged and matched market expectations.
The USD/CHF pair edges lower to 0.8920 during the early European session on Thursday. The weaker US Dollar (USD) amid growing speculation that the Federal Reserve (Fed) will start lowering borrowing costs from the September meeting creates a headwind for the pair.
The recent cooler US Personal Consumption Expenditures (PCE) Price Index data released last week and the weaker Manufacturing PMI report earlier this week revived hopes the Fed would cut interest rates this year. This, in turn, exerts some selling pressure on the USD broadly. Financial markets have priced in about 70% possibility of Fed rate cuts in September, up from 54.9% at the beginning of the week, according to the CME FedWatch tool.
Investors will shift their attention to the release of US May employment data on Friday, including the US Nonfarm Payrolls (NFP), Unemployment Rate, and Average Hourly Earnings. The NFP figure is expected to see 185,000 job additions in May, while the Unemployment Rate is estimated to remain steady at 3.9% in the same period. The softer employment market data might convince the Fed to feel more confident about easing monetary policy.
On the Swiss front, the unemployment rate in Switzerland came in at 2.3% in May, according to the State Secretariat for Economic Affairs (SECO) on Thursday. The figure was unchanged from April and matched the estimation. A further report on Tuesday revealed that Switzerland’s monthly Consumer Price Index (CPI) inflation rose 0.3% MoM in May and was below the market consensus of 0.4%. The cooler inflation data prompted the expectation of rate cuts from the Swiss National Bank (SNB) on June 28, and this might weigh on the Swiss Franc (CHF) in the near term.
- Silver price rises to $30.60 as US yields fall on backfoot amid firm Fed rate-cut bets.
- Fed rate-cut bets for September have been prompted by easing US labor market strength.
- Investors shift focus to the US NFP report for May for fresh guidance.
Silver price (XAG/USD) recovers further to $30.60 in Thursday’s Asian session. The white metal discovers strong buying interest as normalizing United States (US) labor market conditions boost speculation that the Federal Reserve (Fed) will start reducing interest rates in the September meeting.
The CME FedWatch tool shows that traders see a 68% chance for rate cuts in September. The probability has significantly improved from 47% recorded a week ago. This has weighed heavily on US bond yields. 10-year US Treasury yields are slightly up to near 4.29% but have come down significantly from weekly high of 4.64%. A sharp decline in yields on interest bearing assets reduces the opportunity cost of holding an investment in non-yielding assets, such as Silver.
Investors lose confidence over US labor market strength after weak JOLTS Job Openings data for April and lower-than-expected ADP Employment Change for May.
The US Dollar Index (DXY) falls sharply after failing to extend recovery above 104.40 but holds the immediate support of 104.00. The next move in above-mentioned assets will be influenced by the US Nonfarm Payrolls (NFP) report for May, which will be published on Friday.
Silver technical analysis
Silver price trades in a Rising Channel chart formation on a daily timeframe in which each pullback is considered as buying opportunity by market participants. Advancing 50 and 200-day Exponential Moving Averages (EMAs) around $28.63 and $25.46, respectively, indicate that the overall trend is bullish.
The 14-period Relative Strength Index (RSI) falls back into the 40.00-60.00 range, suggesting that upside momentum has faded. However, the upside bias remains intact.
Silver daily chart
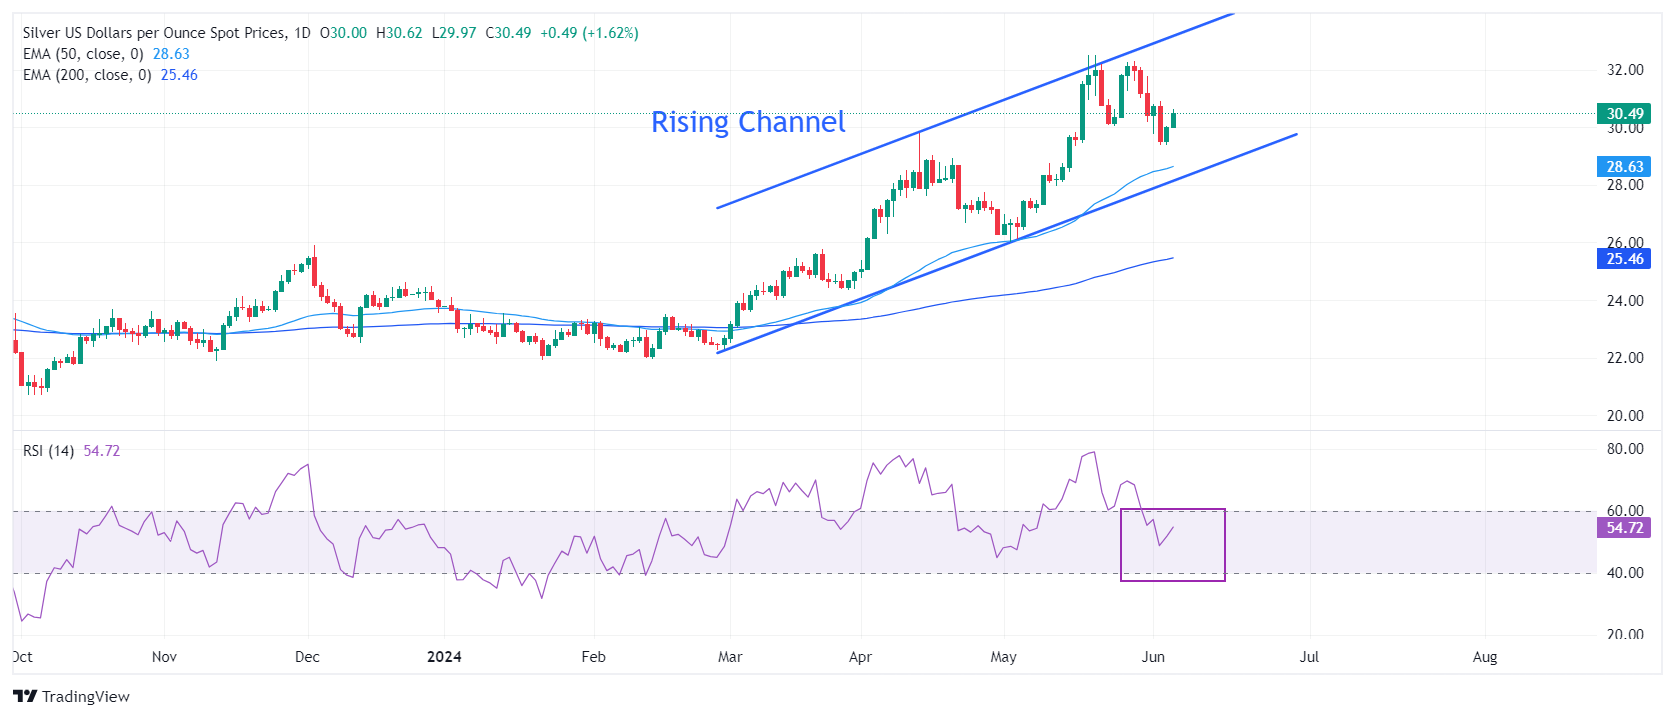
- USD/CAD depreciates as mixed data from the US fuels speculations of a rate cut by the Fed.
- CME FedWatch Tool suggests the probability of a Fed rate cut in September has increased to nearly 70.0%.
- The appreciation of crude Oil prices supports the commodity-linked Canadian Dollar.
USD/CAD retreats after two days of gains, trading around 1.3680 during the Asian session on Thursday. The US Dollar (USD) struggled after mixed economic data was released in the United States (US), which fueled interest rate cut speculations by the US Federal Reserve (Fed). Investors are awaiting key US employment data releases on Friday, including Average Hourly Earnings and Nonfarm Payrolls.
The investors’ sentiment of the Fed’s rate cut leads to the weakening of the US Treasury yields, undermining the US Dollar and USD/CAD pair. Investors await the key US employment data releases on Friday, including the Average Hourly Earnings and Nonfarm Payrolls.
A Reuters poll conducted from May 31 to June 5 has indicated that nearly two-thirds of economists now predict an interest rate cut in September. As per the CME FedWatch Tool, the probability of a Fed rate cut in September by at least 25 basis points has increased to nearly 70.0%, up from 47.5% a week earlier.
On the Loonie front, the upside of the crude Oil prices is supporting the demand of the Canadian Dollar (CAD), given the fact that Canada is the largest Oil exporter to the United States (US). West Texas Intermediate (WTI) Oil price extends its gains for the second session, trading around $74.30 per barrel, by the press time.
In June, the Bank of Canada (BoC) carried out a widely anticipated 25 basis points reduction in its key interest rate, bringing it to 4.75%. This move marked a departure from 11 consecutive months of peak interest rates in the tightening cycle. The sustained disinflation trends in Canada toward the central bank’s target range of 1%-3% have supported a less stringent monetary policy stance. Traders are now shifting their focus to Friday’s upcoming Canadian labor figures.
The Bank of Japan (BoJ) Governor Kazuo Ueda said on Thursday that inflation expectations are gradually rising but yet to reach 2%, adding that the Japanese central bank will move cautiously on interest rates to avoid any big mistakes.
Key quotes
Inflation expectations remain below 2%.
Proceeding cautiously on interest rates.
Uncertainties surround measuring neutral rate.
Reduce bond buying during exit.
To check financial market conditions post-March shift.
Market reaction
At the time of writing, USD/JPY is trading 0.09% lower on the day to trade at 156.82.
Bank of Japan FAQs
The Bank of Japan (BoJ) is the Japanese central bank, which sets monetary policy in the country. Its mandate is to issue banknotes and carry out currency and monetary control to ensure price stability, which means an inflation target of around 2%.
The Bank of Japan has embarked in an ultra-loose monetary policy since 2013 in order to stimulate the economy and fuel inflation amid a low-inflationary environment. The bank’s policy is based on Quantitative and Qualitative Easing (QQE), or printing notes to buy assets such as government or corporate bonds to provide liquidity. In 2016, the bank doubled down on its strategy and further loosened policy by first introducing negative interest rates and then directly controlling the yield of its 10-year government bonds.
The Bank’s massive stimulus has caused the Yen to depreciate against its main currency peers. This process has exacerbated more recently due to an increasing policy divergence between the Bank of Japan and other main central banks, which have opted to increase interest rates sharply to fight decades-high levels of inflation. The BoJ’s policy of holding down rates has led to a widening differential with other currencies, dragging down the value of the Yen.
A weaker Yen and the spike in global energy prices have led to an increase in Japanese inflation, which has exceeded the BoJ’s 2% target. Still, the Bank judges that the sustainable and stable achievement of the 2% target has not yet come in sight, so any sudden change in the current policy looks unlikely.
- The Japanese Yen appreciates due to improved risk sentiment.
- Japan’s 10-year bond yield fell below 1% for the first time in two weeks.
- The depreciation of US Treasury yields weakens the US Dollar.
The Japanese Yen (JPY) appreciates due to improved risk sentiment and rising speculation of an interest rate cut by the US Federal Reserve (Fed) in September. The depreciation of US Treasury yields is putting pressure on the US Dollar (USD), undermining the USD/JPY pair. Investors are awaiting key US employment data releases on Friday, including Average Hourly Earnings and Nonfarm Payrolls.
Japanese bond yields have pulled back from recent highs, with the benchmark 10-year government bond yield falling below 1% for the first time in two weeks. However, Japan’s real wages declined for the 25th straight month in April as domestic inflation continued to outpace wage growth. This data will make it more challenging for the Bank of Japan (BoJ) to normalize its policy.
The US Dollar Index (DXY), measuring the value of the US Dollar (USD) against six other major currencies, faced challenges following the release of mixed economic data in the United States (US). This has heightened speculations of interest rate cuts by the US Federal Reserve (Fed). According to the CME FedWatch Tool, the probability of a Fed rate cut in September by at least 25 basis points has surged to nearly 70.0%, up from 47.5% a week earlier.
Daily Digest Market Movers: Japanese Yen appreciates due to improved risk sentiment
- The ISM US Services PMI on Wednesday soared to 53.8 in May, marking its highest level in nine months and significantly surpassing the forecast of 50.8. In contrast, the ADP US Employment Change report showed that 152,000 new workers were added to payrolls in May, the lowest in four months and well below the forecast of 175,000 and the downwardly revised figure of 188,000 for April.
- The Jibun Bank Japan Services PMI was revised higher to 53.8 in May from the previous figure of 53.6. Despite the upward revision, it fell short of April's 8-month peak of 54.3, indicating the softest growth in the service sector since February.
- Labor Cash Earnings surged by 2.1% year-on-year in April, surpassing forecasts for a 1.7% gain. This latest figure also marked the highest level since June last year.
- The JOLTS US Job Openings declined by 296,000 to 8.059 million in April, down from March's 8.355 million, marking the lowest level since February 2021. This figure also missed the market consensus of 8.340 million, data showed on Tuesday.
- Bank of Japan (BoJ) Governor Kazuo Ueda said on Tuesday that the central bank will conduct "nimble" market operations if long-term interest rates spike, signaling the BoJ's readiness to ramp up bond buying when necessary. Ueda also stated that the BoJ will adjust the degree of monetary support if underlying inflation accelerates in line with its forecast, per Reuters.
- Reuters also reported that Japan's government will highlight the challenges a weak Yen poses for households in this year's long-term economic policy roadmap. This focus on the Yen's impact is expected to maintain pressure on the Bank of Japan to either raise interest rates or reduce its extensive bond-buying program.
- Last week, Atlanta Fed President Raphael Bostic stated in an interview with Fox Business that he does not think additional rate increases are necessary to achieve the Fed's 2% annual inflation target. Furthermore, New York Fed President John Williams stated as per Reuters that inflation is currently too high but should start to decline in the second half of 2024. Williams believes that monetary policy action is not urgently needed.
Technical Analysis: USD/JPY remains above 155.50
USD/JPY trades around 155.60 on Thursday. Analysis of the daily chart suggests a weakening bullish bias as the pair breaks below the lower boundary of the symmetrical triangle pattern. Additionally, the 14-day Relative Strength Index (RSI) is slightly below the 50 level, indicating a potential for further decline that may confirm a bearish bias.
Immediate support for the USD/JPY pair could be found at the psychological level of 156.00. Further support appears at the 50-day Exponential Moving Average (EMA) at 154.69. A break below this level could increase pressure on the pair, potentially leading it toward the throwback support region around 151.86.
On the upside, a key barrier is evident at the lower threshold of the symmetrical triangle. If the USD/JPY pair returns to the symmetrical triangle, it would reinforce the bullish bias and could lead the pair to test the upper boundary of the pattern. A break above the psychological barrier of 157.00 would support the pair in retesting 160.32, its highest level in over thirty years.
USD/JPY: Daily Chart
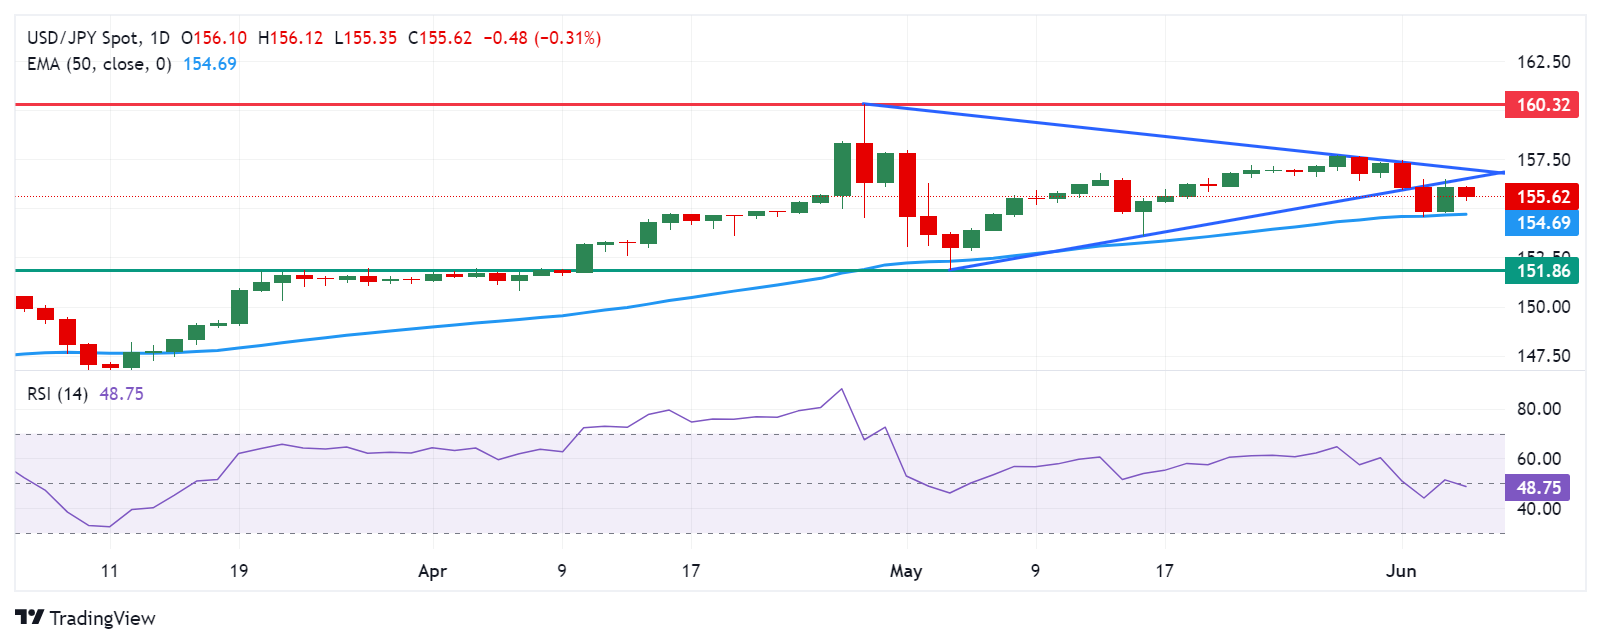
Japanese Yen price today
The table below shows the percentage change of the Japanese Yen (JPY) against listed major currencies today. Japanese Yen was the strongest against the US Dollar.
| USD | EUR | GBP | CAD | AUD | JPY | NZD | CHF | |
| USD | -0.15% | -0.04% | -0.09% | -0.12% | -0.21% | -0.06% | -0.24% | |
| EUR | 0.15% | 0.11% | 0.05% | 0.03% | -0.06% | 0.10% | -0.08% | |
| GBP | 0.04% | -0.10% | -0.06% | -0.09% | -0.17% | -0.01% | -0.20% | |
| CAD | 0.09% | -0.06% | 0.07% | -0.04% | -0.11% | 0.03% | -0.14% | |
| AUD | 0.13% | -0.02% | 0.09% | 0.04% | -0.09% | 0.08% | -0.12% | |
| JPY | 0.20% | 0.08% | 0.18% | 0.11% | 0.09% | 0.14% | -0.03% | |
| NZD | 0.06% | -0.11% | 0.00% | -0.05% | -0.08% | -0.16% | -0.20% | |
| CHF | 0.24% | 0.09% | 0.20% | 0.15% | 0.12% | 0.03% | 0.20% |
The heat map shows percentage changes of major currencies against each other. The base currency is picked from the left column, while the quote currency is picked from the top row. For example, if you pick the Euro from the left column and move along the horizontal line to the Japanese Yen, the percentage change displayed in the box will represent EUR (base)/JPY (quote).
Japanese Yen FAQs
The Japanese Yen (JPY) is one of the world’s most traded currencies. Its value is broadly determined by the performance of the Japanese economy, but more specifically by the Bank of Japan’s policy, the differential between Japanese and US bond yields, or risk sentiment among traders, among other factors.
One of the Bank of Japan’s mandates is currency control, so its moves are key for the Yen. The BoJ has directly intervened in currency markets sometimes, generally to lower the value of the Yen, although it refrains from doing it often due to political concerns of its main trading partners. The current BoJ ultra-loose monetary policy, based on massive stimulus to the economy, has caused the Yen to depreciate against its main currency peers. This process has exacerbated more recently due to an increasing policy divergence between the Bank of Japan and other main central banks, which have opted to increase interest rates sharply to fight decades-high levels of inflation.
The BoJ’s stance of sticking to ultra-loose monetary policy has led to a widening policy divergence with other central banks, particularly with the US Federal Reserve. This supports a widening of the differential between the 10-year US and Japanese bonds, which favors the US Dollar against the Japanese Yen.
The Japanese Yen is often seen as a safe-haven investment. This means that in times of market stress, investors are more likely to put their money in the Japanese currency due to its supposed reliability and stability. Turbulent times are likely to strengthen the Yen’s value against other currencies seen as more risky to invest in.
- Indian Rupee rebounds on the softer US Dollar on Thursday.
- The renewed USD sales and potential FX intervention from the RBI support the INR.
- Any development surrounding the changes to India’s structural reforms might weigh on the INR.
- The US weekly Initial Jobless Claims and Balance of Trade are due later on Thursday.
Indian Rupee (INR) recovers on Thursday amid the weaker US Dollar (USD). On Wednesday, the INR closed stronger on the back of USD sales from foreign banks and likely intervention from the Reserve Bank of India (RBI). Furthermore, Investors started to price in two interest rate cuts by the Federal Reserve (Fed) this year, which weigh on the Greenback and create a headwind for the pair.
The US weekly Initial Jobless Claims and Balance of Trade are due on Thursday. Investors will closely monitor the RBI's interest rate decision on Friday, with no change in rate expected. Also, the US Nonfarm Payrolls data will be in the spotlight. The stronger-than-expected data could boost the Greenback and cap the downside for USD/INR. Meanwhile, India faces multiple headwinds from the political shifts and downbeat PMI data. If there are changes to India’s structural reforms, this could exert some selling pressure on the Indian Rupee.
Daily Digest Market Movers: Indian Rupee recovers amid likely RBI intervention
- Benchmark Indian equity indices, the BSE Sensex and Nifty 50 gained on Wednesday, closing the session higher by about 3% each after logging their steepest fall in four years in the previous session.
- The HSBC India Services PMI dropped to 60.4 in May from the final 60.8 in the previous month. This was the 34th consecutive month of expansion in services activity although it registered the lowest mark since December 2023.
- “The election results are likely to keep both the rupee and bond yields volatile in the short run,” HDFC bank economist Sakshi Gupta said.
- Bharatiya Janata Party (BJP) has won 240 seats in the Lok Sabha elections, which was followed by the Indian National Congress winning 99 seats, and the Samajwadi Party winning 37 seats, according to the Election Commission of India’s (ECI) website.
- The US ISM Services PMI improved to 53.8 in May from 49.4 in April. This figure came in stronger than the estimation of 50.8.
- Traders are now pricing in a nearly 70% chance of a Fed rate cut in September, up from 54.9% at the beginning of the week, according to the CME FedWatch tool.
Technical analysis: USD/INR keeps the bullish vibe above the 100-day EMA
The Indian Rupee trades on a stronger note on the day. The positive outlook of the USD/INR pair remains intact as it broke above the descending trend channel that has been established since mid-April and holds above the key 100-day Exponential Moving Average (EMA) on the daily chart. Nonetheless, the 14-day Relative Strength Index (RSI) hovers around the 50-midline, denoting a neutral level and suggesting that further consolidation looks favorable for the time being.
The resistance-turned-support level and the 100-day EMA at the 83.30-83.35 region act as an initial support level for the pair. A decisive break below this level would attract some sellers to the 83.00 psychological level, followed by a low of January 15 at 82.78.
On the other hand, the first upside barrier will emerge near a high of June 4 at 83.62. Further north, the next hurdle is seen near a high of April 17 at 83.72 en route to the 84.00 round mark.
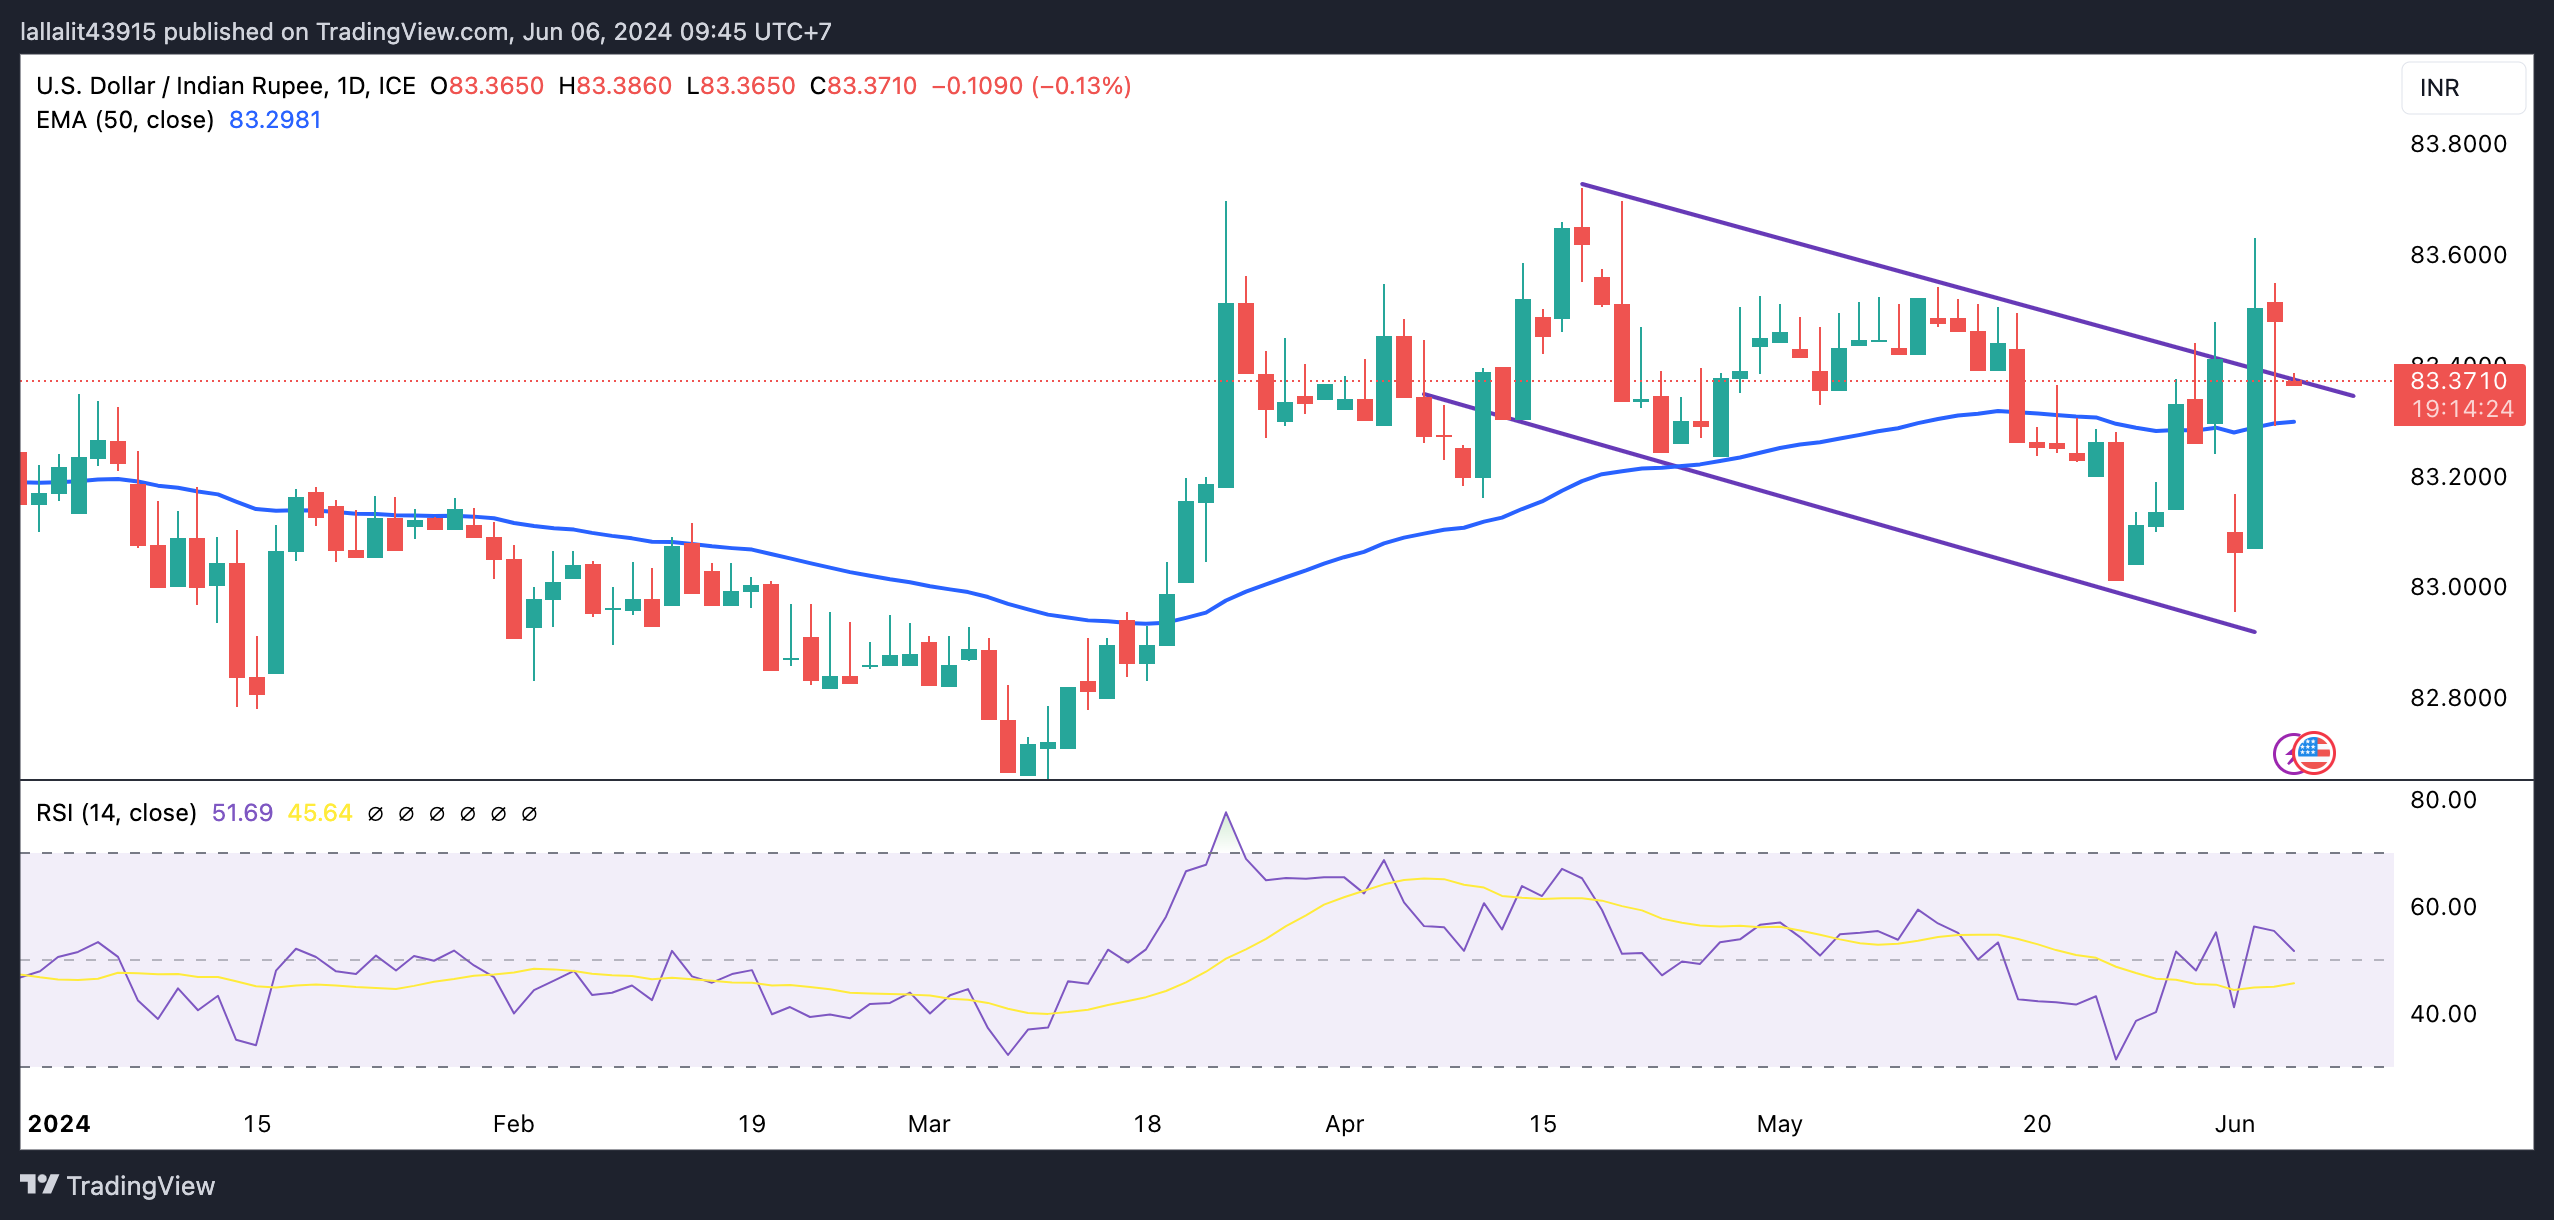
US Dollar price today
The table below shows the percentage change of US Dollar (USD) against listed major currencies today. US Dollar was the weakest against the Japanese Yen.
| USD | EUR | GBP | CAD | AUD | JPY | NZD | CHF | |
| USD | -0.17% | -0.07% | -0.12% | -0.19% | -0.24% | -0.11% | -0.22% | |
| EUR | 0.17% | 0.11% | 0.06% | -0.02% | -0.08% | 0.06% | -0.05% | |
| GBP | 0.08% | -0.09% | -0.05% | -0.12% | -0.17% | -0.03% | -0.15% | |
| CAD | 0.12% | -0.06% | 0.05% | -0.07% | -0.12% | 0.01% | -0.10% | |
| AUD | 0.20% | 0.02% | 0.13% | 0.07% | -0.05% | 0.09% | -0.02% | |
| JPY | 0.24% | 0.07% | 0.16% | 0.13% | 0.03% | 0.12% | 0.03% | |
| NZD | 0.12% | -0.07% | 0.04% | -0.01% | -0.08% | -0.13% | -0.11% | |
| CHF | 0.22% | 0.04% | 0.15% | 0.10% | 0.02% | -0.03% | 0.11% |
The heat map shows percentage changes of major currencies against each other. The base currency is picked from the left column, while the quote currency is picked from the top row. For example, if you pick the Euro from the left column and move along the horizontal line to the Japanese Yen, the percentage change displayed in the box will represent EUR (base)/JPY (quote).
Indian Rupee FAQs
The Indian Rupee (INR) is one of the most sensitive currencies to external factors. The price of Crude Oil (the country is highly dependent on imported Oil), the value of the US Dollar – most trade is conducted in USD – and the level of foreign investment, are all influential. Direct intervention by the Reserve Bank of India (RBI) in FX markets to keep the exchange rate stable, as well as the level of interest rates set by the RBI, are further major influencing factors on the Rupee.
The Reserve Bank of India (RBI) actively intervenes in forex markets to maintain a stable exchange rate, to help facilitate trade. In addition, the RBI tries to maintain the inflation rate at its 4% target by adjusting interest rates. Higher interest rates usually strengthen the Rupee. This is due to the role of the ‘carry trade’ in which investors borrow in countries with lower interest rates so as to place their money in countries’ offering relatively higher interest rates and profit from the difference.
Macroeconomic factors that influence the value of the Rupee include inflation, interest rates, the economic growth rate (GDP), the balance of trade, and inflows from foreign investment. A higher growth rate can lead to more overseas investment, pushing up demand for the Rupee. A less negative balance of trade will eventually lead to a stronger Rupee. Higher interest rates, especially real rates (interest rates less inflation) are also positive for the Rupee. A risk-on environment can lead to greater inflows of Foreign Direct and Indirect Investment (FDI and FII), which also benefit the Rupee.
Higher inflation, particularly, if it is comparatively higher than India’s peers, is generally negative for the currency as it reflects devaluation through oversupply. Inflation also increases the cost of exports, leading to more Rupees being sold to purchase foreign imports, which is Rupee-negative. At the same time, higher inflation usually leads to the Reserve Bank of India (RBI) raising interest rates and this can be positive for the Rupee, due to increased demand from international investors. The opposite effect is true of lower inflation.
- WTI price appreciates as US mixed data fuel rate cut speculations by the Fed.
- A Reuters poll has indicated that nearly two-thirds of economists now predict an interest rate cut in September.
- EIA Crude Oil Stocks Change increased by 1.233 million barrels in the previous week, contrasting with the expected 2.300 million-barrel draw.
West Texas Intermediate (WTI) Oil price extends its gains for the second session, trading around $74.30 per barrel during the Asian session on Thursday. The appreciation in crude Oil prices could be attributed to the rising speculation of an interest rate cut by the US Federal Reserve (Fed) in September. Lower interest rates reduce the cost of borrowing in the United States, the largest Oil consumer. This can incentivize economic activity and potentially boost Oil demand.
The mixed economic data from the United States (US) on Wednesday fueled interest rate cut speculations by the US Federal Reserve (Fed). The ISM US Services PMI soared to 53.8 in May, marking its highest level in nine months and significantly surpassing the forecast of 50.8. In contrast, the ADP US Employment Change report showed that 152,000 new workers were added to payrolls in May, the lowest in four months and well below the forecast of 175,000 and the downwardly revised figure of 188,000 for April.
A Reuters poll conducted from May 31 to June 5 has indicated that nearly two-thirds of economists now predict an interest rate cut in September, offsetting recent bearish supply news from the Organization of the Petroleum Exporting Countries and its allies (OPEC+). According to the CME FedWatch Tool, the probability of a Fed rate cut in September by at least 25 basis points has increased to nearly 70.0%, up from 47.5% a week earlier.
The upside of Oil prices could be limited as the US Energy Information Administration (EIA) Crude Oil Stocks Change showed that crude Oil inventories increased by 1.233 million barrels in the week ending May 31. This marks a reversal from the preceding week's 4.156 million-barrel decline and contrasts with market expectations of a 2.300 million-barrel draw.
| Raw materials | Closed | Change, % |
|---|---|---|
| Silver | 29.984 | 1.51 |
| Gold | 2354.74 | 1.15 |
| Palladium | 935.49 | 2.71 |
- Gold price advances to a two-week top amid the emergence of fresh USD selling.
- Rising Fed rate cut bets keep the US bond yields depressed and weigh on the buck.
- Traders look to the US jobless claims for some impetus ahead of the NFP on Friday.
Gold price (XAU/USD) attracts some follow-through buying for the second straight day and climbs to a two-week top, around the $2,373 area during the Asian session on Thursday. Moreover, the near-term bias remains tilted in favor of bulls in the wake of bets that major central banks will lower borrowing costs to bolster economic activity. In fact, the Bank of Canada (BoC) on Wednesday lowered its benchmark rate for the first time in four years, from a more than two-decade high and signaled concern about slowing economic growth. Furthermore, the European Central Bank (ECB) is also expected to cut interest rates for the first time since March 2016 at the end of its June policy meeting later today.
Meanwhile, the markets are now pricing in a greater chance for an imminent rate cut by the Federal Reserve (Fed) amid signs of a slowdown in the US economy. The expectations keep the US Treasury bond yields depressed near the lowest level in over two months and fail to assist the US Dollar (USD) to build on its modest recovery gains registered over the past two days. This, along with persistent geopolitical tensions stemming from ongoing conflicts in the Middle East, continues to act as a tailwind for the safe-haven Gold price. Despite a combination of supporting factors, the upside for the XAU/USD seems limited as traders keenly await the release of the US Nonfarm Payrolls (NFP) report on Friday.
Daily Digest Market Movers: Gold price draws support from firming Fed rate cut bets, weaker USD
- Mixed US macro data released on Wednesday reaffirmed expectations that the Federal Reserve will start cutting interest rates later this year, dragging the US Treasury bond yields lower and benefiting the non-yielding Gold price.
- The Automatic Data Processing (ADP) reported that private sector employment in the US rose by 152K in May as compared to 173K anticipated and the previous month's downwardly revised reading of 188K (192K reported originally).
- The Institute for Supply Management's (ISM) Services PMI rose to 53.8 in May, registering its highest level since August and surpassing consensus estimates of 50.8, while the Prices Paid sub-component edged lower to 58.1 from 59.2.
- This, along with the softer US Personal Consumption Expenditures (PCE) Price Index on Friday, pointed to easing inflationary pressures and dragged the US Treasury bond yields lower, offering some support to the yellow metal.
- The benchmark 10-year US Treasury yield fell to a two-month low, at 4.28%, and the yield on the rate-sensitive 2-year US government bond slipped to 4.731% amid speculations that the official job data will fall short of expectations.
- The US Dollar did react positively to the data, though a further decline in the US Treasury bond yields offered support to the yellow metal and lifted it to a fresh weekly peak during the Asian session on Thursday.
- Traders now look forward to the release of the Weekly Initial Jobless Claims data from the US for some impetus, though the focus will remain glued to the US monthly employment details, or the Nonfarm Payrolls (NFP) on Friday.
Technical Analysis: Gold price might confront stiff hurdle and remain capped near the $2,400 mark
From a technical perspective, momentum beyond the $2,364 area, or last week's swing high, could be seen as a fresh trigger for bullish traders. That said, mixed oscillators on the daily chart warrant some caution before positioning for any further gains. Hence, any subsequent move up is more likely to confront stiff resistance and remain capped near the $2,400 mark. Some follow-through buying, however, has the potential to lift the Gold price to the next relevant hurdle near the $2,425 zone en route to the $2,450 region, or the all-time peak touched in May.
On the flip side, any meaningful slide back below the $2,360 level might attract fresh buyers around the $2,340 horizontal zone. This should help limit the downside for the Gold price near the $2,315-2,314 area or the multi-week low touched on Tuesday. A convincing break below, however, will confirm a breakdown through the 50-day Simple Moving Average (SMA) and pave the way for deeper losses. the XAU/USD might then weaken further below the $2,300 round-figure mark and test the $2,280 support zone.
Gold FAQs
Gold has played a key role in human’s history as it has been widely used as a store of value and medium of exchange. Currently, apart from its shine and usage for jewelry, the precious metal is widely seen as a safe-haven asset, meaning that it is considered a good investment during turbulent times. Gold is also widely seen as a hedge against inflation and against depreciating currencies as it doesn’t rely on any specific issuer or government.
Central banks are the biggest Gold holders. In their aim to support their currencies in turbulent times, central banks tend to diversify their reserves and buy Gold to improve the perceived strength of the economy and the currency. High Gold reserves can be a source of trust for a country’s solvency. Central banks added 1,136 tonnes of Gold worth around $70 billion to their reserves in 2022, according to data from the World Gold Council. This is the highest yearly purchase since records began. Central banks from emerging economies such as China, India and Turkey are quickly increasing their Gold reserves.
Gold has an inverse correlation with the US Dollar and US Treasuries, which are both major reserve and safe-haven assets. When the Dollar depreciates, Gold tends to rise, enabling investors and central banks to diversify their assets in turbulent times. Gold is also inversely correlated with risk assets. A rally in the stock market tends to weaken Gold price, while sell-offs in riskier markets tend to favor the precious metal.
The price can move due to a wide range of factors. Geopolitical instability or fears of a deep recession can quickly make Gold price escalate due to its safe-haven status. As a yield-less asset, Gold tends to rise with lower interest rates, while higher cost of money usually weighs down on the yellow metal. Still, most moves depend on how the US Dollar (USD) behaves as the asset is priced in dollars (XAU/USD). A strong Dollar tends to keep the price of Gold controlled, whereas a weaker Dollar is likely to push Gold prices up.
The Bank of Japan (BoJ) board member Toyoaki Nakamura said on Thursday that based on current data, it is appropriate to maintain policy intact for the time being, per Reuters.
Key quotes
Closely watching real wages
Warns Japan's economy at critical juncture
Uncertainty remains on sustainability of wage increases
Weak impact of rising wages on prices
Japan's economy recovering moderately albeit some weak signs
My view is that inflation may not reach 2% from fiscal 2025 onward if consumption weakens
Will focus on whether inflation-adjusted consumption turns positive, in deciding future monetary policy
Based on current data, it is appropriate to keep policy intact for time being
Pass-through of wages to inflation remains weak but closely monitoring situation
Households' purchasing power is weak, solid rise in disposable income is needed for households to boost spending
Personally not confident that wage growth will be sustained
Want to check whether capex growth will become broad-based, as some smaller firms appear to be delaying investment due to supply constraints
Structural changes in economy are necessary for Japan to sustainably, stably achieve BOJ's 2% inflation target
Market reaction
At the time of writing, USD/JPY is trading 0.27% lower on the day at 155.66.
Bank of Japan FAQs
The Bank of Japan (BoJ) is the Japanese central bank, which sets monetary policy in the country. Its mandate is to issue banknotes and carry out currency and monetary control to ensure price stability, which means an inflation target of around 2%.
The Bank of Japan has embarked in an ultra-loose monetary policy since 2013 in order to stimulate the economy and fuel inflation amid a low-inflationary environment. The bank’s policy is based on Quantitative and Qualitative Easing (QQE), or printing notes to buy assets such as government or corporate bonds to provide liquidity. In 2016, the bank doubled down on its strategy and further loosened policy by first introducing negative interest rates and then directly controlling the yield of its 10-year government bonds.
The Bank’s massive stimulus has caused the Yen to depreciate against its main currency peers. This process has exacerbated more recently due to an increasing policy divergence between the Bank of Japan and other main central banks, which have opted to increase interest rates sharply to fight decades-high levels of inflation. The BoJ’s policy of holding down rates has led to a widening differential with other currencies, dragging down the value of the Yen.
A weaker Yen and the spike in global energy prices have led to an increase in Japanese inflation, which has exceeded the BoJ’s 2% target. Still, the Bank judges that the sustainable and stable achievement of the 2% target has not yet come in sight, so any sudden change in the current policy looks unlikely.
The People’s Bank of China (PBoC) set the USD/CNY central rate for the trading session ahead on Thursday at 7.1108, as against the previous day's fix of 7.1097 and 7.2436 Reuters estimates.
- The Australian Dollar rises as the Aussie Trade Surplus widens in May.
- The Australian Bureau of Statistics reported a Trade Balance figure of 6,548 million MoM in May, surpassing the expected 5,500 million.
- The US Dollar struggles as Wednesday's mixed data fuel rate cut speculations by the Fed.
The Australian Dollar (AUD) retraced its recent losses on Thursday. The AUD/USD pair strengthened after the Trade Balance release in Australia, which widened to 6,548 million month-over-month in May, exceeding the expected 5,500 million and April's balance of 5,024 million.
The Australian Dollar could appreciate due to a hawkish statement by Reserve Bank of Australia (RBA) Governor Michele Bullock on Wednesday. Bullock indicated that the central bank is prepared to increase interest rates if the Consumer Price Index (CPI) does not return to the target range of 1%-3%. She also acknowledged that the labor market is easing on several measures, as reported by NCA NewsWire.
The US Dollar (USD) struggled after mixed economic data was released in the United States (US), which fueled interest rate cut speculations by the US Federal Reserve (Fed). As per the CME FedWatch Tool, the probability of a Fed rate cut by at least 25 basis points has increased to nearly 70.0%, up from 47.5% a week earlier.
The depreciation in the US Treasury yields are putting pressure on the Greenback. Investors await the key US employment data releases on Friday, including the Average Hourly Earnings and Nonfarm Payrolls.
Daily Digest Market Movers: Australian Dollar rises due to improved risk sentiment
- On Wednesday, the ISM US Services PMI soared to 53.8 in May, marking its highest level in nine months and significantly surpassing the forecast of 50.8. In contrast, the ADP US Employment Change report showed that 152,000 new workers were added to payrolls in May, the lowest in four months and well below the forecast of 175,000 and the downwardly revised figure of 188,000 for April.
- Australia's Gross Domestic Product (GDP) was released on Wednesday, which grew 0.1% in the first quarter, against the expected 0.2% reading. On an annual basis, the economy grew 1.1%, slightly below the expected 1.2%.
- Judo Bank Purchasing Managers Index (PMI) came in at 52.5, lower than the expected reading of 53.1 for May. Meanwhile, Judo Bank Composite PMI recorded a reading of 52.1 in May, a slight decrease from 53.0 in April. This shows that Australia's private sector output continued to grow for the fourth consecutive month, though at a slower rate.
- Caixin China Services PMI came in at 54.0 in May, surpassing expectations of 52.6 and the previous figure of 52.5. This marked the 17th consecutive month of expansion in services activity, indicating the fastest pace since July 2023. Any change in the Chinese economy could impact the Australian market as both countries are close trade partners.
- Last week, Atlanta Fed President Raphael Bostic remarked in an interview with Fox Business that he doesn't believe further rate hikes should be required to reach the Fed's 2% annual inflation target. Additionally, New York Fed President John Williams stated that inflation is still too high but should moderate over the second half of 2024. Williams doesn't feel the urgency to act on monetary policy, per Reuters.
Technical Analysis: Australian Dollar remains above 0.6650
The Australian Dollar trades around 0.6670 on Thursday. Analysis of the daily chart shows a bullish bias for the AUD/USD pair, as it remains within a rising wedge pattern. This bullish bias is further supported by the 14-day Relative Strength Index (RSI), which is above the 50 level.
Potential upside targets for the AUD/USD pair include the psychological level of 0.6700, the four-month high of 0.6714, and the upper limit of the rising wedge around 0.6750.
On the downside, immediate support is at the 21-day Exponential Moving Average (EMA) at 0.6634, which aligns with the lower boundary of the rising wedge. Additional support is found at the psychological level of 0.6600. A further decline could pressure the AUD/USD pair towards the throwback support region at 0.6470.
AUD/USD: Daily Chart
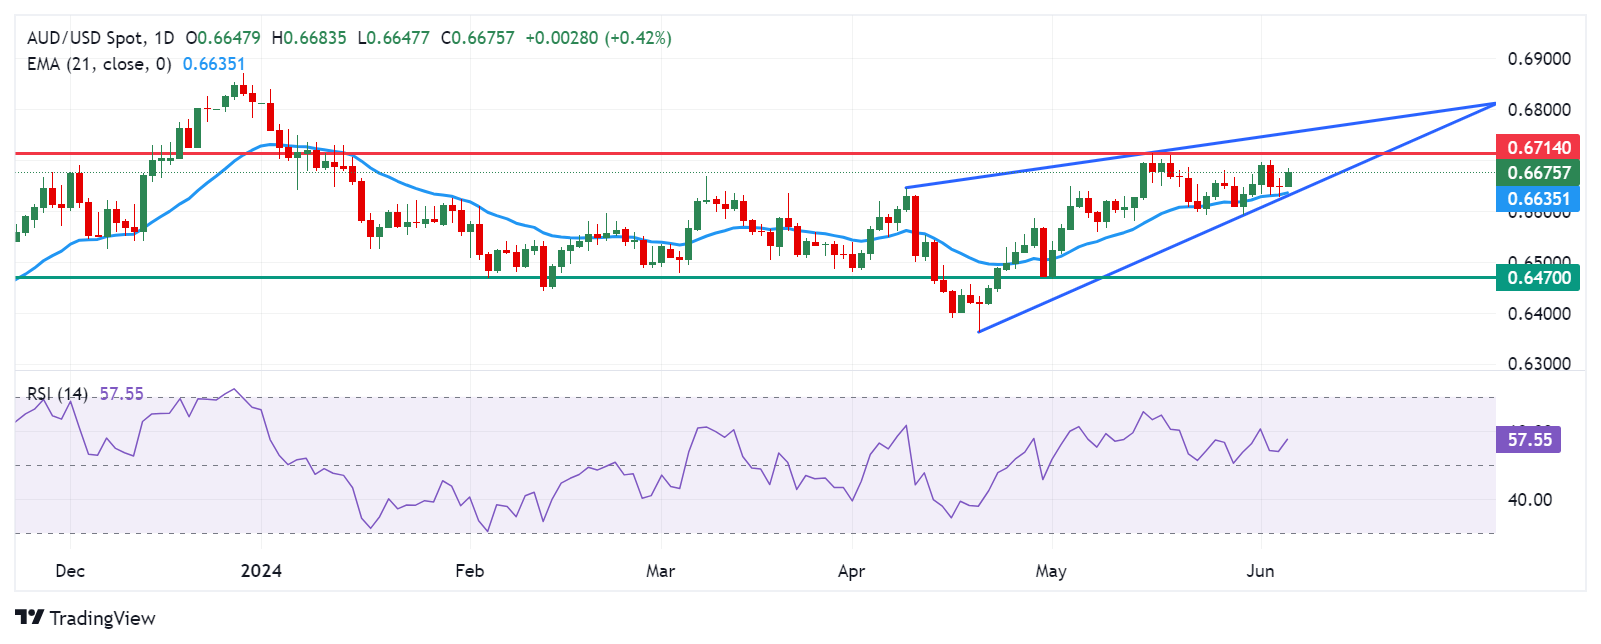
Australian Dollar price today
The table below shows the percentage change of the Australian Dollar (AUD) against listed major currencies today. The Australian Dollar was the strongest against the US Dollar.
| USD | EUR | GBP | CAD | AUD | JPY | NZD | CHF | |
| USD | -0.16% | -0.10% | -0.14% | -0.35% | -0.25% | -0.24% | -0.23% | |
| EUR | 0.16% | 0.07% | 0.02% | -0.17% | -0.07% | -0.04% | -0.06% | |
| GBP | 0.09% | -0.06% | -0.05% | -0.25% | -0.14% | -0.11% | -0.14% | |
| CAD | 0.13% | -0.03% | 0.06% | -0.22% | -0.12% | -0.10% | -0.10% | |
| AUD | 0.36% | 0.20% | 0.27% | 0.20% | 0.09% | 0.12% | 0.13% | |
| JPY | 0.23% | 0.09% | 0.14% | 0.08% | -0.12% | -0.02% | 0.00% | |
| NZD | 0.24% | 0.04% | 0.14% | 0.10% | -0.13% | -0.02% | 0.01% | |
| CHF | 0.23% | 0.06% | 0.14% | 0.09% | -0.12% | -0.03% | -0.01% |
The heat map shows percentage changes of major currencies against each other. The base currency is picked from the left column, while the quote currency is picked from the top row. For example, if you pick the Euro from the left column and move along the horizontal line to the Japanese Yen, the percentage change displayed in the box will represent EUR (base)/JPY (quote).
Australian Dollar FAQs
One of the most significant factors for the Australian Dollar (AUD) is the level of interest rates set by the Reserve Bank of Australia (RBA). Because Australia is a resource-rich country another key driver is the price of its biggest export, Iron Ore. The health of the Chinese economy, its largest trading partner, is a factor, as well as inflation in Australia, its growth rate and Trade Balance. Market sentiment – whether investors are taking on more risky assets (risk-on) or seeking safe-havens (risk-off) – is also a factor, with risk-on positive for AUD.
The Reserve Bank of Australia (RBA) influences the Australian Dollar (AUD) by setting the level of interest rates that Australian banks can lend to each other. This influences the level of interest rates in the economy as a whole. The main goal of the RBA is to maintain a stable inflation rate of 2-3% by adjusting interest rates up or down. Relatively high interest rates compared to other major central banks support the AUD, and the opposite for relatively low. The RBA can also use quantitative easing and tightening to influence credit conditions, with the former AUD-negative and the latter AUD-positive.
China is Australia’s largest trading partner so the health of the Chinese economy is a major influence on the value of the Australian Dollar (AUD). When the Chinese economy is doing well it purchases more raw materials, goods and services from Australia, lifting demand for the AUD, and pushing up its value. The opposite is the case when the Chinese economy is not growing as fast as expected. Positive or negative surprises in Chinese growth data, therefore, often have a direct impact on the Australian Dollar and its pairs.
Iron Ore is Australia’s largest export, accounting for $118 billion a year according to data from 2021, with China as its primary destination. The price of Iron Ore, therefore, can be a driver of the Australian Dollar. Generally, if the price of Iron Ore rises, AUD also goes up, as aggregate demand for the currency increases. The opposite is the case if the price of Iron Ore falls. Higher Iron Ore prices also tend to result in a greater likelihood of a positive Trade Balance for Australia, which is also positive of the AUD.
The Trade Balance, which is the difference between what a country earns from its exports versus what it pays for its imports, is another factor that can influence the value of the Australian Dollar. If Australia produces highly sought after exports, then its currency will gain in value purely from the surplus demand created from foreign buyers seeking to purchase its exports versus what it spends to purchase imports. Therefore, a positive net Trade Balance strengthens the AUD, with the opposite effect if the Trade Balance is negative.
Australia’s trade surplus widens to 6,548MM MoM in May versus 5,500M expected and 5.024M in the previous reading, according to the latest Aussie foreign trade data published by the Australian Bureau of Statistics on Thursday.
Further details reveal that Australia's May Goods/Services Exports reprint -2.5% figures on a monthly basis versus 0.1 prior. The nation’s Goods/Services Imports dropped 7.2% in May MoM versus 4.2% prior.
Market reaction
At the press time, the AUD/USD pair is up 0.51% on the day to trade at 0.6681.
Australian Dollar FAQs
One of the most significant factors for the Australian Dollar (AUD) is the level of interest rates set by the Reserve Bank of Australia (RBA). Because Australia is a resource-rich country another key driver is the price of its biggest export, Iron Ore. The health of the Chinese economy, its largest trading partner, is a factor, as well as inflation in Australia, its growth rate and Trade Balance. Market sentiment – whether investors are taking on more risky assets (risk-on) or seeking safe-havens (risk-off) – is also a factor, with risk-on positive for AUD.
The Reserve Bank of Australia (RBA) influences the Australian Dollar (AUD) by setting the level of interest rates that Australian banks can lend to each other. This influences the level of interest rates in the economy as a whole. The main goal of the RBA is to maintain a stable inflation rate of 2-3% by adjusting interest rates up or down. Relatively high interest rates compared to other major central banks support the AUD, and the opposite for relatively low. The RBA can also use quantitative easing and tightening to influence credit conditions, with the former AUD-negative and the latter AUD-positive.
China is Australia’s largest trading partner so the health of the Chinese economy is a major influence on the value of the Australian Dollar (AUD). When the Chinese economy is doing well it purchases more raw materials, goods and services from Australia, lifting demand for the AUD, and pushing up its value. The opposite is the case when the Chinese economy is not growing as fast as expected. Positive or negative surprises in Chinese growth data, therefore, often have a direct impact on the Australian Dollar and its pairs.
Iron Ore is Australia’s largest export, accounting for $118 billion a year according to data from 2021, with China as its primary destination. The price of Iron Ore, therefore, can be a driver of the Australian Dollar. Generally, if the price of Iron Ore rises, AUD also goes up, as aggregate demand for the currency increases. The opposite is the case if the price of Iron Ore falls. Higher Iron Ore prices also tend to result in a greater likelihood of a positive Trade Balance for Australia, which is also positive of the AUD.
The Trade Balance, which is the difference between what a country earns from its exports versus what it pays for its imports, is another factor that can influence the value of the Australian Dollar. If Australia produces highly sought after exports, then its currency will gain in value purely from the surplus demand created from foreign buyers seeking to purchase its exports versus what it spends to purchase imports. Therefore, a positive net Trade Balance strengthens the AUD, with the opposite effect if the Trade Balance is negative.
- NZD/USD attracts some buyers near 0.6205 on Thursday.
- The US ISM Services PMI came in stronger than expected, rising to 53.8 in May from 49.4 in April.
- The encouraging Chinese Caixin Services PMI data on Wednesday supports the China-proxy NZD.
The NZD/USD pair extends the rally to three-month highs around 0.6205 on Thursday during the early Asian trading hours. Investors start to price in two interest rate cuts by the Federal Reserve (Fed) this year, which drags the Greenback lower against the Kiwi. The US weekly Initial Jobless Claims is due on Thursday ahead of the highly-anticipated US Nonfarm Payrolls (NFP) data on Friday.
The US Dollar (USD) recovery proved short-lived despite the stronger-than-expected US ISM Services Purchasing Managers Index (PMI) data for May. The Services PMI improved to 53.8 from 49.4 in April, better than the forecast of 50.8.
The recent weaker US GDP and more signs of a weakening labour market prompted rising Federal Reserve (Fed) rate-cut bets, which might weigh on the USD in the near term. A majority of forecasters in a Reuters poll showed that the Fed is likely to cut its key interest rate in September and once more this year. Traders are currently pricing in about a 70% possibility of a Fed rate cut in September, according to CME FedWatch.
On the Kiwi front, the encouraging Chinese data provides some support to the New Zealand Dollar (NZD), as China is New Zealand's largest trading partner. On Wednesday, the latest data released by Caixin showed that China's Services PMI rose to 54.0 in May from 52.5 in April, beating market expectations of 52.6 by a wide margin in the reported period.
| Index | Change, points | Closed | Change, % |
|---|---|---|---|
| NIKKEI 225 | -347.29 | 38490.17 | -0.89 |
| Hang Seng | -19.15 | 18424.96 | -0.1 |
| KOSPI | 27.4 | 2689.5 | 1.03 |
| ASX 200 | 31.9 | 7769 | 0.41 |
| DAX | 170.3 | 18575.94 | 0.93 |
| CAC 40 | 68.67 | 8006.57 | 0.87 |
| Dow Jones | 96.04 | 38807.33 | 0.25 |
| S&P 500 | 62.69 | 5354.03 | 1.18 |
| NASDAQ Composite | 330.85 | 17187.9 | 1.96 |
| Pare | Closed | Change, % |
|---|---|---|
| AUDUSD | 0.66482 | -0.01 |
| EURJPY | 169.606 | 0.68 |
| EURUSD | 1.087 | -0.09 |
| GBPJPY | 199.514 | 0.9 |
| GBPUSD | 1.27874 | 0.13 |
| NZDUSD | 0.61926 | 0.27 |
| USDCAD | 1.36928 | 0.11 |
| USDCHF | 0.89329 | 0.39 |
| USDJPY | 156.025 | 0.77 |
- EUR/USD snaps the two-day losing streak near 1.0875 in Thursday’s early Asian session.
- The ECB is expected to cut interest rates for the first time in five years on Thursday.
- The US ISM Services PMI rose to 53.8 in May from 49.4 in April, above the consensus.
The EUR/USD pair gains ground around 1.0875 despite the recovery of the US Dollar (USD) during the early Asian session on Thursday. The European Central Bank (ECB) interest rate decision and Press Conference by President Christine Lagarde will take centre stage later on Thursday.
The ECB is anticipated to cut its interest rates by 25 basis points (bps) at its 6 June meeting, reducing the main refinancing, the marginal lending, and the deposit rate to 4.25%, 4.50%, and 3.75%, respectively. Financial markets have priced in 43 bps of ECB cuts by September and around 60 bps by the end of the year. The divergence between the ECB and the US Federal Reserve (Fed) could exert some selling pressure on the Euro (EUR) and create a headwind for EUR/USD.
Across the pond, there is growing speculation about the first-rate cuts from the Fed in September as the US economy grew at a slower pace in the first quarter. According to the CME FedWatch tool, traders are now pricing in nearly 70% odds of a Fed rate cut in September, a rise from 54.9% at the beginning of the week. The Fed rate cut expectation is likely to weigh on the Greenback in the near term.
Nevertheless, the release of the stronger-than-expected US ISM Services Purchasing Managers Index (PMI) data for May has provided some support to the USD. The figure rose to 53.8 in May from the previous reading of 49.4, above the market consensus of 50.8. Investors will shift their attention to the US Nonfarm Payrolls (NFP) data on Friday, which is estimated to add 185K jobs to the US economy in May. The stronger-than-expected US employment data might further lift the USD and cap the upside for EUR/USD.


© 2000-2024. Sva prava zaštićena.
Sajt je vlasništvo kompanije Teletrade D.J. LLC 2351 LLC 2022 (Euro House, Richmond Hill Road, Kingstown, VC0100, St. Vincent and the Grenadines).
Svi podaci koji se nalaze na sajtu ne predstavljaju osnovu za donošenje investicionih odluka, već su informativnog karaktera.
The company does not serve or provide services to customers who are residents of the US, Canada, Iran, The Democratic People's Republic of Korea, Yemen and FATF blacklisted countries.
Izvršenje trgovinskih operacija sa finansijskim instrumentima upotrebom marginalne trgovine pruža velike mogućnosti i omogućava investitorima ostvarivanje visokih prihoda. Međutim, takav vid trgovine povezan je sa potencijalno visokim nivoom rizika od gubitka sredstava. Проведение торговых операций на финанcовых рынках c маржинальными финанcовыми инcтрументами открывает широкие возможноcти, и позволяет инвеcторам, готовым пойти на риcк, получать выcокую прибыль, но при этом неcет в cебе потенциально выcокий уровень риcка получения убытков. Iz tog razloga je pre započinjanja trgovine potrebno odlučiti o izboru odgovarajuće investicione strategije, uzimajući u obzir raspoložive resurse.
Upotreba informacija: U slučaju potpunog ili delimičnog preuzimanja i daljeg korišćenja materijala koji se nalazi na sajtu, potrebno je navesti link odgovarajuće stranice na sajtu kompanije TeleTrade-a kao izvora informacija. Upotreba materijala na internetu mora biti praćena hiper linkom do web stranice teletrade.org. Automatski uvoz materijala i informacija sa stranice je zabranjen.
Ako imate bilo kakvih pitanja, obratite nam se pr@teletrade.global.
транcфери