- Analiza
- Novosti i instrumenti
- Vesti sa tržišta
Forex-novosti i prognoze od 04-10-2024
- USD/JPY rallies over 1% after US Nonfarm Payrolls added 254K jobs, lifting US Treasury yields.
- Bulls target a decisive break above 149.39 and 150.00, with next resistance at the 200-DMA of 151.06.
- Support lies at 148.00, followed by the Senkou Span B at 147.78 and the bottom of the Ichimoku Cloud at 146.90-147.00.
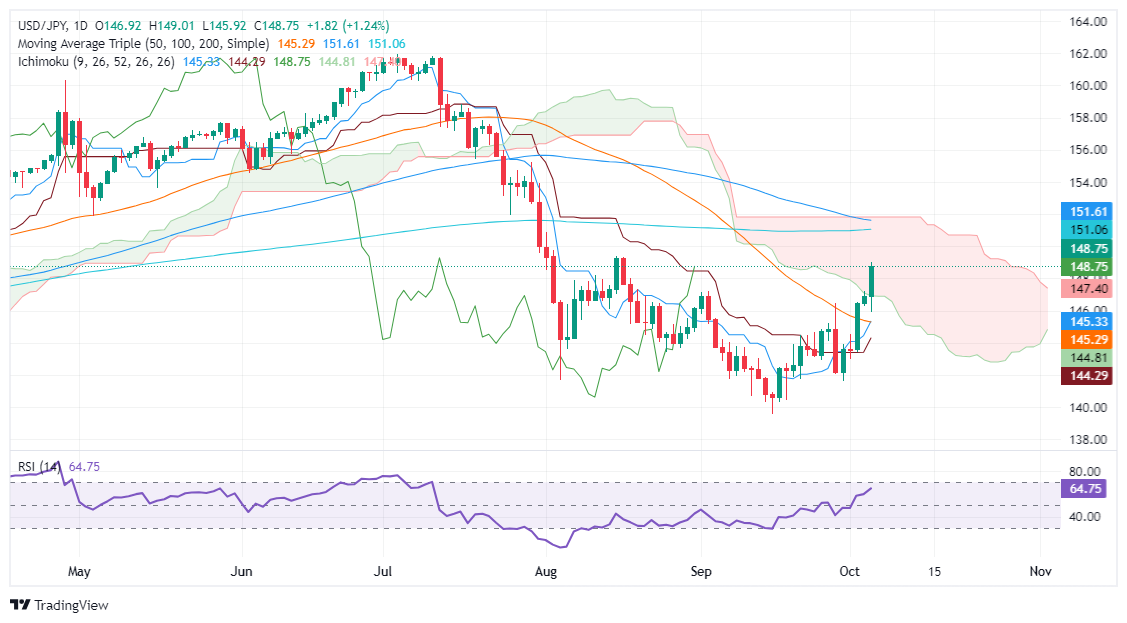
The USD/JPY rallied sharply inside the Ichimoku cloud (Kumo) after the US Bureau of Labor Statistics (BLS) revealed that the latest jobs report added over 254K employees to the workforce. This underpinned US Treasury yields, which lifted the exchange rate to current price levels due to their close correlation with the pair. The major trades at 148.73, up by over 1%.
USD/JPY Price Forecast: Technical outlook
The USD/JPY aimed higher, yet it remains far from turning bullish. Despite this, bulls are in charge in the short term, eyeing a decisive break above the August 15 high of 149.39 and the 150.00 figure.
The Relative Strength Index (RSI) is bullish, aiming upwards, suggesting further upside is seen in the USD/JPY pair.
If buyers clear 150.00, the next resistance would be the 200-day moving average (DMA) at 151.06. On further strength, that will expose the 100-DMA at 151.94.
Conversely, the USD/JPY first support would be the 148.00 figure. Once surrendered, the first support would be the Senkou Span B at 147.78, followed by the bottom of the Kumo at 146.90-147.00.
USD/JPY Price Action – Daily Chart
Japanese Yen PRICE Today
The table below shows the percentage change of Japanese Yen (JPY) against listed major currencies today. Japanese Yen was the strongest against the New Zealand Dollar.
| USD | EUR | GBP | JPY | CAD | AUD | NZD | CHF | |
|---|---|---|---|---|---|---|---|---|
| USD | 0.52% | -0.02% | 1.22% | 0.15% | 0.64% | 0.85% | 0.72% | |
| EUR | -0.52% | -0.52% | 0.72% | -0.35% | 0.11% | 0.35% | 0.18% | |
| GBP | 0.02% | 0.52% | 1.25% | 0.18% | 0.64% | 0.86% | 0.69% | |
| JPY | -1.22% | -0.72% | -1.25% | -1.07% | -0.59% | -0.40% | -0.54% | |
| CAD | -0.15% | 0.35% | -0.18% | 1.07% | 0.47% | 0.72% | 0.52% | |
| AUD | -0.64% | -0.11% | -0.64% | 0.59% | -0.47% | 0.22% | 0.03% | |
| NZD | -0.85% | -0.35% | -0.86% | 0.40% | -0.72% | -0.22% | -0.18% | |
| CHF | -0.72% | -0.18% | -0.69% | 0.54% | -0.52% | -0.03% | 0.18% |
The heat map shows percentage changes of major currencies against each other. The base currency is picked from the left column, while the quote currency is picked from the top row. For example, if you pick the Japanese Yen from the left column and move along the horizontal line to the US Dollar, the percentage change displayed in the box will represent JPY (base)/USD (quote).
- The US Dollar climbed after a bumper NFP print on Friday.
- US jobs additions soared in September, with upside revisions to previous months.
- Market hopes for a follow-up outsized rate cut in November were shattered by jobs growth.
The US Dollar (USD) Index (DXY) climbed into a fifth consecutive bullish day on Friday, driven higher by better-than-expected US Nonfarm Payrolls figures. A firm showing for US jobs gains and an easing in the US Unemployment Rate have hobbled market expectations for a repeat double-cut from the Federal Reserve (Fed) in November.
The US Unemployment Rate dropped back to 4.1% from the previous 4.2%, further reinforcing a healthier-than-expected landscape in the US labor market. In addition, several months’ worth of NFP releases saw healthy upside revisions. August’s previous NFP total was lifted by an additional 17K, while July’s figure rose sharply by 55K, bringing the total up to 144K.
Annual wage growth also firmed up in September, rising 4.0% YoY from the previous 3.9%. Investors had expected September’s Average Hourly Earnings growth to ease back to 3.8%. With wages and net jobs additions blowing well past expectations across the board, rate market expectations of a higher pace of rate cuts have taken a huge hit to round out a middling-at-best trading week.
According to the CME’s FedWatch Tool, rate trader expectations for the Fed’s November rate call plummeted post-NFP; rate futures speculators now see a 95% chance that the Fed will trim rates by a modest 25 bps on November 7, with the last 5% betting on no movement at all on the Fed funds rate.
US Dollar price forecast
The Dollar Index (DXY) has been strong lately, breaking through important levels and going above 102.00. It has tested the 50-day Exponential Moving Average (EMA) at 101.90, which could be a significant barrier.
The recent price movement suggests a possible short-term recovery from the earlier downward trend. The next important resistance is the 200-day EMA at around 103.41. If the index breaks above this level, it could confirm a change in the overall trend.
Since hitting its lowest point in September, the index has been making higher lows, showing a change in market sentiment in favor of the dollar. If this continues, the DXY could aim for the 103.50-104.00 range, where the 200-day EMA is a major hurdle.
If it doesn't break the 50-day EMA, the index may consolidate or go back down to around 101.00, with more support at 100.50.
The Dollar Index seems to be recovering, with the 50-day and 200-day EMAs as important barriers. Breaking above 103.50 could mean a longer period of growth, while failing to do so could result in going back down to around 101.00.
DXY daily chart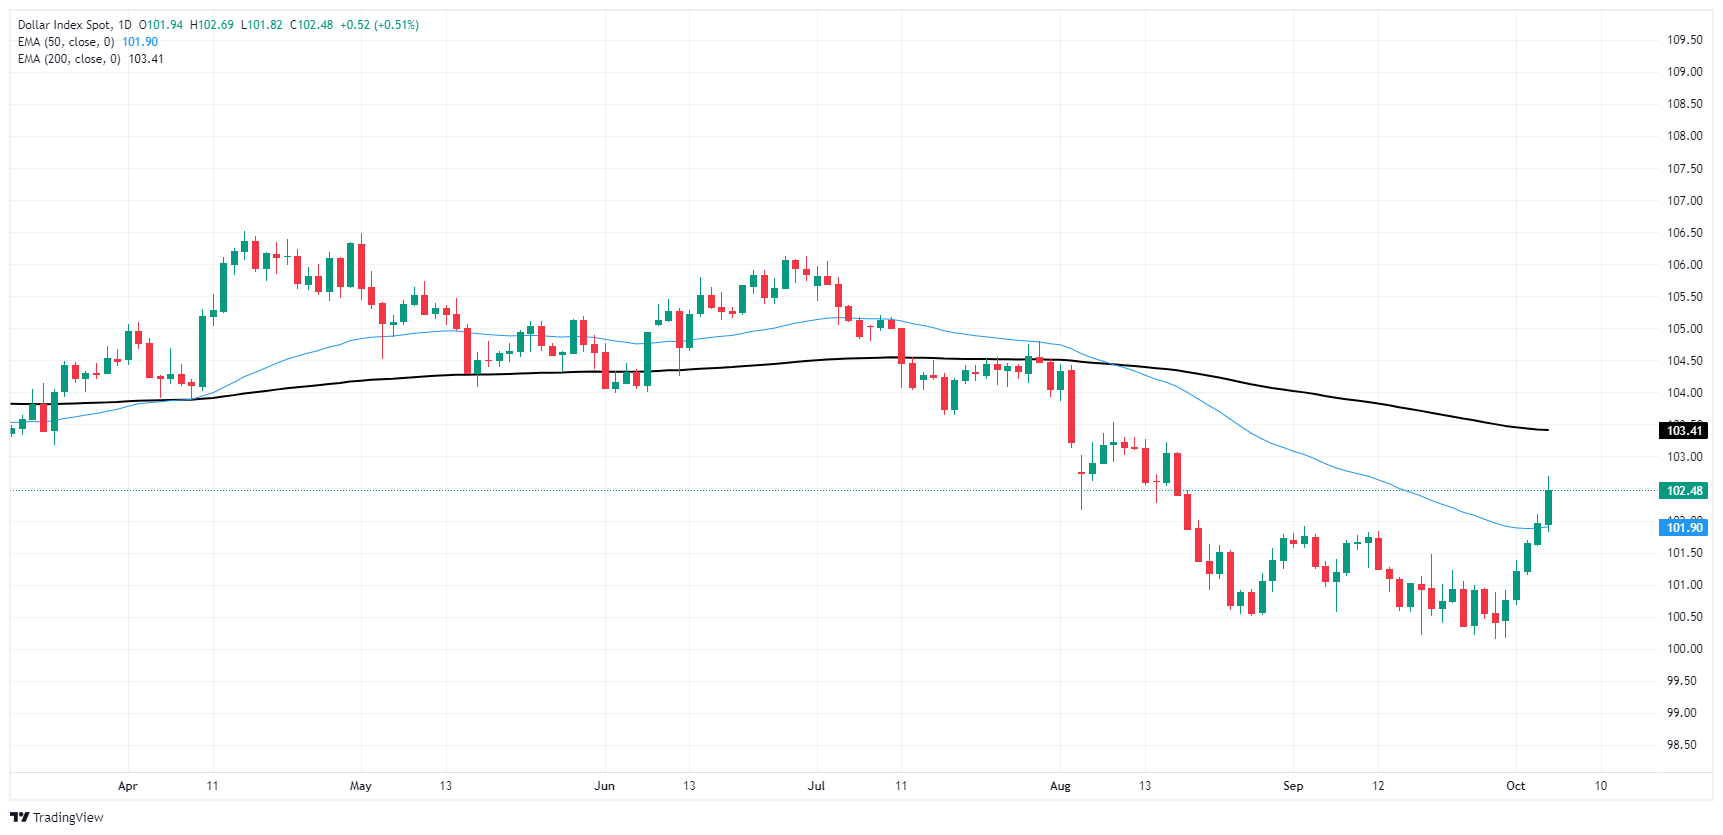
US Dollar FAQs
The US Dollar (USD) is the official currency of the United States of America, and the ‘de facto’ currency of a significant number of other countries where it is found in circulation alongside local notes. It is the most heavily traded currency in the world, accounting for over 88% of all global foreign exchange turnover, or an average of $6.6 trillion in transactions per day, according to data from 2022. Following the second world war, the USD took over from the British Pound as the world’s reserve currency. For most of its history, the US Dollar was backed by Gold, until the Bretton Woods Agreement in 1971 when the Gold Standard went away.
The most important single factor impacting on the value of the US Dollar is monetary policy, which is shaped by the Federal Reserve (Fed). The Fed has two mandates: to achieve price stability (control inflation) and foster full employment. Its primary tool to achieve these two goals is by adjusting interest rates. When prices are rising too quickly and inflation is above the Fed’s 2% target, the Fed will raise rates, which helps the USD value. When inflation falls below 2% or the Unemployment Rate is too high, the Fed may lower interest rates, which weighs on the Greenback.
In extreme situations, the Federal Reserve can also print more Dollars and enact quantitative easing (QE). QE is the process by which the Fed substantially increases the flow of credit in a stuck financial system. It is a non-standard policy measure used when credit has dried up because banks will not lend to each other (out of the fear of counterparty default). It is a last resort when simply lowering interest rates is unlikely to achieve the necessary result. It was the Fed’s weapon of choice to combat the credit crunch that occurred during the Great Financial Crisis in 2008. It involves the Fed printing more Dollars and using them to buy US government bonds predominantly from financial institutions. QE usually leads to a weaker US Dollar.
Quantitative tightening (QT) is the reverse process whereby the Federal Reserve stops buying bonds from financial institutions and does not reinvest the principal from the bonds it holds maturing in new purchases. It is usually positive for the US Dollar.
- AUD/USD falls following robust US Nonfarm Payrolls data, reducing the likelihood of aggressive Fed rate cuts.
- Fed Chair Powell signals slower pace of easing, with markets now pricing in a 25 bps cut for November.
- Australian data shows mixed results with strong Retail Sales and trade surplus but ongoing manufacturing contraction and slowing business activity.
The Australian Dollar dropped during the North American session after September’s jobs report in the United States (US), suggesting that the Federal Reserve (Fed) would not cut rates by 50 basis points (bps) at the November meeting. The AUD/USD trades at 0.6796, down over 0.60%.
The AUD/USD extended its losses following September’s monster Nonfarm Payrolls report in the US, which lowered the Unemployment Rate. Average Hourly Earnings were mixed, though overall the data relieved the Fed from lowering rates aggressively.
In September, the Fed cut rates by 50 bps. The swaps markets showed that investors had earlier been eyeing another one of the same size in the November or December meeting. However, Fed Chair Jerome Powell pushed against this stance on Monday, saying that officials foresaw 50 bps of easing in total at the end of 2024 and that the US central bank is in no rush to cut rates.
According to CME FedWatch Tool data, the markets had priced in a 25 bps cut at the November meeting regarding Fed interest rate probabilities.
Aside from this, Australia’s data witnessed a solid Retail Sales report, and the Balance of Trade in August printed a surplus. Although those conditions could prevent the Reserve Bank of Australia (RBA) from cutting rates, business activity in the manufacturing sector, via the Judo Bank Manufacturing PMI, contracted for eight straight months.
On the other hand, the Judo Bank Services PMI slowed sharply, while Building Permits plummeted, hinting at an ongoing economic slowdown.
Next week, Australia’s economic docket will feature Business and Consumer Confidence data, RBA speakers, and the RBA’s latest meeting minutes. On the US front, the schedule will feature the release of inflation data, jobless claims, and University of Michigan Consumer Sentiment.
Daily digest market movers: Australian Dollar depreciates on US data, geopolitical risks
- The Australian Dollar will likely remain pressured due to several factors. Geopolitical risks, such as over-the-weekend developments in the Middle East, could hurt risk appetite for the AUD.
- The Aussie’s economic docket will feature the NAB Business Confidence and the Westpac Consumer Confidence for September and October, respectively. Following that, traders eye RBA’s Hauser, Kent and Hunter speeches.
- US Nonfarm Payrolls increased by 254K in September, significantly surpassing the estimated 140K and the upwardly revised August figure of 159K. The Unemployment Rate fell from 4.2% to 4.1%, lower than expected.
- Average Hourly Earnings in September rose by 0.4% MoM, down from 0.5% in the previous month but exceeding forecasts of 0.3%.
- On a YoY basis, earnings per hour increased by 4% in the 12 months to September, surpassing estimates and improving on August’s figures of 3.8% and 3.9%.
- Market participants have ruled out a 50 bps cut from the Fed. The odds of a 25 bps cut stand at 95%, with only a 5% chance of rates being held unchanged, according to the CME FedWatch Tool data.
Technical analysis: Australian Dollar extends its losses below 0.6800
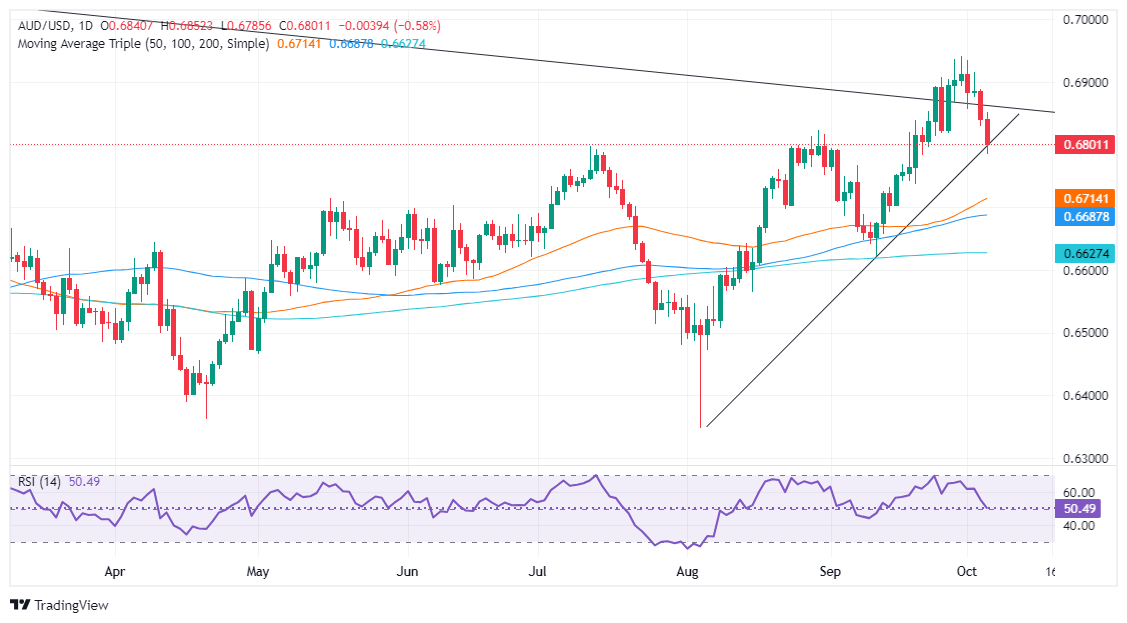
Despite retreacing below the 0.6800 figure, the AUD/USD remains upwardly biased. Momentum is mixed with the Relative Strength Index (RSI) remaining bullish but hinting at dropping into bearish territory.
The AUD/USD could accelerate its losses if it clears the September 6 peak at 0.6767. Once surrendered, the next demand area will be the 50-day Simple Moving Average (SMA) at 0.6712.
On the other hand, if buyers lift the AUD/USD above 0.6800, the first supply zone will be the October 1, 2024 low of 0.6856. A breach of the latter will expose 0.6900 before retesting the year-to-date high of 0.6934.
Australian Dollar FAQs
One of the most significant factors for the Australian Dollar (AUD) is the level of interest rates set by the Reserve Bank of Australia (RBA). Because Australia is a resource-rich country another key driver is the price of its biggest export, Iron Ore. The health of the Chinese economy, its largest trading partner, is a factor, as well as inflation in Australia, its growth rate and Trade Balance. Market sentiment – whether investors are taking on more risky assets (risk-on) or seeking safe-havens (risk-off) – is also a factor, with risk-on positive for AUD.
The Reserve Bank of Australia (RBA) influences the Australian Dollar (AUD) by setting the level of interest rates that Australian banks can lend to each other. This influences the level of interest rates in the economy as a whole. The main goal of the RBA is to maintain a stable inflation rate of 2-3% by adjusting interest rates up or down. Relatively high interest rates compared to other major central banks support the AUD, and the opposite for relatively low. The RBA can also use quantitative easing and tightening to influence credit conditions, with the former AUD-negative and the latter AUD-positive.
China is Australia’s largest trading partner so the health of the Chinese economy is a major influence on the value of the Australian Dollar (AUD). When the Chinese economy is doing well it purchases more raw materials, goods and services from Australia, lifting demand for the AUD, and pushing up its value. The opposite is the case when the Chinese economy is not growing as fast as expected. Positive or negative surprises in Chinese growth data, therefore, often have a direct impact on the Australian Dollar and its pairs.
Iron Ore is Australia’s largest export, accounting for $118 billion a year according to data from 2021, with China as its primary destination. The price of Iron Ore, therefore, can be a driver of the Australian Dollar. Generally, if the price of Iron Ore rises, AUD also goes up, as aggregate demand for the currency increases. The opposite is the case if the price of Iron Ore falls. Higher Iron Ore prices also tend to result in a greater likelihood of a positive Trade Balance for Australia, which is also positive of the AUD.
The Trade Balance, which is the difference between what a country earns from its exports versus what it pays for its imports, is another factor that can influence the value of the Australian Dollar. If Australia produces highly sought after exports, then its currency will gain in value purely from the surplus demand created from foreign buyers seeking to purchase its exports versus what it spends to purchase imports. Therefore, a positive net Trade Balance strengthens the AUD, with the opposite effect if the Trade Balance is negative.
- The Canadian Dollar (CAD) eased lower after better-than-expected US NFP numbers.
- Canada saw an upswing in Ivey PMIs, but was passed over by market watchers.
- A firm jump in US NFP jobs additions toppled rate cut hopes to wrap up the trading week.
The Canadian Dollar (CAD) slipped further on Friday, driven lower by a broad-market extension of recent Greenback bidding that sent the US Dollar higher across the board after US Nonfarm Payrolls (NFP) figures widely outran expectations.
Canada’s Ivey Purchasing Manager’s Index (PMI) recovered in September, but the Canadian datapoint was swept aside by investors fully focused on US payrolls data. US NFP net job additions came in well above expectations in September, with upside revisions to several month’s of jobs figures. The rapid shift in the market’s outlook of the US labor market has widely shifted rate market bets of November’s Federal Reserve (Fed) rate cut.
Daily digest market movers
- The Canadian Dollar lost a scant one-fifth of one percent against the Greenback on Friday.
- Canada’s Ivey PMI for September recovered ground, climbing back into 54.9 after dipping to 50.3 the month prior.
- US NFP jobs data came in wildly above expectations, adding 254K net new job additions in September compared to the forecast 140K. August’s NFP print was also revised upwards to 159K.
- The US Unemployment Rate also ticked down to 4.1% from the previous 4.2%, further burying market hopes for a follow-up double rate cut from the Fed in November.
- According to the CME’s FedWatch Tool, rate traders now see an overwhelming 95% chance of a single 25 bps cut from the Fed on November 7, with a particularly beleaguered 5% expecting no movement at all.
- Hopes for a second 50 bps rate cut in November have entirely evaporated.
Canadian Dollar price forecast
The USD/CAD pair has been grinding higher over the past few sessions, with the pair finding itself at a critical juncture near the 50-day (1.3584) and 200-day (1.3602) Exponential Moving Averages (EMA). After a sustained downtrend from mid-August to early September, the pair has shown signs of stabilization, rebounding off the 1.3450 level.
This recent price action signals that USD/CAD could be testing the upper boundaries of its consolidation range, with potential resistance near the 1.3600 handle. While the pair remains below both the 50-day and 200-day EMAs, the proximity of these moving averages suggests a zone of significant technical resistance. A break above these levels could open the door for further gains, targeting the 1.3700 level.
On the downside, the pair appears to have found support around 1.3450, a key level that has acted as a floor in recent trading. A failure to hold above this level may lead to renewed selling pressure, potentially driving the pair back to the 1.3350 region.
USD/CAD daily chart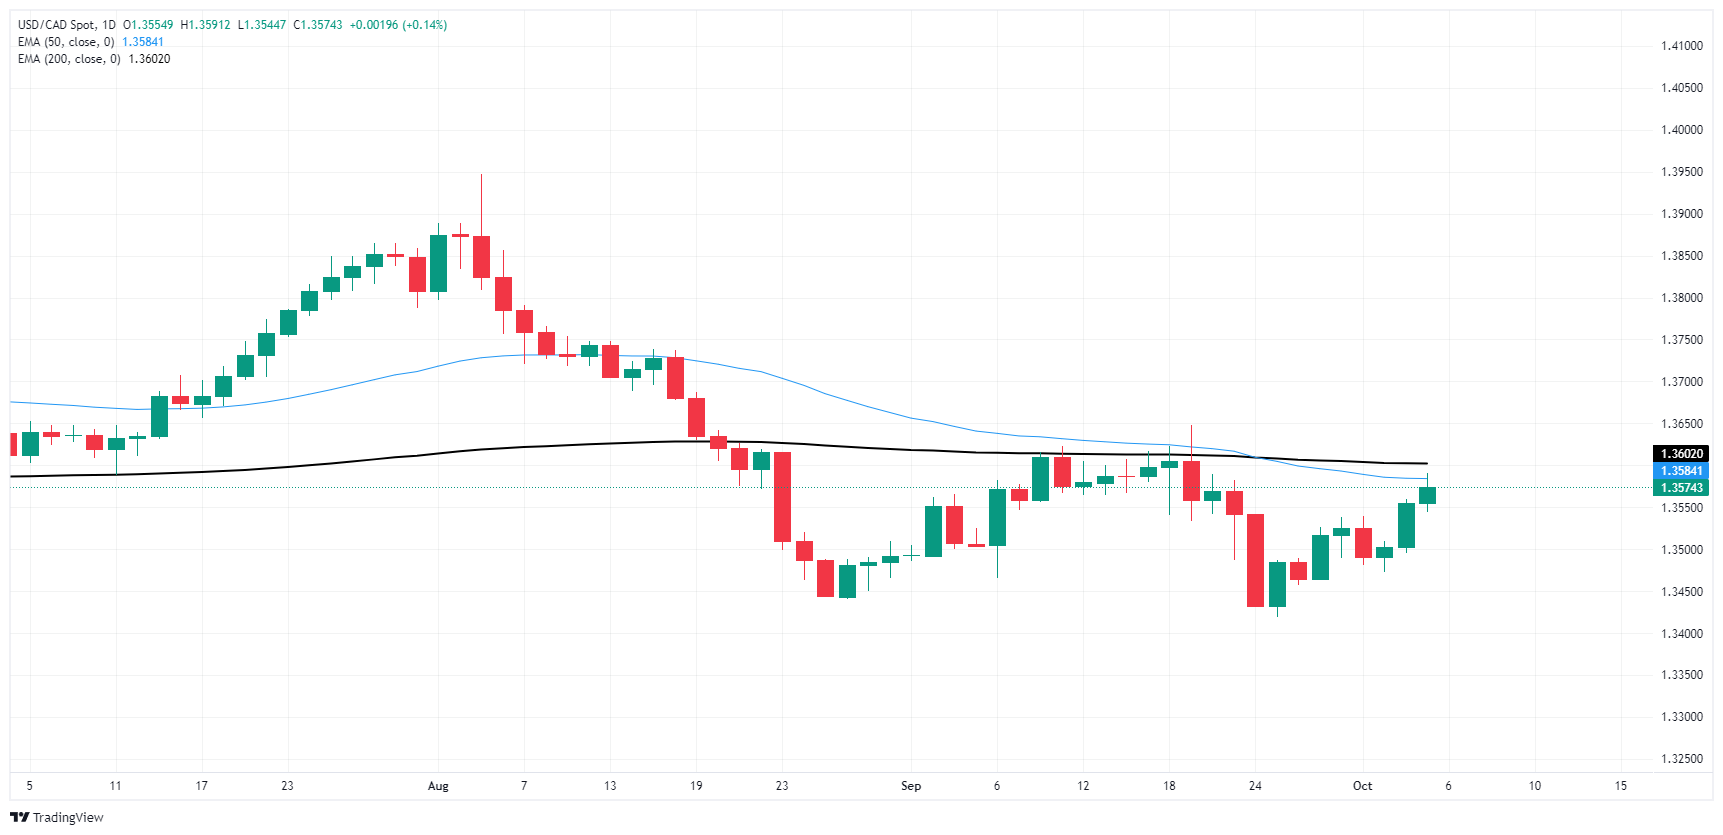
Canadian Dollar FAQs
The key factors driving the Canadian Dollar (CAD) are the level of interest rates set by the Bank of Canada (BoC), the price of Oil, Canada’s largest export, the health of its economy, inflation and the Trade Balance, which is the difference between the value of Canada’s exports versus its imports. Other factors include market sentiment – whether investors are taking on more risky assets (risk-on) or seeking safe-havens (risk-off) – with risk-on being CAD-positive. As its largest trading partner, the health of the US economy is also a key factor influencing the Canadian Dollar.
The Bank of Canada (BoC) has a significant influence on the Canadian Dollar by setting the level of interest rates that banks can lend to one another. This influences the level of interest rates for everyone. The main goal of the BoC is to maintain inflation at 1-3% by adjusting interest rates up or down. Relatively higher interest rates tend to be positive for the CAD. The Bank of Canada can also use quantitative easing and tightening to influence credit conditions, with the former CAD-negative and the latter CAD-positive.
The price of Oil is a key factor impacting the value of the Canadian Dollar. Petroleum is Canada’s biggest export, so Oil price tends to have an immediate impact on the CAD value. Generally, if Oil price rises CAD also goes up, as aggregate demand for the currency increases. The opposite is the case if the price of Oil falls. Higher Oil prices also tend to result in a greater likelihood of a positive Trade Balance, which is also supportive of the CAD.
While inflation had always traditionally been thought of as a negative factor for a currency since it lowers the value of money, the opposite has actually been the case in modern times with the relaxation of cross-border capital controls. Higher inflation tends to lead central banks to put up interest rates which attracts more capital inflows from global investors seeking a lucrative place to keep their money. This increases demand for the local currency, which in Canada’s case is the Canadian Dollar.
Macroeconomic data releases gauge the health of the economy and can have an impact on the Canadian Dollar. Indicators such as GDP, Manufacturing and Services PMIs, employment, and consumer sentiment surveys can all influence the direction of the CAD. A strong economy is good for the Canadian Dollar. Not only does it attract more foreign investment but it may encourage the Bank of Canada to put up interest rates, leading to a stronger currency. If economic data is weak, however, the CAD is likely to fall.
- The Dow Jones recovered ground on NFP Friday, but still remains down on the week..
- The US added far more jobs than expected in September.
- Market hopes for a follow-up jumbo cut from the Fed have collapsed.
The Dow Jones Industrial Average (DJIA) rallied after US Nonfarm Payrolls (NFP) jobs figures blew past expectations. US NFP net job gains soared to 254K on Friday, cudgeling market hopes for a second double-wide rate cut from the Federal Reserve (Fed) on November 7.
The US Unemployment Rate dropped back to 4.1% from the previous 4.2%, further reinforcing a healthier-than-expected landscape in the US labor market. In addition, several months’ worth of NFP releases saw healthy upside revisions. August’s previous NFP total was lifted by an additional 17K, while July’s figure rose sharply by 55K, bringing the total up to 144K.
Annual wage growth also firmed up in September, rising 4.0% YoY from the previous 3.9%. Investors had expected September’s Average Hourly Earnings growth to ease back to 3.8%. With wages and net jobs additions blowing well past expectations across the board, rate market expectations of a higher pace of rate cuts have taken a huge hit to round out a middling-at-best trading week.
According to the CME’s FedWatch Tool, rate trader expectations for the Fed’s November rate call plummeted post-NFP; rate futures speculators now see a 95% chance that the Fed will trim rates by a modest 25 bps on November 7, with the last 5% betting on no movement at all on the Fed funds rate.
Dow Jones news
Despite a moderate recovery after a bumper NFP print, the Dow Jones only saw a tempered rally. The index broadly rallied on reaction to US jobs figures, rising nearly 400 points bottom-to-top, but the index has settled to a more reasonable 200-point gain.
Two-thirds of the Dow Jones’ constituent securities rose on Friday, led by JPMorgan Chase (JPM). JPMorgan rallied 3% on the day, climbing over $210 per share. On the low side, Home Depot (HD) backslid 1% to $407 per share.
In other stock news, Amazon (AMZN) rose nearly 2% on Friday, clipping into $185 per share on the back of upbeat jobs data and the rapid resolution of the East Coast dock worker’s strike.
Dow Jones price forecast
The Dow Jones is on an upward trajectory overall, nearing a crucial resistance level while technical indicators suggest positive momentum in the market. The index is currently hovering around 42,200, a point at which it has previously encountered selling pressure. traders are watching to see whether the Dow can surpass this resistance, a move that could open the door to further advances in the short term.
Despite the overall positive trend, recent price movements reflect uncertainty. Daily candles have been switching between bullish and bearish, indicating that the market is taking a pause as it tests the resistance level.
"We are currently at a critical juncture in the market. A clean breakout above this resistance might generate renewed buying interest," remarked one technical analyst. "However, if the Dow fails to overcome this level, we may witness a retreat toward the moving averages."
Dow Jones daily chart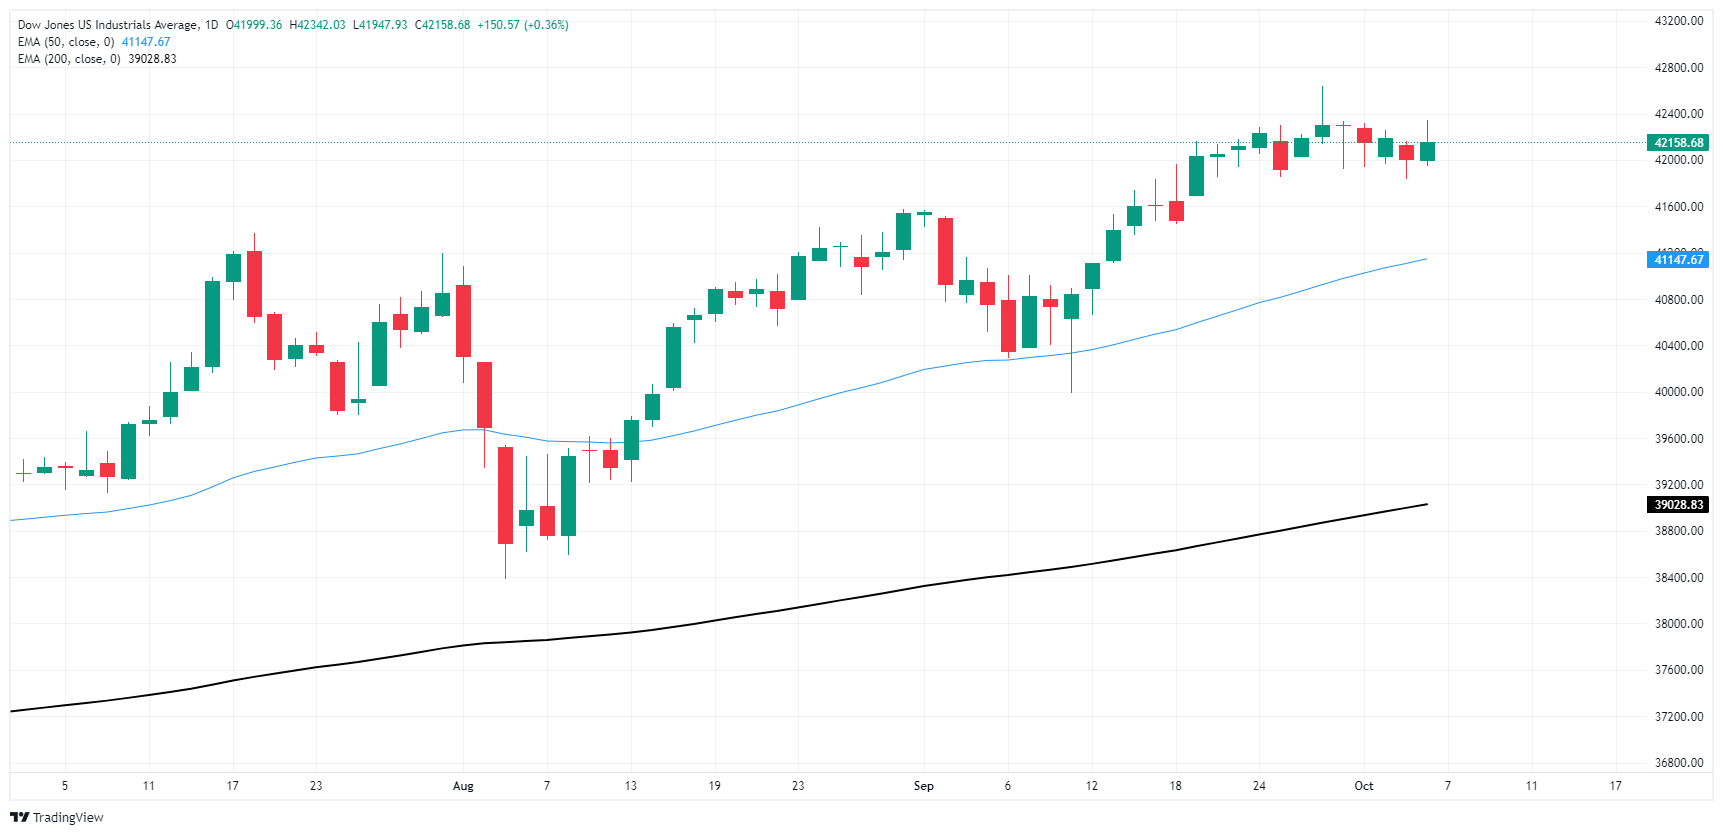
Dow Jones FAQs
The Dow Jones Industrial Average, one of the oldest stock market indices in the world, is compiled of the 30 most traded stocks in the US. The index is price-weighted rather than weighted by capitalization. It is calculated by summing the prices of the constituent stocks and dividing them by a factor, currently 0.152. The index was founded by Charles Dow, who also founded the Wall Street Journal. In later years it has been criticized for not being broadly representative enough because it only tracks 30 conglomerates, unlike broader indices such as the S&P 500.
Many different factors drive the Dow Jones Industrial Average (DJIA). The aggregate performance of the component companies revealed in quarterly company earnings reports is the main one. US and global macroeconomic data also contributes as it impacts on investor sentiment. The level of interest rates, set by the Federal Reserve (Fed), also influences the DJIA as it affects the cost of credit, on which many corporations are heavily reliant. Therefore, inflation can be a major driver as well as other metrics which impact the Fed decisions.
Dow Theory is a method for identifying the primary trend of the stock market developed by Charles Dow. A key step is to compare the direction of the Dow Jones Industrial Average (DJIA) and the Dow Jones Transportation Average (DJTA) and only follow trends where both are moving in the same direction. Volume is a confirmatory criteria. The theory uses elements of peak and trough analysis. Dow’s theory posits three trend phases: accumulation, when smart money starts buying or selling; public participation, when the wider public joins in; and distribution, when the smart money exits.
There are a number of ways to trade the DJIA. One is to use ETFs which allow investors to trade the DJIA as a single security, rather than having to buy shares in all 30 constituent companies. A leading example is the SPDR Dow Jones Industrial Average ETF (DIA). DJIA futures contracts enable traders to speculate on the future value of the index and Options provide the right, but not the obligation, to buy or sell the index at a predetermined price in the future. Mutual funds enable investors to buy a share of a diversified portfolio of DJIA stocks thus providing exposure to the overall index.
- Gold drops after robust US jobs report lowers pressure on the Fed.
- US 10-year T-note yield climbs to 3.971%, while the US Dollar Index hits mid-August highs at 102.58, capping Gold’s rise.
- Geopolitical risks involving Israel and Iran to support Gold, which could hit $2,700.
Gold price retraces after a stronger-than-expected US jobs report hinted that the labor market remains solid and that the Federal Reserve (Fed) will likely ease policy in 25-basis-point (bps) chunks. At the time of writing, the XAU/USD trades at $2,643, down 0.40%.
The US Bureau of Labor Statistics (BLS) revealed that the labor market is far from being in a tough spot following an outstanding September jobs report. The data reduced the pressure on the Fed, which reduced borrowing costs by 0.50% at the September meeting, amid fears of achieving the US central bank maximum employment mandate.
The Unemployment Rate ticked two tenths lower, while Average Hourly Earnings were mixed, with monthly readings decreasing, while in the 12 months to September it rose.
Traders reacted to the data, lifting the US 10-year T-note yield 12 basis points to 3.971%, a level last seen in mid-August 2024. That was one of the reasons that capped Gold prices. The US Dollar Index (DXY), which tracks the Greenback’s value against a basket of six peers, also hit its highest level since mid-August at 102.58, up 0.63%.
The data locked in a 25 bps rate cut by the US central bank at the upcoming November meeting. In fact, a minimal percentage of investors project the Fed will hold rates unchanged.
Next week, the US docket will feature the release of inflation data, jobless claims and University of Michigan Consumer Sentiment.
Chicago Fed President Austan Goolsbee, not a voter in 2024 but one of the most dovish members at the Federal Open Market Committee (FOMC), said that more reports like this “will make me more confident we are settling in at full employment.” He said most Fed officials expect rates to decrease “a lot” over the next 18 months.
Meanwhile, geopolitics will continue to cap the fall in Bullion prices. An escalation of the conflict involving Hezbollah, Iran, Israel and the United States (US) would underpin XAU/USD prices and open the door to challenge $2,700.
Daily digest market movers: Gold price falls amid fading US recession fears
- US Nonfarm Payrolls increased by 254K in September, surpassing the estimated 140K and the upwardly revised August figure of 159K. The Unemployment Rate decreased from 4.2% to 4.1%, lower than expected.
- Average Hourly Earnings in September rose 0.4% MoM, down from 0.5% the previous month but exceeded forecasts of 0.3%.
- Earnings per hour increased by 4% in the 12 months to September, above estimates and August’s number, which was 3.8% and 3.9%, respectively.
- Market participants have disregarded a 50 bps cut from the Fed. The odds of a 25 bps cut are 95%, while the chances for holding rates unchanged are at 5%, according to the CME FedWatch Tool data.
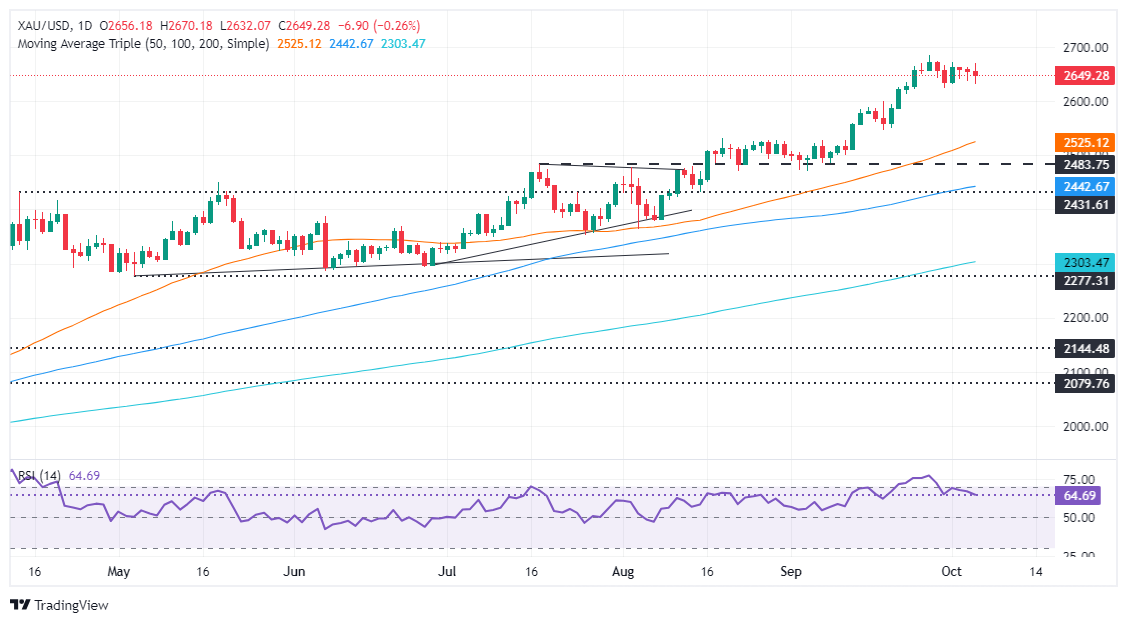
XAU/USD technical analysis: Gold price drops below $2,650, eyeing key technical level below $2,600
Gold's price consolidated near $2,640-$2,670 for the fifth straight day after the Relative Strength Index (RSI) exited overbought territory. Price action remains range-bound while buyers lose momentum, opening the door for a pullback.
If XAU/USD achieves a daily close below $2,650, look for a drop toward the September 18 high turned support at $2,600. Once surrendered, the next demand area would be the 50-day Simple Moving Average (SMA) at $2,524.
Conversely, for a bullish continuation, the XAU/USD needs to clear $2,670 to have the chance to challenge the year-to-date high of $2,685. Up next will be the $2,700 mark.
Gold FAQs
Gold has played a key role in human’s history as it has been widely used as a store of value and medium of exchange. Currently, apart from its shine and usage for jewelry, the precious metal is widely seen as a safe-haven asset, meaning that it is considered a good investment during turbulent times. Gold is also widely seen as a hedge against inflation and against depreciating currencies as it doesn’t rely on any specific issuer or government.
Central banks are the biggest Gold holders. In their aim to support their currencies in turbulent times, central banks tend to diversify their reserves and buy Gold to improve the perceived strength of the economy and the currency. High Gold reserves can be a source of trust for a country’s solvency. Central banks added 1,136 tonnes of Gold worth around $70 billion to their reserves in 2022, according to data from the World Gold Council. This is the highest yearly purchase since records began. Central banks from emerging economies such as China, India and Turkey are quickly increasing their Gold reserves.
Gold has an inverse correlation with the US Dollar and US Treasuries, which are both major reserve and safe-haven assets. When the Dollar depreciates, Gold tends to rise, enabling investors and central banks to diversify their assets in turbulent times. Gold is also inversely correlated with risk assets. A rally in the stock market tends to weaken Gold price, while sell-offs in riskier markets tend to favor the precious metal.
The price can move due to a wide range of factors. Geopolitical instability or fears of a deep recession can quickly make Gold price escalate due to its safe-haven status. As a yield-less asset, Gold tends to rise with lower interest rates, while higher cost of money usually weighs down on the yellow metal. Still, most moves depend on how the US Dollar (USD) behaves as the asset is priced in dollars (XAU/USD). A strong Dollar tends to keep the price of Gold controlled, whereas a weaker Dollar is likely to push Gold prices up.
- Mexican Peso rises after strong US Nonfarm Payrolls data for September crushed estimates.
- Mexico’s data showed an uptick in unemployment, while Automobile Exports and Production increased in September.
- US Unemployment Rate edged lower, easing recession fears.
- The Federal Reserve is expected to cut rates by 25 bps in the coming meetings.
The Mexican Peso appreciated against the US Dollar on Friday, sponsored by an outstanding jobs report in the United States (US) that set aside recessionary fears in the largest economy in the world. Meanwhile, market participants seem confident that President Claudia Sheinbaum’s government could be “market-friendly” despite backing controversial measures that could threaten the state of law. The USD/MXN trades at 19.17, down 0.83%.
Sentiment improved as Wall Street rallied after US Nonfarm Payrolls data for September, which crushed estimates and upward revised July and August figures. Consequently, the Unemployment Rate edged lower, a relief for the Federal Reserve, which slashed rates by 50 basis points at the September meeting, due to risks on the employment mandate, tilted to the upside.
This boosted the Greenback against most G8 FX peers but still not against the Peso. The Mexican currency is set to finish the week with gains of over 2%.
Furthermore, traders trimmed the chances of a 50 bps Fed rate cut in November, and they estimate 25 bps in the subsequent four meetings. Bank of America changed its November Fed call from a 50 to 25 bps cut.
Chicago Fed President Austan Goolsbee, not a voter in 2024 but one of the most dovish members at the Federal Open Market Committee (FOMC), said that more reports like this “will make me more confident we are settling in at full employment.” He said most Fed officials expect rates to decrease over the next 18 months.
Across the south of the border, Mexico’s jobs report showed that the Unemployment Rate ticked up in non-seasonally adjusted rate during August. Automobile Exports and Production increased in September, revealed the Instituto Nacional de Estadistica, Geografia e Informatica (INEGI).
Daily digest market movers: Mexican Peso shrugs off bad jobs report as US NFP data improved risk appetite
- Mexico’s Auto Production and Exports rose in September. Auto Production climbed 11.71% from 8.3% in the previous month. Exports grew by 4.8%, up from 1.7% in August.
- Mexico’s Jobless Rate in August hit 3%, higher than July’s 2.9%.
- US Nonfarm Payrolls grew by 254K in September, exceeding estimates of 140K and upward revised figures for August, at 159K. The Unemployment Rate edged lower from 4.2% to 4.1%, less than estimates.
- Banxico’s September poll of analysts and economists revealed that inflation expectations were reviewed to the downside, with headline prices down from 4.69% to 4.48% YoY. Underlying inflation is expected to hit 3.84% from 3.94%.
- The same survey showed the USD/MXN exchange rate is projected to end 2024 at 19.69, while Banxico’s main reference rate is foreseen to end at 10%.
- Mexico’s economy is foreseen to grow by 1.45% in 2024, lower than August’s by 1.57%.
- Market participants have disregarded a Fed 50 bps cut. The odds of a 25-bps cut are 94.9%, while the chances for holding rates unchanged are at 5.1%, according to the CME FedWatch Tool data.
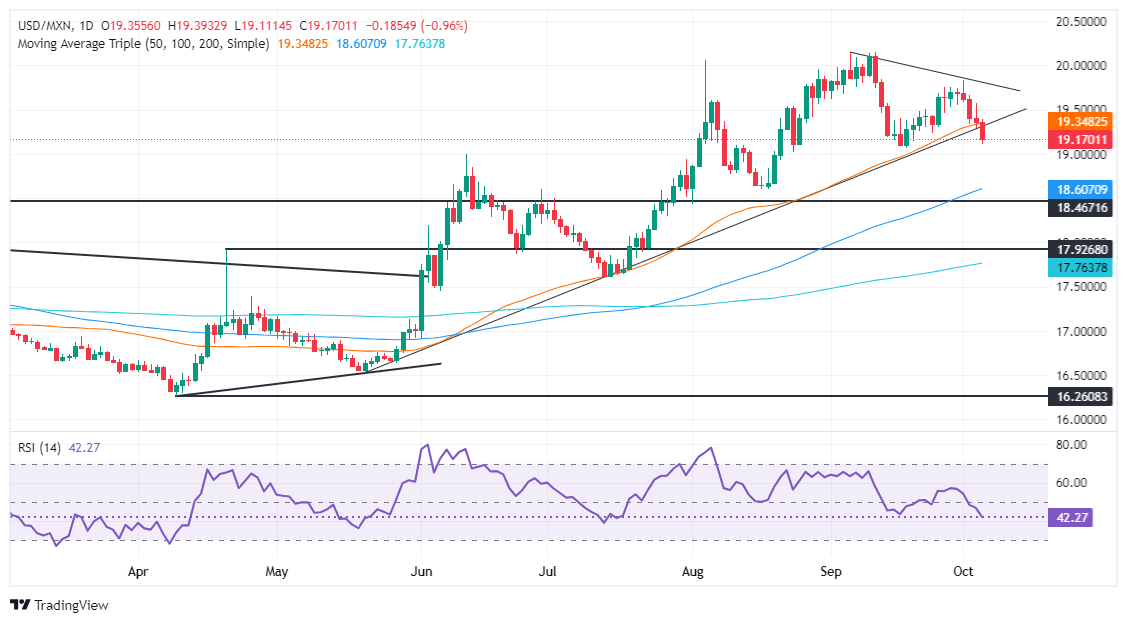
USD/MXN Technical outlook: Mexican Peso rallies as USD/MXN tumbles below 19.20
The USD/MXN uptrend is doubtful as the pair cleared the 50-day Simple Moving Average (SMA) at 19.33, with sellers gathering momentum. The Relative Strength Index (RSI) shifted bearish with an almost vertical slope aiming downwards. Hence, the exotic pair path of least resistance, is tilted to the downside.
That said, the USD/MXN first support would be the 50-day Simple Moving Average (SMA) followed by the September 24 swing low of 19.23. The next floor is the September 18 daily low of 19.06, ahead of the psychological 19.00 figure.
Conversely, for a bullish resumption, the USD/MXN must surpass the 19.50 mark and October’s 1 daily high of 19.82. Once surpassed, the next resistance will be 20.00, followed by the YTD peak of 20.22.
Mexican Peso FAQs
The Mexican Peso (MXN) is the most traded currency among its Latin American peers. Its value is broadly determined by the performance of the Mexican economy, the country’s central bank’s policy, the amount of foreign investment in the country and even the levels of remittances sent by Mexicans who live abroad, particularly in the United States. Geopolitical trends can also move MXN: for example, the process of nearshoring – or the decision by some firms to relocate manufacturing capacity and supply chains closer to their home countries – is also seen as a catalyst for the Mexican currency as the country is considered a key manufacturing hub in the American continent. Another catalyst for MXN is Oil prices as Mexico is a key exporter of the commodity.
The main objective of Mexico’s central bank, also known as Banxico, is to maintain inflation at low and stable levels (at or close to its target of 3%, the midpoint in a tolerance band of between 2% and 4%). To this end, the bank sets an appropriate level of interest rates. When inflation is too high, Banxico will attempt to tame it by raising interest rates, making it more expensive for households and businesses to borrow money, thus cooling demand and the overall economy. Higher interest rates are generally positive for the Mexican Peso (MXN) as they lead to higher yields, making the country a more attractive place for investors. On the contrary, lower interest rates tend to weaken MXN.
Macroeconomic data releases are key to assess the state of the economy and can have an impact on the Mexican Peso (MXN) valuation. A strong Mexican economy, based on high economic growth, low unemployment and high confidence is good for MXN. Not only does it attract more foreign investment but it may encourage the Bank of Mexico (Banxico) to increase interest rates, particularly if this strength comes together with elevated inflation. However, if economic data is weak, MXN is likely to depreciate.
As an emerging-market currency, the Mexican Peso (MXN) tends to strive during risk-on periods, or when investors perceive that broader market risks are low and thus are eager to engage with investments that carry a higher risk. Conversely, MXN tends to weaken at times of market turbulence or economic uncertainty as investors tend to sell higher-risk assets and flee to the more-stable safe havens.
CTAs are 'max long' Gold and Silver, but the margin of safety against algo liquidations in Gold still remains elevated, TDS commodity analyst Daniel Ghali notes.
No directional shorts remain in Gold markets
“This print is the first significant challenge to the consensus narrative that has attracted enough capital for our measures of positioning to scream extreme on several fronts, but liquidations have remained miniscule nonetheless, suggesting geopolitical fears are keeping accounts from liquidating.”
“Contrary to what is implied by price action, the last weeks haven't seen massive inflows into Gold according to our positioning analytics, but rather point to a liquidity vacuum with few sellers up in the stratosphere.”
“After all, money manager shorts are now overwhelmingly tied to EFPs, suggesting nearly no directional shorts remain in Gold markets. Conversely, Silver prices have a smaller margin of safety against the first selling program, but in the event that nascent signs of reflationary trends persist, Silver and base metals are a superior expression.”
In an interview at Bloomberg, Chicago Federal Reserve Bank President Austan Goolsbee said on Friday that he considered the latest job market report to be "superb" and noted that additional reports like this would increase his confidence that the US economy has reached full employment with low inflation.
Key Takeaways
Do not want to react too much to one data point.
If we get more job reports like this, I’ll be more confident we are settling in at full employment.
Strong job reports are likely to mean strong GDP growth.
A large majority of Fed policymakers feel rates are going to come down a lot over the next year-18 months.
You got to be careful keeping rates as restrictive as they are.
There are some signs inflation might undershoot target.
We are still a way off from having to sort out where neutral rate is.
A broad set of data shoes the labour market is cooling.
If productivity keeps booming, that implies higher growth, higher neutral rate.
After the disappointing data of late, the situation on the US labor market improved markedly again in September. At the same time, the unemployment rate fell to 4.1%. Of course, individual monthly figures should not be overstated. But this report should ease concerns that the US economy is on the verge of a recession, Commerzbank’s Senior Economist Dr. Christoph Balz notes.
US economy to avoid a recession
“After several disappointing employment reports, the data for September were surprisingly favorable. The number of jobs rose sharply, and revisions to the data showed that the situation in previous months was better than feared. All sectors expanded, except for manufacturing and transportation. At the same time, the unemployment rate fell, with even the broadest measure of underemployment, which includes, among others, involuntary part-time workers, falling from 7.9% to 7.7%. In addition, wages rose more sharply again, with the increase in August also being revised upwards. The only weak point is that employees worked shorter hours on average.”
“The employment figures are based on a sample of selected companies rather than a full survey of all companies. They can therefore fluctuate sharply from month to month. Accordingly, individual monthly values should not be over-interpreted. Just as the last reports probably presented the situation as too bad, today's figures could be ‘too good’. The six-month average is likely to be more meaningful. It continues to show a slight weakening. However, there is no sign of an imminent slump. Rather, significant employment gains and rising wages suggest that private consumption will continue to support GDP growth. We continue to expect the US economy to avoid a recession.”
“After the 50bp rate cut in September, the question now is whether the US Federal Reserve will maintain this pace in November or whether there will be ‘only’ a 25bp move. The labor market will presumably play the decisive role here, as the Fed does not want to see any further weakening here. However, there is little sign of such a weakening in today's figures. Today's report rather supports our forecast of a ‘small’ step. However, another employment report will be published before the next meeting, along with consumer prices and quarterly employment costs.”
- USD/CAD rises sharply to near 1.3600 after stronger-than-expected US labor market report.
- A robust pace in the US job growth data has forced traders to pare Fed’s 50 bps rate cut expectations.
- Higher Oil prices have strengthened the Canadian Dollar.
The USD/CAD pair climbs to near the round-level resistance of 1.3600 in Friday’s New York session. The Loonie asset strengthens as the United States (US) Nonfarm Payrolls (NFP) report showed that labor demand remained robust and the wage growth accelerated in September, which has prompted a sharp upside move in the US Dollar (USD).
The US NFP report showed that the economy added 254K jobs, which was significantly higher than the estimates of 140K and the former release of 159K, upwardly revised from 142K. The Unemployment Rate decelerated to 4.1% from expectations and the August print of 4.2%. Annual Average Hourly Earnings, a key measure to wage growth, accelerated at a faster-than-expected pace to 4.0%. Month-on-month wage growth measure rose by 0.4%.
Signs of a sharp improvement in the labor market health have dented market expectations for the Federal Reserve (Fed) to deliver another larger-than-usual interest rate cut of 50 basis points (bps) in November. According to the CME FedWatch tool, the probability of the Fed reducing interest rates by a half-of-a-percentage in November has almost waned. The Fed started the policy-easing cycle with a 50-bps interest rate cut in September.
Fading Fed large rate cut expectations have led to a sharp uptick in the US Dollar, with the US Dollar Index (DXY) rising to a fresh two-week high above 102.50. 10-year US Treasury yields surge to near 3.96%.
Meanwhile, the Canadian Dollar (CAD) is also outperforming the majority of its peers due to a sharp surge in the Oil price. A full-fledged war between Iran and Israel has deepened fears of Oil supply remaining tight. It is worth noting that Canada is the leading exporter of Oil to the US, therefore, higher Oil prices strengthen the CAD.
US Dollar FAQs
The US Dollar (USD) is the official currency of the United States of America, and the ‘de facto’ currency of a significant number of other countries where it is found in circulation alongside local notes. It is the most heavily traded currency in the world, accounting for over 88% of all global foreign exchange turnover, or an average of $6.6 trillion in transactions per day, according to data from 2022. Following the second world war, the USD took over from the British Pound as the world’s reserve currency. For most of its history, the US Dollar was backed by Gold, until the Bretton Woods Agreement in 1971 when the Gold Standard went away.
The most important single factor impacting on the value of the US Dollar is monetary policy, which is shaped by the Federal Reserve (Fed). The Fed has two mandates: to achieve price stability (control inflation) and foster full employment. Its primary tool to achieve these two goals is by adjusting interest rates. When prices are rising too quickly and inflation is above the Fed’s 2% target, the Fed will raise rates, which helps the USD value. When inflation falls below 2% or the Unemployment Rate is too high, the Fed may lower interest rates, which weighs on the Greenback.
In extreme situations, the Federal Reserve can also print more Dollars and enact quantitative easing (QE). QE is the process by which the Fed substantially increases the flow of credit in a stuck financial system. It is a non-standard policy measure used when credit has dried up because banks will not lend to each other (out of the fear of counterparty default). It is a last resort when simply lowering interest rates is unlikely to achieve the necessary result. It was the Fed’s weapon of choice to combat the credit crunch that occurred during the Great Financial Crisis in 2008. It involves the Fed printing more Dollars and using them to buy US government bonds predominantly from financial institutions. QE usually leads to a weaker US Dollar.
Quantitative tightening (QT) is the reverse process whereby the Federal Reserve stops buying bonds from financial institutions and does not reinvest the principal from the bonds it holds maturing in new purchases. It is usually positive for the US Dollar.
- EUR/GBP has pulled back to key support after rallying sharply on Thursday.
- The pair has probably changed trend but a break above the October 3 high would confirm a bullish reversal.
EUR/GBP pulls back down to the base of its multi-month range at 0.8380 after shooting higher on Thursday, October 3, as a result of comments made by the Governor of the Bank of England (BoE) Andrew Bailey.
The pair has probably reversed its prior downtrending bias and is now starting a new short-term uptrend, however, a break above the October 3 high of 0.8434 would provide confirmation of such a reversal, and a probable extension higher thereafter.
EUR/GBP Daily Chart
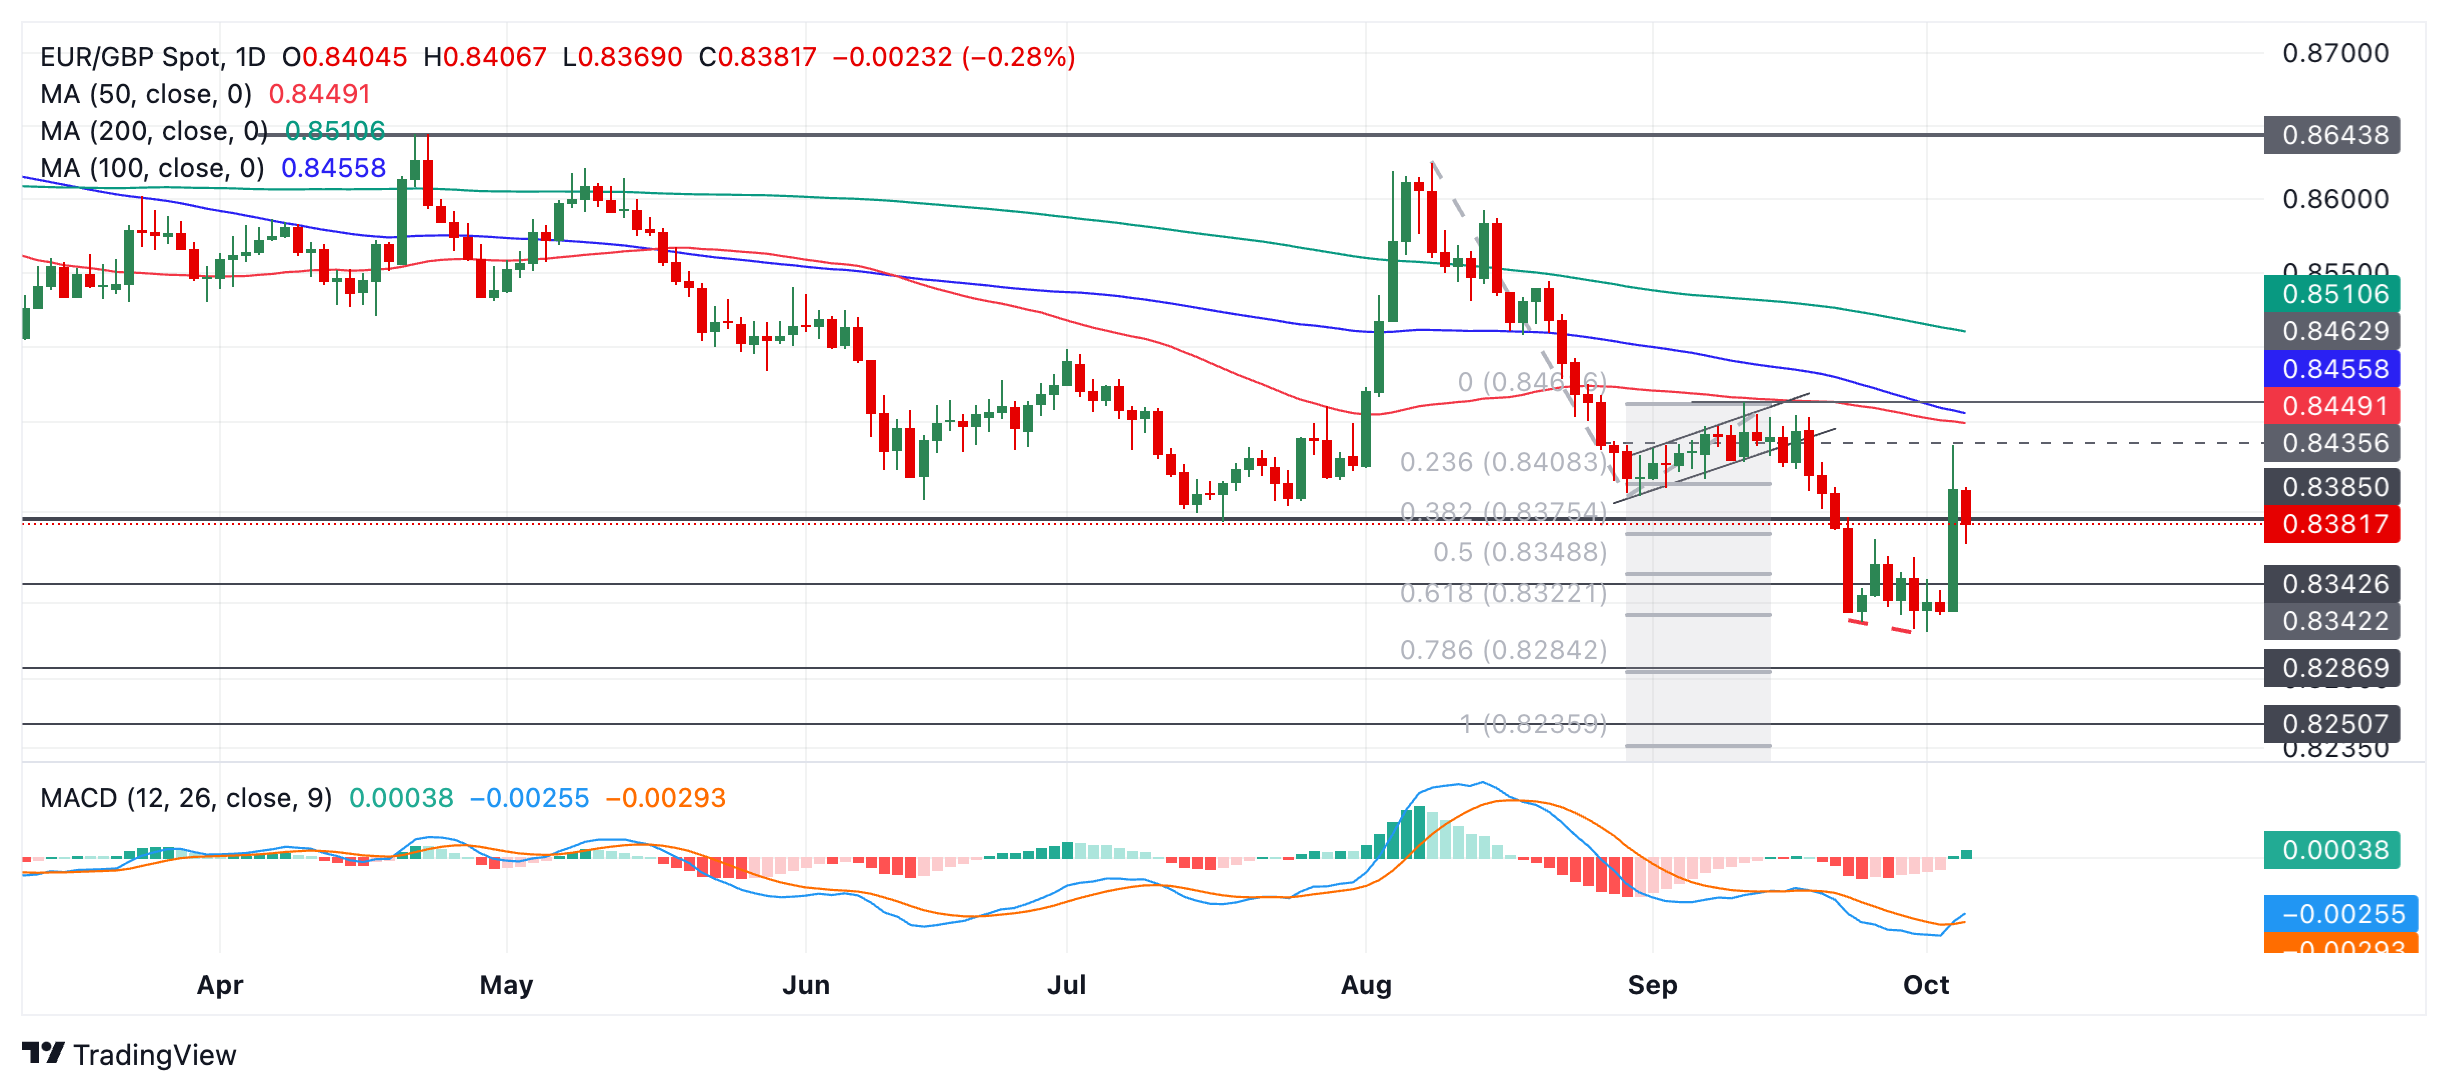
Assuming a bullish scenario, EUR/GBP will probably reach the key resistance level at the cluster of Moving Averages in the 0.8450s, as well as the high of the consolidation channel. The next target above that is the green 200-day Simple Moving Average (SMA) at 0.8510.
The blue Moving Average Convergence Divergence (MACD) momentum indicator has crossed above its red signal line, further signaling a probable change in the trend.
It would require a break below 0.8311 and the October 1 lows to reconfirm bearish bets and suggest the medium-term bear trend was reasserting itself. Such a move would then be expected to fall to the next downside target at 0.8284 (Fibonacci 78.6% extrapolation of the August decline) followed by 0.8236 (100% extrapolation of the same decline).
We now expect more aggressive rate cuts from the RBNZ with growth under pressure. We see two 50bps cuts in Q4-2024, taking the OCR to 4.25% (4.75% prior) by end-2024. We maintain our view for 125bps of cuts in 2025, and see the OCR at 3% by end-2025 (3.5% prior). The RBNZ’s concerns are now shifting towards growth, as inflation is expected to decline further, Standard Chartered’s macro analysts Bader Al Sarraf and Nicholas Chia note.
The Overton Window has gravitated towards a 50bps cuts
“We now expect the Reserve Bank of New Zealand (RBNZ) to cut the Official Cash Rate by 50bps each in back-to-back meetings in October and November. This takes our end-2024 OCR forecast to 4.25% (4.75% prior). Inflation is now well-positioned to edge down within the 1-3% target band in coming prints. But, more importantly, the growth backdrop remains sluggish.
“We think this necessitates an aggressive RBNZ stance, as front-loading cuts would reduce the risk of prolonged economic malaise. Accordingly, our end-2025 OCR now shifts to 3.0% (3.5% prior). This sets a shorter and sharper path to neutral OCR, estimated between 3-3.5% by the RBNZ. We think the balance of risks is skewed towards more aggressive easing by the RBNZ, as poor economic momentum translates to a negative output gap, which exerts downward pressure on inflation.”
“The RBNZ will likely emphasise the importance of acting swiftly to provide much-needed relief, as further delays could result in deeper economic contractions. Governor Orr acknowledged during the August meeting press conference that the committee discussed 50bps to start the easing cycle, but 25bps was seen as the consensus at the time. This was deemed a “low-risk start” by the RBNZ, further supporting the argument of shifting to 50bps cuts. We think the evolution of data since makes it easier for the RBNZ to justify shifting to 50bps cuts, as was the case in historical policy easing cycles.”
- GBP/CAD has declined sharply within a rising channel.
- The pair is likely to continue lower as the counter-trend reaction runs its course.
GBP/CAD is unfolding a down leg within a rising channel. It will probably continue lower to at least the blue 100-day Simple Moving Average (SMA) at 1.7641. A break below the 1.7720 October 3 low would cement bearish bets.
The pair is in a short-term downtrend and given the principle that “the trend is your friend” the odds favor a continuation of that trend.
GBP/CAD Daily Chart
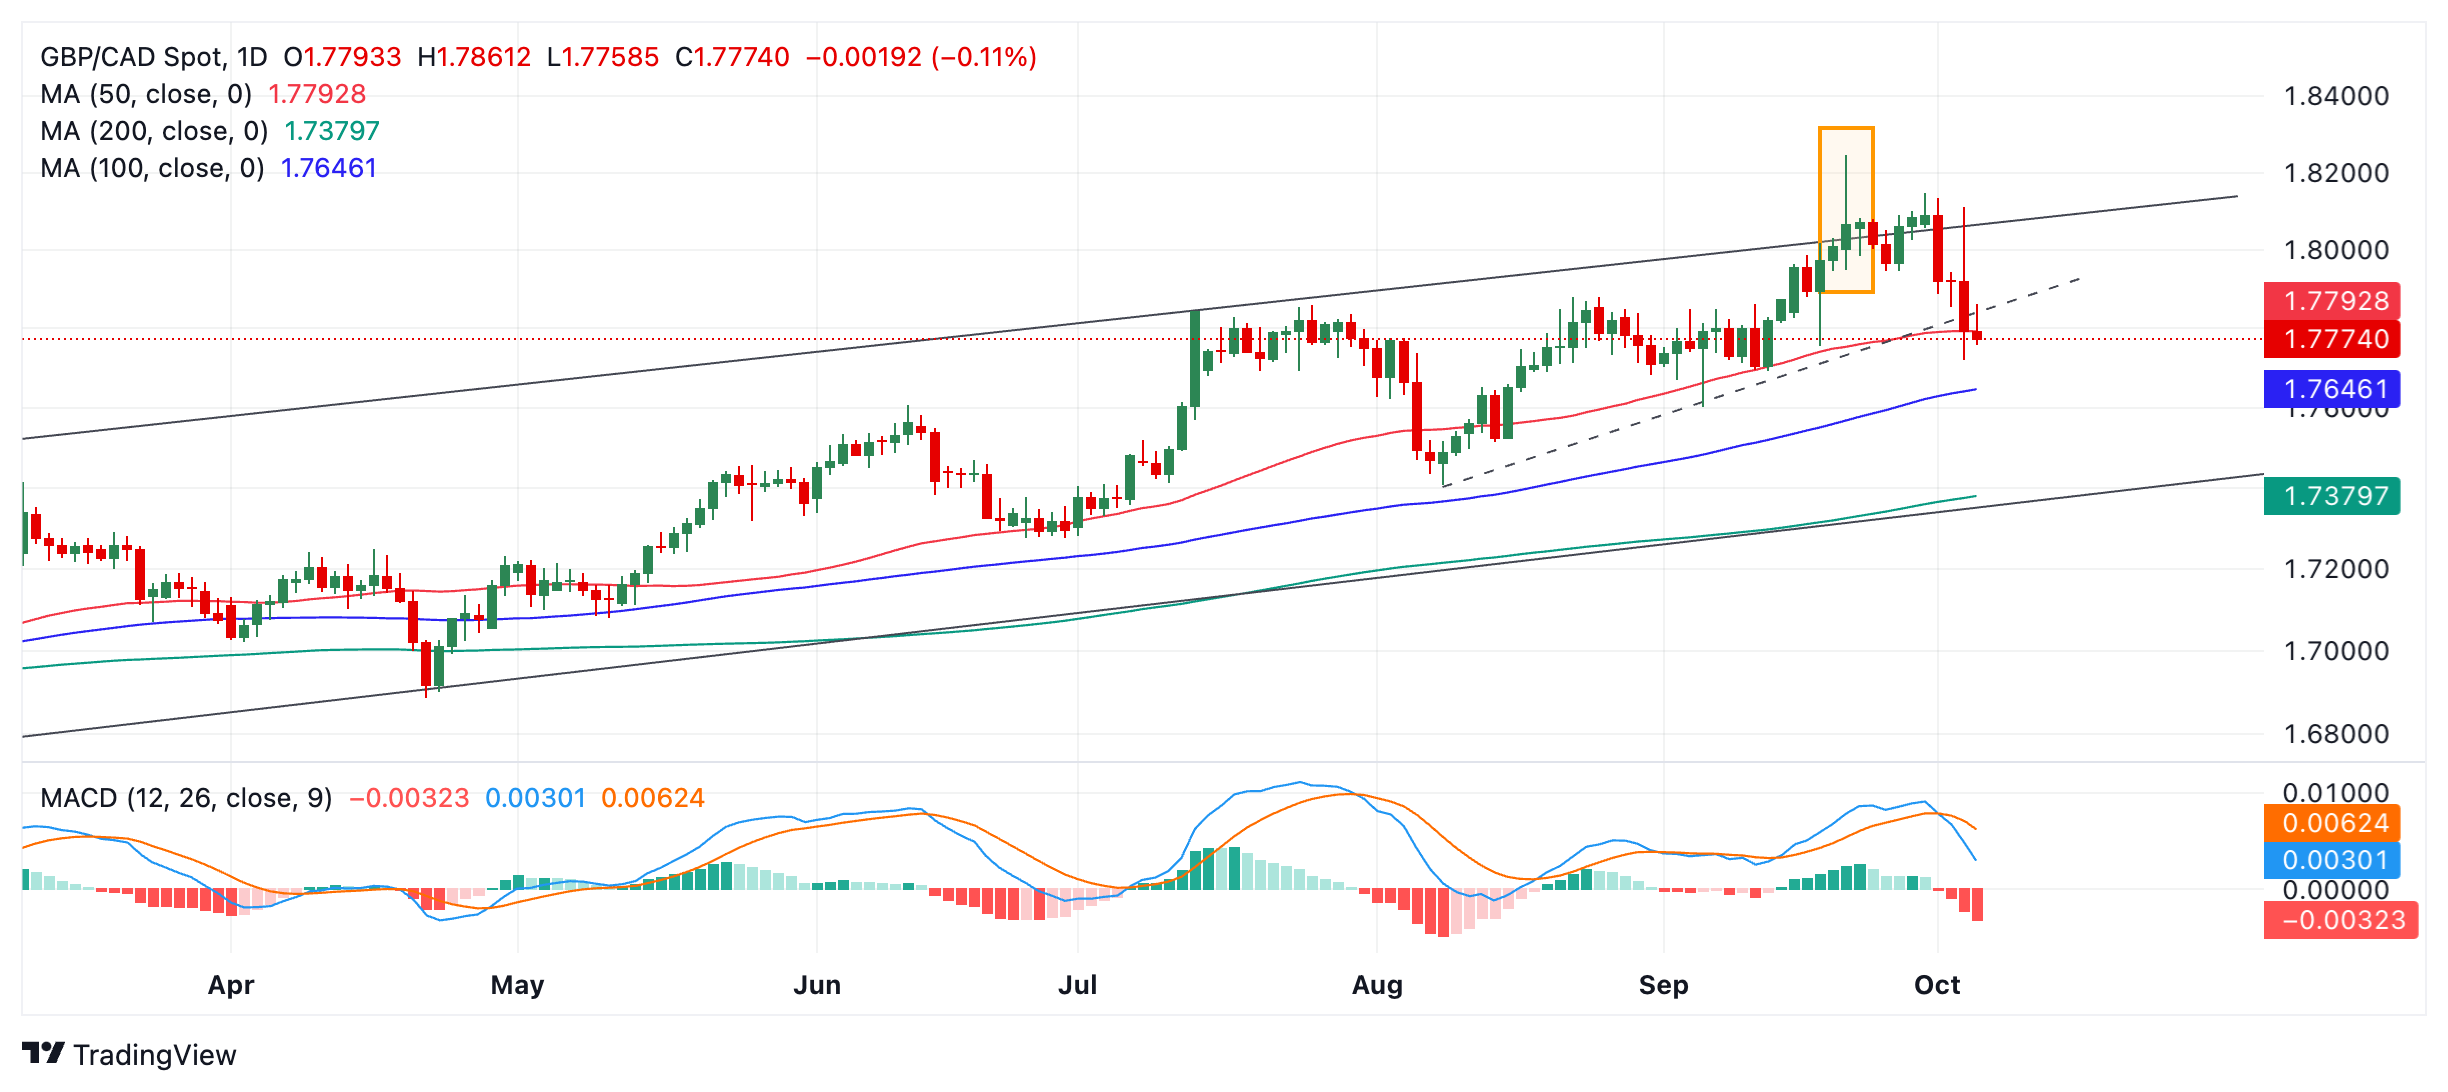
Subsequent downside targets lie at 1.7603 (September 4 low) and 1.7407 (August 8 low). In the most bearish scenario price could fall to the lower channel line at 1.7375.
That said, short-holders are advised to exercise caution as GBP/CAD is in an uptrend on the medium and long-term timeframes, as it oscillates higher within an ascending channel. There is a risk, therefore, of a reversal higher occurring unless the current sell-off marks the beginning of a deeper downtrend. This is possible given its steepness.
The Moving Average Divergence Convergence (MACD) has crossed sharply below its signal line providing added bearish confirmation.
The formation of a bearish Shooting Star Japanese candlestick reversal pattern on September 20 (orange rectangle on chart above) gave the first signs of weakness. It then consolidated for a while before starting to fall properly on October 1.
- USD/CHF breaks out of the range it has been straight-jacketed in for weeks.
- The pair has probably started a new uptrend with odds now favoring the acquisition of bullish targets.
USD/CHF decisively breaks out of the top of its multi-week range, probably ending its protracted sideways market trend. A close clearly above 0.8540 and the range ceiling would cement bullish expectations.
The move means the pair has probably changed its short-term trend from range-bound to bullish, and since it is a fundamental principle of technical analysis that “the trend is your friend” the odds favor a continuation higher.
USD/CHF 4-hour Chart
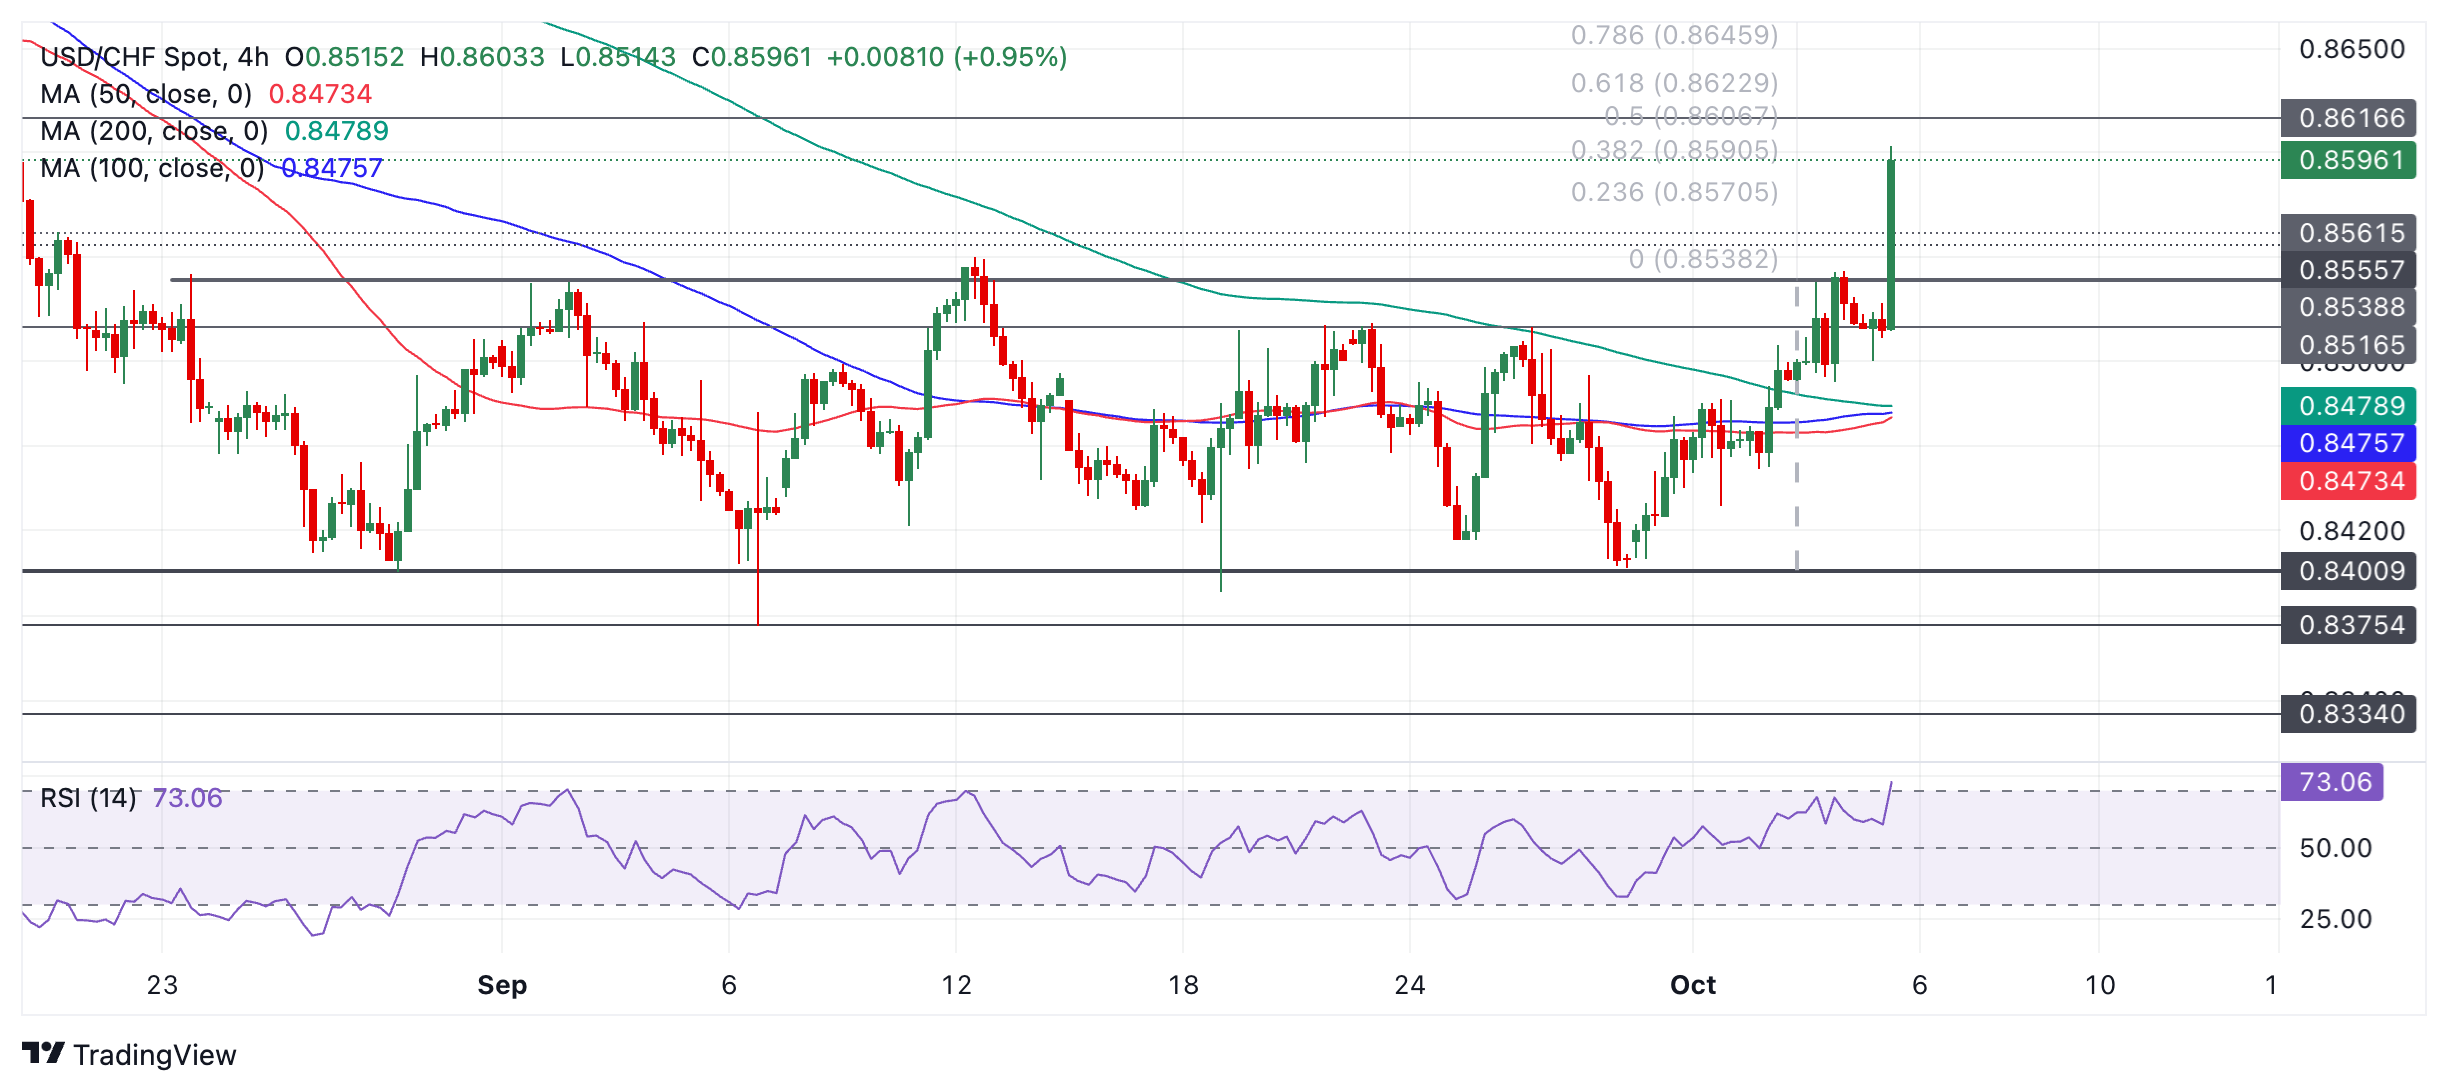
USD/CHF is now likely to reach an upside target at a minimum of 0.8617 (August 14 swing low), or 0.8622 (Fibonacci 61.8% extrapolation of the height of the range higher). A really bullish move could reach 0.8675, the 100% extrapolation of the height of the range.
- USD/JPY breaks above a critical level and extends its bullish advance.
- Bullish momentum could signal an extension.
- Alternatively it may have completed a three-wave correction which could eventually roll over.
USD/JPY breaks clearly above the 147.24 October 3 high on an intraday basis which suggests a continuation of the short-term uptrend with a tentative target at 149.40, the August 15 high.
USD/JPY Daily Chart
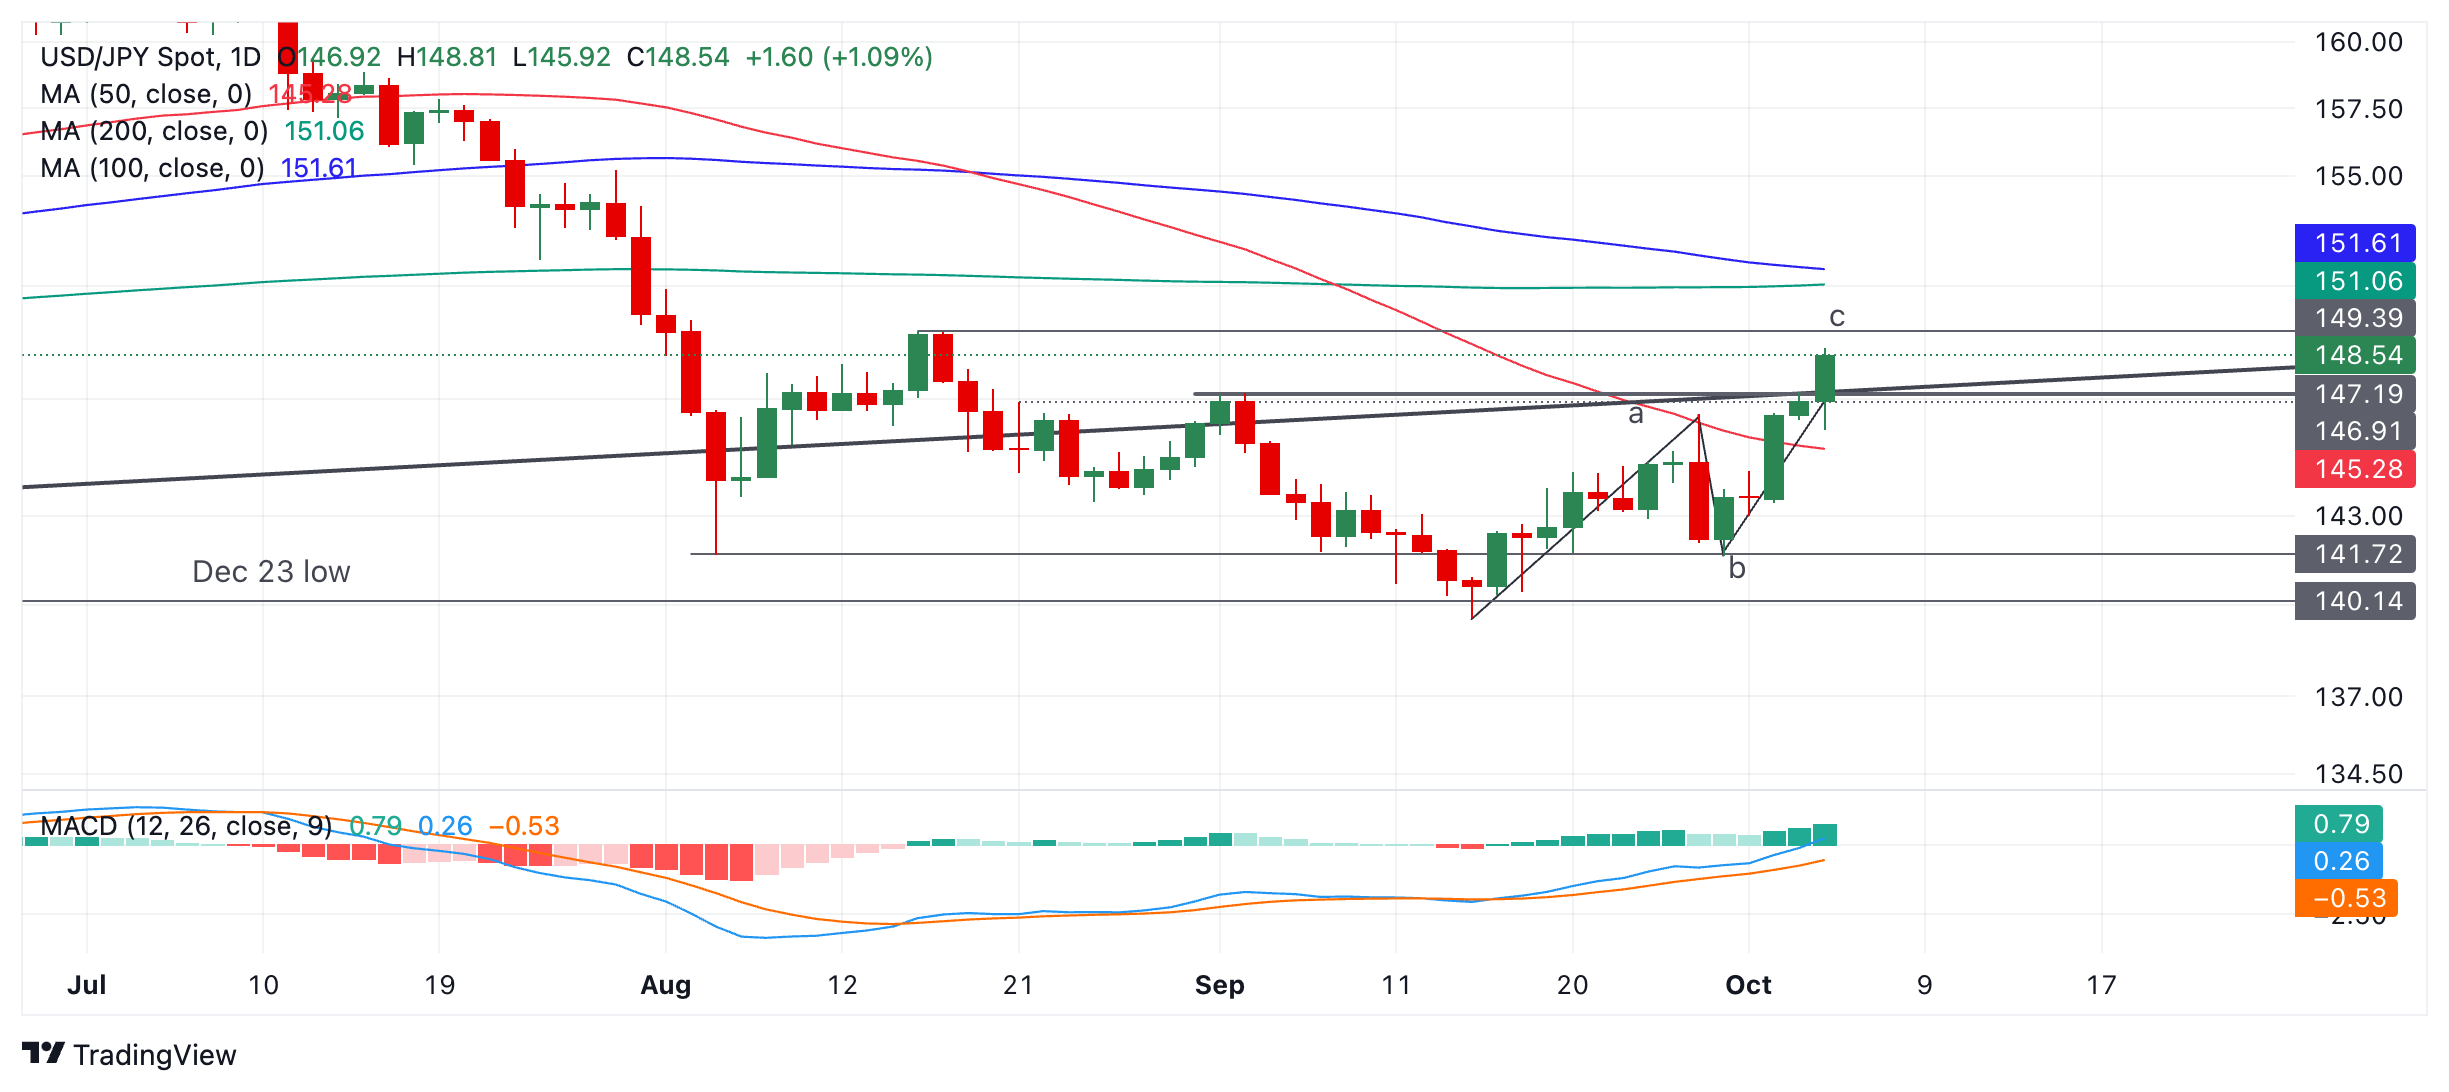
The strong bullish momentum since the August bottom, as measured by the Moving Average Convergence Divergence (MACD) indicator could indicate the start of a new, longer uptrending move.
In addition, the robust recovery from the December ‘23 and September lows – which has taken price back above the major trendline for two days and the key September 2 highs – is further evidence of bullishness.
Alternatively, the pair might also look like it is close to completing an “abc” three-wave corrective pattern of the down move that began after prices rolled over following the July peak.
A close below the 50-day Simple Moving Average (SMA) at 145.24 would probably indicate a resumption of the medium-term downtrend from the summer. Such a move would be expected to reach the wave B lows at around 141.72.
GBP/USD has the potential to trade within a higher 1.30-1.40 range through 2025, DBS’ FX analysts Philip Wee and Chang Wei Liang note.
BoE to reduce interest rates slower than the Fed
“In August, the 10Y yield differential between UK Gilts and US Treasuries turned positive for the first time since Sep 2023, indicating that the Bank of England would reduce interest rates slower than the Fed. The IMF noted that the UK economy was recovering faster than expected after a mild recession in 2023.”
“The Labour Party’s decisive victory in the July snap elections should bring more political stability after years of volatility under Conservative leadership. Prime Minister Keir Starmer had ruled out rejoining the EU but wants to rebuild and strengthen the UK’s post-Brexit relationship with the EU.”
EUR/USD is poised to move into a higher 1.10-1.15 range through 2025, DBS’ FX analysts Philip Wee and Chang Wei Liang note.
To move into a higher 1.10-1.15 range through 2025
“The European Central Bank (ECB) is unlikely to match the Fed’s pace in reducing interest rates. By September’s end, the ECB’s deposit facility rate was 150 bps above its 2% inflation target, compared to the Fed’s 275-300 bps.”
“ECB estimated an inflation-adjusted neutral rate of 1-2%, higher than the Fed’s 0-1%. The ECB’s easing is based on its expectation for inflation to ease amid record-low unemployment. However, the Fed is reducing rates to avert a further cooling labour market—something it considers no longer necessary to achieve its inflation target.”
The US Dollar (USD) is expected to edge higher; any advance is unlikely to reach 7.0710. In the longer run, weakness has stabilised; current price movements are likely part of a 6.9900/7.0800 range trading phase, UOB Group FX analysts Quek Ser Leang and Lee Sue Ann note.
Price movements are a part of a 6.9900/7.0800 range
24-HOUR VIEW: “We expected USD to continue to rise yesterday. However, we indicated that ‘any advance is unlikely to reach the resistance at 7.0600.’ USD subsequently rose to 7.0550, closing at 7.0504 (+0.20%). Despite the advance, there has been no significant increase in momentum. Today, we expect USD to edge higher, but this time around, any advance is unlikely to reach 7.0710. Support is at 7.0390, followed by 7.0220.”
1-3 WEEKS VIEW: “We highlighted yesterday (03 Oct, spot at 7.0380) that the recent USD weakness has stabilised. We also highlighted that “the current price movements are likely part of a range trading phase, probably between 6.9900 and 7.0800.” We continue to hold the same view.”
There’s a risk of EUR/USD dipping back to the 1.10 level in the coming weeks, Rabobank’s FX analyst Jane Foley notes.
ECB is likely to cut rates later this month
“Safe haven demand may play a role in supporting the greenback. In addition, US growth continues to outpace that of the Eurozone.”
“Recent signs that inflation is ebbing further in various Eurozone countries have supported expectations that the ECB is likely to cut rates later this month and this could weigh on the EUR.”
“Additionally, French budget concerns may highlight some of the structural issues in the region.”
The main event in the Central and Eastern Europe (CEE) region today is the meeting of the National Bank of Romania, ING’s FX strategist Frantisek Taborsky notes.
EUR/RON remains firmly anchored just below 5.00
“Our economists expect rates to remain unchanged at 6.50%, in line with expectations, but the survey is split. On one side is the rebounding credit market, wages and loose fiscal policy speaking against further rate cuts. On the other, inflation is lower than expected and the economy is surprising on the negative side.”
“The global picture is also mixed with the Fed cutting rates and the situation in the Middle East pushing up oil prices. FX forwards suggest a market on the dovish side for today's decision. However, it's hard to expect any reaction from the RON which remains firmly anchored just below 5.00 EUR/RON and we don't expect any changes here in the near term.”
“At least the front of the Romania government bond curve could see some support if the NBR continues to cut rates for the third straight time. On the other hand, in the bond space, the focus remains mainly on fiscal policy. Speculation yesterday of the Ministry of Finance's agreement with the European Commission on this year's deficit at 7.9% of GDP can hardly be taken as good news, given that it is more at the upper end of market expectations, implying further bond issuance this year.”
The US Dollar (USD) is likely to trade in a range, probably between 146.00 and 147.40. In the longer run, boost in momentum suggests USD could rise further to 148.00, UOB Group FX analysts Quek Ser Leang and Lee Sue Ann note.
USD could rise further to 148.00 mid term
24-HOUR VIEW: “After USD soared two days ago, we indicated yesterday that USD ‘is likely to continue to rise.’ We highlighted that ‘resistance levels are at 147.20 and 148.00.’ However, we pointed out that ‘the latter level is probably out of reach for now.’ Our view was not wrong, as USD rose to 147.24, closing at 146.92 (0.31%). Overbought conditions, combined with early signs of slowing momentum suggest USD is unlikely to advance much further. Today, USD is more likely to trade in a range, probably between 146.00 and 147.40.”
1-3 WEEKS VIEW: “Our update from yesterday (03 Oct, spot at 146.55) remains valid. As highlighted, the recent strong in USD has resulted in a boost in upward momentum. This could lead to USD rising to 148.00. To maintain the momentum, USD must remain above 144.80 (‘strong support’ level) previously at 144.00.”
There is no doubt that safe-haven demand has been having an impact on asset prices in the past few sessions. Fears of an escalation in the Middle East crisis have put oil prices on course for their biggest weekly gain since 2023 while the USD is the best performing G10 currency on a 5-day view as it claws back a little part of its recent losses, Rabobank’s FX analyst Jane Foley notes.
Fed to announce three more 25 bp rate cuts until January 2025
“While the monthly US non-farm payrolls report is both flawed and subject to significant revision, it remains the most watched data event of the month. Consequently, this afternoon’s release will have a lot of sway on determining expectations regarding the likely size of the Fed’s policy move next month and potentially into early next year. It is Rabo’s house view that the Fed will announce three more 25 bp rate cuts between now and January 2025.”
“Not all Fed officials share Powell’s confidence. Bowman recently commented that inflation remains ‘uncomfortably above the committee’s 2% goal’ while Barken repeated that it was too early to declare victory on inflation. Indeed, this week’s rise in oil prices, if sustained, would bring a fresh inflation risk.”
“The printed market consensus for today’s NFP number stands at 150K, though clearly the revision announced for the past two months will impact how this number is interpreted. There has been a spate of other US labour data releases in recent sessions. The correlation between the various series can be lacking, at least until all of the revisions are in. That said, the messages contained in the various different labour indices can provide clues as to the broad health of the labour market.”
USD/SGD has corrected higher for 4 consecutive days this week, tracking the uptick in USD. Pair was last at 1.2978, OCBC’s FX analysts Frances Cheung and Christopher Wong note.
Daily momentum is mild bullish
“Focus today on US NFP. Risks are likely to be symmetric for USDSGD. If print comes in hotter, then the corrective rebound can continue but if NFP prints lower, then the pair should consolidate with a downside bias.”
“Daily momentum is mild bullish while rise in RSI moderated. Consolidation likely ahead of NFP data. Resistance at 1.2980 (23.6% fibo retracement of Jul high to Sep low), 1.3070 (50 DMA). Support at 1.2940 (21 DMA), 1.2890, 1.28 levels. S$NEER was last estimated at ~1.85% above our model-implied mid.”
- Silver price remains firm near $32 in countdown to US NFP.
- The US labor market data will influence the Fed’s likely policy-easing pace.
- Middle East conflict has strengthened Silver’s appeal as a safe haven.
Silver price (XAG/USD) oscillates in a tight range near the crucial resistance of $32.00 in Friday’s European session. The white metal stays firm due to widening conflicts in the Middle East region between Israel and Iran-backed Hezbollah. Historically, the safe-haven appeal of precious metals improves amid geopolitical uncertainty.
In today’s session, the major trigger for the Silver price will be the United States (US) Nonfarm Payrolls (NFP) data for September, which will be published at 12:30 GMT. The official employment data will significantly influence market expectations for the Federal Reserve’s (Fed) interest rate outlook.
On September 18, the Fed pivoted to policy normalization with a larger-than-usual interest rate cut of 50 basis points (bps). After the Fed’s decision of jumbo rate cut, comments from Fed Chair Jerome Powell and his teammates have indicated that the central bank was more focused on reviving job growth amid confidence that price pressures are on track to return to the bank’s target of 2%.
The US NFP report is expected to show that 140K fresh payrolls were added, similar to 142K in August. The Unemployment Rate is seen steady at 4.2%. Investors will also focus on Average Hourly Earnings data, a key measure to wage growth, which is expected to have grown by 3.8% steadily year-on-year.
Meanwhile, the US Dollar Index (DXY), which tracks the Greenback’s value against six major currencies, edges lower but trades close to its two-week high around 102.00.
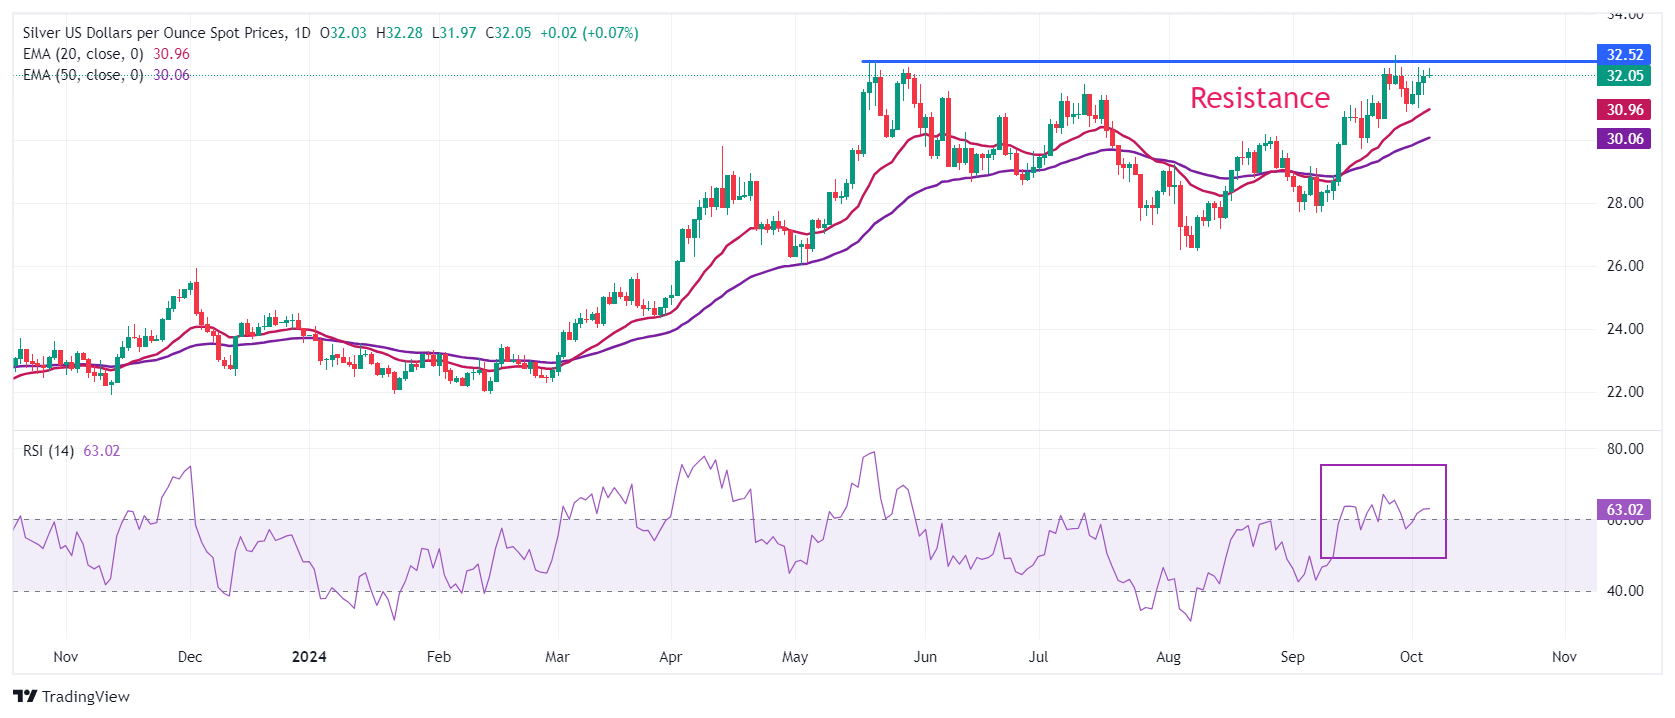
Silver technical analysis
Silver price trades close to near the horizontal resistance plotted from May 20 high of $32.50 on a daily timeframe. The white metal strives for more upside as the outlook is upbeat due to upward-sloping 20 and 50-day Exponential Moving Averages (EMAs), which trade around $31.00 and $30.00, respectively.
The 14-day Relative Strength Index (RSI) remains in the bullish range of 60.00-80.00, suggesting more upside ahead.
Silver daily chart
Silver FAQs
Silver is a precious metal highly traded among investors. It has been historically used as a store of value and a medium of exchange. Although less popular than Gold, traders may turn to Silver to diversify their investment portfolio, for its intrinsic value or as a potential hedge during high-inflation periods. Investors can buy physical Silver, in coins or in bars, or trade it through vehicles such as Exchange Traded Funds, which track its price on international markets.
Silver prices can move due to a wide range of factors. Geopolitical instability or fears of a deep recession can make Silver price escalate due to its safe-haven status, although to a lesser extent than Gold's. As a yieldless asset, Silver tends to rise with lower interest rates. Its moves also depend on how the US Dollar (USD) behaves as the asset is priced in dollars (XAG/USD). A strong Dollar tends to keep the price of Silver at bay, whereas a weaker Dollar is likely to propel prices up. Other factors such as investment demand, mining supply – Silver is much more abundant than Gold – and recycling rates can also affect prices.
Silver is widely used in industry, particularly in sectors such as electronics or solar energy, as it has one of the highest electric conductivity of all metals – more than Copper and Gold. A surge in demand can increase prices, while a decline tends to lower them. Dynamics in the US, Chinese and Indian economies can also contribute to price swings: for the US and particularly China, their big industrial sectors use Silver in various processes; in India, consumers’ demand for the precious metal for jewellery also plays a key role in setting prices.
Silver prices tend to follow Gold's moves. When Gold prices rise, Silver typically follows suit, as their status as safe-haven assets is similar. The Gold/Silver ratio, which shows the number of ounces of Silver needed to equal the value of one ounce of Gold, may help to determine the relative valuation between both metals. Some investors may consider a high ratio as an indicator that Silver is undervalued, or Gold is overvalued. On the contrary, a low ratio might suggest that Gold is undervalued relative to Silver.
The DXY Index consolidated in a lower 100-107 range, underpinned by the Fed’s “higher for longer” rates stance and exceptional US growth. Believing that a further cooling in the US labour market was no longer needed to achieve its 2% target, the Fed started its rate cutting cycle in September, DBS’ FX analyst Philip Wee notes.
Time to consider a resumption of the US dollar’s depreciation
“We see US growth decelerating to 1.7% in 2025, Fed cutting rates by a further 200 bps to 3%, and DXY Index falling below 100 over the next 12-15 month.”
“Next presidential term will begin in 2025 amid a Fed easing cycle, instead of rate hikes; Trump's protectionist policies pose a more significant threat to the global economy while a Harris presidency should be positive for Emerging Asia's currencies.”
- The US Dollar is set to close off this week in the green.
- Tensions in the Middle East together with pared bets of big Fed rate cuts are fueling safe-haven inflows to the Greenback.
- The US Dollar Index broke the September high at 101.90 but the jobs report data will decide the next move.
The US Dollar (USD) consolidates on Friday after trading firmly stronger this week, with all eyes on the US Employment Report and specifically on the Nonfarm Payrolls (NFP) numbers. The data will be pivotal as strong figures could move the DXY further away from the tight range it has been moving so far this month. Meanwhile, if numbers turn out weaker than expected, the Greenback could fall back into the range .
The economic calendar is housing only one main element: the aforementioned US Jobs Report. As always, the Nonfarm Payrolls print will take the most attention. However, elements such as the Average Hourly Wages and the Unemployment Rate could be the second-tier data that in the end will drive the US Dollar higher or lower after the initial volatile reaction.
Daily digest market movers: All eyes on data and Israel
- Expect some volatile moves in the Greenback if Israel strikes Iranian Oil fields. At the time of writing, discussions between Israel and the Biden administration for a green light on the attacks are still ongoing.
- At 12:30 GMT, the US Jobs Report for September is due:
- Nonfarm Payrolls are expected to fall to 140,000, coming from 142,000 in August.
- Monthly Average Hourly Earnings should ease further, to 0.3% from 0.4%.
- The Unemployment rate is expected to remain unchanged at 4.2%.
- At 13:00 GMT, Federal Reserve Bank of New York President John Williams delivers opening remarks at the event "The Future of New York City: Focus on Jobs" organized by the New York Fed.
- Equities are rebounding a touch across the board with Japan having closed off this Friday in the green. European equities post small gains, while US futures are flat.
- The CME Fedwatch Tool shows a 69.3% chance of a 25 basis-point rate cut at the next Fed meeting on November 7, while 30.7% is pricing in another 50-basis-point rate cut.
- The US 10-year benchmark rate trades at 3.85%, a 30-day high.
Economic Indicator
Nonfarm Payrolls
The Nonfarm Payrolls release presents the number of new jobs created in the US during the previous month in all non-agricultural businesses; it is released by the US Bureau of Labor Statistics (BLS). The monthly changes in payrolls can be extremely volatile. The number is also subject to strong reviews, which can also trigger volatility in the Forex board. Generally speaking, a high reading is seen as bullish for the US Dollar (USD), while a low reading is seen as bearish, although previous months' reviews and the Unemployment Rate are as relevant as the headline figure. The market's reaction, therefore, depends on how the market assesses all the data contained in the BLS report as a whole.
Read more.Next release: Fri Oct 04, 2024 12:30
Frequency: Monthly
Consensus: 140K
Previous: 142K
Source: US Bureau of Labor Statistics
America’s monthly jobs report is considered the most important economic indicator for forex traders. Released on the first Friday following the reported month, the change in the number of positions is closely correlated with the overall performance of the economy and is monitored by policymakers. Full employment is one of the Federal Reserve’s mandates and it considers developments in the labor market when setting its policies, thus impacting currencies. Despite several leading indicators shaping estimates, Nonfarm Payrolls tend to surprise markets and trigger substantial volatility. Actual figures beating the consensus tend to be USD bullish.
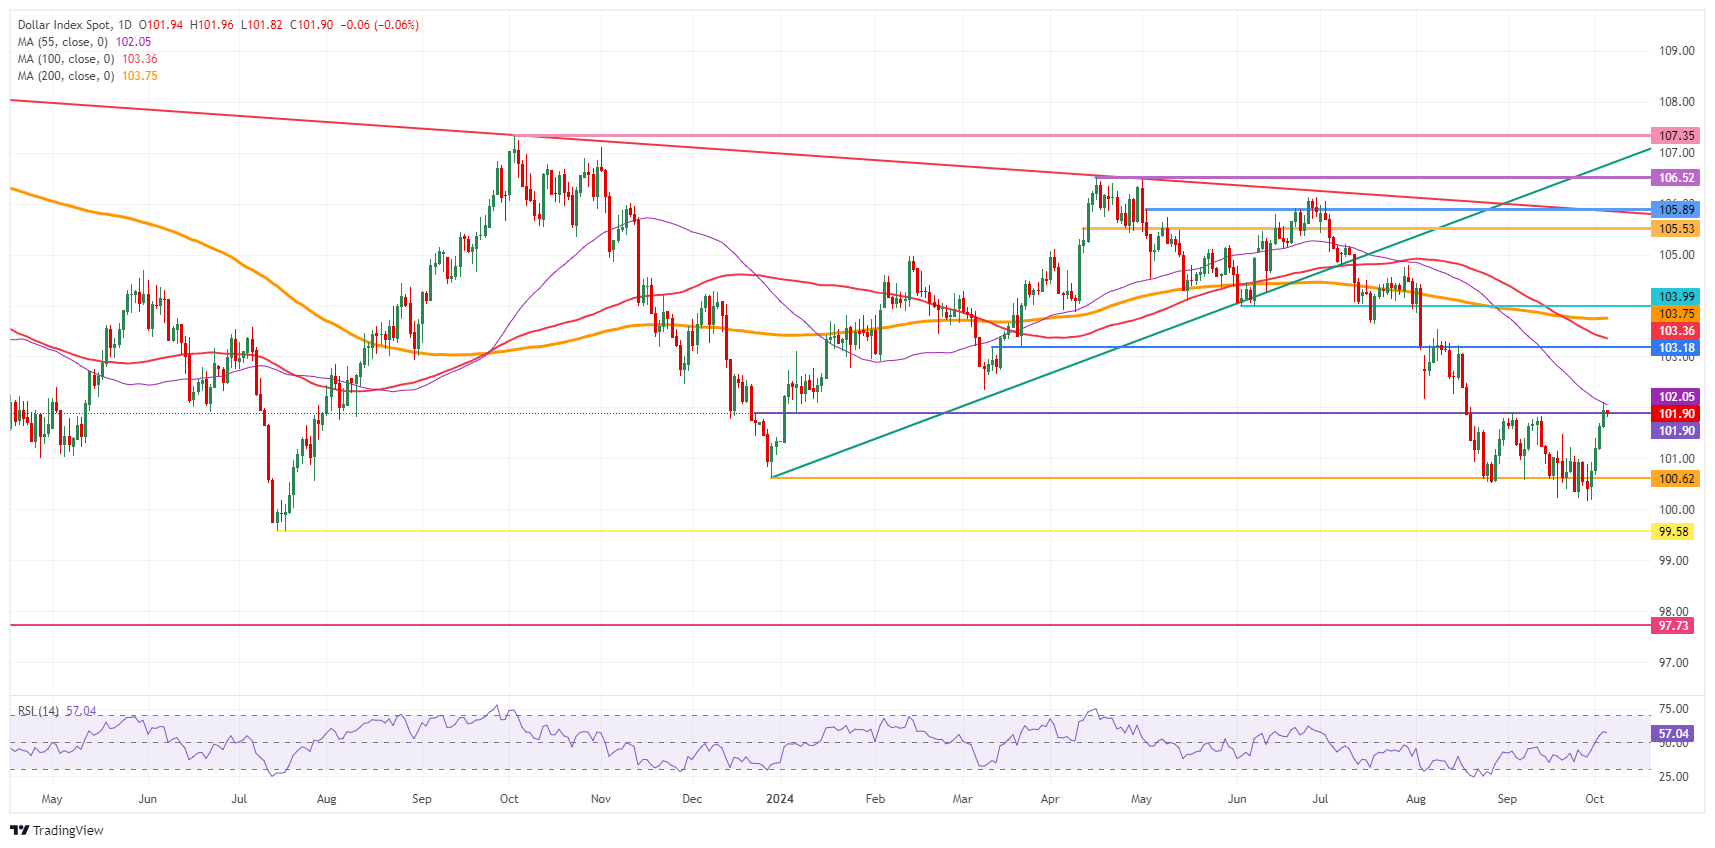
US Dollar Index Technical Analysis: Hitting Resistance
The US Dollar Index (DXY) has made a stellar recovery this week with the cherry on the cake Thursday, when it was able to break out of September’s range. The 55-day Simple Moving Average (SMA) at 102.05 has refused to let the DXY trade higher and shows its strength as a resistance level. Expect the US Jobs Report to be the catalyst that snaps that level for more upside or sees the DXY fall back into range.
The 55-day Simple Moving Average (SMA) at 102.05 has already acted as resistance and is the first level that needs to be broken for more upside. A leg higher, the chart identifies 103.18 as the very final level for this week. Once above there, a very choppy area emerges with the 100-day SMA at 103.36, the 200-day SMA at 103.75 and the pivotal 103.99-104.00 levels in play.
On the downside, 100.62 is flipping back from resistance into support in case the DXY closes above it this week. The fresh low of 2024 is at 100.16, so a test of this level should take place before more downside. Further down, and that means giving up the big 100.00 level, the July 14, 2023, low at 99.58 comes into play.
US Dollar Index: Daily Chart
US Dollar FAQs
The US Dollar (USD) is the official currency of the United States of America, and the ‘de facto’ currency of a significant number of other countries where it is found in circulation alongside local notes. It is the most heavily traded currency in the world, accounting for over 88% of all global foreign exchange turnover, or an average of $6.6 trillion in transactions per day, according to data from 2022. Following the second world war, the USD took over from the British Pound as the world’s reserve currency. For most of its history, the US Dollar was backed by Gold, until the Bretton Woods Agreement in 1971 when the Gold Standard went away.
The most important single factor impacting on the value of the US Dollar is monetary policy, which is shaped by the Federal Reserve (Fed). The Fed has two mandates: to achieve price stability (control inflation) and foster full employment. Its primary tool to achieve these two goals is by adjusting interest rates. When prices are rising too quickly and inflation is above the Fed’s 2% target, the Fed will raise rates, which helps the USD value. When inflation falls below 2% or the Unemployment Rate is too high, the Fed may lower interest rates, which weighs on the Greenback.
In extreme situations, the Federal Reserve can also print more Dollars and enact quantitative easing (QE). QE is the process by which the Fed substantially increases the flow of credit in a stuck financial system. It is a non-standard policy measure used when credit has dried up because banks will not lend to each other (out of the fear of counterparty default). It is a last resort when simply lowering interest rates is unlikely to achieve the necessary result. It was the Fed’s weapon of choice to combat the credit crunch that occurred during the Great Financial Crisis in 2008. It involves the Fed printing more Dollars and using them to buy US government bonds predominantly from financial institutions. QE usually leads to a weaker US Dollar.
Quantitative tightening (QT) is the reverse process whereby the Federal Reserve stops buying bonds from financial institutions and does not reinvest the principal from the bonds it holds maturing in new purchases. It is usually positive for the US Dollar.
US Dollar PRICE This week
The table below shows the percentage change of US Dollar (USD) against listed major currencies this week. US Dollar was the strongest against the Japanese Yen.
| USD | EUR | GBP | JPY | CAD | AUD | NZD | CHF | |
|---|---|---|---|---|---|---|---|---|
| USD | 1.24% | 1.60% | 2.96% | 0.31% | 0.89% | 2.16% | 1.21% | |
| EUR | -1.24% | 0.36% | 1.71% | -0.88% | -0.28% | 0.95% | 0.05% | |
| GBP | -1.60% | -0.36% | 1.49% | -1.24% | -0.64% | 0.58% | -0.31% | |
| JPY | -2.96% | -1.71% | -1.49% | -2.51% | -2.05% | -0.74% | -1.65% | |
| CAD | -0.31% | 0.88% | 1.24% | 2.51% | 0.62% | 1.85% | 0.94% | |
| AUD | -0.89% | 0.28% | 0.64% | 2.05% | -0.62% | 1.23% | 0.32% | |
| NZD | -2.16% | -0.95% | -0.58% | 0.74% | -1.85% | -1.23% | -0.91% | |
| CHF | -1.21% | -0.05% | 0.31% | 1.65% | -0.94% | -0.32% | 0.91% |
The heat map shows percentage changes of major currencies against each other. The base currency is picked from the left column, while the quote currency is picked from the top row. For example, if you pick the US Dollar from the left column and move along the horizontal line to the Japanese Yen, the percentage change displayed in the box will represent USD (base)/JPY (quote).
The New Zealand Dollar (NZD) could continue to weaken; oversold conditions suggest any decline is unlikely to break below the significant support at 0.6170. Momentum has increased further; NZD could continue to decline to 0.6170, UOB Group FX analysts Quek Ser Leang and Lee Sue Ann note.
NZD can continue to decline to 0.6170
24-HOUR VIEW: “Yesterday, we noted that ‘there has been a slight increase in momentum.’ We highlighted that ‘while NZD could break below 0.6250, the major support at 0.6225 is still unlikely to come into view.’ The anticipated weakness exceeded our expectations as NZD fell to a low of 0.6211. While NZD could continue to weaken, oversold conditions suggest any decline is unlikely to break below the significant support at 0.6170 (minor support is at 0.6200). Resistance is 0.6235; a breach of 0.6255 would suggest that NZD is not weakening further.”
1-3 WEEKS VIEW: “Two days ago (02 Oct, spot at 0.6285), we noted that ‘downward momentum has increased slightly.’ We held the view that ‘the pullback in NZD could potentially reach 0.6225.’ Yesterday, NZD dropped below 0.6225, reaching a low of 0.6211. Momentum has increased further, and NZD could continue to decline to 0.6170. We will expect NZD to weaken as long as it remains below 0.6295 (‘strong resistance’ previously at 0.6325.).”
- Gold adopts a sideways mode as traders await the US Nonfarm Payrolls report for fresh clues on the trajectory of Fed policy.
- A weak figure would reignite speculation of the Fed enacting a 50 bps rate cut in November – driving Gold higher.
- Technically, XAU/USD is consolidating in a medium and long-term uptrend.
Gold (XAU/USD) continues trading sideways in the $2,660s on Friday as traders brace for the release of what is likely to be the most significant macroeconomic data report of the week, the US Nonfarm Payrolls (NFP) for September published by the US Bureau of Labor Statistics (BLS).
The report will help clarify the state of the US labor market, which took over from inflation as the chief concern of the US Federal Reserve (Fed) in August after a pivotal speech by Fed Chairman Jerome Powell, in which he stated: "We do not seek or welcome further cooling in labor market conditions."
If the report shows the US labor market has worsened – particularly a rise in unemployment – it could bring back on the table the probability of the Fed making another double-dose 50 basis points (bps) (0.50%) rate cut at their November meeting. This, in turn, would likely spur Gold higher since lower interest rates increase its attractiveness as a non-interest-paying asset.
Gold: Next move probably dependent on US NFP report
Gold’s upside could be capped, however, if the NFP data reveals a healthy labor market, as this would likely further reduce the chances of a 50 bps rate cut by the Fed at their next meeting. Relatively robust US macro data has whittled away at the market-based probabilities of a “jumbo” rate cut from 60% at one point last week to just over 30% at the time of publication on Friday, according to the CME Fedwatch tool.
On Thursday, the latest release – the US ISM Services PMI, a survey of the sector’s purchasing managers – showed a higher-than-expected expansion of activity in September. That said, a steady decline in inflation, as well as some cooling in the labor market, makes a lesser 25 bps (0.25%) cut almost certain and limits any downside for the precious metal.
Consensus expectations for the NFP headline figure of 140K belie a wide variation in estimates – from Citibank’s 70K, to 220K at the upper end, according to Bloomberg News. This suggests the market will remain on edge until the release, and the final figure could cause volatility.
Gold keeps the upside on safe-haven demand
Gold sees further support from safe-haven flows due to concerns about an escalation of the conflict in the Middle East. Israel is widely expected to launch an imminent retaliatory attack on Iran for its bombardment on Tuesday evening. Iran launched around 200 missiles, many of them ballistic, to avenge the death of Hassan Nasrallah, the head of the Iran-backed group Hezbollah.
The yellow metal is further supported by the overall trend lower in global interest rates, which enables Gold to retain its attractiveness as a portfolio asset for investors.
Technical Analysis: Gold extends sideways mode
Gold extends and narrows its sideways market mode further, clearly visible on the 4-hour chart below. It has decisively broken below the 50-period Simple Moving Average (SMA), suggesting a marginally bearish tilt to the short-term outlook.
The immediate range has narrowed to a new ceiling of $2,673 (October 1 high) and a floor of $2.638 (October 3 low).
The short-term trend is sideways, and given the technical analysis principle that “the trend is your friend,” it is more likely than not to endure with price oscillating between poles.
It would require a breakout either above the top of the range or below the bottom to confirm a new directional bias. This is possible, given the event risk on the horizon.
XAU/USD 4-hour Chart
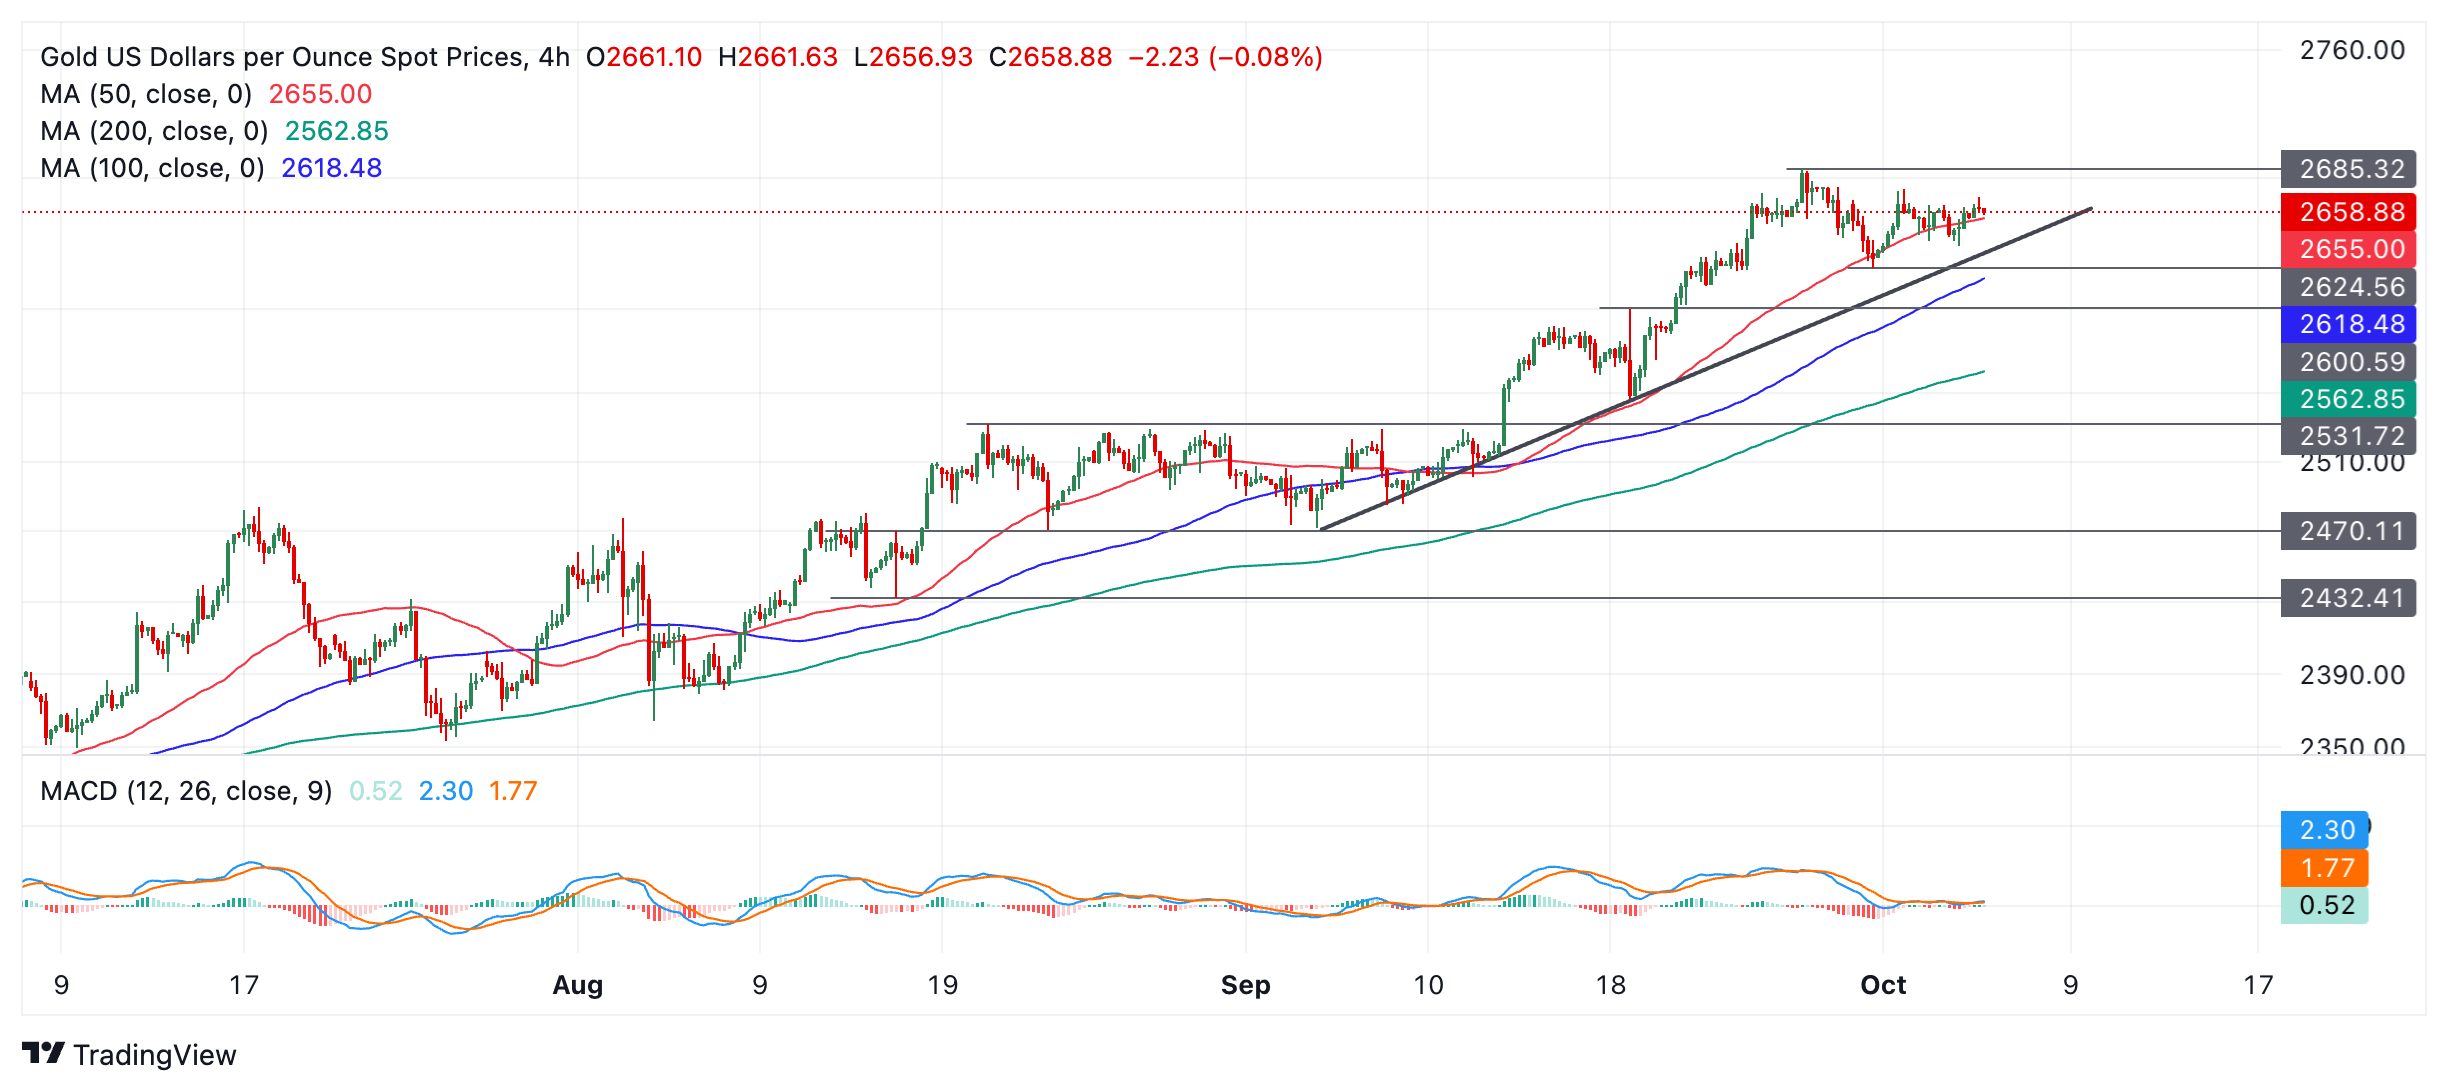
A break above $2,673 would increase the odds of a resumption of the old uptrend, probably leading to a continuation up to the round-number target at $2,700.
A break below $2.638 would lead to a move down to at least the swing low of $2,625 (September 30 low). A break below that would likely see prices give way to support at $2,600 (August 20 high, round number).
On a medium and long-term basis, Gold remains in an uptrend, with the odds favoring an eventual resumption higher once the current period of consolidation has ended.
Economic Indicator
Nonfarm Payrolls
The Nonfarm Payrolls release presents the number of new jobs created in the US during the previous month in all non-agricultural businesses; it is released by the US Bureau of Labor Statistics (BLS). The monthly changes in payrolls can be extremely volatile. The number is also subject to strong reviews, which can also trigger volatility in the Forex board. Generally speaking, a high reading is seen as bullish for the US Dollar (USD), while a low reading is seen as bearish, although previous months' reviews and the Unemployment Rate are as relevant as the headline figure. The market's reaction, therefore, depends on how the market assesses all the data contained in the BLS report as a whole.
Read more.Next release: Fri Oct 04, 2024 12:30
Frequency: Monthly
Consensus: 140K
Previous: 142K
Source: US Bureau of Labor Statistics
America’s monthly jobs report is considered the most important economic indicator for forex traders. Released on the first Friday following the reported month, the change in the number of positions is closely correlated with the overall performance of the economy and is monitored by policymakers. Full employment is one of the Federal Reserve’s mandates and it considers developments in the labor market when setting its policies, thus impacting currencies. Despite several leading indicators shaping estimates, Nonfarm Payrolls tend to surprise markets and trigger substantial volatility. Actual figures beating the consensus tend to be USD bullish.
Yesterday's trading brought the first signs of calm in the CEE region. However, the EM space still remains under pressure and therefore it is too early to turn more optimistic on the region. Today the main focus will of course be on US data and the geopolitical situation and we prefer to wait for Monday to see developments over the weekend in the Middle East. However, as we've mentioned before, CEE currency fundamentals support a quick recovery if the situation calms down, ING’s FX strategist Frantisek Taborsky notes.
EM space still remains under pressure
“The Polish zloty should be the most defensive currency in the region amid the risk-off sentiment and should also have the easiest path to start appreciating again. Although we believe nothing changes that, yesterday's National Bank of Poland press conference altered the picture slightly. The governor surprised with another dovish move and confirmed that the first half of next year is the time for rate cuts.”
“Although we see current market pricing as still very dovish, given the spike in rates in recent days it has not been hard for the market to price back some rate cuts. However, the result has been a deterioration in rate differentials while the rest of CEE remains at record highs. At the same time, EUR/CZK yesterday was the first pair within the CEE3 to find some ground, but EUR/HUF also bounced off 402 and EUR/PLN rejected 4.310.”
“Overall though, we are hardly looking for confirmation that the situation has calmed down and today may reveal more as to the right time to turn more positive.”
USD/JPY recent rally can be attributed to comments from new PM Ishiba and Governor Ueda. Pair was last at 146.46, OCBC’s FX analysts Frances Cheung and Christopher Wong note.
Bullish momentum on daily chart intact
“Both sent a coherent message that policymakers are in no hurry to normalise policy. PM Ishiba has also just ordered his cabinet to draw up a comprehensive economic measure. This continues to be aligned with chatters that the PM may be attempting to shore up confidence ahead of snap elections (27 Oct) by drawing up comprehensive economic measures, including a submission of a supplementary budget to parliament after snap elections, talking down prospects of rate hikes and boosting equity markets.”
“On monetary policy, PM Ishiba had earlier said that the economy is not ready yet for another interest rate hike while Governor Ueda had earlier said that upside risk to prices does appear to be easing given the recent yen strength… there’s some time to confirm certain points when making policy decisions, referring to the importance of checking moves in financial markets and the state of overseas economies.”
“He also spoke about range of 140 – 150 for USD/JPY is comfortable. Bullish momentum on daily chart intact but rise in RSI slowed. Immediate resistance at 147.00/20 levels, 148 (38.2% fibo retracement of Jul double-top to Sep low) and 150 levels. Support at 145.20 (50 DMA), 144.80 (23.6% fibo) and 143.35 (21 DMA).”
- AUD/USD remains restricted to 0.6850 amid caution ahead of the US NFP data for September.
- The US NFP data will significantly influence the Fed’s interest rate cut path.
- Investors await the RBA minutes to project the next move in the Australian Dollar.
The AUD/USD pair remains offered near the key resistance of 0.6850 in Friday’s European session. The Aussie asset would continue to face pressure as traders brace for the United States (US) Nonfarm Payrolls (NFP) data for September, which will be published at 12:30 GMT.
With growing conflicts in the Middle East region, market sentiment remains uncertain. Risk-perceived currencies are under pressure as rising Oil prices due to Israel-Iran war would result in a sharp increase in foreign outflows of those economies, which are highly dependent on imported Oil. The US Dollar Index (DXY), which tracks the Greenback’s value against six major currencies, clings to gains near 102.00.
The US NFP will be under the spotlight as it would force traders to adjust market expectations for Federal Reserve’s (Fed) monetary policy action in the remaining two meetings this year. Currently, financial markets are slightly confident about the Fed to reduce interest rates further by 75 basis points (bps).
Economists expect the addition of fresh payrolls at 140K, marginally lower than 142K in August. The Unemployment Rate is seen steady at 4.2%. Market participants will also focus on the Average Hourly Earnings data, a key measure to wage growth that drives consumer spending. The annual wage growth measure is estimated to have risen steadily by 3.8%, with monthly growth rate slowing to 0.3% from 0.4% in August.
In the Asia-Pacific region, the next trigger for the Australian Dollar (AUD) will be the Reserve Bank of Australia (RBA) Meeting Minutes of the September policy meeting. In the meeting, the RBA left interest rates unchanged at 4.35%, as expected. The RBA also signalled that there was no offer for a further hike on the table.
Australian Dollar FAQs
One of the most significant factors for the Australian Dollar (AUD) is the level of interest rates set by the Reserve Bank of Australia (RBA). Because Australia is a resource-rich country another key driver is the price of its biggest export, Iron Ore. The health of the Chinese economy, its largest trading partner, is a factor, as well as inflation in Australia, its growth rate and Trade Balance. Market sentiment – whether investors are taking on more risky assets (risk-on) or seeking safe-havens (risk-off) – is also a factor, with risk-on positive for AUD.
The Reserve Bank of Australia (RBA) influences the Australian Dollar (AUD) by setting the level of interest rates that Australian banks can lend to each other. This influences the level of interest rates in the economy as a whole. The main goal of the RBA is to maintain a stable inflation rate of 2-3% by adjusting interest rates up or down. Relatively high interest rates compared to other major central banks support the AUD, and the opposite for relatively low. The RBA can also use quantitative easing and tightening to influence credit conditions, with the former AUD-negative and the latter AUD-positive.
China is Australia’s largest trading partner so the health of the Chinese economy is a major influence on the value of the Australian Dollar (AUD). When the Chinese economy is doing well it purchases more raw materials, goods and services from Australia, lifting demand for the AUD, and pushing up its value. The opposite is the case when the Chinese economy is not growing as fast as expected. Positive or negative surprises in Chinese growth data, therefore, often have a direct impact on the Australian Dollar and its pairs.
Iron Ore is Australia’s largest export, accounting for $118 billion a year according to data from 2021, with China as its primary destination. The price of Iron Ore, therefore, can be a driver of the Australian Dollar. Generally, if the price of Iron Ore rises, AUD also goes up, as aggregate demand for the currency increases. The opposite is the case if the price of Iron Ore falls. Higher Iron Ore prices also tend to result in a greater likelihood of a positive Trade Balance for Australia, which is also positive of the AUD.
The Trade Balance, which is the difference between what a country earns from its exports versus what it pays for its imports, is another factor that can influence the value of the Australian Dollar. If Australia produces highly sought after exports, then its currency will gain in value purely from the surplus demand created from foreign buyers seeking to purchase its exports versus what it spends to purchase imports. Therefore, a positive net Trade Balance strengthens the AUD, with the opposite effect if the Trade Balance is negative.
- Crude Oil is set to lock in over 8% of gains for this week on supply concerns amid the escalating conflict in the Middle East.
- The Biden administration and Israel discuss possible strikes on Iranian Oil fields.
- The US Dollar Index consolidates gains ahead of Nonfarm Payrolls data.
Crude Oil heads into its fourth straight day of gains for this week, accumulating more than 8% price rise since its opening on Monday. With tensions not easing in Lebanon, more risk is being priced in after headlines emerged that Israel was seeking green light from the Biden administration to target Oil installations in Iran. Concerns about such an attack, which could disrupt supply, set the tone to come over the weekend and into next week, with a ceasefire deal looking further away than ever.
The US Dollar Index (DXY), which tracks the performance of the Greenback against six other currencies, is trading broadly flat this Friday after a steep four-day rally. The US Dollar Index has broken above 101.9, the upper band of the September range in which it has been trading for over a month. The US Jobs report on Friday, which includes the key Nonfarm Payrolls release as the main component, will decide where the DXY will close off this week.
At the time of writing, Crude Oil (WTI) trades at $74.38 and Brent Crude at $78.48.
Oil news and market movers: No room for easing
- Oil prices could rally further if there's any response by Israel to Iran's October 1 missile attack that targets Oil-related infrastructure. Further retaliation by Iran based on a blockade of the Strait of Hormuz could raise the price of crude to north of $100 a barrel, Bloomberg Intelligence reports.
- A spillover effect is taking place in petrol prices as Israel ponders a hit on Iranian Oil fields, Financial Review reports.
- US President Joe Biden said on Thursday that he was still discussing possible Israeli strikes on Iranian Oil facilities. The President refused to comment on whether he agrees with the path forward that Israel is asking, according to BBC.
Economic Indicator
Baker Hughes US Oil Rig Count
The Baker Hughes Rig Counts are an important business barometer for the drilling industry and its suppliers. When drilling rigs are active they consume products and services produced by the oil service industry. The active rig count acts as a leading indicator of demand for products used in drilling, completing, producing and processing hydrocarbons. This particular case represents the number of rigs drilling exclusively for oil.
Read more.Next release: Fri Oct 04, 2024 17:00
Frequency: Irregular
Consensus: -
Previous: 484
Source: Baker Hughes
Oil Technical Analysis: Shooting through resistances
Crude Oil price action is keeping technical writers at work with one pivotal level after another being broken. On Thursday, the 55-day Simple Moving Average (SMA) at $72.77 was the last victim of the rally. Although $75.00 is still a stretch away, prices could reach that level if Israel gets the green light of the US to attack Oil installations.
The new pivotal upside level is first $75.27. That level coincides with the red descending trendline and the 100-day SMA at $75.77 just hovering above it. That makes that region a very difficult one to break through. Once snapping above there, the 200-day SMA at $77.10 should refute any further upticks.
On the downside, old resistances have turned into supports. First is the 55-day SMA at $72.77, which acts as a potential first line of defence in case of any retreat. A bit further down, $71.46 comes into play as second support before looking back to the $70.00 big figure and $67.11 as ultimate support for traders that want to buy the dip.
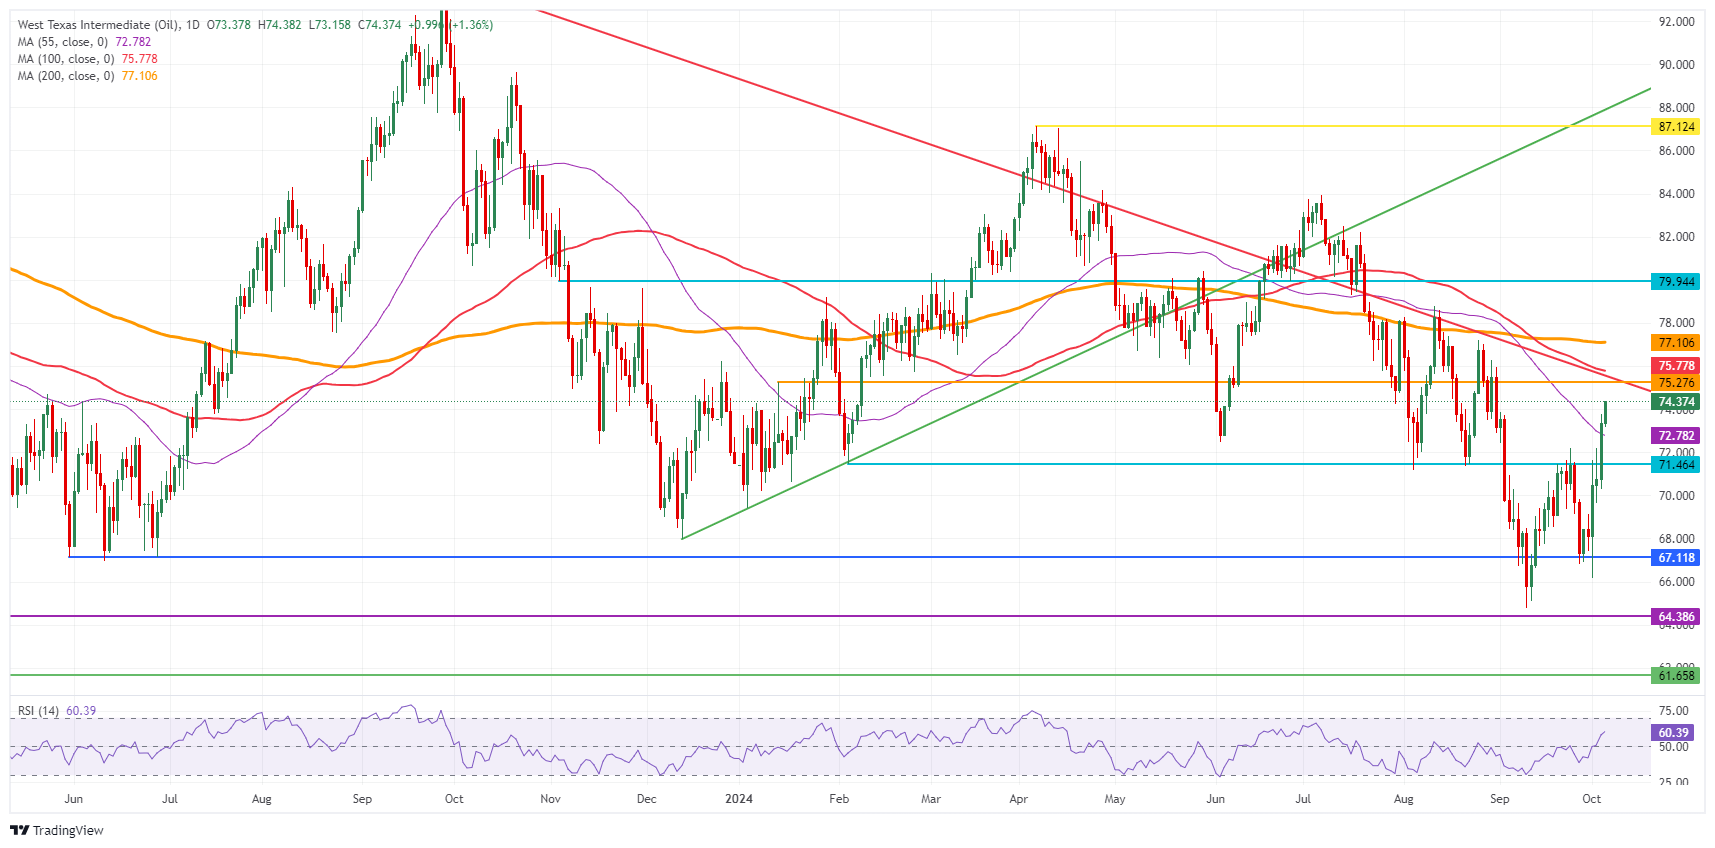
US WTI Crude Oil: Daily Chart
WTI Oil FAQs
WTI Oil is a type of Crude Oil sold on international markets. The WTI stands for West Texas Intermediate, one of three major types including Brent and Dubai Crude. WTI is also referred to as “light” and “sweet” because of its relatively low gravity and sulfur content respectively. It is considered a high quality Oil that is easily refined. It is sourced in the United States and distributed via the Cushing hub, which is considered “The Pipeline Crossroads of the World”. It is a benchmark for the Oil market and WTI price is frequently quoted in the media.
Like all assets, supply and demand are the key drivers of WTI Oil price. As such, global growth can be a driver of increased demand and vice versa for weak global growth. Political instability, wars, and sanctions can disrupt supply and impact prices. The decisions of OPEC, a group of major Oil-producing countries, is another key driver of price. The value of the US Dollar influences the price of WTI Crude Oil, since Oil is predominantly traded in US Dollars, thus a weaker US Dollar can make Oil more affordable and vice versa.
The weekly Oil inventory reports published by the American Petroleum Institute (API) and the Energy Information Agency (EIA) impact the price of WTI Oil. Changes in inventories reflect fluctuating supply and demand. If the data shows a drop in inventories it can indicate increased demand, pushing up Oil price. Higher inventories can reflect increased supply, pushing down prices. API’s report is published every Tuesday and EIA’s the day after. Their results are usually similar, falling within 1% of each other 75% of the time. The EIA data is considered more reliable, since it is a government agency.
OPEC (Organization of the Petroleum Exporting Countries) is a group of 12 Oil-producing nations who collectively decide production quotas for member countries at twice-yearly meetings. Their decisions often impact WTI Oil prices. When OPEC decides to lower quotas, it can tighten supply, pushing up Oil prices. When OPEC increases production, it has the opposite effect. OPEC+ refers to an expanded group that includes ten extra non-OPEC members, the most notable of which is Russia.
The Australian Dollar (AUD) could continue to weaken, but it does seem to have sufficient momentum to break clearly below 0.6820 for now. In the longer run, there has been a slight increase in momentum; the risk of AUD breaking below 0.6820 has also increased, UOB Group FX analysts Quek Ser Leang and Lee Sue Ann note.
The risk of AUD breaking below 0.6820 has increased
24-HOUR VIEW: “Our view of sideways trading yesterday was incorrect, as AUD fell to a low of 0.6830. Downward momentum has increased, albeit not significantly. Today, AUD could continue to weaken, but it does seem to have enough momentum to break clearly below the major support at 0.6820. On the upside, a breach of 0.6880 (minor resistance is at 0.6865) would mean that AUD is not weakening further.”
1-3 WEEKS VIEW: “Our most recent narrative was from Wednesday (02 Oct, spot at 0.6880), wherein AUD ‘has likely entered a range trading phase, and it is expected to trade between 0.6820 and 0.6935 for the time being.’ Yesterday, AUD dropped to a low of 0.6830. There has been a slight increase in downward momentum, and the risk of AUD breaking below 0.6820 has also increased. To maintain the current tentative buildup in momentum, AUD must remain below 0.6905 in the next few days. Looking ahead, below 0.6820, there is another major support nearby at 0.6795.”
- The Pound Sterling jumps to near 1.3160 against the US Dollar ahead of the US NFP report for September.
- The probability of the Fed cutting interest rates by an additional 75 bps by year-end has waned significantly.
- BoE’s Bailey emphasized the need to cut interest rates aggressively.
The Pound Sterling (GBP) finds buying interest near the round-level support of 1.3100 against the US Dollar (USD) in Friday’s London session. The GBP/USD pair moves higher to 1.3160 after a three-day losing spree. However, the near-term outlook of the pair is uncertain, with investors focusing on the United States (US) Nonfarm Payrolls (NFP) report for September, which will be released at 12:30 GMT.
Market participants will keenly focus on the US NFP data as it will provide fresh cues about current US labor market health. The US Federal Reserve (Fed) started its policy-easing cycle with a larger-than-usual interest rate cut of 50 basis points (bps) in September, with officials aiming to revive labor market strength amid a decline in price pressures.
The official employment data is expected to show that US employers hired 140K job-seekers, marginally lower than August’s reading of 142K. The Unemployment Rate is estimated to have remained steady at 4.2%.
Investors will also pay close attention to the Average Hourly Earnings data, a key measure of wage inflation that influences consumer spending, which is expected to have grown steadily by 3.8% year-over-year. The monthly wage growth measure is seen growing by 0.3%, slower than 0.4% in August.
The labor market data will significantly influence the Fed’s monetary policy action for the remaining two meetings this year. According to the CME FedWatch tool, the likelihood of the Fed cutting interest rates further by 75 basis points (bps) by year-end reduced to 55% from 79% a week ago.
Daily digest market movers: Pound Sterling outperforms its major peers
- The Pound Sterling outperforms against its major peers on Friday. However, it is expected to face pressure due to tensions between Iran and Israel having converted into a full-fledged war after the assassination of Hezbollah leader Hassan Nasrallah. Oil prices have rallied amid tensions in the Middle East. Historically, a sharp rise in energy prices weighs on the currencies of those economies that rely heavily on imported oil, as it results in higher foreign outflows for them.
- Besides that, BoE Governor Andrew Bailey’s commentary on the interest rate outlook on Thursday has also dampened Sterling’s outlook. The comments from Baily in an interview with the Guardian newspaper appeared dovish as he stressed the need to cut interest rates aggressively if price pressures continue to ease.
- Bailey said the BoE could become "a bit more activist" and "a bit more aggressive" in its approach to lowering rates if there was further welcome news on inflation for the central bank, Reuters reported.
- On the economic front, the revised S&P Global/CIPS Construction PMI estimate has come in significantly higher at 57.2 unexpectedly. The Construction PMI, which gauges activities in the construction sector, was expected to have expanded at a slower pace to 53.1 from the preliminary estimates of 53.6.
Technical Analysis: Pound Sterling finds cushion near 50-day EMA
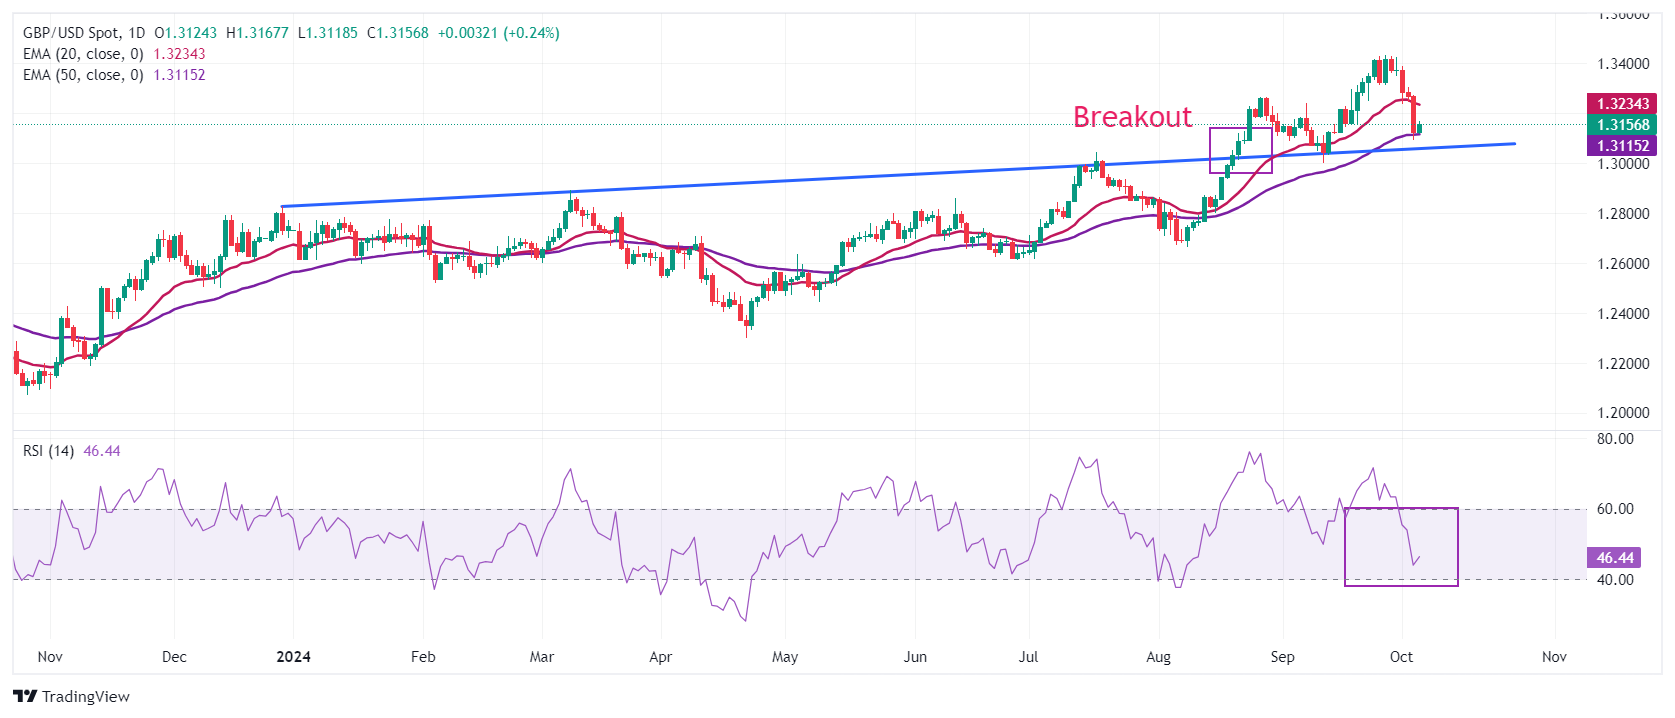
The Pound Sterling finds temporary support near the 50-day Exponential Moving Average (EMA), which stands around 1.3115, against the US Dollar. The GBP/USD gains ground after a sharp correction to near 1.3090 on Thursday from a more than two-year high of 1.3430 registered on September 26.
The 14-day Relative Strength Index (RSI) declines within the 40.00-60.00 range, suggesting a weakening of momentum.
More downsides could drag the Cable towards the trendline around 1.3060, plotted from the December 28, 2023, high of 1.2828. The pair delivered a sharp upside move after a breakout of this line on August 21. Looking up, the 20-day EMA near 1.3234 will be a major barricade for Pound Sterling bulls.
Pound Sterling FAQs
The Pound Sterling (GBP) is the oldest currency in the world (886 AD) and the official currency of the United Kingdom. It is the fourth most traded unit for foreign exchange (FX) in the world, accounting for 12% of all transactions, averaging $630 billion a day, according to 2022 data. Its key trading pairs are GBP/USD, also known as ‘Cable’, which accounts for 11% of FX, GBP/JPY, or the ‘Dragon’ as it is known by traders (3%), and EUR/GBP (2%). The Pound Sterling is issued by the Bank of England (BoE).
The single most important factor influencing the value of the Pound Sterling is monetary policy decided by the Bank of England. The BoE bases its decisions on whether it has achieved its primary goal of “price stability” – a steady inflation rate of around 2%. Its primary tool for achieving this is the adjustment of interest rates. When inflation is too high, the BoE will try to rein it in by raising interest rates, making it more expensive for people and businesses to access credit. This is generally positive for GBP, as higher interest rates make the UK a more attractive place for global investors to park their money. When inflation falls too low it is a sign economic growth is slowing. In this scenario, the BoE will consider lowering interest rates to cheapen credit so businesses will borrow more to invest in growth-generating projects.
Data releases gauge the health of the economy and can impact the value of the Pound Sterling. Indicators such as GDP, Manufacturing and Services PMIs, and employment can all influence the direction of the GBP. A strong economy is good for Sterling. Not only does it attract more foreign investment but it may encourage the BoE to put up interest rates, which will directly strengthen GBP. Otherwise, if economic data is weak, the Pound Sterling is likely to fall.
Another significant data release for the Pound Sterling is the Trade Balance. This indicator measures the difference between what a country earns from its exports and what it spends on imports over a given period. If a country produces highly sought-after exports, its currency will benefit purely from the extra demand created from foreign buyers seeking to purchase these goods. Therefore, a positive net Trade Balance strengthens a currency and vice versa for a negative balance.
Markets keep a moderate bearish bias on EUR/USD in the near term, even if their baseline expectation for a tick higher in US unemployment should offer a respite today, ING’s FX strategist Francesco Pesole notes.
A break below 1.1000 can drive EUR towards 1.09 relatively quickly
“Ultimately, the less supportive rate differentials, risk sentiment instability and a turbulent EU budget season mean EUR/USD could stay under pressure. 1.1000 is a big support, so a break lower could mean the correction extends to 1.09 relatively quickly.”
“The eurozone calendar doesn’t include market-moving data today, but there are quite a few European Central Bank speakers to watch. After the relatively dovish tone by Isabel Schnabel earlier this week, we can reasonably expect other hawks to give in to dovish pressure and no longer push back against an October cut.”
The Pound Sterling (GBP) fell after BoE Governor Bailey unexpectedly spoke about adopting a more aggressive easing stance. Pair was last at 1.3165 levels., OCBC’s FX analysts Frances Cheung and Christopher Wong note.
BoE can become a ‘bit more aggressive’
“In an interview with the Guardian, he said that the BoE could become a ‘bit more aggressive’ and ‘a bit more activist’ in its approach to cutting rates if the news on inflation continued to be good.”
“This is a flip from the last MPC in Sep where policymakers emphasized the need for policy to stay restrictive for ‘sufficiently long’ and that most members saw the need for gradual approach to removing restraint. A catch-up in dovish re-pricing should continue to dampen GBP bulls until the next MPC.”
“Daily momentum turned bearish while RSI fell. Tactical bias switches to sell on rallies for now. Resistance at 1.3230 (21 DMA), 1.3430 levels. Support at 1.3080 (50 DMA), 1.30 levels.”
Weakness has not stabilized. The Pound Sterling (GBP) could dip to 1.3080 before stabilisation can be expected. In the longer run, price action suggests further GBP weakness; the next major support at 1.3000 may not come into view so soon, UOB Group FX analysts Quek Ser Leang and Lee Sue Ann note.
The next major support is at 1.3000
24-HOUR VIEW: “While we expected GBP to weaken yesterday, we were of the view that ‘the major support 1.3210 level is unlikely to come under threat.’ However, GBP not only broke below 1.3210 but also plunged further, reaching a low of 1.3093. Not surprisingly, after such an outsized decline, conditions are severely oversold, but given that the weakness has not stabilised, GBP could dip to 1.3080 before stabilisation can be expected. The major support at 1.3000 is not expected to come into view. Resistance levels are at 1.3160 and 1.3200.”
1-3 WEEKS VIEW: “Our most recent narrative was from Wednesday (02 Oct, spot at 1.3275), wherein for GBP to continue to weaken, it ‘has to break the major support at 1.3210.’ We highlighted that ‘the chance of GBP breaking clearly below 1.3210 appears to be on the high side, provided that it remains below 1.3355.’ Yesterday, GBP broke below 1.3210, plunging to 1.3093. GBP closed lower by a whopping 1.05% (1.3127), its second largest 1-day drop this year. Although the price action suggests further weakness, short-term conditions are severely oversold, and the next major support at 1.3000 may not come into so soon. The downside risk will remain intact provided that GBP does not break above 1.3255 (‘strong resistance’ level previously at 1.3355).”
The US Dollar (USD) has continued to receive substantial support from rising oil prices. The latest rally in crude was driven by President Biden saying that strikes on Iran's oil facilities were being considered as part of Israel's retaliation. The commodities market assumption was probably that Biden would have tried to prevent supply disruptions and an oil price shock before the election, hence the surprise, FX strategist Francesco Pesole notes.
Payrolls and Middle-East conflict to drive DXY movements
“Today, the reaction to US jobs data will likely be combined with geopolitical and commodities' spillover into FX, rates and equities. The consensus payroll number is 150k, but a greater focus should be on the unemployment rate, which is expected to have flattened at 4.2%. Our economists' estimate is 115k for payrolls and 4.3% for the unemployment rate.”
“That probably doesn't change the picture for the Federal Reserve, which should still cut by 25bp in November and push back against 50bp for the time being. However, some hawkish repricing in the USD OIS curve has already happened this week, and the dollar could correct lower on a slightly soft jobs report.”
“But even assuming the Middle East situation doesn't spiral further and oil prices ease back, a substantial US data disappointment is likely needed to revive front-end USD rates bulls. Our view is that markets will gradually align with the Dot Plot's 25bp pace of easing and that dollar downsides are limited into the US election. Our rates team believes that 10-year Treasuries can head back to 4.0% in the near term should we see a consensus payroll print today.”
Silver prices (XAG/USD) broadly unchanged on Friday, according to FXStreet data. Silver trades at $32.04 per troy ounce, broadly unchanged 0.02% from the $32.03 it cost on Thursday.
Silver prices have increased by 34.63% since the beginning of the year.
| Unit measure | Silver Price Today in USD |
|---|---|
| Troy Ounce | 32.04 |
| 1 Gram | 1.03 |
The Gold/Silver ratio, which shows the number of ounces of Silver needed to equal the value of one ounce of Gold, stood at 82.99 on Friday, broadly unchanged from 82.94 on Thursday.
Silver FAQs
Silver is a precious metal highly traded among investors. It has been historically used as a store of value and a medium of exchange. Although less popular than Gold, traders may turn to Silver to diversify their investment portfolio, for its intrinsic value or as a potential hedge during high-inflation periods. Investors can buy physical Silver, in coins or in bars, or trade it through vehicles such as Exchange Traded Funds, which track its price on international markets.
Silver prices can move due to a wide range of factors. Geopolitical instability or fears of a deep recession can make Silver price escalate due to its safe-haven status, although to a lesser extent than Gold's. As a yieldless asset, Silver tends to rise with lower interest rates. Its moves also depend on how the US Dollar (USD) behaves as the asset is priced in dollars (XAG/USD). A strong Dollar tends to keep the price of Silver at bay, whereas a weaker Dollar is likely to propel prices up. Other factors such as investment demand, mining supply – Silver is much more abundant than Gold – and recycling rates can also affect prices.
Silver is widely used in industry, particularly in sectors such as electronics or solar energy, as it has one of the highest electric conductivity of all metals – more than Copper and Gold. A surge in demand can increase prices, while a decline tends to lower them. Dynamics in the US, Chinese and Indian economies can also contribute to price swings: for the US and particularly China, their big industrial sectors use Silver in various processes; in India, consumers’ demand for the precious metal for jewellery also plays a key role in setting prices.
Silver prices tend to follow Gold's moves. When Gold prices rise, Silver typically follows suit, as their status as safe-haven assets is similar. The Gold/Silver ratio, which shows the number of ounces of Silver needed to equal the value of one ounce of Gold, may help to determine the relative valuation between both metals. Some investors may consider a high ratio as an indicator that Silver is undervalued, or Gold is overvalued. On the contrary, a low ratio might suggest that Gold is undervalued relative to Silver.
(An automation tool was used in creating this post.)
The US Dollar (USD) is up for the 4th consecutive session overnight as US data surprised to the upside while geopolitical tensions in the middle east remains elevated. DXY was last at 101.93, OCBC’s FX analysts Frances Cheung and Christopher Wong note.
Daily momentum is bullish
“ISM services, prices paid and new orders were stronger though employment slipped into contractionary territory. Focus today turns to US payrolls. Consensus is looking for +150kprint for NFP (vs. +142k prior), unemployment rate and hourly earnings to hold steady at 4.2% and 3.8% y/y, respectively.”
“Markets may unwind some of its dovish bets if labor-related data comes in hotter, and this may continue to add to USD rebound momentum in the near term. But given that the USD has corrected somewhat this week, the risks for the USD can be symmetric. A downside print in NFP (i.e. cooler job market) may see recent USD gains fade.”
“Daily momentum is bullish while rise in RSI moderated. Some consolidation is likely intra-day. Resistance at 101.90 (50 DMA, 23.6% fibo retracement of 2023 high to 2024 low), 102.50 levels. Near term support at 101 (21 DMA), 100.20 (recent low).”
The Euro (EUR) is expected to trade between 1.1000 and 1.0050. In the longer run, to continue to decline, EUR not only has to break below 1.1000, but also the next solid support at 1.0980, UOB Group FX analysts Quek Ser Leang and Lee Sue Ann note.
EUR has to break below 1.1000 to continue falling
24-HOUR VIEW: “Two days ago, we expected EUR to ‘continue to weaken,’ but we pointed out that ‘any decline is likely limited to a test of 1.1030.’ After EUR dropped to a low of 1.1032, we highlighted yesterday that “the weakness has not stabilised, and EUR could edge lower but is unlikely to be able to break 1.1000.” Our view turned out to be correct, as EUR dropped to 1.1006, recovering to close at 1.1031 (-0.13%). While downward momentum is slowing and conditions remain rather oversold, there is no indication of a sustained rebound yet. Today, we expect EUR to trade between 1.1000 and 1.0050. Even if it can break below 1.1000, there is another major support at 1.0980.”
1-3 WEEKS VIEW: “On Wednesday (02 Oct), when EUR was trading at 1.1065), we noted the “rapid buildup in downward momentum.” We were of the view that this “is likely to lead to EUR weakness, and the levels to monitor are 1.1030 and 1.1000.” Yesterday, EUR broke below 1.1030, reaching a low of 1.1006. To continue to decline, EUR not only has to break below 1.1000 but also the next solid support at 1.0980. Looking ahead, the next level to watch below 1.0980 is 1.0935. Overall, we will continue to view EUR negatively as long as it remains below 1.1090 (‘strong resistance’ level previously at 1.1120).”
- The Mexican Peso trades mixed after rising for four consecutive days.
- Gains came from a move by the Supreme Court to re-examine controversial reforms and a Banxico official’s comments.
- USD/MXN falls to critical support at the base of its rising channel and the 50-day SMA.
The Mexican Peso (MXN) fluctuates between minor gains and losses on Friday during the European session after clocking up four successive up days in all three of its most-traded pairs: USD/MXN, EUR/MXN, and GBP/MXN.
The Peso’s strength came initially from Deputy Governor of the Bank of Mexico (Banxico) Jonathan Heath, who commented on Tuesday that interest rates should remain higher for “more time”. Higher interest rates encourage more foreign capital inflows and strengthen the Peso. Later in the week, news of a Supreme Court decision to review and potentially revise controversial reforms to the judiciary encouraged a continuation of the rally.
It should be noted that the Peso is now at the 50-day Simple Moving Average (SMA) level in all of three of its key pairs, a technical indicator institutional investors take into account during their decision-making.
Mexican Peso appreciates following Supreme Court motion
The Peso rallied on Thursday after the news that Mexico's 11 Supreme Court judges voted by a majority of eight to three to re-examine controversial constitutional reforms to the judiciary, passed by the government in September. The move could block the implementation of the reforms, which seek to have judges elected rather than appointed, according to El Financiero.
Mexican financial markets took a beating in June after the election of the Morena-led government amid investor concerns regarding these and other proposed reforms. They were a contributing factor in a 10% depreciation of the Mexican Peso. Critics argue that they threatened the independence of the judiciary, were anti-democratic, and endangered outside investment.
The new laws, which were voted in by the Mexican Parliament in September, remain a risk to Mexican assets including the Peso, as highlighted by advisory service Capital Economics in a recent note:
“At the moment, Mexico has an investment grade rating from all three major rating agencies and we doubt this will change in the near-term,” wrote Kimberley Sperrfechter, Emerging Markets Economist at Capital Economics, adding, “That said, if the judicial reform leads to a significant deterioration in the quality of institutions and weaker growth and fiscal policy isn’t tightened sufficiently, there is a risk that Mexico is downgraded in the medium-term.”
The decision to have the reforms re-examined has been spear-headed by Supreme Court Judge Juan Luis González Alcántara. It rests on the legal principle that the new laws risk undermining the independence of Mexico’s judiciary.
Whilst the Supreme Court does not have the power to annul the laws, it can decide whether they need to be revised. Morena’s Head of the Government of Mexico City, Marti Luis Batres, described the move as a “coup d’etat”.
Technical Analysis: USD/MXN falls to 50-day Moving Average
USD/MXN falls all the way down to the base of its rising channel and the level of the 50-day Simple Moving Average (SMA) – a key line in the sand for traders.
USD/MXN Daily Chart
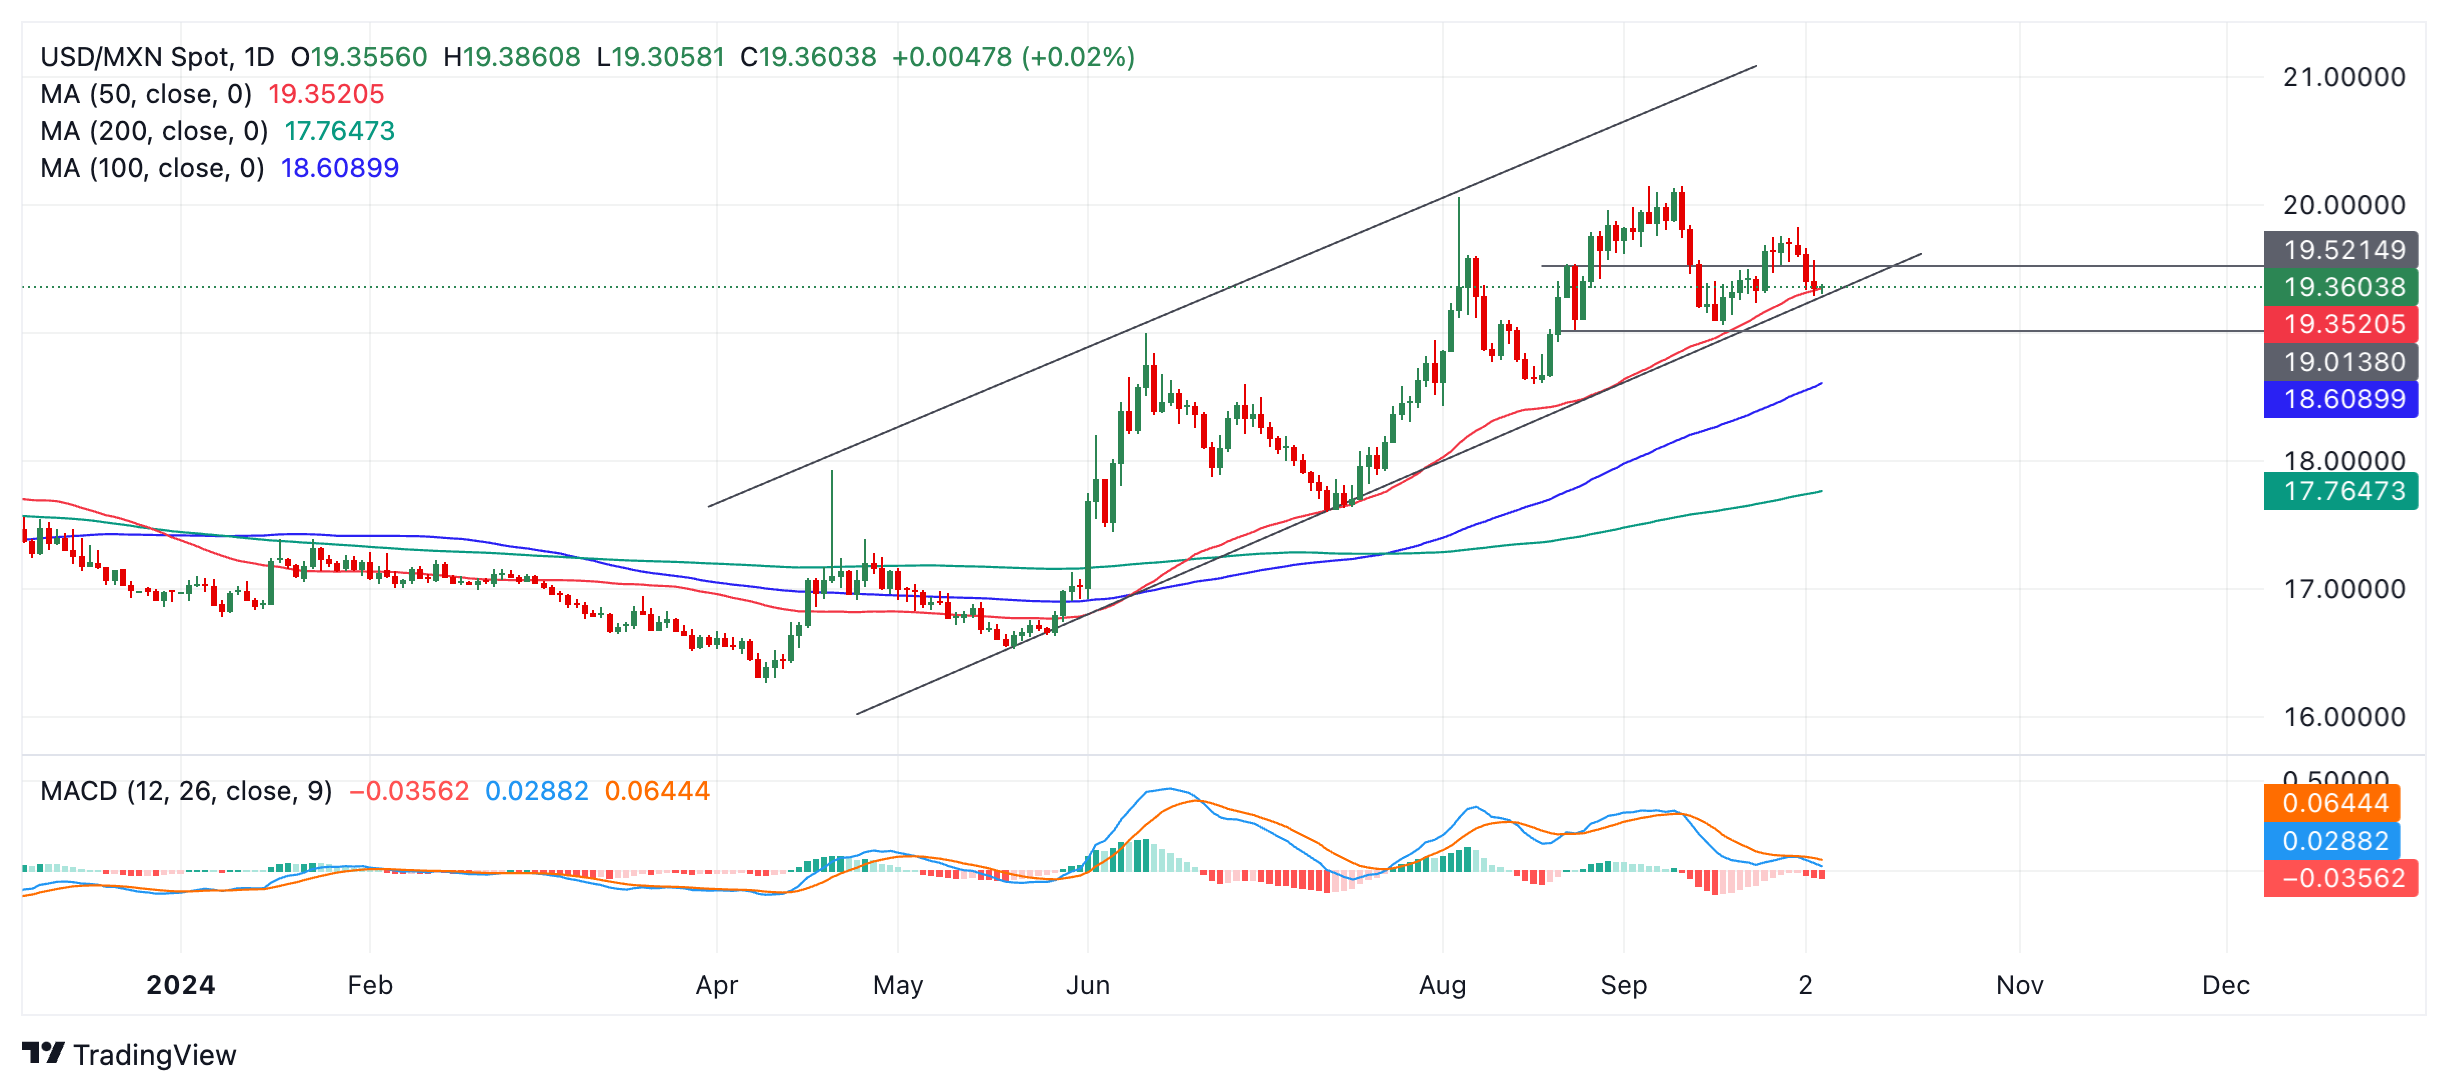
USD/MXN is expected to find support at this level, and there is a chance it will rebound and start moving higher within the range again. The medium and longer-term trends are now bullish, and given the technical analysis principle that “the trend is your friend,” the odds favor a recovery and continuation higher.
That said, the short-term trend is bearish, and the GBP/MXN cross has broken below its rising channel already, which can sometimes be a “canary in the coalmine” warning for other Peso pairs.
A decisive break below the channel and the 50-day SMA, therefore, risks threatening the medium-term uptrend in the USD/MXN. Such a move would be characterized by a longer-than-average bearish candlestick that pierced cleanly below both the channel line and the SMA, and closed near its low. Such a break would clear the way for losses, first down to 19.00 (August 23 low, round number) and then 18.60, the level of the 100-day SMA.
Mexican Peso FAQs
The Mexican Peso (MXN) is the most traded currency among its Latin American peers. Its value is broadly determined by the performance of the Mexican economy, the country’s central bank’s policy, the amount of foreign investment in the country and even the levels of remittances sent by Mexicans who live abroad, particularly in the United States. Geopolitical trends can also move MXN: for example, the process of nearshoring – or the decision by some firms to relocate manufacturing capacity and supply chains closer to their home countries – is also seen as a catalyst for the Mexican currency as the country is considered a key manufacturing hub in the American continent. Another catalyst for MXN is Oil prices as Mexico is a key exporter of the commodity.
The main objective of Mexico’s central bank, also known as Banxico, is to maintain inflation at low and stable levels (at or close to its target of 3%, the midpoint in a tolerance band of between 2% and 4%). To this end, the bank sets an appropriate level of interest rates. When inflation is too high, Banxico will attempt to tame it by raising interest rates, making it more expensive for households and businesses to borrow money, thus cooling demand and the overall economy. Higher interest rates are generally positive for the Mexican Peso (MXN) as they lead to higher yields, making the country a more attractive place for investors. On the contrary, lower interest rates tend to weaken MXN.
Macroeconomic data releases are key to assess the state of the economy and can have an impact on the Mexican Peso (MXN) valuation. A strong Mexican economy, based on high economic growth, low unemployment and high confidence is good for MXN. Not only does it attract more foreign investment but it may encourage the Bank of Mexico (Banxico) to increase interest rates, particularly if this strength comes together with elevated inflation. However, if economic data is weak, MXN is likely to depreciate.
As an emerging-market currency, the Mexican Peso (MXN) tends to strive during risk-on periods, or when investors perceive that broader market risks are low and thus are eager to engage with investments that carry a higher risk. Conversely, MXN tends to weaken at times of market turbulence or economic uncertainty as investors tend to sell higher-risk assets and flee to the more-stable safe havens.
- USD/CHF consolidates in a range below the 50-day SMA as traders await the US NFP report.
- A modest USD pullback from a one-month high is seen as a key factor capping the major.
- Reduced bets for a 50 bps Fed rate cut in November lend support to the USD and the pair.
The USD/CHF pair reverses an intraday dip to the 0.8500 psychological mark and climbs back closer to a three-week top during the first half of the European session on Friday. Spot prices, however, remain below the 50-day Simple Moving Average (SMA), warranting some caution for bullish traders ahead of the release of the US monthly employment details.
The popularly known US Nonfarm Payrolls (NFP) report is expected to show that the economy added 140K jobs in September, slightly lower than the 142K in the previous month, and the Unemployment Rate held steady at 4.2%. Apart from this, Average Hourly Earnings might provide cues about the size of the Federal Reserve's (Fed) rate cut in November. This, in turn, will play a key role in driving the US Dollar (USD) demand and determining the next leg of a directional move for the USD/CHF pair.
Ahead of the key data, some repositioning trade drags the USD Index (DXY), which tracks the Greenback against a basket of currencies, away from a one-month high touched on Thursday. This, in turn, acts as a headwind for spot prices amid a further escalation of geopolitical tensions in the Middle East. That said, reduced bets for an oversized rate cut by the Federal Reserve (Fed) in November limit the USD losses and support prospects for a further appreciating move for the USD/CHF pair.
Nevertheless, spot prices seem poised to register strong weekly gains, though remain confined in a multi-week-old trading range. This makes it prudent to wait for sustained strength and acceptance above the 50-day SMA hurdle, around the 0.8540 region, before positioning for an extension of this week's goodish rebound from sub-0.8400 levels, or the lower end of the short-term range.
Economic Indicator
Nonfarm Payrolls
The Nonfarm Payrolls release presents the number of new jobs created in the US during the previous month in all non-agricultural businesses; it is released by the US Bureau of Labor Statistics (BLS). The monthly changes in payrolls can be extremely volatile. The number is also subject to strong reviews, which can also trigger volatility in the Forex board. Generally speaking, a high reading is seen as bullish for the US Dollar (USD), while a low reading is seen as bearish, although previous months' reviews and the Unemployment Rate are as relevant as the headline figure. The market's reaction, therefore, depends on how the market assesses all the data contained in the BLS report as a whole.
Read more.Next release: Fri Oct 04, 2024 12:30
Frequency: Monthly
Consensus: 140K
Previous: 142K
Source: US Bureau of Labor Statistics
America’s monthly jobs report is considered the most important economic indicator for forex traders. Released on the first Friday following the reported month, the change in the number of positions is closely correlated with the overall performance of the economy and is monitored by policymakers. Full employment is one of the Federal Reserve’s mandates and it considers developments in the labor market when setting its policies, thus impacting currencies. Despite several leading indicators shaping estimates, Nonfarm Payrolls tend to surprise markets and trigger substantial volatility. Actual figures beating the consensus tend to be USD bullish.
Iran's Supreme Leader Ayatollah Ali Khamenei said on Friday that “we will not delay nor rush to respond to Israel.”
Further comments
Muslim nations have a common enemy.
Muslim nations have to strap the belt of defense from Afghanistan to Yemen, from Iran to Gaza and Lebanon.
Every country has the right to defend itself from aggressors.
Oct. 7 attack was a legitimate act, so was Iran's attack on Israel.
Here is what you need to know on Friday, October 4:
The US Dollar (USD) Index, which tracks the USD's valuation against a basket of six major currencies, extended its weekly uptrend and registered its highest daily close since mid-August on Thursday. Early Friday, the index edges slightly lower as investors gear up for the US employment report for September, which will include Nonfarm Payrolls (NFP), Unemployment Rate and wage inflation figures.
US Dollar PRICE This week
The table below shows the percentage change of US Dollar (USD) against listed major currencies this week. US Dollar was the strongest against the Japanese Yen.
| USD | EUR | GBP | JPY | CAD | AUD | NZD | CHF | |
|---|---|---|---|---|---|---|---|---|
| USD | 1.24% | 1.60% | 2.87% | 0.36% | 0.90% | 2.16% | 1.26% | |
| EUR | -1.24% | 0.36% | 1.60% | -0.85% | -0.27% | 0.93% | 0.13% | |
| GBP | -1.60% | -0.36% | 1.37% | -1.21% | -0.64% | 0.57% | -0.27% | |
| JPY | -2.87% | -1.60% | -1.37% | -2.39% | -1.96% | -0.66% | -1.51% | |
| CAD | -0.36% | 0.85% | 1.21% | 2.39% | 0.59% | 1.80% | 0.99% | |
| AUD | -0.90% | 0.27% | 0.64% | 1.96% | -0.59% | 1.21% | 0.37% | |
| NZD | -2.16% | -0.93% | -0.57% | 0.66% | -1.80% | -1.21% | -0.86% | |
| CHF | -1.26% | -0.13% | 0.27% | 1.51% | -0.99% | -0.37% | 0.86% |
The heat map shows percentage changes of major currencies against each other. The base currency is picked from the left column, while the quote currency is picked from the top row. For example, if you pick the US Dollar from the left column and move along the horizontal line to the Japanese Yen, the percentage change displayed in the box will represent USD (base)/JPY (quote).
Investors expect the NFP to rise by 140,000 following the 142,000 increase recorded in August and see the Unemployment Rate holding steady at 4.2%. Ahead of these key data releases, the USD Index fluctuates in a tight range slightly below 102.00. Meanwhile, US stock index futures trade mixed, pointing to a cautious stance. The data from the US showed on Thursday that the number of first-time applications for unemployment benefits rose to 225,000 in the week ending September 28 from 219,000 in the previous week. On a positive note, the ISM Services PMI improved to 54.9 in September from 51.5 in August, highlighting an ongoing expansion in the service sector's business activity at an accelerating pace.
EUR/USD closed the fifth consecutive trading day in negative territory on Thursday. The pair struggles to gain traction in the European morning on Friday and trades slightly above 1.1000.
GBP/USD declined sharply and lost more than 1% on Thursday, pressured by the broad-based USD strength and dovish comments from Bank of England Governor Andrew Bailey. The pair stages a technical correction early Friday and trades in positive territory above 1.3150.
Following Wednesday's upsurge, USD/JPY continued to inch higher and rose above 147.00 for the first time since early September on Thursday. The pair lost its traction during the Asian trading hours on Friday and retreated below 146.50.
Gold dropped below $2,640 on Thursday but erased a large portion of its daily losses in the American session. XAU/USD stays relatively quiet and trades in a narrow band at around $2,660 early Friday.
Nonfarm Payrolls FAQs
Nonfarm Payrolls (NFP) are part of the US Bureau of Labor Statistics monthly jobs report. The Nonfarm Payrolls component specifically measures the change in the number of people employed in the US during the previous month, excluding the farming industry.
The Nonfarm Payrolls figure can influence the decisions of the Federal Reserve by providing a measure of how successfully the Fed is meeting its mandate of fostering full employment and 2% inflation. A relatively high NFP figure means more people are in employment, earning more money and therefore probably spending more. A relatively low Nonfarm Payrolls’ result, on the either hand, could mean people are struggling to find work. The Fed will typically raise interest rates to combat high inflation triggered by low unemployment, and lower them to stimulate a stagnant labor market.
Nonfarm Payrolls generally have a positive correlation with the US Dollar. This means when payrolls’ figures come out higher-than-expected the USD tends to rally and vice versa when they are lower. NFPs influence the US Dollar by virtue of their impact on inflation, monetary policy expectations and interest rates. A higher NFP usually means the Federal Reserve will be more tight in its monetary policy, supporting the USD.
Nonfarm Payrolls are generally negatively-correlated with the price of Gold. This means a higher-than-expected payrolls’ figure will have a depressing effect on the Gold price and vice versa. Higher NFP generally has a positive effect on the value of the USD, and like most major commodities Gold is priced in US Dollars. If the USD gains in value, therefore, it requires less Dollars to buy an ounce of Gold. Also, higher interest rates (typically helped higher NFPs) also lessen the attractiveness of Gold as an investment compared to staying in cash, where the money will at least earn interest.
Nonfarm Payrolls is only one component within a bigger jobs report and it can be overshadowed by the other components. At times, when NFP come out higher-than-forecast, but the Average Weekly Earnings is lower than expected, the market has ignored the potentially inflationary effect of the headline result and interpreted the fall in earnings as deflationary. The Participation Rate and the Average Weekly Hours components can also influence the market reaction, but only in seldom events like the “Great Resignation” or the Global Financial Crisis.
- GBP/JPY remains under some selling pressure for the second straight day on Friday.
- BoE Governor Bailey’s dovish remarks on Thursday continue to undermine the GBP.
- Geopolitical risks benefit the safe-haven JPY and further exert pressure on the cross.
- The BoJ rate hike uncertainty cap gains for the JPY and limits losses for spot prices.
The GBP/JPY cross finds some near the 191.70 region on Friday and for now, seems to have stalled the overnight sharp pullback from a one-week high – levels beyond the 195.00 psychological mark. Spot prices, however, remain in negative territory for the second straight day and currently trade just below mid-192.00s, down nearly 0.25% for the day.
The British Pound (GBP) continues to be undermined by the overnight dovish remarks by the Bank of England (BoE) Governor Andrew Bailey, saying that there was a chance that the central bank could become a bit more aggressive in cutting rates if there's further good news on inflation. Furthermore, geopolitical risks stemming from the ongoing conflicts in the Middle East drive some haven flows towards the Japanese Yen (JPY) and contribute to the offered tone surrounding the GBP/JPY cross.
Meanwhile, Asahi Noguchi, a dovish Bank of Japan (BoJ) board member said on Thursday that the central bank has scope to raise interest rates further but must move cautiously and slowly to avoid hurting the economy. This, in turn, further underpins the JPY, though the uncertainty over future interest rate hikes by the BoJ limits the downside for the GBP/JPY cross. Japan's new Prime Minister Shigeru Ishiba said this week that Japan is not in an environment for an additional rate increase.
Furthermore, Japan's Economy Minister Ryosei Akazawa stated that the PM and the BoJ both agree that overcoming deflation is Japan's highest priority. Adding to this, BoE's Chief Economist Huw Pill said this Friday that it will be important to guard against the risk of cutting interest rates either too far or too fast. This assists the GBP/JPY cross to rebound around 70-80 pips from the daily swing low. That said, the lack of any follow-through buying warrants some caution for bullish traders.
BoE FAQs
The Bank of England (BoE) decides monetary policy for the United Kingdom. Its primary goal is to achieve ‘price stability’, or a steady inflation rate of 2%. Its tool for achieving this is via the adjustment of base lending rates. The BoE sets the rate at which it lends to commercial banks and banks lend to each other, determining the level of interest rates in the economy overall. This also impacts the value of the Pound Sterling (GBP).
When inflation is above the Bank of England’s target it responds by raising interest rates, making it more expensive for people and businesses to access credit. This is positive for the Pound Sterling because higher interest rates make the UK a more attractive place for global investors to park their money. When inflation falls below target, it is a sign economic growth is slowing, and the BoE will consider lowering interest rates to cheapen credit in the hope businesses will borrow to invest in growth-generating projects – a negative for the Pound Sterling.
In extreme situations, the Bank of England can enact a policy called Quantitative Easing (QE). QE is the process by which the BoE substantially increases the flow of credit in a stuck financial system. QE is a last resort policy when lowering interest rates will not achieve the necessary result. The process of QE involves the BoE printing money to buy assets – usually government or AAA-rated corporate bonds – from banks and other financial institutions. QE usually results in a weaker Pound Sterling.
Quantitative tightening (QT) is the reverse of QE, enacted when the economy is strengthening and inflation starts rising. Whilst in QE the Bank of England (BoE) purchases government and corporate bonds from financial institutions to encourage them to lend; in QT, the BoE stops buying more bonds, and stops reinvesting the principal maturing on the bonds it already holds. It is usually positive for the Pound Sterling.
Bank of England (BoE) Chief Economist Huw Pill said in a scheduled appearance on Friday that there is an “ample reason for caution in assessing the dissipation of inflation persistence.”
Pill added that the “need for such caution points to a gradual withdrawal of monetary policy restriction.”
Additional comments
Further cuts in bank rate remain in prospect but it will be important to guard against the risk of cutting rates either too far or too fast.
I remain concerned about the possibility of structural changes sustaining more lasting inflationary pressures.
Current wage and services price inflation are a source of continued concern.
Market reaction
At the press time, GBP/USD is off the highs, despite the prudent comments, trading 0.21% on the day at 1.3150.
British Pound PRICE Today
The table below shows the percentage change of British Pound (GBP) against listed major currencies today. British Pound was the strongest against the New Zealand Dollar.
| USD | EUR | GBP | JPY | CAD | AUD | NZD | CHF | |
|---|---|---|---|---|---|---|---|---|
| USD | 0.07% | -0.24% | -0.37% | 0.03% | -0.04% | 0.12% | 0.02% | |
| EUR | -0.07% | -0.26% | -0.45% | -0.02% | -0.12% | 0.07% | -0.07% | |
| GBP | 0.24% | 0.26% | -0.13% | 0.27% | 0.17% | 0.35% | 0.21% | |
| JPY | 0.37% | 0.45% | 0.13% | 0.41% | 0.33% | 0.48% | 0.36% | |
| CAD | -0.03% | 0.02% | -0.27% | -0.41% | -0.09% | 0.12% | -0.06% | |
| AUD | 0.04% | 0.12% | -0.17% | -0.33% | 0.09% | 0.18% | -0.01% | |
| NZD | -0.12% | -0.07% | -0.35% | -0.48% | -0.12% | -0.18% | -0.16% | |
| CHF | -0.02% | 0.07% | -0.21% | -0.36% | 0.06% | 0.00% | 0.16% |
The heat map shows percentage changes of major currencies against each other. The base currency is picked from the left column, while the quote currency is picked from the top row. For example, if you pick the British Pound from the left column and move along the horizontal line to the US Dollar, the percentage change displayed in the box will represent GBP (base)/USD (quote).
European Central Bank (ECB) policymaker Mario Centeno said on Friday that “inflation is controlled.”
Additional quotes
Inflation today is very close to 2%.
The dynamic of the labour market is cooling a little bit.
Market reaction
EUR/USD was last seen trading flat at 1.1030, awaiting the key US Nonfarm Payrolls data.
ECB FAQs
The European Central Bank (ECB) in Frankfurt, Germany, is the reserve bank for the Eurozone. The ECB sets interest rates and manages monetary policy for the region. The ECB primary mandate is to maintain price stability, which means keeping inflation at around 2%. Its primary tool for achieving this is by raising or lowering interest rates. Relatively high interest rates will usually result in a stronger Euro and vice versa. The ECB Governing Council makes monetary policy decisions at meetings held eight times a year. Decisions are made by heads of the Eurozone national banks and six permanent members, including the President of the ECB, Christine Lagarde.
In extreme situations, the European Central Bank can enact a policy tool called Quantitative Easing. QE is the process by which the ECB prints Euros and uses them to buy assets – usually government or corporate bonds – from banks and other financial institutions. QE usually results in a weaker Euro. QE is a last resort when simply lowering interest rates is unlikely to achieve the objective of price stability. The ECB used it during the Great Financial Crisis in 2009-11, in 2015 when inflation remained stubbornly low, as well as during the covid pandemic.
Quantitative tightening (QT) is the reverse of QE. It is undertaken after QE when an economic recovery is underway and inflation starts rising. Whilst in QE the European Central Bank (ECB) purchases government and corporate bonds from financial institutions to provide them with liquidity, in QT the ECB stops buying more bonds, and stops reinvesting the principal maturing on the bonds it already holds. It is usually positive (or bullish) for the Euro.
- EUR/USD trades with caution above 1.1000 as the focus shifts to the US NFP.
- A sharp expansion in the US ISM Service Prices Paid has renewed fears of price pressures remaining persistent.
- ECB Schnabel remained concerned about the growing economic risks in the Eurozone.
EUR/USD trades in a tight range above the psychological support of 1.1000 in Friday’s European session. The major currency pair consolidates near 1.1030, while the US Dollar (USD) edges lower ahead of the United States (US) Nonfarm Payrolls (NFP) report for September, which will published at 12:30 GMT.
The US Dollar Index (DXY), which tracks the Greenback’s value against six major currencies, drops slightly to 101.80. However, it holds this week’s sharp recovery from the yearly low near 100.10.
Investors will pay close attention to the US NFP report as it will likely influence the pace of the Federal Reserve’s (Fed) policy easing for the remainder of the year. Economists estimate that US employers hired 140K new employees, slightly lower than 142K in August. The Unemployment Rate is expected to remain steady at 4.2%.
Average Hourly Earnings are estimated to have grown at a slower pace of 0.3% month-on-month from 0.4% in August, with annual figures growing steadily by 3.8%.
Looking at the CME FedWatch tool, traders appear to have already adjusted Fed rate cut expectations for November. The 30-day Federal Funds futures pricing data shows that the probability of a further cut in interest rates by 50 basis points (bps) in November has declined to 33% from 53% a week ago. Fed large rate cut prospects for November waned sharply after the upbeat ADP Employment Change data for September and JOLTS Job Openings data for August.
Meanwhile, growing risks of inflation remaining persistent have also forced traders to pare high Fed jumbo rate cut bets. Thursday’s ISM Services PMI report for September showed that its component Prices Paid – which indicates a change in input cost – surprisingly expanded at a faster pace to 59.4. The Services PMI – which gauges activities in the service sector that accounts for two-thirds of the economy – grew at a robust pace to 54.9 from the estimates of 51.7 and the August reading of 51.5.
Daily digest market movers: EUR/USD remains on the backfoot amid dismal market mood
- EUR/USD trades sideways near 1.1030 in European trading hours after finding temporary support near 1.1000 on Thursday. The major currency pair strives to end its five-day losing streak. However, the pair could face more pressure as dismal market sentiment and the growing Middle East conflict would continue to weigh on risk-perceived assets, such as the Euro (EUR).
- Conflicts between Iran and Israel deepened after the killing of Hezbollah leader Hassan Nasrallah, in retaliation to which Tehran launched hundreds of ballistic missiles on military bases in the Tel Aviv region.
- Meanwhile, growing speculation for the European Central Bank (ECB) to cut interest rates again on October 17 has sent the Euro on the backfoot. Market expectations for ECB rate cuts have increased due to deepening Eurozone growth worries and a decline in the continent’s Harmonized Index of Consumer Prices (HICP) below the bank’s target of 2% in September.
- ECB board member Isabel Schnabel, who has remained an outspoken hawk, expressed concerns over growth risks in a speech on Wednesday. "We cannot ignore the headwinds to growth," Schnabel said. She also remained confident about inflation sustainably falling to 2% in a timely manner, with softening labor demand and further progress in disinflation.
Technical Analysis: EUR/USD seeks to gain ground near 1.1000
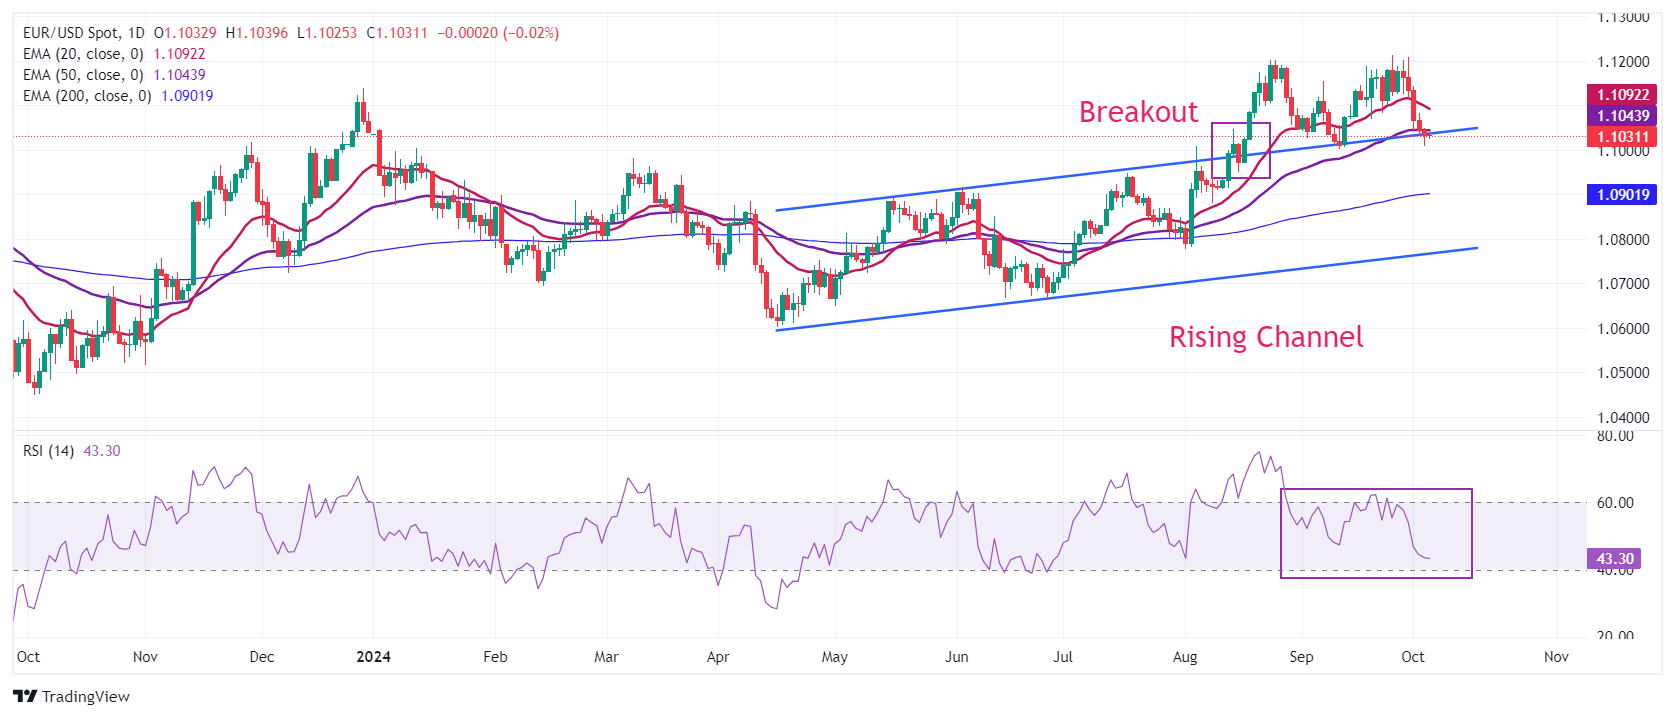
EUR/USD remains on the backfoot near the psychological support of 1.1000. The near-term outlook of the major currency pair has weakened as it trades slightly below the 50-day Exponential Moving Average (EMA), which stands at around 1.1043.
The shared currency pair continues to hold the breakout of the Rising Channel pattern in the daily chart, which occurred in the third week of August. A fresh downside would appear if the pair breaks below the upper line of the pattern.
The 14-day Relative Strength Index (RSI) has declined to near 40.00, suggesting a weakening of momentum.
Looking down, a downside move below 1.1000 will result in a further decline toward the 200-day EMA around 1.0900. On the upside, the 20-day EMA at 1.1090 and the September high around 1.1200 will be major resistance zones.
Euro FAQs
The Euro is the currency for the 19 European Union countries that belong to the Eurozone. It is the second most heavily traded currency in the world behind the US Dollar. In 2022, it accounted for 31% of all foreign exchange transactions, with an average daily turnover of over $2.2 trillion a day. EUR/USD is the most heavily traded currency pair in the world, accounting for an estimated 30% off all transactions, followed by EUR/JPY (4%), EUR/GBP (3%) and EUR/AUD (2%).
The European Central Bank (ECB) in Frankfurt, Germany, is the reserve bank for the Eurozone. The ECB sets interest rates and manages monetary policy. The ECB’s primary mandate is to maintain price stability, which means either controlling inflation or stimulating growth. Its primary tool is the raising or lowering of interest rates. Relatively high interest rates – or the expectation of higher rates – will usually benefit the Euro and vice versa. The ECB Governing Council makes monetary policy decisions at meetings held eight times a year. Decisions are made by heads of the Eurozone national banks and six permanent members, including the President of the ECB, Christine Lagarde.
Eurozone inflation data, measured by the Harmonized Index of Consumer Prices (HICP), is an important econometric for the Euro. If inflation rises more than expected, especially if above the ECB’s 2% target, it obliges the ECB to raise interest rates to bring it back under control. Relatively high interest rates compared to its counterparts will usually benefit the Euro, as it makes the region more attractive as a place for global investors to park their money.
Data releases gauge the health of the economy and can impact on the Euro. Indicators such as GDP, Manufacturing and Services PMIs, employment, and consumer sentiment surveys can all influence the direction of the single currency. A strong economy is good for the Euro. Not only does it attract more foreign investment but it may encourage the ECB to put up interest rates, which will directly strengthen the Euro. Otherwise, if economic data is weak, the Euro is likely to fall. Economic data for the four largest economies in the euro area (Germany, France, Italy and Spain) are especially significant, as they account for 75% of the Eurozone’s economy.
Another significant data release for the Euro is the Trade Balance. This indicator measures the difference between what a country earns from its exports and what it spends on imports over a given period. If a country produces highly sought after exports then its currency will gain in value purely from the extra demand created from foreign buyers seeking to purchase these goods. Therefore, a positive net Trade Balance strengthens a currency and vice versa for a negative balance.
- NZD/USD continues to lose ground as the RBNZ is widely expected to deliver a 50 basis point rate cut in October.
- HSBC and BNZ expect the RBNZ to lower its cash rate by 50 basis points next week.
- The US Dollar received support as recent US data faded the dovish sentiment surrounding the Fed’s policy outlook.
NZD/USD extends its losing streak, trading around 0.6200 during the early European hours on Friday. This downside of the pair could be attributed to dovish sentiment surrounding the Reserve Bank of New Zealand's (RBNZ) monetary policy stance next week. RBNZ is widely expected to deliver a 50 basis point interest rate cut amid concerns over weak economic growth and rising unemployment.
HSBC analysts expect the Reserve Bank of New Zealand (RBNZ) to lower its cash rate by 50 basis points in both October and November, revising their previous forecast of 25 basis point cuts for each month. Similarly, the Bank of New Zealand (BNZ) is also forecasting a 50 basis point cut from the RBNZ next week, citing disinflationary data as a key factor that could prompt the central bank to accelerate its easing measures.
The risk-sensitive NZD/USD pair could struggle due to safe-haven flows amid escalating Middle-East tensions. US President Joe Biden stated that the United States (US) is in discussions with Israel about potential strikes on Iran's Oil infrastructure. Israeli Prime Minister Benjamin Netanyahu warned that Iran "will pay a heavy price" for Tuesday’s attack, which involved the firing of at least 180 ballistic missiles at Israel, according to the BBC.
The US Dollar (USD) received support from better-than-expected US ISM Services PMI and ADP Employment Change data released this week. These reports have challenged dovish expectations for Federal Reserve (Fed) monetary policy.
Federal Reserve Bank of Chicago President Austan Goolsbee said on Thursday that the interest rates need to come down over the next year by “a lot.” Goolsbee further stated that he’d like to keep the unemployment rate at 4.2% and prevent it from rising any further.
New Zealand Dollar FAQs
The New Zealand Dollar (NZD), also known as the Kiwi, is a well-known traded currency among investors. Its value is broadly determined by the health of the New Zealand economy and the country’s central bank policy. Still, there are some unique particularities that also can make NZD move. The performance of the Chinese economy tends to move the Kiwi because China is New Zealand’s biggest trading partner. Bad news for the Chinese economy likely means less New Zealand exports to the country, hitting the economy and thus its currency. Another factor moving NZD is dairy prices as the dairy industry is New Zealand’s main export. High dairy prices boost export income, contributing positively to the economy and thus to the NZD.
The Reserve Bank of New Zealand (RBNZ) aims to achieve and maintain an inflation rate between 1% and 3% over the medium term, with a focus to keep it near the 2% mid-point. To this end, the bank sets an appropriate level of interest rates. When inflation is too high, the RBNZ will increase interest rates to cool the economy, but the move will also make bond yields higher, increasing investors’ appeal to invest in the country and thus boosting NZD. On the contrary, lower interest rates tend to weaken NZD. The so-called rate differential, or how rates in New Zealand are or are expected to be compared to the ones set by the US Federal Reserve, can also play a key role in moving the NZD/USD pair.
Macroeconomic data releases in New Zealand are key to assess the state of the economy and can impact the New Zealand Dollar’s (NZD) valuation. A strong economy, based on high economic growth, low unemployment and high confidence is good for NZD. High economic growth attracts foreign investment and may encourage the Reserve Bank of New Zealand to increase interest rates, if this economic strength comes together with elevated inflation. Conversely, if economic data is weak, NZD is likely to depreciate.
The New Zealand Dollar (NZD) tends to strengthen during risk-on periods, or when investors perceive that broader market risks are low and are optimistic about growth. This tends to lead to a more favorable outlook for commodities and so-called ‘commodity currencies’ such as the Kiwi. Conversely, NZD tends to weaken at times of market turbulence or economic uncertainty as investors tend to sell higher-risk assets and flee to the more-stable safe havens.
- EUR/GBP loses ground as lower inflation data in the Eurozone bolstered the likelihood of an ECB rate cut this month.
- Markets reflect a 95% probability of a 25 basis point rate cut by the European Central Bank in October.
- BoE DMP survey showed that one year ahead expected inflation by UK firms declined by an additional 0.1% in Q3.
EUR/GBP retraces its recent gains, trading around 0.8390 during the Asian session on Friday. This downside could be attributed to the lower inflation reading in the Eurozone increasing expectations of a rate cut by the European Central Bank (ECB) in October, which would mark the central bank's third reduction this year.
Earlier this week, the Harmonized Index of Consumer Prices dropped to 1.8% year-over-year in September, falling below the ECB’s 2% target and lowest since April 2021. Markets reflect a 95% probability of a 25 basis point rate cut this month.
However, the EUR/GBP cross gained ground following the dovish comments by Bank of England (BoE) Governor Andrew Bailey on Thursday. BoE Governor Bailey said the prospect of the central bank becoming a “bit more aggressive” in cutting interest rates as the development of inflation continued to be good. The Bank of England is widely expected to cut the policy rate by 25 bps at the November meeting.
The latest Bank of England Decision Maker Panel (DMP) survey, released on Thursday, indicated that "one-year ahead expected CPI inflation by UK firms declined by an additional 0.1% to 2.6% in the quarter to September." Expected year-ahead wage growth remained steady at 4.1% on a three-month moving average in September, while business uncertainty decreased over the same period.
Interest rates FAQs
Interest rates are charged by financial institutions on loans to borrowers and are paid as interest to savers and depositors. They are influenced by base lending rates, which are set by central banks in response to changes in the economy. Central banks normally have a mandate to ensure price stability, which in most cases means targeting a core inflation rate of around 2%. If inflation falls below target the central bank may cut base lending rates, with a view to stimulating lending and boosting the economy. If inflation rises substantially above 2% it normally results in the central bank raising base lending rates in an attempt to lower inflation.
Higher interest rates generally help strengthen a country’s currency as they make it a more attractive place for global investors to park their money.
Higher interest rates overall weigh on the price of Gold because they increase the opportunity cost of holding Gold instead of investing in an interest-bearing asset or placing cash in the bank. If interest rates are high that usually pushes up the price of the US Dollar (USD), and since Gold is priced in Dollars, this has the effect of lowering the price of Gold.
The Fed funds rate is the overnight rate at which US banks lend to each other. It is the oft-quoted headline rate set by the Federal Reserve at its FOMC meetings. It is set as a range, for example 4.75%-5.00%, though the upper limit (in that case 5.00%) is the quoted figure. Market expectations for future Fed funds rate are tracked by the CME FedWatch tool, which shapes how many financial markets behave in anticipation of future Federal Reserve monetary policy decisions.
- AUD/JPY weakens to near 100.00 in Friday’s early Asian session, down 0.50% on the day.
- The cross keeps the bullish vibe above the key 100-period EMA, but RSI indicator shows neutral momentum.
- The immediate resistance level is located at 100.73; the first downside target emerges at the 99.00 psychological level.
The AUD/JPY cross extends its decline to around 100.00 during the early European session on Friday. The Japanese Yen (JPY) climbs against the Australian Dollar (AUD) after comments from Japan’s ministers earlier in the day.
Japan's new economy minister Ryosei Akazawa said on Friday that the timing of changes in the Bank of Japan’s (BoJ) monetary policy should be aligned with the broader goal of exiting deflation. Additionally, Japan's Chief Cabinet Secretary Yoshimasa Hayashi announced on Friday that new Prime Minister Shigeru Ishiba has instructed the compilation of a comprehensive economic package. Hayashi added that he will submit a supplementary budget to Parliament after the lower house election.
According to the 4-hour chart, the positive outlook of the AUD/JPY cross prevails as the cross holds above the key 100-period Exponential Moving Averages (EMA). However, the further consolidation cannot be ruled out as the Relative Strength Index (RSI) hovers around the midline, suggesting the neutral momentum of the cross.
The immediate resistance level emerges near the high of October at 100.73. Further north, the next upside barrier is seen at 101.35, the upper boundary of the Bollinger Band. The additional upside filter to watch is the 102.00 psychological mark.
On the downside, the 99.00 psychological level acts as an initial support level for the cross. Any follow-through selling below this level will see a drop to the 98.45-98.65 region, representing the 100-period EMA and the lower limit of the Bollinger Band. Extended losses will see the next downside target at 97.63, the low of September 23.
AUD/JPY 4-hour chart
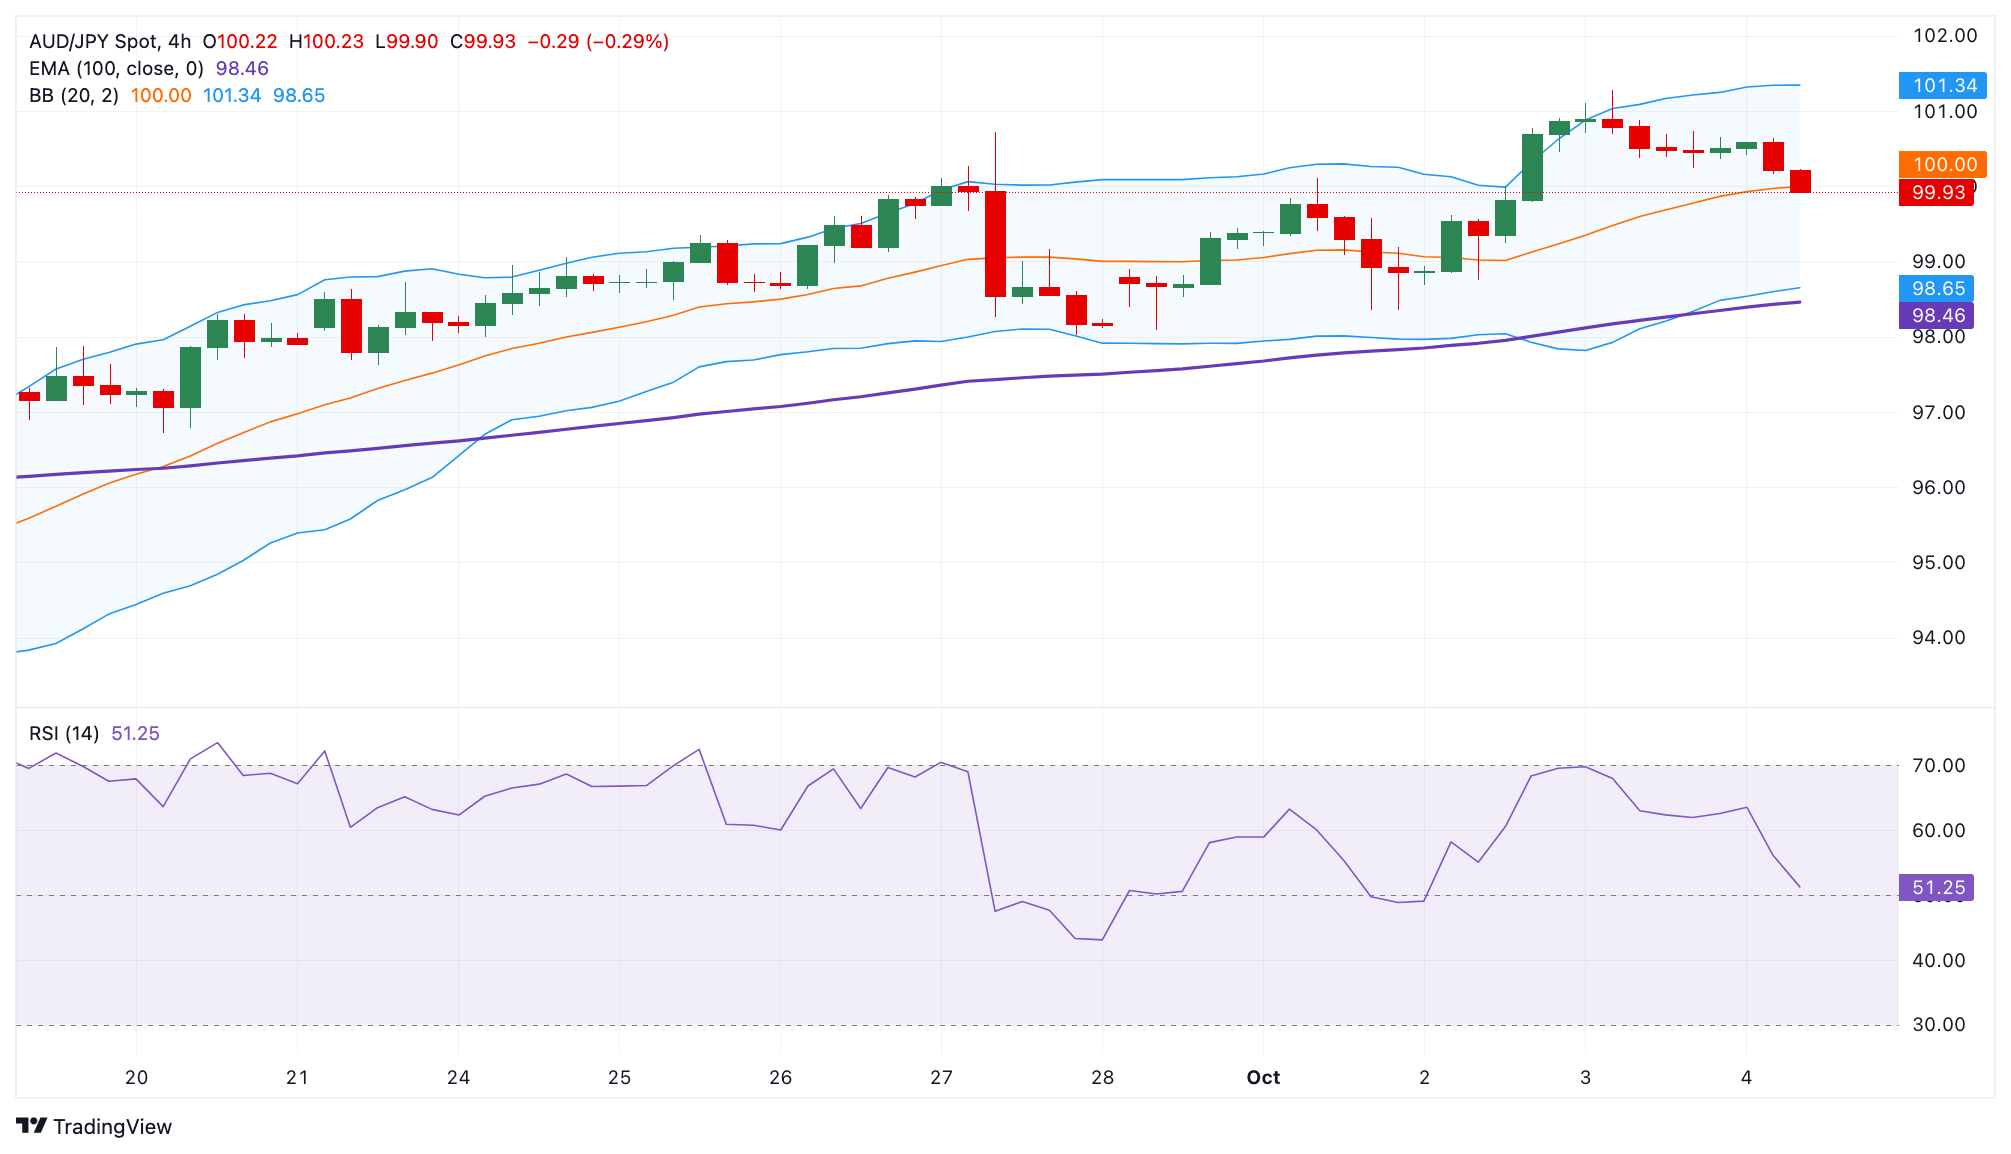
Japanese Yen FAQs
The Japanese Yen (JPY) is one of the world’s most traded currencies. Its value is broadly determined by the performance of the Japanese economy, but more specifically by the Bank of Japan’s policy, the differential between Japanese and US bond yields, or risk sentiment among traders, among other factors.
One of the Bank of Japan’s mandates is currency control, so its moves are key for the Yen. The BoJ has directly intervened in currency markets sometimes, generally to lower the value of the Yen, although it refrains from doing it often due to political concerns of its main trading partners. The BoJ ultra-loose monetary policy between 2013 and 2024 caused the Yen to depreciate against its main currency peers due to an increasing policy divergence between the Bank of Japan and other main central banks. More recently, the gradually unwinding of this ultra-loose policy has given some support to the Yen.
Over the last decade, the BoJ’s stance of sticking to ultra-loose monetary policy has led to a widening policy divergence with other central banks, particularly with the US Federal Reserve. This supported a widening of the differential between the 10-year US and Japanese bonds, which favored the US Dollar against the Japanese Yen. The BoJ decision in 2024 to gradually abandon the ultra-loose policy, coupled with interest-rate cuts in other major central banks, is narrowing this differential.
The Japanese Yen is often seen as a safe-haven investment. This means that in times of market stress, investors are more likely to put their money in the Japanese currency due to its supposed reliability and stability. Turbulent times are likely to strengthen the Yen’s value against other currencies seen as more risky to invest in.
FX option expiries for Oct 4 NY cut at 10:00 Eastern Time, via DTCC, can be found below.
EUR/USD: EUR amounts
- 1.1000 2b
- 1.1100 1b
USD/JPY: USD amounts
- 146.25 879m
- 148.00 958m
AUD/USD: AUD amounts
- 0.6650 300m
- 0.6700 418m
- 0.6850 813m
USD/CAD: USD amounts
- 1.3500 993m
- 1.3550 1.7b
- 1.3600 657m
- USD/CHF halts its winning streak as safe-haven Swiss Franc receives support from rising Middle-East tensions.
- The CHF faced challenges as softer inflation data bolstered expectations of SNB’s 50 basis point rate cut in December.
- The US Dollar receives downward pressure as US Treasury yields lose ground.
USD/CHF breaks its four-day winning streak, trading around 0.8510 during Friday’s Asian session. The Swiss Franc (CHF) receives support from the safe-haven flows amid rising Middle-East tensions. US President Joe Biden mentioned that the United States is in talks with Israel regarding potential strikes on Iran's Oil infrastructure.
Moreover, Israeli Prime Minister Benjamin Netanyahu warned that Iran "will pay a heavy price" for Tuesday’s attack, which reportedly involved the launch of at least 180 ballistic missiles at Israel, according to the BBC.
The Swiss Franc (CHF) faced downward pressure following Thursday's weaker-than-expected inflation data, which has raised the likelihood of dovish policymakers advocating for a 50 basis point rate cut by the Swiss National Bank (SNB) in December. Previously, the SNB had already lowered the key interest rate by 25 basis points for the third consecutive time.
Switzerland's Consumer Price Index rose 0.8% year-over-year in September, down from both market expectations and August's figure of 1.1%. This is the lowest inflation rate since September 2021. Additionally, the monthly inflation rate dropped by 0.3%, exceeding forecasts of a 0.1% decline, after remaining flat in August.
The US Dollar (USD) breaks its winning streak amid subdued US Treasury yields. The US Dollar Index (DXY), which measures the value of the US Dollar (USD) against its six major peers, trades around 101.90 with 2-year and 10-year yields on US Treasury bonds standing at 3.70% and 3.845, respectively, at the time of writing.
Federal Reserve Bank of Chicago President Austan Goolsbee reiterated on Thursday that the interest rates need to come down over the next year by “a lot.” Goolsbee further stated that he’d like to keep the unemployment rate at 4.2% from rising any further.
Swiss Franc FAQs
The Swiss Franc (CHF) is Switzerland’s official currency. It is among the top ten most traded currencies globally, reaching volumes that well exceed the size of the Swiss economy. Its value is determined by the broad market sentiment, the country’s economic health or action taken by the Swiss National Bank (SNB), among other factors. Between 2011 and 2015, the Swiss Franc was pegged to the Euro (EUR). The peg was abruptly removed, resulting in a more than 20% increase in the Franc’s value, causing a turmoil in markets. Even though the peg isn’t in force anymore, CHF fortunes tend to be highly correlated with the Euro ones due to the high dependency of the Swiss economy on the neighboring Eurozone.
The Swiss Franc (CHF) is considered a safe-haven asset, or a currency that investors tend to buy in times of market stress. This is due to the perceived status of Switzerland in the world: a stable economy, a strong export sector, big central bank reserves or a longstanding political stance towards neutrality in global conflicts make the country’s currency a good choice for investors fleeing from risks. Turbulent times are likely to strengthen CHF value against other currencies that are seen as more risky to invest in.
The Swiss National Bank (SNB) meets four times a year – once every quarter, less than other major central banks – to decide on monetary policy. The bank aims for an annual inflation rate of less than 2%. When inflation is above target or forecasted to be above target in the foreseeable future, the bank will attempt to tame price growth by raising its policy rate. Higher interest rates are generally positive for the Swiss Franc (CHF) as they lead to higher yields, making the country a more attractive place for investors. On the contrary, lower interest rates tend to weaken CHF.
Macroeconomic data releases in Switzerland are key to assessing the state of the economy and can impact the Swiss Franc’s (CHF) valuation. The Swiss economy is broadly stable, but any sudden change in economic growth, inflation, current account or the central bank’s currency reserves have the potential to trigger moves in CHF. Generally, high economic growth, low unemployment and high confidence are good for CHF. Conversely, if economic data points to weakening momentum, CHF is likely to depreciate.
As a small and open economy, Switzerland is heavily dependent on the health of the neighboring Eurozone economies. The broader European Union is Switzerland’s main economic partner and a key political ally, so macroeconomic and monetary policy stability in the Eurozone is essential for Switzerland and, thus, for the Swiss Franc (CHF). With such dependency, some models suggest that the correlation between the fortunes of the Euro (EUR) and the CHF is more than 90%, or close to perfect.
- GBP/USD holds steady around 1.3125 in Friday’s Asian session.
- Less dovish Fed and geopolitical risks might support the USD in the near term.
- The BoE said it could move more aggressively to cut rates if inflation pressures continued to ease.
The GBP/USD pair struggles to gain ground near 1.3125 during the Asian session on Friday. Traders prefer to wait on the sidelines ahead of the US employment data, including Nonfarm Payrolls (NFP), Unemployment Rate and Average Hourly Earnings, which are due later on Friday.
Shifting expectations for the US Federal Reserve’s (Fed) next move might lift the US Dollar (USD) against the Pound Sterling (GBP) in the near term. The US employment data might offer some hints about the size of the November Fed rate cut. Analysts estimated a 140k increase in the NFP report, while the Unemployment Rate and the Average Hourly Earnings growth remain steady at 4.2% and 3.8%, respectively. An upside surprise outcome could dampen the hope for a 50 basis point (bps) rate reduction in the November meeting.
The rising Middle East tensions could boost the safe haven flows and benefit the Greenback. CNN reported on Thursday that an attack in central Beirut killed nine people, marking Israel's first strike in the region since 2006. The Israeli military vows to continue targeting Hezbollah in Beirut and southern Lebanon, after more airstrikes in the capital on Thursday.
On the GBP’s front, the dovish comments by Bank of England (BoE) Governor Andrew Bailey on Thursday might undermine the GBP. Bailey said the prospect of the BoE becoming a “bit more aggressive” in cutting interest rates as the development of inflation continued to be good. The BoE is widely expected to cut the policy rate by 25 bps at the November meeting, and the odds of the December meeting increased.
Pound Sterling FAQs
The Pound Sterling (GBP) is the oldest currency in the world (886 AD) and the official currency of the United Kingdom. It is the fourth most traded unit for foreign exchange (FX) in the world, accounting for 12% of all transactions, averaging $630 billion a day, according to 2022 data. Its key trading pairs are GBP/USD, also known as ‘Cable’, which accounts for 11% of FX, GBP/JPY, or the ‘Dragon’ as it is known by traders (3%), and EUR/GBP (2%). The Pound Sterling is issued by the Bank of England (BoE).
The single most important factor influencing the value of the Pound Sterling is monetary policy decided by the Bank of England. The BoE bases its decisions on whether it has achieved its primary goal of “price stability” – a steady inflation rate of around 2%. Its primary tool for achieving this is the adjustment of interest rates. When inflation is too high, the BoE will try to rein it in by raising interest rates, making it more expensive for people and businesses to access credit. This is generally positive for GBP, as higher interest rates make the UK a more attractive place for global investors to park their money. When inflation falls too low it is a sign economic growth is slowing. In this scenario, the BoE will consider lowering interest rates to cheapen credit so businesses will borrow more to invest in growth-generating projects.
Data releases gauge the health of the economy and can impact the value of the Pound Sterling. Indicators such as GDP, Manufacturing and Services PMIs, and employment can all influence the direction of the GBP. A strong economy is good for Sterling. Not only does it attract more foreign investment but it may encourage the BoE to put up interest rates, which will directly strengthen GBP. Otherwise, if economic data is weak, the Pound Sterling is likely to fall.
Another significant data release for the Pound Sterling is the Trade Balance. This indicator measures the difference between what a country earns from its exports and what it spends on imports over a given period. If a country produces highly sought-after exports, its currency will benefit purely from the extra demand created from foreign buyers seeking to purchase these goods. Therefore, a positive net Trade Balance strengthens a currency and vice versa for a negative balance.
- US Nonfarm Payrolls are set to increase by 140K in September, similar to August’s gain of 142K.
- The United States labor data will be published by the Bureau of Labor Statistics on Friday at 12:30 GMT.
- The US jobs data could have a significant impact on the direction of the Fed interest rates and thus the US Dollar’s valuation.
The high-impact Nonfarm Payrolls (NFP) data from the United States (US) for September will be published by the Bureau of Labor Statistics (BLS) on Friday at 12:30 GMT.
The US labor market data is expected to significantly impact the US Dollar (USD) performance against its major rivals, as markets speculate about the size of the next Federal Reserve (Fed) interest rate cut in November.
What to expect in the next Nonfarm Payrolls report?
Economists expect the Nonfarm Payrolls report to show that the US economy added 140,000 jobs in September, following a job gain of 142,000 reported in August.
The Unemployment Rate is expected to stay unchanged at 4.2% in the same period. Further, a closely-watched measure of wage inflation, Average Hourly Earnings, is seen increasing by 3.8% in the year through September, maintaining the pace seen in August.
The September jobs data could reinforce the markets’ expectations of a 50 basis points (bps) rate cut at the November meeting even though Fed Chairman Jerome Powell pushed back against such expectations during his speech at the National Association for Business Economics (NABE) Annual Meeting in Nashville on Monday.
Powell said that “this is not a committee that feels like it’s in a hurry to cut rates quickly.” “If the economy performs as expected, that would mean two more cuts this year, both by a quarter-point, aligning with the forecasts officials penciled in at the September 18 meeting,” he added.
Previewing the September employment situation report, TD Securities analysts said: “We expect payrolls to pick up modestly in September improving to a four-month high after weaker net gains at 89k and 142k in July and August, respectively.”
“The UE rate likely stayed unchanged following August's one-tenth drop to 4.2%. We also look for wage growth to moderate, printing 0.2% MoM (3.8% YoY) after posting an unexpectedly strong 0.4% MoM gain last month,” the analysts said.
How will US September Nonfarm Payrolls affect EUR/USD?
In the run-up to the US NFP data release, markets are pricing in about a 37% chance that the Fed will lower rates by 50 bps in November, down from 53% seen at the start of the week, according to CME Group's FedWatch Tool.
Amidst fading bets for a large Fed rate cut in November and escalating conflict between Iran and Israel, the US Dollar sustains its recovery from over one-year lows against its major rivals.
The mixed Institute for Supply Management (ISM) Manufacturing Purchasing Managers Index (PMI) data and JOLTS Job Openings data failed to alter the market’s pricing for November’s rate cut move.
The ISM announced on Tuesday that its headline US Manufacturing Index steadied at 47.2 in September and remained deep in contraction while below the 47.5 forecast. US Job Openings rebounded to a three-month high in August, arriving at 8.04 million after declining to 7.71 million in July.
The Automatic Data Processing (ADP) reported on Wednesday that the US private sector employment increased by 143,000 jobs for September, accelerating from the upwardly revised 103,000 in August and better than the 120,000 estimate. Strong ADP jobs report eased concerns about the health of the US labor market, leaving room for an upside surprise in Friday’s payrolls data.
If the headline NFP reading shows a payroll growth below 100,000, it could suggest further cooldown in the US jobs market, and hence, reinforce the odds of a big cut in November. This could initiate a fresh US Dollar downtrend while pushing EUR/USD back to 1.1200.
Alternatively, a stronger-than-expected NFP figure alongside hot wage inflation data would fuel expectations that the Fed may opt for a 25 bps rate reduction, providing extra legs to the US Dollar recovery and smashing EUR/USD toward 1.0900.
Dhwani Mehta, Analyst at FXStreet, offers a brief technical outlook for EUR/USD:
“The EUR/USD pair has breached the critical 50-day Simple Moving Average (SMA) at 1.1044 amid the renewed downtrend. The 14-day Relative Strength Index (RSI) points south well below the 50 level, currently near 44, suggesting that sellers are likely to retain the upper hand in the near future.”
“On a daily candlestick closing below the 50-day SMA at 1.1044, sellers will flex their muscles toward the 100-day SMA support at 1.0928. Further down, the 200-day SMA at 1.0875 will be the last line of defense for buyers. Alternatively, they need to recapture the 21-day SMA at 1.1102 to negate the bearish pressure in the near term. Further up, the year-to-date (YTD) high of 1.1214 will be tested en route to the 1.1250 psychological barrier,” Dhwani adds.
Economic Indicator
Nonfarm Payrolls
The Nonfarm Payrolls release presents the number of new jobs created in the US during the previous month in all non-agricultural businesses; it is released by the US Bureau of Labor Statistics (BLS). The monthly changes in payrolls can be extremely volatile. The number is also subject to strong reviews, which can also trigger volatility in the Forex board. Generally speaking, a high reading is seen as bullish for the US Dollar (USD), while a low reading is seen as bearish, although previous months' reviews and the Unemployment Rate are as relevant as the headline figure. The market's reaction, therefore, depends on how the market assesses all the data contained in the BLS report as a whole.
Read more.Next release: Fri Oct 04, 2024 12:30
Frequency: Monthly
Consensus: 140K
Previous: 142K
Source: US Bureau of Labor Statistics
America’s monthly jobs report is considered the most important economic indicator for forex traders. Released on the first Friday following the reported month, the change in the number of positions is closely correlated with the overall performance of the economy and is monitored by policymakers. Full employment is one of the Federal Reserve’s mandates and it considers developments in the labor market when setting its policies, thus impacting currencies. Despite several leading indicators shaping estimates, Nonfarm Payrolls tend to surprise markets and trigger substantial volatility. Actual figures beating the consensus tend to be USD bullish.
Employment FAQs
Labor market conditions are a key element in assessing the health of an economy and thus a key driver for currency valuation. High employment, or low unemployment, has positive implications for consumer spending and economic growth, boosting the value of the local currency. Moreover, a very tight labor market – a situation in which there is a shortage of workers to fill open positions – can also have implications on inflation levels because low labor supply and high demand leads to higher wages.
The pace at which salaries are growing in an economy is key for policymakers. High wage growth means that households have more money to spend, usually leading to price increases in consumer goods. In contrast to more volatile sources of inflation such as energy prices, wage growth is seen as a key component of underlying and persisting inflation as salary increases are unlikely to be undone. Central banks around the world pay close attention to wage growth data when deciding on monetary policy.
The weight that each central bank assigns to labor market conditions depends on its objectives. Some central banks explicitly have mandates related to the labor market beyond controlling inflation levels. The US Federal Reserve (Fed), for example, has the dual mandate of promoting maximum employment and stable prices. Meanwhile, the European Central Bank’s (ECB) sole mandate is to keep inflation under control. Still, and despite whatever mandates they have, labor market conditions are an important factor for policymakers given their significance as a gauge of the health of the economy and their direct relationship to inflation.
- EUR/JPY attracts some sellers on Friday and reverses a part of its recent gains to the weekly top.
- A combination of factors revives the JPY demand and exerts downward pressure on the cross.
- Dovish ECB bets contribute to the fall, though the BoJ rate hike uncertainty might limit losses.
The EUR/JPY cross meets with some supply during the Asian session on Friday and for now, seems to have snapped a two-day winning streak to the weekly peak, around mid-162.00s touched the previous day. The downfall is sponsored by the emergence of some buying around the Japanese Yen (JPY) and drags spot prices to the 161.20 area, or a fresh daily low in the last hour.
Asahi Noguchi, a dovish Bank of Japan (BoJ) board member said on Thursday that the central bank has scope to raise interest rates further but must move cautiously and slowly to avoid hurting the economy. This comes on top of a further escalation of geopolitical tensions in the Middle East and the risk of a full-out war, which drives some flows towards the safe-haven JPY and turns out to be a key factor weighing on the EUR/JPY cross.
The shared currency, on the other hand, remains depressed amid bets that the European Central Bank (ECB) will cut rates again in October on the back of easing inflationary pressures and economic slowdown. In fact, data released earlier this week showed that the Eurozone inflation fell to 1.8% in September, below the ECB's 2% target. This contributes to the offered tone surrounding the EUR/JPY cross and supports prospects for further losses.
That said, the uncertainty over future interest rate hikes by the BoJ might hold back the JPY bulls from placing aggressive bets and help limit the downside for the currency pair. Japan's new Prime Minister Shigeru Ishiba said earlier this week that Japan is not in an environment for an additional rate increase. Moreover, Japan's Economy Minister Ryosei Akazawa stated that the PM and the BoJ both agree that overcoming deflation is Japan's highest priority.
The aforementioned mixed fundamental backdrop warrants some caution for bearish traders and makes it prudent to wait for strong follow-through selling before positioning for any further depreciating move. From a technical perspective, the formation of a 'Death Cross' on the daily chart – the 50-day Simple Moving Average (SMA) crossing below the 200-day SMA – suggests that the path of least resistance for the EUR/JPY cross remains to the downside.
Bank of Japan FAQs
The Bank of Japan (BoJ) is the Japanese central bank, which sets monetary policy in the country. Its mandate is to issue banknotes and carry out currency and monetary control to ensure price stability, which means an inflation target of around 2%.
The Bank of Japan embarked in an ultra-loose monetary policy in 2013 in order to stimulate the economy and fuel inflation amid a low-inflationary environment. The bank’s policy is based on Quantitative and Qualitative Easing (QQE), or printing notes to buy assets such as government or corporate bonds to provide liquidity. In 2016, the bank doubled down on its strategy and further loosened policy by first introducing negative interest rates and then directly controlling the yield of its 10-year government bonds. In March 2024, the BoJ lifted interest rates, effectively retreating from the ultra-loose monetary policy stance.
The Bank’s massive stimulus caused the Yen to depreciate against its main currency peers. This process exacerbated in 2022 and 2023 due to an increasing policy divergence between the Bank of Japan and other main central banks, which opted to increase interest rates sharply to fight decades-high levels of inflation. The BoJ’s policy led to a widening differential with other currencies, dragging down the value of the Yen. This trend partly reversed in 2024, when the BoJ decided to abandon its ultra-loose policy stance.
A weaker Yen and the spike in global energy prices led to an increase in Japanese inflation, which exceeded the BoJ’s 2% target. The prospect of rising salaries in the country – a key element fuelling inflation – also contributed to the move.
- EUR/USD continues to lose ground as the ECB is widely expected to deliver a 25 basis point rate cut in October.
- The risk-sensitive Euro struggles due to safe-haven flows amid rising geopolitical tensions in the Middle East.
- The US Dollar receives support as recent US data challenge dovish expectations for Fed monetary policy.
EUR/USD continues its losing streak for the sixth successive session, trading around 1.1030 during the Asian hours on Friday. Lower Eurozone inflation reading raised expectations of a rate cut by the European Central Bank (ECB) in October, which would mark the central bank's third reduction this year.
Earlier this week, the Harmonized Index of Consumer Prices dropped to 1.8% year-over-year in September, falling below the ECB’s 2% target and lowest since April 2021. Markets reflect a 95% probability of a 25 basis point rate cut this month.
The risk-sensitive Euro may face challenges as escalating geopolitical tensions in the Middle East impact risk appetite. US President Joe Biden mentioned that the United States is in talks with Israel regarding potential strikes on Iran's Oil infrastructure.
Israeli Prime Minister Benjamin Netanyahu warned that Iran "will pay a heavy price" for Tuesday’s attack, which reportedly involved the launch of at least 180 ballistic missiles at Israel, according to the BBC.
The EUR/USD pair depreciates as the US Dollar (USD) receives support from a better-than-expected US ISM Services PMI and ADP Employment Change reports, which challenged dovish expectations for Federal Reserve (Fed) monetary policy.
US ISM Services PMI rose to 54.9 in September, from 51.5 in August and exceeding the market forecast of 51.7. The ADP US Employment Change report showed an increase of 143,000 jobs in September, surpassing the forecasted 120,000 jobs.
Euro FAQs
The Euro is the currency for the 19 European Union countries that belong to the Eurozone. It is the second most heavily traded currency in the world behind the US Dollar. In 2022, it accounted for 31% of all foreign exchange transactions, with an average daily turnover of over $2.2 trillion a day. EUR/USD is the most heavily traded currency pair in the world, accounting for an estimated 30% off all transactions, followed by EUR/JPY (4%), EUR/GBP (3%) and EUR/AUD (2%).
The European Central Bank (ECB) in Frankfurt, Germany, is the reserve bank for the Eurozone. The ECB sets interest rates and manages monetary policy. The ECB’s primary mandate is to maintain price stability, which means either controlling inflation or stimulating growth. Its primary tool is the raising or lowering of interest rates. Relatively high interest rates – or the expectation of higher rates – will usually benefit the Euro and vice versa. The ECB Governing Council makes monetary policy decisions at meetings held eight times a year. Decisions are made by heads of the Eurozone national banks and six permanent members, including the President of the ECB, Christine Lagarde.
Eurozone inflation data, measured by the Harmonized Index of Consumer Prices (HICP), is an important econometric for the Euro. If inflation rises more than expected, especially if above the ECB’s 2% target, it obliges the ECB to raise interest rates to bring it back under control. Relatively high interest rates compared to its counterparts will usually benefit the Euro, as it makes the region more attractive as a place for global investors to park their money.
Data releases gauge the health of the economy and can impact on the Euro. Indicators such as GDP, Manufacturing and Services PMIs, employment, and consumer sentiment surveys can all influence the direction of the single currency. A strong economy is good for the Euro. Not only does it attract more foreign investment but it may encourage the ECB to put up interest rates, which will directly strengthen the Euro. Otherwise, if economic data is weak, the Euro is likely to fall. Economic data for the four largest economies in the euro area (Germany, France, Italy and Spain) are especially significant, as they account for 75% of the Eurozone’s economy.
Another significant data release for the Euro is the Trade Balance. This indicator measures the difference between what a country earns from its exports and what it spends on imports over a given period. If a country produces highly sought after exports then its currency will gain in value purely from the extra demand created from foreign buyers seeking to purchase these goods. Therefore, a positive net Trade Balance strengthens a currency and vice versa for a negative balance.
Gold prices rose in India on Friday, according to data compiled by FXStreet.
The price for Gold stood at 7,188.75 Indian Rupees (INR) per gram, up compared with the INR 7,170.18 it cost on Thursday.
The price for Gold increased to INR 83,848.18 per tola from INR 83,631.55 per tola a day earlier.
| Unit measure | Gold Price in INR |
|---|---|
| 1 Gram | 7,188.75 |
| 10 Grams | 71,887.51 |
| Tola | 83,848.18 |
| Troy Ounce | 223,595.30 |
FXStreet calculates Gold prices in India by adapting international prices (USD/INR) to the local currency and measurement units. Prices are updated daily based on the market rates taken at the time of publication. Prices are just for reference and local rates could diverge slightly.
Gold FAQs
Gold has played a key role in human’s history as it has been widely used as a store of value and medium of exchange. Currently, apart from its shine and usage for jewelry, the precious metal is widely seen as a safe-haven asset, meaning that it is considered a good investment during turbulent times. Gold is also widely seen as a hedge against inflation and against depreciating currencies as it doesn’t rely on any specific issuer or government.
Central banks are the biggest Gold holders. In their aim to support their currencies in turbulent times, central banks tend to diversify their reserves and buy Gold to improve the perceived strength of the economy and the currency. High Gold reserves can be a source of trust for a country’s solvency. Central banks added 1,136 tonnes of Gold worth around $70 billion to their reserves in 2022, according to data from the World Gold Council. This is the highest yearly purchase since records began. Central banks from emerging economies such as China, India and Turkey are quickly increasing their Gold reserves.
Gold has an inverse correlation with the US Dollar and US Treasuries, which are both major reserve and safe-haven assets. When the Dollar depreciates, Gold tends to rise, enabling investors and central banks to diversify their assets in turbulent times. Gold is also inversely correlated with risk assets. A rally in the stock market tends to weaken Gold price, while sell-offs in riskier markets tend to favor the precious metal.
The price can move due to a wide range of factors. Geopolitical instability or fears of a deep recession can quickly make Gold price escalate due to its safe-haven status. As a yield-less asset, Gold tends to rise with lower interest rates, while higher cost of money usually weighs down on the yellow metal. Still, most moves depend on how the US Dollar (USD) behaves as the asset is priced in dollars (XAU/USD). A strong Dollar tends to keep the price of Gold controlled, whereas a weaker Dollar is likely to push Gold prices up.
(An automation tool was used in creating this post.)
- Silver scales higher for the fourth straight day and climbs back closer to the weekly top.
- The technical setup favors bulls and supports prospects for a further appreciating move.
- Dips below the $32.00 mark could be seen as a buying opportunity and remain limited.
Silver (XAG/USD) attracts buyers for the fourth successive day on Friday and trades near the top end of its weekly range, above the $32.00 mark during the Asian session. Meanwhile, the white metal remains within the striking distance of a multi-year peak touched last week and seems poised to prolong its recent uptrend from the August monthly swing low.
This week's bounce from sub-$31.00 levels and a subsequent move up validate the positive outlook. Moreover, oscillators on the daily chart are holding in positive territory and are away from being in the overbought zone, suggesting that the path of least resistance for the XAG/USD is to the upside. Hence, some follow-through strength back towards the multi-year top around the $32.70 region, en route to the $33.00 mark, looks like a distinct possibility.
On the flip side, weakness below the $32.00 mark now seems to find some support near the $31.75 area. A convincing break below, however, might prompt some technical selling and drag the XAG/USD towards the $31.10-$31.05 support and the weekly low, around the $30.90-$30.85 region. The latter should act as a key pivotal point, which if broken decisively will negate the constructive setup and shift the near-term bias in favor of bearish traders.
The XAG/USD might then accelerate the slide further towards the $30.25 zone before extending the downfall towards the $30.00 psychological mark and the 100-day SMA support near the $29.80-$29.65 region.
Silver daily chart
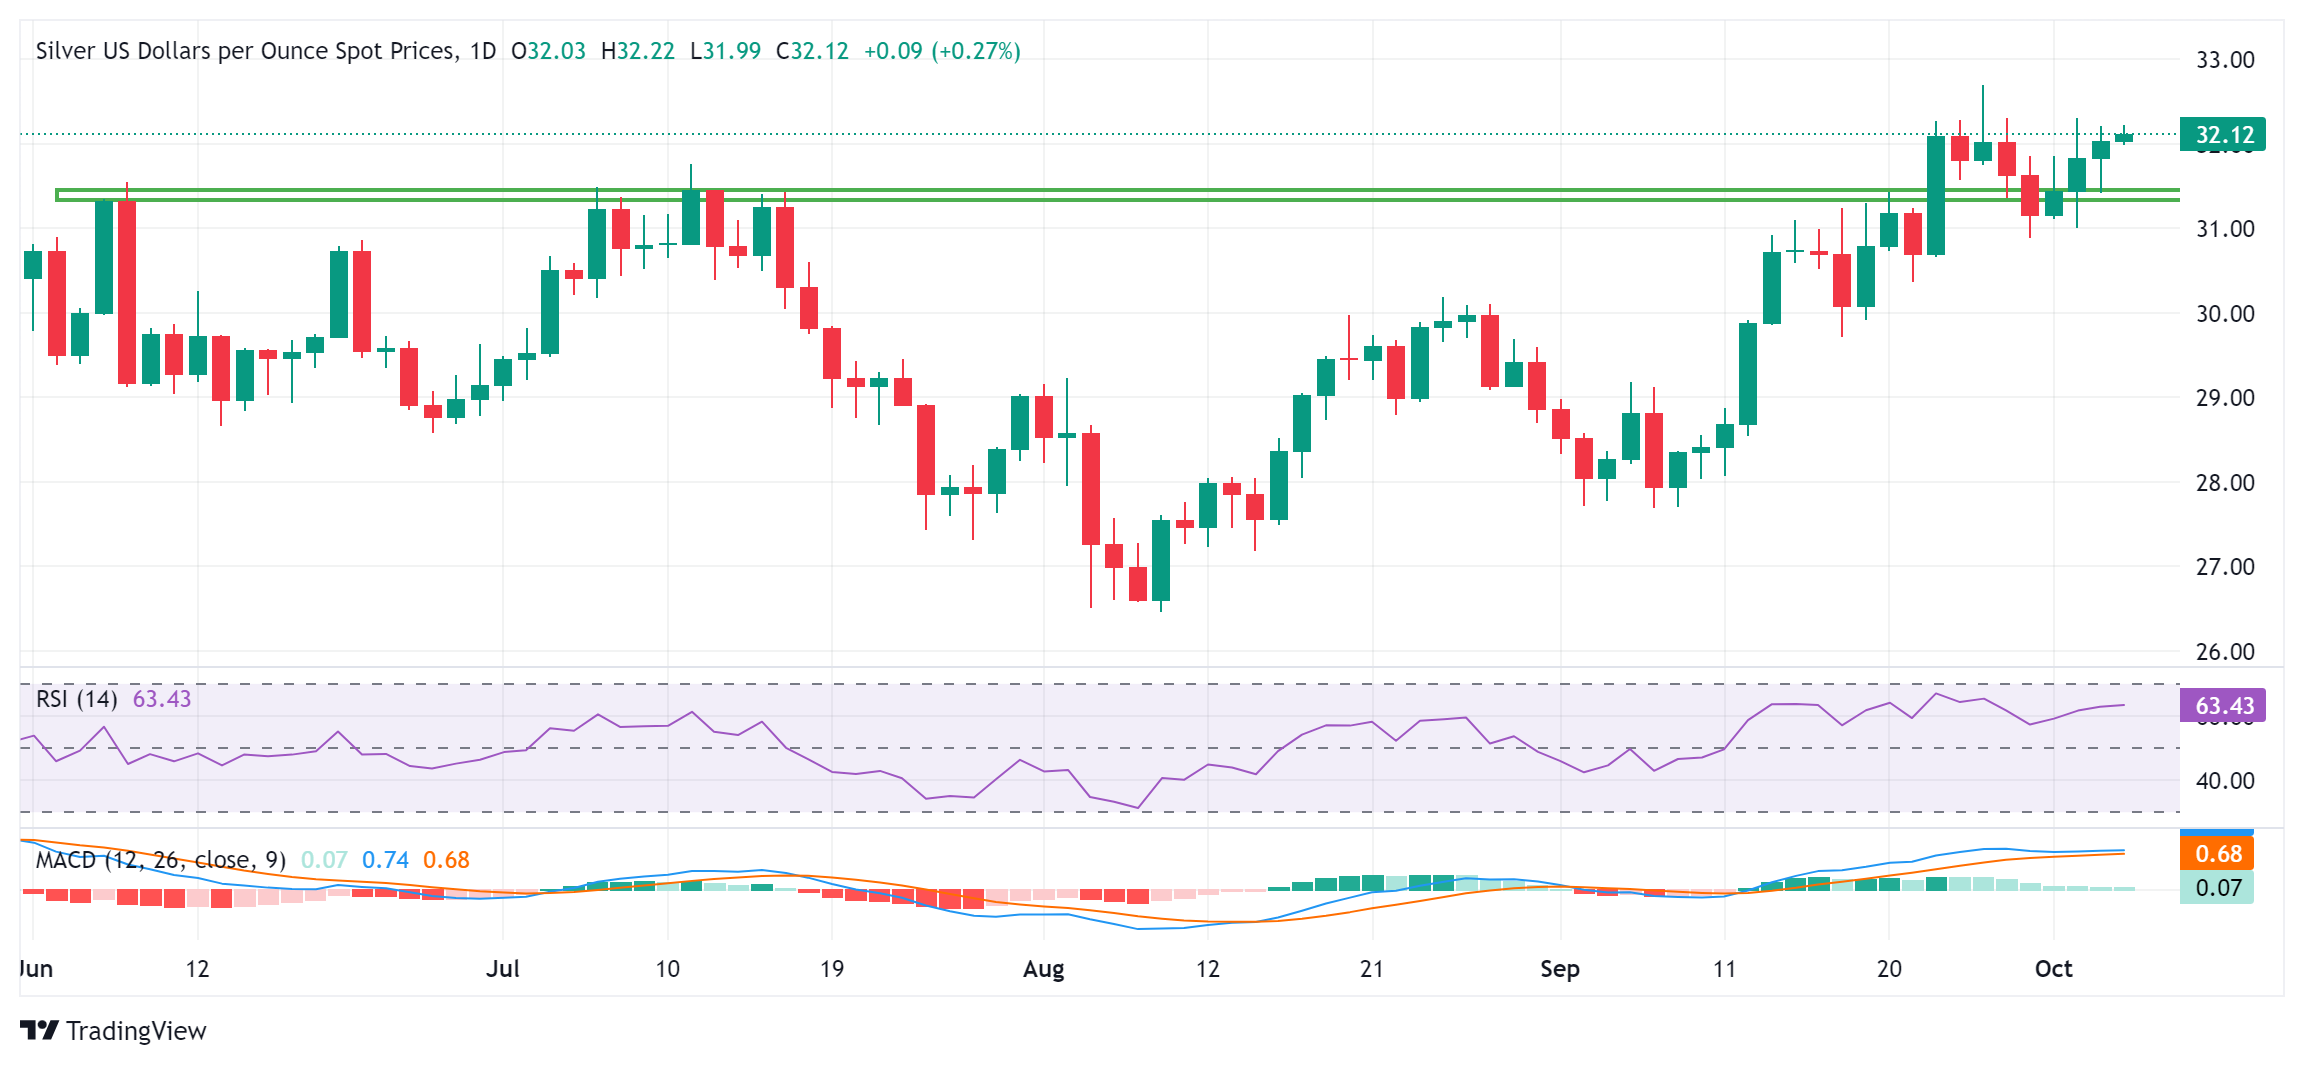
Silver FAQs
Silver is a precious metal highly traded among investors. It has been historically used as a store of value and a medium of exchange. Although less popular than Gold, traders may turn to Silver to diversify their investment portfolio, for its intrinsic value or as a potential hedge during high-inflation periods. Investors can buy physical Silver, in coins or in bars, or trade it through vehicles such as Exchange Traded Funds, which track its price on international markets.
Silver prices can move due to a wide range of factors. Geopolitical instability or fears of a deep recession can make Silver price escalate due to its safe-haven status, although to a lesser extent than Gold's. As a yieldless asset, Silver tends to rise with lower interest rates. Its moves also depend on how the US Dollar (USD) behaves as the asset is priced in dollars (XAG/USD). A strong Dollar tends to keep the price of Silver at bay, whereas a weaker Dollar is likely to propel prices up. Other factors such as investment demand, mining supply – Silver is much more abundant than Gold – and recycling rates can also affect prices.
Silver is widely used in industry, particularly in sectors such as electronics or solar energy, as it has one of the highest electric conductivity of all metals – more than Copper and Gold. A surge in demand can increase prices, while a decline tends to lower them. Dynamics in the US, Chinese and Indian economies can also contribute to price swings: for the US and particularly China, their big industrial sectors use Silver in various processes; in India, consumers’ demand for the precious metal for jewellery also plays a key role in setting prices.
Silver prices tend to follow Gold's moves. When Gold prices rise, Silver typically follows suit, as their status as safe-haven assets is similar. The Gold/Silver ratio, which shows the number of ounces of Silver needed to equal the value of one ounce of Gold, may help to determine the relative valuation between both metals. Some investors may consider a high ratio as an indicator that Silver is undervalued, or Gold is overvalued. On the contrary, a low ratio might suggest that Gold is undervalued relative to Silver.
- The Japanese Yen appreciates as the US Dollar remains tepid ahead of the US labor data release on Friday.
- Japan’s Economy Minister Akazawa stated that the timing of any monetary policy changes is crucial
- Traders await Friday’s US employment data, including Nonfarm Payrolls (NFP) and Average Hourly Earnings, for further direction.
The Japanese Yen (JPY) retraces recent gains following comments from Japan’s ministers on Friday. Newly appointed Economy Minister Ryosei Akazawa stated that Prime Minister Shigeru Ishiba and the Bank of Japan (BoJ) both agree that overcoming deflation is Japan's highest priority.
Economy Minister Akazawa added “No change to the interpretation of the government-Bank of Japan (BoJ) accord targeting 2% inflation.” The timing of monetary policy change is important and must align with Japan's broader goal of exiting deflation.
Japan's Chief Cabinet Secretary Yoshimasa Hayashi announced on Friday that Prime Minister Ishiba has directed the creation of a comprehensive economic package. Hayashi also mentioned that he plans to present a supplementary budget to Parliament following the lower house election.
However, the downside of the USD/JPY pair could be limited as the Japanese Yen may struggle due to the waning likelihood of further rate hikes by the Bank of Japan. Newly elected PM Ishiba stated on Wednesday, "I do not believe that we are in an environment that would require us to raise interest rates further," according to Reuters.
Daily Digest Market Movers: Japanese Yen receives downward pressure from dovish mood surrounding the BoJ
- The US Dollar (USD) gained strength following a better-than-expected US ISM Services PMI and ADP Employment Change reports, which challenged dovish expectations for Federal Reserve (Fed) monetary policy.
- The CME FedWatch Tool indicates that markets are assigning a 67.4% probability to a 25 basis point rate cut by the Federal Reserve in November, while the likelihood of a 50-basis-point cut is 32.6%, down from 35.2% a day ago.
- Federal Reserve Bank of Chicago President Austan Goolsbee reiterated on Thursday that the interest rates need to come down over the next year by “a lot.” Goolsbee further stated that he’d like to keep the unemployment rate at 4.2% and prevent it from rising any further.
- US ISM Services PMI rose to 54.9 in September, from 51.5 in August and exceeding the market forecast of 51.7. Meanwhile, the Services Prices Paid Index, a key inflation indicator, climbed to 59.4 from 57.3.
- Futures indicated less than a 50% likelihood of the Bank of Japan raising rates by 10 basis points by the end of 2024. Additionally, rates are projected to reach only 0.5% by the end of next year, up from the current 0.25%, per Reuters.
- BoJ board member Asahi Noguchi stated that the central bank "must patiently maintain loose monetary conditions." Noguchi indicated that the BoJ will likely make gradual adjustments to the level of monetary support while carefully assessing whether inflation sustainably reaches the 2% target, supported by wage growth.
- The ADP US Employment Change report showed an increase of 143,000 jobs in September, surpassing the forecasted 120,000 jobs. Additionally, annual pay rose by 4.7% year-over-year. The total number of jobs added in August was revised upward from 99,000 to 103,000.
- On Tuesday, BoJ’s Summary of Opinions from September’s Monetary Policy Meeting indicates no immediate plans for additional rate hikes. The central bank intends to maintain its accommodative stance but remains open to adjustments if economic conditions show significant improvement.
Technical Analysis: USD/JPY hovers near 146.50, five-week highs
USD/JPY trades around 146.50 on Friday. The daily chart analysis shows that the pair could attempt to break above the ascending channel pattern, indicating a strengthening bullish bias. Additionally, the 14-day Relative Strength Index (RSI) remains above the 50 mark, reinforcing the continuation of the bullish trend.
Regarding the upside, the USD/JPY pair is facing resistance close to the upper boundary of the ascending channel, near the five-week high of 147.21, which was last reached on September 3. A breakout above this level could enable the pair to test its seven-week high at 149.40.
In terms of downside, the USD/JPY pair may find support at the nine-day Exponential Moving Average (EMA) around 144.97, followed by the lower boundary of the ascending channel at 143.60. A drop below this level could push the pair toward 139.58, marking its lowest point since June 2023.
USD/JPY: Daily Chart
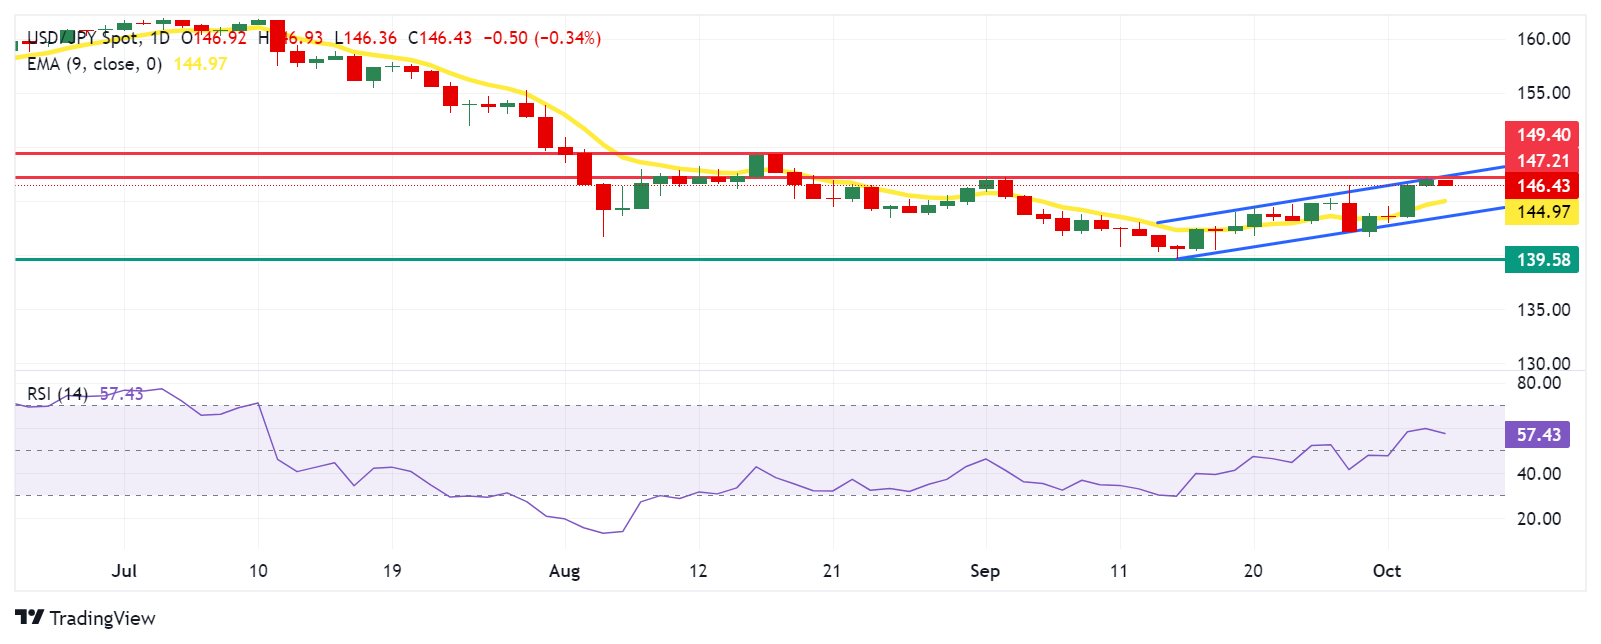
Japanese Yen PRICE Today
The table below shows the percentage change of Japanese Yen (JPY) against listed major currencies today. Japanese Yen was the strongest against the Euro.
| USD | EUR | GBP | JPY | CAD | AUD | NZD | CHF | |
|---|---|---|---|---|---|---|---|---|
| USD | 0.04% | -0.03% | -0.40% | 0.01% | -0.13% | 0.01% | -0.09% | |
| EUR | -0.04% | -0.05% | -0.44% | -0.01% | -0.16% | -0.01% | -0.15% | |
| GBP | 0.03% | 0.05% | -0.35% | 0.08% | -0.12% | 0.04% | -0.11% | |
| JPY | 0.40% | 0.44% | 0.35% | 0.41% | 0.25% | 0.38% | 0.26% | |
| CAD | -0.01% | 0.00% | -0.08% | -0.41% | -0.16% | 0.02% | -0.16% | |
| AUD | 0.13% | 0.16% | 0.12% | -0.25% | 0.16% | 0.15% | -0.03% | |
| NZD | -0.01% | 0.01% | -0.04% | -0.38% | -0.02% | -0.15% | -0.16% | |
| CHF | 0.09% | 0.15% | 0.11% | -0.26% | 0.16% | 0.03% | 0.16% |
The heat map shows percentage changes of major currencies against each other. The base currency is picked from the left column, while the quote currency is picked from the top row. For example, if you pick the Japanese Yen from the left column and move along the horizontal line to the US Dollar, the percentage change displayed in the box will represent JPY (base)/USD (quote).
Japanese Yen FAQs
The Japanese Yen (JPY) is one of the world’s most traded currencies. Its value is broadly determined by the performance of the Japanese economy, but more specifically by the Bank of Japan’s policy, the differential between Japanese and US bond yields, or risk sentiment among traders, among other factors.
One of the Bank of Japan’s mandates is currency control, so its moves are key for the Yen. The BoJ has directly intervened in currency markets sometimes, generally to lower the value of the Yen, although it refrains from doing it often due to political concerns of its main trading partners. The BoJ ultra-loose monetary policy between 2013 and 2024 caused the Yen to depreciate against its main currency peers due to an increasing policy divergence between the Bank of Japan and other main central banks. More recently, the gradually unwinding of this ultra-loose policy has given some support to the Yen.
Over the last decade, the BoJ’s stance of sticking to ultra-loose monetary policy has led to a widening policy divergence with other central banks, particularly with the US Federal Reserve. This supported a widening of the differential between the 10-year US and Japanese bonds, which favored the US Dollar against the Japanese Yen. The BoJ decision in 2024 to gradually abandon the ultra-loose policy, coupled with interest-rate cuts in other major central banks, is narrowing this differential.
The Japanese Yen is often seen as a safe-haven investment. This means that in times of market stress, investors are more likely to put their money in the Japanese currency due to its supposed reliability and stability. Turbulent times are likely to strengthen the Yen’s value against other currencies seen as more risky to invest in.
- USD/CAD enters a bullish consolidation phase near a one-month top set on Thursday.
- Reduced bets for a 50 bps Fed rate cut boost the USD and lend support to the major.
- Bullish Oil prices underpin the Loonie and cap the pair ahead of the key US NFP report.
The USD/CAD pair struggles to capitalize on the previous day's strong move up to a one-and-half-week top and oscillates in a range around mid-1.3500s during the Asian session on Friday. The downside, however, remains cushioned in the wake of the near-term bullish sentiment surrounding the US Dollar (USD) and ahead of the release of the crucial US monthly employment details.
The incoming US macro data provided evidence of a resilient labor market and suggested that the economy remained on a solid footing in the third quarter, which forced investors to further scale back their bets for a more aggressive easing by the Federal Reserve (Fed). This, in turn, assists the USD Index (DXY), which tracks the Greenback against a basket of currencies, to stand tall near a one-month peak touched on Thursday and turns out to be a key factor acting as a tailwind for the USD/CAD pair.
Furthermore, expectations for a bigger interest rate cut by the Bank of Canada (BoC) weigh on the Canadian Dollar (CAD) and offer additional support to spot prices. That said, escalating Middle East tensions keep Crude Oil prices elevated near a one-month top, which is seen underpinning the commodity-linked Loonie and capping the upside for the USD/CAD pair. Traders also prefer to move to the sidelines ahead of the official US jobs data, due later during the North American session.
The popularly known US Nonfarm Payrolls (NFP) report is expected to show that the economy added 140K jobs in September, slightly lower than the 142K in the previous month, and the Unemployment Rate held steady at 4.2%. Apart from this, Average Hourly Earnings will be looked upon for cues about the size of the Federal Reserve's (Fed) rate cut at its next policy meeting in November. This will drive the USD demand and determine the next leg of a directional move for the USD/CAD pair.
Canadian Dollar FAQs
The key factors driving the Canadian Dollar (CAD) are the level of interest rates set by the Bank of Canada (BoC), the price of Oil, Canada’s largest export, the health of its economy, inflation and the Trade Balance, which is the difference between the value of Canada’s exports versus its imports. Other factors include market sentiment – whether investors are taking on more risky assets (risk-on) or seeking safe-havens (risk-off) – with risk-on being CAD-positive. As its largest trading partner, the health of the US economy is also a key factor influencing the Canadian Dollar.
The Bank of Canada (BoC) has a significant influence on the Canadian Dollar by setting the level of interest rates that banks can lend to one another. This influences the level of interest rates for everyone. The main goal of the BoC is to maintain inflation at 1-3% by adjusting interest rates up or down. Relatively higher interest rates tend to be positive for the CAD. The Bank of Canada can also use quantitative easing and tightening to influence credit conditions, with the former CAD-negative and the latter CAD-positive.
The price of Oil is a key factor impacting the value of the Canadian Dollar. Petroleum is Canada’s biggest export, so Oil price tends to have an immediate impact on the CAD value. Generally, if Oil price rises CAD also goes up, as aggregate demand for the currency increases. The opposite is the case if the price of Oil falls. Higher Oil prices also tend to result in a greater likelihood of a positive Trade Balance, which is also supportive of the CAD.
While inflation had always traditionally been thought of as a negative factor for a currency since it lowers the value of money, the opposite has actually been the case in modern times with the relaxation of cross-border capital controls. Higher inflation tends to lead central banks to put up interest rates which attracts more capital inflows from global investors seeking a lucrative place to keep their money. This increases demand for the local currency, which in Canada’s case is the Canadian Dollar.
Macroeconomic data releases gauge the health of the economy and can have an impact on the Canadian Dollar. Indicators such as GDP, Manufacturing and Services PMIs, employment, and consumer sentiment surveys can all influence the direction of the CAD. A strong economy is good for the Canadian Dollar. Not only does it attract more foreign investment but it may encourage the Bank of Canada to put up interest rates, leading to a stronger currency. If economic data is weak, however, the CAD is likely to fall.
- Indian Rupee holds positive ground in Friday’s Asian session.
- Higher crude oil prices and Foreign Portfolio Investors (FPI) outflows weigh on the INR.
- Investors await the HSBC India Services PMI and US employment data.
The Indian Rupee (INR) recovers some lost ground on Friday. The rise in crude oil prices amid escalating geopolitical tensions in the Middle East, the significant outflow from domestic equities and regional currency downtrends could undermine the INR.
Investors will closely monitor the HSBC India Services Purchasing Managers Index (PMI) on Friday, which is expected to decline to 58.9 in September from 60.9 in August. On the US docket, the employment data for September will take center stage, including Nonfarm Payrolls (NFP) and Unemployment Rate. The US economy is expected to see 140K jobs added in September. While the Unemployment Rate is expected to remain unchanged at 4.2% in the same period. If the report shows a weaker-than-expected outcome, this could weigh on the Greenback.
Daily Digest Market Movers: Indian Rupee trades firmer, potential upside seems limited
- According to the World Bank’s latest report, the Indian economy continues to grow at a healthy pace despite global challenges, but to reach its $1 trillion merchandise exports goal by 2030, India needs to diversify its export basket and leverage global value chains.
- The US Services PMI climbed to 54.9 in September from 51.5 in August, the Institute for Supply Management (ISM) showed on Thursday. This figure came in stronger than the market forecast of 51.7.
- The US weekly Initial Jobless Claims in the US rose by 6,000 to 225,000 in the week ending September 28. This figure followed the previous week's print of 219,000 (revised from 218,000) and was worse than the market expectation of 220,000.
- Federal Reserve Bank of Chicago President Austan Goolsbee reiterated on Thursday that the interest rates need to come down over the next year by “a lot.” Goolsbee further stated that he’d like to keep the unemployment rate at 4.2% and prevent it from rising any further.
- The markets have priced in nearly 68.9% odds of a 25 bps Fed rate cut, while the chance of 50 bps reductions stands at 31.1%, according to the CME FedWatch Tool.
Technical Analysis: USD/INR keeps the positive bias in the longer term
The Indian Rupee trades stronger on the day. The USD/INR pair maintains its constructive outlook on the daily chart as the price is well-supported above the key 100-day Exponential Moving Average (EMA). The path of least resistance level is to the upside as the 14-day Relative Strength Index (RSI) stands above the midline near 61.0.
The key upside barrier for USD/INR emerges at the 84.00 level, representing the upper boundary of the rectangle and psychological mark. A decisive break above this level could attract some buyers to 84.15 (the high of August 5), followed by 84.50.
On the downside, the low of October 1 at 83.80 acts as an initial support level for the pair. A breach of this level could lead to the 100-day EMA at 83.65. Further south, the additional downside filter to watch is 83.00, representing the round mark and the low of May 24.
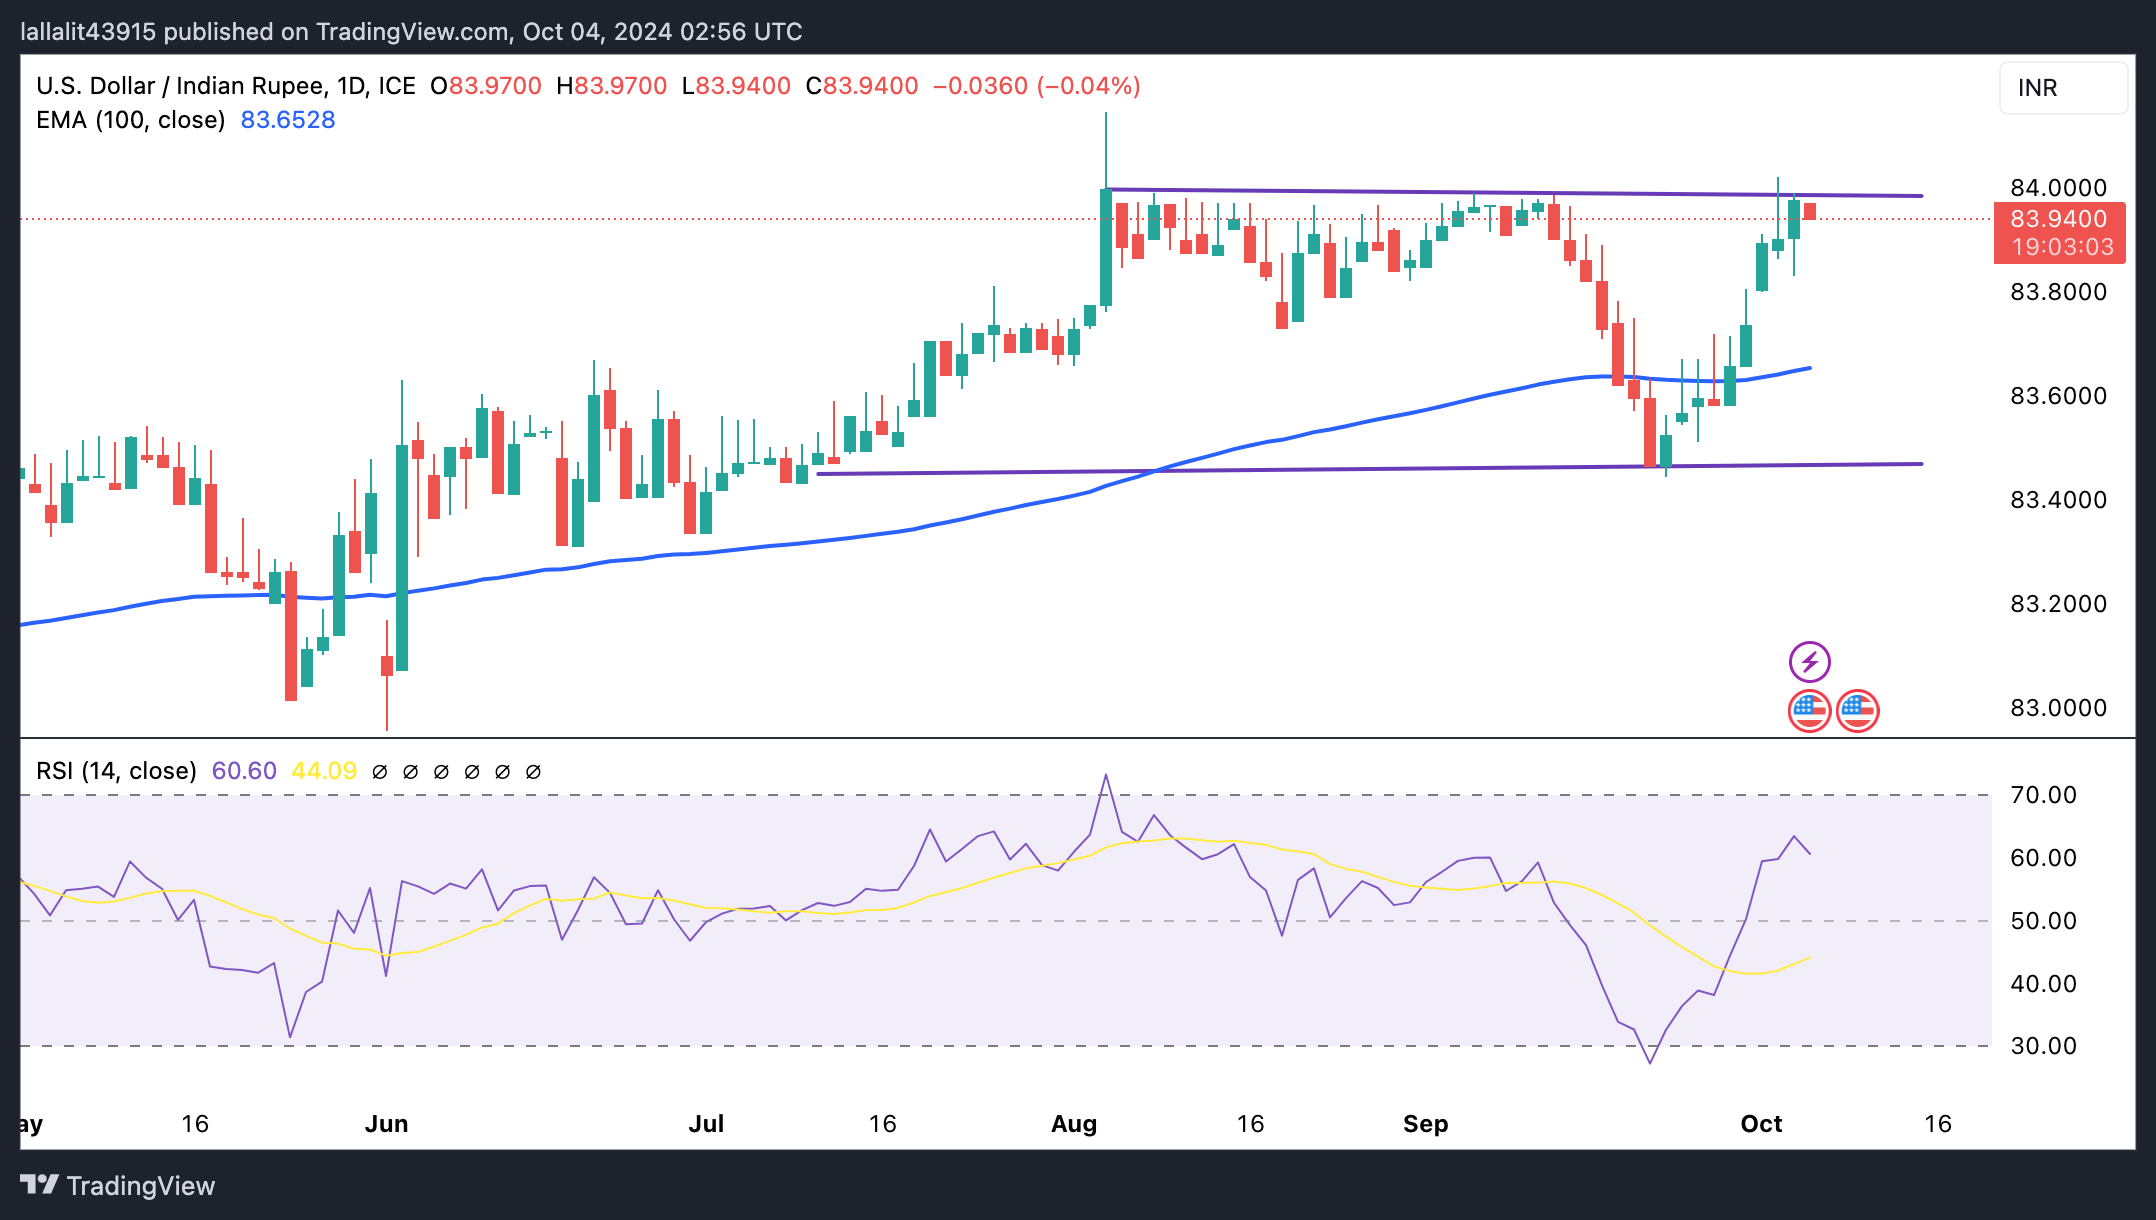
Indian Rupee FAQs
The Indian Rupee (INR) is one of the most sensitive currencies to external factors. The price of Crude Oil (the country is highly dependent on imported Oil), the value of the US Dollar – most trade is conducted in USD – and the level of foreign investment, are all influential. Direct intervention by the Reserve Bank of India (RBI) in FX markets to keep the exchange rate stable, as well as the level of interest rates set by the RBI, are further major influencing factors on the Rupee.
The Reserve Bank of India (RBI) actively intervenes in forex markets to maintain a stable exchange rate, to help facilitate trade. In addition, the RBI tries to maintain the inflation rate at its 4% target by adjusting interest rates. Higher interest rates usually strengthen the Rupee. This is due to the role of the ‘carry trade’ in which investors borrow in countries with lower interest rates so as to place their money in countries’ offering relatively higher interest rates and profit from the difference.
Macroeconomic factors that influence the value of the Rupee include inflation, interest rates, the economic growth rate (GDP), the balance of trade, and inflows from foreign investment. A higher growth rate can lead to more overseas investment, pushing up demand for the Rupee. A less negative balance of trade will eventually lead to a stronger Rupee. Higher interest rates, especially real rates (interest rates less inflation) are also positive for the Rupee. A risk-on environment can lead to greater inflows of Foreign Direct and Indirect Investment (FDI and FII), which also benefit the Rupee.
Higher inflation, particularly, if it is comparatively higher than India’s peers, is generally negative for the currency as it reflects devaluation through oversupply. Inflation also increases the cost of exports, leading to more Rupees being sold to purchase foreign imports, which is Rupee-negative. At the same time, higher inflation usually leads to the Reserve Bank of India (RBI) raising interest rates and this can be positive for the Rupee, due to increased demand from international investors. The opposite effect is true of lower inflation.
- Gold price remains confined in a narrow trading range amid mixed fundamental cues.
- Geopolitical risks lend support to the metal, though the recent USD strength caps gains.
- Traders also seem reluctant and look to the US NFP report before placing directional bets.
Gold price (XAU/USD) extends its sideways consolidative price move in a familiar range held since the beginning of the current week as traders await a fresh catalyst before positioning for the next leg of a directional move. Hence, the focus remains glued to the release of the closely-watched US monthly employment details, due later during the North American session this Friday. The popularly known Nonfarm Payrolls (NFP) report might influence expectations about the pace of the Federal Reserve's (Fed) rate-cutting cycle. This, in turn, will play a key role in driving the US Dollar (USD) demand in the near term and provide some meaningful impetus to the non-yielding yellow metal.
Heading into the key data risk, diminishing odds for a more aggressive policy easing by the Fed and an oversized rate cut at the next policy meeting in November keep the US Dollar (USD) firm near a one-month peak on Thursday. This, in turn, is seen as a key factor acting as a headwind for the Gold price. That said, a further escalation of geopolitical tensions in the Middle East and the growing risk of a broader conflict act as a tailwind for the safe-haven precious metal. Nevertheless, the XAU/USD remains within striking distance of the all-time peak touched last week.
Daily Digest Market Movers: Gold price traders remain on the sidelines ahead of the crucial US monthly jobs report
- The US Department of Labor (DOL) reported on Thursday that the number of Americans filing applications for unemployment benefits increased marginally to 225K during the week ended September 28 as compared to the 218K previous.
- This comes on top of a larger-than-anticipated increase in the US private-sector employment in September and an unexpected rise in the number of available jobs in August, providing evidence of a stable and still resilient labor market.
- Separately, the Institute for Supply Management (ISM) said that its Non-Manufacturing PMI rose to 54.9 in September, or the highest level since February 2023, suggesting that the economy remained on a solid footing in the third quarter.
- This further tempers market expectations for another oversized interest rate cut by the Federal Reserve and lifts the US Dollar to a one-month top, which, in turn, is seen as a key factor acting as a headwind for the non-yielding Gold price.
- Hezbollah launched approximately 230 projectiles from Lebanon into Israeli territory on Thursday and Israel launched strikes early on Friday targeting Hezbollah's intelligence headquarters in the southern suburbs of Lebanese capital Beirut.
- Meanwhile, Israel will reportedly carry out a very significant retaliation within days to Iran's onslaught of nearly 200 ballistic missiles on Tuesday night, raising the risk of a full-blown war and lending support to the XAU/USD.
- Traders now look forward to the US Nonfarm Payrolls (NFP) report, which is expected to show that the economy added 140K jobs in September slightly lower than the 142K previous, and the Unemployment Rate held steady at 4.2%.
- This, along with Average Hourly Earnings, will be looked upon for cues about the size of the Fed rate cut in November, which will play a key role in driving the USD demand and provide a fresh directional impetus to the commodity.
Technical Outlook: Gold price bulls have the upper hand while above the $2,625-2,624 throwback support
From a technical perspective, the range-bound price action might still be categorized as a bullish consolidation phase against the backdrop of the recent strong runup to the record peak. Moreover, oscillators on the daily chart are holding comfortably in positive territory and have also eased from the overbought zone. This, in turn, favors bullish traders and suggests that the path of least resistance for the Gold price remains to the upside. In the meantime, the $2,672-$2,673 area could offer immediate resistance ahead of the $2,685-2,686 zone, or the all-time high touched last week. This is closely followed by the $2,700 mark, which if conquered will set the stage for an extension of a well-established multi-month-old uptrend.
On the flip side, the weekly low, around the $2,625-2,624 area, which coincides with a short-term ascending channel resistance breakpoint, might continue to offer support and act as a key pivotal point. A convincing break below might prompt aggressive technical selling and drag the Gold price below the $2,600 mark, towards the next relevant support near the $2,560 zone. The corrective decline could extend further towards the $2,535-2,530 support before the XAU/USD eventually drops to the $2,500 psychological mark.
Gold FAQs
Gold has played a key role in human’s history as it has been widely used as a store of value and medium of exchange. Currently, apart from its shine and usage for jewelry, the precious metal is widely seen as a safe-haven asset, meaning that it is considered a good investment during turbulent times. Gold is also widely seen as a hedge against inflation and against depreciating currencies as it doesn’t rely on any specific issuer or government.
Central banks are the biggest Gold holders. In their aim to support their currencies in turbulent times, central banks tend to diversify their reserves and buy Gold to improve the perceived strength of the economy and the currency. High Gold reserves can be a source of trust for a country’s solvency. Central banks added 1,136 tonnes of Gold worth around $70 billion to their reserves in 2022, according to data from the World Gold Council. This is the highest yearly purchase since records began. Central banks from emerging economies such as China, India and Turkey are quickly increasing their Gold reserves.
Gold has an inverse correlation with the US Dollar and US Treasuries, which are both major reserve and safe-haven assets. When the Dollar depreciates, Gold tends to rise, enabling investors and central banks to diversify their assets in turbulent times. Gold is also inversely correlated with risk assets. A rally in the stock market tends to weaken Gold price, while sell-offs in riskier markets tend to favor the precious metal.
The price can move due to a wide range of factors. Geopolitical instability or fears of a deep recession can quickly make Gold price escalate due to its safe-haven status. As a yield-less asset, Gold tends to rise with lower interest rates, while higher cost of money usually weighs down on the yellow metal. Still, most moves depend on how the US Dollar (USD) behaves as the asset is priced in dollars (XAU/USD). A strong Dollar tends to keep the price of Gold controlled, whereas a weaker Dollar is likely to push Gold prices up.
- WTI price receives support from rising geopolitical tensions in the Middle East, raising concerns about potential supply disruptions.
- US President Joe Biden stated that Israel could strike Iran's Oil infrastructure.
- OPEC+ could potentially offset a complete loss of Oil supply if Iran's facilities are targeted.
West Texas Intermediate (WTI) Oil price continues to rise for the fourth consecutive day, holding firm with strong weekly gains, trading around $73.50 per barrel during Friday's Asian session. Crude Oil prices are supported by escalating geopolitical tensions in the Middle East, raising concerns about potential disruptions in crude supply from the region, which accounts for roughly one-third of the global Oil supply.
US President Joe Biden stated that the United States (US) is in discussions with Israel about potential strikes on Iran's Oil infrastructure. Israeli Prime Minister Benjamin Netanyahu warned that Iran "will pay a heavy price" for Tuesday’s attack, which involved the firing of at least 180 ballistic missiles at Israel, according to the BBC.
However, OPEC+, which consists of The Organization of the Petroleum Exporting Countries (OPEC) and allies such as Russia and Kazakhstan, has sufficient spare Oil capacity to offset a complete loss of Iranian supply if Israel were to target Iran’s facilities. However, the group would face significant challenges if Iran retaliates by attacking the Oil installations of its Gulf neighbors.
OPEC+ has been reducing production in recent years to support Oil prices in the face of weak global demand, leaving the group with millions of barrels in spare capacity. Currently, OPEC+ production cuts amount to 5.86 million barrels per day (bpd). Analysts estimate that Saudi Arabia can increase output by 3.0 million bpd, while the United Arab Emirates (UAE) can boost production by 1.4 million bpd.
Libya's eastern-based government and the Tripoli-based National Oil Corporation announced on Thursday the reopening of all oilfields and export terminals, following the resolution of a leadership dispute at the central bank. This decision ends a crisis that had significantly reduced the country's Oil production, according to Reuters.
WTI Oil FAQs
WTI Oil is a type of Crude Oil sold on international markets. The WTI stands for West Texas Intermediate, one of three major types including Brent and Dubai Crude. WTI is also referred to as “light” and “sweet” because of its relatively low gravity and sulfur content respectively. It is considered a high quality Oil that is easily refined. It is sourced in the United States and distributed via the Cushing hub, which is considered “The Pipeline Crossroads of the World”. It is a benchmark for the Oil market and WTI price is frequently quoted in the media.
Like all assets, supply and demand are the key drivers of WTI Oil price. As such, global growth can be a driver of increased demand and vice versa for weak global growth. Political instability, wars, and sanctions can disrupt supply and impact prices. The decisions of OPEC, a group of major Oil-producing countries, is another key driver of price. The value of the US Dollar influences the price of WTI Crude Oil, since Oil is predominantly traded in US Dollars, thus a weaker US Dollar can make Oil more affordable and vice versa.
The weekly Oil inventory reports published by the American Petroleum Institute (API) and the Energy Information Agency (EIA) impact the price of WTI Oil. Changes in inventories reflect fluctuating supply and demand. If the data shows a drop in inventories it can indicate increased demand, pushing up Oil price. Higher inventories can reflect increased supply, pushing down prices. API’s report is published every Tuesday and EIA’s the day after. Their results are usually similar, falling within 1% of each other 75% of the time. The EIA data is considered more reliable, since it is a government agency.
OPEC (Organization of the Petroleum Exporting Countries) is a group of 12 Oil-producing nations who collectively decide production quotas for member countries at twice-yearly meetings. Their decisions often impact WTI Oil prices. When OPEC decides to lower quotas, it can tighten supply, pushing up Oil prices. When OPEC increases production, it has the opposite effect. OPEC+ refers to an expanded group that includes ten extra non-OPEC members, the most notable of which is Russia.
| Raw materials | Closed | Change, % |
|---|---|---|
| Silver | 32.022 | 0.63 |
| Gold | 265.599 | -0.11 |
| Palladium | 1003.82 | -1.54 |
- The Australian Dollar appreciates as the RBA is widely expected to maintain its hawkish policy stance in November.
- The commodity-linked AUD receives support from stimulus measures in China, Australia’s largest trading partner.
- The risk-sensitive AUD/USD pair could struggle as US President Biden stated that Israel could strike Iran's Oil infrastructure.
The Australian Dollar (AUD) gains ground due to the hawkish outlook surrounding the Reserve Bank of Australia (RBA). Recent data showed retail sales growth for August exceeding expectations, reducing the chances of an early rate cut from the RBA. Markets have nearly ruled out a rate cut in November. Furthermore, the AUD is benefiting from stimulus measures in China, Australia’s largest trading partner, which have lifted commodity prices.
The risk-sensitive AUD/USD pair could encounter headwinds as rising geopolitical tensions in the Middle East weigh on risk appetite. US President Joe Biden stated that the United States (US) is in discussions with Israel about potential strikes on Iran's Oil infrastructure. Israeli Prime Minister Benjamin Netanyahu warned that Iran "will pay a heavy price" for Tuesday’s attack, which involved the firing of at least 180 ballistic missiles at Israel, according to the BBC.
The Australian Dollar came under pressure as the US Dollar (USD) gained strength following a better-than-expected US ISM Services PMI and ADP Employment Change reports, which challenged dovish expectations for Federal Reserve (Fed) monetary policy. Traders are now looking ahead to Friday’s US employment data, including Nonfarm Payrolls (NFP) and Average Hourly Earnings, for further direction.
Daily Digest Market Movers: Australian Dollar receives support from hawkish sentiment surrounding the RBA
- The CME FedWatch Tool indicates that markets are assigning a 67.4% probability to a 25 basis point rate cut by the Federal Reserve in November, while the likelihood of a 50-basis-point cut is 32.6%, down from 35.2% a day ago.
- Federal Reserve Bank of Chicago President Austan Goolsbee reiterated on Thursday that the interest rates need to come down over the next year by “a lot.” Goolsbee further stated that he’d like to keep the unemployment rate at 4.2% from rising any further.
- US ISM Services PMI rose to 54.9 in September, from 51.5 in August and exceeding the market forecast of 51.7. Meanwhile, the Services Prices Paid Index, a key inflation indicator, climbed to 59.4 from 57.3.
- Australia’s Trade Balance for August stood at 5,644 million month-over-month, surpassing market expectations of 5,500 million and slightly higher than July’s surplus of 5,636 million. However, both Exports and Imports declined by 0.2% month-over-month in August.
- Australia's Judo Bank Services Purchasing Managers' Index (PMI) posted a reading of 50.5 in September, down from 52.5 in August. This indicates the eighth consecutive month of growth in services activity, albeit at a slower and marginal rate. Meanwhile, the Composite PMI declined slightly to 49.6 in September, compared to 49.8 in the previous month, data showed on Thursday.
- Federal Reserve Bank of Richmond President Tom Barkin addressed the Fed's recent rate actions on Wednesday, warning that the fight against inflation may not be over, as risks still persist. Barkin noted that the 50 basis points (bps) rate cut in September was justified because rates had become "out of sync" with the decline in inflation, while the unemployment rate was near its sustainable level.
- The ADP Employment Change report showed an increase of 143,000 jobs in September, surpassing the forecasted 120,000 jobs. Additionally, annual pay rose by 4.7% year-over-year. The total number of jobs added in August was revised upward from 99,000 to 103,000.
- On Monday, Federal Reserve (Fed) Chairman Jerome Powell said that the central bank is not in a hurry and will lower its benchmark rate ‘over time.’ Powell added that the recent half-point interest rate cut should not indicate similarly aggressive future actions, noting that upcoming rate changes are likely to be more modest.
Technical Analysis: Australian Dollar remains below 0.6850, nine-day EMA
The AUD/USD pair trades near 0.6840 on Friday. Technical analysis of the daily chart indicates that the pair is positioned below the ascending channel, signaling an emergence of a bearish bullish bias. However, a move back into the channel would reinforce the bullish sentiment, as the 14-day Relative Strength Index (RSI) remains above the 50 level, suggesting that bullish momentum is still present.
Regarding resistance, the pair could test the immediate nine-day Exponential Moving Average (EMA) at 0.6857 level, followed by the lower boundary of the ascending channel at 0.6910 level. A return to the ascending channel would reinforce the bullish bias and support the AUD/USD pair to explore the area around the channel's upper boundary, at the 0.7040 level.
On the downside, the AUD/USD pair could target a psychological level of 0.6800. A break below this level could push the pair to navigate the region around its seven-week low of 0.6622, recorded on September 11.
AUD/USD: Daily Chart
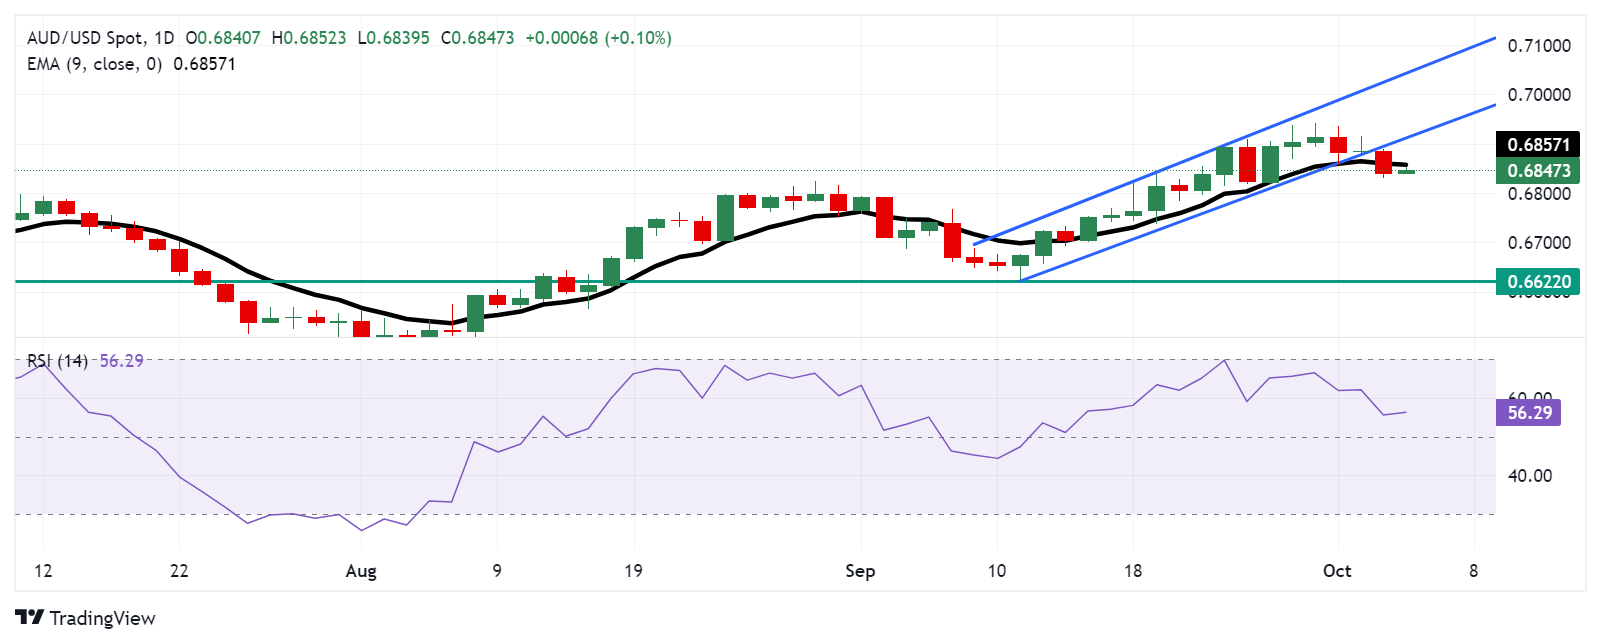
Australian Dollar PRICE Today
The table below shows the percentage change of Australian Dollar (AUD) against listed major currencies today. Australian Dollar was the strongest against the Euro.
| USD | EUR | GBP | JPY | CAD | AUD | NZD | CHF | |
|---|---|---|---|---|---|---|---|---|
| USD | 0.03% | -0.05% | -0.31% | -0.03% | -0.09% | -0.04% | -0.05% | |
| EUR | -0.03% | -0.06% | -0.32% | -0.03% | -0.12% | -0.05% | -0.10% | |
| GBP | 0.05% | 0.06% | -0.27% | 0.04% | -0.06% | -0.00% | -0.05% | |
| JPY | 0.31% | 0.32% | 0.27% | 0.29% | 0.22% | 0.25% | 0.22% | |
| CAD | 0.03% | 0.03% | -0.04% | -0.29% | -0.08% | 0.00% | -0.08% | |
| AUD | 0.09% | 0.12% | 0.06% | -0.22% | 0.08% | 0.05% | -0.02% | |
| NZD | 0.04% | 0.05% | 0.00% | -0.25% | -0.01% | -0.05% | -0.07% | |
| CHF | 0.05% | 0.10% | 0.05% | -0.22% | 0.08% | 0.02% | 0.07% |
The heat map shows percentage changes of major currencies against each other. The base currency is picked from the left column, while the quote currency is picked from the top row. For example, if you pick the Australian Dollar from the left column and move along the horizontal line to the US Dollar, the percentage change displayed in the box will represent AUD (base)/USD (quote).
Australian Dollar FAQs
One of the most significant factors for the Australian Dollar (AUD) is the level of interest rates set by the Reserve Bank of Australia (RBA). Because Australia is a resource-rich country another key driver is the price of its biggest export, Iron Ore. The health of the Chinese economy, its largest trading partner, is a factor, as well as inflation in Australia, its growth rate and Trade Balance. Market sentiment – whether investors are taking on more risky assets (risk-on) or seeking safe-havens (risk-off) – is also a factor, with risk-on positive for AUD.
The Reserve Bank of Australia (RBA) influences the Australian Dollar (AUD) by setting the level of interest rates that Australian banks can lend to each other. This influences the level of interest rates in the economy as a whole. The main goal of the RBA is to maintain a stable inflation rate of 2-3% by adjusting interest rates up or down. Relatively high interest rates compared to other major central banks support the AUD, and the opposite for relatively low. The RBA can also use quantitative easing and tightening to influence credit conditions, with the former AUD-negative and the latter AUD-positive.
China is Australia’s largest trading partner so the health of the Chinese economy is a major influence on the value of the Australian Dollar (AUD). When the Chinese economy is doing well it purchases more raw materials, goods and services from Australia, lifting demand for the AUD, and pushing up its value. The opposite is the case when the Chinese economy is not growing as fast as expected. Positive or negative surprises in Chinese growth data, therefore, often have a direct impact on the Australian Dollar and its pairs.
Iron Ore is Australia’s largest export, accounting for $118 billion a year according to data from 2021, with China as its primary destination. The price of Iron Ore, therefore, can be a driver of the Australian Dollar. Generally, if the price of Iron Ore rises, AUD also goes up, as aggregate demand for the currency increases. The opposite is the case if the price of Iron Ore falls. Higher Iron Ore prices also tend to result in a greater likelihood of a positive Trade Balance for Australia, which is also positive of the AUD.
The Trade Balance, which is the difference between what a country earns from its exports versus what it pays for its imports, is another factor that can influence the value of the Australian Dollar. If Australia produces highly sought after exports, then its currency will gain in value purely from the surplus demand created from foreign buyers seeking to purchase its exports versus what it spends to purchase imports. Therefore, a positive net Trade Balance strengthens the AUD, with the opposite effect if the Trade Balance is negative.
Japan's newly appointed Economy Minister Ryosei Akazawa said on Friday that Prime Minister Shigeru Ishiba and the BoJ share the view that exit from deflation is Japan's top priority.
Additional quotes
No change to the interpretation of the government-Bank of Japan (BoJ) accord targeting 2% inflation.
Will communicate with markets, dialogue with markets is important.
Timing of monetary policy change is important, must align with Japan's broader goal of exiting deflation.
Market reaction
At the time of writing, USD/JPY has paused its renewed downside, trading at around 146.65, still losing 0.18% on the day.
Japan's Finance Minister Katsunobu Kato said on Thursday that he will unveil an economic package with a focus on price relief and growth and will discuss assistance for low-income households.
Key quotes
Focus on price relief.
Measures to boost economic growth.
Assistance for low-income household..
Market reaction
At the time of writing, USD/JPY was down 0.24% on the day at 146.57.
Japanese Yen FAQs
The Japanese Yen (JPY) is one of the world’s most traded currencies. Its value is broadly determined by the performance of the Japanese economy, but more specifically by the Bank of Japan’s policy, the differential between Japanese and US bond yields, or risk sentiment among traders, among other factors.
One of the Bank of Japan’s mandates is currency control, so its moves are key for the Yen. The BoJ has directly intervened in currency markets sometimes, generally to lower the value of the Yen, although it refrains from doing it often due to political concerns of its main trading partners. The BoJ ultra-loose monetary policy between 2013 and 2024 caused the Yen to depreciate against its main currency peers due to an increasing policy divergence between the Bank of Japan and other main central banks. More recently, the gradually unwinding of this ultra-loose policy has given some support to the Yen.
Over the last decade, the BoJ’s stance of sticking to ultra-loose monetary policy has led to a widening policy divergence with other central banks, particularly with the US Federal Reserve. This supported a widening of the differential between the 10-year US and Japanese bonds, which favored the US Dollar against the Japanese Yen. The BoJ decision in 2024 to gradually abandon the ultra-loose policy, coupled with interest-rate cuts in other major central banks, is narrowing this differential.
The Japanese Yen is often seen as a safe-haven investment. This means that in times of market stress, investors are more likely to put their money in the Japanese currency due to its supposed reliability and stability. Turbulent times are likely to strengthen the Yen’s value against other currencies seen as more risky to invest in.
Israel officials said that Hezbollah launched approximately 230 projectiles from Lebanon into Israeli territory on Thursday.
The Israeli military vows to continue targeting Hezbollah in Beirut and southern Lebanon, after more airstrikes in the capital on Thursday. An attack in downtown Beirut killed nine people, marking Israel's first strike in the region since 2006, per CNN.
Market reaction
At the time of press, the Gold price was up 0.07% on the day at $2,658.
Risk sentiment FAQs
In the world of financial jargon the two widely used terms “risk-on” and “risk off'' refer to the level of risk that investors are willing to stomach during the period referenced. In a “risk-on” market, investors are optimistic about the future and more willing to buy risky assets. In a “risk-off” market investors start to ‘play it safe’ because they are worried about the future, and therefore buy less risky assets that are more certain of bringing a return, even if it is relatively modest.
Typically, during periods of “risk-on”, stock markets will rise, most commodities – except Gold – will also gain in value, since they benefit from a positive growth outlook. The currencies of nations that are heavy commodity exporters strengthen because of increased demand, and Cryptocurrencies rise. In a “risk-off” market, Bonds go up – especially major government Bonds – Gold shines, and safe-haven currencies such as the Japanese Yen, Swiss Franc and US Dollar all benefit.
The Australian Dollar (AUD), the Canadian Dollar (CAD), the New Zealand Dollar (NZD) and minor FX like the Ruble (RUB) and the South African Rand (ZAR), all tend to rise in markets that are “risk-on”. This is because the economies of these currencies are heavily reliant on commodity exports for growth, and commodities tend to rise in price during risk-on periods. This is because investors foresee greater demand for raw materials in the future due to heightened economic activity.
The major currencies that tend to rise during periods of “risk-off” are the US Dollar (USD), the Japanese Yen (JPY) and the Swiss Franc (CHF). The US Dollar, because it is the world’s reserve currency, and because in times of crisis investors buy US government debt, which is seen as safe because the largest economy in the world is unlikely to default. The Yen, from increased demand for Japanese government bonds, because a high proportion are held by domestic investors who are unlikely to dump them – even in a crisis. The Swiss Franc, because strict Swiss banking laws offer investors enhanced capital protection.
Japan Chief Cabinet Secretary Yoshimasa Hayashi said on Friday that Japan's new Prime Minister Shigeru Ishiba has instructed the compilation of a comprehensive economic package. Hayashi added that he will submit a supplementary budget to Parliament after the lower house election.
Market reaction
At the time of writing, USD/JPY is trading 0.24% lower on the day at 146.58.
Japanese Yen FAQs
The Japanese Yen (JPY) is one of the world’s most traded currencies. Its value is broadly determined by the performance of the Japanese economy, but more specifically by the Bank of Japan’s policy, the differential between Japanese and US bond yields, or risk sentiment among traders, among other factors.
One of the Bank of Japan’s mandates is currency control, so its moves are key for the Yen. The BoJ has directly intervened in currency markets sometimes, generally to lower the value of the Yen, although it refrains from doing it often due to political concerns of its main trading partners. The BoJ ultra-loose monetary policy between 2013 and 2024 caused the Yen to depreciate against its main currency peers due to an increasing policy divergence between the Bank of Japan and other main central banks. More recently, the gradually unwinding of this ultra-loose policy has given some support to the Yen.
Over the last decade, the BoJ’s stance of sticking to ultra-loose monetary policy has led to a widening policy divergence with other central banks, particularly with the US Federal Reserve. This supported a widening of the differential between the 10-year US and Japanese bonds, which favored the US Dollar against the Japanese Yen. The BoJ decision in 2024 to gradually abandon the ultra-loose policy, coupled with interest-rate cuts in other major central banks, is narrowing this differential.
The Japanese Yen is often seen as a safe-haven investment. This means that in times of market stress, investors are more likely to put their money in the Japanese currency due to its supposed reliability and stability. Turbulent times are likely to strengthen the Yen’s value against other currencies seen as more risky to invest in.
- USD/JPY enters a bullish consolidation phase near its highest level since August 19.
- Bulls seem reluctant to place fresh bets ahead of the release of the US NFP report.
- BoJ rate hike uncertainty and reduced bets for a 50 bps Fed rate cut lend support.
The USD/JPY pair is seen oscillating in a narrow range during the Asian session on Friday and consolidating its weekly gains to the highest level since August 19 touched the previous day. Spot prices currently trade below the 147.00 mark, unchanged for the day, as traders opt to move to the sidelines ahead of the release of the closely-watched US monthly employment details.
The popularly known US Nonfarm Payrolls (NFP) report is expected to show that the economy added 140K jobs in September, slightly lower than the 142K in the previous month, and the Unemployment Rate held steady at 4.2%. Apart from this, Average Hourly Earnings will be looked upon for cues about the size of the Federal Reserve's (Fed) rate cut at its next policy meeting in November. This, in turn, will play a key role in driving the demand for the US Dollar (USD) and provide some meaningful impetus to the USD/JPY pair.
Heading into the key data risk, investors have been scaling back their bets for a more aggressive policy easing by the Fed amid signs of a still resilient US labor market. This pushed the USD Index (DXY), which tracks the Greenback against a basket of currencies, to a one-month top on Thursday. Furthermore, reduced bets for more BoJ rate hikes in 2024, along with the political uncertainty ahead of a snap election in Japan on October 27, could undermine the Japanese Yen (JPY) and act as a tailwind for the USD/JPY pair.
Nevertheless, spot prices remain on track to register strong gains for the second week in the previous three and barring any big negative surprises from the US jobs data, the fundamental backdrop supports prospects for further gains. That said, persistent geopolitical risks stemming from the ongoing conflicts in the Middle East and the risk of a full-blown war in the region could benefit the safe-haven JPY. This might turn out to be the only factor holding back bullish traders from placing aggressive bets around the USD/JPY pair.
Economic Indicator
Nonfarm Payrolls
The Nonfarm Payrolls release presents the number of new jobs created in the US during the previous month in all non-agricultural businesses; it is released by the US Bureau of Labor Statistics (BLS). The monthly changes in payrolls can be extremely volatile. The number is also subject to strong reviews, which can also trigger volatility in the Forex board. Generally speaking, a high reading is seen as bullish for the US Dollar (USD), while a low reading is seen as bearish, although previous months' reviews and the Unemployment Rate are as relevant as the headline figure. The market's reaction, therefore, depends on how the market assesses all the data contained in the BLS report as a whole.
Read more.Next release: Fri Oct 04, 2024 12:30
Frequency: Monthly
Consensus: 140K
Previous: 142K
Source: US Bureau of Labor Statistics
America’s monthly jobs report is considered the most important economic indicator for forex traders. Released on the first Friday following the reported month, the change in the number of positions is closely correlated with the overall performance of the economy and is monitored by policymakers. Full employment is one of the Federal Reserve’s mandates and it considers developments in the labor market when setting its policies, thus impacting currencies. Despite several leading indicators shaping estimates, Nonfarm Payrolls tend to surprise markets and trigger substantial volatility. Actual figures beating the consensus tend to be USD bullish.
- NZD/USD recovers to near 0.6215 in Friday’s early Asian session.
- Reduced bets of Fed deeper rate cuts and the cautious mood might underpin the USD and cap NZD/USD’s upside.
- The RBNZ will likely cut its OCR by 50 bps next week.
The NZD/USD pair edges higher to around 0.6215 on Friday during the early Asian trading hours. The cautious mood ahead of the key US employment data on Friday and the growing bets of the Reserve Bank of New Zealand (RBNZ) rate cut next week might cap the pair’s upside.
Federal Reserve Bank of Chicago President Austan Goolsbee reiterated on Thursday that the interest rates need to come down over the next year by “a lot.” Goolsbee further stated that he’d like to keep the unemployment rate at 4.2% from rising any further. Meanwhile, Richmond Fed President Thomas Barkin said on Wednesday that a jumbo rate cut last month was an acknowledgement that its policy rate was "out of sync" with where the economy stands but shouldn't be taken as a sign that the battle with inflation is finished.
Traders await the US employment data for fresh impetus. The US economy is expected to see 140K jobs added in September. While the Unemployment Rate is expected to remain unchanged at 4.2% in the same period.
The rising geopolitical tensions in the Middle East and the uncertainty around the US elections might support the US Dollar in the near term. After carrying out further airstrikes in Lebanon's capital on Thursday, the Israeli military vows to continue attacking Hezbollah targets in Beirut and southern Lebanon. An attack in central Beirut killed nine people, marking the first time Israel has targeted the city since 2006, per CNN.
The RBNZ is anticipated to reduce the Official Cash Rate (OCR) by 50 basis points to 4.75% next week, after a 25 bps cut in August. The swaps market implies a 75% chance of a 50 bps cut, while the vast majority of analysts surveyed by Bloomberg have a 50 bps cut pencilled in. The expectation that the RBNZ will continue cutting interest rates next week is likely to drag the Kiwi lower against the USD.
New Zealand Dollar FAQs
The New Zealand Dollar (NZD), also known as the Kiwi, is a well-known traded currency among investors. Its value is broadly determined by the health of the New Zealand economy and the country’s central bank policy. Still, there are some unique particularities that also can make NZD move. The performance of the Chinese economy tends to move the Kiwi because China is New Zealand’s biggest trading partner. Bad news for the Chinese economy likely means less New Zealand exports to the country, hitting the economy and thus its currency. Another factor moving NZD is dairy prices as the dairy industry is New Zealand’s main export. High dairy prices boost export income, contributing positively to the economy and thus to the NZD.
The Reserve Bank of New Zealand (RBNZ) aims to achieve and maintain an inflation rate between 1% and 3% over the medium term, with a focus to keep it near the 2% mid-point. To this end, the bank sets an appropriate level of interest rates. When inflation is too high, the RBNZ will increase interest rates to cool the economy, but the move will also make bond yields higher, increasing investors’ appeal to invest in the country and thus boosting NZD. On the contrary, lower interest rates tend to weaken NZD. The so-called rate differential, or how rates in New Zealand are or are expected to be compared to the ones set by the US Federal Reserve, can also play a key role in moving the NZD/USD pair.
Macroeconomic data releases in New Zealand are key to assess the state of the economy and can impact the New Zealand Dollar’s (NZD) valuation. A strong economy, based on high economic growth, low unemployment and high confidence is good for NZD. High economic growth attracts foreign investment and may encourage the Reserve Bank of New Zealand to increase interest rates, if this economic strength comes together with elevated inflation. Conversely, if economic data is weak, NZD is likely to depreciate.
The New Zealand Dollar (NZD) tends to strengthen during risk-on periods, or when investors perceive that broader market risks are low and are optimistic about growth. This tends to lead to a more favorable outlook for commodities and so-called ‘commodity currencies’ such as the Kiwi. Conversely, NZD tends to weaken at times of market turbulence or economic uncertainty as investors tend to sell higher-risk assets and flee to the more-stable safe havens.
| Index | Change, points | Closed | Change, % |
|---|---|---|---|
| NIKKEI 225 | 743.3 | 38552.06 | 1.97 |
| Hang Seng | -330.22 | 22113.51 | -1.47 |
| ASX 200 | 7 | 8205.2 | 0.09 |
| DAX | -149.34 | 19015.41 | -0.78 |
| CAC 40 | -99.81 | 7477.78 | -1.32 |
| Dow Jones | -184.93 | 42011.59 | -0.44 |
| S&P 500 | -9.6 | 5699.94 | -0.17 |
| NASDAQ Composite | -6.64 | 17918.47 | -0.04 |
| Pare | Closed | Change, % |
|---|---|---|
| AUDUSD | 0.68397 | -0.66 |
| EURJPY | 161.984 | 0.18 |
| EURUSD | 1.10318 | -0.15 |
| GBPJPY | 192.675 | -0.77 |
| GBPUSD | 1.31217 | -1.1 |
| NZDUSD | 0.62113 | -0.81 |
| USDCAD | 1.35532 | 0.4 |
| USDCHF | 0.8524 | 0.35 |
| USDJPY | 146.831 | 0.34 |


© 2000-2026. Sva prava zaštićena.
Sajt je vlasništvo kompanije Teletrade D.J. LLC 2351 LLC 2022 (Euro House, Richmond Hill Road, Kingstown, VC0100, St. Vincent and the Grenadines).
Svi podaci koji se nalaze na sajtu ne predstavljaju osnovu za donošenje investicionih odluka, već su informativnog karaktera.
The company does not serve or provide services to customers who are residents of the US, Canada, Iran, The Democratic People's Republic of Korea, Yemen and FATF blacklisted countries.
Izvršenje trgovinskih operacija sa finansijskim instrumentima upotrebom marginalne trgovine pruža velike mogućnosti i omogućava investitorima ostvarivanje visokih prihoda. Međutim, takav vid trgovine povezan je sa potencijalno visokim nivoom rizika od gubitka sredstava. Проведение торговых операций на финанcовых рынках c маржинальными финанcовыми инcтрументами открывает широкие возможноcти, и позволяет инвеcторам, готовым пойти на риcк, получать выcокую прибыль, но при этом неcет в cебе потенциально выcокий уровень риcка получения убытков. Iz tog razloga je pre započinjanja trgovine potrebno odlučiti o izboru odgovarajuće investicione strategije, uzimajući u obzir raspoložive resurse.
Upotreba informacija: U slučaju potpunog ili delimičnog preuzimanja i daljeg korišćenja materijala koji se nalazi na sajtu, potrebno je navesti link odgovarajuće stranice na sajtu kompanije TeleTrade-a kao izvora informacija. Upotreba materijala na internetu mora biti praćena hiper linkom do web stranice teletrade.org. Automatski uvoz materijala i informacija sa stranice je zabranjen.
Ako imate bilo kakvih pitanja, obratite nam se pr@teletrade.global.
транcфери