- Analiza
- Novosti i instrumenti
- Vesti sa tržišta
Forex-novosti i prognoze od 04-09-2024
- AUD/USD trades on a weaker note near 0.6720 in Thursday’s early Asian session.
- The weaker US Job Openings data suggested continued cooling in the US job market, undermining the USD.
- Traders will monitor the RBA’s Bullock speech ahead of US ISM Services PMI on Thursday.
The AUD/USD pair softens around 0.6720 during the early Asian session on Thursday. The pair trades in a volatile session amid Chinese economic concern and the weaker US Dollar (USD). Traders will take more cues from the Reserve Bank of Australia's (RBA) Michele Bullock's speech ahead of the US ISM Services PMI, which is due later on Thursday.
The weaker-than-expected US JOLT Job Openings for July signaled further cooling in the US labor market, triggering the expectation of a potential 50 basis points (bps) rate cut by the US Federal Reserve (Fed) in September. This, in turn, might weigh on the USD against the Australian Dollar (AUD). Traders will keep an eye on the US August Nonfarm Payrolls (NFP) for August on Friday. Goldman Sachs analysts noted, “A market correction may start to get traction if payrolls are weak on Friday.”
On the Aussie front, Australia’s Gross Domestic Product (GDP) growth grew by just 0.2% in the April-June period and 1% over the last year, the Australian Bureau of Statistics reported on Wednesday. The report indicated that the Australian economy registered its worst performance in more than 30 years, excluding the first year of the COVID-19 pandemic.
Additionally, the fear of a Chinese economic slowdown might contribute to the AUD’s downside as China is a major trading partner to Australia. Chinese Caixin Manufacturing PMI rose to 50.4 in August from 49.8 in July, below the estimation of 52.2.
Traders await the RBA’s Bullock speech on Thursday for more insight about the economic and interest rate outlook. Any hawkish comments from Bullock could lift the Aussie and cap the pair’s downside.
Australian Dollar FAQs
One of the most significant factors for the Australian Dollar (AUD) is the level of interest rates set by the Reserve Bank of Australia (RBA). Because Australia is a resource-rich country another key driver is the price of its biggest export, Iron Ore. The health of the Chinese economy, its largest trading partner, is a factor, as well as inflation in Australia, its growth rate and Trade Balance. Market sentiment – whether investors are taking on more risky assets (risk-on) or seeking safe-havens (risk-off) – is also a factor, with risk-on positive for AUD.
The Reserve Bank of Australia (RBA) influences the Australian Dollar (AUD) by setting the level of interest rates that Australian banks can lend to each other. This influences the level of interest rates in the economy as a whole. The main goal of the RBA is to maintain a stable inflation rate of 2-3% by adjusting interest rates up or down. Relatively high interest rates compared to other major central banks support the AUD, and the opposite for relatively low. The RBA can also use quantitative easing and tightening to influence credit conditions, with the former AUD-negative and the latter AUD-positive.
China is Australia’s largest trading partner so the health of the Chinese economy is a major influence on the value of the Australian Dollar (AUD). When the Chinese economy is doing well it purchases more raw materials, goods and services from Australia, lifting demand for the AUD, and pushing up its value. The opposite is the case when the Chinese economy is not growing as fast as expected. Positive or negative surprises in Chinese growth data, therefore, often have a direct impact on the Australian Dollar and its pairs.
Iron Ore is Australia’s largest export, accounting for $118 billion a year according to data from 2021, with China as its primary destination. The price of Iron Ore, therefore, can be a driver of the Australian Dollar. Generally, if the price of Iron Ore rises, AUD also goes up, as aggregate demand for the currency increases. The opposite is the case if the price of Iron Ore falls. Higher Iron Ore prices also tend to result in a greater likelihood of a positive Trade Balance for Australia, which is also positive of the AUD.
The Trade Balance, which is the difference between what a country earns from its exports versus what it pays for its imports, is another factor that can influence the value of the Australian Dollar. If Australia produces highly sought after exports, then its currency will gain in value purely from the surplus demand created from foreign buyers seeking to purchase its exports versus what it spends to purchase imports. Therefore, a positive net Trade Balance strengthens the AUD, with the opposite effect if the Trade Balance is negative.
- USD/CAD trades flat around 1.3505 in Thursday’s early Asian session.
- The BoC cut interest rates by 25 bps, bringing its policy rate to 4.25% on Wednesday.
- JOLTS Job Openings fell to their lowest level in three and a half years in July, weighing on the USD.
The USD/CAD pair trades on a flat note near 1.3505 during the early Asian session on Thursday. The Bank of Canada (BoC) cut interest rates as expected, while US Job Openings came in weaker than expected. Traders await the release of US August ISM Services PMI data on Thursday for fresh impetus, which is expected to ease to 51.1 from 51.4 in July.
The Bank of Canada (BoC) decided to cut its benchmark interest rate for the third consecutive time at its September meeting on Wednesday, as widely expected. The BoC governor Tiff Macklem said, “If inflation continues to ease broadly in line with our July forecast, it is reasonable to expect further cuts in our policy rate.”
During the press conference, BoC’s Macklem stated that 25 basis points (bps) cut looked appropriate, adding that he’s not seeing a big impact on the exchange rate from divergence with the US Federal Reserve (Fed) on rates.
Meanwhile, crude oil prices fell to the lowest level in nine months as downbeat US economic data and a sluggish Chinese economy raised concerns about a weaker global economy. It's worth noting that Canada is the largest oil exporter to the United States (US), and lower crude oil prices tend to have a negative impact on the CAD value.
Data released by the Labor Department on Wednesday reported that the Job Openings and Labor Turnover Survey showed that available positions fell to 7.67 million in July, compared with 7.91 million openings (revised from 8.1 million) seen in June and came in below the market consensus of 8.1 million.
The dovish comments from Atlanta Fed President Raphael Bostic might undermine the USD. Bostic stated that he is ready to start cutting interest rates even though inflation is still running above the US central bank’s target. The markets are now pricing in nearly 57% possibility of a 25 basis points (bps) rate cut by the Fed in September, while the chance of a 50 bps reduction stands at 43%, according to the CME FedWatch tool.
Looking ahead, the US Nonfarm Payrolls (NFP) for August will be released on Friday, which is projected to show an increase of 161,000. This event could offer some hints about the size of the Fed rate cut this year and give a clear trading opportunity to the USD/CAD pair.
Canadian Dollar FAQs
The key factors driving the Canadian Dollar (CAD) are the level of interest rates set by the Bank of Canada (BoC), the price of Oil, Canada’s largest export, the health of its economy, inflation and the Trade Balance, which is the difference between the value of Canada’s exports versus its imports. Other factors include market sentiment – whether investors are taking on more risky assets (risk-on) or seeking safe-havens (risk-off) – with risk-on being CAD-positive. As its largest trading partner, the health of the US economy is also a key factor influencing the Canadian Dollar.
The Bank of Canada (BoC) has a significant influence on the Canadian Dollar by setting the level of interest rates that banks can lend to one another. This influences the level of interest rates for everyone. The main goal of the BoC is to maintain inflation at 1-3% by adjusting interest rates up or down. Relatively higher interest rates tend to be positive for the CAD. The Bank of Canada can also use quantitative easing and tightening to influence credit conditions, with the former CAD-negative and the latter CAD-positive.
The price of Oil is a key factor impacting the value of the Canadian Dollar. Petroleum is Canada’s biggest export, so Oil price tends to have an immediate impact on the CAD value. Generally, if Oil price rises CAD also goes up, as aggregate demand for the currency increases. The opposite is the case if the price of Oil falls. Higher Oil prices also tend to result in a greater likelihood of a positive Trade Balance, which is also supportive of the CAD.
While inflation had always traditionally been thought of as a negative factor for a currency since it lowers the value of money, the opposite has actually been the case in modern times with the relaxation of cross-border capital controls. Higher inflation tends to lead central banks to put up interest rates which attracts more capital inflows from global investors seeking a lucrative place to keep their money. This increases demand for the local currency, which in Canada’s case is the Canadian Dollar.
Macroeconomic data releases gauge the health of the economy and can have an impact on the Canadian Dollar. Indicators such as GDP, Manufacturing and Services PMIs, employment, and consumer sentiment surveys can all influence the direction of the CAD. A strong economy is good for the Canadian Dollar. Not only does it attract more foreign investment but it may encourage the Bank of Canada to put up interest rates, leading to a stronger currency. If economic data is weak, however, the CAD is likely to fall.
- EUR/USD rose on Wednesday as markets sell off Greenback.
- Markets have tilted into a risk-on position as bets of a Fed rate cut rise.
- US jobs data rules the market roost as investors look to NFP.
EUR/USD caught a bid on Wednesday, rebounding from a recent selloff and catching technical support from 1.1050. Despite the topside tilt to price action in the midweek, the pair remains hobbled below the 1.1100 handle. US jobs data will remain the key focus for markets this week in the run-up to Friday’s US Nonfarm Payrolls (NFP).
European Retail Sales remain the sole key data print from the EU side of the Pacific this week. Slated for early Thursday, pan-EU Retail Sales figures in July are expected to recover to a scant 0.1% YoY compared to the previous -0.3% contraction.
US JOLTS Job Openings in July missed the mark, adding 7.673 million available jobs compared to the forecast 8.1 million, compared to the previous month’s revised 7.91 million. With the Federal Reserve (Fed) broadly expected to begin cutting interest rates on September 18, markets are tilting further into bets of a 50 bps cut to kick off the next rate cutting cycle. Rate markets are still pricing in 100 bps in total cuts by the end of 2024, but there’s still a 57% chance of the Fed’s September rate call being a slimmer 25 bps, according to CME’s FedWatch Tool.
Friday's US Nonfarm Payrolls (NFP) report looms large and represents the last round of key US labor data before the Fed’s first rate trim. Friday's NFP print is widely expected to set the tone for market expectations regarding the depth of a Fed rate cut, with investors fully priced in on the start of a new rate-cutting cycle this month.
EUR/USD price forecast
Fiber has slumped back into near-term technical barriers, but bidders continue to come out of the woodwork to keep bids on balance even if they can’t quite pull out a bullish recovery. EUR/USD popped into a 13-month high just above 1.1200 early last week, and a near-term pullback in Greenback flows sees bids scrambling to hold onto bullish chart paper.
The pair still trades well north of the 200-day Exponential Moving Average (EMA) at 1.0845. Despite holding deep in the bull country, EUR/USD still faces a steepening bearish pullback as shorts congregate targets just above the 50-day EMA at 1.0956.
EUR/USD daily chart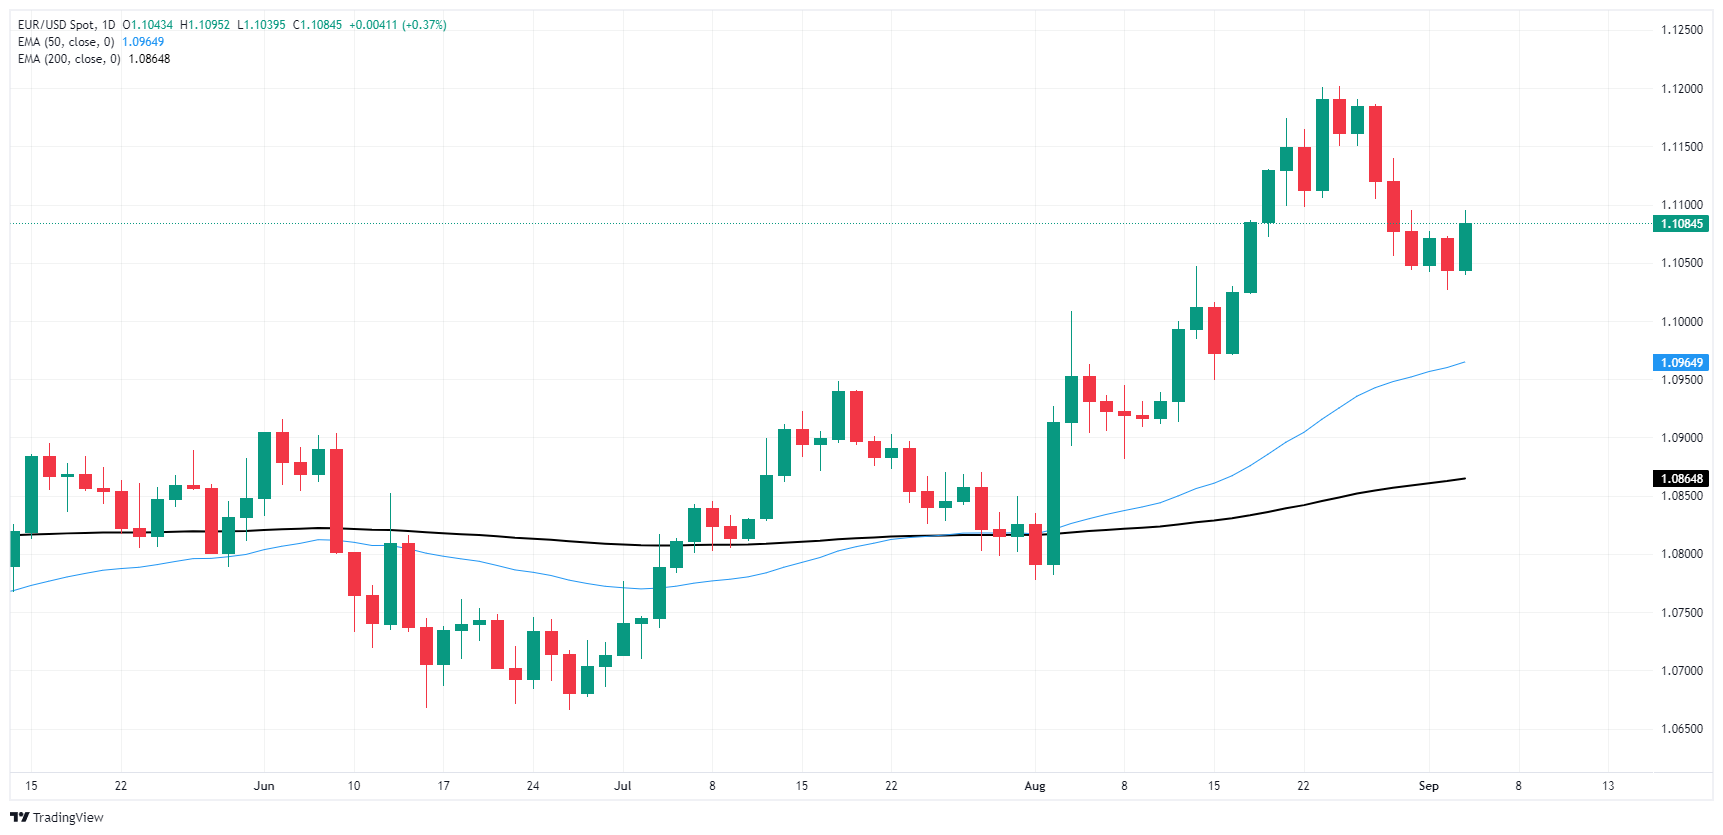
Euro FAQs
The Euro is the currency for the 20 European Union countries that belong to the Eurozone. It is the second most heavily traded currency in the world behind the US Dollar. In 2022, it accounted for 31% of all foreign exchange transactions, with an average daily turnover of over $2.2 trillion a day. EUR/USD is the most heavily traded currency pair in the world, accounting for an estimated 30% off all transactions, followed by EUR/JPY (4%), EUR/GBP (3%) and EUR/AUD (2%).
The European Central Bank (ECB) in Frankfurt, Germany, is the reserve bank for the Eurozone. The ECB sets interest rates and manages monetary policy. The ECB’s primary mandate is to maintain price stability, which means either controlling inflation or stimulating growth. Its primary tool is the raising or lowering of interest rates. Relatively high interest rates – or the expectation of higher rates – will usually benefit the Euro and vice versa. The ECB Governing Council makes monetary policy decisions at meetings held eight times a year. Decisions are made by heads of the Eurozone national banks and six permanent members, including the President of the ECB, Christine Lagarde.
Eurozone inflation data, measured by the Harmonized Index of Consumer Prices (HICP), is an important econometric for the Euro. If inflation rises more than expected, especially if above the ECB’s 2% target, it obliges the ECB to raise interest rates to bring it back under control. Relatively high interest rates compared to its counterparts will usually benefit the Euro, as it makes the region more attractive as a place for global investors to park their money.
Data releases gauge the health of the economy and can impact on the Euro. Indicators such as GDP, Manufacturing and Services PMIs, employment, and consumer sentiment surveys can all influence the direction of the single currency. A strong economy is good for the Euro. Not only does it attract more foreign investment but it may encourage the ECB to put up interest rates, which will directly strengthen the Euro. Otherwise, if economic data is weak, the Euro is likely to fall. Economic data for the four largest economies in the euro area (Germany, France, Italy and Spain) are especially significant, as they account for 75% of the Eurozone’s economy.
Another significant data release for the Euro is the Trade Balance. This indicator measures the difference between what a country earns from its exports and what it spends on imports over a given period. If a country produces highly sought after exports then its currency will gain in value purely from the extra demand created from foreign buyers seeking to purchase these goods. Therefore, a positive net Trade Balance strengthens a currency and vice versa for a negative balance.
- NZD/JPY extends its downward momentum, falling to 89.00.
- The RSI has dropped to 45, falling from 60, indicating a sharp decline in buying pressure.
The NZD/JPY pair is holding onto its bearish bias, selling off Wednesday's session. Technical indicators point to bears gaining control, and the pair may slide lower in the near term.
The Relative Strength Index (RSI) has plummeted to 45, indicating that selling pressure is increasing. This reading suggests that the pair is likely to continue its downward movement and challenge the support at 88.00. The Moving Average Convergence Divergence (MACD) has also turned bearish, with the MACD printing falling green bars, indicating that the bearish momentum is gathering strength.
NZD/JPY daily chart
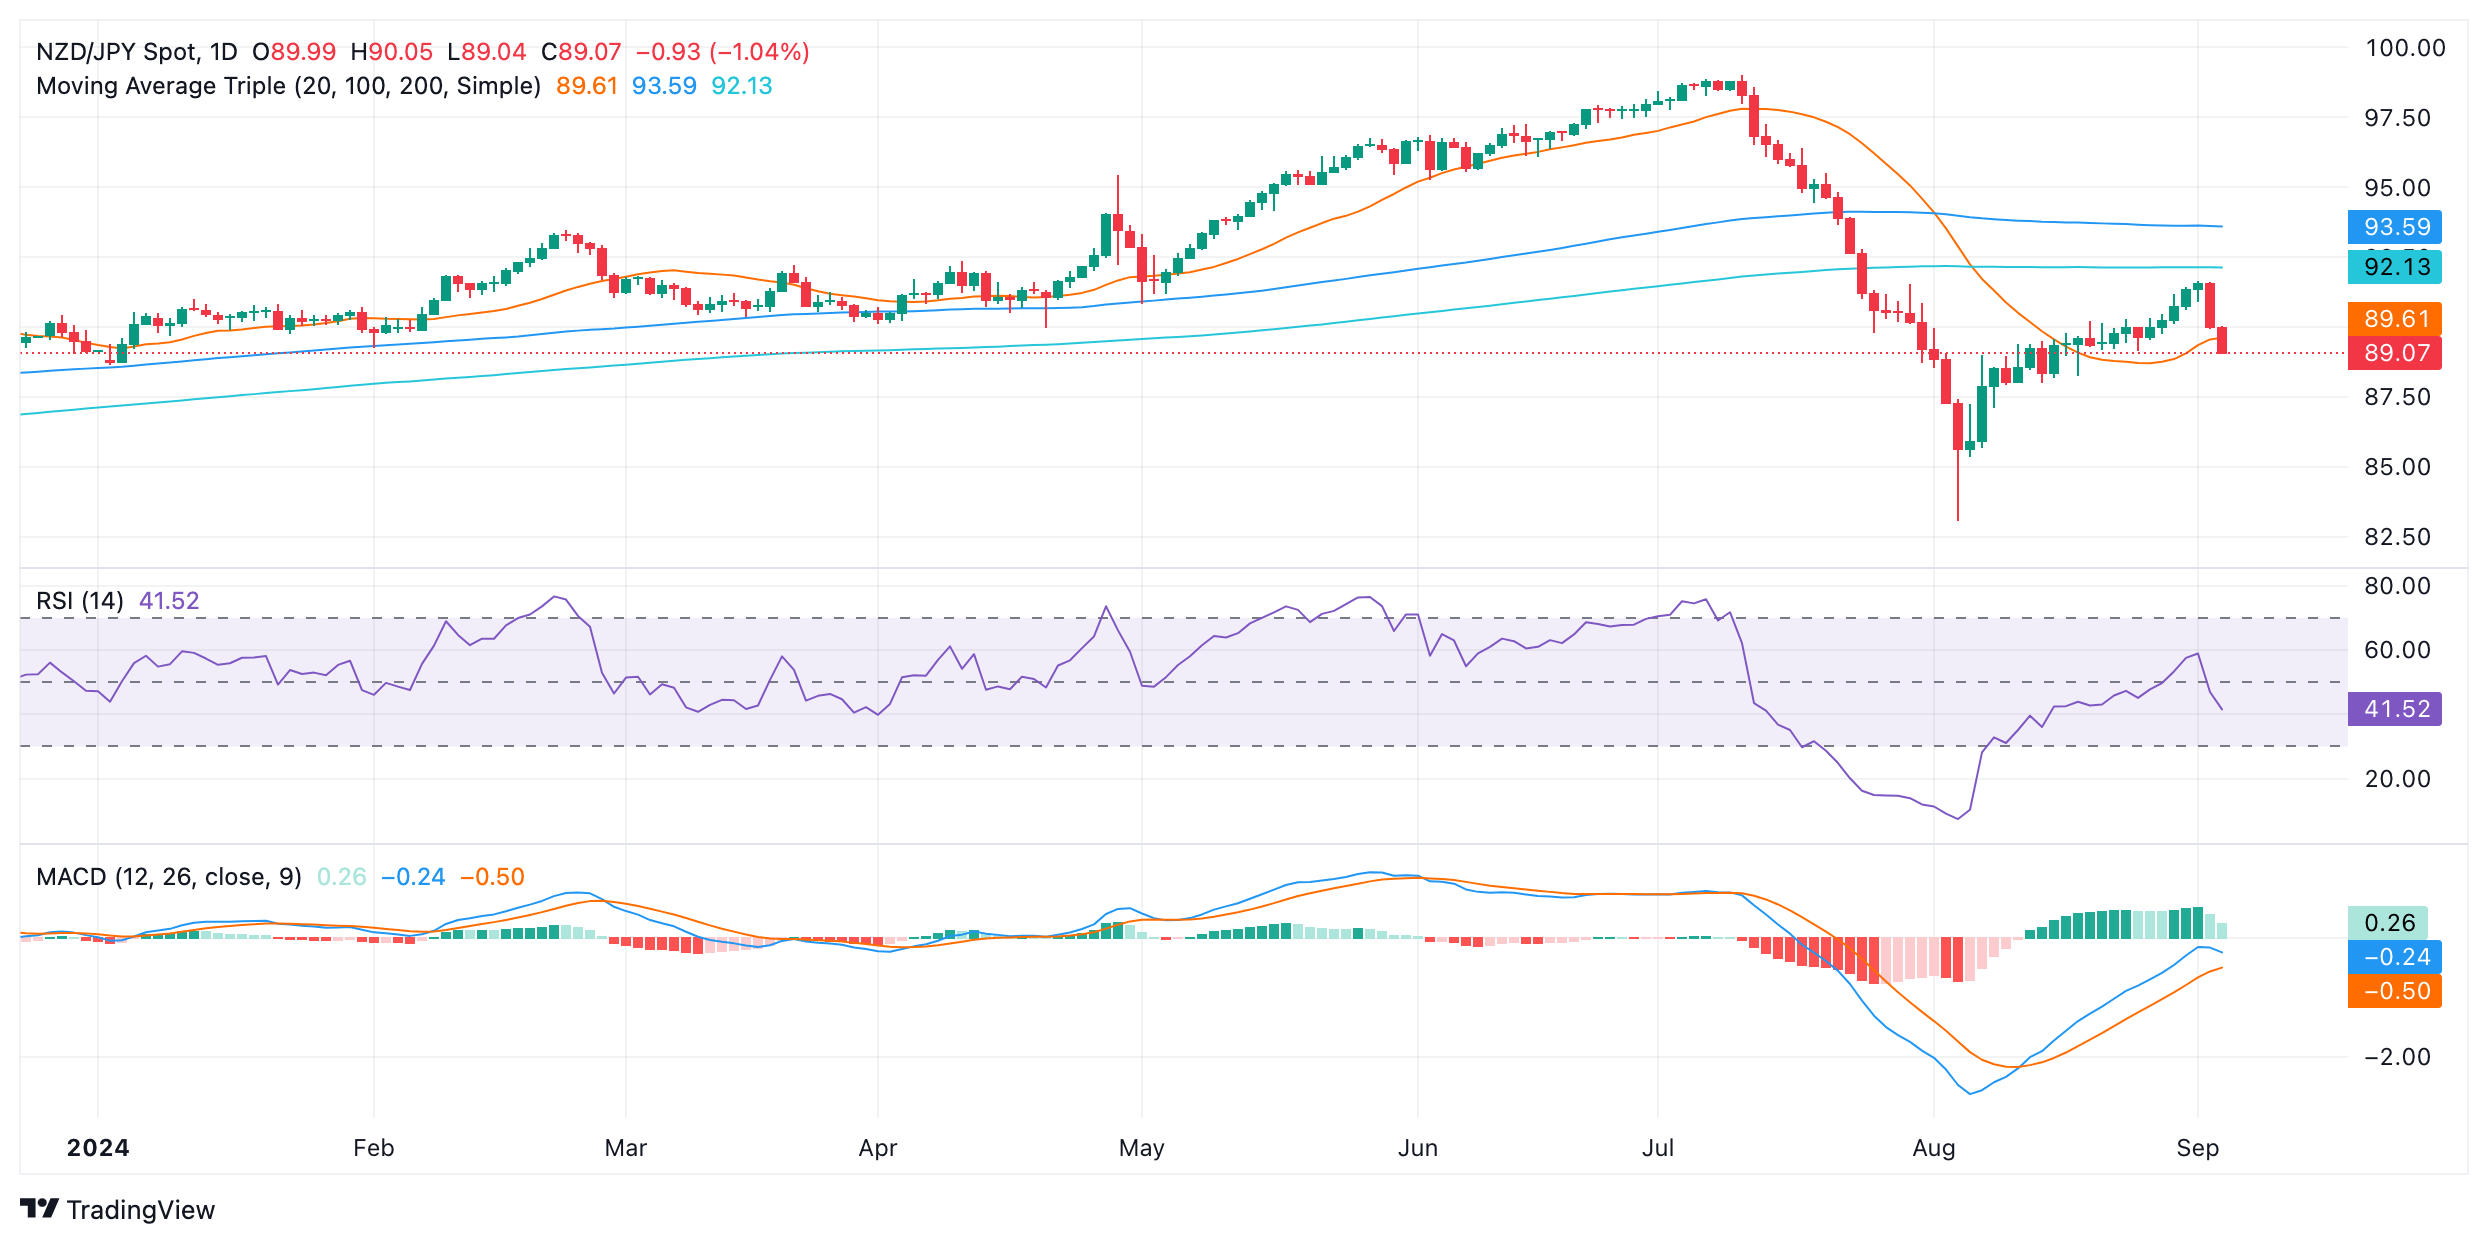
The NZD/JPY pair seems to be losing ground, with negative technical indicators and a falling RSI. After falling below the 20-day SMA at 89.60, bears seemed to have gathered enough momentum to continue pushing the pair lower, with 88.70, 88.50, and 88.30 presenting strong barriers to the sellers.
- XAG/USD climbs to $28.21, reclaiming the key $28.00 level after US JOLTS data hints at rate cuts.
- Momentum remains flat despite a bullish RSI, with key resistance at the 100-DMA of $29.14.
- Sellers must push below $28.00 to test support at $27.71 and the 200-DMA at $26.59.
Silver price recovers in late trading on Wednesday, gains over 0.74%, and trades at $28.21 at the time of writing.
US data reassured that the labor market is cooling, as the latest US JOLTS report portrays. This increased the odds for a 50-basis point interest rate cut at the next Fed meeting in two weeks. The grey metal rose, while US yields dropped and undermined the Greenback. This allowed the precious metal to reclaim the $28.00 figure.
XAG/USD Price Forecast: Technical outlook
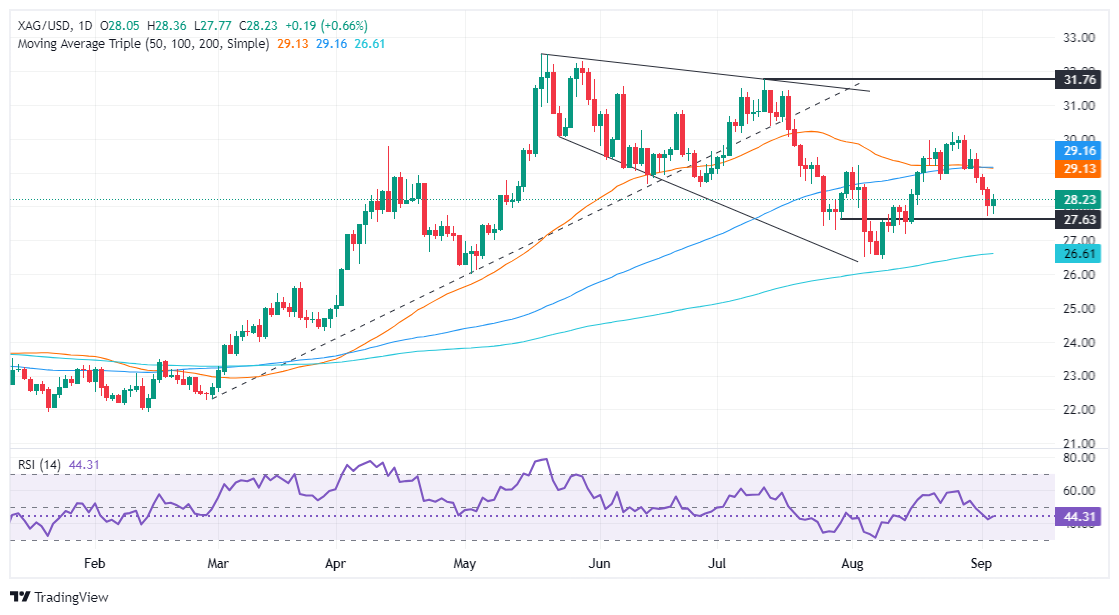
The XAg/USD continues to hover around $28.00, yet it achieved a daily close above the latter. Momentum remains flat even though the Relative Strength Index (RSI) is bullish, but the slope is almost horizontal, hinting that neither buyers nor sellers are in control.
Key technical indicators like the 50—and 100-day moving averages (DMAs) above price action hint that Silver could test lower prices in the short term. Still, sellers need to clear key support levels on their way south.
They must drag XAG/USD prices below the $28.00 figure, followed by the September 3 low of $27.71. Further weakness will sponsor a leg-down toward the August 14 swing low of $27.18, followed by the 200-day moving average (DMA) at $26.59.
Conversely, buyers need to reclaim the 100-DMA at $29.14 if they would like to regain control.
XAG/USD Price Action – Daily Chart
Silver FAQs
Silver is a precious metal highly traded among investors. It has been historically used as a store of value and a medium of exchange. Although less popular than Gold, traders may turn to Silver to diversify their investment portfolio, for its intrinsic value or as a potential hedge during high-inflation periods. Investors can buy physical Silver, in coins or in bars, or trade it through vehicles such as Exchange Traded Funds, which track its price on international markets.
Silver prices can move due to a wide range of factors. Geopolitical instability or fears of a deep recession can make Silver price escalate due to its safe-haven status, although to a lesser extent than Gold's. As a yieldless asset, Silver tends to rise with lower interest rates. Its moves also depend on how the US Dollar (USD) behaves as the asset is priced in dollars (XAG/USD). A strong Dollar tends to keep the price of Silver at bay, whereas a weaker Dollar is likely to propel prices up. Other factors such as investment demand, mining supply – Silver is much more abundant than Gold – and recycling rates can also affect prices.
Silver is widely used in industry, particularly in sectors such as electronics or solar energy, as it has one of the highest electric conductivity of all metals – more than Copper and Gold. A surge in demand can increase prices, while a decline tends to lower them. Dynamics in the US, Chinese and Indian economies can also contribute to price swings: for the US and particularly China, their big industrial sectors use Silver in various processes; in India, consumers’ demand for the precious metal for jewellery also plays a key role in setting prices.
Silver prices tend to follow Gold's moves. When Gold prices rise, Silver typically follows suit, as their status as safe-haven assets is similar. The Gold/Silver ratio, which shows the number of ounces of Silver needed to equal the value of one ounce of Gold, may help to determine the relative valuation between both metals. Some investors may consider a high ratio as an indicator that Silver is undervalued, or Gold is overvalued. On the contrary, a low ratio might suggest that Gold is undervalued relative to Silver.
- GBP/USD recovered one-quarter of one percent on Wednesday.
- Despite a bullish bounce, Cable remains hampered by familiar levels.
- US jobs data weighs on market sentiment as NFP looms ahead.
GBP/USD caught a bounce on broad-market risk flows pushing down the Greenback, keeping Cable bid on the north side of the 1.3100 handle on Wednesday. Despite a pivot in risk appetite, GBP bidders were unable to push price action into new territory, and the pair remains hobbled within recent levels.
There remains very little to say about the UK’s economic calendar for the remainder of the trading week; UK data releases are strictly low-tier through Friday, leaving Cable traders at the mercy of overall market flows into and out of the US Dollar.
US JOLTS Job Openings in July missed the mark, adding 7.673 million available jobs compared to the forecast 8.1 million, compared to the previous month’s revised 7.91 million. With the Federal Reserve (Fed) broadly expected to begin cutting interest rates on September 18, markets are tilting further into bets of a 50 bps cut to kick off the next rate cutting cycle. Rate markets are still pricing in 100 bps in total cuts by the end of 2024, but there’s still a 57% chance of the Fed’s September rate call being a slimmer 25 bps, according to CME’s FedWatch Tool.
Friday's US Nonfarm Payrolls (NFP) report looms large and represents the last round of key US labor data before the Fed’s first rate trim. Friday's NFP print is widely expected to set the tone for market expectations regarding the depth of a Fed rate cut, with investors fully priced in on the start of a new rate-cutting cycle this month.
GBP/USD price forecast
Despite an intraday recovery on Wednesday, Cable remains down from multi-month highs above 1.3250. The pair is sticking stubbornly to recent highs after vaulting to a peak 29-month bid in August. Price action is still tilted firmly into the bullish side above the 200-day Exponential Moving Average (EMA) at 1.2725, while the immediate downside technical target for shorts will be the 50-day EMA just above the 1.2900 handle.
GBP/USD daily chart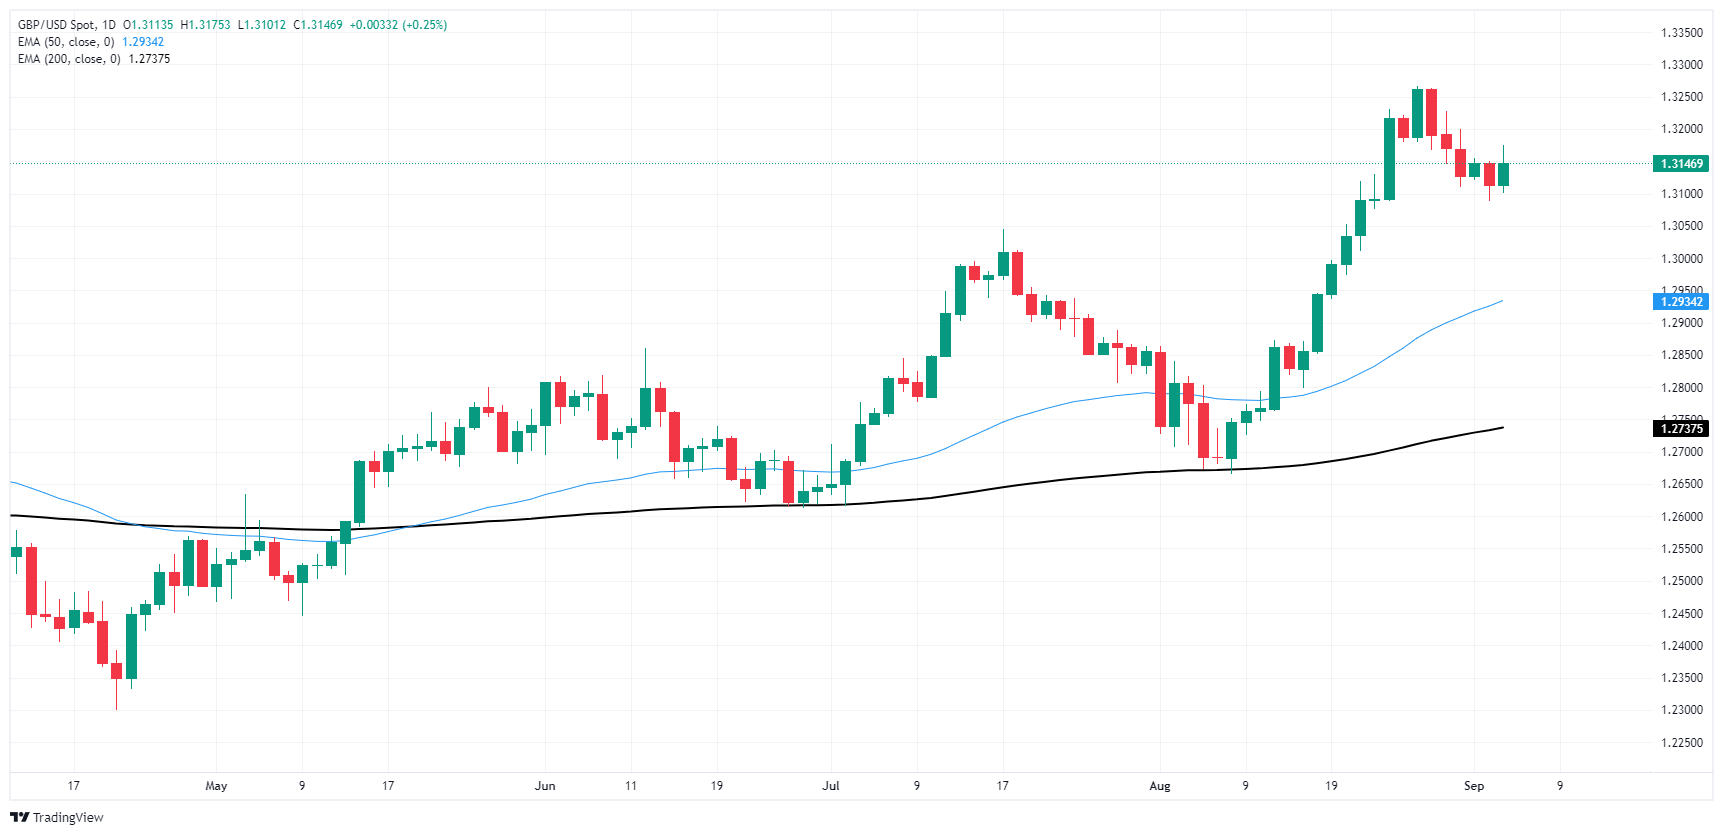
Pound Sterling FAQs
The Pound Sterling (GBP) is the oldest currency in the world (886 AD) and the official currency of the United Kingdom. It is the fourth most traded unit for foreign exchange (FX) in the world, accounting for 12% of all transactions, averaging $630 billion a day, according to 2022 data. Its key trading pairs are GBP/USD, aka ‘Cable’, which accounts for 11% of FX, GBP/JPY, or the ‘Dragon’ as it is known by traders (3%), and EUR/GBP (2%). The Pound Sterling is issued by the Bank of England (BoE).
The single most important factor influencing the value of the Pound Sterling is monetary policy decided by the Bank of England. The BoE bases its decisions on whether it has achieved its primary goal of “price stability” – a steady inflation rate of around 2%. Its primary tool for achieving this is the adjustment of interest rates. When inflation is too high, the BoE will try to rein it in by raising interest rates, making it more expensive for people and businesses to access credit. This is generally positive for GBP, as higher interest rates make the UK a more attractive place for global investors to park their money. When inflation falls too low it is a sign economic growth is slowing. In this scenario, the BoE will consider lowering interest rates to cheapen credit so businesses will borrow more to invest in growth-generating projects.
Data releases gauge the health of the economy and can impact the value of the Pound Sterling. Indicators such as GDP, Manufacturing and Services PMIs, and employment can all influence the direction of the GBP. A strong economy is good for Sterling. Not only does it attract more foreign investment but it may encourage the BoE to put up interest rates, which will directly strengthen GBP. Otherwise, if economic data is weak, the Pound Sterling is likely to fall.
Another significant data release for the Pound Sterling is the Trade Balance. This indicator measures the difference between what a country earns from its exports and what it spends on imports over a given period. If a country produces highly sought-after exports, its currency will benefit purely from the extra demand created from foreign buyers seeking to purchase these goods. Therefore, a positive net Trade Balance strengthens a currency and vice versa for a negative balance.
- The NZD/USD pair is showing signs of consolidation after reaching yearly highs last week.
- The RSI and the MAC point to a flattening bullish traction.
The NZD/USD pair is consolidating near the 0.6200 support level as bulls take a breather after August's rally.
The Relative Strength Index (RSI), at 57 remains in positive territory but flat. However, the decreasing green bars in the Moving Average Convergence Divergence (MACD), suggest that bullish momentum remains steady but decreasing. If the MACD turns to bearish momentum, it could confirm to a reversal of sentiment.
NZD/USD daily chart
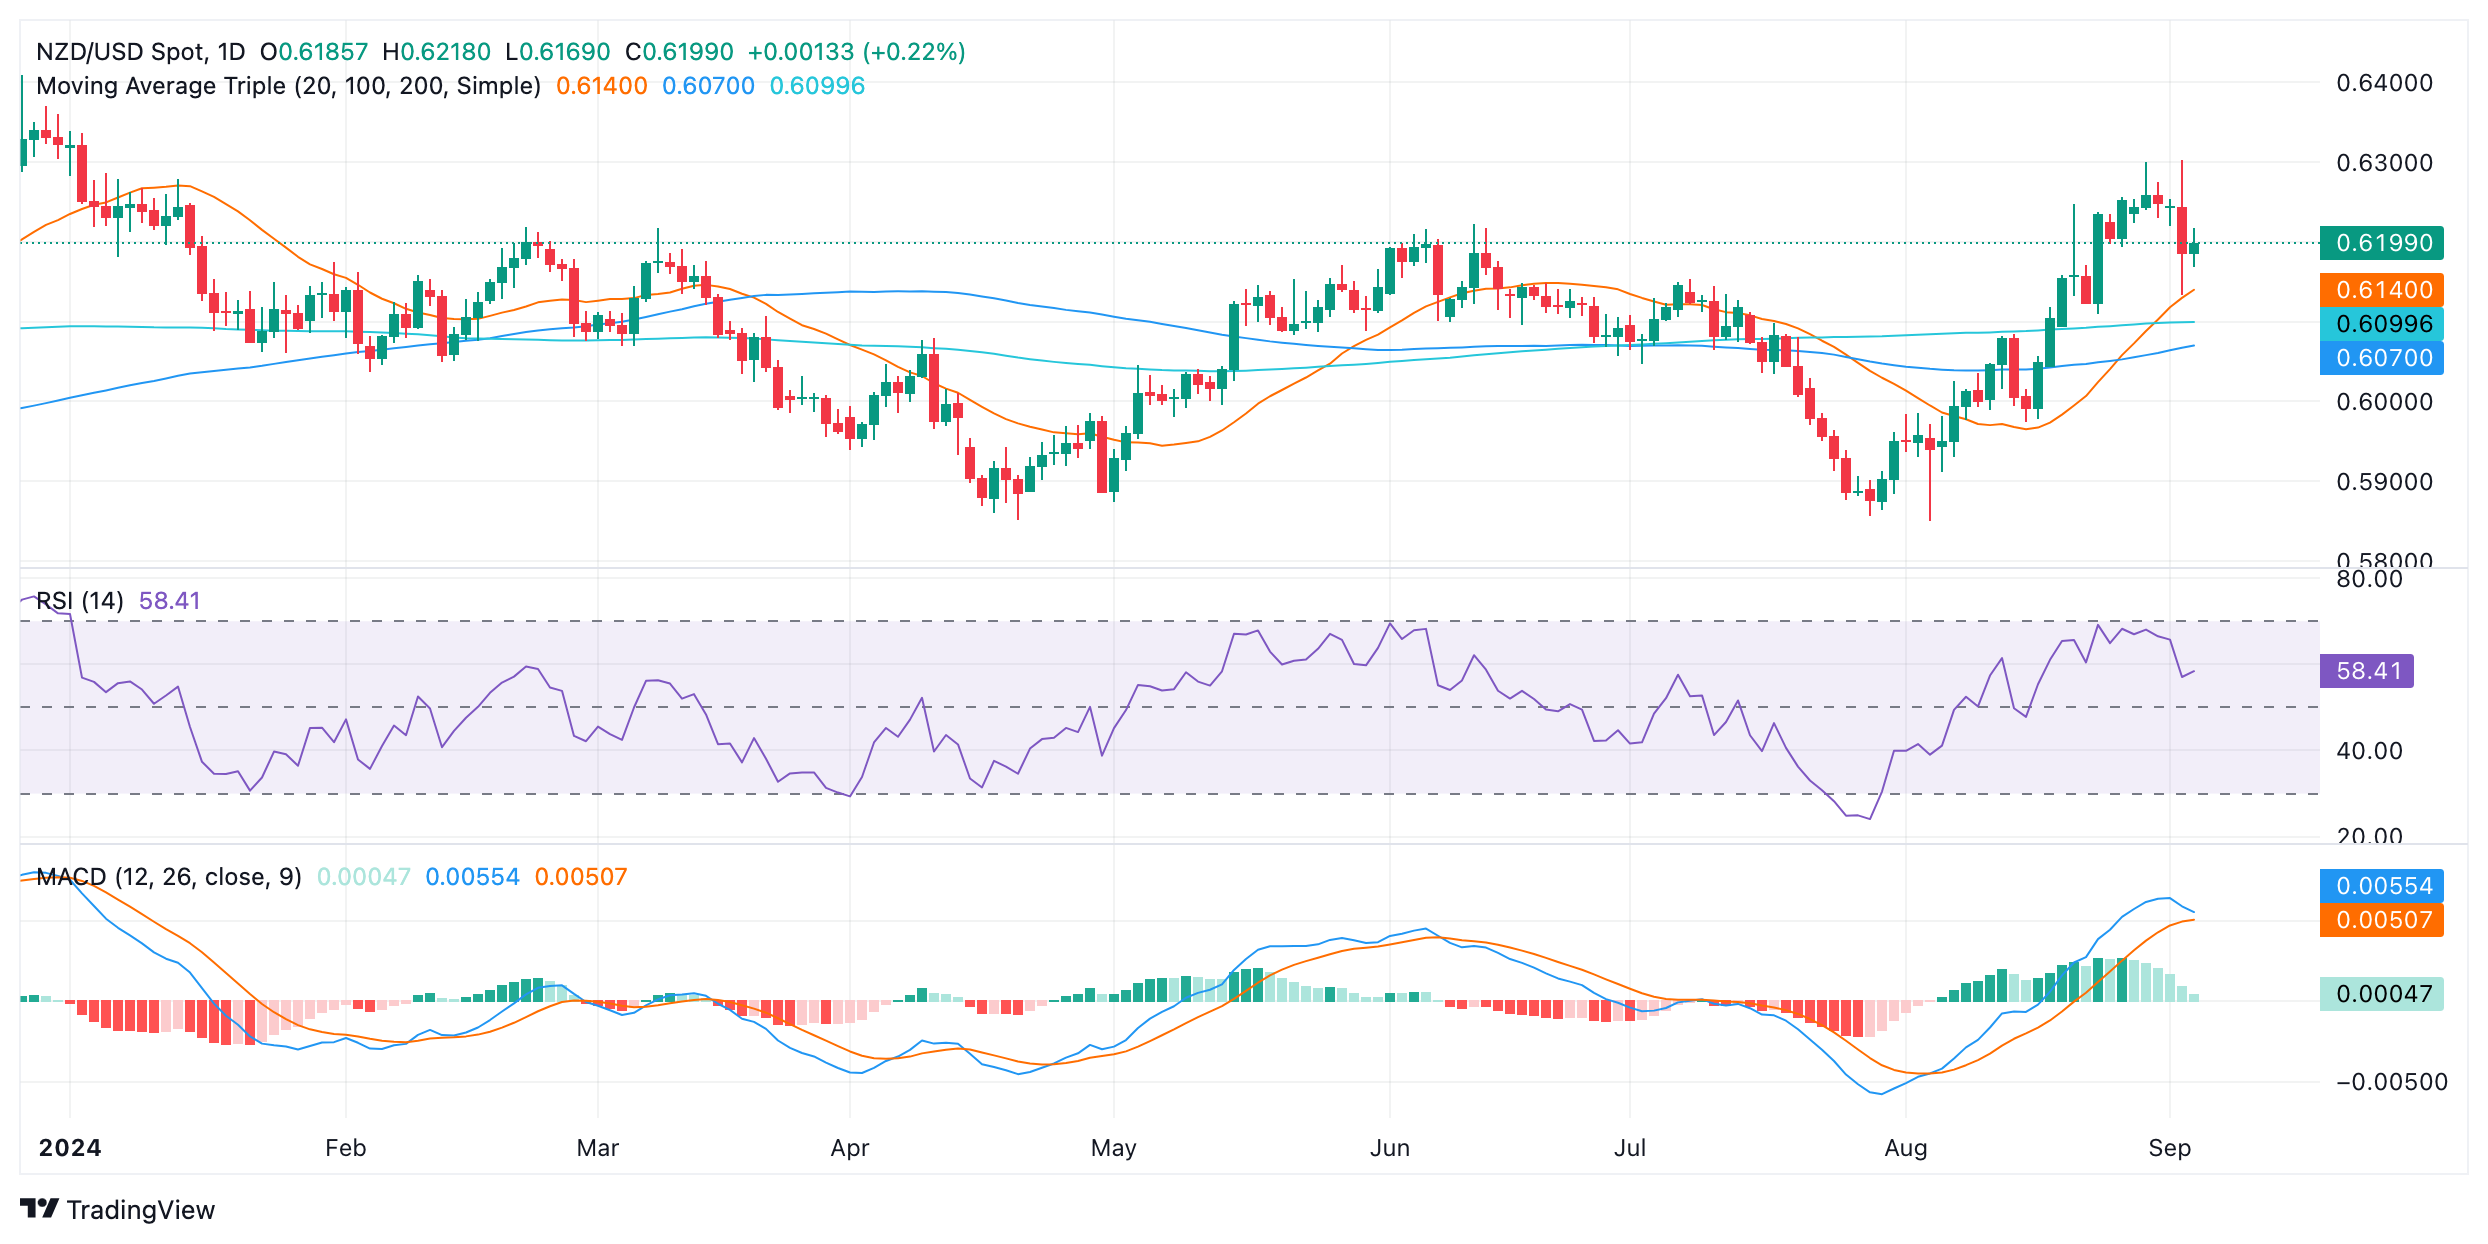
Looking at the daily chart, the NZD/USD pair is facing resistance at the 0.6230 level. A break above this level could open the door for further gains. On the downside, the pair is facing support at the 0.6170 level. A break below this level could shift the tide in favor of the bears. Overall, the outlook is positive but a healthy correction was needed after rising to highs since January last week where the upside movement became over-extended. Now the pair is set to consolidate.
- USD/JPY declines to 143.77, weighed by falling US 10-year Treasury yields and bearish market sentiment.
- Key support at 143.45 is now in focus, with further downside risks toward the 143.00 and 142.50 levels.
- Bulls need to reclaim the Kijun-Sen at 148.45 to regain control, with 150.00 acting as a critical resistance.
The USD/JPY collapsed late during the North American session and fell below 144.00 for the first time since last Wednesday. At the time of writing, the major is at 143.77, losing more than 1%.
Softer than expected, US JOLTS data for July increased speculations that the Federal Reserve will lower rates at the upcoming meeting, being the only doubt about the size of the cut. Consequently, that weighed on the closely correlated US 10-year Treasury note yield with the USD/JPY, with the former extending losses by almost 2% at 3.757%.
USD/JPY Price Forecast: Technical outlook
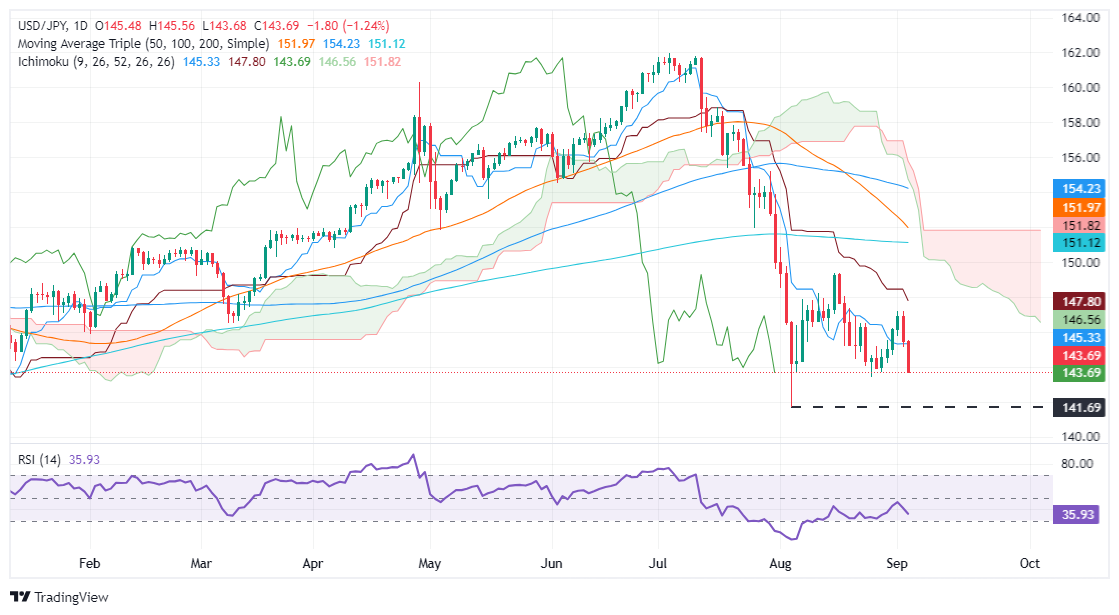
The USD/JPY resumed its downtrend after registering a leg-up from 143.44 (August 26) to 147.21 (September 3 high), sinking following the US data release, as momentum turned bearish.
The Relative Strength Index (RSI) remained bearish, but its slope shifted upwards to downwards, a sign of a trend shift in the short term.
The USD/JPY first support would be the August 26 daily low of 143.45. A breach of the latter would expose key psychological support levels, like the 143.00 mark, followed by the 142.50 and 142.00. Once hurdled, the next stop would be the August 5 low of 141.69.
For bulls to regain control, they must regain the Kijun-Sen at 148.45 before reclaiming the 150.00 figure above the latest cycle high of 149.39.
USD/JPY Price Action – Daily Chart
Japanese Yen PRICE Today
The table below shows the percentage change of Japanese Yen (JPY) against listed major currencies today. Japanese Yen was the strongest against the Swiss Franc.
| USD | EUR | GBP | JPY | CAD | AUD | NZD | CHF | |
|---|---|---|---|---|---|---|---|---|
| USD | 0.00% | 0.00% | -0.03% | 0.00% | 0.06% | -0.06% | 0.14% | |
| EUR | -0.01% | 0.03% | -0.02% | 0.00% | 0.04% | -0.02% | 0.15% | |
| GBP | -0.00% | -0.03% | -0.04% | 0.03% | 0.04% | -0.04% | 0.02% | |
| JPY | 0.03% | 0.02% | 0.04% | 0.02% | 0.07% | 0.02% | 0.09% | |
| CAD | 0.00% | -0.01% | -0.03% | -0.02% | 0.06% | -0.03% | 0.02% | |
| AUD | -0.06% | -0.04% | -0.04% | -0.07% | -0.06% | -0.03% | -0.03% | |
| NZD | 0.06% | 0.02% | 0.04% | -0.02% | 0.03% | 0.03% | 0.06% | |
| CHF | -0.14% | -0.15% | -0.02% | -0.09% | -0.02% | 0.03% | -0.06% |
The heat map shows percentage changes of major currencies against each other. The base currency is picked from the left column, while the quote currency is picked from the top row. For example, if you pick the Japanese Yen from the left column and move along the horizontal line to the US Dollar, the percentage change displayed in the box will represent JPY (base)/USD (quote).
- Australian Dollar records modest gains due to waning USD strength.
- Australian Q2 GDP meets expectations but relies heavily on government spending.
- US job openings decrease, indicating potential labor market easing, which weighs on USD.
The AUD/USD saw mild gains on Wednesday, rising to 0.6720 amid reduced USD strength. This move followed the release of Australian Q2 GDP data, which met expectations but highlighted the economy's reliance on government spending and subdued private domestic demand. This weakness supports the case for the Reserve Bank of Australia (RBA) to ease monetary policy in the near term. Michelle Bullocks will speak on Thursday.
Given the uncertain economic outlook in Australia and the Reserve Bank of Australia's (RBA) aggressive stance on monetary policy due to persistent inflation, financial markets anticipate only a 0.25% reduction in interest rates in 2024.
Daily digest market movers: Australian Dollar rises on weak US jobs data, eyes on Bullock statements
- On the local front, Australia's Q2 GDP growth met expectations at 0.2% QoQ, but the YoY rate exceeded forecasts at 1.0%.
- Government spending boosted GDP growth by 0.3%, while private sector activity subtracted 0.1%.
- Net exports added 0.1% to growth, while inventory destocking reduced it by 0.3%.
- Weak private demand reinforced expectations for RBA easing later this year, but the best-case scenario is that the bank will only cut 25 bps in 2024.
- US job openings fell to 7.67 million in July, below expectations of 8.1 million.
- US decline in job openings suggests a cooling labor market, potentially adding pressure on the Federal Reserve to cut rates.
- Next Fed steps will likely be determined by Friday's Nonfarm Payrolls figures from August.
AUD/USD technical outlook: Bullish exhaustion seen, indicators weaken
The AUD/USD pair rose mildly in Wednesday’s trading session, jumping from the lows of 0.6680s recorded on Tuesday and approaching the 0.6740 zone.
The Relative Strength Index (RSI) retreated from overbought conditions, suggesting potential exhaustion in upward momentum. Also, the Moving Average Convergence Divergence (MACD) printed a red bar, indicating mounting selling pressure.
Volume has been decreasing in the last two trading sessions, which could be related to profit-taking. If the AUD/USD loses 0.6700, 0.6680 and 0.6660 would be the next support levels to watch. On the other hand, if it breaks above 0.6760, 0.6800 and 0.6820 are the next resistance levels to consider.
Australian Dollar FAQs
One of the most significant factors for the Australian Dollar (AUD) is the level of interest rates set by the Reserve Bank of Australia (RBA). Because Australia is a resource-rich country another key driver is the price of its biggest export, Iron Ore. The health of the Chinese economy, its largest trading partner, is a factor, as well as inflation in Australia, its growth rate and Trade Balance. Market sentiment – whether investors are taking on more risky assets (risk-on) or seeking safe-havens (risk-off) – is also a factor, with risk-on positive for AUD.
The Reserve Bank of Australia (RBA) influences the Australian Dollar (AUD) by setting the level of interest rates that Australian banks can lend to each other. This influences the level of interest rates in the economy as a whole. The main goal of the RBA is to maintain a stable inflation rate of 2-3% by adjusting interest rates up or down. Relatively high interest rates compared to other major central banks support the AUD, and the opposite for relatively low. The RBA can also use quantitative easing and tightening to influence credit conditions, with the former AUD-negative and the latter AUD-positive.
China is Australia’s largest trading partner so the health of the Chinese economy is a major influence on the value of the Australian Dollar (AUD). When the Chinese economy is doing well it purchases more raw materials, goods and services from Australia, lifting demand for the AUD, and pushing up its value. The opposite is the case when the Chinese economy is not growing as fast as expected. Positive or negative surprises in Chinese growth data, therefore, often have a direct impact on the Australian Dollar and its pairs.
Iron Ore is Australia’s largest export, accounting for $118 billion a year according to data from 2021, with China as its primary destination. The price of Iron Ore, therefore, can be a driver of the Australian Dollar. Generally, if the price of Iron Ore rises, AUD also goes up, as aggregate demand for the currency increases. The opposite is the case if the price of Iron Ore falls. Higher Iron Ore prices also tend to result in a greater likelihood of a positive Trade Balance for Australia, which is also positive of the AUD.
The Trade Balance, which is the difference between what a country earns from its exports versus what it pays for its imports, is another factor that can influence the value of the Australian Dollar. If Australia produces highly sought after exports, then its currency will gain in value purely from the surplus demand created from foreign buyers seeking to purchase its exports versus what it spends to purchase imports. Therefore, a positive net Trade Balance strengthens the AUD, with the opposite effect if the Trade Balance is negative.
- XAU/USD rises 0.05% to $2493, with prices rebounding after hitting a daily low of $2471.
- Weaker-than-expected US JOLTS report fuels speculation of a 50 bps Fed rate cut in September.
- Falling US Treasury yields and a softer US Dollar support Gold, despite volatile profit-taking throughout the session.
Gold's price aimed higher during the North American session after weaker-than-expected jobs data in the United States (US) increased the odds for a 50-basis point (bps) rate cut by the Federal Reserve. Additionally, US Treasury bond yields dropped and undermined the greenback, which is inversely correlated to the golden metal. Therefore, the XAU/USD trades at $2493, up by a minimal 0.05%.
Bullion prices had been seesawing throughout the day, mainly driven by traders' booking profits, which pushed the golden metal toward a daily low of $2,471. Lately, Gold recovered some ground as the US Bureau of Labor Statistics (BLS) revealed its latest Jobs and Labor Turnover Survey (JOLTS), showing vacancies dropped to their lowest level since January 2021.
Following the data, US Treasury bond yields dropped, as shown by the yield on the 10-year benchmark note, which is down almost six bps to 3.776%, as traders increased their bets that the Fed might lower interest rates aggressively on fears that they are behind the curve.
According to CME FedWatch Tool data, odds for a 50 bps at the September meeting rose to 43%, almost a flip of a coin, as the next Federal Open Market Committee (FOMC) meeting will be held on September 17-18.
The US Dollar Index (DXY), which tracks the performance of six currencies against the American Dollar, dropped 0.37% to 101.38 after recovering from a year-to-date (YTD) low and rose almost 1.30% during the last six days.
Market sentiment remains negative, blamed on stock rotation amid fears of a recession in the US. In the geopolitical sphere, the narrative remains slightly calm amid talks of a ceasefire in the Israel-Hamas conflict, while Russia’s invasion of Ukraine conflict remains.
In the meantime, Gold traders prepare for another round of US jobs data, with ADP National Employment Change, Initial Jobless Claims, and the Nonfarm Payrolls (NFP) report.
Daily digest market movers: Gold price traders await busy US economic calendar
- The US BLS revealed that the number of job openings in July tanked compared to June’s downward revised data via the JOLTS report. Vacancies dropped from 7.910 million to 7.673 million.
- In other data, Factory Orders for July exceeded estimates of 4.7%, climbed sharply to 5%, and crushed June’s -.3.3% contraction.
- US Business activity in the manufacturing sector improved but remained in contractionary territory.
- Private hiring, revealed by the ADP National Employment Change report, is foreseen increasing from 122K in July to 150K in August.
- August’s NFP figures are expected to rise from 114K to 163K, while the Unemployment Rate could dip, according to the consensus, from 4.3% to 4.2%.
- December 2024 Chicago Board of Trade (CBOT) fed funds future rates contract hints that investors are eyeing 106 basis points of Fed easing this year.
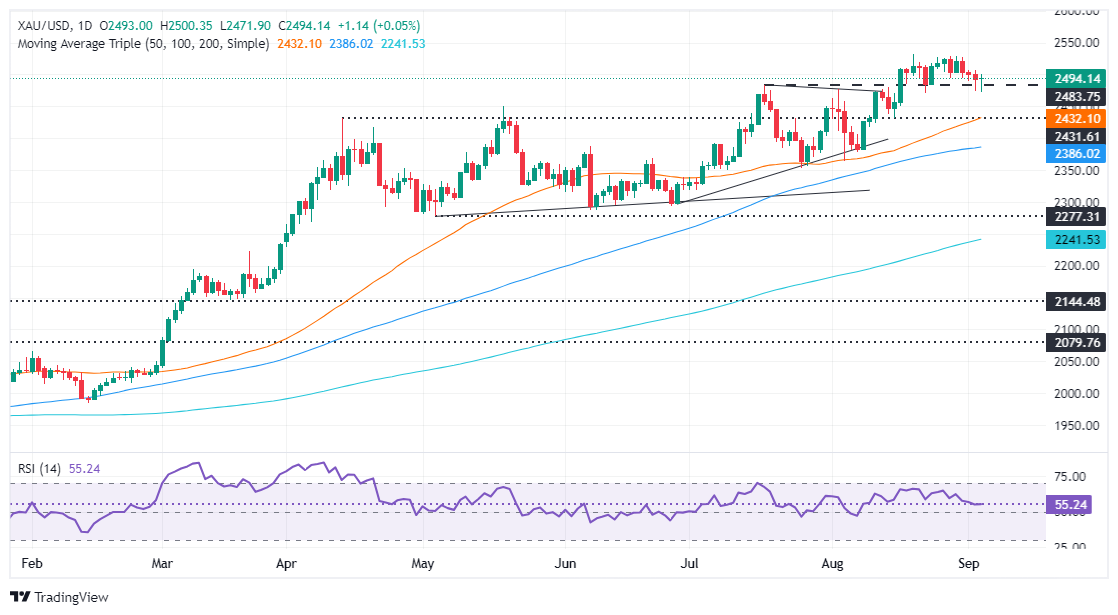
Technical outlook: Gold price hovers around $2,500
Gold price uptrend resumed on Wednesday as a ‘tweezers bottom’ chart pattern emerges, yet buyers need to clear a key resistance level that could sponsor a re-test of the YTD high. Momentum, as measured by the Relative Strength Index (RSI), hints that buyers are in charge but turned flat in the near term.
If buyers achieve a daily close above $2,500, the next resistance would be the all-time high (ATH) at $2,531, followed by the $2,550 mark. A breach of the latter will expose $2,600.
Conversely, if XAU/USD stays below $2,500, the next support would be the August 22 low at $2,470. Once hurdled, the next demand zone would be the confluence of the April 12 high turned support and the 50-day Simple Moving Average (SMA) at around $2,431.
Gold FAQs
Gold has played a key role in human’s history as it has been widely used as a store of value and medium of exchange. Currently, apart from its shine and usage for jewelry, the precious metal is widely seen as a safe-haven asset, meaning that it is considered a good investment during turbulent times. Gold is also widely seen as a hedge against inflation and against depreciating currencies as it doesn’t rely on any specific issuer or government.
Central banks are the biggest Gold holders. In their aim to support their currencies in turbulent times, central banks tend to diversify their reserves and buy Gold to improve the perceived strength of the economy and the currency. High Gold reserves can be a source of trust for a country’s solvency. Central banks added 1,136 tonnes of Gold worth around $70 billion to their reserves in 2022, according to data from the World Gold Council. This is the highest yearly purchase since records began. Central banks from emerging economies such as China, India and Turkey are quickly increasing their Gold reserves.
Gold has an inverse correlation with the US Dollar and US Treasuries, which are both major reserve and safe-haven assets. When the Dollar depreciates, Gold tends to rise, enabling investors and central banks to diversify their assets in turbulent times. Gold is also inversely correlated with risk assets. A rally in the stock market tends to weaken Gold price, while sell-offs in riskier markets tend to favor the precious metal.
The price can move due to a wide range of factors. Geopolitical instability or fears of a deep recession can quickly make Gold price escalate due to its safe-haven status. As a yield-less asset, Gold tends to rise with lower interest rates, while higher cost of money usually weighs down on the yellow metal. Still, most moves depend on how the US Dollar (USD) behaves as the asset is priced in dollars (XAU/USD). A strong Dollar tends to keep the price of Gold controlled, whereas a weaker Dollar is likely to push Gold prices up.
- The Dow Jones rallied early Wednesday before dipping back to the open.
- US JOLTS data eased back more than expected in July.
- Markets have tilted further into bets of a double Fed cut in September.
The Dow Jones Industrial Average (DJIA) whipped on Wednesday, rising at the start of the US market session but falling back into the day’s opening bids after the opening volley of US labor data disappointed investors.
US JOLTS Job Openings in July missed the mark, adding 7.673 million available jobs compared to the forecast 8.1 million, compared to the previous month’s revised 7.91 million. With the Federal Reserve (Fed) broadly expected to begin cutting interest rates on September 18, markets are tilting further into bets of a 50 bps cut to kick off the next rate cutting cycle. Rate markets are still pricing in 100 bps in total cuts by the end of 2024, but there’s still a 57% chance of the Fed’s September rate call being a slimmer 25 bps, according to CME’s FedWatch Tool.
Friday's US Nonfarm Payrolls (NFP) report looms large and represents the last round of key US labor data before the Fed’s first rate trim. Friday's NFP print is widely expected to set the tone for market expectations regarding the depth of a Fed rate cut, with investors fully priced in on the start of a new rate-cutting cycle this month.
Economic Indicator
JOLTS Job Openings
JOLTS Job Openings is a survey done by the US Bureau of Labor Statistics to help measure job vacancies. It collects data from employers including retailers, manufacturers and different offices each month.
Read more.Last release: Wed Sep 04, 2024 14:00
Frequency: Monthly
Actual: 7.673M
Consensus: 8.1M
Previous: 8.184M
Source: US Bureau of Labor Statistics
Dow Jones news
The Dow Jones tilted into the low side on Wednesday, with two-thirds of the equity index testing into the red for the midweek market session. Travelers Companies (TRV) still managed to rise 1.4% to $231.12 per share, while Verizon Communications (VZ) stumbled to the bottom of the board, falling 3.7% to $19.34 per share.
Dow Jones price forecast
The Dow Jones couldn’t figure it out on Wednesday, rising early in the day to 41,160 before slumping back to the day’s opening prices just above 40,840. The DJIA is holding onto bullish chart paper near record highs approaching 41,600, but momentum has drained out of the bidders’ camp as price action shifts back down toward the 50-day Exponential Moving Average (EMA) at 40,253.
Dow Jones daily chart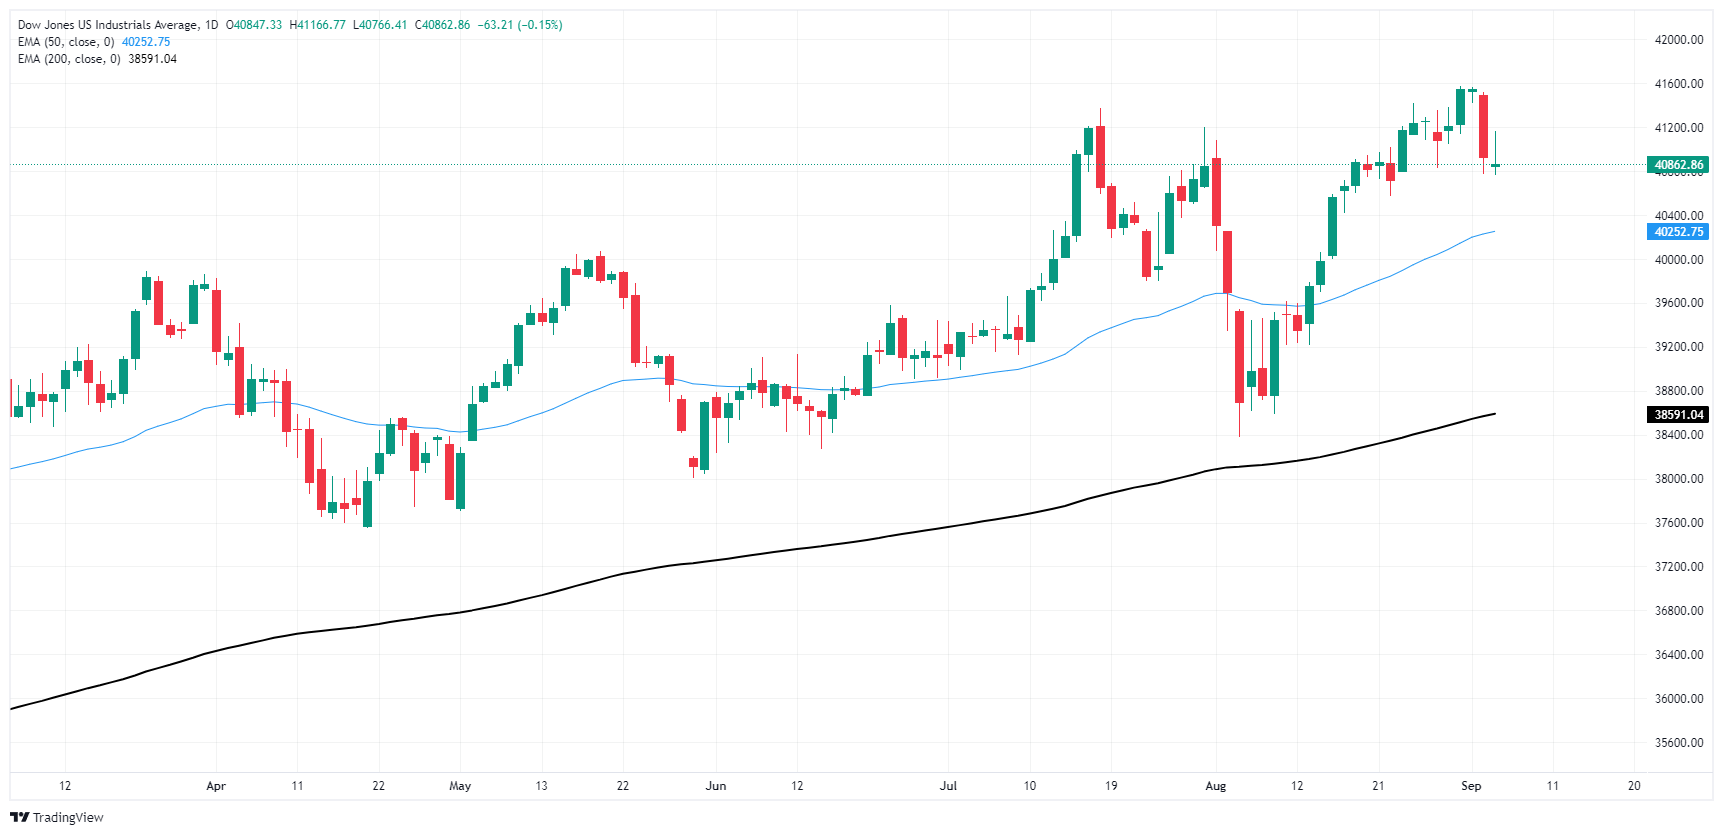
Dow Jones FAQs
The Dow Jones Industrial Average, one of the oldest stock market indices in the world, is compiled of the 30 most traded stocks in the US. The index is price-weighted rather than weighted by capitalization. It is calculated by summing the prices of the constituent stocks and dividing them by a factor, currently 0.152. The index was founded by Charles Dow, who also founded the Wall Street Journal. In later years it has been criticized for not being broadly representative enough because it only tracks 30 conglomerates, unlike broader indices such as the S&P 500.
Many different factors drive the Dow Jones Industrial Average (DJIA). The aggregate performance of the component companies revealed in quarterly company earnings reports is the main one. US and global macroeconomic data also contributes as it impacts on investor sentiment. The level of interest rates, set by the Federal Reserve (Fed), also influences the DJIA as it affects the cost of credit, on which many corporations are heavily reliant. Therefore, inflation can be a major driver as well as other metrics which impact the Fed decisions.
Dow Theory is a method for identifying the primary trend of the stock market developed by Charles Dow. A key step is to compare the direction of the Dow Jones Industrial Average (DJIA) and the Dow Jones Transportation Average (DJTA) and only follow trends where both are moving in the same direction. Volume is a confirmatory criteria. The theory uses elements of peak and trough analysis. Dow’s theory posits three trend phases: accumulation, when smart money starts buying or selling; public participation, when the wider public joins in; and distribution, when the smart money exits.
There are a number of ways to trade the DJIA. One is to use ETFs which allow investors to trade the DJIA as a single security, rather than having to buy shares in all 30 constituent companies. A leading example is the SPDR Dow Jones Industrial Average ETF (DIA). DJIA futures contracts enable traders to speculate on the future value of the index and Options provide the right, but not the obligation, to buy or sell the index at a predetermined price in the future. Mutual funds enable investors to buy a share of a diversified portfolio of DJIA stocks thus providing exposure to the overall index.
- US job openings for July arrived at 7.67 million, weaker than expected.
- Fed Beige Book notes modest price increases and slight economic growth.
- Markets remain overconfident on a super-dovish Fed.
The US Dollar Index (DXY), a measure of the USD against a basket of six currencies, snapped its recovery streak on Wednesday after a disappointing report on US job openings and a mixed outlook from the Federal Reserve's (Fed) Beige Book.
Overall, the US economy remains in a state of expansion, surpassing its expected growth rate, but the soft tone of the labor market gives the market reason to bet on a dovish Fed.
Daily digest market movers: US Dollar declines on weak JOLTS data and mixed Fed outlook
- US job openings decreased to 7.67 million at the end of July, missing market expectations.
- Fed's Beige Book indicated modest price increases and uneven economic growth.
- Economic activity improved or remained stable in most Fed districts with some anticipating slight declines.
- Price pressures are expected to moderate, but economic activity remains mixed.
- Market expectations for Fed easing remain steady at 100 basis points by year-end and 200 basis points over the next 12 months.
- The probability of a 50 bps cut in September stands around 30-35%.
- Friday's Nonfarm Payrolls will dictate the pace of Fed cuts and USD dynamics.
DXY technical outlook: DXY remains bearish, encountering resistance at 102.00.
The index recently rallied but encountered resistance at the 20-day Simple Moving Average (SMA), leading to a selling frenzy. The Relative Strength Index (RSI) is in negative territory, indicating bearish momentum. The Moving Average Convergence Divergence (MACD) remains on negative terrain, reinforcing the downtrend.
Supports are located at 101.30, 101.15 and 101.00, while resistances lie at 101.80, 102.00 and 102.30.
US Dollar FAQs
The US Dollar (USD) is the official currency of the United States of America, and the ‘de facto’ currency of a significant number of other countries where it is found in circulation alongside local notes. It is the most heavily traded currency in the world, accounting for over 88% of all global foreign exchange turnover, or an average of $6.6 trillion in transactions per day, according to data from 2022. Following the second world war, the USD took over from the British Pound as the world’s reserve currency. For most of its history, the US Dollar was backed by Gold, until the Bretton Woods Agreement in 1971 when the Gold Standard went away.
The most important single factor impacting on the value of the US Dollar is monetary policy, which is shaped by the Federal Reserve (Fed). The Fed has two mandates: to achieve price stability (control inflation) and foster full employment. Its primary tool to achieve these two goals is by adjusting interest rates. When prices are rising too quickly and inflation is above the Fed’s 2% target, the Fed will raise rates, which helps the USD value. When inflation falls below 2% or the Unemployment Rate is too high, the Fed may lower interest rates, which weighs on the Greenback.
In extreme situations, the Federal Reserve can also print more Dollars and enact quantitative easing (QE). QE is the process by which the Fed substantially increases the flow of credit in a stuck financial system. It is a non-standard policy measure used when credit has dried up because banks will not lend to each other (out of the fear of counterparty default). It is a last resort when simply lowering interest rates is unlikely to achieve the necessary result. It was the Fed’s weapon of choice to combat the credit crunch that occurred during the Great Financial Crisis in 2008. It involves the Fed printing more Dollars and using them to buy US government bonds predominantly from financial institutions. QE usually leads to a weaker US Dollar.
Quantitative tightening (QT) is the reverse process whereby the Federal Reserve stops buying bonds from financial institutions and does not reinvest the principal from the bonds it holds maturing in new purchases. It is usually positive for the US Dollar.
The Greenback succumbed to expectations of a potential 50 bps rate cut by the Fed later this month after data signalled further cooling in the US labour market, all prior to crucial metrics later in the week.
Here is what you need to know on Thursday, September 5:
The US Dollar Index (DXY) receded to multi-day lows near 101.20 on the back of market chatter, suggesting a larger rate cut and shrinking US yields. The key ADP Employment Change takes centre stage on September 5, seconded by weekly Initial Jobless Claims, the final S&P Global Services PMI, and the ISM Services PMI.
EUR/USD regained composure and flirted with the 1.1100 barrier against the backdrop of renewed downward bias in the Greenback. Germany’s Factory Orders will be published on September 5, along with the HCOB Construction PMI in both Germany and the euro area, and Retail Sales in the euro bloc.
The broad-based upbeat mood in the risk complex lifted GBP/USD back above the 1.3100 hurdle, briefly clocking weekly tops. On September 5, New Car Sales are due, followed by the final S&P Global Construction PMI.
Extra appreciation of the Japanese Yen, lower yields, and the marked pullback in the US Dollar all helped USD/JPY retest the 144.00 region, adding to Tuesday’s decline. Average Cash Earnings, and weekly Foreign Bond Investment figures are expected on September 5.
In quite a volatile day, AUD/USD barely changed just above the 0.6700 yardstick amidst Chinese concerns, the weaker Dollar, and declining commodity prices. The Balance of Trade results and the speech by the RBA’s M. Bullock are due on September 5.
WTI prices dropped to new YTD lows near the $69.00 mark per barrel amidst the prevailing bearish sentiment among traders.
Gold prices alternated gains with losses just below the $2,500 mark per ounce troy despite the move lower in the Greenback and the negative performance of US yields. Silver saw a ray of hope following the Dollar’s bearish tone and advanced modestly past the $28.00 mark per ounce.
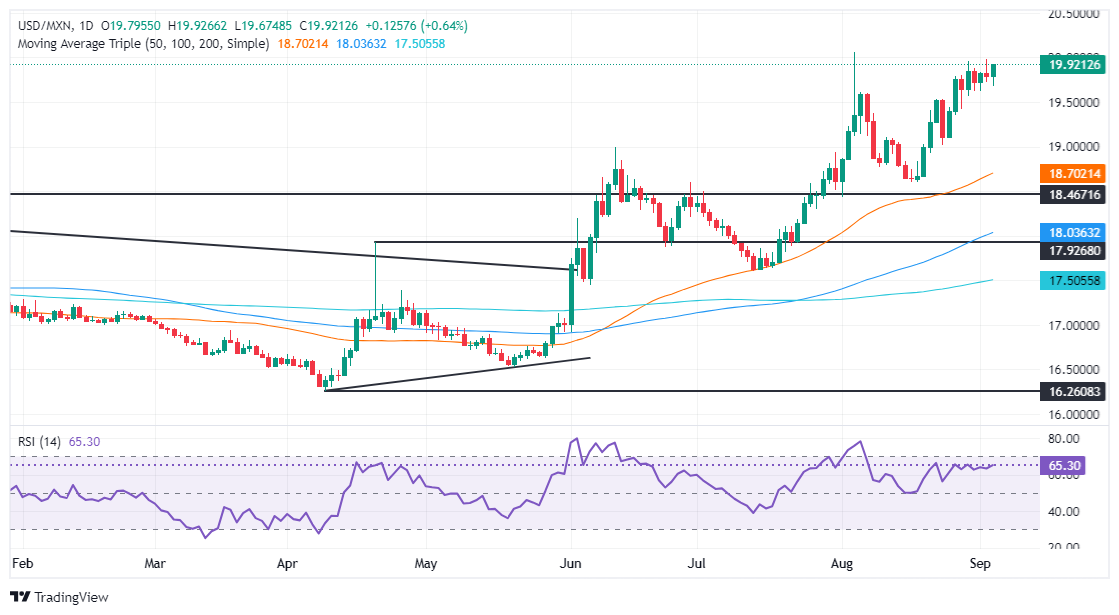
- Mexican Peso on defensive as political turmoil deepens, ignoring foreign investors.
- AMLO’s judicial overhaul bill passes Mexico’s lower house, awaiting Senate approval amid fierce opposition.
- USD/MXN trades in 19.67-19.92 range with political uncertainty overshadowing US JOLTS impact.
The Mexican Peso depreciated against the Greenback on Wednesday during the North American session as the Mexican lower house voted and approved President Andres Manuel Lopez Obrador's (AMLO) bill to overhaul the judicial system. At the time of writing, the USD/MXN traded at 19.85, rising over 0.30%.
Mexico’s political turmoil continued on Wednesday. After more than 17 hours of discussion, Morena’s ruling party and its allies approved AMLO’s bill with 357 votes in favor and 130 against. Now it’s the turn of the Senate, where Morena is one vote short of what’s needed to pass the bill into law as part of the Mexican Constitution.
Although foreign governments, workers of the Mexican court system, and international companies expressed concerns that the reform threatened the rule of law, Mexico’s Chamber of Deputies approved it.
It is worth noting that on Tuesday, the US Ambassador in Mexico, Ken Salazar, expressed that the approval of the judiciary reform could damage relations between Mexico and the United States.
Despite that, as traders digested the latest US JOLTS report, the USD/MXN remains anchored in the middle of the 19.67-19.92 range. Job openings in July fell to their lowest level in three-and-a-half years, sparking speculation that the US Federal Reserve (Fed) might cut rates by 50 basis points (bps) at the upcoming September meeting.
According to the CME FedWatch Tool, odds for a 50 bps Fed rate cut are at 43%; while for a quarter of a percentage point, 57%.
Ahead this week, the US economic docket will feature the release of the ADP National Employment Change, Initial Jobless Claims, S&P and ISM Services PMI data, and the Nonfarm Payrolls (NFP) report on Friday.
Daily digest market movers: Mexican Peso on backfoot on scarce economic docket
- Mexico’s data revealed during the week show the economy is decelerating, due in part to higher interest rates set by the Bank of Mexico.
- On Tuesday, the Unemployment Rate ticked close to the 3% threshold, while business activity in the manufacturing sectors shrank.
- The docket will feature Mexico’s automobile industry data on Friday, ahead of next week’s inflation data.
- Most banks expect the Bank of Mexico (Banxico) to reduce rates by at least 50 basis points (bps) for the remainder of 2024. This would pressure the Mexican currency, which has already depreciated 17.38% year to date (YTD).
- US JOLTS Job Openings in July dropped from June’s 7.910 million downward revision to 7.673 million.
- US Factory Orders for the same period rose sharply from a -3.3% plunge on June 5 to 5% growth.
- US Nonfarm Payrolls in August are expected to grow from 114K to 163K, while the Unemployment Rate is foreseen to tick lower from 4.3% to 4.2%.
- Data from the Chicago Board of Trade (CBOT) suggests the Fed will cut at least 103 basis points this year, up from a day ago’s 96.5 bps, according to the fed funds rate futures contract for December 2024.
Technical outlook: Mexican Peso weakens as USD/MXN rallies above 19.85
Political development sponsored a leg-up in the USD/MXN, which retreated somewhat after hitting a weekly high of 19.98. As the judicial reform overcame the first obstacle, traders ditched the Mexican currency and began to buy the Greenback.
USD/MXN buyers need to clear the weekly high before testing the 20.00 figure. A breach of the latter will expose the YTD high at 20.22, followed by the September 28, 2022 daily high at 20.57. If those two levels are surrendered, the next stop would be August 2, 2022 swing high at 20.82, ahead of 21.00.
Conversely, if USD/MXN weakens further, the first support would be 19.50. A breach of the latter will expose the August 23 swing low of 19.02 before giving way for sellers eyeing a test of the 50-day Simple Moving Average (SMA) at 18.65.
Mexican Peso FAQs
The Mexican Peso (MXN) is the most traded currency among its Latin American peers. Its value is broadly determined by the performance of the Mexican economy, the country’s central bank’s policy, the amount of foreign investment in the country and even the levels of remittances sent by Mexicans who live abroad, particularly in the United States. Geopolitical trends can also move MXN: for example, the process of nearshoring – or the decision by some firms to relocate manufacturing capacity and supply chains closer to their home countries – is also seen as a catalyst for the Mexican currency as the country is considered a key manufacturing hub in the American continent. Another catalyst for MXN is Oil prices as Mexico is a key exporter of the commodity.
The main objective of Mexico’s central bank, also known as Banxico, is to maintain inflation at low and stable levels (at or close to its target of 3%, the midpoint in a tolerance band of between 2% and 4%). To this end, the bank sets an appropriate level of interest rates. When inflation is too high, Banxico will attempt to tame it by raising interest rates, making it more expensive for households and businesses to borrow money, thus cooling demand and the overall economy. Higher interest rates are generally positive for the Mexican Peso (MXN) as they lead to higher yields, making the country a more attractive place for investors. On the contrary, lower interest rates tend to weaken MXN.
Macroeconomic data releases are key to assess the state of the economy and can have an impact on the Mexican Peso (MXN) valuation. A strong Mexican economy, based on high economic growth, low unemployment and high confidence is good for MXN. Not only does it attract more foreign investment but it may encourage the Bank of Mexico (Banxico) to increase interest rates, particularly if this strength comes together with elevated inflation. However, if economic data is weak, MXN is likely to depreciate.
As an emerging-market currency, the Mexican Peso (MXN) tends to strive during risk-on periods, or when investors perceive that broader market risks are low and thus are eager to engage with investments that carry a higher risk. Conversely, MXN tends to weaken at times of market turbulence or economic uncertainty as investors tend to sell higher-risk assets and flee to the more-stable safe havens.
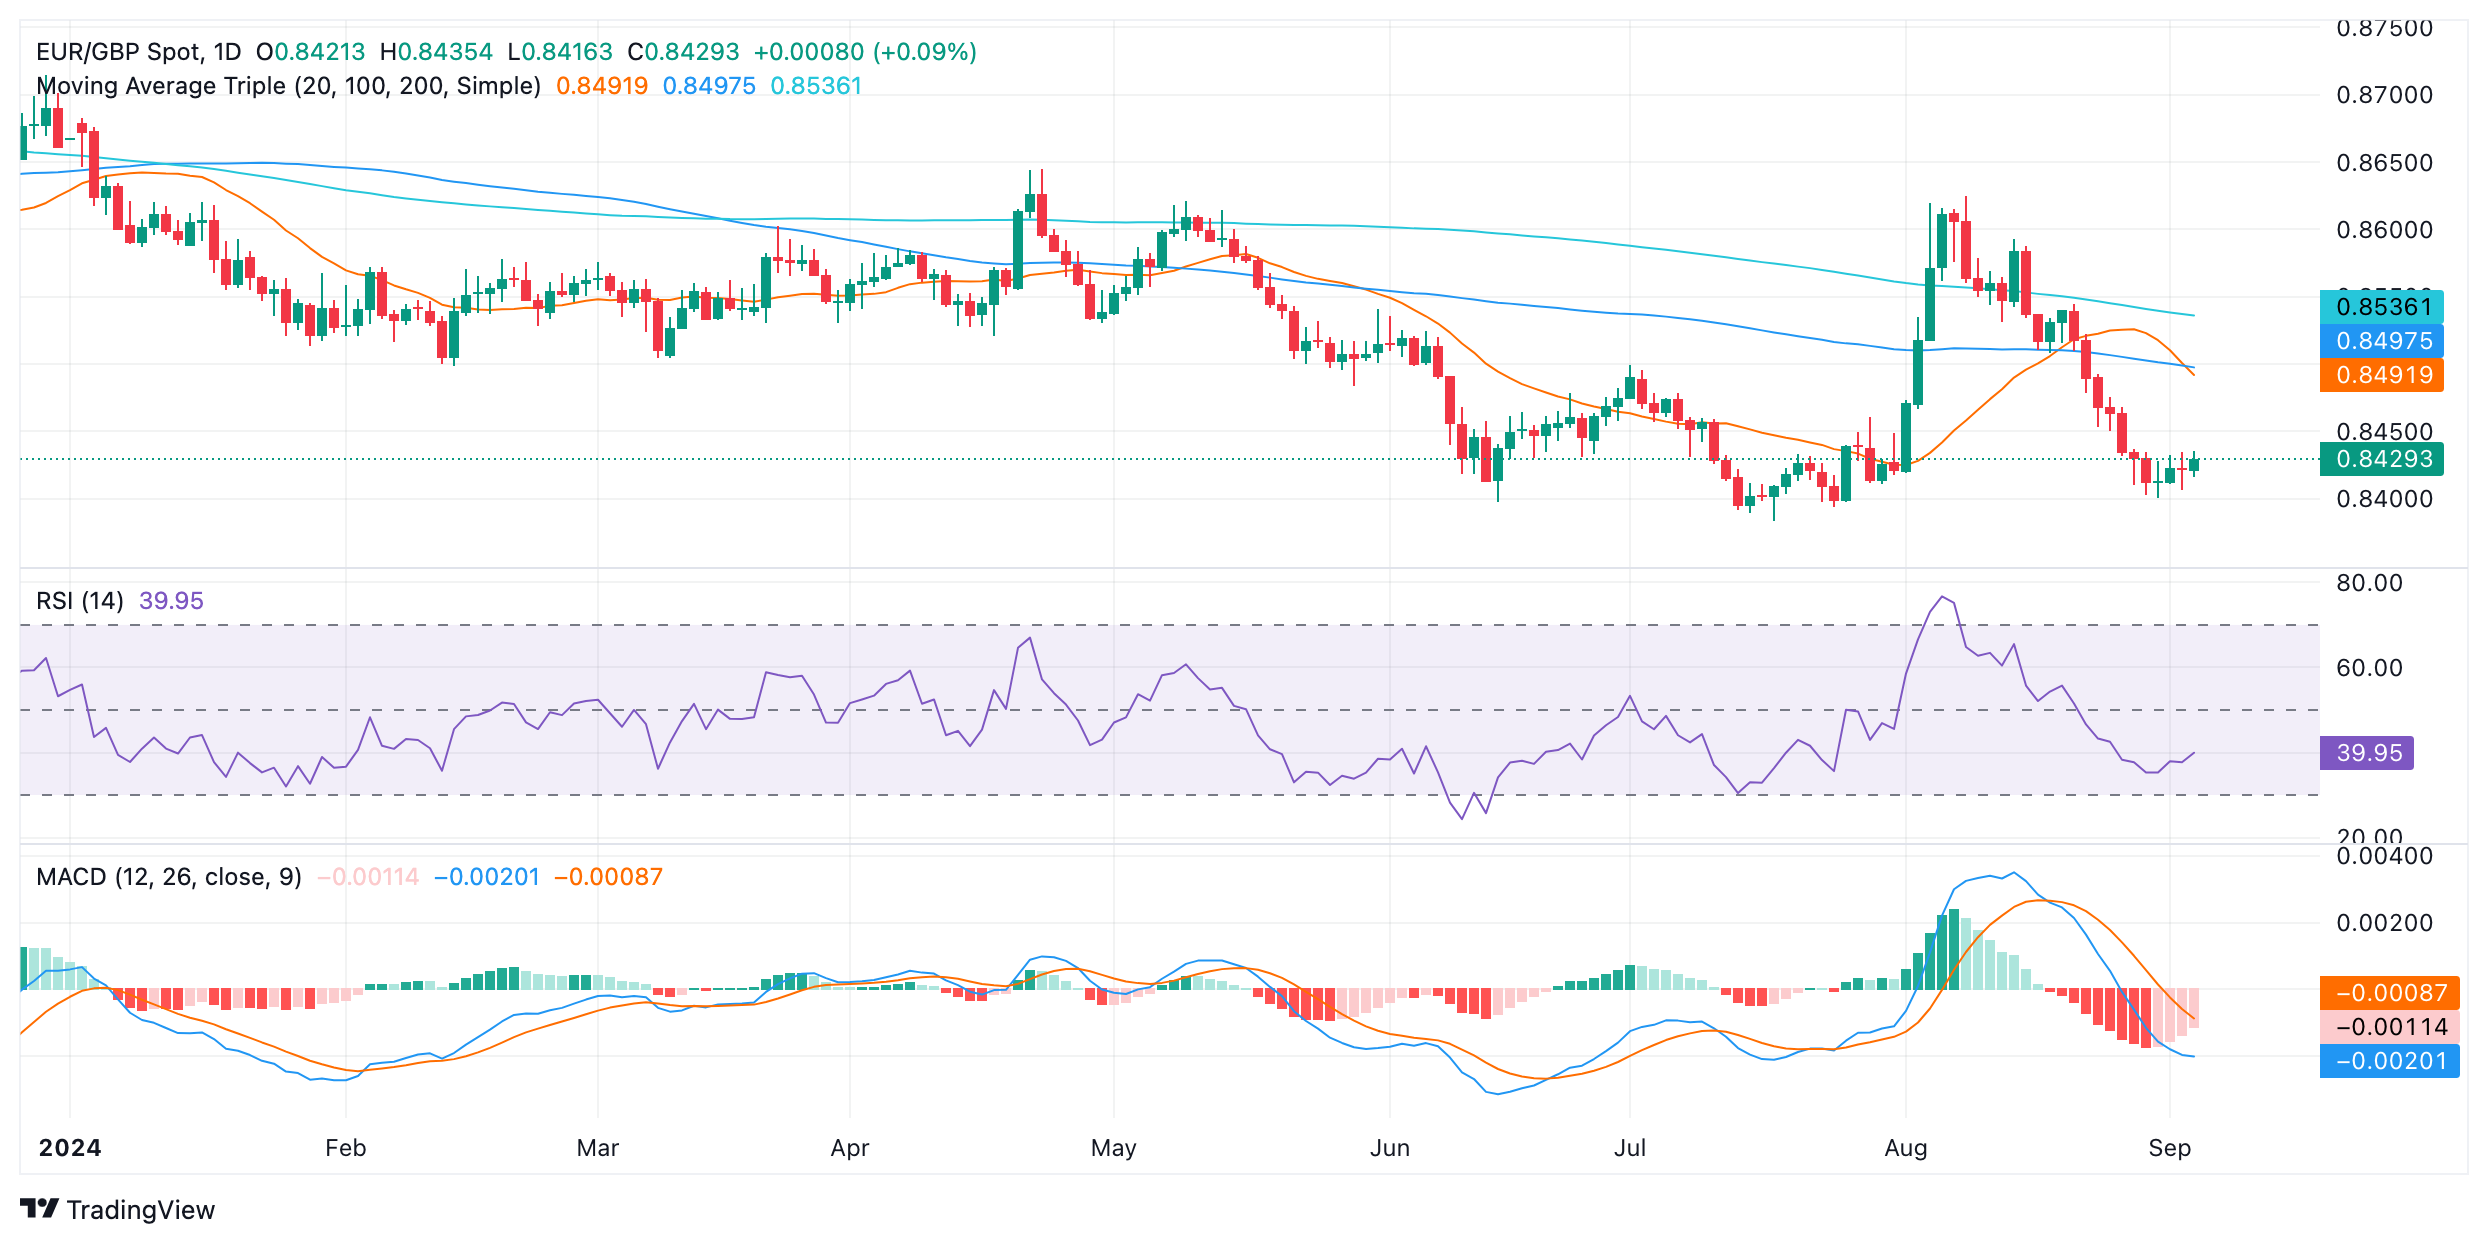
- EUR/GBP has extended its recovery from last week's lows, with technical indicators showing signs of improvement.
- Mixed signals from RSI and MACD, overall neutral outlook.
- The pair might continue side-ways trading in the next sessions above 0.8400.
In Wednesday's session, the EUR/GBP mildly rose to 0.8420, continuing its recovery from last week's losses which saw the cross bottoming at 0.8400.
The Relative Strength Index (RSI) remains in negative territory, indicating that bears have the upper hand. However, the RSI's slope is rising, suggesting that bullish momentum is building. The Moving Average Convergence Divergence (MACD) prints decreasing red bars, also pointing out that the bears are losing steam.
The EUR/GBP pair seems to be consolidating above the 0.8400 level, which acts as immediate support while resistances line up at 0.8430, 0.8450, and above at 0.8470. With that in mind, it all points out that the bears are taking a breather after last week's movements and that the cross has entered in consolidation mode.
EUR/GBP daily chart
Signs of CTA selling exhaustion in crude oil markets have emerged, and CTAs are now likely to buy in every scenario.
Downside risks are still growing
“Algorithmic trend followers are now unlikely to add to the pain in crude markets, following a modest selling program that totaled -6% of the algos' max size over the last session which marked peak selling activity for the time being. In fact, CTAs are now likely to buy WTI and Brent crude in every single scenario over the next week, even in a big downtape.”
“While this bodes well for an imminent-term bounce, our return decomposition framework points to deeper troubles than simple positioning dynamics alone. Energy supply risk premia is plummeting as concerns emerge over OPEC+ plans to increase production and optimism rises over a deal that could see Libyan production return to market.”
“At the same time, commodity demand sentiment has also resumed its slump with concerns around Chinese demand and potential run cuts on top of traders' minds. Pressure is growing on OPEC+ to delay their plans to unwind their curtailments in an attempt to halt the slump in supply risk premia. For the time being, downside risks are still growing, and traders won't be able to blame CTA flows if prices continue to weaken.”
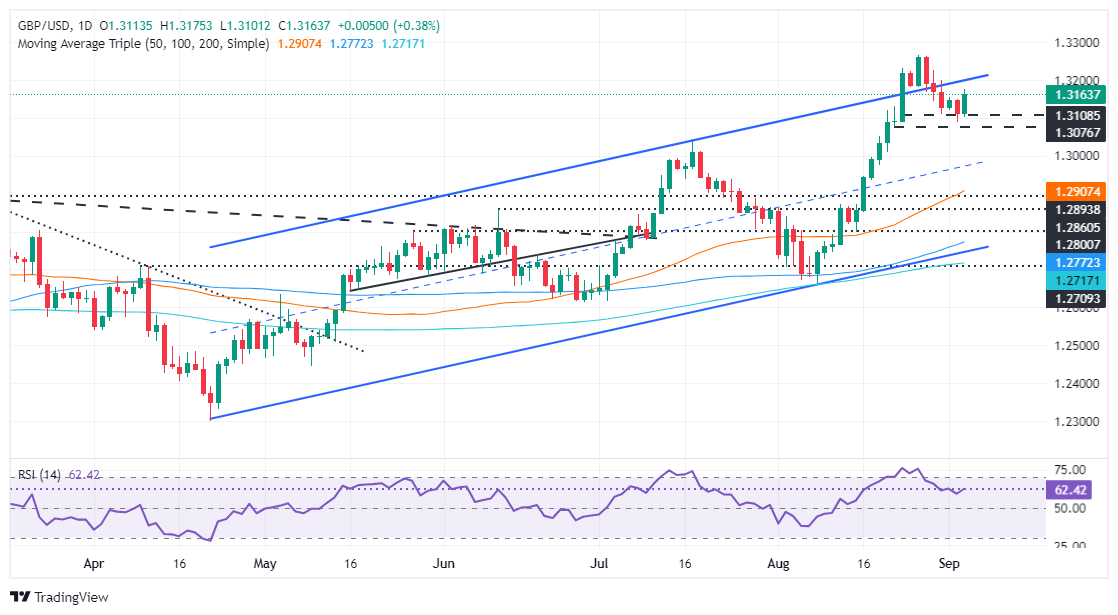
- GBP/USD breaks above 1.3140, gaining short-term momentum as RSI tilts in favor of buyers.
- Clearing 1.3200 opens the door to challenge the YTD peak of 1.3266, with further resistance at 1.3300.
- Sellers must push below 1.3140 to test key support levels at 1.3100 and 1.3043.
The Pound Sterling enjoys a good rebound off the weekly low of 1.3087 and rises in early trading on Wednesday during the North American session, climbing over 0.22% against the Greenback. Soft US jobs data increased the odds of a 50-basis points rate cut by the Federal Reserve and underpinned the GBP/USD higher, trading at 1.3163.
GBP/USD Price Forecast: Technical outlook
The GBP/USD remains upward biased after consolidating within the 1.3080-1.3140 narrow range, with buyers clearing the latter, which would open the door for higher prices. Buyers had gained momentum short-term as seen by the Relative Strength Index (RSI).
If bulls clear 1.3200, the next resistance would be the year-to-date (YTD) peak of 1.3266. On further strength, the 1.3300 would be up for grabs before buyers challenge the March 23, 2022, high at 1.3437.
Conversely, sellers must drag prices below 1.3140 and challenge the 1.3100 figure. Once those levels are taken out, the next support would be the 1.3043, July 17 high turned support, followed by the 1.3000 figure, and the 50-day moving average (DMA) would be up next at 1.2905.
GBP/USD Price Action – Daily Chart
British Pound PRICE Today
The table below shows the percentage change of British Pound (GBP) against listed major currencies today. British Pound was the strongest against the US Dollar.
| USD | EUR | GBP | JPY | CAD | AUD | NZD | CHF | |
|---|---|---|---|---|---|---|---|---|
| USD | -0.38% | -0.39% | -0.95% | -0.34% | -0.47% | -0.38% | -0.24% | |
| EUR | 0.38% | 0.00% | -0.51% | 0.06% | -0.08% | 0.03% | 0.14% | |
| GBP | 0.39% | -0.01% | -0.49% | 0.05% | -0.09% | 0.04% | 0.12% | |
| JPY | 0.95% | 0.51% | 0.49% | 0.55% | 0.41% | 0.50% | 0.64% | |
| CAD | 0.34% | -0.06% | -0.05% | -0.55% | -0.15% | -0.02% | 0.07% | |
| AUD | 0.47% | 0.08% | 0.09% | -0.41% | 0.15% | 0.11% | 0.23% | |
| NZD | 0.38% | -0.03% | -0.04% | -0.50% | 0.02% | -0.11% | 0.10% | |
| CHF | 0.24% | -0.14% | -0.12% | -0.64% | -0.07% | -0.23% | -0.10% |
The heat map shows percentage changes of major currencies against each other. The base currency is picked from the left column, while the quote currency is picked from the top row. For example, if you pick the British Pound from the left column and move along the horizontal line to the US Dollar, the percentage change displayed in the box will represent GBP (base)/USD (quote).
Signs of extreme upside asymmetry are emerging in Platinum, TDS Senior Commodity Strategist Daniel Ghali notes.
Reversal in prices can spark CTA buying activity
“Even a small reversal in prices can now spark massive CTA buying activity in Platinum markets, with CTAs potentially adding up to +60% of their max size over the coming week in this scenario. A flat tape won't be enough to spark a whipsaw in CTA positioning, suggesting that another cohort will have to lift prices first.”
“Discretionary traders are net short, but position sizes remain modest, suggesting little support from this cohort on the horizon. However, a substantial increase in SGE Platinum volumes amid slumping prices suggests dip buyers have emerged in physical markets.”
Gold prices are under pressure, but decisively sticking to the range set near all-time highs. However, for the first time in months, price action could now unlock CTA selling activity over the coming week, TDS Senior Commodity Strategist Daniel Ghali notes.
Gold rangebound near all-time highs
“This set-up has formed just in time for the NFP data release, which risks injecting volatility into markets amid TD Securities' expectations for a 205k beat in jobs.”
“While we would only expect CTAs to sell 10% of their max size in a scenario in which prices break $2450/oz over the coming sessions, this could be the first cohort to blink in a context where positioning cues are flashing red on several fronts.”
“Macro fund positioning is particularly extreme, with our gauge now nearing its highest levels on record. While this consensus outlook can be challenged, a context where rate cuts engineer a soft-landing is still not necessarily a positive environment for Gold, as capital could plausibly flow out of the yellow metal towards more productive uses.”
Atlanta Federal Reserve President Raphael Bostic said on Wednesday that the Fed is in a favorable position but added that they must not maintain a restrictive policy stance for too long, per Reuters.
Key takeaways
"Soft landing for economy may be within reach."
"Most recent inflation reports bolster my confidence inflation likely on sustainable path back to 2%."
"No panic among my business contacts but describe an economy and labor market losing momentum."
"Price pressures are diminishing quickly and broadly."
"I am not quite prepared to declare victory over inflation as risks remain."
"Fed must stay vigilant to ensure inflation risks continue to wane."
"I am now giving equal attention to maximum employment objective as inflation."
"Labor market continues to weaken, but is not weak."
"Business contacts point to a loosening but still broadly stably labor market."
"Wage growth pulling back to level more conducive to price stability."
Market reaction
The US Dollar stays under bearish pressure following these comments. At the time of press, the US Dollar Index was down 0.33% on the day at 101.43.
- USD/CAD slips below 1.3550 as the BoC reduces interest rates by 25 bps to 4.25% as expected.
- The US Dollar corrects sharply after weak US JOLTS Job Openings data for July.
- Investors await the US NFP for August for fresh guidance on interest rates.
The USD/CAD pair drops sharply below the crucial support of 1.3550 as the Bank of Canada (BoC) reduces its key borrowing rates by 25 basis points (bps) for the third straight time, pushing them lower to 4.25%.
The BoC was widely anticipated to reduce interest rates, which didn't lead the Canadian Dollar (CAD) to weaken further. Investors were anticipating a dovish interest rate decision as inflationary pressures in the Canadian economy have been contained significantly. Also, the economy needs a liquidity boost to uplift weakening growth prospects.
Meanwhile, the US Dollar (USD) falls vertically on weak United States (US) JOLTS Job Openings data for July. The report showed that job vacancies come in sharply lower at 7.673 million than estimates of 8.1 million that the former release of 7.91 million, downwardly revised from 8.184 million. Weak job posting data has escalated downside risks to the US job market. The US Dollar Index (DXY), which tracks the Greenback's value against six major currencies, tumbles below 101.40.
On Tuesday, the US Dollar corrected after the release of the downbeat United States (US) ISM Manufacturing PMI for August, which prompted expectations that the Federal Reserve (Fed) could begin the policy-easing process aggressively, which is expected this month.
The ISM agency reported that activities in the manufacturing sector contracted at a faster-than-projected pace, with PMI landing at 47.2 from the estimates of 47.5.
According to the CME FedWatch tool, the likelihood of a 50-basis points (bps) interest rate reduction in September is 39%, while the rest favors a 25-bps decline to 5.00%-5.25%, indicating that rate cuts this month have been fully priced in by traders.
This week, the major trigger for the US Dollar will be the US Nonfarm Payrolls (NFP) data for August, which will be published on Friday. Investors will pay close attention to the official labor market data as the Fed is now more concerned about preventing job loss.
- US JOLTS Job Openings declined further in July.
- US Dollar Index stays in negative territory below 101.50.
The number of job openings on the last business day of July stood at 7.67 million, the US Bureau of Labor Statistics (BLS) reported in the Job Openings and Labor Turnover Survey (JOLTS) on Wednesday. This reading followed the 7.9 million openings (revised from 8.1 million) reported in June and came in below the market expectation of 8.1 million.
"Over the month, hires changed little at 5.5 million," the BLS noted in its press release. "Separations increased to 5.4 million. Within separations, quits (3.3 million) and layoffs and discharges (1.8 million) changed little."
Market reaction to US JOLTS Job Openings data
The US Dollar came under renewed selling pressure following this data. At the time of press, the US Dollar Index was down 0.44% on the day at 101.33.
Employment FAQs
Labor market conditions are a key element in assessing the health of an economy and thus a key driver for currency valuation. High employment, or low unemployment, has positive implications for consumer spending and economic growth, boosting the value of the local currency. Moreover, a very tight labor market – a situation in which there is a shortage of workers to fill open positions – can also have implications on inflation levels because low labor supply and high demand leads to higher wages.
The pace at which salaries are growing in an economy is key for policymakers. High wage growth means that households have more money to spend, usually leading to price increases in consumer goods. In contrast to more volatile sources of inflation such as energy prices, wage growth is seen as a key component of underlying and persisting inflation as salary increases are unlikely to be undone. Central banks around the world pay close attention to wage growth data when deciding on monetary policy.
The weight that each central bank assigns to labor market conditions depends on its objectives. Some central banks explicitly have mandates related to the labor market beyond controlling inflation levels. The US Federal Reserve (Fed), for example, has the dual mandate of promoting maximum employment and stable prices. Meanwhile, the European Central Bank’s (ECB) sole mandate is to keep inflation under control. Still, and despite whatever mandates they have, labor market conditions are an important factor for policymakers given their significance as a gauge of the health of the economy and their direct relationship to inflation.
- GBP/JPY’s August rally is running out of steam and risks reversing lower.
- It has sold off steeply from the September peak and broken below a key level.
- Further weakness is required to confirm a bearish reversal.
GBP/JPY has unfolded a recovery rally since the August 5 lows. Since then it has risen from a low of 180.09 to a peak of 193.49 reached on September 2.
This almost month-long rally is now showing signs of weakness, however, which indicate the risk of a reversal lower is growing. If GBP/JPY does reverse lower the bias will shift to favoring lower prices.
GBP/JPY 4-hour Chart
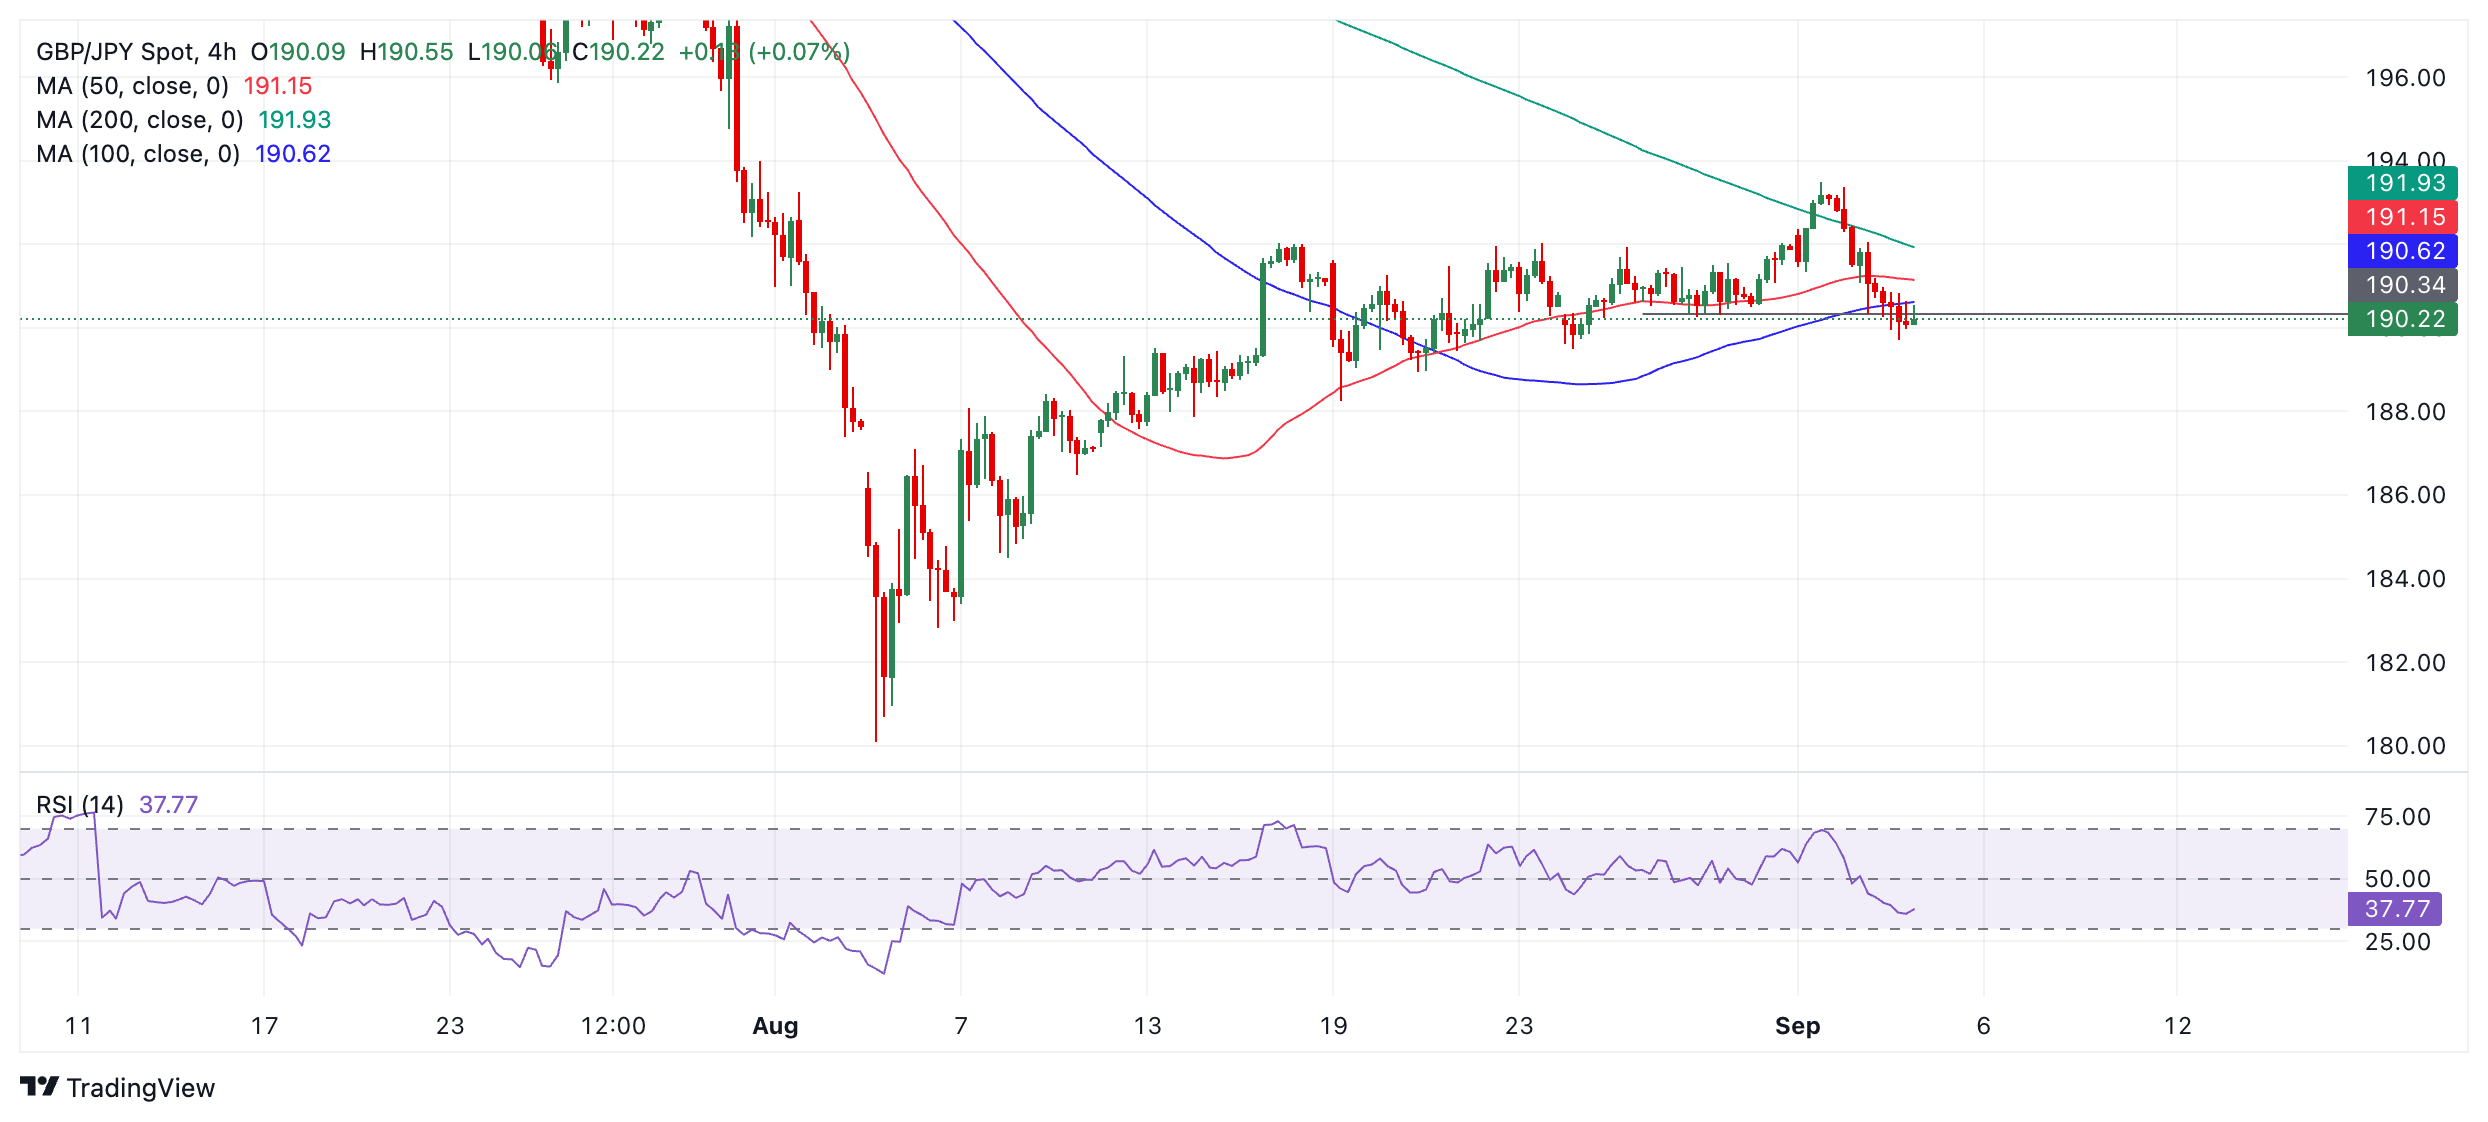
The pair has fallen quite steeply from the September 2 highs and it recently broke below a key swing low situated at around 190.26.
The Relative Strength Index (RSI) momentum indicator has fallen to 37.77 and is showing the momentum which accompanied the sell-off from the peak was strong.
Although these signs suggest a bearish reversal is developing they are not quite enough to be confident. The pair needs to fall lower to be more certain. Ideally it should fall below 189.50 (August 26 low) to confirm a new bear trend was underway. Such a move would probably follow-through down to an initial target at 188.24 (August 19 low).
Alternatively, a recovery is still possible given the lack of downside confirmation. A close above 192.00 would strongly indicate a resumption of the August rally was underway. Such a move would then be expected to continue up to the 193.49 September 2 highs.
UK final August Services and Composite PMI data were revised modestly higher to 53.7 and 53.8 (from 53.3 and 53.4 respectively), Scotiabank’s Chief FX Strategist Shaun Osborne notes.
GBP consolidates in low 1.31 range
“Details were constructive as well. Improved sentiment is boosting spending and hiring, the surveys suggest. Somewhat stronger economic momentum will not stop BoE rate cuts but the process of easing is likely to be relatively slower than the Bank’s major central bank peers. Sterling is virtually unchanged on the session today.”
“A narrow, inside range is potentially developing on the daily chart while the intraday chart suggests the pound is trying to break above the short-term bear trend (1.3105) off of last week’s high for Cable. A break above 1.3155 would add to near-term momentum for the pound. Support is 1.3090/00.”
- EUR/JPY has been in an uptrend for over two years and despite a breakdown in July it may still be intact.
- Ideally, another break below the August lows in the 154s would be necessary to indicate a reversal of the trend.
EUR/JPY broke out of the rising channel it had been in for over two years, in late July.
The breakdown was a significant bearish sign; it was steeper than the prior uptrend indicating a possible reversal in the long-term trend.
Despite this, there is still not enough evidence to confirm a reversal lower and price could still recover and go back up again, resuming its broad uptrend.
EUR/JPY Weekly Chart
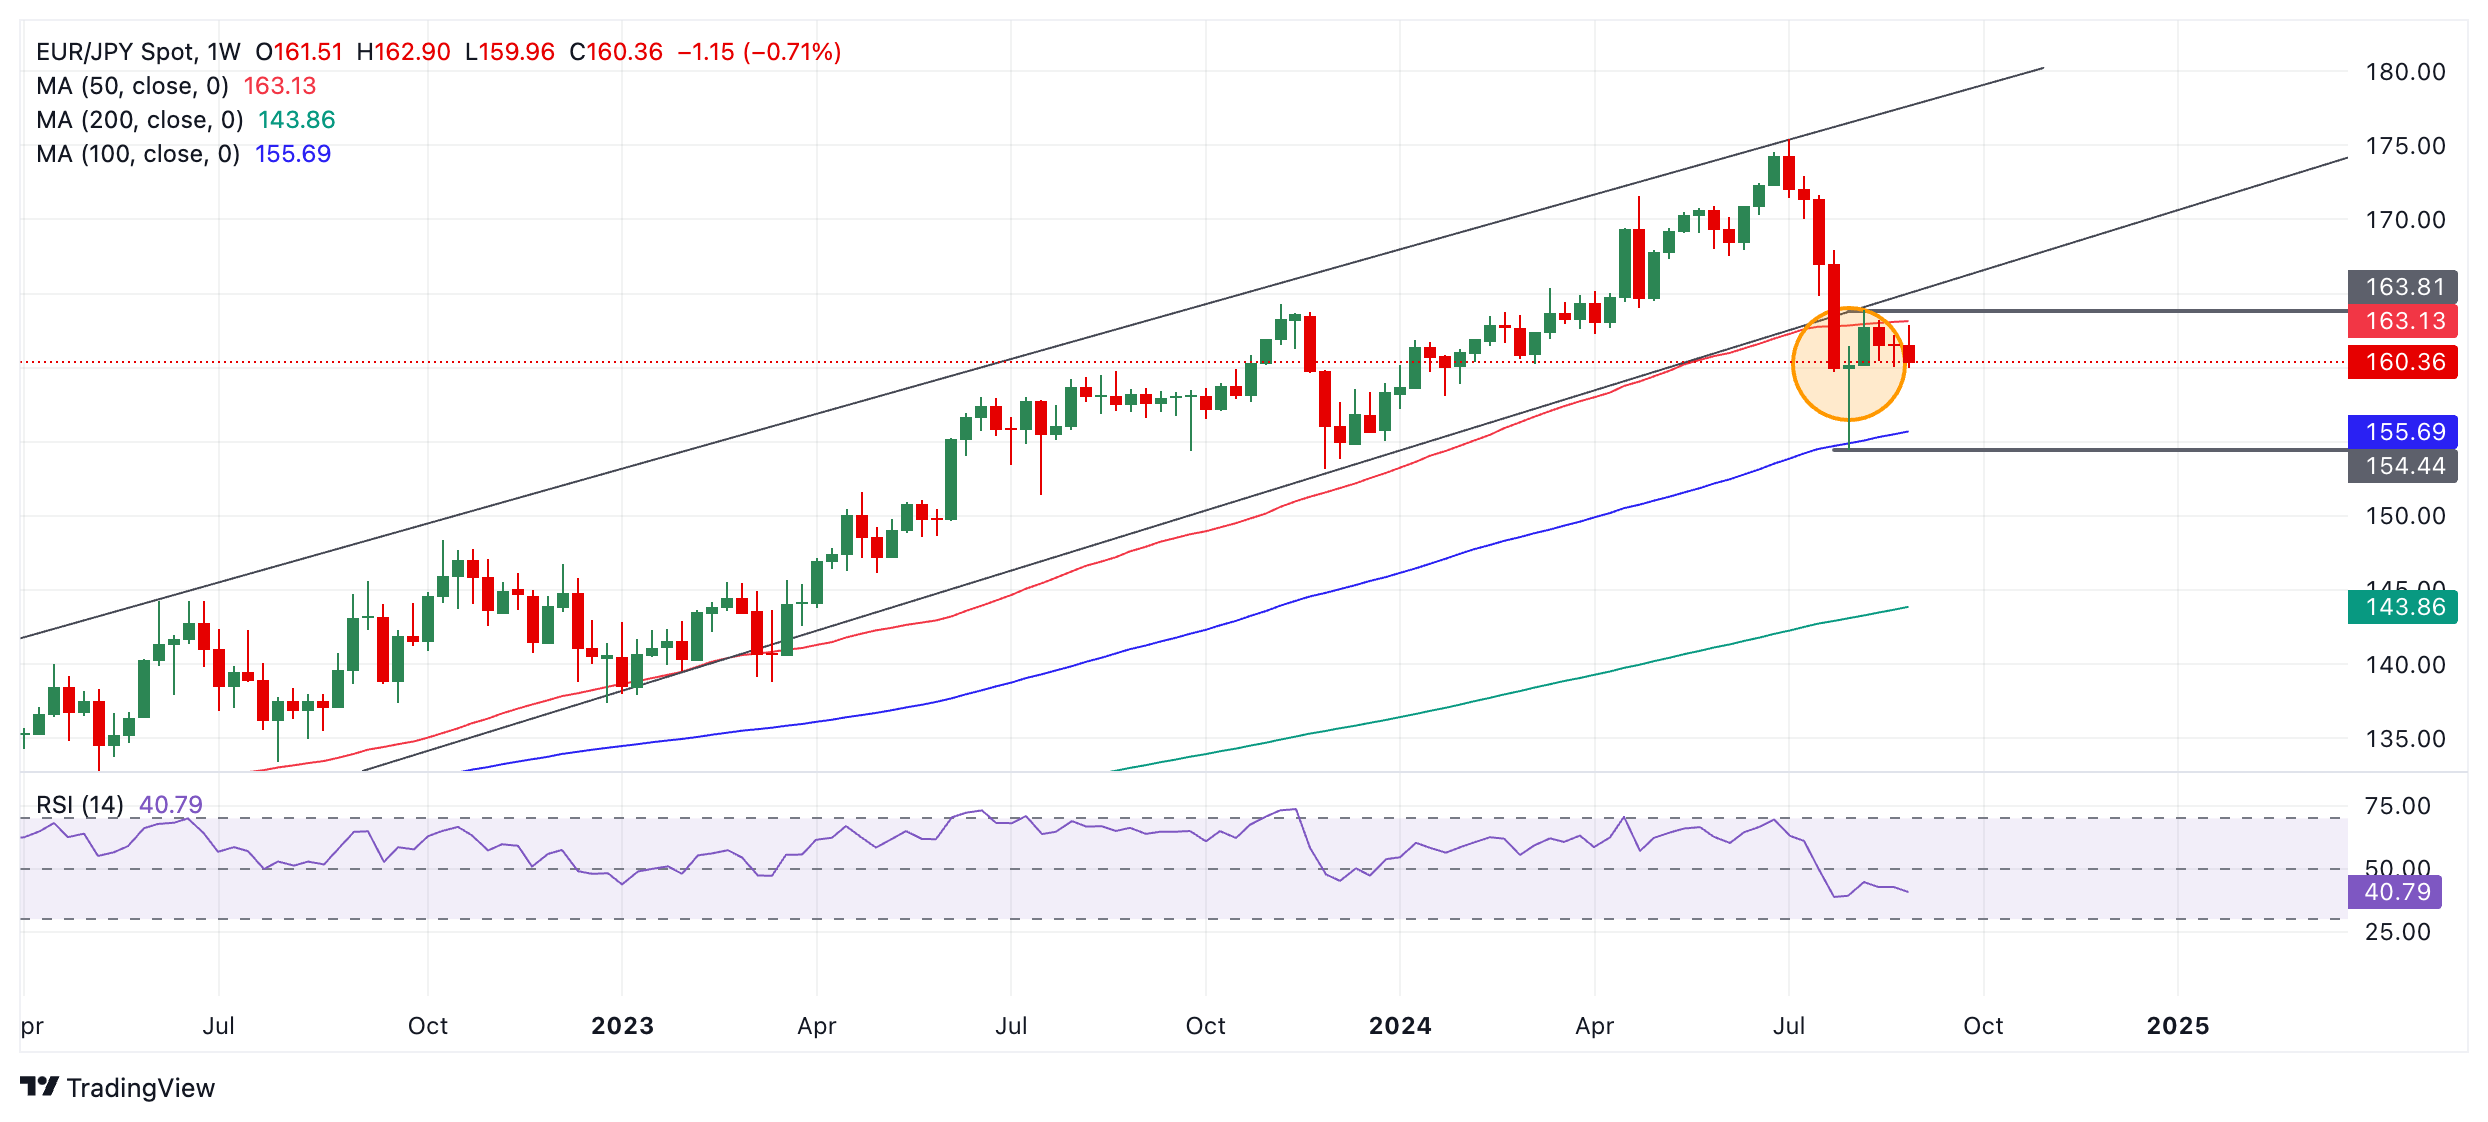
The sell-off from the peak in the 170s bottomed in the 154s at the level of the blue 100-week Simple Moving Average (SMA), a significant major SMA.
EUR/JPY then recovered, rising back above the 160 level during the beginning of August. The week-ending August 9 formed a bullish Dragonfly Doji Japanese candlestick pattern (shaded circle) which gained confirmation after the following week also closed green. Since then, however, price has broadly oscillated in a range.
A break above 163.89 would probably signal a resumption of the dominant multi-year uptrend. From there price would probably rise back up to the 50-day SMA at 166.00 (not shown), initially.
It would take a break below the low of the Dragonfly Doji at 154.41 to signal probable reversal of the longer-term trend. Such a move would probably find support at 151.41 at first – the late July lows.
- NZD/USD recovers intraday losses as the US Dollar struggles to resume its upside journey.
- The risk profile remains favorable for risk-sensitive assets.
- Investors await the US NFP the most in a US heavy-data week.
The NZD/USD pair recovers strongly from the intraday low of 0.6170 in in Wednesday’s New York session. The Kiwi asset bounces back as the US Dollar (USD) struggles to resume its upside journey after correcting from a fresh two-week high.
The US Dollar Index (DXY), which tracks the Greenback’s value against six major currencies, trades in a tight range near 101.60. Meanwhile, the market sentiment remains risk-averse amid uncertainty ahead of the United States (US) Nonfarm Payrolls (NFP) data for August, which will be published later this week. S&P 500 futures have posted significant losses in the American session, portraying a decline in the risk-appetite of market participants.
Investors keenly await the US NFP data release as it will shape the Federal Reserve’s (Fed) interest rate path. The Fed is widely anticipated to start reducing interest rates from the September meeting. However, traders remain split over the likely Fed interest rate cut size. According to the CME FedWatch tool, the likelihood of a 50-basis points (bps) interest rate reduction in September is 39%, while the rest favors a 25-bps decline to 5.00%-5.25%.
The possibility of a 50-bps interest rate reduction could increase if the US NFP report shows that the labor demand remained weak and the Unemployment Rate increased in August. On the contrary, steady or upbeat labor market data would weaken the same.
In today’s session, investors will focus on the US JOLTS Job Openings data for July, which will be published at 14:00 GMT. According to the estimates, US employers posted 8.1 million job vacancies, marginally lower from 8.184 million in June.
On the Asia-Pacific front, the New Zealand Dollar (NZD) will be guided by market speculation for Reserve Bank of New Zealand’s (RBNZ) interest rate path amid absence of top-tier economic data. The RBNZ unexpectedly pivoted to policy normalization in August.
New Zealand Dollar FAQs
The New Zealand Dollar (NZD), also known as the Kiwi, is a well-known traded currency among investors. Its value is broadly determined by the health of the New Zealand economy and the country’s central bank policy. Still, there are some unique particularities that also can make NZD move. The performance of the Chinese economy tends to move the Kiwi because China is New Zealand’s biggest trading partner. Bad news for the Chinese economy likely means less New Zealand exports to the country, hitting the economy and thus its currency. Another factor moving NZD is dairy prices as the dairy industry is New Zealand’s main export. High dairy prices boost export income, contributing positively to the economy and thus to the NZD.
The Reserve Bank of New Zealand (RBNZ) aims to achieve and maintain an inflation rate between 1% and 3% over the medium term, with a focus to keep it near the 2% mid-point. To this end, the bank sets an appropriate level of interest rates. When inflation is too high, the RBNZ will increase interest rates to cool the economy, but the move will also make bond yields higher, increasing investors’ appeal to invest in the country and thus boosting NZD. On the contrary, lower interest rates tend to weaken NZD. The so-called rate differential, or how rates in New Zealand are or are expected to be compared to the ones set by the US Federal Reserve, can also play a key role in moving the NZD/USD pair.
Macroeconomic data releases in New Zealand are key to assess the state of the economy and can impact the New Zealand Dollar’s (NZD) valuation. A strong economy, based on high economic growth, low unemployment and high confidence is good for NZD. High economic growth attracts foreign investment and may encourage the Reserve Bank of New Zealand to increase interest rates, if this economic strength comes together with elevated inflation. Conversely, if economic data is weak, NZD is likely to depreciate.
The New Zealand Dollar (NZD) tends to strengthen during risk-on periods, or when investors perceive that broader market risks are low and are optimistic about growth. This tends to lead to a more favorable outlook for commodities and so-called ‘commodity currencies’ such as the Kiwi. Conversely, NZD tends to weaken at times of market turbulence or economic uncertainty as investors tend to sell higher-risk assets and flee to the more-stable safe havens.
The Euro (EUR) is little changed on the session, Scotiabank’s Chief FX Strategist Shaun Osborne notes.
PMI revisions disappoint
“Final Eurozone Services and Composite PMI data were a little worse than the preliminary August read. Spanish and Italian data were mostly better than July data but failed to meet expectations. France’s Composite data were revised slightly higher while German data were revised a little lower.”
“The data had no significant impact on spot trading but sluggish growth momentum in the Eurozone may crimp the EUR’s ability to take fuller advantage of a soft USD once the Fed easing cycle starts. Spot retains a soft technical undertone after peaking around the 1.12 point late last month.”
“But EUR losses are showing signs of flattening out around the mid-1.10 area, which roughly equates to the 1.1040 retracement support point (38.2% of the EUR’s August rally). Short-term price action suggests a minor low may have been reached yesterday on the quick dip under 1.1030. Resistance and minor bull trigger is 1.1100/05.”
- EUR/GBP has slowed its decline and is consolidating after forming a temporary bottom.
- The trend remains bearish, however, there are signs the bear trend may be exhausted and about to reverse.
EUR/GBP has paused its sell-off within a falling channel. The pair temporarily broke below the bottom of the channel (shaded circle) before recovering and consolidating. This break may be a sign of exhaustion and the first faint signs of a reversal higher, however, it is too soon to tell.
EUR/GBP 4-hour Chart
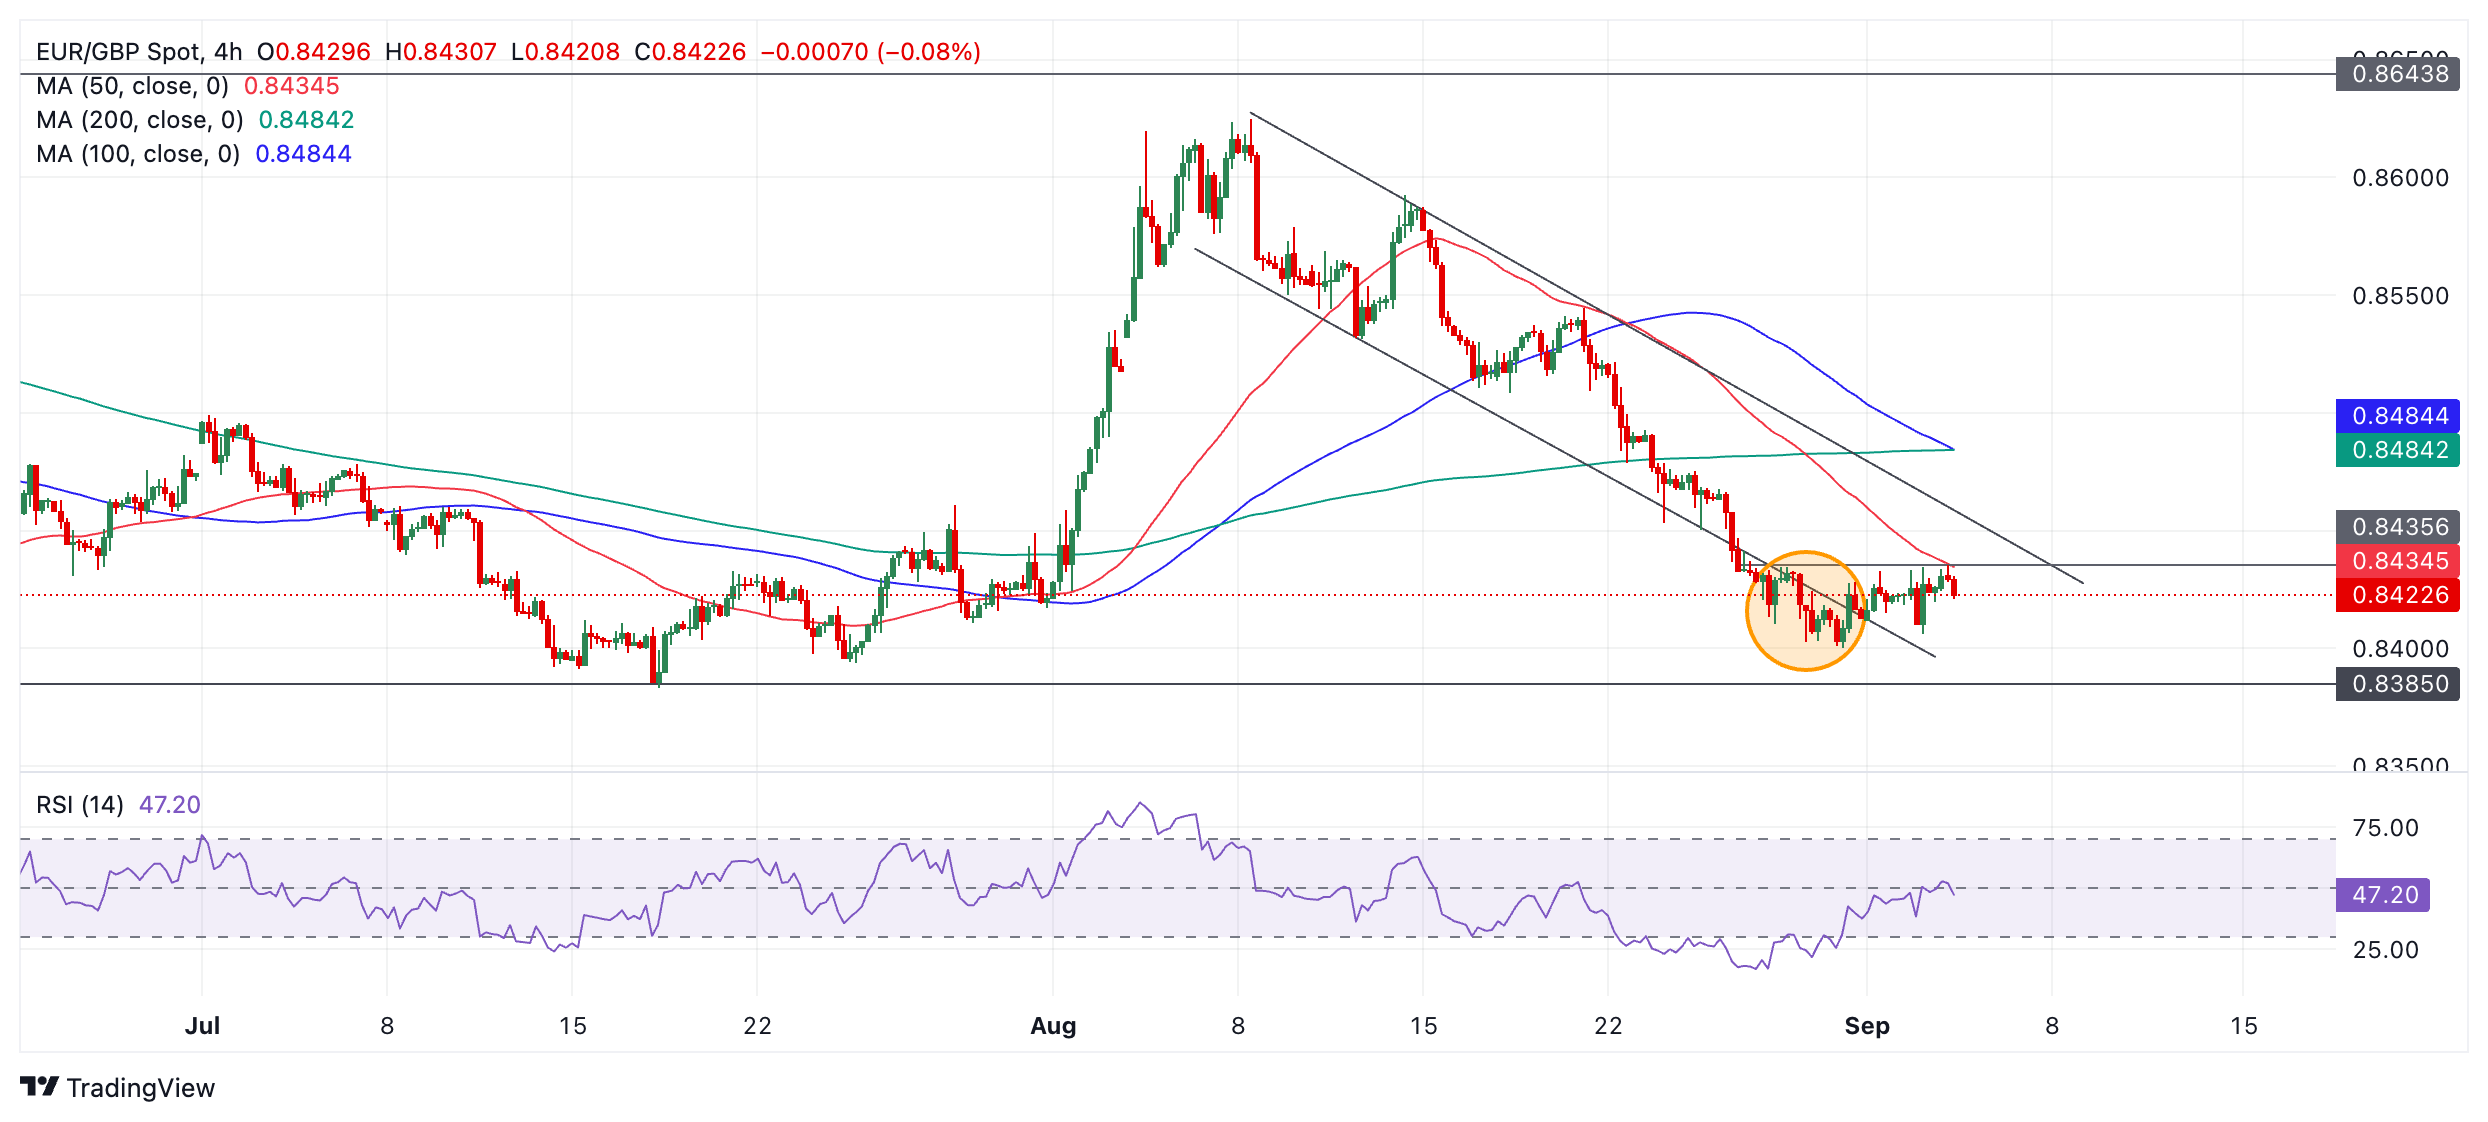
So far the recovery has been quite shallow and it is currently capped by resistance from the 50-period Simple Moving Average (SMA). Price would need to break decisively above the SMA and the line of highs at 0.8435 to provide a stronger bullish signal. Such a move would be expected to extend to the upper channel line at roughly 0.8450 where it would probably encounter reasonably tough resistance. A decisive break would be accompanied by a long green candle that closed near its high or three green candles in a row.
The short-term trend remains bearish, however, suggesting the odds continue to favor an extension lower. A break below 0.8406 (September 3 low) would pave the way for further weakness to a downside target at 0.8385 (July 17 lows).
The long-term trend (weekly chart) is still bearish whilst the medium-term trend is bullish
The Canadian Dollar (CAD) is holding close to Tuesday’s closing level ahead of the Bank of Canada policy decision. The Bank is widely expected to cut its Overnight rate 25bps to 4.25%. This is a policy statement (9.45ET)/press conference (10.30ET) meeting, with the next MPR update due on October 23rd, Scotiabank’s Chief FX Strategist Shaun Osborne notes.
A push above 1.3575 to push USD even higher
“The easing cycle has some way to go yet in all likelihood so policymakers are likely to sound dovish. Markets are pricing in sequential cuts from the BoC over the remainder of the year so dovishness may help keep the CAD tone corrective after its recent rebound but is unlikely to drive it significantly lower. Assuming no surprises today, attention may shift quickly back to the USD and the Fed outlook.”
“USD/CAD’s estimate fair value sits at 1.3616 today, suggesting some modest upside risk for the USD, all else equal. Governor Macklem has a busy September ahead of him. Speeches are scheduled for September 10th, 20th and 24th. Corrective USD gains have stalled about where I expected them too, at least for now. Intraday price action is neutral and leaning bearish for the USD at this point, with spot gains finding a little more resistance in the mid/upper 1.35 area.”
“Short-term momentum remains with the USD, however, and (non-technical) factors today suggest upside risks remain for spot. A push above 1.3575 resistance allows the USD to appreciate a little more to 1.3635 (38.2% retracement of the USD’s August drop) and potentially towards the mid/upper 1.36s. Support is 1.3515/20.”
Risk aversion remains a key feature of markets after hefty losses for US stocks yesterday suggest the August rebound may have peaked around the high seen in July. European stocks have dropped around 1% so far today and US equity futures are in the red, led by tech. Recall that, seasonally, September is the worst month of the calendar year (over the past 25 years) for the S&P 500, Scotiabank’s Chief FX Strategist Shaun Osborne notes.
USD mixed versus majors as global stocks drop again
“The FX market is trading in (mostly) risk-off mode; the JPY and CHF are outperformers among the majors again but so is the ZAR (on better economic data). The USD is mixed to slightly lower, however, as markets continue to mull Fed easing risks. ISM Manufacturing data suggested slowing US growth momentum (paring back the Atlanta Fed’s GDPNow estimate to 2.0%).”
“Markets are pricing incrementally more risk of a 50bps cut (about 40% priced in now) but payrolls data at the end of the week is still the key determinant of the Fed policy outlook. Today’s JOLTS data is expected to reflect some softening in the US labour market. More focus on weaker employment trends in the Fed’s Beige Book may bolster the perception that the bar to a 50bps Fed cut on September 18th is relatively low.”
“Japan releases labour cash earnings data tonight. July data may slow somewhat relative to June’s 4.5% rise but the trend in strengthening pay growth will support the outlook for modest BoJ tightening ahead. The DXY is nearing short-term range support at 101.55; losses may extend towards 101 on losses below here.”
- Silver is in a short-term downtrend after rolling over at the late-August high.
- The price has found support from a key Fibonacci retracement and is oversold indicating risk of a correction.
Silver (XAG/USD) has established a sequence of falling peaks and troughs on the 4-hour chart since it rolled over at the August 26 high. This suggests the precious metal is in a new short-term downtrend, and given “the trend is your friend” will continue lower.
Silver 4-hour Chart
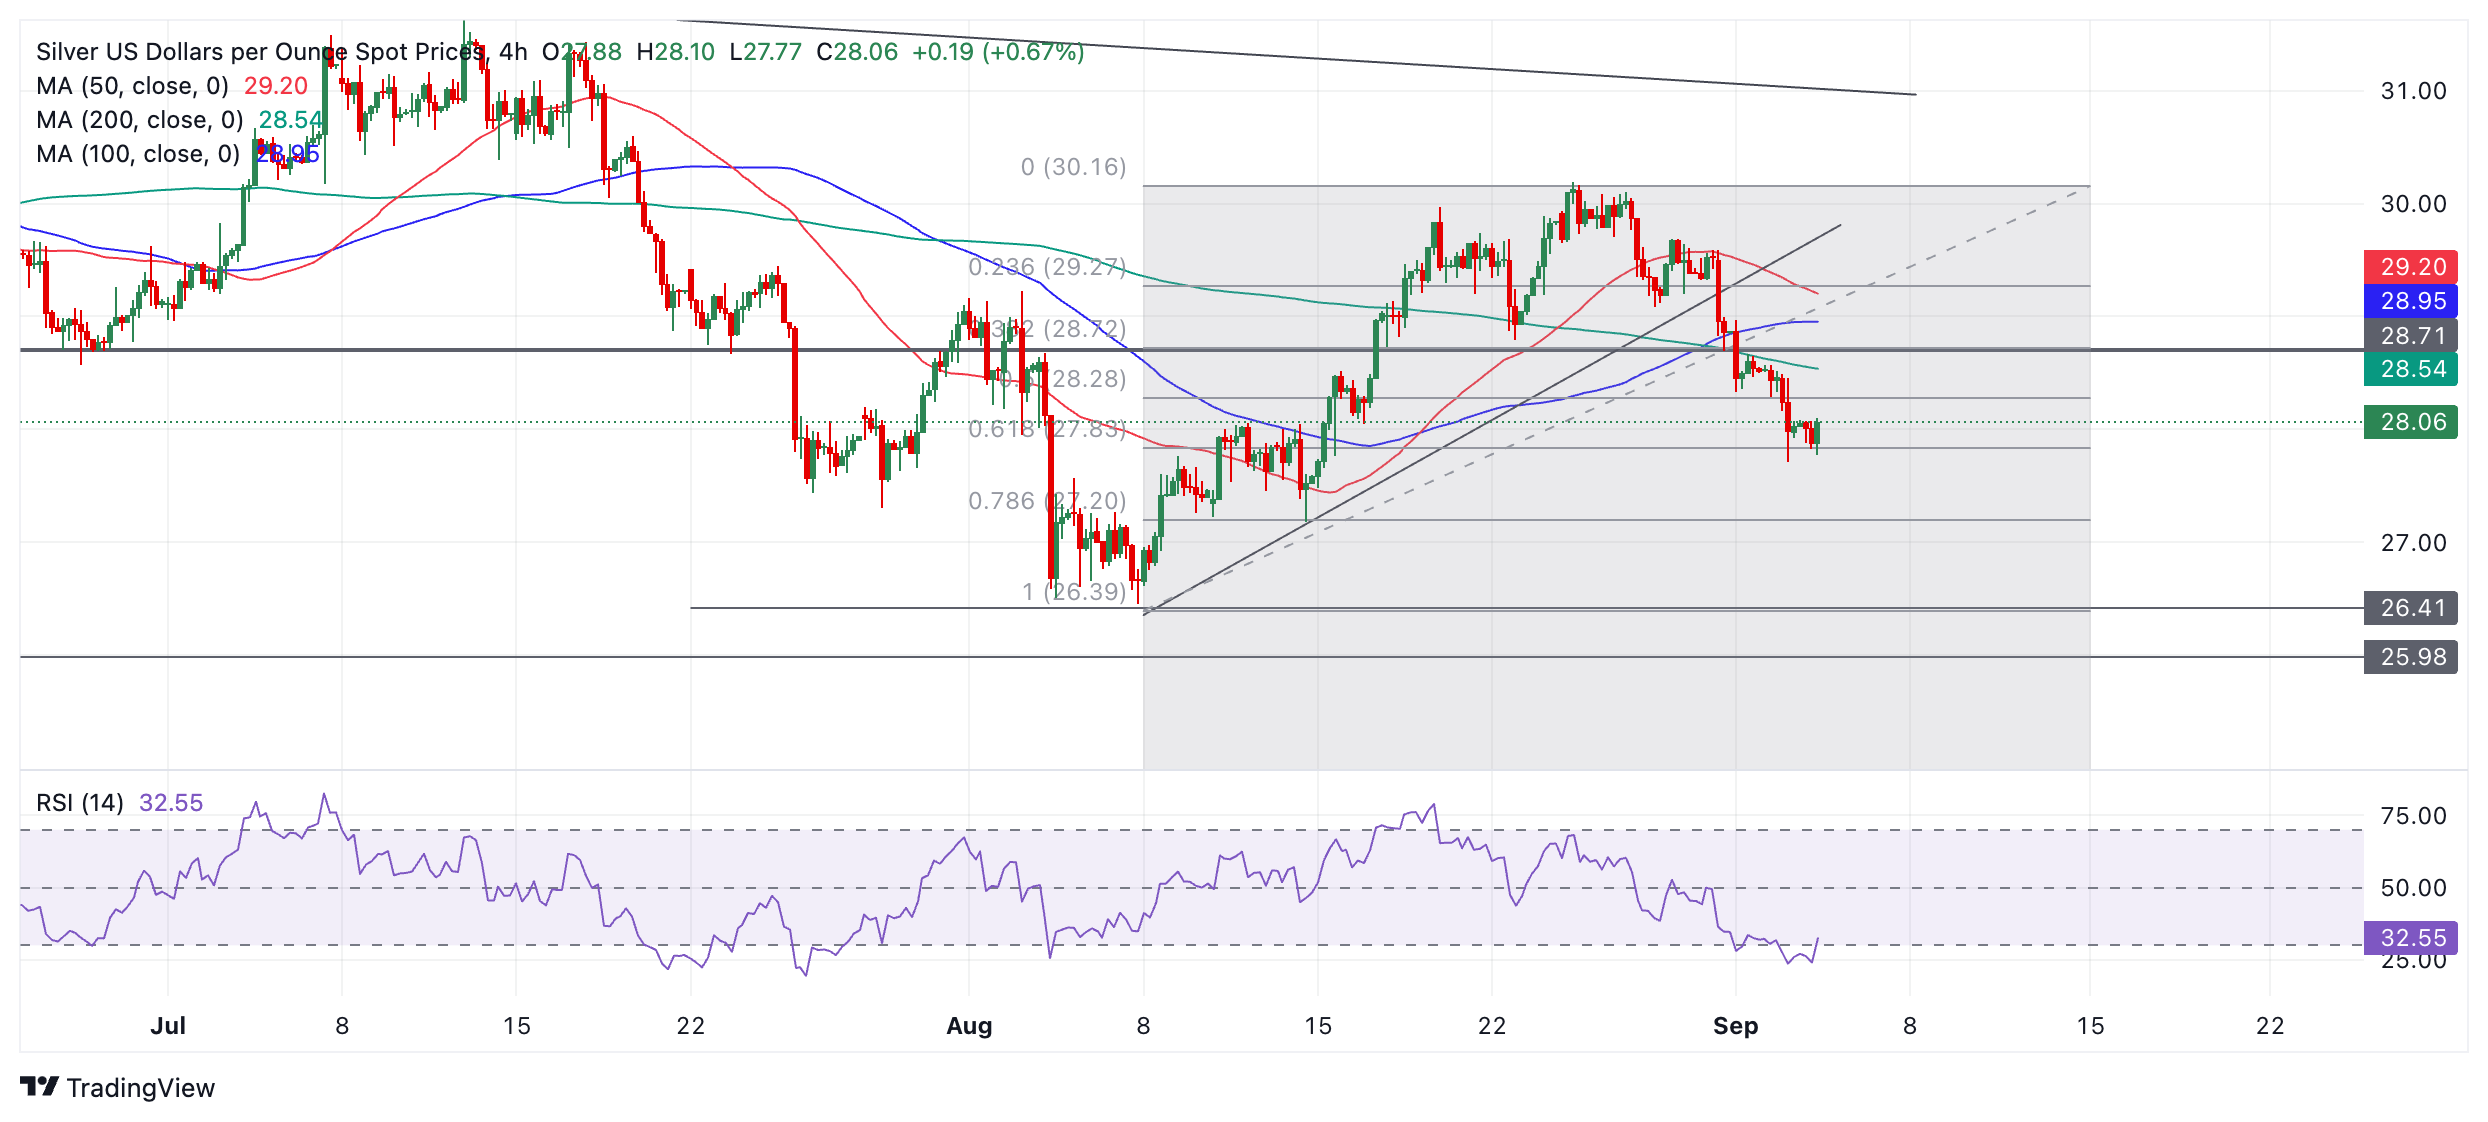
Silver is currently finding support at a key level – the 0.618 Fibonacci ratio retracement of the August rally.
The Relative Strength Index (RSI) momentum indicator has fallen into oversold territory and although it is shown exiting oversold on the current bar it is not possible to tell whether it will close that way until the 4-hour period finishes. If it does rise out of oversold it will give a buy signal and, taken together with the support from the Fibonacci retracement, could indicate a temporary bottom in the downtrend.
If a correction higher unfolds it will probably meet resistance between $28.28 (the 0.50 Fib retracement) and $28.33 (September 2 swing low). Given the trend is down it would be expected to resume its decline thereafter.
In any case, a break below $27.71 (September 3 low) would produce a lower low and extend the downtrend. The next target is the August low at $26.41.
The trend on the medium and longer-term charts is unclear – possibly sideways – indicating little directional bias from higher time frames.
China's policymakers are likely to roll out more housing stimulus in the next 2 months as the swathe of support measures appears inadequate to stem the declines in home prices, TDS FX and Macro Strategist Alex Loo notes.
More housing stimulus in the next 2 months
“The housing downturn has weighed on consumer confidence and crimped real-estate investment, which is a headwind to GDP growth this year and next. Mortgage refinancing is a one-trick pony and will do little to revitalize demand. Instead, supply-side policies may work better.”
“We expect PBoC to raise the quota of its affordable home relending facility to CNY1tn (prior: CNY300bn) and to provide 100% of the loan amount (prior: 60%) next month. We also anticipate that local government will be permitted to use their special local bond proceeds to purchase unsold homes, as soon as this month.”
“The ‘bazooka move’ for the property sector would be the establishment of a property stabilization fund, but we don't envision this occurring with the central government being notably cautious in big policy moves over the past 3 years.”
USD/CAD has recently broken the trend line drawn since February resulting in an extended pullback, Société Generale market analysts note.
A hawkish cut may invite short covering
“USD/CAD has recently broken the trend line drawn since February resulting in an extended pullback. It has established below the 200-DMA which denotes lack of steady upward momentum.”
“The MA near 1.3590/1.3620 must be overcome to confirm a short-term rebound. Holding below this hurdle, there could be risk of continuation in decline towards next potential supports located near March low of 1.3420 and 1.3350, the 76.4% retracement from December.”
The Bank of Canada is set to deliver its third successive quarter-point rate cut today. USD/CAD returned below 1.3550 after briefly topping 1.3900 amid the carry chaos of early August. A hawkish cut could invite short covering and guide the Loonie below 1.35, conditional on risk sentiment recovering.
- The US Dollar trades sideways in a tight range this week ahead of key US employment data.
- Markets brace for JOLTS numbers after ISM Manufacturing PMI did not move the needle.
- The US Dollar Index remains just below an important technical level.
The US Dollar (USD) trades sideways on Wednesday ahead of some key US economic data. Meanwhile, equity markets have a severe hangover with tech stocks selling off. The nosedive took place after NVIDIA (NVDA) received a subpoena from the US Justice Department on whether the chipmaker violated antitrust laws.
On the economic data front, all eyes will be on the appetiser preceding the US Jobs Reports with the Nonfarm Payrolls (NFP) release on Friday, and that is the JOLTS Job Openings release on Wednesday. Although there is no correlation between both numbers, the lagging US JOLTS Job Openings report can reveal if certain sectors are cutting down on their demand for labor force. Markets are still to make up their mind if the US Federal Reserve (Fed) will cut by 25 or 50 basis points in September.
Daily digest market movers: Focus on employment data this week
- During US trading hours on Tuesday, news reported that the US Justice Department has subpoenaed NVIDIA (NVDA) for possible violations of antitrust laws. This triggered a selloff in the broader tech space that spilled over into the Asian and European session.
- At 11:00 GMT, the Mortgage Bankers Association will release its Mortgage Applications Index for the last week of August. The previous number was a slim 0.5%.
- At 12:30 GMT, the US Gods and Trade Balance data will be released. For July, a deficit of $79 billion is expected after June's deficit of $73.1 billion.
- At 14:00 GMT, the JOLTS Job Openings report for July will be released. June’s number came in at 8.184 million vacancies, with 8.1 million expected for July. At the same time, Factory Orders data is expected to jump out of contraction by 3.3% in June to a positive 4.7% in July.
- Equities are selling off on the back of the Nvidia subpoena. In Japan, both the Nikkei and the Topix index are down nearly 4%. European equities are opening more than 1% lower on the day.
- The CME Fedwatch Tool shows a 59.0% chance of a 25 basis points (bps) interest rate cut by the Fed in September against a 41.0% chance for a 50 bps cut. Another 25 bps cut (if September is a 25 bps cut) is expected in November by 40.0%, while there is a 46.8% chance that rates will be 75 bps (25 bps + 50 bps) below the current levels and a 13.2% probability of rates being 100 (25 bps + 75 bps) basis points lower.
- The US 10-year benchmark rate trades at 3.81%, the lowest level this week.
US Dollar Index Technical Analysis: JOLTS can do the trick
The US Dollar Index (DXY) looks to be stuck in a tight range, remaining there for now after Tuesday’s data was unable to move the needle. With the JOLTS Job Openings report on Wednesday, the assumption is the same: any number that comes in substantially above or below consensus will move the DXY in either direction. Meanwhile, markets are giving a bigger chance to a 50 basis point rate cut by the Fed this month, while data does not support that stance.
Looking up, the first resistance at 101.90 could easily be broken should JOLTS report come in stronger than expected. Further up, a steep 2% uprising would be needed to get the index to 103.18. Finally, a heavy resistance level near 104.00 not only holds a pivotal technical value, but it also bears the 200-day Simple Moving Average (SMA) as the second heavyweight to cap price action.
On the downside, 100.62 (the low from December 28) holds as support, although it looks rather feeble. Should it break, the low from July 14, 2023, at 99.58, will be the ultimate level to look out for. Once that level gives way, early levels from 2023 are coming in near 97.73.
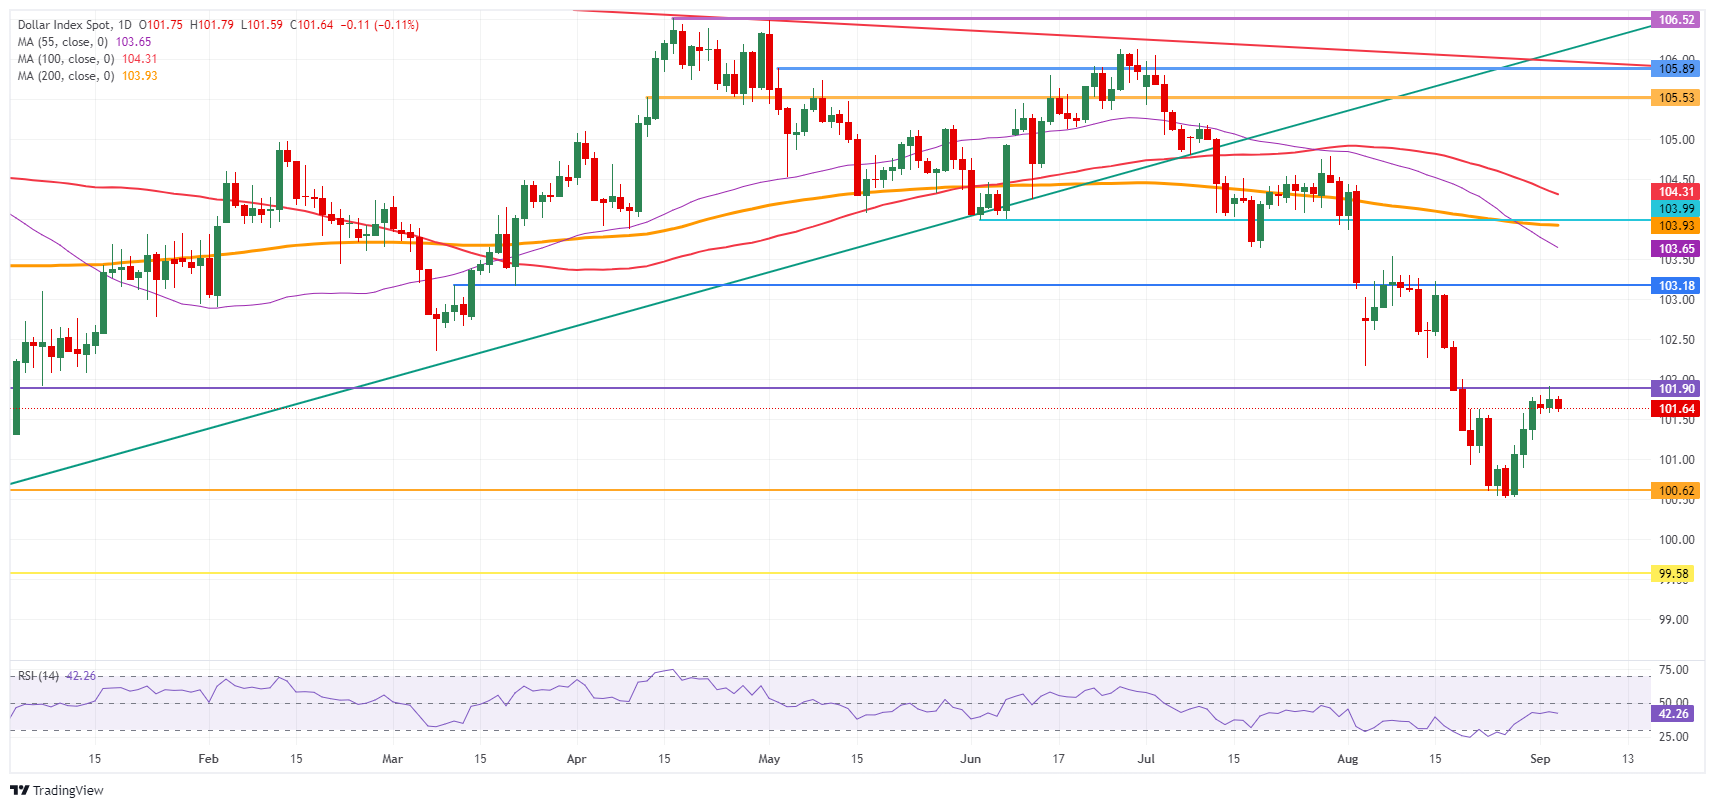
US Dollar Index: Daily Chart
US Dollar FAQs
The US Dollar (USD) is the official currency of the United States of America, and the ‘de facto’ currency of a significant number of other countries where it is found in circulation alongside local notes. It is the most heavily traded currency in the world, accounting for over 88% of all global foreign exchange turnover, or an average of $6.6 trillion in transactions per day, according to data from 2022. Following the second world war, the USD took over from the British Pound as the world’s reserve currency. For most of its history, the US Dollar was backed by Gold, until the Bretton Woods Agreement in 1971 when the Gold Standard went away.
The most important single factor impacting on the value of the US Dollar is monetary policy, which is shaped by the Federal Reserve (Fed). The Fed has two mandates: to achieve price stability (control inflation) and foster full employment. Its primary tool to achieve these two goals is by adjusting interest rates. When prices are rising too quickly and inflation is above the Fed’s 2% target, the Fed will raise rates, which helps the USD value. When inflation falls below 2% or the Unemployment Rate is too high, the Fed may lower interest rates, which weighs on the Greenback.
In extreme situations, the Federal Reserve can also print more Dollars and enact quantitative easing (QE). QE is the process by which the Fed substantially increases the flow of credit in a stuck financial system. It is a non-standard policy measure used when credit has dried up because banks will not lend to each other (out of the fear of counterparty default). It is a last resort when simply lowering interest rates is unlikely to achieve the necessary result. It was the Fed’s weapon of choice to combat the credit crunch that occurred during the Great Financial Crisis in 2008. It involves the Fed printing more Dollars and using them to buy US government bonds predominantly from financial institutions. QE usually leads to a weaker US Dollar.
Quantitative tightening (QT) is the reverse process whereby the Federal Reserve stops buying bonds from financial institutions and does not reinvest the principal from the bonds it holds maturing in new purchases. It is usually positive for the US Dollar.
Brent breached below a multi-year ascending trend line denoting risk of deeper decline, Société Generale market analysts note.
Oil price may fall towards $70.00
“Brent struggled to reclaim the 50-DMA in recent rebound attempt and has now breached below a multi-year ascending trend line denoting risk of deeper decline. Daily MACD is at a higher level than last month, but signals of a meaningful rebound are not yet visible.”
“August trough near $75/75.65 is first layer of resistance. Inability to cross this could mean persistence in down move towards December low of $72.30 and perhaps even towards $70.00. The decline in Brent crude to below $74/bbl is disinflationary and follows reports that OPEC may add about 180k bpd of supply within weeks.
- The Mexican Peso is trading flat as Mexican lawmakers debate a controversial constitutional reform bill.
- A vote on the reforms taking place on Wednesday could cause volatility for the Peso.
- USD/MXN pauses in its uptrend – more gains are expected from technical analysis.
The Mexican Peso (MXN) trades in a narrow range in its key pairs on Wednesday as the dust settles following the global market sell-off of previous sessions.
On Tuesday, US stocks experienced their largest declines since the market meltdown on August 5, after the release of weak US manufacturing data revived hard-landing concerns for the US economy.
Global chipmaker Nvidia’s shares dropped 9%, and the company saw $279 billion wiped off its market capitalization – the largest ever recorded in a single day – after fears Artificial Intelligence (AI) stocks had formed a market bubble.
One of the less-affected assets in Tuesday’s turmoil, the Peso is likely to be more influenced by domestic affairs. Lawmakers in Mexico’s lower house are currently debating controversial reforms to the judiciary before a vote scheduled for Wednesday.
If passed, the legislation will move to the upper house for voting. However, the news could weigh on the Mexican Peso. Critics say the reforms will stifle inward investment and could damage trade ties with the US and Canada.
Mexican Peso vulnerable to political turmoil
Mexican Peso fluctuates between tepid losses and gains as Mexico’s Morena-led parliament tries to push through a judicial reform bill on Wednesday.
The debate had to take place in a different location on Tuesday after the entrance to the Mexican Congress was blocked by Supreme Court workers protesting against the bill, according to El Financiero.
Over 1,000 workers in the judiciary, including several Supreme Court judges themselves, are striking against the controversial reforms, which would see judges elected by popular vote rather than appointment. Critics say the move will undermine the independence of the judiciary and democracy; supporters argue the reforms will help break the stranglehold of organized crime on the courts.
The bill is expected to pass smoothly through the lower house because the Morena-led coalition government has a two-thirds majority there. After that, it will pass to the upper house for voting, where the government is one seat short of a majority – however, experts still believe it will pass without much trouble.
From a financial perspective, the reforms run the risk of leading to a decline in foreign investment. This, in turn, would reduce demand for the Peso, leading to a further depreciation of the currency.
The US ambassador for Mexico, Ken Salazar, has warned that although reforms are needed, the current bill is not the right way to implement them. He warned it could jeopardize the two countries’ close relationship, which includes a free-trade deal.
“If it is not done in the right way, it could cause a lot of damage to the relationship,” said Salazar at a press conference on Tuesday.
Recent data showed that the Mexican Jobless Rate rose to 2.9% in July from 2.8% in the previous month, in line with expectations. On a seasonally adjusted basis, the Jobless Rate rose 2.7% in July, the same as the previous month, according to data from INEGI.
At the time of writing, one US Dollar (USD) buys 19.82 Mexican Pesos, EUR/MXN trades at 21.92, and GBP/MXN at 26.02.
Technical Analysis: USD/MXN rising in solid uptrend
USD/MXN pauses during its uptrend within a broader rising channel. On Tuesday, it broke briefly above the 19.96 high of the mini-range, making a higher high at 19.98, but the pair failed to build on the gains.
Given that “the trend is your friend”, however, the odds favor more upside eventually, taking the pair to new highs.
USD/MXN Daily Chart
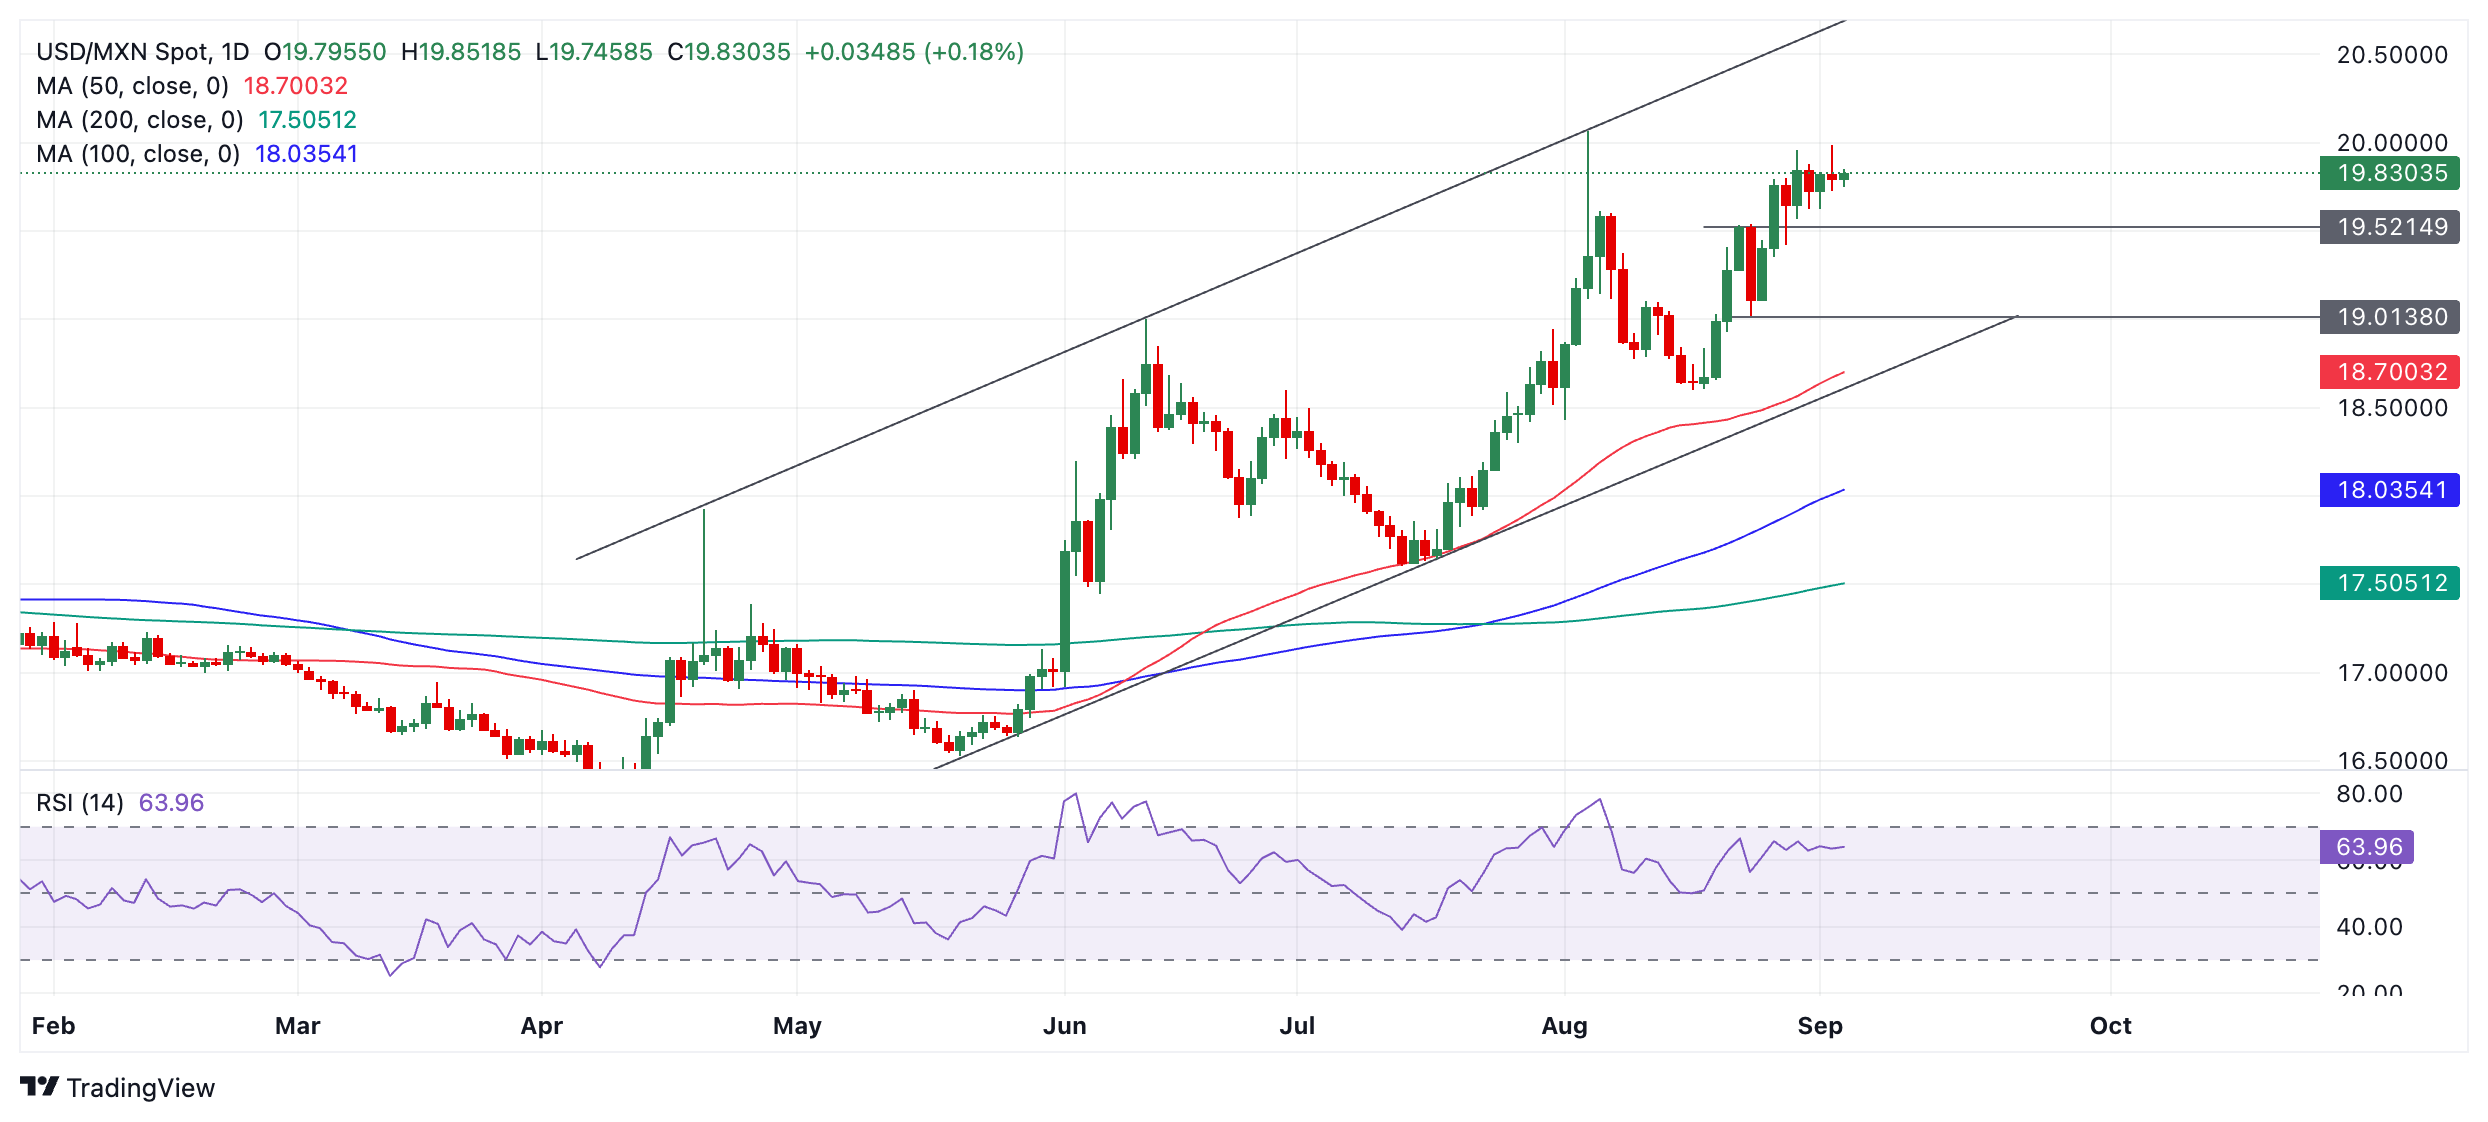
A close above 19.98 (September 3 high) would further confirm a continuation of the bull trend, with the next target at the upper channel line in the 20.60s.
Mexican Peso FAQs
The Mexican Peso (MXN) is the most traded currency among its Latin American peers. Its value is broadly determined by the performance of the Mexican economy, the country’s central bank’s policy, the amount of foreign investment in the country and even the levels of remittances sent by Mexicans who live abroad, particularly in the United States. Geopolitical trends can also move MXN: for example, the process of nearshoring – or the decision by some firms to relocate manufacturing capacity and supply chains closer to their home countries – is also seen as a catalyst for the Mexican currency as the country is considered a key manufacturing hub in the American continent. Another catalyst for MXN is Oil prices as Mexico is a key exporter of the commodity.
The main objective of Mexico’s central bank, also known as Banxico, is to maintain inflation at low and stable levels (at or close to its target of 3%, the midpoint in a tolerance band of between 2% and 4%). To this end, the bank sets an appropriate level of interest rates. When inflation is too high, Banxico will attempt to tame it by raising interest rates, making it more expensive for households and businesses to borrow money, thus cooling demand and the overall economy. Higher interest rates are generally positive for the Mexican Peso (MXN) as they lead to higher yields, making the country a more attractive place for investors. On the contrary, lower interest rates tend to weaken MXN.
Macroeconomic data releases are key to assess the state of the economy and can have an impact on the Mexican Peso (MXN) valuation. A strong Mexican economy, based on high economic growth, low unemployment and high confidence is good for MXN. Not only does it attract more foreign investment but it may encourage the Bank of Mexico (Banxico) to increase interest rates, particularly if this strength comes together with elevated inflation. However, if economic data is weak, MXN is likely to depreciate.
As an emerging-market currency, the Mexican Peso (MXN) tends to strive during risk-on periods, or when investors perceive that broader market risks are low and thus are eager to engage with investments that carry a higher risk. Conversely, MXN tends to weaken at times of market turbulence or economic uncertainty as investors tend to sell higher-risk assets and flee to the more-stable safe havens.
There should be no surprises from the Polish central bank (NBP) today. It is consensus that it will keep the key interest rate at 5.75%, where it has stood since October last year, Commerzbank’s FX Analyst Antje Praefcke notes.
NBP's restrictive stance is a supportive factor for PLN
“The prevailing opinion in the Monetary Policy Council (MPC) is that interest rates cannot be lowered further until next year at the earliest. Even the head of the central bank, Adam Glapinsiki, who had long said that key interest rates would remain unchanged until 2026, recently changed his stance and no longer wanted to rule out a discussion about cuts in 2025. However, interest rates are likely to remain at their current levels until at least the end of the year.”
“Inflation stood at 4.30% in August, with core inflation at 3.8%, which is still above the inflation target (2.5% +/-1%). This underpins the NBP's stance, especially as price pressure has recently increased again somewhat. At tomorrow's press conference, Glapinski is likely to confirm the NBP's view that there will be no interest rate cuts this year. No surprises are to be expected here either, so the decision for the PLN should be neutral.”
“We have often pointed out that the monetary policy considerations of the decision-makers are likely to be politically motivated, which justifies a risk premium on the zloty in the medium term. At the moment, however, the market still sees the NBP's restrictive stance as a supportive factor for the zloty.”
The Bank of Canada (BoC) is likely to deliver its next 25bp rate cut today, at least according to the vast majority of economists surveyed by Bloomberg, Commerzbank’s FX Analyst Michael Pfister notes.
CAD is likely to come under some pressure
“There are good reasons for this view. For one thing, inflation has continued to ease recently. Seasonally adjusted monthly rates of change in the headline rate have been in line with the inflation target on average over the past eleven months.”
“On the other hand, the labour market has weakened further recently. As the labour force continues to grow strongly, the unemployment rate is also rising. In short, the interest rate level is clearly too restrictive at present, which allows for further easing.”
“The most important factor for the CAD is likely to be the extent to which further rate cuts are signalled. Given the latest data, a 25bp cut is likely to be the base case for each of the upcoming meetings. Depending on how much room the BoC sees for (even) more significant rate cuts, the CAD is likely to come under more or less pressure today.”
Data on the US labor market is gradually trickling in over the course of the week. The highlight is of course the labor market report for August on Friday. Tomorrow, one day later than usual due to the US public holiday on Monday, we will receive the ADP index, which is often used as a leading indicator for the non-farm payrolls, but does not really correlate well with them, Commerzbank’s FX Analyst Antje Praefcke notes.
US employments reports to be decisive
“We already get the number of job openings today, the ‘JOLTS Job Openings’, which provide an indication of how many jobs are unfilled, newly created or existing, and which companies are struggling to fill. The number of vacancies has fallen steadily since the peak during the pandemic, but has not yet returned to pre-crisis levels. In this respect, there are still many vacancies, even if the pressure to find employees has visibly decreased in recent quarters.”
“The labor market report for August is particularly important this time because the previous report four weeks ago gave rise to speculation that the Fed would have to cut rates faster and more sharply than previously expected due to fears of a recession. However, the market is currently only pricing in around 30 basis points for the FOMC meeting the week after next, which seems more realistic in view of the price and economic data than the 50 basis points that the market was pricing in after the publication of the July report.”
“A relatively weak labor market report on Friday could lead to notable USD weakness again. However, our economists expect the unemployment rate to remain unchanged at 4.3%. Employment growth should be slightly higher again at 150 thousand. Today and tomorrow, the USD could see a bit of a back and forth due to the job openings and the ADP index, but without any particular direction, since Friday's report will be decisive. If it continues to show a solid situation on the labor market, major shifts in interest rate expectations for the near future and thus USD weakness are inappropriate.”
- Crude Oil trades substantially lower after several headwinds emerged on Tuesday.
- The Libyan outage is set to be resolved, while recession fears in China and Europe weigh on the demand outlook.
- The US Dollar Index trades above 101.00 ahead of the US Jobs Report on Friday.
Crude Oil struggles for support around $70.00 on Wednesday, extending losses after the 5% drop on Tuesday left Oil trading at its lowest level this year so far. Several headlines that came out on Tuesday were just too much to bear for Oil traders, sending the black fuel in a selloff spin. The headwinds are double-fold, taking place both on the demand side and on the sell side of the equation.
On the demand side, recent Purchasing Managers Index data out of China showed another severe slowdown in its manufacturing sector, which means more sluggish demand for Oil ahead. Meanwhile in Europe, one of Germany’s core companies, Volkswagen, has announced plans to close several factories in its native homeland, a sign on the wall that Europe could be facing a severe recession. On the supply side, OPEC is steaming ahead with its intention to normalize output, while the political impasse in Libya is nearly resolved and might see Libyan Oil heading back to markets quicker than expected.
The US Dollar Index (DXY), which tracks the performance of the US Dollar against a bucket of currencies, is holding ground above 101.00. All eyes are on the data points later this week, with several analysts having pencilled in that the US Jobs Report from Friday might be the deciding factor for the US Federal Reserve to cut interest rates either by 25 basis points or by 50 basis points. This makes Friday’s Nonfarm Payrolls print even more important.
At the time of writing, Crude Oil (WTI) trades at $69.52 and Brent Crude at $73.21
Oil news and market movers: API drawdown must be massive
- At 20:30 GMT, the American Petroleum Institute (API) will release its weekly crude oil stockpile change number. In the previous week, there was a drawdown of 3.4 million barrels.
- Bloomberg reports that the issue concerning who should lead the Libyan central bank is set to be resolved soon, opening up the Oil output for the country.
- US Crude exports have found their way to India, with the US trying to push Russia out of its leading role as the main deliverer. According to ship-tracking data, nearly $1 billion worth of crude Oil has been delivered to India from the US, according to Business Standard news.
Oil Technical Analysis: Washed out
Crude Oil’s price action on Tuesday must have hurted a lot of parties. However, traders should not have been surprised by this move considering the recent string of headlines and data that pointed to an imbalance between oversupply – and more supply to come online – versus economic softer data with even some recession signals. More downturn could come ahead before a bounce can occur.
On that upside, the lost level at $75.27 will be the first level to head back to if possible. Next up, the double level at $77.55 aligns with both a descending trendline and the 200-day Simple Moving Average (SMA). In case bulls are able to break above it, the 100-day SMA at $78.54 could trigger a rejection.
On the downside, the low from August 5 at $71.17 has been broken. From here, the $68.00 big figure is the first level to watch, followed by $67.11, which is the lowest point from the triple bottom seen back in June 2023.
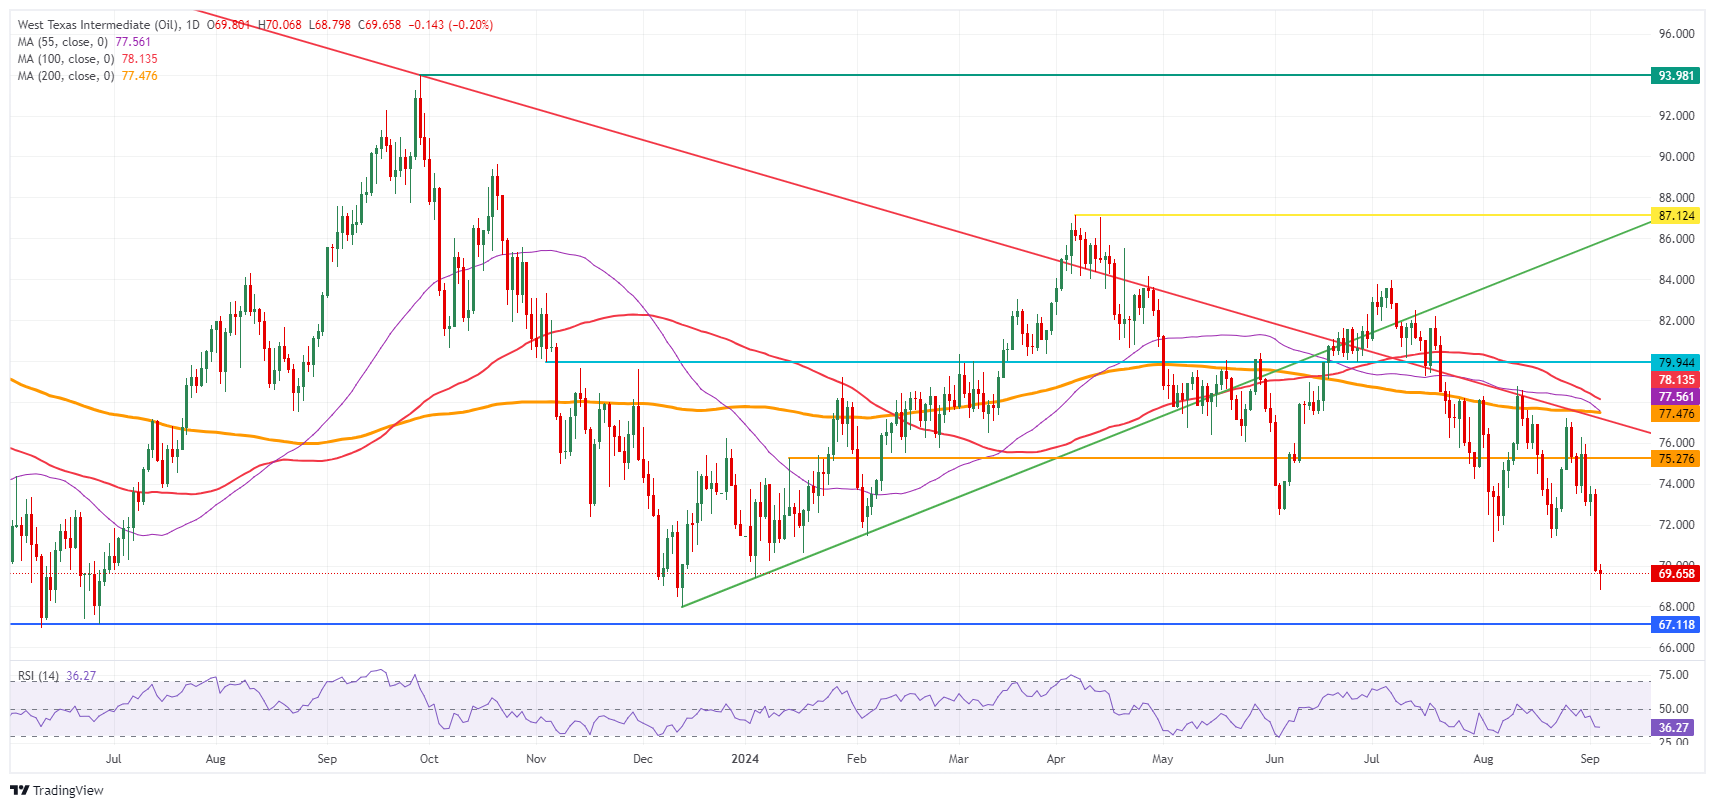
US WTI Crude Oil: Daily Chart
WTI Oil FAQs
WTI Oil is a type of Crude Oil sold on international markets. The WTI stands for West Texas Intermediate, one of three major types including Brent and Dubai Crude. WTI is also referred to as “light” and “sweet” because of its relatively low gravity and sulfur content respectively. It is considered a high quality Oil that is easily refined. It is sourced in the United States and distributed via the Cushing hub, which is considered “The Pipeline Crossroads of the World”. It is a benchmark for the Oil market and WTI price is frequently quoted in the media.
Like all assets, supply and demand are the key drivers of WTI Oil price. As such, global growth can be a driver of increased demand and vice versa for weak global growth. Political instability, wars, and sanctions can disrupt supply and impact prices. The decisions of OPEC, a group of major Oil-producing countries, is another key driver of price. The value of the US Dollar influences the price of WTI Crude Oil, since Oil is predominantly traded in US Dollars, thus a weaker US Dollar can make Oil more affordable and vice versa.
The weekly Oil inventory reports published by the American Petroleum Institute (API) and the Energy Information Agency (EIA) impact the price of WTI Oil. Changes in inventories reflect fluctuating supply and demand. If the data shows a drop in inventories it can indicate increased demand, pushing up Oil price. Higher inventories can reflect increased supply, pushing down prices. API’s report is published every Tuesday and EIA’s the day after. Their results are usually similar, falling within 1% of each other 75% of the time. The EIA data is considered more reliable, since it is a government agency.
OPEC (Organization of the Petroleum Exporting Countries) is a group of 13 Oil-producing nations who collectively decide production quotas for member countries at twice-yearly meetings. Their decisions often impact WTI Oil prices. When OPEC decides to lower quotas, it can tighten supply, pushing up Oil prices. When OPEC increases production, it has the opposite effect. OPEC+ refers to an expanded group that includes ten extra non-OPEC members, the most notable of which is Russia.
The only event on the CEE calendar today is the National Bank of Poland (NBP) meeting. In line with the market, we expect rates to be unchanged at 5.75% with little room for surprises. However, the statement following the decision may reveal some hints, but the main focus will be on the Governor's press conference tomorrow, ING’s FX strategist Frantisek Taborsky notes.
Governor Glapiński sounds exceptionally hawkish
“After July’s decision, Governor Glapiński sounded exceptionally hawkish, stating that rates might need to stay unchanged until 2026. Other policymakers suggested rate cuts should start earlier, while government measures to prevent high energy prices next year should mean the inflation path is more favourable than the NBP thought in June.”
“More recently, Glapinski realised that there is probably sufficient support in the Council to discuss rate cuts in 2025 and amended his wording accordingly, surprising markets with his less-hawkish policy stance. Our economists still expect the first cut in the second quarter of 2025 and think that rates could fall by 100bp next year, especially if the energy shield is not fully withdrawn.”
“The markets are more on the dovish side with the first fully priced-in rate cut in January, which on the other hand is still within the range of possible scenarios if inflation and economic recovery surprise to the downside. It's not that long ago though when the markets were pricing in earlier rate cuts, and if the governor hints at a dovish turn, the market would be happy to move in that direction. FX on the other hand lost ground yesterday, as did the entire CEE region, but is on the stronger side in the medium term and should remain there, in our view.”
- USD/CAD trades in a tight range near 1.3550 as investors have sidelined ahead of the BoC’s monetary policy announcement.
- The BoC is expected to cut interest rates by 25 bps for the third straight time.
- The US Dollar delivers a modest correction with US NFP under spotlight.
The USD/CAD pair trades sideways near 1.3550 in Wednesday’s European trading hours. The Loonie asset struggles for direction as investors await the Bank of Canada’s (BoC) interest rate decision, which will be announced at 13:45 GMT.
Investors see the BoC cutting its key borrowing rates by 25 basis points (bps) to 4.25%. This will be the third straight interest rate cut decision by the BoC, which it started in June after gaining confidence that price pressures will return to bank’s target of 2%. Also, the Canadian economy was struggling to bear the consequences of BoC’s restrictive interest rate stance, which forced them to start unwinding high rates.
Though the BoC is widely anticipated to cut interest rates, investors will majorly focus on the interest rate guidance and the economic outlook. Signs of deeper policy-easing this year from the monetary policy statement or BoC Governor’s Tiff Macklem press conference or both would weigh heavily on the Canadian Dollar (CAD).
Meanwhile, the US Dollar (USD) corrects slightly from fresh two-week highs as United States ISM Manufacturing PMI data for August exhibited contraction in the factory activities at a faster-than-projected pace. The PMI came in at 47.2, missed estimates of 47.5 but improved from eight-month low of 46.8.
This week, the major trigger for the US Dollar is the US Nonfarm Payrolls (NFP) data for August, which will be published on Friday. The official employment data will influence market expectations for Federal Reserve (Fed) interest rate cut size this month. Weak payrolls would prompt peculation for Fed large rate cut while steady or better figures would allow the Fed to start the policy-easing process gradually.
Economic Indicator
BoC Interest Rate Decision
The Bank of Canada (BoC) announces its interest rate decision at the end of its eight scheduled meetings per year. If the BoC believes inflation will be above target (hawkish), it will raise interest rates in order to bring it down. This is bullish for the CAD since higher interest rates attract greater inflows of foreign capital. Likewise, if the BoC sees inflation falling below target (dovish) it will lower interest rates in order to give the Canadian economy a boost in the hope inflation will rise back up. This is bearish for CAD since it detracts from foreign capital flowing into the country.
Read more.Next release: Wed Sep 04, 2024 13:45
Frequency: Irregular
Consensus: 4.25%
Previous: 4.5%
Source: Bank of Canada
USD/SGD rebounded to near 1.31 overnight before partially erasing the move, OCBC FX strategists Frances Cheung and Christopher Wong note.
Rebound may have stalled for now
“Pair was last at 1.3070 levels. Daily momentum turned is bullish while RSI is flat. Rebound may have stalled for now.”
“Resistance at 1.3110 (21 DMA), 1.3160 levels (23.6% fibo retracement of 2024 high to low). Support at 1.3050, 1.30 (recent low). S$NEER was last estimated at ~1.87% above our model-implied mid.”
At 2.47% month-on-month, consumer price inflation in Turkey was slightly above the median of analysts' expectations (2.29%). Under normal circumstances, comments on yesterday's publication by TurkStat would be deployed in a similar way. However, nothing about inflation in Turkey is normal, Commerzbank’s Head of FX and Commodity Research Ulrich Leuchtmann notes.
Lira continues to depreciate significantly in nominal terms
“With such high inflation, measuring it is particularly difficult. Reporting the rate to two decimal places is therefore nonsensical. The official figures enjoy little public trust. The only problem is that when TurkStat reports lower inflation rates than in the past, nobody believes it, and lower figures do not change price-setting behavior. A dynamic of falling inflation is impeded.”
“On the other hand: assuming that inflation is measured reasonably correctly, previous month's rates of around 2½% imply that monetary policy (with a key rate of 50%) is now clearly restrictive. So, it's actually time for the first interest rate cuts. But this phase is particularly tricky. After the Lira crisis of 2018, the central bank had cut its key interest rate far too quickly and far too aggressively, sowing the seeds for the next, even bigger wave of inflation and depreciation.”
“This is far from forgotten. Not by currency traders and not by those who set prices in Turkey. Therefore, the danger zone has not been left behind. Anyone who expects more from the Lira under these circumstances than a devaluation that understates price developments, anyone who wonders, for example, why the Lira continues to depreciate significantly in nominal terms, is much, much too optimistic.”
The Australian Dollar’s (AUD) double-top bearish reversal gets underway, OCBC FX strategists Frances Cheung and Christopher Wong note.
Further downside towards 0.6640 is possible
“Pair was last at 0.6715 levels. Bullish momentum on daily chart faded while RSI fell. Recent pullback may have found an interim support at 0.67 (21 DMA). Decisive break may open room for further downside towards 0.6640. Resistance at 0.6730, 0.6790.”
“2Q GDP released this morning was largely in line with estimates while services PMI held up. With domestic data out of the way. AUD should revert to taking cues from equity sentiments and USD moves in the coming sessions.”
- AUD/USD rebounds as the US Dollar corrects with US NFP data taking centre stage.
- US employers are expected to have posted fresh 8.1 million job vacancies in July.
- The Aussie economy expanded at an expected pace of 1% on an annualized basis.
The AUD/USD pair bounces back and recovers its intraday losses after posting a fresh two-week low slightly below the crucial support of 0.6700 in Wednesday’s European session. The Aussie asset rebounds as the US Dollar (USD) corrects moderately after posting a fresh two-week high. The US Dollar Index (DXY), which tracks the Greenback’s value against six major currencies, falls from recent highs of 102.00 to near 101.60.
Market sentiment remains risk-averse as investors are cautious ahead of the United States (US) Nonfarm Payrolls (NFP) data for August, which will be published on Friday. S&P 500 futures extend its Tuesday’s downside further, exhibiting a decline in investors’ risk-appetite.
Investors keenly await the US labor market data as it will shape the Federal Reserve’s (Fed) interest rate cut path for the September meeting. The significance of the labor market has increased as the commentary from Fed Chair Jerome Powell at the Jackson Hole (JH) Symposium signalled that the central bank is focused on preventing job losses, given that price pressures are on track to return sustainably to bank’s target of 2%.
Before that, the US Dollar will be guided by the JOLTS Job Openings data for July, which will be published at 14:00 GMT. Economists expect that US employers posted 8.1 million fresh job vacancies, marginally lower from 8.184 million in June.
On the Aussie front, the Australian Dollar (AUD) recovers losses driven by mixed Q2 Gross Domestic Product (GDP) data. The report showed that the economy expanded steadily by 0.2%, slower than estimate of 0.3%. Annualized GDP grew in line with expectations of 1%, slower than the former reading of 1.3%, upwardly revised from 1.1%.
Going forward, investors will focus on the Reserve Bank of Australia (RBA) Governor Michele Bullock’s speech on Thursday. Investors will look for fresh cues about whether the RBA will pivot to policy normalization this year.
Australian Dollar FAQs
One of the most significant factors for the Australian Dollar (AUD) is the level of interest rates set by the Reserve Bank of Australia (RBA). Because Australia is a resource-rich country another key driver is the price of its biggest export, Iron Ore. The health of the Chinese economy, its largest trading partner, is a factor, as well as inflation in Australia, its growth rate and Trade Balance. Market sentiment – whether investors are taking on more risky assets (risk-on) or seeking safe-havens (risk-off) – is also a factor, with risk-on positive for AUD.
The Reserve Bank of Australia (RBA) influences the Australian Dollar (AUD) by setting the level of interest rates that Australian banks can lend to each other. This influences the level of interest rates in the economy as a whole. The main goal of the RBA is to maintain a stable inflation rate of 2-3% by adjusting interest rates up or down. Relatively high interest rates compared to other major central banks support the AUD, and the opposite for relatively low. The RBA can also use quantitative easing and tightening to influence credit conditions, with the former AUD-negative and the latter AUD-positive.
China is Australia’s largest trading partner so the health of the Chinese economy is a major influence on the value of the Australian Dollar (AUD). When the Chinese economy is doing well it purchases more raw materials, goods and services from Australia, lifting demand for the AUD, and pushing up its value. The opposite is the case when the Chinese economy is not growing as fast as expected. Positive or negative surprises in Chinese growth data, therefore, often have a direct impact on the Australian Dollar and its pairs.
Iron Ore is Australia’s largest export, accounting for $118 billion a year according to data from 2021, with China as its primary destination. The price of Iron Ore, therefore, can be a driver of the Australian Dollar. Generally, if the price of Iron Ore rises, AUD also goes up, as aggregate demand for the currency increases. The opposite is the case if the price of Iron Ore falls. Higher Iron Ore prices also tend to result in a greater likelihood of a positive Trade Balance for Australia, which is also positive of the AUD.
The Trade Balance, which is the difference between what a country earns from its exports versus what it pays for its imports, is another factor that can influence the value of the Australian Dollar. If Australia produces highly sought after exports, then its currency will gain in value purely from the surplus demand created from foreign buyers seeking to purchase its exports versus what it spends to purchase imports. Therefore, a positive net Trade Balance strengthens the AUD, with the opposite effect if the Trade Balance is negative.
Economic growth is slowing mostly in line with our expectations, but we think recession risks remain low. We make only marginal adjustments to our forecast profile and see 2024 GDP growth at 2.5% (from 2.3%) and 2025 at 1.5% (unchanged), Danske Bank macro analysts note.
Fed to reach a terminal policy rate of 3.00-3.25%
“Potential output continues to grow at a brisk pace, supported by increases in labour supply, solid productivity growth and fiscal policy driven demand for manufacturing investments.”
“Risks to the outlook remain somewhat skewed to the downside. The current low savings rate indicates that consumers' buffers remain weak. Slow monetary policy pass-through and high share of fixed rate mortgages suggest that rate cuts will not provide a rapid boost to economic growth, if the outlook deteriorates faster than we expect.”
“Inflation forecasts have been adjusted modestly lower. We see headline inflation averaging 2.9% in 2024 (from 3.2%) and 2.2% in 2025 (from 2.5%) and core inflation at 3.3% in 2024 (from 3.4%) and 2.4% in 2025 (from 2.6%). We now expect the Fed to cut interest rates by 25bp at every meeting from September until June 2025 (prev. only every other meeting from September), followed by two final cuts in H2 2025 (terminal rate 3.00-3.25%; prev. 3.75-4.00%).”
The Euro (EUR) traded a touch softer, but range remains subdued, OCBC FX strategists Frances Cheung and Christopher Wong note.
ECB may lower rate again on September 12
“Pair was last seen at 1.1055 levels. Daily momentum is mild bearish while RSI was flat. Support at 1.1026 (recent low), 1.10, 1.0930 (61.8% fibo retracement of 2024 high to low). Resistance at 1.12 (recent high) and 1.1280 (2023 high).”
“Slippage in CPIs out of Euro-area, Germany and Spain and softer mfg PMI print added to expectation that ECB may lower rate again at its upcoming meeting on September 12. Markets have priced in 25bp cut at this meeting and about 36bp cut for remainder of the year (another 1.5 cut).”
“This week, focus is on services PMI, PPI (Wednesday), retail sales (Thursday) and GDP (Friday). Another series of underwhelming data print could move the needle for markets to price in a more dovish ECB and for the EUR to trade lower”.
The Bank of Canada (BoC) is widely expected to cut rates for a third consecutive meeting today. As discussed in our BoC preview, we think the policy rate will be trimmed from 4.50% to 4.25%, in line with the consensus and market pricing. The Bank won’t release a new set of economic forecasts at this meeting, so all of the market’s attention will be on the forward-looking language used in the statement and press conference, ING’s FX strategist Francesco Pesole notes.
Risks are quite balanced given market pricing
“At the BoC cut in July, Governor Tiff Macklem was generally dovish on the rate outlook, stressing a greater focus on growth over inflation, and signalling there would be more cuts ahead. Since then, Canada had a soft employment read (-3k in July), cooler wage growth, and crucially another slowdown in all key inflation measures, both headline and core. All those measures now range between 2.4% and 2.7%, so well within the BoC’s 1-3% target range.”
“We expect Macklem to reiterate it is “reasonable” to expect more easing by year-end, effectively endorsing market pricing for rates to be taken to 3.75% by year-end – i.e. another two 25bp cuts after September. Our view is that the BoC is on a relatively predictable track to gradually ease policy to reach the 3.0% mark by mid-2025. That is also broadly in line with market pricing.”
“We doubt there will be huge implications for CAD from the BoC decision today. The risks are quite balanced given market pricing, and USD/CAD continues to be more responsive to US developments. We could see much more USD/CAD volatility on Friday when both US and Canadian jobs figures are released. For now, we continue to see USD/CAD as a 1.35-1.36 story in the near term, with risks slightly tilted to the upside as the external environment may not turn much more favourable for high-beta currencies like the loonie.”
USD/JPY turned lower after BoJ Governor submitted a document to government panel, which reiterated that the BoJ would continue to raise interest rates if the economy and prices perform as expected by the BoJ, OCBC FX strategists Frances Cheung and Christopher Wong note.
Sideways trading is likely
“Fed-BoJ policy shifts will bring about a narrowing of UST-JGB yield differentials and this should continue to underpin the broader direction of travel for USDJPY to the downside Elsewhere, the sell-off in equities (pullback in risk appetite) was also another factor weighing on USDJPY.”
“Pair was last seen at 145.20. Bullish momentum on daily chart intact while decline in RSI moderated. Sideways trading likely. Resistance at 146.10 (21 DMA), 147.20 (recent high). Support at 144.40, 143.45 (recent low).”
Silver prices (XAG/USD) fell on Wednesday, according to FXStreet data. Silver trades at $27.88 per troy ounce, down 0.59% from the $28.05 it cost on Tuesday.
Silver prices have increased by 17.18% since the beginning of the year.
| Unit measure | Silver Price Today in USD |
|---|---|
| Troy Ounce | 27.88 |
| 1 Gram | 0.90 |
The Gold/Silver ratio, which shows the number of ounces of Silver needed to equal the value of one ounce of Gold, stood at 88.75 on Wednesday, down from 88.88 on Tuesday.
Silver FAQs
Silver is a precious metal highly traded among investors. It has been historically used as a store of value and a medium of exchange. Although less popular than Gold, traders may turn to Silver to diversify their investment portfolio, for its intrinsic value or as a potential hedge during high-inflation periods. Investors can buy physical Silver, in coins or in bars, or trade it through vehicles such as Exchange Traded Funds, which track its price on international markets.
Silver prices can move due to a wide range of factors. Geopolitical instability or fears of a deep recession can make Silver price escalate due to its safe-haven status, although to a lesser extent than Gold's. As a yieldless asset, Silver tends to rise with lower interest rates. Its moves also depend on how the US Dollar (USD) behaves as the asset is priced in dollars (XAG/USD). A strong Dollar tends to keep the price of Silver at bay, whereas a weaker Dollar is likely to propel prices up. Other factors such as investment demand, mining supply – Silver is much more abundant than Gold – and recycling rates can also affect prices.
Silver is widely used in industry, particularly in sectors such as electronics or solar energy, as it has one of the highest electric conductivity of all metals – more than Copper and Gold. A surge in demand can increase prices, while a decline tends to lower them. Dynamics in the US, Chinese and Indian economies can also contribute to price swings: for the US and particularly China, their big industrial sectors use Silver in various processes; in India, consumers’ demand for the precious metal for jewellery also plays a key role in setting prices.
Silver prices tend to follow Gold's moves. When Gold prices rise, Silver typically follows suit, as their status as safe-haven assets is similar. The Gold/Silver ratio, which shows the number of ounces of Silver needed to equal the value of one ounce of Gold, may help to determine the relative valuation between both metals. Some investors may consider a high ratio as an indicator that Silver is undervalued, or Gold is overvalued. On the contrary, a low ratio might suggest that Gold is undervalued relative to Silver.
(An automation tool was used in creating this post.)
- The Pound Sterling finds temporary support near 1.3100 against the US Dollar as the Greenback corrects slightly.
- Investors see the Fed reducing interest rates this month but are split over the size of the potential rate cut.
- The BoE’s policy-easing cycle is expected to be shallow for the remainder of the year.
The Pound Sterling (GBP) tries to find a firm footing near the round-level support of 1.3100 in Wednesday’s London session. The GBP/USD pair struggles to gain bids as the market sentiment sours amid increasing uncertainty ahead of the United States (US) Nonfarm Payrolls (NFP) data for August, which will be published on Friday.
S&P 500 futures decline further in European trading hours after a bearish Tuesday, exhibiting a sharp decline in the risk appetite among market participants. The US Dollar Index (DXY), which tracks the Greenback’s value against six major currencies, corrects marginally to near 101.60.
The official labor market data will influence market speculation about the size of the Federal Reserve (Fed) interest rate cut in September. Markets are fully pricing in that the Fed will pivot to policy normalization this month, but traders remain divided about whether the central bank will begin the policy-easing cycle aggressively, with a big interest rate cut, or more gradually.
If the US NFP data points to a further slowdown in labor demand and higher unemployment, market expectations for the Fed reducing its key borrowing rates by 50 basis points (bps) would increase sharply. In a speech at the latest Jackson Hole (JH) Symposium, Fed Chair Jerome Powell vowed to support the labor market in case it continues to deteriorate. On the contrary, steady or better-than-projected job data would weaken expectations of a big rate cut.
In Wednesday’s session, investors will focus on the US JOLTS Job Openings data for July and the Fed’s Beige Book, which will be published at 14:00 GMT and 18:00 GMT, respectively. Economists expect that US employers posted 8.1 million fresh job vacancies, marginally lower from 8.184 million in June.
Daily digest market movers: Pound Sterling remains subdued amid absence of UK top-tier economic data
- The Pound Sterling exhibits a subdued performance against its major peers on Wednesday. The British currency struggles to gain strength despite growing speculation that the policy-easing cycle by the Bank of England (BoE) would be shallow in the remainder of this year compared with that of its peer central banks.
- According to money market pricing data, the BoE is expected to cut interest rates by 40 bps in the remaining year, while the European Central Bank (ECB) is projected to cut by 65 bps, Reuters reported. In the same time frame, the Fed is estimated to cut its key borrowing rates by 100 bps, according to the CME FedWatch tool.
- An improving economic outlook in the United Kingdom (UK) and a slower decline in service inflation have supported expectations of the BoE opting for a gradual policy-easing cycle. The UK economy is expected to perform better than initially anticipated due to an expansion in manufacturing as well as the service sector.
- The final estimate for S&P Global/CIPS Composite PMI came in at 53.8 in August, higher than the preliminary release of 53.4. The indicator suggests that the economy grew at the fastest pace since April.
Technical Analysis: Pound Sterling seeks to gain ground near 1.3100
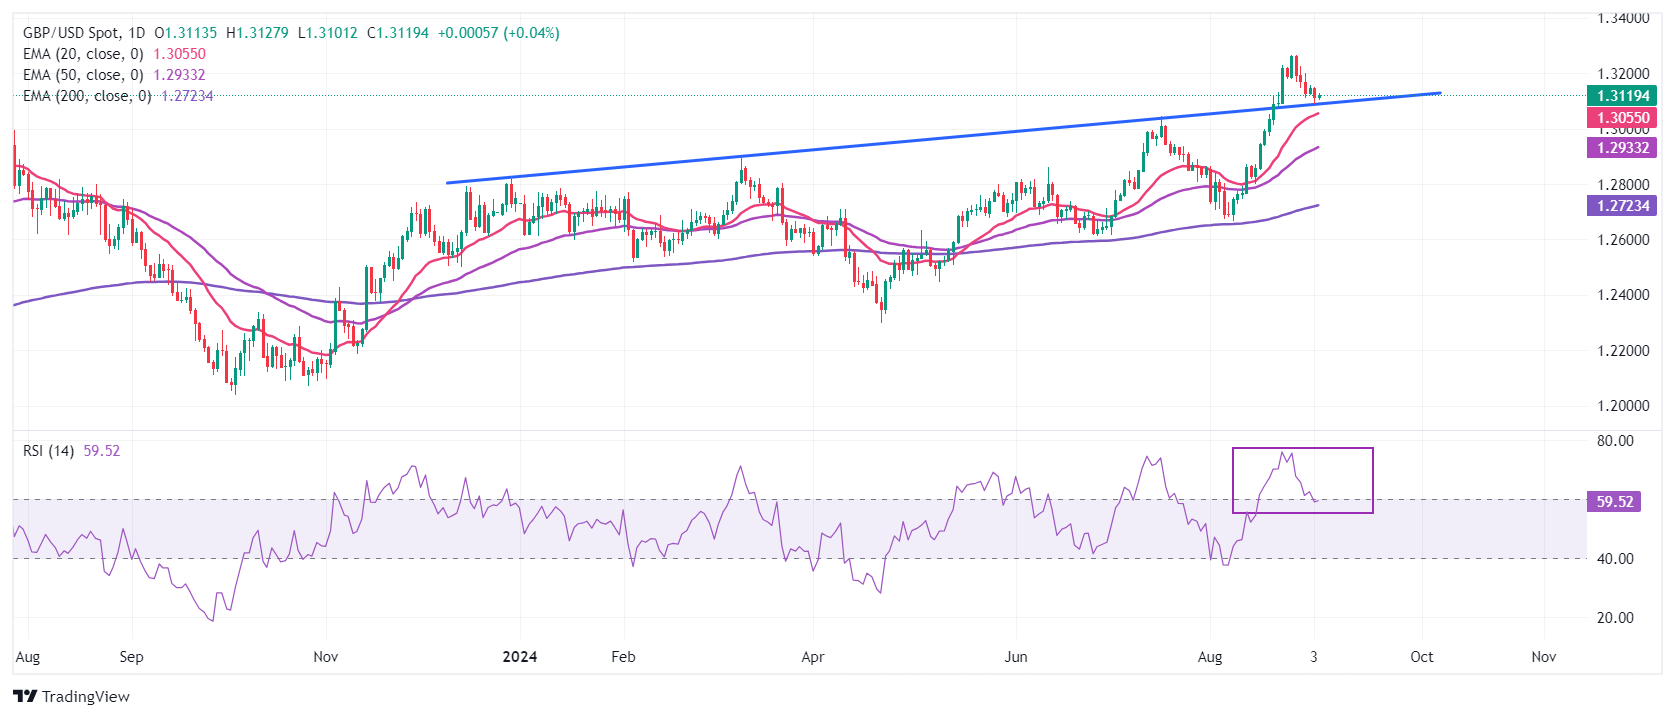
The Pound Sterling edges higher from a fresh weekly low of around 1.3090 against the US Dollar. Still, the GBP/USD pair struggles to gain a firm footing near the round-level support of 1.3200. The Cable may likely find buying interest near the breakout region of an upward-sloping trendline plotted from 28 December 2023 high of 1.2828 on a daily time frame.
The 14-day Relative Strength Index (RSI) declines to near 60.00 after exiting overbought conditions, signaling a lack of bullish momentum.
However, upward-sloping short-to-long-term Exponential Moving Averages (EMAs) suggest a strong bullish trend.
If bullish momentum resumes, the Cable is expected to rise towards the psychological resistance of 1.3500 and the February 4, 2022, high of 1.3640 after breaking above a fresh two-and-a-half-year high of 1.3266. On the downside, the psychological level of 1.3000 will be the crucial support for the Pound Sterling bulls.
Pound Sterling FAQs
The Pound Sterling (GBP) is the oldest currency in the world (886 AD) and the official currency of the United Kingdom. It is the fourth most traded unit for foreign exchange (FX) in the world, accounting for 12% of all transactions, averaging $630 billion a day, according to 2022 data. Its key trading pairs are GBP/USD, aka ‘Cable’, which accounts for 11% of FX, GBP/JPY, or the ‘Dragon’ as it is known by traders (3%), and EUR/GBP (2%). The Pound Sterling is issued by the Bank of England (BoE).
The single most important factor influencing the value of the Pound Sterling is monetary policy decided by the Bank of England. The BoE bases its decisions on whether it has achieved its primary goal of “price stability” – a steady inflation rate of around 2%. Its primary tool for achieving this is the adjustment of interest rates. When inflation is too high, the BoE will try to rein it in by raising interest rates, making it more expensive for people and businesses to access credit. This is generally positive for GBP, as higher interest rates make the UK a more attractive place for global investors to park their money. When inflation falls too low it is a sign economic growth is slowing. In this scenario, the BoE will consider lowering interest rates to cheapen credit so businesses will borrow more to invest in growth-generating projects.
Data releases gauge the health of the economy and can impact the value of the Pound Sterling. Indicators such as GDP, Manufacturing and Services PMIs, and employment can all influence the direction of the GBP. A strong economy is good for Sterling. Not only does it attract more foreign investment but it may encourage the BoE to put up interest rates, which will directly strengthen GBP. Otherwise, if economic data is weak, the Pound Sterling is likely to fall.
Another significant data release for the Pound Sterling is the Trade Balance. This indicator measures the difference between what a country earns from its exports and what it spends on imports over a given period. If a country produces highly sought-after exports, its currency will benefit purely from the extra demand created from foreign buyers seeking to purchase these goods. Therefore, a positive net Trade Balance strengthens a currency and vice versa for a negative balance.
- NZD/USD could test the lower boundary of the ascending channel around 0.6160 level.
- The nine-day EMA is above the 50-day EMA, indicating that short-term upward momentum is likely to continue.
- A break above the nine-day EMA at 0.6201 level prompts the pair to revisit a seven-month high of 0.6247.
NZD/USD extends losses, trading around 0.6180 during the European hours on Wednesday. On the daily chart, the pair is positioned within the ascending channel, supporting a bullish bias.
Additionally, the 14-day Relative Strength Index (RSI) remains above the 50 level, confirming the overall bullish trend. However, if the RSI breaks the 50 mark, it could signal a potential momentum shift from a bullish to a bearish trend.
The nine-day Exponential Moving Average (EMA) is positioned above the 50-day EMA, signaling that the NZD/USD pair is experiencing short-term upward momentum and is likely to continue rising.
On the upside, the NZD/USD pair may encounter immediate resistance around the nine-day EMA at 0.6201 level, followed by the seven-month high of 0.6247, recorded on August 21. A break above this level could lead the pair to test the upper boundary of the ascending channel at 0.6320,
In terms of support, the NZD/USD pair may test the lower boundary of the ascending channel around the 0.6160 level. A break below this level could weaken the bullish bias and lead the pair to approach the area around the 50-day EMA at 0.6099.
NZD/USD: Daily Chart
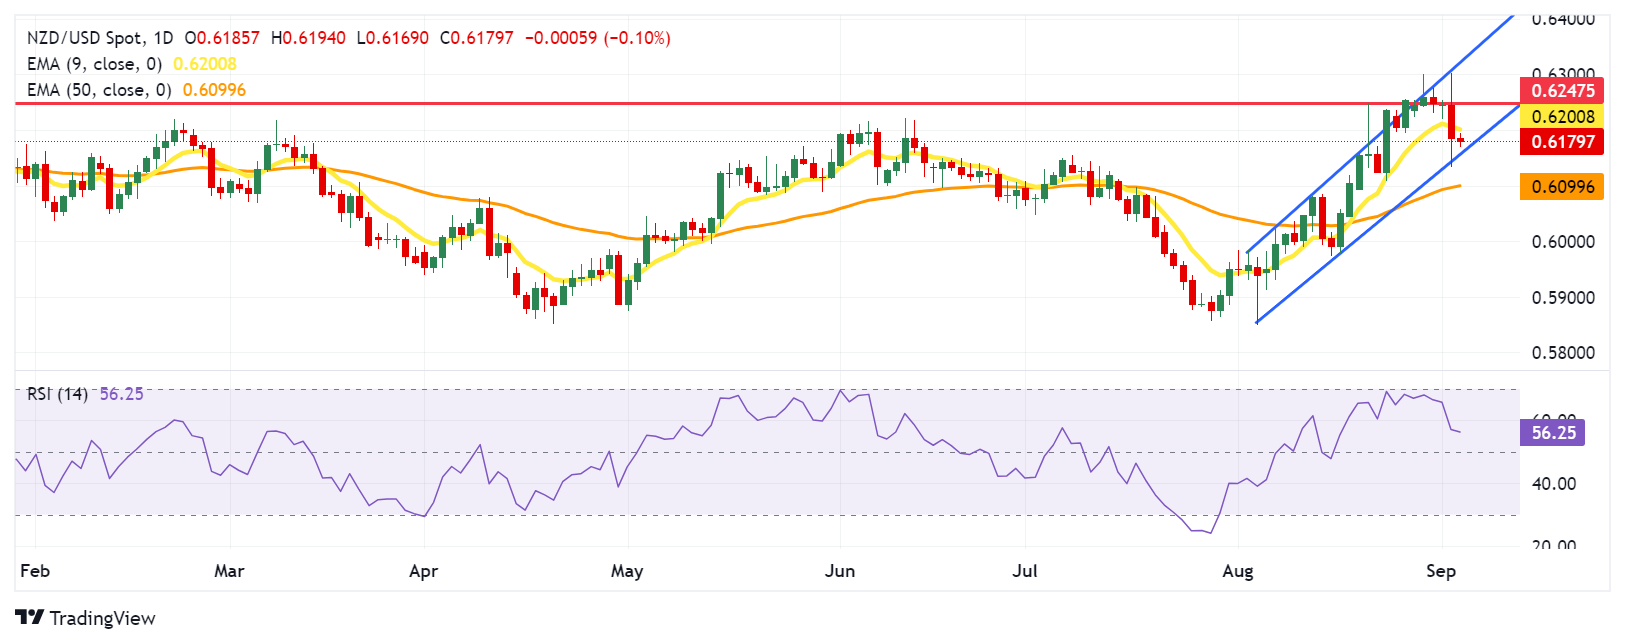
New Zealand Dollar PRICE Today
The table below shows the percentage change of New Zealand Dollar (NZD) against listed major currencies today. New Zealand Dollar was the weakest against the Swiss Franc.
| USD | EUR | GBP | JPY | CAD | AUD | NZD | CHF | |
|---|---|---|---|---|---|---|---|---|
| USD | -0.09% | -0.07% | -0.19% | 0.07% | 0.11% | 0.10% | -0.19% | |
| EUR | 0.09% | 0.04% | -0.11% | 0.18% | 0.20% | 0.22% | -0.11% | |
| GBP | 0.07% | -0.04% | -0.13% | 0.14% | 0.16% | 0.19% | -0.14% | |
| JPY | 0.19% | 0.11% | 0.13% | 0.26% | 0.29% | 0.29% | -0.01% | |
| CAD | -0.07% | -0.18% | -0.14% | -0.26% | 0.02% | 0.05% | -0.28% | |
| AUD | -0.11% | -0.20% | -0.16% | -0.29% | -0.02% | 0.02% | -0.29% | |
| NZD | -0.10% | -0.22% | -0.19% | -0.29% | -0.05% | -0.02% | -0.32% | |
| CHF | 0.19% | 0.11% | 0.14% | 0.00% | 0.28% | 0.29% | 0.32% |
The heat map shows percentage changes of major currencies against each other. The base currency is picked from the left column, while the quote currency is picked from the top row. For example, if you pick the New Zealand Dollar from the left column and move along the horizontal line to the US Dollar, the percentage change displayed in the box will represent NZD (base)/USD (quote).
As discussed in the US Dollar (USD) section above, there is perhaps a narrower path at this stage for pro-cyclical currencies to benefit from a weaker US macro story, ING’s FX strategist Francesco Pesole notes.
Waiting for the nest US data report
“While we would favour JPY and CHF in this environment, the euro should still benefit from its liquidity conditions in a defensive risk environment and outperform higher-beta currencies. In other words, we are not as concerned for EUR/USD as we are for the likes of AUD/USD or NZD/USD that a softer US macro environment may have a net-negative impact due to the softer equities and a Fed pricing that is already dovish.”
“Our preference remains for EUR/USD to hold above 1.1000 into tomorrow’s US ISM services and Friday’s payrolls. If we are right about a softer payroll figure, then we should see it trade back above 1.110 by the end of the week.”
“The eurozone calendar is not very inspiring today. There are some final PMI reads for August and July’s PPI data for the eurozone, which normally does not have a major market impact. On the ECB side, we’ll hear from Francois Villeroy, who is generally considered neutral in the hawk-dove spectrum.”
Markets got back into action after the US Labor Day with a defensive stance and risk assets coming under pressure. Markets saw a return of the textbook risk-off dynamics in FX: strong safe-havens (JPY, CHF, USD) and weak high-betas (AUD, NZD, NOK), ING’s FX strategist Francesco Pesole notes.
Fed’s Beige Book is coming
“The US ISM Manufacturing was a mixed bag yesterday. The headline index rebounded slightly less than expected to 47.2, as new orders slumped to the lowest since May 2023. At the same time, prices paid were above expectations at 54.0. We’d be wary of overinterpreting a survey that has been in contractionary territory for 20 of the last 21 months: ultimately, it is well established that for growth momentum to extend into the second half of the year, it will be up to services to drive it.”
“Today’s main event is the release of US JOLTS job openings, which are seen slowing from 8,184k to 8,100k in July. This figure feeds into an important metric: the ratio of unemployed persons per job opening, which has risen from the 0.5 low of 2022-23 to 0.8 in June. In July, unemployment rose to 7.16m, meaning that the ratio will likely round up to 0.9 unless job openings surprisingly spike back to 8.42m. In the two years before the pandemic, the average was 0.8-0.9, so a move to 1.0+ in the coming months would be a clear signal of labour market strain. The other event on the US calendar today is the Fed’s Beige Book.”
“We have been warning of pockets of USD strength in an environment where markets are fully pricing one 50bp cut by the Fed this year and may need to get more concerned about a US recession to move more on the dovish side. The key here is that US recessionary bets may end up hitting equities and high-beta currencies more than USD. We think the yen and Swiss franc are in a stronger position compared to other G10 currencies.”
- AUD/JPY extends losses following the Jibun Bank Services PMI data on Wednesday.
- Japan’s Services PMI came in at 53.7 in August, against the estimated 54.0, marking the seventh consecutive month of expansion.
- The Aussie Dollar declined as GDP reported a 0.2% increase in QoQ for Q2, falling short of the expected 0.3% readings.
AUD/JPY depreciates for the second successive day, trading around 97.50 during the European hours on Wednesday. The downside of the AUD/JPY cross could be attributed to the improved Japanese Yen (JPY) following the release of the Jibun Bank Services PMI data on Wednesday. The index was revised to 53.7 in August from an initial estimate of 54.0. Although this marks the seventh consecutive month of expansion in the service sector, the latest figure remains unchanged from July.
On Wednesday, Japan’s Chief Cabinet Secretary Yoshimasa Hayashi stated that he is "closely monitoring domestic and international market developments with a sense of urgency." Hayashi emphasized the importance of conducting fiscal and economic policy management in close coordination with the Bank of Japan (BoJ). He also stressed the need for a calm assessment of market movements but declined to comment on daily stock fluctuations.
The Australian Dollar (AUD) extends its losses following the release of Australia’s Gross Domestic Product (GDP), which posted a 0.2% increase in QoQ for the second quarter, up from the previous quarter’s 0.1% but falling short of the expected 0.3% readings.
Additionally, China's Services Purchasing Managers' Index (PMI) fell from 52.1 in July to 51.6 in August, which is notable considering the close trade relationship between China and Australia. Moreover, Bank of America (BoA) has revised its economic growth forecast for China, lowering its 2024 projection to 4.8% from the previous 5.0%. For 2025, the forecast is adjusted to 4.5% growth, while the 2026 outlook remains unchanged at 4.5%.
Central banks FAQs
Central Banks have a key mandate which is making sure that there is price stability in a country or region. Economies are constantly facing inflation or deflation when prices for certain goods and services are fluctuating. Constant rising prices for the same goods means inflation, constant lowered prices for the same goods means deflation. It is the task of the central bank to keep the demand in line by tweaking its policy rate. For the biggest central banks like the US Federal Reserve (Fed), the European Central Bank (ECB) or the Bank of England (BoE), the mandate is to keep inflation close to 2%.
A central bank has one important tool at its disposal to get inflation higher or lower, and that is by tweaking its benchmark policy rate, commonly known as interest rate. On pre-communicated moments, the central bank will issue a statement with its policy rate and provide additional reasoning on why it is either remaining or changing (cutting or hiking) it. Local banks will adjust their savings and lending rates accordingly, which in turn will make it either harder or easier for people to earn on their savings or for companies to take out loans and make investments in their businesses. When the central bank hikes interest rates substantially, this is called monetary tightening. When it is cutting its benchmark rate, it is called monetary easing.
A central bank is often politically independent. Members of the central bank policy board are passing through a series of panels and hearings before being appointed to a policy board seat. Each member in that board often has a certain conviction on how the central bank should control inflation and the subsequent monetary policy. Members that want a very loose monetary policy, with low rates and cheap lending, to boost the economy substantially while being content to see inflation slightly above 2%, are called ‘doves’. Members that rather want to see higher rates to reward savings and want to keep a lit on inflation at all time are called ‘hawks’ and will not rest until inflation is at or just below 2%.
Normally, there is a chairman or president who leads each meeting, needs to create a consensus between the hawks or doves and has his or her final say when it would come down to a vote split to avoid a 50-50 tie on whether the current policy should be adjusted. The chairman will deliver speeches which often can be followed live, where the current monetary stance and outlook is being communicated. A central bank will try to push forward its monetary policy without triggering violent swings in rates, equities, or its currency. All members of the central bank will channel their stance toward the markets in advance of a policy meeting event. A few days before a policy meeting takes place until the new policy has been communicated, members are forbidden to talk publicly. This is called the blackout period.
The US Dollar (USD) short squeeze was well underway, with AUD, NZD and THB under pressure overnight, OCBC FX strategists Frances Cheung and Christopher Wong note.
Some risks of further short squeeze exist
“ISM manufacturing slumped (47.2 vs. 47.5 expected), alongside new orders while employment subindex remains in contractionary territory. Focus shifts to JOLTS job openings and Fed’s Beige book report. July’s Beige Book showed most Districts reported employment was flat or up slightly, while a few Districts reported modest employment growth.”
“We reiterate that USD should remain sensitive to job data this week given that Fed’s focus has shifted towards supporting labour market. Good and bad data may continue to point to USD rebound while data in line with estimate may see a more muted response to USD. DXY was last at 101.61.”
“Daily momentum is mild bullish but rise in RSI moderated. We still see some risks of further short squeeze. Resistance at 101.90 (21 DMA), 102.20 (23.6% fibo retracement of 2023 high to 2024 low). Support at 100.50 levels. Week remaining brings JOLTs job openings (Wed), ADP employment, ISM services employment (Thursday), and US payrolls report on Friday.
- EUR/GBP pares its intraday gains after the downbeat HCOB PMI data from Eurozone and Germany.
- Eurozone Services PMI decreased to 52.9 in August, from 53.3 in the previous month.
- The Pound Sterling may appreciate it as the BoE is expected to deliver no rate cut in September.
EUR/GBP trims its intraday gains following the release of HCOB Purchasing Managers Index (PMI) data from the Eurozone and Germany, trading around 0.8430 during Wednesday’s European session. The Eurozone Services PMI decreased to 52.9 in August, from 53.3 in the previous month. Meanwhile, the Composite PMI dropped to 51.0, missing expectations and falling below the previous reading of 51.2, which was expected to remain unchanged.
In Germany, the HCOB Services PMI declined to 51.2 in August, slightly below market expectations of no change from the previous 51.4 reading. Meanwhile, the Composite PMI also fell to 48.4, just under the anticipated and prior reading of 48.5.
However, the upside potential for the EUR/GBP cross may be limited, as the Euro may face challenges amid strong speculation that the European Central Bank (ECB) will cut interest rates in September. This would mark the second interest rate cut by the ECB since it began shifting toward policy normalization in June. Policymakers remain confident that inflation will gradually return to the bank's 2% target by 2025.
The EUR/GBP cross may struggle as traders anticipate no rate cut by the Bank of England (BoE) in the September meeting. However, traders expect a 25 basis points (bps) interest rate cut in the November meeting.
Growing concerns about the global economy have intensified after weak PMI data from the world's two largest economies. Traders will be closely watching the PMI data from the United Kingdom (UK) later in the day.
Interest rates FAQs
Interest rates are charged by financial institutions on loans to borrowers and are paid as interest to savers and depositors. They are influenced by base lending rates, which are set by central banks in response to changes in the economy. Central banks normally have a mandate to ensure price stability, which in most cases means targeting a core inflation rate of around 2%. If inflation falls below target the central bank may cut base lending rates, with a view to stimulating lending and boosting the economy. If inflation rises substantially above 2% it normally results in the central bank raising base lending rates in an attempt to lower inflation.
Higher interest rates generally help strengthen a country’s currency as they make it a more attractive place for global investors to park their money.
Higher interest rates overall weigh on the price of Gold because they increase the opportunity cost of holding Gold instead of investing in an interest-bearing asset or placing cash in the bank. If interest rates are high that usually pushes up the price of the US Dollar (USD), and since Gold is priced in Dollars, this has the effect of lowering the price of Gold.
The Fed funds rate is the overnight rate at which US banks lend to each other. It is the oft-quoted headline rate set by the Federal Reserve at its FOMC meetings. It is set as a range, for example 4.75%-5.00%, though the upper limit (in that case 5.00%) is the quoted figure. Market expectations for future Fed funds rate are tracked by the CME FedWatch tool, which shapes how many financial markets behave in anticipation of future Federal Reserve monetary policy decisions.
- Gold continues slowly falling despite risk sentiment turning negative following weak US manufacturing data.
- Overcrowded long positioning could be the reason the commodity is not rising as expected.
- Technically, Gold has broken below the key $2,500 level – a bearish sign for the precious metal.
Gold (XAU/USD) trades marginally lower on Wednesday, exchanging hands in the $2,490s. Market sentiment remains negative after the global sell-off triggered by the release of weak US manufacturing data on Tuesday, and fears about the Artificial Intelligence (AI) tech bubble bursting.
Surprisingly, this has failed to translate into upside for Gold despite its safe-haven status, perhaps due to the overweight long positioning of Commodity Trading Advisors (CTA) and institutional investors. Gold actually finished Tuesday down over a quarter of a percent.
Gold shrugs off increased probabilities of a 0.50% Fed rate cut
Gold also fails to capitalize on the significant rise in market-based probabilities of the US Federal Reserve (Fed) opting for a larger 0.50% interest rate cut at its September 18 meeting.
Prior to the release of the weak US Manufacturing PMI print, the CME FedWatch Tool – which uses the 30-day fed fund Futures price to estimate chances of future Fed decisions – calculated the probability of the Fed making a 0.50% cut at around 31%. Today the probability has increased significantly to 41%.
Such a big shift in expectations of interest rates falling would normally be expected to have a bullish effect on Gold since it lowers the opportunity cost of holding the non-interest-paying precious metal. However, on this occasion this does not seem to be the case.
US employment metrics, scheduled for release during the remainder of the week, could still impact the outlook for US interest rates either way. This is particularly the case given recent comments by Federal Reserve (Fed) Chairman Jerome Powell, who highlighted risks to the labor market as now being more important than inflation in his speech at Jackson Hole. This week the data will put his remarks to the test.
Wednesday sees the release of US JOLTS Job Openings, which are forecast to show a decline to 8.1 million in July from 8.184 million in June. A more pronounced decline in openings, however, would raise concerns regarding the state of the jobs market and further increase the chances of the Fed making a larger 0.50% cut.
ADP Employment Change and Jobless Claims follow on Thursday, but the main event on the calendar will be US Nonfarm Payrolls (NFP) on Friday. If NFPs increase less than expected it would further support the case of the larger cut.
On the geopolitical front, there are no major flare-ups that could pass through to increased demand for Gold. Although Russia launched a large missile and drone attack on Ukraine on Tuesday, killing 50 people in Poltava, it follows days of similar bombardments.
Out of Gaza, meanwhile, the Israeli populace continues to protest for a ceasefire to allow the safe release of hostages and the US criminally charged Hamas’s leaders for organizing the October 7 attacks.
Technical Analysis: Continues oscillating in a messy range
Gold (XAU/USD) continues meandering within a messy range below its previous all-time highs of $2,531.
It has now broken below the key $2,500 support level – a bearish turn of events from a technical perspective – but remains above the next key level at $2,470-$2,460, the top of the old range formed in July and early August.
XAU/USD Daily Chart
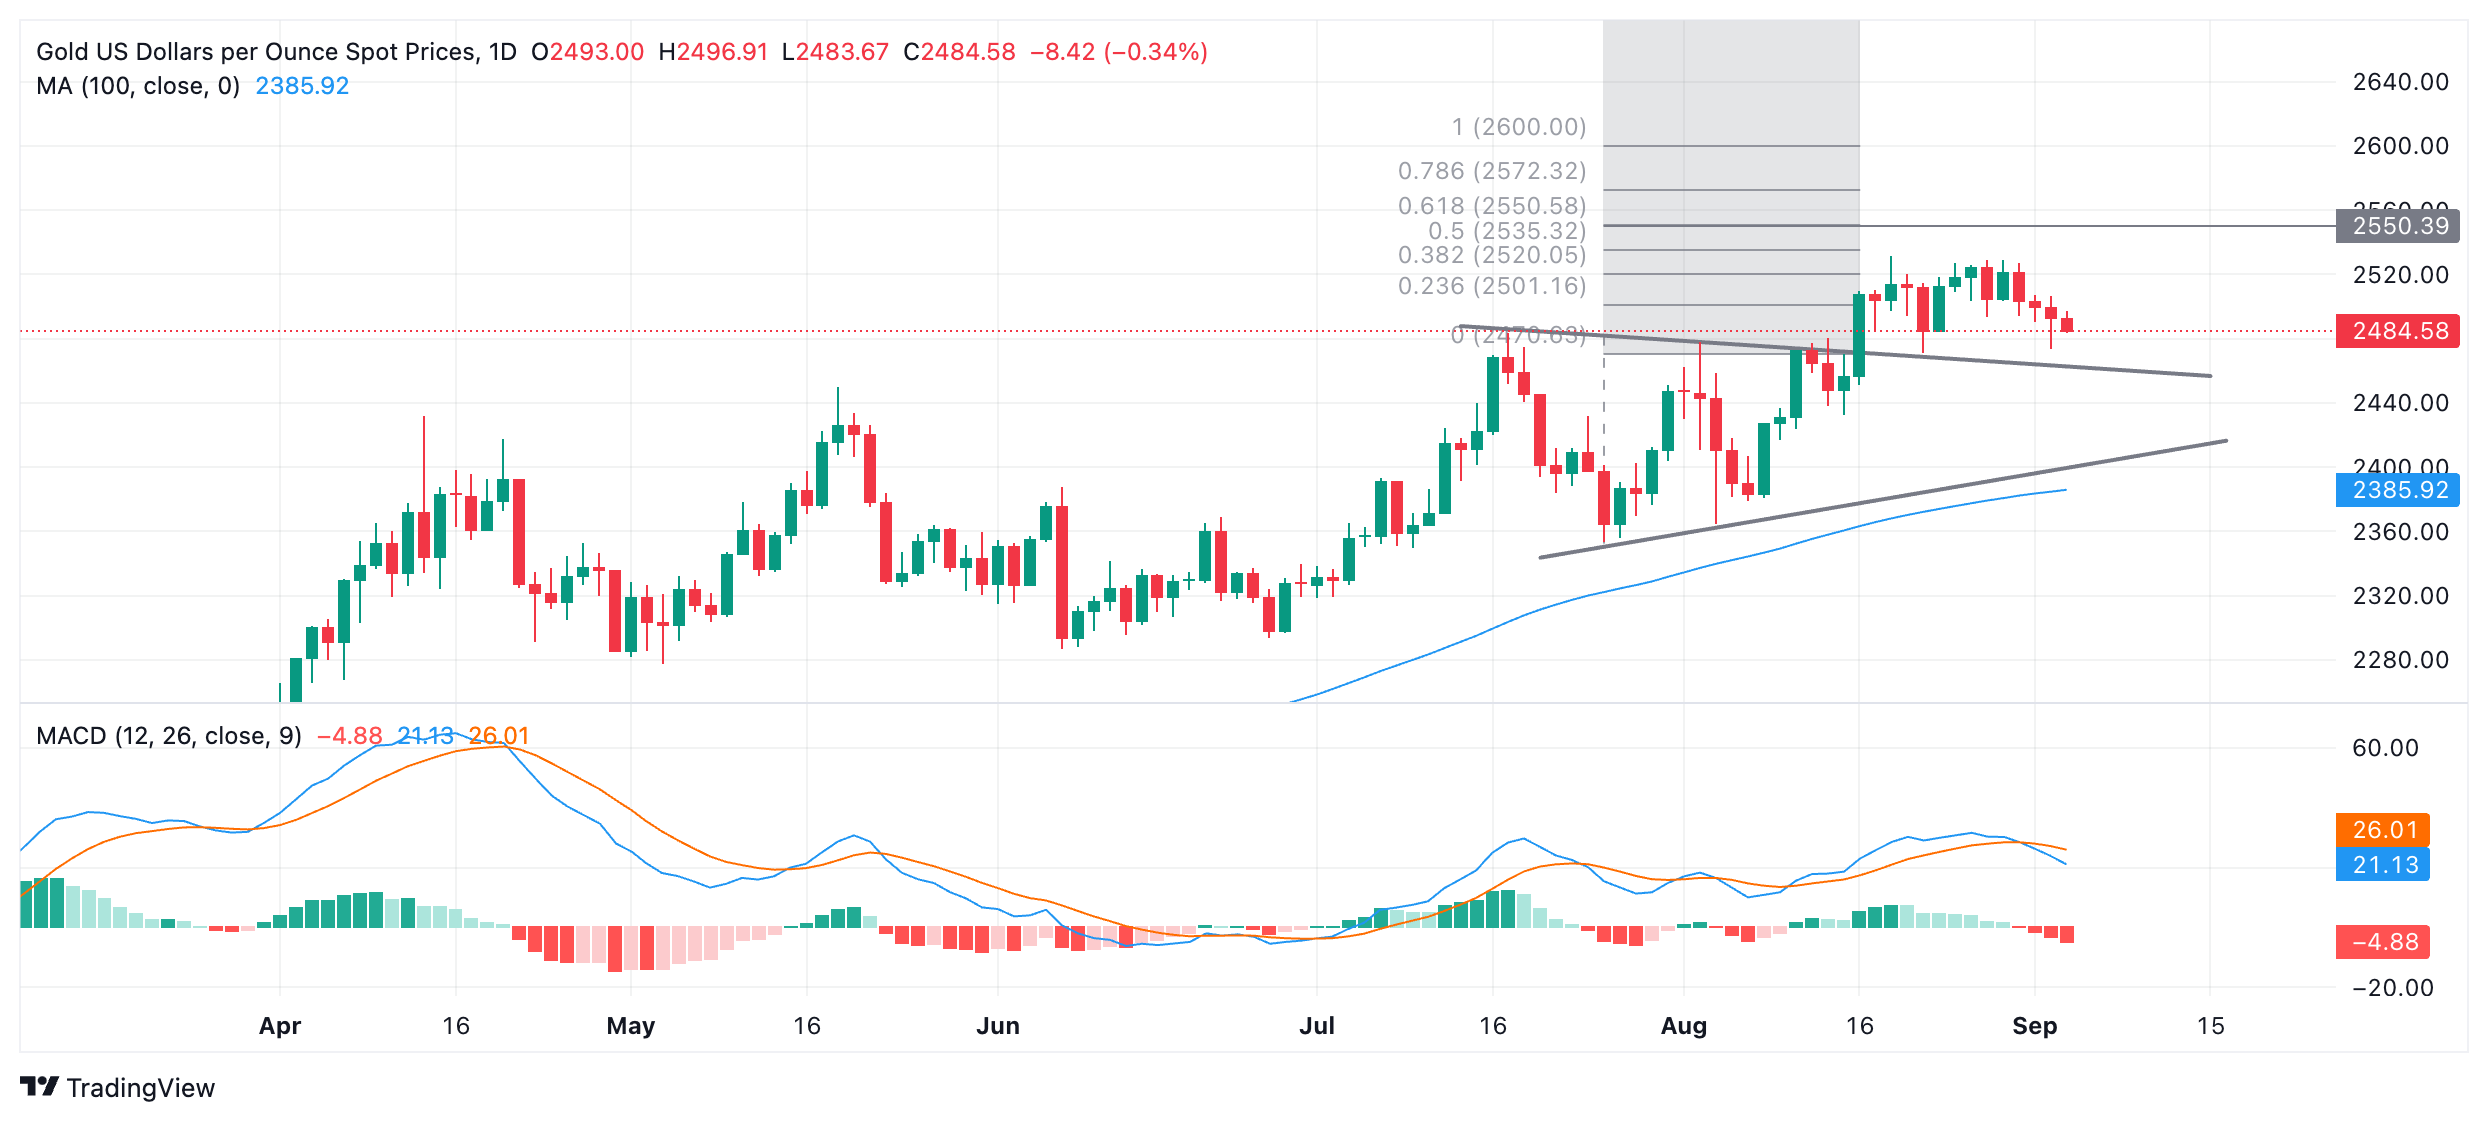
An as yet un-met upside target for Gold sits at $2,550 and remains active. This was generated after the original breakout from the July-August range on August 14.
Gold’s medium and long-term trends also remain bullish, which, given “the trend is your friend,” means the odds still favor an eventual breakout higher materializing.
A break above the August 20 all-time high of $2,531 would provide more confirmation of a continuation higher toward the $2,550 target.
If Gold continues steadily weakening, however, it is likely to next find support at the $2,470-$2,460 level. A decisive break below that level would change the picture for Gold and suggest that the commodity might be starting a more pronounced downtrend.
Economic Indicator
JOLTS Job Openings
JOLTS Job Openings is a survey done by the US Bureau of Labor Statistics to help measure job vacancies. It collects data from employers including retailers, manufacturers and different offices each month.
Read more.Next release: Wed Sep 04, 2024 14:00
Frequency: Monthly
Consensus: 8.1M
Previous: 8.184M
Source: US Bureau of Labor Statistics
- Bank of Canada (BoC) is seen reducing its policy rate to 4.25%.
- Canadian Dollar started the month on the back foot vs. the US Dollar.
- Headline inflation in Canada dropped further in July.
- Swaps markets see around 36 bps of easing this week.
There is widespread expectation that the Bank of Canada (BoC) will lower its policy rate for the third consecutive meeting on September 4. Mirroring previous decisions by the central bank, this move would most likely be of 25 basis points, taking the benchmark interest rate to 4.25%.
Since the year began, the Canadian Dollar (CAD) has been weakening against the US Dollar (USD), taking USD/CAD to fresh highs near 1.3950 in early August. Since then, however, the Canadian currency has started a period of sharp appreciation, dragging the pair around 5 cents lower by the epilogue of the previous month.
In July, the annual rate of domestic inflation, as measured by the headline Consumer Price Index (CPI), declined further to 2.5% vs. the same month in 2023, and the BoC's core CPI fell further below the 2.0% target, recording a 1.7% increase over the last twelve months. The expected rate cut by the central bank seems linked to the ongoing decrease in consumer prices and anticipated further easing in the Canadian labour market.
Inflation has stayed under 3% since January, aligning with the central bank's forecast for the first half of 2024, with key core consumer price metrics also showing a consistent decrease. Additionally, the BoC is likely to continue basing its future rate decisions on economic data. Current swaps markets suggest around 36 basis points of easing in September.
The BoC could maintain its dovish narrative
Despite the anticipated rate cut, the central bank's overall stance is expected to lean towards the bearish side, particularly against the backdrop of declining inflation (which suggests that the headline CPI could hit the bank’s target anytime soon) and growing slack in the labour market.
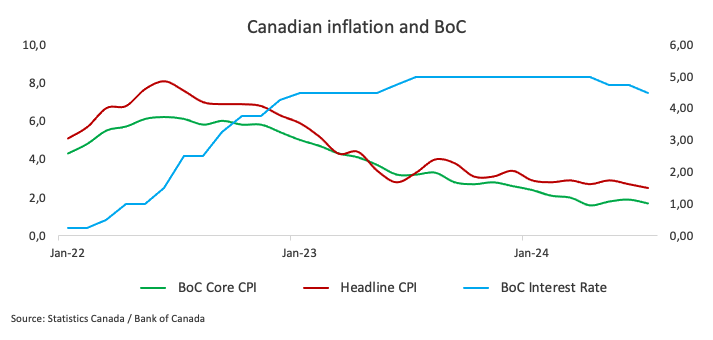
Following the rate cut in July, BoC Governor Tiff Macklem argued that the economy is experiencing excess supply, with slack in the labour market contributing to downward pressure on inflation. He explained that their assessment indicates there is already enough excess supply in the economy, and the necessary conditions are increasingly in place to bring inflation back to the 2% target. He also emphasized that rather than needing more excess supply, there is a need for growth and job creation to start picking up to absorb the excess supply and achieve a sustainable return to the inflation target.
Macklem added that the central bank aims to balance the risks on both sides, expressing a determination to bring inflation back to 2% without excessively weakening the economy and causing inflation to fall below the target. He noted that these considerations would be weighed carefully moving forward, and decisions would be made one meeting at a time.
In light of the upcoming interest rate decision by the BoC, Taylor Schleich and Warren Lovely at the National Bank of Canada said:
“The Bank of Canada is set to lower the target for the overnight rate by 25 basis points on Wednesday, the third such move in as many meetings. The only data point that had the potential to derail a cut — the July CPI report — offered encouraging news on the core inflation front, allowing policymakers to ease without controversy.
“Meanwhile, even though the July employment report revealed an unchanged unemployment rate, the labour market outlook remains challenged. Consensus expectations for the unemployment rate (and those implied by the Bank of Canada’s rosy growth projections) are too optimistic, and we still see the jobless rate hitting ~7% by year-end.”
When will the BoC release its monetary policy decision, and how could it affect USD/CAD?
The Bank of Canada will announce its policy decision at 13:45 GMT on Wednesday, September 4, followed by Governor Macklem’s press conference at 14:30 GMT.
Eliminating any potential surprises, the impact on the Canadian currency is expected to come mainly from the message of the bank rather than the move on the interest rate per se. Taking a conservative approach may result in more support for CAD and a subsequent dip in USD/CAD. If the bank indicates that it intends to decrease interest rates further, the Canadian Dollar may suffer and open the door to further gains in USD/CAD.
According to Pablo Piovano, Senior Analyst at FXStreet.com, "USD/CAD has been on a strong downward path since the beginning of August, taking spot to monthly lows near 1.3640 last week. The rebound since then came mainly on the back of the recovery in the US Dollar (USD), prompting the pair to reclaim the 1.3500 barrier and beyond so far.
Pablo adds:
“The immediate target emerges at the 200-day SMA, currently at 1.3589. Once this region is cleared, the pair might revisit the 1.3665-1.3680 band, where the interim 55-day and 100-day SMAs converge. Further up, there are no resistance levels of note until the 2024 peak at 1.3946 recorded on August 6.
“If bears regain the initiative, USD/CAD might revisit its August low of 1.3436 (August 28) prior to the March low of 1.3419 (March 8). A deeper decline beyond the latter exposes a move to the December 2023 bottom of 1.3177 (December 27)”, Pablo concludes.
Economic Indicator
BoC Interest Rate Decision
The Bank of Canada (BoC) announces its interest rate decision at the end of its eight scheduled meetings per year. If the BoC believes inflation will be above target (hawkish), it will raise interest rates in order to bring it down. This is bullish for the CAD since higher interest rates attract greater inflows of foreign capital. Likewise, if the BoC sees inflation falling below target (dovish) it will lower interest rates in order to give the Canadian economy a boost in the hope inflation will rise back up. This is bearish for CAD since it detracts from foreign capital flowing into the country.
Read more.Last release: Wed Jul 24, 2024 13:45
Frequency: Irregular
Actual: 4.5%
Consensus: 4.5%
Previous: 4.75%
Source: Bank of Canada
Canadian Dollar FAQs
The key factors driving the Canadian Dollar (CAD) are the level of interest rates set by the Bank of Canada (BoC), the price of Oil, Canada’s largest export, the health of its economy, inflation and the Trade Balance, which is the difference between the value of Canada’s exports versus its imports. Other factors include market sentiment – whether investors are taking on more risky assets (risk-on) or seeking safe-havens (risk-off) – with risk-on being CAD-positive. As its largest trading partner, the health of the US economy is also a key factor influencing the Canadian Dollar.
The Bank of Canada (BoC) has a significant influence on the Canadian Dollar by setting the level of interest rates that banks can lend to one another. This influences the level of interest rates for everyone. The main goal of the BoC is to maintain inflation at 1-3% by adjusting interest rates up or down. Relatively higher interest rates tend to be positive for the CAD. The Bank of Canada can also use quantitative easing and tightening to influence credit conditions, with the former CAD-negative and the latter CAD-positive.
The price of Oil is a key factor impacting the value of the Canadian Dollar. Petroleum is Canada’s biggest export, so Oil price tends to have an immediate impact on the CAD value. Generally, if Oil price rises CAD also goes up, as aggregate demand for the currency increases. The opposite is the case if the price of Oil falls. Higher Oil prices also tend to result in a greater likelihood of a positive Trade Balance, which is also supportive of the CAD.
While inflation had always traditionally been thought of as a negative factor for a currency since it lowers the value of money, the opposite has actually been the case in modern times with the relaxation of cross-border capital controls. Higher inflation tends to lead central banks to put up interest rates which attracts more capital inflows from global investors seeking a lucrative place to keep their money. This increases demand for the local currency, which in Canada’s case is the Canadian Dollar.
Macroeconomic data releases gauge the health of the economy and can have an impact on the Canadian Dollar. Indicators such as GDP, Manufacturing and Services PMIs, employment, and consumer sentiment surveys can all influence the direction of the CAD. A strong economy is good for the Canadian Dollar. Not only does it attract more foreign investment but it may encourage the Bank of Canada to put up interest rates, leading to a stronger currency. If economic data is weak, however, the CAD is likely to fall.
- EUR/USD finds a temporary cushion near 1.1030 amid a slight correction in the US Dollar.
- The US Dollar falls as the US ISM Manufacturing PMI data signaled a contraction in activity for the fifth month in a row.
- Investors await the US JOLTS Job Openings data for July.
EUR/USD discovers buying interest in Wednesday’s European session after posting a fresh two-week low near 1.1025 on Tuesday. The major currency pair edges higher as the US Dollar (USD) corrects after the release of the United States (US) ISM Manufacturing PMI data for August. The US Dollar Index (DXY), which tracks the Greenback’s value against six major currencies, falls to near 101.60 after failing to reclaim a two-week high of 102.00.
The ISM Manufacturing PMI, released on Tuesday, came in at 47.2, missing estimates of 47.5 but improving from an eight-month low of 46.8. Despite the slight improvement, markets considered that the overall trend points to a slowdown as a figure below 50.0 suggests a contraction in manufacturing activity.
Amid a data-heavy week, investors keenly await the US Nonfarm Payrolls (NFP) data for August, which will be published on Friday. The official labor market data will shape the Federal Reserve’s (Fed) interest rate cut path for September. Investors seem to be confident that the Fed will start reducing its key borrowing rates this month, but are divided over the size of this potential rate cut.
The importance of the labor market data has increased significantly after the commentary from Fed Chair Jerome Powell at the Jackson Hole (JH) Symposium, who signalled that the central bank is very much concerned about weakening labor demand.
For more insights on the current labor market status, investors will also focus on the US JOLTS Job Opening data for July and the ADP Employment Change data for August, which will be published at 14:00 GMT and on Thursday, respectively.
The US JOLTS Job Openings report is expected to show that employers posted 8.1 million fresh job vacancies, marginally lower than the 8.184 million a month earlier.
Daily digest market movers: EUR/USD edges higher as US Dollar corrects
- EUR/USD recovers slightly in European trading hours amid a gradual correction in the US Dollar. The Euro’s (EUR) near-term outlook remains downbeat as market participants expect that the European Central Bank’s (ECB) policy-easing cycle could be aggressive given the steep decline in Eurozone inflationary pressures and weak economic growth.
- Economists at Bank of America (BofA) said in their latest report about the Eurozone: "We still see more cuts in 2025/26 than the markets are pricing, with a return to a deposit rate of 2% by 3Q25 (at the latest) and to 1.5% in 2026." BofA said that Europe's recovery remains fragile and it will likely be shallow, pressured by several economic factors such as slowing growth in China as well as politics.
- ECB officials also remain worried about increasing risks to Eurozone economic growth. ECB Executive board member Piero Cipollone said in an interview with a French newspaper said that there is a real risk that our stance could become too restrictive," adding that, "we must ensure that inflation converges to our target without holding back the economy unnecessarily," Reuters reported.
- On the economic front, investors await the Eurozone Retail Sales data for July, which will be published on Thursday. Economists estimate the Retail Sales to have grown by 0.1% after contracting 0.3% in June on a monthly as well as an annual basis. A slight improvement in sales at retail stores would be insufficient to dampen market speculation that the ECB will resume its policy-easing cycle this month, which it started in June, after pausing in July.
- In today’s session, investors will focus on the Eurozone Producer Price Index (PPI) data for July,w which will be published at 09:00 GMT. The PPI report is expected to show that prices of goods and services at factory gates were deflated at a slower pace of 2.5% from 3.2% in June. A sharp deflation in producer prices indicates a sharp slowdown in the overall demand. This would prompt expectations of ECB rate cuts in September.
Technical Analysis: EUR/USD strives for firm footing near 20-day EMA
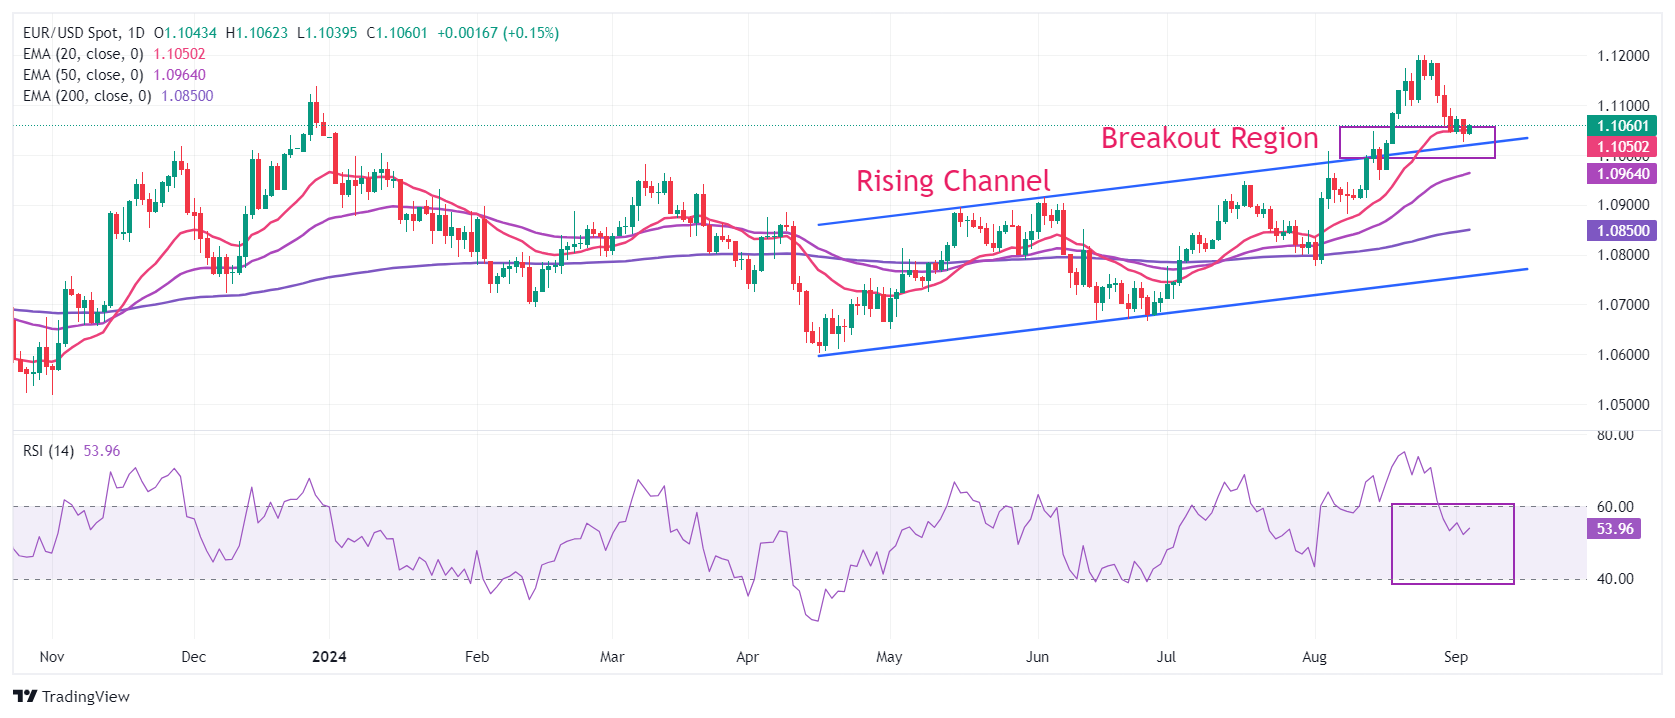
EUR/USD recovers slightly after posting a fresh two-week low near 1.1025. The near-term outlook of the major currency pair is uncertain as it struggles to gain firm footing near the 20-day Exponential Moving Average (EMA) around 1.1020.
The longer-term outlook is still bullish as the 50-day and 200-day EMAs at 1.0964 and 1.0850, respectively, are sloping higher. Also, the shared currency pair holds the Rising Channel breakout on a daily time frame.
The 14-day Relative Strength Index (RSI) has declined below 60.00 after turning overbought near 75.00.
On the upside, the recent high of 1.1200 and the July 2023 high at 1.1275 will be the next stop for the Euro bulls. Meanwhile, the downside is expected to remain cushioned near the psychological support of 1.1000.
Euro FAQs
The Euro is the currency for the 20 European Union countries that belong to the Eurozone. It is the second most heavily traded currency in the world behind the US Dollar. In 2022, it accounted for 31% of all foreign exchange transactions, with an average daily turnover of over $2.2 trillion a day. EUR/USD is the most heavily traded currency pair in the world, accounting for an estimated 30% off all transactions, followed by EUR/JPY (4%), EUR/GBP (3%) and EUR/AUD (2%).
The European Central Bank (ECB) in Frankfurt, Germany, is the reserve bank for the Eurozone. The ECB sets interest rates and manages monetary policy. The ECB’s primary mandate is to maintain price stability, which means either controlling inflation or stimulating growth. Its primary tool is the raising or lowering of interest rates. Relatively high interest rates – or the expectation of higher rates – will usually benefit the Euro and vice versa. The ECB Governing Council makes monetary policy decisions at meetings held eight times a year. Decisions are made by heads of the Eurozone national banks and six permanent members, including the President of the ECB, Christine Lagarde.
Eurozone inflation data, measured by the Harmonized Index of Consumer Prices (HICP), is an important econometric for the Euro. If inflation rises more than expected, especially if above the ECB’s 2% target, it obliges the ECB to raise interest rates to bring it back under control. Relatively high interest rates compared to its counterparts will usually benefit the Euro, as it makes the region more attractive as a place for global investors to park their money.
Data releases gauge the health of the economy and can impact on the Euro. Indicators such as GDP, Manufacturing and Services PMIs, employment, and consumer sentiment surveys can all influence the direction of the single currency. A strong economy is good for the Euro. Not only does it attract more foreign investment but it may encourage the ECB to put up interest rates, which will directly strengthen the Euro. Otherwise, if economic data is weak, the Euro is likely to fall. Economic data for the four largest economies in the euro area (Germany, France, Italy and Spain) are especially significant, as they account for 75% of the Eurozone’s economy.
Another significant data release for the Euro is the Trade Balance. This indicator measures the difference between what a country earns from its exports and what it spends on imports over a given period. If a country produces highly sought after exports then its currency will gain in value purely from the extra demand created from foreign buyers seeking to purchase these goods. Therefore, a positive net Trade Balance strengthens a currency and vice versa for a negative balance.
Here is what you need to know on Wednesday, September 4:
Major currency pairs continue to trade within familiar ranges early Wednesday as markets await the next catalyst. Eurostat will release Producer Price Index (PPI) data for July in the European session. In the second half of the day, July Goods Trade Balance, Factory Orders and JOLTS Job Openings data will be featured in the US economic docket. During the American trading hours, the Bank of Canada (BoC) will announce monetary policy decisions and the Federal Reserve will release its Beige Book later in the session.
The data from Australia showed in the Asian session that the country's Gross Domestic Product expanded at an annual rate of 1% in the second quarter, matching the market expectation. Meanwhile, Caixin Services PMI in China edged slightly lower to 51.6 in August from 52.1 in July. Following Tuesday's sharp decline, AUD/USD holds steady at around 0.6700 early Wednesday.
The BoC is forecast to lower the policy rate by 25 basis points (bps) to 4.25% following the September policy meeting. USD/CAD rose 0.4% on Tuesday and closed the fifth consecutive trading day in positive territory. The pair stays in a consolidation phase slightly below 1.3550 in the European morning.
US Dollar PRICE This week
The table below shows the percentage change of US Dollar (USD) against listed major currencies this week. US Dollar was the strongest against the New Zealand Dollar.
| USD | EUR | GBP | JPY | CAD | AUD | NZD | CHF | |
|---|---|---|---|---|---|---|---|---|
| USD | -0.10% | 0.11% | -0.83% | 0.40% | 0.82% | 0.98% | -0.13% | |
| EUR | 0.10% | 0.23% | -0.74% | 0.47% | 0.92% | 1.07% | -0.05% | |
| GBP | -0.11% | -0.23% | -0.97% | 0.23% | 0.66% | 0.87% | -0.30% | |
| JPY | 0.83% | 0.74% | 0.97% | 1.18% | 1.68% | 1.94% | 0.62% | |
| CAD | -0.40% | -0.47% | -0.23% | -1.18% | 0.46% | 0.58% | -0.53% | |
| AUD | -0.82% | -0.92% | -0.66% | -1.68% | -0.46% | 0.14% | -0.96% | |
| NZD | -0.98% | -1.07% | -0.87% | -1.94% | -0.58% | -0.14% | -1.11% | |
| CHF | 0.13% | 0.05% | 0.30% | -0.62% | 0.53% | 0.96% | 1.11% |
The heat map shows percentage changes of major currencies against each other. The base currency is picked from the left column, while the quote currency is picked from the top row. For example, if you pick the US Dollar from the left column and move along the horizontal line to the Japanese Yen, the percentage change displayed in the box will represent USD (base)/JPY (quote).
The US Dollar (USD) Index touched its highest level since August 20 at 101.91 on Tuesday but erased a portion of its gains to close the day marginally higher. The index holds above 101.50 early Wednesday and the benchmark 10-year US Treasury bond yield stays near 3.8% after falling over 2% on Tuesday. Meanwhile, US stock index futures were last seen losing between 0.4% and 0.8%.
EUR/USD edged lower on Tuesday but managed to recover above 1.1050 on Wednesday. Monthly PPI in the Euro area is forecast to rise 0.3% in August.
GBP/USD registered small losses on Tuesday. The pair holds steady slightly above 1.3100 in the European session.
USD/JPY turned south and snapped a four-day winning streak on Tuesday. The pair stays under bearish pressure early Wednesday and trades at around 145.00.
After failing to stabilize above $2,500, Gold closed in negative territory on Tuesday. XAU/USD continues to stretch lower early Wednesday and was last seen trading below $2,490.
Bank of Canada FAQs
The Bank of Canada (BoC), based in Ottawa, is the institution that sets interest rates and manages monetary policy for Canada. It does so at eight scheduled meetings a year and ad hoc emergency meetings that are held as required. The BoC primary mandate is to maintain price stability, which means keeping inflation at between 1-3%. Its main tool for achieving this is by raising or lowering interest rates. Relatively high interest rates will usually result in a stronger Canadian Dollar (CAD) and vice versa. Other tools used include quantitative easing and tightening.
In extreme situations, the Bank of Canada can enact a policy tool called Quantitative Easing. QE is the process by which the BoC prints Canadian Dollars for the purpose of buying assets – usually government or corporate bonds – from financial institutions. QE usually results in a weaker CAD. QE is a last resort when simply lowering interest rates is unlikely to achieve the objective of price stability. The Bank of Canada used the measure during the Great Financial Crisis of 2009-11 when credit froze after banks lost faith in each other’s ability to repay debts.
Quantitative tightening (QT) is the reverse of QE. It is undertaken after QE when an economic recovery is underway and inflation starts rising. Whilst in QE the Bank of Canada purchases government and corporate bonds from financial institutions to provide them with liquidity, in QT the BoC stops buying more assets, and stops reinvesting the principal maturing on the bonds it already holds. It is usually positive (or bullish) for the Canadian Dollar.
- USD/CHF loses ground as traders adopt caution ahead of key economic data from the United States.
- The US Dollar faces challenges as US Treasury yields extend losses amid rising odds of a Fed rate cut.
- Swiss Consumer Price Index eased to 1.1% YoY in August, down from July’s 1.3% and below market expectations of 1.2%.
USD/CHF trades around 0.8480 during the early hours on Wednesday, extending losses for the second successive session. Traders adopt caution ahead of key economic data due this week, including the ISM Services PMI and Nonfarm Payrolls (NFP). This data could shed light on the potential size of an expected rate cut by the Fed this month. Furthermore, the Fed Beige Book and JOLTS Job Openings will be eyed later in the North American hours.
The Greenback depreciates due to lower Treasury yields. The US Dollar Index (DXY), which measures the value of the US Dollar (USD) against its six major peers, trades around 101.60 with 2-year and 10-year yields on US Treasury bonds standing at 3.86% and 3.83%, respectively, at the time of writing.
However, the Greenback received support after the release of the ISM Manufacturing PMI. The index inched up to 47.2 in August from 46.8 in July, falling short of market expectations of 47.5. This marks the 21st contraction in US factory activity over the past 22 months.
In Switzerland, the Swiss Federal Statistical Office released data on Tuesday, showing that the Consumer Price Index eased to 1.1% year-on-year in August, down from July’s 1.3% and below market expectations of 1.2%. Meanwhile, the CPI (MoM) reported no change at 0.0%, against the 0.1% rise in August.
Additionally, Switzerland's Gross Domestic Product (GDP) grew by 0.7% quarter-on-quarter in the second quarter, beating market forecasts and previous period's 0.5% gain. This marked the fastest economic expansion since the second quarter of 2022. Meanwhile, annual GDP rose 1.8% for Q2, following the previous increase of 0.6%.
Swiss Franc FAQs
The Swiss Franc (CHF) is Switzerland’s official currency. It is among the top ten most traded currencies globally, reaching volumes that well exceed the size of the Swiss economy. Its value is determined by the broad market sentiment, the country’s economic health or action taken by the Swiss National Bank (SNB), among other factors. Between 2011 and 2015, the Swiss Franc was pegged to the Euro (EUR). The peg was abruptly removed, resulting in a more than 20% increase in the Franc’s value, causing a turmoil in markets. Even though the peg isn’t in force anymore, CHF fortunes tend to be highly correlated with the Euro ones due to the high dependency of the Swiss economy on the neighboring Eurozone.
The Swiss Franc (CHF) is considered a safe-haven asset, or a currency that investors tend to buy in times of market stress. This is due to the perceived status of Switzerland in the world: a stable economy, a strong export sector, big central bank reserves or a longstanding political stance towards neutrality in global conflicts make the country’s currency a good choice for investors fleeing from risks. Turbulent times are likely to strengthen CHF value against other currencies that are seen as more risky to invest in.
The Swiss National Bank (SNB) meets four times a year – once every quarter, less than other major central banks – to decide on monetary policy. The bank aims for an annual inflation rate of less than 2%. When inflation is above target or forecasted to be above target in the foreseeable future, the bank will attempt to tame price growth by raising its policy rate. Higher interest rates are generally positive for the Swiss Franc (CHF) as they lead to higher yields, making the country a more attractive place for investors. On the contrary, lower interest rates tend to weaken CHF.
Macroeconomic data releases in Switzerland are key to assessing the state of the economy and can impact the Swiss Franc’s (CHF) valuation. The Swiss economy is broadly stable, but any sudden change in economic growth, inflation, current account or the central bank’s currency reserves have the potential to trigger moves in CHF. Generally, high economic growth, low unemployment and high confidence are good for CHF. Conversely, if economic data points to weakening momentum, CHF is likely to depreciate.
As a small and open economy, Switzerland is heavily dependent on the health of the neighboring Eurozone economies. The broader European Union is Switzerland’s main economic partner and a key political ally, so macroeconomic and monetary policy stability in the Eurozone is essential for Switzerland and, thus, for the Swiss Franc (CHF). With such dependency, some models suggest that the correlation between the fortunes of the Euro (EUR) and the CHF is more than 90%, or close to perfect.
- Silver price loses ground for the fourth consecutive day around $27.90 in Wednesday’s early European session, down 0.55% on the day.
- Stronger USD and Chinese demand concerns undermine Silver, while rising Fed rate cut bets might help limit its losses.
- The US August Nonfarm Payrolls report will take center stage on Friday.
Silver price (XAG/USD) faces some selling pressure near $27.90 on Wednesday during the early European trading hours. The renewed US Dollar (USD) demand weighs on the USD-denominated Silver price. Traders will take more cues from the highly-anticipated US Nonfarm Payrolls (NFP) on Friday, which might influence the white metal price.
China’s service activity growth slowed in August despite the summer travel peak. The Chinese Caixin Services Purchasing Managers' Index (PMI) dropped to 51.6 in August from 52.1 in July, weaker than the estimation of 52.2. This report and another PMI report on the weekend added concerns about the economic slowdown and deterioration of demand in China, which exert some selling pressure on the Silver price as China is the top silver exporter globally.
The imminent Federal Reserve (Fed) rate cuts might underpin the precious metal in the near term as it makes Silver cheaper for most buyers. The markets are now pricing in nearly 61% possibility of a 25 basis points (bps) rate cut by the Fed in September, while the chance of a 50 bps reduction stands at 39%, according to the CME FedWatch tool.
The US August Nonfarm Payrolls (NFP) report on Friday will be more significant than usual and might offer some hints about the size and pace of the Fed rate cut. The US economy is expected to see 163K job additions in August, while the Unemployment Rate is expected to tick lower to 4.2%. In case of the weaker-than-expected reading, this might prompt speculation of the looming US recession and deeper rate cuts, which could boost the Silver price.
Silver FAQs
Silver is a precious metal highly traded among investors. It has been historically used as a store of value and a medium of exchange. Although less popular than Gold, traders may turn to Silver to diversify their investment portfolio, for its intrinsic value or as a potential hedge during high-inflation periods. Investors can buy physical Silver, in coins or in bars, or trade it through vehicles such as Exchange Traded Funds, which track its price on international markets.
Silver prices can move due to a wide range of factors. Geopolitical instability or fears of a deep recession can make Silver price escalate due to its safe-haven status, although to a lesser extent than Gold's. As a yieldless asset, Silver tends to rise with lower interest rates. Its moves also depend on how the US Dollar (USD) behaves as the asset is priced in dollars (XAG/USD). A strong Dollar tends to keep the price of Silver at bay, whereas a weaker Dollar is likely to propel prices up. Other factors such as investment demand, mining supply – Silver is much more abundant than Gold – and recycling rates can also affect prices.
Silver is widely used in industry, particularly in sectors such as electronics or solar energy, as it has one of the highest electric conductivity of all metals – more than Copper and Gold. A surge in demand can increase prices, while a decline tends to lower them. Dynamics in the US, Chinese and Indian economies can also contribute to price swings: for the US and particularly China, their big industrial sectors use Silver in various processes; in India, consumers’ demand for the precious metal for jewellery also plays a key role in setting prices.
Silver prices tend to follow Gold's moves. When Gold prices rise, Silver typically follows suit, as their status as safe-haven assets is similar. The Gold/Silver ratio, which shows the number of ounces of Silver needed to equal the value of one ounce of Gold, may help to determine the relative valuation between both metals. Some investors may consider a high ratio as an indicator that Silver is undervalued, or Gold is overvalued. On the contrary, a low ratio might suggest that Gold is undervalued relative to Silver.
FX option expiries for Sept 4 NY cut at 10:00 Eastern Time, via DTCC, can be found below.
EUR/USD: EUR amounts
- 1.0925 683m
- 1.0935 668m
- 1.0950 1.1b
- 1.1000 658m
- 1.1020 877m
- 1.1055 751m
- 1.1100 831m
- 1.1200 1.2b
USD/JPY: USD amounts
- 145.00 987m
- 146.35 940m
- 147.00 605m
AUD/USD: AUD amounts
- 0.6505 586m
- 0.6565 707m
- 0.6740 720m
USD/CAD: USD amounts
- 1.3515 2b
- 1.3700 805m
- GBP/USD trades steady around 1.3110 in Wednesday’s early European session.
- US ISM Manufacturing PMI was weaker-than-expected in August.
- Investors expect the BoE to leave interest rates unchanged in September.
The GBP/USD pair flat lines near 1.3110 during the early European session on Wednesday. However, the risk-off sentiment ahead of the key US events could provide some support to the US Dollar (USD) and drag the major pair lower. The US JOLTS Job Openings and Fed Beige Book are due later on Wednesday.
Data released by the Institute for Supply Management (ISM) on Tuesday revealed that the Manufacturing PMI rose slightly to 47.2 in August from 46.8 in July. This figure came in below the market consensus of 47.5.
According to the CME FedWatch tool, which acts as a barometer for the market's expectation of the Fed funds target rate, the chance of the Federal Reserve (Fed) cutting rates by 25 basis points (bps) at the September meeting is 61%, while the odds of the Fed cutting rates by 50 bps are 39%.
The Fed Chair Jerome Powell said last month that the "time has come" for monetary policy to adjust, signaling that the US central bank will likely start easing monetary policy at its upcoming meeting scheduled for September 17-18. The firmer Fed rate cut bets might weigh on the USD in the near term.
The US August employment data will be in the spotlight on Friday. Deutsche Bank economists suggested that a rise in Unemployment Rate could reinforce market expectations for a 50 bps rate cut by the Fed.
On the other hand, the cautious mood continues to underpin the Greenback for the time being, although the Bank of England (BoE) is expected to follow a shallow interest rate cut cycle this year compared to its peer central bankers. GBP/USD will likely be influenced by USD price dynamics, given there are no top-tier economic data releases from the UK.
Pound Sterling FAQs
The Pound Sterling (GBP) is the oldest currency in the world (886 AD) and the official currency of the United Kingdom. It is the fourth most traded unit for foreign exchange (FX) in the world, accounting for 12% of all transactions, averaging $630 billion a day, according to 2022 data. Its key trading pairs are GBP/USD, aka ‘Cable’, which accounts for 11% of FX, GBP/JPY, or the ‘Dragon’ as it is known by traders (3%), and EUR/GBP (2%). The Pound Sterling is issued by the Bank of England (BoE).
The single most important factor influencing the value of the Pound Sterling is monetary policy decided by the Bank of England. The BoE bases its decisions on whether it has achieved its primary goal of “price stability” – a steady inflation rate of around 2%. Its primary tool for achieving this is the adjustment of interest rates. When inflation is too high, the BoE will try to rein it in by raising interest rates, making it more expensive for people and businesses to access credit. This is generally positive for GBP, as higher interest rates make the UK a more attractive place for global investors to park their money. When inflation falls too low it is a sign economic growth is slowing. In this scenario, the BoE will consider lowering interest rates to cheapen credit so businesses will borrow more to invest in growth-generating projects.
Data releases gauge the health of the economy and can impact the value of the Pound Sterling. Indicators such as GDP, Manufacturing and Services PMIs, and employment can all influence the direction of the GBP. A strong economy is good for Sterling. Not only does it attract more foreign investment but it may encourage the BoE to put up interest rates, which will directly strengthen GBP. Otherwise, if economic data is weak, the Pound Sterling is likely to fall.
Another significant data release for the Pound Sterling is the Trade Balance. This indicator measures the difference between what a country earns from its exports and what it spends on imports over a given period. If a country produces highly sought-after exports, its currency will benefit purely from the extra demand created from foreign buyers seeking to purchase these goods. Therefore, a positive net Trade Balance strengthens a currency and vice versa for a negative balance.
- NZD/USD extends its losses ahead of key economic data scheduled for release later in the week.
- The decline in the US Treasury yields puts downward pressure on the Greenback.
- The New Zealand Dollar depreciates as China's Services Purchasing Managers' Index fell to 51.6 in August from 52.1 in July.
NZD/USD continues its losing streak for the fourth consecutive day, trading around 0.6180 during the Asian hours on Wednesday. The downside of the NZD/USD pair could be attributed to the cautious stance adopted by market participants ahead of key economic data due this week, including the ISM Services PMI and Nonfarm Payrolls (NFP). This data could shed light on the potential size of an expected rate cut by the Fed this month.
The US Dollar depreciates due to lower Treasury yields. 2-year and 10-year yields on US Treasury bonds stand at 3.86% and 3.83%, respectively, at the time of writing. However, the Greenback received support after the release of the ISM Manufacturing PMI. The index inched up to 47.2 in August from 46.8 in July, falling short of market expectations of 47.5. This marks the 21st contraction in US factory activity over the past 22 months.
The New Zealand Dollar (NZD) faces downward pressure as China's Services Purchasing Managers' Index (PMI) declined to 51.6 in August from 52.1 in July. This drop is significant given the strong trade relationship between China and New Zealand.
Additionally, Bank of America (BoA) has revised its economic growth forecast for China, lowering its 2024 projection to 4.8% from the previous 5.0%. For 2025, the forecast is adjusted to 4.5% growth, while the 2026 outlook remains unchanged at 4.5%.
In August, New Zealand's ANZ Commodity Price Index increased by 2.1%, rebounding from a 1.7% drop in July. In a Bloomberg interview on Wednesday, Martin Foo, Director at S&P Global Ratings, cautioned that “New Zealand’s current account deficit needs to narrow further.” Foo added that while he is broadly comfortable with New Zealand’s sovereign rating outlook, he is “closely watching the country’s large current-account deficit and weak economic growth.”
New Zealand Dollar FAQs
The New Zealand Dollar (NZD), also known as the Kiwi, is a well-known traded currency among investors. Its value is broadly determined by the health of the New Zealand economy and the country’s central bank policy. Still, there are some unique particularities that also can make NZD move. The performance of the Chinese economy tends to move the Kiwi because China is New Zealand’s biggest trading partner. Bad news for the Chinese economy likely means less New Zealand exports to the country, hitting the economy and thus its currency. Another factor moving NZD is dairy prices as the dairy industry is New Zealand’s main export. High dairy prices boost export income, contributing positively to the economy and thus to the NZD.
The Reserve Bank of New Zealand (RBNZ) aims to achieve and maintain an inflation rate between 1% and 3% over the medium term, with a focus to keep it near the 2% mid-point. To this end, the bank sets an appropriate level of interest rates. When inflation is too high, the RBNZ will increase interest rates to cool the economy, but the move will also make bond yields higher, increasing investors’ appeal to invest in the country and thus boosting NZD. On the contrary, lower interest rates tend to weaken NZD. The so-called rate differential, or how rates in New Zealand are or are expected to be compared to the ones set by the US Federal Reserve, can also play a key role in moving the NZD/USD pair.
Macroeconomic data releases in New Zealand are key to assess the state of the economy and can impact the New Zealand Dollar’s (NZD) valuation. A strong economy, based on high economic growth, low unemployment and high confidence is good for NZD. High economic growth attracts foreign investment and may encourage the Reserve Bank of New Zealand to increase interest rates, if this economic strength comes together with elevated inflation. Conversely, if economic data is weak, NZD is likely to depreciate.
The New Zealand Dollar (NZD) tends to strengthen during risk-on periods, or when investors perceive that broader market risks are low and are optimistic about growth. This tends to lead to a more favorable outlook for commodities and so-called ‘commodity currencies’ such as the Kiwi. Conversely, NZD tends to weaken at times of market turbulence or economic uncertainty as investors tend to sell higher-risk assets and flee to the more-stable safe havens.
Gold prices remained broadly unchanged in India on Wednesday, according to data compiled by FXStreet.
The price for Gold stood at 6,735.62 Indian Rupees (INR) per gram, broadly stable compared with the INR 6,729.20 it cost on Tuesday.
The price for Gold was broadly steady at INR 78,563.32 per tola from INR 78,488.07 per tola a day earlier.
| Unit measure | Gold Price in INR |
|---|---|
| 1 Gram | 6,735.62 |
| 10 Grams | 67,357.32 |
| Tola | 78,563.32 |
| Troy Ounce | 209,502.30 |
FXStreet calculates Gold prices in India by adapting international prices (USD/INR) to the local currency and measurement units. Prices are updated daily based on the market rates taken at the time of publication. Prices are just for reference and local rates could diverge slightly.
Gold FAQs
Gold has played a key role in human’s history as it has been widely used as a store of value and medium of exchange. Currently, apart from its shine and usage for jewelry, the precious metal is widely seen as a safe-haven asset, meaning that it is considered a good investment during turbulent times. Gold is also widely seen as a hedge against inflation and against depreciating currencies as it doesn’t rely on any specific issuer or government.
Central banks are the biggest Gold holders. In their aim to support their currencies in turbulent times, central banks tend to diversify their reserves and buy Gold to improve the perceived strength of the economy and the currency. High Gold reserves can be a source of trust for a country’s solvency. Central banks added 1,136 tonnes of Gold worth around $70 billion to their reserves in 2022, according to data from the World Gold Council. This is the highest yearly purchase since records began. Central banks from emerging economies such as China, India and Turkey are quickly increasing their Gold reserves.
Gold has an inverse correlation with the US Dollar and US Treasuries, which are both major reserve and safe-haven assets. When the Dollar depreciates, Gold tends to rise, enabling investors and central banks to diversify their assets in turbulent times. Gold is also inversely correlated with risk assets. A rally in the stock market tends to weaken Gold price, while sell-offs in riskier markets tend to favor the precious metal.
The price can move due to a wide range of factors. Geopolitical instability or fears of a deep recession can quickly make Gold price escalate due to its safe-haven status. As a yield-less asset, Gold tends to rise with lower interest rates, while higher cost of money usually weighs down on the yellow metal. Still, most moves depend on how the US Dollar (USD) behaves as the asset is priced in dollars (XAU/USD). A strong Dollar tends to keep the price of Gold controlled, whereas a weaker Dollar is likely to push Gold prices up.
(An automation tool was used in creating this post.)
- WTI price loses ground due to indications that a political dispute in Libya, may be coming to an end.
- Libya's two legislative bodies agreed to jointly appoint a central bank governor, easing the conflict over Oil revenue.
- Oil prices fell as the Institute for Supply Management showed that US manufacturing remained sluggish.
West Texas Intermediate (WTI) Oil price extends its losses for the second successive day, trading around $69.40 per barrel during the Asian session on Wednesday. The drop in crude Oil prices is driven by the potential resolution of a political dispute that has halted Libyan exports and concerns over slowing global demand growth.
Reuters reported that Libya's two legislative bodies agreed on Tuesday to jointly appoint a central bank governor, potentially easing the conflict over control of the country's Oil revenue that sparked the recent dispute. The potential agreement to restore the Oil supply could result in more than 500,000 barrels per day returning to the market.
Market sentiment was further dampened by data from the Institute for Supply Management, which showed that US manufacturing remained sluggish, despite a slight improvement in August from an eight-month low in July. The US ISM Manufacturing PMI inched up to 47.2 in August from 46.8 in July, falling short of market expectations of 47.5. This marks the 21st contraction in US factory activity over the past 22 months.
The world's biggest crude importer China showed that manufacturing activity fell to a six-month low in August, with factory gate prices dropping significantly. This has prompted Chinese policymakers to push forward with plans to increase stimulus for households.
Additionally, Oil prices are under pressure from the Organization of the Petroleum Exporting Countries and their allies (OPEC+) plans to increase production in the coming quarter. OPEC+ is poised to move forward with a planned increase in Oil output starting in October. Eight OPEC+ members are set to raise production by 180,000 barrels per day (bpd) next month.
WTI Oil FAQs
WTI Oil is a type of Crude Oil sold on international markets. The WTI stands for West Texas Intermediate, one of three major types including Brent and Dubai Crude. WTI is also referred to as “light” and “sweet” because of its relatively low gravity and sulfur content respectively. It is considered a high quality Oil that is easily refined. It is sourced in the United States and distributed via the Cushing hub, which is considered “The Pipeline Crossroads of the World”. It is a benchmark for the Oil market and WTI price is frequently quoted in the media.
Like all assets, supply and demand are the key drivers of WTI Oil price. As such, global growth can be a driver of increased demand and vice versa for weak global growth. Political instability, wars, and sanctions can disrupt supply and impact prices. The decisions of OPEC, a group of major Oil-producing countries, is another key driver of price. The value of the US Dollar influences the price of WTI Crude Oil, since Oil is predominantly traded in US Dollars, thus a weaker US Dollar can make Oil more affordable and vice versa.
The weekly Oil inventory reports published by the American Petroleum Institute (API) and the Energy Information Agency (EIA) impact the price of WTI Oil. Changes in inventories reflect fluctuating supply and demand. If the data shows a drop in inventories it can indicate increased demand, pushing up Oil price. Higher inventories can reflect increased supply, pushing down prices. API’s report is published every Tuesday and EIA’s the day after. Their results are usually similar, falling within 1% of each other 75% of the time. The EIA data is considered more reliable, since it is a government agency.
OPEC (Organization of the Petroleum Exporting Countries) is a group of 13 Oil-producing nations who collectively decide production quotas for member countries at twice-yearly meetings. Their decisions often impact WTI Oil prices. When OPEC decides to lower quotas, it can tighten supply, pushing up Oil prices. When OPEC increases production, it has the opposite effect. OPEC+ refers to an expanded group that includes ten extra non-OPEC members, the most notable of which is Russia.
Martin Foo, Director at S&P Global Ratings warned in a Bloomberg interview on Wednesday that “New Zealand’s (NZ) current account deficit must narrow further.”
Additional quotes
“Broadly comfortable with New Zealand’s sovereign rating outlook.”
“Closely watching NZ large current-account deficit and weak economic growth.”
New Zealand’s current account deficit was 6.8% of the gross domestic product in the 12 months through March ... among the widest of advanced economies, reflecting subdued exports, stronger-than-expected imports and debt servicing costs.”
“Our base case is that it will narrow to something like 5% of GDP over the next couple of years. But if it doesn’t, that’s going to be probably a downside trigger for the rating.”
Market reaction
At the press time, NZD/USD loses 0.11% on the day to trade near 0.6175.
New Zealand Dollar FAQs
The New Zealand Dollar (NZD), also known as the Kiwi, is a well-known traded currency among investors. Its value is broadly determined by the health of the New Zealand economy and the country’s central bank policy. Still, there are some unique particularities that also can make NZD move. The performance of the Chinese economy tends to move the Kiwi because China is New Zealand’s biggest trading partner. Bad news for the Chinese economy likely means less New Zealand exports to the country, hitting the economy and thus its currency. Another factor moving NZD is dairy prices as the dairy industry is New Zealand’s main export. High dairy prices boost export income, contributing positively to the economy and thus to the NZD.
The Reserve Bank of New Zealand (RBNZ) aims to achieve and maintain an inflation rate between 1% and 3% over the medium term, with a focus to keep it near the 2% mid-point. To this end, the bank sets an appropriate level of interest rates. When inflation is too high, the RBNZ will increase interest rates to cool the economy, but the move will also make bond yields higher, increasing investors’ appeal to invest in the country and thus boosting NZD. On the contrary, lower interest rates tend to weaken NZD. The so-called rate differential, or how rates in New Zealand are or are expected to be compared to the ones set by the US Federal Reserve, can also play a key role in moving the NZD/USD pair.
Macroeconomic data releases in New Zealand are key to assess the state of the economy and can impact the New Zealand Dollar’s (NZD) valuation. A strong economy, based on high economic growth, low unemployment and high confidence is good for NZD. High economic growth attracts foreign investment and may encourage the Reserve Bank of New Zealand to increase interest rates, if this economic strength comes together with elevated inflation. Conversely, if economic data is weak, NZD is likely to depreciate.
The New Zealand Dollar (NZD) tends to strengthen during risk-on periods, or when investors perceive that broader market risks are low and are optimistic about growth. This tends to lead to a more favorable outlook for commodities and so-called ‘commodity currencies’ such as the Kiwi. Conversely, NZD tends to weaken at times of market turbulence or economic uncertainty as investors tend to sell higher-risk assets and flee to the more-stable safe havens.
- Indian Rupee trades flat in Wednesday’s Asian trading hours.
- Possible RBI interventions and lower crude oil prices might support the INR, while firmer USD could limit its upside.
- Investors await the HSBC India Services PMI on Wednesday for fresh impetus.
The Indian Rupee (INR) holds steady on Wednesday. Traders remain vigilant for potential interventions from the Reserve Bank of India (RBI) to prevent the INR from breaching the 84 mark, though this has yet to be officially confirmed. Meanwhile, a fall in crude oil prices to the lowest since January might underpin the local currency as India is the world's third-largest oil-consuming and importing nation.
Nonetheless, the renewed demand for the US Dollar (USD) from importers and risk aversion could weigh on the INR and boost the safe-haven currency like the Greenback. Looking ahead, the HSBC India Services Purchasing Managers Index (PMI) is due on Wednesday. On the US docket, JOLTS Job Openings and Fed Beige Book will be published. The attention will shift to the US Nonfarm Payrolls (NFP) for August on Friday, which might offer some hints about the size and pace of rate cuts by the Federal Reserve (Fed) this year.
Daily Digest Market Movers: Indian Rupee remains fragile amid multiple headwinds
- The World Bank has raised India's growth forecast to 7% for the current financial year (FY25), up from an earlier projection of 6.6%.
- The RBI Deputy Governor Michael Patra said India will need rapid economic growth for a decade in order to achieve Prime Minister Narendra Modi’s goal of becoming a developed country by 2047.
- HSBC India Services PMI is expected to improve to 60.4 in August from 60.3 in July.
- The business activity in the US manufacturing sector continued to contract, albeit at a softer pace in August. The US ISM Manufacturing PMI rose to 47.2 in August versus 46.8 prior, weaker than expected.
- Financial markets have priced in around 61% odds of a 25 basis points (bps) rate cut by the Fed in September, while the possibility of a 50 bps reduction stands at 39%, according to the CME FedWatch tool.
Technical Analysis: USD/INR is in consolidative mode, a longer-term bullish outlook remains in play
The Indian Rupee trades weaker on the day. The USD/INR pair remains traded in a consolidative mode in the near term. However, in the longer term, the positive view of the pair prevails as the price is well-supported above the key 100-day Exponential Moving Average (EMA) on the daily timeframe, with the 14-day Relative Strength Index (RSI) standing in bullish territory near 58.0.
The 84.00 psychological figure appears to be a tough nut to crack for USD/INR. A decisive break above this level could pave the way to 84.50.
In the bearish event, the initial support level emerges at 83.84, the low of August 30. A breach of the mentioned level could lead to some downside, possibly dragging the pair lower to the 100-day EMA at 83.62.
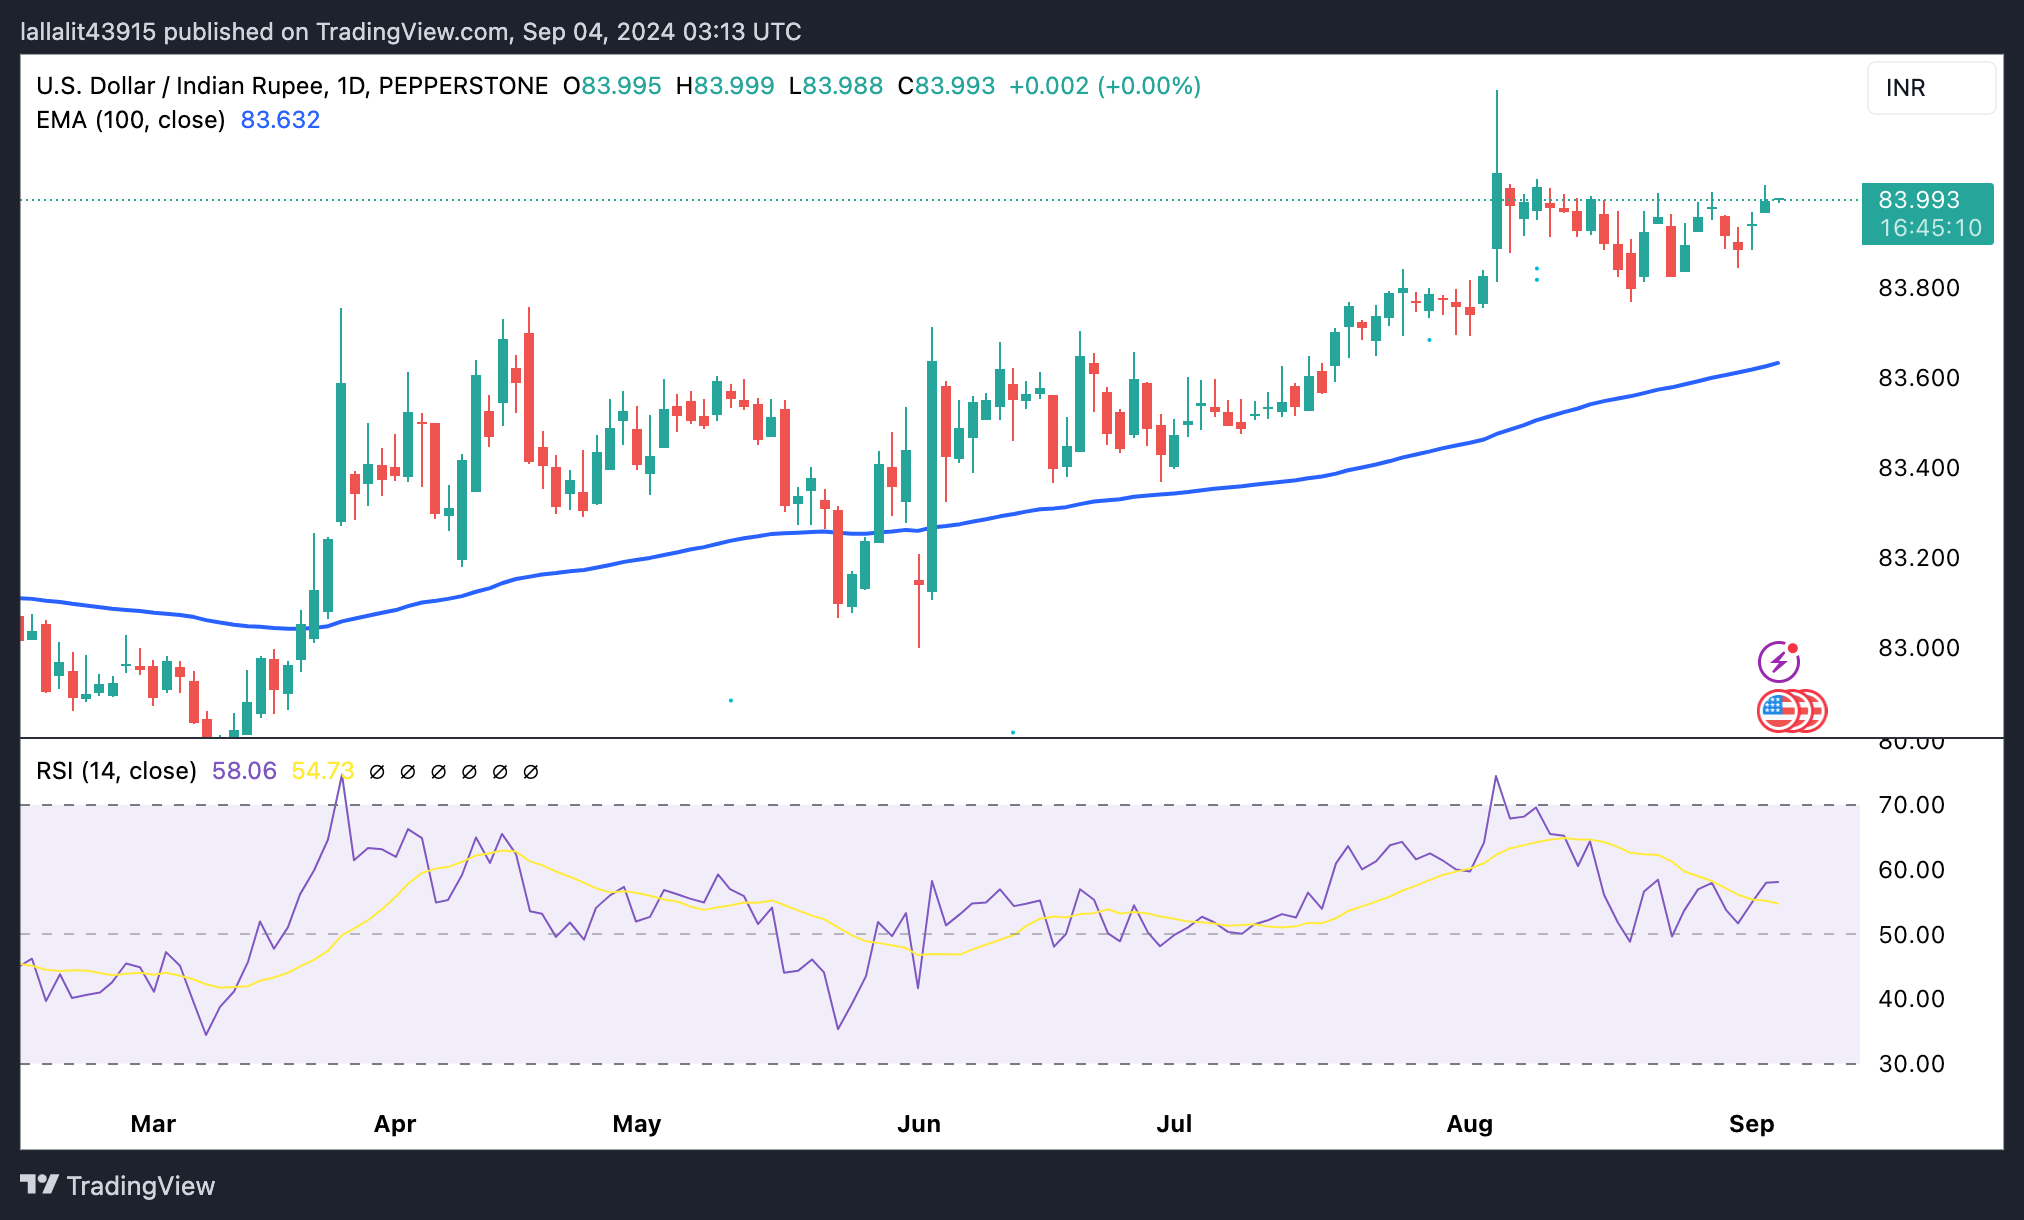
Indian Rupee FAQs
The Indian Rupee (INR) is one of the most sensitive currencies to external factors. The price of Crude Oil (the country is highly dependent on imported Oil), the value of the US Dollar – most trade is conducted in USD – and the level of foreign investment, are all influential. Direct intervention by the Reserve Bank of India (RBI) in FX markets to keep the exchange rate stable, as well as the level of interest rates set by the RBI, are further major influencing factors on the Rupee.
The Reserve Bank of India (RBI) actively intervenes in forex markets to maintain a stable exchange rate, to help facilitate trade. In addition, the RBI tries to maintain the inflation rate at its 4% target by adjusting interest rates. Higher interest rates usually strengthen the Rupee. This is due to the role of the ‘carry trade’ in which investors borrow in countries with lower interest rates so as to place their money in countries’ offering relatively higher interest rates and profit from the difference.
Macroeconomic factors that influence the value of the Rupee include inflation, interest rates, the economic growth rate (GDP), the balance of trade, and inflows from foreign investment. A higher growth rate can lead to more overseas investment, pushing up demand for the Rupee. A less negative balance of trade will eventually lead to a stronger Rupee. Higher interest rates, especially real rates (interest rates less inflation) are also positive for the Rupee. A risk-on environment can lead to greater inflows of Foreign Direct and Indirect Investment (FDI and FII), which also benefit the Rupee.
Higher inflation, particularly, if it is comparatively higher than India’s peers, is generally negative for the currency as it reflects devaluation through oversupply. Inflation also increases the cost of exports, leading to more Rupees being sold to purchase foreign imports, which is Rupee-negative. At the same time, higher inflation usually leads to the Reserve Bank of India (RBI) raising interest rates and this can be positive for the Rupee, due to increased demand from international investors. The opposite effect is true of lower inflation.
- The Japanese Yen edges higher following the Jibun Bank Services PMI on Wednesday.
- Japan’s Yoshimasa Hayashi monitors domestic and international market developments with urgency.
- The US Dollar holds ground as traders adopt caution ahead of US employment data.
The Japanese Yen (JPY) continues to strengthen against the US Dollar (USD) following the release of the Jibun Bank Services PMI data on Wednesday. The index was revised to 53.7 in August from an initial estimate of 54.0. Although this marks the seventh consecutive month of expansion in the service sector, the latest figure remains unchanged from July.
Japan’s Chief Cabinet Secretary Yoshimasa Hayashi stated on Wednesday that he is "closely monitoring domestic and international market developments with a sense of urgency." Hayashi emphasized the importance of conducting fiscal and economic policy management in close coordination with the Bank of Japan (BoJ). He also stressed the need for a calm assessment of market movements but declined to comment on daily stock fluctuations.
The US Dollar receives support as traders adopt caution ahead of US employment data, particularly the August Nonfarm Payrolls (NFP). This data may provide further insights into the potential timing and scale of Federal Reserve (Fed) rate cuts.
Daily Digest Market Movers: Japanese Yen extends gains due to the hawkish mood surrounding BoJ
- The US ISM Manufacturing PMI inched up to 47.2 in August from 46.8 in July, falling short of market expectations of 47.5. This marks the 21st contraction in US factory activity over the past 22 months.
- On Tuesday, Japan announced plans to allocate ¥989 billion to fund energy subsidies in response to rising energy costs and the resulting cost-of-living pressures.
- The US Bureau of Economic Analysis reported on Friday that the headline Personal Consumption Expenditures (PCE) Price Index increased by 2.5% year-over-year in July, matching the previous reading of 2.5% but falling short of the estimated 2.6%. Meanwhile, the core PCE, which excludes volatile food and energy prices, rose by 2.6% year-over-year in July, consistent with the prior figure of 2.6% but slightly below the consensus forecast of 2.7%.
- Tokyo's Consumer Price Index (CPI) increased to 2.6% year-on-year in August, up from 2.2% in July. Core CPI also rose to 1.6% YoY in August, compared to the previous 1.5%. Additionally, Japan’s Unemployment Rate unexpectedly climbed to 2.7% in July, up from both the market estimate and June's 2.5%, marking the highest jobless rate since August 2023.
- Federal Reserve Bank of Atlanta President Raphael Bostic, a prominent hawk on the FOMC, indicated last week that it might be "time to move" on rate cuts due to further cooling inflation and a higher-than-expected unemployment rate. FXStreet’s FedTracker, which gauges the tone of Fed officials’ speeches on a dovish-to-hawkish scale from 0 to 10 using a custom AI model, rated Bostic’s words as neutral with a score of 5.6.
- The US Gross Domestic Product (GDP) grew at an annualized rate of 3.0% in the second quarter, exceeding both the expected and previous growth rate of 2.8%. Additionally, Initial Jobless Claims showed that the number of people filing for unemployment benefits fell to 231,000 for the week ending August 23, down from the previous 233,000 and slightly below the expected 232,000.
- Japan’s Finance Minister Shunichi Suzuki stated last week that foreign exchange rates are influenced by a variety of factors, including monetary policies, interest rate differentials, geopolitical risks, and market sentiment. Suzuki added that it is difficult to predict how these factors will impact FX rates.
Technical Analysis: USD/JPY reacts off 21-day EMA, further downward pressure expected
USD/JPY trades around 145.40 on Wednesday. An analysis of the daily chart shows that the nine-day Exponential Moving Average (EMA) is below the 21-day EMA, signaling a bearish trend in the market. Additionally, the 14-day Relative Strength Index (RSI) remains below 50, further confirming that the bearish trend is still in place.
For the USD/JPY pair, support may be found around the seven-month low of 141.69, recorded on August 5, with the next key support level near 140.25.
On the upside, the pair might first encounter resistance at the nine-day EMA around 145.63, followed by the 21-day EMA at 146.73. A break above this level could pave the way for a move toward the psychological barrier of 150.00, with further resistance at the 154.50 level, which has transitioned from support to resistance.
USD/JPY: Daily Chart
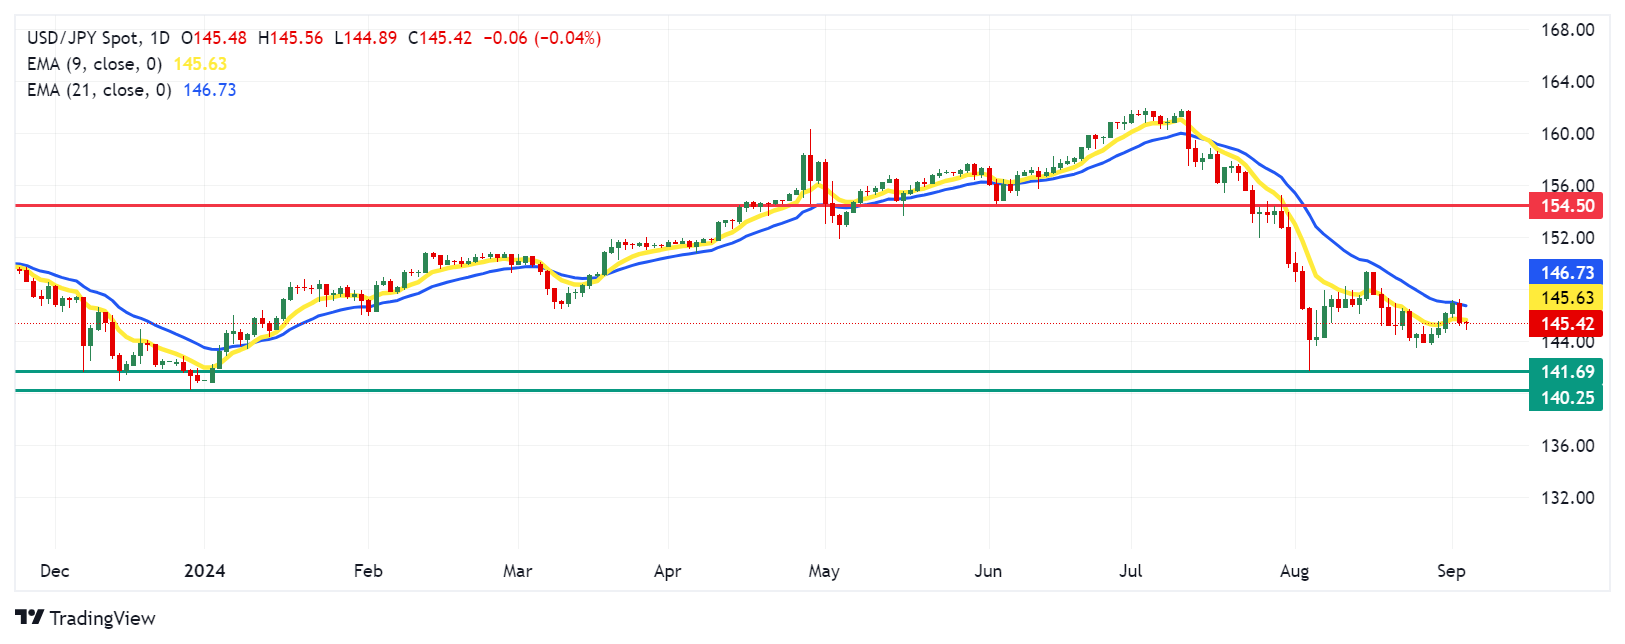
Japanese Yen PRICE Today
The table below shows the percentage change of Japanese Yen (JPY) against listed major currencies today. Japanese Yen was the strongest against the Australian Dollar.
| USD | EUR | GBP | JPY | CAD | AUD | NZD | CHF | |
|---|---|---|---|---|---|---|---|---|
| USD | -0.10% | 0.00% | -0.03% | -0.12% | 0.11% | 0.07% | -0.18% | |
| EUR | 0.10% | 0.13% | 0.08% | 0.01% | 0.23% | 0.21% | -0.08% | |
| GBP | -0.01% | -0.13% | -0.04% | -0.13% | 0.11% | 0.11% | -0.21% | |
| JPY | 0.03% | -0.08% | 0.04% | -0.09% | 0.15% | 0.11% | -0.16% | |
| CAD | 0.12% | -0.01% | 0.13% | 0.09% | 0.22% | 0.22% | -0.08% | |
| AUD | -0.11% | -0.23% | -0.11% | -0.15% | -0.22% | -0.02% | -0.29% | |
| NZD | -0.07% | -0.21% | -0.11% | -0.11% | -0.22% | 0.02% | -0.29% | |
| CHF | 0.18% | 0.08% | 0.21% | 0.16% | 0.08% | 0.29% | 0.29% |
The heat map shows percentage changes of major currencies against each other. The base currency is picked from the left column, while the quote currency is picked from the top row. For example, if you pick the Japanese Yen from the left column and move along the horizontal line to the US Dollar, the percentage change displayed in the box will represent JPY (base)/USD (quote).
Japanese Yen FAQs
The Japanese Yen (JPY) is one of the world’s most traded currencies. Its value is broadly determined by the performance of the Japanese economy, but more specifically by the Bank of Japan’s policy, the differential between Japanese and US bond yields, or risk sentiment among traders, among other factors.
One of the Bank of Japan’s mandates is currency control, so its moves are key for the Yen. The BoJ has directly intervened in currency markets sometimes, generally to lower the value of the Yen, although it refrains from doing it often due to political concerns of its main trading partners. The current BoJ ultra-loose monetary policy, based on massive stimulus to the economy, has caused the Yen to depreciate against its main currency peers. This process has exacerbated more recently due to an increasing policy divergence between the Bank of Japan and other main central banks, which have opted to increase interest rates sharply to fight decades-high levels of inflation.
The BoJ’s stance of sticking to ultra-loose monetary policy has led to a widening policy divergence with other central banks, particularly with the US Federal Reserve. This supports a widening of the differential between the 10-year US and Japanese bonds, which favors the US Dollar against the Japanese Yen.
The Japanese Yen is often seen as a safe-haven investment. This means that in times of market stress, investors are more likely to put their money in the Japanese currency due to its supposed reliability and stability. Turbulent times are likely to strengthen the Yen’s value against other currencies seen as more risky to invest in.
| Raw materials | Closed | Change, % |
|---|---|---|
| Silver | 28.037 | -1.69 |
| Gold | 249.263 | -0.27 |
| Palladium | 944.97 | -3.33 |
Japan’s Chief Cabinet Secretary Yoshimasa Hayashi said on Wednesday that he is “closely watching domestic and overseas market moves with a sense of urgency.”
Additional comments
No comment on daily share moves.
Will conduct fiscal and economic policy management while working closely with the Bank of Japan (BoJ).
Important to make assessment of market moves calmly.
Market reaction
At press time, USD/JPY is trading 10.13% lower on the day, easing off 145.50 following these comments.
China's Services Purchasing Managers' Index (PMI) fell from 52.1 in July to 51.6 in August, the latest data published by Caixin showed on Wednesday.
The data missed the market consensus of 52.2 in the reported period, by a wide margin.
AUD/USD reaction to China’s Services PMI
At the time of writing, the AUD/USD pair is keeping its recovery mode intact near 0.6705, still down 0.07% on the day.
Australian Dollar FAQs
One of the most significant factors for the Australian Dollar (AUD) is the level of interest rates set by the Reserve Bank of Australia (RBA). Because Australia is a resource-rich country another key driver is the price of its biggest export, Iron Ore. The health of the Chinese economy, its largest trading partner, is a factor, as well as inflation in Australia, its growth rate and Trade Balance. Market sentiment – whether investors are taking on more risky assets (risk-on) or seeking safe-havens (risk-off) – is also a factor, with risk-on positive for AUD.
The Reserve Bank of Australia (RBA) influences the Australian Dollar (AUD) by setting the level of interest rates that Australian banks can lend to each other. This influences the level of interest rates in the economy as a whole. The main goal of the RBA is to maintain a stable inflation rate of 2-3% by adjusting interest rates up or down. Relatively high interest rates compared to other major central banks support the AUD, and the opposite for relatively low. The RBA can also use quantitative easing and tightening to influence credit conditions, with the former AUD-negative and the latter AUD-positive.
China is Australia’s largest trading partner so the health of the Chinese economy is a major influence on the value of the Australian Dollar (AUD). When the Chinese economy is doing well it purchases more raw materials, goods and services from Australia, lifting demand for the AUD, and pushing up its value. The opposite is the case when the Chinese economy is not growing as fast as expected. Positive or negative surprises in Chinese growth data, therefore, often have a direct impact on the Australian Dollar and its pairs.
Iron Ore is Australia’s largest export, accounting for $118 billion a year according to data from 2021, with China as its primary destination. The price of Iron Ore, therefore, can be a driver of the Australian Dollar. Generally, if the price of Iron Ore rises, AUD also goes up, as aggregate demand for the currency increases. The opposite is the case if the price of Iron Ore falls. Higher Iron Ore prices also tend to result in a greater likelihood of a positive Trade Balance for Australia, which is also positive of the AUD.
The Trade Balance, which is the difference between what a country earns from its exports versus what it pays for its imports, is another factor that can influence the value of the Australian Dollar. If Australia produces highly sought after exports, then its currency will gain in value purely from the surplus demand created from foreign buyers seeking to purchase its exports versus what it spends to purchase imports. Therefore, a positive net Trade Balance strengthens the AUD, with the opposite effect if the Trade Balance is negative.
- The Australian Dollar remains weaker following the mixed economic data on Wednesday.
- Australia’s Gross Domestic Product grew by 0.2% QoQ in Q2, an improvement from the previous quarter’s growth of 0.1%.
- The US ISM Manufacturing PMI inched up to 47.2 in August from 46.8 in July.
The Australian Dollar (AUD) pares daily losses against the US Dollar (USD) following the release of the key economic data on Wednesday. Australia’s Gross Domestic Product (GDP) posted a 0.2% reading QoQ for the second quarter, up from the previous quarter’s 0.1% but falling short of the expected 0.3% readings. Additionally, China's Services Purchasing Managers' Index (PMI) fell from 52.1 in July to 51.6 in August, given the fact that both countries are close trade partners.
The upbeat Australian August Purchasing Managers Index (PMI) might have provided some support to the Australian Dollar (AUD) and limited the downside of the AUD/USD pair. Traders are now focusing on the upcoming speech by Reserve Bank of Australia (RBA) Governor Michele Bullock on Thursday, to gather more insights into the central bank's hawkish stance on monetary policy.
The US Dollar receives support as traders evaluate the economic and monetary outlook. The ISM Manufacturing PMI indicated that factory activity contracted for the fifth consecutive month, with the pace of decline slightly exceeding expectations. This renewed concerns about the impact of elevated interest rates on the health of the US economy.
Traders now await more economic data due this week, including the ISM Services PMI and Nonfarm Payrolls (NFP) to shed light on the potential size of an expected rate cut by the Fed this month.
Daily Digest Market Movers: Australian Dollar extends losses after key economic data
- The Judo Bank Composite PMI climbed to 51.7 in August, up from 51.4 in July, signaling the fastest expansion in three months. This growth was primarily fueled by a rise in services activity, with the Services PMI reaching 52.5 in August, up from 52.2 in July, marking the seventh consecutive month of growth in the services sector.
- The US ISM Manufacturing PMI inched up to 47.2 in August from 46.8 in July, falling short of market expectations of 47.5. This marks the 21st contraction in US factory activity over the past 22 months.
- Australia’s Building Permits surged by 10.4% month-over-month in July, sharply rebounding from a 6.5% decline in June, marking the strongest growth since May 2023. On an annual basis, the growth rate reached 14.3%, a significant recovery from the previous 3.7% decline.
- China’s Caixin Manufacturing PMI rose to 50.4 in August, up from 49.8 in July, which is particularly noteworthy given China’s close trade relationship with Australia.
- The US Bureau of Economic Analysis reported on Friday that the headline Personal Consumption Expenditures (PCE) Price Index increased by 2.5% year-over-year in July, matching the previous reading of 2.5% but falling short of the estimated 2.6%. Meanwhile, the core PCE, which excludes volatile food and energy prices, rose by 2.6% year-over-year in July, consistent with the prior figure of 2.6% but slightly below the consensus forecast of 2.7%.
- The US Gross Domestic Product (GDP) grew at an annualized rate of 3.0% in the second quarter, exceeding both the expected and previous growth rate of 2.8%. Additionally, Initial Jobless Claims showed that the number of people filing for unemployment benefits fell to 231,000 for the week ending August 23, down from the previous 233,000 and slightly below the expected 232,000.
- Australia's Private Capital Expenditure unexpectedly declined by 2.2% in the second quarter, reversing from an upwardly revised 1.9% expansion in the previous period and falling short of market expectations for a 1.0% increase. This marks the first contraction in new capital expenditure since the third quarter of 2023.
Technical Analysis: Australian Dollar falls to near 0.6700
The Australian Dollar trades around 0.6700 on Wednesday. Analyzing the daily chart, the AUD/USD pair has breached below the nine-day Exponential Moving Average (EMA), suggesting a short-term bearish trend. Additionally, the 14-day Relative Strength Index (RSI) has also moved below the 50 level, confirming the bearish bias.
On the downside, the AUD/USD pair may navigate region around the throwback level at 0.6575, with further decline possibly targeting the lower support at 0.6470.
In terms of resistance, the AUD/USD pair may test immediate support around the 14-day EMA at 0.6729, followed by the nine-day EMA at 0.6742. A break above these EMAs could support the pair to test the seven-month high of 0.6798.
AUD/USD: Daily Chart
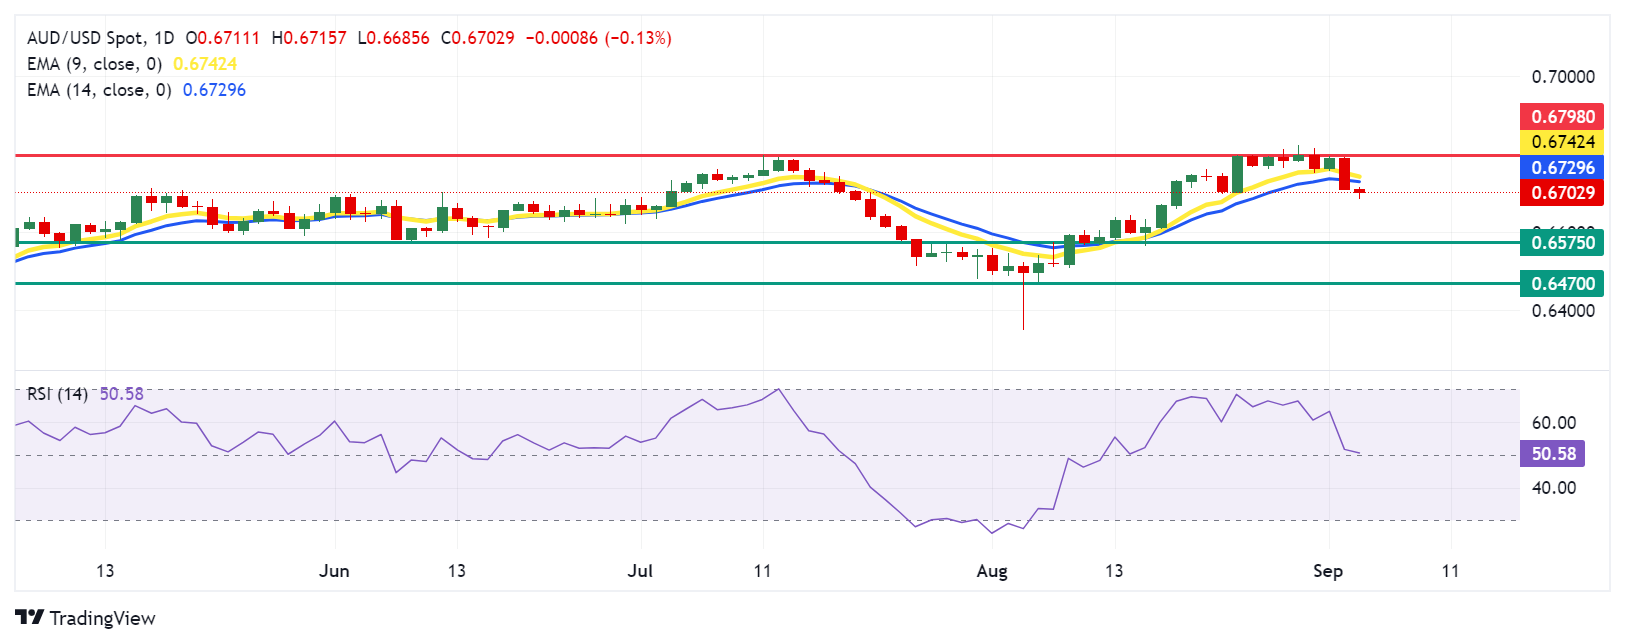
Australian Dollar PRICE Today
The table below shows the percentage change of Australian Dollar (AUD) against listed major currencies today. Australian Dollar was the weakest against the Swiss Franc.
| USD | EUR | GBP | JPY | CAD | AUD | NZD | CHF | |
|---|---|---|---|---|---|---|---|---|
| USD | -0.10% | 0.02% | -0.06% | -0.06% | 0.12% | 0.08% | -0.16% | |
| EUR | 0.10% | 0.13% | 0.03% | 0.06% | 0.22% | 0.21% | -0.07% | |
| GBP | -0.02% | -0.13% | -0.08% | -0.08% | 0.09% | 0.10% | -0.20% | |
| JPY | 0.06% | -0.03% | 0.08% | 0.00% | 0.18% | 0.14% | -0.11% | |
| CAD | 0.06% | -0.06% | 0.08% | -0.01% | 0.16% | 0.16% | -0.13% | |
| AUD | -0.12% | -0.22% | -0.09% | -0.18% | -0.16% | -0.01% | -0.27% | |
| NZD | -0.08% | -0.21% | -0.10% | -0.14% | -0.16% | 0.01% | -0.27% | |
| CHF | 0.16% | 0.07% | 0.20% | 0.11% | 0.13% | 0.27% | 0.27% |
The heat map shows percentage changes of major currencies against each other. The base currency is picked from the left column, while the quote currency is picked from the top row. For example, if you pick the Australian Dollar from the left column and move along the horizontal line to the US Dollar, the percentage change displayed in the box will represent AUD (base)/USD (quote).
Australian Dollar FAQs
One of the most significant factors for the Australian Dollar (AUD) is the level of interest rates set by the Reserve Bank of Australia (RBA). Because Australia is a resource-rich country another key driver is the price of its biggest export, Iron Ore. The health of the Chinese economy, its largest trading partner, is a factor, as well as inflation in Australia, its growth rate and Trade Balance. Market sentiment – whether investors are taking on more risky assets (risk-on) or seeking safe-havens (risk-off) – is also a factor, with risk-on positive for AUD.
The Reserve Bank of Australia (RBA) influences the Australian Dollar (AUD) by setting the level of interest rates that Australian banks can lend to each other. This influences the level of interest rates in the economy as a whole. The main goal of the RBA is to maintain a stable inflation rate of 2-3% by adjusting interest rates up or down. Relatively high interest rates compared to other major central banks support the AUD, and the opposite for relatively low. The RBA can also use quantitative easing and tightening to influence credit conditions, with the former AUD-negative and the latter AUD-positive.
China is Australia’s largest trading partner so the health of the Chinese economy is a major influence on the value of the Australian Dollar (AUD). When the Chinese economy is doing well it purchases more raw materials, goods and services from Australia, lifting demand for the AUD, and pushing up its value. The opposite is the case when the Chinese economy is not growing as fast as expected. Positive or negative surprises in Chinese growth data, therefore, often have a direct impact on the Australian Dollar and its pairs.
Iron Ore is Australia’s largest export, accounting for $118 billion a year according to data from 2021, with China as its primary destination. The price of Iron Ore, therefore, can be a driver of the Australian Dollar. Generally, if the price of Iron Ore rises, AUD also goes up, as aggregate demand for the currency increases. The opposite is the case if the price of Iron Ore falls. Higher Iron Ore prices also tend to result in a greater likelihood of a positive Trade Balance for Australia, which is also positive of the AUD.
The Trade Balance, which is the difference between what a country earns from its exports versus what it pays for its imports, is another factor that can influence the value of the Australian Dollar. If Australia produces highly sought after exports, then its currency will gain in value purely from the surplus demand created from foreign buyers seeking to purchase its exports versus what it spends to purchase imports. Therefore, a positive net Trade Balance strengthens the AUD, with the opposite effect if the Trade Balance is negative.
The People’s Bank of China (PBOC) set the USD/CNY central rate for the trading session ahead on Wednesday at 7.1148, as against the previous day's fix of 7.1112 and 7.1167 Reuters estimates.
- Gold price edges lower in Wednesday’s early Asian session.
- The escalating Middle East geopolitical tensions and firmer Fed rate-cut expectations might cap the Gold’s downside.
- JOLTS Job Openings and Fed Beige Book are due later on Wednesday.
The Gold price (XAU/USD) bounces off the multi-day lows but remains below the $2,500 barrier amid the renewed bid bias in the US Dollar (USD) on Wednesday. However, the ongoing geopolitical risks and imminent Federal Reserve (Fed) rate cuts might underpin the yellow metal in the near term.
Later on Wednesday, JOLTS Job Openings and Fed Beige Book will be released. Investors will closely monitor the highly-anticipated US August Nonfarm Payrolls (NFP) on Friday, which could determine the size and pace of the potential rate cut by the Federal Reserve's September policy meeting. If the report shows weaker than expected reading, this could fuel speculation about a US recession and faster Fed rate cuts. This, in turn, could further boost the precious metal as lower interest rates reduce the opportunity cost of holding non-yielding gold.
Daily Digest Market Movers: Gold price loses ground amid firmer US Dollar
- "We see evidence that speculative positioning in gold is effectively maxed out for the time being. I think the level to which gold is seeing pressure from the rise in the dollar reflects our view on positioning," said Daniel Ghali, commodity strategist at TD Securities.
- The US ISM Manufacturing PMI rose to 47.2 in August from an eight-month low in July at 46.8. This figure was below the market consensus of 47.5.
- Traders raised the chance of a more aggressive half-point reduction to 39%, up from 31% before the US ISM Manufacturing PMI report, according to the CME Group’s FedWatch measure.
- The US JOLTS Job Openings are expected to be 8.10 million, down from 8.184 million in June.
- The US ISM Services PMI is projected to ease to 51.4 in August from 51.1 in July.
Technical Analysis: Gold price keeps the bright picture in the longer term
The Gold price trades in negative territory on the day. The precious metal maintains a bullish trend on the daily chart as the price is above the key 100-day Exponential Moving Average (EMA) and reinforced by the 14-day Relative Strength Index (RSI), which stands above the midline.
The crucial upside barrier for the yellow metal emerges at the $2,530-$2,540, representing the five-month-old ascending channel’s upper boundary and the all-time high. Sustained trading above this level could pave the way to the $2,600 psychological mark.
On the other hand, the immediate support level to watch is $2,470, the low of August 22. A breach of the mentioned level could see a downward move back towards $2,432, the low of August 15. Extended losses will see a drop to $2,377, the 100-day EMA.
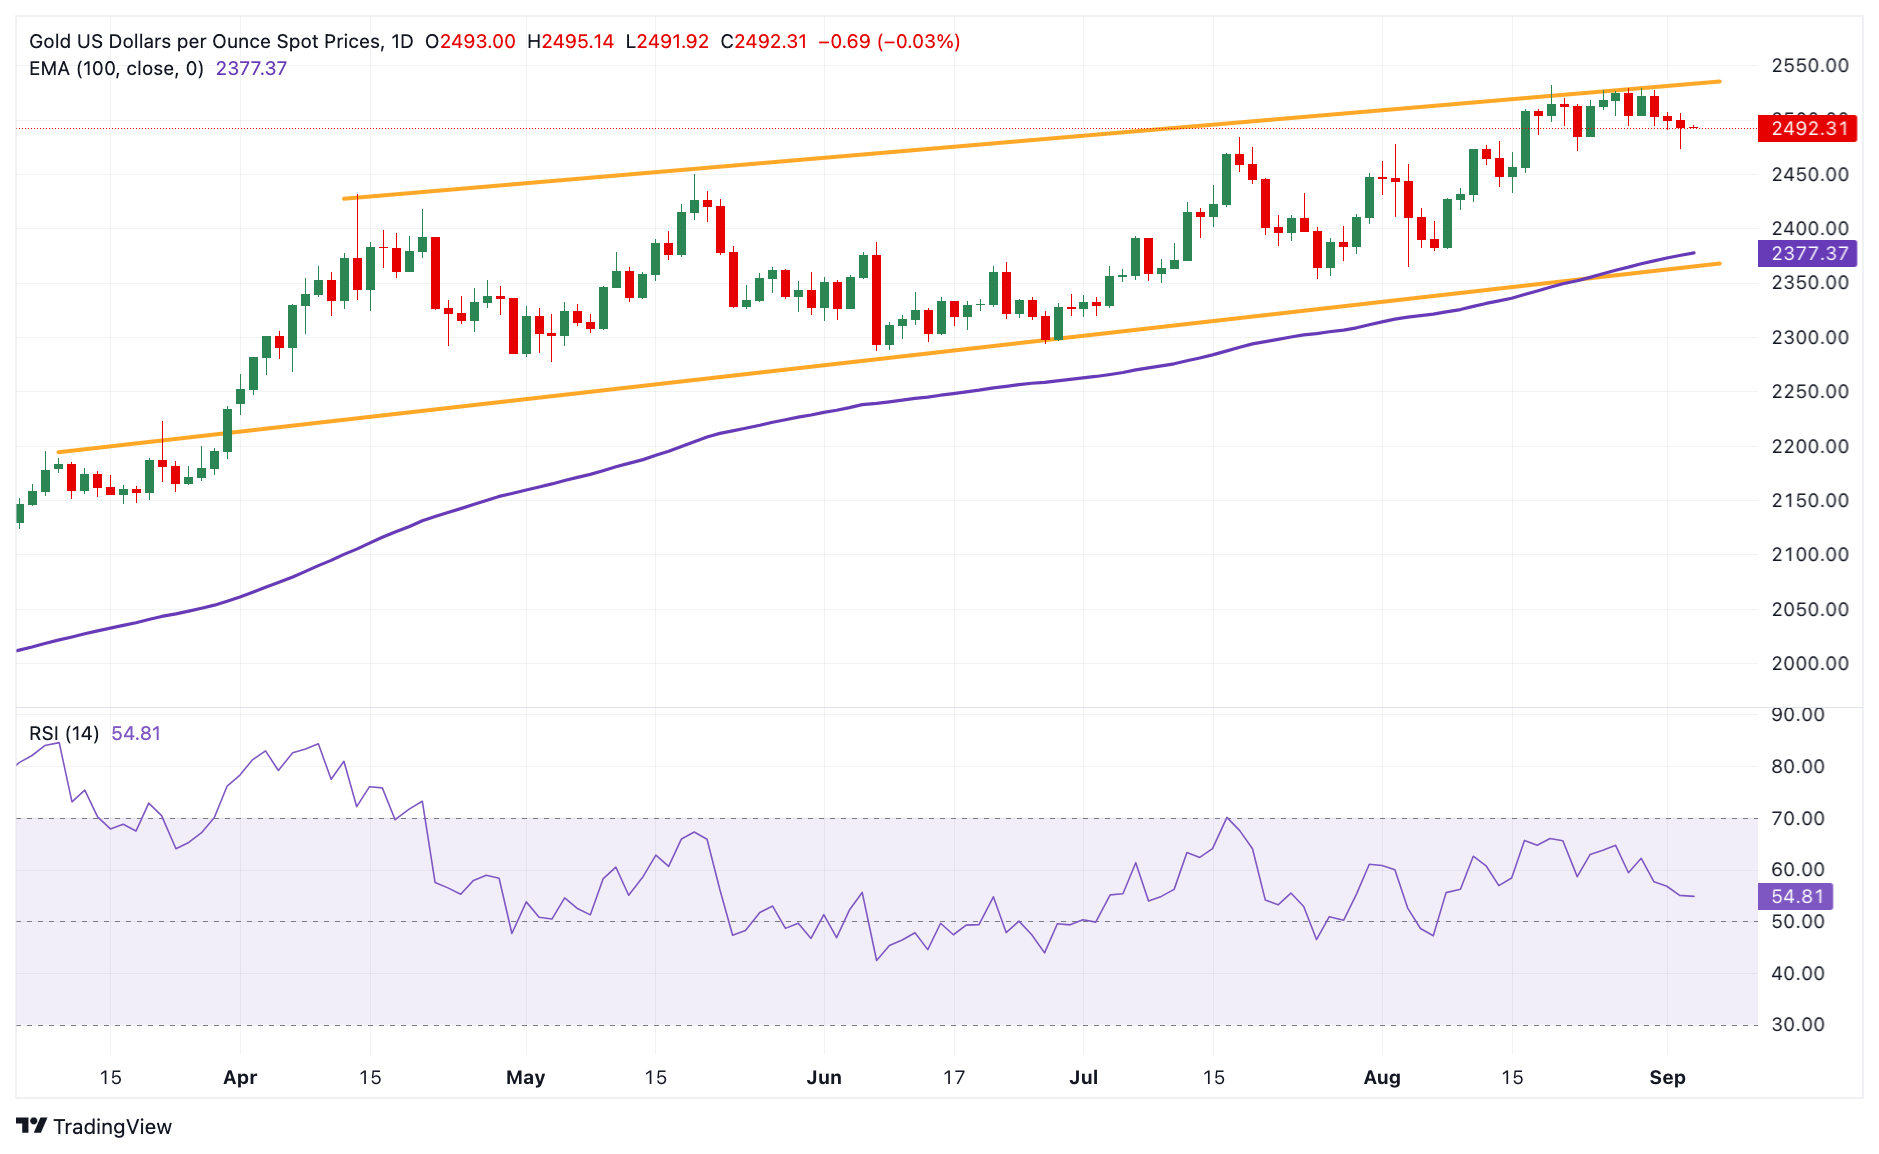
Gold FAQs
Gold has played a key role in human’s history as it has been widely used as a store of value and medium of exchange. Currently, apart from its shine and usage for jewelry, the precious metal is widely seen as a safe-haven asset, meaning that it is considered a good investment during turbulent times. Gold is also widely seen as a hedge against inflation and against depreciating currencies as it doesn’t rely on any specific issuer or government.
Central banks are the biggest Gold holders. In their aim to support their currencies in turbulent times, central banks tend to diversify their reserves and buy Gold to improve the perceived strength of the economy and the currency. High Gold reserves can be a source of trust for a country’s solvency. Central banks added 1,136 tonnes of Gold worth around $70 billion to their reserves in 2022, according to data from the World Gold Council. This is the highest yearly purchase since records began. Central banks from emerging economies such as China, India and Turkey are quickly increasing their Gold reserves.
Gold has an inverse correlation with the US Dollar and US Treasuries, which are both major reserve and safe-haven assets. When the Dollar depreciates, Gold tends to rise, enabling investors and central banks to diversify their assets in turbulent times. Gold is also inversely correlated with risk assets. A rally in the stock market tends to weaken Gold price, while sell-offs in riskier markets tend to favor the precious metal.
The price can move due to a wide range of factors. Geopolitical instability or fears of a deep recession can quickly make Gold price escalate due to its safe-haven status. As a yield-less asset, Gold tends to rise with lower interest rates, while higher cost of money usually weighs down on the yellow metal. Still, most moves depend on how the US Dollar (USD) behaves as the asset is priced in dollars (XAU/USD). A strong Dollar tends to keep the price of Gold controlled, whereas a weaker Dollar is likely to push Gold prices up.
| Index | Change, points | Closed | Change, % |
|---|---|---|---|
| NIKKEI 225 | -14.56 | 38686.31 | -0.04 |
| Hang Seng | -40.48 | 17651.49 | -0.23 |
| KOSPI | -16.37 | 2664.63 | -0.61 |
| ASX 200 | -6.7 | 8103.2 | -0.08 |
| DAX | -183.74 | 18747.11 | -0.97 |
| CAC 40 | -71.32 | 7575.1 | -0.93 |
| Dow Jones | -626.15 | 40936.93 | -1.51 |
| S&P 500 | -119.47 | 5528.93 | -2.12 |
| NASDAQ Composite | -577.32 | 17136.3 | -3.26 |
| Pare | Closed | Change, % |
|---|---|---|
| AUDUSD | 0.67115 | -1.16 |
| EURJPY | 160.616 | -1.26 |
| EURUSD | 1.10439 | -0.25 |
| GBPJPY | 190.648 | -1.31 |
| GBPUSD | 1.31127 | -0.27 |
| NZDUSD | 0.61852 | -0.77 |
| USDCAD | 1.35471 | 0.4 |
| USDCHF | 0.85012 | -0.16 |
| USDJPY | 145.412 | -1.01 |
European Central Bank policymaker Joachim Nagel said on Tuesday that "the great wave of inflation is over", adding he will not decide whether to vote to cut rates in September until next week, per Reuters.
Key quotes
I really won’t make a decision until the ECB Governing Council meeting next week, when I will have a complete overview of all the data.
Inflation was on the right track.
We shouldn’t prematurely burst into cheers and pat ourselves on the back.
We must remain vigilant and keep an eye on the risks on the way back to stable prices.
Market reaction
At the time of press, the EUR/USD pair was up 0.04% on the day at 1.1048.
ECB FAQs
The European Central Bank (ECB) in Frankfurt, Germany, is the reserve bank for the Eurozone. The ECB sets interest rates and manages monetary policy for the region. The ECB primary mandate is to maintain price stability, which means keeping inflation at around 2%. Its primary tool for achieving this is by raising or lowering interest rates. Relatively high interest rates will usually result in a stronger Euro and vice versa. The ECB Governing Council makes monetary policy decisions at meetings held eight times a year. Decisions are made by heads of the Eurozone national banks and six permanent members, including the President of the ECB, Christine Lagarde.
In extreme situations, the European Central Bank can enact a policy tool called Quantitative Easing. QE is the process by which the ECB prints Euros and uses them to buy assets – usually government or corporate bonds – from banks and other financial institutions. QE usually results in a weaker Euro. QE is a last resort when simply lowering interest rates is unlikely to achieve the objective of price stability. The ECB used it during the Great Financial Crisis in 2009-11, in 2015 when inflation remained stubbornly low, as well as during the covid pandemic.
Quantitative tightening (QT) is the reverse of QE. It is undertaken after QE when an economic recovery is underway and inflation starts rising. Whilst in QE the European Central Bank (ECB) purchases government and corporate bonds from financial institutions to provide them with liquidity, in QT the ECB stops buying more bonds, and stops reinvesting the principal maturing on the bonds it already holds. It is usually positive (or bullish) for the Euro.


© 2000-2026. Sva prava zaštićena.
Sajt je vlasništvo kompanije Teletrade D.J. LLC 2351 LLC 2022 (Euro House, Richmond Hill Road, Kingstown, VC0100, St. Vincent and the Grenadines).
Svi podaci koji se nalaze na sajtu ne predstavljaju osnovu za donošenje investicionih odluka, već su informativnog karaktera.
The company does not serve or provide services to customers who are residents of the US, Canada, Iran, The Democratic People's Republic of Korea, Yemen and FATF blacklisted countries.
Izvršenje trgovinskih operacija sa finansijskim instrumentima upotrebom marginalne trgovine pruža velike mogućnosti i omogućava investitorima ostvarivanje visokih prihoda. Međutim, takav vid trgovine povezan je sa potencijalno visokim nivoom rizika od gubitka sredstava. Проведение торговых операций на финанcовых рынках c маржинальными финанcовыми инcтрументами открывает широкие возможноcти, и позволяет инвеcторам, готовым пойти на риcк, получать выcокую прибыль, но при этом неcет в cебе потенциально выcокий уровень риcка получения убытков. Iz tog razloga je pre započinjanja trgovine potrebno odlučiti o izboru odgovarajuće investicione strategije, uzimajući u obzir raspoložive resurse.
Upotreba informacija: U slučaju potpunog ili delimičnog preuzimanja i daljeg korišćenja materijala koji se nalazi na sajtu, potrebno je navesti link odgovarajuće stranice na sajtu kompanije TeleTrade-a kao izvora informacija. Upotreba materijala na internetu mora biti praćena hiper linkom do web stranice teletrade.org. Automatski uvoz materijala i informacija sa stranice je zabranjen.
Ako imate bilo kakvih pitanja, obratite nam se pr@teletrade.global.
транcфери