- Analiza
- Novosti i instrumenti
- Vesti sa tržišta
Forex-novosti i prognoze od 04-06-2024
Japan's Labor Cash Earnings rose 2.1% YoY through April, rising above the forecast 1.7%, with the previous period's cash earnings also getting revised higher to 1.0% from the inital print of 0.6%.
Rising labor earnings improve the Japanese inflation outlook. The Bank of Japan (BoJ) has been stubbornly entrenched in hyper-easy monetary policy as the Japanese central bank fears a future return to a disinflationary envirnoment. With labor cash earnings rising faster than expected, it will add pressure to the BoJ to start clamping down on an easy monetary policy stance that has undercut the Yen across the board through 2024. The rate differential between the Yen and all other global currencies has left the Yen struggling across the board.
Market reaction
USD/JPY is testing the 155.00 handle in early Wednesday action, rebounding after a broad-market Yen bid dragged the pair sharply down to a near-term floor at 154.60, backsliding from the week's peak bids near 157.50.
About Japan's Labor Cash Earnings
This indicator, released by the Ministry of Health, Labor and Welfare, shows the average income, before taxes, per regular employee. It includes overtime pay and bonuses but it doesn't take into account earnings from holding financial assets nor capital gains. Higher income puts upward pressures on consumption, and is inflationary for the Japanese economy. Generally, a higher-than-expected reading is bullish for the Japanese Yen (JPY), while a below-the-market consensus result is bearish.
The Reserve Bank of Australia (RBA) Governor Michele Bullock said on Wednesday that she expects Q1 GDP growth to be quite low, adding that the central bank’s plan A is to remain data-driven.
Key quotes
Expects Q1 growth to be quite low
Household spending is very weak
Board judges economy still on track
Underlying Inflation Decreasing Gradually
Demand still exceeds economy's capacity to supply
Plan A is to remain data-driven
Demand Exceeds Economy's Capacity to Supply
Economy Readiness to Ease if Significantly Weaker
Market reaction
At the press time, the AUD/USD pair was down 0.02% on the day to trade at 0.6648.
Australian Dollar FAQs
One of the most significant factors for the Australian Dollar (AUD) is the level of interest rates set by the Reserve Bank of Australia (RBA). Because Australia is a resource-rich country another key driver is the price of its biggest export, Iron Ore. The health of the Chinese economy, its largest trading partner, is a factor, as well as inflation in Australia, its growth rate and Trade Balance. Market sentiment – whether investors are taking on more risky assets (risk-on) or seeking safe-havens (risk-off) – is also a factor, with risk-on positive for AUD.
The Reserve Bank of Australia (RBA) influences the Australian Dollar (AUD) by setting the level of interest rates that Australian banks can lend to each other. This influences the level of interest rates in the economy as a whole. The main goal of the RBA is to maintain a stable inflation rate of 2-3% by adjusting interest rates up or down. Relatively high interest rates compared to other major central banks support the AUD, and the opposite for relatively low. The RBA can also use quantitative easing and tightening to influence credit conditions, with the former AUD-negative and the latter AUD-positive.
China is Australia’s largest trading partner so the health of the Chinese economy is a major influence on the value of the Australian Dollar (AUD). When the Chinese economy is doing well it purchases more raw materials, goods and services from Australia, lifting demand for the AUD, and pushing up its value. The opposite is the case when the Chinese economy is not growing as fast as expected. Positive or negative surprises in Chinese growth data, therefore, often have a direct impact on the Australian Dollar and its pairs.
Iron Ore is Australia’s largest export, accounting for $118 billion a year according to data from 2021, with China as its primary destination. The price of Iron Ore, therefore, can be a driver of the Australian Dollar. Generally, if the price of Iron Ore rises, AUD also goes up, as aggregate demand for the currency increases. The opposite is the case if the price of Iron Ore falls. Higher Iron Ore prices also tend to result in a greater likelihood of a positive Trade Balance for Australia, which is also positive of the AUD.
The Trade Balance, which is the difference between what a country earns from its exports versus what it pays for its imports, is another factor that can influence the value of the Australian Dollar. If Australia produces highly sought after exports, then its currency will gain in value purely from the surplus demand created from foreign buyers seeking to purchase its exports versus what it spends to purchase imports. Therefore, a positive net Trade Balance strengthens the AUD, with the opposite effect if the Trade Balance is negative.
- NZD/USD trades stronger near 0.6175 in Wednesday’s early Asian session.
- The rising expectation that the Fed will start cutting rates from the September meeting weighs on the USD.
- The encouraging Chinese Caixin Manufacturing PMI supports the China-proxy NZD.
The NZD/USD pair posts modest gains around 0.6175 during the early Asian session on Wednesday. The USD Index (DXY) weakens to multi-week lows near 104.00 on the back of rising speculation of an interest rate cut by the Federal Reserve (Fed) this year, which provides some support to the pair. Investors await the key US data releases later on Wednesday, including the US ADP Employment Change, the final S&P Global Services PMI, and the ISM Services PMI.
The weakening of the Greenback in the previous sessions is driven by a series of weaker US economic data, despite the hawkish tone from US Fed officials in recent weeks. Traders raise their bets on the expectation that the Fed will start lowering borrowing costs from the September meeting. According to the CME FedWatch Tool, the markets have priced in nearly a 54.9% chance of a rate cut in September, up from 49% at the end of last week.
On Tuesday, the US JOLTs Job Openings decreased from 8.355 million to 8.059 million in April, missing the market expectation of 8.34 million. The USD will be determined by Wednesday’s US ISM services data, which is estimated to improve to 50.5 in May from 49.4 in the previous reading. The weaker reading could further weigh on USD and Treasury yields.
On the Kiwi front, China’s manufacturing sector accelerates for the fourth consecutive month due to strong increases in consumer goods production. The Chinese Caixin Manufacturing PMI came in at 51.7 in May from 51.4 in the previous reading, above the market consensus of 51.5. This, in turn, boosts the China-proxy New Zealand Dollar (NZD) as New Zealand is one of China's leading trading partners.
Australia's Judo Bank Services Purchasing Managers Index (PMI) Business Activity index fell to 52.5 MoM in May, down from the previous month's 53.6, marking in a second straight month of declines.
Despite the easing headline figure, Services activity chalked in a fourth consecutive month of expansion in serivces business activity, albeit on a softer tone.
As Matthew De Pasquale, Economist at Judo Bank noted, "The complete May PMI release confirms findings from the Flash report earlier this month. Business conditions have improved for four consecutive months, the services sector is driving the rise, and employment growth remained strong throughout the month."
Market reaction
AUD/USD is grinding to a halt near 0.6650 in the early Wednesday market session after flubbing a bullish attempt to grab the 0.6700 handle on Tuesday.
About Australia's Judo Bank Services PMI
The Services Purchasing Managers Index (PMI), released on a monthly basis by Judo Bank and S&P Global, is a leading indicator gauging business activity in Australia’s services sector. The data is derived from surveys of senior executives at private-sector companies from the services sector. Survey responses reflect the change, if any, in the current month compared to the previous month and can anticipate changing trends in official data series such as Gross Domestic Product (GDP), employment and inflation. A reading above 50 indicates that the services economy is generally expanding, a bullish sign for the Australian Dollar (AUD). Meanwhile, a reading below 50 signals that activity among service providers is generally declining, which is seen as bearish for AUD.
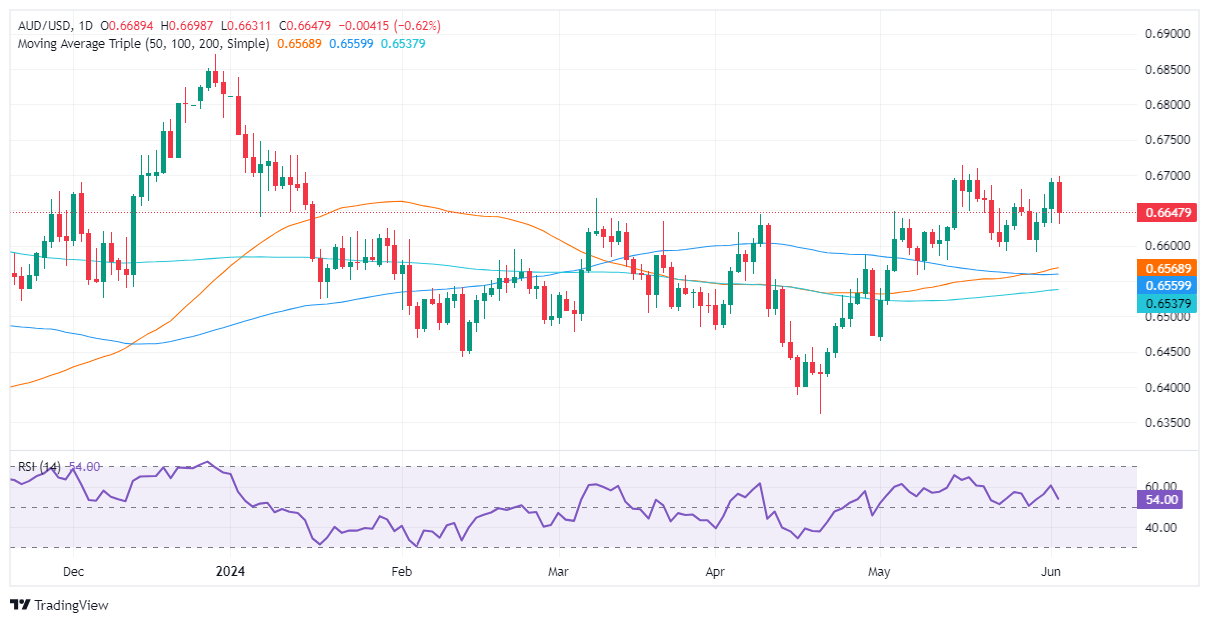
- AUD/USD declines to 0.6648, down 0.60%, despite speculation of Fed rate cuts due to weaker US data.
- US job openings fall to 8.059 million in April, the lowest since early 2021, below estimates.
- Upcoming Australian PMIs and Q1 GDP figures expected to show 0.2% QoQ and 1.2% YoY growth.
The Australian Dollar reversed its course and registered losses of 0.60% against the US Dollar on Tuesday, even though data from the United States sparked speculations that the Fed would cut rates in the year. As the Wednesday Asian session begins, the AUD/USD trades at 0.6648, virtually Unchanged.
Aussie Dollar on the defensive, despite increased Fed rate cut speculation
US job openings in April were lower than expected and marked the lowest level since early 2021. The reading reached 8.059 million, lower than estimates of 8.34 million and down from March's 8.355 million.
Other data showed that US Durable Goods Orders rose by 0.6% MoM in April, which is below both the estimates and the previous reading of 0.7%.
Following the data release, the December 2024 fed funds rate futures contract showed that most traders expect at least 35 basis points of rate cuts via the Chicago Board of Trade (CBOT).
In the meantime, the 10-year US Treasury bond yields shed six basis points to 4.332%, while the US Dollar Index (DXY) climbed some 0.10% at 104.14.
The schedule will feature the release of PMIs and March Gross Domestic Product (GDP) figures on the Aussie's front. The GDP for the first quarter of 2024 is expected to rise by 0.2% QoQ and 1.2% YoY.
AUD/USD Price Analysis: Technical outlook
On Monday, I wrote, “From a technical perspective, a ‘double bottom’ chart pattern looms, which could pave the way to test 0.6750 and beyond. However, to confirm its validity, buyers must crack the latest cycle high of 0.6714.” It should be said that the ‘double bottom’ has been invalidated, as the AUD/USD formed a ‘bearish engulfing’ candle pattern, paving the way for further losses.
With that said, if sellers push the price below 0.6600, the next stop would be the 50-day moving average (DMA) at 0.6571, followed by the 100-DMA at 0.6561 and the 200-DMA at 0.6536.
For a bullish resumption, buyers need to keep the exchange rate above 0.6600 if they want to challenge the 0.6700 figure.
- EUR/USD loses grip on 1.0900 on Tuesday after risk aversion reignites.
- Fed rate cut hopes have been pushed back to November.
- ECB rate cut, US NFP Friday loom darkly ahead.
EUR/USD declined around a quarter of a percent on Tuesday after market sentiment soured following US dataprints that pushed markets back into risk-off bids into the Greenback. US data failed to deliver signs of a steepening economic slowdown in the US, sending broad-market hopes for signs of Federal Reserve (Fed) rate cuts back to the bottom and sparking a fresh bout of risk-off safe haven bidding.
According to the CME’s FedWatch Tool, rate markets are still hoping for at least a quarter-point rate cut at the Fed’s September interest rate meeting. However, odds are tilted towards November fora first rate trim with probabilities pricing in 90% odds of a 25-basis point decline in Fed reference rates to the 500-525 range expected November 7.
The European Central Bank (ECB) is broadly expected to deliver a quarter-point cut when the ECB meets this week on Thursday. With the rate differential between the EUR and the USD set to widen, albeit slightly, further downside for the Fiber could be on the cards, especially if Friday’s NFP shows a still-healthy US labor market. If Friday’s NFP print, expected to show the US added 190K net new jobs in May, higher than the previous month’s 175K.
EUR/USD technical outlook
EUR/USD fell back from 1.0900 on Tuesday, slipping back into near-term congestion after a fresh break into the pair’s highest bids since March. The Fiber has ground sideways in a large consolidation range for most of the year, and the pair remains down from 2024’s opening bids near 1.1037.
The Fiber’s long-term technical floor is priced in at the 200-day Exponential Moving Average (EMA) at 1.0797. Despite Tuesday’s declines, the pair remains up 2.65% from the year’s botto mbids set in mid-April near 1.0600.
EUR/USD daily chart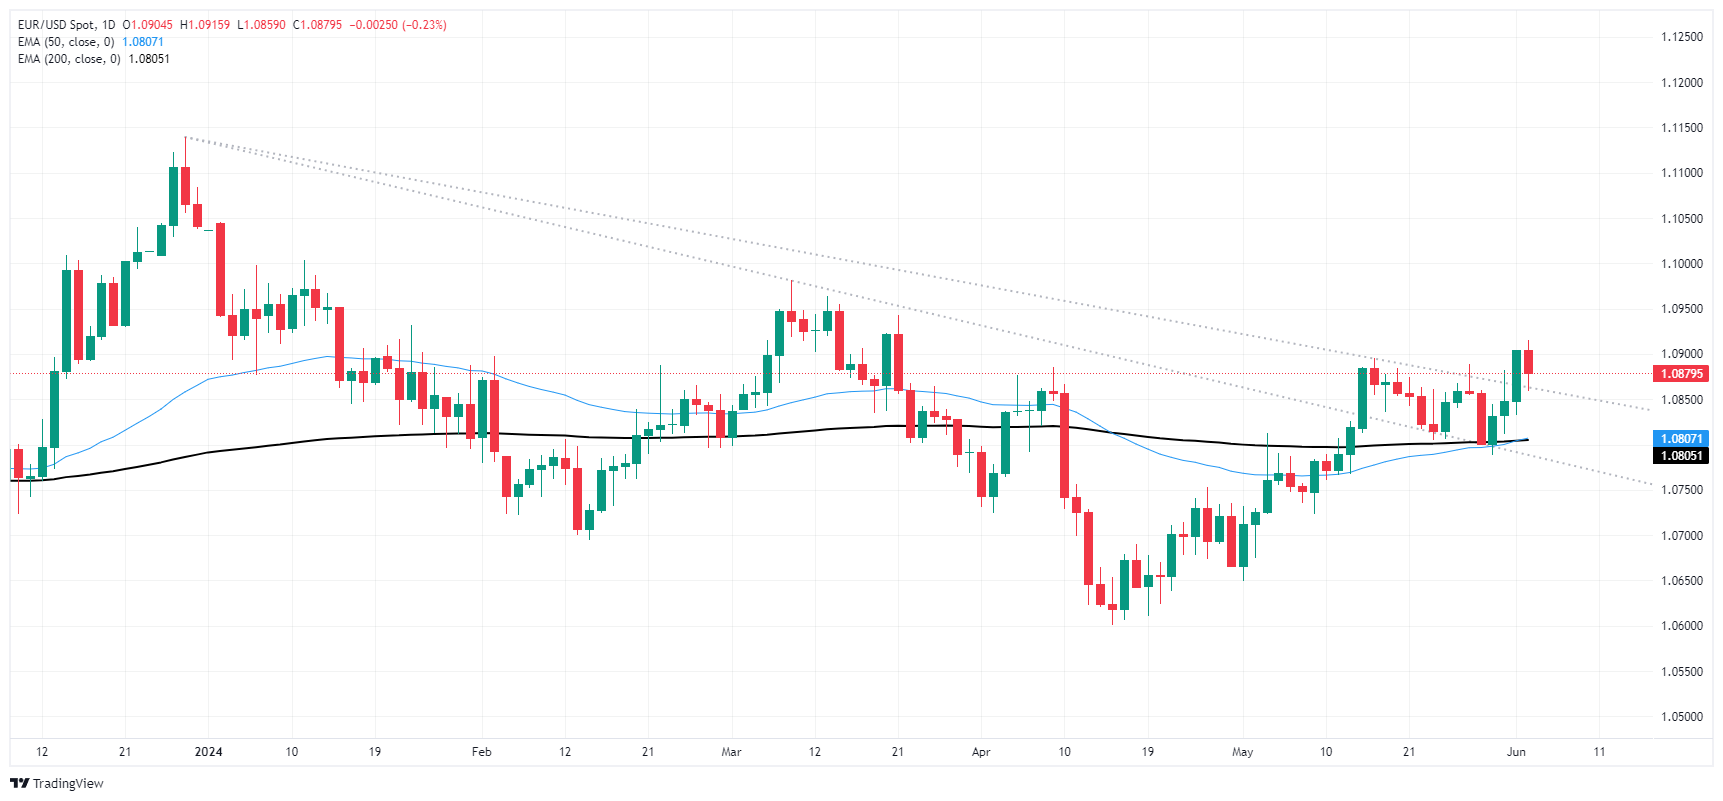
- Silver breaches key support levels amid ‘double top’ chart pattern confirmation.
- XAG/USD fall amid lower US T-bond yields as traders book profits.
- XAG/USD double top pattern objective would be $27.80.
Silver prices sank sharply on Tuesday amid falling US Treasury bond yields and a firm US dollar. The grey metal dropped more than 4% at the time of writing and trades at $29.48 after the XAG/USD hit a daily high of $30.88.
XAG/USD Price Analysis: Technical outlook
The XAG/USD fell below the latest cycle high seen on April 12 at $29.79, opening the door for deeper losses. Traders had witnessed the confirmation of a ‘double top’ chart pattern, opening the door to test key support levels on the way south.
The first one would be the psychological $29.00. A breach of the latter will expose previous key resistance levels that turned support, like the May 18, 2021, high of $28.74, followed by the June 10, 2021, high of $28.34. Up next would be the ‘double top’ objective at $27.80.
XAG/USD Price Action – Daily Chart

- GBP/USD declined 0.3% on Tuesday after risk-off USD bids.
- Softening UK data mixes poorly with declining Fed rate cut hopes.
- US markets set to pivot to key US labor data ahead of Friday’s NFP.
GBP/USD shed a third of a percent through Tuesday’s trading, falling below 1.2800 after short-lived bullish momentum carried the pair into its highest bids since mid-March. The Cable is falling back after three straight bullish days, and market sentiment is broadly pivoting into Greenback bids as hopes for a Federal Reserve (Fed) rate cut get pushed out to November.
UK BRC Like-For-Like Retail Sales grew less than expected for the year ended in May, printing at 0.4% YoY compared to the forecast 1.2%. UK retail sales data is struggling to recover from the previous period’s -4.4% decline. On the US side, JOLTS Job Opening in April eased to 8.059 million, down from the previous revised 8.355 million and missing the forecast 8.34 million. With a still-tight job market plaguing broad-market hopes for rate cuts, risk sentiment soured on the data miss.
The economic calendar remains thin through the remainder of the week, leaving investors to face further labor figures from the US with ADP Employment Change figures on Wednesday and another batch of monthly US Nonfarm Payrolls (NFP) figures on Friday. ADP’s Employment Change in May is forecast to ease to 173K from the previous 192K, while Friday’s NFP is expected to bounce to 190K from the previous 175K.
GBP/USD technical outlook
GBP/USD has fallen back from near-term highs above the 1.2800 handle, and is set for a rough decline to the lower bound of a choppy rising channel. The bottom could potentially get priced in between 1.2720 and 1.2740, though long-term bullish pressure will look for an extended rebound from the 200-day Exponential Moving Average (EMA) at 1.2739.
Bulls will have their work cut out for them with daily candlesticks set to tumble out of the bottom end of a heavy supply zone below 1.2900, and the immediate price floor for short momentum sits at the 200-day EMA at 1.2580.
GBP/USD hourly chart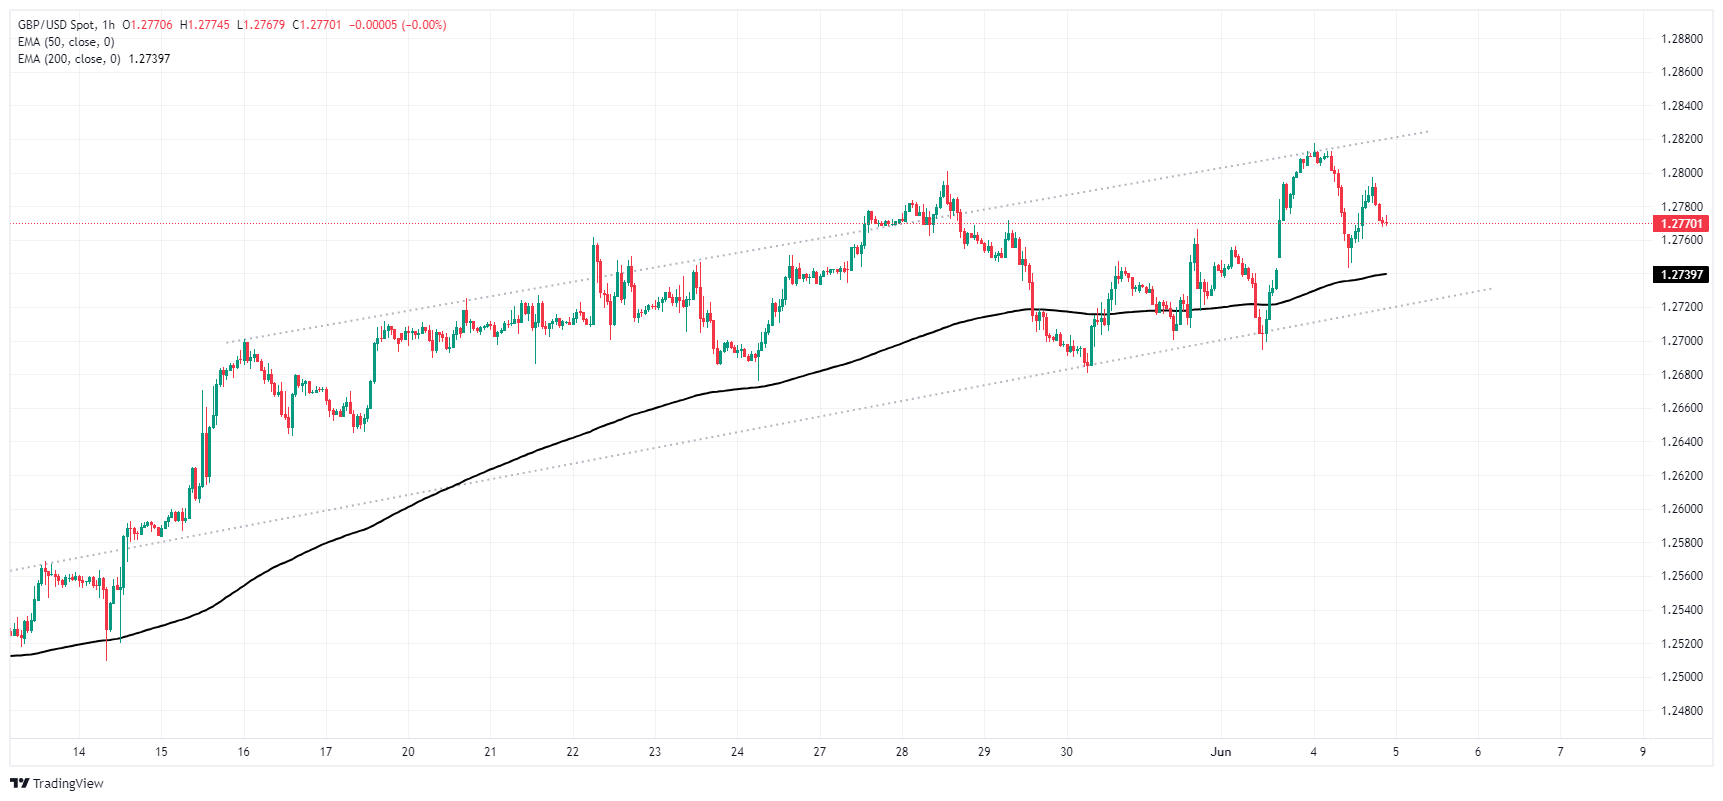
GBP/USD daily chart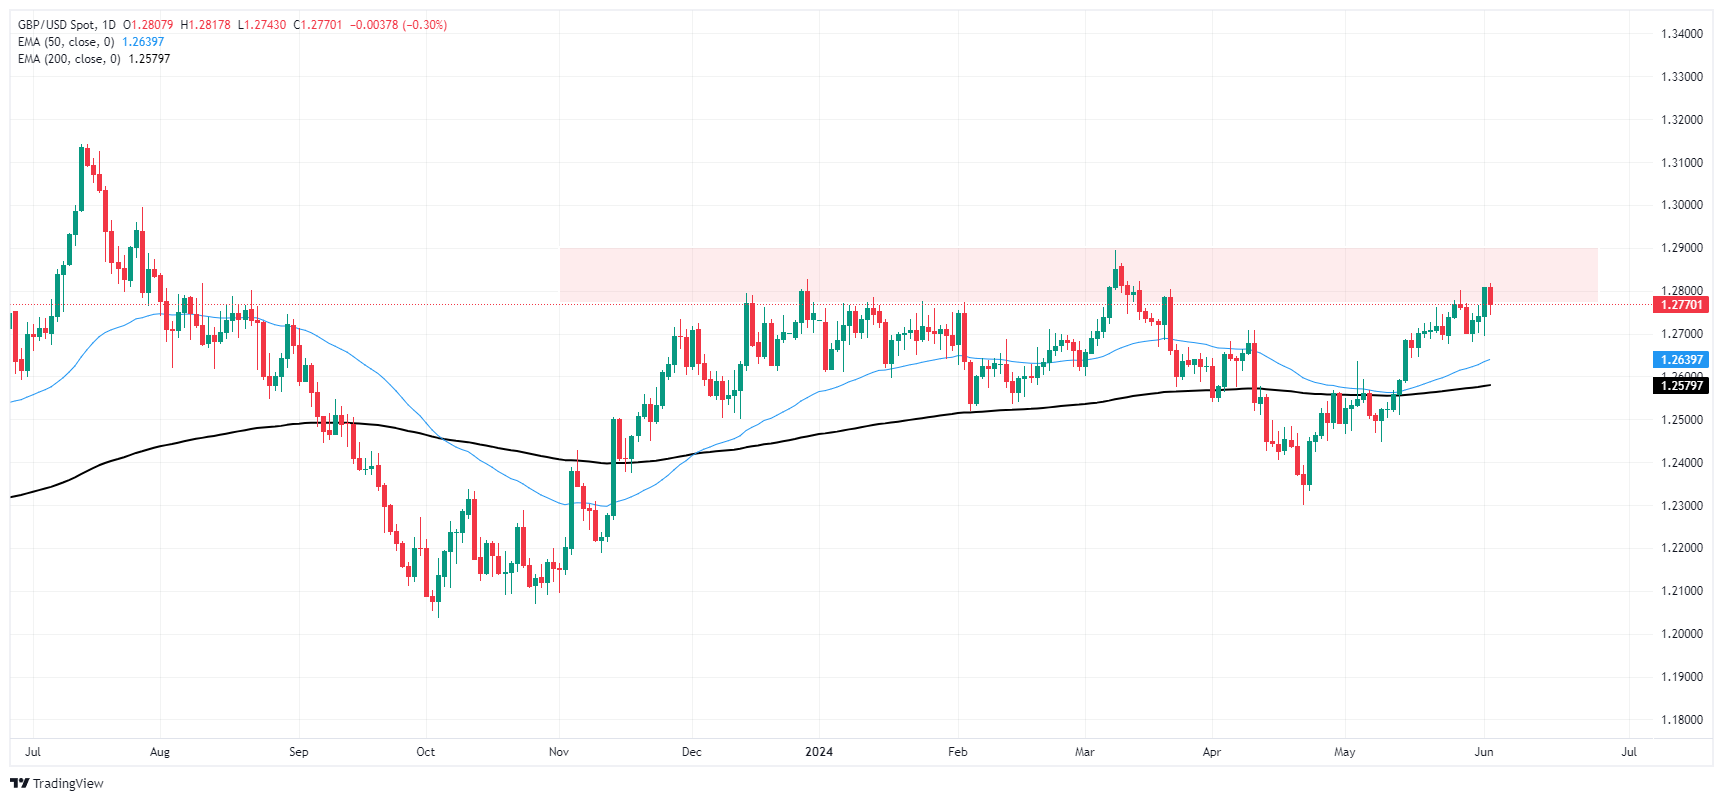
- The daily RSI has continued on its downward trajectory, backed by the rising red bards on the MACD.
- Previously strong support at 20-day SMA has been breached, opening the potential for further bearish movements in the short term.
- The existing bullish trend finds defense in the 100 and 200-day SMAs, around the 164.00 and 161.00 levels respectively.
In Tuesday's session, the EUR/JPY pair endured significant selling pressure pushing below the cross below the strong support level of the 20-day Simple Moving Average (SMA) at 169.30, and touching a low of 168.50. Although this bearish movement puts a dampener on the outlook over the short term, the overall bullish outlook remains unaffected.
This shift in momentum aligns with the downward turn noted in the daily Relative Strength Index (RSI), which now stands at 46, compared to the higher reading of 61 in Monday's session. This indicates a loss in buying momentum, echoed by the daily Moving Average Convergence Divergence (MACD) which exhibits increasing red bars.
EUR/JPY daily chart
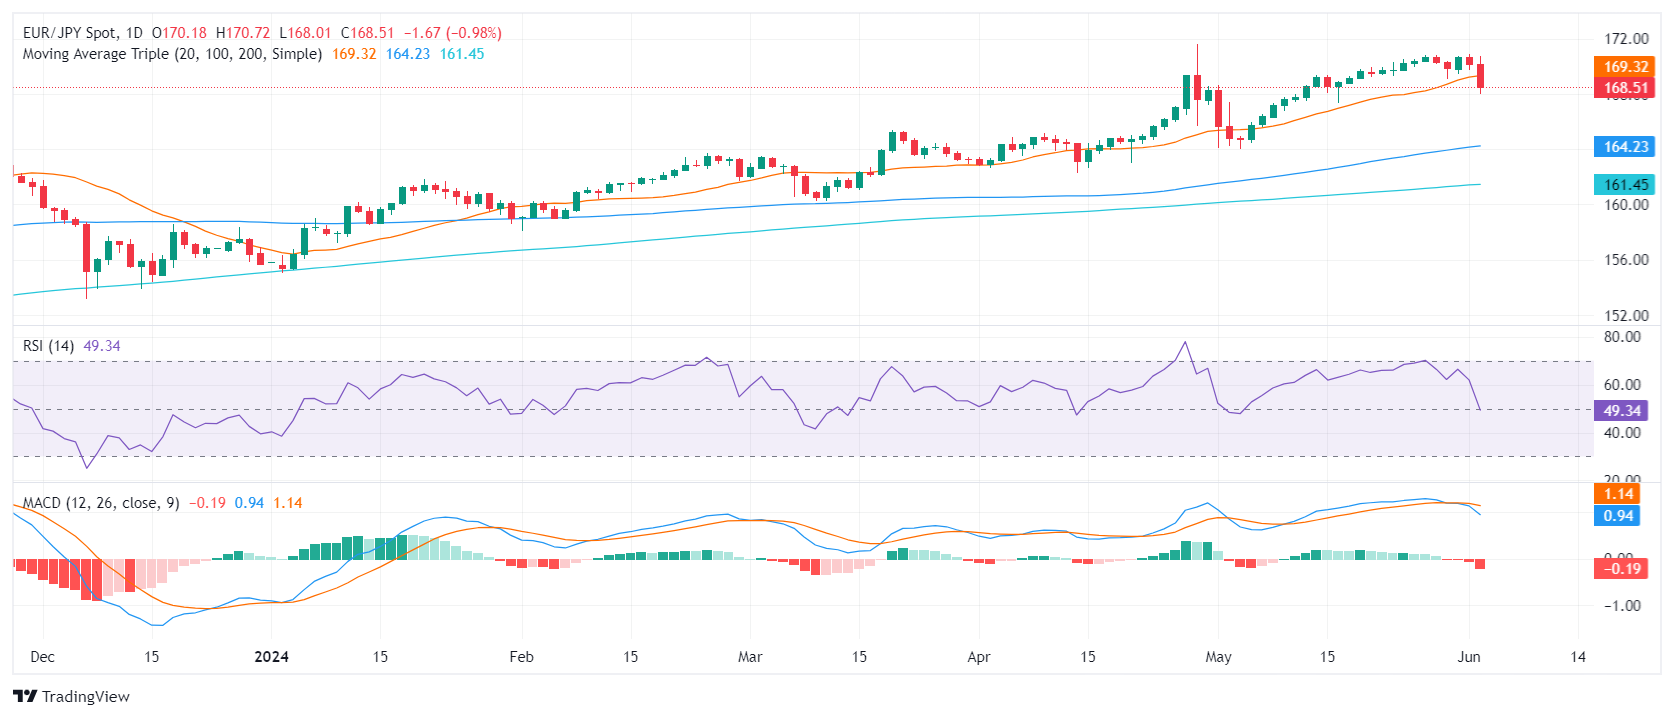
Looking at the broader picture, despite the short-term bearishness, the lengthy bullish trend remains unaffected for the moment. The support given by the 100 and 200-day Simple Moving Averages (SMAs) at 164.00 and 161.00 respectively will need to be broken in order to flip the table. Conversely, for the bulls to regain momentum, they will need to recapture the 169.30 region, which recently turned from support to resistance.
- USD/JPY falls below 155.00 inside the Ichimoku Cloud.
- The pair shifted neutral, consolidating inside the ‘cloud.’
- Key support levels: 154.72 (50-DMA), 154.00, and 153.31 (bottom of Kumo).
- Key resistance at 154.93 (Tenkan-Sen) and 156.17 (top of Kumo).
The USD/JPY plummeted some 0.80% late in the North American session, as economic data from the United States fueled speculations that the US Federal Reserve could lower rates in September. The pair traded at 154.72 after hitting a daily high of 156.48.
USD/JPY Price Analysis: Technical outlook
The USD/JPY has shifted from a neutral upward bias to neutral as prices tumbled inside the Ichimoku Cloud (Kumo) while testing the 50-day moving averages (DMA). Further consolidation is seen if buyers fail to push the exchange rate above the top of the Kumo at around 156.10-15.
The USD/JPY could remain within the 153.30-156.00 range. A breach of the 50-DMA at 154.72 exposes the 154.00 mark. Once those two levels are cleared, the next stop would be the bottom of the Kumo at 153.31.
Conversely, if buyers reclaim the 155.00 figure, the next resistance level would be the Tenkan-Sen at 154.93. Further resistance lies overhead, like the 155.00 psychological level, followed by the top of the Kumo at 156.17.
USD/JPY Price Action – Daily Chart

- Yen leverages strength against the Kiwi on Tuesday, pushing the NZD/JPY pair closer to the 20-day SMA.
- Sellers face growing momentum, but significant support at 96.30 remains unchallenged.
- The pair might have entered in a consolidation period after hitting multi-year highs.
On Tuesday, the NZD/JPY pair encountered sustained selling pressure as the Japanese Yen powered upwards against its rivals. Despite the sellers' incessant attempts, the critical support level at 95.30 remains strong which preserves an overall bullish outlook.
The Relative Strength Index (RSI) on the daily chart, currently at 54, shaved off the overbought status it held in Monday's session at 71, indicating a rapid negative momentum shift. Despite this, the RSI still comfortably sits in neutral territory, reflecting the subdued yet persistent bullish sentiment driving the pair. The Moving Average Convergence Divergence (MACD) continues to print rising red bars, suggesting an increase in selling momentum.
NZD/JPY daily chart

The NZD/JPY pair's encounter with the 20-day Simple Moving Average (SMA) at 95.30, showed that the buyers remain resilient and that the pair's outlook remains bullish. In case of losing it, the pair have additional supports which may limit losses at 95.00 and 94.00. As long as the cross holds above these levels, the overall outlook will be positive.
- WTI falls below $74.00 per barrel on increased oversupply concerns.
- Bets on Fed rate cuts have backslid further, markets now see November cut.
- Crude Oil sentiment slumps in the face of an extended wait for rate cuts.
West Texas Intermediate (WTI) US Crude Oil tumbled to fresh lows on Tuesday as energy market sentiment extended a pullback in risk appetite. The Organization of the Petroleum Exporting Countries (OPEC) and its extended network of non-meber ally states, OPEC+, recently unveiled plans to slowly walk back voluntary production cuts that were meant to bolster global Crude Oil prices.
OPEC+ announced on June 2 that the Crude Oil conglomerate would look at pohasing out production restrictions heading into the final quarter of 2024 after enacting voluntary production caps in 2023. OPEC+ member states, many of whom rely on Crude Oil production in order to balance their government budgets, have grown weary of carrying supply constraints championed by OPEC.
With global growth in Crude Oil demand failing to materialize as many investors had anticipated, barrel bids are declining as few traders see a reason to buy up long-dated Crude Oil as global supply is set to grow an overhang on demand figures.
Crude Oil traders will be pivoting to week-on-week US supply counts from the American Petroleum Institute (API) and the Energy Information Administration (EIA). Weekly Crude Oil stocks reporting recently showed a sharp decline in raw barrel counts at US storage facilities, but refinery stocks have been swamped by overproduction after the run-up into the Memorial Day holiday driving season, usually marked by a notable upswing in gasoline demand, failed to spark consumer draws anywhere near producers’ hoped levels.
Mixed data on Tuesday drove rate cut bets even lower, and according to the CME’s FedWatch Tool, rate traders are fully pricing in a first quarter-point cut from the Federal Reserve (Fed) in November.
WTI technical outlook
WTI tumbled to fresh multi-month lows near $72.50 on Tuesday, and US Crude Oil is grappling with chart territory south of $74.00 per barrel. WTI has slid nearly 16% from 2024’s peak bids above $87.00 per barrel, and US Crude Oil bids are up a scant 2.5% from the year’s opening prices near $71.40.
WTI daily chart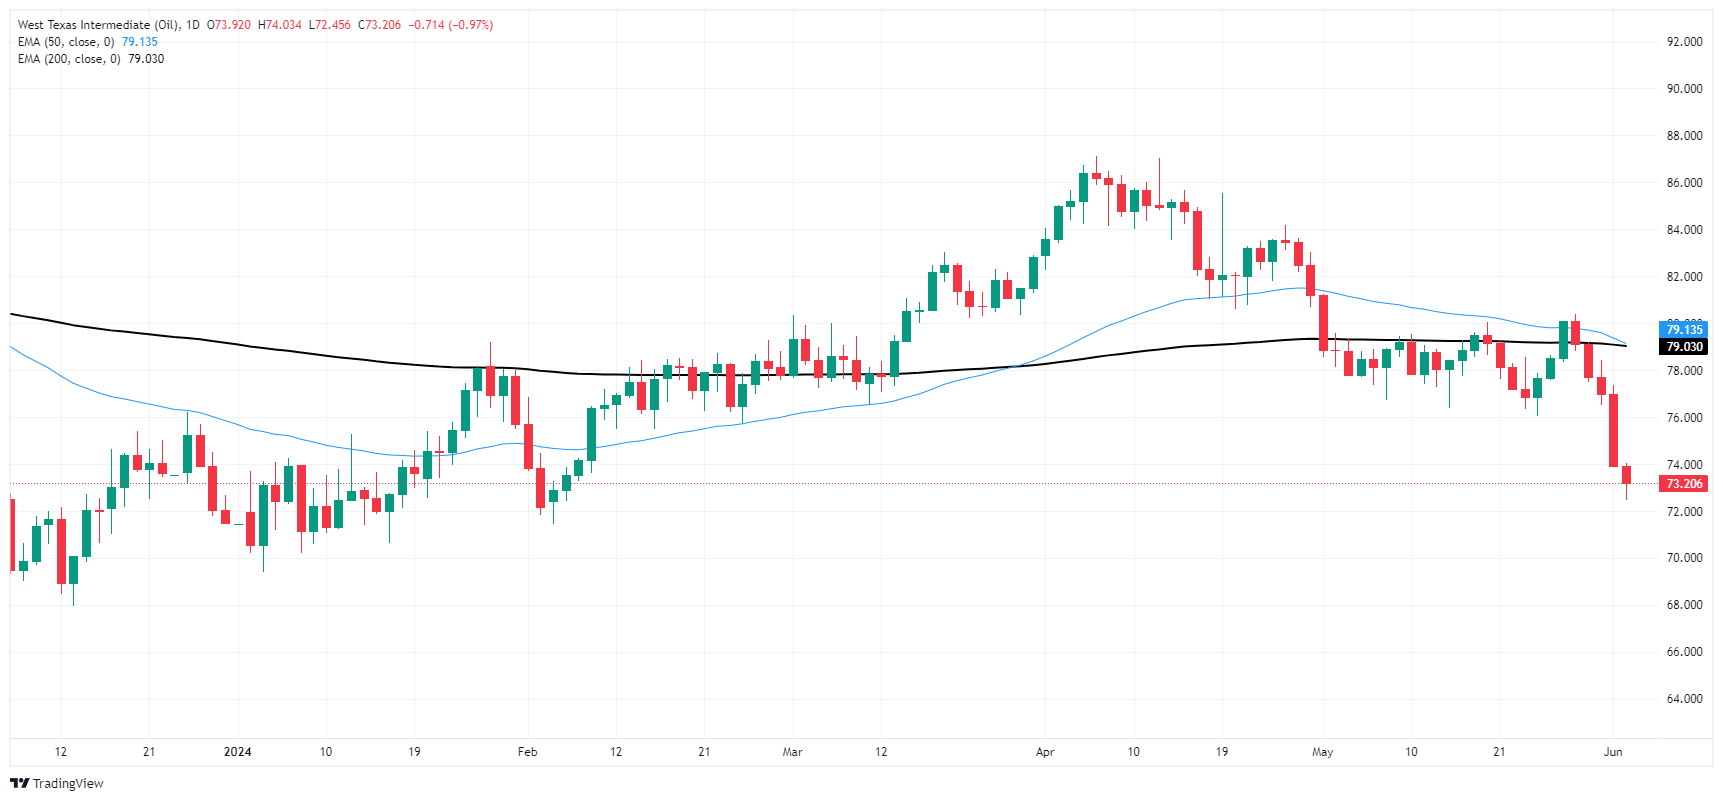
The Greenback managed to reverse part of the recent weakness after bottoming out in multi-week lows against the backdrop of rising speculation of an interest rate cut by the Fed in November, while investors get ready for key upcoming US data releases.
Here is what you need to know on Wednesday, June 5:
The USD Index (DXY) advanced slightly after briefly testing two-month lows near 104.00. On June 5, MBA’s Mortgage Applications are due seconded by ADP Employment Change, the final S&P Global Services PMI and the ISM Services PMI.
EUR/USD came under pressure soon after hitting fresh tops in the 1.0915-1.0920 band. The final HCOB Services PMI is due in Germany and the broader Euroland on June 5.
GBP/USD followed the selling pressure in the risk complex and ended with marked losses despite reaching fresh highs north of 1.2800. The final S&P Global Services PMI is expected on June 5.
The continuation of the retracement in US yields plus comments from a BoJ official supported another positive session of the Japanese currency, dragging USD/JPY to three-week lows.
After three consecutive daily advances, AUD/USD succumbed to the uptick in the Dollar and the bearish tone in the commodity complex, revisiting the 0.6630 zone. On June 5, the Ai Group Industry Index comes ahead of the final Judo Bank Services PMI and the GDP Growth Rate Q1.
WTI collapsed around 5% and broke below the $73.00 mark per barrel as traders continued to assess the latest OPEC+ meeting and persistent demand concerns.
Prices of Gold maintained its range bound trade unchanged for yet another session on the back of the small uptick in the Dollar and diminishing yields. Silver also traded on the defensive, deflating to three-week lows after breaching the key $30.00 mark per ounce.
- Gold drops 0.90% as commodities face widespread pressure.
- US Treasury yields fall seven basis points, but the Greenback gains marginally, with the DXY up 0.04% to 104.08.
- US JOLTS data hit three-year low, showing economic slowdown alongside below-estimate Durable Goods Orders.
Gold prices retreat some 0.90% in the mid-North American session on Tuesday, amid a risk-off impulse and despite falling US Treasury bond yields. The latest tranche of US economic data shows the economy is slowing down, warranting lower interest rates. Despite that, the XAU/USD trades with losses and exchanges hands at $2328.
The golden metal has fallen below $2350 a troy ounce as commodities plunges across the board. Oil prices were under heavy pressure earlier amidst fears that the global economy might grow at a slower pace, which could dent demand for crude.
US Treasury yields, which usually correlate inversely to Gold prices, were also down seven basis points, as depicted by the US 10-year T-note yield.
Contrarily, the Greenback is trading with marginal gains of 0.04%, as depicted by the US Dollar Index (DXY). The DXY tracks the greenback against a basket of six currencies and is up at 104.08.
Data-wise, the US economic docket featured the release of April’s JOLTS data and Durable Goods Orders. The reports showcased that the economy remains resilient yet weak amid higher borrowing costs set by the US Federal Reserve.
Following the data release, the December 2024 fed funds rate futures contract showed that most traders expect at least 36 basis points of rate cuts via the Chicago Board of Trade (CBOT).
Consequently, US Treasury bond yields dropped, and the Greenback extended its losses to three straight days. The US 10-year Treasury bond yields plunged eleven basis points to 4.392%. The US Dollar Index (DXY), which tracks the performance against a basket of six currencies, fell 0.5% to 104.07.
Daily Digest Market Movers: Gold price falls as US Treasury yields retreat
- Tuesday’s US economic docket featured the US JOLTs Job Openings report, which decreased from 8.355 million to 8.059 million in April, falling short of the estimated 8.34 million.
- US Durable Goods Orders rose by 0.6% month-over-month in April, which is below both the estimates and the previous reading of 0.7%.
- Last week, the US Core Personal Consumption Expenditure Price Index (PCE), the Fed’s preferred inflation gauge, stabilized, boosting hopes for potential rate cuts.
- Meanwhile, business activity showed mixed results, with the S&P Global Manufacturing PMI expanding, while the Institute for Supply Management (ISM) Manufacturing PMI contracted for the second consecutive month.
- Traders are currently pricing about a 54.9% chance of a rate cut, according to the CME FedWatch Tool.
- The US economic docket during the week will feature ADP Employment Change ahead of Friday’s Nonfarm Payrolls.
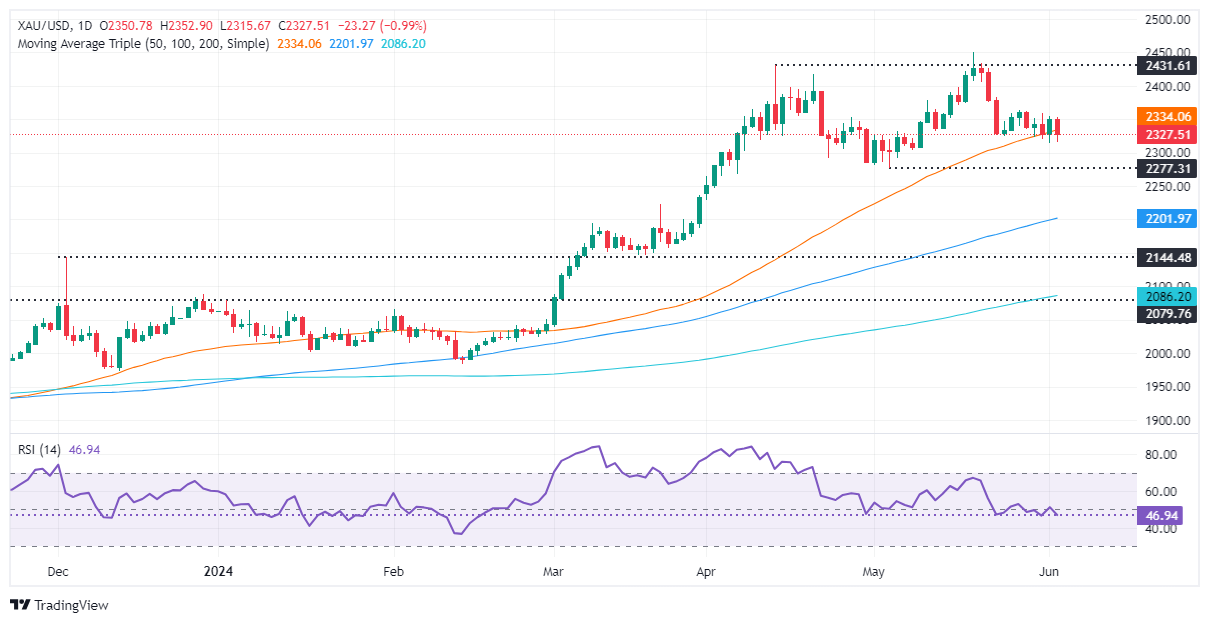
Technical analysis: Gold price slips below $2,350
Gold’s rally remains in place, though the spot prices have fallen below the 50-day Simple Moving Average (SMA) of $2,334. Price action and the momentum shifted in favor of the sellers could pave the way for a pullback. The Relative Strength Index (RSI) turned bearish, below the 50 midline, opening the door for further Gold’s losses.
Once the XAU/USD fell below the 50-day Simple Moving Average (SMA) at $2,334, that could pave the way to challenge the May 8 low of $2,303, followed by the May 3 cycle low of $2,277.
Further gains lie ahead if XAU/USD buyers reclaim $2,350. Up next would be the $2,400 level, followed by the year-to-date high of $2,450 and, subsequently, the $2,500 mark.
Gold FAQs
Gold has played a key role in human’s history as it has been widely used as a store of value and medium of exchange. Currently, apart from its shine and usage for jewelry, the precious metal is widely seen as a safe-haven asset, meaning that it is considered a good investment during turbulent times. Gold is also widely seen as a hedge against inflation and against depreciating currencies as it doesn’t rely on any specific issuer or government.
Central banks are the biggest Gold holders. In their aim to support their currencies in turbulent times, central banks tend to diversify their reserves and buy Gold to improve the perceived strength of the economy and the currency. High Gold reserves can be a source of trust for a country’s solvency. Central banks added 1,136 tonnes of Gold worth around $70 billion to their reserves in 2022, according to data from the World Gold Council. This is the highest yearly purchase since records began. Central banks from emerging economies such as China, India and Turkey are quickly increasing their Gold reserves.
Gold has an inverse correlation with the US Dollar and US Treasuries, which are both major reserve and safe-haven assets. When the Dollar depreciates, Gold tends to rise, enabling investors and central banks to diversify their assets in turbulent times. Gold is also inversely correlated with risk assets. A rally in the stock market tends to weaken Gold price, while sell-offs in riskier markets tend to favor the precious metal.
The price can move due to a wide range of factors. Geopolitical instability or fears of a deep recession can quickly make Gold price escalate due to its safe-haven status. As a yield-less asset, Gold tends to rise with lower interest rates, while higher cost of money usually weighs down on the yellow metal. Still, most moves depend on how the US Dollar (USD) behaves as the asset is priced in dollars (XAU/USD). A strong Dollar tends to keep the price of Gold controlled, whereas a weaker Dollar is likely to push Gold prices up.
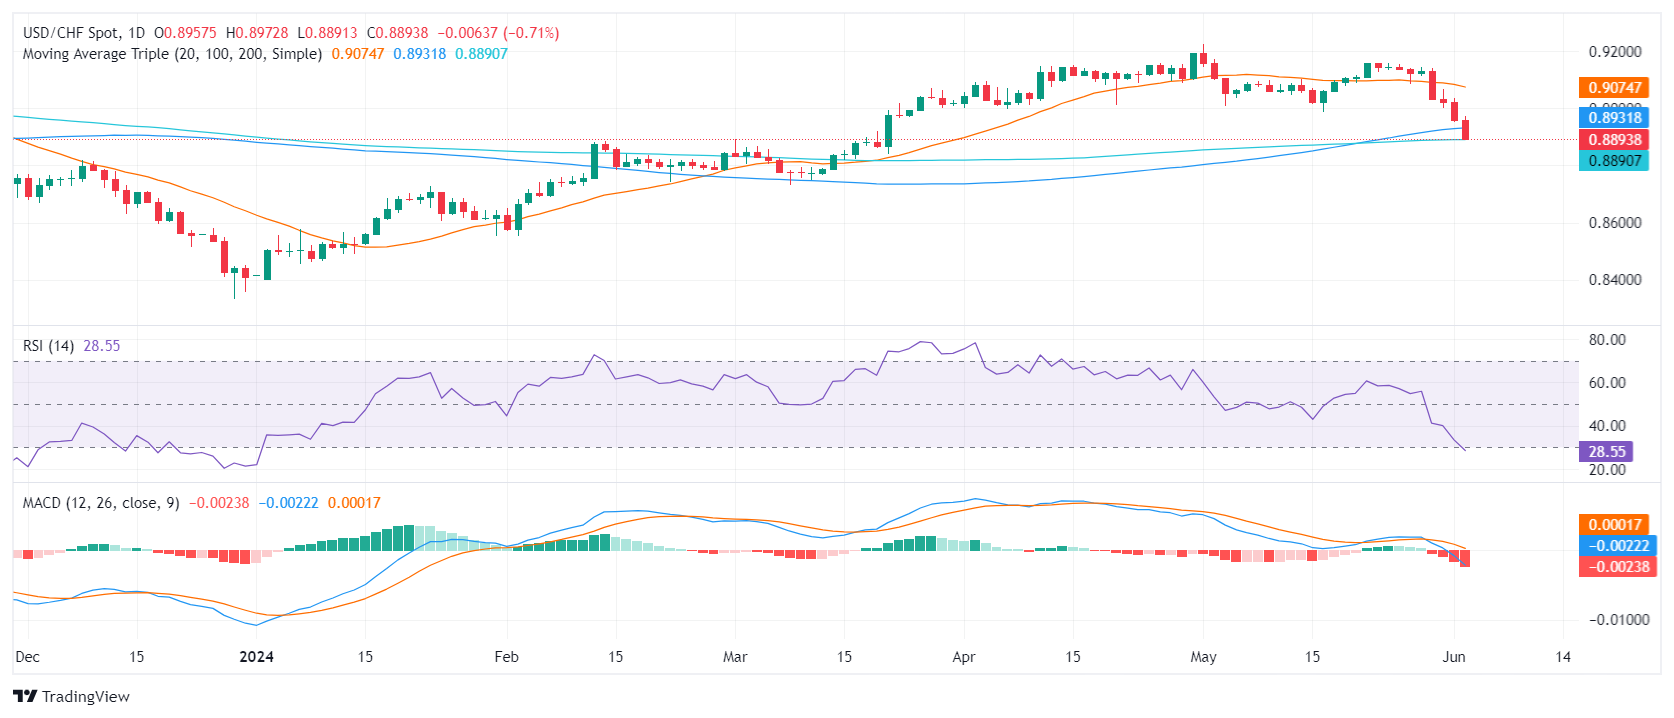
- USD/CHF faced turbulence in Tuesday’s session, dipping further towards 0.8890.
- CPI data from Switzerland came in steady.
- The likelihood of rate cuts in September by the Fed remains bound to the outcome of labor market data to be reported this week.
The USD/CHF pair is trending lower following recent JOLTS data released on Tuesday which showed a lower number of job openings than initially predicted from the US. Markets also are digesting inflation data from Switzerland.
The number of job openings in the US on the last business day of April was reported to be 8.059 million, a figure below the market's expectation of 8.34 million. This follows the unexpected March figures, which were revised to 8.35 million from 8.48 million. Despite this, the market maintains hope for the first-rate cut to occur in September, but those odds may change as investors are expecting a fresh Nonfarm Payroll report from May, due on Friday. ADP data and Jobless Claims on Wednesday and Thursday will also be looked at.
In Switzerland, inflation steadied as forecasted at 1.4% YoY for May while the core inflation was slightly lower than expected, at 1.2% YoY. On the Swiss National Bank (SNB), the bank had previously commenced its easing cycle in March, with a 25 bps cut to 1.5%. The market is currently pricing in about 55% odds for another rate cut at the next meeting on June 20.
USD/CHF technical analysis
On the technical front, indicators have plunged deep into negative territory with the daily RSI already signaling oversold conditions. This is followed by the Moving Average Convergence Divergence (MACD) which prints red bars. This may suggest that an upward correction could be imminent. However, the pair has now lost its position above both the 20-day SMA at 0.9095 and the 100-day SMA, pointing towards a more bearish short-term outlook. The 200-day SMA offers additional support to prevent losses.
USD/CHF daily chart
- Dow Jones treads water near 38,550.00 after US data comes in mixed.
- US Factory Orders activity rises, but with steep revisions.
- First batch of labor figures comes in softer ahead of Friday’s NFP print.
The Dow Jones Industrial Average (DJIA) is struggling to make gains on Tuesday after US data gave investors little reason to push the needle in either direction. US factory activity rose faster than expected in April, but previous prints saw a harsh downside revision. JOLTS April employment vacancies declined, revealing a still-tight labor market as Friday’s US Nonfarm Payrolls (NFP) looms ahead later in the week.
April’s Factory Orders rose 0.7% MoM, beating the forecast 0.6% but the previous print saw a sharp downside correction, getting revised to 0.7% from the initial print of 1.6%. JOLTS Job Openings in April fell to 8.059 million, below the forecast 8.34 million and easing from the previous 8.355 million, which was revised from 8.488 million. Looking deeper into the JOLTS figures, the labor vacancy rate fell to 4.8% from the previous 5.0%, while the number of job openings remained little-changed at 8.1 million overall. A tightening job market helped to shave some points off of Treasury yields, but the move lower in bonds did little to support equities on Tuesday.
With markets fully pricing in a first quarter-point cut from the Federal Reserve (Fed) in November, investors will be pivoting to Friday’s NFP labor figures, hoping for signs of further easing in the US economy that could push the Fed towards rate cuts sooner rather than later. Friday’s NFP print is expected to show the US economy added 190K new jobs in May, up from the previous month’s print of 175K.
Dow Jones news
The Dow Jones is stuck in the midrange on Tuesday, with roughly half of the major equity index’s constituent securities facing small losses on the day. Caterpillar Inc. (CAT) is leading the charge lower, down -1.45% to $326.68 per share. On the high side, Honeywell International Inc. (HON) climbed 2.22% to $206.93 per share on Tuesday. HON is slowly gaining ground after investors initially balked at Honeywell’s completion of a $4.95 billion acquisition of Carrier, a digital security firm focused on cloud-based storage protection. Investors remain skeptical that the acquisition will contribute as much to Honeywell’s diversification into digital services as the company hopes.
Dow Jones technical outlook
Dow Jones continues to grind chart paper near 38,550.00 after tumbling to near-term lows at the 38,000.00 handle. The major equity index clipped into record highs just above 40,000.00 in May, but bulls are struggling to keep bids on-balance as broader sentiment sags.
The DJIA is still trading deep into bull country, well above the 200-day Exponential Moving Average (EMA) at 37,275.22, but investors will need firmer signs of Fed rate cuts before resuming the buying party and pushing the Dow Jones back into record highs. The index is still up 2.45% in 2024, but recent short pressure has dragged the DJIA down -3.6% from all-time peaks above 40,000.00.
Dow Jones five minute chart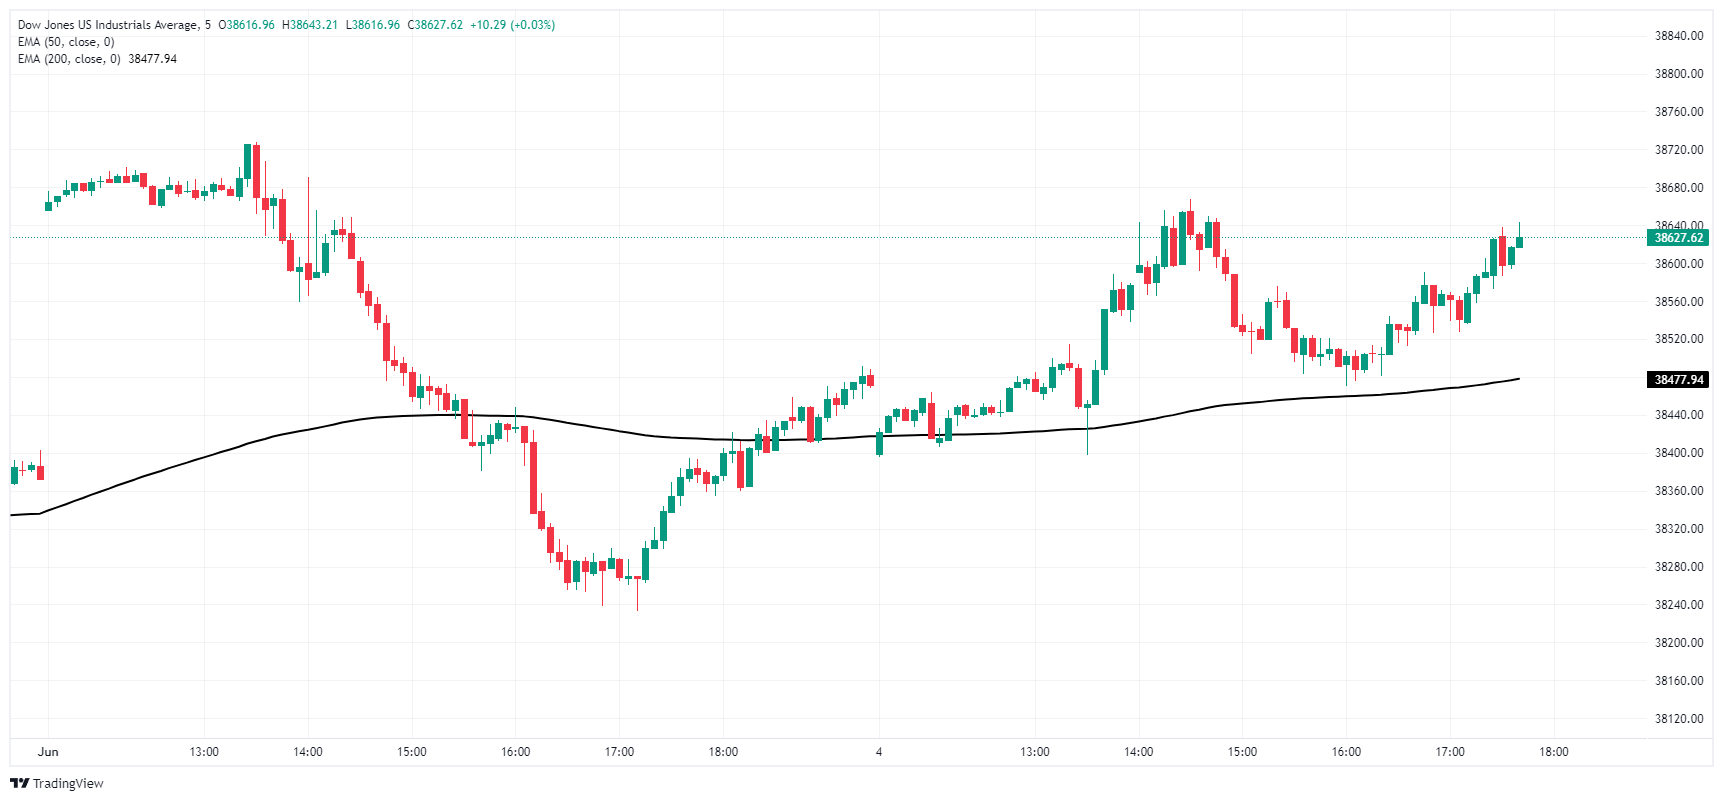
Dow Jones daily chart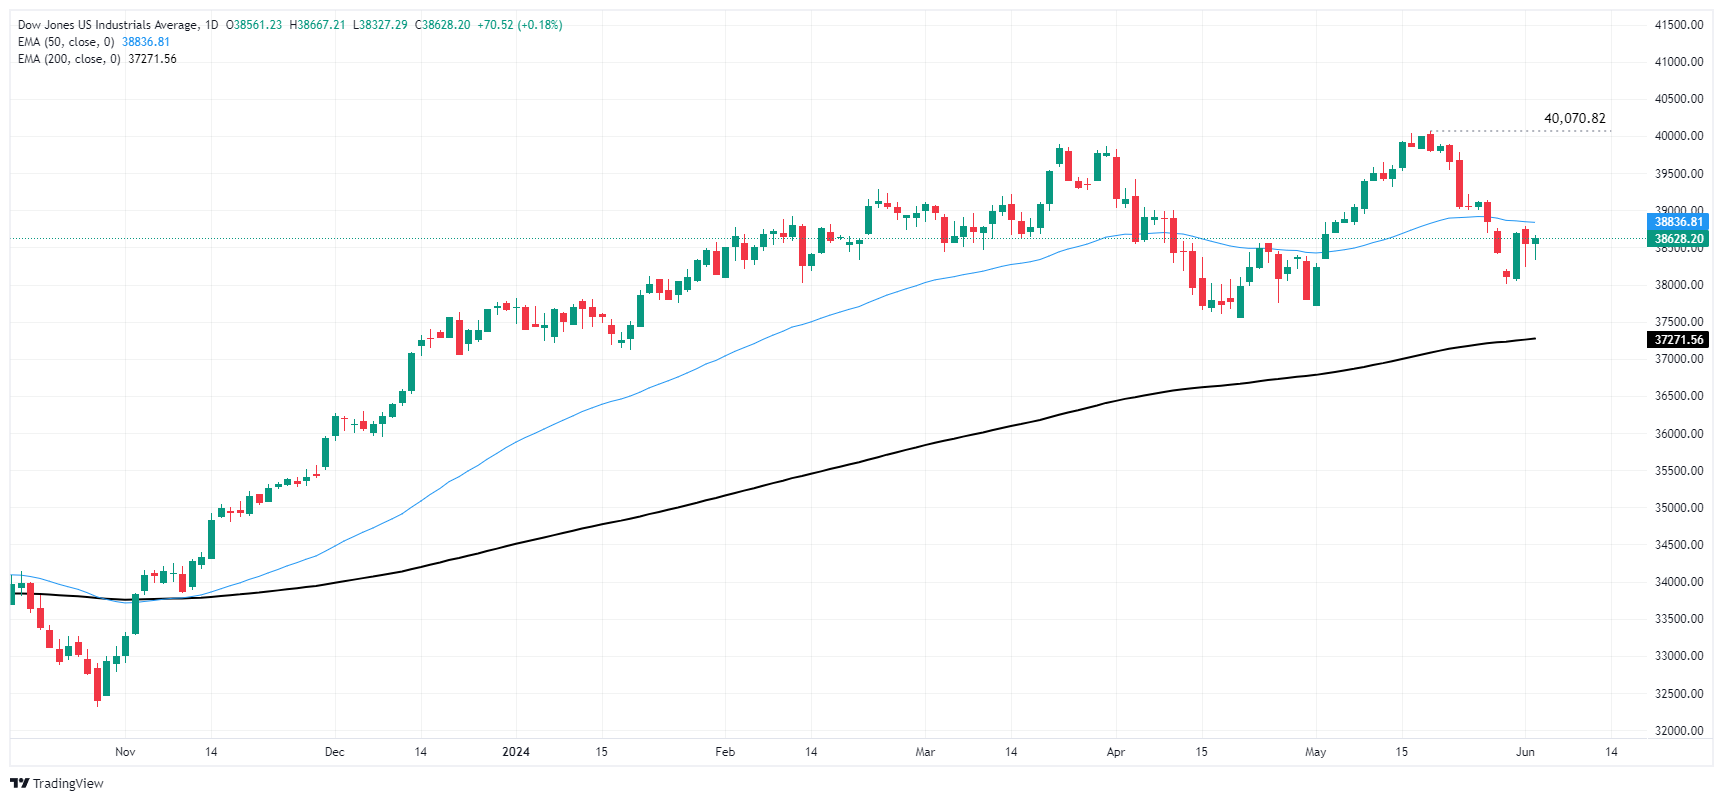
Dow Jones FAQs
The Dow Jones Industrial Average, one of the oldest stock market indices in the world, is compiled of the 30 most traded stocks in the US. The index is price-weighted rather than weighted by capitalization. It is calculated by summing the prices of the constituent stocks and dividing them by a factor, currently 0.152. The index was founded by Charles Dow, who also founded the Wall Street Journal. In later years it has been criticized for not being broadly representative enough because it only tracks 30 conglomerates, unlike broader indices such as the S&P 500.
Many different factors drive the Dow Jones Industrial Average (DJIA). The aggregate performance of the component companies revealed in quarterly company earnings reports is the main one. US and global macroeconomic data also contributes as it impacts on investor sentiment. The level of interest rates, set by the Federal Reserve (Fed), also influences the DJIA as it affects the cost of credit, on which many corporations are heavily reliant. Therefore, inflation can be a major driver as well as other metrics which impact the Fed decisions.
Dow Theory is a method for identifying the primary trend of the stock market developed by Charles Dow. A key step is to compare the direction of the Dow Jones Industrial Average (DJIA) and the Dow Jones Transportation Average (DJTA) and only follow trends where both are moving in the same direction. Volume is a confirmatory criteria. The theory uses elements of peak and trough analysis. Dow’s theory posits three trend phases: accumulation, when smart money starts buying or selling; public participation, when the wider public joins in; and distribution, when the smart money exits.
There are a number of ways to trade the DJIA. One is to use ETFs which allow investors to trade the DJIA as a single security, rather than having to buy shares in all 30 constituent companies. A leading example is the SPDR Dow Jones Industrial Average ETF (DIA). DJIA futures contracts enable traders to speculate on the future value of the index and Options provide the right, but not the obligation, to buy or sell the index at a predetermined price in the future. Mutual funds enable investors to buy a share of a diversified portfolio of DJIA stocks thus providing exposure to the overall index.
- Mexican Peso hits new yearly low of 18.19 during European session before retreating.
- Mexican finance minister reassures markets, emphasizes financial discipline and investment.
- US job openings hit three-year low, signaling economic slowdown alongside below-estimate Durable Goods Orders.
The Mexican Peso edges lower against the US Dollar for the second straight day on Tuesday, though it has trimmed some earlier losses after hitting a new yearly high of 18.19 during the European session. However, softer US jobs data and Mexican Finance Minister Rogelio Ramirez de la O's conference call tempered volatility in the exotic pair. The USD/MXN trades at 17.90, gaining 1.25%.
The Mexican currency has lost almost 5% during the last few days. Therefore, Mexico’s Finance Minister, Rogelio Ramirez de la O, held a conference call earlier during the North American session to calm the financial markets after the Peso depreciated more than 4% and the Mexican Stock Exchange plummeted more than 6%.
He said, “We want to confirm to international organizations and private investors that our project is based on financial discipline, abiding by the autonomy of the Bank of Mexico, adherence to the rule of law and facilitating national and foreign private investment,” according to El Financiero.
Ramirez de la O accepted Dr. Claudia Sheinbaum’s invitation to remain in charge of Mexico’s finances once President Andres Lopez finished his term on September 30.
Morena’s overwhelming victory in the general election sounded the alarms of possible constitutional reforms that could eliminate autonomous regulators and threaten Mexican democracy.
Once the election results are confirmed, Morena will have a two-thirds majority in both houses, which could lead to a change in the Mexican Constitution.
According to the Wall Street Journal, “The proposed initiatives include allowing for the direct election of judges, slimming down congress, and eliminating the autonomous election agency. It would also boost the government’s role in the energy sector.”
Goldman Sachs analyst Alberto Ramos said, “Some bills are perceived as leading to institutional erosion and weakening the current checks and balances, and several are not viewed as market-friendly.”
In addition, Mexico’s economic docket revealed that fixed investment slowed in March, according to the National Statistics Agency (INEGI).
Across the border, the US Bureau of Labor Statistics (BLS) revealed that job openings dropped to their lowest level in three years, as depicted by the JOLTS report. Other data shows the economy is slowing as April Durable Goods Orders missed estimates and ticked lower.
Daily digest market movers: Mexican Peso on defensive as selling pressure continues
- Gross Fixed Investment in Mexico increased from 0.7% to 0.8% MoM in March. On a yearly basis, it showed a deceleration, expanding by just 3%, down from 12.5%.
- September should be a crucial month for the Mexican Congress. Morena’s majority could push bills blocked by the opposition, including the reduction of lawmakers and plans for direct election of the Supreme Court members.
- Morgan Stanley noted that if Mexico’s upcoming government and Congress adopted an unorthodox agenda, it would undermine Mexican institutions and be bearish for the Mexican Peso, which could weaken to 19.20.
- Speculation of another Banxico rate cut in June could pave the way for further upside in the USD/MXN.
- US JOLTs Job Openings in April edged lower from 8.355 million to 8.059 million, below estimates of 8.34 million.
- US Durable Goods Orders increased 0.6% MoM in April, below estimates and the previous reading of 0.7%
- The futures markets suggest the Federal Reserve might cut rates by 35 basis points in 2024, according to the December 2024 fed funds future rate contract.
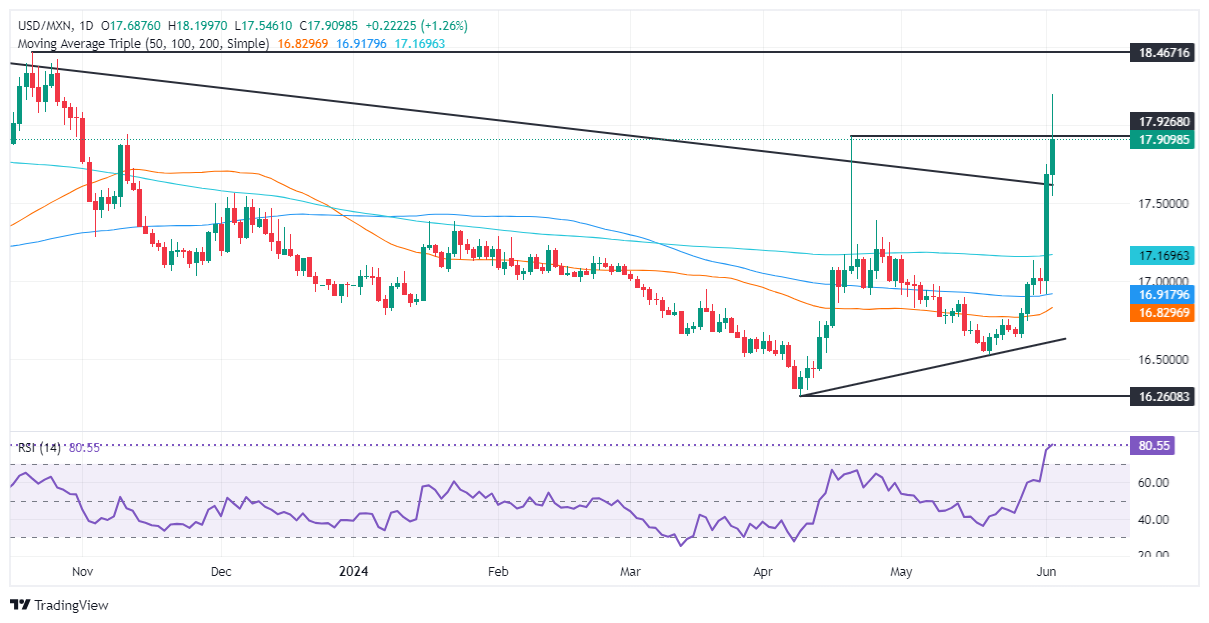
Technical analysis: Mexican Peso depreciates as USD/MXN rallies above 17.90
As mentioned on Monday, “The USD/MXN downtrend begins to be threatened due to political uncertainty.”
The pair has decisively broken above the 200-day Simple Moving Average (SMA) and continued to extend its gains. The pair hit 18.19 during the European session but recovered some ground during the North American session.
Even though the Relative Strength Index (RSI) is strongly overbought, momentum has shifted to the upside.
That said, if the USD/MXN clears the psychological 18.00 figure, up next would be the year-to-date (YTD) high of 18.15. Further gains are seen above the latter, on October 6, 2023, at a high of 18.48, before the exotic pair trends up toward the 19.00 figure.
On the downside, if sellers push the exchange rate below the 17.00 figure, that could pave the way to test the YTD low of 16.25.
Mexican Peso FAQs
The Mexican Peso (MXN) is the most traded currency among its Latin American peers. Its value is broadly determined by the performance of the Mexican economy, the country’s central bank’s policy, the amount of foreign investment in the country and even the levels of remittances sent by Mexicans who live abroad, particularly in the United States. Geopolitical trends can also move MXN: for example, the process of nearshoring – or the decision by some firms to relocate manufacturing capacity and supply chains closer to their home countries – is also seen as a catalyst for the Mexican currency as the country is considered a key manufacturing hub in the American continent. Another catalyst for MXN is Oil prices as Mexico is a key exporter of the commodity.
The main objective of Mexico’s central bank, also known as Banxico, is to maintain inflation at low and stable levels (at or close to its target of 3%, the midpoint in a tolerance band of between 2% and 4%). To this end, the bank sets an appropriate level of interest rates. When inflation is too high, Banxico will attempt to tame it by raising interest rates, making it more expensive for households and businesses to borrow money, thus cooling demand and the overall economy. Higher interest rates are generally positive for the Mexican Peso (MXN) as they lead to higher yields, making the country a more attractive place for investors. On the contrary, lower interest rates tend to weaken MXN.
Macroeconomic data releases are key to assess the state of the economy and can have an impact on the Mexican Peso (MXN) valuation. A strong Mexican economy, based on high economic growth, low unemployment and high confidence is good for MXN. Not only does it attract more foreign investment but it may encourage the Bank of Mexico (Banxico) to increase interest rates, particularly if this strength comes together with elevated inflation. However, if economic data is weak, MXN is likely to depreciate.
As an emerging-market currency, the Mexican Peso (MXN) tends to strive during risk-on periods, or when investors perceive that broader market risks are low and thus are eager to engage with investments that carry a higher risk. Conversely, MXN tends to weaken at times of market turbulence or economic uncertainty as investors tend to sell higher-risk assets and flee to the more-stable safe havens.
- USD manages to hold its ground on Tuesday after sharp losses on Monday due to disappointing May ISM PMIs.
- JOLTS for April reported a lower-than-expected job opening.
- Markets await upcoming Nonfarm Payrolls report and wage growth data for further insights into the Fed's policy outlook.
On Tuesday, the US Dollar Index (DXY) saw moderate gains despite soft labor market data reported by the US Bureau of Labor Statistics. The previously bearish market environment, fueled by weak Institute for Supply Management (ISM) PMI data for May, appeared to stabilize. That being said, the market seems to be building concerns around a weakening US economy that might prompt the Federal Reserve (Fed) to cut rates sooner.
Market attention has now shifted to additional labor market data that will include ADP Employment Change figures, Nonfarm Payrolls, Wage inflation, and Unemployment data for May, which will give additional insights into the US economy.
Daily digest market movers: USD holds ground despite soft JOLTS data
- Markets displayed unease with the JOLTS report indicating fewer job openings in April.
- Job openings in April were reported to be 8.059 million, lower than both the expected 8.34 million and March's revised figure of 8.35 million, according to data released on Tuesday by the BLS.
- Falling job openings contributed to the market's wariness, escalating speculation of a Fed interest rate cut in September to nearly 60%.
- Upcoming Nonfarm Payrolls report for May and wage growth data will be crucial in further influencing the Fed's future policy direction.
DXY technical analysis: US Dollar sees short relief despite negative indicators
Despite the slight gains on Tuesday, the DXY outlook continues to be negative. Indicators such as the Relative Strength Index (RSI) and Moving Average Convergence Divergence (MACD) remain in negative territory, reflecting persistent bearish sentiment and selling pressure.
After falling below the 20,100 and 200-day Simple Moving Averages (SMAs), the overall trend has turned in favor of the sellers.
US Dollar FAQs
The US Dollar (USD) is the official currency of the United States of America, and the ‘de facto’ currency of a significant number of other countries where it is found in circulation alongside local notes. It is the most heavily traded currency in the world, accounting for over 88% of all global foreign exchange turnover, or an average of $6.6 trillion in transactions per day, according to data from 2022. Following the second world war, the USD took over from the British Pound as the world’s reserve currency. For most of its history, the US Dollar was backed by Gold, until the Bretton Woods Agreement in 1971 when the Gold Standard went away.
The most important single factor impacting on the value of the US Dollar is monetary policy, which is shaped by the Federal Reserve (Fed). The Fed has two mandates: to achieve price stability (control inflation) and foster full employment. Its primary tool to achieve these two goals is by adjusting interest rates. When prices are rising too quickly and inflation is above the Fed’s 2% target, the Fed will raise rates, which helps the USD value. When inflation falls below 2% or the Unemployment Rate is too high, the Fed may lower interest rates, which weighs on the Greenback.
In extreme situations, the Federal Reserve can also print more Dollars and enact quantitative easing (QE). QE is the process by which the Fed substantially increases the flow of credit in a stuck financial system. It is a non-standard policy measure used when credit has dried up because banks will not lend to each other (out of the fear of counterparty default). It is a last resort when simply lowering interest rates is unlikely to achieve the necessary result. It was the Fed’s weapon of choice to combat the credit crunch that occurred during the Great Financial Crisis in 2008. It involves the Fed printing more Dollars and using them to buy US government bonds predominantly from financial institutions. QE usually leads to a weaker US Dollar.
Quantitative tightening (QT) is the reverse process whereby the Federal Reserve stops buying bonds from financial institutions and does not reinvest the principal from the bonds it holds maturing in new purchases. It is usually positive for the US Dollar.
- Canadian Dollar backslides 0.4% against Greenback after mixed US data.
- Canada delivers BoC’s latest rate call on Wednesday.
- Broader markets pivot to Wednesday’s ADP jobs data, Friday’s NFP.
The Canadian Dollar (CAD) broadly fell on Tuesday, further erasing recent gains against the US Dollar (USD). 1.3600 is proving too tough of a nut for USD/CAD sellers to crack, and the pair remains mired in technical congestion since falling from the year’s highs near 1.3840 in mid-April.
Canada is absent from the economic data docket on Tuesday, leaving the Canadian Dollar at the mercy of broad market sentiment. Mixed US data, combined with an extended backslide in Crude Oil prices, has left investors with one foot planted firmly in safe havens and eroded near-term buying strength in the CAD. The Bank of Canada (BoC) is broadly expected to deliver its first quarter-point interest rate cut on Wednesday, nearly a year after the Canadian central bank raised rates to a 23-year-high of 5.0% last July.
Daily digest market movers: US data drives markets after mixed data and steepening revisions
- US Factory Orders in April rose 0.7% MoM, better than the forecast of 0.6%, but March’s figures saw a steep downside revision to 0.7% from the initial print of 1.6%.
- US JOLTS Job Openings in April also slipped back, falling to 8.059 million versus the forecast of 8.34 million. The previous month’s initial print was also revised to 8.355 million from 8.488 million.
- The BoC is expected to cut interest rates by 25 basis points on Wednesday, bringing Canada’s main policy rate down to 4.75% from 5.0%. The BoC will also deliver its latest Monetary Policy Statement.
- US ADP Employment Change figures due Wednesday to serve as a volatile preview of Friday’s US Nonfarm Payrolls.
- US ADP Employment Change for May is expected to slip back to 173K from 192K, while Friday’s NFP is expected to show the US added 190K jobs in May compared to the previous 175K.
Canadian Dollar PRICE Today
The table below shows the percentage change of Canadian Dollar (CAD) against listed major currencies today. Canadian Dollar was the weakest against the Japanese Yen.
| USD | EUR | GBP | JPY | CAD | AUD | NZD | CHF | |
|---|---|---|---|---|---|---|---|---|
| USD | 0.20% | 0.15% | -0.84% | 0.43% | 0.70% | 0.28% | -0.75% | |
| EUR | -0.20% | -0.05% | -1.03% | 0.25% | 0.49% | 0.09% | -0.95% | |
| GBP | -0.15% | 0.05% | -0.97% | 0.30% | 0.55% | 0.16% | -0.87% | |
| JPY | 0.84% | 1.03% | 0.97% | 1.29% | 1.54% | 1.11% | 0.11% | |
| CAD | -0.43% | -0.25% | -0.30% | -1.29% | 0.26% | -0.15% | -1.16% | |
| AUD | -0.70% | -0.49% | -0.55% | -1.54% | -0.26% | -0.41% | -1.41% | |
| NZD | -0.28% | -0.09% | -0.16% | -1.11% | 0.15% | 0.41% | -1.00% | |
| CHF | 0.75% | 0.95% | 0.87% | -0.11% | 1.16% | 1.41% | 1.00% |
The heat map shows percentage changes of major currencies against each other. The base currency is picked from the left column, while the quote currency is picked from the top row. For example, if you pick the Canadian Dollar from the left column and move along the horizontal line to the US Dollar, the percentage change displayed in the box will represent CAD (base)/USD (quote).
Technical analysis: USD/CAD poised for another spin around midrange
The Canadian Dollar (CAD) is broadly lower on Tuesday, losing ground against the majority of its major currency peers. The CAD is steeply lower against the Japanese Yen (JPY), falling -1.25% against the day’s best-performing currency, and has shed nearly -1.10% against the Swiss Franc (CHF). The CAD still managed to find higher ground against the Australian Dollar (AUD), gaining a third of a percent against the Aussie.
USD/CAD has bounced back from another dip toward 1.3600, climbing into the 1.3700 handle after the Canadian Dollar shed over four-tenths of a percent against the Greenback. The pair is caught in sideways churn, and a near-term demand zone just above 1.3600 is keeping bids bolstered as the CAD struggles to find buyers.
With the BoC set to widen the interest rate differential between the CAD and the USD on Wednesday, investors will be keeping an eye on any spikes that could kick off a leg higher and send the USD/CAD back into 2024’s peaks at 1.3846. On the low side, long-term technical support sits at the 200-day Exponential Moving Average (EMA) at 1.3560.
USD/CAD hourly chart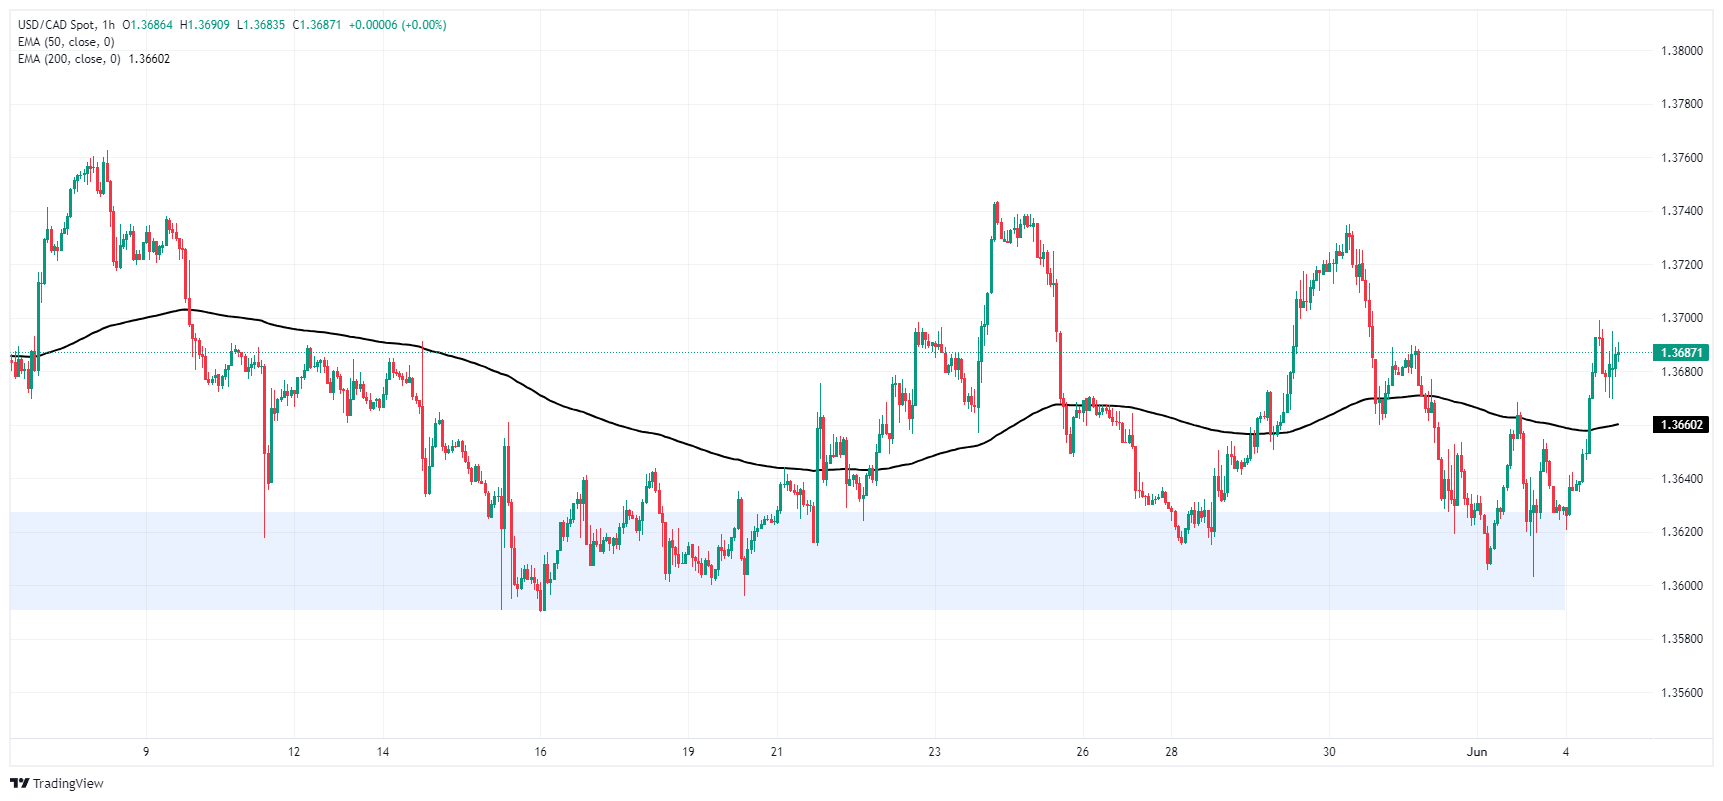
USD/CAD daily chart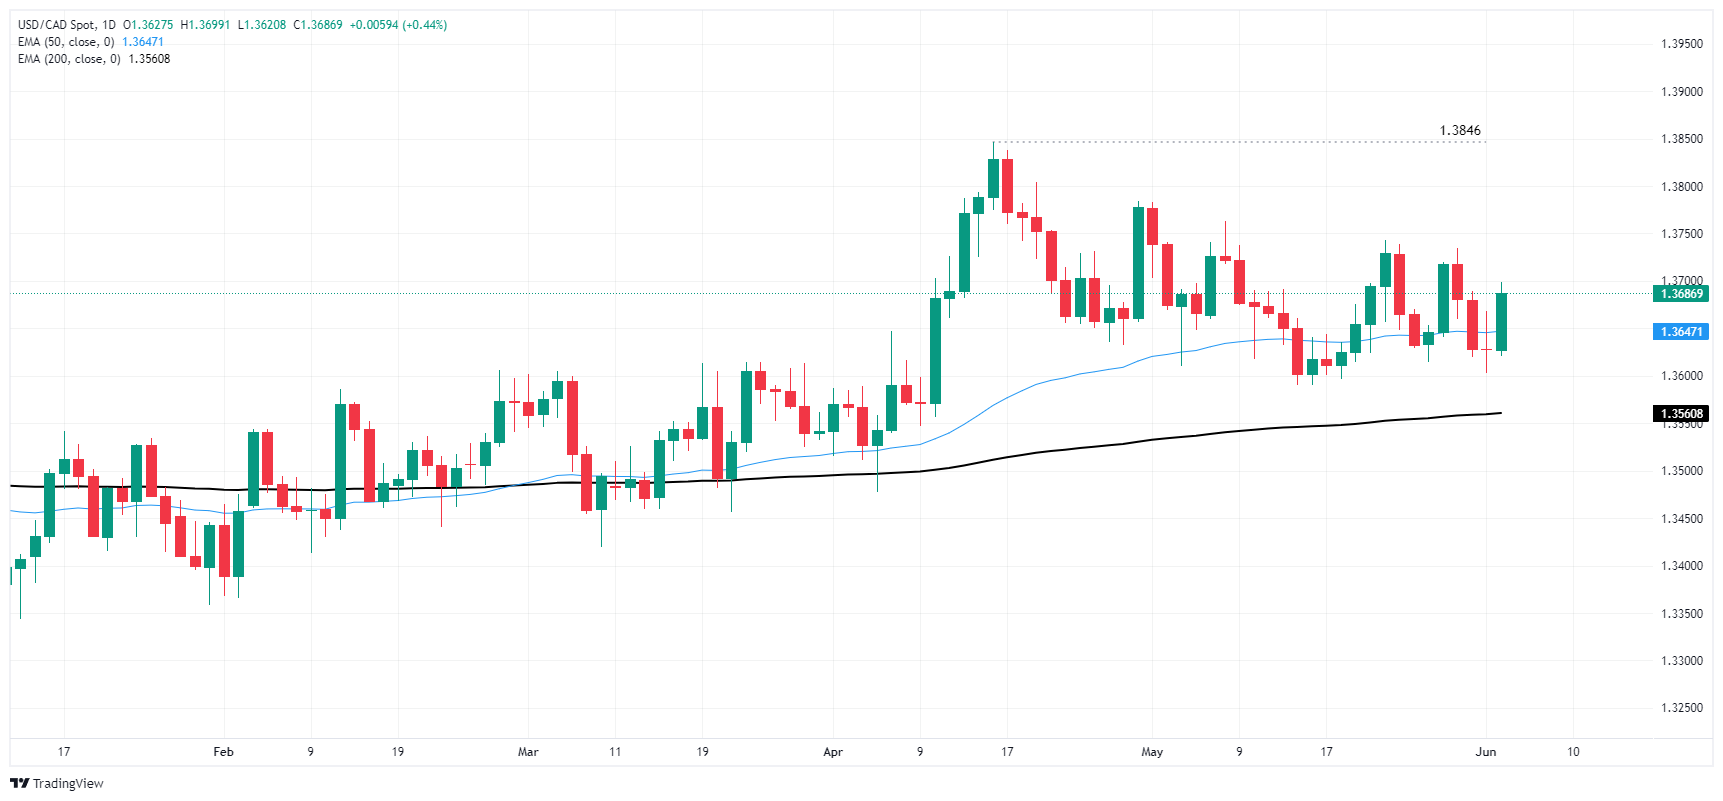
Canadian Dollar FAQs
The key factors driving the Canadian Dollar (CAD) are the level of interest rates set by the Bank of Canada (BoC), the price of Oil, Canada’s largest export, the health of its economy, inflation and the Trade Balance, which is the difference between the value of Canada’s exports versus its imports. Other factors include market sentiment – whether investors are taking on more risky assets (risk-on) or seeking safe-havens (risk-off) – with risk-on being CAD-positive. As its largest trading partner, the health of the US economy is also a key factor influencing the Canadian Dollar.
The Bank of Canada (BoC) has a significant influence on the Canadian Dollar by setting the level of interest rates that banks can lend to one another. This influences the level of interest rates for everyone. The main goal of the BoC is to maintain inflation at 1-3% by adjusting interest rates up or down. Relatively higher interest rates tend to be positive for the CAD. The Bank of Canada can also use quantitative easing and tightening to influence credit conditions, with the former CAD-negative and the latter CAD-positive.
The price of Oil is a key factor impacting the value of the Canadian Dollar. Petroleum is Canada’s biggest export, so Oil price tends to have an immediate impact on the CAD value. Generally, if Oil price rises CAD also goes up, as aggregate demand for the currency increases. The opposite is the case if the price of Oil falls. Higher Oil prices also tend to result in a greater likelihood of a positive Trade Balance, which is also supportive of the CAD.
While inflation had always traditionally been thought of as a negative factor for a currency since it lowers the value of money, the opposite has actually been the case in modern times with the relaxation of cross-border capital controls. Higher inflation tends to lead central banks to put up interest rates which attracts more capital inflows from global investors seeking a lucrative place to keep their money. This increases demand for the local currency, which in Canada’s case is the Canadian Dollar.
Macroeconomic data releases gauge the health of the economy and can have an impact on the Canadian Dollar. Indicators such as GDP, Manufacturing and Services PMIs, employment, and consumer sentiment surveys can all influence the direction of the CAD. A strong economy is good for the Canadian Dollar. Not only does it attract more foreign investment but it may encourage the Bank of Canada to put up interest rates, leading to a stronger currency. If economic data is weak, however, the CAD is likely to fall.
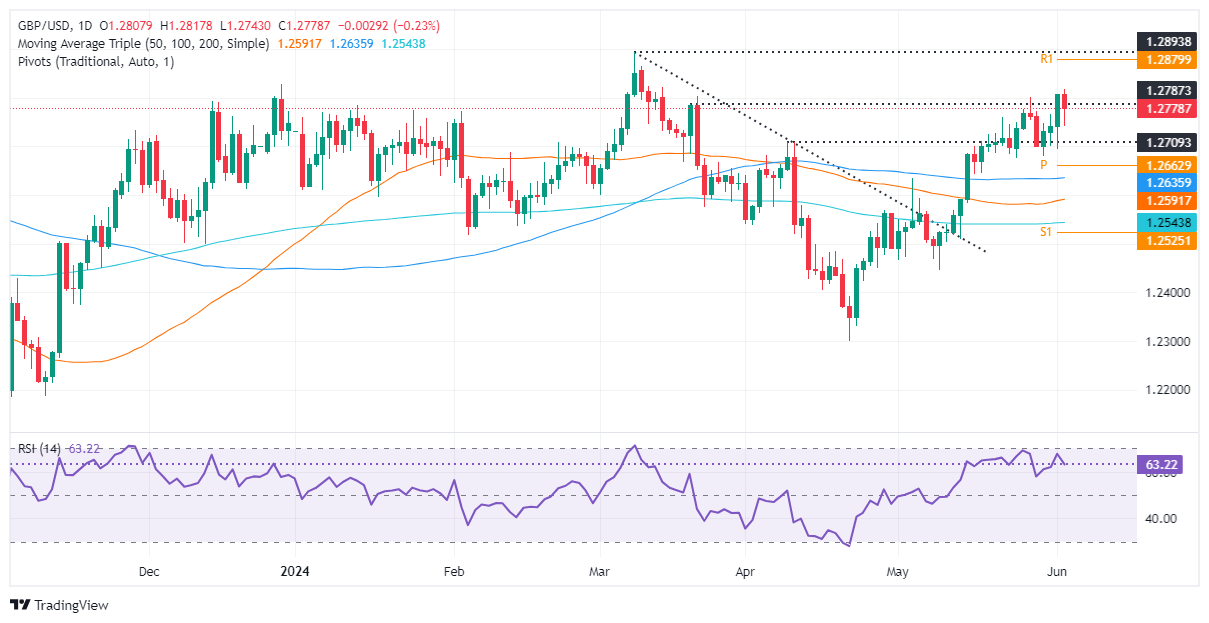
- GBP/USD retreats at technical confluence around 1.2800.
- Key support levels lie at 1.2694, 1.2635, and 1.2600.
- The GBP/USD could test a YTD high if buyers reclaim 1.2800.
The British Pound lost ground versus the US Dollar after hitting a three-month high of 1.2817 yet retreated below 1.2800 during the European session. Data from the United States showed the labor market is cooling yet keeping the Greenback in the driver’s seat. The GBP/USD trades at 1.2775, down 0.25%.
GBP/USD Price Analysis: Technical outlook
The daily chart portrays the pair as neutral-upward biased but struggling to clear the confluence of a downslope resistance trendline drawn from July highs, which passes at around 1.2800. Although momentum favors buyers, as shown by the Relative Strength Index (RSI), the RSI is aiming lower.
The GBP/USD first support would be the June 3 low of 1.2694. Once cleared, the next stop would be the 100-day moving average (DMA), which converges with the May 3 high at 1.2635, followed by the 1.2600 mark.
On the flip side, buyers reclaiming 1.2800 could sponsor a test of the year-to-date (YTD) high of 1.2893, followed by 1.2900.
GBP/USD Price Action – Daily Chart
- USD/JPY pulls back after markets’ risk-off tone generates safe-haven demand, benefiting the Yen.
- The BoJ might be considering reducing bond purchases at its June meeting according to rumors reported by Bloomberg.
- Such a move would raise Japanese bond yields and support the Yen – a negative for USD/JPY.
USD/JPY falls to the 155.00 barrier on Tuesday as a combination of a risk-off market sentiment and rumors circulating that the Bank of Japan (BoJ) is poised to reduce its bond purchases support the Japanese Yen (JPY) and pressure USD/JPY. A reduction in bond purchases would put upward pressure on Japanese bond yields which are highly correlated to the JPY.
The US Dollar (USD), meanwhile, bounces after the steep sell-off of the previous day when the US ISM Manufacturing PMI came out lower than expected in May, however, the rebound looks unconvincing.
The fall in US manufacturing activity was mainly caused by a decline in the New Orders and Prices Paid components, indicating possible hamstrung future growth and lower inflation expectations. This, in turn, increased bets the Federal Reserve (Fed) might lower interest rates, with the probabilities of a rate cut in September rising to around 65%, according to the CME FedWatch tool.
USD/JPY falls on rumors BoJ to cut bond purchases
USD/JPY declines over half a percent on Tuesday partly as a result of market rumors first reported by Bloomberg News, that the BoJ is considering reducing the number of bond purchases it makes via its quantitative easing (QE) programme.
If implemented, the policy move will reduce demand for Japanese Government Bonds (JGB), raising yields (which move inversely to bond prices) and positively impacting the Yen which is highly correlated to bond yields.
“Reports suggest the BOJ may discuss reducing its bond purchases as early as next week’s meeting,” said Brown Brothers Harriman (BBH) on Tuesday. ”Policymakers will reportedly discuss the appropriate timing to slow its bond buying from around JPY6 trillion ($38.4 billion) per month currently, and whether the BOJ needs to provide more details to improve predictability,” the note went on.
“That the BOJ is discussing this matter even as Japanese Government Bond (JGB) yields move higher is a testament to its desire to continue normalizing policy,” added BBH.
Currency Warning
USD/JPY was further hit by intervention fears. On Tuesday morning the Deputy Governor of the BoJ, Ryozo Himino, repeated concerns regarding how a weak JPY might be negatively impacting the economy, saying the BoJ needed to be “very vigilant” regarding currency moves. His comments suggested the BoJ might be gearing up for another direct intervention in FX markets to prop up JPY (negative for USD/JPY).
Himino further went on to discuss the impact the weak Yen was having on inflation. Although a weak Yen increases the costs of imported goods, thereby generating inflation – which is what the BoJ wants – it also reduces consumption as shoppers are put off purchases by high prices. The BoJ would prefer inflation to derive from higher wages, however, as this would lead to more spending, higher consumption and a more dynamic economy.
The takeaway from Himino’s remarks is that they “ratcheted up concerns that the BoJ could confront the market with a hawkish policy move at its June 14 policy meeting,” said analysts at Rabobank.
On the Radar
US jobs data will be the focus for the pair this week, with just-released JOLTS Job Openings, showing a deterioration in the job market. The US Bureau of Labor Statistics (BLS) data showed 8.059 million job openings in April, which was below both the 8.34M expected, and the 8.355M in March. The data suggests a deterioration in the US job market.
On Wednesday Automatic Data Processing (ADP) will release its payrolls figures for the private sector and on Friday, the big one – US Nonfarm Payrolls (NFP) – will reveal official labor statistics including payrolls, wage inflation and the Unemployment Rate.
If the data later in the week shows a decline in line with the JOLTS report, the USD could weaken, pulling USD/JPY down with it.
- EUR/GBP holds the 0.8500 support tightly ahead of the ECB policy meeting.
- Investors will keenly focus on the ECB’s rate-cut path beyond June.
- UK’s persistent wage growth remains a barrier for the BoE pivoting to policy normalization.
The EUR/GBP pair remains subdued above the psychological support of 0.8500 in Tuesday’s American session. The cross stays on the sidelines as investors await the European Central Bank’s (ECB) interest rate decision, which will be announced on Thursday.
The ECB is widely anticipated to deliver a rate-cut move of 25 basis points (bps) in its June meeting. Therefore, investors will keenly focus on the rate-cut path for the entire year. ECB officials have remained comfortable with market speculation for a rate cut in June but are reluctant to offer any specific rate-cut path due to higher-than-expected Eurozone annual Harmonized Index of Consumer Prices (HICP) data for May.
The HICP report showed that headline and core HICP figures beat estimates due to stubbornly higher service inflation. The underlying inflation at 4.1% was the highest in seven months. ECB officials have advised to remain data-dependent and have kept hopes of subsequent rate cuts off the table.
Meanwhile, better-than-projected Eurozone Q1 Gross Domestic Product (GDP) data has also pushed back speculation for ECB rate cuts in July. The Eurozone economy expanded at a higher pace of 0.3% from the estimates of 0.2%.
In the United Kingdom (UK) region, investors remain uncertain over Bank of England (BoE) rate-cut timing as higher wage growth continues to keep risks of persistent price pressures elevated. Currently, financial markets expect that the BoE will start reducing interest rates in the August meeting.
- USD/CAD aims to break above 1.3700 as the US Dollar gains ground.
- The BoC is expected to deliver a dovish interest rate decision on Wednesday.
- Investors see the Fed returning to policy normalization from September.
The USD/CAD pair finds temporary resistance near the round-level barrier of 1.3700 in Tuesday’s New York session. The Loonie asset is poised to deliver more upside as investors expect the Bank of Canada (BoC) to announce a rate-cut decision in its monetary policy meeting on Wednesday.
Factors that have prompted market speculation that the BoC will reduce interest rates in June are the decline in the core Consumer Price Index (CPI) in its 1%-3% band and weak labor market conditions. Canada’s Unemployment rate has jumped to 6.1%, a level significantly higher than the BoC’s mandate of 5%. Also, Average Weekly Earnings slowed to 4.2% in March, which faded fears of persistent inflation.
Unlike the European Central Bank (ECB), BoC policymakers have not communicated their comfort with market speculation for rate cuts in June, which has kept the uncertainty over the policy decision intact.
Meanwhile, the market sentiment is risk-averse as investors turn cautious ahead of the United States (US) Nonfarm Payrolls (NFP) data for May, which will be announced on Friday. Considering negative overnight futures, the S&P 500 is expected to open on a bearish note. The US Dollar Index (DXY), which tracks the US Dollar’s value against six major currencies, recovers sharply to 104.30.
The US NFP data will influence market expectations for Fed rate cuts, which investors expect will start at the September meeting.
But before that, the next move in the US Dollar will be guided by the JOLTS Job Openings data for April, which will be published at 14:00 GMT. US employers are estimated to have posted 8.34 million jobs, lower than the prior reading of 8.49 million.
- AUD/USD declines after the release of the Australian Current Account Balance uncovers a deficit in Q1.
- The data indicates less profits from exports and lower economic growth, weighing on the Australian Dollar.
- The US Dollar, meanwhile, bounces after Monday’s steep decline following lower-than-expected US manufacturing data.
AUD/USD trades almost three-quarters of a percent lower in the 0.6640s on Tuesday, after the release of Australian Current Account Balance data for Q1 shows a 4.9 billion (AUD) deficit when a 5.9 billion surplus had been expected. The data suggests a trade balance that favors imports and weighs on the country’s economic growth prospects.
The first-quarter deficit was caused by a fall in the trade surplus and rise in the net primary income deficit – or the net inflows from wages, foreign property and “entrepreneurial activities” abroad. The figures, released by the Australian Bureau of Statistics (ABS), also showed the previous quarter’s 11.6B surplus was substantially revised down to 2.6B.
As an input into Gross Domestic Product (GDP) calculations the data has led many economists to lower their estimates of Q1 GDP growth which will be released on Wednesday. Consensus estimates are for GDP to have grown 0.2% quarter-over-quarter and 1.2% year-over year, however, Westpac, for example, has lowered its GDP forecast to 0.0% and 1.0% respectively.
Other data for Australia showed a mixed picture for inflation, with the Melbourne Institute Monthly Inflation Gauge rising by 0.3% MoM in May, its highest since January, but cooling to 3.1% YoY, “its slowest reading since January 2022,” according to Jason Coombs, an Economist at Westpac, who says the data may provide a hint of what’s to come in official statistics.
“The inflation measure has tracked above the official ABS monthly and quarterly inflation results since the middle of last year. Taken alone this could be a sign we may see some better inflation progress in May. However, it’s too early to draw too much from the move,” added Coombs.
The US Dollar (USD) is bouncing back slightly on Tuesday as traders take profit and “back-and-fill” the steep slide from Monday. This came on the back of lower-than-expected ISM Manufacturing PMIs for the US. The decline in manufacturing was mainly put down to a steep drop in the “New Orders” subcomponent, raising fears about future growth. A fall in the “Prices Paid” subcomponent also lowered inflation-expectations, and increased bets the Federal Reserve (Fed) may finally get off first base and begin to cut interest rates. Current forecasts estimate a cut in September is now more likely than not (circa 67%), according to the CME FedWatch tool.
In comparison the Reserve Bank of Australia (RBA) is not expected to cut interest rates until 2025, and is viewed as the last G10 central bank likely to begin cutting interest rates. This is due to the stubbornly high inflation being experienced in Australia.
The outlook supports the AUD more than the USD providing a backwind for the pair. This is because it will likely close the rate differential between the two countries which currently supports the USD due to the higher interest rates in the US. Higher interest rates are generally positive for a currency as they increase foreign capital inflows but if the gap narrows AUD could rise from the narrowing differential.
- Natural Gas prices shot higher on Monday after reports on Norway supply issues.
- Meanwhile the option markets show fatigue in the overextended long positioning.
- The US Dollar Index jumps higher on Tuesday on safe-haven inflow after it sank on Monday.
Natural Gas price (XNG/USD) trades in a narrow range around $2.80 on Tuesday after a more than 6% surge on Monday on reports that Norway was facing delivery issues in its Gas supply to Europe. Gas prices shot higher after the news amidst the refueling season for Europe ahead of next fall and winter. However, some headwinds are emerging for an extension of that rally with the options markets tilted to an overstretched long position, which might get set to become unwinded for profit-taking.
Meanwhile, the US Dollar Index (DXY), which tracks the Greenback’s value against six major currencies, is facing a volatile week. The sharp fall on Monday resulted from a mixed and overall weaker data release from the Institute for Supply Management (ISM), which confirmed again that the US manufacturing activity is retreating from its peak performance. However, the DXY soars on Tuesday, bouncing off its weekly lows, with markets fleeing to risk-off mode as equity markets plunge lower.
Natural Gas is trading at $2.78 per MMBtu at the time of writing.
Natural Gas news and market movers: Positioning to get unwinded
- Recent futures data reveals that Hedge Funds have extended their net-long positions in European Dutch TTF Gas futures to the highest level since October, Bloomberg Intelligence reports.
- Norwegian Gas network operator Gassco reports on its website that the unplanned Nyhamna outage will be extended until at least Friday to get the processing plant back online.
- TotalEnergies has signed two new medium- and long-term contracts for the Asian markets, amassing 1,300,000 tonnes per year of Liquefied Natural Gas (LNG), according to news website Tank Storage.
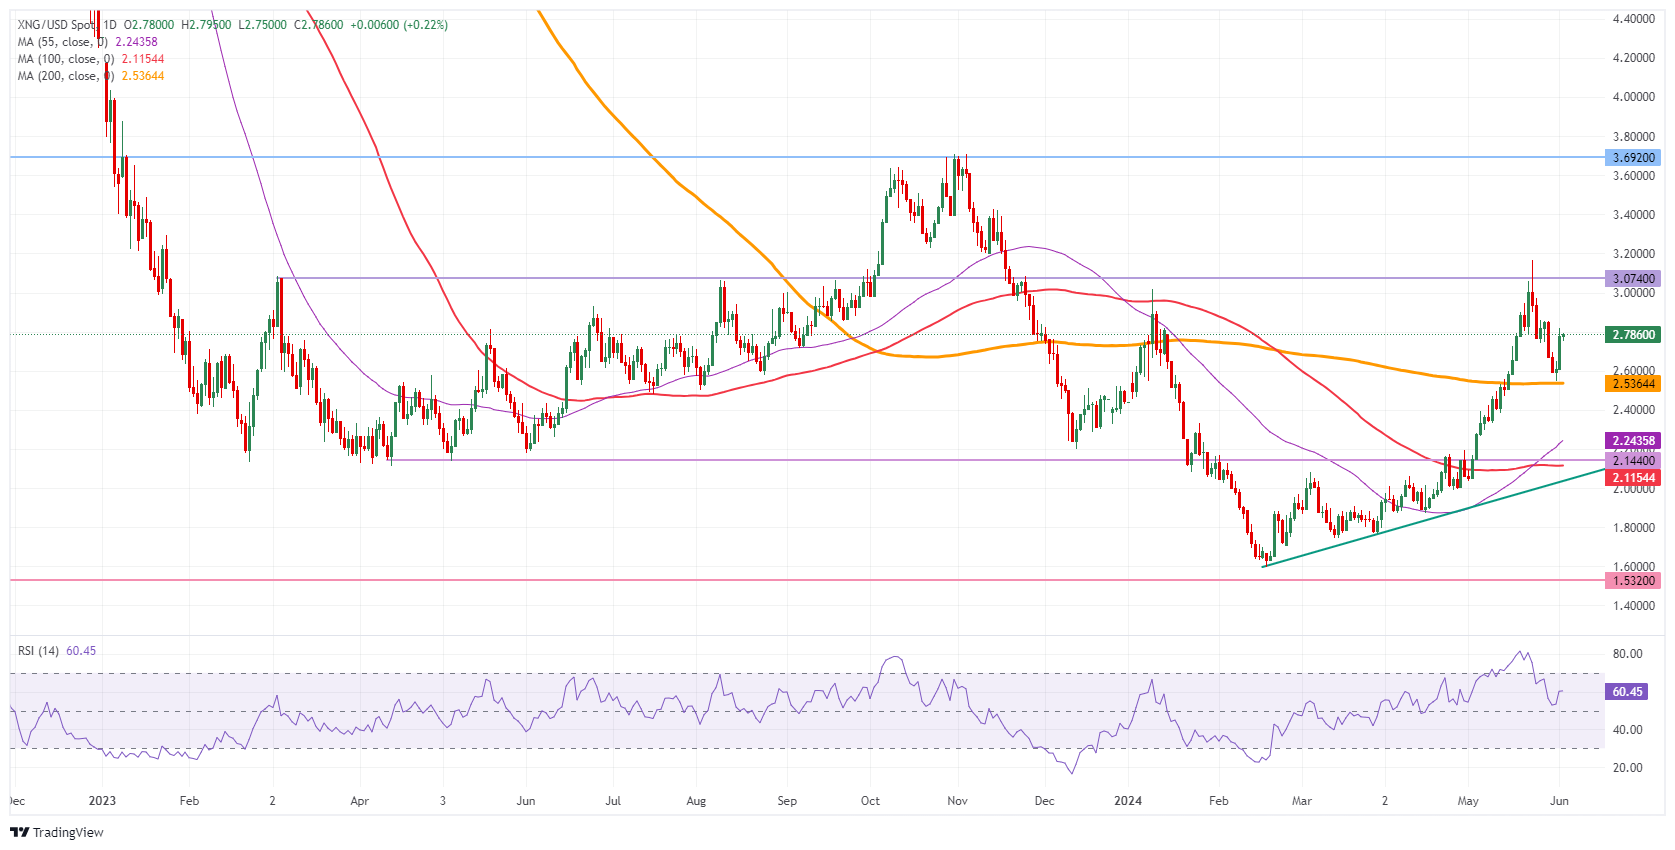
Natural Gas Technical Analysis: Pure technical bounce facing profit-taking
Natural Gas has pulled off a very nice technical pattern by bouncing off the 200-day Simple Moving Average (SMA), near $2.53. Although it looks tempting to stick on the trade towards $3.07, the market positioning must not be overlooked. Futures data reveals that long positions are getting too crowded, which could drive a correction with traders unwinding their positions and cashing in on their gains in the near future, while Europe is in a good position to get fully refueled ahead of the next heating season.
The $3.00 marker as a big figure was tested in May. The pivotal level near $3.07 ( March 6, 2023, high) remains key as prices failed to post a daily close above it. Further up, the fresh year-to-date high at $3.16 is the level to beat.
On the downside, the 200-day Simple Moving Average (SMA) acts as the first support near $2.53. Should that support area fail to hold, the next target could be the pivotal level near $2.14, with interim support by the 55-day SMA near $2.24. Further down, the biggest support comes at $2.11 with the 100-day SMA.
Natural Gas: Daily Chart
Natural Gas FAQs
Supply and demand dynamics are a key factor influencing Natural Gas prices, and are themselves influenced by global economic growth, industrial activity, population growth, production levels, and inventories. The weather impacts Natural Gas prices because more Gas is used during cold winters and hot summers for heating and cooling. Competition from other energy sources impacts prices as consumers may switch to cheaper sources. Geopolitical events are factors as exemplified by the war in Ukraine. Government policies relating to extraction, transportation, and environmental issues also impact prices.
The main economic release influencing Natural Gas prices is the weekly inventory bulletin from the Energy Information Administration (EIA), a US government agency that produces US gas market data. The EIA Gas bulletin usually comes out on Thursday at 14:30 GMT, a day after the EIA publishes its weekly Oil bulletin. Economic data from large consumers of Natural Gas can impact supply and demand, the largest of which include China, Germany and Japan. Natural Gas is primarily priced and traded in US Dollars, thus economic releases impacting the US Dollar are also factors.
The US Dollar is the world’s reserve currency and most commodities, including Natural Gas are priced and traded on international markets in US Dollars. As such, the value of the US Dollar is a factor in the price of Natural Gas, because if the Dollar strengthens it means less Dollars are required to buy the same volume of Gas (the price falls), and vice versa if USD strengthens.
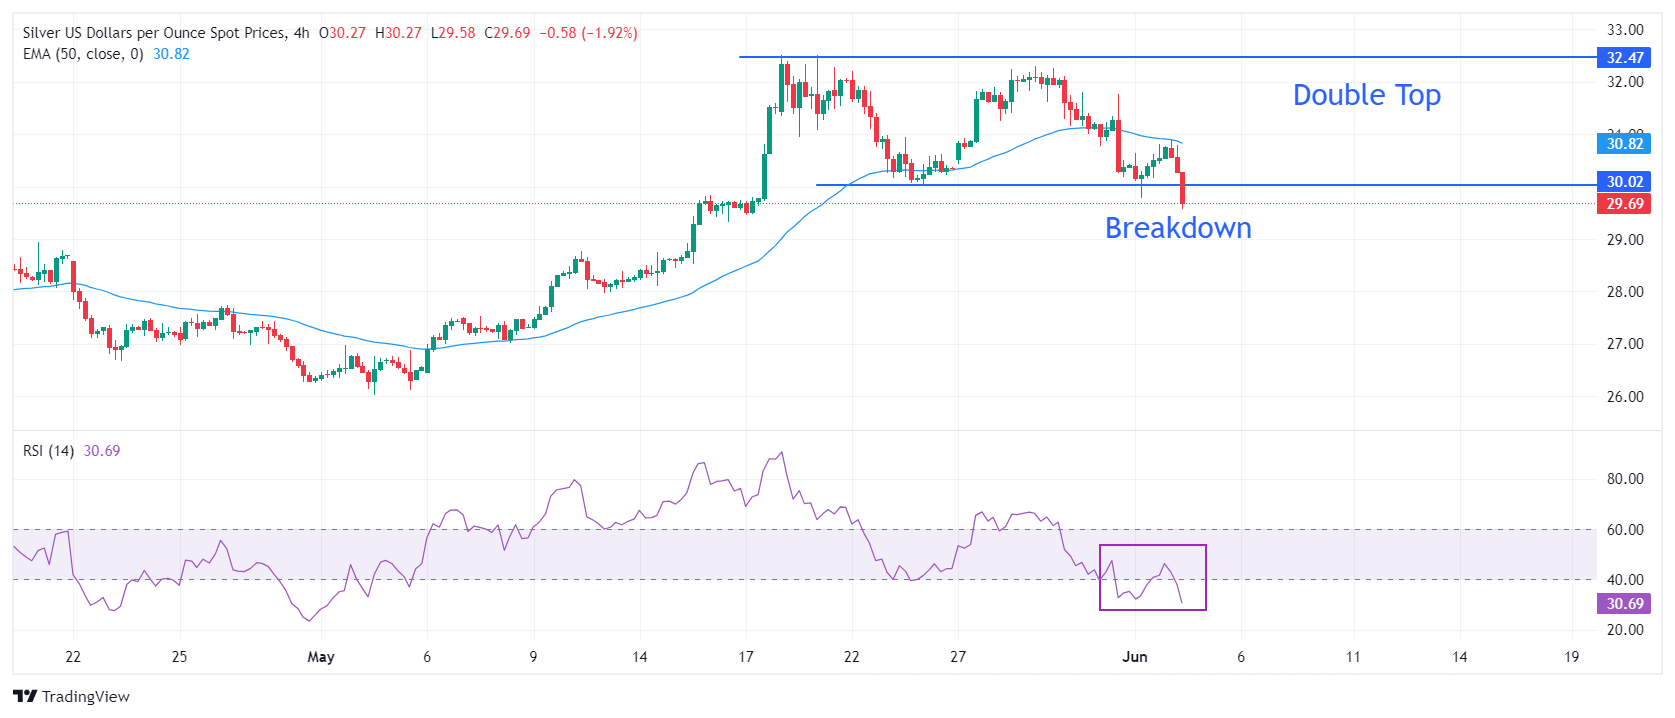
- Silver price dives below $30 as the US Dollar recovers amid caution ahead of US NFP data.
- Market speculation for the Fed reducing interest rates in September improves.
- Silver price weakens after a Double Top breakdown.
Silver price (XAG/USD) declines below the psychological support of $30.00 in Tuesday’s European session. The white metal weakens as the US Dollar (DXY) rebounds amid uncertainty ahead of United States (US) Nonfarm Payrolls (NFP) data for May, which will provide cues about whether the Federal Reserve (Fed) will start lowering key borrowing rates from their current levels in the September meeting.
The US Dollar Index (DXY) rebounds after falling to a multi-week low near 104.00. The appeal for dollar-denominated commodities, such as Silver, weakens as higher US Dollar makes them expensive.
Currently, the speculation for the Fed reducing interest rates in September has strengthened as recent US economic data has indicated signs of slowdown in the pace of US economic growth.
The US ISM manufacturing PMI showed that factory activity contracted for the second straight month, demand outlook is bleak and input prices expanded at a slower pace. Recently, the US Q1 Gross Domestic Product (GDP) was also revised lower to 1.3% from the preliminary estimates of 1.6%.
In today’s session, investors on the JOLTS Job Openings data for April, which will be published at 14:00 GMT. US employers are estimated to have posted 8.34 million jobs, lower than the prior reading of 8.49 million.
Silver technical analysis
Silver price weakens after a breakdown of the Double Top chart pattern formed on a four-hour timeframe. The chart formation was at multi-year high of $32.50 and it got triggered after breaking below May 24 low near $30.00. A breakdown of the above-mentioned chart pattern indicates a bearish reversal.
The asset has shifted below the 50-period Exponential Moving Average (EMA) near $30.80, which indicates that the short-term trend has turned bearish.
The 14-period Relative Strength Index (RSI) has shifted into the bearish range of 20.00-40.00, which suggests that momentum has leaned towards the downside.
Silver four-hour chart
- Gold is falling in line with a bearish short-term technical picture and a US Dollar bounce.
- Lower global inflation expectations are prompting investors to rotate into bonds, possibly draining investment away from Gold.
- XAU/USD technicals indicate the potential for more downside following a recent trendline break.
Gold (XAU/USD) trades over three quarters of a percent lower in the $2,330s on Tuesday. A slight bounce from the US Dollar (USD), which is negatively correlated to Gold, could be partly responsible as could asset rotation into bonds. Commodities in general are trading lower – and the move is in line with Gold technicals which are short-term bearish.
Gold weakens as broader commodity markets sell-off
The lion’s share of commodities and most equity markets are selling off on Tuesday, which – apart from idiosyncratic reasons such as the OPEC+ decision and Indian elections – seems to be a result of generalized fears about global economic growth. This seems to be due to the poor US ISM Manufacturing PMI data released on Monday. Another reason could be asset rotation as increasing numbers of investors reallocate to bonds.
There are growing signs inflation is falling globally, with Friday’s US core PCE data undershooting estimates and Swiss inflation similarly missing the mark on Tuesday, after coming out at 0.3% month-over-month in May when economists had estimated a 0.4% rise.
The Swiss CPI data has sparked speculation the Swiss National Bank (SNB) could make another interest rate cut at its meeting in June. With the European central Bank (ECB) highly anticipated to cut interest rates on Thursday and increasing speculation the Bank of Canada (BoC) could also cut rates on Wednesday, global bond markets are rallying and could be draining investment from Gold.
Technical Analysis: Gold trades along 50-day SMA
Gold price is finding support at the 50-day Simple Moving Average (SMA) and consolidating after a sell-off from the May highs.
XAU/USD has broken through a major trendline and is probably in a short-term downtrend. Given “the trend is your friend” the odds favor more weakness.
XAU/USD Daily Chart
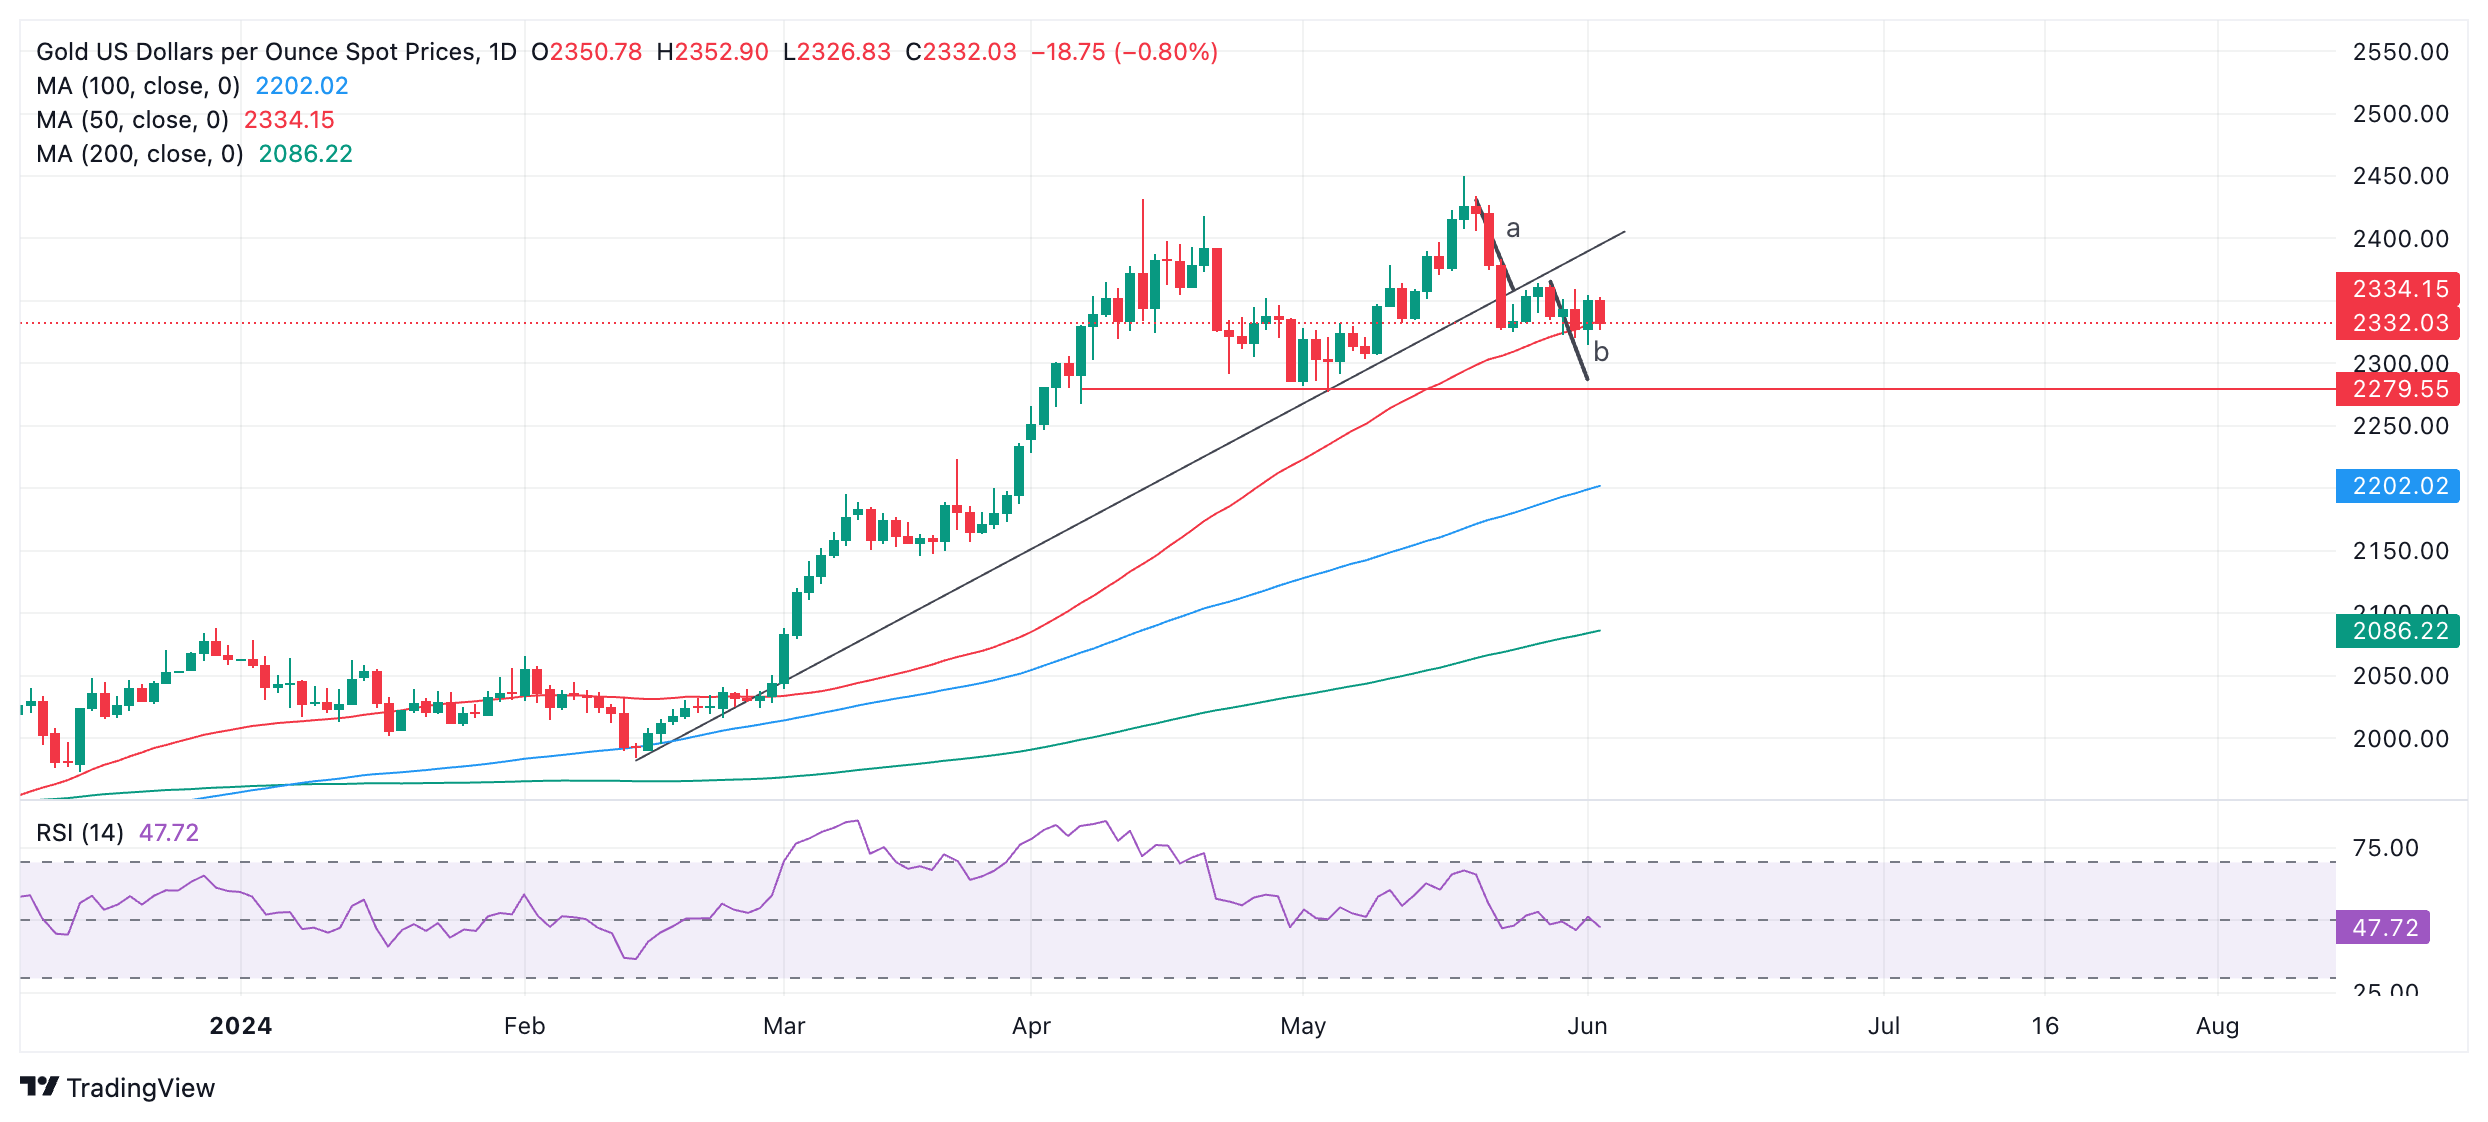
The trendline break generated downside targets. The length of the move prior to a break can be used as a guide to the follow-through after a break, according to technical analysis. In the case of Gold, these have been labeled “a” and “b” respectively.
The first target is at $2,303, which is the 0.618 Fibonacci extrapolation of “a”.
Gold could even fall to $2,272-$2,279, the 100% extrapolation of “a” and the end of “b”. This also happens to be an area of historical support (red line).
The precious metal’s medium and long-term trends, however, are still bullish and the risk of a recovery remains high. That said, price action is not supporting a resumption hypothesis at the moment.
A break above $2,362 (May 29 high) would be required to bring into doubt the integrity of the short-term downtrend, otherwise further weakness is foreseen.
Economic Indicator
ISM Manufacturing PMI
The Institute for Supply Management (ISM) Manufacturing Purchasing Managers Index (PMI), released on a monthly basis, is a leading indicator gauging business activity in the US manufacturing sector. The indicator is obtained from a survey of manufacturing supply executives based on information they have collected within their respective organizations. Survey responses reflect the change, if any, in the current month compared to the previous month. A reading above 50 indicates that the manufacturing economy is generally expanding, a bullish sign for the US Dollar (USD). A reading below 50 signals that factory activity is generally declining, which is seen as bearish for USD.
Read more.Last release: Mon Jun 03, 2024 14:00
Frequency: Monthly
Actual: 48.7
Consensus: 49.6
Previous: 49.2
Source: Institute for Supply Management
The Institute for Supply Management’s (ISM) Manufacturing Purchasing Managers Index (PMI) provides a reliable outlook on the state of the US manufacturing sector. A reading above 50 suggests that the business activity expanded during the survey period and vice versa. PMIs are considered to be leading indicators and could signal a shift in the economic cycle. Stronger-than-expected prints usually have a positive impact on the USD. In addition to the headline PMI, the Employment Index and the Prices Paid Index numbers are watched closely as they shine a light on the labour market and inflation.
- The US Dollar trades in the green against its peers, recovering some of the losses registered on Monday
- Equity markets are erasing their positive start of the week.
- The US Dollar Index jumps back above 104.00 after falling below it during the Asia-Pacific trading session.
The US Dollar (USD) trades in the green on Tuesday in an attempt to recoup Monday’s losses. The Greenback is rallying supported by substantial safe-haven inflows as most major equity markets are in the red. The move sparked during the Asian trading session, with the Indian Nifty index falling over 5%, as Prime Minister Narendra Modi’s victory appears to be narrower than what polls were predicting.
On the economic front, all eyes are on some important indicators that could further confirm the slightly downbeat sentiment surrounding the US economy. The main event will be the US JOLTS Job Openings report for April. Although this is a lagging number, job openings have been decreasing for several months in a row and a further decline could further confirm the end of that US exceptionalism.
Daily digest market movers: JOLTS as appetiser
- The Redbook Index for this week will be published at 12:55 GMT. The previous number showed a 6.3% increase.
- At 14:00 GMT, the JOLTS survey will be released.
- Job Openings in April are expected to fall further to 8.34 million from 8.488 million a month earlier.
- Factory Orders for April are expected to increase 0.6% in April, slowing from the 1.6% rise seen in March.
- The TechnoMetrica Institute of Policy and Politics (TIPP) will release its Economic Optimism Index for June. The index is expected to increase to 45.2 from 41.8 in May.
- Equities are falling across the globe with the more than 5% sell-off in Indian equities. European indices are down near 1%, while US equity futures are losing less than 0.50%.
- According to the CME Fedwatch Tool, Fed Fund futures pricing data suggests a 38.4% chance for keeping rates unchanged in September, against a 52.6% chance for a 25 basis points (bps) rate cut and a 8.9% chance for an even 50 bps rate cut. An interest rate hike is no longer considered an option since this week. For the upcoming meeting on June 12, futures are fully pricing in an unchanged result.
- The benchmark 10-year US Treasury Note trades around 4.38%, and is near its monthly low at 4.34%.
US Dollar Index Technical Analysis: Up for the wrong reasons
The US Dollar Index (DXY) is seeing Dollar bulls fighting with knives between their teeth. The DXY might be popping back up above 104.00 this Tuesday, but this would happen for all the wrong reasons. Simply because equities are heading lower, the US Dollar is seeing some safe-haven flows. The recent appreciation should not be seen in correlation with the recent softening in the US economy, which could still bring more easing in the Greenback over the coming weeks and months.
On the upside, the DXY first faces the double belt of resistance in the form of the 200-day Simple Moving Average (SMA) at 104.43 and the 100-day SMA at 104.42. Next up, the pivotal level near 104.60 comes into play. Topside for now is forming around 105.00, with the 55-day SMA at 105.00 and the peak from recent weeks at 105.12.
On the downside, the Greenback is trading in that air pocket area in which the 104.00 big figure looks to be holding. Once through there, another decline to first 103.50 and even 103.00 are the levels to watch. With the Relative Strength Index (RSI) still not trading in the oversold level, more downside room is still under consideration.
US Dollar FAQs
The US Dollar (USD) is the official currency of the United States of America, and the ‘de facto’ currency of a significant number of other countries where it is found in circulation alongside local notes. It is the most heavily traded currency in the world, accounting for over 88% of all global foreign exchange turnover, or an average of $6.6 trillion in transactions per day, according to data from 2022. Following the second world war, the USD took over from the British Pound as the world’s reserve currency. For most of its history, the US Dollar was backed by Gold, until the Bretton Woods Agreement in 1971 when the Gold Standard went away.
The most important single factor impacting on the value of the US Dollar is monetary policy, which is shaped by the Federal Reserve (Fed). The Fed has two mandates: to achieve price stability (control inflation) and foster full employment. Its primary tool to achieve these two goals is by adjusting interest rates. When prices are rising too quickly and inflation is above the Fed’s 2% target, the Fed will raise rates, which helps the USD value. When inflation falls below 2% or the Unemployment Rate is too high, the Fed may lower interest rates, which weighs on the Greenback.
In extreme situations, the Federal Reserve can also print more Dollars and enact quantitative easing (QE). QE is the process by which the Fed substantially increases the flow of credit in a stuck financial system. It is a non-standard policy measure used when credit has dried up because banks will not lend to each other (out of the fear of counterparty default). It is a last resort when simply lowering interest rates is unlikely to achieve the necessary result. It was the Fed’s weapon of choice to combat the credit crunch that occurred during the Great Financial Crisis in 2008. It involves the Fed printing more Dollars and using them to buy US government bonds predominantly from financial institutions. QE usually leads to a weaker US Dollar.
Quantitative tightening (QT) is the reverse process whereby the Federal Reserve stops buying bonds from financial institutions and does not reinvest the principal from the bonds it holds maturing in new purchases. It is usually positive for the US Dollar.
- The Oil price fell to $72.50 as OPEC+ plans to shore up the market.
- Weak US factory PMI raise concerns over the Oil demand outlook.
- Investors await the US NFP data for fresh guidance.
West Texas Intermediate (WTI), futures on NYMEX, fall further to $72.50 in Tuesday’s European session. The Oil price extends its losing streak for the third trading session on Tuesday as the latest supply policy from the OPEC+ meeting on June 2 indicated that the production cuts could be relaxed to some extent later this year.
OPEC members didn’t not full extend the current oil production cut policy. The agency said voluntary cuts of 2.2 million barrels per day (bpd), handled by eight members, out of overall output cut of 5.86 million barrels per day (bpd) will expire by June 2024, unlike the remaining stock cut that will last till September 2024.
Meanwhile, weak United States (US) ISM Manufacturing PMI has also raised concerns over the Oil demand outlook. The US Manufacturing PMI report showed that factory activity contracts for the second straight month in May.
The PMI data was recorded at 48.7, lower than the consensus of 49.8 and the prior reading of 49.2. Apart from that, New Orders Index that reflects the demand outlook fell to 45.4 from the former reading of 49.1, suggesting sluggishness in the economy in the midst of the second quarter due to the Federal Reserve (Fed) maintaining a restrictive monetary policy framework.
Going forward, investors will focus on the US Nonfarm Payrolls (NFP) for May, which will be published on Friday. The US NFP will provide cues about when the Fed will start reducing interest rates. Currently, financial markets expect that the Fed will choose the September meeting as the earliest point to return to policy normalization.
- USD/JPY falls sharply to near 155.00 even though the US Dollar gains ground.
- The possibility of the Fed returning to policy normalization in September improves.
- Weak Japanese Yen boosts price pressures.
The USD/JPY pair extends its downside to 155.00 in Tuesday’s European session. The asset weakens as the Japanese Yen strengthens amid expected to that the Bank of Japan (BoJ) would tighten its policy further.
A weak Yen against other currencies has resulted in strong demand for Japanese exports, which is boosting price pressures. The scenario is expected to force BoJ policymakers to focus on tightening the monetary policy further either by raising interest rates or diminishing the bond-buying pace.
Meanwhile, a decent recovery in the US Dollar fails to uplift the USD/JPY pair. The US Dollar Index (DXY) discovers buying interest after declining to an almost two-month low near 104.00. The USD Index rebounds as market sentiment turns cautious, even though investors' confidence in the Federal Reserve (Fed) to begin reducing interest rates from the September meeting has improved.
The CME FedWatch tool shows that the probability of a rate cut in the September meeting has increased to 61% from 45.8% a week ago. The higher possibility of the Fed reducing interest rates in September is prompted by concerns over the United States (US) economic strength due to the central bank’s maintaining a restrictive framework for a longer period.
This week, the US Dollar is expected to remain highly volatile as the US ISM Services PMI and the Nonfarm Payrolls (NFP) reports are due to be published on Wednesday and Friday, respectively.
In today’s session, investors will focus on the JOLTS Job Openings data for April, which will be published at 14:00 GMT. US employers are estimated to have posted 8.34 million jobs, lower than the prior reading of 8.49 million.
Silver prices (XAG/USD) fell on Tuesday, according to FXStreet data. Silver trades at $29.96 per troy ounce, down 2.51% from the $30.73 it cost on Monday.
Silver prices have increased by 17.63% since the beginning of the year.
| Unit measure | Today Price |
|---|---|
| Silver price per troy ounce | $29.96 |
| Silver price per gram | $0.96 |
The Gold/Silver ratio, which shows the number of troy ounces of Silver needed to equal the value of one troy ounce of Gold, stood at 77.89 on Tuesday, up from 76.49 on Monday.
Investors might use this ratio to determine the relative valuation of Gold and Silver. Some may consider a high ratio as an indicator that Silver is undervalued – or Gold is overvalued – and might buy Silver or sell Gold accordingly. Conversely, a low ratio might suggest that Gold is undervalued relative to Silver.
Silver FAQs
Silver is a precious metal highly traded among investors. It has been historically used as a store of value and a medium of exchange. Although less popular than Gold, traders may turn to Silver to diversify their investment portfolio, for its intrinsic value or as a potential hedge during high-inflation periods. Investors can buy physical Silver, in coins or in bars, or trade it through vehicles such as Exchange Traded Funds, which track its price on international markets.
Silver prices can move due to a wide range of factors. Geopolitical instability or fears of a deep recession can make Silver price escalate due to its safe-haven status, although to a lesser extent than Gold's. As a yieldless asset, Silver tends to rise with lower interest rates. Its moves also depend on how the US Dollar (USD) behaves as the asset is priced in dollars (XAG/USD). A strong Dollar tends to keep the price of Silver at bay, whereas a weaker Dollar is likely to propel prices up. Other factors such as investment demand, mining supply – Silver is much more abundant than Gold – and recycling rates can also affect prices.
Silver is widely used in industry, particularly in sectors such as electronics or solar energy, as it has one of the highest electric conductivity of all metals – more than Copper and Gold. A surge in demand can increase prices, while a decline tends to lower them. Dynamics in the US, Chinese and Indian economies can also contribute to price swings: for the US and particularly China, their big industrial sectors use Silver in various processes; in India, consumers’ demand for the precious metal for jewellery also plays a key role in setting prices.
Silver prices tend to follow Gold's moves. When Gold prices rise, Silver typically follows suit, as their status as safe-haven assets is similar. The Gold/Silver ratio, which shows the number of ounces of Silver needed to equal the value of one ounce of Gold, may help to determine the relative valuation between both metals. Some investors may consider a high ratio as an indicator that Silver is undervalued, or Gold is overvalued. On the contrary, a low ratio might suggest that Gold is undervalued relative to Silver.
(An automation tool was used in creating this post.)
- USD/CAD gains ground despite a bearish bias suggested by daily chart analysis.
- The momentum indicator MACD also suggests a bearish trend for the pair.
- A break above the upper boundary of the descending channel and the psychological level of 1.3700 could weaken the bearish bias.
USD/CAD halts its three-day losing streak, trading around 1.3680 during the European hours on Tuesday. The appreciation of the pair is attributed to the decline in crude Oil prices, given the fact that Canada is the largest Oil exporter to the United States (US).
The analysis of the daily chart suggests the bearish bias for the USD/CAD pair, as it lies within the descending channel. Additionally, the 14-day Relative Strength Index (RSI) is positioned slightly above the 50 level, further movement may offer a clear directional trend.
The momentum indicator Moving Average Convergence Divergence (MACD) also suggests a bearish trend for the USD/CAD pair as the MACD line is positioned below the centerline and the signal line. However, the convergence below the signal line could lead to a momentum shift. A breakthrough above the centerline could weaken the bearish trend.
The USD/CAD pair could find the key support around the psychological level of 1.3600 and a throwback support of 1.3590. A break below this region could exert downward pressure on the pair to navigate around the significant level of 1.3500. Further support may appear at the lower threshold of the descending channel.
On the upside, the USD/CAD pair tests the upper boundary of the descending channel, followed by the psychological level of 1.3700. A breakthrough above the latter could weaken the bearish bias and lead the pair to explore the region around the key level of 1.3800, followed by April’s high of 1.3846.
USD/CAD: Daily Chart
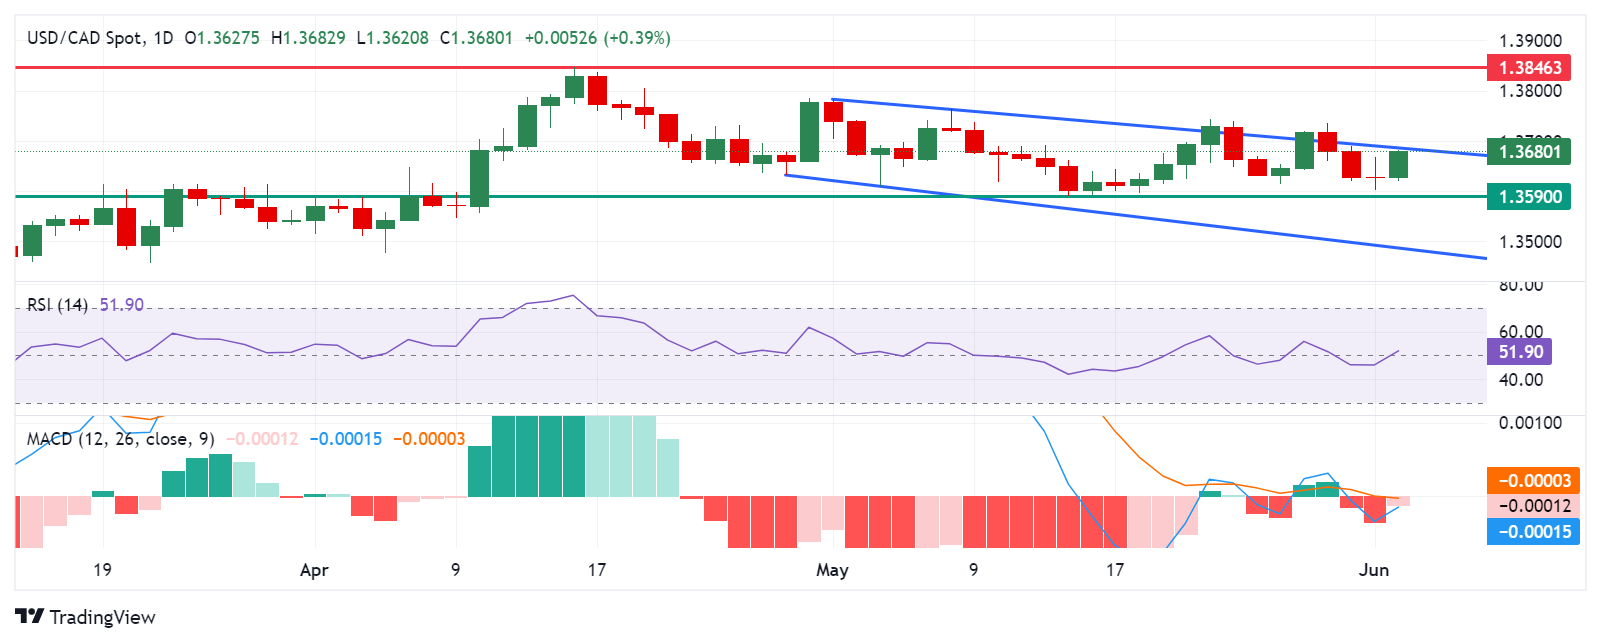
- NZD/USD drops as the US Dollar steadies ahead of US JOLTS Job Openings data.
- Weak US factory PMI report prompts Fed rate-cut bets.
- NZD/USD tests the Bullish Flag breakout region near 0.6170
The NZD/USD pair corrects modestly from fresh almost three-month high of 0.6200 in Tuesday’s European session. The Kiwi asset drops as the US Dollar (USD) gains ground after a sharp sell-off move on Monday. The US Dollar Index (DXY) finds a temporary cushion near 104.00. While the broader outlook of the US Dollar remains poor amid growing speculation that the Federal Reserve (Fed) will begin lowering its key interest rates in the September meeting.
Firm speculation for Fed rate-cuts in September is boosted by diminishing confidence of investors in the United States (US) economic strength. Weak US ISM Manufacturing PMI report for May and downwardly revised Q1 Gross Domestic Product (GDP) estimates have shaken investors’ confidence.
In today’s session, investors shift focus to the US JOLTS Job Openings data for April, which will be published at 14:00 GMT. US employers are estimated to have posted 8.34 million jobs, lower than the prior reading of 8.49 million. Lower job postings suggest easing labor market conditions.
Meanwhile, the New Zealand Dollar has performed strongly in last few trading sessions as investors worry about persistent price pressures in the kiwi economy, which keeps possibility of more rates hikes by the Reserve Bank of New Zealand (RBNZ) on the table.
NZD/USD delivers a modest corrective move and tests the strength of the Bullish Flag chart pattern breakout delivered on Monday. The above-mentioned chart formation exhibits an inventory adjustment process between institutional investors and retail participants. This pattern indicates a consolidation after a sharp upside move and it generally breaks towards the direction of the trend, which in this is upwards.
The 50-period Exponential Moving Average (EMA) near 0.6126 continues to provide support to the New Zealand Dollar bulls.
Meanwhile, the 14-period Relative Strength Index (RSI) has climbed above 60.00. A sustainable move above 60.00 will strengthen Kiwi bulls further.
An upside move above the round-level resistance of 0.6200 will drive the asset January 15 high near 0.6250, followed by January 12 high near 0.6280.
On the contrary, fresh downside would appear if the asset breaks below April 4 high around 0.6050 This would drag the asset towards the psychological support of 0.6000 and April 25 high at 0.5969.
NZD/USD four-hour chart
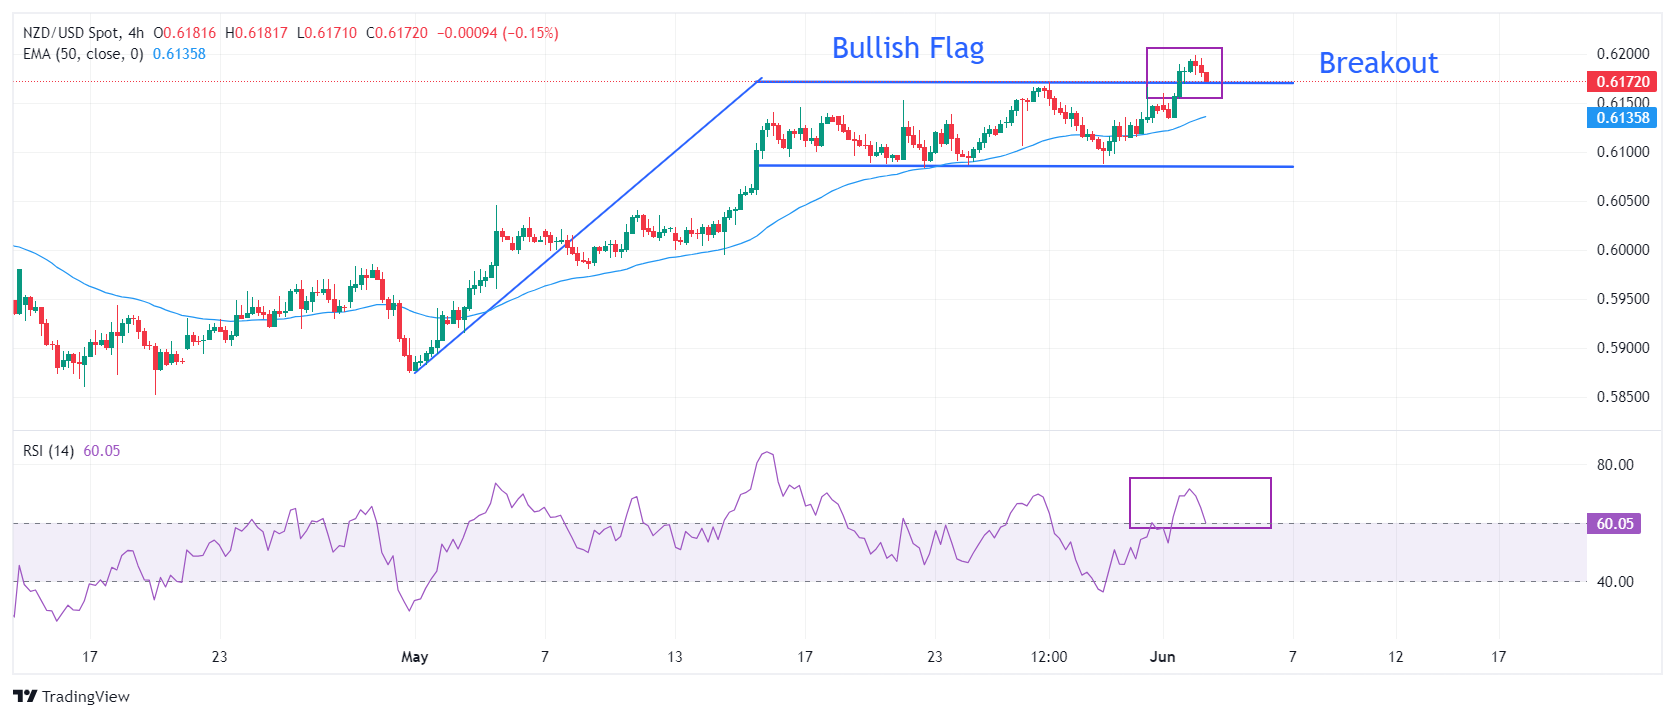
- The Mexican Peso pauses after plummeting over 4% in key pairs on Monday.
- The possibility of the left-leaning Morena party winning a supermajority sparks fears among investors.
- USD/MXN breaks above a key long-term trendline, transforming the technical picture for the pair.
The Mexican Peso (MXN) is resuming its downtrend after a brief pause on Tuesday following an over 4% decline in its key pairs on Monday. The Peso went into freefall after early indications showed President-elect Claudia Sheinbaum and her Morena party were heading for a landslide victory in the Mexican presidential and congressional elections held on Sunday.
USD/MXN is exchanging hands at 17.87 at the time of writing, EUR/MXN is trading at 19.47 and GBP/MXN at 22.86.
Mexican Peso weakens on fears of a Morena party supermajority
The Mexican Peso plummeted on Monday after a quick count by the National Electoral Institute showed Claudia Sheinbaum leading with at least 59% of the vote in the presidential elections, and her Morena party poised to possibly clinch super majorities in both houses of the Mexican legislature, according to Aljazeera News. The official results will be published after the votes are counted between June 5-8.
The Mexican Peso weakened significantly after investors became nervous Sheinbaum’s Morena party could win super majorities – defined as a majority of two thirds – in both the Congress and the Senate. This would enable them to enact proposed reforms to the Mexican constitution, such as the election of the judiciary by popular vote and the preferential treatment of state-owned energy companies over private corporations. Critics argue such changes could be anti-democratic and market unfriendly.
According to estimates by Bloomberg Economics, Morena will probably win a super majority in Congress but fall four-seats short of one in the Senate.
“Although that doesn’t immediately allow Sheinbaum to make changes to the constitution that have eluded [current President] Andres Manuel Lopez Obrador, it leaves her in the position to negotiate with just a few senators to pass key reforms,” said Bloomberg News’ Economy and Government reporter Alex Vasquez.
Yet not all of Sheinbaum’s policies will necessarily hurt the Mexican Peso. Her pledge to increase the minimum wage by around 11%, better welfare benefits and government-led investment could increase consumer spending and economic growth, forcing the Banco de México (Banxico) to maintain high interest rates, according to Kimberley Sperrfechter, Emerging Markets Economist at Capital Economics.
Since relatively high interest rates attract more foreign capital inflows, the Peso could remain well-supported despite investor fears.
Technical Analysis: USD/MXN breaks decisively above major trendline
USD/MXN – or the number of Pesos that can be bought with one US Dollar – breaks above a long-term trendline, marking a major shift in the outlook for the pair and probably reversing the intermediate-term downtrend to an uptrend.
With both the short and intermediate trends bullish, the odds favor more upside over those time frames (up to six months).
USD/MXN 4-hour Chart
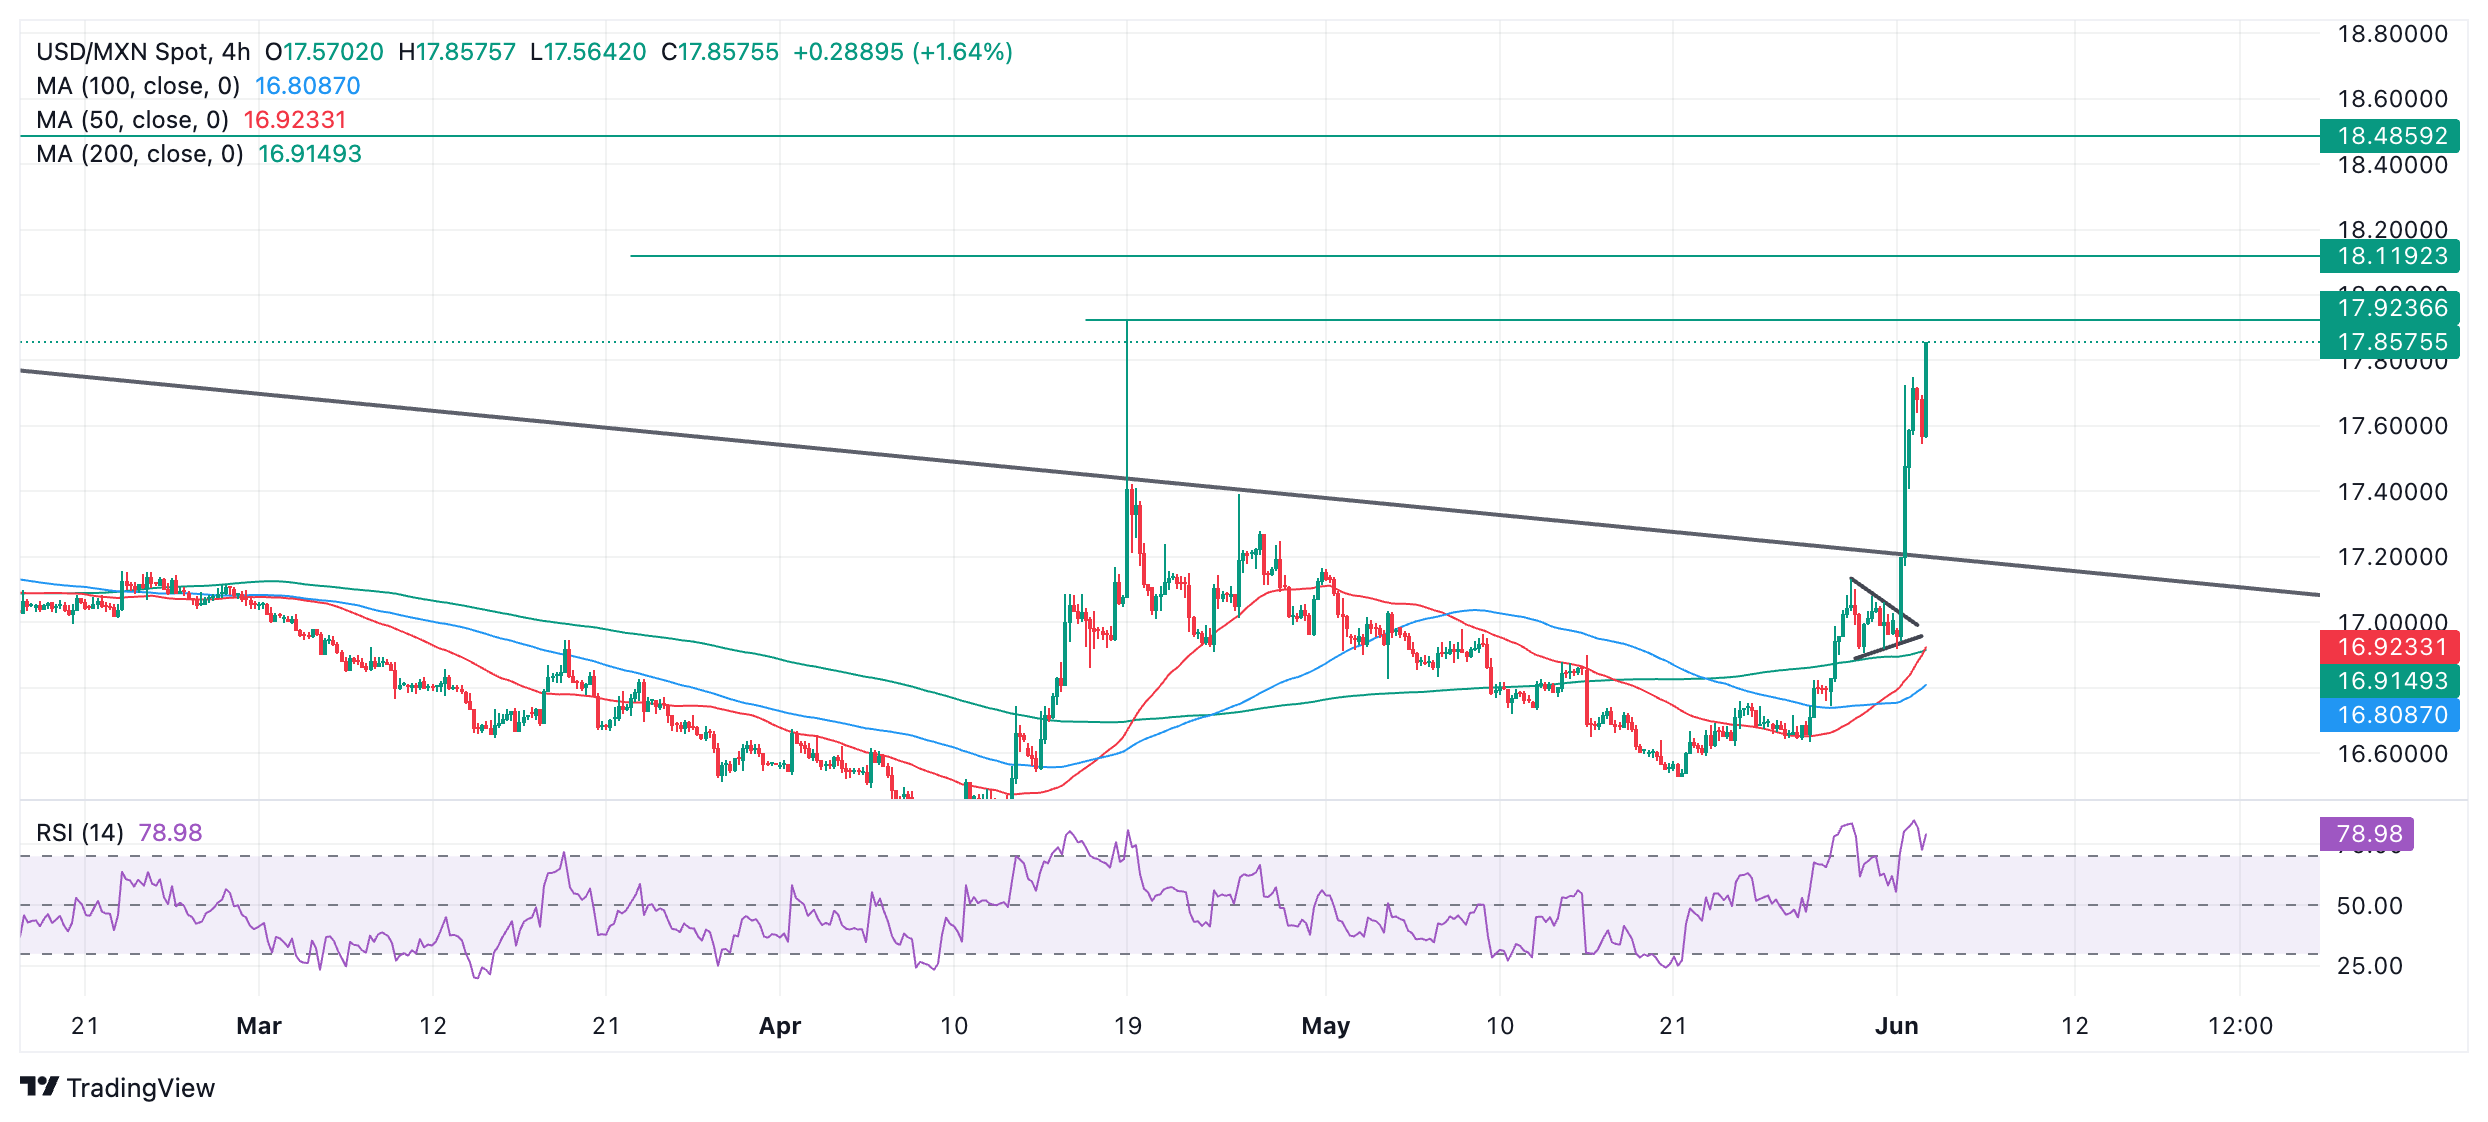
Further upside could see USD/MXN reach the April highs at around 17.92, followed by resistance at 18.12 (100-week Simple Moving Average) and then 18.49 (October 2023 high).
The long-term trend is probably still bearish, however, suggesting a risk of a reversal lower if the uptrend runs out of steam. There are no signs of that happening yet from price action, however, which remains resolutely bullish.
Mexican Peso FAQs
The Mexican Peso (MXN) is the most traded currency among its Latin American peers. Its value is broadly determined by the performance of the Mexican economy, the country’s central bank’s policy, the amount of foreign investment in the country and even the levels of remittances sent by Mexicans who live abroad, particularly in the United States. Geopolitical trends can also move MXN: for example, the process of nearshoring – or the decision by some firms to relocate manufacturing capacity and supply chains closer to their home countries – is also seen as a catalyst for the Mexican currency as the country is considered a key manufacturing hub in the American continent. Another catalyst for MXN is Oil prices as Mexico is a key exporter of the commodity.
The main objective of Mexico’s central bank, also known as Banxico, is to maintain inflation at low and stable levels (at or close to its target of 3%, the midpoint in a tolerance band of between 2% and 4%). To this end, the bank sets an appropriate level of interest rates. When inflation is too high, Banxico will attempt to tame it by raising interest rates, making it more expensive for households and businesses to borrow money, thus cooling demand and the overall economy. Higher interest rates are generally positive for the Mexican Peso (MXN) as they lead to higher yields, making the country a more attractive place for investors. On the contrary, lower interest rates tend to weaken MXN.
Macroeconomic data releases are key to assess the state of the economy and can have an impact on the Mexican Peso (MXN) valuation. A strong Mexican economy, based on high economic growth, low unemployment and high confidence is good for MXN. Not only does it attract more foreign investment but it may encourage the Bank of Mexico (Banxico) to increase interest rates, particularly if this strength comes together with elevated inflation. However, if economic data is weak, MXN is likely to depreciate.
As an emerging-market currency, the Mexican Peso (MXN) tends to strive during risk-on periods, or when investors perceive that broader market risks are low and thus are eager to engage with investments that carry a higher risk. Conversely, MXN tends to weaken at times of market turbulence or economic uncertainty as investors tend to sell higher-risk assets and flee to the more-stable safe havens.
- The US JOLTS data will be watched closely by investors ahead of the May jobs report.
- Job openings are forecast to edge lower to 8.34 million on the last business day of April.
- Markets don’t expect the Fed to lower the policy rate at least until September.
The Job Openings and Labor Turnover Survey (JOLTS) will be released on Tuesday by the US Bureau of Labor Statistics (BLS). The publication will provide data about the change in the number of job openings in April, alongside the number of layoffs and quits.
JOLTS data is scrutinized by market participants and Federal Reserve (Fed) policymakers because it can provide valuable insights regarding the supply-demand dynamics in the labor market, a key factor impacting salaries and inflation. Job openings have been trending down over the last year and a half, pointing to cooling conditions in the labor market. In March, the number of job openings stood at 8.48 million, marking the lowest reading since February 2021.
What to expect in the next JOLTS report?
"Over the month, the number of hires changed little at 5.5 million while the number of total separations decreased to 5.2 million," the BLS noted in its March JOLTS report and added: "Within separations, quits (3.3 million) and layoffs and discharges (1.5 million) changed little."
Following the 9.3 million openings announced in September, job openings remained below 9 million for six consecutive months. Investors expect job openings to edge lower to 8.34 million in April from 8.48 million in March. Meanwhile, Nonfarm Payrolls rose by 175,000 in April following the impressive 315,0000 increase recorded in March.
After closing the first four months of the year in positive territory, the US Dollar (USD) Index, which measures the USD’s valuation against a basket of six major currencies, lost more than 1.5% in May. Investors remain hopeful that the Federal Reserve (Fed) could opt for a 25 basis points reduction in the policy rate in September. According to the CME FedWatch Tool, the probability of a policy pivot stands at nearly 55%.
FXStreet Analyst Eren Sengezer shares his view on the JOLTS Job Openings data and the potential market reaction:
“In case the JOLTS Job Openings data for April comes in at or below 8 million, it could reaffirm loosening conditions in labor market and weigh on the USD with the immediate reaction. On the other hand, a reading above 9 million could cause investors to refrain from pricing in a rate cut in September, at least until May jobs report, and allow the USD to outperform its peers.”
When will the JOLTS report be released and how could it affect EUR/USD?
Job openings numbers will be published on Tuesday, June 4, at 14:00 GMT. Eren points out key technical levels to watch for EUR/USD ahead of JOLTS data:
“The Relative Strength Index (RSI) indicator on the daily chart holds comfortably above 50, highlighting a lack of bearish pressure. Following the uptrend that ended on May 16, the pair stabilized above the 1.0780-1.0800 region, where the 50-day, 100-day and 200-day Simple Moving Averages (SMA) are located. If EUR/USD drops below that area and starts using it as resistance, technical sellers could take action. In this scenario, further losses toward 1.0700 (psychological level, static level) and 1.0600 (2024-low set on April 16) could be seen.”
“In case EUR/USD continues to use 1.0780-1.0800 area as support, buyers could remain interested and open the door for a leg higher toward 1.0900 (static level, psychological level), 1.0950 (static level) and 1.1000 (psychological level, static level).”
Economic Indicator
JOLTS Job Openings
JOLTS Job Openings is a survey done by the US Bureau of Labor Statistics to help measure job vacancies. It collects data from employers including retailers, manufacturers and different offices each month.
Read more.Last release: Wed May 01, 2024 14:00
Frequency: Monthly
Actual: 8.488M
Consensus: 8.69M
Previous: 8.756M
Source: US Bureau of Labor Statistics
- The Pound Sterling aims to shift comfortably above 1.2800 against the USD as traders raise Fed rate-cut bets for September.
- A weak US factory PMI report boosts the possibility of the Fed pivoting to rate cuts.
- UK’s persistent service inflation remains a major concern for BoE policymakers.
The Pound Sterling (GBP) eases slightly from the round-level resistance of 1.2800 against the US Dollar in Tuesday’s London session but remains broadly firm. The GBP/USD pair posted a fresh two-month high earlier in the day due to a sharp decline in the US Dollar (USD), which was triggered by growing speculation that the Federal Reserve (Fed) will start reducing interest rates from the September meeting.
Market expectations for the Fed returning to policy normalisation strengthened after the weaker-than-expected United States (US) ISM Manufacturing PMI report for May indicated that the growth outlook of the world’s largest economy appears to be losing momentum. According to the PMI report, US manufacturing activity contracted for a second straight month as “demand remains elusive as companies demonstrate an unwillingness to invest due to current monetary policy and other conditions.”
The Manufacturing PMI, which gauges the health of factory activity, came in at 48.7, lower than the consensus of 49.6 and the former release of 49.2. The report also indicated a bleak demand environment and easing inflation prospects. The New Orders Index, which reflects the demand outlook, declined to 45.4 from the prior reading of 49.1. The Prices Paid Index, which gauges chances in input prices, dropped to 57.0 from the consensus of 60.0 and the prior reading of 60.9. Decelerating input price growth results in a slower increase in selling prices, which eases fears of inflation remaining persistent.
Daily digest market movers: Pound Sterling next move hinges on US JOLTS Job Openings data
- The Pound Sterling is slightly down against the US Dollar as the latter steadies in Tuesday’s European session after Monday’s sell-off. The US Dollar Index (DXY), which tracks the Greenback’s value against six major currencies, is slightly up but trades close to an almost two-month low near 104.00. The near-term outlook of the GBP/USD pair remains firm as traders increasingly price in that the Fed will lower interest rates in September.
- The CME FedWatch tool shows that traders see a 60% chance for interest rates declining from their current levels in September. The probability has improved significantly from 45.8% registered a week ago. The market speculation for Fed rate cuts is expected to remain volatile this week as investors gear up for major economic data releases such as the ISM Services PMI and Nonfarm Payrolls (NFP) data for May, which will be published on Wednesday and Friday, respectively.
- In today’s session, investors will focus on the JOLTS Job Openings data for April, which will be published at 14:00 GMT. US employers are estimated to have posted 8.34 million jobs, lower than the prior reading of 8.49 million. Lower job postings suggest that the labor market is losing strength.
- In the United Kingdom (UK), market speculation for Bank of England (BoE) rate cuts isn’t likely to move much Pound Sterling due to the absence of top-tier economic events and the fact that BoE officials aren’t speaking until after the upcoming elections. Currently, financial markets expect that the BoE will start reducing interest rates in the August meeting. UK’s annual headline Consumer Price Index (CPI) has come down significantly to 2.3% while persistent service inflation is still a major concern for BoE policymakers.
Technical Analysis: Pound Sterling aims to stabilize above 1.2800
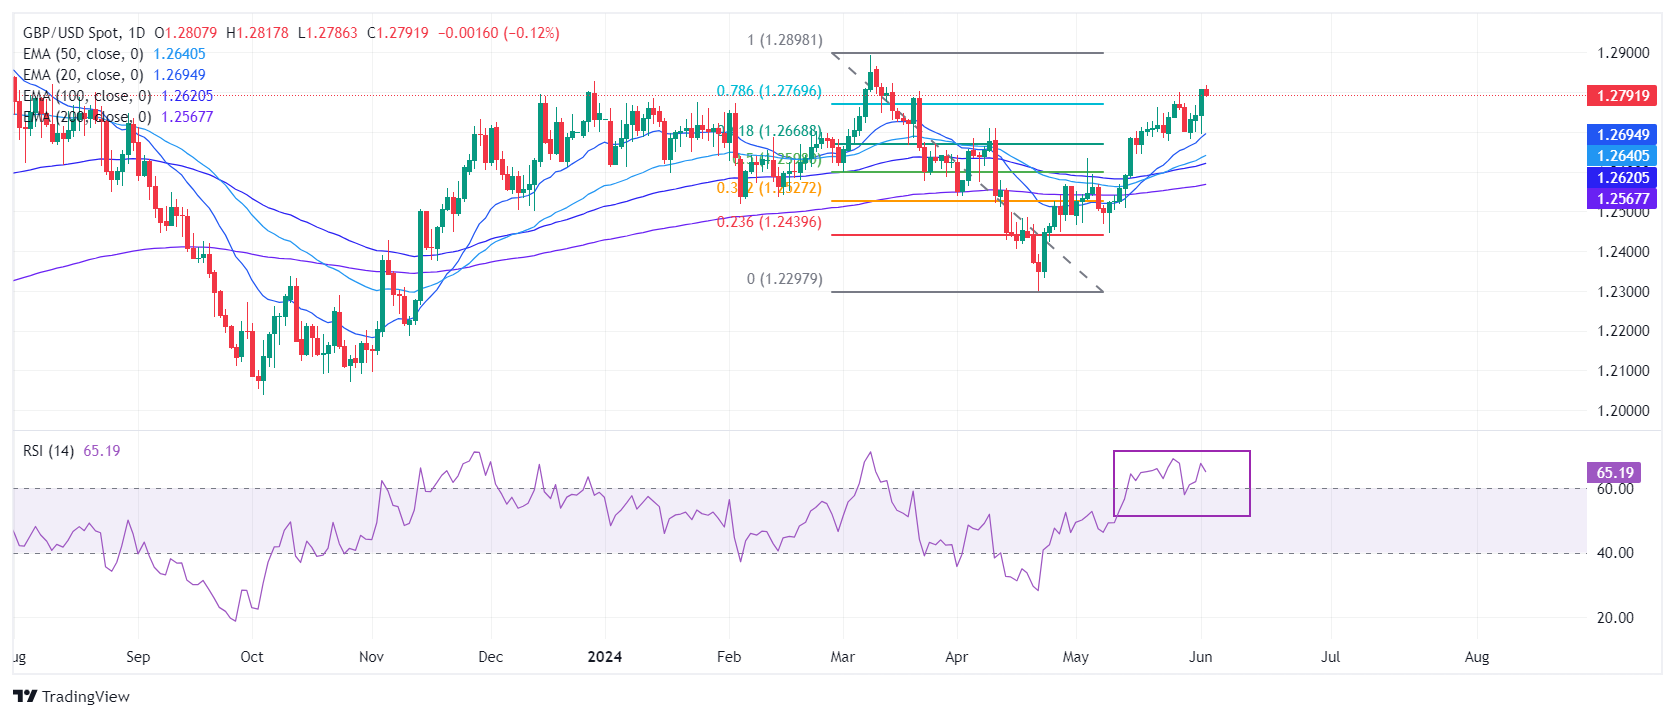
The Pound Sterling trades close to the round-level resistance of 1.2800 against the US Dollar after a sharp recovery move from 1.2700. The GBP/USD pair’s appeal has strengthened as it appears to sustain above the 78.6% Fibonacci retracement support at 1.2770 (plotted from the March 8 high of 1.2900 to the April 22 low at 1.2300).
The Cable is expected to remain in the bullish trajectory as all short-to-long-term Exponential Moving Averages (EMAs) are sloping higher, indicating a strong uptrend.
The 14-period Relative Strength Index (RSI) has shifted into the 40.00-60.00 range, suggesting that the momentum has leaned toward the upside.
Pound Sterling FAQs
The Pound Sterling (GBP) is the oldest currency in the world (886 AD) and the official currency of the United Kingdom. It is the fourth most traded unit for foreign exchange (FX) in the world, accounting for 12% of all transactions, averaging $630 billion a day, according to 2022 data. Its key trading pairs are GBP/USD, aka ‘Cable’, which accounts for 11% of FX, GBP/JPY, or the ‘Dragon’ as it is known by traders (3%), and EUR/GBP (2%). The Pound Sterling is issued by the Bank of England (BoE).
The single most important factor influencing the value of the Pound Sterling is monetary policy decided by the Bank of England. The BoE bases its decisions on whether it has achieved its primary goal of “price stability” – a steady inflation rate of around 2%. Its primary tool for achieving this is the adjustment of interest rates. When inflation is too high, the BoE will try to rein it in by raising interest rates, making it more expensive for people and businesses to access credit. This is generally positive for GBP, as higher interest rates make the UK a more attractive place for global investors to park their money. When inflation falls too low it is a sign economic growth is slowing. In this scenario, the BoE will consider lowering interest rates to cheapen credit so businesses will borrow more to invest in growth-generating projects.
Data releases gauge the health of the economy and can impact the value of the Pound Sterling. Indicators such as GDP, Manufacturing and Services PMIs, and employment can all influence the direction of the GBP. A strong economy is good for Sterling. Not only does it attract more foreign investment but it may encourage the BoE to put up interest rates, which will directly strengthen GBP. Otherwise, if economic data is weak, the Pound Sterling is likely to fall.
Another significant data release for the Pound Sterling is the Trade Balance. This indicator measures the difference between what a country earns from its exports and what it spends on imports over a given period. If a country produces highly sought-after exports, its currency will benefit purely from the extra demand created from foreign buyers seeking to purchase these goods. Therefore, a positive net Trade Balance strengthens a currency and vice versa for a negative balance.
Here is what you need to know on Tuesday, June 4:
The US Dollar (USD) holds steady against its major rivals early Tuesday after suffering large losses in the American session on Monday. April Factory Orders and JOLTS Job Openings data will be featured in the US economic docket in the second half of the day.
The data from the US showed on Monday that the ISM Manufacturing PMI dropped to 48.7 in May from 49.2 in April, showing an ongoing contraction in the manufacturing sector's business activity at an accelerating pace. Additionally, the inflation component of the survey, the Prices Paid Index, dropped to 57 from 60.9, highlighting a softer input inflation. The USD Index declined sharply following these data and touched its lowest level since early April, losing over 0.5% on a daily basis. The USD Index fluctuates slightly above 104.00 in the European morning and the benchmark 10-year US Treasury bond yield stays near 4.4% after falling nearly 2.5% on Monday. Finally, US stock index futures trade marginally lower on the day.
Economic Indicator
JOLTS Job Openings
JOLTS Job Openings is a survey done by the US Bureau of Labor Statistics to help measure job vacancies. It collects data from employers including retailers, manufacturers and different offices each month.
Read more.Last release: Wed May 01, 2024 14:00
Frequency: Monthly
Actual: 8.488M
Consensus: 8.69M
Previous: 8.756M
Source: US Bureau of Labor Statistics
Bank of Japan (BoJ) Governor Kazuo Ueda said on Tuesday that they will adjust the degree of monetary support if underlying inflation were to continue to move in line with their projections. Meanwhile, Japanese Finance Minister Shunichi Suzuki noted that the forex intervention was intended to respond to speculative moves and added that it had some effects. Following Monday's drop, USD/JPY holds steady at around 156.00 in the European morning on Tuesday.
EUR/USD gathered bullish momentum and advanced to its highest level since late March above 1.0910. The pair stays in a consolidation phase near 1.0900 early Tuesday.
GBP/USD took advantage of the selling pressure surrounding the USD and advanced to the 1.2800 area.
Following a modest decline seen in the first half of the day, Gold reversed its direction and climbed above $2,350 on Monday, rising over 1% on a daily basis. XAU/USD stages a technical correction and trades at around mid-$2,340s in the European session.
- USD/CHF rebounds around 0.8970 in Tuesday’s early European session.
- The monthly Swiss CPI inflation rose 0.3% MoM in May and was below the consensus of 0.4%.
- The downbeat US ISM Manufacturing PMI raised the possibility of first rate cuts from Fed, weighing on the US Dollar.
The USD/CHF pair snaps the three-day losing streak around 0.8970 on Tuesday during the early European trading hours. The Swiss Franc (CHF) attracts some sellers after the cooler-than-expected Swiss inflation data.
Switzerland’s Consumer Price Index (CPI) rose 1.4% YoY in May, compared to the previous reading of 1.4%, the Swiss Federal Statistical Office reported on Tuesday. Meanwhile, the monthly CPI inflation rose 0.3% MoM in May and was below the market consensus of 0.4%. The cooler inflation data has triggered expectations for the Swiss National Bank (SNB) rate cut on June 28 and weighs on the CHF. Nonetheless, the downside of the CHF might be limited as SNB President Thomas Jordan hinted that the Swiss central bank could intervene in the foreign exchange markets in order to keep a lid on inflation.
On the other hand, the US PCE inflation remained steady in April, and the ISM Manufacturing PMI came in weaker than expected in May, raising the possibility of first rate cuts from the US Federal Reserve (Fed) in September. This, in turn, might exert some pressure on the USD against the CHF. Traders will shift their attention to the US employment data on Friday.
The US Nonfarm Payrolls (NFP) is projected to see 190,000 job additions in May, while the Unemployment Rate is estimated to remain steady at 3.9% in the same period. Any sign of weaker labour market data might further undermine the Greenback and create a headwind for the USD/CHF pair.
Bank of Japan (BoJ) Deputy Governor Ryozo Himino said on Tuesday, “when easy monetary policy lasts for an extremely long period of time, policymakers must be vigilant to the potential impact it has on the economy's productivity, potential growth.”
Additional quotes
Firms will likely have more freedom in setting prices flexibly when prices, wages are rising moderately in tandem.
In economy facing effective zero lower bound, asset price moves such as FX, stocks and property prices are likely to serve as key transmission channel of monetary policy.
Bank of Japan FAQs
The Bank of Japan (BoJ) is the Japanese central bank, which sets monetary policy in the country. Its mandate is to issue banknotes and carry out currency and monetary control to ensure price stability, which means an inflation target of around 2%.
The Bank of Japan has embarked in an ultra-loose monetary policy since 2013 in order to stimulate the economy and fuel inflation amid a low-inflationary environment. The bank’s policy is based on Quantitative and Qualitative Easing (QQE), or printing notes to buy assets such as government or corporate bonds to provide liquidity. In 2016, the bank doubled down on its strategy and further loosened policy by first introducing negative interest rates and then directly controlling the yield of its 10-year government bonds.
The Bank’s massive stimulus has caused the Yen to depreciate against its main currency peers. This process has exacerbated more recently due to an increasing policy divergence between the Bank of Japan and other main central banks, which have opted to increase interest rates sharply to fight decades-high levels of inflation. The BoJ’s policy of holding down rates has led to a widening differential with other currencies, dragging down the value of the Yen.
A weaker Yen and the spike in global energy prices have led to an increase in Japanese inflation, which has exceeded the BoJ’s 2% target. Still, the Bank judges that the sustainable and stable achievement of the 2% target has not yet come in sight, so any sudden change in the current policy looks unlikely.
Gold prices fell in India on Tuesday, according to data compiled by FXStreet.
The price for Gold stood at 6,305.08 Indian Rupees (INR) per gram, down INR 6.47 compared with the INR 6,311.55 it cost on Monday.
The price for Gold decreased to INR 73,541.21 per tola from INR 73,616.68 per tola.
| Unit measure | Gold Price in INR |
|---|---|
| 1 Gram | 6,305.08 |
| 10 Grams | 63,050.26 |
| Tola | 73,541.21 |
| Troy Ounce | 196,110.00 |
FXStreet calculates Gold prices in India by adapting international prices (USD/INR) to the local currency and measurement units. Prices are updated daily based on the market rates taken at the time of publication. Prices are just for reference and local rates could diverge slightly.
Global Market Movers: Comex Gold price fails to attract follow-through buying despite Fed rate cut bets
- Signs of easing inflationary pressures and slowing economic growth lifted bets for an imminent rate cut by the Federal Reserve this year, which should continue to drive flows towards the non-yielding Comex Gold price.
- The US Bureau of Economic Analysis (BEA) reported on Friday that the Personal Consumption Expenditures (PCE) Price Index held steady at 2.7% and the core gauge rose 2.8% on a yearly basis, matching expectations.
- Data published on Monday showed that the US Institute for Supply Management's (ISM) Manufacturing PMI fell to 48.7 in May from the 49.2 previous, led by a slump in new goods orders by the most in nearly two years.
- This, in turn, triggered a fresh leg down in the US Treasury bond yields, dragging yields on the rate-sensitive two-year US government bond and the benchmark 10-year note to their lowest level since May 21.
- The US Dollar slides to its lowest level since April 10, which, along with geopolitical tensions in the Middle East, could offer additional support to the safe-haven XAU/USD and support prospects for some upside.
- Traders now look forward to the US economic docket, featuring the release of JOLTS Job Openings and Factory Orders data for short-term opportunities later during the early North American session this Tuesday.
- The attention will then turn to the US ADP report on private-sector employment scheduled on Wednesday, which will be followed by the official jobs data, popularly known as the Nonfarm Payrolls (NFP) report on Friday
- Apart from this, investors this week will take cues from key central bank event risks – the Bank of Canada (BoC) decision on Wednesday and the highly-anticipated European Central Bank (ECB) meeting on Thursday.
Gold FAQs
Gold has played a key role in human’s history as it has been widely used as a store of value and medium of exchange. Currently, apart from its shine and usage for jewelry, the precious metal is widely seen as a safe-haven asset, meaning that it is considered a good investment during turbulent times. Gold is also widely seen as a hedge against inflation and against depreciating currencies as it doesn’t rely on any specific issuer or government.
Central banks are the biggest Gold holders. In their aim to support their currencies in turbulent times, central banks tend to diversify their reserves and buy Gold to improve the perceived strength of the economy and the currency. High Gold reserves can be a source of trust for a country’s solvency. Central banks added 1,136 tonnes of Gold worth around $70 billion to their reserves in 2022, according to data from the World Gold Council. This is the highest yearly purchase since records began. Central banks from emerging economies such as China, India and Turkey are quickly increasing their Gold reserves.
Gold has an inverse correlation with the US Dollar and US Treasuries, which are both major reserve and safe-haven assets. When the Dollar depreciates, Gold tends to rise, enabling investors and central banks to diversify their assets in turbulent times. Gold is also inversely correlated with risk assets. A rally in the stock market tends to weaken Gold price, while sell-offs in riskier markets tend to favor the precious metal.
The price can move due to a wide range of factors. Geopolitical instability or fears of a deep recession can quickly make Gold price escalate due to its safe-haven status. As a yield-less asset, Gold tends to rise with lower interest rates, while higher cost of money usually weighs down on the yellow metal. Still, most moves depend on how the US Dollar (USD) behaves as the asset is priced in dollars (XAU/USD). A strong Dollar tends to keep the price of Gold controlled, whereas a weaker Dollar is likely to push Gold prices up.
(An automation tool was used in creating this post.)
FX option expiries for June 4 NY cut at 10:00 Eastern Time, via DTCC, can be found below
- EUR/USD: EUR amounts
- 1.0810 773m
- 1.0850 556m
- 1.0870 554m
- 1.0890 544m
- 1.0900 910m
- 1.0925 430m
- USD/JPY: USD amounts
- 155.00 523m
- USD/CHF: USD amounts
- 0.9030 660m
- 0.9100 422m
- AUD/USD: AUD amounts
- 0.6550 713m
- 0.6675 439m
- USD/CAD: USD amounts
- 1.3500 1.2b
- 1.3950 986m
- EUR/GBP: EUR amounts
- 0.8500 793m
- EUR/USD jumps above 1.0900 as the US Dollar weakens due to firm Fed rate-cut prospects.
- Traders raise Fed rate-cut bets amid fears of slower US economic growth.
- The ECB is due to announce June’s monetary policy decision on Thursday.
EUR/USD holds strength slightly above the round-level resistance of 1.0900 in Tuesday’s European session. Sheer strength in the major currency pair is driven by a sharp sell-off in the US Dollar (USD).
The US Dollar Index (DXY), which tracks the Greenback’s value against six major currencies, slips to an almost two-month low near the crucial support of 104.00 as a weak United States (US) ISM Manufacturing PMI report for May deepens fears of slowing economic growth and eases risks of persistent inflation.
The report showed that the Manufacturing PMI, which gauges the health of factory activity, contracted for the second straight month. The economic data came in at 48.7, lower than the consensus of 49.6 and the prior reading of 49.2. Apart from that, the New Orders Index, which reflects the demand outlook, fell to 45.4 from the former reading of 49.1, suggesting sluggishness in the economy in the midst of the second quarter as the Federal Reserve (Fed) maintains a restrictive monetary policy.
Financial markets were already worried about slowing US economic strength as the Q1 Gross Domestic Product (GDP) growth was downwardly revised to 1.3% from the preliminary estimates of 1.6%.
Weak US factory data has boosted market expectations that the Fed will begin reducing interest rates from the September meeting. The CME FedWatch tool shows that the probability of a rate cut in the September meeting has increased to 60% from 45.8% a week ago.
Meanwhile, investors await the US ISM Services PMI, ADP Employment Change and the Nonfarm Payrolls (NFP) report for May and JOLTS Job Openings data for April. This slew of economic data will influence market speculation for Fed rate cuts in September.
Daily digest market movers: EUR/USD remains firm with focus on ECB policy
- EUR/USD exhibits strength due to a sharp decline in the US Dollar. The major event for the Euro will be the European Central Bank’s (ECB) interest rate decision, which will be announced on Thursday. As ECB policymakers have remained comfortable with expectations of opting for the first rate cut since 2019, investors are keen to know the interest rate outlook beyond the June meeting.
- Currently, financial markets expect that the ECB will reduce its key borrowing rates by 60 basis points (bps) this year that suggests two rate cuts, which were at least five at the beginning of the year. These expectations have waned due to a rebound in price pressures in May, stubborn service inflation and an improved economic outlook.
- May’s preliminary Eurozone Harmonized Index of Consumer Prices (HICP) report showed a higher-than-expected increase in annual price pressures. The report also showed that services inflation, which is driven by wage growth, rose by 4.1%, the most in seven months. Meanwhile, the Eurozone economy grew by 0.3% in 1Q, beating the estimates of 0.2%.
- The majority of ECB policymakers have been reluctant to offer a specific rate trajectory and have advised they will remain data-dependent.
Technical Analysis: EUR/USD rises above 1.0900
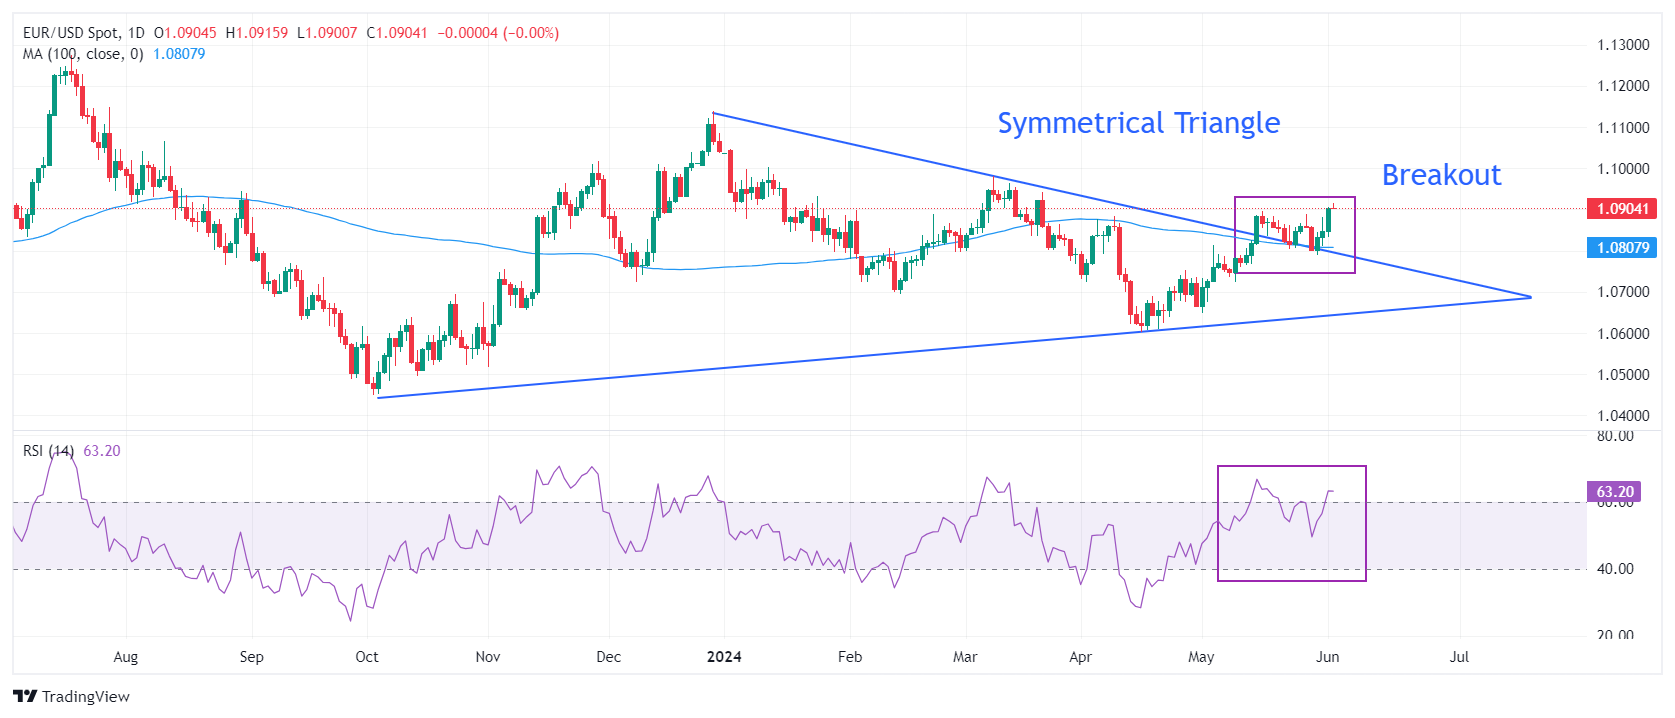
EUR/USD extends its upside to 1.0910, driven by strength due to the breakout from the Symmetrical Triangle formation on the daily time frame. The near-term outlook of the pair remains firm as the 50-day Exponential Moving Average (EMA) near 1.0800 is sloping higher.
The 14-period Relative Strength Index (RSI) has slipped into the 40.00-60.00 range, suggesting that the momentum, which leaned toward the upside, has faded for now.
The major currency pair is expected to extend its upside towards the March 21 high, around 1.0940, and the psychological resistance of 1.1000. However, a downside move below the 200-day EMA at 1.0800 could push it further down.
Euro FAQs
The Euro is the currency for the 20 European Union countries that belong to the Eurozone. It is the second most heavily traded currency in the world behind the US Dollar. In 2022, it accounted for 31% of all foreign exchange transactions, with an average daily turnover of over $2.2 trillion a day. EUR/USD is the most heavily traded currency pair in the world, accounting for an estimated 30% off all transactions, followed by EUR/JPY (4%), EUR/GBP (3%) and EUR/AUD (2%).
The European Central Bank (ECB) in Frankfurt, Germany, is the reserve bank for the Eurozone. The ECB sets interest rates and manages monetary policy. The ECB’s primary mandate is to maintain price stability, which means either controlling inflation or stimulating growth. Its primary tool is the raising or lowering of interest rates. Relatively high interest rates – or the expectation of higher rates – will usually benefit the Euro and vice versa. The ECB Governing Council makes monetary policy decisions at meetings held eight times a year. Decisions are made by heads of the Eurozone national banks and six permanent members, including the President of the ECB, Christine Lagarde.
Eurozone inflation data, measured by the Harmonized Index of Consumer Prices (HICP), is an important econometric for the Euro. If inflation rises more than expected, especially if above the ECB’s 2% target, it obliges the ECB to raise interest rates to bring it back under control. Relatively high interest rates compared to its counterparts will usually benefit the Euro, as it makes the region more attractive as a place for global investors to park their money.
Data releases gauge the health of the economy and can impact on the Euro. Indicators such as GDP, Manufacturing and Services PMIs, employment, and consumer sentiment surveys can all influence the direction of the single currency. A strong economy is good for the Euro. Not only does it attract more foreign investment but it may encourage the ECB to put up interest rates, which will directly strengthen the Euro. Otherwise, if economic data is weak, the Euro is likely to fall. Economic data for the four largest economies in the euro area (Germany, France, Italy and Spain) are especially significant, as they account for 75% of the Eurozone’s economy.
Another significant data release for the Euro is the Trade Balance. This indicator measures the difference between what a country earns from its exports and what it spends on imports over a given period. If a country produces highly sought after exports then its currency will gain in value purely from the extra demand created from foreign buyers seeking to purchase these goods. Therefore, a positive net Trade Balance strengthens a currency and vice versa for a negative balance.
- The non-yielding Silver loses ground as US Treasury yields edge higher.
- Silver prices could strengthen as the Fed is expected to deliver at least a 25 basis-point rate cut in 2024.
- The safe-haven demand for Silver diminishes by easing tensions in the Middle East.
Silver price retraces its recent gains, trading around $30.50 per troy ounce during the Asian session on Tuesday. The upward correction in the US Treasury yields dampened the demand for non-yielding assets like Silver.
However, Silver price could limit its losses due to growing expectations of interest rate cuts by the Federal Reserve (Fed) in 2024. This sentiment is reinforced by the unexpected drop in the ISM Manufacturing PMI to 48.7 in May, down from April's reading of 49.2 and below the forecast of 49.6. The US manufacturing sector experiencing its second consecutive month of contraction, marking the 18th in the last 19 months.
Traders increasingly bet on the possibility of rate cuts by the US Federal Reserve (Fed) this year. According to the CME FedWatch Tool, there is nearly a 60% probability of the Fed lowering the policy rate by at least 25 basis points in September.
The safe-haven appeal of Silver has been affected by the easing tensions in the Israel-Hamas conflict in the Middle East. As reported by Reuters on Monday, the US is seeking support from the United Nations Security Council for President Joe Biden's proposal to halt the fighting between Israel and Palestinian militants Hamas in the Gaza Strip. Israeli Prime Minister Benjamin Netanyahu's administration reluctantly accepted President Biden's cease-fire proposal for Gaza on Sunday.
- GBP/JPY hovers around 200.00 in Tuesday’s early European session.
- The cross keeps the positive stance above the 100-period EMA on the 4-hour chart, with a bullish RSI indicator.
- The first upside target is seen at 200.60; the initial support level is located at 199.40.
The GBP/JPY cross holds positive ground near 200.00 during the early European session on Tuesday. The interest rate differential between the United Kingdom and Japan continued to undermine the Japanese Yen (JPY) and create a tailwind for GBP/JPY. However, the verbal intervention from Japanese authorities might cap the upside for the cross in the near term.
Technically, the bullish outlook of GBP/JPY remains intact as the cross holds above the key 100-period Exponential, Moving Average (EMA) on the 4-hour chart. The upward momentum is supported by the 14-day Relative Strength Index (RSI), which stands in bullish territory around 54.0. This indicates that the path of least resistance level is to the upside.
The immediate upside target will emerge near the upper boundary of Bollinger Band at 200.60. A bullish breakout above this level will pave the way to the 201.00 psychological mark.
On the flip side, the initial support level for the cross is seen near a low of June 3 at 199.40. The next contention level to watch is the lower limit of the Bollinger Band at 199.16. Further south, the key barrier is located at the 100-period EMA at 198.60.
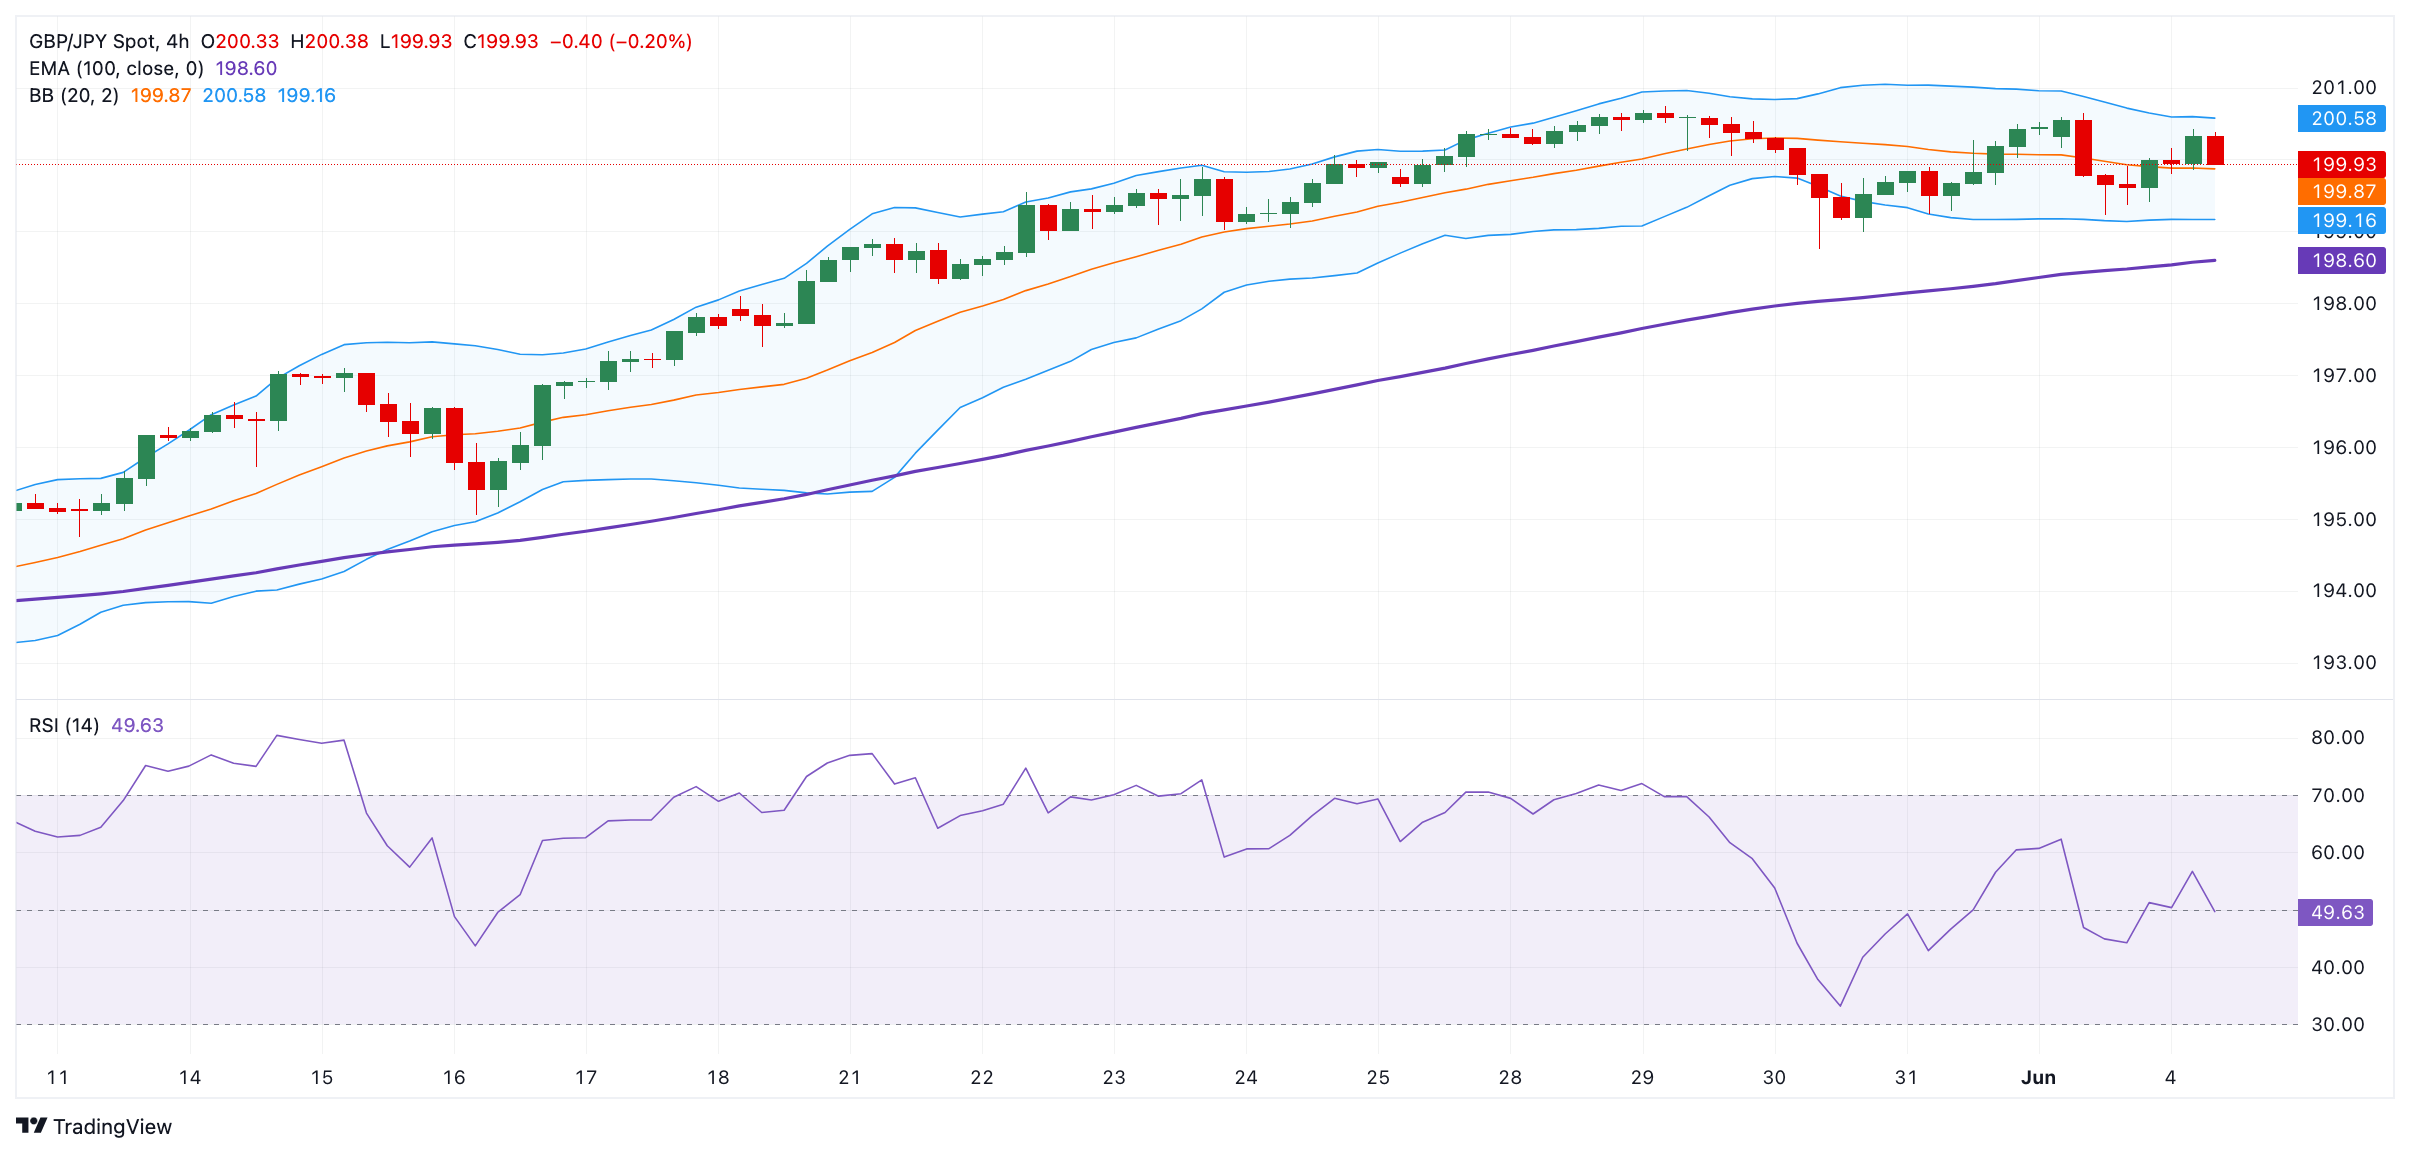
- The Japanese Yen edges lower due to the interest rate differential between the US and Japan.
- BoJ Governor Kazuo Ueda stated that the central bank may increase rates if underlying inflation accelerates as expected.
- The US Dollar gains ground due to the upward correction in US Treasury yields.
The Japanese Yen (JPY) edges lower against the US Dollar (USD) on Tuesday as depreciation in global bond yields reduced safe-haven demand for the JPY. Additionally, the interest rate differential between the US and Japan continued to pressure the Yen, underpinning the USD/JPY pair.
Bank of Japan (BoJ) Governor Kazuo Ueda said on Tuesday that the central bank will conduct "nimble" market operations if long-term interest rates spike, signaling the BoJ's readiness to ramp up bond buying when necessary. Ueda also stated that the BoJ will adjust the degree of monetary support if underlying inflation accelerates in line with its forecast, per Reuters.
US Dollar Index (DXY), which measures the value of the US Dollar (USD) against six other major currencies, edges higher with the improvement in US Treasury yields. This uptick can be linked to a prevalent risk-averse mood before the release of Wednesday's ADP Employment Change and ISM Services PMI data. Despite expectations that the Federal Reserve (Fed) won't pursue further interest rate hikes, putting downward pressure on US Treasury yields, this could potentially weaken the Greenback.
Daily Digest Market Movers: Japanese Yen depreciates due to investors’ caution
- Reuters reported on Tuesday that Japan's government will highlight the challenges a weak Yen poses for households in this year's long-term economic policy roadmap. This focus on the Yen's impact is expected to maintain pressure on the Bank of Japan to either raise interest rates or reduce its extensive bond-buying program.
- The ISM Manufacturing PMI unexpectedly dropped to 48.7 in May, down from April's reading of 49.2 and below the forecast of 49.6. The US manufacturing sector experienced its second consecutive month of contraction, marking the 18th time in the last 19 months.
- Reuters reported on Monday that Japanese Economy Minister Yoshitaka Shindo announced that the government will “continue efforts for primary balance to reach within surplus territory in FY 2025.” Shindo also expressed optimism, stating that “Real economic growth of 1.3% in FY 2025 is not so unrealistic.”
- Japan's Tokyo Consumer Price Index (CPI), released on Friday, rose to 2.2% year-over-year in May, up from April's 1.8% rise. If nationwide inflation in Japan were to decline, it would likely deter the Bank of Japan (BoJ) from raising interest rates.
- In an interview with Fox Business on Thursday, Atlanta Fed President Raphael Bostic stated that he does not think additional rate increases are necessary to achieve the Fed's 2% annual inflation target. Furthermore, New York Fed President John Williams stated as per Reuters that inflation is currently too high but should start to decline in the second half of 2024. Williams believes that monetary policy action is not urgently needed.
Technical Analysis: USD/JPY tests the key level of 156.50
The USD/JPY pair trades around 156.40 on Tuesday. Analysis of the daily chart shows a symmetrical triangle pattern, signaling a period of consolidation. However, the 14-day Relative Strength Index (RSI) remains slightly above 50 level, a decline may suggest a potential momentum shift toward a bearish bias.
Regarding potential price movements, if the USD/JPY pair breaks above the psychological barrier of 157.00 and surpasses the upper boundary of the symmetrical triangle, it could find support to retest 160.32, its highest level in over thirty years.
Conversely, if the pair breaches the lower boundary of the symmetrical triangle, it may face downward pressure, approaching the psychological level of 156.00. Further downside could lead to testing the 50-day Exponential Moving Average (EMA) at 154.69.
USD/JPY: Daily Chart
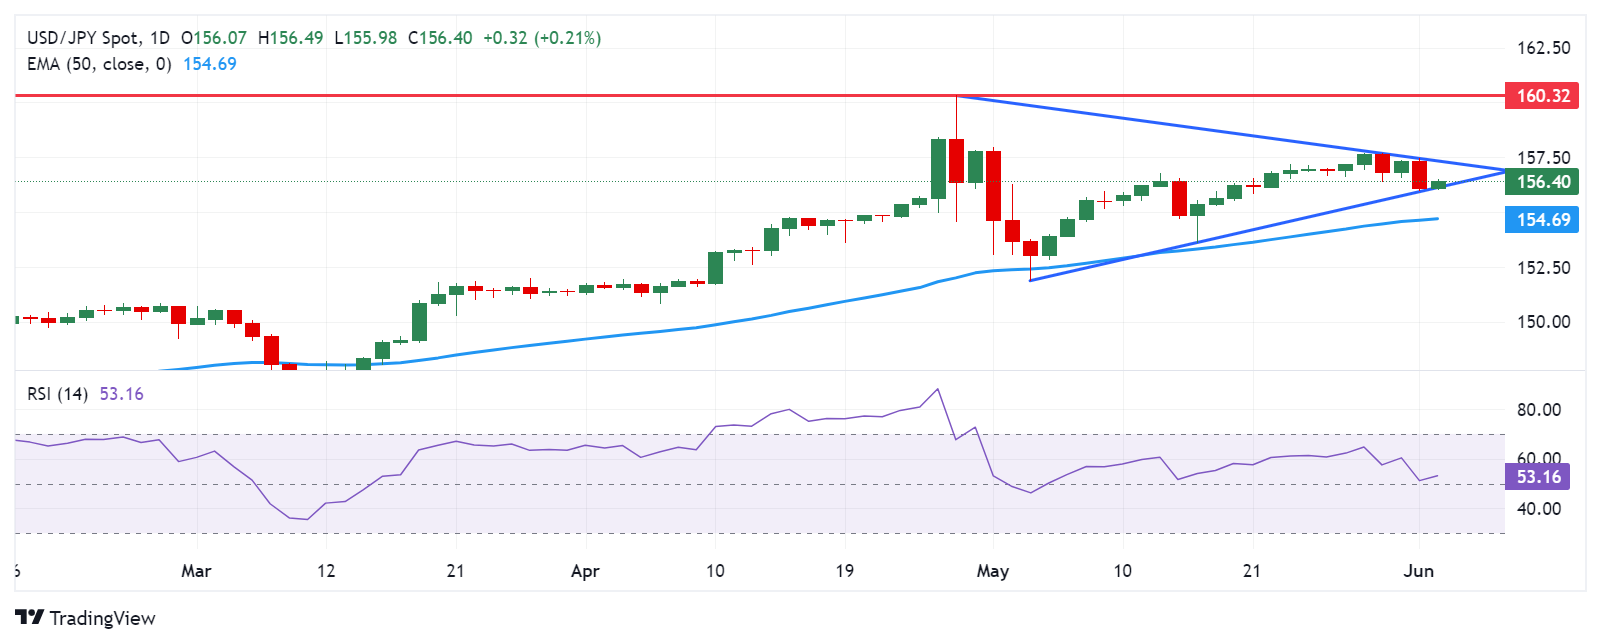
Japanese Yen price today
The table below shows the percentage change of the Japanese Yen (JPY) against listed major currencies today. Japanese Yen was the weakest against the US Dollar.
| USD | EUR | GBP | CAD | AUD | JPY | NZD | CHF | |
| USD | -0.02% | -0.01% | 0.05% | 0.13% | 0.19% | 0.03% | 0.09% | |
| EUR | 0.03% | 0.02% | 0.07% | 0.17% | 0.22% | 0.06% | 0.11% | |
| GBP | 0.00% | -0.02% | 0.06% | 0.16% | 0.21% | 0.05% | 0.09% | |
| CAD | -0.05% | -0.08% | -0.06% | 0.13% | 0.15% | -0.02% | 0.04% | |
| AUD | -0.13% | -0.19% | -0.18% | -0.10% | 0.03% | -0.11% | -0.08% | |
| JPY | -0.21% | -0.20% | -0.18% | -0.16% | -0.05% | -0.15% | -0.11% | |
| NZD | -0.03% | -0.07% | -0.08% | 0.01% | 0.12% | 0.16% | 0.04% | |
| CHF | -0.09% | -0.11% | -0.09% | -0.03% | 0.10% | 0.12% | -0.04% |
The heat map shows percentage changes of major currencies against each other. The base currency is picked from the left column, while the quote currency is picked from the top row. For example, if you pick the Euro from the left column and move along the horizontal line to the Japanese Yen, the percentage change displayed in the box will represent EUR (base)/JPY (quote).
Japanese Yen FAQs
The Japanese Yen (JPY) is one of the world’s most traded currencies. Its value is broadly determined by the performance of the Japanese economy, but more specifically by the Bank of Japan’s policy, the differential between Japanese and US bond yields, or risk sentiment among traders, among other factors.
One of the Bank of Japan’s mandates is currency control, so its moves are key for the Yen. The BoJ has directly intervened in currency markets sometimes, generally to lower the value of the Yen, although it refrains from doing it often due to political concerns of its main trading partners. The current BoJ ultra-loose monetary policy, based on massive stimulus to the economy, has caused the Yen to depreciate against its main currency peers. This process has exacerbated more recently due to an increasing policy divergence between the Bank of Japan and other main central banks, which have opted to increase interest rates sharply to fight decades-high levels of inflation.
The BoJ’s stance of sticking to ultra-loose monetary policy has led to a widening policy divergence with other central banks, particularly with the US Federal Reserve. This supports a widening of the differential between the 10-year US and Japanese bonds, which favors the US Dollar against the Japanese Yen.
The Japanese Yen is often seen as a safe-haven investment. This means that in times of market stress, investors are more likely to put their money in the Japanese currency due to its supposed reliability and stability. Turbulent times are likely to strengthen the Yen’s value against other currencies seen as more risky to invest in.
- India’s Nifty opened 1% lower on Tuesday, reversing from record highs.
- Early vote counting shows PM Modi-led BJP alliance leading in 300 seats out of total 543.
- All eyes remain on India’s election outcome and the June 7 RBI policy decision.
Nifty 50, India’s key benchmark index, opened 1% lower on Tuesday, reversing Monday’s over 3% rally.
Markets are witnessing a ‘sell the fact’ trading in the Indian equity markets, as they highly anticipate a stronger return of the Prime Minister Narendra Modi-led Bharatiya Janata Party (BJP) alliance, now for the third straight term.
The National Stock Exchange (NSE) Nifty 50 is losing 1.41% on the day to trade below 23,000, having closed Monday at 23,263.
Stock market news
- Early gainers on Nifty are SunPharma and Nestle India. Meanwhile, the big losers in early trades on Nifty are Adani Enterprises, Adani Ports, Coal India, SBI Bank and ONGC.
- PM Modi-led BJP alliance leads in 300 seats out of total 543 in early vote counting trends, per local media outlets, cited by Reuters.
- Exit polls over the weekend predicted that PM Modi will retain power for a third straight term, with BJP-led NDA winning anywhere between 350-401 seats.
- The Indian Rupee has faced rejection at the key resistance of 83.04 against the US Dollar, driving USD/INR back toward 83.50, as of writing, up 0.36% on the day.
- Markets are also weighing the US economic health prospects after weak ISM PMI data on Monday.
- ISM Manufacturing PMI index dropped from 49.2 in April to 48.7 in May, missing the expected 49.6 print. The ISM Manufacturing Prices Paid eased to 57.0 in May vs. 60.9 previous and 60.0 expected.
- Last week, India’s economy grew by 8.2% in the fiscal year ended March 2024, sharply higher than 7% expansion recorded in the previous year, led by a robust performance of manufacturing and construction sectors, per Reuters.
- All eyes remain on the results of the 2024 India’s general election due later on Tuesday and the Reserve Bank of India’s (RBI) monetary policy announcements on June 7 for fresh trading impulse.
Nifty 50 FAQs
The Nifty 50, or simply Nifty, is the most commonly followed stock index in India. It was launched in 1996 by the National Stock Exchange of India (NSE). It plots the weighted average share price of 50 of the largest Indian corporations, offering investors comprehensive exposure to 13 sectors of the economy. Each corporation's weighting is based on its "free-float capitalization", or the value of all its shares readily available for trading.
The Nifty is a composite so its value is dependent on the performance of the companies that make up the index, as revealed in their quarterly and annual results. Another factor is government policies, such as when in 2016 the government decided to demonetize 500 and 1000 Rupee banknotes. This led to a temporary cash shortage which negatively impacted the Nifty. The level of interest rates set by the Reserve Bank of India is a further factor as it determines the cost of borrowing. Climate change, pandemics and natural disasters are also drivers.
The Nifty 50 was launched on April 22, 1996 at a base level of 1,000. Its highest recorded level to date is 22,097 achieved on January 15, 2024 (this is being written in Feb 2024). The index first closed above the 10,000 level on October 17, 2017. The Nifty recorded its biggest daily decline on March 23, 2020 during the Covid pandemic, when it fell 1,125 points or 12.37%. The Nifty’s biggest gain in a single day occurred on May 18, 2009, when it rose 651 points after the results of the Indian elections.
Major corporations in the Nifty 50 include HDFC Bank, Reliance Industries, ICICI Bank, Tata Consultancy Services, Larsen and Toubro, ITC Ltd, Housing Development Finance Corporation Ltd and Kotak Mahendra Bank.
- GBP/USD struggles to capitalize on the move to a nearly three-month high set this Tuesday.
- Fed rate cut bets keep the USD bulls on the defensive and lend some support to the major.
- The technical setup validates the positive outlook and supports prospects for further gains.
The GBP/USD pair climbs to its highest level since March 14 during the Asian session on Tuesday, albeit struggles to capitalize on the move and is currently placed just above the 1.2800 mark. The near-term bias, meanwhile, seems tilted in favor of bullish traders in the wake of the prevalent selling bias surrounding the US Dollar (USD).
In fact, the USD Index (DXY), which tracks the Greenback against a basket of currencies, drops to a nearly two-month low on the back of rising bets for an imminent rate cut by the Federal Reserve (Fed), bolstered by Monday's disappointing US ISM PMI. Apart from this, expectations that the Bank of England (BoE) might keep interest rates at their current level for a little bit longer should underpin the British Pound (GBP) and validate the near-term positive outlook for the GBP/USD pair.
From a technical perspective, the overnight breakout through the 1.2800 mark could be seen as a fresh trigger for bullish traders. Moreover, oscillators on the daily chart have been gaining positive traction and are still away from being in the overbought territory. This, in turn, suggests that the path of least resistance for the GBP/USD pair is to the upside and supports prospects for a move to the 1.2855-1.2860 region en route to the 1.2900 neighborhood or the YTD peak touched in March.
On the flip side, weakness below the 1.2780-1.2775 immediate support might attract some buyers around the 1.2725-1.2720 area. This should help limit the downside for the GBP/USD pair near the 1.2700 mark. The latter should act as a key pivotal point, which if broken decisively should pave the way for a slide towards the next relevant support near mid-1.2600s. Spot prices might eventually drop to test the 50-day Simple Moving Average (SMA) support near the 1.2600-1.2595 region.
GBP/USD daily chart
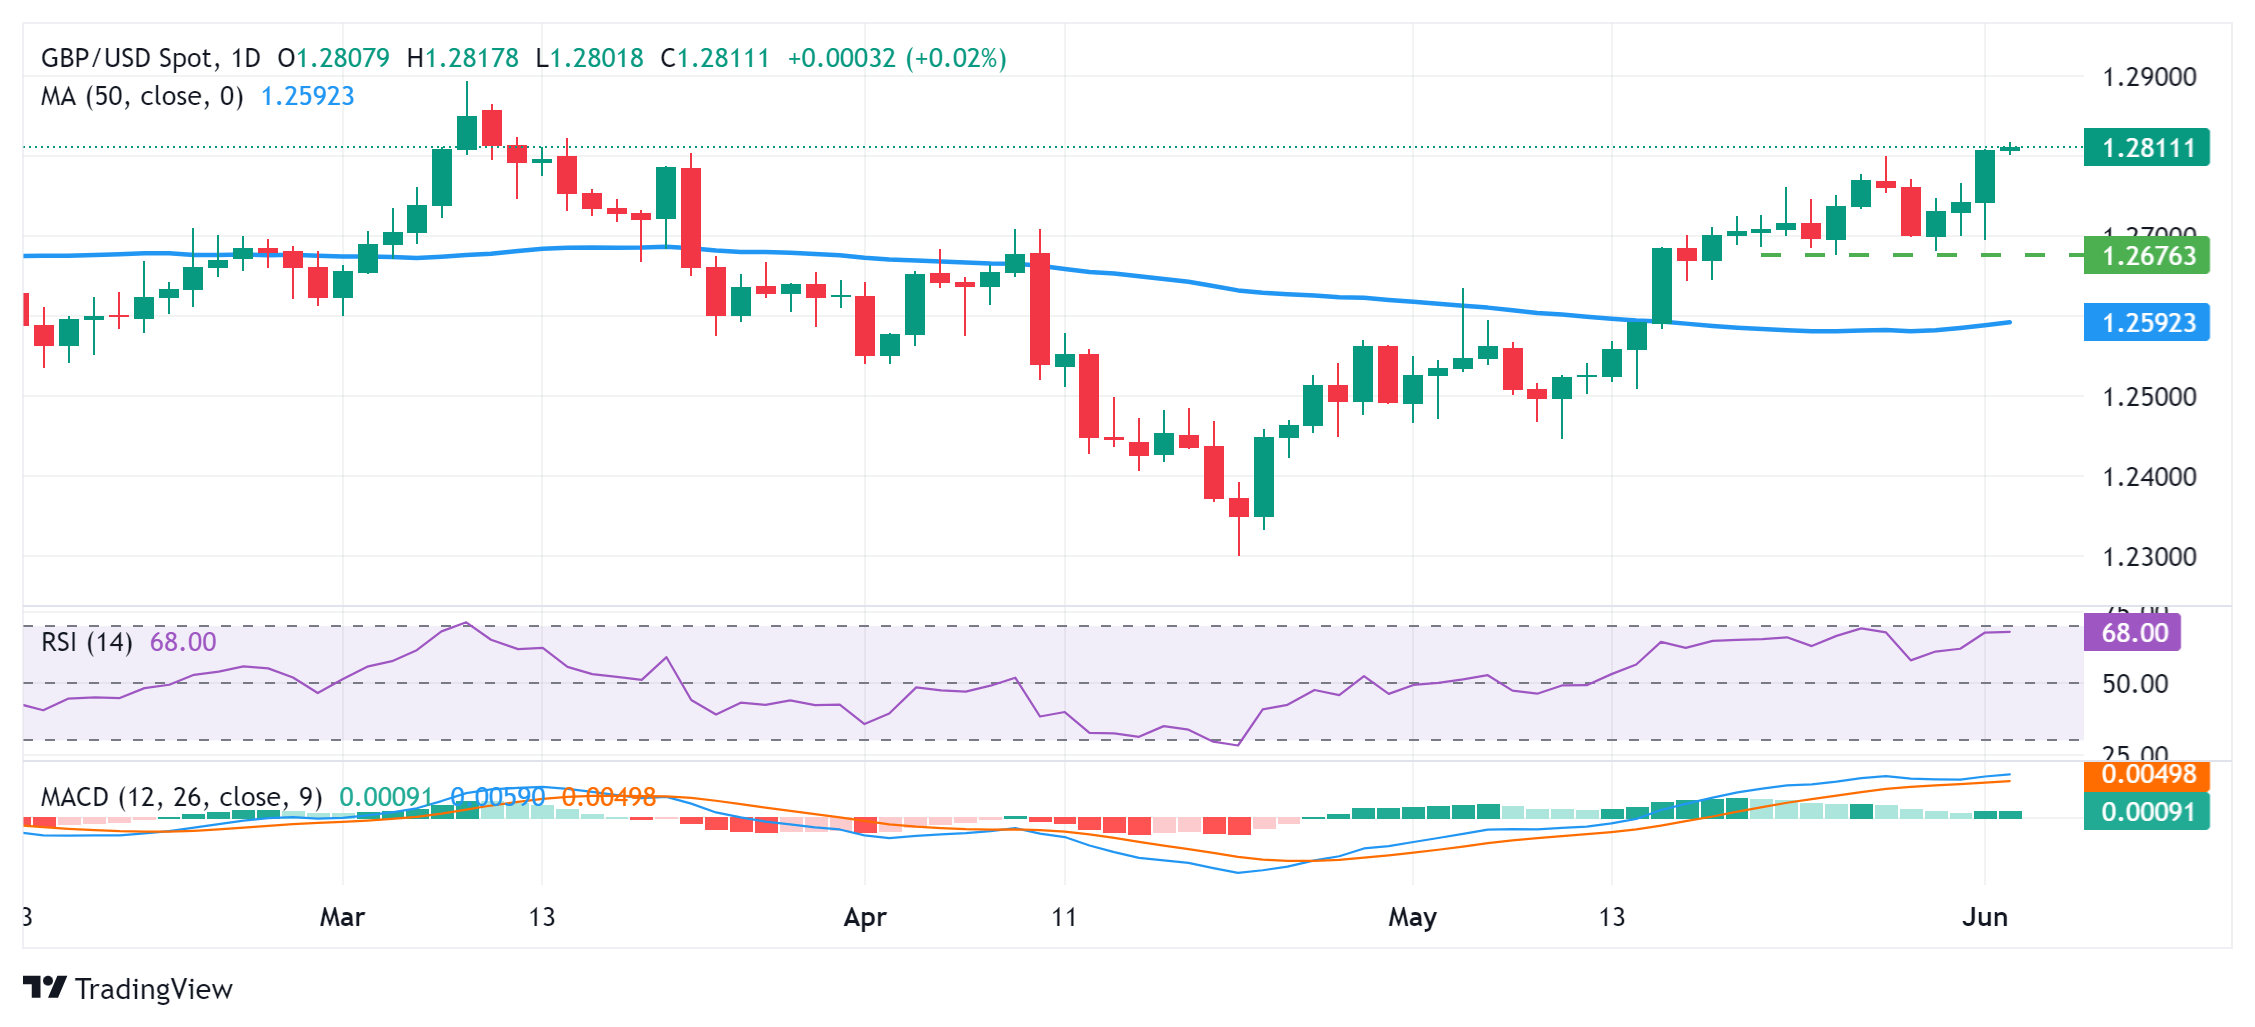
- Indian Rupee trades with mild negative bias on Tuesday.
- The cautious mood ahead of India's general election results and key US data weighs on the INR.
- India’s HSBC Services PMI and US ISM Services PMI for May will be released on Wednesday.
Indian Rupee (INR) trades with mild losses on Tuesday despite the softer US Dollar (USD). The INR trims gains after marking its best intraday performance since December 2023 on Monday. Investors turn cautious ahead of India's official general election outcome, which is due on Tuesday. A third consecutive win for the BJP-led government might boost investor confidence and lift the Indian Rupee. Furthermore, risk appetite and a decline in crude oil prices continue to underpin the INR as India is the third-largest oil consumer in the world.
India’s HSBC Services Purchasing Managers Index (PMI) and US ISM Services PMI for May will be published on Wednesday. The highlight of this week will be the Reserve Bank of India's (RBI) monetary policy and the US Nonfarm Payrolls later on Friday. The stronger-than-expected US economic data might provide some support to the Greenback and cap the downside for the pair.
Daily Digest Market Movers: Indian Rupee weakens ahead of India's election outcome
- India’s Prime Minister Narendra Modi's BJP leads in 150 seats out of a total of 543 in early vote counting trends, per Reuters.
- Most exit polls projected the alliance led by Modi's Bharatiya Janata Party (BJP) would win 303 seats in the 543-member lower house and likely get a two-thirds majority, enough to initiate amendments to the constitution, per Reuters.
- HDFC Securities FX research analyst, Dilip Parmar, said that the Indian rupee should gain "as we will see dollar inflows on foreign funds buying domestic equities and debt.”
- The Indian HSBC Manufacturing PMI dropped to 57.5 in May, compared to the previous reading and the market consensus of 58.4.
- The US ISM Manufacturing PMI declined to 48.7 in May from the previous reading of 49.2, weaker than the market expectation of 49.6.
- The US Nonfarm Payrolls (NFP) is estimated to see 190,000 job additions in May.
Technical analysis: USD/INR resumes bearish outlook
The Indian Rupee trades softer on the day. The USD/INR pair turns bearish on the daily timeframe as the pair crosses below the key 100-day Exponential Moving Average (EMA) and the 14-day Relative Strength Index (RSI) remains capped below the 50-midline, suggesting the further downside looks favorable for the time being.
The potential support level for the pair will emerge at the 82.90–83.00 region, portraying the lower limit of a descending trend channel that has been established since mid-April and the psychological mark. A decisive break below this level will see a drop to a low of January 15 at 82.78, followed by a low of March 8 at 82.65.
On the upside, the first upside barrier is located near the 100-day EMA at 83.20. Any follow-through buying above the mentioned level will pave the way to the upper boundary of the descending trend channel at 83.40. Further north, the next hurdle is seen near a high of April 17 at 83.72 en route to the 84.00 psychological mark.
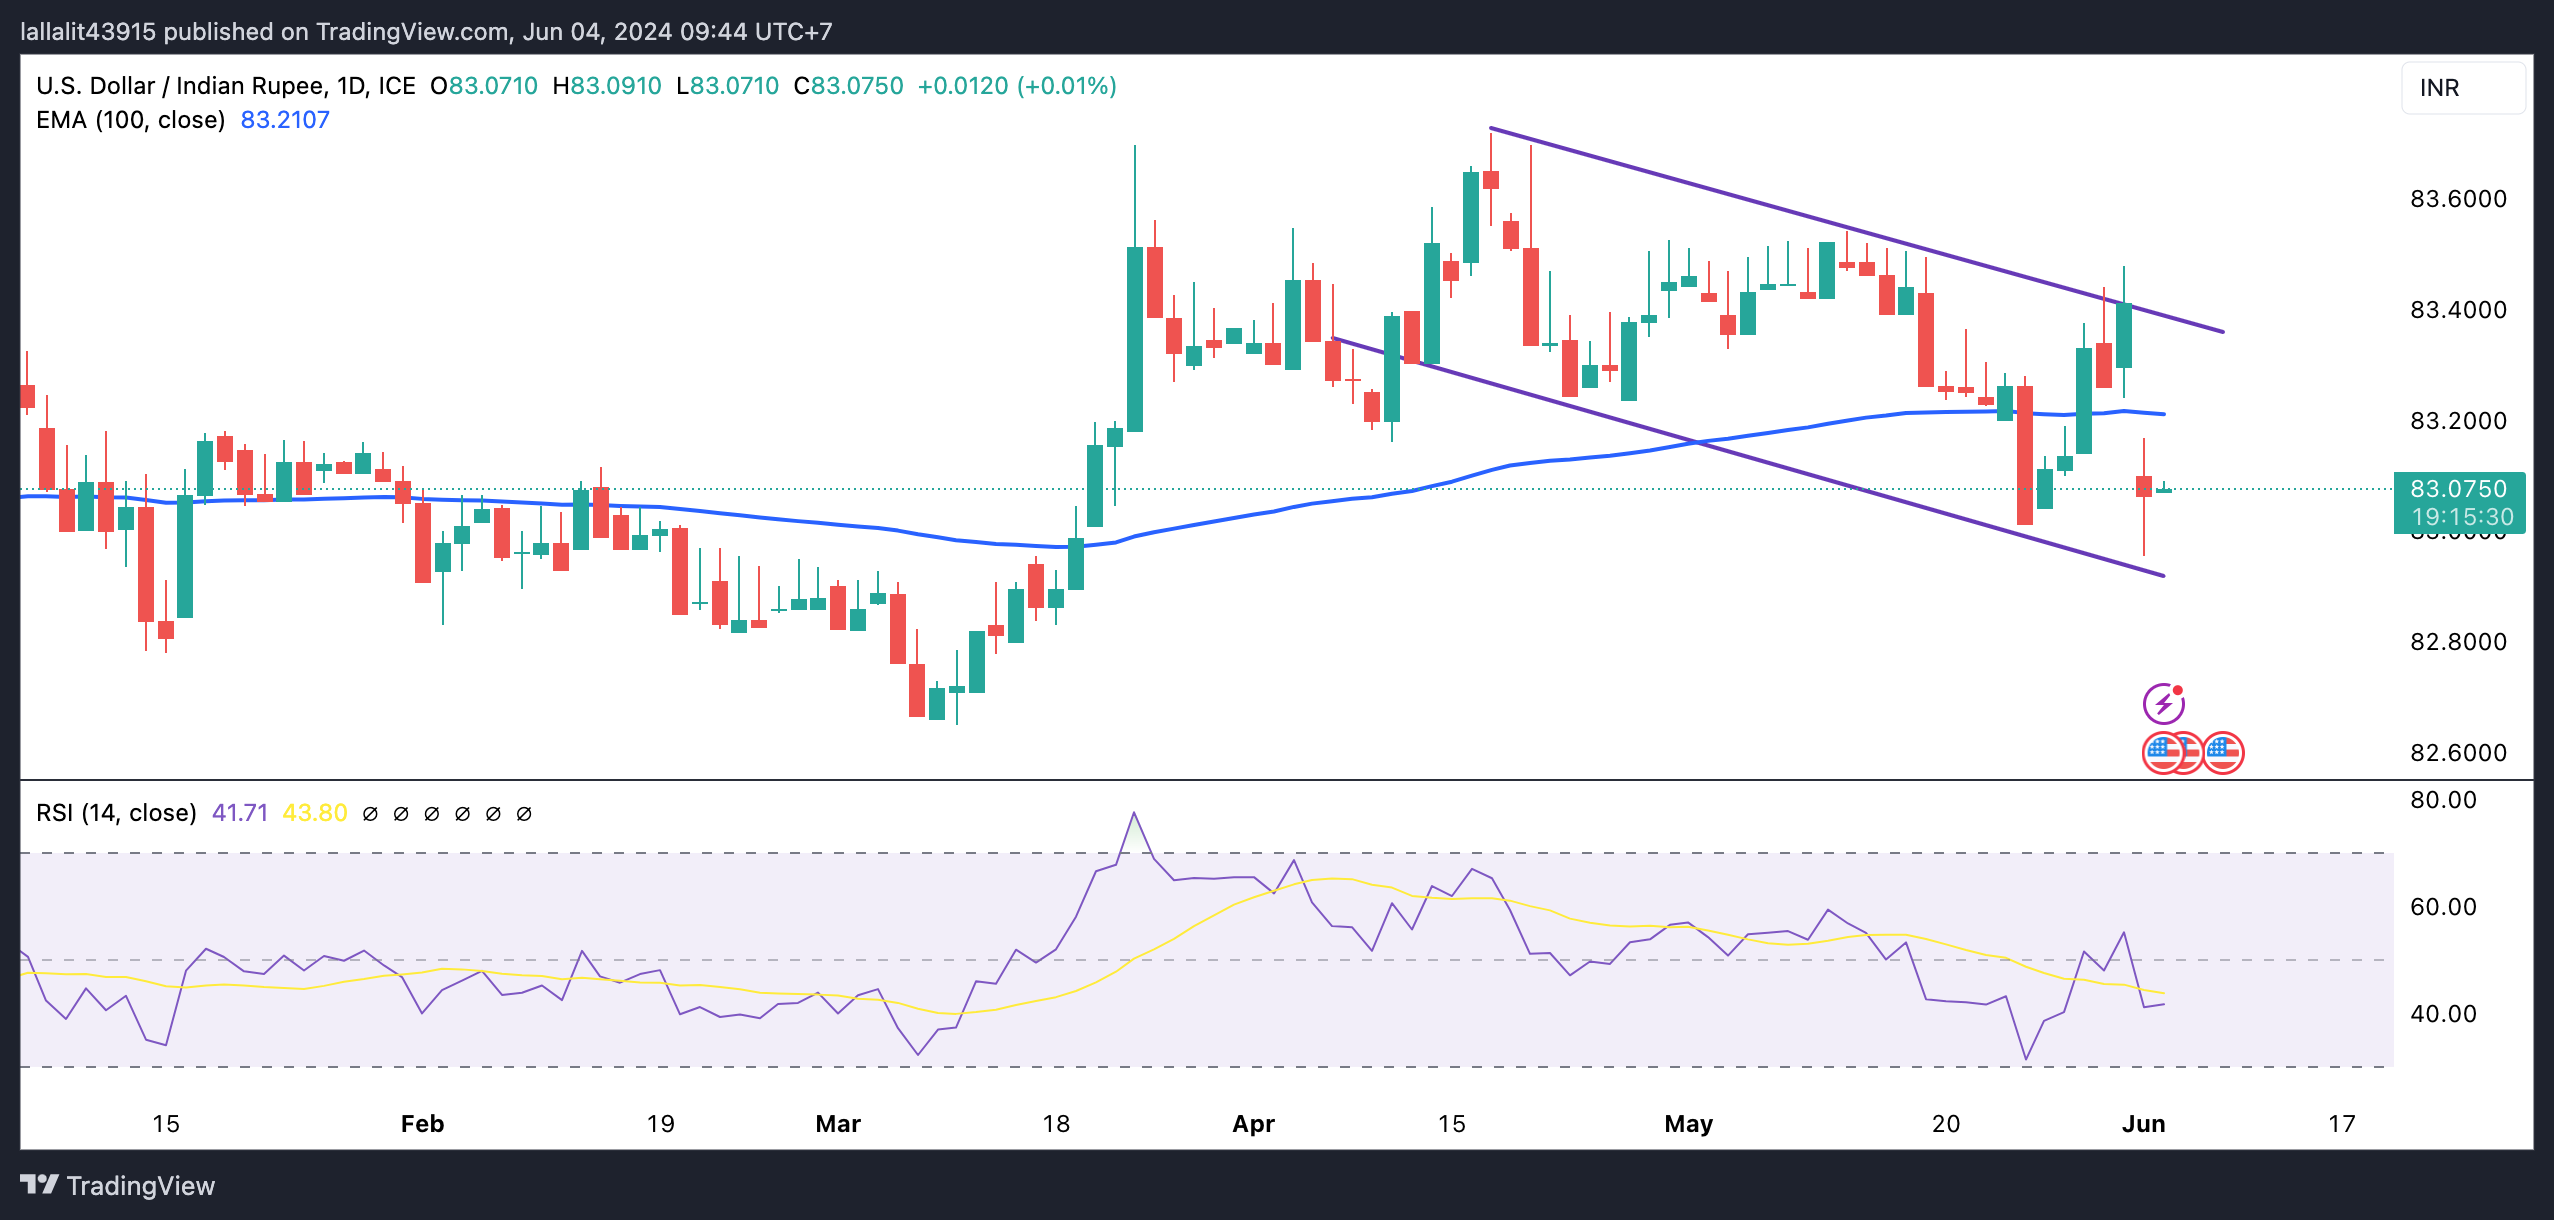
US Dollar price today
The table below shows the percentage change of US Dollar (USD) against listed major currencies today. US Dollar was the weakest against the Euro.
| USD | EUR | GBP | CAD | AUD | JPY | NZD | CHF | |
| USD | -0.01% | 0.01% | 0.05% | 0.11% | 0.18% | 0.11% | 0.08% | |
| EUR | 0.01% | 0.02% | 0.05% | 0.13% | 0.20% | 0.12% | 0.09% | |
| GBP | -0.02% | -0.02% | 0.04% | 0.11% | 0.17% | 0.10% | 0.07% | |
| CAD | -0.05% | -0.06% | -0.03% | 0.08% | 0.13% | 0.06% | 0.03% | |
| AUD | -0.11% | -0.13% | -0.11% | -0.06% | 0.06% | 0.00% | -0.04% | |
| JPY | -0.20% | -0.19% | -0.16% | -0.15% | -0.08% | -0.09% | -0.11% | |
| NZD | -0.11% | -0.12% | -0.10% | -0.06% | 0.01% | 0.08% | -0.03% | |
| CHF | -0.08% | -0.09% | -0.07% | -0.03% | 0.04% | 0.11% | 0.03% |
The heat map shows percentage changes of major currencies against each other. The base currency is picked from the left column, while the quote currency is picked from the top row. For example, if you pick the Euro from the left column and move along the horizontal line to the Japanese Yen, the percentage change displayed in the box will represent EUR (base)/JPY (quote).
Indian Rupee FAQs
The Indian Rupee (INR) is one of the most sensitive currencies to external factors. The price of Crude Oil (the country is highly dependent on imported Oil), the value of the US Dollar – most trade is conducted in USD – and the level of foreign investment, are all influential. Direct intervention by the Reserve Bank of India (RBI) in FX markets to keep the exchange rate stable, as well as the level of interest rates set by the RBI, are further major influencing factors on the Rupee.
The Reserve Bank of India (RBI) actively intervenes in forex markets to maintain a stable exchange rate, to help facilitate trade. In addition, the RBI tries to maintain the inflation rate at its 4% target by adjusting interest rates. Higher interest rates usually strengthen the Rupee. This is due to the role of the ‘carry trade’ in which investors borrow in countries with lower interest rates so as to place their money in countries’ offering relatively higher interest rates and profit from the difference.
Macroeconomic factors that influence the value of the Rupee include inflation, interest rates, the economic growth rate (GDP), the balance of trade, and inflows from foreign investment. A higher growth rate can lead to more overseas investment, pushing up demand for the Rupee. A less negative balance of trade will eventually lead to a stronger Rupee. Higher interest rates, especially real rates (interest rates less inflation) are also positive for the Rupee. A risk-on environment can lead to greater inflows of Foreign Direct and Indirect Investment (FDI and FII), which also benefit the Rupee.
Higher inflation, particularly, if it is comparatively higher than India’s peers, is generally negative for the currency as it reflects devaluation through oversupply. Inflation also increases the cost of exports, leading to more Rupees being sold to purchase foreign imports, which is Rupee-negative. At the same time, higher inflation usually leads to the Reserve Bank of India (RBI) raising interest rates and this can be positive for the Rupee, due to increased demand from international investors. The opposite effect is true of lower inflation.
- The Australian Dollar edges lower possibly due to an unexpected current account deficit of A$ 4.9 billion in Q1.
- Australia's GDP is expected to grow by 0.2% in the first quarter, against the previous 0.2% rise.
- The ISM Manufacturing PMI dropped to 48.7 in May, experiencing its second consecutive month of contraction.
The Australian Dollar (AUD) halted its three-day winning streak on Tuesday, likely due to Australia's unexpected current account deficit of A$ 4.9 billion (USD 3.2 billion) in the first quarter. This shift from a downwardly revised surplus of A$ 2.7 billion in the previous quarter missed market expectations of an A$ 5.9 billion surplus.
In a media release from the Australian Bureau of Statistics (ABS), Grace Kim, ABS head of International Statistics, stated: "The current account deficit reflects a smaller trade surplus, driven by a rise in the imports of goods, while the net primary income deficit increased." Imports of goods rose by 4.5% in Q1, driven by consumption goods, while exports of goods fell by 1.5%, reflecting reduced domestic production of coal and iron ore.
The US Dollar (USD) edges higher as US Treasury yields improve, which can be attributed to a prevailing risk aversion sentiment. However, the Greenback may face challenges as Federal Reserve (Fed) officials indicated last week that the central bank could achieve its 2% annual inflation target without further interest rate hikes.
Investors are likely awaiting Australia's Gross Domestic Product (GDP) data for the first quarter and China's Caixin Services PMI for May, both set to be released on Wednesday. In the US, attention will be paid to the ADP Employment Change and ISM Services PMI reports.
Daily Digest Market Movers: Australian Dollar depreciates due to risk aversion
- The ISM Manufacturing PMI unexpectedly dropped to 48.7 in May, down from April's reading of 49.2 and below the forecast of 49.6. The US manufacturing sector experienced its second consecutive month of contraction, marking the 18th time in the last 19 months.
- Australia’s Judo Bank Manufacturing PMI released on Monday, edging up slightly to 49.7 in May from 49.6 in April, marking the fourth consecutive month of declining conditions in the manufacturing sector.
- On Monday, the Caixin China Manufacturing PMI rose to 51.7 in May from 51.4 in April, marking the seventh consecutive month of expansion in factory activity and surpassing the estimates of 51.5. Friday’s NBS PMI data showed that manufacturing activity fell to 49.5 in May from 50.4 in April, missing the market consensus of an increase to 50.5. Meanwhile, the Non-Manufacturing PMI declined to 51.1 from the previous reading of 51.2, falling short of the estimated 51.5.
- Last week, Atlanta Fed President Raphael Bostic remarked in an interview with Fox Business that he doesn't believe further rate hikes should be required to reach the Fed's 2% annual inflation target. Additionally, New York Fed President John Williams stated that inflation is still too high but should moderate over the second half of 2024. Williams doesn't feel the urgency to act on monetary policy, per Reuters.
- As per a Bloomberg report, RBA Assistant Governor Sarah Hunter said at a conference in Sydney on Thursday that “inflationary pressures" are the key issue. “We’re very mindful of that." Hunter also stated that the RBA Board is concerned about inflation remaining above the target range of 1%-3%, suggesting persistent inflationary pressure. Wages growth appears to be near its peak.
Technical Analysis: Australian Dollar maintains its position above 0.6650
The Australian Dollar trades around 0.6680 on Tuesday. A daily chart analysis suggests a bullish bias for the AUD/USD pair, as it appears to be moving upward from the lower boundary of a rising wedge pattern. Additionally, the 14-day Relative Strength Index (RSI) is positioned above the 50 level, confirming this bullish bias.
The AUD/USD pair could target the psychological level of 0.6700, followed by the four-month high of 0.6714 and the upper limit of the rising wedge around 0.6750.
On the downside, immediate support is observed at the 21-day Exponential Moving Average (EMA) at 0.6632, followed by the lower boundary of the rising wedge and the psychological level of 0.6600. A further decline could exert downward pressure on the AUD/USD pair, potentially leading it toward the throwback support region at 0.6470.
AUD/USD: Daily Chart
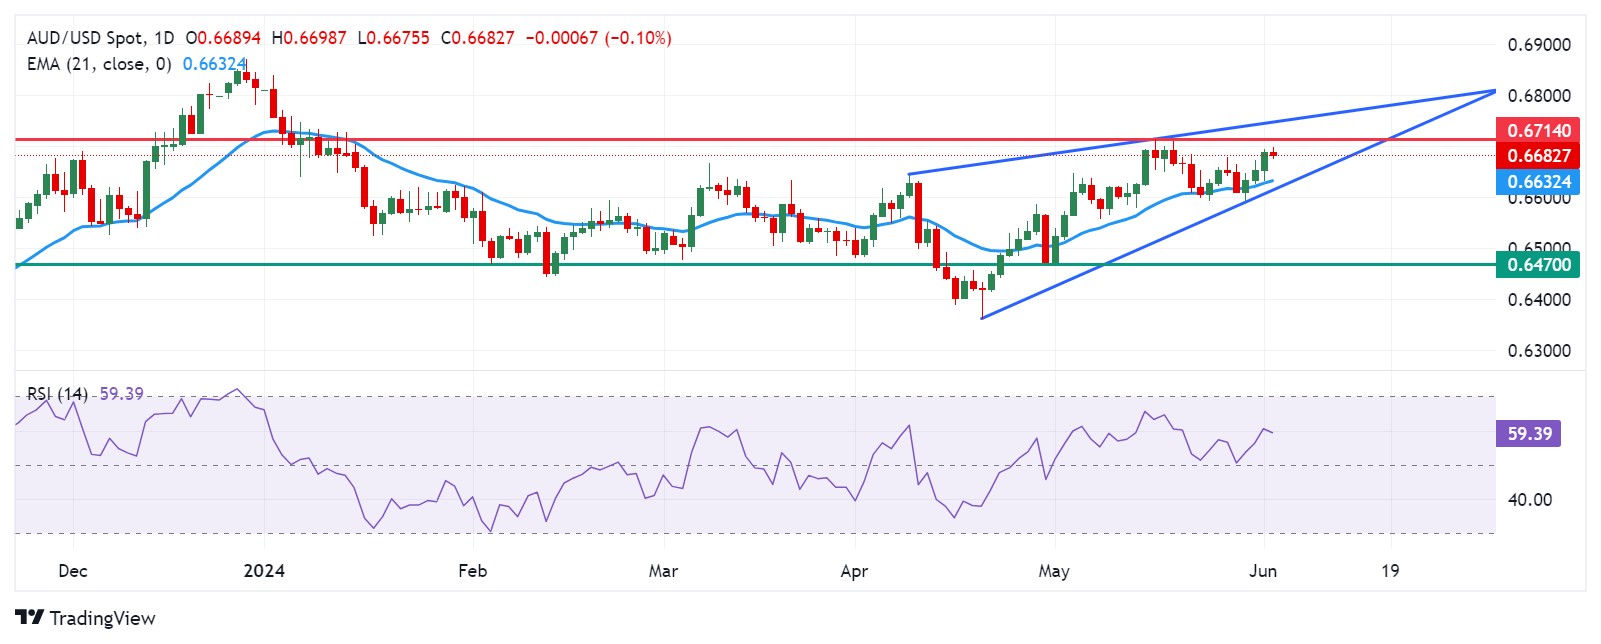
Australian Dollar price today
The table below shows the percentage change of the Australian Dollar (AUD) against listed major currencies today. The Australian Dollar was the weakest against the Euro.
| USD | EUR | GBP | CAD | AUD | JPY | NZD | CHF | |
| USD | 0.00% | 0.01% | 0.05% | 0.11% | 0.19% | 0.10% | 0.09% | |
| EUR | 0.01% | 0.02% | 0.05% | 0.13% | 0.20% | 0.11% | 0.09% | |
| GBP | -0.02% | -0.02% | 0.03% | 0.11% | 0.18% | 0.09% | 0.08% | |
| CAD | -0.05% | -0.06% | -0.04% | 0.07% | 0.14% | 0.05% | 0.04% | |
| AUD | -0.11% | -0.13% | -0.12% | -0.06% | 0.07% | -0.01% | -0.03% | |
| JPY | -0.20% | -0.19% | -0.17% | -0.15% | -0.08% | -0.10% | -0.10% | |
| NZD | -0.10% | -0.11% | -0.09% | -0.06% | 0.03% | 0.09% | -0.02% | |
| CHF | -0.07% | -0.08% | -0.06% | -0.02% | 0.05% | 0.12% | 0.03% |
The heat map shows percentage changes of major currencies against each other. The base currency is picked from the left column, while the quote currency is picked from the top row. For example, if you pick the Euro from the left column and move along the horizontal line to the Japanese Yen, the percentage change displayed in the box will represent EUR (base)/JPY (quote).
Australian Dollar FAQs
One of the most significant factors for the Australian Dollar (AUD) is the level of interest rates set by the Reserve Bank of Australia (RBA). Because Australia is a resource-rich country another key driver is the price of its biggest export, Iron Ore. The health of the Chinese economy, its largest trading partner, is a factor, as well as inflation in Australia, its growth rate and Trade Balance. Market sentiment – whether investors are taking on more risky assets (risk-on) or seeking safe-havens (risk-off) – is also a factor, with risk-on positive for AUD.
The Reserve Bank of Australia (RBA) influences the Australian Dollar (AUD) by setting the level of interest rates that Australian banks can lend to each other. This influences the level of interest rates in the economy as a whole. The main goal of the RBA is to maintain a stable inflation rate of 2-3% by adjusting interest rates up or down. Relatively high interest rates compared to other major central banks support the AUD, and the opposite for relatively low. The RBA can also use quantitative easing and tightening to influence credit conditions, with the former AUD-negative and the latter AUD-positive.
China is Australia’s largest trading partner so the health of the Chinese economy is a major influence on the value of the Australian Dollar (AUD). When the Chinese economy is doing well it purchases more raw materials, goods and services from Australia, lifting demand for the AUD, and pushing up its value. The opposite is the case when the Chinese economy is not growing as fast as expected. Positive or negative surprises in Chinese growth data, therefore, often have a direct impact on the Australian Dollar and its pairs.
Iron Ore is Australia’s largest export, accounting for $118 billion a year according to data from 2021, with China as its primary destination. The price of Iron Ore, therefore, can be a driver of the Australian Dollar. Generally, if the price of Iron Ore rises, AUD also goes up, as aggregate demand for the currency increases. The opposite is the case if the price of Iron Ore falls. Higher Iron Ore prices also tend to result in a greater likelihood of a positive Trade Balance for Australia, which is also positive of the AUD.
The Trade Balance, which is the difference between what a country earns from its exports versus what it pays for its imports, is another factor that can influence the value of the Australian Dollar. If Australia produces highly sought after exports, then its currency will gain in value purely from the surplus demand created from foreign buyers seeking to purchase its exports versus what it spends to purchase imports. Therefore, a positive net Trade Balance strengthens the AUD, with the opposite effect if the Trade Balance is negative.
- EUR/USD advances to its highest level since March in the wake of a modest USD downtick.
- Monday’s disappointing US ISM PMI reaffirms Fed rate cut bets and undermines the buck.
- Bulls, however, prefer to wait for the ECB meeting on Thursday before placing fresh bets.
The EUR/USD pair attracts some buyers for the fourth straight day and climbs beyond the 1.0900 mark – its highest level since March 21 during the Asian session on Tuesday. The uptick, however, lacks strong follow-through, warranting some caution for bulls and before positioning for an extension of the recent solid rebound from the 1.0600 round figure, or the YTD low touched in April.
The US Dollar (USD) slides to a nearly two-month low in the wake of growing acceptance that the Federal Reserve (Fed) is on track to start cutting interest rates later this year and turns out to be a key factor acting as a tailwind for the EUR/USD pair. The US ISM PMI released on Monday pointed to a slowdown in manufacturing activity and the economy, lifting bets for an imminent Fed rate cut in September. This drag yields on the rate-sensitive two-year US government bond and the benchmark 10-year note to their lowest level since May 21, which, in turn, keeps the USD bulls on the defensive.
Traders, however, seem reluctant to place aggressive bullish bets around the EUR/USD pair and prefer to wait on the sidelines ahead of the crucial European Central Bank (ECB) meeting on Thursday. Investors will closely scrutinize comments from ECB officials and the latest economic projections for cues about future rate cuts against the backdrop of a rise in Eurozone inflation in May. This, in turn, will play a key role in driving the shared currency and provide a fresh directional impetus to the currency pair ahead of the release of the US Nonfarm Payrolls (NFP) report on Friday.
Nevertheless, the aforementioned fundamental backdrop suggests that the path of least resistance for the EUR/USD pair is to the upside and any meaningful dip could be seen as a buying opportunity. Even from a technical perspective, acceptance above the 1.0900 mark could be seen as a fresh trigger for bulls and validate the near-term positive outlook for spot prices. Traders now look to Tuesday's release of German employment figures and the US macro data – JOLTS Job Openings and Factory Orders – for short-term opportunities.
“If underlying inflation moves as we project, we will adjust the degree of monetary support,” Bank of Japan (BoJ) Governor Kazuo Ueda said on Tuesday.
Additional quotes
If our economic, price projections and assessment of risks change, that will also be reason to change interest rate levels.
Our policy goal is price stability, so won't guide policy to fund fiscal spending.
Our basic stance is to allow markets to set long-term interest rates.
We have maintained current pace of bond buying to avoid big discontiniuity in bond buying operations.
We are ready to conduct nimble market operations if there are sharp rises in long-term rates.
Not thinking about introducing central bank digital currency.
Market reaction
USD/JPY is retreating slightly from 156.50 on these above comments, currently trading at 156.36, up 0.18% on the day.
| Raw materials | Closed | Change, % |
|---|---|---|
| Silver | 30.719 | 0.86 |
| Gold | 2350.82 | 0.95 |
| Palladium | 925.32 | 1.81 |
- Gold price fails to attract any follow-through buying despite a combination of supporting factors.
- Fed rate cut bets drag the USD to a nearly two-month low, but does little to lure XAU/USD bulls.
- Traders now look forward to this week’s important US macro data and key central bank event risks.
Gold price (XAU/USD) struggles to capitalize on the previous day's goodish bounce from the $2,315-$2,314 area, or over a three-week low and oscillates in a narrow trading band during the Asian session on Tuesday. The bias, meanwhile, seems tilted in favor of bullish traders amid firming expectations that the Federal Reserve (Fed) will cut interest rates later this year. The bets were reaffirmed by the US macro data released on Monday, which pointed to a slowdown in manufacturing activity and the economy. This, in turn, drags the US Dollar (USD) to a near two-month low and should continue to act as a tailwind for the non-yielding yellow metal.
Apart from this, persistent geopolitical risks validate the near-term positive outlook for the Gold price and support prospects for further appreciation. Hence, any meaningful dip might be seen as a buying opportunity and is more likely to remain limited. Traders might also prefer to wait on the sidelines ahead of other important US macro releases this week, including the Nonfarm Payrolls (NFP) report on Friday. Apart from this, key central bank event risks – the Bank of Canada (BoC) decision on Wednesday and the European Central Bank (ECB) meeting on Thursday – could provide some impetus to the XAU/USD and help determine the near-term trajectory.
Daily Digest Market Movers: Gold price might continue to draw support from Fed rate cut bets
- Signs of easing inflationary pressures and slowing economic growth lifted bets for an imminent rate cut by the Federal Reserve this year, which should continue to drive flows towards the non-yielding Gold price.
- The US Bureau of Economic Analysis (BEA) reported on Friday that the Personal Consumption Expenditures (PCE) Price Index held steady at 2.7% and the core gauge rose 2.8% on a yearly basis, matching expectations.
- Data published on Monday showed that the US Institute for Supply Management's (ISM) Manufacturing PMI fell to 48.7 in May from the 49.2 previous, led by a slump in new goods orders by the most in nearly two years.
- This, in turn, triggered a fresh leg down in the US Treasury bond yields, dragging yields on the rate-sensitive two-year US government bond and the benchmark 10-year note to their lowest level since May 21.
- The US Dollar slides to its lowest level since April 10, which, along with geopolitical tensions in the Middle East, could offer additional support to the safe-haven XAU/USD and support prospects for some upside.
- Traders now look forward to the US economic docket, featuring the release of JOLTS Job Openings and Factory Orders data for short-term opportunities later during the early North American session this Tuesday.
- The attention will then turn to the US ADP report on private-sector employment scheduled on Wednesday, which will be followed by the official jobs data, popularly known as the Nonfarm Payrolls (NFP) report on Friday
- Apart from this, investors this week will take cues from key central bank event risks – the Bank of Canada (BoC) decision on Wednesday and the highly-anticipated European Central Bank (ECB) meeting on Thursday.
Technical Analysis: Gold price could attract dip-buyers near 50-day SMA, around $2,334 region
From a technical perspective, the $2,360 region (Friday's swing high) is likely to act as an immediate hurdle ahead of the $2,364 level. Some follow-through buying beyond the latter will be seen as a fresh trigger for bullish traders and lift the Gold price towards the $2,385 intermediate hurdle en route to the $2,400 mark. The momentum could extend to the $2,425 zone en route to the $2,450 region or the all-time peak touched in May.
On the flip side, the 50-day Simple Moving Average (SMA), currently pegged near the $2,334 area, should act as immediate support ahead of the $2,325 horizontal zone and the overnight swing low, around the $2,315-2,314 region. Given that oscillators on the daily chart have just started gaining negative traction, a convincing break below should pave the way for deeper losses. The Gold price might then weaken further below the $2,300 mark and decline further towards testing the next relevant support near the $2,285-$2,284 region.
Gold FAQs
Gold has played a key role in human’s history as it has been widely used as a store of value and medium of exchange. Currently, apart from its shine and usage for jewelry, the precious metal is widely seen as a safe-haven asset, meaning that it is considered a good investment during turbulent times. Gold is also widely seen as a hedge against inflation and against depreciating currencies as it doesn’t rely on any specific issuer or government.
Central banks are the biggest Gold holders. In their aim to support their currencies in turbulent times, central banks tend to diversify their reserves and buy Gold to improve the perceived strength of the economy and the currency. High Gold reserves can be a source of trust for a country’s solvency. Central banks added 1,136 tonnes of Gold worth around $70 billion to their reserves in 2022, according to data from the World Gold Council. This is the highest yearly purchase since records began. Central banks from emerging economies such as China, India and Turkey are quickly increasing their Gold reserves.
Gold has an inverse correlation with the US Dollar and US Treasuries, which are both major reserve and safe-haven assets. When the Dollar depreciates, Gold tends to rise, enabling investors and central banks to diversify their assets in turbulent times. Gold is also inversely correlated with risk assets. A rally in the stock market tends to weaken Gold price, while sell-offs in riskier markets tend to favor the precious metal.
The price can move due to a wide range of factors. Geopolitical instability or fears of a deep recession can quickly make Gold price escalate due to its safe-haven status. As a yield-less asset, Gold tends to rise with lower interest rates, while higher cost of money usually weighs down on the yellow metal. Still, most moves depend on how the US Dollar (USD) behaves as the asset is priced in dollars (XAU/USD). A strong Dollar tends to keep the price of Gold controlled, whereas a weaker Dollar is likely to push Gold prices up.
Citing a draft of this year's long-term roadmap signed by the Japanese Government, Reuters reported on Tuesday the authorities will warn that "vigilance is required to the impact a weak Yen could have on households' purchasing power through rising import prices."
Additional takeaways
"Japan's economy continues to recover moderately, though some sectors, notably consumption, are stalling.”
"At present, the pace of wage rises hasn't caught up with that of inflation.”
The roadmap draft document is expected to be finalized around June 21.
Market reaction
Following the above report, USD/JPY has stalled its rebound at 156.50, still up 0.22% on the day.
Japanese Yen FAQs
The Japanese Yen (JPY) is one of the world’s most traded currencies. Its value is broadly determined by the performance of the Japanese economy, but more specifically by the Bank of Japan’s policy, the differential between Japanese and US bond yields, or risk sentiment among traders, among other factors.
One of the Bank of Japan’s mandates is currency control, so its moves are key for the Yen. The BoJ has directly intervened in currency markets sometimes, generally to lower the value of the Yen, although it refrains from doing it often due to political concerns of its main trading partners. The current BoJ ultra-loose monetary policy, based on massive stimulus to the economy, has caused the Yen to depreciate against its main currency peers. This process has exacerbated more recently due to an increasing policy divergence between the Bank of Japan and other main central banks, which have opted to increase interest rates sharply to fight decades-high levels of inflation.
The BoJ’s stance of sticking to ultra-loose monetary policy has led to a widening policy divergence with other central banks, particularly with the US Federal Reserve. This supports a widening of the differential between the 10-year US and Japanese bonds, which favors the US Dollar against the Japanese Yen.
The Japanese Yen is often seen as a safe-haven investment. This means that in times of market stress, investors are more likely to put their money in the Japanese currency due to its supposed reliability and stability. Turbulent times are likely to strengthen the Yen’s value against other currencies seen as more risky to invest in.
- WTI price lost ground as OPEC+ intends to phase out production cuts of 2.2 million barrels per day over 2025.
- The US is purchasing an additional 3 million barrels of Oil for the country's Strategic Petroleum Reserve.
- Oil prices may struggle further due to the expectations of the Fed maintaining higher rates for longer.
West Texas Intermediate (WTI) Oil price continues to decline for the fifth consecutive day, trading around $73.90 per barrel during the Asian session on Tuesday. This drop in crude Oil prices is attributed to the Organization of the Petroleum Exporting Countries and allies led by Russia, known as OPEC+, announcing a gradual plan to ease some of their Oil production cuts.
OPEC+ plans to phase out voluntary production cuts of 2.2 million barrels per day (bpd) over the next year, starting in October. By December, over 500,000 bpd are expected to re-enter the market, with a total of 1.8 million bpd returning by June 2025.
According to a Reuters report, the United States is purchasing an additional 3 million barrels of Oil for the country's Strategic Petroleum Reserve (SPR), as announced by the Department of Energy on Monday. This move is part of a gradual replenishment effort following the largest sale ever in 2022. US President Joe Biden had ordered the sale of 180 million barrels over six months in 2022 to control fuel prices after Russia's invasion of Ukraine.
The latest US Personal Consumption Expenditure (PCE) data indicated that price pressures eased in April. Despite this, the report did not prompt a rate cut from the Federal Reserve (Fed), suggesting that the central bank may need more time to achieve its inflation goals. The higher interest rates are negatively impacting the US economic outlook and dampening the demand for Oil.
The People’s Bank of China (PBoC) set the USD/CNY central rate for the trading session ahead on Tuesday at 7.1083, as against the previous day's fix of 7.1086 and 7.2297 Reuters estimates.
Japanese Finance Minister Shunichi Suzuki said on Tuesday that foreign exchange (FX) intervention had effects to some effects, adding that the central bank will continue to respond appropriately when asked about forex.
Key quotes
Forex intervention had certain effects
Forex intervention was intended to respond to speculative moves
Says will continue to respond appropriately when asked about Forex
Concerned that automakers' certification irregularities could have large implications
Market reaction
At the time of writing, USD/JPY is trading 0.19% higher on the day to trade at 156.38.
Japanese Yen FAQs
The Japanese Yen (JPY) is one of the world’s most traded currencies. Its value is broadly determined by the performance of the Japanese economy, but more specifically by the Bank of Japan’s policy, the differential between Japanese and US bond yields, or risk sentiment among traders, among other factors.
One of the Bank of Japan’s mandates is currency control, so its moves are key for the Yen. The BoJ has directly intervened in currency markets sometimes, generally to lower the value of the Yen, although it refrains from doing it often due to political concerns of its main trading partners. The current BoJ ultra-loose monetary policy, based on massive stimulus to the economy, has caused the Yen to depreciate against its main currency peers. This process has exacerbated more recently due to an increasing policy divergence between the Bank of Japan and other main central banks, which have opted to increase interest rates sharply to fight decades-high levels of inflation.
The BoJ’s stance of sticking to ultra-loose monetary policy has led to a widening policy divergence with other central banks, particularly with the US Federal Reserve. This supports a widening of the differential between the 10-year US and Japanese bonds, which favors the US Dollar against the Japanese Yen.
The Japanese Yen is often seen as a safe-haven investment. This means that in times of market stress, investors are more likely to put their money in the Japanese currency due to its supposed reliability and stability. Turbulent times are likely to strengthen the Yen’s value against other currencies seen as more risky to invest in.
- USD/CAD trades with mild losses near 1.3620 on Tuesday.
- The US business activity in the manufacturing sector contracted for the second consecutive month in May.
- Markets expect the BoC to cut its key lending rate by a quarter of a percentage point on Wednesday.
The USD/CAD pair remains on the defensive around 1.3620 during the early Asian session on Tuesday. The downtick of the pair is backed by the softer US Dollar (USD) to the 104.00 support level on Monday. Investors will shift their focus to the US Services PMI on Wednesday ahead of the highly-anticipated Nonfarm Payrolls (NFP).
The Institute for Supply Management (ISM) revealed on Monday that business activity in the manufacturing sector contracted for the second consecutive month in May. The US Manufacturing PMI declined to 48.7 in May from the previous reading of 49.2, below forecasts of 49.6. The weaker-than-expected reading exerted some selling pressure on the US Dollar (USD) and prompted speculation on Fed rate cuts this year.
On Friday, the US Nonfarm Payrolls (NFP) will take centre stage, which is estimated to see 190,000 job additions in May. In case of stronger-than-expected data, this could boost the USD.
The Bank of Canada (BoC) is expected to cut its overnight rate by 25 basis points (bps) to 4.75% on Wednesday as inflation in Canada cooled down in April. CIBC Capital Markets economists anticipate the BoC could cut its interest rate up to three times before the Fed begins easing policy. The divergence of policy rate between the BoC and Fed might drag the Canadian Dollar (CAD) lower and create a tailwind for USD/CAD. The BoC governor Tiff Macklem said that a rate cut is possible, but that the decision would be driven by economic data.
| Index | Change, points | Closed | Change, % |
|---|---|---|---|
| NIKKEI 225 | 435.13 | 38923.03 | 1.13 |
| Hang Seng | 323.43 | 18403.04 | 1.79 |
| KOSPI | 46 | 2682.52 | 1.74 |
| ASX 200 | 59.3 | 7761 | 0.77 |
| DAX | 110.22 | 18608.16 | 0.6 |
| CAC 40 | 5.15 | 7998.02 | 0.06 |
| Dow Jones | -115.29 | 38571.03 | -0.3 |
| S&P 500 | 5.89 | 5283.4 | 0.11 |
| NASDAQ Composite | 93.65 | 16828.67 | 0.56 |
| Pare | Closed | Change, % |
|---|---|---|
| AUDUSD | 0.66871 | 0.54 |
| EURJPY | 170.205 | -0.23 |
| EURUSD | 1.09031 | 0.5 |
| GBPJPY | 199.861 | -0.22 |
| GBPUSD | 1.28005 | 0.5 |
| NZDUSD | 0.61903 | 0.79 |
| USDCAD | 1.36275 | -0.03 |
| USDCHF | 0.89561 | -0.76 |
| USDJPY | 156.095 | -0.73 |


© 2000-2026. Sva prava zaštićena.
Sajt je vlasništvo kompanije Teletrade D.J. LLC 2351 LLC 2022 (Euro House, Richmond Hill Road, Kingstown, VC0100, St. Vincent and the Grenadines).
Svi podaci koji se nalaze na sajtu ne predstavljaju osnovu za donošenje investicionih odluka, već su informativnog karaktera.
The company does not serve or provide services to customers who are residents of the US, Canada, Iran, The Democratic People's Republic of Korea, Yemen and FATF blacklisted countries.
Izvršenje trgovinskih operacija sa finansijskim instrumentima upotrebom marginalne trgovine pruža velike mogućnosti i omogućava investitorima ostvarivanje visokih prihoda. Međutim, takav vid trgovine povezan je sa potencijalno visokim nivoom rizika od gubitka sredstava. Проведение торговых операций на финанcовых рынках c маржинальными финанcовыми инcтрументами открывает широкие возможноcти, и позволяет инвеcторам, готовым пойти на риcк, получать выcокую прибыль, но при этом неcет в cебе потенциально выcокий уровень риcка получения убытков. Iz tog razloga je pre započinjanja trgovine potrebno odlučiti o izboru odgovarajuće investicione strategije, uzimajući u obzir raspoložive resurse.
Upotreba informacija: U slučaju potpunog ili delimičnog preuzimanja i daljeg korišćenja materijala koji se nalazi na sajtu, potrebno je navesti link odgovarajuće stranice na sajtu kompanije TeleTrade-a kao izvora informacija. Upotreba materijala na internetu mora biti praćena hiper linkom do web stranice teletrade.org. Automatski uvoz materijala i informacija sa stranice je zabranjen.
Ako imate bilo kakvih pitanja, obratite nam se pr@teletrade.global.
транcфери