- Analiza
- Novosti i instrumenti
- Vesti sa tržišta
Forex-novosti i prognoze od 04-05-2021
| Time | Country | Event | Period | Previous value | Forecast |
|---|---|---|---|---|---|
| 01:30 (GMT) | Australia | Building Permits, m/m | March | 21.6% | 3% |
| 06:30 (GMT) | Switzerland | Consumer Price Index (MoM) | April | 0.3% | 0.2% |
| 06:30 (GMT) | Switzerland | Consumer Price Index (YoY) | April | -0.2% | 0.3% |
| 07:50 (GMT) | France | Services PMI | April | 48.2 | 50.4 |
| 07:55 (GMT) | Germany | Services PMI | April | 51.5 | 50.1 |
| 08:00 (GMT) | Eurozone | Services PMI | April | 49.6 | 50.3 |
| 09:00 (GMT) | Eurozone | Producer Price Index, MoM | March | 0.5% | 1.1% |
| 09:00 (GMT) | Eurozone | Producer Price Index (YoY) | March | 1.5% | 4.2% |
| 12:15 (GMT) | U.S. | ADP Employment Report | April | 517 | 750 |
| 13:45 (GMT) | U.S. | Services PMI | April | 60.4 | 63.1 |
| 14:00 (GMT) | U.S. | ISM Non-Manufacturing | April | 63.7 | 64.3 |
| 14:30 (GMT) | U.S. | Crude Oil Inventories | April | 0.09 | -2.191 |
| 22:30 (GMT) | Canada | BOC Gov Tiff Macklem Speaks | |||
| 22:45 (GMT) | New Zealand | Building Permits, m/m | March | -18.2% | |
| 23:50 (GMT) | Japan | Monetary Policy Meeting Minutes |
FXStreet notes that Brent has hovered between $60 and $70 per barrel in recent weeks. Strategists at Capital Economics forecast a peak in prices in Q3, before they start to fall in Q4 and into 2022.
“We still expect a release of ‘pent-up’ demand for oil later this year as the rollout of vaccines paves the way for travel and leisure activities to resume. At the same time, oil supply is likely to remain somewhat constrained in the near term.”
“Our current forecast is that the price of Brent (WTI) will peak at around $75 ($72) per barrel in Q3 this year.”
“We expect oil prices to fall back in Q4 and into next year. Our end-year forecasts for Brent (WTI) are $70 ($67) per barrel for 2021, $60 ($57) for 2022 and $55 ($52) for 2023.”
FXStreet notes that the RBA's hawkish pivot was unable to provide the currency with a sustained lift. Together with a deteriorating technical backdrop and an inability to benefit from cross-asset support, economists at TD Securities think momentum is now shifting more clearly to the downside in the near term.
“The Reserve Bank of Australia kept all of its policy settings unchanged at its May meeting, as widely expected. That said, the RBA still managed to surprise us. Policymakers upgraded all key forecasts more than we anticipated and stated the decision on the Yield Curve Control (YCC) Target bond and QE will be made at the policy meeting scheduled for 6 July. We were looking for this to come in August."
“We think it is notable that AUD/USD is underperforming most of its G10 and EM counterparts despite the upside surprise from the RBA overnight. We think this weakness could suggest that market sentiment is turning more bearish toward the pair.”
“We note that the daily MACD is also very close to a downside crossover event. The pullback has taken the pair lower to test the 100-DMA (0.7707), which also corresponds closely with a cluster of other attractors around the 0.77 mark. We think a daily close below that pivot will draw out additional selling pressure in the days ahead.”
The
U.S. Commerce Department reported on Tuesday that the value of new factory
orders rose 1.1 percent m-o-m in March, following a revised 0.5 percent m-o-m drop
in February (originally an 0.8 percent m-o-m fall).
Economists had forecast a 1.3 percent m-o-m increase.
According to the report, gains occurred in orders for fabricated metal products (+4.0 percent m-o-m), primary metals (+1.6 percent m-o-m), machinery (+1.5 percent m-o-m) and computers and electronic products (+0.5 percent m-o-m). However, these advances were partially offset by a decline in orders for transport equipment (-1.6 percent m-o-m).
Meanwhile,
total factory orders excluding transportation, a volatile part of the overall
reading, increased 1.7 percent m-o-m in March (compared to a revised 0.2
percent m-o-m fall in February), while orders for nondefense capital goods
excluding aircraft, a measure of business spending plans, went up 1.2 percent
m-o-m instead of advancing 0.9 percent m-o-m as reported
last month. The report also showed that shipments of core capital goods jumped
1.6 percent m-o-m in March, rather than gaining 1.3 percent m-o-m as previously
reported.
Statistics
Canada announced on Tuesday that the value of building permits issued by the
Canadian municipalities climbed 5.7 percent m-o-m in March, following a revised
3.1 percent m-o-m gain in February (originally an advance of 2.1 percent
m-o-m). The March reading pointed to the third straight month of record-setting
increases.
Economists
had forecast a 2.0 percent increase in March from the previous month.
According
to the report, the value of residential permits surged 15.9 percent m-o-m in March,
as single-family permits increased 7.6 percent m-o-m and permits for
multi-family dwellings jumped 24.5 percent m-o-m.
At
the same time, the value of non-residential building permits plunged 15.6
percent m-o-m in March, due to declines in institutional (-33.5 percent m-o-m)
and commercial permits (-14.6 percent m-o-m), which, however, were partially offset
by an increase in industrial permits (+16.4 percent m-o-m).
In
y-o-y terms, building permits climbed 44.9 percent in March.
U.S. stock-index futures fell on Tuesday, as tech stocks remained under pressure amid ongoing rotation into value stocks.
Global Stocks:
Index/commodity | Last | Today's Change, points | Today's Change, % |
Nikkei | - | - | - |
Hang Seng | 28,557.14 | +199.60 | +0.70% |
Shanghai | - | - | - |
S&P/ASX | 7,067.90 | +39.10 | +0.56% |
FTSE | 6,973.90 | +4.09 | +0.06% |
CAC | 6,282.13 | -25.77 | -0.41% |
DAX | 14,999.79 | -236.68 | -1.55% |
Crude oil | $65.29 | +1.24% | |
Gold | $1,787.30 | -0.25% |
(company / ticker / price / change ($/%) / volume)
ALCOA INC. | AA | 37.87 | 0.26(0.69%) | 44620 |
ALTRIA GROUP INC. | MO | 48.3 | -0.07(-0.14%) | 6107 |
Amazon.com Inc., NASDAQ | AMZN | 3,352.00 | -34.49(-1.02%) | 86932 |
Apple Inc. | AAPL | 131.19 | -1.35(-1.02%) | 2967002 |
AT&T Inc | T | 31.59 | 0.09(0.29%) | 60838 |
Boeing Co | BA | 235.38 | 0.19(0.08%) | 68187 |
Caterpillar Inc | CAT | 226.75 | -1.42(-0.62%) | 3953 |
Chevron Corp | CVX | 106 | 0.47(0.45%) | 20581 |
Cisco Systems Inc | CSCO | 51.07 | -0.10(-0.20%) | 31208 |
Citigroup Inc., NYSE | C | 71.25 | -0.46(-0.64%) | 76918 |
Deere & Company, NYSE | DE | 371.5 | -2.27(-0.61%) | 2004 |
E. I. du Pont de Nemours and Co | DD | 78.62 | 0.34(0.43%) | 6136 |
Exxon Mobil Corp | XOM | 59.19 | 0.37(0.63%) | 205545 |
Facebook, Inc. | FB | 319.68 | -2.90(-0.90%) | 133564 |
FedEx Corporation, NYSE | FDX | 301.51 | -3.04(-1.00%) | 8091 |
Ford Motor Co. | F | 11.54 | -0.09(-0.77%) | 293550 |
Freeport-McMoRan Copper & Gold Inc., NYSE | FCX | 38.6 | -0.11(-0.28%) | 147158 |
General Electric Co | GE | 13.37 | -0.08(-0.59%) | 416351 |
General Motors Company, NYSE | GM | 56.8 | -0.35(-0.61%) | 427473 |
Goldman Sachs | GS | 348 | -2.16(-0.62%) | 6271 |
Google Inc. | GOOG | 2,370.00 | -25.17(-1.05%) | 12690 |
Hewlett-Packard Co. | HPQ | 34.24 | -0.24(-0.70%) | 2540 |
Home Depot Inc | HD | 329.99 | -0.28(-0.08%) | 9887 |
HONEYWELL INTERNATIONAL INC. | HON | 223 | -0.20(-0.09%) | 1257 |
Intel Corp | INTC | 57.11 | -0.15(-0.26%) | 886817 |
International Business Machines Co... | IBM | 144.19 | -0.56(-0.39%) | 336071 |
International Paper Company | IP | 58.86 | -0.08(-0.14%) | 263 |
Johnson & Johnson | JNJ | 164.5 | -0.71(-0.43%) | 3412 |
JPMorgan Chase and Co | JPM | 152.36 | -1.00(-0.65%) | 20317 |
McDonald's Corp | MCD | 235.01 | -0.55(-0.23%) | 2538 |
Merck & Co Inc | MRK | 75.84 | -0.14(-0.18%) | 17468 |
Microsoft Corp | MSFT | 250.05 | -1.81(-0.72%) | 628675 |
Nike | NKE | 132.15 | -0.88(-0.66%) | 12291 |
Pfizer Inc | PFE | 40.13 | 0.30(0.75%) | 2304286 |
Procter & Gamble Co | PG | 134.65 | -0.35(-0.26%) | 1954 |
Starbucks Corporation, NASDAQ | SBUX | 115.19 | -0.53(-0.46%) | 210357 |
Tesla Motors, Inc., NASDAQ | TSLA | 675.02 | -9.88(-1.44%) | 435169 |
The Coca-Cola Co | KO | 54.4 | -0.08(-0.15%) | 17612 |
Twitter, Inc., NYSE | TWTR | 54.64 | 0.06(0.11%) | 357574 |
UnitedHealth Group Inc | UNH | 400 | -5.90(-1.45%) | 3358 |
Verizon Communications Inc | VZ | 58 | 0.08(0.14%) | 26216 |
Visa | V | 231.5 | -1.11(-0.48%) | 5207 |
Wal-Mart Stores Inc | WMT | 141.99 | -0.13(-0.09%) | 12406 |
Walt Disney Co | DIS | 184.22 | -1.29(-0.70%) | 40387 |
Yandex N.V., NASDAQ | YNDX | 64.36 | -0.15(-0.23%) | 37827 |
Statistics
Canada announced on Tuesday that Canada recorded a trade deficit of CAD1.14
billion in March, compared with a revised CAD1.42-billion surplus in February
(originally a CAD1.04-billion surplus). This was the first trade shortfall
following two consecutive monthly trade surpluses.
Economists
had forecast a surplus of CAD0.70 billion.
According
to the report, Canada’s exports rose 0.3 percent m-o-m to CAD50.62 billion in March, as higher exports of motor
vehicles and parts (+10.2 percent m-o-m) and metal ores and non-metallic
minerals (+33.0 percent m-o-m) were partly offset by declines in exports of
energy products (-6.7 percent m-o-m) and aircraft and other transportation
equipment and parts (-23.8 percent m-o-m). Meanwhile, imports surged 5.5
percent m-o-m to CAD51.76 billion in March (the highest level since May 2019), as
all 11 product sections posted monthly gains, led by imports of energy products
(+54.7 percent m-o-m).
McDonald's (MCD) target raised to $260 from $250 at Telsey Advisory Group
Bank of America (BAC) downgraded to Neutral from Outperform at Robert W. Baird; target $42
Boeing (BA) upgraded to Mkt Perform from Underperform at Bernstein; target raised to $229
The
U.S. Commerce Department reported on Tuesday that U.S. the goods and services
trade deficit widened to $74.4 billion in March from a revised $70.5 billion in
the previous month (originally a gap of $71.1 billion). This was the biggest
trade deficit on record.
Economists
had expected a deficit of $74.5 billion.
According
to the report, the March increase in the goods and services reflected an
advance in the goods deficit of $3.6 billion to $91.6 billion and a decline in
the services surplus of $0.3 billion to $17.1 billion.
In March,
exports of goods and services from the U.S. climbed 6.6 percent m-o-m to $200.0
billion, while imports jumped 6.3 percent m-o-m to $274.5 billion, as the
global COVID-19 pandemic and the economic recovery continued to impact the
international trade.
Year-to-date,
the goods and services deficit surged 64.2 percent from the same period in
2020. Exports fell 3.5 percent, while imports surged 8.5 percent.
FXStreet notes that S&P 500 closed the week back below 4200 on Friday. With another neutral session on Monday, economists at Credit Suisse believe the market remains in a consolidation phase, which it is expected to persist going forwards.
“The S&P 500 reversed to close back below our Q2 objective of 4200 on Friday. With a range of ‘red flags’ and overextension signals still in place, including OnBalanceVolume still not confirming the new highs and a growing bearish momentum divergence, we still do not look to chase strength beyond here for now.”
“We look for a continuation of the recent consolidative range and further sideways ranging. Support remains at 4176/75 initially, which now includes the 13-day exponential average. A close below here would suggest a deeper corrective setback and a lengthier sideways phase, with support seen next at 4124.”
“Only below the 4118 recent low though would mark a near-term top.”
| Time | Country | Event | Period | Previous value | Forecast | Actual |
|---|---|---|---|---|---|---|
| 08:30 | United Kingdom | Net Lending to Individuals, bln | March | 5.3 | 11.3 | |
| 08:30 | United Kingdom | Mortgage Approvals | March | 87.4 | 92.3 | 82.7 |
| 08:30 | United Kingdom | Consumer credit, mln | March | -1.168 | -0.5 | -0.5 |
| 08:30 | United Kingdom | Purchasing Manager Index Manufacturing | April | 58.9 | 60.7 | 60.9 |
USD appreciated against its major rivals in the European session on Tuesday as investors awaited a slew of important U.S. economic data, including the U.S. services PMI on Wednesday and April non-farm payroll reading on Friday, which are expected to provide more clues on the health of the U.S. economy. There are speculations that quick economic recovery could force the U.S. Federal Reserve to hike interest rates and to begin tapering its asset purchases sooner than expected.
The U.S. Dollar Index (DXY), measuring the U.S. currency's value relative to a basket of foreign currencies, rose 0.39% to 91.30.
New York Fed President John Williams said Monday that the U.S. economy is positioned to grow quickly this year, helped by "accommodative financial conditions, strong fiscal support, and widespread vaccinations", but added that he saw no urgent need for the .s. central bank to pull back on its aggressive support as the Fed is still far from the goal of maximizing employment and price stability.
Meanwhile, Fed's Chairman Jerome Powell said the economic outlook in the U.S. has “clearly brightened” amid fast vaccinations and fiscal stimulus, but noted that the recovery has been uneven.
FXStreet notes that copper (LME) has reached the 10000.00 mark around which it is to short-term consolidate and Axel Rudolph, Senior FICC Technical Analyst at Commerzbank, suggests that further up lies the 10190.00 February 2011 high.
“Copper has reached the psychological 10000 mark around which it is expected to further consolidate this week.”
“If the recent ascent were to continue unabated, the February 2011 peak at 10190.00 would be next in line.”
“Minor support below the 9617.00 February high comes in around the 9483.00 April 20 high and also at the 9199.50 mid-March high.”
“We will retain our medium-term bullish forecast while the contract remains above the 8570.00 March low.”
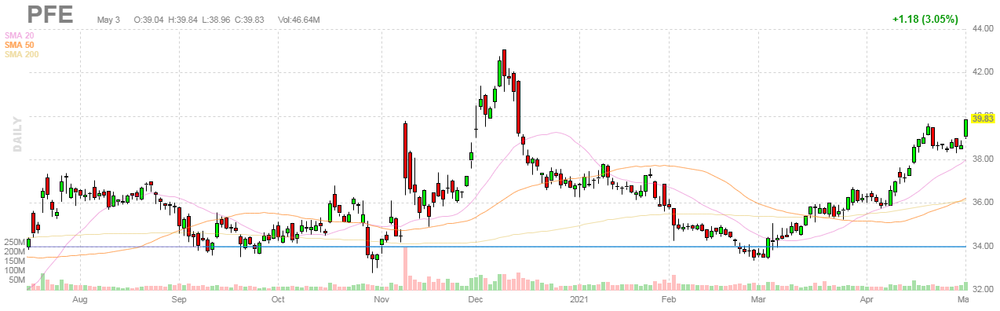
Pfizer (PFE) reported Q1 FY 2021 earnings of $0.93 per share (versus $0.80 per share in Q1 FY 2020), beating analysts’ consensus estimate of $0.78 per share.
The company’s quarterly revenues amounted to $14.582 bln (+44.6% y/y), beating analysts’ consensus estimate of $13.408 bln.
The company also issued upside guidance for FY 2021, projecting EPS of $3.55-3.65 versus analysts’ consensus estimate of $3.23 and prior guidance of $3.10-3.20 and revenues of $70.5-72.5 bln versus analysts’ consensus estimate of $60.17 bln and prior guidance of $59.4-61.4 bln.
PFE rose to $40.60 (+1.93%) in pre-market trading.
FXStreet notes that USD/CAD is holding above the bottom of a potential trend channel at 1.2274/66. Nonetheless, analysts at Credit Suisse stay bearish, with the next major support at 1.2256/51.
“Short-term, the pair is holding above the bottom of a potential trend channel at 1.2274/66, however, we stay bearish, with the next major support below here seen at a major corrective price low at 1.2256/51, which is expected to prove a tough initial barrier at first.
“With a major long-term top in place, we still see scope for an eventual move beyond here to 1.2062, the 2017 low.”
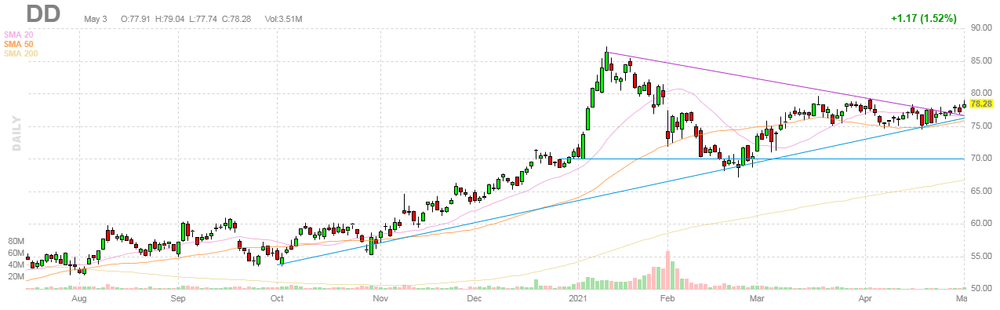
DuPont (DD) reported Q1 FY 2021 earnings of $0.91 per share (versus $0.84 per share in Q1 FY 2020), beating analysts’ consensus estimate of $0.76 per share.
The company’s quarterly revenues amounted to $3.976 bln (-23.8% y/y), beating analysts’ consensus estimate of $3.821 bln.
The company issued upside guidance for Q2 FY 2021, projecting EPS of $0.93-0.95 versus analysts' consensus estimate of $0.89 and revenues of $3.98-4.08 bln versus analysts' consensus estimate of $3.83 bln. DuPont also raised guidance for the full FY 2021: it now sees EPS of $3.60-3.75 compared to $3.30-3.45 previously and analysts' consensus estimate of $3.46 and revenues of $15.7-15.9 bln compared to $15.39-15.59 bln previously and analysts' consensus estimate of $15.45 bln.
DD rose to $78.89 (+0.78%) in pre-market trading.
FXStreet notes that local and regional elections in the UK on Thursday, May 6 have rekindled interest in the thorny question of Scottish independence. The uncertainty surrounding a vote would be bad for the pound, as Kit Juckes, Chief Global FX Strategist at Société Générale, notes.
“If pro-independence parties gain a strong majority in the new Scottish Parliament, First Minister and SNP leader Nicola Sturgeon will likely demand a second independence referendum, once the Covid-19 pandemic is behind us.”
“The possibility of a second Scottish referendum in Scotland reinforces our belief that EUR/GBP won’t go back to its pre-Brexit-referendum levels for many years.”
“Our end-year forecast for EUR/GBP remains at 0.87, which is where it is trading today."
FXStreet reports that UOB Group’s FX Strategists note the likeliness of further weakness in USD/CNH seems to be dwindling in the near term.
24-hour view: “USD subsequently traded within a 6.4688/1.4832 range before closing little changed at 6.4700 (-0.07%). The price actions offer no fresh clues and we continue to expect USD to trade sideways, likely between 6.4620 and 6.4820.”
Next 1-3 weeks: “In our latest narrative from last Thursday (29 Apr, spot at 6.4650), we highlighted that ‘boost in downward momentum could lead to further USD weakness towards 6.4410’. However, USD has not been able to make much headway to the downside and downward momentum is beginning to wane. From here, a break of 6.4900 (no change in ‘strong resistance’ level) would indicate that the negative phase has ended.”
FXStreet notes that USD/CHF posted a bullish “key reversal day” on Friday. Although mindful of potential month-end distortions, this is a potentially significant signal. Analysts at Credit Suisse stay bullish, with a break above the 0.9196 resistance needed to confirm an important low is in place for a resumption of the uptrend.
“USD/CHF posted a bullish ‘key reversal day’ on Friday, the first candlestick reversal signal of any kind since the April correction began. This is a potentially significant signal, particularly as it occurred on the back of hold above a key cluster of medium-term supports at the 200-day average and uptrend from the 2021 lows at 0.9088/80.”
“We stay bullish, with a break above the 0.9196 resistance needed to confirm an important low is in place for a resumption of the uptrend, with the next resistance at 0.9246.”
“Our broader bullish view is based on the fact that trend following indicators such as moving averages maintain a bullish ‘golden cross’, with weekly MACD also staying outright bullish.”
FXStreet reports that economists at MUFG Bank expect an extension of the RBA current dovish stance, which will not be a hurdle for AUD appreciation.
“The RBA maintained the cash rate and three-year yield target at 0.10%. Governor Lowe stated that the RBA will review their policy stance in July. The RBA needs to decide whether to shift yield curve control to target the November 2024 maturity bond from the current April 2024 bond. At the same time, the RBA will need to lay out plans for their QE programme. We expect the RBA to announce an extension of their current dovish policy stance in July.”
“The RBA has acknowledged that the Australian economy continues to recover more strongly than expected from the COVID-19 shock. More concerning for the RBA will be below target inflation. The lack of underlying inflation pressure will again encourage the RBA to maintain looser policy for longer.”
“The RBA remains committed to plans not to begin rate hikes until 2024 at the earliest. The RBA’s continued dovish policy stance is set to remain a dampener on further AUD upside as they lean against improving fundamentals. We continue to believe though that it will not prevent further AUD gains from higher commodity prices and improving global investor risk sentiment. We still expect AUD/USD to rise above the 0.8000-level.”
Reuters reports that Bank of France Governor Francois Villeroy de Galhau said there was no evidence business bankruptcies would go beyond catching up from exceptionally low levels seen last year, warning against exaggerating the likelihood of insolvencies.
Many European countries saw corporate bankruptcies fall to historic lows last year as governments put in place a range of measures to help them survive the coronavirus crisis and the lockdowns that left many businesses shuttered for months. However, fears are rising that there will be a surge in insolvencies once the measures are rolled back.
"Is there a risk of going beyond catching-up with an increase beyond the 2020 bankruptcy 'deficit'? Nothing can be excluded, but nothing allows it to be anticipated today," Villeroy said.
Though bankruptcies in France were rising this year from 2020's lows, they remained significantly lower than in 2019, Villeroy told.
He said the central bank's monthly business climate survey showed cash levels were above long term averages in industry and heading that way in services, with the exception of sectors hardest hit by COVID restrictions like hotels and restaurants.
FXStreet reports that according to 2021 estimates of economists at Charles Schwab, market returns on stocks and bonds over the next decade are expected to fall short of historical averages.
"Three primary factors are behind the forecast for reduced returns: Low-interest rates. Lower inflation affects yields on everything from cash to 30-year Treasury bonds. Inflation is low by historical standards and expected to remain so over the next 10 years. Low yields mean investors earn less from the fixed-income portion of their portfolios.”
“Low economic growth. At present, while near-term economic growth is likely to be robust, as the economy opens up (post-pandemic), consensus forecasts of economic growth over the long term remain subdued. According to consensus forecasts, economists expect 2.3% GDP growth per year, on average, over the next 10 years. This compares to historical average GDP growth of 3.1% per year (since 1948).”
“Equity valuations. Valuations appear to be stretched compared to last March’s levels. While earnings growth is expected to remain strong in the medium term – as the economy starts to get back to normal post-pandemic – the stock rally since last March has run far ahead of these expectations. High stock prices today, without a proportionate increase in future earnings, mean lower expected returns going forward.”
According to the report from the Bank of England, net mortgage borrowing was £11.8 billion in March, the strongest since the series began in April 1993.
Mortgage approvals for house purchase were 82,700 in March, lower than the recent peak of 103,100 in November 2020, but higher than in February 2020 (73,000). Economists had expected an increase to 92,300.
Individuals continued making net repayments of consumer credit in March (£0.5 billion). The effective rate on new personal loans remained low at 5.03%, compared to 7.03% in January 2020.
Households continued depositing significant amounts, with an additional £16.2 billion placed in March. Deposit interest rates remained at historically low levels.
Private non-financial companies repaid £6.2 billion of finance to capital markets in March, compared to a monthly average net issuance of £4.5 billion since March 2020. Net bank borrowing by small and medium sized businesses was £0.7 billion in March, whilst large businesses made net repayments of £1.4 billion.
According to the report from IHS Markit/CIPS, April saw a further acceleration in the rate of expansion of the UK manufacturing sector. Growth of output and new orders were both among the best seen over the past seven years, leading to a solid increase in employment. The sector remained beset by supply-chain delays and input shortages, however, which contributed to increased purchasing costs and record selling price inflation.
The seasonally adjusted PMI rose to 60.9 in April, up from 58.9 in March and above the earlier flash estimate of 60.7. The latest reading is the highest since July 1994's record high (61.0). Manufacturing production increased for the eleventh successive month in April. Output growth was attributed to a loosening of lockdown restrictions, improved demand and rising backlogs of work. Solid and accelerated expansions of output were seen across the consumer, intermediate and investment goods industries, with the consumer goods category the strongest performer overall.
The outlook for the UK manufacturing sector also remained positive at the start of the second quarter. Two-thirds (66%) of companies forecast that output will be higher in a year's time, compared to only 4% anticipating a contraction. The overall degree of confidence currently stands at its highest level in seven years. Optimism reflected expectations for less disruption related to COVID-19 and Brexit, economic recovery, improved client confidence and planned new product launches.
Bloomberg reports that Westpac Banking Corp.’s Bill Evans said that Australia’s fiscal position has undergone an “extraordinary improvement” that reflects a faster-than-expected recovery in the labor market and household spending, and higher commodity prices.
The budget shortfall in the year ending June 30 will be A$155 billion ($120 billion), or 7.5% of gross domestic product, compared with the government’s December forecast of A$197.7 billion, Evans, chief economist at Westpac, said in a research note. It will narrow to A$84 billion, or 4% of GDP, in fiscal 2022, even with an expected additional A$20 billion of spending, he said.
“The budget strategy is to go for growth,” Evans said. “What drives fiscal repair is having the economy operating closer to full capacity -- with revenue boosted by a higher employment to population ratio. Spending restraint may well gain less traction – if the economy gets stuck in the slow lane.”
FXStreet reports that in the view of economists at HSBC, a patient Fed will remain a headwind to the USD, while the implications of the fiscal plan remain muddied.
“The FOMC left the federal funds target range unchanged at 0-0.25%. The USD weakness was seen during the press conference where Fed Chair Powell reiterated that it was too early to talk about tapering. Mr. Powell also noted that employment was still 8.5 M below its pre-pandemic level and indicated that closing much of this gap would be an important criterion for tapering. As such, the release of Nonfarm Payrolls on 7 May is likely to be a market focus. We believe a patient Fed will remain a headwind to the USD.”
“There is a trade-off between the cyclical upside for the USD and the structural deficit downside. As the USD is a ‘safe haven’ currency, there is also a trade-off for risk appetite between extra government spending and higher taxation. For now, we expect the cyclical and ‘risk on’ aspects to win out. We expect some modest USD weakness this year, as the global economic recovery gains momentum.”
According to the report from the State Secretariat for Economic Affairs (SECO), sentiment amongst Swiss households is improving. The results of the April survey show that expectations regarding general economic development in particular are becoming more positive. The likelihood of households making major purchases has also risen.
As of April 2021, the consumer sentiment index has climbed to -7 points. This returns it approximately to the pre-crisis level of early 2020, and is closing in on its long-term average (-5 points). The primary reason for this significant improvement in sentiment is households’ expectations regarding general economic development. The relevant sub-index climbed from -18 points in January to +3, the highest value recorded since autumn 2018. This indicates that consumers are expecting the economic recovery following the crisis plagued year of 2020 to continue over the coming twelve months.
Increasing likelihood of making major purchases has also helped to raise the consumer sentiment index. However, the relevant sub-index (current level: -13 points) has not yet recovered to its pre-crisis level. Households’ assessment of the labour market is also more positive than in previous quarters, but it remains considerably more negative than before the outbreak of the crisis. The index on expected unemployment (90 points) has improved considerably, but the index for job security has remained at a very low level since last autumn.
In the wake of rising inflation rates, price developments are weighing on purchasing power. As a result, the sub-indices on past and future price developments have increased compared to previous surveys.
| Time | Country | Event | Period | Previous value | Forecast | Actual |
|---|---|---|---|---|---|---|
| 01:30 | Australia | Trade Balance | March | 7.595 | 8 | 5.574 |
| 04:30 | Australia | Announcement of the RBA decision on the discount rate | 0.1% | 0.1% | 0.1% | |
| 07:00 | Switzerland | SECO Consumer Climate | Quarter II | -14.2 | -7.1 |
During today's Asian trading, the US dollar rose against most major currencies, recovering from yesterday's fall on the back of US data. The ICE Dollar index, which shows the value of the US dollar against six major world currencies, rose by 0.25%.
The ISM index of business activity in the US manufacturing sector in April fell to 60.7 points compared with 64.7 points in March, data from the Institute for Supply Management (ISM), published on Monday, showed. This came as a surprise to analysts, who on average predicted an increase to 65 points.
Tomorrow, the ISM will release the April index of business activity in the US services sector, while on Friday, the US Department of Labor will release nonfarm payrolls data for April. According to some analysts, the strong indicators may support the dollar, as they will strengthen expectations of an increase in interest rates.
The head of the Fer, Jerome Powell, said yesterday that the growth prospects for the US economy have improved on the background of vaccination and thanks to budget incentives, but he stressed that the economic recovery is uneven.
The Australian dollar fell by 0.25% against the US dollar, which was partly due to the outcome of the Reserve Bank of Australia meeting. RBA kept the base rate at a record low of 0.1% per annum, as most experts expected. The Bank confirmed its intention to adhere to an ultra-soft monetary policy until at least 2024.
FXStreet reports that economists at the National Bank of Canada see the USD/CAD trading at 1.20 by the third quarter.
“We see more QE tapering coming before year end and the BoC’s first rate hike likely in October 2022, well before the first Fed rate hike expected in Q1 2023. With the Bank looking to move a bit ahead of the Fed and the BoC tapering progressing, we see our USD/CAD 1.20 forecast arriving one quarter earlier than scheduled, in Q3 2021.”
EUR/USD
Resistance levels (open interest**, contracts)
$1.2160 (2075)
$1.2124 (2058)
$1.2086 (3340)
Price at time of writing this review: $1.2036
Support levels (open interest**, contracts):
$1.1991 (977)
$1.1946 (2250)
$1.1898 (1823)
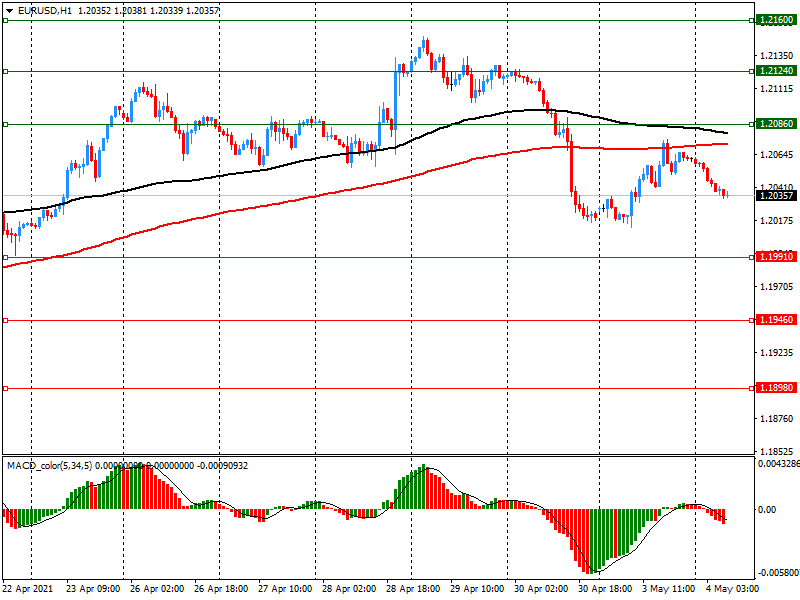
Comments:
- Overall open interest on the CALL options and PUT options with the expiration date May, 7 is 60392 contracts (according to data from May, 3) with the maximum number of contracts with strike price $1,2000 (3340);
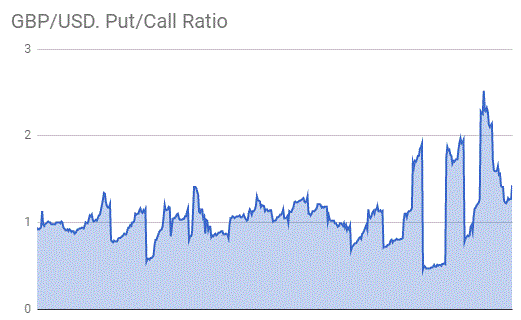
GBP/USD
$1.4017 (1119)
$1.3956 (1203)
$1.3928 (516)
Price at time of writing this review: $1.3871
Support levels (open interest**, contracts):
$1.3826 (277)
$1.3787 (446)
$1.3743 (1923)
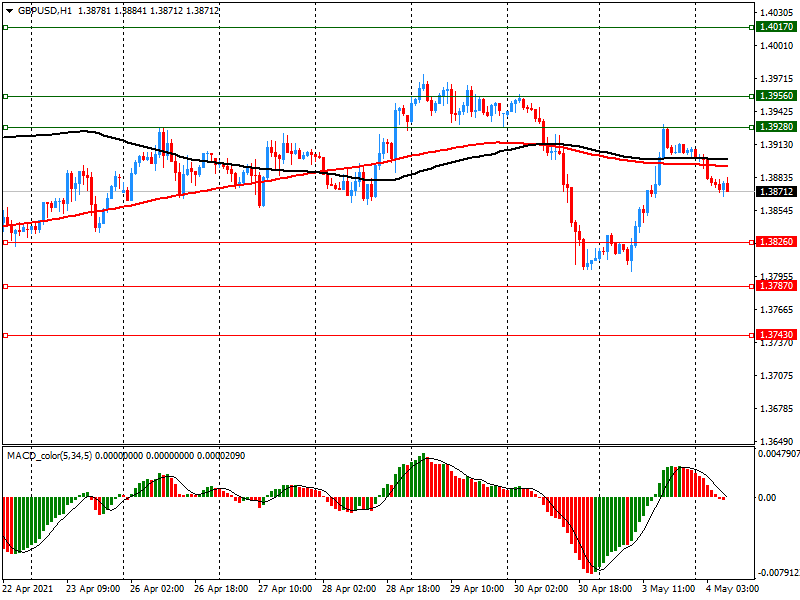
Comments:
- Overall open interest on the CALL options with the expiration date May, 7 is 11460 contracts, with the maximum number of contracts with strike price $1,4200 (2932);
- Overall open interest on the PUT options with the expiration date May, 7 is 18988 contracts, with the maximum number of contracts with strike price $1,3700 (2034);
- The ratio of PUT/CALL was 1.66 versus 1.54 from the previous trading day according to data from May, 3
* - The Chicago Mercantile Exchange bulletin (CME) is used for the calculation.
** - Open interest takes into account the total number of option contracts that are open at the moment.
eFXdata reports that Credit Suisse discusses USD/JPY outlook.
"In our Q2 Outlook, we argued for an expected range of USDJPY 107.00 – 112.50 for the quarter, arguing that moves to the low end of the range should be bought given the likelihood of pro-carry outcomes paying off over time in a reflationary global environment where the US is a growth leader. For those who missed the best levels to enter in terms of spot levels below 108.00, it’s still possible to consider option ideas as alternatives. This trade can benefit from any period of calm into and after the Golden Week period starting in Japan, as well as a longer period of reflection around whether the Fed can push against stronger US data, while retaining upside USD/JPY possibilities," CS adds.
RTTNews reports that Australia's central bank decided to leave its cash rate unchanged at a record low of 0.10 percent.
The central bank retained the target yield on the 3-year Australian government bond at around 0.1 percent and also maintained the parameters of the Term Funding Facility and the government bond purchase programme.
The bank repeated that it will not increase the cash rate until actual inflation is sustainably within the 2 to 3 percent target range.
For this to occur, the labor market will need to be tight enough to generate wages growth that is materially higher than it is currently, the bank said.
| Raw materials | Closed | Change, % |
|---|---|---|
| Brent | 67.86 | 0.79 |
| Silver | 26.865 | 3.99 |
| Gold | 1792.828 | 1.49 |
| Palladium | 2969.39 | 1.23 |
| Time | Country | Event | Period | Previous value | Forecast |
|---|---|---|---|---|---|
| 01:30 (GMT) | Australia | Trade Balance | March | 7.529 | 8 |
| 01:45 (GMT) | China | Markit/Caixin Manufacturing PMI | April | 50.6 | 50.8 |
| 04:30 (GMT) | Australia | Announcement of the RBA decision on the discount rate | 0.1% | 0.1% | |
| 07:00 (GMT) | Switzerland | SECO Consumer Climate | Quarter II | -14.6 | |
| 08:30 (GMT) | United Kingdom | Net Lending to Individuals, bln | March | 4.9 | |
| 08:30 (GMT) | United Kingdom | Mortgage Approvals | March | 87.7 | 92.3 |
| 08:30 (GMT) | United Kingdom | Consumer credit, mln | March | -1.246 | -0.5 |
| 08:30 (GMT) | United Kingdom | Purchasing Manager Index Manufacturing | April | 58.9 | 60.7 |
| 12:30 (GMT) | Canada | Building Permits (MoM) | March | 2.1% | |
| 12:30 (GMT) | Canada | Trade balance, billions | March | 1.04 | 0.8 |
| 12:30 (GMT) | U.S. | International Trade, bln | March | -71.1 | -74.3 |
| 14:00 (GMT) | U.S. | Factory Orders | March | -0.8% | 1.3% |
| 22:30 (GMT) | Australia | AiG Performance of Construction Index | April | 61.8 | |
| 22:45 (GMT) | New Zealand | Employment Change, q/q | Quarter I | 0.6% | 0.2% |
| 22:45 (GMT) | New Zealand | Unemployment Rate | Quarter I | 4.9% | 4.9% |
| Pare | Closed | Change, % |
|---|---|---|
| AUDUSD | 0.77589 | 0.58 |
| EURJPY | 131.534 | 0.07 |
| EURUSD | 1.20613 | 0.28 |
| GBPJPY | 151.676 | 0.51 |
| GBPUSD | 1.39071 | 0.7 |
| NZDUSD | 0.71988 | 0.44 |
| USDCAD | 1.22756 | -0.07 |
| USDCHF | 0.91082 | -0.16 |
| USDJPY | 109.046 | -0.2 |


© 2000-2026. Sva prava zaštićena.
Sajt je vlasništvo kompanije Teletrade D.J. LLC 2351 LLC 2022 (Euro House, Richmond Hill Road, Kingstown, VC0100, St. Vincent and the Grenadines).
Svi podaci koji se nalaze na sajtu ne predstavljaju osnovu za donošenje investicionih odluka, već su informativnog karaktera.
The company does not serve or provide services to customers who are residents of the US, Canada, Iran, The Democratic People's Republic of Korea, Yemen and FATF blacklisted countries.
Izvršenje trgovinskih operacija sa finansijskim instrumentima upotrebom marginalne trgovine pruža velike mogućnosti i omogućava investitorima ostvarivanje visokih prihoda. Međutim, takav vid trgovine povezan je sa potencijalno visokim nivoom rizika od gubitka sredstava. Проведение торговых операций на финанcовых рынках c маржинальными финанcовыми инcтрументами открывает широкие возможноcти, и позволяет инвеcторам, готовым пойти на риcк, получать выcокую прибыль, но при этом неcет в cебе потенциально выcокий уровень риcка получения убытков. Iz tog razloga je pre započinjanja trgovine potrebno odlučiti o izboru odgovarajuće investicione strategije, uzimajući u obzir raspoložive resurse.
Upotreba informacija: U slučaju potpunog ili delimičnog preuzimanja i daljeg korišćenja materijala koji se nalazi na sajtu, potrebno je navesti link odgovarajuće stranice na sajtu kompanije TeleTrade-a kao izvora informacija. Upotreba materijala na internetu mora biti praćena hiper linkom do web stranice teletrade.org. Automatski uvoz materijala i informacija sa stranice je zabranjen.
Ako imate bilo kakvih pitanja, obratite nam se pr@teletrade.global.
транcфери