- Analiza
- Novosti i instrumenti
- Vesti sa tržišta
Forex-novosti i prognoze od 03-07-2024
- USD/CHF trades with a mild bearish bias around 0.9015 in Thursday’s Asian session.
- Fed officials maintain a cautious stance and refrain from committing to interest rate cuts.
- The Swiss CPI is estimated to show an increase of 1.4% in June.
The USD/CHF pair trades with mild losses near 0.9015 during the early Asian trading hours on Thursday. The softer US Dollar (USD) and declining US bond yields weigh on the pair. The US markets will be closed on Thursday due to Independence Day. On Friday, the attention will shift to the US employment data for June, including Nonfarm Payrolls, Unemployment Rate, and Average Hourly Earnings.
The weaker-than-expected US Services Purchasing Managers Index (PMI) for June exerts some selling pressure on the Greenback. The US ISM Services PMI declined to 48.8 in June from 53.8 in May, lower than the market consensus of 52.5 by a wide margin.
Meanwhile, US Initial Jobless Claims increased by 238K in the week ending June 29, according to the US Department of Labour (DoL) on Thursday. This figure came in above the estimation of 235K and higher than the previous weekly gain of 233K.
The US Federal Reserve (USD) officials indicated during their June meeting that inflation is moving in the right direction but not quickly enough for them to cut interest rates, FOMC minutes released Wednesday showed. Some policymakers emphasized the importance of patience before considering rate cuts, while several others stated that it’s necessary to hike again if inflation were to rebound.
On the Swiss front, the Swiss National Bank's (SNB) interest rate cut for the second consecutive meeting in June continues to undermine the Swiss Franc (CHF). However, the uncertainty and
Looking ahead, investors will take more cues from the Swiss Consumer Price Index (CPI) inflation data for June, which is expected to ease to 0.1% MoM from 0.3% in May. On an annual basis, the Swiss CPI is estimated to show an increase of 1.4% in June.
Swiss Franc FAQs
The Swiss Franc (CHF) is Switzerland’s official currency. It is among the top ten most traded currencies globally, reaching volumes that well exceed the size of the Swiss economy. Its value is determined by the broad market sentiment, the country’s economic health or action taken by the Swiss National Bank (SNB), among other factors. Between 2011 and 2015, the Swiss Franc was pegged to the Euro (EUR). The peg was abruptly removed, resulting in a more than 20% increase in the Franc’s value, causing a turmoil in markets. Even though the peg isn’t in force anymore, CHF fortunes tend to be highly correlated with the Euro ones due to the high dependency of the Swiss economy on the neighboring Eurozone.
The Swiss Franc (CHF) is considered a safe-haven asset, or a currency that investors tend to buy in times of market stress. This is due to the perceived status of Switzerland in the world: a stable economy, a strong export sector, big central bank reserves or a longstanding political stance towards neutrality in global conflicts make the country’s currency a good choice for investors fleeing from risks. Turbulent times are likely to strengthen CHF value against other currencies that are seen as more risky to invest in.
The Swiss National Bank (SNB) meets four times a year – once every quarter, less than other major central banks – to decide on monetary policy. The bank aims for an annual inflation rate of less than 2%. When inflation is above target or forecasted to be above target in the foreseeable future, the bank will attempt to tame price growth by raising its policy rate. Higher interest rates are generally positive for the Swiss Franc (CHF) as they lead to higher yields, making the country a more attractive place for investors. On the contrary, lower interest rates tend to weaken CHF.
Macroeconomic data releases in Switzerland are key to assessing the state of the economy and can impact the Swiss Franc’s (CHF) valuation. The Swiss economy is broadly stable, but any sudden change in economic growth, inflation, current account or the central bank’s currency reserves have the potential to trigger moves in CHF. Generally, high economic growth, low unemployment and high confidence are good for CHF. Conversely, if economic data points to weakening momentum, CHF is likely to depreciate.
As a small and open economy, Switzerland is heavily dependent on the health of the neighboring Eurozone economies. The broader European Union is Switzerland’s main economic partner and a key political ally, so macroeconomic and monetary policy stability in the Eurozone is essential for Switzerland and, thus, for the Swiss Franc (CHF). With such dependency, some models suggest that the correlation between the fortunes of the Euro (EUR) and the CHF is more than 90%, or close to perfect.
- EUR/USD drifts into the upside as Greenback flows reverse course.
- US data broadly misses the mark, sparking risk appetite on rate cut hopes.
- US holiday looms ahead of Friday’s NFP US data dump.
EUR/USD found a leg up on Wednesday, climbing briefly above the 1.0800 handle after a broad miss in US economic figures hinted at further signs of a weakening US economy, sparking fresh hopes for an accelerated pace of rate cuts from the Federal Reserve (Fed) and markets flowing out of the safe haven US Dollar.
Forex Today: The UK’s Labour Party is aiming for a landslide victory
European data also came in mixed early Thursday, with the pan-EU HCOB Purchasing Managers Index (PMI) ticking up to 50.9 MoM in June compared to the forecast hold at 50.8. The EU-wide Producer Price Index contracted more sharply than expected in May, falling -0.2% MoM versus the forecast hold at -0.1%.
The US ADP Employment Change dropped to 150K in June, down from the previous month's 157K and missing the forecasted increase to 160K. The ADP report also revealed that many of the reduced job additions were concentrated in lower-paying leisure and hospitality industries.
Additionally, US Initial Jobless Claims increased for the week ending June 28, rising to 238K compared to the previous week's 233K, surpassing the forecast of 235K. The four-week average of Initial Jobless Claims also rose to 238.5K from 236.25K.
Finally, the US ISM Services Purchasing Managers Index (PMI) sharply contracted to 48.8 in June, marking its lowest level since June 2020. The ISM Services PMI decreased from the previous month's 53.8, falling short of the forecasted decline to 52.5.
US markets will be dark on Thursday as the US takes the Independence Day holiday, leaving Fiber traders to contend with German Factory Orders, forecast to rebound to 0.5% MoM in May from the previous -0.2%. EUR/USD traders will also be looking for any knock-on volatility as a result of the UK’s Parliamentary Elections.
Economic Indicator
ISM Services PMI
The Institute for Supply Management (ISM) Services Purchasing Managers Index (PMI), released on a monthly basis, is a leading indicator gauging business activity in the US services sector, which makes up most of the economy. The indicator is obtained from a survey of supply executives across the US based on information they have collected within their respective organizations. Survey responses reflect the change, if any, in the current month compared to the previous month. A reading above 50 indicates that the services economy is generally expanding, a bullish sign for the US Dollar (USD). A reading below 50 signals that services sector activity is generally declining, which is seen as bearish for USD.
Read more.Last release: Wed Jul 03, 2024 14:00
Frequency: Monthly
Actual: 48.8
Consensus: 52.5
Previous: 53.8
Source: Institute for Supply Management
The Institute for Supply Management’s (ISM) Services Purchasing Managers Index (PMI) reveals the current conditions in the US service sector, which has historically been a large GDP contributor. A print above 50 shows expansion in the service sector’s economic activity. Stronger-than-expected readings usually help the USD gather strength against its rivals. In addition to the headline PMI, the Employment Index and the Prices Paid Index numbers are also watched closely by investors as they provide useful insights regarding the state of the labour market and inflation.
EUR/USD technical outlook
EUR/USD has extended a recent bullish bounce from a demand zone priced in below 1.0680, briefly testing chart territory north of 1.0800. The pair is leaning further bullish in the near-term, accelerating above the 200-hour Exponential Moving Average (EMA) at 1.0734.
Despite intraday bullish action, the Fiber is primed for a downside rejection after failing to make a decisive break of the 200-day EMA at 1.0794, and a rough descending channel limiting upside potential in daily candlesticks.
EUR/USD hourly chart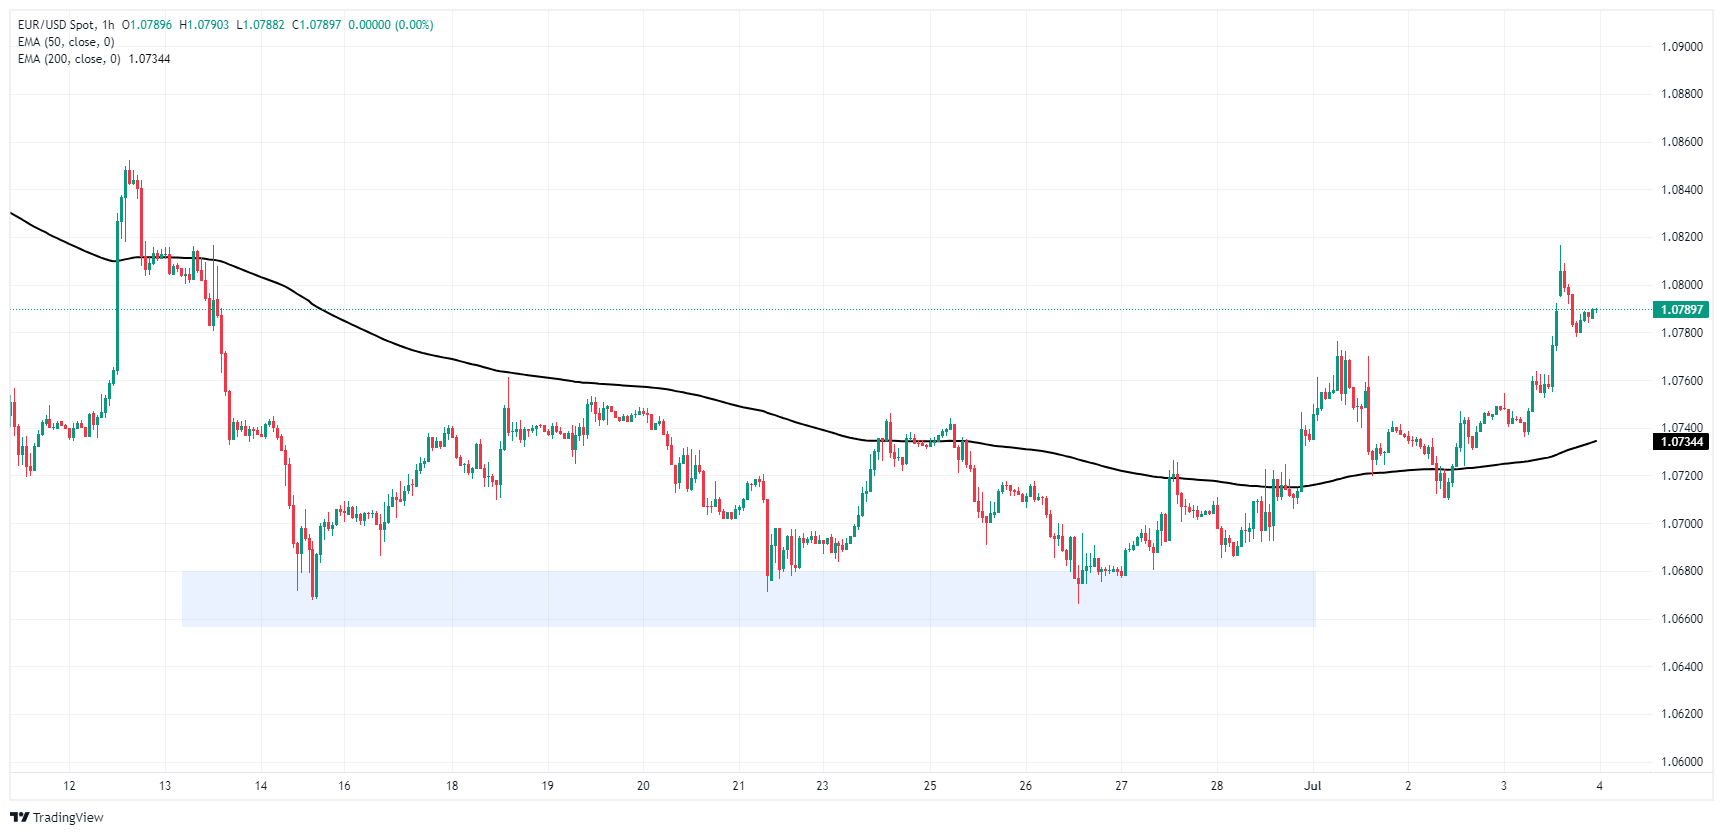
EUR/USD daily chart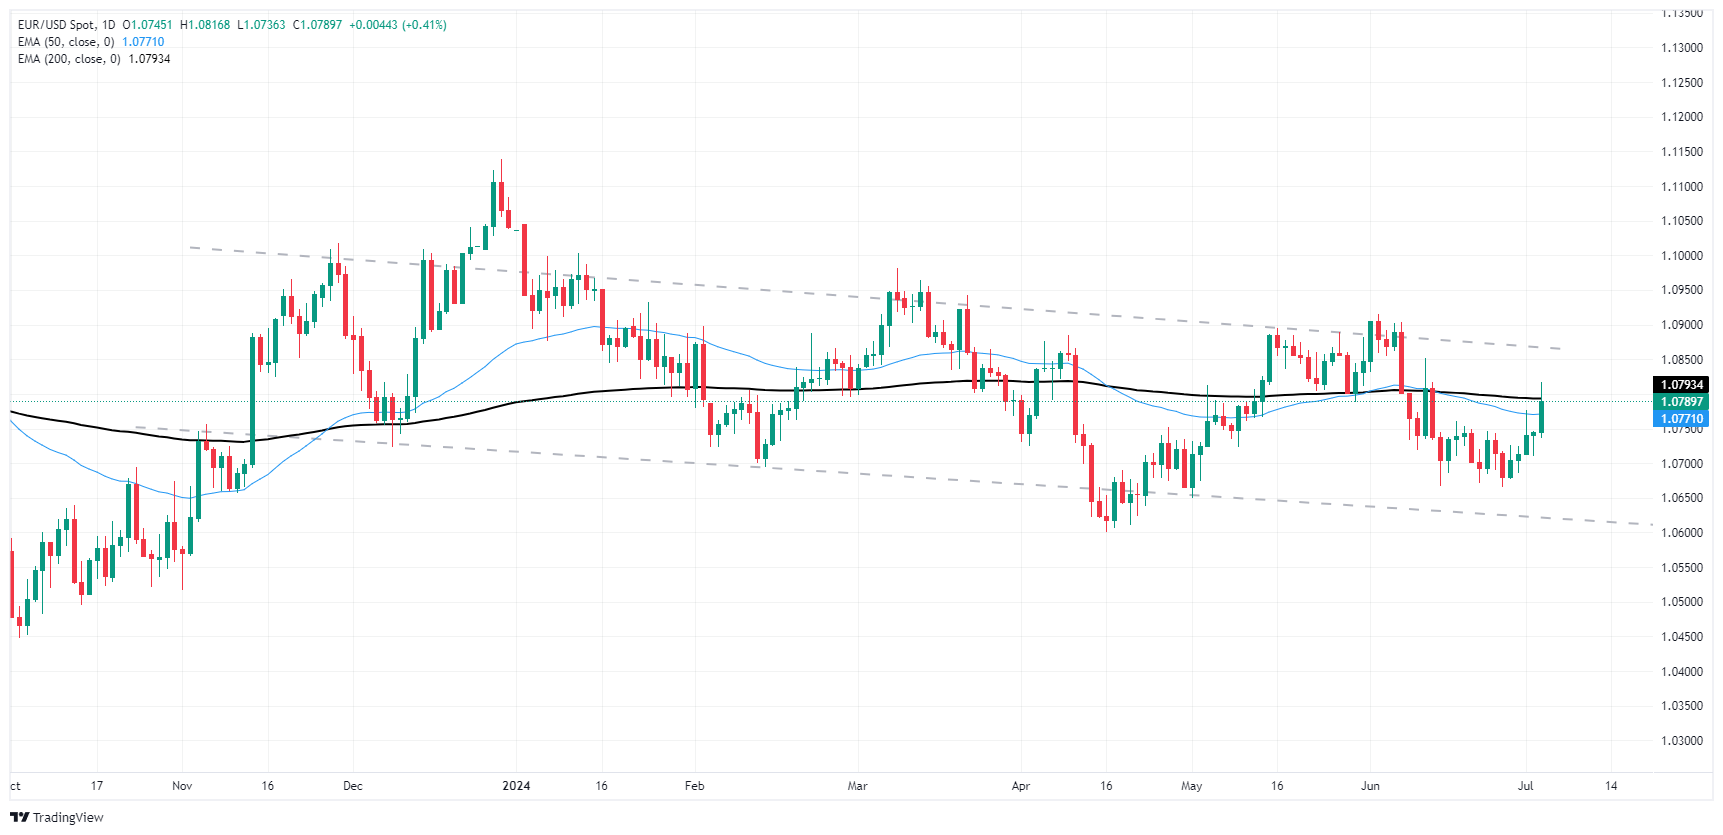
Euro FAQs
The Euro is the currency for the 20 European Union countries that belong to the Eurozone. It is the second most heavily traded currency in the world behind the US Dollar. In 2022, it accounted for 31% of all foreign exchange transactions, with an average daily turnover of over $2.2 trillion a day. EUR/USD is the most heavily traded currency pair in the world, accounting for an estimated 30% off all transactions, followed by EUR/JPY (4%), EUR/GBP (3%) and EUR/AUD (2%).
The European Central Bank (ECB) in Frankfurt, Germany, is the reserve bank for the Eurozone. The ECB sets interest rates and manages monetary policy. The ECB’s primary mandate is to maintain price stability, which means either controlling inflation or stimulating growth. Its primary tool is the raising or lowering of interest rates. Relatively high interest rates – or the expectation of higher rates – will usually benefit the Euro and vice versa. The ECB Governing Council makes monetary policy decisions at meetings held eight times a year. Decisions are made by heads of the Eurozone national banks and six permanent members, including the President of the ECB, Christine Lagarde.
Eurozone inflation data, measured by the Harmonized Index of Consumer Prices (HICP), is an important econometric for the Euro. If inflation rises more than expected, especially if above the ECB’s 2% target, it obliges the ECB to raise interest rates to bring it back under control. Relatively high interest rates compared to its counterparts will usually benefit the Euro, as it makes the region more attractive as a place for global investors to park their money.
Data releases gauge the health of the economy and can impact on the Euro. Indicators such as GDP, Manufacturing and Services PMIs, employment, and consumer sentiment surveys can all influence the direction of the single currency. A strong economy is good for the Euro. Not only does it attract more foreign investment but it may encourage the ECB to put up interest rates, which will directly strengthen the Euro. Otherwise, if economic data is weak, the Euro is likely to fall. Economic data for the four largest economies in the euro area (Germany, France, Italy and Spain) are especially significant, as they account for 75% of the Eurozone’s economy.
Another significant data release for the Euro is the Trade Balance. This indicator measures the difference between what a country earns from its exports and what it spends on imports over a given period. If a country produces highly sought after exports then its currency will gain in value purely from the extra demand created from foreign buyers seeking to purchase these goods. Therefore, a positive net Trade Balance strengthens a currency and vice versa for a negative balance.
- GBP/USD climbed towards 1.2780 on Wednesday as rate cut hopes reignite.
- US data broadly missed the mark, signs of further softening mount.
- UK election on Thursday could introduce a fresh round of volatility.
GBP/USD extended a near-term rebound on Wednesday, bolstered by a broad softening in US economic figures in the midweek market session. Thursday’s upcoming UK election will draw plenty of attention from Cable traders as US markets hunker down for the wait through Thursday’s market holiday.
Forex Today: The UK’s Labour Party is aiming for a landslide victory
US ADP Employment Change fell to 150K in June, down from the previous month’s 157K and missing the forecast increase to 160K. Looking deeper into the ADP’s report, many of the already-lower job additions were concentrated in lower-paying leisure and hospitality industries.
US Initial Jobless Claims also ticked up for the week ended June 28, rising to 238K week-on-week compared to the previous week’s 233K, more than the forecast 235K. The four-week average of Initial Jobless Claims also ticked higher to 238.5K from 236.25K.
US ISM Services Purchasing Managers Index (PMI) in June contracted sharply to 48.8, falling to its lowest level since June of 2020. Services PMI fell from the previous month’s 53.8, entirely undershooting the forecast decline to 52.5.
US markets will be dark on Thursday for the US Independence Day holiday, leaving Cable to churn as the UK’s Parliamentary Elections get underway. The Labour Party in the UK is widely expected to win a majority in the government, ending 14 years of Conservative party rule. Based on the latest mega polls released on Wednesday, it is anticipated that Labour will significantly outperform the Conservatives, with Keir Starmer of the Labour Party expected to replace the current Conservative Prime Minister, Rishi Sunak. According to the polling conducted by YouGov, Labour is projected to win 431 seats, while the Tories are expected to win just 102.
Economic Indicator
ISM Services PMI
The Institute for Supply Management (ISM) Services Purchasing Managers Index (PMI), released on a monthly basis, is a leading indicator gauging business activity in the US services sector, which makes up most of the economy. The indicator is obtained from a survey of supply executives across the US based on information they have collected within their respective organizations. Survey responses reflect the change, if any, in the current month compared to the previous month. A reading above 50 indicates that the services economy is generally expanding, a bullish sign for the US Dollar (USD). A reading below 50 signals that services sector activity is generally declining, which is seen as bearish for USD.
Read more.Last release: Wed Jul 03, 2024 14:00
Frequency: Monthly
Actual: 48.8
Consensus: 52.5
Previous: 53.8
Source: Institute for Supply Management
The Institute for Supply Management’s (ISM) Services Purchasing Managers Index (PMI) reveals the current conditions in the US service sector, which has historically been a large GDP contributor. A print above 50 shows expansion in the service sector’s economic activity. Stronger-than-expected readings usually help the USD gather strength against its rivals. In addition to the headline PMI, the Employment Index and the Prices Paid Index numbers are also watched closely by investors as they provide useful insights regarding the state of the labour market and inflation.
GBP/USD technical outlook
Cable has extended a near-term bullish rebound from a demand zone priced in below 1.2640, climbing towards 1.2780 on Wednesday and leaving bids adrift sharply above the 200-hour Exponential Moving Average (EMA) at 1.2676.
Despite a bullish midweek bounce, a heavy supply zone is waiting for buyers, priced in above the 1.2800 handle. GBP/USD is trading north of the 200-day EMA at 1.2604.
GBP/USD hourly chart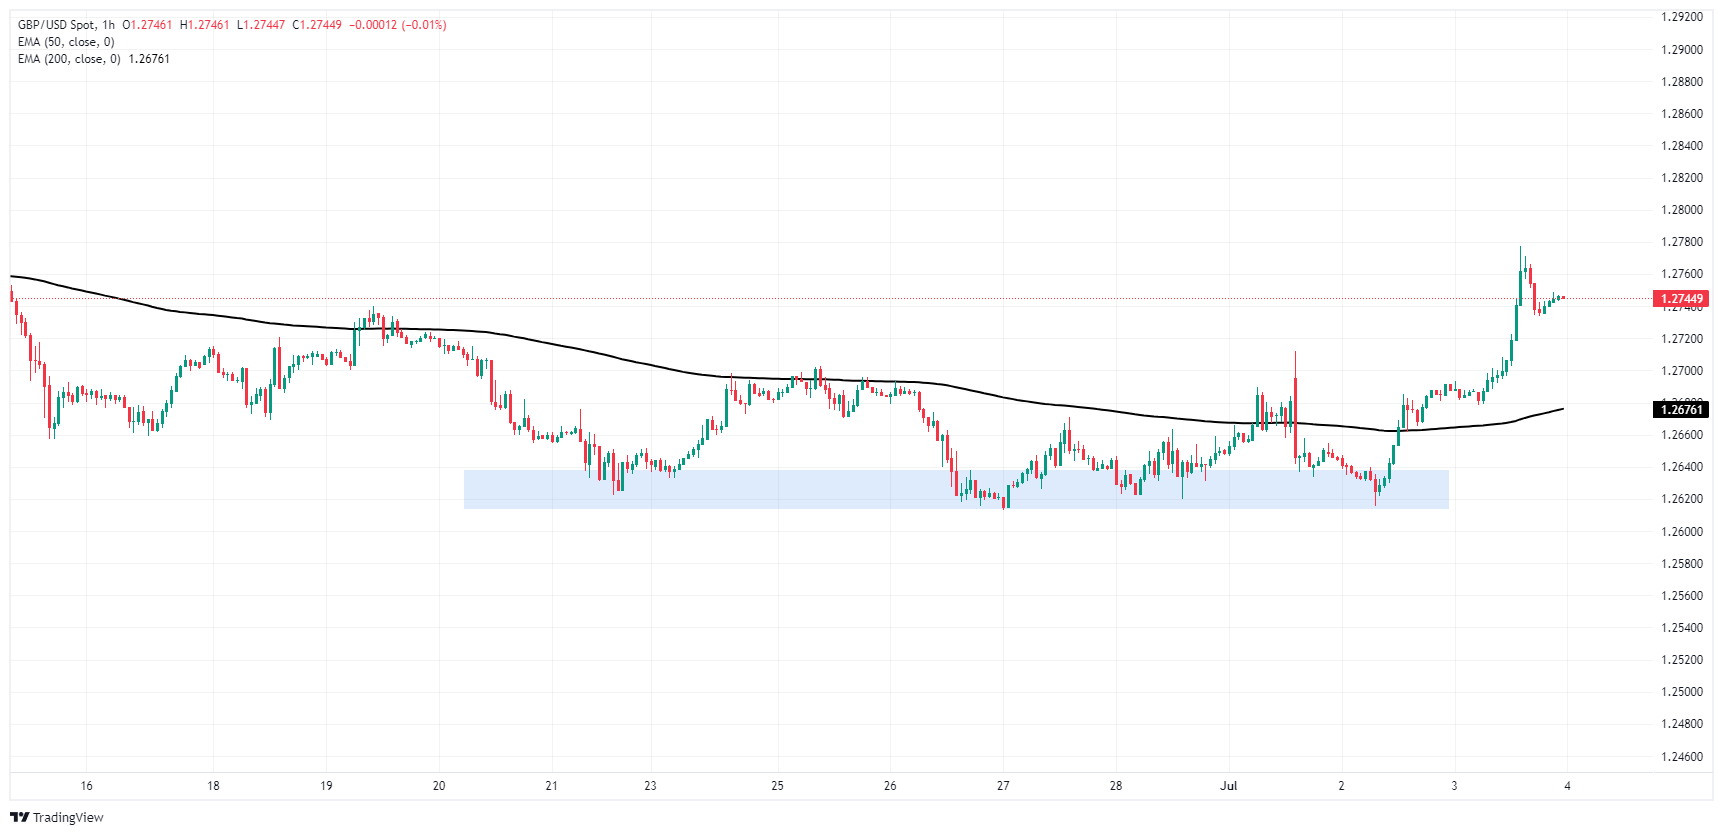
GBP/USD daily chart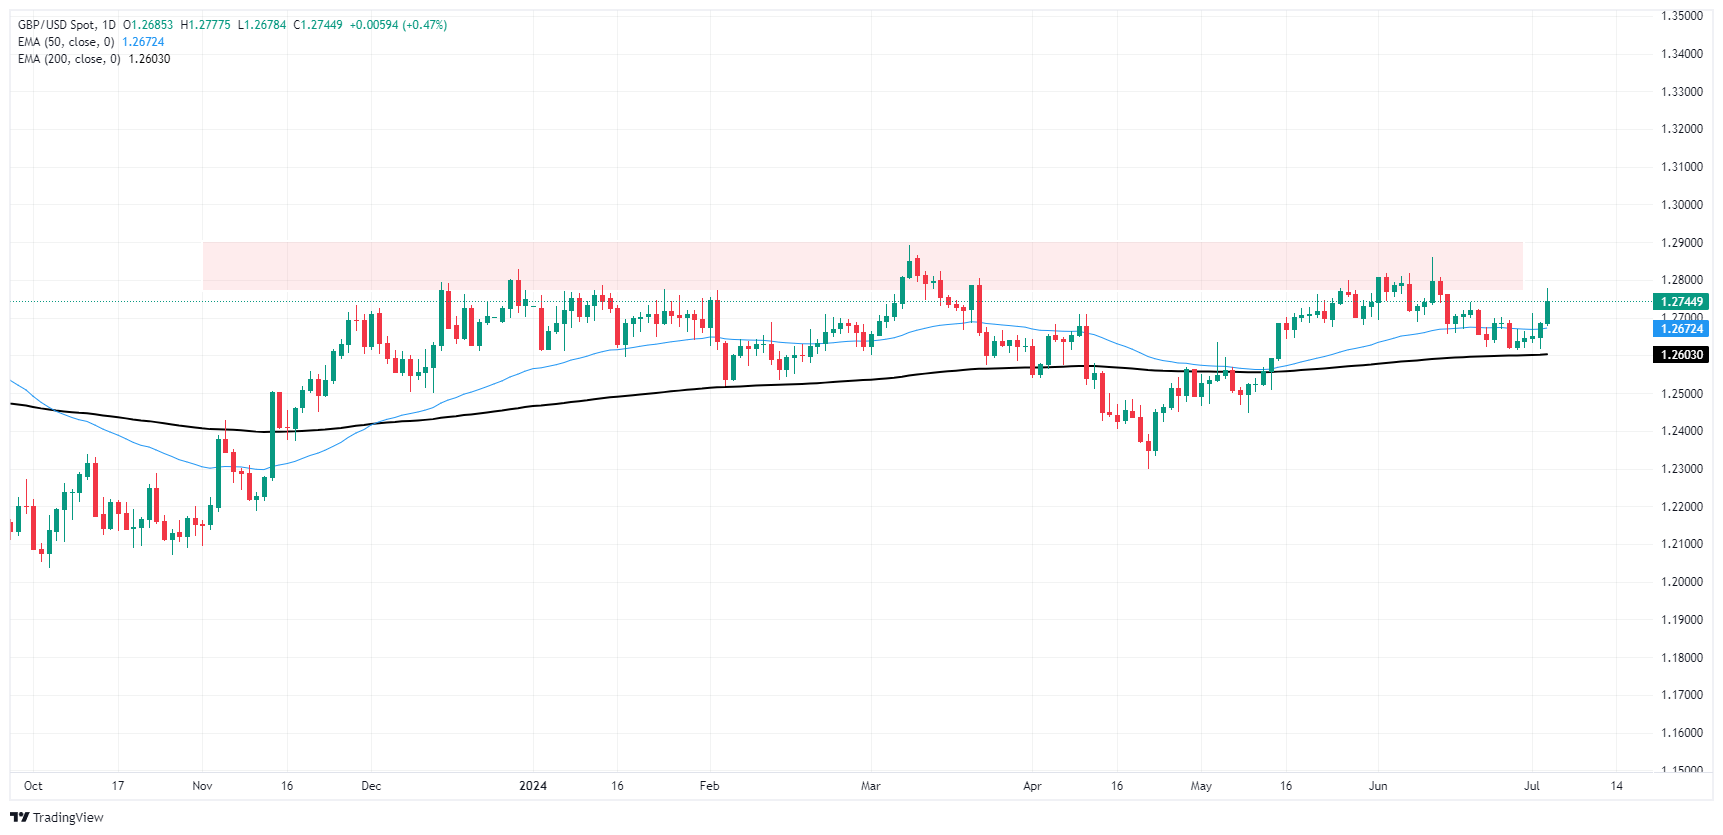
Pound Sterling FAQs
The Pound Sterling (GBP) is the oldest currency in the world (886 AD) and the official currency of the United Kingdom. It is the fourth most traded unit for foreign exchange (FX) in the world, accounting for 12% of all transactions, averaging $630 billion a day, according to 2022 data. Its key trading pairs are GBP/USD, aka ‘Cable’, which accounts for 11% of FX, GBP/JPY, or the ‘Dragon’ as it is known by traders (3%), and EUR/GBP (2%). The Pound Sterling is issued by the Bank of England (BoE).
The single most important factor influencing the value of the Pound Sterling is monetary policy decided by the Bank of England. The BoE bases its decisions on whether it has achieved its primary goal of “price stability” – a steady inflation rate of around 2%. Its primary tool for achieving this is the adjustment of interest rates. When inflation is too high, the BoE will try to rein it in by raising interest rates, making it more expensive for people and businesses to access credit. This is generally positive for GBP, as higher interest rates make the UK a more attractive place for global investors to park their money. When inflation falls too low it is a sign economic growth is slowing. In this scenario, the BoE will consider lowering interest rates to cheapen credit so businesses will borrow more to invest in growth-generating projects.
Data releases gauge the health of the economy and can impact the value of the Pound Sterling. Indicators such as GDP, Manufacturing and Services PMIs, and employment can all influence the direction of the GBP. A strong economy is good for Sterling. Not only does it attract more foreign investment but it may encourage the BoE to put up interest rates, which will directly strengthen GBP. Otherwise, if economic data is weak, the Pound Sterling is likely to fall.
Another significant data release for the Pound Sterling is the Trade Balance. This indicator measures the difference between what a country earns from its exports and what it spends on imports over a given period. If a country produces highly sought-after exports, its currency will benefit purely from the extra demand created from foreign buyers seeking to purchase these goods. Therefore, a positive net Trade Balance strengthens a currency and vice versa for a negative balance.
- USD/CAD remains under selling pressure near 1.3640 in Thursday’s early Asian session.
- The US service sector fell into contraction territory in June.
- Higher crude oil prices continue to support the commodity-linked Loonie.
The USD/CAD pair trades on a softer note around 1.3640 during the early Asian session on Thursday. The softer Greenback after the weaker-than-expected US Services Purchasing Managers Index (PMI) for June has dragged the pair lower. Meanwhile, the USD Index (DXY) accelerates its decline to 105.30 and US yields decline across the board amid the Independence Day holiday on Thursday.
Business activity in the US service sector fell into contraction territory in June. The US ISM Services PMI dropped to 48.8 in June from 53.8 in May, missing the market expectation of 52.5 by a wide margin. In response to the weaker data, the US Dollar (USD) attracts some sellers broadly.
According to the Federal Open Market Committee (FOMC) meeting on June 11–12, Federal Reserve (Fed) officials emphasized the data-dependent approach and refrained from committing to interest rate cuts until further observation. Additionally, some policymakers noted the importance of patience before considering rate cuts, while several others stated that it’s necessary to hike again if inflation were to rebound.
On the Loonie front, the rise of crude oil prices continues to underpin the commodity-linked Canadian Dollar (CAD), as Canada is the major crude oil exporter to the United States. On the downside, manufacturing activity in Canada remained weak in June, with the Canadian S&P Global Manufacturing PMI standing at 49.3 in June. This figure came in weaker than the market estimation of 50.2, the 14th straight month of contraction, and the longest run in records dating back to October 2010.
Canadian Dollar FAQs
The key factors driving the Canadian Dollar (CAD) are the level of interest rates set by the Bank of Canada (BoC), the price of Oil, Canada’s largest export, the health of its economy, inflation and the Trade Balance, which is the difference between the value of Canada’s exports versus its imports. Other factors include market sentiment – whether investors are taking on more risky assets (risk-on) or seeking safe-havens (risk-off) – with risk-on being CAD-positive. As its largest trading partner, the health of the US economy is also a key factor influencing the Canadian Dollar.
The Bank of Canada (BoC) has a significant influence on the Canadian Dollar by setting the level of interest rates that banks can lend to one another. This influences the level of interest rates for everyone. The main goal of the BoC is to maintain inflation at 1-3% by adjusting interest rates up or down. Relatively higher interest rates tend to be positive for the CAD. The Bank of Canada can also use quantitative easing and tightening to influence credit conditions, with the former CAD-negative and the latter CAD-positive.
The price of Oil is a key factor impacting the value of the Canadian Dollar. Petroleum is Canada’s biggest export, so Oil price tends to have an immediate impact on the CAD value. Generally, if Oil price rises CAD also goes up, as aggregate demand for the currency increases. The opposite is the case if the price of Oil falls. Higher Oil prices also tend to result in a greater likelihood of a positive Trade Balance, which is also supportive of the CAD.
While inflation had always traditionally been thought of as a negative factor for a currency since it lowers the value of money, the opposite has actually been the case in modern times with the relaxation of cross-border capital controls. Higher inflation tends to lead central banks to put up interest rates which attracts more capital inflows from global investors seeking a lucrative place to keep their money. This increases demand for the local currency, which in Canada’s case is the Canadian Dollar.
Macroeconomic data releases gauge the health of the economy and can have an impact on the Canadian Dollar. Indicators such as GDP, Manufacturing and Services PMIs, employment, and consumer sentiment surveys can all influence the direction of the CAD. A strong economy is good for the Canadian Dollar. Not only does it attract more foreign investment but it may encourage the Bank of Canada to put up interest rates, leading to a stronger currency. If economic data is weak, however, the CAD is likely to fall.
- GBP/JPY gains further ground, chalks in a 13-day win streak.
- UK PMI figures improved slightly in June, bolstering GBP.
- UK elections on Thursday to introduce some volatility.
GBP/JPY rose to yet another fresh 16-year high on Wednesday, crossing the 206.00 handle after extending recent gains into a 13-trading-day winning streak. The Japanese Yen (JPY) continues to flounder at the bottom of the Bank of Japan’s (BoJ) hyper easy monetary policy stance. Still, the UK’s upcoming Parliamentary Elections on Thursday could spark fresh volatility in GBP pairs.
The BoJ remains bitterly entrenched in an extremely loose monetary policy stance, and the wide rate differential between the Yen and other major currencies has left the JPY to swirl the drain and steadily decline against broader markets. Despite a steady stream of cautionary statements from Japanese policymakers, Yen action remains firmly one-sided.
The UK’s upcoming Parliamentary Election could introduce a fresh round of volatility into the Pound Sterling on Thursday. The UK’s Labour Party is broadly expected to sweep into a majority government, overturning 14 years of Conservative party leadership. According to the most recent batch of mega polls released on Wednesday, Labour is expected to utterly devastate the Tories, and Labour’s Keir Starmer is expected to replace the Conservative Prime Minister Rishi Sunak. Labour is projected to win 431 seats compared to the Tories' projected win of just 102 according to polling by YouGov.
GBP/JPY technical outlook
Bullish momentum has accelerated further in the Guppy, dragging the pair over the 206.00 handle on Wednesday and chalking in a thirteenth consecutive trading day ending in the green.
GBP/JPY is up 13.3% from 2024’s early low bids near 178.75, trading deep into bull country above the 200-day Exponential Moving Average (EMA) at 190.65.
GBP/JPY hourly chart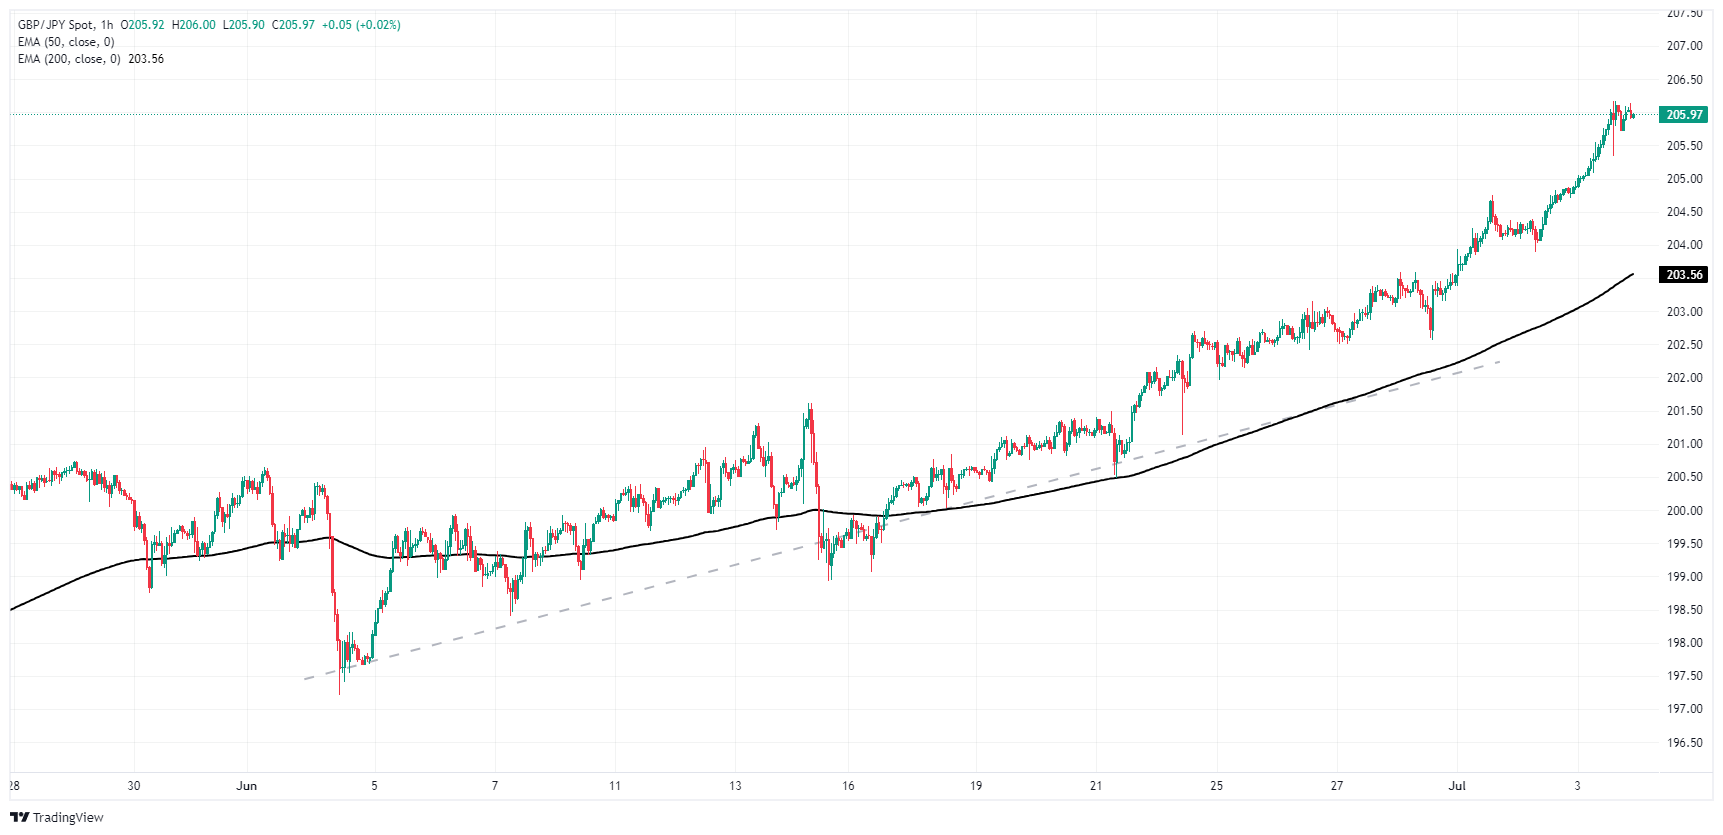
GBP/JPY daily chart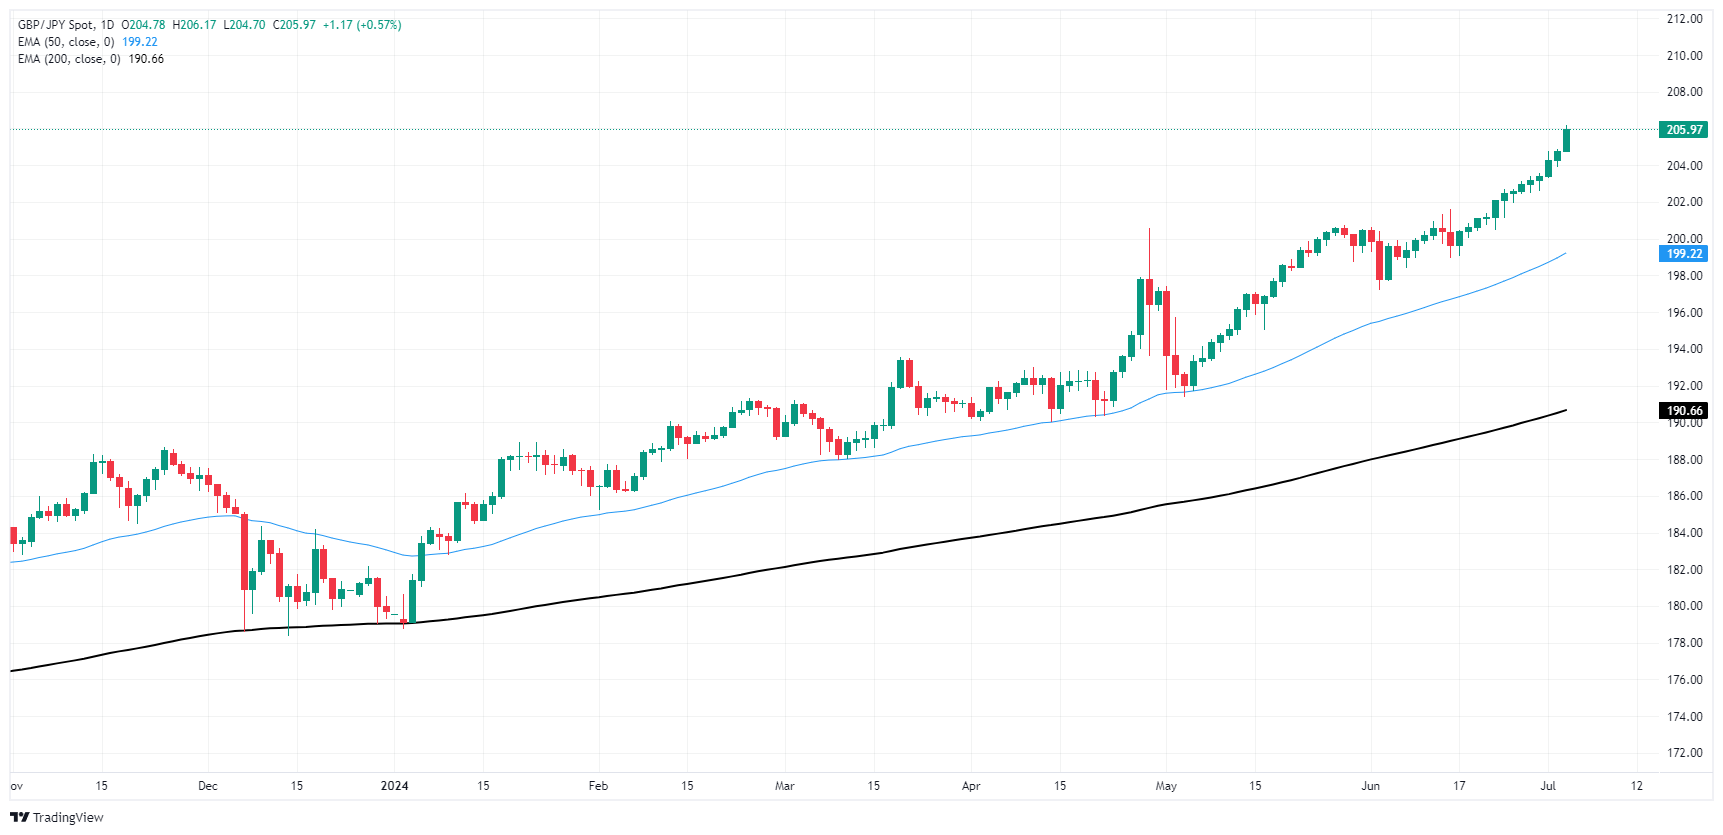
Pound Sterling FAQs
The Pound Sterling (GBP) is the oldest currency in the world (886 AD) and the official currency of the United Kingdom. It is the fourth most traded unit for foreign exchange (FX) in the world, accounting for 12% of all transactions, averaging $630 billion a day, according to 2022 data. Its key trading pairs are GBP/USD, aka ‘Cable’, which accounts for 11% of FX, GBP/JPY, or the ‘Dragon’ as it is known by traders (3%), and EUR/GBP (2%). The Pound Sterling is issued by the Bank of England (BoE).
The single most important factor influencing the value of the Pound Sterling is monetary policy decided by the Bank of England. The BoE bases its decisions on whether it has achieved its primary goal of “price stability” – a steady inflation rate of around 2%. Its primary tool for achieving this is the adjustment of interest rates. When inflation is too high, the BoE will try to rein it in by raising interest rates, making it more expensive for people and businesses to access credit. This is generally positive for GBP, as higher interest rates make the UK a more attractive place for global investors to park their money. When inflation falls too low it is a sign economic growth is slowing. In this scenario, the BoE will consider lowering interest rates to cheapen credit so businesses will borrow more to invest in growth-generating projects.
Data releases gauge the health of the economy and can impact the value of the Pound Sterling. Indicators such as GDP, Manufacturing and Services PMIs, and employment can all influence the direction of the GBP. A strong economy is good for Sterling. Not only does it attract more foreign investment but it may encourage the BoE to put up interest rates, which will directly strengthen GBP. Otherwise, if economic data is weak, the Pound Sterling is likely to fall.
Another significant data release for the Pound Sterling is the Trade Balance. This indicator measures the difference between what a country earns from its exports and what it spends on imports over a given period. If a country produces highly sought-after exports, its currency will benefit purely from the extra demand created from foreign buyers seeking to purchase these goods. Therefore, a positive net Trade Balance strengthens a currency and vice versa for a negative balance.
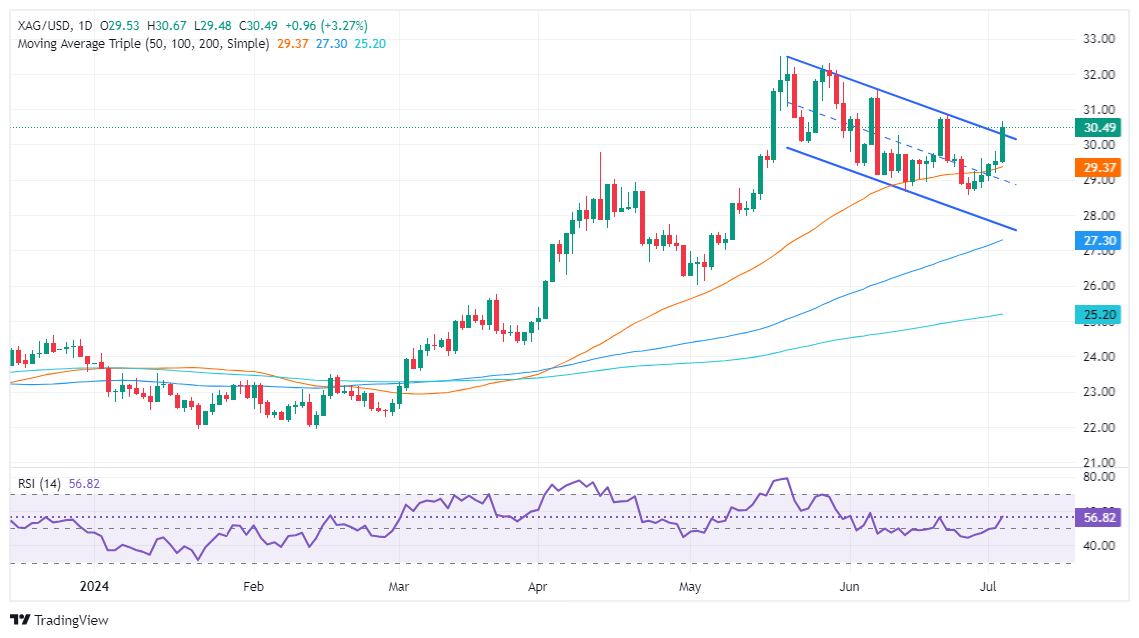
- Silver climbs to $30.66, an eight-day peak, surpassing the $30.00 resistance.
- Technicals indicate a strong upward trend, with XAG/USD exiting a descending channel.
- Resistance levels: $30.84 (June 21 high), $32.51 (YTD high).
- Support points: $30.00, $29.48 (July 3 low), $29.00, $28.57 (June 26 low), $27.59 (April 15 low).
Silver price surged on Wednesday and, on its way north, cleared the key resistance trendline seen passing at around $30.00, which underpinned the grey metal to an eight-day high of $30.66. As the Asian session begins, the XAG/USD trades at $30.44, virtually unchanged.
XAG/USD Price Analysis: Technical outlook
Silver's upward trend is still in place, with the non-yielding metal clearing the top of a descending channel, which opens the door for further upside. Buyers remain hopeful that the 'double bottom' chart pattern will be confirmed as they eye the next possible upside target at $30.84, the June 21 cycle high. Once hurdle, up next would be the year-to-date (YTD) high of $32.51.
On the downside, if XAG/USD drops below $30.00, the next support level would be the July 3 low of $29.48, ahead of $29.00. Further losses are seen once Silver clears the June 26 low at $28.57. Falling below this level could lead to a decline towards the April 15 swing low of $27.59.
XAG/USD Price Action – Daily Chart
Silver FAQs
Silver is a precious metal highly traded among investors. It has been historically used as a store of value and a medium of exchange. Although less popular than Gold, traders may turn to Silver to diversify their investment portfolio, for its intrinsic value or as a potential hedge during high-inflation periods. Investors can buy physical Silver, in coins or in bars, or trade it through vehicles such as Exchange Traded Funds, which track its price on international markets.
Silver prices can move due to a wide range of factors. Geopolitical instability or fears of a deep recession can make Silver price escalate due to its safe-haven status, although to a lesser extent than Gold's. As a yieldless asset, Silver tends to rise with lower interest rates. Its moves also depend on how the US Dollar (USD) behaves as the asset is priced in dollars (XAG/USD). A strong Dollar tends to keep the price of Silver at bay, whereas a weaker Dollar is likely to propel prices up. Other factors such as investment demand, mining supply – Silver is much more abundant than Gold – and recycling rates can also affect prices.
Silver is widely used in industry, particularly in sectors such as electronics or solar energy, as it has one of the highest electric conductivity of all metals – more than Copper and Gold. A surge in demand can increase prices, while a decline tends to lower them. Dynamics in the US, Chinese and Indian economies can also contribute to price swings: for the US and particularly China, their big industrial sectors use Silver in various processes; in India, consumers’ demand for the precious metal for jewellery also plays a key role in setting prices.
Silver prices tend to follow Gold's moves. When Gold prices rise, Silver typically follows suit, as their status as safe-haven assets is similar. The Gold/Silver ratio, which shows the number of ounces of Silver needed to equal the value of one ounce of Gold, may help to determine the relative valuation between both metals. Some investors may consider a high ratio as an indicator that Silver is undervalued, or Gold is overvalued. On the contrary, a low ratio might suggest that Gold is undervalued relative to Silver.
- NZD/USD bounced off from the critical 100 and 200-day SMA convergence at 0.6070.
- The Kiwi's outlook tilts positive as the pair tests the pivotal 20-day SMA level.
On Wednesday, the NZD/USD witnessed a gain of 0.50%, as markets turned their back on the USD. Now testing the important 20-day Simple Moving Average (SMA) threshold at 0.6125, the pair rebounded off the crucial convergence of the 100 and 200-day Simple Moving Averages (SMAs) at 0.6070 mark. The pair's future course now hinges on whether the currency pair manages to conquer the mentioned 20-day SMA.
Regarding the daily technical indicators, the Relative Strength Index (RSI), now resting at 50, portrays an improvement in bullish momentum. However, it has further ground to gain to confirm a bullish bias. The Moving Average Convergence Divergence (MACD) continues to print decreasing red bars, depicting a neutral to bearish stance, but overall positive as bears lose strength.
NZD/USD daily chart
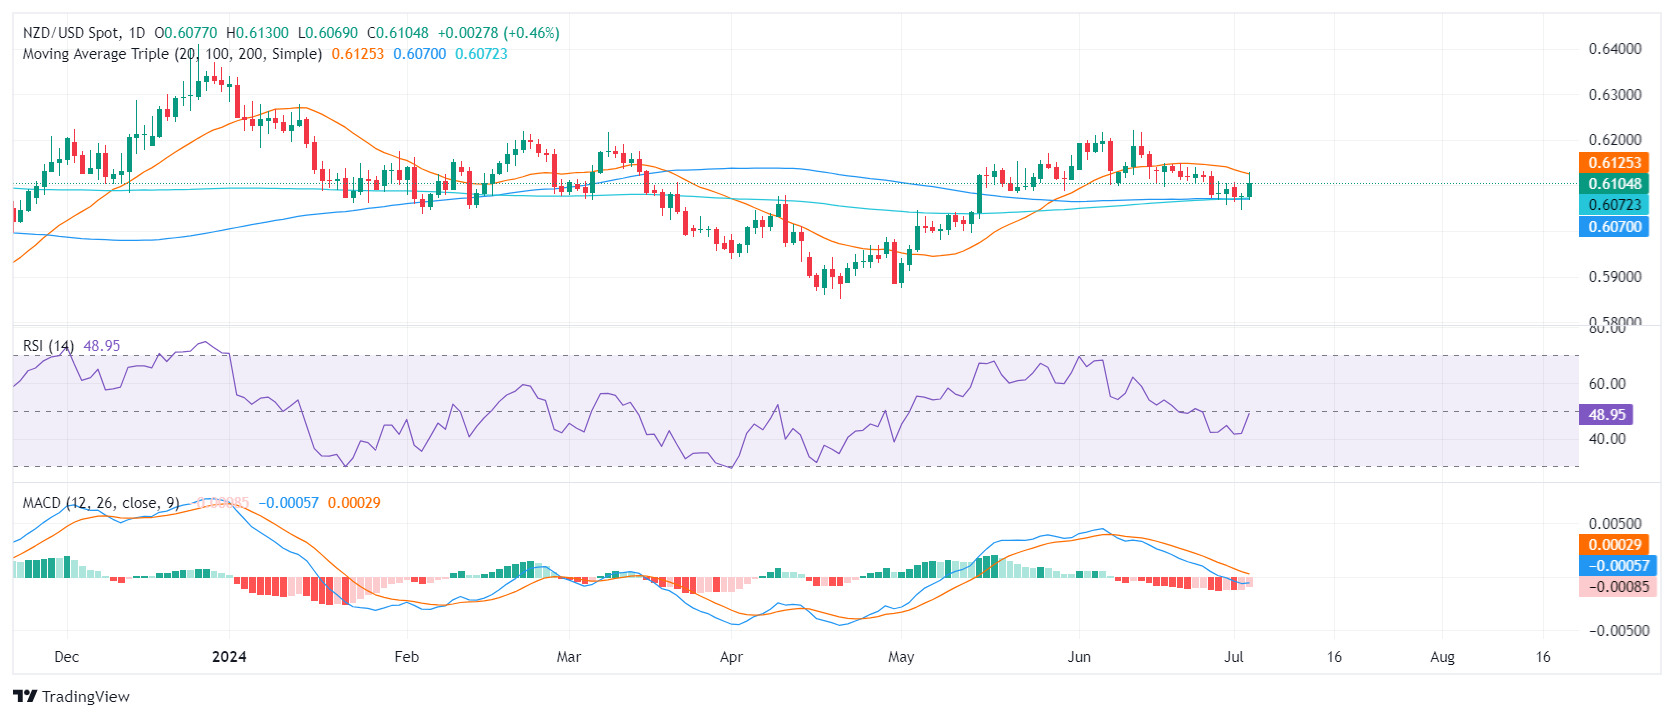
The NZD/USD establishes immediate support near the 0.6070 threshold, aligned with the mentioned convergence point of the 100 and 200-day SMAs. Therefore, if the sellers manage to drive the price below it, it could enhance selling pressure and indicate a deeper retracement. Further support resides at the 0.6050 level.
On the flip side, resistance currently hovers around the 20-day SMA at 0.6125 level. If the buyers manage to navigate through, additional resistance lies at the 0.6170 mark, followed by a significant barrier at 0.6200. A decisive break above these resistance levels could end the bearish dominance and steer the pair into bullish territory.
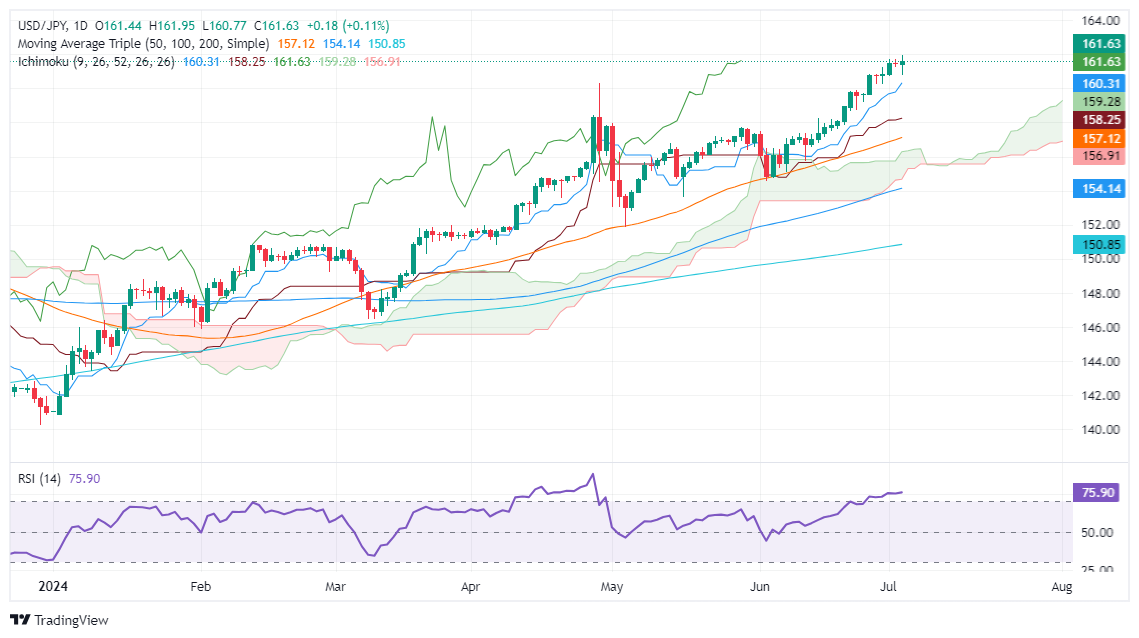
- USD/JPY climbs 0.14%, rebounding from a low of 160.77.
- Resistance levels: 161.95 (July 3 high), 162.00, 164.87 (Nov 1986 high).
- Support levels: 161.00, 160.35 (Tenkan-Sen), 159.30 (Senkou Span A), 158.25 (Kijun-Sen).
The USD/JPY pair finished Wednesday's session with minuscule gains of 0.14% after dipping to a daily low of 160.77, sponsored by traders increasing bets that the Federal Reserve might cut rates in 2024, following dismal data revealed during the day. At the time of writing, the major trades at 161.62.
USD/JPY Price Analysis: Technical outlook
The uptrend remains intact in the USD/JPY pair amid increasing risks that Japanese authorities or the Bank of Japan could intervene in the FX markets. The major continues to advance steadily and trades at multi-year highs, with buyers eyeing a test of the 162.00 psychological level.
Momentum remains on the buyers' side, as depicted by the Relative Strength Index (RSI), which has turned overbought, but it doesn’t show signs of aiming lower. That said, the path of least resistance is skewed to the upside.
Resistance lies at the July 3 high of 161.95. Once cleared, the next stop would be 162.00, ahead of the challenging November 1986 high of 164.87. On further USD/JPY weakness, the first support would be 161.00, immediately followed by the Tenkan-Sen at 160.35. A breach of the latter can exacerbate a pullback toward the Senkou Span A at 159.30, followed by the Kijun-Sen at 158.25.
USD/JPY Price Action – Daily Chart
Japanese Yen FAQs
The Japanese Yen (JPY) is one of the world’s most traded currencies. Its value is broadly determined by the performance of the Japanese economy, but more specifically by the Bank of Japan’s policy, the differential between Japanese and US bond yields, or risk sentiment among traders, among other factors.
One of the Bank of Japan’s mandates is currency control, so its moves are key for the Yen. The BoJ has directly intervened in currency markets sometimes, generally to lower the value of the Yen, although it refrains from doing it often due to political concerns of its main trading partners. The current BoJ ultra-loose monetary policy, based on massive stimulus to the economy, has caused the Yen to depreciate against its main currency peers. This process has exacerbated more recently due to an increasing policy divergence between the Bank of Japan and other main central banks, which have opted to increase interest rates sharply to fight decades-high levels of inflation.
The BoJ’s stance of sticking to ultra-loose monetary policy has led to a widening policy divergence with other central banks, particularly with the US Federal Reserve. This supports a widening of the differential between the 10-year US and Japanese bonds, which favors the US Dollar against the Japanese Yen.
The Japanese Yen is often seen as a safe-haven investment. This means that in times of market stress, investors are more likely to put their money in the Japanese currency due to its supposed reliability and stability. Turbulent times are likely to strengthen the Yen’s value against other currencies seen as more risky to invest in.
- NZD/JPY resumes its bullish trend, surpassing 98.00 mark and hitting new cycle highs.
- Immediate supports identified at 97.50 and 97.00 markers represented by 20-day SMA in case of potential corrections.
- As the pair rides uncharted terrain it might test the 99.00-100.00 range.
On Wednesday, the NZD/JPY pair resumed its upward trajectory, an extension of the bullish trend noted in the previous week. Even as a strong bullish drive emerges as the predominant force, there is caution regarding a potential correction as indicators reflect overbought conditions. In the session, the pair rose by 0.60% to reach 98.70, a fresh cycle high.
In terms of the daily chart's analysis, the Relative Strength Index (RSI) has increased, now sitting in overbought territory at a reading of 75, up from Tuesday's reading of 68. This points to increasing market momentum. However, this climb incurs the risk of a potential pullback given these heightened overbought conditions. The Moving Average Convergence Divergence (MACD) presents green bars, also adding arguments to the overextended movements.
NZD/JPY daily chart
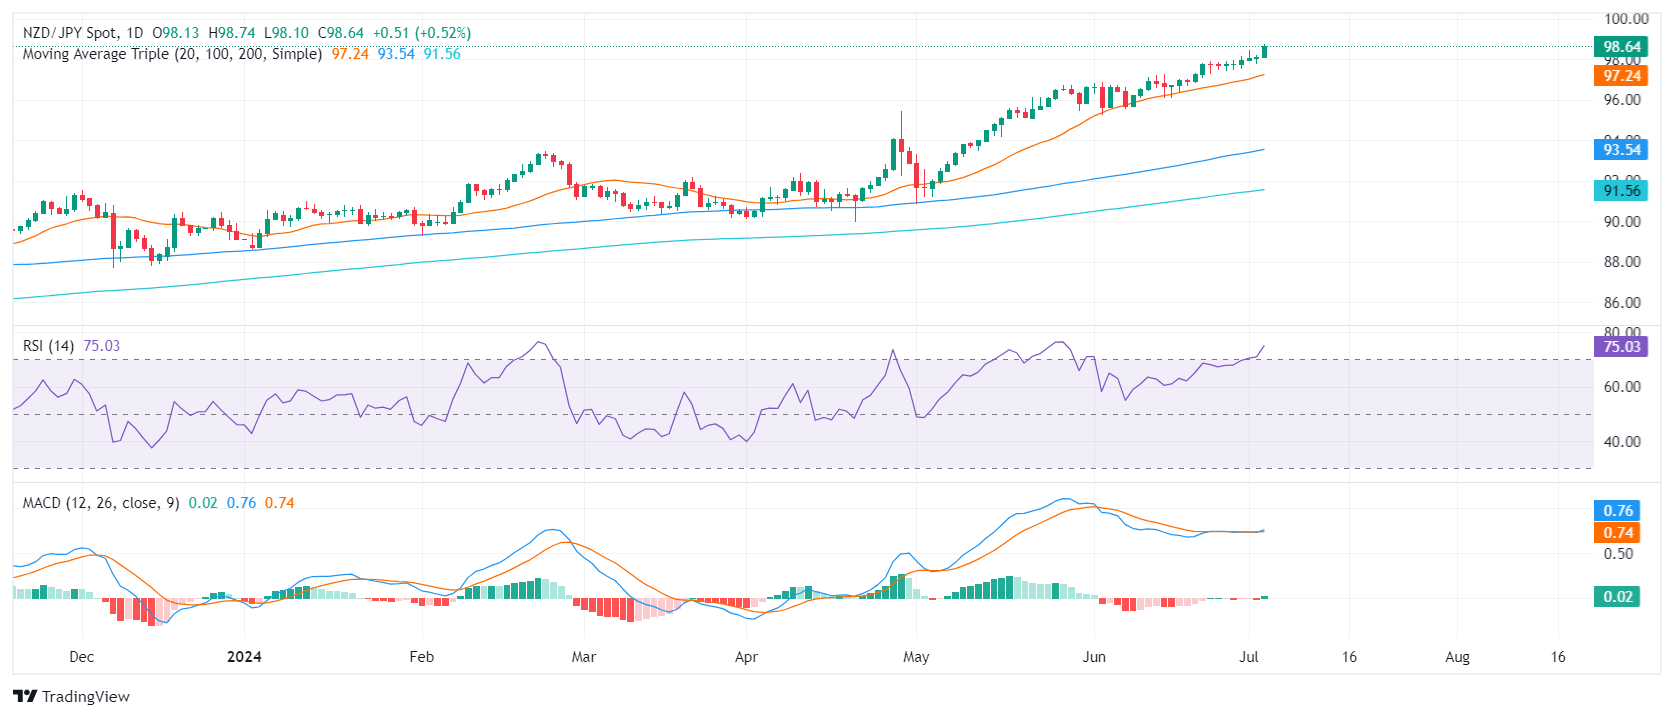 Looking ahead, it is anticipated that the pair may sustain its upward trajectory, remaining above the 20-day, 100-day, and 200-day Simple Moving Averages (SMA), suggesting ongoing bullish momentum. However, there might be possible corrections due to current overbought situations.
Immediate support in case of a downward correction is now speculated around the 97.50 and 97.00 markers, represented by the 20-day SMA. Buyers should concentrate on maintaining these levels prior to reaching newer peaks. Potential for advancements around 98.80, 99.00, and even 100.00 windows are within sight, following a successful defense of the 97.00 level.
- US 10-year Treasury yield falls eight basis points sponsored by weak US economic data.
- FOMC minutes note economic slowdown, open door for rate cuts if inflation approaches 2% target.
- Significant ISM Services PMI drop to 48.8, and a decrease in ADP Employment Change pushed yields down.
- Initial Jobless Claims increase to 238K, exceeding forecasts and previous readings.
US Treasury bond yields sank on Wednesday after data from the United States increased the chances of the Federal Reserve easing policy as soon as September, according to the CME FedWatch Tool. Labor market data and weak Services PMI drove the US bonds rally and weighed on yields. The US 10-year benchmark note rate dropped almost eight basis points on Wednesday, down to 4.355%.
US 10-year benchmark note rate tanks amid rising expectations of a September rate cut following weak data
The latest FOMC minutes revealed that officials acknowledged the economy seems to be slowing, yet stated that if the disinflation process stalls, they would not hesitate to raise the fed funds rate. Policymakers added that the current policy is restrictive and mentioned they could ease policy once they're confident that inflation is headed toward its 2% goal.
In terms of data, US business activity in the services sector contracted after reaching its highest level since August 2023, according to the Institute for Supply Management (ISM). The ISM Services PMI for June dropped sharply to 48.8, its lowest since May 2020 and the fastest decline in four years, signaling recessionary conditions
This, along with a weaker ADP Employment Change report for June coming at 150K and missing estimates and the previous month’s data, could be a prelude to Friday’s Nonfarm Payroll numbers. Meanwhile, Initial Jobless Claims for the week ending June 29 rose to 238K, surpassing estimates of 235K and the previous reading of 234K.
According to the CME FedWatch Tool, odds for a 25-basis-point Fed rate cut in September are at 66%, up from 63% on Tuesday. Data from the Chicago Board of Trade (CBOT) shows that traders expect 38 basis points (bps) of easing, according to December’s 2024 fed funds rate futures contract.
Interest rates FAQs
Interest rates are charged by financial institutions on loans to borrowers and are paid as interest to savers and depositors. They are influenced by base lending rates, which are set by central banks in response to changes in the economy. Central banks normally have a mandate to ensure price stability, which in most cases means targeting a core inflation rate of around 2%. If inflation falls below target the central bank may cut base lending rates, with a view to stimulating lending and boosting the economy. If inflation rises substantially above 2% it normally results in the central bank raising base lending rates in an attempt to lower inflation.
Higher interest rates generally help strengthen a country’s currency as they make it a more attractive place for global investors to park their money.
Higher interest rates overall weigh on the price of Gold because they increase the opportunity cost of holding Gold instead of investing in an interest-bearing asset or placing cash in the bank. If interest rates are high that usually pushes up the price of the US Dollar (USD), and since Gold is priced in Dollars, this has the effect of lowering the price of Gold.
The Fed funds rate is the overnight rate at which US banks lend to each other. It is the oft-quoted headline rate set by the Federal Reserve at its FOMC meetings. It is set as a range, for example 4.75%-5.00%, though the upper limit (in that case 5.00%) is the quoted figure. Market expectations for future Fed funds rate are tracked by the CME FedWatch tool, which shapes how many financial markets behave in anticipation of future Federal Reserve monetary policy decisions.
- Crude Oil markets rebound after EIA reports a significant drawdown in US stocks.
- WTI still remains below the early week’s peaks.
- Geopolitical concerns continue to add a risk premium to energies.
West Texas Intermediate (WTI) US Crude Oil bounced into the high end on Wednesday, climbing back towards $83.50 per barrel after an early dip back to $82.00. The Energy Information Administration (EIA) posted a much larger week-on-week drawdown in US Crude Oil reserves, sparking a risk rally despite an initial plunge following worse-than-expected economic figures from the US.
According to the EIA, US Crude Oil Stocks Change for the week ended June 28 contracted sharply by -12.157 million barrels, well below the forecast drawdown of -150K and entirely engulfing the previous week’s 3.591 million barrel buildup. The EIA also noted similar, albeit smaller, drawdowns in gasoline and distillate inventories over the same period.
Crude Oil markets initially balked on Wednesday before an EIA-fueled rally, with WTI backsliding to $81.00 per barrel after the US reported a broad miss in key economic figures. ADP Employment Change eased to 150K from the previous 157K, Initial Jobless Claims ticked up to 238K for the week ended June 28 from 233K, and June’s USM Services Purchasing Managers Index (PMI) tumbled to a multi-year low of 48.8 compared to the previous month’s 53.8.
The ongoing Israel-Palestinian Hamas conflict continues to broil in the Middle East, keeping a firm risk bid underpinning Crude Oil prices as energy traders hold onto fears that a destabilization of the situation would see the conflict spill over into neighboring countries, specifically drawing Iran directly into matters.
Economic Indicator
EIA Crude Oil Stocks Change
The EIA Crude Oil stockpiles report is a weekly measure of the change in the number of barrels in stock of crude oil and its derivates, and it's released by the Energy Information Administration. This report tends to generate large price volatility, as oil prices impact on worldwide economies, affecting the most, commodity related currencies such as the Canadian dollar. Despite it has a limited impact among currencies, this report tends to affect the price of oil itself, and, therefore, had a more notorious impact on WTI crude futures.
Read more.Last release: Wed Jul 03, 2024 14:30
Frequency: Weekly
Actual: -12.157M
Consensus: -0.15M
Previous: 3.591M
WTI technical outlook
Despite a bullish push on Wednesday, WTI trades south of the early week’s peak bids near $83.75 and found a fresh technical floor at the $82.00 handle. However, intraday price action is still holding just north of the 200-hour Exponential Moving Average (EMA) at $81.55.
After a bullish breakout from a rough near-term consolidation phase, WTI is leaning steeper into a bull run, but momentum remains thin and could see Crude Oil backslide into the 200-day EMA rising above the $74.00 handle.
WTI hourly chart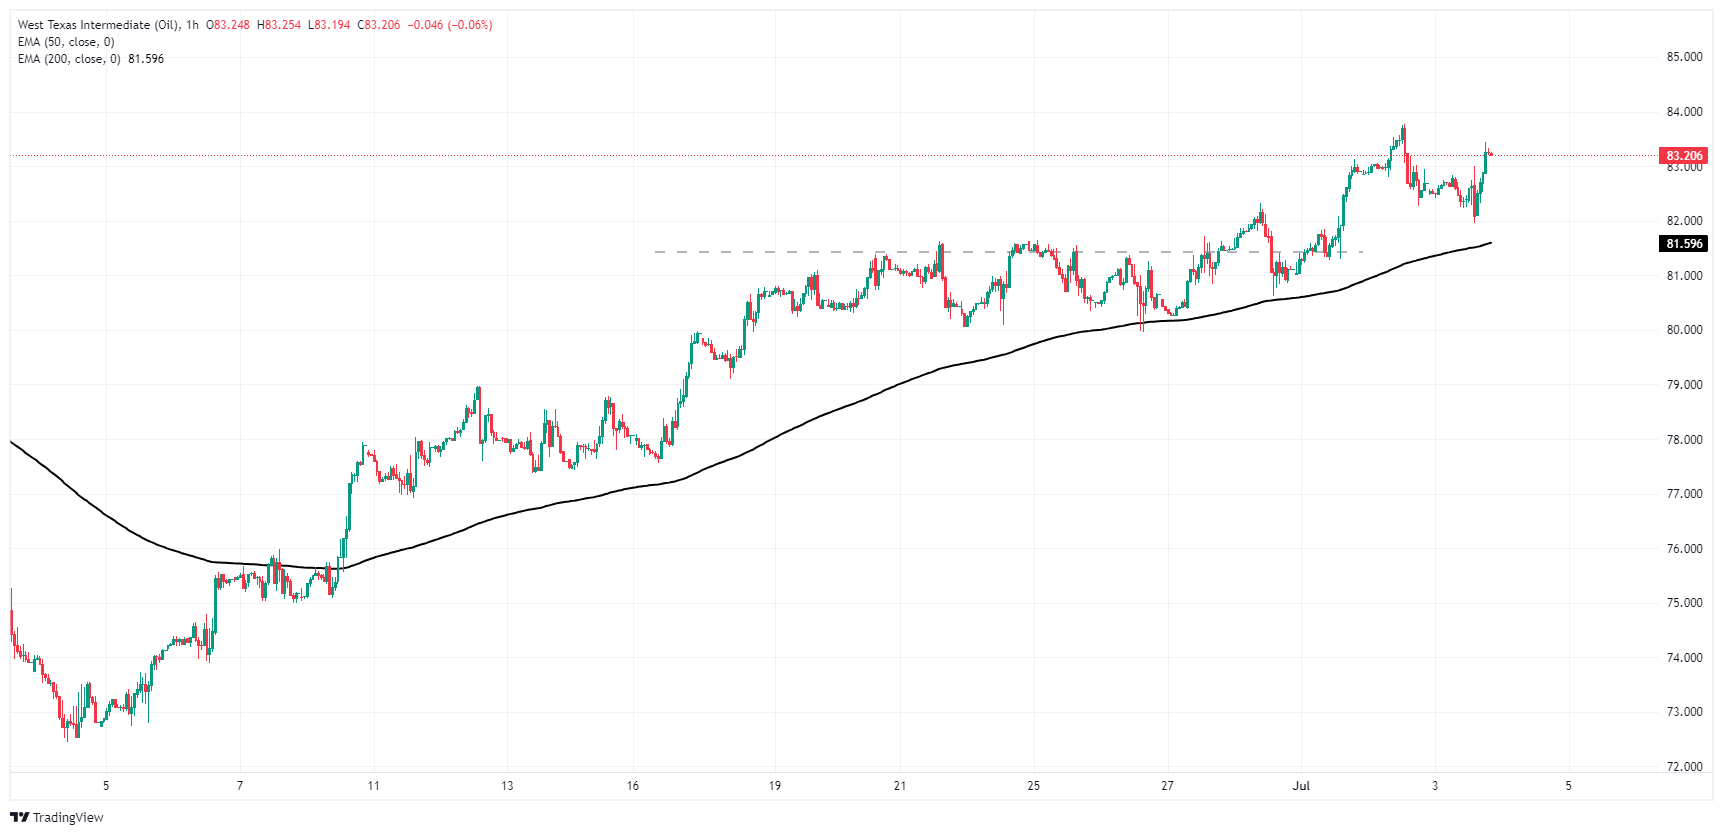
WTI daily chart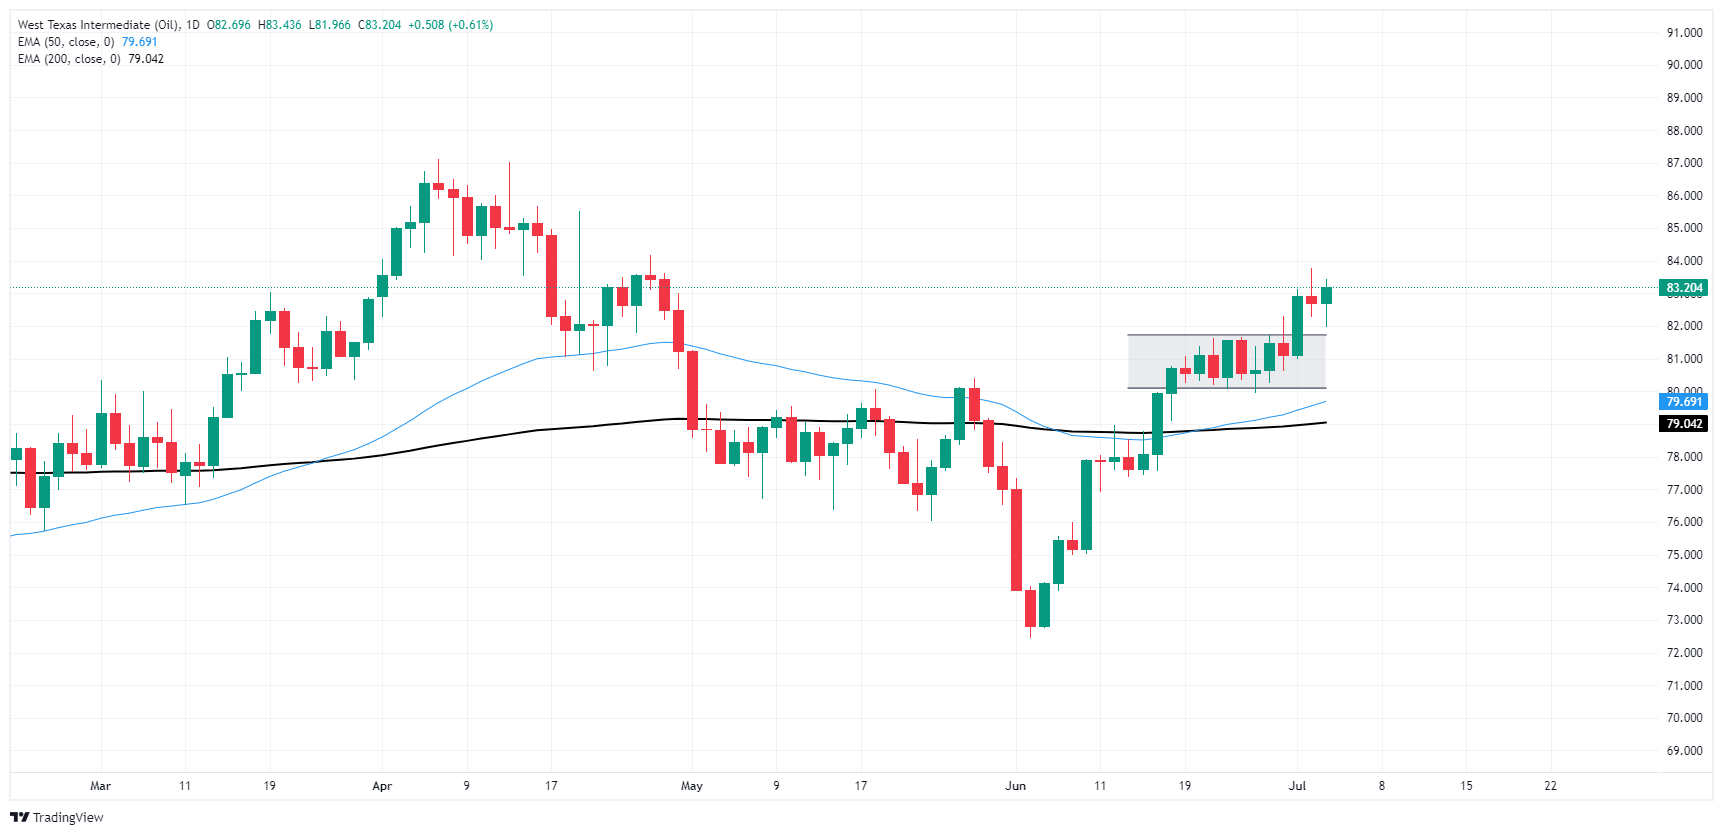
WTI Oil FAQs
WTI Oil is a type of Crude Oil sold on international markets. The WTI stands for West Texas Intermediate, one of three major types including Brent and Dubai Crude. WTI is also referred to as “light” and “sweet” because of its relatively low gravity and sulfur content respectively. It is considered a high quality Oil that is easily refined. It is sourced in the United States and distributed via the Cushing hub, which is considered “The Pipeline Crossroads of the World”. It is a benchmark for the Oil market and WTI price is frequently quoted in the media.
Like all assets, supply and demand are the key drivers of WTI Oil price. As such, global growth can be a driver of increased demand and vice versa for weak global growth. Political instability, wars, and sanctions can disrupt supply and impact prices. The decisions of OPEC, a group of major Oil-producing countries, is another key driver of price. The value of the US Dollar influences the price of WTI Crude Oil, since Oil is predominantly traded in US Dollars, thus a weaker US Dollar can make Oil more affordable and vice versa.
The weekly Oil inventory reports published by the American Petroleum Institute (API) and the Energy Information Agency (EIA) impact the price of WTI Oil. Changes in inventories reflect fluctuating supply and demand. If the data shows a drop in inventories it can indicate increased demand, pushing up Oil price. Higher inventories can reflect increased supply, pushing down prices. API’s report is published every Tuesday and EIA’s the day after. Their results are usually similar, falling within 1% of each other 75% of the time. The EIA data is considered more reliable, since it is a government agency.
OPEC (Organization of the Petroleum Exporting Countries) is a group of 13 Oil-producing nations who collectively decide production quotas for member countries at twice-yearly meetings. Their decisions often impact WTI Oil prices. When OPEC decides to lower quotas, it can tighten supply, pushing up Oil prices. When OPEC increases production, it has the opposite effect. OPEC+ refers to an expanded group that includes ten extra non-OPEC members, the most notable of which is Russia.
- AUD/JPY strengthens its position, touching new peaks beyond 108.00.
- Overbought conditions could trigger a healthy correction, yet the outlook reveals a continuation of momentum.
In Wednesday's session, the AUD/JPY pair elongated its upward trajectory, reaching new high points around 108.40, hence beating its record once again after crossing its 2007 highs of around 107.30.
On a daily scale, the Relative Strength Index (RSI) for the AUDJPY settled at 80 and it concurrently flags the pair as overbought, which may provoke a downward correction. Parallely, the Moving Average Convergence Divergence (MACD) depicts growing green bars, signifying stubborn bullish momentum, although a correction seems likely given the overbought situation.
AUD/JPY daily chart
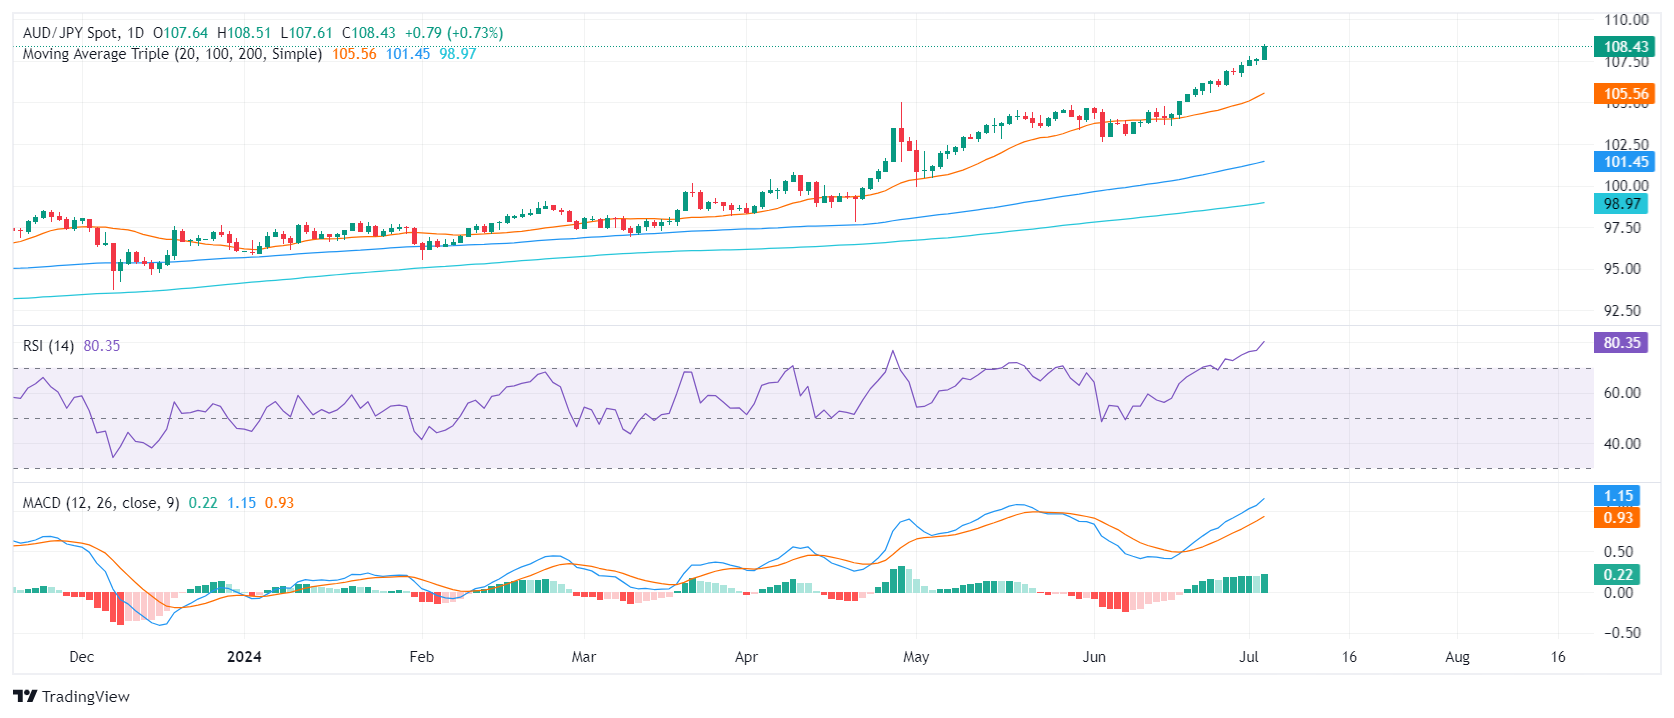
In the broader perspective, the AUD/JPY pair exhibits relentless bullish behaviors, fortified by its standing above the 20-day, 100-day, and 200-day Simple Moving Averages (SMAs). Should the pair face a correction pulling it beneath the 108.00 level, followed by the 107.00 mark, it could discover new support levels. Thus, the 104.90 (20-day SMA) level may act as another potential support line. Meanwhile, buyers will investigate unexplored grounds should the pair stay on its current course and surpass the 108.50 level.
- Gold climbs, spurred by weak US economic data and rising Fed rate cut expectations.
- FOMC Minutes: readiness to hike rates if inflation persists, but current policy seen as restrictive.
- ISM shows contracting US services activity; labor market data reveals higher unemployment claims, decreased private hiring.
- Attention turns to Friday's Nonfarm Payrolls, with US markets closed Thursday for Independence Day.
Gold price surged over 1% on Wednesday after softer-than-expected economic data from the United States increased bets that the Federal Reserve (Fed) could cut interest rates by September. In the meantime, the latest FOMC meeting minutes showed that “several participants” were ready to lift rates if inflation remained elevated. At the time of writing, XAU/USD trades at $2,356 above its opening price.
The Fed’s minutes showed that most participants estimated that the current policy is restrictive but had opened the door for rate increases. Policymakers acknowledged the economy is cooling and could react to unexpected economic weakness.
In addition, US business activity in the services sector contracted after hitting its highest level since August 2023, according to the Institute for Supply Management (ISM). This and weaker jobs data, as the number of Americans filing for unemployment benefits rose and private companies hired fewer workers than foreseen, sparked a repricing of Fed interest rate cuts.
Labor market data surprisingly came in softer following Tuesday’s stronger-than-expected JOLTS report. Trader focus shifts to Friday’s Nonfarm Payrolls (NFP) report as US markets will be closed on Thursday due to Independence Day.
Daily digest market movers: Gold shines and climbs on soft US data
- On Tuesday, Powell remarked that the disinflation process has resumed but emphasized the need for further progress before considering any interest rate cuts. He added, “Because the US economy is strong and the labor market is strong, we have the ability to take our time and get this right.”
- US jobs data for June, led by the ADP Employment Change, came in at 150K, missing estimates of 160K and down from May's 157K.
- US Initial Jobless Claims for the week ending June 29 rose to 238K, surpassing estimates of 235K and the previous reading of 234K.
- June's ISM Services PMI dropped sharply to 48.8, its lowest since May 2020 and the fastest decline in four years, signaling recessionary conditions.
- According to the CME FedWatch Tool, odds for a 25-basis-point Fed rate cut in September are at 66%, up from 63% on Tuesday.
- December 2024 fed funds rate futures contract implies that the Fed will ease policy by just 38 basis points (bps) toward the end of the year.
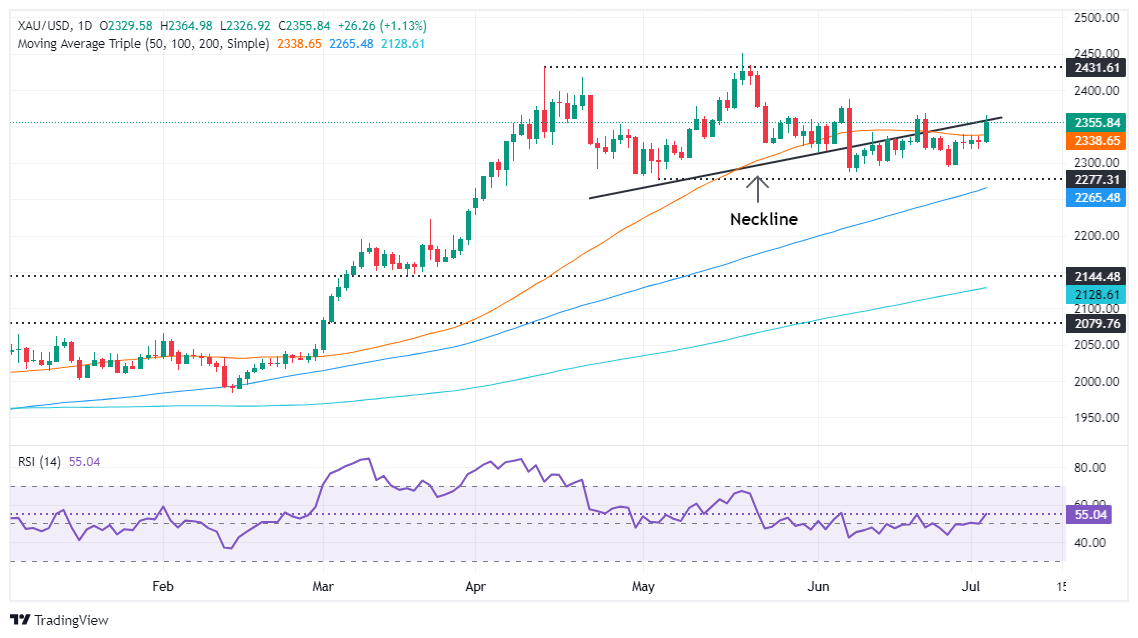
Technical analysis: Gold price fluctuates near Head-and-Shoulders neckline
The Gold price uptrend is set to continue and is testing the neckline of a Head-and-Shoulders chart pattern that has emerged since April 2024.
From a price action perspective, XAU/USD is downwardly biased in the near term, but the overall trend is bullish and is intact. This is further confirmed by momentum as the Relative Strength Index (RSI) is bullish.
If the Gold price clears the pattern’s neckline, that would sponsor a leg up to $2,400 and invalidate the Head-and-Shoulders chart structure. This would pave the way for further gains and expose the year-to-date high of $2,450.
Conversely, if sellers push the spot price below $2,350, further downside is seen near $2,300. If successful, the next demand zone would be the May 3 low of $2,277, followed by the March 21 high of $2,222.
Gold FAQs
Gold has played a key role in human’s history as it has been widely used as a store of value and medium of exchange. Currently, apart from its shine and usage for jewelry, the precious metal is widely seen as a safe-haven asset, meaning that it is considered a good investment during turbulent times. Gold is also widely seen as a hedge against inflation and against depreciating currencies as it doesn’t rely on any specific issuer or government.
Central banks are the biggest Gold holders. In their aim to support their currencies in turbulent times, central banks tend to diversify their reserves and buy Gold to improve the perceived strength of the economy and the currency. High Gold reserves can be a source of trust for a country’s solvency. Central banks added 1,136 tonnes of Gold worth around $70 billion to their reserves in 2022, according to data from the World Gold Council. This is the highest yearly purchase since records began. Central banks from emerging economies such as China, India and Turkey are quickly increasing their Gold reserves.
Gold has an inverse correlation with the US Dollar and US Treasuries, which are both major reserve and safe-haven assets. When the Dollar depreciates, Gold tends to rise, enabling investors and central banks to diversify their assets in turbulent times. Gold is also inversely correlated with risk assets. A rally in the stock market tends to weaken Gold price, while sell-offs in riskier markets tend to favor the precious metal.
The price can move due to a wide range of factors. Geopolitical instability or fears of a deep recession can quickly make Gold price escalate due to its safe-haven status. As a yield-less asset, Gold tends to rise with lower interest rates, while higher cost of money usually weighs down on the yellow metal. Still, most moves depend on how the US Dollar (USD) behaves as the asset is priced in dollars (XAU/USD). A strong Dollar tends to keep the price of Gold controlled, whereas a weaker Dollar is likely to push Gold prices up.
- AUD/USD bulls step in as the pair soars to multi-month highs.
- May's strong Retail Sales figures from Australia and weak US ADP data are driving the pair.
- FOMC Minutes reveal members admitting that price pressure is easing.
The Australian Dollar (AUD) soared against the USD to its highest level since January following the report of soft labor market figures from the US and strong Retail Sales data from Australia earlier in the session.
The Australian economy continues to show mixed signs. Nonetheless, persistent high inflation is causing the Reserve Bank of Australia (RBA) to postpone potential rate cuts. As one of the last G10 central banks to initiate rate reductions, this might somewhat extend the gains of the Aussie.
Updated daily market movers: Aussie soars on strong Retail Sales and soft ADPs from US
- Retail Sales figures for May from Australia showed a better-than-expected increase of 0.6% MoM compared to a 0.1% rise in April, boosted by early end-of-financial-year promotions and sales events.
- The market is now factoring in nearly 40% odds of a 25-basis-point rate hike on September 24, rising to roughly 50% for November 5, making these events key to monitoring.
- On Tuesday, Minutes from the June meeting provided a more nuanced perspective on the RBA's hold stance. A major reason for bank members favoring keeping the policy rate unchanged rather than implementing an increase was due to "uncertainty around the data for consumption and clear evidence that many households were experiencing financial stress."
- However, Minutes reflected that the bank left door open for a hike.
- On the US front, private sector employment in the US reported by ADP came in at 150K, lower than the 160K expected, and showed signs of a cooling labor market.
- Regarding Federal Reserve (Fed) expectations, markets are now more confident of a cut in September, betting on nearly 70% odds.
- FOMC Minutes from the June meeting give reasons for the market to hope as they showed that members are acknowledging a cooldown of inflation.
Technical analysis: AUD/USD finds momentum, outlook in favor of the bulls now
After the pair traded sideways since mid-May within the range of 0.6600-0.6700, the AUD/USD has soared above 0.6700 for the first time since January. Indicators including the Relative Strength Index (RSI) and Moving Average Convergence Divergence (MACD) leaped further in positive terrain.
On the downside, the 20-day Simple Moving Average (SMA) at 0.6640 provides firm support, with further backstop at levels 0.6620 and the psychological threshold of 0.6600. Resistance stands at 0.6730 and 0.6750.
Australian Dollar FAQs
One of the most significant factors for the Australian Dollar (AUD) is the level of interest rates set by the Reserve Bank of Australia (RBA). Because Australia is a resource-rich country another key driver is the price of its biggest export, Iron Ore. The health of the Chinese economy, its largest trading partner, is a factor, as well as inflation in Australia, its growth rate and Trade Balance. Market sentiment – whether investors are taking on more risky assets (risk-on) or seeking safe-havens (risk-off) – is also a factor, with risk-on positive for AUD.
The Reserve Bank of Australia (RBA) influences the Australian Dollar (AUD) by setting the level of interest rates that Australian banks can lend to each other. This influences the level of interest rates in the economy as a whole. The main goal of the RBA is to maintain a stable inflation rate of 2-3% by adjusting interest rates up or down. Relatively high interest rates compared to other major central banks support the AUD, and the opposite for relatively low. The RBA can also use quantitative easing and tightening to influence credit conditions, with the former AUD-negative and the latter AUD-positive.
China is Australia’s largest trading partner so the health of the Chinese economy is a major influence on the value of the Australian Dollar (AUD). When the Chinese economy is doing well it purchases more raw materials, goods and services from Australia, lifting demand for the AUD, and pushing up its value. The opposite is the case when the Chinese economy is not growing as fast as expected. Positive or negative surprises in Chinese growth data, therefore, often have a direct impact on the Australian Dollar and its pairs.
Iron Ore is Australia’s largest export, accounting for $118 billion a year according to data from 2021, with China as its primary destination. The price of Iron Ore, therefore, can be a driver of the Australian Dollar. Generally, if the price of Iron Ore rises, AUD also goes up, as aggregate demand for the currency increases. The opposite is the case if the price of Iron Ore falls. Higher Iron Ore prices also tend to result in a greater likelihood of a positive Trade Balance for Australia, which is also positive of the AUD.
The Trade Balance, which is the difference between what a country earns from its exports versus what it pays for its imports, is another factor that can influence the value of the Australian Dollar. If Australia produces highly sought after exports, then its currency will gain in value purely from the surplus demand created from foreign buyers seeking to purchase its exports versus what it spends to purchase imports. Therefore, a positive net Trade Balance strengthens the AUD, with the opposite effect if the Trade Balance is negative.
Another data-driven sell-off motivated the Greenback to recede to multi-day lows amidst declining US yields across the board and ahead of the Independence Day holiday on July 4. In addition, markets are expected to closely follow the UK general elections amidst the run-up to the French second round next weekend.
Here is what you need to know on Thursday, July 4:
The USD Index (DXY) accelerated its decline on the back of poor prints from the US docket and ahead of the Independence Day holiday on Thursday.
EUR/USD finally surpassed the 1.0800 barrier amidst extra weakness in the Greenback. On July 4, the ECB will publish its Accounts of the June meeting.
GBP/USD continued to outperform its risk-linked peers and rose to three-week highs well north of 1.2700 the figure. All the attention is expected to be on the UK general elections on July 4, where the Labour party is seen achieving a significant victory. In the docket, the S&P Global Construction PMI is due along with New Car Sales.
USD/JPY remained in the upper end of the recent range and near multi-decade tops in the boundaries of 162.00. The usual weekly Foreign Bond Investment figures are only due on July 4.
A sharp rebound saw AUD/USD finally breaking above the key 0.6700 hurdle on the back of positive domestic data and further selling pressure in the US Dollar. The Balance of Trade results will be published on July 4.
WTI prices resumed their uptrend on the back of a bullish weekly report from the EIA, prospects of higher demand and a weaker dollar.
Gold prices climbed to multi-session tops and flirted with the $2,365 mark per ounce troy, backed by selling pressure in the Greenback, lower US yields, and expectations of interest rate cuts. By the same token, Silver rallied more than 3% to surpass the key $30.00 mark per ounce and revisit multi-day peaks.
- Dow Jones churns close to flat on Wednesday as index gets left out of bull run.
- Dow Jones struggles as other US equity indexes climb into fresh record highs.
- US data broadly softened, sparking a risk rally on heightened rate cut hopes.
The Dow Jones Industrial Average (DJIA) failed to capitalize on a broad-market uptick in risk appetite on Wednesday. Other US equity indexes climbed into fresh all-time highs, but the DJIA floundered close to the day’s opening bids.
US data broadly softened on Wednesday, sparking a lopsided bull run in market sentiment after easing economic figures helped to bolster rate cut hopes back into the high end. US ADP Employment Change in June fell to 150K compared to the forecast increase to 160K from the previous month’s revised 157K. Looking into the finer details of ADP’s employment report, further softness is found; the overwhelming majority of job gains for the period were in lower-paying leisure and hospitality positions.
US Initial Jobless Claims also ticked higher to 238K for the week ended June 28, rising from the previous 233K and bolstering the four-week average to 238.5K. The June ISM Services Purchasing Managers Index (PMI) activity survey also eased, falling to a multi-year low of 48.8. This is the indicator’s lowest reading since June of 2020, and entirely missed the forecast decline to 52.5 from the previous 55.1.
Read more: FOMC Minutes left the door open to rate hikes if inflation picks up pace
The Federal Reserve (Fed) continues to lean firmly into a cautious tone on monetary policy, and the Federal Open Market Committee’s (FOMC) latest Meeting Minutes showed that the US central bank continues to urge caution on declaring victory over inflation. However, policymakers have nodded the head toward improving price growth figures recently, and the FOMC’s internal discussions noted a slowing in US economic data.
Dow Jones news
The Dow Jones is entirely mixed on Wednesday, with half of the index’s constituent securities in the red on an otherwise risk-on trading day. Losses are being led by Unitedhealth Group Inc. (UNH), which fell below $490.00 per share, declining -1.68%. On the high side, Salesforce Inc. (CRM) is testing $261.00 per share, gaining 1.86% on Wednesday and climbing nearly five points.
Dow Jones technical outlook
The Dow Jones Industrial Average continues to churn in familiar middle ground, cycling in a rough consolidation range just above 39,000.00. The index briefly recovered into a near-term high above 39,500.00 early last week, but bidders have run out of gas.
Daily candlesticks find technical support from the 50-day Exponential Moving Average (EMA) at 38,936.00, but topside momentum remains thin as the Dow Jones treads water on the high end of a near-term recovery from May’s sharp correction into 38,000.00.
Dow Jones five minute chart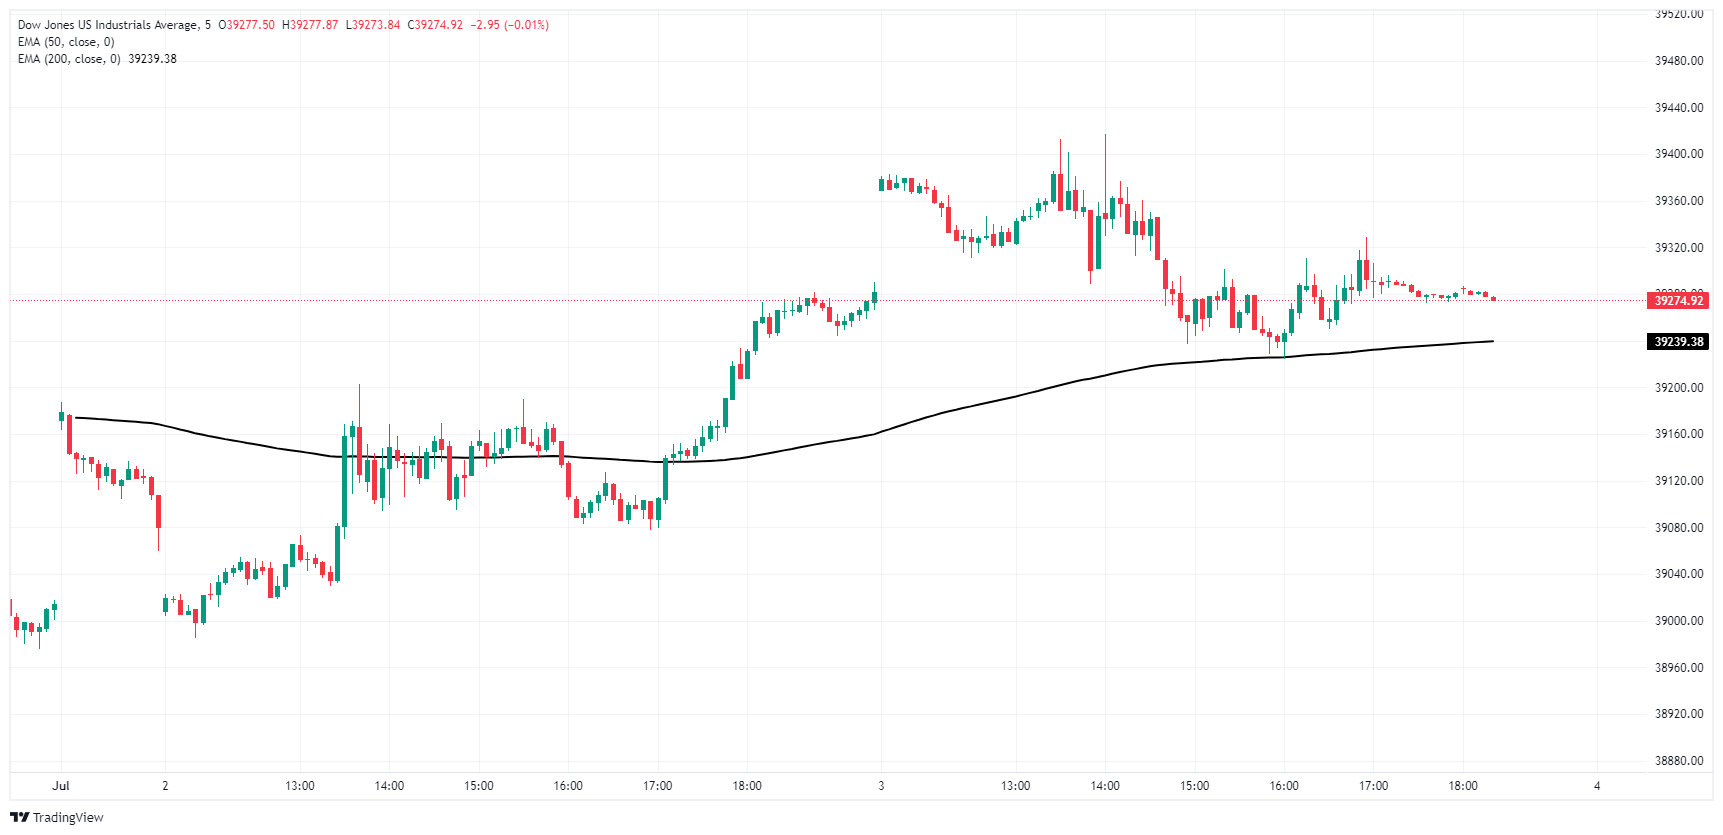
Dow Jones daily chart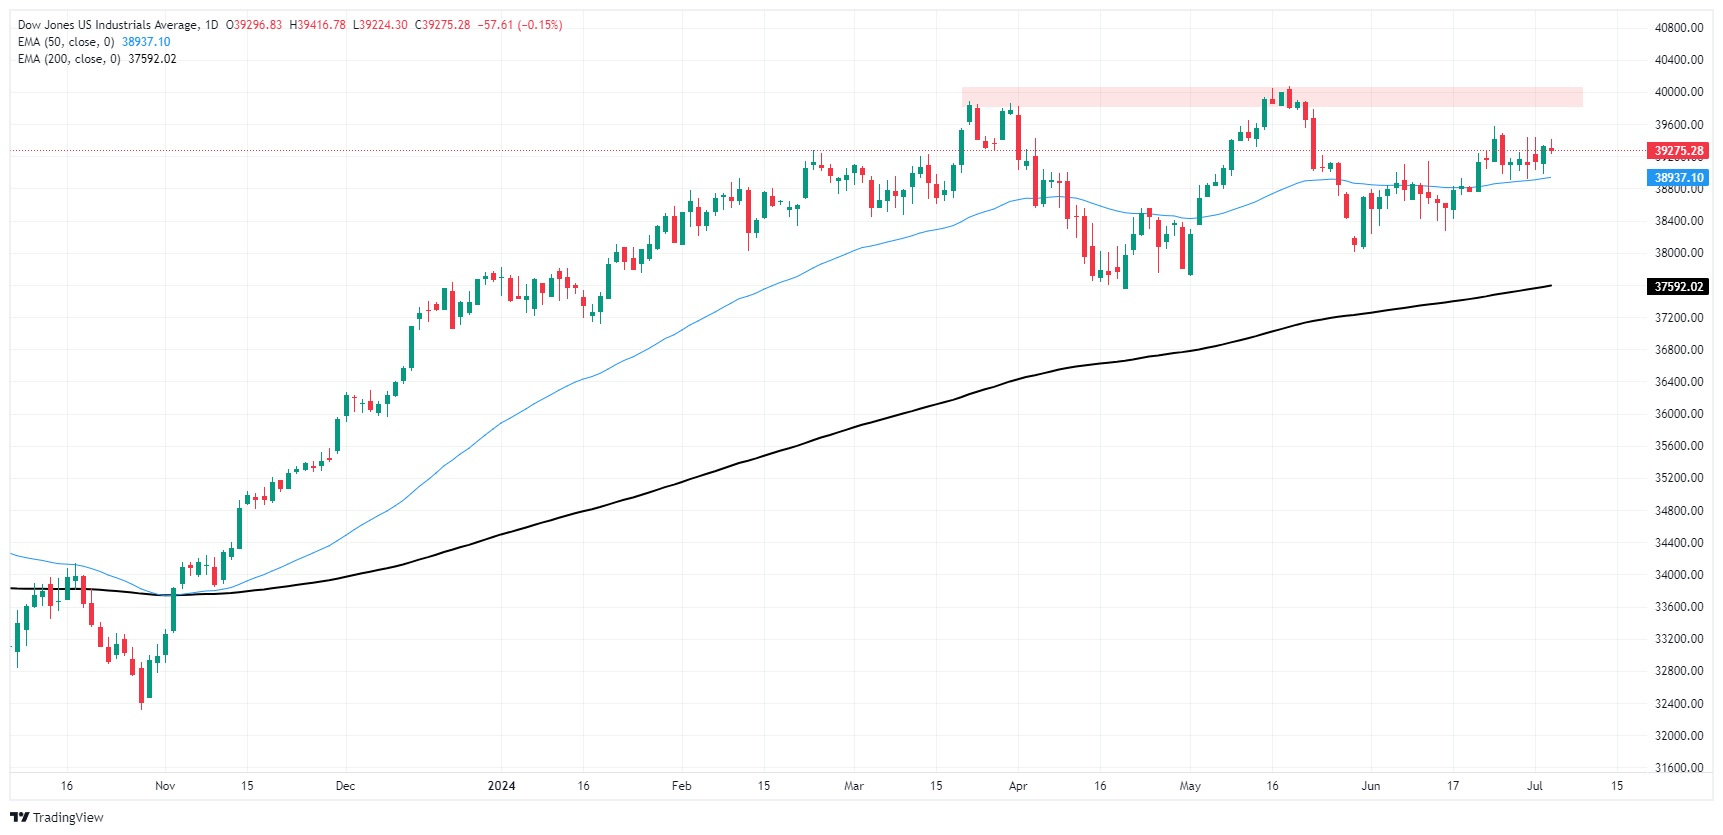
Dow Jones FAQs
The Dow Jones Industrial Average, one of the oldest stock market indices in the world, is compiled of the 30 most traded stocks in the US. The index is price-weighted rather than weighted by capitalization. It is calculated by summing the prices of the constituent stocks and dividing them by a factor, currently 0.152. The index was founded by Charles Dow, who also founded the Wall Street Journal. In later years it has been criticized for not being broadly representative enough because it only tracks 30 conglomerates, unlike broader indices such as the S&P 500.
Many different factors drive the Dow Jones Industrial Average (DJIA). The aggregate performance of the component companies revealed in quarterly company earnings reports is the main one. US and global macroeconomic data also contributes as it impacts on investor sentiment. The level of interest rates, set by the Federal Reserve (Fed), also influences the DJIA as it affects the cost of credit, on which many corporations are heavily reliant. Therefore, inflation can be a major driver as well as other metrics which impact the Fed decisions.
Dow Theory is a method for identifying the primary trend of the stock market developed by Charles Dow. A key step is to compare the direction of the Dow Jones Industrial Average (DJIA) and the Dow Jones Transportation Average (DJTA) and only follow trends where both are moving in the same direction. Volume is a confirmatory criteria. The theory uses elements of peak and trough analysis. Dow’s theory posits three trend phases: accumulation, when smart money starts buying or selling; public participation, when the wider public joins in; and distribution, when the smart money exits.
There are a number of ways to trade the DJIA. One is to use ETFs which allow investors to trade the DJIA as a single security, rather than having to buy shares in all 30 constituent companies. A leading example is the SPDR Dow Jones Industrial Average ETF (DIA). DJIA futures contracts enable traders to speculate on the future value of the index and Options provide the right, but not the obligation, to buy or sell the index at a predetermined price in the future. Mutual funds enable investors to buy a share of a diversified portfolio of DJIA stocks thus providing exposure to the overall index.
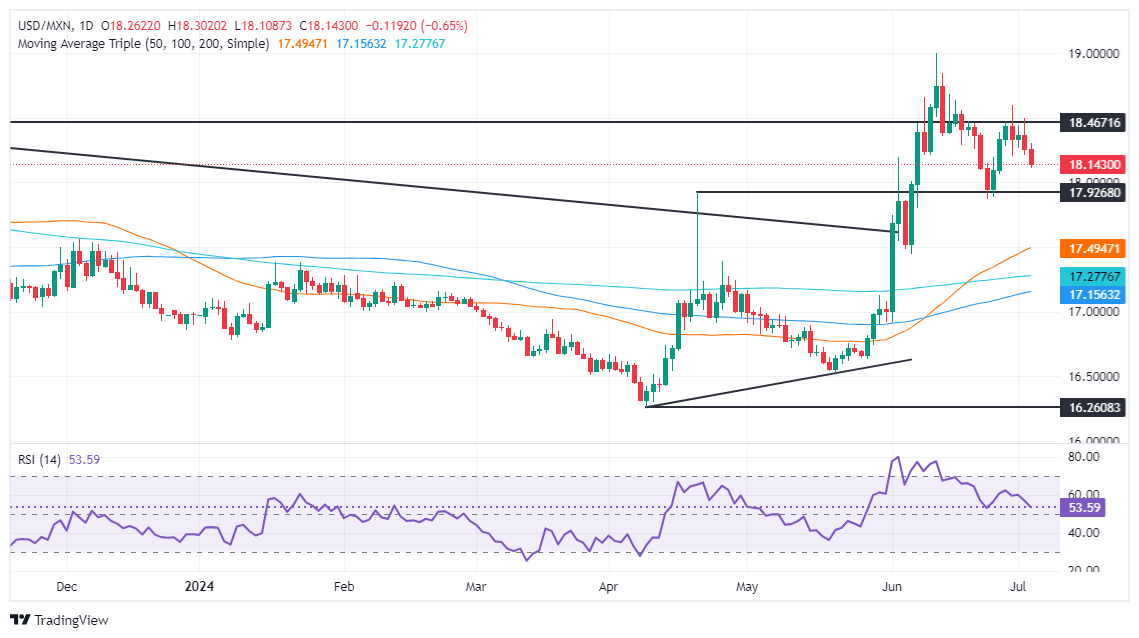
- Mexican Peso is buoyed, sponsored by weak US data and cautious comments from Chair Powell.
- Banxico Deputy Governor Heath mirrors Powell’s caution, advocating for clearer signs of benign inflation before rate cuts.
- Disappointing US private hiring, rising unemployment claims, sharp drop in ISM Services PMI pressure Greenback.
The Mexican Peso skyrocketed against the US Dollar on Wednesday after data from the United States (US) fueled speculation that the Federal Reserve (Fed) might cut interest rates more aggressively than expected. That and Fed Chair Jerome Powell's remarks at the European Central Bank’s (ECB) Sintra Forum spooked investors, who ditched the Greenback. The USD/MXN trades at 18.11, down 0.76%.
Mexico’s economic docket was light as the Bank of Mexico (Banxico) revealed that the Foreign Exchange Reserve increased in May from April 2024. Additionally, Banxico Deputy Governor Jonathan Heath noted on X that he “agree[s] with Jerome Powell, more benign inflation data is needed before cutting rates. He said it for the Federal Reserve, but the same applies to the case of Mexico”.
US economic data disappointed market players after private hiring was lower than May’s but missed the mark. That, along with more Americans filing for unemployment benefits and the ISM Services PMI plunging after hitting its highest level since August 2023, weighed on the US Dollar as US yields dropped.
US Treasury yields fell as market participants began to price in additional rate cuts. According to the CME FedWatch Tool, odds for a September 2024 cut lie at 66%, higher than a day ago's 63% chances.
Daily digest market movers: Mexican Peso rises further on US Dollar weakness
- Foreign Exchange Reserve in Mexico rose by $223 billion, exceeding April’s $221 billion and reaching an all-time high.
- Banxico’s survey showed that economists estimate the Gross Domestic Product (GDP) to end at 2%, down from 2.1%. They expect Banxico to cut rates from 11.00% to 10.25%, up from 10.00% projected in May.
- On Monday, Banxico Governor Victoria Rodriguez Ceja was dovish, as she said the evolution of disinflation can “allow us to continue discussing downward adjustments in our rate, and I consider that this is what we will be doing in our next monetary policy meetings.”
- Fed Chair Powell said the US economy made significant progress on inflation while adding that the risks of the Fed’s dual mandate are more balanced.
- US jobs data was released earlier, led by the ADP Employment Change, in June, which was 150K, below estimates of 160K and trailing May’s 157K.
- After that, US Initial Jobless Claims for the week ending June 29 were 238K, exceeding estimates of 235K and the prior reading of 234K.
- June’s ISM Services PMI plummeted to recessionary territory, from 53.8 to 48.8, the fastest pace in four years and its weakest since May 2020.
Technical analysis: Mexican Peso extends advancement as USD/MXN slumps below 18.20
The USD/MXN extended its losses to two straight days, with the pair clearing key support seen at 18.20, exposing the psychological 18.00 figure. Although momentum remains bullish, as depicted by the Relative Strength Index (RSI), buyers had lost traction while sellers continued to gain steam.
If USD/MXN drops further, the next target is the psychological level of 18.00. Breaking below this level would expose the next support at the December 5 high, which turned support at 17.56. Further decline aims for the 50-day Simple Moving Average (SMA) at 17.37.
Conversely, if buyers push the spot price above 18.50, it could rally toward the June 28 high of 18.59, potentially extending gains to challenge the year-to-date high of 18.99.
Mexican Peso FAQs
The Mexican Peso (MXN) is the most traded currency among its Latin American peers. Its value is broadly determined by the performance of the Mexican economy, the country’s central bank’s policy, the amount of foreign investment in the country and even the levels of remittances sent by Mexicans who live abroad, particularly in the United States. Geopolitical trends can also move MXN: for example, the process of nearshoring – or the decision by some firms to relocate manufacturing capacity and supply chains closer to their home countries – is also seen as a catalyst for the Mexican currency as the country is considered a key manufacturing hub in the American continent. Another catalyst for MXN is Oil prices as Mexico is a key exporter of the commodity.
The main objective of Mexico’s central bank, also known as Banxico, is to maintain inflation at low and stable levels (at or close to its target of 3%, the midpoint in a tolerance band of between 2% and 4%). To this end, the bank sets an appropriate level of interest rates. When inflation is too high, Banxico will attempt to tame it by raising interest rates, making it more expensive for households and businesses to borrow money, thus cooling demand and the overall economy. Higher interest rates are generally positive for the Mexican Peso (MXN) as they lead to higher yields, making the country a more attractive place for investors. On the contrary, lower interest rates tend to weaken MXN.
Macroeconomic data releases are key to assess the state of the economy and can have an impact on the Mexican Peso (MXN) valuation. A strong Mexican economy, based on high economic growth, low unemployment and high confidence is good for MXN. Not only does it attract more foreign investment but it may encourage the Bank of Mexico (Banxico) to increase interest rates, particularly if this strength comes together with elevated inflation. However, if economic data is weak, MXN is likely to depreciate.
As an emerging-market currency, the Mexican Peso (MXN) tends to strive during risk-on periods, or when investors perceive that broader market risks are low and thus are eager to engage with investments that carry a higher risk. Conversely, MXN tends to weaken at times of market turbulence or economic uncertainty as investors tend to sell higher-risk assets and flee to the more-stable safe havens.
- Canadian Dollar climbs a third of a percent against Greenback after sour data patch.
- Canada economic data remains thin until Friday’s labor figures.
- US data broadly softens, propping up rate cut hopes.
The Canadian Dollar (CAD) gave a shaky performance on Wednesday. The Loonie was mixed against a basket of major currencies but notably climbed one-third of one percent against the US Dollar (USD) after a raft of data misses from the US. Broad-market rate cut hopes are stepping higher after a sharp drag on US ISM Purchasing Managers Index (PMI) activity figures, and rate markets are pricing in over 70% odds of at least a quarter-point rate trim from the Federal Reserve (Fed) in September.
Canada saw little impact from low-tier trade balance figures on Wednesday. Imports and Exports both declined slightly, leading to a sharper-than-expected contraction in May’s International Merchandise Trade tally. Thursday will bring a notable lull to the action with US markets set to be shuttered for the US Independence Day holiday. Friday will open the floodgates with a fully-stocked US session for the latest US Nonfarm Payrolls (NFP) labor data dump.
Daily digest market movers: Canadian Dollar performance saved by stumbling Greenback
- US ADP Employment Change figures gave their lowest print since January, showing 150K net jobs added in June, below the forecast for 160K and falling back from the previous 157K (revised up from 152K).
- US Initial Jobless Claims for the week ended June 28 also rose faster than expected, coming in at 238K compared to the forecast of 235K and previous 233K. The figure lifted the four-week average to 238.5K from the revised previous figure of 236.25K.
- June’s US ISM PMI activity survey revealed a steepening slowdown in business activity. The survey index dropped sharply to 48.8, the lowest print since June of 2020.
- ISM Services Prices Paid in June declined to 56.3 from 58.1 as industry-level inflation eases.
- Canada’s International Merchandise Trade contracted in May, printing at $-1.93 billion versus the expected recovery to $-1.2 billion from the previous $-1.32 billion (revised down from $-1.05 billion).
- Overall trade activity is slowing in Canada, with May Exports and Imports both declining slightly. Exports fell to $62.45 billion from $64.11 billion, while Imports slid to $64.37 billion from the previous $65.43 billion.
- According to CME’s FedWatch Tool, rate markets are pricing in 72% odds of at least a quarter-point rate trim from the Fed on September 18.
Canadian Dollar PRICE Today
The table below shows the percentage change of Canadian Dollar (CAD) against listed major currencies today. Canadian Dollar was the strongest against the Japanese Yen.
| USD | EUR | GBP | JPY | CAD | AUD | NZD | CHF | |
|---|---|---|---|---|---|---|---|---|
| USD | -0.47% | -0.54% | 0.05% | -0.35% | -0.70% | -0.57% | -0.37% | |
| EUR | 0.47% | -0.07% | 0.52% | 0.12% | -0.24% | -0.07% | 0.10% | |
| GBP | 0.54% | 0.07% | 0.60% | 0.18% | -0.17% | -0.00% | 0.19% | |
| JPY | -0.05% | -0.52% | -0.60% | -0.42% | -0.76% | -0.62% | -0.41% | |
| CAD | 0.35% | -0.12% | -0.18% | 0.42% | -0.35% | -0.20% | -0.00% | |
| AUD | 0.70% | 0.24% | 0.17% | 0.76% | 0.35% | 0.16% | 0.34% | |
| NZD | 0.57% | 0.07% | 0.00% | 0.62% | 0.20% | -0.16% | 0.20% | |
| CHF | 0.37% | -0.10% | -0.19% | 0.41% | 0.00% | -0.34% | -0.20% |
The heat map shows percentage changes of major currencies against each other. The base currency is picked from the left column, while the quote currency is picked from the top row. For example, if you pick the Canadian Dollar from the left column and move along the horizontal line to the US Dollar, the percentage change displayed in the box will represent CAD (base)/USD (quote).
Technical analysis: Wednesday’s Greenback declines a welcome reprieve for CAD bulls
Despite a soft-to-mixed performance, the Canadian Dollar (CAD) found higher ground against the US Dollar and the Japanese Yen (JPY), climbing around one-third of one percent against each. The CAD shed weight against the Australian Dollar (AUD) and the Pound Sterling (GBP), declining one-third of one percent and one-fifth of one percent, respectively.
USD/CAD volatility continues to litter the charts, with the pair declining back into familiar lows near 1.3630. Wednesday’s decline adds to earlier declines after an early week peak just below 1.3760.
A supply zone is baked into the daily chart as candlesticks slump back below the 50-day Exponential Moving Average (EMA) at 1.3677. Buyers will be looking for a chance to re-up on an extended pullback to the 200-day EMA at 1.3588.
USD/CAD hourly chart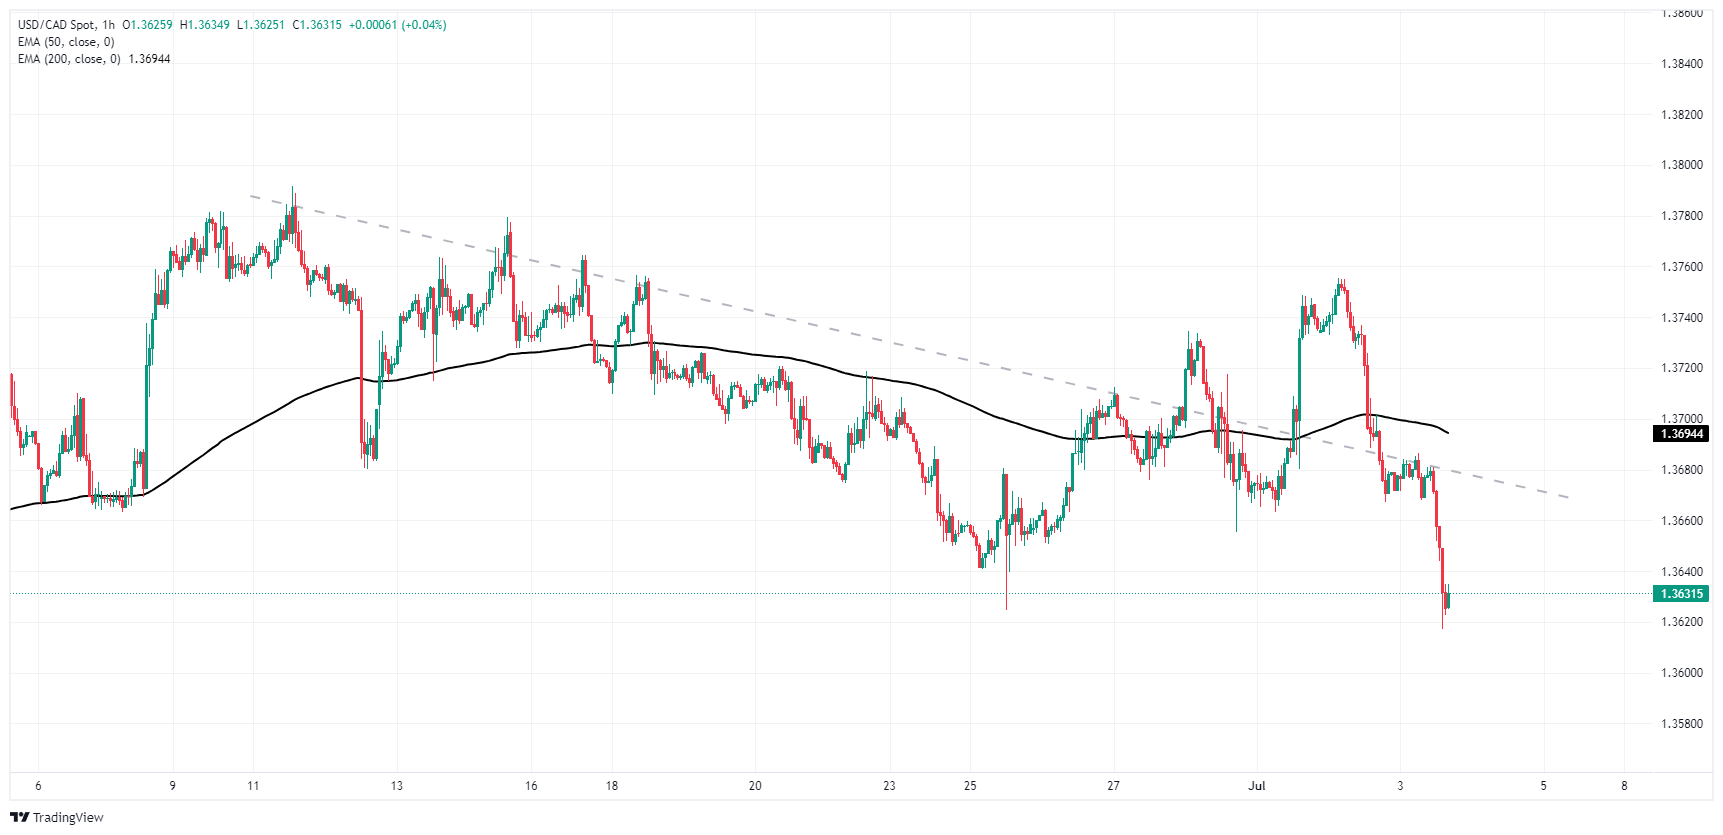
USD/CAD daily chart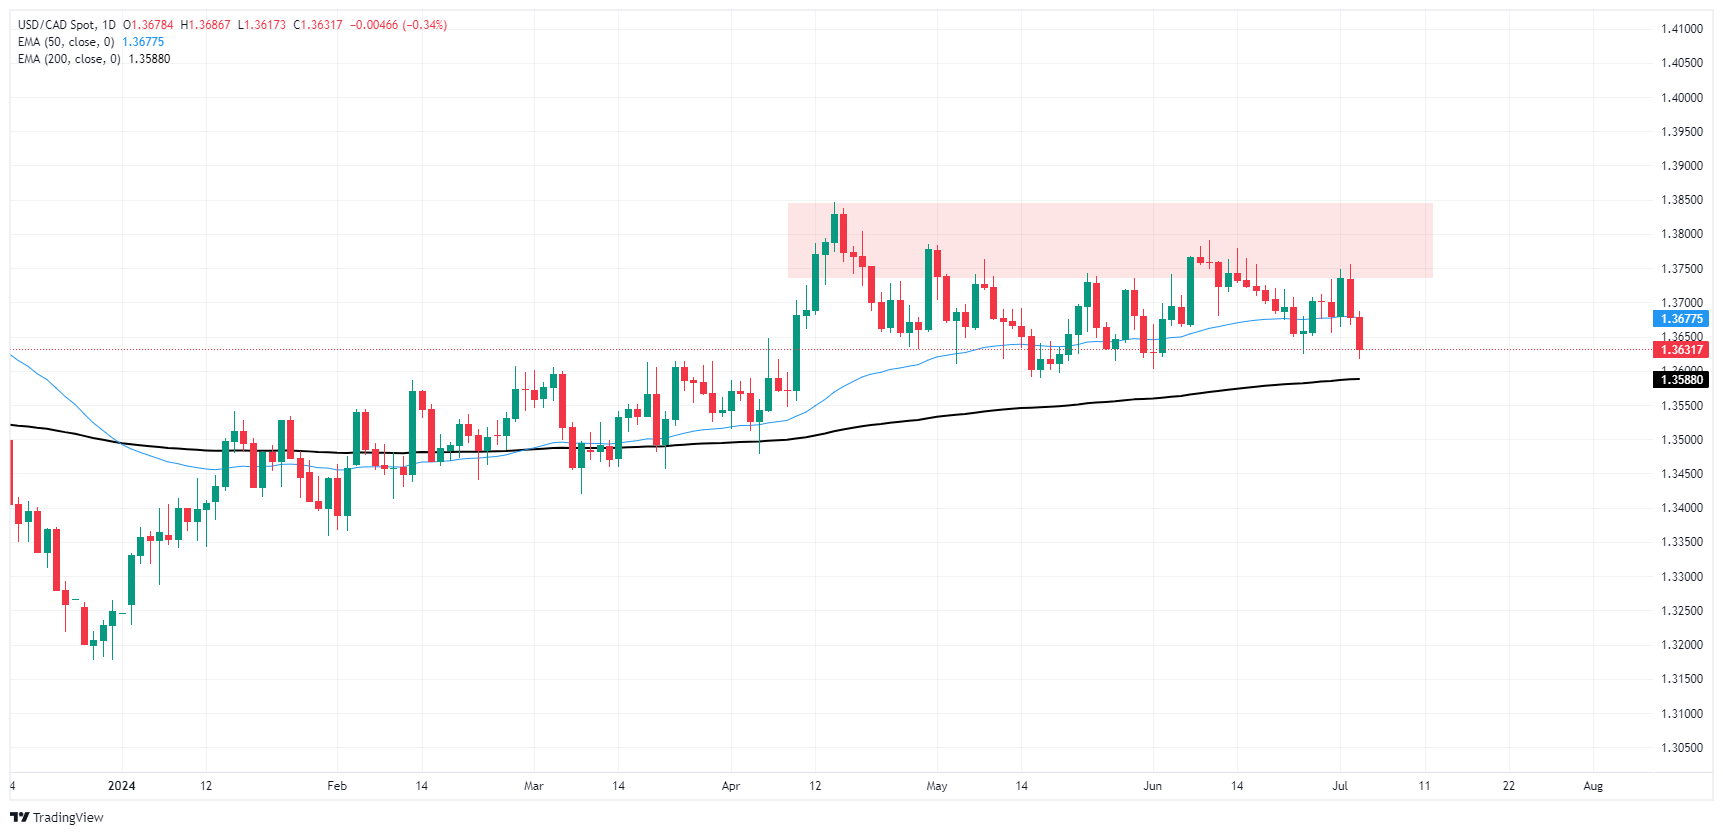
Canadian Dollar FAQs
The key factors driving the Canadian Dollar (CAD) are the level of interest rates set by the Bank of Canada (BoC), the price of Oil, Canada’s largest export, the health of its economy, inflation and the Trade Balance, which is the difference between the value of Canada’s exports versus its imports. Other factors include market sentiment – whether investors are taking on more risky assets (risk-on) or seeking safe-havens (risk-off) – with risk-on being CAD-positive. As its largest trading partner, the health of the US economy is also a key factor influencing the Canadian Dollar.
The Bank of Canada (BoC) has a significant influence on the Canadian Dollar by setting the level of interest rates that banks can lend to one another. This influences the level of interest rates for everyone. The main goal of the BoC is to maintain inflation at 1-3% by adjusting interest rates up or down. Relatively higher interest rates tend to be positive for the CAD. The Bank of Canada can also use quantitative easing and tightening to influence credit conditions, with the former CAD-negative and the latter CAD-positive.
The price of Oil is a key factor impacting the value of the Canadian Dollar. Petroleum is Canada’s biggest export, so Oil price tends to have an immediate impact on the CAD value. Generally, if Oil price rises CAD also goes up, as aggregate demand for the currency increases. The opposite is the case if the price of Oil falls. Higher Oil prices also tend to result in a greater likelihood of a positive Trade Balance, which is also supportive of the CAD.
While inflation had always traditionally been thought of as a negative factor for a currency since it lowers the value of money, the opposite has actually been the case in modern times with the relaxation of cross-border capital controls. Higher inflation tends to lead central banks to put up interest rates which attracts more capital inflows from global investors seeking a lucrative place to keep their money. This increases demand for the local currency, which in Canada’s case is the Canadian Dollar.
Macroeconomic data releases gauge the health of the economy and can have an impact on the Canadian Dollar. Indicators such as GDP, Manufacturing and Services PMIs, employment, and consumer sentiment surveys can all influence the direction of the CAD. A strong economy is good for the Canadian Dollar. Not only does it attract more foreign investment but it may encourage the Bank of Canada to put up interest rates, leading to a stronger currency. If economic data is weak, however, the CAD is likely to fall.
- US Dollar saw severe selling pressure after soft ADP figures from June.
- Markets boosted their bets for a September Fed rate cut.
- Keen market focus remains on the upcoming FOMC minutes from the June meeting.
On Wednesday, the US Dollar, represented by the Dollar Index (DXY), declined to its lowest level since June 18 at around 105.20 following the release of robust ADP labor market data. In addition, market participants eagerly anticipate the meeting minutes from the June Federal Open Market Committee (FOMC) event, which might influence interest rate expectations.
Signs of disinflation and a cooling labor market are becoming evident in the US economy, thereby fuelling belief in a rate cut possibly occurring in September. Federal Reserve (Fed) officials, however, exhibit restraint and maintain their data-dependent stance.
Daily digest market movers: US Dollar loses ground following robust ADP data, markets await FOMC Minutes
- Private sector employment in the US reported by ADP reflected a decline with a rise of 150K in June, contrasted against a revised number of 160K expected.
- Later this week, the highlight resides with the June Nonfarm Payrolls data due on Friday. Bloomberg consensus predicts a drop to 190k from 272k in May, yet whisper numbers currently point to 198k.
- Session late Wednesday will see another critical event with the impending release of FOMC June Meeting Minutes.
- Market perceives a 70% likelihood of a September rate cut.
DXY technical outlook: Bulls give up and lose 20-day SMA
On Wednesday, the outlook for the DXY turned negative in the short term with both the Relative Strength Index (RSI) and Moving Average Convergence Divergence (MACD) now on negative terrain.
The highlight is that the bulls lost their position above the 20-day Simple Moving Averages (SMAs). The market should monitor potential fallbacks toward the 105.00 and 104.50 zones. On the upside, the former support of the 20-day SMA at 105.40 is now a resistance line.
US Dollar FAQs
The US Dollar (USD) is the official currency of the United States of America, and the ‘de facto’ currency of a significant number of other countries where it is found in circulation alongside local notes. It is the most heavily traded currency in the world, accounting for over 88% of all global foreign exchange turnover, or an average of $6.6 trillion in transactions per day, according to data from 2022. Following the second world war, the USD took over from the British Pound as the world’s reserve currency. For most of its history, the US Dollar was backed by Gold, until the Bretton Woods Agreement in 1971 when the Gold Standard went away.
The most important single factor impacting on the value of the US Dollar is monetary policy, which is shaped by the Federal Reserve (Fed). The Fed has two mandates: to achieve price stability (control inflation) and foster full employment. Its primary tool to achieve these two goals is by adjusting interest rates. When prices are rising too quickly and inflation is above the Fed’s 2% target, the Fed will raise rates, which helps the USD value. When inflation falls below 2% or the Unemployment Rate is too high, the Fed may lower interest rates, which weighs on the Greenback.
In extreme situations, the Federal Reserve can also print more Dollars and enact quantitative easing (QE). QE is the process by which the Fed substantially increases the flow of credit in a stuck financial system. It is a non-standard policy measure used when credit has dried up because banks will not lend to each other (out of the fear of counterparty default). It is a last resort when simply lowering interest rates is unlikely to achieve the necessary result. It was the Fed’s weapon of choice to combat the credit crunch that occurred during the Great Financial Crisis in 2008. It involves the Fed printing more Dollars and using them to buy US government bonds predominantly from financial institutions. QE usually leads to a weaker US Dollar.
Quantitative tightening (QT) is the reverse process whereby the Federal Reserve stops buying bonds from financial institutions and does not reinvest the principal from the bonds it holds maturing in new purchases. It is usually positive for the US Dollar.
The Euro (EUR) has been holding on to gains against the US dollar at the start of this month, MUFG analysts note.
EUR to continue its volatile wobbling
“After hitting a low of 1.0666 towards the end of last month, EUR/USD initially jumped to a high of 1.0776 on Monday after the release of results from the first round of the French elections triggered a relief rally for EUR, the pair has since fallen back towards the 1.0700-level and recovered back to 1.0800.“
“The market impact has once again been more evident in the government bond market where the yield spread between the 10-year French and German government bonds has narrowed to around 71bps from a high of 82bps towards the end of last month.”
“The easing of the first risk premium priced into French government bonds that had reached the highest levels seen the euro-zone debt crisis back between 2011 and 2012 reflects building investor optimism that the far-right RN party will fall short of winning a majority in parliament.”
Higher USD/JPY continues to drum up expectations of intervention though some may be watching if authorities are allowing for further depreciation before stepping in. Spread between implied and realised vol continues to widen. And we observed from history that actual market intervention risks do rise if spread continues to widen, OCBC strategists Frances Cheung and Christopher Wong note.
Bullish momentum on daily chart
“In the interim, USD/JPY will look to UST yields, US Dollar (USD) for directional cues. For USD/JPY to turn lower, that would require the USD to turn/Fed to cut or for BoJ to signal an intent to normalise urgently (rate hike or increase pace of balance sheet reduction). None of the above appears to be taking place.”
“As such, the path of least resistance for USD/JPY may still be to the upside unless intervention takes place. And we shared that intervention is at best a tool to slow pace of JPY depreciation and not to reverse the trend.”
“USD/JPY was last at 161.44. Bullish momentum on daily chart intact while RSI is still in overbought conditions. Next resistance at 164, 164.90 levels. Support at 160.20, 158.10 (21 DMA), 156.90 (50 DMA).”
The Euro (EUR) dipped in London morning yesterday as the release of CPI estimate shows inflation slows. But losses were more than retraced into gains following the US Dollar (USD) pullback (on Powell’s comments), OCBC strategists Frances Cheung and Christopher Wong note.
Second round runoff may spur volatile price action
“French media reported that between 214 and 218 third-places contenders had pulled out of the race in their constituencies. This means Marine Le Pen’s party needs 289 seats to win an absolute majority in the National Assembly. She says that she will try to open talks with individual MPs to form a government if she can secure around 270 deputies.
“We should expect to see EUR volatility returning closer to second round runoff this Sunday (7 Jul). Results should be in by the time Asia opens on Mon (8 Jul). A hung parliament would be a lesser evil for EUR than a right-wing outcome.”
“EUR/USD was last at 1.0808 levels. Bearish momentum on daily chart faded though rise in RSI slowed. 2-way trades still likely. Resistance at 1.0810 (38.2% fibo retracement of 2024 high to low, 100 DMA). Support at 1.0710, 1.0660/ 70 levels (recent low).”
- GBP/USD rises and surpasses 1.2700 resistance after weak ISM Services PMI.
- Technicals show buyer momentum; RSI remains bullish above 50.
- Resistance levels: 1.2777 (May 27 high), 1.2760/1.2775 (trendline confluence), 1.2800, 1.2860 (June 12 high), 1.2894 (YTD high).
- Support points: 1.2750, 1.2700, 1.2662 (50-DMA), 1.2644 (100-DMA).
The Pound Sterling rallied sharply against the US Dollar following a dismal ISM Services PMI reading, which increased the likelihood that the Federal Reserve will indeed cut rates at least once in 2024. The GBP/USD trades at 1.2772, up 0.69%.
GBP/USD Price Analysis: Technical outlook
The GBP/USD pushed through key resistance seen at 1.2700 and aimed toward a confluence of technical resistance levels, like the May 27 high of 1.2777 and two key resistance trendlines, which confluence at around 1.2760/1.2775.
Momentum favors buyers as depicted by the Relative Strength Index (RSI) bullish above the 50-neutral line, with enough room before turning overbought.
For a bullish continuation, the GBP/USD needs to clear 1.2775 so buyers can test 1.2800. A breach of the latter will expose the June 12 high at 1.2860, ahead of the year-to-date (YTD) high of 1.2894.
On further weakness, if GBP/USD drops below 1.2750 the next demand area is seen at 1.2700. Once surpassed, the 50-day moving average (DMA) emerges as first support at 1.2662, followed by the 100-DMA at 1.2644.
GBP/USD Price Action – Daily Chart
British Pound PRICE Today
The table below shows the percentage change of British Pound (GBP) against listed major currencies today. British Pound was the strongest against the US Dollar.
| USD | EUR | GBP | JPY | CAD | AUD | NZD | CHF | |
|---|---|---|---|---|---|---|---|---|
| USD | -0.51% | -0.57% | -0.08% | -0.34% | -0.74% | -0.60% | -0.33% | |
| EUR | 0.51% | -0.07% | 0.45% | 0.17% | -0.24% | -0.07% | 0.18% | |
| GBP | 0.57% | 0.07% | 0.51% | 0.23% | -0.17% | 0.00% | 0.25% | |
| JPY | 0.08% | -0.45% | -0.51% | -0.27% | -0.67% | -0.51% | -0.25% | |
| CAD | 0.34% | -0.17% | -0.23% | 0.27% | -0.41% | -0.24% | 0.01% | |
| AUD | 0.74% | 0.24% | 0.17% | 0.67% | 0.41% | 0.16% | 0.42% | |
| NZD | 0.60% | 0.07% | -0.00% | 0.51% | 0.24% | -0.16% | 0.26% | |
| CHF | 0.33% | -0.18% | -0.25% | 0.25% | -0.01% | -0.42% | -0.26% |
The heat map shows percentage changes of major currencies against each other. The base currency is picked from the left column, while the quote currency is picked from the top row. For example, if you pick the British Pound from the left column and move along the horizontal line to the US Dollar, the percentage change displayed in the box will represent GBP (base)/USD (quote).
The economic recovery in the euro area might not be as solid as previously thought. At least that is the impression the June PMI survey gives, and the less upbeat picture was confirmed by German IFO data, Danske Bank’s macro analysts note.
Eurozone recovery may be less solid than expected
“The service sector has lost some momentum and the manufacturing recession reaccelerated after we had seen promising signs of a stabilisation here in recent months. Price pressures moderated a bit in June in the euro area, but by and large, service inflation remains too high.”
“The ECB delivered the widely anticipated first 25bp rate cut but kept its forward-looking guidance vague at its June meeting. We see the move as a roll-back of the September 2023 insurance hike and as we still see a sufficiently growth momentum and sticky inflation, we do not expect the next rate cut from the ECB until December.”
“The possibility of a new French parliament ready to run higher deficits has spooked markets through June. Rassemblement National won the first round of the parliamentary elections with 33% of the votes. This means the most likely scenario is a ‘hung parliament’ and thus limited risk of France going down an increasingly unsustainable fiscal policy path.”
- EUR/GBP forms a two bar reversal pattern and begins descending.
- This follows price filling a gap on the charts – another reversal sign.
- The correction from the June 14 lows may have ended and a new leg of the intermediate downtrend could be evolving.
EUR/GBP has moved lower after filling the price gap that opened between 0.8472 and 0.8490 (red shaded area) during the steep decline of June 10.
The pair has formed a two-bar reversal pattern on July 1-2 (light blue rectangle) which is a bearish reversal sign. These patterns form after an up move when a green candle is succeeded by a red candle of a similar shape and size. The pattern indicates a reversal of sentiment at a peak. This and the gap-fill increase the odds the up move from the June 14 lows has finished. It is likely the pair is probably rolling over and entering a bearish phase.
EUR/GBP Daily Chart
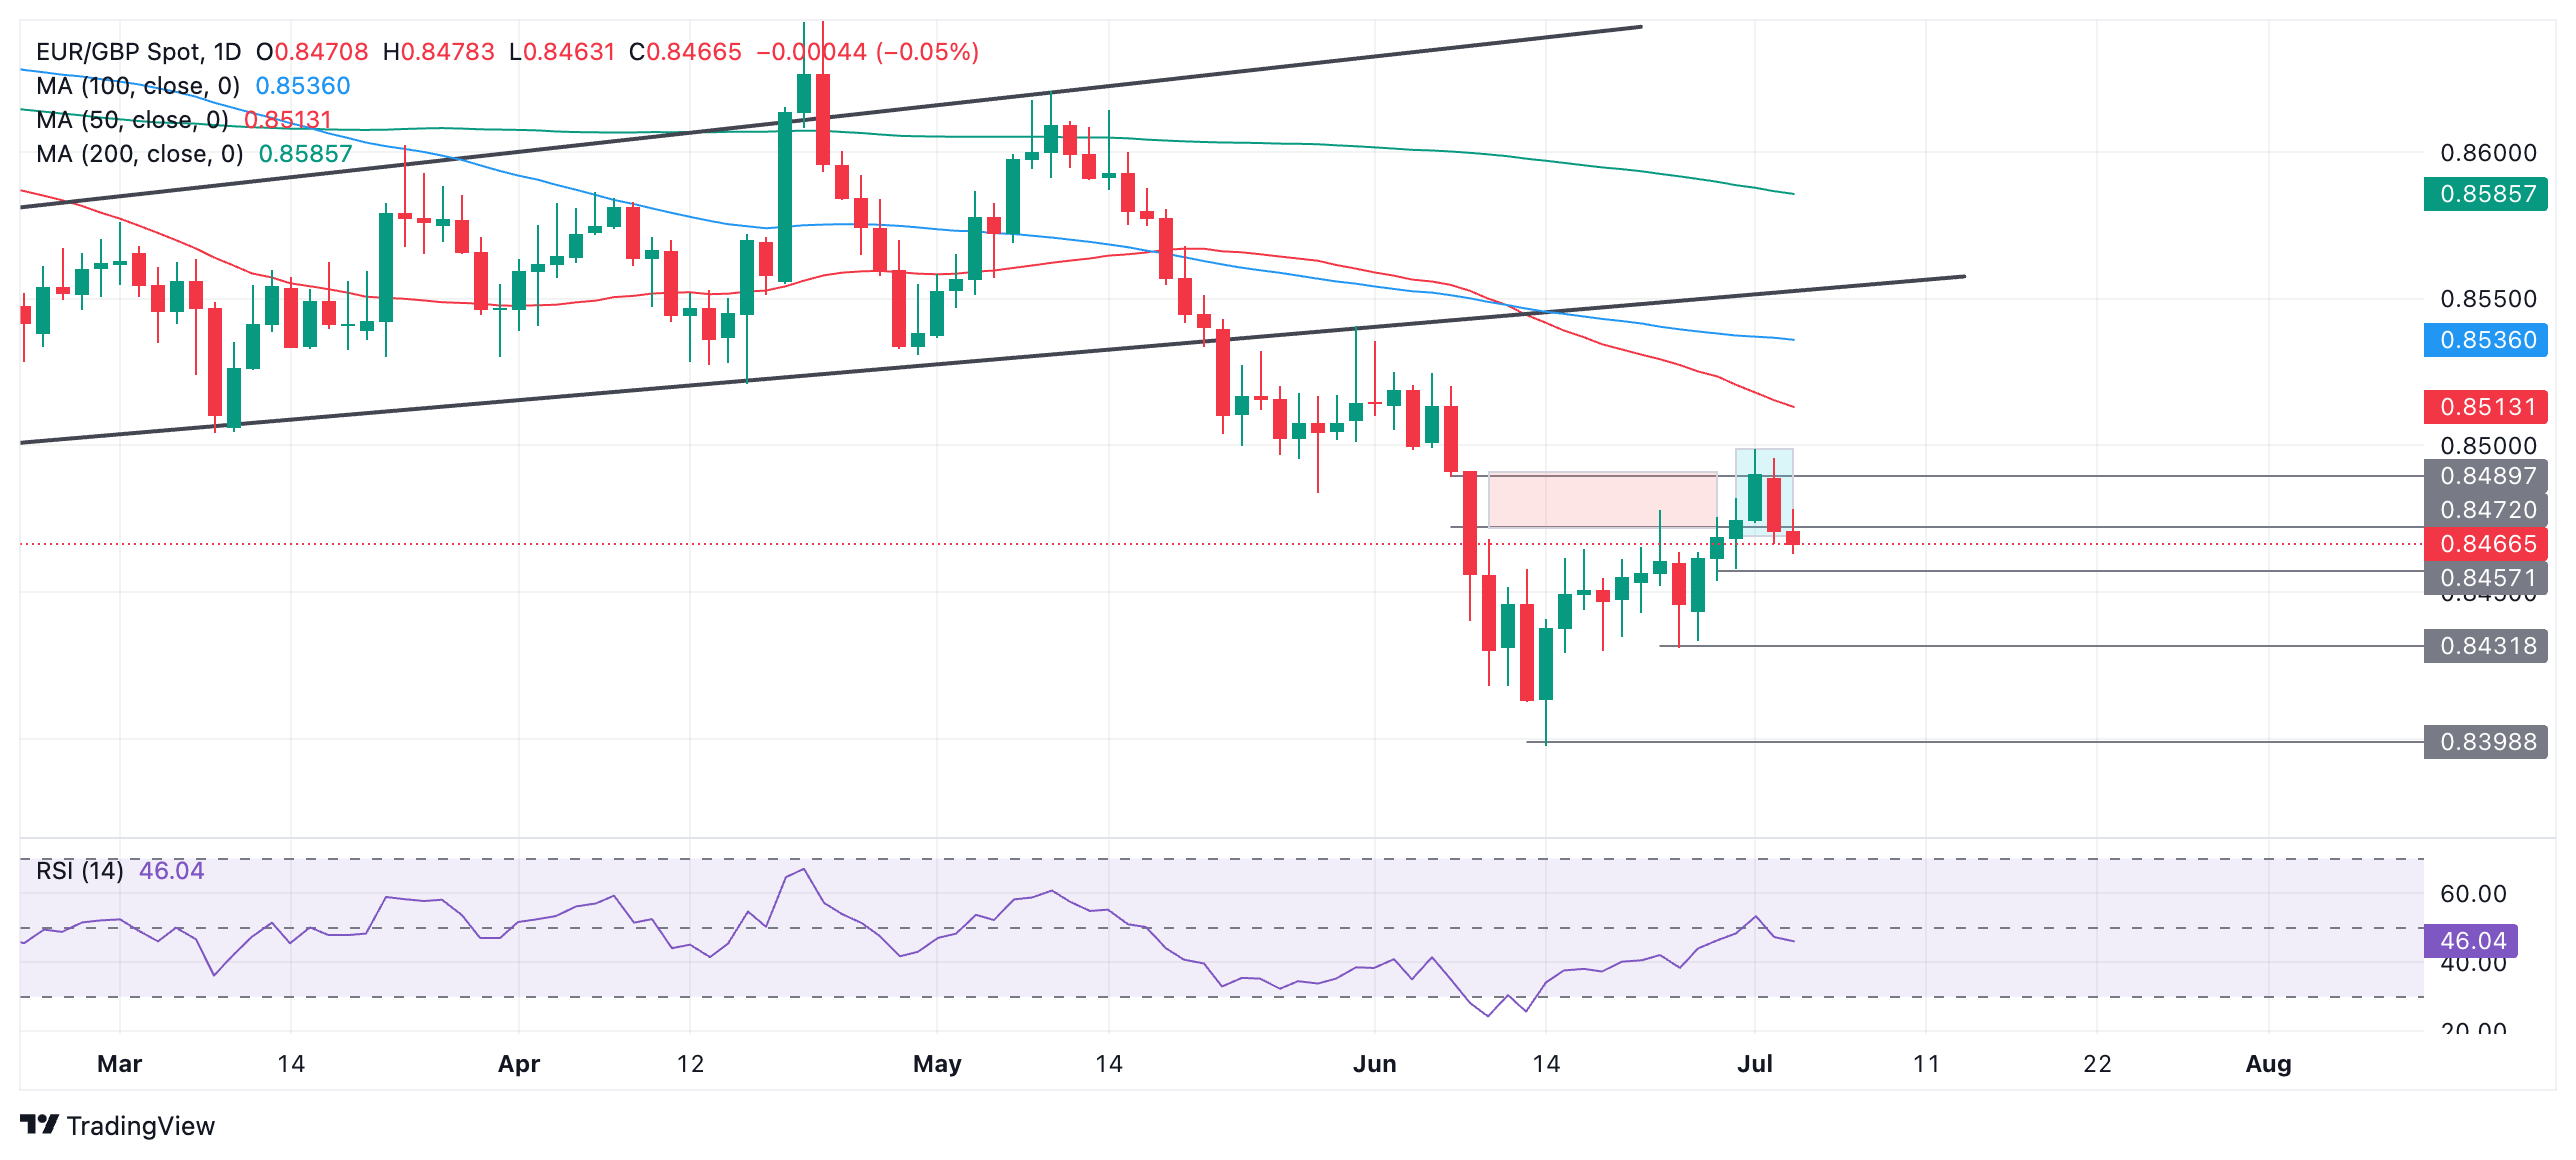
Taken together with the fact that the pair seems to be in a medium-term downtrend and “the trend is your friend” the odds favor a resumption lower.
A break below 0.8457 (June 28 low) would add confirmation.
The next target below that would be the 0.8431 June 25 low.
EUR/GBP 4-hour Chart
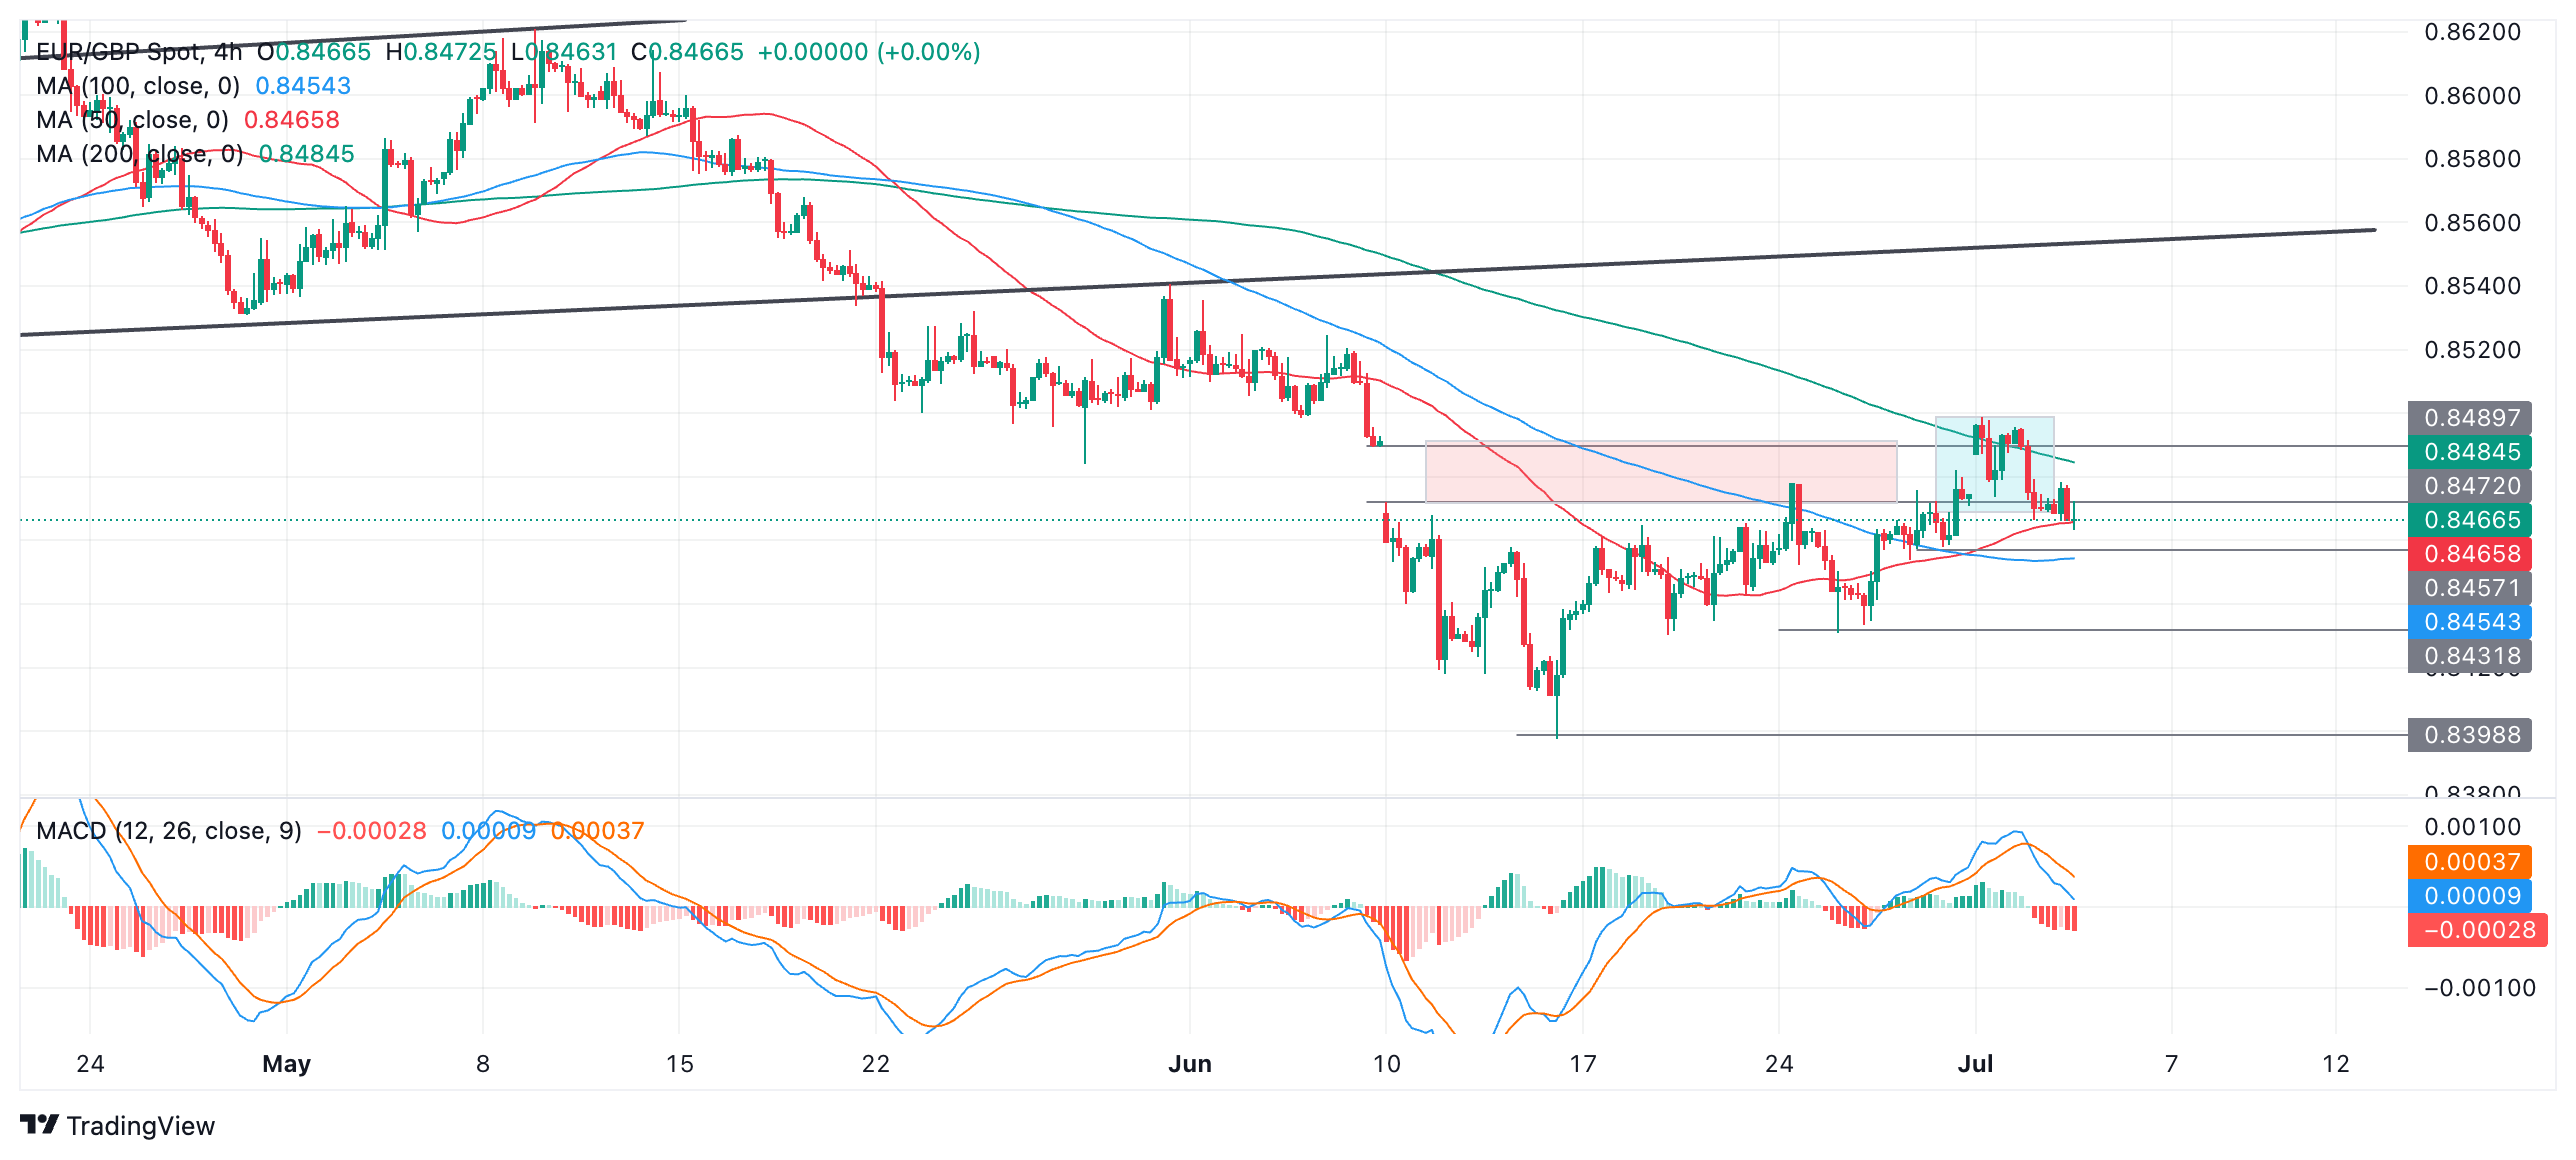
The Moving Average Convergence Divergence (MACD) on the 4-hour chart has crossed below its signal line during the reversal at the recent July 1 highs. This further indicates the correction may have run its course and is now turning lower.
It is still possible the pair could recover, however, and a break above 0.8499 (July 1) high would indicate a continuation of the correction higher, with the 50-day Simple Moving Average at 0.8517 providing the next resistance target to the upside.
Today is the last day of the Sintra summit, which will include comments by ECB’s Lagarde, Luis de Guindos, Piero Cipollone, Philip Lane and Klaas Knot, ING’s FX strategist Francesco Pesole notes.
EUR/USD has little chance to rise to 1.0900
“Eurozone inflation declined in line with expectations in June (from 2.6% to 2.5%), but the core measure was unchanged at 2.9%, which endorses the widely reiterated caution on easing guidance by Christine Lagarde and other ECB members.”
“Today is the last day of the Sintra summit, which will include some closing comments by Lagarde, as well as speeches by the ECB’s Luis de Guindos, Piero Cipollone, Philip Lane and Klaas Knot. Chief Economist Philip Lane backed Lagarde’s message of patience yesterday, adding that June data would not answer questions on services inflation.”
“The calendar in the eurozone turns much quieter in the second half of the week, and today it only includes final PMI figures and May PPI numbers. While a softer USD could drive EUR/USD above 1.0800, we doubt there is enough steam to rise to 1.0900 for now.”
Yield differentials seem important to the USD/JPY outlook. FX intervention may be on the cards again very soon because the Japanese Yen (JPY) is weak, weighing on the consumer confidence, Rabobank FX strategists note.
JPY weakness is inflationary
“Yield differentials are clearly front and centre to the outlook for USD/JPY. Today’s downward revision to Japan’s June PMI survey has only enhanced the difficulty that BoJ hawks face.”
“That said, JPY weakness is inflationary and is weighing on consumer confidence which will increase the will of policy makers to stabilise the currency. FX intervention may be on the cards again very soon. However, in the absence of better Japanese economic data the JPY remains very vulnerable.”
“We have revised higher our forecasts for USD/JPY and see little scope for a sustained recovery for the JPY below USD/JPY160 in the coming weeks.”
- USD/CAD declines to near 1.3620 as the US Dollar weakens after poor US data.
- US private labor demand remained slowed and the Services PMI contracted in June.
- Investors await the US/Canada official Employment data for June.
The USD/CAD pair falls sharply to near 1.3650 in Wednesday’s American session. The Loonie asset weakens as the US Dollar (USD) faces an intense sell-off after the United States (US) ADP Employment report showed that labor growth in the private sector surprisingly slowed in June and the ISM Services PMI report showed that activities in the service sector contracted significantly.
According to the report, private employers hired 150K job-seekers, missed estimates of 160K and the prior release of 157K, upwardly revised from 152K. This has deepened uncertainty over the labor market outlook. However, investors await the US Nonfarm Payrolls (NFP) report for June, which will be published on Friday. The US NFP report will provide clarity about the current status of the labor market.
Meanwhile, the Services PMI declined to 48.8 from expectations of 52.5 and the prior release of 53.8. A figure below the 50.0 threshold is itself considered as contraction in service activities. Other sub-components, such as the Prices Paid and New Orders Index, were weaker than their former readings.
The US Dollar Index (DXY), which tracks the Greenback’s value against six major currencies, has slumped to near 105.30.
On the Loonie front, investors await the Canadian Employment report for June, which will be published on Friday. The labor market report is expected to show that the Unemployment Rate increased to 6.3% from the prior release of 6.2%. Canadian employers hired 22.5K workers, which were lower than the former reading of 26.7K.
Strong Employment numbers would ease expectations of subsequent rate cuts by the Bank of Canada (BoC), while soft figures will boost them.
Economic Indicator
ADP Employment Change
The ADP Employment Change is a gauge of employment in the private sector released by the largest payroll processor in the US, Automatic Data Processing Inc. It measures the change in the number of people privately employed in the US. Generally speaking, a rise in the indicator has positive implications for consumer spending and is stimulative of economic growth. So a high reading is traditionally seen as bullish for the US Dollar (USD), while a low reading is seen as bearish.
Read more.Last release: Wed Jul 03, 2024 12:15
Frequency: Monthly
Actual: 150K
Consensus: 160K
Previous: 152K
Source: ADP Research Institute
Traders often consider employment figures from ADP, America’s largest payrolls provider, report as the harbinger of the Bureau of Labor Statistics release on Nonfarm Payrolls (usually published two days later), because of the correlation between the two. The overlaying of both series is quite high, but on individual months, the discrepancy can be substantial. Another reason FX traders follow this report is the same as with the NFP – a persistent vigorous growth in employment figures increases inflationary pressures, and with it, the likelihood that the Fed will raise interest rates. Actual figures beating consensus tend to be USD bullish.
The EUR/USD weighs heavy weighting on the DXY. Markets think a hung parliament would restrict the Far-Right in Europe to enact costly voter-friendly fiscal changes, Rabobank analysts note.
EUR/USD is set to move lower in the coming months
“The direction of EUR/USD carries a heavy weighting within the DXY index. Despite the uncertainties connected with the French election, the EUR/USD is trading slightly above its mid-June levels as the market reacts to an increase in expectations that Le Pen’s far-right party will fail to win an outright parliamentary majority in Sunday’s run-off election.”
“From the market’s perspective a hung parliament should restrict the ability of the Far-Right to enact costly voter-friendly fiscal changes. Like other far-right parties across Europe currently, France’s National Rally party is far-right in terms of national identity and tight immigration policies but is also has a strong social agenda which would be costly in terms of the budget.”
“Looking beyond the short-term fluctuations, our bond strategists see the Bund/Oat spread trading in a wider range going forward and, if the market pays greater heed to both French and Italian budgets, EUR bulls could retreat. This supports the view that EUR/USD could move lower in the coming months.”
- US ISM Services PMI fell into contraction territory in June.
- US Dollar came under heavy selling pressure with the immediate reaction.
Business activity in the US service sector contracted in June, with the ISM Services PMI dropping to 48.8 from 53.8 in May. This reading missed the market expectation of 52.5 by a wide margin.
Other details of the report showed that the Prices Paid Index, the inflation component, edged lower to 56.3 from 58.1, while the Employment Index slumped to 46.1 from 47.1.
Assessing the survey's findings, "the decrease in the composite index in June is a result of notably lower business activity, a contraction in new orders for the second time since May 2020 and continued contraction in employment," said Steve Miller, Chair of the Institute for Supply Management (ISM) Services Business Survey Committee.
"Survey respondents report that in general, business is flat or lower, and although inflation is easing, some commodities have significantly higher costs," Miller added. "Panelists indicate that slower supplier delivery performance is due primarily to transportation challenges, not increases in demand."
Market reaction
The US Dollar came under heavy bearish pressure with the immediate reaction to the disappointing ISM Services PMI report. At the time of press, the US Dollar Index was down 0.5% on the day at 105.17.
- The Minutes of the Fed’s June 11-12 policy meeting will be published on Wednesday.
- Details of Jerome Powell and Co’s hawkish hold and their inflation outlook will be scrutinized.
- Markets wager a roughly 67% chance of a Fed interest-rate cut in September.
The Minutes of the US Federal Reserve (Fed) June 11-12 monetary policy meeting will be published on Wednesday at 18:00 GMT. Investors will scout for details into the Fed’s hawkish hold and policymakers’ outlook on inflation to gauge the timing of the expected interest rate cut this year.
Jerome Powell admits disinflation progress, a September cut likely?
The Fed maintained its monetary policy settings for the seventh consecutive meeting in June, as widely expected. In its policy statement, the US central bank said that “while inflation has slowed recently and the jobs market has become more balanced this year, the uncertain economic outlook keeps the Fed “highlight attentive to inflation risks”.”
“Summary of Economic Projections (SEP), the so-called Dot Plot, broadly met expectations with a higher inflation forecast for 2024 and less easing this year; The median FOMC member called for one 25 basis point cut by the end of this year and four 25 basis point cuts in 2025,” the policy statement read.
In the post-meeting press conference, Fed Chairman Jerome Powell noted that "we need further confidence, more good inflation readings but won't be specific about how many to start rate cuts. We'll also be looking at a balance of risks, and outlook as well." "Unexpected weakness in the labor market could also call for a response,” Powell explained.
Just a few hours before the Fed policy announcement, the US Bureau of Labor Statistics published the May inflation report. Data showed that the core Consumer Price Index (CPI) increased 0.2% on the month and 3.4% from a year ago, compared with respective estimates of 0.3% and 3.5%.
Since the May inflation report and the June policy announcement, several Fed policymakers remained wary about the inflation outlook, suggesting that the rates could stay ‘higher for longer’.
However, dovish Fed bets returned on the table after data on June 28 showed that the core Personal Consumption Expenditures (PCE) Price Index, the Fed’s preferred inflation measure, rose at an annual pace of 2.6% in May after advancing 2.7% a month before. May's inflation readings were in line with economists' expectations.
Fed Chairman Jerome Powell’s much-awaited comments at the European Central Bank (ECB) Forum on Central Banking in Sintra on Tuesday added to the Fed rate cut expectations. Powell acknowledged the recent progress in disinflation, which was perceived as dovish even though he quickly added he wanted to see more before being confident enough to start lowering interest rates.
Currently, markets see a 67% chance of the Fed lowering rates in September, a tad higher than about 63% seen before Powell’s commentary.
Previewing the Fed’s publication, “Wednesday's FOMC minutes will also shed light on the Fed's more cautious stance at the June meeting, though SEP projections might prove to be already somewhat stale,” TD Securities analysts said.
When will FOMC Minutes be released and how could it affect the US Dollar?
The Fed will release the minutes of the June 11-12 policy meeting at 18:00 GMT on Wednesday. Investors will keep a close eye on any hints on the timing of the policy pivot, especially after the ongoing disinflationary trend and dovish Fed Chair Powell’s remarks.
In case the Minutes show that policymakers continued to warrant caution on inflation, pushing back against aggressive Fed rate cut expectations while justifying a single rate cut later in the year, the US Dollar (USD) could stage a comeback against its major rivals. If the publication suggests that officials express their optimism on the encouraging progress in inflation, risk flows could regain momentum and weigh negatively on the USD.
Dhwani Mehta, Asian Session Lead Analyst, shares a brief technical outlook for the US Dollar Index (DXY):
“The US Dollar Index has been in a consolidative phase after retreating from two-month highs of 106.13, with risks likely to the upside amid a 21-day and the 50-day Simple Moving Averages (SMA) bullish crossover. The 14-day Relative Strength Index (RSI) stays firm above the 50 level, near 56.30, adding credence to the bullish potential. In case the index finds acceptance above the 106.00 threshold, a retest of June highs at 106.13 cannot be ruled. The next upside target is seen at the 106.50 psychological mark.”
“On the flip side, if the 21-day SMA support at 105.37 gives way, a test of the 50-day SMA at 105.17 will be inevitable. A sustained move below that level could fuel a fresh downtrend toward the 100-day SMA at 104.76.”
Economic Indicator
FOMC Minutes
FOMC stands for The Federal Open Market Committee that organizes 8 meetings in a year and reviews economic and financial conditions, determines the appropriate stance of monetary policy and assesses the risks to its long-run goals of price stability and sustainable economic growth. FOMC Minutes are released by the Board of Governors of the Federal Reserve and are a clear guide to the future US interest rate policy.
Read more.Next release: Wed Jul 03, 2024 18:00
Frequency: Irregular
Consensus: -
Previous: -
Source: Federal Reserve
Minutes of the Federal Open Market Committee (FOMC) is usually published three weeks after the day of the policy decision. Investors look for clues regarding the policy outlook in this publication alongside the vote split. A bullish tone is likely to provide a boost to the greenback while a dovish stance is seen as USD-negative. It needs to be noted that the market reaction to FOMC Minutes could be delayed as news outlets don’t have access to the publication before the release, unlike the FOMC’s Policy Statement.
Fed FAQs
Monetary policy in the US is shaped by the Federal Reserve (Fed). The Fed has two mandates: to achieve price stability and foster full employment. Its primary tool to achieve these goals is by adjusting interest rates. When prices are rising too quickly and inflation is above the Fed’s 2% target, it raises interest rates, increasing borrowing costs throughout the economy. This results in a stronger US Dollar (USD) as it makes the US a more attractive place for international investors to park their money. When inflation falls below 2% or the Unemployment Rate is too high, the Fed may lower interest rates to encourage borrowing, which weighs on the Greenback.
The Federal Reserve (Fed) holds eight policy meetings a year, where the Federal Open Market Committee (FOMC) assesses economic conditions and makes monetary policy decisions. The FOMC is attended by twelve Fed officials – the seven members of the Board of Governors, the president of the Federal Reserve Bank of New York, and four of the remaining eleven regional Reserve Bank presidents, who serve one-year terms on a rotating basis.
In extreme situations, the Federal Reserve may resort to a policy named Quantitative Easing (QE). QE is the process by which the Fed substantially increases the flow of credit in a stuck financial system. It is a non-standard policy measure used during crises or when inflation is extremely low. It was the Fed’s weapon of choice during the Great Financial Crisis in 2008. It involves the Fed printing more Dollars and using them to buy high grade bonds from financial institutions. QE usually weakens the US Dollar.
Quantitative tightening (QT) is the reverse process of QE, whereby the Federal Reserve stops buying bonds from financial institutions and does not reinvest the principal from the bonds it holds maturing, to purchase new bonds. It is usually positive for the value of the US Dollar.
- Silver price surges to near $30.50 as unexpectedly weak US ADP Employment data weighs on the US Dollar.
- Fed Powell admitted slight progress in inflation.
- Investors await the US ISM Services PMI and the FOMC minutes.
Silver price (XAG/USD) rallies to near $30.50 in Wednesday’s American session. The white metal weakens as the US Dollar (USD) fell on the backfoot after Federal Reserve (Fed) Chair Jerome Powell said in the European Central Bank (ECB) Forum on Central Banking on Tuesday that recent data suggests the United States (US) economy has returned on the disinflationary path.
Fed Powell acknowledged that the central bank has made quiet a bit progress on inflation. In spite of that policymakers want to see inflation declining for months before lowering interest rates. The US Dollar Index (DXY), which tracks the Greenback’s value against six major currencies, corrects further to near 105.50. 10-year US Treasury yields decline to near 4.42%. Lower yields on interest-bearing assets and the US Dollar reduce the opportunity cost of holding an investment in non-yielding assets, such as Silver.
Meanwhile, investors turn uncertain over labor market conditions as private payrolls unexpectedly dropped in June. The ADP Employment report showed that fresh payrolls came in at 150K. Economists forecasted them to have remained slightly higher at 160K than the prior release of 152K.
Going forward, investors will focus on the US ISM Services PMI for June and the Federal Open Market Committee (FOMC) minutes of the June meeting.
Silver technical analysis
Silver price attempts to deliver a breakout of the Falling Channel chart formation on a daily timeframe. This suggests that a corrective move in the Silver price has now concluded and it has resumed its upside journey.
The white metal climbs above the 20-day Exponential Moving Average (EMA) near $29.60, suggesting that the near-term trend is bullish.
The 14-period Relative Strength Index (RSI) approaches 60.00. A decisive break above the same would shift momentum towards the upside.
Silver daily chart
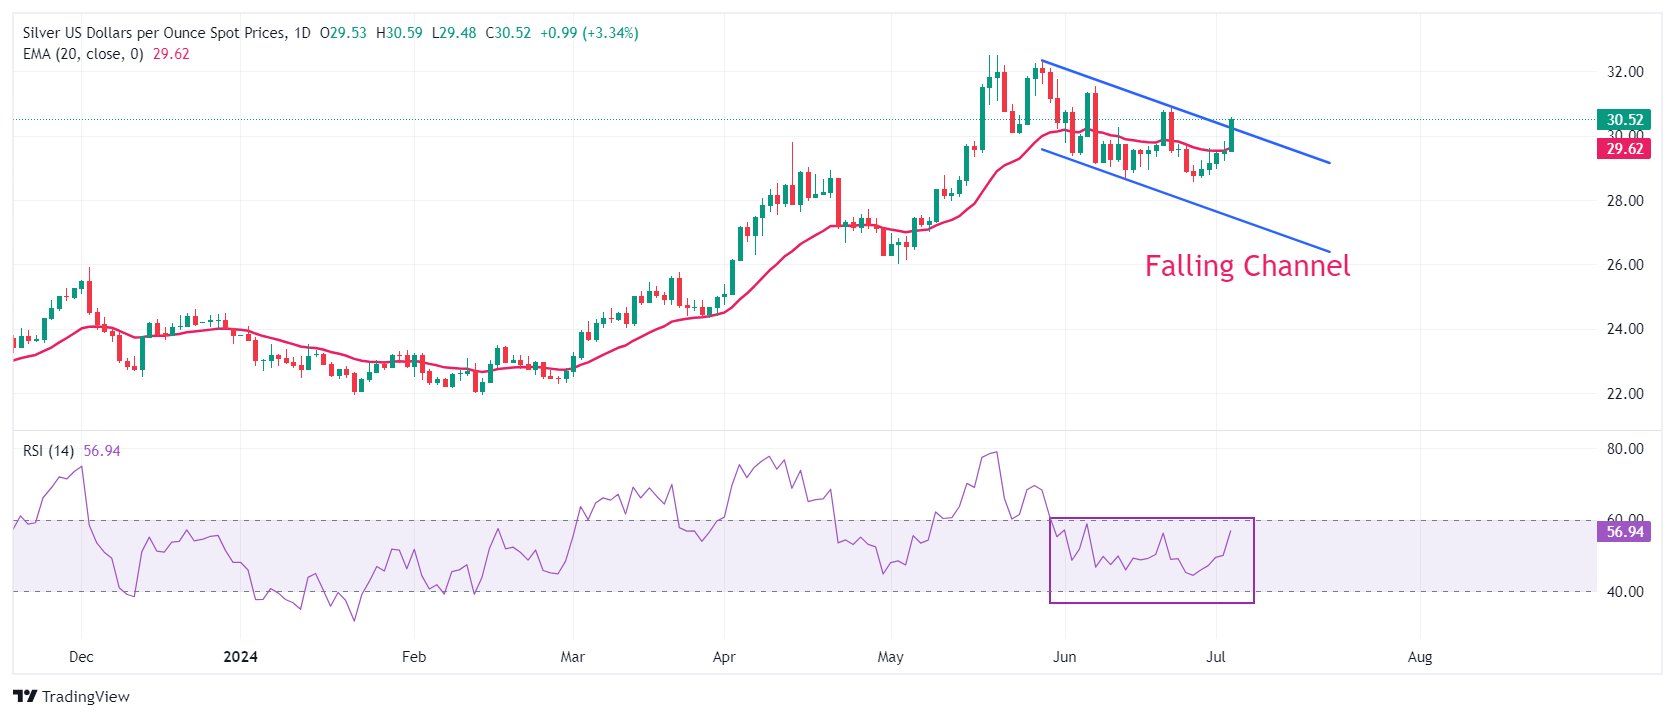
Economic Indicator
ADP Employment Change
The ADP Employment Change is a gauge of employment in the private sector released by the largest payroll processor in the US, Automatic Data Processing Inc. It measures the change in the number of people privately employed in the US. Generally speaking, a rise in the indicator has positive implications for consumer spending and is stimulative of economic growth. So a high reading is traditionally seen as bullish for the US Dollar (USD), while a low reading is seen as bearish.
Read more.Last release: Wed Jul 03, 2024 12:15
Frequency: Monthly
Actual: 150K
Consensus: 160K
Previous: 152K
Source: ADP Research Institute
Traders often consider employment figures from ADP, America’s largest payrolls provider, report as the harbinger of the Bureau of Labor Statistics release on Nonfarm Payrolls (usually published two days later), because of the correlation between the two. The overlaying of both series is quite high, but on individual months, the discrepancy can be substantial. Another reason FX traders follow this report is the same as with the NFP – a persistent vigorous growth in employment figures increases inflationary pressures, and with it, the likelihood that the Fed will raise interest rates. Actual figures beating consensus tend to be USD bullish.
- Initial Jobless Claims rose by 238K vs. the previous week.
- Continuing Jobless Claims increased by nearly 1.850M.
US citizens that applied for unemployment insurance benefits increased by 238K in the week ending June 29 according to the US Department of Labor (DoL) on Thursday. The prints came in above initial estimates (235K) and were higher than the previous weekly gain of 234K (revised from 233K).
Further details of the publication revealed that the advance seasonally adjusted insured unemployment rate was 1.2% and the 4-week moving average was 238.50K, an increase of 2.250K from the previous week's revised average.
In addition, Continuing Claims increased by 26K to 1.858M in the week ended June 22.
Market reaction
The US Dollar Index (DXY) maintains its bearish stance on Thursday, hovering around the mid-105.00s amidst the firm improvement in the risk-associated galaxy.
Federal Reserve (Fed) Chair Jay Powell sounded cautiously optimistic on disinflation which, paired with recent PCE data, allows markets to keep betting on a Fed rate cut in September, ING’s analyst Francesco Pesole notes.
Fed minutes less relevant than data
“The US Dollar (USD) traded on the soft side yesterday after Fed Chair Powell's comments in Sintra. As we had expected, he sounded rather upbeat on disinflation, even though he continued to warrant caution on the next policy move.”
“Today, the focus will be on a few important data releases: ADP employment, Jobless claims, and ISM services index for June. Yesterday, job openings for May rose unexpectedly, but the trend continues to point at the kind of “inflection point” in the jobs market described by the Fed’s Mary Daly in a recent comment.”
“The Fed will publish the minutes of the 12 June FOMC meeting. We expect members to voice concerns on inflation, although the market impact may not be very big after Powell’s comments in Sintra and recent encouraging data on disinflation. We see some downside risks for the USD stemming from softer US data, but the euro-heavy DXY may not show that very clearly.”
- Natural Gas sets forth its losing streak for a seventh day.
- European gas storages are filling up quickly, even with demand picking up.
- The US Dollar index eases ahead of a very full agenda due to Thursday’s public holiday.
Natural Gas price (XNG/USD) still stuck in its correction, adding a seventh day for now to the chronicles. The decline is being fueled again by the outlook that European gas storages are still being filled up, despite the current pickup in energy demand. Europe looks set to head into the next heating season with ample amount of supply to winter through.
Meanwhile, the US Dollar Index (DXY), which tracks the Greenback’s value against six major currencies, easing after US Federal Reserve Bank of Chicago President Austan Goolsbee had a change of heart and advocated for rate cuts during an interview with Bloomberg during the European Central Bank symposium in Sintra, Portugal. The change comes after several weeks of comments from Fed officials all signaling the same message: that rates should be kept steady for longer.
Natural Gas is trading at $2.45 per MMBtu at the time of writing.
Natural Gas news and market movers: Supply is flowing
- Norwegian gas operator GASSCO is showing that gas flows from Norway into Europe are above their 5-day average volume, according to Bloomberg.
- Northwestern Europe will see high temperatures returning by the weekend, which means energy consumption to pick up.
- Reuters reports that the French energy company TotalEnergies has notified South Africa's petroleum regulator of its plans to exit its offshore gas field but has yet to submit a formal request to do so, a source at Petroleum Agency SA said.
Natural Gas Technical Analysis: Still room to go
Natural Gas price has snapped the important 200-day Simple Moving Average (SMA) support near $2.53 and is ekeing out more losses. With that break lower, Gas price is now trading below $2.50. A very wide area is opening up now where gas prices could still sink around 8% lower, before the Relative Strength Index (RSI) reaches the oversold barrier.
The 200-day SMA turns now as a resistance, near $2.53. Once back above there, the pivotal level near $3.08 (March 6, 2023, high) remains key resistance after its false break last week, which is still 20% away. In addition, the red descending trendline in the chart below at $3.10 will also weigh on this area as a cap. Further up, the fresh year-to-date high at $3.16 is the level to beat.
On the downside, the next target could be the pivotal level near $2.13, with interim support by the 100-day SMA near $2.25
Natural Gas: Daily Chart
Natural Gas FAQs
Supply and demand dynamics are a key factor influencing Natural Gas prices, and are themselves influenced by global economic growth, industrial activity, population growth, production levels, and inventories. The weather impacts Natural Gas prices because more Gas is used during cold winters and hot summers for heating and cooling. Competition from other energy sources impacts prices as consumers may switch to cheaper sources. Geopolitical events are factors as exemplified by the war in Ukraine. Government policies relating to extraction, transportation, and environmental issues also impact prices.
The main economic release influencing Natural Gas prices is the weekly inventory bulletin from the Energy Information Administration (EIA), a US government agency that produces US gas market data. The EIA Gas bulletin usually comes out on Thursday at 14:30 GMT, a day after the EIA publishes its weekly Oil bulletin. Economic data from large consumers of Natural Gas can impact supply and demand, the largest of which include China, Germany and Japan. Natural Gas is primarily priced and traded in US Dollars, thus economic releases impacting the US Dollar are also factors.
The US Dollar is the world’s reserve currency and most commodities, including Natural Gas are priced and traded on international markets in US Dollars. As such, the value of the US Dollar is a factor in the price of Natural Gas, because if the Dollar strengthens it means less Dollars are required to buy the same volume of Gas (the price falls), and vice versa if USD strengthens.
- Gold is breaking above the 50-day SMA following a dovish speech by Fed Chairman Jerome Powell.
- Multiple geopolitical factors suggest a broadly bullish backdrop for the precious metal.
- XAU/USD trades above $2,340, increasing bullish bets of a recovery in the short term.
Gold (XAU/USD) rallies into the $2,340s on Wednesday as investors continue to digest the contents of Federal Reserve (Fed) Chairman Jerome Powell’s speech from Tuesday and the shift in monetary-policy stance that his words reflected.
Additionally, “bargain hunting” by longer-term investors may further support Gold, as they accumulate before another rally due to multiple global factors that continue to favor the precious metal over the long term.
Gold is attempting to penetrate the important 50-day Simple Moving Average (SMA), which has been capping its gains for several days. A bullish close on Wednesday would signal a fresh upside for the yellow metal.
Gold rising as Fed Chair Powell reinforces early rate-cut hopes
Gold is pushing higher as the words of Fed Chair Powell sink in and reinforce market expectations the Fed will cut interest rates in September. Powell said that “quite a lot of progress” had been made on defeating inflation, in his remarks at the central-banking forum in Sintra, Portugal. It is his first clear acknowledgment that the Fed is closing in on its target.
Powell added the familiar caveat that more data still needed to be seen to confirm the trend towards the Fed’s 2.0% inflation target before the central bank went ahead with rate cuts, yet he also added there was a risk of cutting too late as well as too early.
Heightened expectations of lower interest rates are positive for Gold as they reduce the opportunity cost of holding the non-interest-paying asset. Powell’s speech came after the Fed’s preferred inflation gauge, the Personal Consumption Expenditures (PCE) Price Index, showed a fall to 2.6% both for headline and core inflation in May.
The Fed has been adopting a cautious stance after getting it wrong in Q1 when policymakers expected inflation to fall more rapidly than it did. This led to an embarrassing u-turn, where from first predicting three 0.25% cuts in 2024, the Fed had to shift to a “wait-and-see” data-dependent stance. Markets are now pricing in a 65% probability of a first-rate cut in or before September, according to the CME FedWatch tool.
Gold gains on broader global backdrop
Gold is also rising as wider global factors enhance its value.
Ongoing conflicts in the Middle East and Ukraine and a political lurch right in Europe, are leading wary investors to opt for the safe and secure: enter Gold.
In the US, the Supreme Court’s decision to grant former US President Donald Trump partial immunity from prosecution over the uprising that followed his 2020 defeat, combined with question marks over President Joe Biden, his rival’s fitness for office, have increased the chances of a second Trump presidency materializing – something that would further destabilize global security.
Furthermore, the expansion of the BRICS trading confederation is challenging the dominance of the US Dollar with Gold as the most realistic replacement in international trade for those countries not wishing or denied access to Dollar-denominated markets.
Technical Analysis: Gold attempts to break above 50-day SMA
Gold is pushing higher and piercing the 50-day SMA on an intraday basis. If it manages to close above the key resistance level, it could mark the beginning of a more bullish phase for the precious metal.
XAU/USD has twice now broken above a trendline connecting the “Head” and “Right Shoulder” of what was a Head and Shoulders (H&S) topping pattern with bearish connotations. The breaks invalidate the pattern, although there is still a lesser chance it could be a more complex topping pattern instead.
XAU/USD Daily Chart
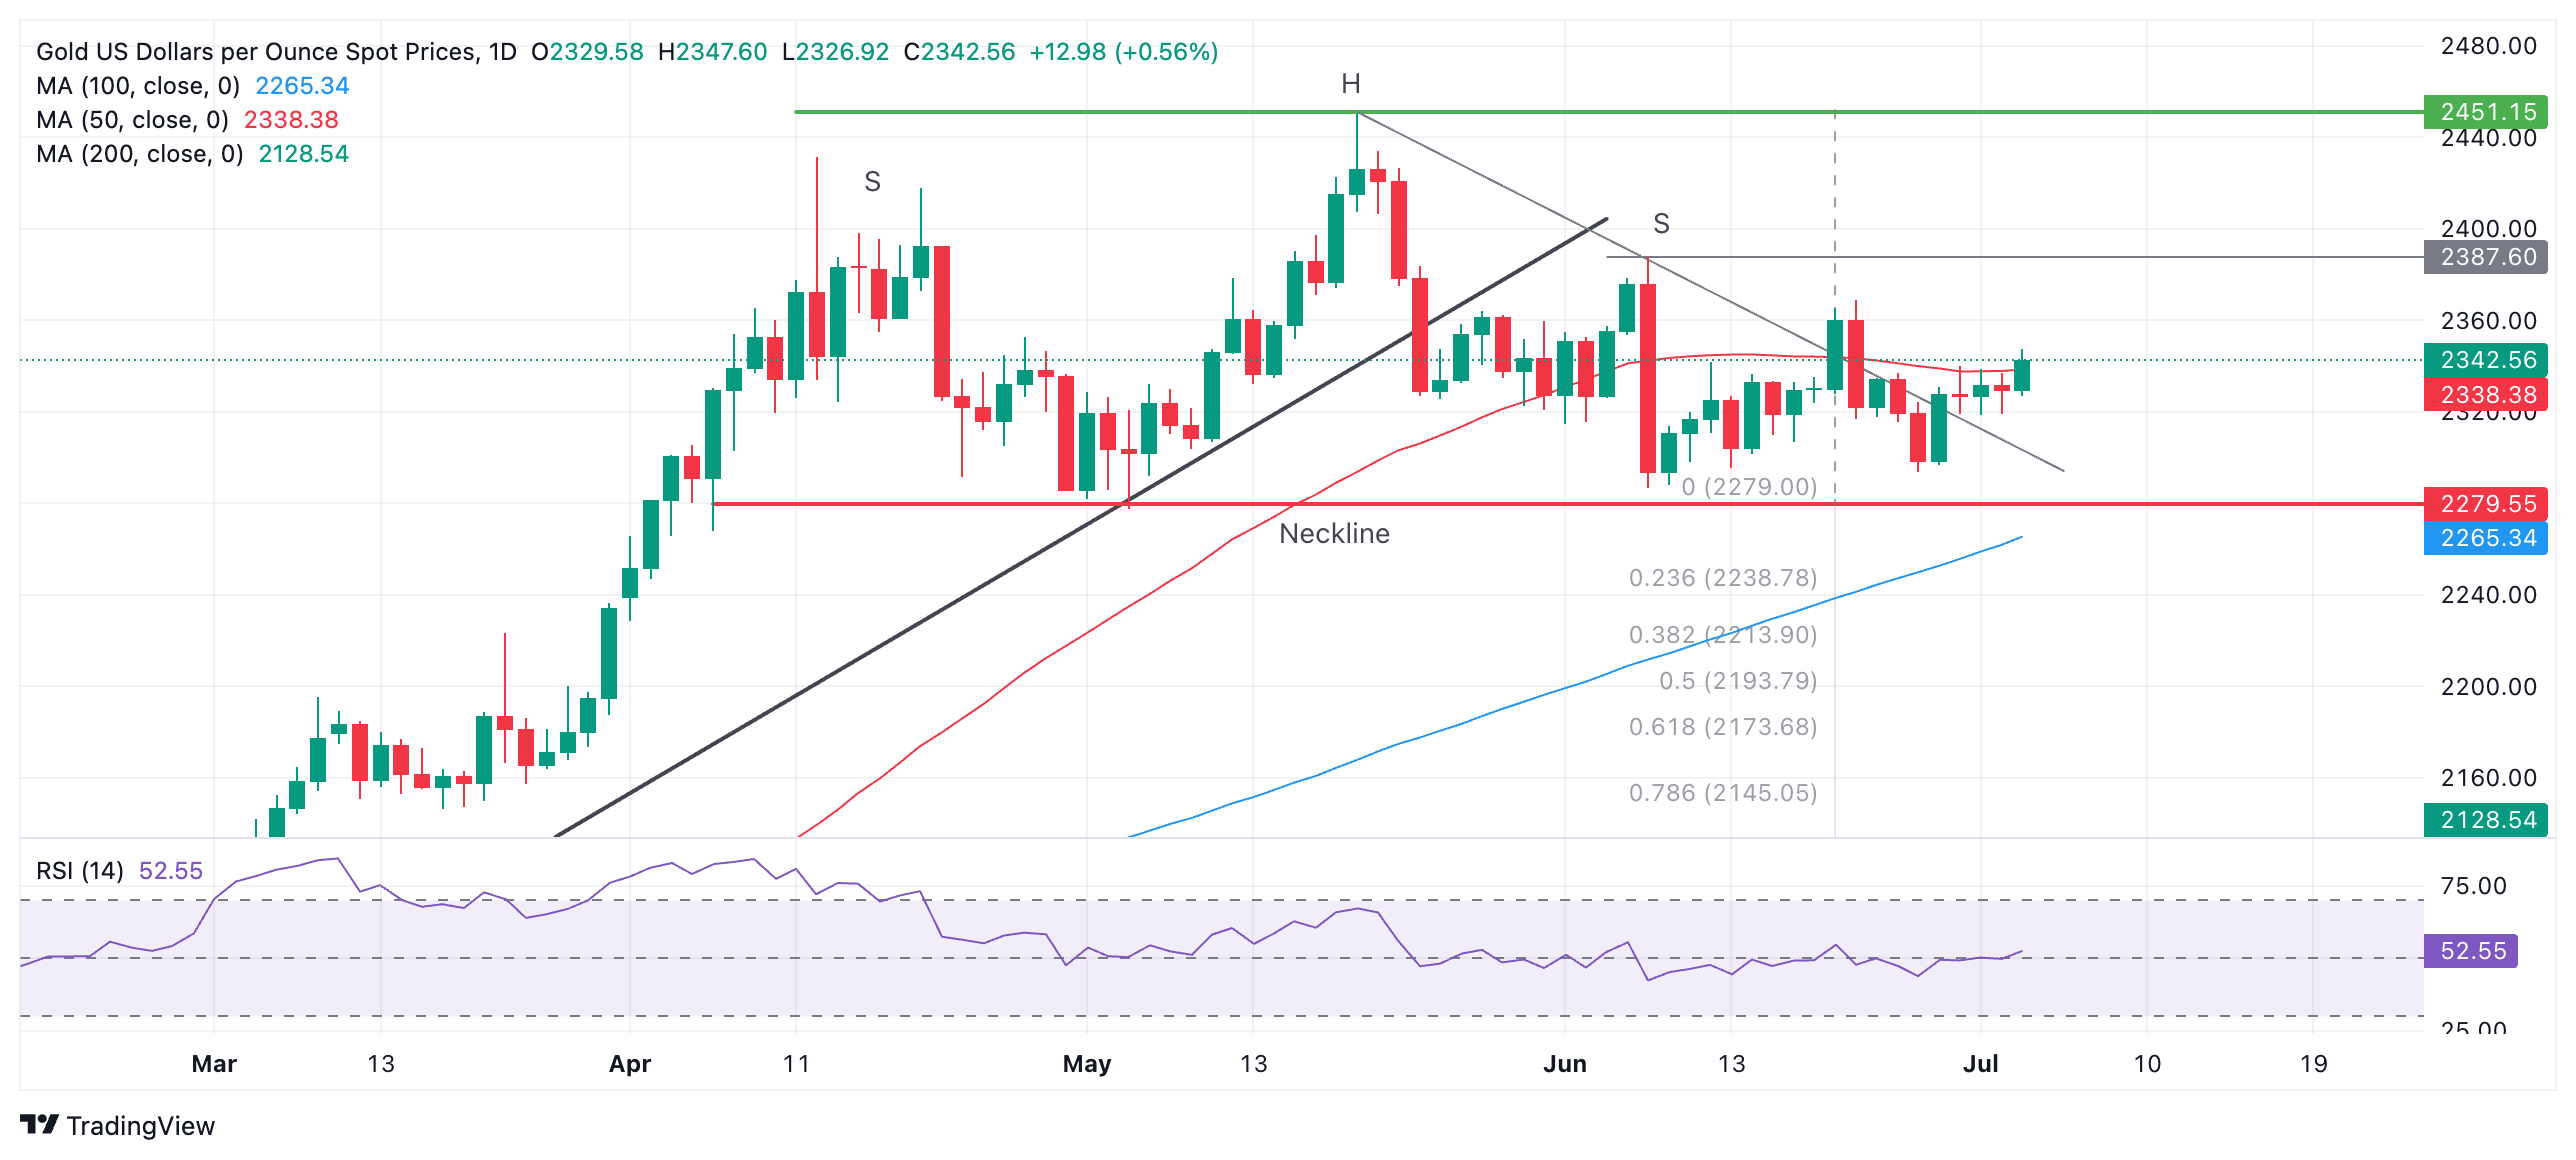
Since the break above $2,340, Gold will probably now rise to the $2,369 level (the June 21 high). The next target after that is $2,388, the June 7 high.
Alternatively, assuming the compromised topping pattern’s neckline at $2,279 is broken, a reversal lower may still follow, with a conservative target at $2,171, the 0.618 ratio of the height of the pattern extrapolated lower.
The trend is now sideways in both the short and medium term. In the long term, Gold remains in an uptrend.
Gold FAQs
Gold has played a key role in human’s history as it has been widely used as a store of value and medium of exchange. Currently, apart from its shine and usage for jewelry, the precious metal is widely seen as a safe-haven asset, meaning that it is considered a good investment during turbulent times. Gold is also widely seen as a hedge against inflation and against depreciating currencies as it doesn’t rely on any specific issuer or government.
Central banks are the biggest Gold holders. In their aim to support their currencies in turbulent times, central banks tend to diversify their reserves and buy Gold to improve the perceived strength of the economy and the currency. High Gold reserves can be a source of trust for a country’s solvency. Central banks added 1,136 tonnes of Gold worth around $70 billion to their reserves in 2022, according to data from the World Gold Council. This is the highest yearly purchase since records began. Central banks from emerging economies such as China, India and Turkey are quickly increasing their Gold reserves.
Gold has an inverse correlation with the US Dollar and US Treasuries, which are both major reserve and safe-haven assets. When the Dollar depreciates, Gold tends to rise, enabling investors and central banks to diversify their assets in turbulent times. Gold is also inversely correlated with risk assets. A rally in the stock market tends to weaken Gold price, while sell-offs in riskier markets tend to favor the precious metal.
The price can move due to a wide range of factors. Geopolitical instability or fears of a deep recession can quickly make Gold price escalate due to its safe-haven status. As a yield-less asset, Gold tends to rise with lower interest rates, while higher cost of money usually weighs down on the yellow metal. Still, most moves depend on how the US Dollar (USD) behaves as the asset is priced in dollars (XAU/USD). A strong Dollar tends to keep the price of Gold controlled, whereas a weaker Dollar is likely to push Gold prices up.
Federal Reserve (Fed) Chair Jerome Powell said recent data suggest that they’re getting back on a disinflationary path and that unexpected labor market weakening could prompt a policy reaction, BBH macro analysts note.
Fed policy might pivot soon
“Fed Chair Jerome Powell said recent data ‘suggest that we’re getting back on a disinflationary path. What we’d like to see is more data like what we’ve been seeing recently.’ He added that unexpected labor market weakening could prompt a policy reaction.”
“Elsewhere, Goolsbee said ‘If employment starts falling apart or if the economy begins to weaken, which you’ve seen some warning signs, you’ve got to balance that off with how progress you’re making on the price front. The unemployment rate is still quite low, but it has been rising.’”
“More and more Fed officials are expressing concern about the state of the labor market. We started to see this last week, when both Goolsbee and Daly hinted that Fed policy might pivot soon. Again, the Fed is certainly more concerned about the labor market than it's been in the past. If the data cooperate, we believe a September cut remains very much in play.”
- The US Dollar is a touch softer on Wednesday ahead of FOMC Minutes.
- Markets are easing their positions on the US Dollar after Fed’s Goolsbee calls for a rate cut.
- The US Dollar index retreats away from 106.00.
The US Dollar (USD) eases on Wednesday after surprise comments from US Federal Reserve Bank of Chicago President Austan Goolsbee in Sintra during the European Central Bank symposium. Goolsbee said that keeping rates steady while inflation is coming down should also be considered as tightening and is no longer needed, suggesting interest rate cuts on the table. Ahead of the Fed’s Federal Open Market Committee (FOMC) Minutes, a bold statement to make.
On the US economic front, the calendar is very crowded on Wednesday, with many data points being moved from Thursday due to the US public holiday. The main key element will be the ADP Employment Change number for June ahead of the US Nonfarm Payrolls print on Friday. Additionally, the FOMC Minutes for the June meeting will be released at the end of the day, and some volatility looks to be guaranteed.
Daily digest market movers: Goolsbee dissents
- At 11:30 GMT, the Challenger Job Cuts for June will be released. The previous number was at 63,816.
- The June ADP Employment Change data will be released at 12:15 GMT. An increase of 160,000 is expected after the 152,000 seen in May.
- Weekly Jobless Claims are to come in at 12:30 GMT, exceptionally on Wednesday:
- Initial Jobless Claims for the week ending June 28 are expected to rise to 235,000 from 233,000 a week before.
- Continuing Jobless Claims were at 1.839 million, with no consensus number available for the week ending June 21.
- At 14:00 GMT, the Institute for Supply Management will release June’s Purchasing Managers Index (PMI) reading for the Services sector:
- The Employment Index was at 47.1 in May, with no forecast available for June.
- The New Orders Index was at 54.1 in May, with no forecast available for June.
- The ISM Services PMI is expected to ease to 52.5 in June from 53.8.
- The Prices Paid Index was at 58.1 in May, with no forecast available for June.
- On the Federal Reserve front, some communication on the docket:
- At 10:30 GMT, comments from the Federal Reserve Bank of New York President John Williams, who participates in a panel about drivers of equilibrium interest rates at the ECB Forum on central banking in Sintra, Portugal.
- At 18:00 GMT, the FOMC Minutes for the Federal Reserve’s June meeting will be released.
- European equities are flirting with a 1% increase on the day. US Futures are still looking for direction.
- The CME Fedwatch Tool is broadly backing a rate cut in September despite recent comments from Fed officials. The odds now stand at 59.9% for a 25-basis-point cut. A rate pause stands at a 34.7% chance, while a 50-basis-point rate cut has a slim 5.4% possibility.
- The US 10-year benchmark rate trades near 4.44%, near this week’s high.
US Dollar Index Technical Analysis: FOMC breaks up
The US Dollar Index (DXY) is easing a touch after Fed member Goolsbee dissented from his fellow members by saying that keeping rates steady for longer is not helping anymore. His call for rate cuts is a welcomed change after hearing each and every FOMC member saying that rates will remain steady for longer. Rate cuts should see some weakening of the Greenback, and could mean that the DXY will not be making any new highs anytime soon.
On the upside, the pivotal level of 105.89 is a must-have for additional gains. Once a daily close has taken place above that level, marching above the red descending trend line in the chart below at 106.26 and the peak of April at 106.52 are the two main resistances ahead of a fresh nine-month high. That would be reached once 107.35 is broken to the upside.
On the downside, 105.53 is the first support ahead of a trifecta of Simple Moving Averages (SMA). Next down is the 55-day SMA at 105.24, safeguarding the 105.00 round figure. A touch lower, near 104.75 and 104.45, both the 100-day and the 200-day SMA form a double layer of protection to support any declines together with the green ascending trendline from last December.
US Dollar Index: Daily Chart
US Dollar FAQs
The US Dollar (USD) is the official currency of the United States of America, and the ‘de facto’ currency of a significant number of other countries where it is found in circulation alongside local notes. It is the most heavily traded currency in the world, accounting for over 88% of all global foreign exchange turnover, or an average of $6.6 trillion in transactions per day, according to data from 2022. Following the second world war, the USD took over from the British Pound as the world’s reserve currency. For most of its history, the US Dollar was backed by Gold, until the Bretton Woods Agreement in 1971 when the Gold Standard went away.
The most important single factor impacting on the value of the US Dollar is monetary policy, which is shaped by the Federal Reserve (Fed). The Fed has two mandates: to achieve price stability (control inflation) and foster full employment. Its primary tool to achieve these two goals is by adjusting interest rates. When prices are rising too quickly and inflation is above the Fed’s 2% target, the Fed will raise rates, which helps the USD value. When inflation falls below 2% or the Unemployment Rate is too high, the Fed may lower interest rates, which weighs on the Greenback.
In extreme situations, the Federal Reserve can also print more Dollars and enact quantitative easing (QE). QE is the process by which the Fed substantially increases the flow of credit in a stuck financial system. It is a non-standard policy measure used when credit has dried up because banks will not lend to each other (out of the fear of counterparty default). It is a last resort when simply lowering interest rates is unlikely to achieve the necessary result. It was the Fed’s weapon of choice to combat the credit crunch that occurred during the Great Financial Crisis in 2008. It involves the Fed printing more Dollars and using them to buy US government bonds predominantly from financial institutions. QE usually leads to a weaker US Dollar.
Quantitative tightening (QT) is the reverse process whereby the Federal Reserve stops buying bonds from financial institutions and does not reinvest the principal from the bonds it holds maturing in new purchases. It is usually positive for the US Dollar.
- AUD/USD trades sideways below 0.6700 for more than two weeks.
- The RBA could tighten its monetary policy further as disinflation appears to have reversed.
- Investors await the US ADP Employment Change and the ISM Services PMI for June.
The AUD/USD pair stays in a tight range below the immediate resistance of 0.6700 from almost three weeks. The upside in the Aussie asset appears to be restricted as the Reserve Bank of Australia (RBA) has not leaned strongly towards raising interest rates further despite price pressures appear to have revamped again.
Australia’s Monthly Consumer Price Index (CPI) has been accelerating for the last three months after progress in the disinflation process stalled in the December-February period. In May, the inflation measure grew strongly by 4.0% from expectations of 3.8% and the prior release of 3.6%.
Meanwhile, the US Dollar (USD) remains on the backfoot as financial markets expect the Federal Reserve (Fed) to start reducing interest rates after the September meeting. According to 30-day Federal Funds pricing data from the CME FedWatch tool, the Fed is also expected to deliver two rate cuts this year.
On Tuesday, Fed Chair Jerome Powell said at the European Central Bank (ECB) Forum of the Central Banking in Sintra, Portugal that the central bank has made quiet a bit progress on inflation and recent data shows that disinflation has resumed. In spite of that policymakers want to see inflation declining for months before cutting interest rates.
In today’s session, investors will focus on the ADP Employment Change and the ISM Services PMI reports for June. The ADP is expected to show that 160K job-seekers were hired by private employers, slightly higher than May’s reading of 152K. The ISM Services PMI is estimated to have expanded at a slower pace of 52.5 from the former release of 53.8.
This week, the major trigger for the US Dollar will be the Nonfarm Payrolls (NFP) data for June, which will be published on Friday.
Australian Dollar FAQs
One of the most significant factors for the Australian Dollar (AUD) is the level of interest rates set by the Reserve Bank of Australia (RBA). Because Australia is a resource-rich country another key driver is the price of its biggest export, Iron Ore. The health of the Chinese economy, its largest trading partner, is a factor, as well as inflation in Australia, its growth rate and Trade Balance. Market sentiment – whether investors are taking on more risky assets (risk-on) or seeking safe-havens (risk-off) – is also a factor, with risk-on positive for AUD.
The Reserve Bank of Australia (RBA) influences the Australian Dollar (AUD) by setting the level of interest rates that Australian banks can lend to each other. This influences the level of interest rates in the economy as a whole. The main goal of the RBA is to maintain a stable inflation rate of 2-3% by adjusting interest rates up or down. Relatively high interest rates compared to other major central banks support the AUD, and the opposite for relatively low. The RBA can also use quantitative easing and tightening to influence credit conditions, with the former AUD-negative and the latter AUD-positive.
China is Australia’s largest trading partner so the health of the Chinese economy is a major influence on the value of the Australian Dollar (AUD). When the Chinese economy is doing well it purchases more raw materials, goods and services from Australia, lifting demand for the AUD, and pushing up its value. The opposite is the case when the Chinese economy is not growing as fast as expected. Positive or negative surprises in Chinese growth data, therefore, often have a direct impact on the Australian Dollar and its pairs.
Iron Ore is Australia’s largest export, accounting for $118 billion a year according to data from 2021, with China as its primary destination. The price of Iron Ore, therefore, can be a driver of the Australian Dollar. Generally, if the price of Iron Ore rises, AUD also goes up, as aggregate demand for the currency increases. The opposite is the case if the price of Iron Ore falls. Higher Iron Ore prices also tend to result in a greater likelihood of a positive Trade Balance for Australia, which is also positive of the AUD.
The Trade Balance, which is the difference between what a country earns from its exports versus what it pays for its imports, is another factor that can influence the value of the Australian Dollar. If Australia produces highly sought after exports, then its currency will gain in value purely from the surplus demand created from foreign buyers seeking to purchase its exports versus what it spends to purchase imports. Therefore, a positive net Trade Balance strengthens the AUD, with the opposite effect if the Trade Balance is negative.
Federal Reserve (Fed) Chair Powell said yesterday that the strength of the US economy and labor market meant the Fed could take its time in cutting rates. Taking time means tightening policy further, and this is a rather risky point of view, UBS analyst Paul Donovan notes.
Signs of strain in the US, French elections ease their grasp
“Powell seems to have a rather trusting belief in the precision of economic data. The declining accuracy of data reduces certainty about the state of the US economy. While a soft landing seems to have been achieved, looking across a broad range of indicators there are signs of strain (perhaps especially in the labor market).”
“In France, over two hundred candidates have withdrawn from three-way contests in the second round of the national assembly elections. This is a 'front républicain', aimed at preventing the far-right Rassemblement National from taking office. Markets will view this as reducing the possibility of an absolute majority in the assembly.”
“Assorted sentiment polls clutter the calendar, and there is ongoing central bank chatter. The US is releasing May factory orders data, but this is rarely an indicator that markets care that much about.”
- EUR/USD moves higher to 1.0770 as the US Dollar corrects, and the preliminary Eurozone service inflation for June remains sticky.
- The US Dollar declines as Fed’s Powell remains confident that disinflation has resumed.
- Headline Eurozone HICP decelerated expectedly, while the core figure grew steadily year-on-year.
EUR/USD jumps higher to near 1.0770 in Wednesday’s European session after a strong recovery from the round-level support of 1.0700 on Tuesday. The major currency pair extends its recovery as sticky preliminary Eurozone service inflation for June deepens fears of price pressures remaining elevated for a longer period.
Also, other components of the preliminary Eurozone Harmonized Index of Consumer Prices (HICP) report showed that headline inflation decelerated expectedly to 2.5% from May’s reading of 2.6%. In the same period, the core HICP that excludes volatile items rose at a steady pace of 2.9%, and remained higher than estimates of 2.8%. The overall data fails to provide any clarity on where price pressures are heading and kept the European Central Bank’s (ECB) interest-rate outlook uncertain.
However, ECB President Christine Lagarde said at the ECB Forum on Central Banking that inflation is moving in the right direction, and the central bank is very advanced in the disinflation path.
On the interest rate outlook, ECB policymaker and Ireland’s Central Bank Governor Gabriel Makhlouf said he is comfortable with one more rate cut this year but not with market expectations of two. However, he didn’t rule out the possibility.
On the political front, the centralist alliance and the left wing of the European Union’s (EU) second-largest nation withdrew more than 200 candidates from Sunday’s parliamentary elections in an attempt to thwart the far right from gaining an absolute majority.
Daily digest market movers: EUR/USD recovers further as US Dollar falls
- EUR/USD extends its recovery to near 1.0770 as the US Dollar (USD) corrects further. The major currency pair strengthens as the commentary from Federal Reserve (Fed) Chair Jerome Powell at the ECB Forum on Central Banking indicated that the United States (US) economy has resumed its journey on the disinflation path.
- Powell said that recent data indicate the disinflation process has resumed and added that the central bank has made quite a bit of progress in inflation. However, he also said policymakers want to see more good inflation data before cutting interest rates. Powell's comments were much more in line with expectations and his speech delivered at the June policy meeting.
- Meanwhile, expectations for the Fed to reduce interest rates twice this year and initiate the easing cycle from the September meeting remain firm. Going forward, investors will pay close attention to the US Nonfarm Payrolls (NFP) data for June, which will be published on Friday. The NFP report will indicate the current status of labor demand and wage growth, which will influence market speculation for Fed rate cuts in September.
- The US Dollar will remain uncertain on an event-packed Wednesday as ADP Employment Change, ISM Services Purchasing Managers’ Index (PMI), and the Federal Open Market Committee (FOMC) Minutes for June are scheduled for release.
Technical Analysis: EUR/USD extends recovery to 1.0770
EUR/USD moves higher to near 1.0770 after a decisive break of the Hammer candlestick formation on a daily timeframe. The broader trend remains sideways amid a Symmetrical Triangle formation that exhibits a volatility contraction.
Last week, the major currency pair rebounded after finding strong buying interest near the upward-sloping border of the Symmetrical Triangle formation near 1.0666, which is marked from the 3 October 2023 low at 1.0448. The downward-sloping border of the above-mentioned chart pattern is plotted from 18 July 2023 high at 1.1276. The Symmetrical Triangle formation exhibits a sharp volatility contraction, which indicates low volume and narrow ticks.
The major currency pair remains below the 200-day Exponential Moving Average (EMA) near 1.0790, suggesting that the overall trend is bearish.
The 14-period Relative Strength Index (RSI) oscillates in the 40.00-60.00 range, suggesting indecisiveness among market participants.
Euro FAQs
The Euro is the currency for the 20 European Union countries that belong to the Eurozone. It is the second most heavily traded currency in the world behind the US Dollar. In 2022, it accounted for 31% of all foreign exchange transactions, with an average daily turnover of over $2.2 trillion a day. EUR/USD is the most heavily traded currency pair in the world, accounting for an estimated 30% off all transactions, followed by EUR/JPY (4%), EUR/GBP (3%) and EUR/AUD (2%).
The European Central Bank (ECB) in Frankfurt, Germany, is the reserve bank for the Eurozone. The ECB sets interest rates and manages monetary policy. The ECB’s primary mandate is to maintain price stability, which means either controlling inflation or stimulating growth. Its primary tool is the raising or lowering of interest rates. Relatively high interest rates – or the expectation of higher rates – will usually benefit the Euro and vice versa. The ECB Governing Council makes monetary policy decisions at meetings held eight times a year. Decisions are made by heads of the Eurozone national banks and six permanent members, including the President of the ECB, Christine Lagarde.
Eurozone inflation data, measured by the Harmonized Index of Consumer Prices (HICP), is an important econometric for the Euro. If inflation rises more than expected, especially if above the ECB’s 2% target, it obliges the ECB to raise interest rates to bring it back under control. Relatively high interest rates compared to its counterparts will usually benefit the Euro, as it makes the region more attractive as a place for global investors to park their money.
Data releases gauge the health of the economy and can impact on the Euro. Indicators such as GDP, Manufacturing and Services PMIs, employment, and consumer sentiment surveys can all influence the direction of the single currency. A strong economy is good for the Euro. Not only does it attract more foreign investment but it may encourage the ECB to put up interest rates, which will directly strengthen the Euro. Otherwise, if economic data is weak, the Euro is likely to fall. Economic data for the four largest economies in the euro area (Germany, France, Italy and Spain) are especially significant, as they account for 75% of the Eurozone’s economy.
Another significant data release for the Euro is the Trade Balance. This indicator measures the difference between what a country earns from its exports and what it spends on imports over a given period. If a country produces highly sought after exports then its currency will gain in value purely from the extra demand created from foreign buyers seeking to purchase these goods. Therefore, a positive net Trade Balance strengthens a currency and vice versa for a negative balance.
In contrast to the strong data releases in previous months, June PMIs declined unexpectedly with the composite indicator falling to 50.8 from 52.5 in May, below expectations of 52.5,
Eurozone economy to continue growing
“Despite, the downtick, the composite PMI was significantly higher in Q2 compared to Q1, indicating that the economy also grew in Q2. Hence, we expect the economy to continue growing, driven by a strong services sector, resilient labour market and rising real incomes.”
“Headline inflation in June declined to 2.5% y/y from 2.6% y/y due to lower energy and food inflation, while core remained sticky at 2.9% y/y. Decomposing the print reveals a continued strong momentum in services inflation. Akin to the picture seen lately, underlying inflation momentum - especially services inflation - remains too high for the ECB's comfort.”
“In the French election, we believe the most probable outcome is that no party will gain an absolute majority, resulting in a 'hung parliament' and policy gridlock. Hence, France's public spending, which has been a centre of attention in recent weeks, is not set to rise markedly.”
The manufacturing PMI stayed below 50 for a second straight month in June as demand softened. Real activity growth likely edged down partly due to base effects; export growth may have stayed strong, Standard Chartered Global Research analysts Hunter Chan and Shuang Ding note.
Production remained robust amid weak demand
“China’s official manufacturing PMI stood at 49.5 in June, staying in contractionary territory for a second month. That said, production activity remained resilient. The average production PMI picked up 0.3pt from Q1 to 51.4 in Q2. Meanwhile, the average new orders PMI fell 0.2pts to 50.1.”
“Industrial production (IP), retail sales and fixed asset investment (FAI) growth likely edged down in June versus May, partly due to base effects. External demand may have remained resilient, supporting production activity. The consumer goods trade-in programme likely supported retail sales of home appliances.”
“PPI deflation likely eased further to 0.5% y/y in June due to a low base, while CPI inflation may have inched up to 0.4% y/y. We believe M2 and credit growth slowed further amid weak credit demand, and enhanced regulatory and statistical measures.”
The two most-watched US economic surprise indices, published by Bloomberg and Citi, are showing a steady downward trend – i.e., a lot of negative surprises in the data, Societe Generale FX strategist Kit Juckes notes.
Services ISM and Friday’s NFP data attract plenty of interest
“The negative surprises in data clearly affect sentiment, though we are wary of over-interpreting short-term swings and roundabouts with the data and since employment growth remains consistent with a tight labour market, the Federal Reserve (Fed) will want to see a lot more evidence before embarking on an easing cycle.”
“The downtrend in the data increases the focus on the most closely watched releases; ISMs, labour market data and the CPI/PCE inflation readings. Wednesday services ISM and Friday’s NFP data will attract plenty of interest and any surprise will trigger a reaction.”
“We expect the services ISM to fall back from 53.8 to 52.3, which is consistent with steady growth, and payroll employment to increase by 220,000. I’ll guess the market needs to see something closer to 150k in payrolls and an ISM closer to 50, to get really excited and start selling the dollar.”
- WTI drops from two-month high of $83.77 as risks to Oil supply due to disruption in facilities at Gulf of Mexico eases.
- The US API reported a big drawdown in Oil inventories for the week ending June 28.
- Investors await the US NFP data for fresh guidance on the Fed’s interest rates.
West Texas Intermediate (WTI), futures on NYMEX, correct to near $82.30 from a two-month high of $83.77 in Wednesday’s European session. The Oil price comes under pressure after a sharp rally as supply concerns over Hurricane Beryl reaching the Gulf of Mexico ease. However, the near-term outlook appears to be firm due to a larger-than-expected drawdown in the United States (US) American Petroleum Institute (API) crude oil inventories for the week ending June 28.
The latest weather forecast from the US National Hurricane Center indicated that Hurricane Beryl would weaken into a tropical storm. Earlier, it was expected that it would disrupt oil production facilities in the Gulf of Mexico.
Meanwhile, the US API reported that oil stockpiles declined by 9.163 million barrels after a small build-up of 0.91 million barrels last week.
In Wednesday’s session, investors will focus on the crude oil inventories data from the US Energy Information Administration (EIA), which will be published at 14:30 GMT. The agency is expected to report a small drawdown in oil inventories by 0.15 million barrels.
On the economic front, investors await the US Nonfarm Payrolls (NFP) data for June, which will be published on Friday. The Employment data will indicate the labor demand and the wage growth, which will influence market expectations for Federal Reserve (Fed) to begin reducing interest rates from the September meeting. Higher expectations for early Fed rate cuts are favorable for the Oil price.
Brent Crude Oil FAQs
Brent Crude Oil is a type of Crude Oil found in the North Sea that is used as a benchmark for international Oil prices. It is considered ‘light’ and ‘sweet’ because of its high gravity and low sulfur content, making it easier to refine into gasoline and other high-value products. Brent Crude Oil serves as a reference price for approximately two-thirds of the world's internationally traded Oil supplies. Its popularity rests on its availability and stability: the North Sea region has well-established infrastructure for Oil production and transportation, ensuring a reliable and consistent supply.
Like all assets supply and demand are the key drivers of Brent Crude Oil price. As such, global growth can be a driver of increased demand and vice versa for weak global growth. Political instability, wars, and sanctions can disrupt supply and impact prices. The decisions of OPEC, a group of major Oil-producing countries, is another key driver of price. The value of the US Dollar influences the price of Brent Crude Oil, since Oil is predominantly traded in US Dollars, thus a weaker US Dollar can make Oil more affordable and vice versa.
The weekly Oil inventory reports published by the American Petroleum Institute (API) and the Energy Information Agency (EIA) impact the price of Brent Crude Oil. Changes in inventories reflect fluctuating supply and demand. If the data shows a drop in inventories it can indicate increased demand, pushing up Oil price. Higher inventories can reflect increased supply, pushing down prices. API’s report is published every Tuesday and EIA’s the day after. Their results are usually similar, falling within 1% of each other 75% of the time. The EIA data is considered more reliable, since it is a government agency.
OPEC (Organization of the Petroleum Exporting Countries) is a group of 13 Oil producing nations who collectively decide production quotas for member countries at twice-yearly meetings. Their decisions often impact Brent Crude Oil prices. When OPEC decides to lower quotas, it can tighten supply, pushing up Oil prices. When OPEC increases production, it has the opposite effect. OPEC+ refers to an expanded group that includes ten extra non-OPEC members, the most notable of which is Russia.
The Euro (EUR) is back where it was before parliamentary elections were called, Societe Generale FX strategist Kit Juckes notes.
EUR is beck where it was
“1-mnth volatility is most of the way back to where it was before parliamentary elections were called. Insouciance or simply a case that the consensus was already so negative that it takes a lot of bad news to get it significantly lower?”
“Either way, I still think there’s less upside from here than downside and we see a 1.03-1.09 range holding for the rest of the year.”
The Australian Dollar (AUD) continues to find support in solid data, this morning in the form of retail sales, Societe Generale analyst Kit Juckes notes.
AUD/JPY draws attention of the market
“The front end of the curve now prices a 50% chance of another rate hike this year and the Australian/US 2y yield differential is wider than it was at the start of the year (when AUD/USD was above 0.68).”
“The more fashionable trade today, however, may be to buy AUD/JPY. The Japanese Yen (JPY) bears are talking of the BoJ’s next line in the sand being at USD/JPY 6, though most of them simply think that as long as yield differentials are huge, the yen can just keep on falling.”
“I can’t see the yen turning around until Fed easing is in view, and AUD/JPY has now broken above the 2007 peak and is back at levels last spotted in 1991.”
The US Dollar (USD) could edge above 7.3100. The next resistance at 7.3200 is unlikely to come into view, but it is too early to tell if the next significant resistance at 7.3400 will come into view, UOB Group analysts note.
USD can edge above 7.3100
24-HOUR VIEW: “Yesterday, we indicated that ‘there is a chance for USD to edge above 7.3100, but it is unlikely to be able to maintain a foothold above this level.’ However, USD traded in a narrow range between 7.3029 and 7.3094, closing at 7.3072 (+0.02%). The underlying tone still appears to be firm, and we continue to expect USD to edge above 7.3100. The next resistance at 7.3200 is unlikely to come into view. Support levels are at 7.3020 and 7.2980.”
1-3 WEEKS VIEW: “In our most recent narrative from last Thursday (27 Jun, spot at 7.2990), we indicated that USD could break above 7.3100, but it is too early to tell if the next significant resistance at 7.3400 will come into view. We added, ‘only a breach of 7.2800 would mean that the advance in USD from the middle of the month has ended.’ While we continue to hold the same view, the ‘strong support’ level has moved higher to 7.2880 from 7.2800 previously.”
The US Dollar (USD) is expected to trade in a sideways range between 161.20 and 161.80. If it breaks above 162.00, the next level to watch is 163.00, UOB Group FX strategists suggest.
USD strength remains intact
24-HOUR VIEW: “We highlighted yesterday that USD ‘could test the resistance at 162.00 before the risk of a pullback increases.’ We added, ‘a sustained break above 162.00 appears unlikely.’ However, instead of testing 162.00, USD traded in a relatively quiet manner between 161.26 and 161.75, closing largely unchanged at 161.44 (-0.01%). The price action is likely part of a sideways trading phase. Today, we expect USD to trade between 161.20 and 161.80.”
1-3 WEEKS VIEW: “Not much has changed since our update yesterday (02 Jul, spot at 161.76). As highlighted, the USD strength that started in the middle of last month remains intact. From here, if USD breaks above 162.00, the next level to watch is 163.00. Overall, only a breach of 160.45 (‘strong support’ level previously at 160.30) would indicate that the USD strength has ended.”
The New Zealand Dollar (NZD) is expected to trade with an upward bias. It remains to be seen if it can breach the strong resistance level at 0.6105, because downward momentum has slowed further, UOB Group analysts note.
A breach of 0.6105 to turn NZD positive
24-HOUR VIEW: “Yesterday, we held the view that NZD ‘could pullback further, but any decline is unlikely to reach the major support at 0.6040.’ We indicated that ‘resistance levels are at 0.6085 and 0.6105.’ Our view was not wrong, as NZD dipped to a fresh one-month low of 0.6048 before rebounding. Not only has downward momentum faded, but upward momentum has also increased to some extent. Today, we expect NZD to trade with an upward bias, but it remains to be seen if it can breach the strong resistance level at 0.6105. Support levels are at 0.6065 and 0.6050.”
1-3 WEEKS VIEW: “We have expected NZD to weaken since the middle of last month. In our latest narrative from Monday (01 Jul, spot at 0.6095), we indicated that ‘while there is still room for NZD to continue to weaken, the slowdown in momentum suggests 0.6040 could be out of reach this time.’ Yesterday, NZD dipped to 0.6048 and then rebounded, closing largely unchanged at 0.6078 (+0.05%). Downward momentum has slowed further, and if NZD breaches 0.6105 (‘strong resistance’ level previously at 0.6135), it would mean that the weakness in NZD has stabilised.”
Silver prices (XAG/USD) rose on Wednesday, according to FXStreet data. Silver trades at $30.05 per troy ounce, up 1.75% from the $29.53 it cost on Tuesday.
Silver prices have increased by 26.27% since the beginning of the year.
| Unit measure | Silver Price Today in USD |
|---|---|
| Troy Ounce | 30.05 |
| 1 Gram | 0.97 |
The Gold/Silver ratio, which shows the number of ounces of Silver needed to equal the value of one ounce of Gold, stood at 78.03 on Wednesday, down from 78.89 on Tuesday.
Silver FAQs
Silver is a precious metal highly traded among investors. It has been historically used as a store of value and a medium of exchange. Although less popular than Gold, traders may turn to Silver to diversify their investment portfolio, for its intrinsic value or as a potential hedge during high-inflation periods. Investors can buy physical Silver, in coins or in bars, or trade it through vehicles such as Exchange Traded Funds, which track its price on international markets.
Silver prices can move due to a wide range of factors. Geopolitical instability or fears of a deep recession can make Silver price escalate due to its safe-haven status, although to a lesser extent than Gold's. As a yieldless asset, Silver tends to rise with lower interest rates. Its moves also depend on how the US Dollar (USD) behaves as the asset is priced in dollars (XAG/USD). A strong Dollar tends to keep the price of Silver at bay, whereas a weaker Dollar is likely to propel prices up. Other factors such as investment demand, mining supply – Silver is much more abundant than Gold – and recycling rates can also affect prices.
Silver is widely used in industry, particularly in sectors such as electronics or solar energy, as it has one of the highest electric conductivity of all metals – more than Copper and Gold. A surge in demand can increase prices, while a decline tends to lower them. Dynamics in the US, Chinese and Indian economies can also contribute to price swings: for the US and particularly China, their big industrial sectors use Silver in various processes; in India, consumers’ demand for the precious metal for jewellery also plays a key role in setting prices.
Silver prices tend to follow Gold's moves. When Gold prices rise, Silver typically follows suit, as their status as safe-haven assets is similar. The Gold/Silver ratio, which shows the number of ounces of Silver needed to equal the value of one ounce of Gold, may help to determine the relative valuation between both metals. Some investors may consider a high ratio as an indicator that Silver is undervalued, or Gold is overvalued. On the contrary, a low ratio might suggest that Gold is undervalued relative to Silver.
(An automation tool was used in creating this post.)
- The Mexican Peso trades variably as idiosyncratic factors affect its major counterparts.
- USD/MXN is impacted by a perceived change in stance from the Federal Reserve after a speech by its Chairman on Tuesday.
- In Europe, political factors relating to up-and-coming elections impact EUR/MXN and GBP/MXN.
The Mexican Peso (MXN) trades according to the distinctive domestic factors affecting its key counterparts on Wednesday.
The US Dollar (USD) is weakening against the Mexican Peso after a speech by the Chairman of the Federal Reserve (Fed) Jerome Powell reflected a change in stance from the more cautious rhetoric that preceded it. Across the pond, Europe’s political risk ahead of key elections in France and the United Kingdom is causing volatility for the Euro and capping gains for the Pound Sterling.
At the time of writing, one US Dollar (USD) buys 18.25 Mexican Pesos, EUR/MXN trades at 19.63, and GBP/MXN at 23.17.
Mexican Peso rises versus the US Dollar after Powell speech
The Mexican Peso is rising against USD after a speech by Fed Chairman Jerome Powell on Tuesday took investors by surprise after the hitherto cautious commentary of his colleagues. Powell touted progress on inflation, which suggested the Fed was now closer to cutting interest rates. Lower interest rates are negative for a currency as they reduce foreign capital inflows.
The US Dollar’s downside is capped, however, by an increase in the chances that former US President Donald Trump could win the US presidential election in November. One hurdle on his path to the White House was removed on Monday when the US Supreme Court ruled he had partial immunity from charges he incited the uprising that followed his election defeat in 2020. Meanwhile, his rival, President Joe Biden is facing questions about his mental capacity following several gaffs made during a televised debate last Thursday.
Europe on the march
The Euro is recovering against the Mexican Peso as risks subside that the far-right French National Rally (RN) party will gain an overall majority in the second round of the French elections on July 7. Although RN won the biggest share of the vote during the first round, the remaining centrists and socialists have formed a coalition to try to prevent RN from winning an outright majority in the second round.
This coalition has left many moderate voters with stark choices, according to Reuters, and there is a risk they could boycott the election in many constituencies where neither extreme appeals to them. However, the coalition will make it harder for RN to win an outright majority, alleviating pressure on the Euro, which had been weakening due to concerns an RN government would destabilize the EU.
Pound capped by UK’s fiscal woes
The Pound Sterling (GBP) is capped against the Mexican Peso by growing concerns about the UK’s finances ahead of the UK general election on July 4, according to Reuters.
With little room for fiscal maneuver to kick-start growth through tax or spend policies, the new government may turn to the BoE to provide the necessary stimulus. This could mean the central bank lowers interest rates sooner than imagined, resulting in a weaker Pound. The supposed “independence” of the BoE, however, is one counterargument against this view; another is the still-hot wage inflation in the UK, which will prevent the BoE from cutting interest rates in the near term, according to Philip Bokeloh, Senior Economist at Abn Amro.
Technical Analysis: USD/MXN trades in a short-term range
USD/MXN meanders in a range after pulling back from its June 28 swing high at 18.59. It is currently at the lower end of the range, trading in the 18.20s. It is possible the pair is entering a sideways trend although it is still a little too early to be sure.
USD/MXN 4-hour Chart
If USD/MXN rallies and breaks above 18.59 it will make a higher high and likely continue up to 18.68 (June 14 high), followed by 19.00 (June 12 high). A break above 19.00 would provide strong confirmation of a resumption of the short-and-intermediate term uptrends.
A move below 18.06 (June 26 low), however, would suggest the short-term downtrend was resuming and probably see a continuation down to 17.87 (June 24 low).
The direction of the long-term trend remains in doubt.
Mexican Peso FAQs
The Mexican Peso (MXN) is the most traded currency among its Latin American peers. Its value is broadly determined by the performance of the Mexican economy, the country’s central bank’s policy, the amount of foreign investment in the country and even the levels of remittances sent by Mexicans who live abroad, particularly in the United States. Geopolitical trends can also move MXN: for example, the process of nearshoring – or the decision by some firms to relocate manufacturing capacity and supply chains closer to their home countries – is also seen as a catalyst for the Mexican currency as the country is considered a key manufacturing hub in the American continent. Another catalyst for MXN is Oil prices as Mexico is a key exporter of the commodity.
The main objective of Mexico’s central bank, also known as Banxico, is to maintain inflation at low and stable levels (at or close to its target of 3%, the midpoint in a tolerance band of between 2% and 4%). To this end, the bank sets an appropriate level of interest rates. When inflation is too high, Banxico will attempt to tame it by raising interest rates, making it more expensive for households and businesses to borrow money, thus cooling demand and the overall economy. Higher interest rates are generally positive for the Mexican Peso (MXN) as they lead to higher yields, making the country a more attractive place for investors. On the contrary, lower interest rates tend to weaken MXN.
Macroeconomic data releases are key to assess the state of the economy and can have an impact on the Mexican Peso (MXN) valuation. A strong Mexican economy, based on high economic growth, low unemployment and high confidence is good for MXN. Not only does it attract more foreign investment but it may encourage the Bank of Mexico (Banxico) to increase interest rates, particularly if this strength comes together with elevated inflation. However, if economic data is weak, MXN is likely to depreciate.
As an emerging-market currency, the Mexican Peso (MXN) tends to strive during risk-on periods, or when investors perceive that broader market risks are low and thus are eager to engage with investments that carry a higher risk. Conversely, MXN tends to weaken at times of market turbulence or economic uncertainty as investors tend to sell higher-risk assets and flee to the more-stable safe havens.
Underlying tone seems to be firming. The Australian Dollar (AUD) could edge above 0.6685 but is unlikely to threaten the major resistance at 0.6705. The likelihood of it breaking clearly above the major resistance zone of 0.6705/0.6715 is low for now, UOB Group analysts note.
The major resistance zone is at 0.6705/0.6715
24-HOUR VIEW: “We noted yesterday that the price action from Monday did not result in any increase in either upward or downward momentum. We expected AUD to trade sideways between 0.6630 and 0.6685. AUD then traded in a range of 0.6634/0.6671, closing at 0.6668 (+0.11%). The underlying tone seems to be firming, and AUD is likely to trade with an upward bias today. While it could edge above 0.6685, the major resistance at 0.6705 is unlikely to come under threat. Support levels are at 0.6655 and 0.6640.”
1-3 WEEKS VIEW: “Our most recent narrative was from Monday (01 Jul, spot at 0.6670), wherein the recent price action has resulted in a slight increase in upward momentum. We indicated that ‘as long as AUD remains above 0.6610, it is likely to edge higher, but the likelihood of it breaking clearly above the major resistance zone of 0.6705/0.6715 is low for now.’ While we continue to expect AUD to edge higher, the ‘strong support’ level has moved up to 0.6625 from 0.6610.”
Current price movements are likely part of a consolidation, likely between 1.2600 and 1.2720. The Pound Sterling (GBP) could rebound further, but any advance is unlikely to be able to break the major resistance at 1.2720, UOB Group FX strategists suggest.
GBP must not break below 1.2650 to remain positive
24-HOUR VIEW: “After GBP spiked to a high of 1.2710 on Monday and then pulled back, we indicated yesterday (Tuesday) that ‘the brief advance did not result in any increase in upward momentum.’ We held the view that GBP is likely to trade in a sideways range of 1.2615/1.2680. GBP then dipped close to the bottom of our expected range (low of 1.2616) before rebounding strongly, reaching a high of 1.2689. Upward momentum is building, and GBP could continue to rebound today. Given that conditions are approaching overbought levels, any advance is unlikely to be able to break above the major resistance at 1.2720. To keep the momentum going, GBP must not break below 1.2650, with minor support at 1.2665.”
1-3 WEEKS VIEW: “We highlighted yesterday (02 Jul, spot at 1.2645) that the current price movements are likely part of a consolidation phase. We held the view that GBP ‘is likely to trade between 1.2600 and 1.2720 for now.’ We continue to hold the same view.”
- NZD/USD gains ground as dovish comments from Fed officials raise speculations of rate cuts.
- Fed Chair Jerome Powell said that the central bank is getting back on the disinflationary path.
- The economic slowdown in China, a major trade partner, poses a headwind for the New Zealand Dollar.
NZD/USD appreciates for the second successive session as the US Dollar (USD) struggles due to the escalated speculations of Federal Reserve (Fed) reducing interest rates in 2024. The NZD/USD pair trades around 0.6080 during the European trading hours on Wednesday.
The Greenback could limit its downside as US Treasury yields improve with 2-year and 10-year Treasury bonds standing at 4.75% and 4.43%, respectively, at the time of writing. Traders will be looking for further direction from the US ADP Employment Change, ISM Services PMI for June, and the FOMC Minutes, all of which are scheduled for release later on Wednesday.
As per Reuters, Federal Reserve (Fed) Chair Jerome Powell’s somewhat dovish remarks on Tuesday. Powell said that the Fed is getting back on the disinflationary path. Additionally, Chicago Federal Reserve Bank President Austan Goolsbee cautioned on Tuesday during an interview with CNBC, stating, "I see some warning signs that the real economy is weakening."
On the Kiwi’s front, the Services Purchasing Managers' Index (PMI) in China, a major trading partner, fell to 51.2 in June from 54.0 in May, according to the latest data released by Caixin on Wednesday. The market had forecast a figure of 53.4 for the period. This decline adds to concerns about a slowdown in the world's second-largest economy and poses a headwind for the New Zealand Dollar (NZD).
The Reserve Bank of New Zealand (RBNZ) is set to deliver an interest rate decision next week after maintaining borrowing costs at 5.5% for the seventh consecutive meeting in May. Expectations that the Reserve Bank of New Zealand (RBNZ) will cut rates earlier than projected may restrain any significant appreciation of the NZD/USD pair.
Interest rates FAQs
Interest rates are charged by financial institutions on loans to borrowers and are paid as interest to savers and depositors. They are influenced by base lending rates, which are set by central banks in response to changes in the economy. Central banks normally have a mandate to ensure price stability, which in most cases means targeting a core inflation rate of around 2%. If inflation falls below target the central bank may cut base lending rates, with a view to stimulating lending and boosting the economy. If inflation rises substantially above 2% it normally results in the central bank raising base lending rates in an attempt to lower inflation.
Higher interest rates generally help strengthen a country’s currency as they make it a more attractive place for global investors to park their money.
Higher interest rates overall weigh on the price of Gold because they increase the opportunity cost of holding Gold instead of investing in an interest-bearing asset or placing cash in the bank. If interest rates are high that usually pushes up the price of the US Dollar (USD), and since Gold is priced in Dollars, this has the effect of lowering the price of Gold.
The Fed funds rate is the overnight rate at which US banks lend to each other. It is the oft-quoted headline rate set by the Federal Reserve at its FOMC meetings. It is set as a range, for example 4.75%-5.00%, though the upper limit (in that case 5.00%) is the quoted figure. Market expectations for future Fed funds rate are tracked by the CME FedWatch tool, which shapes how many financial markets behave in anticipation of future Federal Reserve monetary policy decisions.
The Euro (EUR) is likely to trade in a range for now, probably between 1.0680 and 1.0785. It might drift higher, but any advance is unlikely to reach the major resistance level at 1.0785, UOB Group analysts note.
Rangebound for the time being
24-HOUR VIEW: “Two days ago, EUR rose to 1.0776 before pulling back. Yesterday, we indicated that ‘the pullback in overbought conditions suggests EUR is unlikely to rise further,’ and we expected EUR to trade in a sideways range of 1.0710/1.0760. EUR subsequently traded sideways between 1.0709 and 1.0747, closing largely unchanged at 1.0744 (+0.06%). Despite the relatively quiet price action, the underlying tone has firmed somewhat. Today, we expect EUR to drift higher, but any advance is unlikely to reach the major resistance at 1.0785 (there is another resistance level at 1.0765). On the downside, if the pair breaks below 1.0715 (minor support is at 1.0730), it would suggest that the current mild upward pressure has eased.”
1-3 WEEKS VIEW: “We continue to hold the same view as two days (01 Jul, spot at 1.0735). As highlighted, EUR is likely to trade in a range for now, probably between 1.0680 and 1.0785.”
Here is what you need to know on Wednesday, July 3:
The US Dollar (USD) struggles to find demand early Wednesday but the Japanese Yen trades at its weakest level in nearly four decades against the USD. ADP Employment Change, Goods Trade Balance and ISM Services PMI data will be featured in the US economic docket later in the session. Ahead of the July 4 holiday, the Federal Reserve (Fed) will release the minutes of its June policy meeting.
Fed Chairman Jerome Powell and European Central Bank (ECB) President Christine Lagarde discussed policy outlook at the ECB Forum on Central Banking on Tuesday. Powell noted that the disinflation trend was showing signs of resuming but reiterated that they need to be more confident before reducing the policy rate. Lagarde, on the other hand, said that they were very advanced on the disinlftionary path and added that inflation in the Eurozone was heading in the right direction. Although the USD weakened against its rivals following this event, the currency's losses remained limited. In the meantime, the benchmark 10-year US Treasury bond yield edged lower and Wall Street's main indexes posted strong gains.
US Dollar PRICE This week
The table below shows the percentage change of US Dollar (USD) against listed major currencies this week. US Dollar was the weakest against the Euro.
| USD | EUR | GBP | JPY | CAD | AUD | NZD | CHF | |
|---|---|---|---|---|---|---|---|---|
| USD | -0.41% | -0.38% | 0.68% | -0.02% | -0.20% | 0.21% | 0.63% | |
| EUR | 0.41% | -0.20% | 0.80% | 0.08% | 0.09% | 0.30% | 0.73% | |
| GBP | 0.38% | 0.20% | 0.99% | 0.29% | 0.30% | 0.51% | 0.94% | |
| JPY | -0.68% | -0.80% | -0.99% | -0.69% | -0.82% | -0.47% | -0.03% | |
| CAD | 0.02% | -0.08% | -0.29% | 0.69% | -0.14% | 0.23% | 0.65% | |
| AUD | 0.20% | -0.09% | -0.30% | 0.82% | 0.14% | 0.21% | 0.72% | |
| NZD | -0.21% | -0.30% | -0.51% | 0.47% | -0.23% | -0.21% | 0.45% | |
| CHF | -0.63% | -0.73% | -0.94% | 0.03% | -0.65% | -0.72% | -0.45% |
The heat map shows percentage changes of major currencies against each other. The base currency is picked from the left column, while the quote currency is picked from the top row. For example, if you pick the US Dollar from the left column and move along the horizontal line to the Japanese Yen, the percentage change displayed in the box will represent USD (base)/JPY (quote).
Following Wednesday's indecisive action, USD/JPY gathered bullish momentum and touched its highest level in 38 years near 162.00 early Wednesday.
GBP/USD continues to edge higher and trades within a touching distance of 1.2700 after closing in positive territory on Tuesday. The UK general election will take place on Thursday.
EUR/USD registered small gains on Tuesday and stabilized near 1.0750 early Wednesday. Eurostat will release Producer Price Index data for May and several ECB policymakers will be delivering speeches later in the session.
The data from Australia showed earlier in the day that Retail Sales rose 0.6% on a monthly basis in May. Meanwhile, Caixin Services PMI in China declined to 51.2 in June from 54 in May. AUD/USD holds its ground following these data releases and trades in positive territory near 0.6700.
Gold failed to make a decisive move in either direction on Tuesday but gathered bullish momentum early Wednesday. At the time of press, XAU/USD was up nearly 0.5% on the day at $2,340.
Economic Indicator
FOMC Minutes
FOMC stands for The Federal Open Market Committee that organizes 8 meetings in a year and reviews economic and financial conditions, determines the appropriate stance of monetary policy and assesses the risks to its long-run goals of price stability and sustainable economic growth. FOMC Minutes are released by the Board of Governors of the Federal Reserve and are a clear guide to the future US interest rate policy.
Read more.Next release: Wed Jul 03, 2024 18:00
Frequency: Irregular
Consensus: -
Previous: -
Source: Federal Reserve
Minutes of the Federal Open Market Committee (FOMC) is usually published three weeks after the day of the policy decision. Investors look for clues regarding the policy outlook in this publication alongside the vote split. A bullish tone is likely to provide a boost to the greenback while a dovish stance is seen as USD-negative. It needs to be noted that the market reaction to FOMC Minutes could be delayed as news outlets don’t have access to the publication before the release, unlike the FOMC’s Policy Statement.
- The Pound Sterling holds gains against the US Dollar as Fed’s Powell seems confident that disinflation has resumed.
- UK elections outcome will be the major trigger for the Pound Sterling.
- The US Dollar will dance to the tunes of US ISM Servies PMI, the ADP Employment Change for June, and the FOMC minutes.
The Pound Sterling (GBP) consolidates below the round-level resistance of 1.2700 in Wednesday’s London session after a sharp recovery from the three-day low of 1.2615 on Tuesday. The GBP/USD pair exhibits strength as the near-term outlook of the US Dollar (USD) has become uncertain after the speech from Federal Reserve (Fed) Chair Jerome Powell at the European Central Bank (ECB) Forum on Central banking on Tuesday prompted optimism on rate cuts.
Powell said recent data suggests that the disinflation process has resumed, though we need more good inflation data before reducing interest rates. Powell added that risks to inflation are more balanced. He also said that an unexpected weakness in the labor market could force them to react on interest rates.
Powell’s improved confidence in the progress in disinflation has kept speculation on rate cuts in September firm. Going forward, the major trigger for the US Dollar will be the United States (US) Nonfarm Payrolls (NFP) report for June, which will be published on Friday.
In Wednesday’s session, investors will keenly focus on the ADP Employment Change, the US ISM Services Purchasing Managers Index (PMI) data for June, and the Federal Open Market Committee (FOMC) minutes for the June meeting.
The ADP Employment report is expected to show that private sector employers hired 160K job-seekers, slightly higher than May’s reading of 152K. The ISM Services PMI is estimated to have expanded at a slower pace of 52.5 from the former release of 53.8. Investors will also focus on the Prices Paid, a sub-component of Services PMI, which indicates cost pressures in the service sector.
The FOMC minutes will provide cues about when the Fed will start reducing interest rates.
Daily digest market movers: Pound Sterling weakens against the US Dollar and Australian Dollar
- The Pound Sterling outperforms the majority of its peers except the US Dollar and the Australian Dollar (AUD). The US Dollar rebounds in European trading hours after correcting on Tuesday and the Australian Dollar is upbeat as expectations for rate cuts by the Reserve Bank of Australia (RBA) have been postponed to April 2025 from February of the same year projected earlier.
- The British currency clings to gains as Bank of England (BoE) policymakers worry about stubborn inflation in the United Kingdom (UK) service sector, which has been refraining from leaning towards policy easing. While inflation in other sectors has declined significantly due to weak demand from domestic and overseas markets.
- Due to the absence of top-tier economic data this week, investors will majorly focus on headlines relating to the UK elections, which kick off on Thursday. The UK Prime Minister Rishi Sunak-led Conservative Party is expected to suffer a defeat from the opposition Labor Party.
- New government formation is expected to deliver expansionary fiscal policies, which could boost price pressures and force the BoE to maintain a restrictive stance on interest rates for a longer period than previously expected.
Technical Analysis: Pound Sterling climbs above 61.8% Fibo retracement
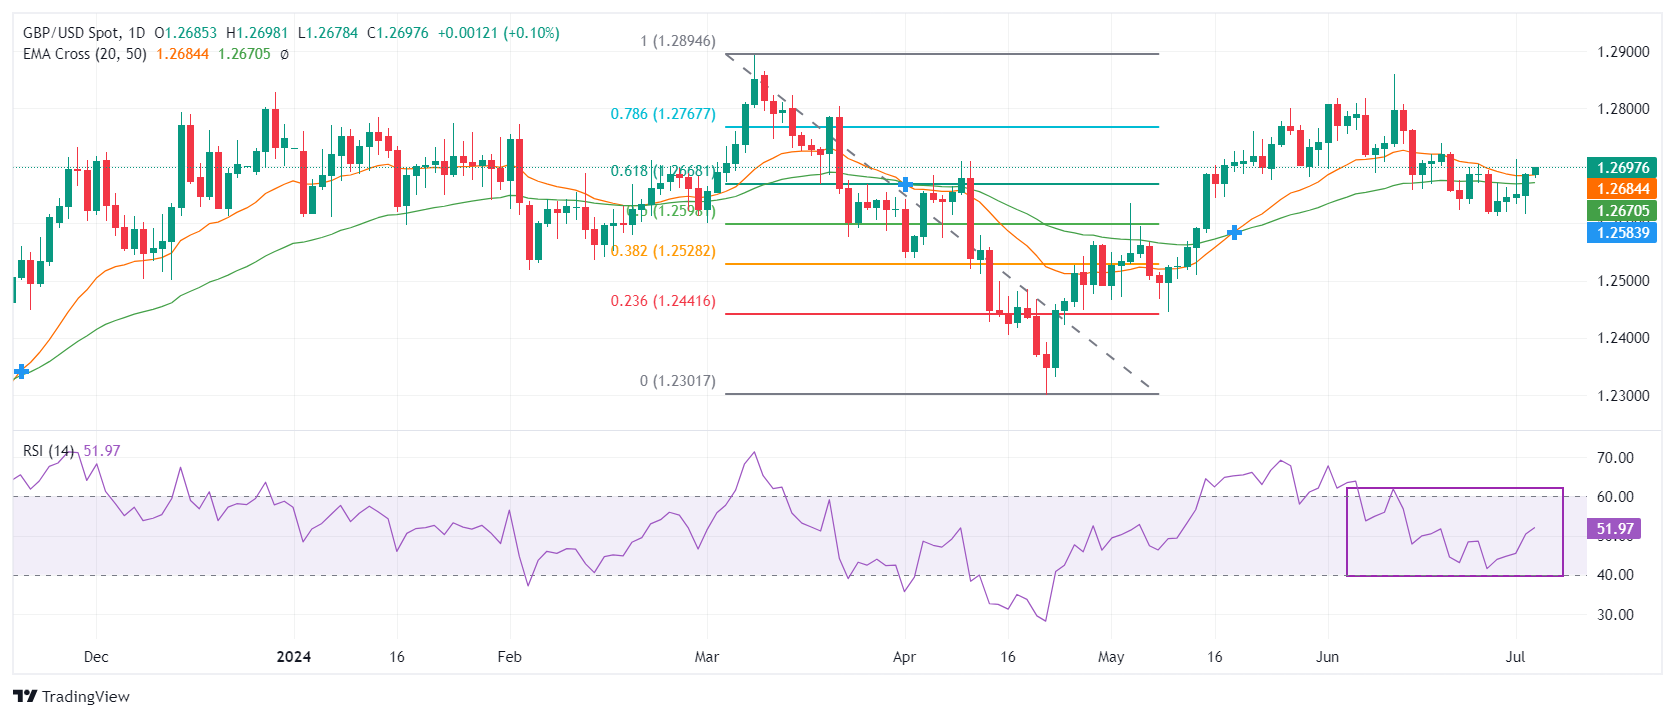
The Pound Sterling trades sideways against the US Dollar after recovering sharply from the round-level support of 1.2600. The GBP/USD pair moves higher above the 61.8% Fibonacci retracement support at 1.2667, plotted from the March 8 high of 1.2900 to the April 22 low at 1.2300.
The Cable rises above the 50-day Exponential Moving Average (EMA) near 1.2666 and is aiming to climb above the 20-day EMA, which trades around 1.2680
The 14-day Relative Strength Index (RSI) oscillates in the 40.00-60.00 range, indicating indecisiveness among market participants.
Pound Sterling FAQs
The Pound Sterling (GBP) is the oldest currency in the world (886 AD) and the official currency of the United Kingdom. It is the fourth most traded unit for foreign exchange (FX) in the world, accounting for 12% of all transactions, averaging $630 billion a day, according to 2022 data. Its key trading pairs are GBP/USD, aka ‘Cable’, which accounts for 11% of FX, GBP/JPY, or the ‘Dragon’ as it is known by traders (3%), and EUR/GBP (2%). The Pound Sterling is issued by the Bank of England (BoE).
The single most important factor influencing the value of the Pound Sterling is monetary policy decided by the Bank of England. The BoE bases its decisions on whether it has achieved its primary goal of “price stability” – a steady inflation rate of around 2%. Its primary tool for achieving this is the adjustment of interest rates. When inflation is too high, the BoE will try to rein it in by raising interest rates, making it more expensive for people and businesses to access credit. This is generally positive for GBP, as higher interest rates make the UK a more attractive place for global investors to park their money. When inflation falls too low it is a sign economic growth is slowing. In this scenario, the BoE will consider lowering interest rates to cheapen credit so businesses will borrow more to invest in growth-generating projects.
Data releases gauge the health of the economy and can impact the value of the Pound Sterling. Indicators such as GDP, Manufacturing and Services PMIs, and employment can all influence the direction of the GBP. A strong economy is good for Sterling. Not only does it attract more foreign investment but it may encourage the BoE to put up interest rates, which will directly strengthen GBP. Otherwise, if economic data is weak, the Pound Sterling is likely to fall.
Another significant data release for the Pound Sterling is the Trade Balance. This indicator measures the difference between what a country earns from its exports and what it spends on imports over a given period. If a country produces highly sought-after exports, its currency will benefit purely from the extra demand created from foreign buyers seeking to purchase these goods. Therefore, a positive net Trade Balance strengthens a currency and vice versa for a negative balance.
- The ADP report on Employment Change is expected to print 160K in June.
- The Federal Reserve may continue delaying interest rate cuts on strong employment reports.
- The US Dollar is technically bullish and may reach 106.45 with an upbeat report.
On Wednesday, the United States (US) Automatic Data Processing (ADP) Research Institute will release its monthly report on private sector job creation for June. The announcement, known as the ADP Employment Change, is expected to show that the country’s private sector added 160K new positions in June after adding 152K in May.
The survey is usually released two days before the official Nonfarm Payrolls (NFP) report, and despite random divergences in the outcome, market participants tend to read it as an advanced indicator of the Bureau of Labor Statistics (BLS) report. A strong job creation in the private sector will likely be seen as an upcoming upbeat NFP report.
ADP Jobs Report: Employment and the Federal Reserve
The US central bank, the Federal Reserve (Fed), has a dual mandate: price stability and maximum sustainable employment. According to the Fed, price stability equals inflation, averaging 2%, while maximum sustainable employment is the highest level of employment the economy can sustain without generating unwelcome inflation.
Inflationary levels have eased sustainably after hitting multi-decade highs in the pandemic aftermath, yet the labor market has been quite tight, which increases the risk of higher price pressures. Behind the Fed’s reluctance to trim interest rates is not just inflation still above 2%.
The central bank met earlier in June, and Chairman Jerome Powell said data had not given the Federal Open Market Committee (FOMC) enough confidence to begin rate cuts.
"As labor market tightness has eased and inflation has declined over the past year, the risks of reaching unemployment and inflation goals have moved towards better balance," Powell said. "Our economy has made considerable progress towards both goals of maintaining maximum employment and stable prices," he added. However, Powell and co remained cautious about potential rate cuts, with market participants now hoping for just one 25 basis points (bps) cut this year.
With that in mind, a strong ADP survey and a subsequent strong NFP report will further delay the odds of a rate cut. A hawkish outcome should then give additional impetus to the USD Index.
When will the ADP Report be released, and how could it affect the USD Index?
ADP will release the Employment Change report on Wednesday, July 3. As previously said, it is expected to reveal that the private sector added 160K new positions in June. Generally speaking, a better-than-anticipated report should underpin the USD Index, while a disappointing reading will pressure it.
The US will release the Challenger Job Cuts report ahead of the ADP survey, published by Challenger, Grey & Christmas monthly. The report provides information on the number of announced corporate layoffs by industry and region. In May, US-based employers announced 63,816 job cuts, a 1.5% decline from the previous month and down 20% from 80,089 cuts announced in May 2023. The figure is unlikely to directly affect the USD index but will add to the impact of the ADP report.
Valeria Bednarik, Chief Analyst at FXStreet, takes a technical look at charts and says: “The USD Index hovers around 106.00, trading near its June monthly high at 106.13. According to the daily chart, the Index is poised to extend its advance, given the positive momentum of technical indicators, advancing within positive levels. Furthermore, the USD Index trades above all its moving averages, with the 20 Simple Moving Average (SMA) gaining upward traction above the longer ones. The next relevant level to watch is 106.49, the high posted on May 1 in the Fed’s monetary policy decision aftermath. The bullish case will be supported by a better-than-anticipated report.”
Bednarik adds: “Should the ADP figure disappoint, the USD Index may enter a corrective decline, as a sustained decline remains out of the picture for now. A strong support level comes at 105.40, followed by the 105.10 price zone.”
Employment FAQs
Labor market conditions are a key element in assessing the health of an economy and thus a key driver for currency valuation. High employment, or low unemployment, has positive implications for consumer spending and economic growth, boosting the value of the local currency. Moreover, a very tight labor market – a situation in which there is a shortage of workers to fill open positions – can also have implications on inflation levels because low labor supply and high demand leads to higher wages.
The pace at which salaries are growing in an economy is key for policymakers. High wage growth means that households have more money to spend, usually leading to price increases in consumer goods. In contrast to more volatile sources of inflation such as energy prices, wage growth is seen as a key component of underlying and persisting inflation as salary increases are unlikely to be undone. Central banks around the world pay close attention to wage growth data when deciding on monetary policy.
The weight that each central bank assigns to labor market conditions depends on its objectives. Some central banks explicitly have mandates related to the labor market beyond controlling inflation levels. The US Federal Reserve (Fed), for example, has the dual mandate of promoting maximum employment and stable prices. Meanwhile, the European Central Bank’s (ECB) sole mandate is to keep inflation under control. Still, and despite whatever mandates they have, labor market conditions are an important factor for policymakers given their significance as a gauge of the health of the economy and their direct relationship to inflation.
Economic Indicator
ADP Employment Change
The ADP Employment Change is a gauge of employment in the private sector released by the largest payroll processor in the US, Automatic Data Processing Inc. It measures the change in the number of people privately employed in the US. Generally speaking, a rise in the indicator has positive implications for consumer spending and is stimulative of economic growth. So a high reading is traditionally seen as bullish for the US Dollar (USD), while a low reading is seen as bearish.
Read more.Next release: Wed Jul 03, 2024 12:15
Frequency: Monthly
Consensus: 160K
Previous: 152K
Source: ADP Research Institute
Traders often consider employment figures from ADP, America’s largest payrolls provider, report as the harbinger of the Bureau of Labor Statistics release on Nonfarm Payrolls (usually published two days later), because of the correlation between the two. The overlaying of both series is quite high, but on individual months, the discrepancy can be substantial. Another reason FX traders follow this report is the same as with the NFP – a persistent vigorous growth in employment figures increases inflationary pressures, and with it, the likelihood that the Fed will raise interest rates. Actual figures beating consensus tend to be USD bullish.
- USD/CAD depreciates as commodity-linked CAD improves due to rising Oil prices.
- WTI Oil price edges higher due to supply threat amid escalated geopolitical tensions in the Middle East.
- The US Dollar may struggle due to dovish remarks from the Fed officials.
USD/CAD extends losses for the second consecutive day, trading around 1.3780 during the early European session on Wednesday. The Canadian Dollar (CAD) gains strength due to rising crude prices, as Canada is the largest Oil exporter to the United States. This increase in Oil prices puts pressure on the USD/CAD pair.
West Texas Intermediate (WTI) Oil price inches higher to near $82.80 per barrel at the time of writing. This upside could be attributed to the supply threat, which arises due to the geopolitical tensions persisting in the Middle East. Israel intensifies its operations in Gaza, prompting Palestinians to evacuate Khan Younis amid fears of further attacks. Israeli forces conducted airstrikes across the southern Gaza Strip on Tuesday, leading to widespread displacement among Palestinians.
The Canadian S&P Global Manufacturing PMI held steady at 49.3 in June, falling short of the market expectation of 50.2. This marks the 14th consecutive month of contraction. Traders will likely keep a close eye on the Canadian Unemployment Rate, set to be released on Friday, which is expected to increase to 6.3% in June.
The US Dollar (USD) could struggle due to Federal Reserve (Fed) Chair Jerome Powell’s somewhat dovish remarks on Tuesday. Powell said that the Fed is getting back on the disinflationary path. However, Powell wants to see further evidence before cutting interest rates as the US economy and the labor market remain strong, per Reuters.
Additionally, Chicago Federal Reserve Bank President Austan Goolsbee cautioned on Tuesday during an interview with CNBC, stating, "I see some warning signs that the real economy is weakening." Goolsbee further mentioned that progress toward the Fed's 2% inflation target could accelerate more swiftly than anticipated.
Canadian Dollar FAQs
The key factors driving the Canadian Dollar (CAD) are the level of interest rates set by the Bank of Canada (BoC), the price of Oil, Canada’s largest export, the health of its economy, inflation and the Trade Balance, which is the difference between the value of Canada’s exports versus its imports. Other factors include market sentiment – whether investors are taking on more risky assets (risk-on) or seeking safe-havens (risk-off) – with risk-on being CAD-positive. As its largest trading partner, the health of the US economy is also a key factor influencing the Canadian Dollar.
The Bank of Canada (BoC) has a significant influence on the Canadian Dollar by setting the level of interest rates that banks can lend to one another. This influences the level of interest rates for everyone. The main goal of the BoC is to maintain inflation at 1-3% by adjusting interest rates up or down. Relatively higher interest rates tend to be positive for the CAD. The Bank of Canada can also use quantitative easing and tightening to influence credit conditions, with the former CAD-negative and the latter CAD-positive.
The price of Oil is a key factor impacting the value of the Canadian Dollar. Petroleum is Canada’s biggest export, so Oil price tends to have an immediate impact on the CAD value. Generally, if Oil price rises CAD also goes up, as aggregate demand for the currency increases. The opposite is the case if the price of Oil falls. Higher Oil prices also tend to result in a greater likelihood of a positive Trade Balance, which is also supportive of the CAD.
While inflation had always traditionally been thought of as a negative factor for a currency since it lowers the value of money, the opposite has actually been the case in modern times with the relaxation of cross-border capital controls. Higher inflation tends to lead central banks to put up interest rates which attracts more capital inflows from global investors seeking a lucrative place to keep their money. This increases demand for the local currency, which in Canada’s case is the Canadian Dollar.
Macroeconomic data releases gauge the health of the economy and can have an impact on the Canadian Dollar. Indicators such as GDP, Manufacturing and Services PMIs, employment, and consumer sentiment surveys can all influence the direction of the CAD. A strong economy is good for the Canadian Dollar. Not only does it attract more foreign investment but it may encourage the Bank of Canada to put up interest rates, leading to a stronger currency. If economic data is weak, however, the CAD is likely to fall.
- EUR/GBP weakens to 0.8470 in Wednesday’s early European session.
- The uncertainty surrounding UK general elections and the BoE's rate cuts might cap the upside of GBP.
- Investors await the Eurozone PMI data for June and the ECB’s Lagarde speech on Wednesday.
The EUR/GBP cross trades on a softer note around 0.8470 during the early European session on Wednesday. The softer inflation in the Eurozone in June has spurred the hopes that the European Central Bank (ECB) will cut interest rates again this year, which exerts some selling pressure on the Euro (EUR).
The upcoming UK general elections might limit GBP movement ahead of the vote on Thursday before the results potentially trigger some volatility on Friday. Apart from this, the rising bets that the Bank of England (BoE) will cut the interest rate this year are likely to weigh on the British Pound (GBP).
The Eurozone flash Harmonized Index of Consumer Prices (HICP) came in at 2.5% YoY in June, in line with consensus expectations, Eurostat reported on Tuesday. Meanwhile, the core HICP increased 2.9% YoY in the same period, above the market consensus of 2.8%. ECB Chief Economist Philip Lane said that the incoming June data “seem to be in line with the ECB assessment” while also continuing to signal the possibility of further rate cuts.
Later on Wednesday, investors will keep an eye on the Purchasing Managers Index (PMI) data from Germany, France, and the Eurozone. Also, the speeches from ECB’s Luis de Guindos, Piero Cipollone, Philip Lane, and Christine Lagarde will be the highlights on Wednesday.
Euro FAQs
The Euro is the currency for the 20 European Union countries that belong to the Eurozone. It is the second most heavily traded currency in the world behind the US Dollar. In 2022, it accounted for 31% of all foreign exchange transactions, with an average daily turnover of over $2.2 trillion a day. EUR/USD is the most heavily traded currency pair in the world, accounting for an estimated 30% off all transactions, followed by EUR/JPY (4%), EUR/GBP (3%) and EUR/AUD (2%).
The European Central Bank (ECB) in Frankfurt, Germany, is the reserve bank for the Eurozone. The ECB sets interest rates and manages monetary policy. The ECB’s primary mandate is to maintain price stability, which means either controlling inflation or stimulating growth. Its primary tool is the raising or lowering of interest rates. Relatively high interest rates – or the expectation of higher rates – will usually benefit the Euro and vice versa. The ECB Governing Council makes monetary policy decisions at meetings held eight times a year. Decisions are made by heads of the Eurozone national banks and six permanent members, including the President of the ECB, Christine Lagarde.
Eurozone inflation data, measured by the Harmonized Index of Consumer Prices (HICP), is an important econometric for the Euro. If inflation rises more than expected, especially if above the ECB’s 2% target, it obliges the ECB to raise interest rates to bring it back under control. Relatively high interest rates compared to its counterparts will usually benefit the Euro, as it makes the region more attractive as a place for global investors to park their money.
Data releases gauge the health of the economy and can impact on the Euro. Indicators such as GDP, Manufacturing and Services PMIs, employment, and consumer sentiment surveys can all influence the direction of the single currency. A strong economy is good for the Euro. Not only does it attract more foreign investment but it may encourage the ECB to put up interest rates, which will directly strengthen the Euro. Otherwise, if economic data is weak, the Euro is likely to fall. Economic data for the four largest economies in the euro area (Germany, France, Italy and Spain) are especially significant, as they account for 75% of the Eurozone’s economy.
Another significant data release for the Euro is the Trade Balance. This indicator measures the difference between what a country earns from its exports and what it spends on imports over a given period. If a country produces highly sought after exports then its currency will gain in value purely from the extra demand created from foreign buyers seeking to purchase these goods. Therefore, a positive net Trade Balance strengthens a currency and vice versa for a negative balance.
- EUR/JPY gains momentum around 173.80 in Wednesday’s European session, up 0.20% on the day.
- Japanese business activity turned contractionary in June, pressuring the JPY.
- The interest rate differential between the Eurozone and Japan continues to support the Euro for the time being.
The EUR/JPY cross trades in positive territory for the sixth consecutive day near 173.80 on Wednesday during the early European session. The Japanese Yen (JPY) weakens after the data showed that Japanese business activity turned contractionary in June.
The final reading of Japan’s Services PMI fell to 49.4 in June from 49.8 in May. This figure registered the largest downward movement since January 2022 and among the biggest on record, which exerts some selling pressure on the JPY and acts as a headwind for the pair. On the other hand, the possibility that the Bank of Japan (BoJ) will intervene in the foreign exchange (FX) could underpin the JPY in the near term.
On the Euro front, the preliminary Eurozone Harmonized Index of Consumer Prices (HICP) inflation eased to 2.5% YoY in June from 2.6% in May. However, these inflation reports were unlikely to encourage the ECB to cut interest rates again at its next policy meeting on 18 July. “Nothing in these figures would make the ECB cut again in July, and we think it’ll be eagerly awaiting data over the summer before seriously debating a next rate cut in September,” said Bert Colijn, senior eurozone economist at the Dutch bank ING.
On Monday, the ECB president Christine Lagarde said that the recent economic developments suggested that further interest rate cuts are not urgent. The divergence in monetary policy between the Eurozone and Japan continues to support the Euro for the time being.
Japanese Yen FAQs
The Japanese Yen (JPY) is one of the world’s most traded currencies. Its value is broadly determined by the performance of the Japanese economy, but more specifically by the Bank of Japan’s policy, the differential between Japanese and US bond yields, or risk sentiment among traders, among other factors.
One of the Bank of Japan’s mandates is currency control, so its moves are key for the Yen. The BoJ has directly intervened in currency markets sometimes, generally to lower the value of the Yen, although it refrains from doing it often due to political concerns of its main trading partners. The current BoJ ultra-loose monetary policy, based on massive stimulus to the economy, has caused the Yen to depreciate against its main currency peers. This process has exacerbated more recently due to an increasing policy divergence between the Bank of Japan and other main central banks, which have opted to increase interest rates sharply to fight decades-high levels of inflation.
The BoJ’s stance of sticking to ultra-loose monetary policy has led to a widening policy divergence with other central banks, particularly with the US Federal Reserve. This supports a widening of the differential between the 10-year US and Japanese bonds, which favors the US Dollar against the Japanese Yen.
The Japanese Yen is often seen as a safe-haven investment. This means that in times of market stress, investors are more likely to put their money in the Japanese currency due to its supposed reliability and stability. Turbulent times are likely to strengthen the Yen’s value against other currencies seen as more risky to invest in.
FX option expiries for July 3 NY cut at 10:00 Eastern Time, via DTCC, can be found below
- EUR/USD: EUR amounts
- 1.0600 1.1b
- 1.0675 1.6b
- 1.0685 1.2b
- 1.0700 1.7b
- 1.0750 1.3b
- 1.0800 1.4b
- 1.0870 863m
- USD/JPY: USD amounts
- 159.50 870m
- 160.20 748m
- 162.00 660m
- USD/CHF: USD amounts
- 0.8800 2.8b
- 0.8985 809m
- 0.9050 1.2b
- 0.9150 790m
- AUD/USD: AUD amounts
- 0.6450 1.3b
- 0.6650 554m
- USD/CAD: USD amounts
- 1.3500 1.8b
- 1.3660 880m
- 1.3900 595m
Gold prices rose in India on Wednesday, according to data compiled by FXStreet.
The price for Gold stood at 6,268.77 Indian Rupees (INR) per gram, up compared with the INR 6,255.50 it cost on Tuesday.
The price for Gold increased to INR 73,117.69 per tola from INR 72,962.97 per tola a day earlier.
| Unit measure | Gold Price in INR |
|---|---|
| 1 Gram | 6,268.77 |
| 10 Grams | 62,687.41 |
| Tola | 73,117.69 |
| Troy Ounce | 194,982.30 |
FXStreet calculates Gold prices in India by adapting international prices (USD/INR) to the local currency and measurement units. Prices are updated daily based on the market rates taken at the time of publication. Prices are just for reference and local rates could diverge slightly.
Gold FAQs
Gold has played a key role in human’s history as it has been widely used as a store of value and medium of exchange. Currently, apart from its shine and usage for jewelry, the precious metal is widely seen as a safe-haven asset, meaning that it is considered a good investment during turbulent times. Gold is also widely seen as a hedge against inflation and against depreciating currencies as it doesn’t rely on any specific issuer or government.
Central banks are the biggest Gold holders. In their aim to support their currencies in turbulent times, central banks tend to diversify their reserves and buy Gold to improve the perceived strength of the economy and the currency. High Gold reserves can be a source of trust for a country’s solvency. Central banks added 1,136 tonnes of Gold worth around $70 billion to their reserves in 2022, according to data from the World Gold Council. This is the highest yearly purchase since records began. Central banks from emerging economies such as China, India and Turkey are quickly increasing their Gold reserves.
Gold has an inverse correlation with the US Dollar and US Treasuries, which are both major reserve and safe-haven assets. When the Dollar depreciates, Gold tends to rise, enabling investors and central banks to diversify their assets in turbulent times. Gold is also inversely correlated with risk assets. A rally in the stock market tends to weaken Gold price, while sell-offs in riskier markets tend to favor the precious metal.
The price can move due to a wide range of factors. Geopolitical instability or fears of a deep recession can quickly make Gold price escalate due to its safe-haven status. As a yield-less asset, Gold tends to rise with lower interest rates, while higher cost of money usually weighs down on the yellow metal. Still, most moves depend on how the US Dollar (USD) behaves as the asset is priced in dollars (XAU/USD). A strong Dollar tends to keep the price of Gold controlled, whereas a weaker Dollar is likely to push Gold prices up.
(An automation tool was used in creating this post.)
- USD/CHF stands tall near its highest level in over a month, albeit lacks bullish conviction.
- The SNB’s position as a frontrunner in the global policy easing cycle undermines the CHF.
- Traders await the release of US economic data and FOMC minutes later this Wednesday.
The USD/CHF pair trades with a mild positive bias for the seventh successive day on Wednesday and is currently placed just below its highest level in over a month touched the previous day. Spot prices, however, remain below mid-0.9000s as investors await more cues about the Federal Reserve's (Fed) rate-cut path before placing fresh directional bets.
Hence, the market focus will remain glued to the release of the FOMC meeting minutes, due later during the US session. Apart from this, traders will take cues from the US economic docket – featuring the ADP report on private-sector employment and the ISM Services PMI. The attention will then shift to the closely-watched US monthly jobs data, popularly known as the Nonfarm Payrolls (NFP) report on Friday. This will play a key role in influencing the near-term US Dollar (USD) price dynamics and help in determining the next leg of a directional move for the USD/CHF pair.
In the meantime, the markets have been pricing in a greater chance that the Fed will begin its monetary policy easing cycle in September. The bets were reaffirmed by Fed Chair Jerome Powell's dovish-sounding remarks on Tuesday, saying that the US economy has made significant progress on inflation and is back on the disinflationary path. This fails to assist the USD to attract any meaningful buyers. That said, the Swiss National Bank's (SNB) interest rate cut for the second consecutive meeting in June continues to undermine the Swiss Franc (CHF) and acts as a tailwind for the USD/CHF pair.
The aforementioned fundamental backdrop seems tilted in favor of bullish traders and suggests that the path of least resistance for the currency pair is to the upside. Hence, any corrective pullback is more likely to attract fresh buyers and remain limited near the 0.9000 psychological mark. Bulls, however, need to wait for some follow-through buying before positioning for an extension of the recent upward trajectory from the 0.8825 region, or a three-month low touched on June 18.
Economic Indicator
FOMC Minutes
FOMC stands for The Federal Open Market Committee that organizes 8 meetings in a year and reviews economic and financial conditions, determines the appropriate stance of monetary policy and assesses the risks to its long-run goals of price stability and sustainable economic growth. FOMC Minutes are released by the Board of Governors of the Federal Reserve and are a clear guide to the future US interest rate policy.
Read more.Next release: Wed Jul 03, 2024 18:00
Frequency: Irregular
Consensus: -
Previous: -
Source: Federal Reserve
Minutes of the Federal Open Market Committee (FOMC) is usually published three weeks after the day of the policy decision. Investors look for clues regarding the policy outlook in this publication alongside the vote split. A bullish tone is likely to provide a boost to the greenback while a dovish stance is seen as USD-negative. It needs to be noted that the market reaction to FOMC Minutes could be delayed as news outlets don’t have access to the publication before the release, unlike the FOMC’s Policy Statement.
- EUR/USD trades with mild losses near 1.0745 in Wednesday’s early European session.
- The negative outlook of the pair remains intact below the key 100-day EMA.
- The first upside barrier will emerge at 1.0786; the initial support level is seen at 1.0650.
The EUR/USD pair consolidates gains around 1.0745 during the early European session on Wednesday. Data released on Tuesday showed that the annual inflation rate in the Eurozone cooled down in June, in line with the market consensus. This figure has triggered hopes for potential interest rate cuts by the European Central Bank (ECB), which might cap the upside of the Euro (EUR) for the time being.
The major pair keeps the bearish vibe unchanged on the daily chart as it holds below the key 100-day Exponential Moving Average (EMA). In the near term, further consolidation cannot be ruled out as the Relative Strength Index (RSI) hovers around the 50-midline, suggesting the neutral momentum of the pair.
The crucial upside barrier for the major pair is seen at 1.0786, the 100-day EMA. Further north, the next hurdle is located at 1.0835, the upper boundary of the Bollinger Band. A decisive break above the latter will expose 1.0885, a high of May 15.
On the downside, the lower limit of the Bollinger Band near 1.0650 acts as an initial support level for EUR/USD. The additional downside filter to watch is the 1.0600 psychological level. A breach of this level will see a drop to 1.0522, a low of October 26.
EUR/USD daily chart
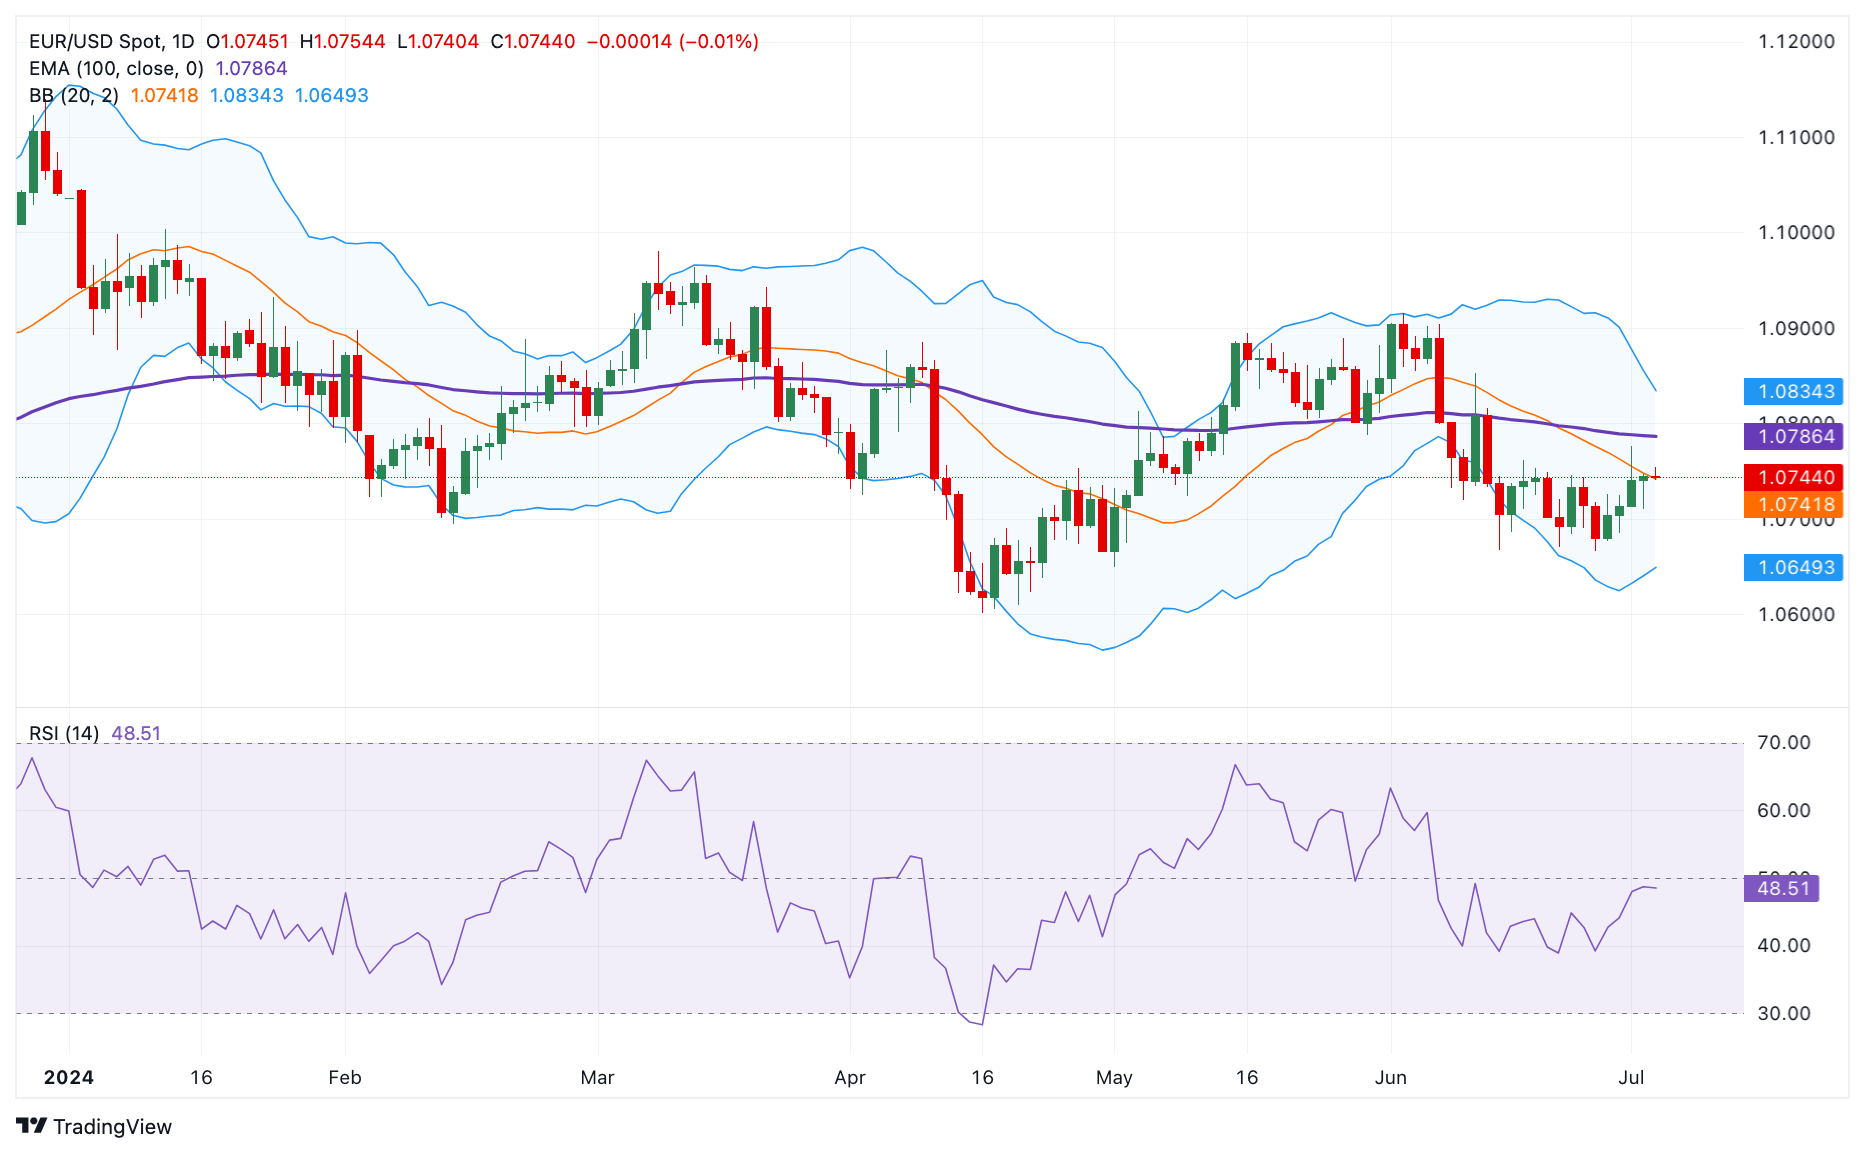
Euro FAQs
The Euro is the currency for the 20 European Union countries that belong to the Eurozone. It is the second most heavily traded currency in the world behind the US Dollar. In 2022, it accounted for 31% of all foreign exchange transactions, with an average daily turnover of over $2.2 trillion a day. EUR/USD is the most heavily traded currency pair in the world, accounting for an estimated 30% off all transactions, followed by EUR/JPY (4%), EUR/GBP (3%) and EUR/AUD (2%).
The European Central Bank (ECB) in Frankfurt, Germany, is the reserve bank for the Eurozone. The ECB sets interest rates and manages monetary policy. The ECB’s primary mandate is to maintain price stability, which means either controlling inflation or stimulating growth. Its primary tool is the raising or lowering of interest rates. Relatively high interest rates – or the expectation of higher rates – will usually benefit the Euro and vice versa. The ECB Governing Council makes monetary policy decisions at meetings held eight times a year. Decisions are made by heads of the Eurozone national banks and six permanent members, including the President of the ECB, Christine Lagarde.
Eurozone inflation data, measured by the Harmonized Index of Consumer Prices (HICP), is an important econometric for the Euro. If inflation rises more than expected, especially if above the ECB’s 2% target, it obliges the ECB to raise interest rates to bring it back under control. Relatively high interest rates compared to its counterparts will usually benefit the Euro, as it makes the region more attractive as a place for global investors to park their money.
Data releases gauge the health of the economy and can impact on the Euro. Indicators such as GDP, Manufacturing and Services PMIs, employment, and consumer sentiment surveys can all influence the direction of the single currency. A strong economy is good for the Euro. Not only does it attract more foreign investment but it may encourage the ECB to put up interest rates, which will directly strengthen the Euro. Otherwise, if economic data is weak, the Euro is likely to fall. Economic data for the four largest economies in the euro area (Germany, France, Italy and Spain) are especially significant, as they account for 75% of the Eurozone’s economy.
Another significant data release for the Euro is the Trade Balance. This indicator measures the difference between what a country earns from its exports and what it spends on imports over a given period. If a country produces highly sought after exports then its currency will gain in value purely from the extra demand created from foreign buyers seeking to purchase these goods. Therefore, a positive net Trade Balance strengthens a currency and vice versa for a negative balance.
- Silver price appreciates as Fed Chair Jerome Powell believes that the central bank is getting back on the disinflationary path.
- The non-yielding Silver might gain ground as recent US inflation data raised the expectations of the Fed reducing rates in 2024.
- Safe-haven Silver might attract investors as Israeli forces conducted airstrikes across the southern Gaza Strip on Tuesday.
Silver price (XAG/USD) continues its winning streak for the fifth day, trading around $29.70 per troy ounce during the Asian session on Wednesday. The price of silver is possibly bolstered by investor reaction to Federal Reserve (Fed) Chair Jerome Powell’s somewhat dovish remarks.
On Tuesday, Powell said that the Fed is getting back on the disinflationary path. However, Powell wants to see further evidence before cutting interest rates as the US economy and the labor market remain strong, per Reuters.
Additionally, Chicago Federal Reserve Bank President Austan Goolsbee cautioned on Tuesday during an interview with CNBC, stating, "I see some warning signs that the real economy is weakening." Goolsbee further mentioned that progress toward the Fed's 2% inflation target could accelerate more swiftly than anticipated.
The price of the grey metal also gained ground as the recent US inflation data raised the expectations of the Federal Reserve (Fed) reducing interest rates in 2024. US Personal Consumption Expenditures (PCE) Price Index increased by 2.6% year-over-year in May, down from 2.7% in April. Lower interest rates could spark the demand of non-yielding assets like Silver.
Geopolitical tensions persist in the Middle East as Israel intensifies its operations in Gaza, prompting Palestinians to evacuate Khan Younis amid fears of further attacks. Israeli forces conducted airstrikes across the southern Gaza Strip on Tuesday, leading to widespread displacement among Palestinians. These developments, reported by Reuters, highlight heightened tensions and may bolster demand for safe-haven assets such as Silver.
Silver FAQs
Silver is a precious metal highly traded among investors. It has been historically used as a store of value and a medium of exchange. Although less popular than Gold, traders may turn to Silver to diversify their investment portfolio, for its intrinsic value or as a potential hedge during high-inflation periods. Investors can buy physical Silver, in coins or in bars, or trade it through vehicles such as Exchange Traded Funds, which track its price on international markets.
Silver prices can move due to a wide range of factors. Geopolitical instability or fears of a deep recession can make Silver price escalate due to its safe-haven status, although to a lesser extent than Gold's. As a yieldless asset, Silver tends to rise with lower interest rates. Its moves also depend on how the US Dollar (USD) behaves as the asset is priced in dollars (XAG/USD). A strong Dollar tends to keep the price of Silver at bay, whereas a weaker Dollar is likely to propel prices up. Other factors such as investment demand, mining supply – Silver is much more abundant than Gold – and recycling rates can also affect prices.
Silver is widely used in industry, particularly in sectors such as electronics or solar energy, as it has one of the highest electric conductivity of all metals – more than Copper and Gold. A surge in demand can increase prices, while a decline tends to lower them. Dynamics in the US, Chinese and Indian economies can also contribute to price swings: for the US and particularly China, their big industrial sectors use Silver in various processes; in India, consumers’ demand for the precious metal for jewellery also plays a key role in setting prices.
Silver prices tend to follow Gold's moves. When Gold prices rise, Silver typically follows suit, as their status as safe-haven assets is similar. The Gold/Silver ratio, which shows the number of ounces of Silver needed to equal the value of one ounce of Gold, may help to determine the relative valuation between both metals. Some investors may consider a high ratio as an indicator that Silver is undervalued, or Gold is overvalued. On the contrary, a low ratio might suggest that Gold is undervalued relative to Silver.
- GBP/USD lacks firm intraday direction on Wednesday amid mixed fundamental cues.
- August BoE rate cut bets cap the GBP ahead of the UK general elections on Thursday.
- Traders also seem reluctant and prefer to wait for the release of the FOMC minutes.
The GBP/USD pair struggles to build on the overnight goodish rebound from the 1.2615 area, or a multi-day low and oscillates in a narrow band during the Asian session on Wednesday. Spot prices remain confined in a familiar range held over the past two weeks or so and currently trade just below the 1.2700 round-figure mark.
Against the backdrop of the Bank of England's (BoE) dovish pause in June, which lifted bets for a rate cut in August, the anxiety surrounding the upcoming UK general elections on Thursday acts as a headwind for the British Pound (GBP). The US Dollar (USD), on the other hand, struggles to attract any meaningful buyers in the wake of Fed Chair Jerome Powell's dovish-sounding remarks on Tuesday, saying that the US economy has made significant progress on inflation and is back on the disinflationary path.
Powell's comments reaffirm market expectations that the Fed is more likely to begin its rate-cutting cycle in September and again lower borrowing costs in December. This, along with a modest downtick in the US Treasury bond yields, keeps the USD bulls on the defensive, which, in turn, is seen acting as a tailwind for the GBP/USD pair. Meanwhile, expectations that a Trump presidency would be more inflationary than the Biden administration should limit the downside for the US bond yields and the Greenback.
Traders also seem reluctant and might prefer to wait for more cues about the Fed's rate-cut path before placing aggressive directional bets. Hence, the focus remains on FOMC meeting minutes, due for release later during the US session. In the meantime, Wednesday's US economic docket – featuring the ADP report on private-sector employment and the ISM Services PMI – might provide some impetus to the GBP/USD pair. The immediate market reaction, however, is likely to be limited ahead of the key event risks.
Pound Sterling FAQs
The Pound Sterling (GBP) is the oldest currency in the world (886 AD) and the official currency of the United Kingdom. It is the fourth most traded unit for foreign exchange (FX) in the world, accounting for 12% of all transactions, averaging $630 billion a day, according to 2022 data. Its key trading pairs are GBP/USD, aka ‘Cable’, which accounts for 11% of FX, GBP/JPY, or the ‘Dragon’ as it is known by traders (3%), and EUR/GBP (2%). The Pound Sterling is issued by the Bank of England (BoE).
The single most important factor influencing the value of the Pound Sterling is monetary policy decided by the Bank of England. The BoE bases its decisions on whether it has achieved its primary goal of “price stability” – a steady inflation rate of around 2%. Its primary tool for achieving this is the adjustment of interest rates. When inflation is too high, the BoE will try to rein it in by raising interest rates, making it more expensive for people and businesses to access credit. This is generally positive for GBP, as higher interest rates make the UK a more attractive place for global investors to park their money. When inflation falls too low it is a sign economic growth is slowing. In this scenario, the BoE will consider lowering interest rates to cheapen credit so businesses will borrow more to invest in growth-generating projects.
Data releases gauge the health of the economy and can impact the value of the Pound Sterling. Indicators such as GDP, Manufacturing and Services PMIs, and employment can all influence the direction of the GBP. A strong economy is good for Sterling. Not only does it attract more foreign investment but it may encourage the BoE to put up interest rates, which will directly strengthen GBP. Otherwise, if economic data is weak, the Pound Sterling is likely to fall.
Another significant data release for the Pound Sterling is the Trade Balance. This indicator measures the difference between what a country earns from its exports and what it spends on imports over a given period. If a country produces highly sought-after exports, its currency will benefit purely from the extra demand created from foreign buyers seeking to purchase these goods. Therefore, a positive net Trade Balance strengthens a currency and vice versa for a negative balance.
- The USD/JPY pair holds its position near a 38-year high of 161.75.
- The Jibun Bank Japan Services PMI was revised downward to 49.4 in June, marking a reversal from May's 53.8.
- The US Dollar edges higher due to a recovery in yield on 2-year Treasury bond.
The Japanese Yen (JPY) continues to hold losses on Wednesday, remaining near its low of 161.75, a level not seen since 1986, recorded in the previous session. This decline can be attributed to final data indicating that Japan's business activity turned contractionary in June. Market participants focus on the possibility of foreign exchange (FX) intervention from the Bank of Japan (BoJ), which could support the JPY and limit the upside of the USD/JPY pair.
Japan’s 10-ear government bond yield increased to a near 13-year high of 1.11%. Traders continue to evaluate the Bank of Japan's monetary policy outlook amid a sharply depreciating Japanese Yen, which drives up import costs and contributes to inflationary pressures. Additionally, the central bank also announced plans to unveil a strategy for winding down its bond-buying program in July.
The US Dollar (USD) halted its four-day losing streak due to a recovery in yield on a 2-year Treasury bond, which stands at 4.75% at the time of writing. Traders await the release of the US ADP Employment Change, ISM Services PMI for June, and the FOMC Minutes scheduled for Wednesday.
Daily Digest Market Movers: Japanese Yen declines due to softer Services PMI
- The Jibun Bank Japan Services PMI was revised downward to 49.4 in June from May’s 49.8 reading. This marks a reversal from May's 53.8 and represents the first decline in services activity since August 2022.
- The Federal Reserve (Fed) Chair Jerome Powell turned slightly dovish on Tuesday. Powell said that the Fed is getting back on the disinflationary path. However, Powell wants to see further evidence before cutting interest rates as the US economy and the labor market remain strong, per Reuters.
- Chicago Federal Reserve Bank President Austan Goolsbee cautioned on Tuesday during an interview with CNBC, stating, "I see some warning signs that the real economy is weakening." Goolsbee further mentioned that progress toward the Fed's 2% inflation target could accelerate more swiftly than anticipated.
- According to the latest Reuters survey conducted from June 25 to July 1, the Bank of Japan is expected to reduce its monthly bond purchases by roughly $100 billion (¥16.00 trillion) in the first year under a quantitative tightening (QT) plan set for release this month. This adjustment would bring the monthly purchases to approximately ¥4.65 trillion, down from the current pace of about ¥6.00 trillion. In the second year, survey respondents anticipate further reductions, with monthly purchases averaging around ¥3.55 trillion.
- Japanese Finance Minister Shunichi Suzuki stated on Tuesday that he is "closely watching FX moves with vigilance." Suzuki refrained from commenting on specific forex levels, noting that there is no change in the government's stance on foreign exchange, according to Reuters.
- On Monday, OCBC strategists Frances Cheung and Christopher Wong noted that “USD/JPY continued to trade near recent highs. This is also near the highest level since 1986. There are expectations that Japanese authorities could soon intervene. While the level of JPY is one factor to consider, officials also focus on the pace of depreciation as the intent of intervention is to curb excessive volatility.”
Technical Analysis: USD/JPY holds ground above 161.50
USD/JPY trades around 161.60 on Wednesday. The daily chart analysis indicates a bullish bias, with the pair holding ground near the upper boundary of an ascending channel pattern. However, caution is advised as the 14-day Relative Strength Index (RSI) is above 70, signaling overbought conditions and suggesting a possible correction in the near term.
The USD/JPY pair might test the upper boundary of the ascending channel near 161.80. A breakout above this level could strengthen bullish sentiment, potentially pushing the pair toward the psychological resistance at 162.00.
On the downside, immediate support is seen around the nine-day Exponential Moving Average (EMA) at 160.60. A breach below this level could weaken the bullish bias, potentially guiding USD/JPY toward the lower boundary of the ascending channel near 158.60. Further decline below this channel support could lead to a test of June's low at 154.55.
USD/JPY: Daily Chart
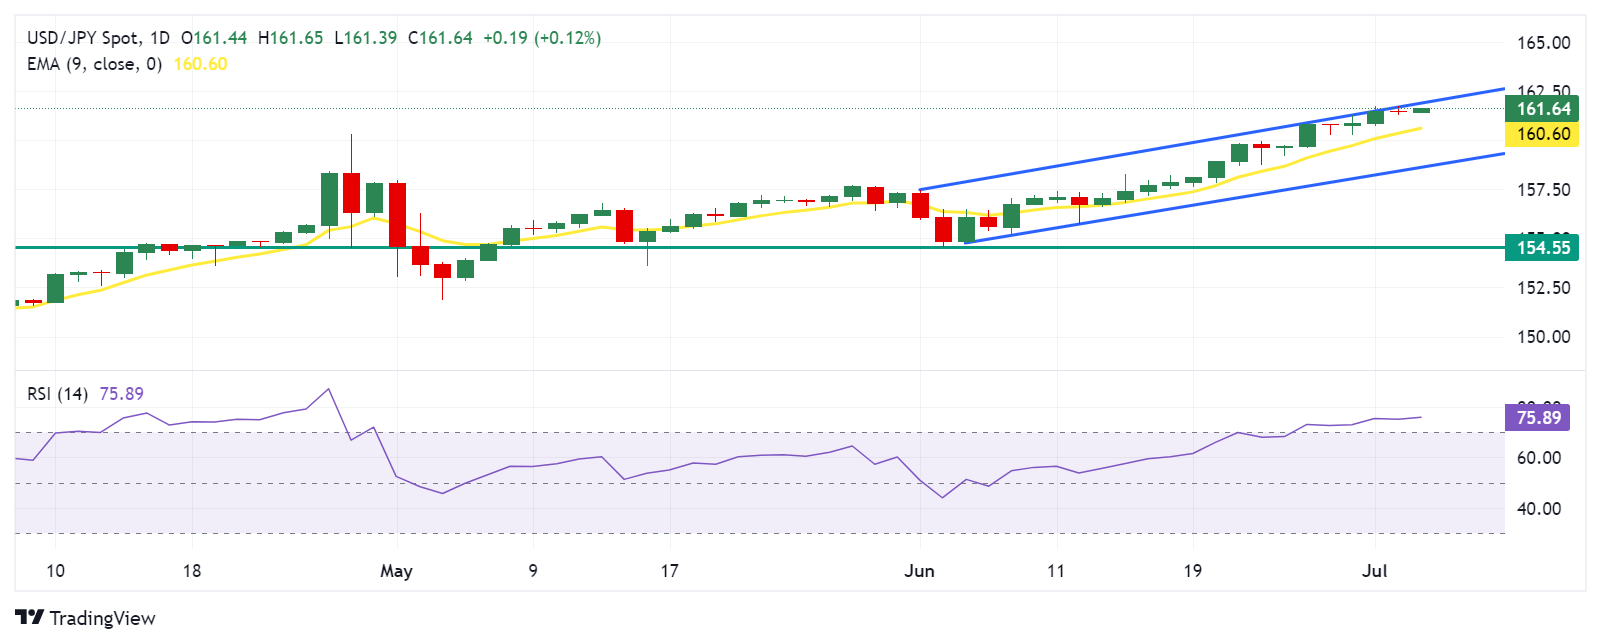
Japanese Yen PRICE Today
The table below shows the percentage change of Japanese Yen (JPY) against listed major currencies today. Japanese Yen was the weakest against the Australian Dollar.
| USD | EUR | GBP | JPY | CAD | AUD | NZD | CHF | |
|---|---|---|---|---|---|---|---|---|
| USD | 0.02% | 0.00% | 0.10% | 0.02% | -0.08% | -0.02% | 0.02% | |
| EUR | -0.02% | -0.02% | 0.09% | -0.00% | -0.10% | -0.01% | 0.00% | |
| GBP | -0.00% | 0.02% | 0.10% | 0.01% | -0.09% | 0.00% | 0.02% | |
| JPY | -0.10% | -0.09% | -0.10% | -0.10% | -0.19% | -0.11% | -0.08% | |
| CAD | -0.02% | 0.00% | -0.01% | 0.10% | -0.10% | -0.02% | 0.00% | |
| AUD | 0.08% | 0.10% | 0.09% | 0.19% | 0.10% | 0.09% | 0.11% | |
| NZD | 0.02% | 0.00% | -0.01% | 0.11% | 0.02% | -0.09% | 0.02% | |
| CHF | -0.02% | -0.00% | -0.02% | 0.08% | -0.00% | -0.11% | -0.02% |
The heat map shows percentage changes of major currencies against each other. The base currency is picked from the left column, while the quote currency is picked from the top row. For example, if you pick the Japanese Yen from the left column and move along the horizontal line to the US Dollar, the percentage change displayed in the box will represent JPY (base)/USD (quote).
Japanese Yen FAQs
The Japanese Yen (JPY) is one of the world’s most traded currencies. Its value is broadly determined by the performance of the Japanese economy, but more specifically by the Bank of Japan’s policy, the differential between Japanese and US bond yields, or risk sentiment among traders, among other factors.
One of the Bank of Japan’s mandates is currency control, so its moves are key for the Yen. The BoJ has directly intervened in currency markets sometimes, generally to lower the value of the Yen, although it refrains from doing it often due to political concerns of its main trading partners. The current BoJ ultra-loose monetary policy, based on massive stimulus to the economy, has caused the Yen to depreciate against its main currency peers. This process has exacerbated more recently due to an increasing policy divergence between the Bank of Japan and other main central banks, which have opted to increase interest rates sharply to fight decades-high levels of inflation.
The BoJ’s stance of sticking to ultra-loose monetary policy has led to a widening policy divergence with other central banks, particularly with the US Federal Reserve. This supports a widening of the differential between the 10-year US and Japanese bonds, which favors the US Dollar against the Japanese Yen.
The Japanese Yen is often seen as a safe-haven investment. This means that in times of market stress, investors are more likely to put their money in the Japanese currency due to its supposed reliability and stability. Turbulent times are likely to strengthen the Yen’s value against other currencies seen as more risky to invest in.
- WTI struggles to gain any meaningful traction, though the bias seems tilted in favor of bulls.
- Escalating geopolitical tensions fuels supply concerns and acts as a tailwind for the commodity.
- The technical setup also suggests that the path of least resistance for Oil prices is to the upside.
West Texas Intermediate (WTI) US crude Oil prices lack any firm intraday direction on Wednesday and oscillate in a narrow band during the Asian session. The commodity currently trades around the $82.65-$82.70 region, nearly unchanged for the day and remains well within striking distance of its highest level since April 26 touched the previous day.
Investors remain concerned that a wider conflict in the Middle East could disrupt supplies from the key Oil-producing countries. This, along with A very strong start to the hurricane season in the US, turn out to be a key factor acting as a tailwind for the black liquid. That said, concerns over a slowdown in global economic growth might hold back bulls from placing fresh bets and cap the upside for Crude Oil prices.
From a technical perspective, this week's breakout through a short-term trading range comes on the back of the recent strength and acceptance above the very important 200-day Simple Moving Average (SMA). Moreover, oscillators on the daily chart are holding in positive territory and are still away from being in the overbought zone, suggesting that the path of least resistance for Crude Oil prices is to the upside.
Hence, any subsequent weakness below the overnight swing low, around the $82.25 region, is likely to find decent support near the $82.00 mark. This is followed by the aforementioned trading range breakpoint point, now turned support near the $81.55 area, which if broken might prompt some technical selling. Crude Oil prices might then slide to the $81.00/barrel mark en route to the $80.40-$80.35 horizontal support.
On the flip side, momentum back above the $83.00 mark is likely to confront some resistance near the $83.75-$83.80 region, or over a two-month peak set on Tuesday. Some follow-through buying, leading to a move beyond the $84.00 mark, will be seen as a fresh trigger for bulls and allow Crude Oil prices to accelerate the positive move towards the next relevant barrier, just ahead of the $85.00 psychological mark.
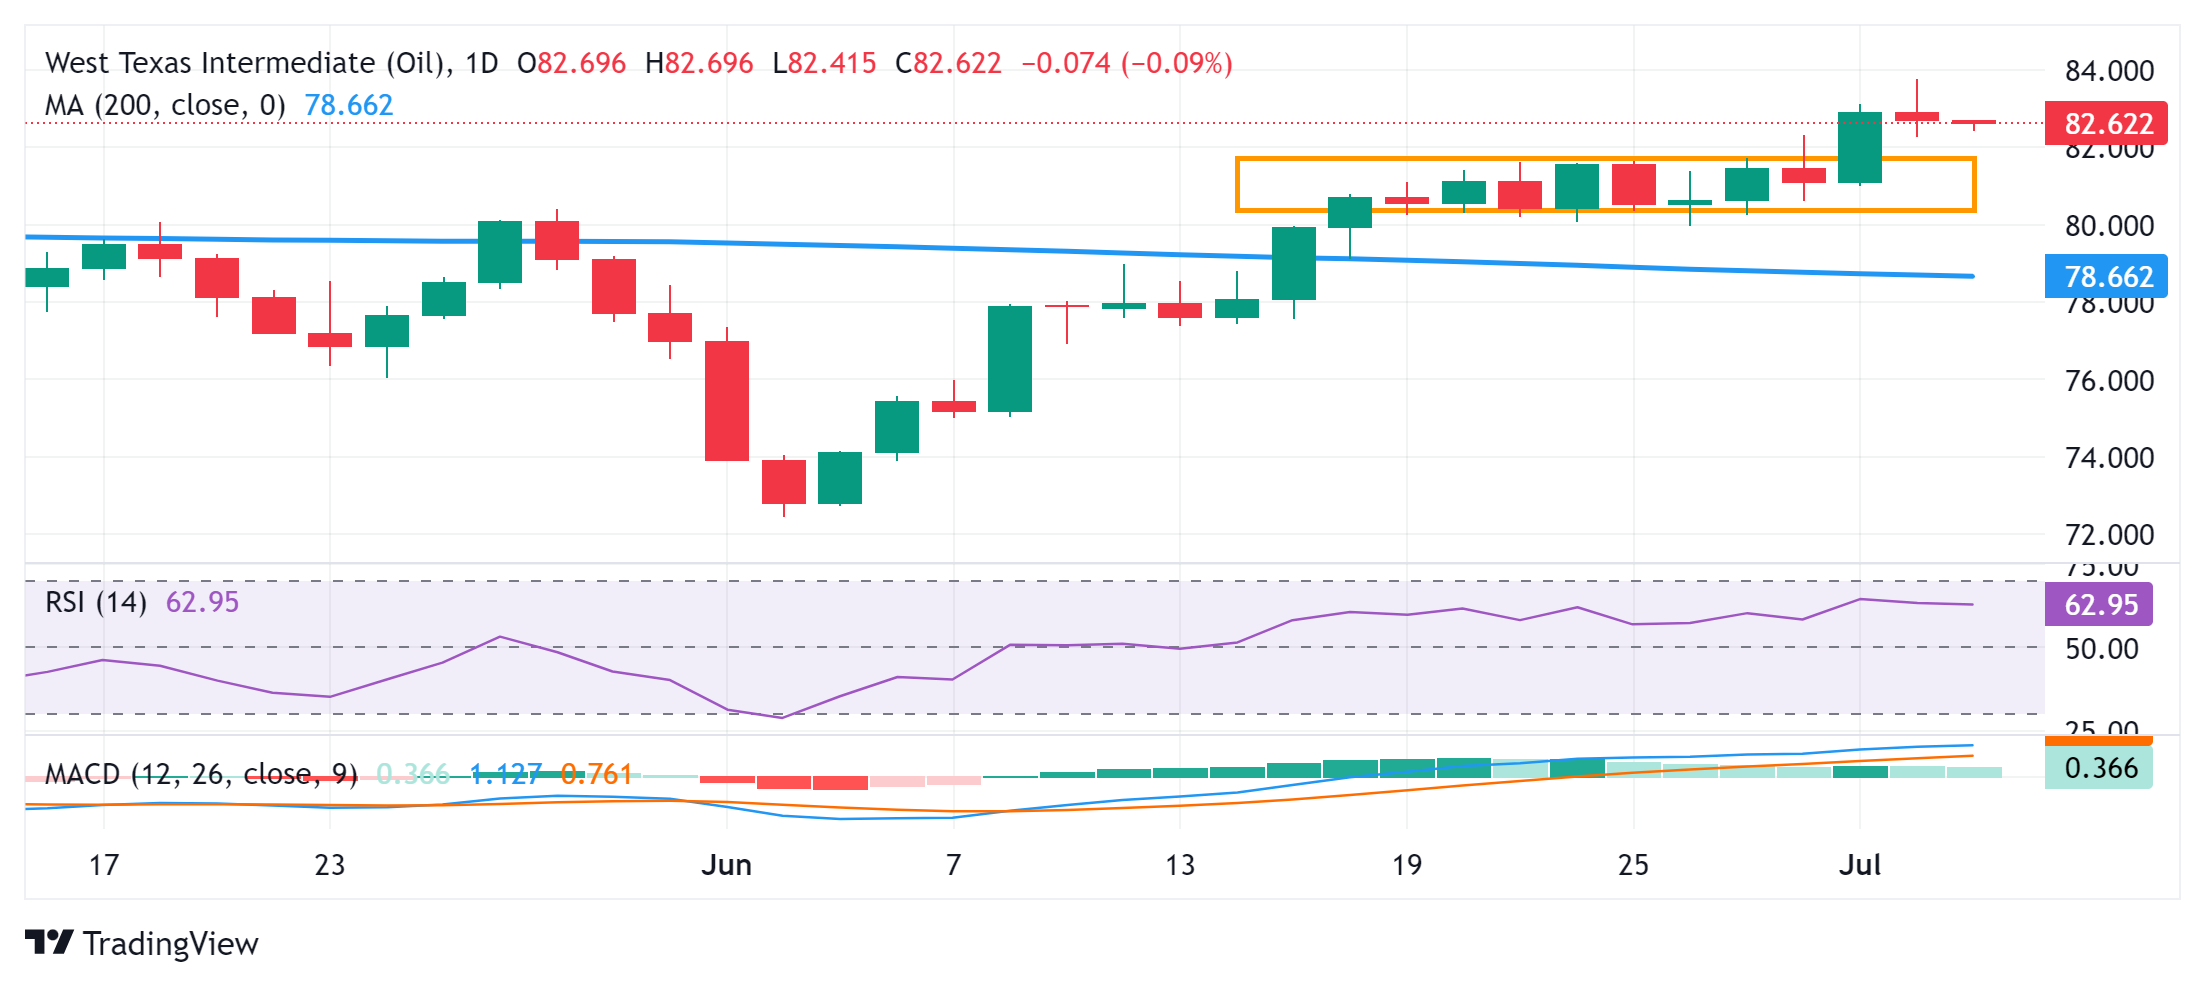
WTI Oil FAQs
WTI Oil is a type of Crude Oil sold on international markets. The WTI stands for West Texas Intermediate, one of three major types including Brent and Dubai Crude. WTI is also referred to as “light” and “sweet” because of its relatively low gravity and sulfur content respectively. It is considered a high quality Oil that is easily refined. It is sourced in the United States and distributed via the Cushing hub, which is considered “The Pipeline Crossroads of the World”. It is a benchmark for the Oil market and WTI price is frequently quoted in the media.
Like all assets, supply and demand are the key drivers of WTI Oil price. As such, global growth can be a driver of increased demand and vice versa for weak global growth. Political instability, wars, and sanctions can disrupt supply and impact prices. The decisions of OPEC, a group of major Oil-producing countries, is another key driver of price. The value of the US Dollar influences the price of WTI Crude Oil, since Oil is predominantly traded in US Dollars, thus a weaker US Dollar can make Oil more affordable and vice versa.
The weekly Oil inventory reports published by the American Petroleum Institute (API) and the Energy Information Agency (EIA) impact the price of WTI Oil. Changes in inventories reflect fluctuating supply and demand. If the data shows a drop in inventories it can indicate increased demand, pushing up Oil price. Higher inventories can reflect increased supply, pushing down prices. API’s report is published every Tuesday and EIA’s the day after. Their results are usually similar, falling within 1% of each other 75% of the time. The EIA data is considered more reliable, since it is a government agency.
OPEC (Organization of the Petroleum Exporting Countries) is a group of 13 Oil-producing nations who collectively decide production quotas for member countries at twice-yearly meetings. Their decisions often impact WTI Oil prices. When OPEC decides to lower quotas, it can tighten supply, pushing up Oil prices. When OPEC increases production, it has the opposite effect. OPEC+ refers to an expanded group that includes ten extra non-OPEC members, the most notable of which is Russia.
- The Indian Rupee posts modest gains in Wednesday’s Asian session.
- India’s foreign portfolio inflows and lower crude oil prices support the INR.
- Market players await India’s HSBC Services PMI on Wednesday ahead of the FOMC Minutes.
The Indian Rupee (INR) trades with mild gains on Wednesday amid the weaker US Dollar (USD). Foreign portfolio inflows into the equity markets have returned following the post-election outflows, which might boost the Indian Rupee. Additionally, the decline in crude oil prices helps limit the INR’s losses.
Market players are focusing on the final reading of India’s HSBC Services PMI on Wednesday, which is expected to improve to 60.4 in June, up from 60.2 in the previous reading. On the US docket, ADP Employment Change, ISM Services PMI for June, and the FOMC Minutes will be released later on Wednesday. The cautious stance from the Federal Reserve (Fed) Chair might support the USD. Furthermore, any evidence of further improvement in the US economy might lift the Greenback and create a tailwind for USD/INR.
Daily Digest Market Movers: Indian Rupee remains firm amid optimistic Indian economy outlook
- Nomura analysts expect the Indian rupee will rally by 2% by August. "India's post-election calm, portfolio inflows, economic sweet spot and the RBI (Reserve Bank of India) containing FX volatility are supportive factors," said Nomura analysts.
- India's foreign exchange reserves rose by $816 million to $653.711 billion last week, the Reserve Bank of India (RBI) revealed on Friday.
- Fed Chair Jerome Powell stated on Tuesday that US inflation is cooling again after higher readings earlier this year, but he wants to see more evidence before being confident enough to start cutting interest rates.
- Chicago Fed President Austan Goolsbee said that he sees some "warning signs" of economic weakness, and added that the Fed's goal is to bring inflation down without pressuring the labour market.
- US JOLTS Job Openings climbed to 8.14 million in May, followed by the 7.91 million (revised from 8.05 million) openings reported in April. This figure exceeded the forecasts of 7.91 million, US Bureau of Labor Statistics reported on Tuesday.
- Traders are now pricing in a nearly 63% chance for a 25 basis points (bps) rate cut from the Fed in September, up from 59.5% on Monday, according to the CME FedWatch tool.
Technical analysis: USD/INR might stick within the consolidative range in the near term
The Indian Rupee trades stronger on the day. The USD/INR pair remains capped within the familiar trading range on the daily timeframe. The pair maintains the bullish outlook unchanged in the longer term. However, in the near term, further consolidation looks favorable as the 14-day Relative Strength Index (RSI) hovers around the 50-midline, indicating neutral momentum.
Extended gains above 83.65, a high of June 26, would set up the pair for a potential move to the all-time high of 83.75. An upside breakout might attract some buyers to the 84.00 psychological level.
On the flip side, the initial support level for USD/INR will emerge at 83.35, the 100-day EMA. A decisive break below this level will pave the way to the 83.00 round figure, en route to 82.82, a low of January 12.
US Dollar price this week
The table below shows the percentage change of US Dollar (USD) against listed major currencies this week. US Dollar was the strongest against the Japanese Yen.
| USD | EUR | GBP | CAD | AUD | JPY | NZD | CHF | |
| USD | -0.09% | -0.29% | 0.06% | -0.02% | 0.44% | 0.30% | 0.42% | |
| EUR | 0.09% | -0.21% | 0.14% | 0.07% | 0.54% | 0.38% | 0.51% | |
| GBP | 0.29% | 0.21% | 0.35% | 0.28% | 0.74% | 0.59% | 0.70% | |
| CAD | -0.05% | -0.14% | -0.35% | -0.07% | 0.40% | 0.24% | 0.37% | |
| AUD | 0.02% | -0.06% | -0.27% | 0.07% | 0.48% | 0.31% | 0.44% | |
| JPY | -0.45% | -0.56% | -0.76% | -0.38% | -0.44% | -0.16% | -0.04% | |
| NZD | -0.30% | -0.39% | -0.59% | -0.24% | -0.31% | 0.16% | 0.13% | |
| CHF | -0.42% | -0.50% | -0.71% | -0.36% | -0.43% | 0.04% | -0.11% |
The heat map shows percentage changes of major currencies against each other. The base currency is picked from the left column, while the quote currency is picked from the top row. For example, if you pick the Euro from the left column and move along the horizontal line to the Japanese Yen, the percentage change displayed in the box will represent EUR (base)/JPY (quote).
Indian Rupee FAQs
The Indian Rupee (INR) is one of the most sensitive currencies to external factors. The price of Crude Oil (the country is highly dependent on imported Oil), the value of the US Dollar – most trade is conducted in USD – and the level of foreign investment, are all influential. Direct intervention by the Reserve Bank of India (RBI) in FX markets to keep the exchange rate stable, as well as the level of interest rates set by the RBI, are further major influencing factors on the Rupee.
The Reserve Bank of India (RBI) actively intervenes in forex markets to maintain a stable exchange rate, to help facilitate trade. In addition, the RBI tries to maintain the inflation rate at its 4% target by adjusting interest rates. Higher interest rates usually strengthen the Rupee. This is due to the role of the ‘carry trade’ in which investors borrow in countries with lower interest rates so as to place their money in countries’ offering relatively higher interest rates and profit from the difference.
Macroeconomic factors that influence the value of the Rupee include inflation, interest rates, the economic growth rate (GDP), the balance of trade, and inflows from foreign investment. A higher growth rate can lead to more overseas investment, pushing up demand for the Rupee. A less negative balance of trade will eventually lead to a stronger Rupee. Higher interest rates, especially real rates (interest rates less inflation) are also positive for the Rupee. A risk-on environment can lead to greater inflows of Foreign Direct and Indirect Investment (FDI and FII), which also benefit the Rupee.
Higher inflation, particularly, if it is comparatively higher than India’s peers, is generally negative for the currency as it reflects devaluation through oversupply. Inflation also increases the cost of exports, leading to more Rupees being sold to purchase foreign imports, which is Rupee-negative. At the same time, higher inflation usually leads to the Reserve Bank of India (RBI) raising interest rates and this can be positive for the Rupee, due to increased demand from international investors. The opposite effect is true of lower inflation.
| Raw materials | Closed | Change, % |
|---|---|---|
| Silver | 29.517 | 0.22 |
| Gold | 232.981 | -0.09 |
| Palladium | 1009.72 | 3.25 |
- NZD/USD edges higher for the second straight day, albeit lacks follow-through buying.
- Markets react little to the disappointing release of China’s Caixin Services PMI for June.
- The focus remains on FOMC meeting minutes for cues about the Fed’s rate-cut path.
The NZD/USD pair builds on the previous day's goodish rebound from the 0.6050-0.6045 area, or its lowest level since mid-May and attracts some follow-through buyers for the second successive day on Wednesday. Spot prices stick to modest intraday gains following the release of softer Chinese data, albeit lack bullish conviction and remain below the 50-day Simple Moving Average (SMA) support breakpoint.
According to the latest data released by Caixin, China's Services PMI fell from 54.0 in May to 51.2 in June as compared to the market forecast for a reading of 53.4. This adds to worries about a slowdown in the world's second-largest economy and acts as a headwind for antipodean currencies, including the Kiwi. Apart from this, expectations that the Reserve Bank of New Zealand (RBNZ) will cut rates earlier than projected further contribute to keeping a lid on any meaningful appreciating move for the NZD/USD pair.
Meanwhile, the US Dollar (USD) struggles to gain any meaningful traction amid growing acceptance that the Federal Reserve (Fed) will begin its rate-cutting cycle later this year. The bets were reaffirmed by relatively dovish remarks by Fed Chair Jerome Powell on Tuesday, saying the US economy has made significant progress on inflation and is back on the disinflationary path. This, along with retreating US Treasury bond yields, fails to lure the USD bulls and should continue to act as a tailwind for the NZD/USD pair.
Market participants now look forward to the US economic docket, featuring the release of the ADP report on private-sector employment and the ISM Services PMI. The focus, however, will remain glued to the FOMC meeting minutes, which, along with the closely-watched US Nonfarm Payrolls (NFP) report on Friday, will influence market expectations about the Fed's rate-cut path. This, in turn, should drive the USD demand in the near term and help determine the next leg of a directional move for the NZD/USD pair.
Economic Indicator
Caixin Services PMI
The Caixin Services Purchasing Managers Index (PMI), released on a monthly basis by Caixin Insight Group and S&P Global, is a leading indicator gauging business activity in China’s services sector. The data is derived from surveys of senior executives at both private-sector and state-owned companies. Survey responses reflect the change, if any, in the current month compared to the previous month and can anticipate changing trends in official data series such as Gross Domestic Product (GDP), industrial production, employment and inflation. The index varies between 0 and 100, with levels of 50.0 signaling no change over the previous month. A reading above 50 indicates that the services economy is generally expanding, a bullish sign for the Renminbi (CNY). Meanwhile, a reading below 50 signals that activity among service providers is generally declining, which is seen as bearish for CNY.
Read more.Last release: Wed Jul 03, 2024 01:45
Frequency: Monthly
Actual: 51.2
Consensus: 53.4
Previous: 54
Source: IHS Markit
- The Australian Dollar gains ground due to the release of solid economic data on Wednesday.
- Australia's Retail Sales rose by 0.6% MoM in May, surpassing both the anticipated 0.2% rise and the prior 0.1% gain.
- Fed Chair Jerome Powell wants to see further evidence before cutting interest rates.
The Australian Dollar (AUD) continues to gain ground for the second successive day on Wednesday. This upside is attributed to the Judo Bank's Australia Purchasing Managers Index (PMI) figures, which showed a slight improvement in June.
Australia's Retail Sales, a measure of the country's consumer spending, increased by 0.6% MoM in May, up from the previous month's 0.1% rise. This figure exceeded market expectations of a 0.2% increase.
The AUD/USD pair is also supported by the weaker US Dollar (USD), which is likely due to the decline in US Treasury yields. Traders will be looking for further direction from the US ADP Employment Change, ISM Services PMI for June, and the FOMC Minutes, all of which are scheduled for release later on Wednesday.
Daily Digest Market Movers: Australian Dollar appreciates due to higher PMI
- Judo Bank's Australia Services PMI increased to 51.2 MoM, up from the previous month's 51.0, surpassing the forecasted drop to 50.6. Meanwhile, the Composite PMI rose to 50.7 MoM, compared to 50.6 in the previous month.
- China's Services Purchasing Managers' Index (PMI) fell from 54.0 in May to 51.2 in June, according to the latest data released by Caixin on Wednesday. The market forecast was for a 53.4 figure in the reported period.
- The Federal Reserve (Fed) Chair Jerome Powell turned slightly dovish on Tuesday. Powell said that the Fed is getting back on the disinflationary path. However, Powell wants to see further evidence before cutting interest rates as the US economy and the labor market remain strong, per Reuters.
- The Reserve Bank of Australia’s (RBA) June monetary policy meeting minutes, released on Tuesday, indicated that the "board judged the case for holding rates steady stronger than hiking." The board emphasized the need to remain vigilant regarding upside risks to inflation, noting that data suggested an upside risk for May's Consumer Price Index (CPI).
- The Reserve Bank of Australia's (RBA) Index of Commodity Prices fell by 4.1% YoY in June, following an upwardly revised 6.0% decline in the previous month. The June decline marks the mildest deflation in sixteen consecutive months.
- The Melbourne Institute's Monthly Inflation Gauge has heightened concerns that the RBA might raise interest rates again in August. The gauge increased by 0.3% in June, maintaining the same pace as in May, marking the fourth consecutive month of rises and remaining at the highest since January.
- On Tuesday, Chinese state media outlet Securities Daily quoted the chief economist at CITIC Securities, suggesting that the People's Bank of China (PBOC) might consider measures like reducing the reserve requirement ratio (RRR) to inject liquidity into the market. Any potential economic shift in China could notably influence the Australian Dollar (AUD), given the close trade ties between the two nations.
Technical Analysis: Australian Dollar holds ground above 0.6650
The Australian Dollar trades around 0.6670 on Wednesday. The analysis of the daily chart shows a symmetrical triangle, which represents a pause in the trend as traders reach an equilibrium. However, once the price breaks out decisively from the triangle, it would signal a clear directional trend. However, the 14-day Relative Strength Index (RSI) is slightly above 50 level, indicating a bullish bias.
The AUD/USD pair is likely to test the upper boundary of the symmetrical triangle at around 0.6680, followed by the psychological level of 0.6700. Additional resistance is located at 0.6714, the highest level since January.
On the downside, the AUD/USD pair could find the key support around the lower boundary of the symmetrical triangle at 0.6630, followed by the 50-day Exponential Moving Average (EMA) at 0.6625.
AUD/USD: Daily Chart
Australian Dollar PRICE Today
The table below shows the percentage change of Australian Dollar (AUD) against listed major currencies today. Australian Dollar was the strongest against the Japanese Yen.
| USD | EUR | GBP | JPY | CAD | AUD | NZD | CHF | |
|---|---|---|---|---|---|---|---|---|
| USD | 0.02% | 0.00% | 0.08% | 0.03% | -0.10% | -0.02% | 0.05% | |
| EUR | -0.02% | -0.01% | 0.09% | 0.00% | -0.13% | -0.02% | 0.02% | |
| GBP | -0.01% | 0.01% | 0.10% | 0.02% | -0.11% | 0.00% | 0.02% | |
| JPY | -0.08% | -0.09% | -0.10% | -0.07% | -0.20% | -0.11% | -0.07% | |
| CAD | -0.03% | -0.01% | -0.02% | 0.07% | -0.13% | -0.03% | 0.00% | |
| AUD | 0.10% | 0.13% | 0.11% | 0.20% | 0.13% | 0.10% | 0.13% | |
| NZD | 0.02% | 0.02% | 0.00% | 0.11% | 0.03% | -0.10% | 0.03% | |
| CHF | -0.05% | -0.02% | -0.02% | 0.07% | -0.00% | -0.13% | -0.03% |
The heat map shows percentage changes of major currencies against each other. The base currency is picked from the left column, while the quote currency is picked from the top row. For example, if you pick the Australian Dollar from the left column and move along the horizontal line to the US Dollar, the percentage change displayed in the box will represent AUD (base)/USD (quote).
Australian Dollar FAQs
One of the most significant factors for the Australian Dollar (AUD) is the level of interest rates set by the Reserve Bank of Australia (RBA). Because Australia is a resource-rich country another key driver is the price of its biggest export, Iron Ore. The health of the Chinese economy, its largest trading partner, is a factor, as well as inflation in Australia, its growth rate and Trade Balance. Market sentiment – whether investors are taking on more risky assets (risk-on) or seeking safe-havens (risk-off) – is also a factor, with risk-on positive for AUD.
The Reserve Bank of Australia (RBA) influences the Australian Dollar (AUD) by setting the level of interest rates that Australian banks can lend to each other. This influences the level of interest rates in the economy as a whole. The main goal of the RBA is to maintain a stable inflation rate of 2-3% by adjusting interest rates up or down. Relatively high interest rates compared to other major central banks support the AUD, and the opposite for relatively low. The RBA can also use quantitative easing and tightening to influence credit conditions, with the former AUD-negative and the latter AUD-positive.
China is Australia’s largest trading partner so the health of the Chinese economy is a major influence on the value of the Australian Dollar (AUD). When the Chinese economy is doing well it purchases more raw materials, goods and services from Australia, lifting demand for the AUD, and pushing up its value. The opposite is the case when the Chinese economy is not growing as fast as expected. Positive or negative surprises in Chinese growth data, therefore, often have a direct impact on the Australian Dollar and its pairs.
Iron Ore is Australia’s largest export, accounting for $118 billion a year according to data from 2021, with China as its primary destination. The price of Iron Ore, therefore, can be a driver of the Australian Dollar. Generally, if the price of Iron Ore rises, AUD also goes up, as aggregate demand for the currency increases. The opposite is the case if the price of Iron Ore falls. Higher Iron Ore prices also tend to result in a greater likelihood of a positive Trade Balance for Australia, which is also positive of the AUD.
The Trade Balance, which is the difference between what a country earns from its exports versus what it pays for its imports, is another factor that can influence the value of the Australian Dollar. If Australia produces highly sought after exports, then its currency will gain in value purely from the surplus demand created from foreign buyers seeking to purchase its exports versus what it spends to purchase imports. Therefore, a positive net Trade Balance strengthens the AUD, with the opposite effect if the Trade Balance is negative.
- Gold price continues with its struggle to gain any meaningful traction on Wednesday.
- Traders seem reluctant and prefer to wait for more cues about the Fed’s rate-cut path.
- Investors look to FOMC minutes for some impetus ahead of the NFP report on Friday.
Gold price (XAU/USD) struggles to capitalize on the overnight bounce from the $2,319 area and oscillates in a narrow band below the 50-day Simple Moving Average (SMA) during the Asian session on Wednesday. The commodity remains confined in a familiar range held over the past week or so as traders prefer to wait for more cues about the Federal Reserve's (Fed) policy path before placing fresh directional bets. Hence, the focus remains glued to the release of FOMC meeting minutes later today, which, along with the Nonfarm Payrolls (NFP) report on Friday, might influence expectations about the Fed's future policy decisions. This will drive the near-term US Dollar (USD) demand and provide a fresh impetus to the non-yielding yellow metal.
In the meantime, Fed Chair Jerome Powell sounded slightly dovish on Tuesday and reaffirmed bets that the central bank is more than likely to start its rate-cutting cycle later this year. This leads to a modest pullback in the US Treasury bond yields and keeps the USD bulls on the defensive, which is seen acting as a tailwind for the Gold price. Apart from this, concerns over a slowdown in global economic growth, persistent geopolitical tensions, along with political uncertainty in the US and Europe, should help limit the downside for the safe-haven precious metal. Meanwhile, the mixed fundamental backdrop makes it prudent to wait for a sustained breakout through a short-term range before positioning for the next leg of a directional move for the XAU/USD.
Daily Digest Market Movers: Gold price awaits more Fed signals before the next leg of a directional move
- Investors opt to wait on the sidelines and seek more clarity about the Federal Reserve's rate-cut path, leading to subdued range-bound price action around the Gold price for the fourth straight day on Wednesday.
- Fed Chair Jerome Powell expressed satisfaction with the progress on inflation but said that he wants to be more confident that it is moving sustainably down toward 2% before starting the process of reducing rates.
- The markets are currently pricing in a greater chance that the Fed will lower borrowing costs in September and the possibility of another rate cut in December, triggering a pullback in the US Treasury bond yields.
- The yield on the benchmark 10-year US government bond retreats further from a one-month high touched on Monday, which keeps the US Dollar bulls on the defensive and acts as a tailwind for the commodity.
- This overshadowed the Job Openings and Labor Turnover Survey, or JOLTS report that showed US job openings rose to 8.140 million on the last day of May from April’s downwardly revised figure of 7.092 million.
- Expectations that a Trump presidency would lead to higher tariffs, and government borrowing and be more inflationary than the Biden administration should limit the downside for the US bond yields, in turn, the USD.
- Investors now look forward to the release of the FOMC meeting minutes, due later today, for some meaningful impetus ahead of the closely-watched US monthly employment details, or the NFP report on Friday.
- Wednesday's US economic docket also highlights the release of the ISM Services PMI, which might influence the USD price dynamics and contribute to producing short-term trading opportunities around the metal.
Technical Analysis: Gold price could appreciate further once the 50-day SMA barrier is taken out decisively
From a technical perspective, the recent range-bound price action points to indecision among traders over the near-term trajectory. Moreover, neutral oscillators on the daily chart further warrant caution before placing aggressive directional bets. Meanwhile, the 50-day SMA, currently pegged near the $2,340 area, might continue to act as an immediate hurdle ahead of the late June swing high, around the $2,365-2,370 region. Some follow-through buying should allow bulls to reclaim the $2,400 round-figure mark and aim towards challenging the all-time peak, around the $2,450 area touched in May.
On the flip side, the $2,319-2,318 area now seems to have emerged as immediate strong support ahead of the $2,300 mark and the $2,285 horizontal zone. A convincing break below the latter will be seen as a fresh trigger for bearish traders and make the Gold price vulnerable to accelerate the fall further towards the 100-day SMA, currently near the $2,258 region. The metal could extend the downward trajectory further towards the $2,225-2,220 region before eventually dropping to the $2,200 round-figure mark.
Gold FAQs
Gold has played a key role in human’s history as it has been widely used as a store of value and medium of exchange. Currently, apart from its shine and usage for jewelry, the precious metal is widely seen as a safe-haven asset, meaning that it is considered a good investment during turbulent times. Gold is also widely seen as a hedge against inflation and against depreciating currencies as it doesn’t rely on any specific issuer or government.
Central banks are the biggest Gold holders. In their aim to support their currencies in turbulent times, central banks tend to diversify their reserves and buy Gold to improve the perceived strength of the economy and the currency. High Gold reserves can be a source of trust for a country’s solvency. Central banks added 1,136 tonnes of Gold worth around $70 billion to their reserves in 2022, according to data from the World Gold Council. This is the highest yearly purchase since records began. Central banks from emerging economies such as China, India and Turkey are quickly increasing their Gold reserves.
Gold has an inverse correlation with the US Dollar and US Treasuries, which are both major reserve and safe-haven assets. When the Dollar depreciates, Gold tends to rise, enabling investors and central banks to diversify their assets in turbulent times. Gold is also inversely correlated with risk assets. A rally in the stock market tends to weaken Gold price, while sell-offs in riskier markets tend to favor the precious metal.
The price can move due to a wide range of factors. Geopolitical instability or fears of a deep recession can quickly make Gold price escalate due to its safe-haven status. As a yield-less asset, Gold tends to rise with lower interest rates, while higher cost of money usually weighs down on the yellow metal. Still, most moves depend on how the US Dollar (USD) behaves as the asset is priced in dollars (XAU/USD). A strong Dollar tends to keep the price of Gold controlled, whereas a weaker Dollar is likely to push Gold prices up.
China's Services Purchasing Managers' Index (PMI) fell from 54.0 in May to 51.2 in June, according to the latest data released by Caixin on Wednesday.
The market forecast was for a 53.4 figure in the reported period.
AUD/USD reaction to China’s Services PMI
At the time of writing, the AUD/USD pair is adding 0.14% on the day to flirt with intraday highs near 0.6680.
Australian Dollar FAQs
One of the most significant factors for the Australian Dollar (AUD) is the level of interest rates set by the Reserve Bank of Australia (RBA). Because Australia is a resource-rich country another key driver is the price of its biggest export, Iron Ore. The health of the Chinese economy, its largest trading partner, is a factor, as well as inflation in Australia, its growth rate and Trade Balance. Market sentiment – whether investors are taking on more risky assets (risk-on) or seeking safe-havens (risk-off) – is also a factor, with risk-on positive for AUD.
The Reserve Bank of Australia (RBA) influences the Australian Dollar (AUD) by setting the level of interest rates that Australian banks can lend to each other. This influences the level of interest rates in the economy as a whole. The main goal of the RBA is to maintain a stable inflation rate of 2-3% by adjusting interest rates up or down. Relatively high interest rates compared to other major central banks support the AUD, and the opposite for relatively low. The RBA can also use quantitative easing and tightening to influence credit conditions, with the former AUD-negative and the latter AUD-positive.
China is Australia’s largest trading partner so the health of the Chinese economy is a major influence on the value of the Australian Dollar (AUD). When the Chinese economy is doing well it purchases more raw materials, goods and services from Australia, lifting demand for the AUD, and pushing up its value. The opposite is the case when the Chinese economy is not growing as fast as expected. Positive or negative surprises in Chinese growth data, therefore, often have a direct impact on the Australian Dollar and its pairs.
Iron Ore is Australia’s largest export, accounting for $118 billion a year according to data from 2021, with China as its primary destination. The price of Iron Ore, therefore, can be a driver of the Australian Dollar. Generally, if the price of Iron Ore rises, AUD also goes up, as aggregate demand for the currency increases. The opposite is the case if the price of Iron Ore falls. Higher Iron Ore prices also tend to result in a greater likelihood of a positive Trade Balance for Australia, which is also positive of the AUD.
The Trade Balance, which is the difference between what a country earns from its exports versus what it pays for its imports, is another factor that can influence the value of the Australian Dollar. If Australia produces highly sought after exports, then its currency will gain in value purely from the surplus demand created from foreign buyers seeking to purchase its exports versus what it spends to purchase imports. Therefore, a positive net Trade Balance strengthens the AUD, with the opposite effect if the Trade Balance is negative.
Australia’s Retail Sales, a measure of the country’s consumer spending, rose 0.6% MoM in May from the previous reading of a 0.1% increase, according to the official data published by the Australian Bureau of Statistics (ABS) on Wednesday. The figure came in stronger than market expectations with a rise of 0.2%.
Market reaction to Australia’s Retail Sales data
At the time of writing, the AUD/USD pair is up 0.12% on the day at 0.6675.
Australian Dollar FAQs
One of the most significant factors for the Australian Dollar (AUD) is the level of interest rates set by the Reserve Bank of Australia (RBA). Because Australia is a resource-rich country another key driver is the price of its biggest export, Iron Ore. The health of the Chinese economy, its largest trading partner, is a factor, as well as inflation in Australia, its growth rate and Trade Balance. Market sentiment – whether investors are taking on more risky assets (risk-on) or seeking safe-havens (risk-off) – is also a factor, with risk-on positive for AUD.
The Reserve Bank of Australia (RBA) influences the Australian Dollar (AUD) by setting the level of interest rates that Australian banks can lend to each other. This influences the level of interest rates in the economy as a whole. The main goal of the RBA is to maintain a stable inflation rate of 2-3% by adjusting interest rates up or down. Relatively high interest rates compared to other major central banks support the AUD, and the opposite for relatively low. The RBA can also use quantitative easing and tightening to influence credit conditions, with the former AUD-negative and the latter AUD-positive.
China is Australia’s largest trading partner so the health of the Chinese economy is a major influence on the value of the Australian Dollar (AUD). When the Chinese economy is doing well it purchases more raw materials, goods and services from Australia, lifting demand for the AUD, and pushing up its value. The opposite is the case when the Chinese economy is not growing as fast as expected. Positive or negative surprises in Chinese growth data, therefore, often have a direct impact on the Australian Dollar and its pairs.
Iron Ore is Australia’s largest export, accounting for $118 billion a year according to data from 2021, with China as its primary destination. The price of Iron Ore, therefore, can be a driver of the Australian Dollar. Generally, if the price of Iron Ore rises, AUD also goes up, as aggregate demand for the currency increases. The opposite is the case if the price of Iron Ore falls. Higher Iron Ore prices also tend to result in a greater likelihood of a positive Trade Balance for Australia, which is also positive of the AUD.
The Trade Balance, which is the difference between what a country earns from its exports versus what it pays for its imports, is another factor that can influence the value of the Australian Dollar. If Australia produces highly sought after exports, then its currency will gain in value purely from the surplus demand created from foreign buyers seeking to purchase its exports versus what it spends to purchase imports. Therefore, a positive net Trade Balance strengthens the AUD, with the opposite effect if the Trade Balance is negative.
The People’s Bank of China (PBOC) set the USD/CNY central rate on Wednesday at 7.1312, as against the previous day's fix of 7.1291 and 7.2633 Reuters estimates.
- USD/CAD trades on a softer note around 1.3675 in Wednesday’s early Asian session.
- Fed’s Powell sees progress on inflation, but he wants to see further evidence before cutting interest rates.
- Canadian S&P Global Manufacturing PMI remained steady at 49.3 in June, weaker than expected.
The USD/CAD pair edges lower to 1.3675 during the early Asian trading hours on Wednesday, supported by the weaker US Dollar (USD). Traders will take more cues from the US ADP Employment Change, ISM Services PMI for June, and the FOMC Minutes, which are due later on Wednesday.
The Federal Reserve (Fed) Chair Jerome Powell turned slightly dovish on Tuesday, which has dragged the Greenback lower. Powell said that the Fed is getting back on the disinflationary path. However, Powell wants to see further evidence before cutting interest rates as the US economy and the labor market remain strong. Meanwhile, Chicago Fed President Austan Goolsbee said on Tuesday that progress on the final chunk of inflation heading towards the Fed's 2% inflation target will happen faster than many expect.
US JOLTS Job Openings climbed to 8.14 million in May, followed by the 7.91 million (revised from 8.05 million) openings reported in April. This figure exceeded the forecasts of 7.91 million, US Bureau of Labor Statistics reported on Tuesday.
On the CAD’s front, manufacturing activity in Canada remained weak in June as new orders declined and firms cut jobs for the first time in five months. The Canadian S&P Global Manufacturing PMI remains steady at 49.3 in June, weaker than the market estimation of 50.2. This figure registered the 14th straight month of contraction, the longest run in records dating back to October 2010.
Traders will closely watch the Canadian employment data on Friday. The Unemployment Rate is expected to rise to 6.3% in June, while the Canadian economy is estimated to see 22.5K jobs added in the same period.
Canadian Dollar FAQs
The key factors driving the Canadian Dollar (CAD) are the level of interest rates set by the Bank of Canada (BoC), the price of Oil, Canada’s largest export, the health of its economy, inflation and the Trade Balance, which is the difference between the value of Canada’s exports versus its imports. Other factors include market sentiment – whether investors are taking on more risky assets (risk-on) or seeking safe-havens (risk-off) – with risk-on being CAD-positive. As its largest trading partner, the health of the US economy is also a key factor influencing the Canadian Dollar.
The Bank of Canada (BoC) has a significant influence on the Canadian Dollar by setting the level of interest rates that banks can lend to one another. This influences the level of interest rates for everyone. The main goal of the BoC is to maintain inflation at 1-3% by adjusting interest rates up or down. Relatively higher interest rates tend to be positive for the CAD. The Bank of Canada can also use quantitative easing and tightening to influence credit conditions, with the former CAD-negative and the latter CAD-positive.
The price of Oil is a key factor impacting the value of the Canadian Dollar. Petroleum is Canada’s biggest export, so Oil price tends to have an immediate impact on the CAD value. Generally, if Oil price rises CAD also goes up, as aggregate demand for the currency increases. The opposite is the case if the price of Oil falls. Higher Oil prices also tend to result in a greater likelihood of a positive Trade Balance, which is also supportive of the CAD.
While inflation had always traditionally been thought of as a negative factor for a currency since it lowers the value of money, the opposite has actually been the case in modern times with the relaxation of cross-border capital controls. Higher inflation tends to lead central banks to put up interest rates which attracts more capital inflows from global investors seeking a lucrative place to keep their money. This increases demand for the local currency, which in Canada’s case is the Canadian Dollar.
Macroeconomic data releases gauge the health of the economy and can have an impact on the Canadian Dollar. Indicators such as GDP, Manufacturing and Services PMIs, employment, and consumer sentiment surveys can all influence the direction of the CAD. A strong economy is good for the Canadian Dollar. Not only does it attract more foreign investment but it may encourage the Bank of Canada to put up interest rates, leading to a stronger currency. If economic data is weak, however, the CAD is likely to fall.
| Index | Change, points | Closed | Change, % |
|---|---|---|---|
| NIKKEI 225 | 443.63 | 40074.69 | 1.12 |
| Hang Seng | 50.53 | 17769.14 | 0.29 |
| KOSPI | -23.45 | 2780.86 | -0.84 |
| ASX 200 | -32.5 | 7718.2 | -0.42 |
| DAX | -126.6 | 18164.06 | -0.69 |
| CAC 40 | -22.84 | 7538.29 | -0.3 |
| Dow Jones | 162.33 | 39331.85 | 0.41 |
| S&P 500 | 33.92 | 5509.01 | 0.62 |
| NASDAQ Composite | 149.46 | 18028.76 | 0.84 |
| Pare | Closed | Change, % |
|---|---|---|
| AUDUSD | 0.66663 | 0.12 |
| EURJPY | 173.45 | 0.03 |
| EURUSD | 1.07439 | 0.05 |
| GBPJPY | 204.771 | 0.26 |
| GBPUSD | 1.26845 | 0.29 |
| NZDUSD | 0.60756 | 0.09 |
| USDCAD | 1.36776 | -0.43 |
| USDCHF | 0.90354 | 0.06 |
| USDJPY | 161.435 | -0.03 |


© 2000-2026. Sva prava zaštićena.
Sajt je vlasništvo kompanije Teletrade D.J. LLC 2351 LLC 2022 (Euro House, Richmond Hill Road, Kingstown, VC0100, St. Vincent and the Grenadines).
Svi podaci koji se nalaze na sajtu ne predstavljaju osnovu za donošenje investicionih odluka, već su informativnog karaktera.
The company does not serve or provide services to customers who are residents of the US, Canada, Iran, The Democratic People's Republic of Korea, Yemen and FATF blacklisted countries.
Izvršenje trgovinskih operacija sa finansijskim instrumentima upotrebom marginalne trgovine pruža velike mogućnosti i omogućava investitorima ostvarivanje visokih prihoda. Međutim, takav vid trgovine povezan je sa potencijalno visokim nivoom rizika od gubitka sredstava. Проведение торговых операций на финанcовых рынках c маржинальными финанcовыми инcтрументами открывает широкие возможноcти, и позволяет инвеcторам, готовым пойти на риcк, получать выcокую прибыль, но при этом неcет в cебе потенциально выcокий уровень риcка получения убытков. Iz tog razloga je pre započinjanja trgovine potrebno odlučiti o izboru odgovarajuće investicione strategije, uzimajući u obzir raspoložive resurse.
Upotreba informacija: U slučaju potpunog ili delimičnog preuzimanja i daljeg korišćenja materijala koji se nalazi na sajtu, potrebno je navesti link odgovarajuće stranice na sajtu kompanije TeleTrade-a kao izvora informacija. Upotreba materijala na internetu mora biti praćena hiper linkom do web stranice teletrade.org. Automatski uvoz materijala i informacija sa stranice je zabranjen.
Ako imate bilo kakvih pitanja, obratite nam se pr@teletrade.global.
транcфери