- Analiza
- Novosti i instrumenti
- Vesti sa tržišta
Forex-novosti i prognoze od 03-06-2024
Japan's Monetary Base, or the amount of currency being supplied by the Bank of Japan (BoJ) as measured by combining all notes and coins in circulation in addition to current account balances, eased to 0.9% for the year ended in May as Japanese markets struggle to find uses for additional cash supplied by the BoJ. Investors broadly expected May's annualized Monetary Base to expand by 2.2% YoY, a slight uptick from the previous period's 2.1%.
Market reaction
USD/JPY is battling the 156.00 handle in the early hours of the Pacific market session. The pair is down from the week's early bids near 157.40 and testing into near-term lows as the Greenback falls in a broad-market recovery in risk appetite.
USD/JPY hourly chart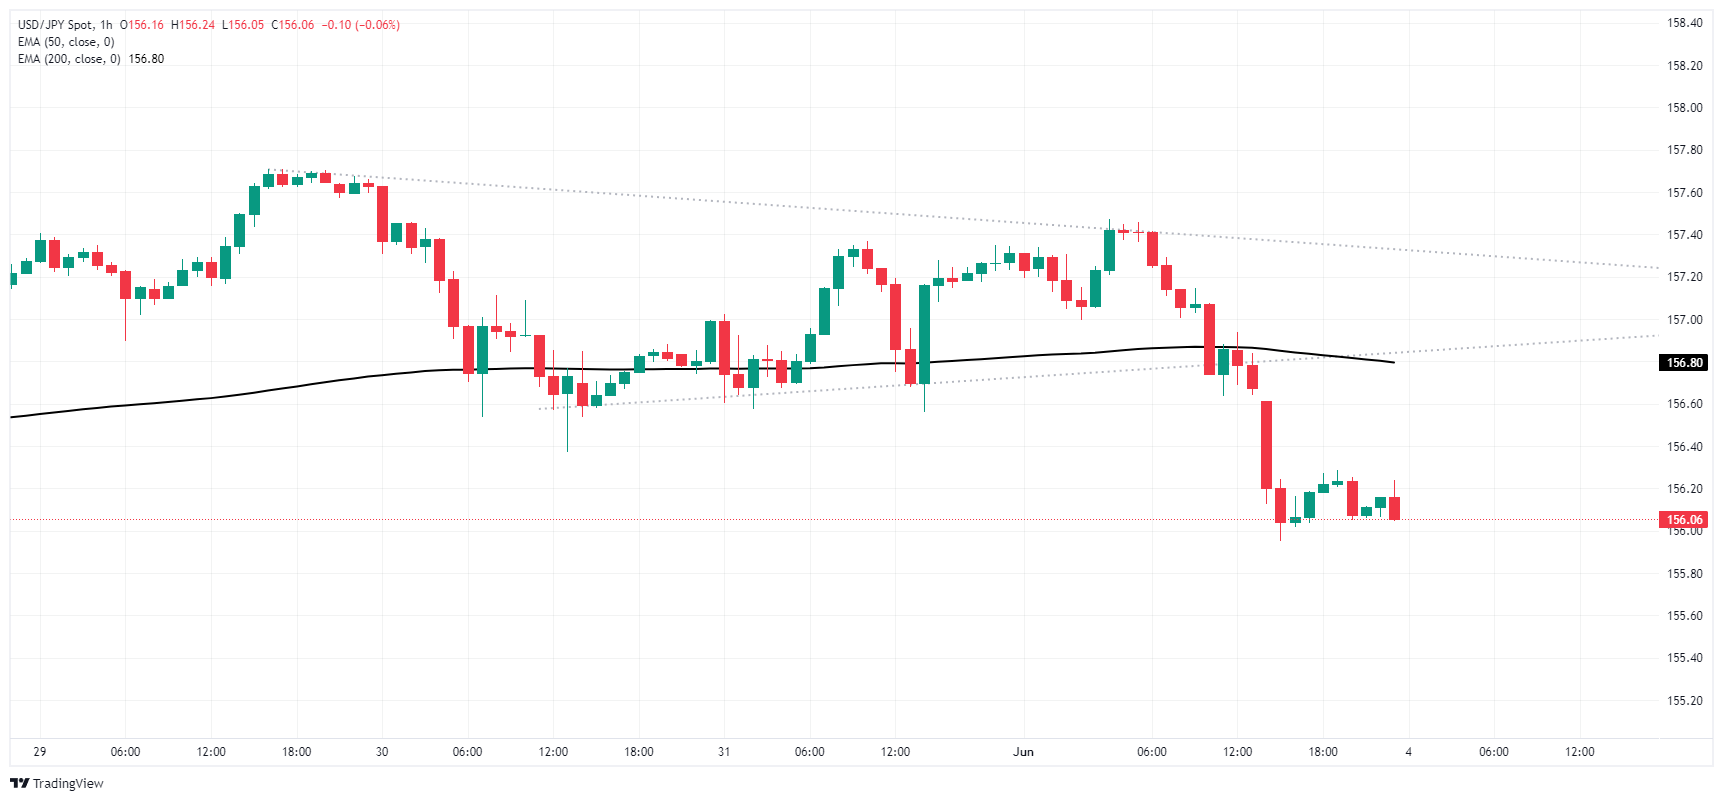
About Japanese Monetary Base
The Monetary Base released by the Bank of Japan is the "Currency Supplied by the BoJ" including all the JPY in circulation, encompassing notes and coins as well as money held in bank accounts. It is considered as an important indicator of inflation, as monetary expansion adds pressure to the exchange rates. An acceleration of monetary base is considered as positive for the JPY, whereas a decline is seen as negative.
- NZD/USD trades flat around 0.6190 in Tuesday’s early Asian session.
- The US Manufacturing PMI dropped to 48.7 in May from 49.2 in April, weaker than expected.
- The improving Chinese Caixin Manufacturing PMI data and the hawkish stance from the RBNZ support the Kiwi.
The NZD/USD pair consolidates its gains near 0.6190 on Tuesday during the early Asian session. The worse-than-expected US ISM Manufacturing PMI data has dragged the Greenback lower and supported the pair. Investors await the US ISM Services PMI, which is due on Wednesday. On Friday, US employment data, including Nonfarm Payrolls, Unemployment Rate, and Average Hourly Earnings will be in the spotlight.
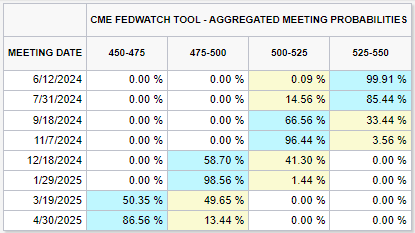
The US manufacturing sector had a second consecutive month of contraction in May and the 18th time in the last 19 months, the Institute for Supply Management (ISM) showed on Monday. The US Manufacturing PMI came in weaker than expected, dropping to 48.7 in May from 49.2 in April. Traders raise their bets on the US Federal Reserve (Fed) rate cuts this year, seeing nearly a 53% odds of a rate cut in September, up from 49% before the inflation report, according to the CME FedWatch tool.
On the Kiwi front, the encouraging Chinese Caixin Manufacturing PMI for May lifted the China-proxy New Zealand Dollar (NZD) as New Zealand is one of China's leading trading partners. Apart from this, the hawkish stance from the Reserve Bank of New Zealand (RBNZ) further boosted the NZD, as RBNZ Deputy Governor Christian Hawkesby said in recent weeks that cutting interest rates is not part of the near-term discussion and the central bank needs to maintain rates for longer to ensure inflation returns to the 1-3% target range.
- EUR/USD vaulted into fresh near-term highs to kick off the new trading week.
- Markets broadly sold off the Greenback after worse-than-expected PMIs.
- Thursday’s ECB rate call, Friday’s US NFP labor print loom ahead.
EUR/USD kicked off another Nonfarm Payrolls (NFP) week looking for higher ground, vaulting the Euro to its highest bids against the US Dollar in almost ten weeks, clipping over the 1.0900 handle. Monday’s one-sided trading leaves the Fiber overextended in bullish chart territory, and it will be several days until meaningful data hits newsfeeds.
Tuesday will carry the week’s momentum into a moderately thin economic calendar. Final German unemployment figures for May are due early during European market hours, and Tuesday’s US market session will follow up with US Factory Orders and JOLTS Job Openings.
Germany’s Unemployment Change in May is expected to hold steady at 10K MoM, with the seasonally-adjusted Unemployment Rate broadly expected to hold flat at 5.9%. On the US side, Tuesday’s upcoming MoM Factory Orders in April are forecast to ease to 0.6% from 1.6%, while JOLTS Job Openings are expected to ease slightly to 8.34 million MoM in April compared to the previous 8.488 million.
Firm early-week bidding set to clash with ECB rate cuts and NFP jobs data
Thursday’s ECB rate call will be closely watched by Fiber traders. The ECB is broadly expected to trim its Main Refinancing Operations Rate by 25 basis points to 4.25%, and with a first rate cut all but priced in, investors will be scrambling to take a look at the ECB’s Monetary Policy Report for signals about when a follow-up rate cut will be forthcoming.
Friday will close out an otherwise mild trading week with a fresh print of US NFP labor data. The US is expected to have added 190K new jobs through May, a tick higher than the previous month’s 175K. Investors desperate for rate cuts, which are currently pricing in a first rate trim from the Federal Reserve (Fed) in November, will be looking for downside revisions to key employment figures in order to knock the Fed into a faster pace of rate cuts.
EUR/USD technical outlook
EUR/USD drove into fresh ten-week highs on Monday, crossing 1.0900 and testing 1.0910 for the first time since late March. The pair has pushed deep into the north side of the 200-day Exponential Moving Average (EMA) at 1.0804, and overbought conditions could set into the pair and drag the Fiber back into consolidation territory.
A long-running pattern of lower highs from 2024’s peak bids near 1.1140 is weighing on continued bullish pressure, though the pair has broken through a descending trendline and could make a leg higher after a brief pullback to the 1.0850-1.0800 region.
EUR/USD hourly chart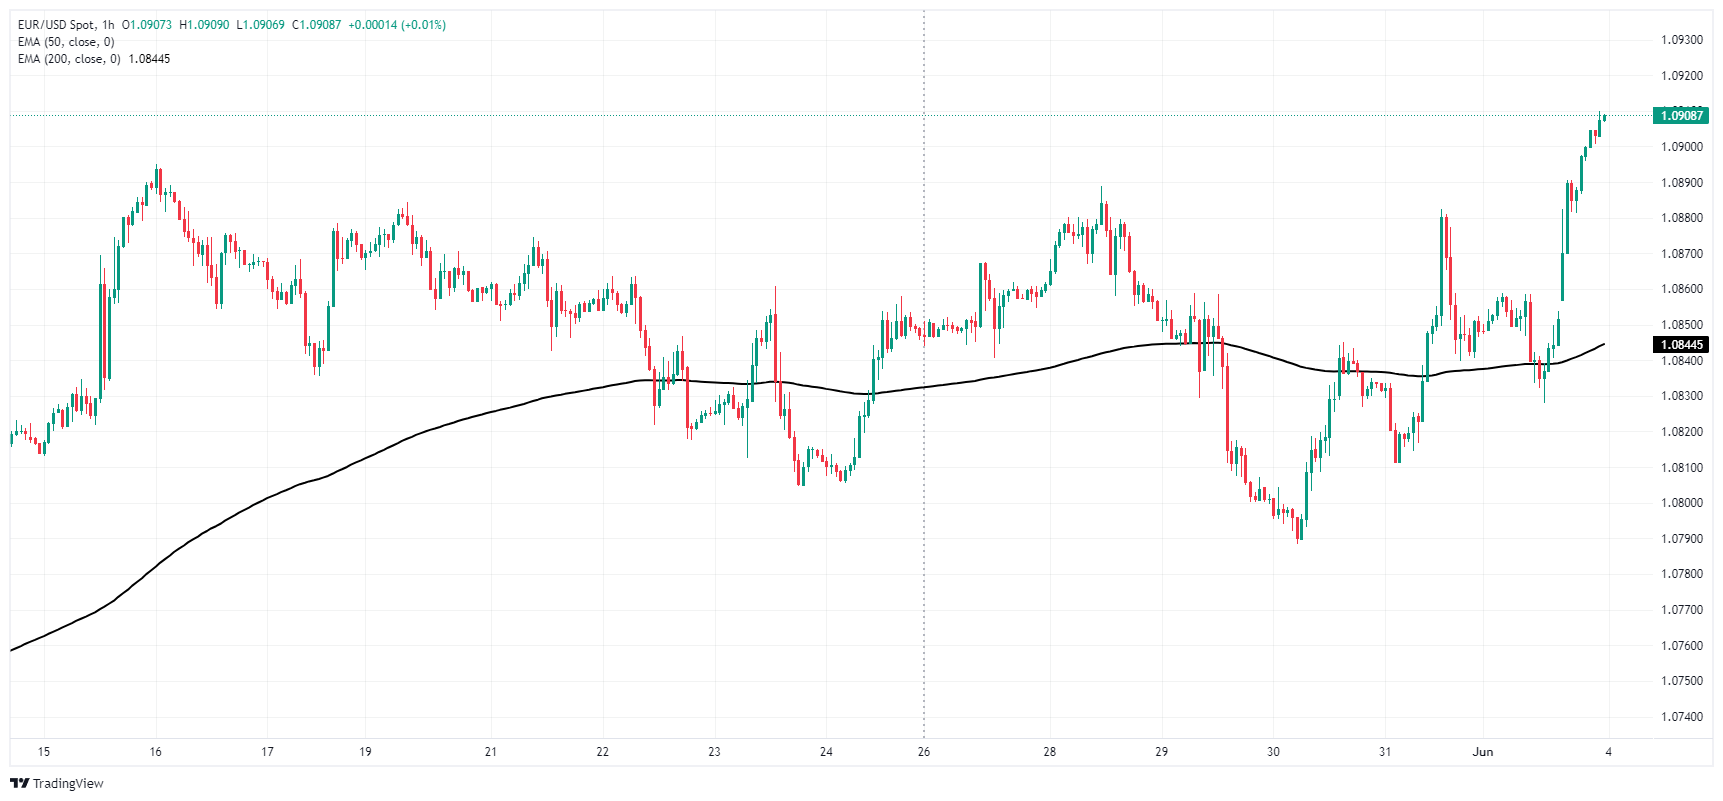
EUR/USD daily chart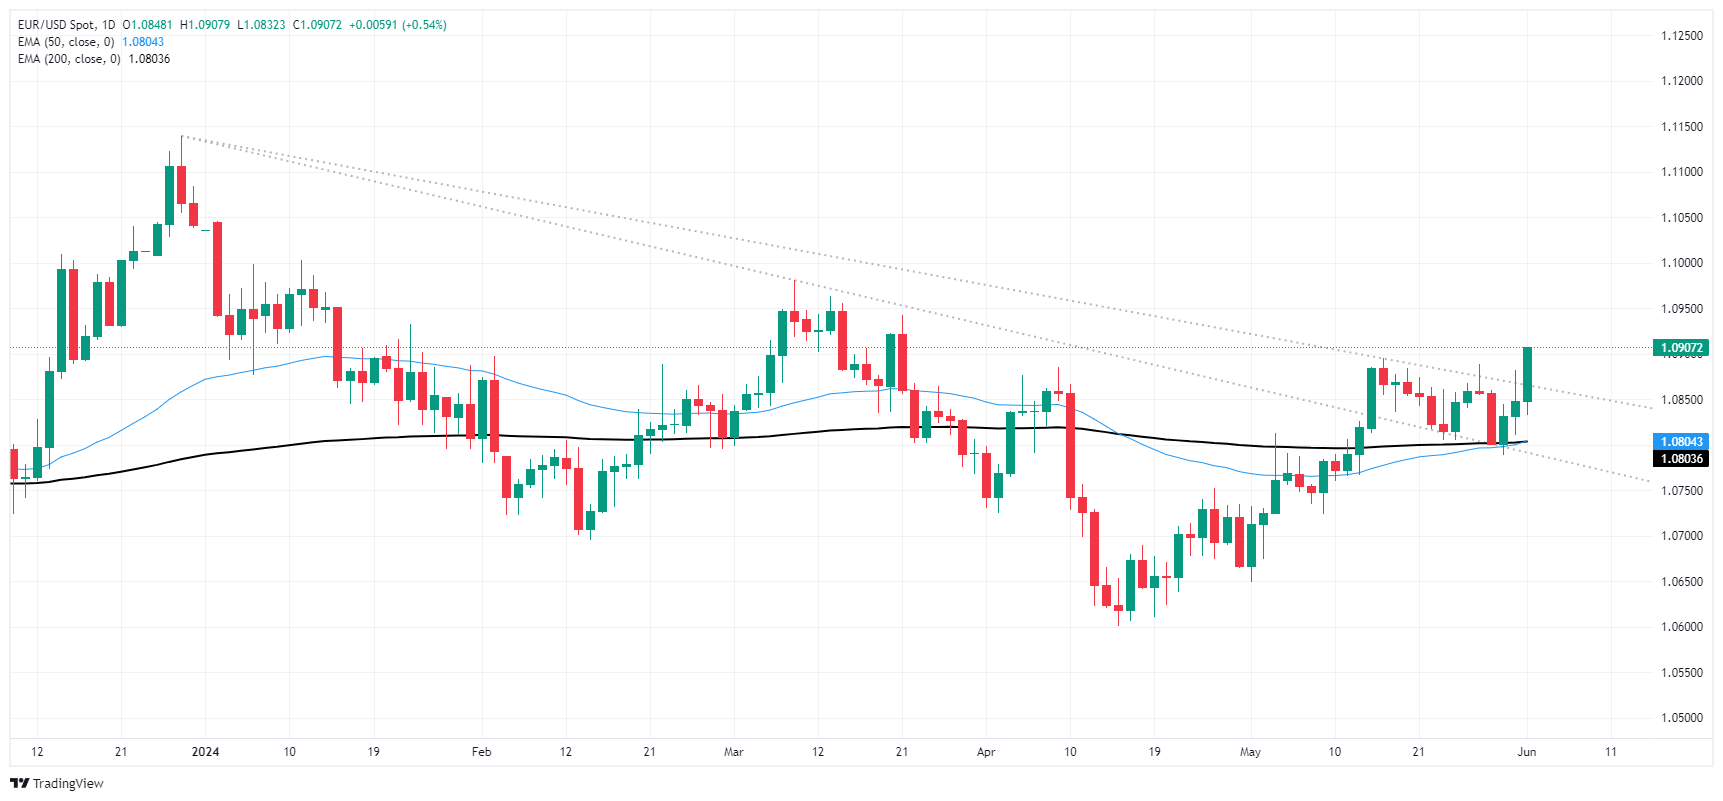
- AUD/USD rises to 0.6693, buoyed by weaker US business activity data and falling Treasury yields.
- ISM Manufacturing PMI dips to 48.7, signaling contraction, while S&P Global PMI shows slight recovery.
- Upcoming US Nonfarm Payrolls report and Australian economic data could influence AUD/USD direction.
The Australian Dollar registered gains of 0.55% versus the Greenback on Monday and opened Asian Tuesday’s session with renewed strength amid falling US yields. Expectations that the Federal Reserve would ease policy in 2024 were fueled by a weaker-than-expected US business activity report. The AUD/USD trades at 0.6693, virtually unchanged.
Aussie Dollar up as US yields drop and undermine the buck
US data was the driver of the day. The Institute for Supply Management (ISM) reported that business activity in the manufacturing sector slowed in May for the third straight month. The ISM Manufacturing PMI decreased from 49.2 to 48.7 for the second straight reading at contractionary ground and below the consensus of 49.6.
Other data from S&P Global highlighted a recovery for the same sector, with the Manufacturing PMI expanding from 50 to 51.3, which is above estimates of 50.9.
The AUD/USD advanced due to overall US Dollar weakness, undermined by lower US Treasury yields. The US 10-year Treasury bond yields plunged eleven basis points to 4.392%, while the US Dollar Index (DXY) dove 0.5% to 104.07. However, US data ahead could change the pair's direction as the release of the US Nonfarm Payrolls report looms.
Fed funds rate futures estimate just 32 basis points of interest rate cuts in 2024, according to data from the Chicago Board of Trade (CBOT).
On Australia’s front, the schedule will feature Company Gross Profits and Business Inventories for the first quarter of 2024, on QoQ figures, along with the Current Account for the same period and the final Retail Sales report for April. month.
AUD/USD Price Analysis: Technical outlook
From a technical perspective, a ‘double bottom’ chart pattern looms, which could pave the way to test 0.6750 and beyond. However, to confirm its validity, buyers must crack the latest cycle high of 0.6714 before reaching 0.6750 and the 0.6800 figure. Otherwise, if sellers moved in and kept prices below 0.6700, look for a retest of the 0.6600 figure.
- GBP/USD gains ground near 1.2810 amid the weaker USD on Tuesday.
- The US ISM Manufacturing PMI declined to 48.7 in May from 49.2 in April, worse than expected.
- Traders expect that the BoE could start cutting interest rates from August meeting.
The GBP/USD pair attracts some buyers around 1.2810 during the early Asian session on Tuesday. The uptick of the major pair near multi-week highs is bolstered by the softer US dollar (USD) after the weaker-than-expected US Manufacturing PMI data. Later on Tuesday, the US Factory Orders and JOLTs Job Openings will be released.
The manufacturing sector in the United States contracted at an accelerating pace in May, the Institute for Supply Management (ISM) reported on Monday. The US ISM Manufacturing PMI dropped to 48.7 in May from 49.2 in April, below the market consensus of 49.6. The Greenback faced some renewed selling pressure in response to the downbeat data.
Ahead of the blackout period for the FOMC, Minneapolis Fed president Neel Kashkari noted that interest rates need to stay on hold for an “extended” time, adding that lowering borrowing costs before inflation was under control would put the foundations of US prosperity at risk. Nonetheless, the recent cooler US PCE inflation data and weaker US Manufacturing PMI have triggered the expectation that the US Federal Reserve (Fed) will cut the interest rate this year. Traders are now pricing in nearly a 53% possibility of a Fed rate cut in September, up from 49% before the inflation report.
On the other hand, the markets anticipate that the Bank of England (BoE) could start cutting interest rates from the August meeting as UK annual headline inflation eased significantly in April. However, the BoE policymakers remain worried about slower progress in the service disinflation process. In the absence of top-tier economic data releases from the UK, the USD price dynamics will continue to play a key role in influencing the GBP/USD this week.
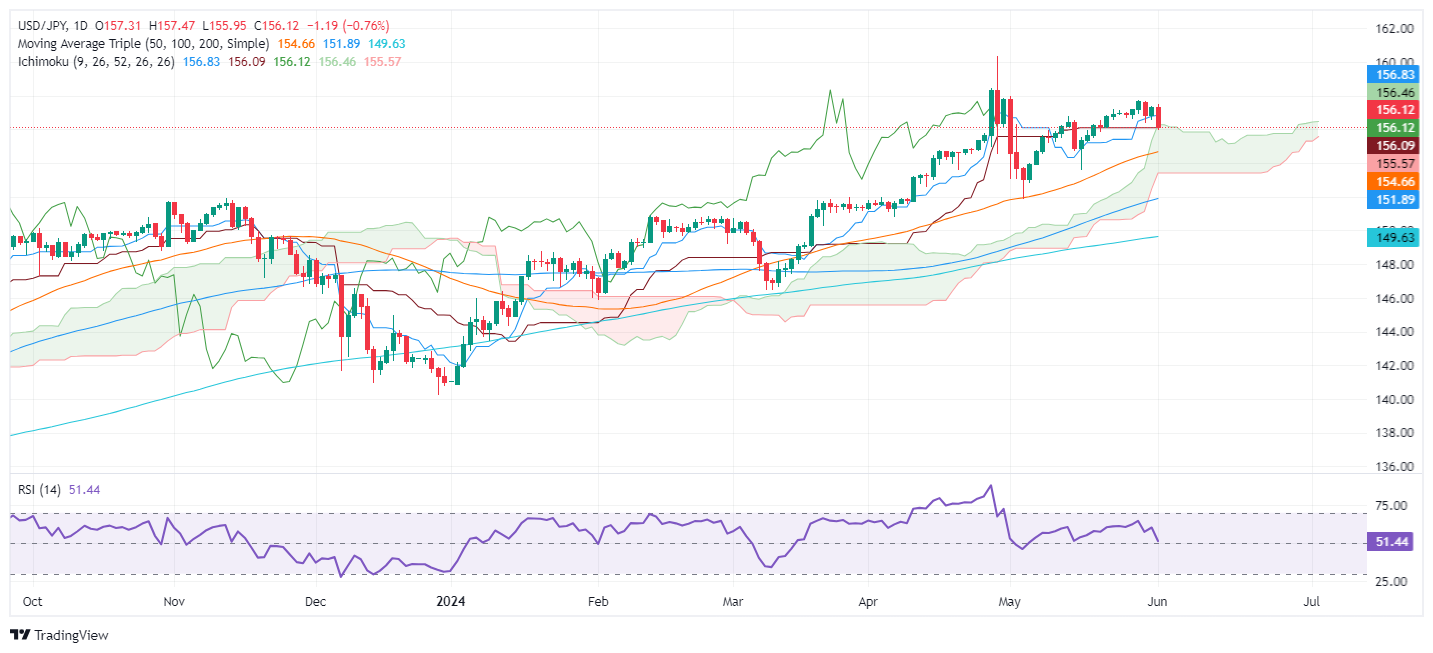
- USD/JPY retreats as it forms a bearish engulfing candle chart pattern.
- Technical outlook: USD/JPY drops below Ichimoku Cloud top at 155.95, hinting at potential further declines.
- Key support levels: Tenkan-Sen at 154.92, 50-DMA at 154.74, and trendline at 154.20; resistance at Kumo top 156.15/20 and May 29 high of 157.71.
The USD/JPY retreated more than 0.70% on Monday following softer-than-expected business activity data in the United States (US). That, along with last Friday’s inflation report, the Fed’s Core PCE, reignited speculation that the US central bank could slash rates toward the end of the year. The pair trades at 156.14.
USD/JPY Price Analysis: Technical outlook
From a daily chart perspective, the USD/JPY failed to pierce the 157.50 resistance level and dived below the 157.00 figure, exacerbating a drop below the top of the Ichimoku Cloud (Kumo) at around 155.95, opening the door for further losses.
Even though momentum favors buyers, as depicted by the Relative Strength Index (RSI), it has turned flat close to the 50 midlines, about to enter bearish territory.
In the short term, the USD/JPY is neutral to downward biased. The first support would be the Tenkan-Sen at 154.92, followed by the 50-day moving average (DMA) at 154.74. Once cleared, the next stop would be an upslope support trendline at 154.20 before testing the bottom of the Kumo at 153.30/40.
Conversely, if USD/JPY climbs above the top of the Kumo at around 156.15/20, that would sponsor an uptick toward the May 29 high at 157.71.
USD/JPY Price Action – Daily Chart
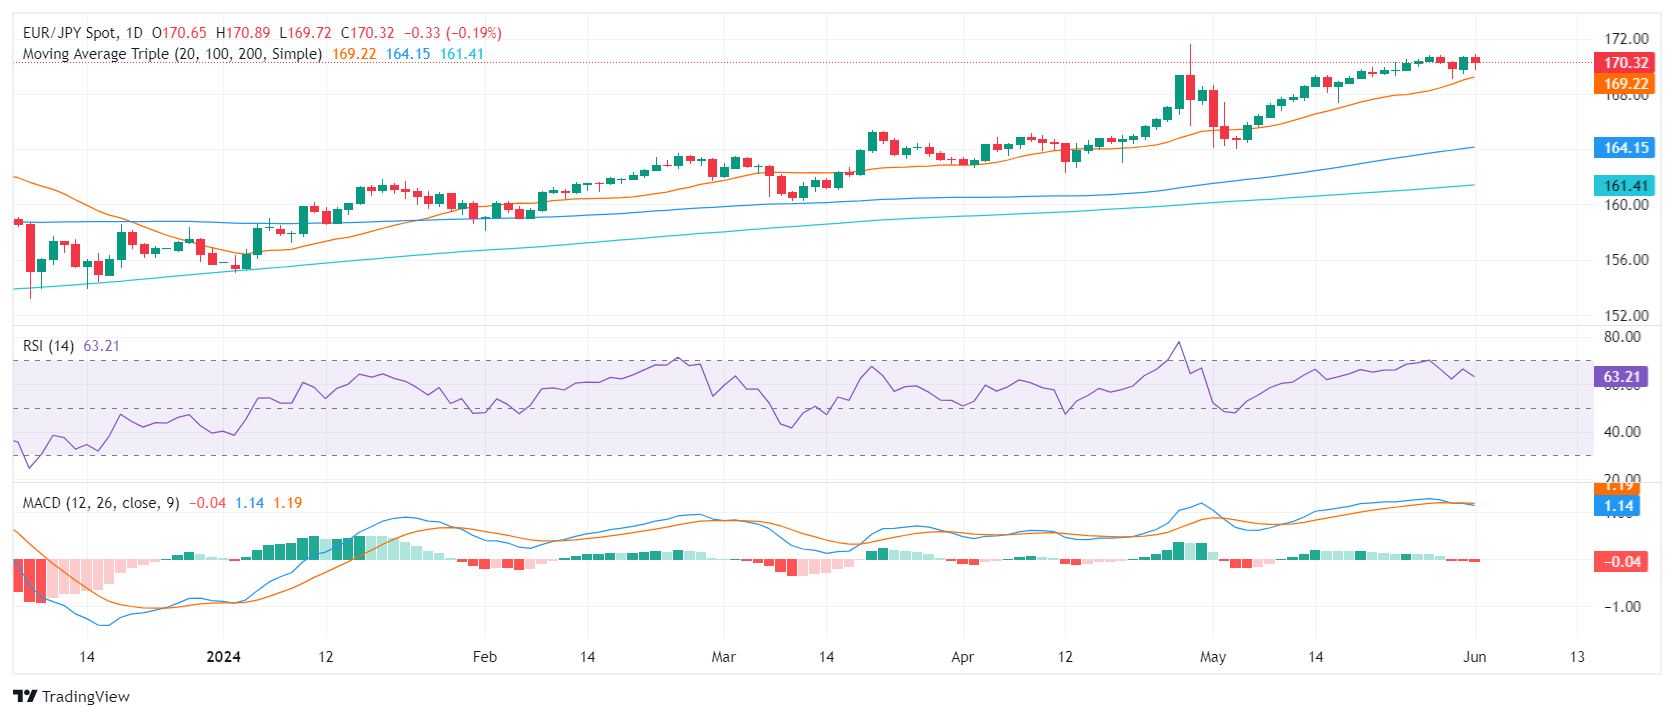
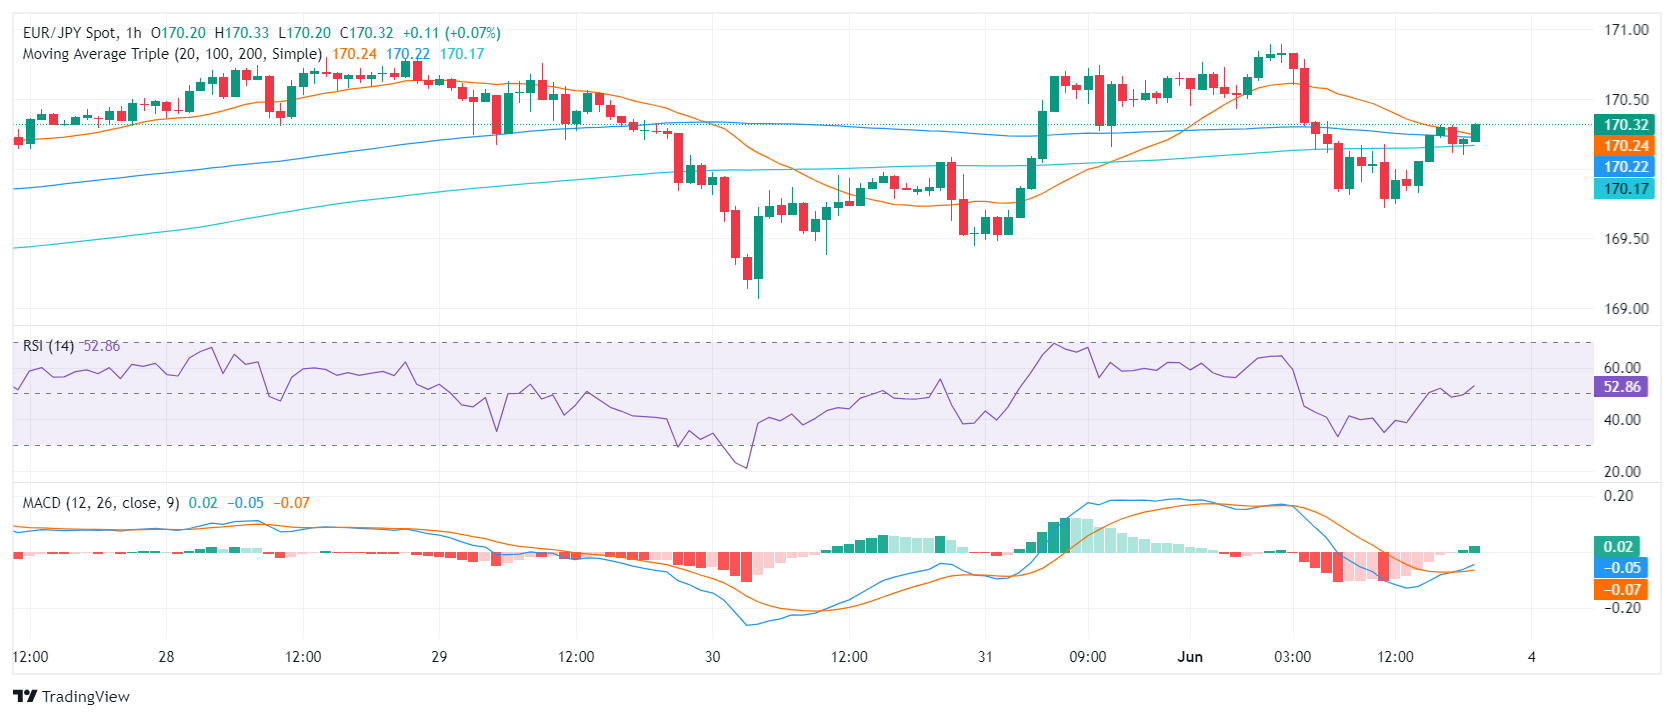
- The daily RSI has shifted downwards and with the MACD showing increasing red bars pointing to a slowdown in upward momentum.
- On the hourly chart, indicators suggest moderate bullish momentum, supported by an increasing RSI and green bars in the MACD.
- The 20-day SMA at 169.22 serves as a critical support level for the pair to consolidate.
In Monday's session, a weak Yen against its rivals caused the EUR/JPY pair to slip to 170.30. Despite this slip, the pair's position remains solid above the key support level of the 20-day SMA at 169.22. However, as the pair currently hovers in overbought territory, the upside appears limited.
The daily Relative Strength Index (RSI) showed a reduction to 61, suggesting a potential slowdown in the pair's upward momentum. The daily MACD, with increasing red bars, agrees with this outlook..
EUR/JPY daily chart
On the hourly chart, the RSI suggests a moderate bullish momentum, standing at 51, marking a positive shift in the session. The hourly MACD, showing rising green bars, supports this short-term bullish sentiment. Nevertheless, because the pair is hovering in the overbought zone, the upward move may be short-lived.
EUR/JPY hourly chart
Meanwhile, the pair continues to trade above the significant support level of the 20-day Simple Moving Average (SMA). Should the position fall below this support level, sellers may meet further resistance at the 100 and 200-day SMAs, providing a safety barrier at around 164.00 and 161.00. As long as these support levels are defended, the overall bullish outlook remains intact, despite the possibility of consolidation. On the upside, the buyers must recapture the 167.00 area to continue moving upwards.
- GBP/JPY cycles 200.00 in rough churn as Yen struggles to hold steady.
- GBP and JPY settle in for a quiet week on the data docket.
- UK Retail Sales and Japanese wages both expected to rebound this week.
GBP/JPY is cycling the 200.00 major handle heading into a quiet week for both currencies, with the economic data calendar almost entirely populated with low-tier data releases through the majority of the trading week. UK BRC Like-For-Like Retail Sales are expected to recover ground in May, while Japanese Labor Cash Earnings are expected to accelerate for the year ended in April.
UK YoY BRC Retail Sales are expected to rebound to 1.2% through May, a healthy recovery but still underperforming the previous period’s -4.4% decline. April’s YoY Retail Sales figures had tumbled to its lowest level since December of 2019, and investors are hoping that May’s annualized figure is able to recover ground. UK BRC Retail Sales are slated to print early Tuesday.
Japanese Labor Cash Earnings are expected to accelerate to 1.7% for the year ended in April, forecast to rise to 1.7% from the previous period’s 0.6% increase. Wage growth remains a key driver in Bank of Japan (BoJ) policymaking as the Japanese central bank remains fearful of Japanese inflation slumping to near-zero growth figures. A firm rebound in wage growth will help bolster the BoJ’s confidence in closing the differential between Japanese monetary policy and other major central banks around the world.
GBP/JPY technical outlook
GBP/JPY has struggled in a rough range after hitting multi-decade highs at 200.75 in May, waffling between bids north of 200.00 and a near-term floor just below 199.00. The Guppy is treading water on the high side, but bulls finally appear to have run out of gas after pushing the pair into higher closes for five consecutive months.
GBP/JPY hourly chart
GBP/JPY daily chart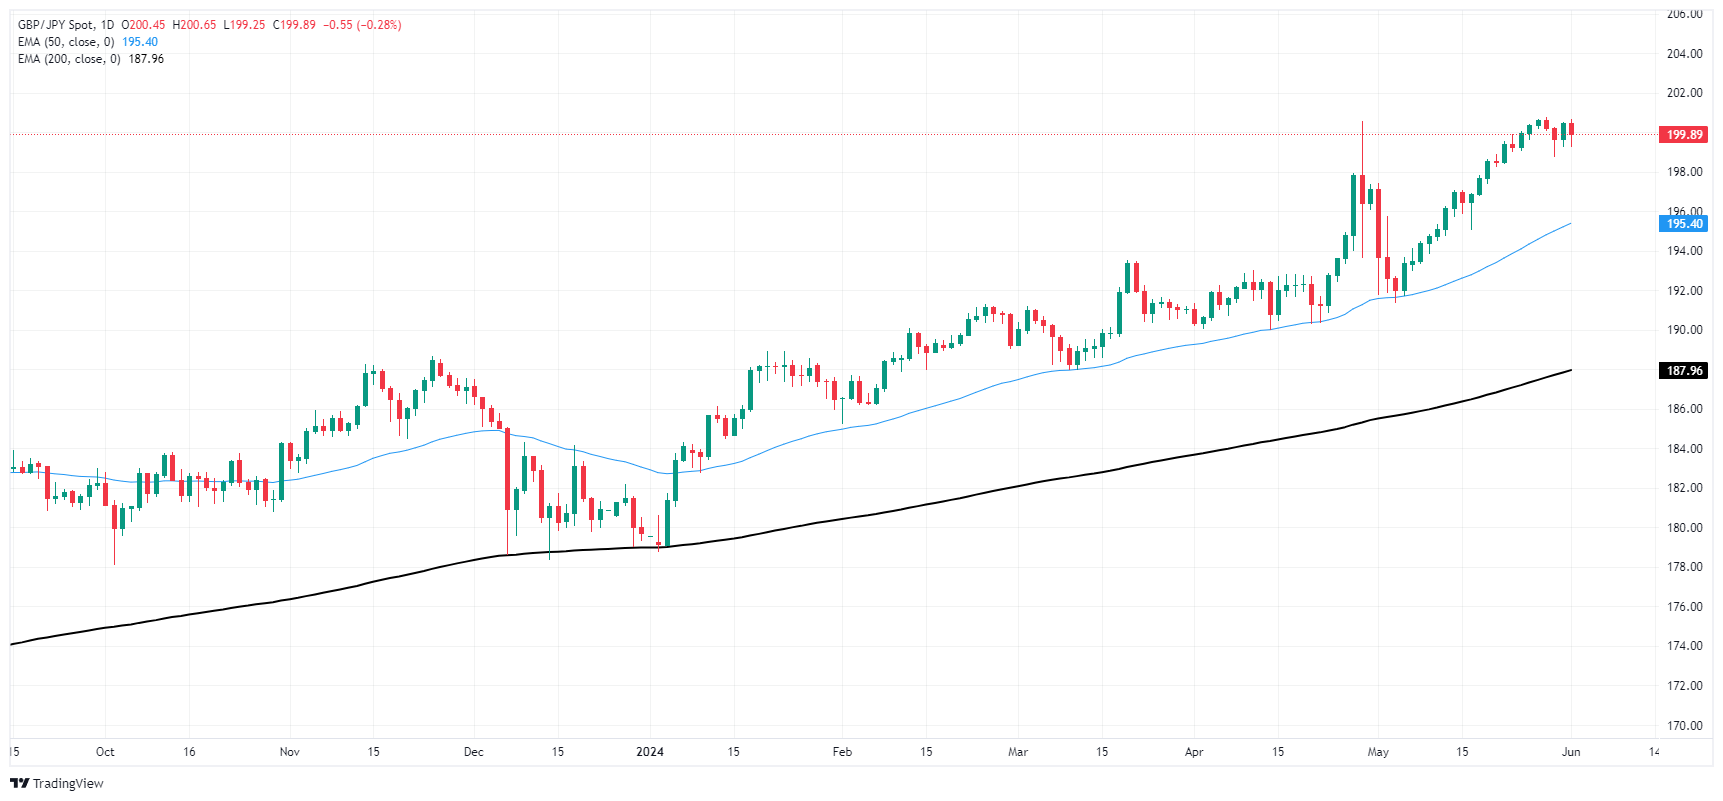
- Daily chart indicators suggest a downward trend; the decline in RSI is marking a downward momentum
- Signs of bullish exhaustion after the recent gains have strengthened the consolidation outlook.
- The pair currently targets support around the 103.70 area, which aligns with the 20-day SMA.
In Monday's trading session, the AUD/JPY pair slipped to the 104.35 region due to the resumption of a downward momentum. The pair's upward trajectory appears increasingly exhausted, and a consolidation phase seems more probable moving forward.
As per the daily chart, the RSI has descended to 59 from the previous session's reading of 65, suggesting a continued downward momentum. Along with this, the MACD prints rising red bars, indicating an increase in the selling traction
AUD/JPY daily chart
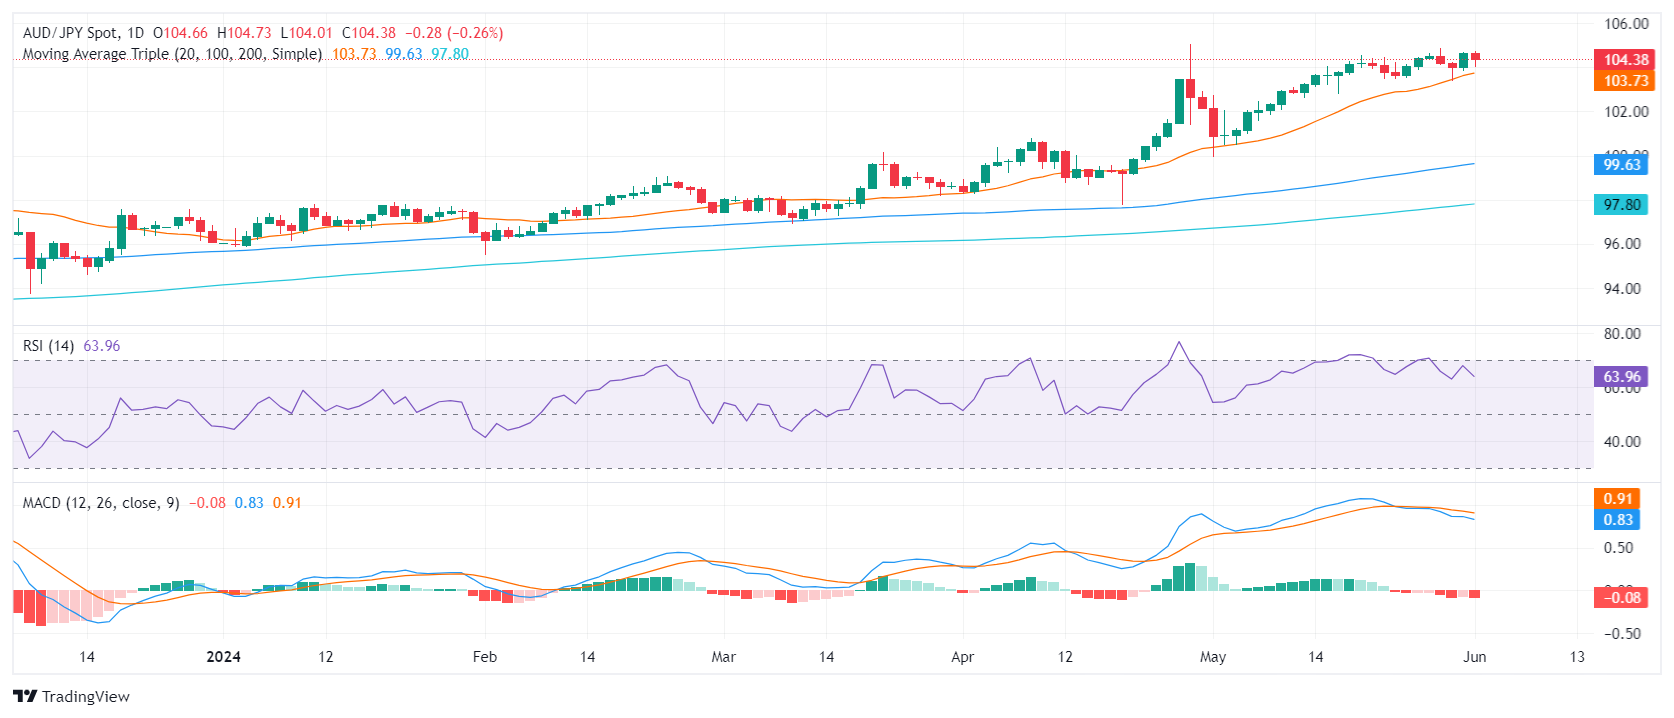
The 20-day SMA has now established a sturdy support base around the 103.70 region, which could potentially halt the ongoing losses. Any breakthrough below the 20-day SMA could prompt a short-term bearish atmosphere.
In the case of a further decline, the 100 and 200-day SMA might act as barriers to cushion losses. On the other hand, the bulls might face resistance in trying to push the pair back above the 105.00 mark. If the pair fails to break through these integral points, traders might witness the pair entering into a consolidation phase.
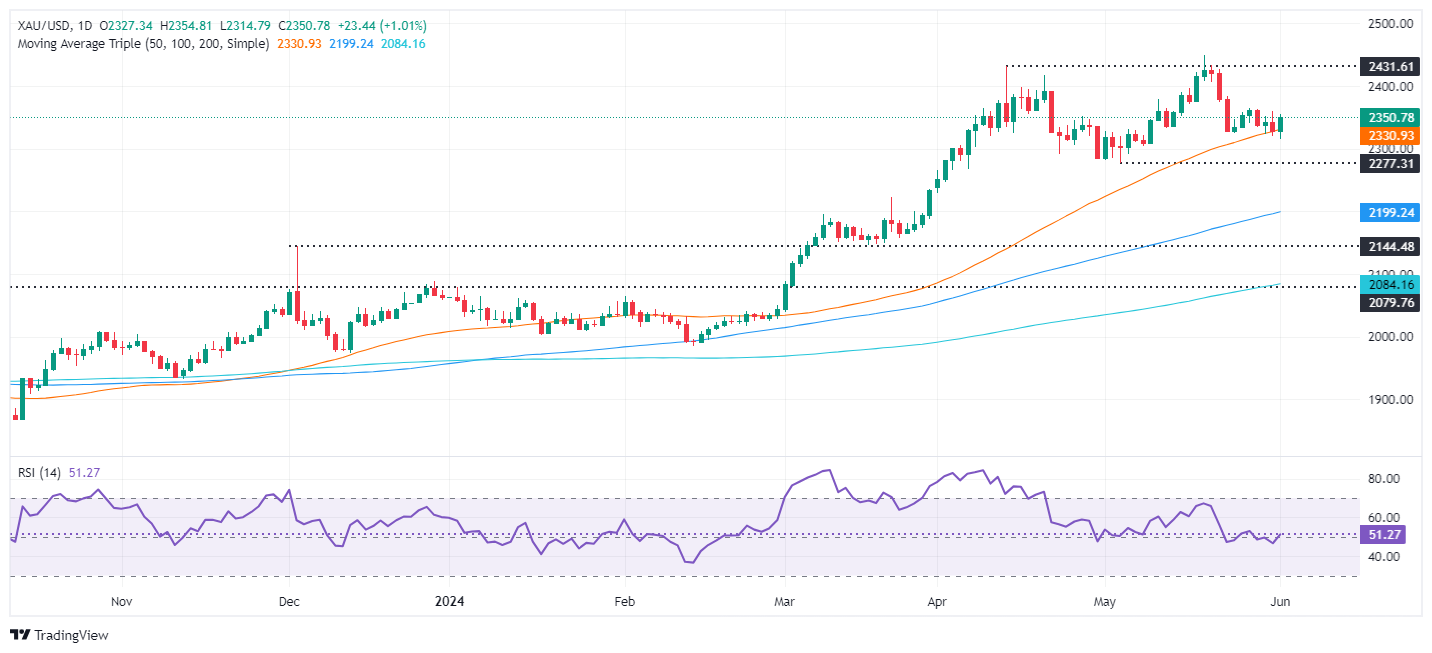
- Gold climbs over 0.80% after hitting a daily low of $2,314.
- Mixed US economic data and stable PCE inflation raise hopes for Fed rate cuts.
- US Treasury yields drop, extending Greenback’s losses for the third consecutive day.
Gold climbed more than 0.80% after US Treasury bond yields dropped following the release of mixed data from the United States (US), increasing hopes that the US Federal Reserve might ease policy. That, along with a risk-off impulse, kept the yellow metal climbing after hitting a daily low of $2,314 and trading at $2,345.
Last week, the Fed’s preferred inflation gauge, the US Core Personal Consumption Expenditure Price Index (PCE), stabilized, augmenting hopes for rate cuts. Meanwhile, business activity was mixed, according to reports from S&P Global and the Institute for Supply Management (ISM) in May, with the latter contracting for the second consecutive month.
Consequently, US Treasury bond yields dropped, and the Greenback extended its losses to three straight days. The US 10-year Treasury bond yields plunged eleven basis points to 4.392%. The US Dollar Index (DXY), which tracks the performance against a basket of six currencies, fell 0.5% to 104.07.
On the geopolitics front, Hamas accepted US President Joe Biden's cease-fire proposal for Gaza. However, Israeli President Benjamin Netanyahu rejected the idea and emphasized Israel’s conditions for ending the war.
Daily Digest Market Movers: Gold price rises as US Treasury yields retreat from multi-week high
- Gold prices advance after bouncing off the 50-day Simple Moving Average (SMA) at $2,324.
- US S&P Global revealed that Manufacturing PMI for May increased from 50 to 51.3, exceeding estimates of 50.9
- The ISM Manufacturing PMI contracted further, from 49.2 to 48.7.
- Traders are currently pricing about a 59% chance of a rate cut, according to the CME FedWatch Tool.
- The US economic docket during the week will feature Factory Orders, JOLTS Job openings, and ADP Employment Change ahead of Friday’s Nonfarm Payrolls.
- Fed funds rate futures estimate just 32 basis points of interest rate cuts in 2024, according to data provided by the Chicago Board of Trade (CBOT).
Technical analysis: Gold price climbs and hovers at $2,350
Gold price uptrend remains intact after bouncing off the 50-day Simple Moving Average (SMA) at $2,331. Momentum shifted in favor of the buyers, as the Relative Strength Index (RSI) remained above the 50 midline, opening the door for further Gold’s upside.
Further gains lie ahead if XAU/USD buyers reclaim the $2,400 level, followed by the year-to-date high of $2,450 and, subsequently, the $2,500 mark.
Conversely, if XAU/USD falls below the 50-day Simple Moving Average (SMA) at $2,331, that could pave the way to challenge the May 8 low of $2,303, followed by the May 3 cycle low of $2,277.
Gold FAQs
Gold has played a key role in human’s history as it has been widely used as a store of value and medium of exchange. Currently, apart from its shine and usage for jewelry, the precious metal is widely seen as a safe-haven asset, meaning that it is considered a good investment during turbulent times. Gold is also widely seen as a hedge against inflation and against depreciating currencies as it doesn’t rely on any specific issuer or government.
Central banks are the biggest Gold holders. In their aim to support their currencies in turbulent times, central banks tend to diversify their reserves and buy Gold to improve the perceived strength of the economy and the currency. High Gold reserves can be a source of trust for a country’s solvency. Central banks added 1,136 tonnes of Gold worth around $70 billion to their reserves in 2022, according to data from the World Gold Council. This is the highest yearly purchase since records began. Central banks from emerging economies such as China, India and Turkey are quickly increasing their Gold reserves.
Gold has an inverse correlation with the US Dollar and US Treasuries, which are both major reserve and safe-haven assets. When the Dollar depreciates, Gold tends to rise, enabling investors and central banks to diversify their assets in turbulent times. Gold is also inversely correlated with risk assets. A rally in the stock market tends to weaken Gold price, while sell-offs in riskier markets tend to favor the precious metal.
The price can move due to a wide range of factors. Geopolitical instability or fears of a deep recession can quickly make Gold price escalate due to its safe-haven status. As a yield-less asset, Gold tends to rise with lower interest rates, while higher cost of money usually weighs down on the yellow metal. Still, most moves depend on how the US Dollar (USD) behaves as the asset is priced in dollars (XAU/USD). A strong Dollar tends to keep the price of Gold controlled, whereas a weaker Dollar is likely to push Gold prices up.
- Negative momentum nudges the NZD/JPY pair into a slight retreat, with consolidation continuing to dominate the trend.
- The sellers face a considerable barrier at the 96.30 area.
- The buying momentum continues to be limited.
During Monday's session, the NZD/JPY pair experienced a slight retreat as the sellers tried pushing past a strong resistance at the 96.30 area. However, the charm offensive from the buyers wasn't entirely diminished, holding the pair in a protracted consolidation phase over the course of the day.
Though still well within positive territory, the Relative Strength Index (RSI) has dropped to 67, from 71. This drop, mild in nature, indicates a reduction in the momentum that characterized the previous session's overbought situation However, on Monday the index managed to jump back near the 70 threshold suggesting that there is still more toom to correct. Concurrently, the Moving Average Convergence Divergence (MACD) continues to register decreasing green bars, suggesting a decline in buying momentum. The combination of these factors implies the potential for a continued period of consolidation, rather than a reversal of the uptrend seen recently.
NZD/JPY daily chart
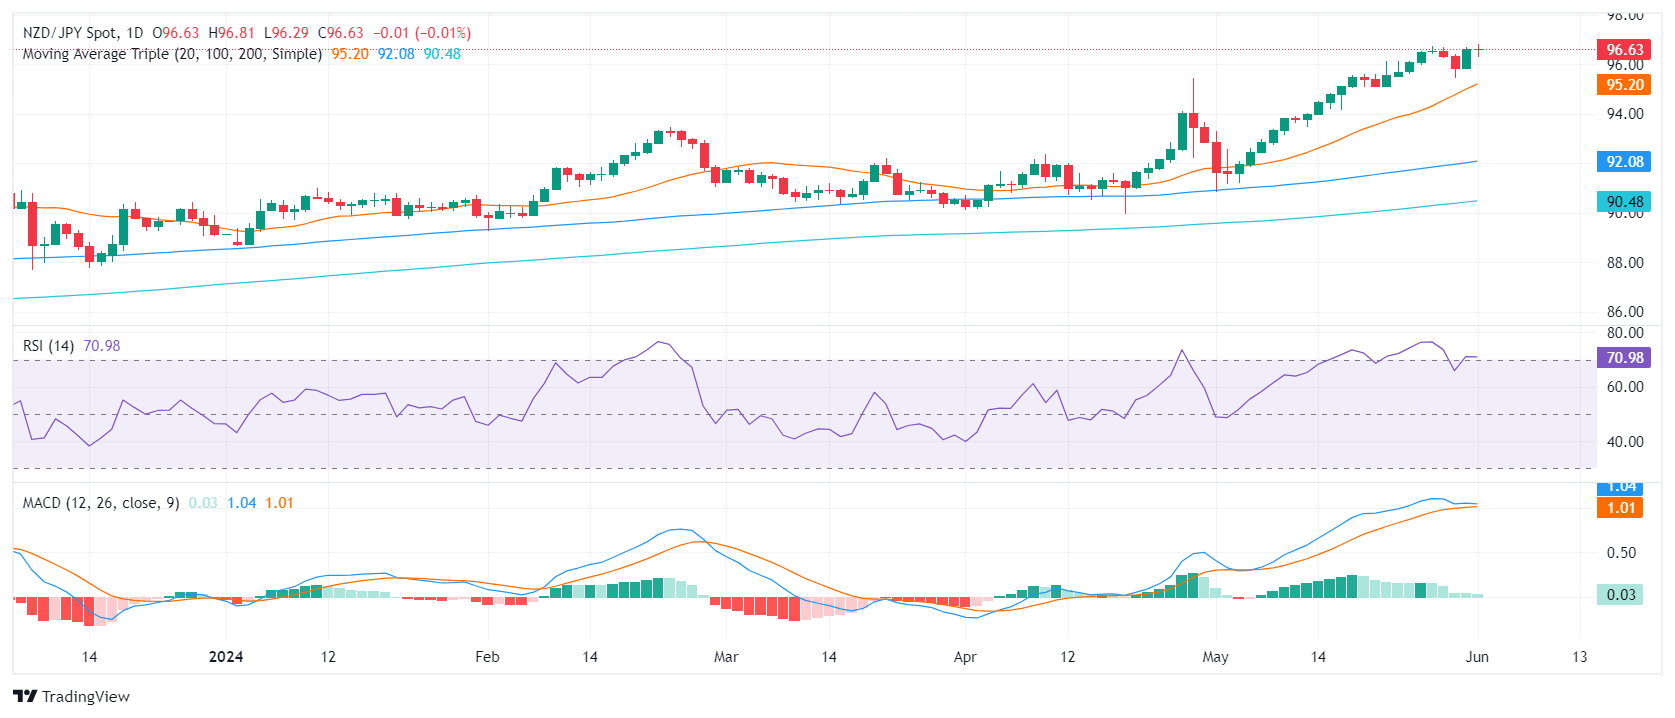
This retreat is by no means a synonym for reversal. The outlook still remains positive, and the NZD/JPY pair continues to rest well above a healthy support level at 95.50. For the balance to tip in favor of the sellers, they would need to crack this support and break below the 20-day Simple Moving Average (SMA) at 95.20, a level that has provided reliable support for buyers since the beginning of May. Until then, the current pattern is likely to be viewed as corrective and part of the ongoing consolidation phase.
- WTI backslid to $74.00 per barrel after OPEC+ failed to bolster Crude trader hopes.
- Voluntary production cuts are slated to be phased out beginning in October.
- OPEC voluntary cuts have kept 2.2 million bpd off the market since 2022.
Crude Oil prices tumbled on Monday after an update on voluntary production cuts didn’t go how energy traders had hoped last week. The Organization of the Petroleum Exporting Countries (OPEC) and its extended network of non-member allies, OPEC+, announced the beginning of a phase-out of long-running production caps. The phase-out is slated to begin in October.
OPEC+ has been participating in voluntary Crude Oil production cuts that have kept 2.2 million barrels per day off the markets in an attempt to bolster global barrel prices in the face of global Crude Oil output that has grown to outpace demand. However, key members of OPEC+ who rely on selling Crude Oil in order to balance their government budgets have balked at the idea of continuing to support global prices at the expense of their solvency, and are set to begin phasing out currently-standing production limits sometime in October. OPEC+ stipulated that ending production limits will be data-dependent heading closer to October, but energy traders promptly sold off Crude Oil as barrels slated for year-end delivery become an unappealing bet.
US Crude Oil traders will be looking ahead to weekly updates on barrel counts from the American Petroleum Insitute (API) and the Energy Information Administration (EIA), due on Tuesday and Wednesday, respectively. Last week’s updates showed a sharp pullback in Crude Oil supplies, but inventories in upstream refined Crude Oil products spiked after a widely-expected uptick in US Crude Oil demand at the beginning of the Memorial Day driving season failed to materialize, leaving refineries with far more inventory than expected.
WTI technical outlook
WTI tumbled to its lowest prices since February, extending a bearish slide into the $74.00 per barrel handle and declining 8% from last week’s peak near $80.40 per barrel. Intraday short pressure cleanly snapped a technical barrier at $77.00, and a long-standing demand zone from $77.00 to $76.00 could rotate to form a heavy supply zone following any profit-taking from rebound bets.
US Crude Oil is poised for its single worst day in 2024, in the red nearly 4% from the day’s opening bids near $77.00 and testing into lows last set during the first week of February. WTI is down 15% from 2024’s peaks near $87.00.
WTI hourly chart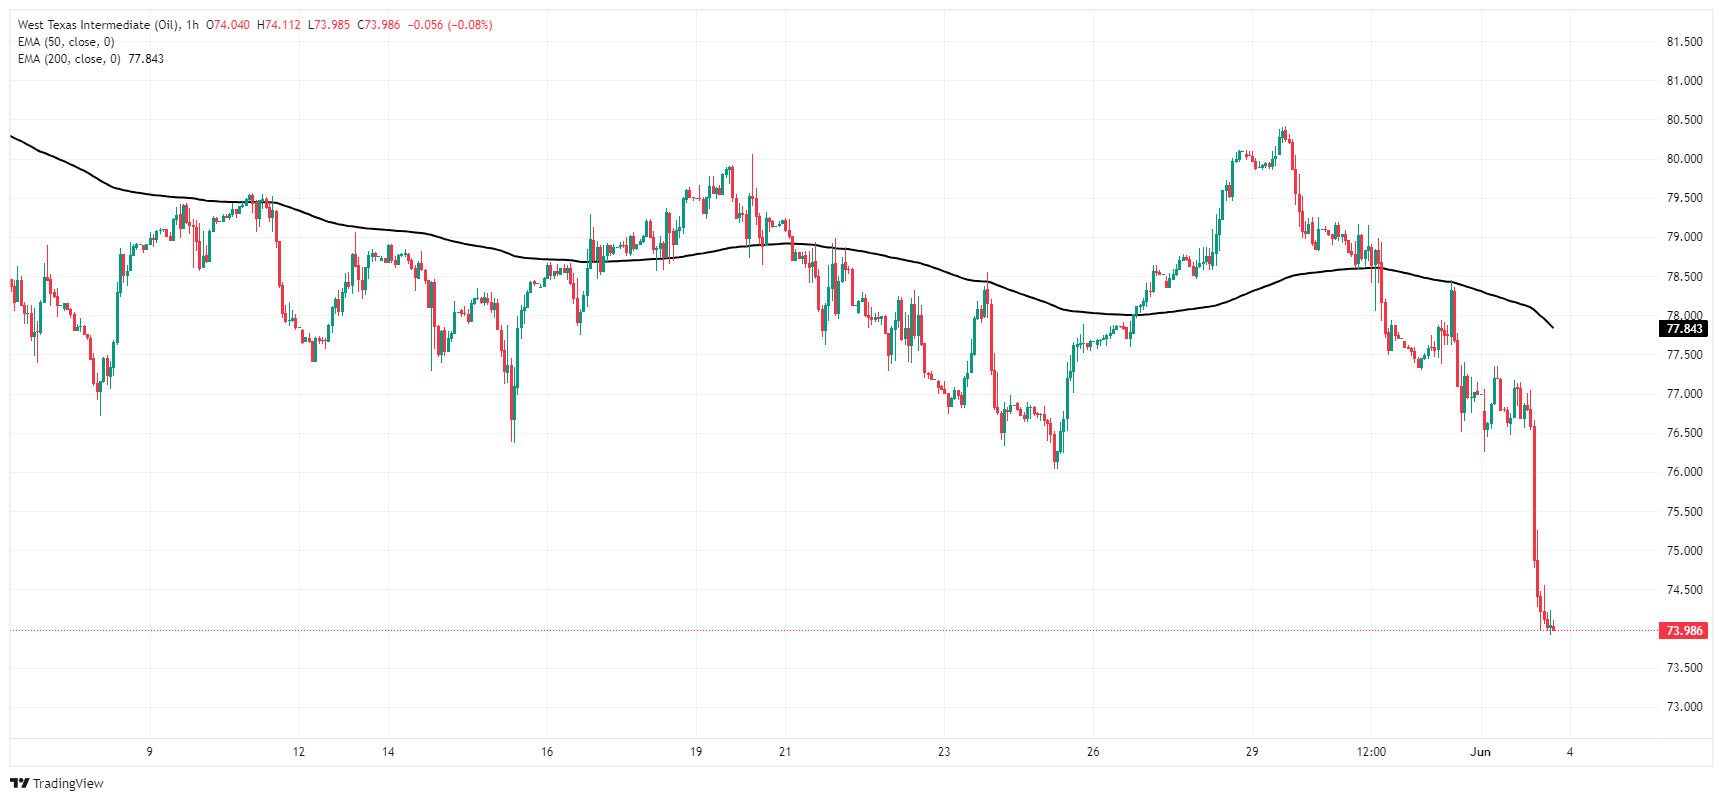
WTI daily chart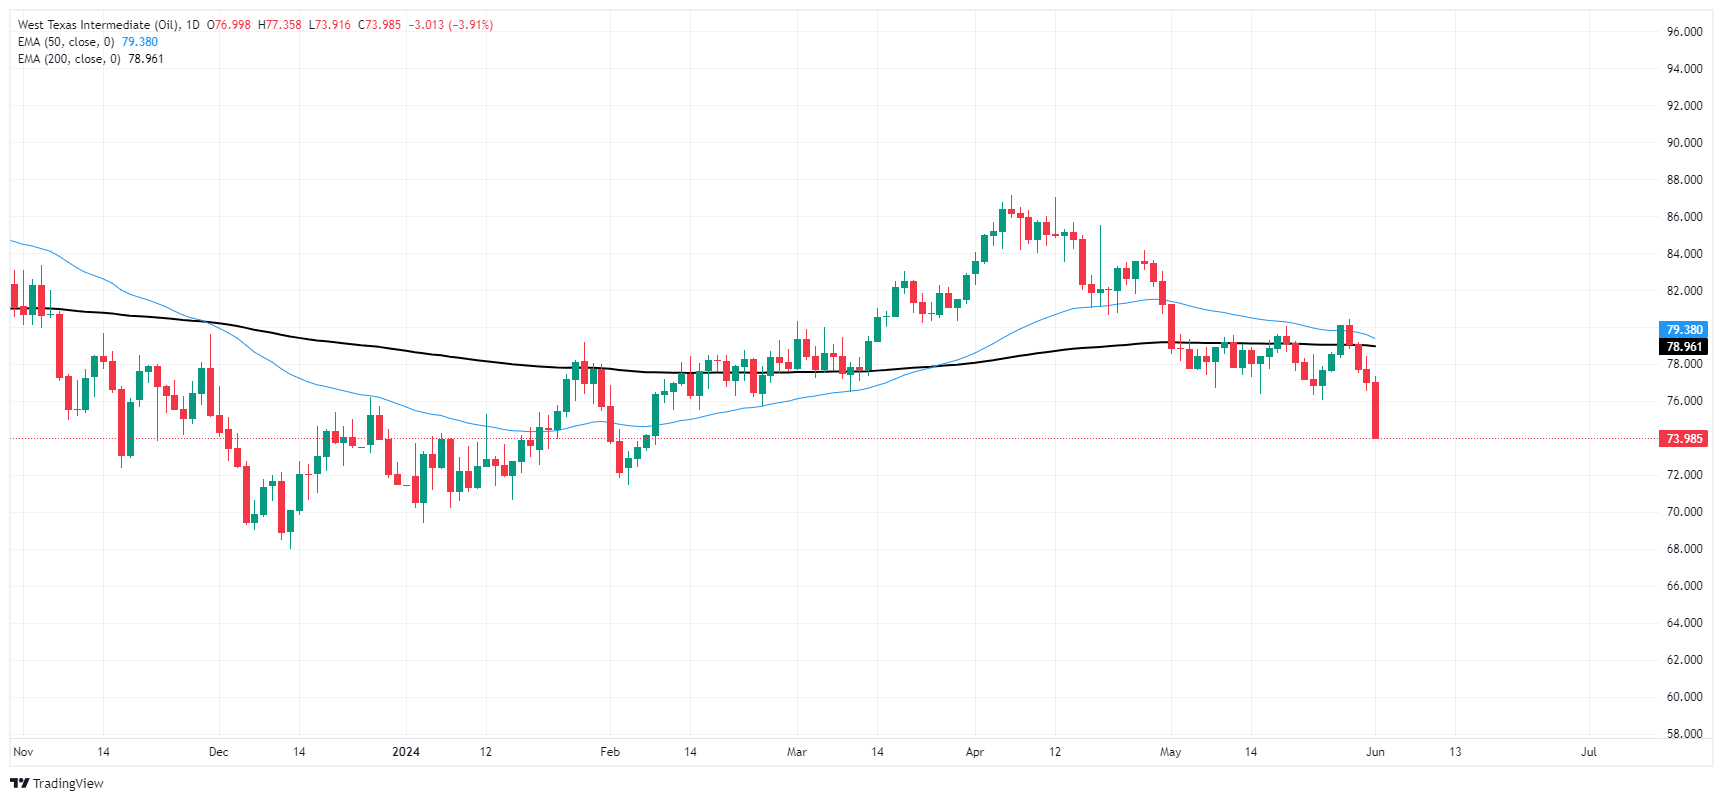
The loss of impetus in the US manufacturing sector sparked a deeper pullback in the Greenback and supported further the recovery of the risk-associated assets at the beginning of a week ruled by the ECB event and US Nonfarm Payrolls.
Here is what you need to know on Tuesday, June 4:
The USD Index (DXY) dropped markedly and flirted with three-week lows near the 104.00 neighbourhood. On June 4, Factory Orders take centre stage seconded by the JOLTs Job Openings and the RCM/TIPP Economic Optimism Index.
EUR/USD advanced for the third session in a row and challenged the key 1.0900 barrier amidst generalized Dollar weakness. The release of Germany’s labour market report and EMU’s Consumer Inflation Expectations will be at the centre of the debate on the domestic docket on June 4.
GBP/USD advanced to just pips away from the key 1.2800 hurdle, or multi-week highs, on Monday. The BRC Retail Sales Monitor is expected across the Channel on June 4.
The weaker Dollar and diminishing US yields prompted USD/JPY to recede to multi-session lows in the sub-156.00 region at the beginning of the week. In Japan, a JGB 10-year Auction is only due on June 4.
The increasing selling pressure in the Greenback motivated AUD/USD to advance to the proximity of the 0.6700 mark. On June 4, Business Inventories, Current Account and final Retail Sales are all due in Oz.
WTI prices receded for the third consecutive week and broke below the $77.00 mark per barrel on Monday, as traders digested the bearish tone from the OPEC+ meeting on Sunday.
Gold prices charted a strong advance to the $2,350 region on the back of the intense sell-off in the Dollar and declining US yields across the curve. By the same token, Silver followed suit and reversed three consecutive sessions of losses.
- On Monday, the AUD/NZD dipped below key technical levels, with the 100 and 200-day SMAs breached.
- Current focus is on GDP data from Australia, expected to remain steady.
- New Zealand’s manufacturing activity Q1 data on Friday will be closely watched.
The AUD/NZD echoed a bearish technical outlook on Monday, falling below key levels towards 1.0805 as markets await mid-tier data from both nations on a quiet economic schedule at the beginning of the week.
In Australia, markets will anticipate Wednesday's Gross Domestic Product (GDP) data. A steady growth of 0.2% QoQ is expected, while a 1.2% YoY rate is projected, a slight dip compared to the Q4 YoY rate of 1.5%. That being said, the AUD’s losses may be limited, thanks to the strong Australian Q1 CPI inflation data and another robust April reading, which hints at the Reserve Bank of Australia (RBA) being one of the last G10 central banks to cut rates in this cycle.
On the other hand, New Zealand will focus on releasing its Q1 manufacturing activity data on Friday. Should the manufacturing output reflect the same upward trend, it might further slow the Reserve Bank of New Zealand’s RBNZ's rate cuts. The market now forecasts a 75% probability of the first cut happening as late as November.
AUD/NZD technical analysis
Technical indicators have turned bearish. On Monday, sellers oversaw the breaching of the 100 and 200-day Simple Moving Averages (SMAs). The RSI heads towards the oversold territory, echoing a similar sentiment, while the MACD histogram continues to confirm this downward momentum with its persistent formation of red bars.
Despite the bearish patterns unfolding, the focus will be whether the downward trend can be sustained or if there will be an upward correction as markets continue to assess the upcoming economic data releases.
AUD/NZD daily chart
- Dow Jones backslides as investors balk at softening US data.
- Markets have shifted to bets of a November Fed rate cut.
- Monday kicks off NFP week with a sharp pullback in equities.
The Dow Jones Industrial Average (DJIA) fell around 300 points on Monday after investors took a backstep after US ISM Manufacturing Purchasing Managers Index (PMI) figures unexpectedly declined in May. Softening US data knocked risk appetite lower as markets rethink their outlook on the US economy.
Despite an uptick in May’s S&P Global Manufacturing PMI, which rose to 51.3 compared to the expected flat hold at 50.9, investors are balking after the ISM Manufacturing PMI for the same period eased lower. May’s ISM Manufacturing PMI eased back to 48.7 from the previous month’s 49.2, falling away from the market forecast increase to 49.6.
According to the CME’s FedWatch Tool, rate markets have fully priced in a first rate cut from the Federal Reserve (Fed) in November, with interest rate traders seeing over 96% odds of an initial 25-basis-point decline in the Fed Funds Rate by the Federal Open Market Committee’s (FOMC) November rate decision.
Dow Jones news
The Dow Jones initially plunged 400 points in early Monday trading, recovering slightly to -300 points on the day as investors try to recover their footing. Around two-thirds of the DJIA’s constituent equities are in the red on Monday, with losses lead by Chevron Corp. (CVX) which fell -3.35% to $156.71 per share. CVX is closely followed by Dow Inc. (DOW), which fell -3% to %55.91 per share on Monday.
Boeing Co. (BA) rebounded 2.34% on Monday, climbing to $181.91 per share. Merch & Co Inc. (MRK) followed closely behind, gaining 1.85% and rising to $127.85 per share.
Dow Jones technical outlook
Monday’s pullback chewed throw a significant portion of last Friday’s much-needed rebound, keeping the Dow Jones pinned below 39,000.00. The major equity index is still down over 4% from record highs set just above 40,000.00.
The Dow Jones is on pace to close down once more on Monday, and the index’s pullback has seen the DJIA close in the red for all but three of the last ten consecutive trading sessions. The Dow Jones still remains firmly in bull territory, but bids are edging closer to the 200-day Exponential Moving Average (EMA) at 37,247.44.
Dow Jones five minute chart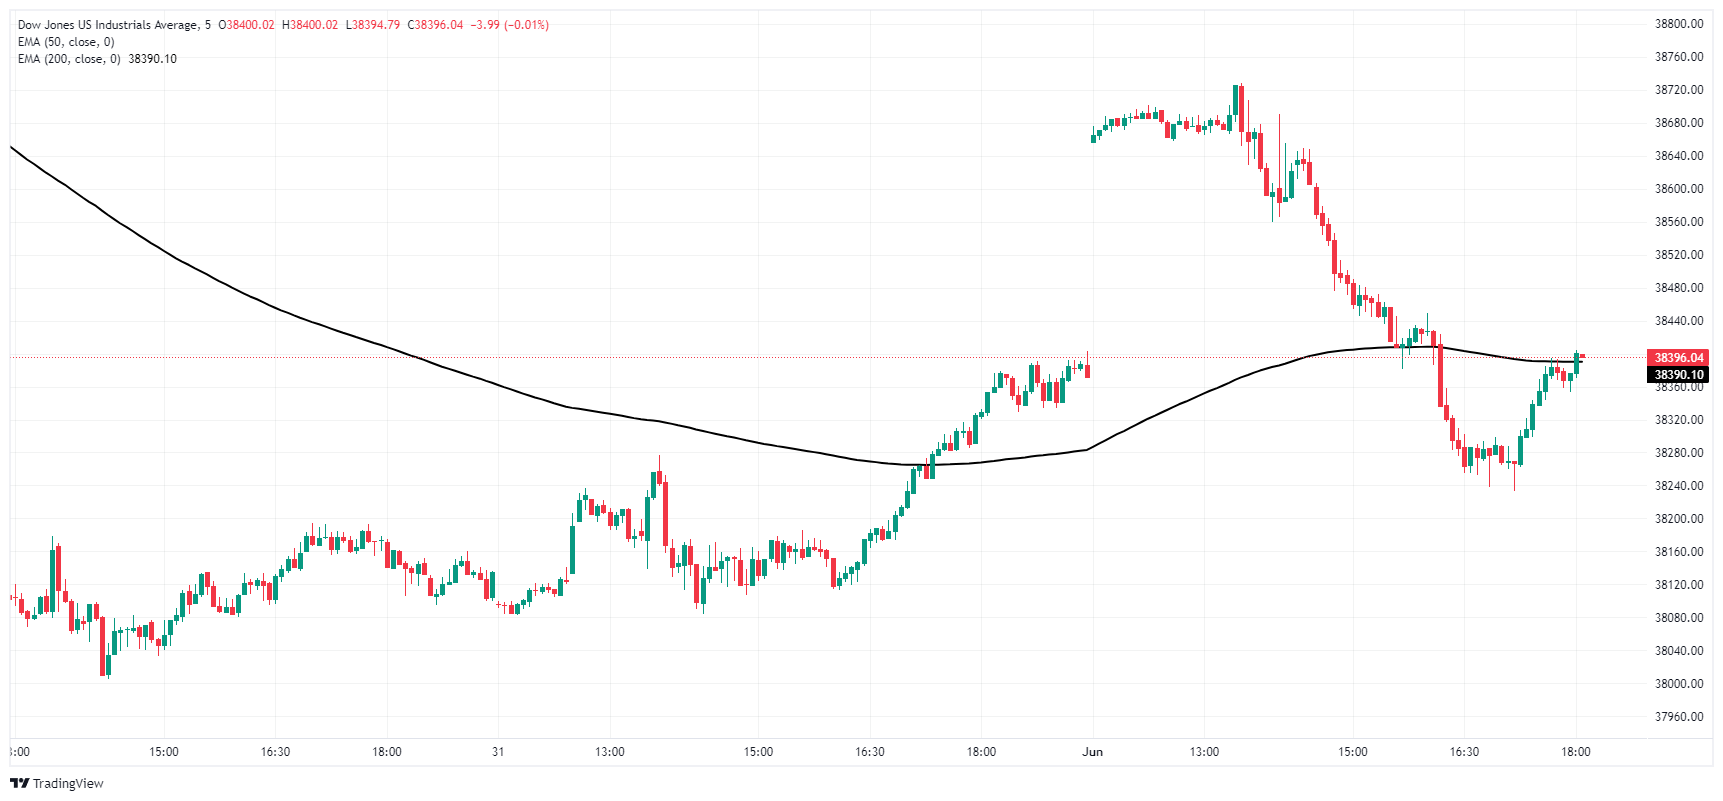
Dow Jones daily chart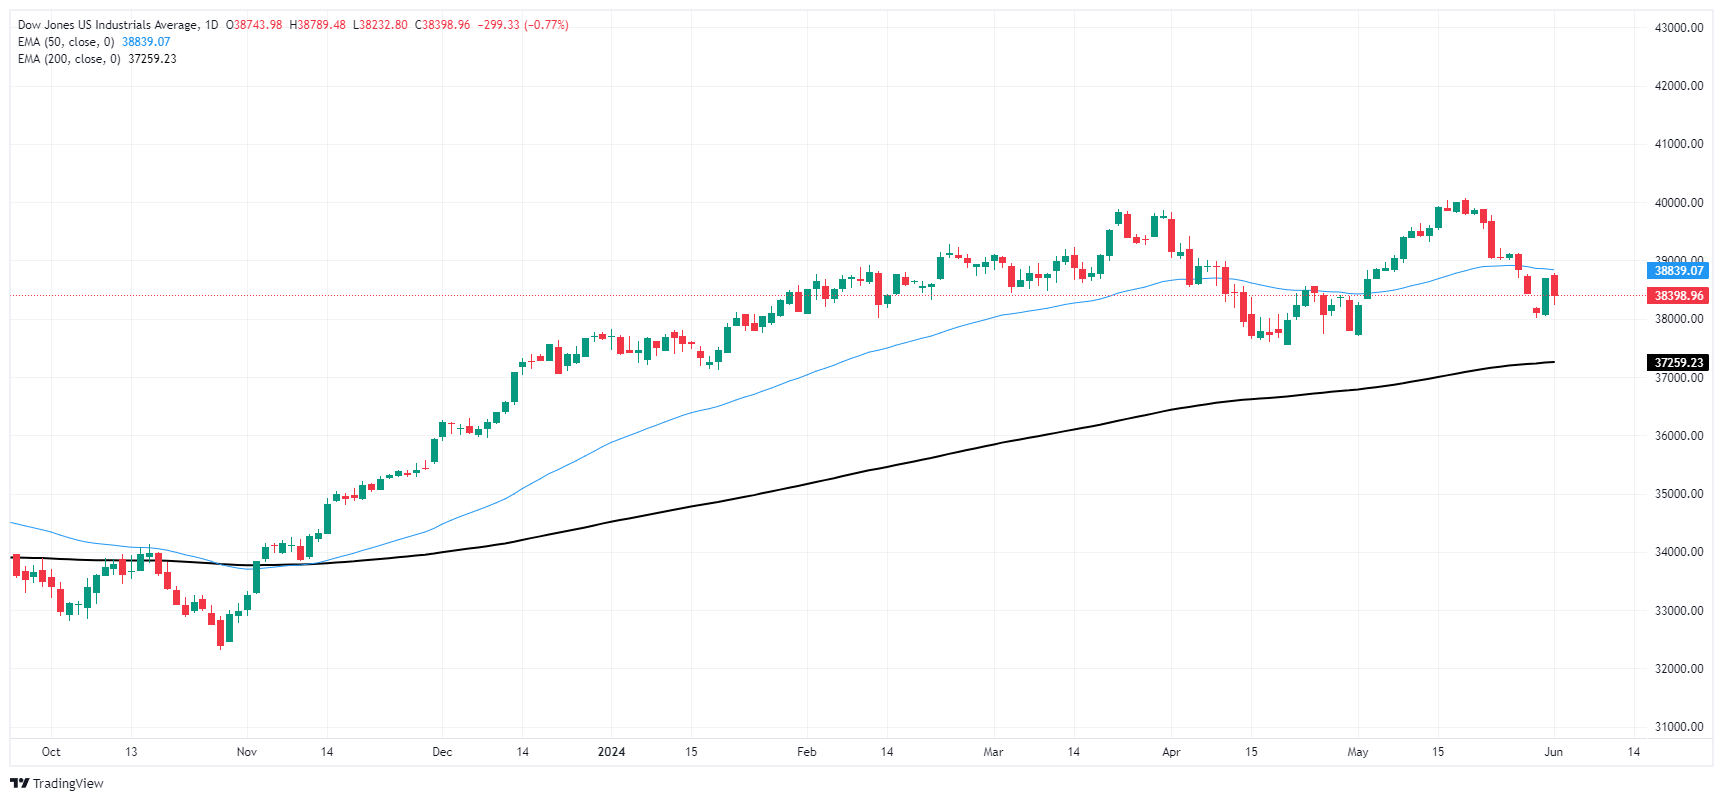
Dow Jones FAQs
The Dow Jones Industrial Average, one of the oldest stock market indices in the world, is compiled of the 30 most traded stocks in the US. The index is price-weighted rather than weighted by capitalization. It is calculated by summing the prices of the constituent stocks and dividing them by a factor, currently 0.152. The index was founded by Charles Dow, who also founded the Wall Street Journal. In later years it has been criticized for not being broadly representative enough because it only tracks 30 conglomerates, unlike broader indices such as the S&P 500.
Many different factors drive the Dow Jones Industrial Average (DJIA). The aggregate performance of the component companies revealed in quarterly company earnings reports is the main one. US and global macroeconomic data also contributes as it impacts on investor sentiment. The level of interest rates, set by the Federal Reserve (Fed), also influences the DJIA as it affects the cost of credit, on which many corporations are heavily reliant. Therefore, inflation can be a major driver as well as other metrics which impact the Fed decisions.
Dow Theory is a method for identifying the primary trend of the stock market developed by Charles Dow. A key step is to compare the direction of the Dow Jones Industrial Average (DJIA) and the Dow Jones Transportation Average (DJTA) and only follow trends where both are moving in the same direction. Volume is a confirmatory criteria. The theory uses elements of peak and trough analysis. Dow’s theory posits three trend phases: accumulation, when smart money starts buying or selling; public participation, when the wider public joins in; and distribution, when the smart money exits.
There are a number of ways to trade the DJIA. One is to use ETFs which allow investors to trade the DJIA as a single security, rather than having to buy shares in all 30 constituent companies. A leading example is the SPDR Dow Jones Industrial Average ETF (DIA). DJIA futures contracts enable traders to speculate on the future value of the index and Options provide the right, but not the obligation, to buy or sell the index at a predetermined price in the future. Mutual funds enable investors to buy a share of a diversified portfolio of DJIA stocks thus providing exposure to the overall index.
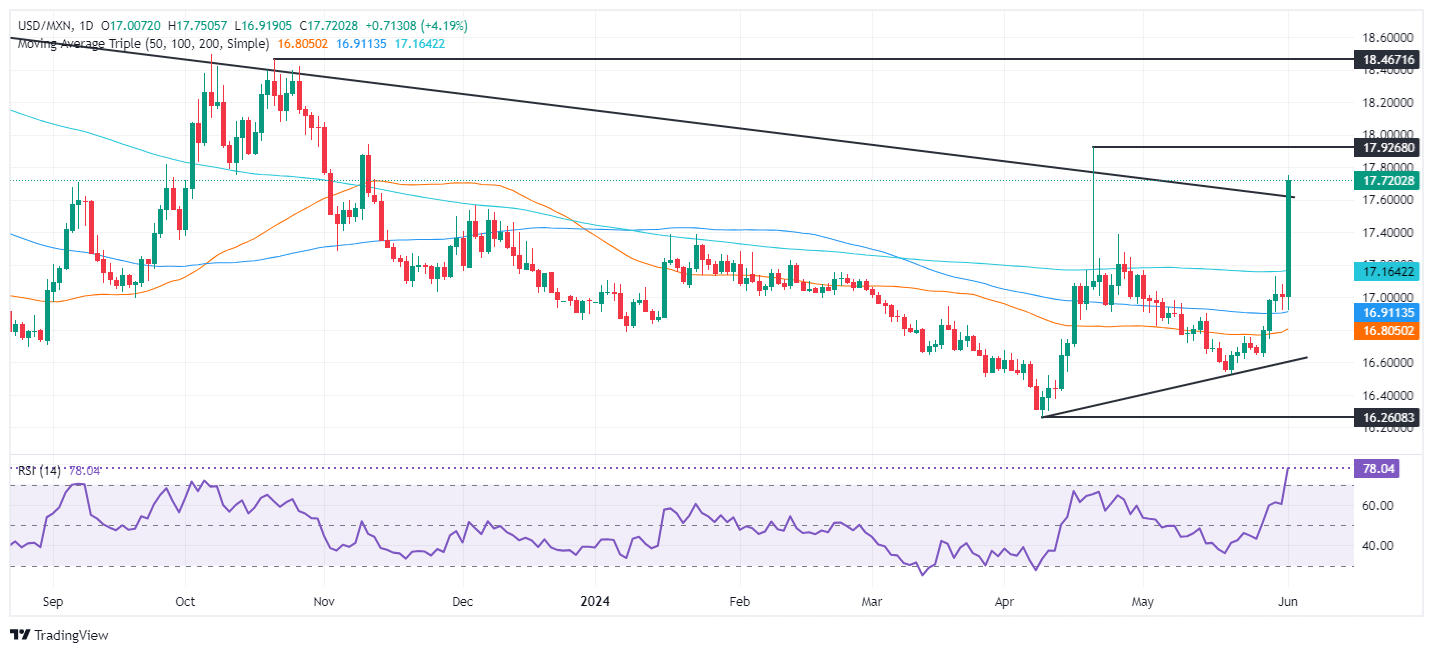
- Mexican Peso falls sharply after Dr. Claudia Sheinbaum’s victory and Morena’s majority in Congress.
- Concerns rise over potential constitutional changes and market stability, impacting investor sentiment toward the Peso.
- Sheinbaum pledges to maintain financial discipline and Bank of Mexico autonomy, but market remains wary.
The Mexican Peso plunges against the US Dollar during the North American session following Dr. Claudia Sheinbaum’s overwhelming victory in Mexico’s presidential election. Additionally, her party, Morena, won the majority of the Mexican Congress, opening the door to change the Mexican Constitution, which was seen by investors as a threat to the status quo. The USD/MXN trades at 17.66, with more than 4% losses.
The Mexican Peso began its landslide after the Instituto Nacional Electoral (INE) revealed Sheinbaum’s party, Morena, would have the majority in both houses of the legislature. This opens the door to making structural changes that involve reforming the judicial system, which could be greatly influenced by the president.
Following the INE announcement, Sheinbaum compromised to continue the current plant from President Andres Manuel Lopez Obrador’s (AMLO) government. She pledged to maintain financial discipline and emphasized the autonomy of the Bank of Mexico.
Sheinbaum added, “There wouldn’t be real increases to fuels or electricity,” populist promises previously made by AMLO.
Analysts via Reuters commented that a Morena-led congress could be reluctant to “approve the necessary reforms to adopt the measures required to attract investment,” which could leverage the nearshoring opportunity, said Alberto Ramos of Goldman Sachs.
Most analysts were expecting Sheinbaum’s victory but not the overwhelming result in the Mexican Congress.
Andres Abadia of Pantheon Macroeconomics added, “The potentially qualified majority could open the door for (her party) Morena to increase the concentration of power and pose a threat to institutional checks and balances.”
Lastly, Chris Turner of ING added, "The question is whether the Morena party has done so well that it could command a super-majority and try to pursue market non-friendly policies of constitutional reform.”
Daily digest market movers: Mexican Peso remains offered on investors' fears
- Monday’s economic docket in Mexico featured Business Confidence and Foreign Reserves.
- Mexico’s Business Confidence in May worsened compared to April’s, drifting from 54.1 to 53.7.
- Mexico’s Foreign Reserves increased from $220 billion to $221 billion in April, revealed Banxico.
- September would be the crucial month for the Mexican Congress. Morena’s majority could push bills blocked by the opposition, including the reduction of lawmakers and plans for direct election of the Supreme Court members.
- Morgan Stanley noted that if Mexico’s upcoming government and Congress adopted an unorthodox agenda, it would undermine Mexican institutions and be bearish for the Mexican Peso, which could weaken to 19.20.
- That and speculation of another Banxico rate cut in June could pave the way for further upside in the USD/MXN.
- US manufacturing PMIs in May were mixed, as revealed by the Institute for Supply Management (ISM) and S&P Global.
- The US ISM Manufacturing PMI was worse than expected in May, coming at 48.7, down from 49.2 and below estimates of 49.6. Contrarily, the S&P Global Manufacturing PMI expanded by 51.3, up from 50 and exceeding estimates of 50.9.
- The futures markets suggest the Federal Reserve might cut rates by 31 basis points in 2024, according to December’s 2024 fed funds future rate contract.
Technical analysis: Mexican Peso depreciates as USD/MXN rallies above 17.50
The USD/MXN downtrend begins to be threatened due to political uncertainty. That has lifted the exchange rate above the 200-day Simple Moving Average (SMA) of 17.15, opening the door to push the spot prices toward a one-month high of 17.73.
Momentum has shifted strongly in favor of buyers as communicated by the Relative Strength Index (RSI), which has skyrocketed and crushed the 70 overbought level.
That said, if the USD/MXN clears the psychological 18.00 figure, up next would be the year-to-date (YTD) high of 18.15. Further gains are seen above the latter, on October 6, 2023, at a high of 18.48, before the exotic pair trends up toward the 19.00 figure.
On the downside, if sellers push the exchange rate below the 17.00 figure, that could pave the way to test the year-to-date (YTD) low of 16.25.
Mexican Peso FAQs
The Mexican Peso (MXN) is the most traded currency among its Latin American peers. Its value is broadly determined by the performance of the Mexican economy, the country’s central bank’s policy, the amount of foreign investment in the country and even the levels of remittances sent by Mexicans who live abroad, particularly in the United States. Geopolitical trends can also move MXN: for example, the process of nearshoring – or the decision by some firms to relocate manufacturing capacity and supply chains closer to their home countries – is also seen as a catalyst for the Mexican currency as the country is considered a key manufacturing hub in the American continent. Another catalyst for MXN is Oil prices as Mexico is a key exporter of the commodity.
The main objective of Mexico’s central bank, also known as Banxico, is to maintain inflation at low and stable levels (at or close to its target of 3%, the midpoint in a tolerance band of between 2% and 4%). To this end, the bank sets an appropriate level of interest rates. When inflation is too high, Banxico will attempt to tame it by raising interest rates, making it more expensive for households and businesses to borrow money, thus cooling demand and the overall economy. Higher interest rates are generally positive for the Mexican Peso (MXN) as they lead to higher yields, making the country a more attractive place for investors. On the contrary, lower interest rates tend to weaken MXN.
Macroeconomic data releases are key to assess the state of the economy and can have an impact on the Mexican Peso (MXN) valuation. A strong Mexican economy, based on high economic growth, low unemployment and high confidence is good for MXN. Not only does it attract more foreign investment but it may encourage the Bank of Mexico (Banxico) to increase interest rates, particularly if this strength comes together with elevated inflation. However, if economic data is weak, MXN is likely to depreciate.
As an emerging-market currency, the Mexican Peso (MXN) tends to strive during risk-on periods, or when investors perceive that broader market risks are low and thus are eager to engage with investments that carry a higher risk. Conversely, MXN tends to weaken at times of market turbulence or economic uncertainty as investors tend to sell higher-risk assets and flee to the more-stable safe havens.
- Weak ISM PMI report for May and decreasing US Treasury yields weigh on USD.
- ISM Manufacturing PMI report increases odds of Fed rate cut in September.
- Markets awaiting upcoming Nonfarm Payrolls report and wage growth data.
On Monday, the US Dollar Index (DXY) continued its decline toward the 104.15 area mainly due to the Institute of Supply Management (ISM) PMI report for May. The data led to a decline in US Treasury yields and a slight increase in the odds of a Federal Reserve (Fed) rate cut in September.
Market attention has now shifted toward labor market data, specifically the Nonfarm Payrolls report for May, for investors to gather additional data on the US economy.
Daily digest market movers: DXY retreats due to weak ISM data
- Investors are signaling concerns with the ISM PMI report due to indications of a contracting manufacturing sector.
- The ISM Manufacturing PMI for May contracted to 48.7, falling below both the expected 49.6 and April's 49.2, as per the ISM data released on Monday.
- The lower-than-expected PMI data led to an increase in market-based probabilities of a Fed interest rate cut in September.
- Following the release, the probability of a rate cut in September increased to nearly 60%.
- Markets eagerly await the Nonfarm Payrolls report for May, due later this week, which may influence the Fed's future decisions.
- US Treasury yields saw a sharp decline with the 2, 5 and 10-year yields falling more than 2%.
DXY technical analysis: US Dollar struggles as negative indicators resurface
The DXY fell below the 20, 100 and 200-day Simple Moving Averages (SMAs) on Monday due to the disappointing ISM PMI report. This caused the index to enter a bearish phase.
Similarly, the Relative Strength Index (RSI) and Moving Average Convergence Divergence (MACD) fell into negative territory, indicating a rise in bearish sentiment and selling pressure. However, as the pair now tallies a three-day losing streak there are chances that buyers might step in for a slight upwards correction.
US Dollar FAQs
The US Dollar (USD) is the official currency of the United States of America, and the ‘de facto’ currency of a significant number of other countries where it is found in circulation alongside local notes. It is the most heavily traded currency in the world, accounting for over 88% of all global foreign exchange turnover, or an average of $6.6 trillion in transactions per day, according to data from 2022. Following the second world war, the USD took over from the British Pound as the world’s reserve currency. For most of its history, the US Dollar was backed by Gold, until the Bretton Woods Agreement in 1971 when the Gold Standard went away.
The most important single factor impacting on the value of the US Dollar is monetary policy, which is shaped by the Federal Reserve (Fed). The Fed has two mandates: to achieve price stability (control inflation) and foster full employment. Its primary tool to achieve these two goals is by adjusting interest rates. When prices are rising too quickly and inflation is above the Fed’s 2% target, the Fed will raise rates, which helps the USD value. When inflation falls below 2% or the Unemployment Rate is too high, the Fed may lower interest rates, which weighs on the Greenback.
In extreme situations, the Federal Reserve can also print more Dollars and enact quantitative easing (QE). QE is the process by which the Fed substantially increases the flow of credit in a stuck financial system. It is a non-standard policy measure used when credit has dried up because banks will not lend to each other (out of the fear of counterparty default). It is a last resort when simply lowering interest rates is unlikely to achieve the necessary result. It was the Fed’s weapon of choice to combat the credit crunch that occurred during the Great Financial Crisis in 2008. It involves the Fed printing more Dollars and using them to buy US government bonds predominantly from financial institutions. QE usually leads to a weaker US Dollar.
Quantitative tightening (QT) is the reverse process whereby the Federal Reserve stops buying bonds from financial institutions and does not reinvest the principal from the bonds it holds maturing in new purchases. It is usually positive for the US Dollar.
- Markets kick off NFP week pricing in a first Fed rate cut in November.
- Canada reveals unexpected downturn in Manufacturing PMI data.
- CAD traders will be gearing up for a midweek BoC rate call as NFP Friday looms.
The Canadian Dollar (CAD) is broadly lower on Monday after May’s S&P Canadian Global Manufacturing Purchasing Managers Index (PMI) figures missed the mark. A similar miss in ISM US Manufacturing PMIs has left the Canadian Dollar and the US Dollar (USD) battling for second place.
Canada has spent 13 months with manufacturing PMI surveys printing below the key 50.0 level as industry leaders continue to grapple with a mouldering Canadian economy. CAD traders will also be looking ahead to Wednesday’s rate call from the Bank of Canada (BoC) as markets lean further into hopes of a rate trim from the Canadian central bank. According to a recent Reuters poll, 22 of 29 surveyed economists expect a 25-basis-point rate cut from the BoC on June 5.
Daily digest market movers: Canadian Dollar weakens, but Greenback weakens faster
- Canadian S&P Manufacturing PMI in May eased to 49.3 from 49.4, missing the forecasted increase to 50.2.
- Markets broadly ignored the S&P Global US PMI to focus on a miss in the US ISM Manufacturing PMI, which eased to 48.7 from 49.2 in May, down from the forecast increase to 49.6.
- Wednesday looms ahead with the BoC’s latest rate call, where markets are anticipating a quarter-point cut.
- Wednesday also brings ADP Employment Change for May, a common (albeit volatile) preview of Friday’s US Nonfarm Payrolls (NFP) jobs report.
- Canadian labor figures due Friday will be overshadowed by market reactions to US NFP.
Canadian Dollar PRICE Today
The table below shows the percentage change of Canadian Dollar (CAD) against listed major currencies today. Canadian Dollar was the strongest against the US Dollar.
| USD | EUR | GBP | JPY | CAD | AUD | NZD | CHF | |
|---|---|---|---|---|---|---|---|---|
| USD | -0.31% | -0.29% | -0.72% | 0.09% | -0.29% | -0.62% | -0.87% | |
| EUR | 0.31% | 0.05% | -0.39% | 0.40% | -0.10% | -0.33% | -0.56% | |
| GBP | 0.29% | -0.05% | -0.38% | 0.34% | -0.09% | -0.44% | -0.63% | |
| JPY | 0.72% | 0.39% | 0.38% | 0.78% | 0.47% | 0.21% | 0.01% | |
| CAD | -0.09% | -0.40% | -0.34% | -0.78% | -0.41% | -0.73% | -0.97% | |
| AUD | 0.29% | 0.10% | 0.09% | -0.47% | 0.41% | -0.24% | -0.49% | |
| NZD | 0.62% | 0.33% | 0.44% | -0.21% | 0.73% | 0.24% | -0.28% | |
| CHF | 0.87% | 0.56% | 0.63% | -0.01% | 0.97% | 0.49% | 0.28% |
The heat map shows percentage changes of major currencies against each other. The base currency is picked from the left column, while the quote currency is picked from the top row. For example, if you pick the Canadian Dollar from the left column and move along the horizontal line to the US Dollar, the percentage change displayed in the box will represent CAD (base)/USD (quote).
Technical analysis: Canadian Dollar stumbles on Monday despite USD/CAD pumping the brakes
The Canadian Dollar (CAD) is broadly lower on Monday, shedding weight across the board and struggling to hold ground against the US Dollar. The CAD is down three-quarters of a percent against the Japanese Yen (JPY) and the Swiss Franc (CHF). A softening Greenback will have to settle for second place on Monday as the declining US Dollar is struggling to catch up to the weakening CAD.
USD/CAD slumped once more into a familiar demand zone near the 1.3600 handle, but firmer bidding on the Greenback side keeps the pair in range of Monday’s early peak near 1.3660. The pair has been in a rough consolidation pattern since the beginning of May, but highs are drifting lower as CAD strength looks set to fade further.
A long-term technical floor is still priced in at the 200-day Exponential Moving Average (EMA) near 1.3560, and USD/CAD appears mired in congestion at the 50-day EMA near 1.3645. A move higher will see the pair grappling with 2024’s peak bids near 1.3850.
USD/CAD hourly chart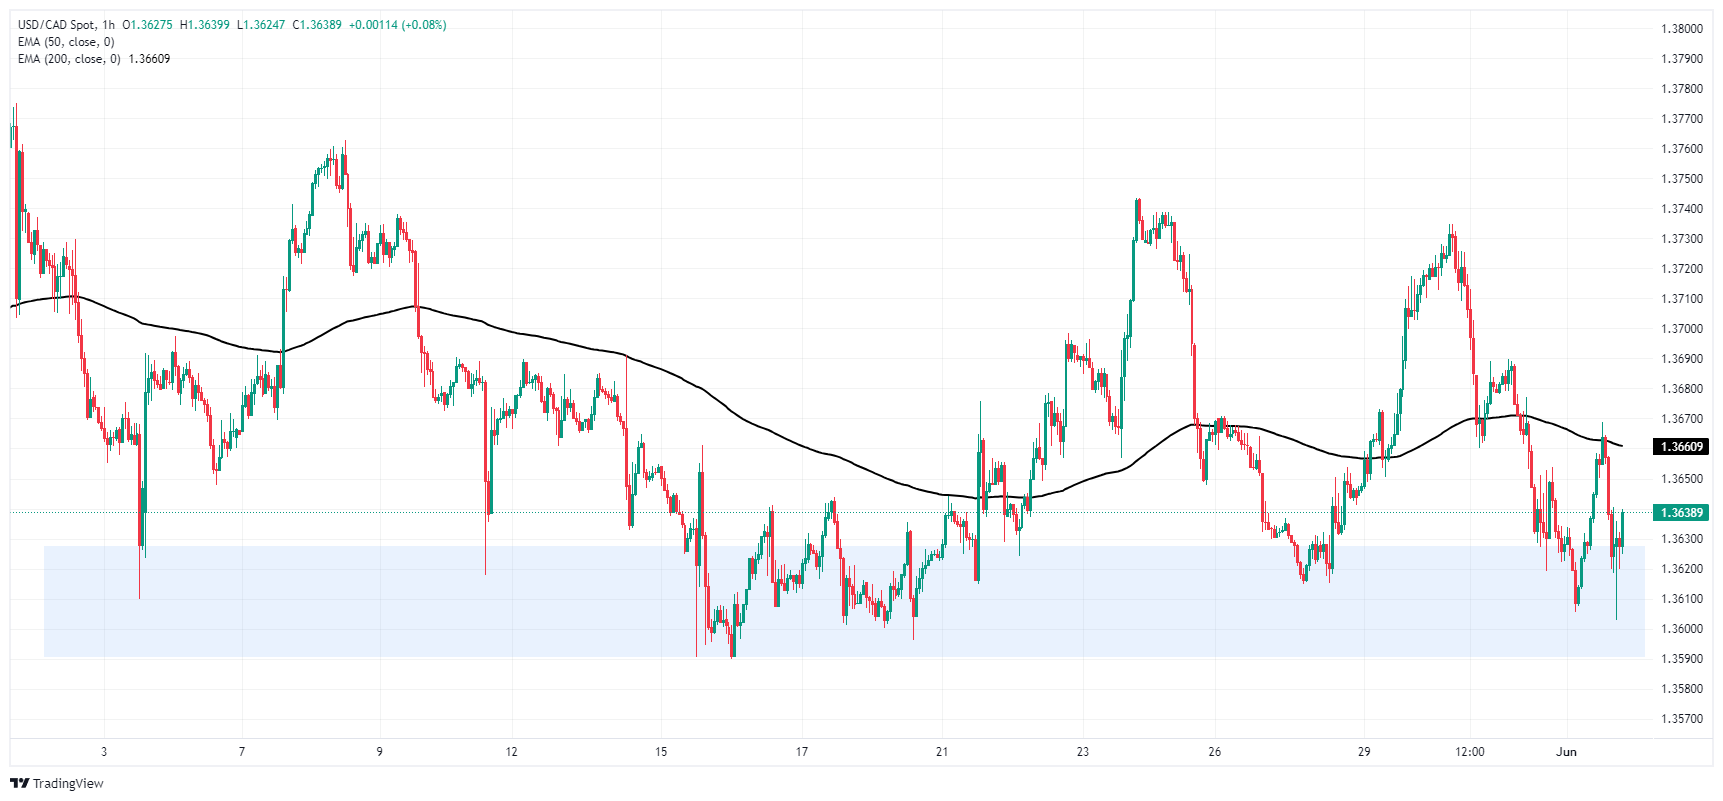
USD/CAD daily chart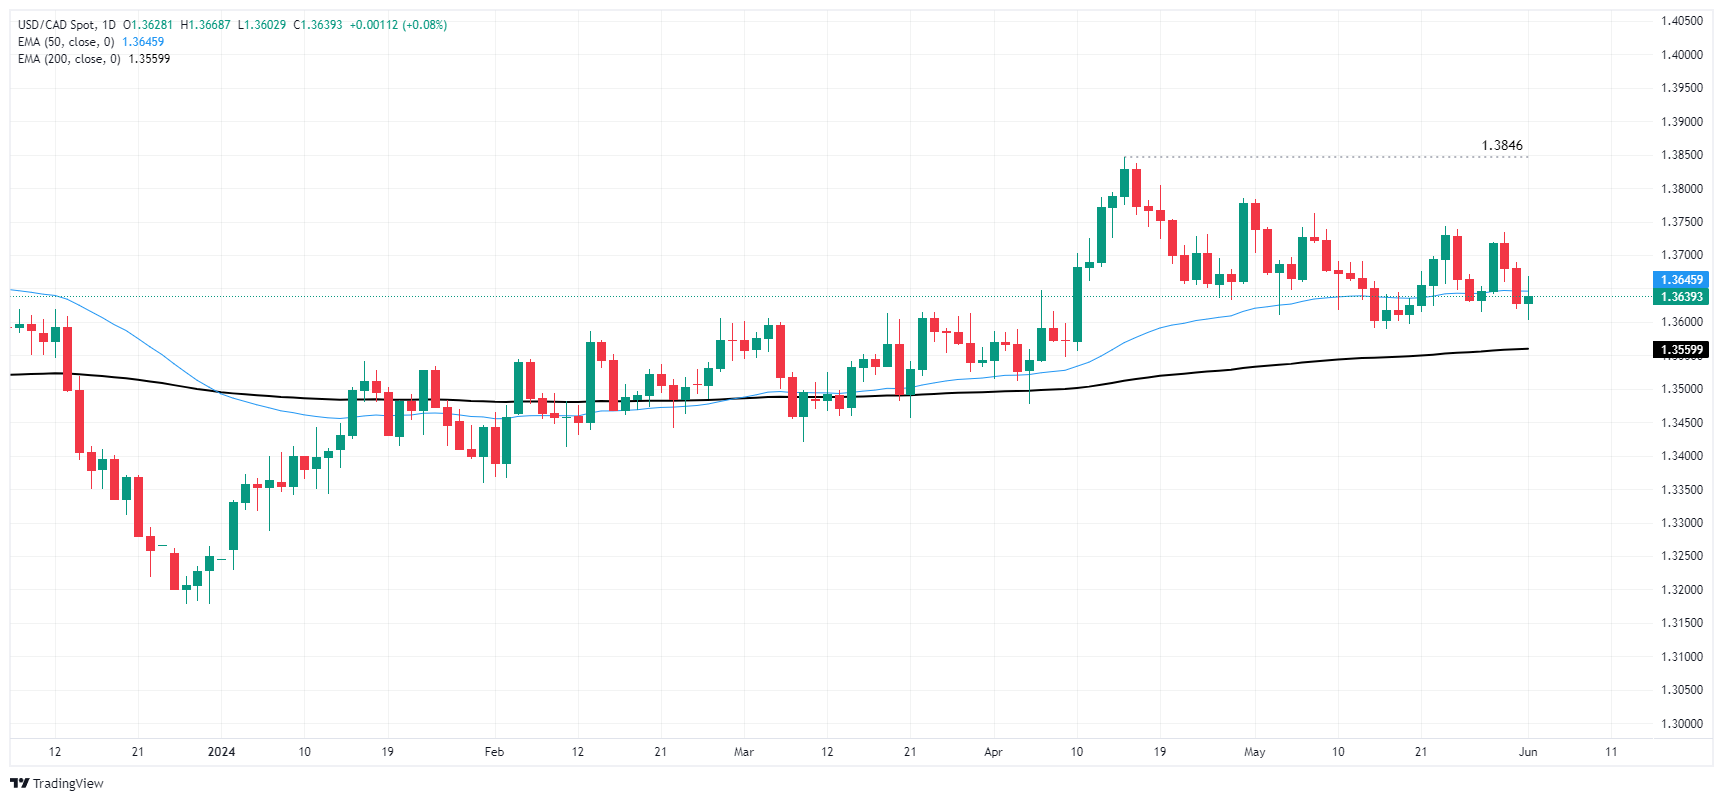
Canadian Dollar FAQs
The key factors driving the Canadian Dollar (CAD) are the level of interest rates set by the Bank of Canada (BoC), the price of Oil, Canada’s largest export, the health of its economy, inflation and the Trade Balance, which is the difference between the value of Canada’s exports versus its imports. Other factors include market sentiment – whether investors are taking on more risky assets (risk-on) or seeking safe-havens (risk-off) – with risk-on being CAD-positive. As its largest trading partner, the health of the US economy is also a key factor influencing the Canadian Dollar.
The Bank of Canada (BoC) has a significant influence on the Canadian Dollar by setting the level of interest rates that banks can lend to one another. This influences the level of interest rates for everyone. The main goal of the BoC is to maintain inflation at 1-3% by adjusting interest rates up or down. Relatively higher interest rates tend to be positive for the CAD. The Bank of Canada can also use quantitative easing and tightening to influence credit conditions, with the former CAD-negative and the latter CAD-positive.
The price of Oil is a key factor impacting the value of the Canadian Dollar. Petroleum is Canada’s biggest export, so Oil price tends to have an immediate impact on the CAD value. Generally, if Oil price rises CAD also goes up, as aggregate demand for the currency increases. The opposite is the case if the price of Oil falls. Higher Oil prices also tend to result in a greater likelihood of a positive Trade Balance, which is also supportive of the CAD.
While inflation had always traditionally been thought of as a negative factor for a currency since it lowers the value of money, the opposite has actually been the case in modern times with the relaxation of cross-border capital controls. Higher inflation tends to lead central banks to put up interest rates which attracts more capital inflows from global investors seeking a lucrative place to keep their money. This increases demand for the local currency, which in Canada’s case is the Canadian Dollar.
Macroeconomic data releases gauge the health of the economy and can have an impact on the Canadian Dollar. Indicators such as GDP, Manufacturing and Services PMIs, employment, and consumer sentiment surveys can all influence the direction of the CAD. A strong economy is good for the Canadian Dollar. Not only does it attract more foreign investment but it may encourage the Bank of Canada to put up interest rates, leading to a stronger currency. If economic data is weak, however, the CAD is likely to fall.
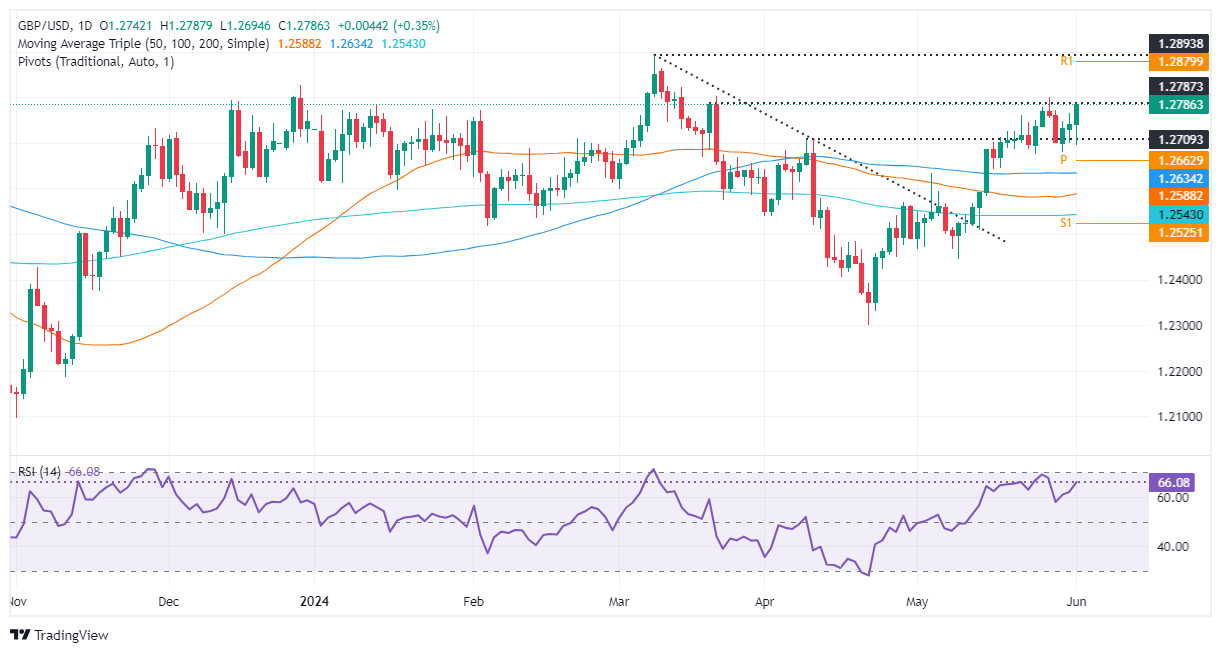
- GBP/USD climbs to 1.2772, close to a four-day high of 1.2784.
- Technical outlook shows upward bias with RSI pointing higher but not yet overbought.
- Key resistance at 1.2800; surpassing it could lead to YTD high of 1.2893, while support lies at 1.2643 and 1.2600.
The British Pound rallied for the third straight day against the US Dollar, gaining some 0.37% in early trading during the North American session. The GBP/USD exchanged hands at 1.2785, shy of a four-day high of 1.2787 reached during the European session.
GBP/USD Price Analysis: Technical outlook
From a daily chart perspective, the GBP/USD is upward biased as buyers gain momentum, reflected on the Relative Strength Index (RSI). The RSI aims upwards yet with a room before turning overbought.
That said, buyers need to clear the conglomeration of technical levels, with the 1.2800 figure and a downslope resistance trendline passing around that area. Once surpassed, the next stop would be the year-to-date (YTD) high of 1.2893, which is shy of 1.2900.
On the other hand, if GBP/USD tumbles below 1.2700, that could sponsor a leg down toward the confluence of the May 3 high turned support and the 100-day moving average (DMA) at around 1.2643. Further losses lie at 1.2600.
GBP/USD Price Action - Daily Chart
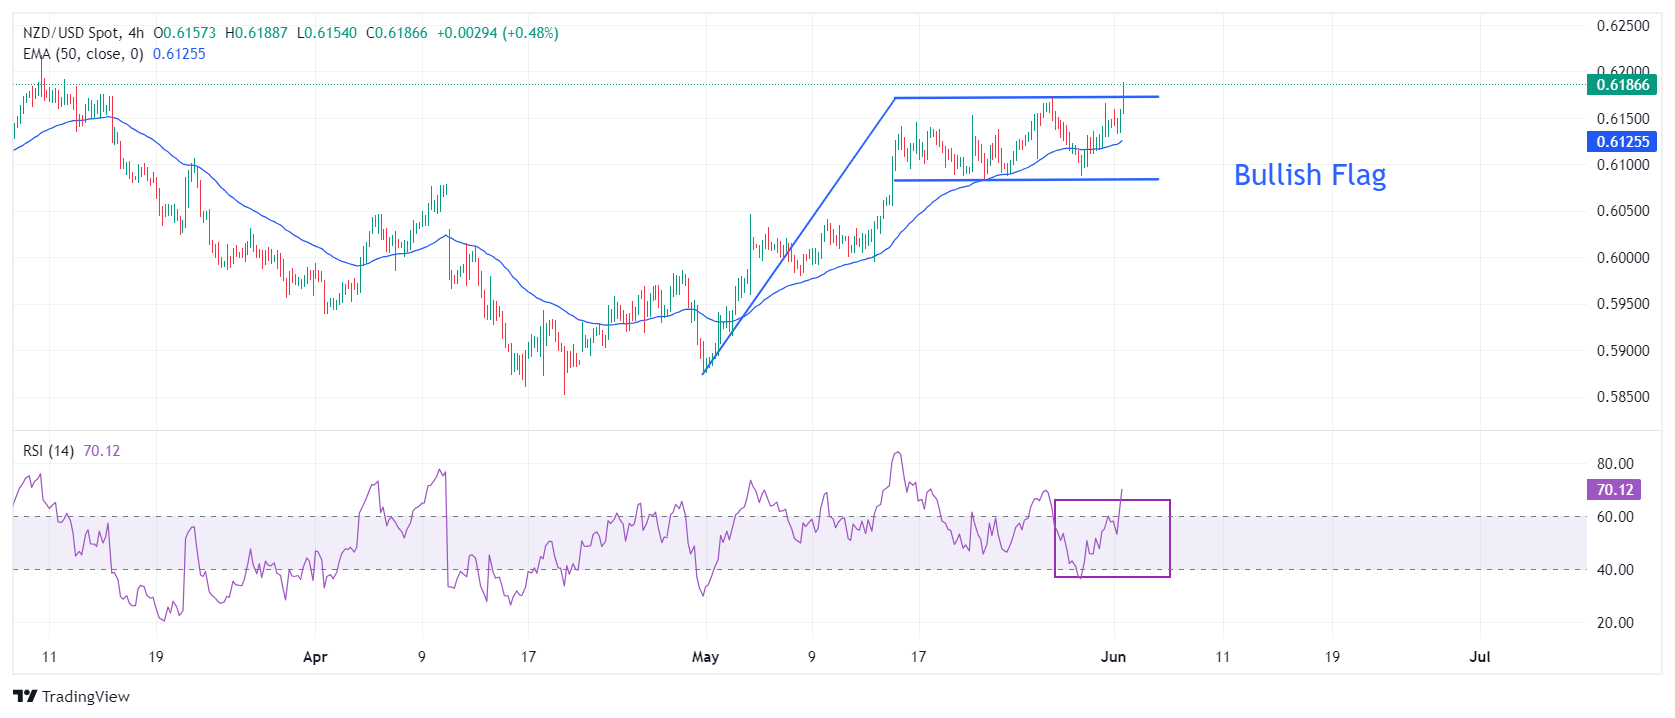
- NZD/USD jumps to 0.6815 after downbeat US ISM Manufacturing PMI report.
- Weak factory activity report dents the US Dollar’s appeal.
- The RBNZ is less likely to return to the policy normalization process this year.
The NZD/USD pair advances to 0.6185 in Monday’s American session as the United States (US) Institute of Supply Management (ISM) has reported a weak Manufacturing PMI report for May. The agency reported that the Manufacturing PMI, which gauges the factory activity, surprisingly declines to 48.7 from the estimates of 49.8 and the former release of 49.2.
Apart from that, other sub-components such as New Orders and Prices Paid Indexes were also weaker than expectations, weighing on the US Dollar (USD). Weak factory data is expected to boost market speculation for the Federal Reserve (Fed) to begin reducing interest rates from the September meeting. The US Dollar Index (DXY) slumps to 104.25.
Meanwhile, the New Zealand Dollar remains firm as investors expect that the Reserve Bank of New Zealand (RBNZ) will not consider lowering interest rates this year. Also, there is a debate that the RBNZ could hike its Official Cash Rate further. Meanwhile, RBNZ Governor Adrian Orr has already commented that more rate hikes remain off the table as long as inflation expectations remain anchored.
NZD/USD attempts to break the Bullish Flag chart formation in a four-hour timeframe, which exhibits an inventory adjustment process between institutional investors and retail participants. This pattern indicates a consolidation after a sharp upside move and it generally breaks towards the direction of the trend, which in this is upwards.
The 50-period Exponential Moving Average (EMA) near 0.6126 continues to provide support to the New Zealand Dollar bulls.
Meanwhile, the 14-period Relative Strength Index (RSI) has climbed above 60.00. A sustainable move above 60.00 will strengthen Kiwi bulls further.
An upside move above the round-level resistance of 0.6200 will drive the asset January 15 high near 0.6250, followed by January 12 high near 0.6280.
On the contrary, fresh downside would appear if the asset breaks below April 4 high around 0.6050 This would drag the asset towards the psychological support of 0.6000 and April 25 high at 0.5969.
NZD/USD daily chart
- ISM Manufacturing PMI declined in May, pointing to ongoing contraction.
- US Dollar stays under bearish pressure after disappointing PMI data.
The business activity in the US manufacturing sector contracted at an accelerating pace in May, with the ISM Manufacturing PMI dropping to 48.7 from 49.2 in April. This reading came in below the market expectation of 49.6.
The Employment Index of the PMI survey improved to 51.1 in May from 48.6 in April, while the New Orders Index slumped to 45.4 from 49.1. Finally, the Prices Paid Index, the inflation component, retreated to 57 from 60.9 in the same period.
Commenting on the survey's findings, "US manufacturing activity continued in contraction after growing in March, the first expansion for the sector since September 2022. Demand was soft again, output was stable, and inputs stayed accommodative," said Timothy R. Fiore, Chair of the Institute for Supply Management (ISM) Manufacturing Business Survey Committee.
Market reaction
The US Dollar (USD) came under renewed selling pressure following this report. At the time of press, the USD Index was down 0.28% on the day at 104.33.
- GBP/JPY pulls back after retouching multi-year highs.
- The trend is bullish so the pull back is not expected to last before the uptrend resumes.
- Intervention by the Japanese authorities is a risk factor that could push GBP/JPY lower.
GBP/JPY rallies up to 200.65 on Monday just short of multi-year highs (May 29) and then pulls back. Despite correcting back down to the 199.50s the pair remains in an uptrend over a short, intermediate and long-term time horizon, and since “the trend is your friend” more upside it expected.
4-hour Chart
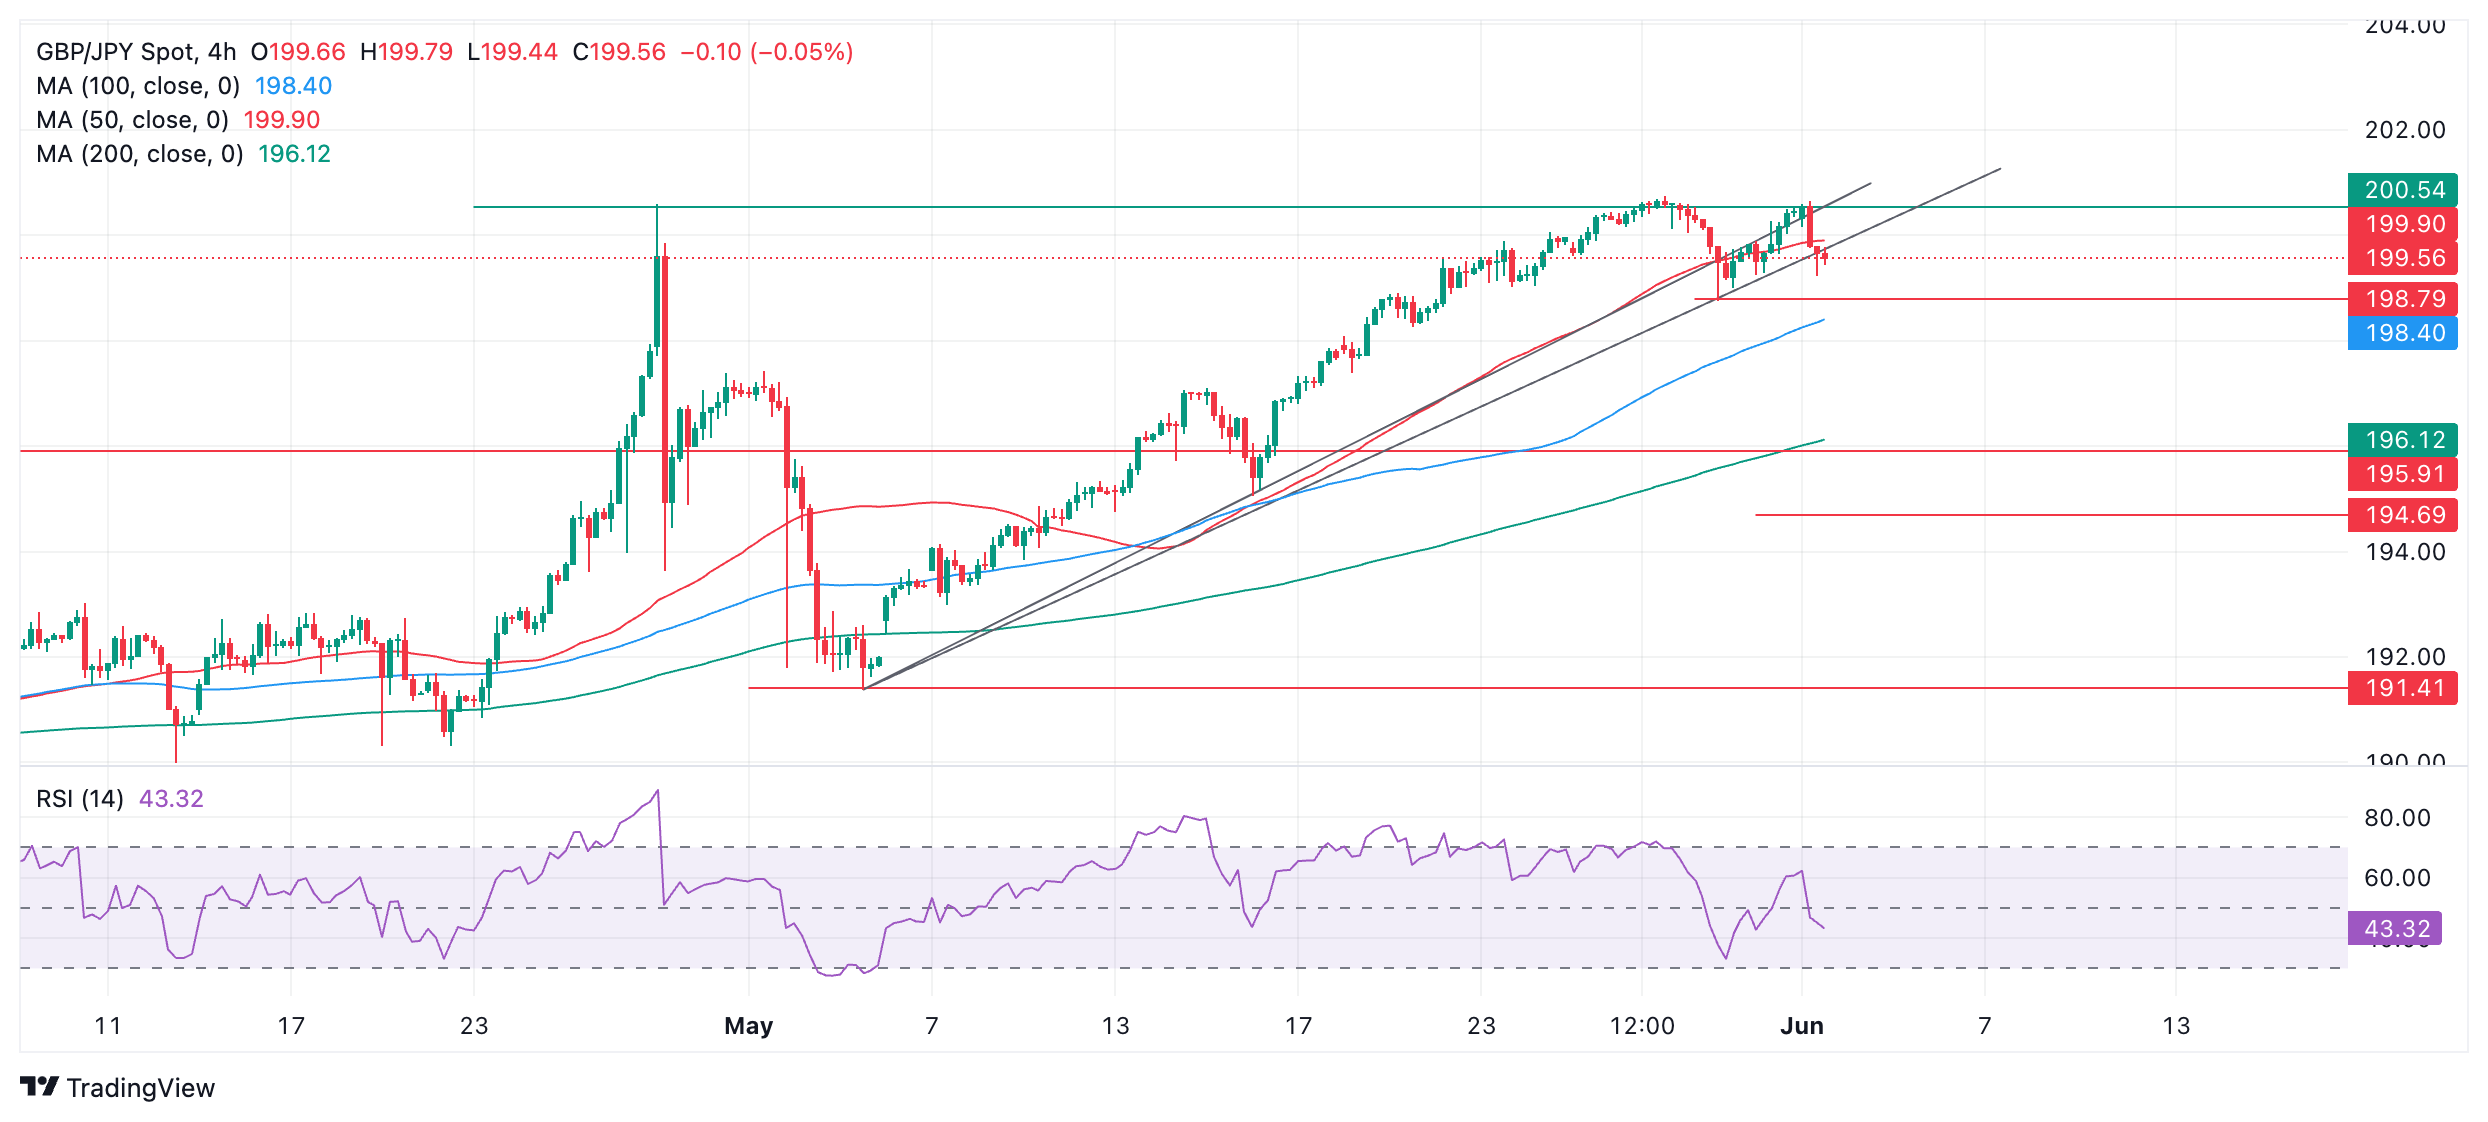
The pair has broken through one – perhaps even two – trendlines underpinning the rally during May. If the correction continues it will probably find support at 198.79 (May 30 swing lows). A break below would suggest further weakness to perhaps the 100 Simple Moving Average (SMA) at 198.40.
Given the dominant uptrend, however, bulls are expected to turn things around once the correction runs out of steam and pushes the pair higher again.
The only sign the pull back may be ending is the formation of a bullish Japanese Hammer candlestick reversal candlestick on the last bar. This occurs when price makes a new low but then recovers to close near the open. If the current period ends as a bullish green candle it will confirm the hammer and could indicate a short-term reversal and resumption of the uptrend.
A break above the 200.75 high will establish a higher high and extend the uptrend. The next targets will probably be at the round numbers – 201.00, 202.00 etc.
Risk of intervention from the Japanese authorities to strengthen the Yen (resulting in a decline of GBP/JPY) could distort the technical picture.
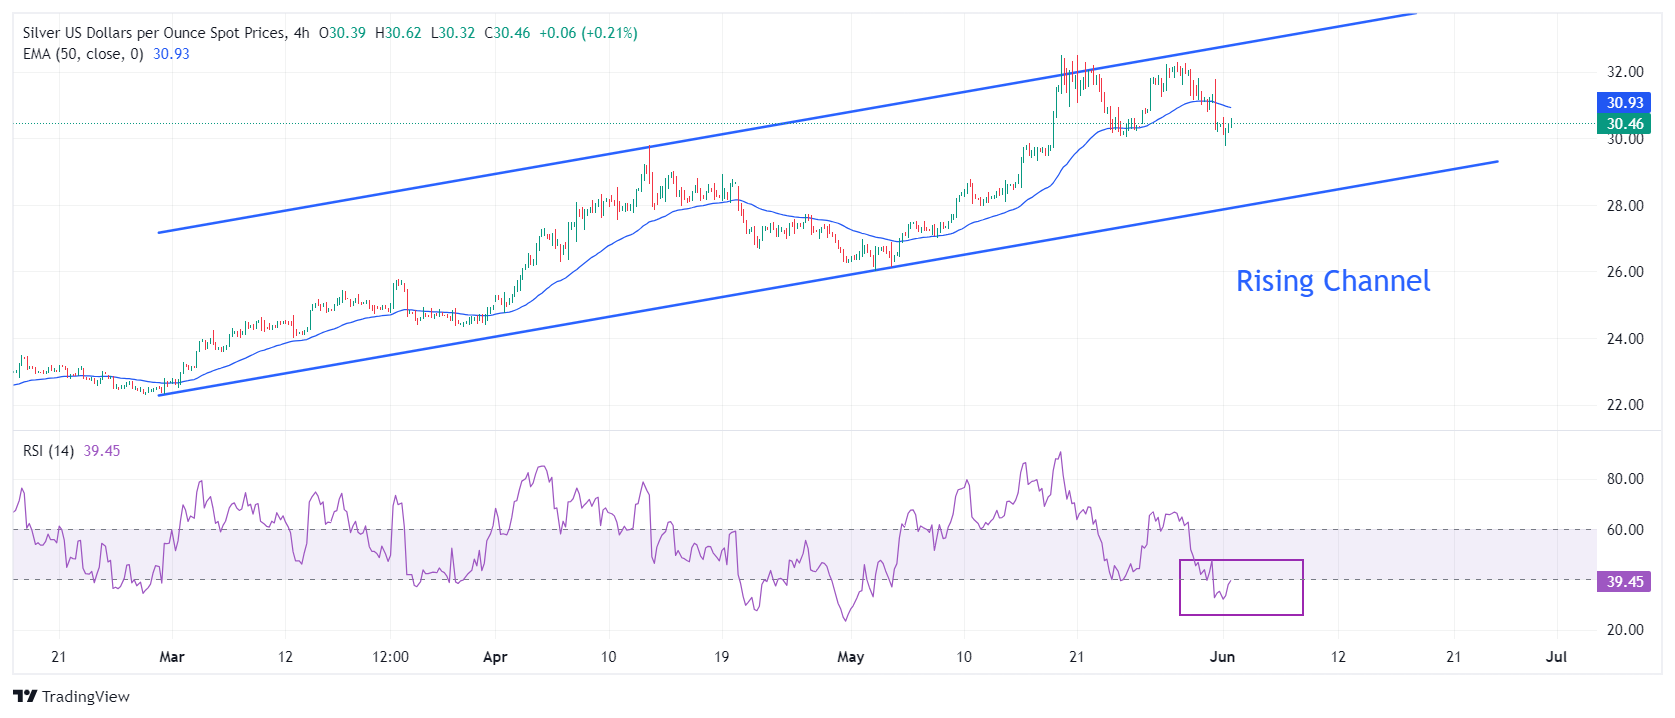
- Silver price revives downside move as US bond yields drop sharply.
- US bond yields weaken as market speculation for Fed reducing interest rates in September improves.
- The next move in the US Dollar will be guided by the US ISM Manufacturing PMI for May.
Silver price (XAG/USD) recovers strongly after discovering buying interest near the crucial support of $30.00 in Monday’s New York session. The white metal bounced back as US Treasury yields plunge du to slight improvement in market speculation for the Federal Reserve (Fed) to begin reducing interest rates from the September meeting.
The CME FedWatch tool shows that the probability of a rate-cut decision in the September meeting has increased to 52% from 49% recorded a week ago. This has weighed heavily on US Treasury yields. 10-year US bond yields have declined to 4.46%. Lower yields on interest-bearing assets reduce the opportunity cost of holding an investment in non-yielding assets, such as Silver.
Some improvement in the Fed rate-cut expectations was driven by downwardly revised Q1 United States (US) Gross Domestic Product (GDP) estimates to 1.3% and weak Personal Spending data for April.
The US Dollar Index (DXY), which tracks the Greenback’s value against six major currencies, retreats to 104.50.
Going forward, investors will focus on the US ISM Manufacturing PMI data for May, which will be published at 14:00 GMT. The PMI is estimated to have improved to 49.8 from the former reading of 49.2. However, a figure below the 50.0 threshold Itself suggests contraction.
Silver technical analysis
Silver price trades in a Rising Channel chart pattern formed on a four-hour timeframe in which each pullback move is considered a buying opportunity by market participants. The white metal comes under pressure as it drops below the 50-period Exponential Moving Average (EMA), which trades around $31.00.
The 14-period Relative Strength Index (RSI) shifts into the bearish range of 20.00-40.00, suggesting that the momentum has leaned towards the downside.
Silver four-hour chart
- EUR/JPY is pulling back within a strong short, intermediate and long-term uptrend.
- If it continues declining the pull back could well find support at the 100 SMA.
- Any weakness will probably be short-lived given the overall bullish bias of the charts.
EUR/JPY is in an uptrend on all major timeframes and trading with a bullish bias over a short, intermediate and long time horizon. Given “the trend is your friend” EUR/JPY is more likely than not to continue rising.
4-hour Chart
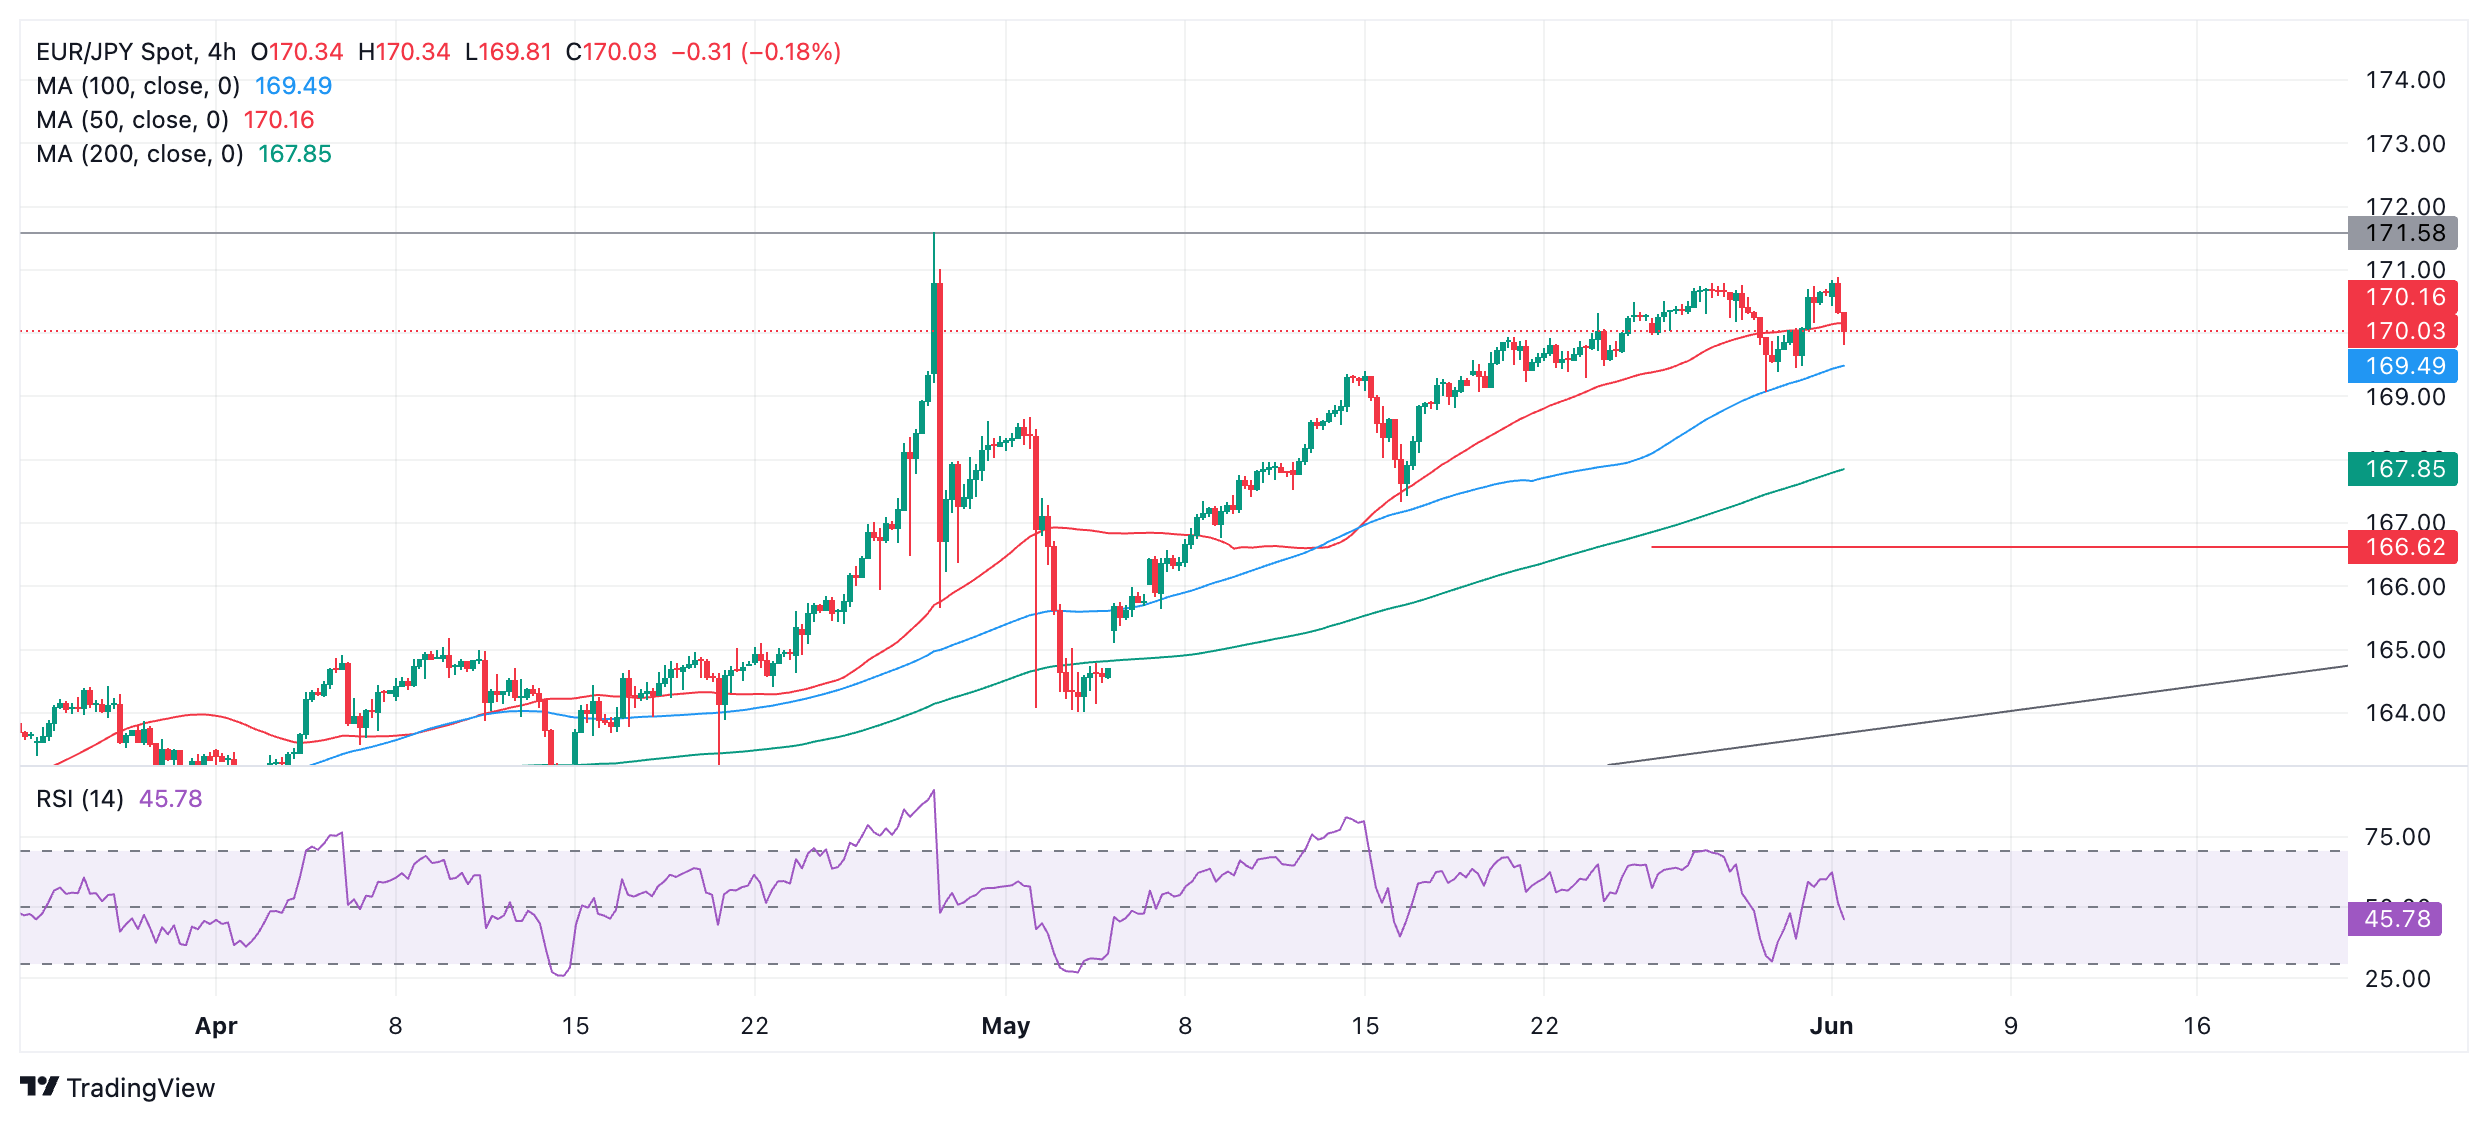
The pair has pulled back to the 50 Simple Moving Average (SMA) but the uptrend remains intact in the short-term, and it is expected to find its feet and resume going higher. There are currently no signs of a recovery and reversal in line with the dominant uptrend.
The 100 SMA (blue) at 168.49 has faithfully supported price on previous pull backs, suggesting it may do the same if price pulls back any lower.
A break above 170.89 (June 3 high) would establish a higher high and probably indicate a continuation of the uptrend. The next target to the upside is 171.60, the high of April 29.
The Relative Strength Index (RSI) is in the neutral zone suggests there is more room for upside before the pair becomes overbought.
EUR/JPY would need to fall to 166.62 (50-day SMA) to suggest a reversal of the dominant uptrend. It would need to break below the trendline at circa 164.50 for confirmation of a reversal of the trend.
- The US Dollar trades mixed against its major peers on Monday.
- Markets are in a positive tone after a quiet weekend on the geopolitical front.
- The US Dollar Index trades in the mid-104.00 region, looking for direction.
The US Dollar (USD) trades broadly stable on Monday after a calm weekend without geopolitical headlines setting the tone. The Greenback will not be able to enjoy the calm start for long, because this week is full on the economic front. On Monday, a few important data points are set to be released in the run-up to the ultimate data point right at the end of the week: the US Employment Report, with its Nonfarm Payrolls print for May.
On Monday, all eyes will be on two PMI surveys gauging the health of the US manufacturing sector: the final reading of the S&P Global Manufacturing Purchasing Managers Index (PMI) for May and the more market-moving survey from the Institute for Supply Management (ISM).
Daily digest market movers: Manufacturing PMI on forefront
- Monday’s US calendar kicks off with the release of the final S&P Global Manufacturing PMI for May at 13:45 GMT. The preliminary estimate was at 50.9 and it is expected to remain unchanged.
- At 14:00 GMT, the Institute for Supply Management releases its recent findings from its monthly survey for May:
- The headline Manufacturing PMI index is expected to increase to 49.8 from 49.2.
- The Employment Index was at 48.6 in April, with no forecast available for May.
- The New Orders index came in at 49.1 a month ago, with no consensus view reported.
- The Prices Paid index should remain rather stable, from 60.9 to 60.
- Construction Spending is expected to rise 0.2% in April, swinging from a 0.2% contraction in March.
- Equities are trading in the green across the board, with all major indices from Asia, Europe and US futures up by an average of 1%.
- According to the CME Fedwatch Tool, Fed Fund futures pricing data suggests a 46.1% chance for keeping rates unchanged in September, against a 47.2% chance for a 25 basis points (bps) rate cut and a 6.7% chance for an even 50 bps rate cut. An interest rate hike is no longer considered an option.
- The benchmark 10-year US Treasury Note trades around 4.49%, in the middle of its monthly range between 4.34% and 4.61%.
US Dollar Index Technical Analysis: Tensions building towards NFP
The US Dollar Index (DXY) is hanging a bit in no man's land this Monday after its negative performance last week. When looking at a weekly chart, the DXY is clearly in consolidation, posting with lower highs and higher lows as sellers and buyers are being pushed towards each other. In this context, normally a breakout is then set to take place, something that could happen this week taking into account the very busy economic calendar ahead.
On the upside, the DXY index reclaimed the key 105.00 round level, which broadly aligns with the 55-day Simple Moving Average (SMA). It will be important to see if these levels hold support should the US data weaken. Once that is proven, look for 105.52 and 105.88.
On the downside, the 200-day SMA at 104.44 and the 100-day SMA around 104.42 are the last line of defence. Once that level snaps, an air pocket is placed between 104.30 and 103.00. Should the US Dollar decline persist, the low of March at 102.35 and the low from December at 100.62 are levels to consider.
US Dollar FAQs
The US Dollar (USD) is the official currency of the United States of America, and the ‘de facto’ currency of a significant number of other countries where it is found in circulation alongside local notes. It is the most heavily traded currency in the world, accounting for over 88% of all global foreign exchange turnover, or an average of $6.6 trillion in transactions per day, according to data from 2022. Following the second world war, the USD took over from the British Pound as the world’s reserve currency. For most of its history, the US Dollar was backed by Gold, until the Bretton Woods Agreement in 1971 when the Gold Standard went away.
The most important single factor impacting on the value of the US Dollar is monetary policy, which is shaped by the Federal Reserve (Fed). The Fed has two mandates: to achieve price stability (control inflation) and foster full employment. Its primary tool to achieve these two goals is by adjusting interest rates. When prices are rising too quickly and inflation is above the Fed’s 2% target, the Fed will raise rates, which helps the USD value. When inflation falls below 2% or the Unemployment Rate is too high, the Fed may lower interest rates, which weighs on the Greenback.
In extreme situations, the Federal Reserve can also print more Dollars and enact quantitative easing (QE). QE is the process by which the Fed substantially increases the flow of credit in a stuck financial system. It is a non-standard policy measure used when credit has dried up because banks will not lend to each other (out of the fear of counterparty default). It is a last resort when simply lowering interest rates is unlikely to achieve the necessary result. It was the Fed’s weapon of choice to combat the credit crunch that occurred during the Great Financial Crisis in 2008. It involves the Fed printing more Dollars and using them to buy US government bonds predominantly from financial institutions. QE usually leads to a weaker US Dollar.
Quantitative tightening (QT) is the reverse process whereby the Federal Reserve stops buying bonds from financial institutions and does not reinvest the principal from the bonds it holds maturing in new purchases. It is usually positive for the US Dollar.
- USD/CHF declines to near 0.9000 despite the US Dollar’s recovery.
- The US Dollar rebounds amid uncertainty ahead of US data-packed week.
- The Swiss Franc reflects sheer strength ahead of the Swiss CPI report for May
The USD/CHF pair extends its losing streak for the third trading session on Monday. The Swiss Franc asset weakens even though the US Dollar has rebounded amid uncertainty ahead of the United States data-packed week.
This week, the US economic calendar is full of top-tier events such as the ISM Manufacturing and Services PMI, ADP Employment Change and the Nonfarm Payrolls (NFP) data for May, and the JOLTS Job Openings for April. The economic data will provide significant cues about when the Federal Reserve (Fed) will start lowering its key borrowing rates this year.
Currently, financial markets expect that the Fed will choose the September meeting as the earliest point from when it will start reducing interest rates.
In today’s session, the US Dollar will be impacted by the US ISM manufacturing PMI, which will be published at 12: 30 GMT. The Manufacturing PMI is estimated to have risen to 49.8 from 49.2. However, a figure below the 50.0 threshold is considered as contraction. Investors will also focus on other sub-components such as New Orders and Prices Paid Indexes, which are leading indicators of inflation.
Meanwhile, the Swiss Franc exhibits strength ahead of the Swiss Consumer Price Index (CPI) data for May, which will be published on Tuesday. May’s CPI data will be the latest inflation reading available to Swiss National Bank (SNB) policymakers that will indicate whether a subsequent rate-cut move is required. Monthly CPI data is expected to have grown at a faster pace of 0.4% from the prior reading of 0.3%.
- Oil steadies near $77.00, looking for direction after Sunday’s OPEC+ meeting.
- OPEC+ meeting sets the tone for more downside after the summer season despite the decision to extend production cuts.
- The US Dollar Index trades at mid-104.00 levels and is facing a heavy week full of economic data.
Oil prices trade broadly steady on Monday, ignoring the OPEC+ decision to extend current production cuts into 2025 with the goal to support prices. Despite the broad commitment to keep a tight supply, some Oil producers within the organization will be able to ease some of the voluntary production cuts, which came as a surprise. The biggest winner was the United Arab Emirates, which can head back to markets and sell more barrels. Overall, Saudi Arabia and Russia will still take the bulk part of the effort and maintain that 2 million barrel draw per day, phasing it out from October.
Meanwhile, the US Dollar Index (DXY) is floating around a steady level near 104.63 with markets bracing for a very busy week. Several important data points are set to be released throughout the week in the run-up to the main event on Friday: the US Employment Report. Traders will be looking for clues over whether the US economy has topped out.
At the time of writing, Crude Oil (WTI) trades at $77.08 and Brent Crude at $81.33.
Oil news and market movers: OPEC+ fizzled again
- OPEC+ agreed to extend the cuts of 3.66 million barrels per day by a year until the end of 2025. However, voluntary production cuts, currently at around 2 million barrels per day, will start to be phased out from October after the recent OPEC+ production quota decision, Bloomberg reports.
- Goldman Sachs managing director and head of research Daan Struyven said in a note that the outcome of the OPEC+ meeting is bearish due to the decision to return supply to markets despite the recent surprise increase in inventories. Risks for Oil prices are now skewed to the downside, Bloomberg reports.
- Warren Patterson, head of commodity strategies at ING, sees a possible uptick in crude prices over the summer period. Still, the deficit is expected to widen by the third quarter.
Oil Technical Analysis: Doubling down on Fed cuts
Oil prices are not feeling warm about the recent agreement on output from OPEC+. Despite several bearish headlines from analysts and traders, there might be the consideration that OPEC+ expects a pickup in demand will take place by 2025. After all, sooner or later, the US Federal Reserve will cut interest rates, and it looks like OPEC+ is starting to prepare for this scenario.
First, the Simple Moving Averages (SMA) need to be regained under control. The 100-day SMA at $79.09 and the 200-day SMA at $79.54 are the first levels on the upside. Next, the 55-day Simple Moving Average (SMA) at $81.13 and the descending trendline at $81.45 are an area with a lot of resistance where any recovery rally could pause. Once broken through there, the road looks quite open to head to $87.12.
On the downside, the $76.00 marker is coming back into focus with the $75.27 level playing a crucial role if traders still want to have an option to head back to $80.00. Should that $75.27 pivotal level snap, expect to see a risk-full nosedive move that could sprint all the way down to $68, below $70.00.
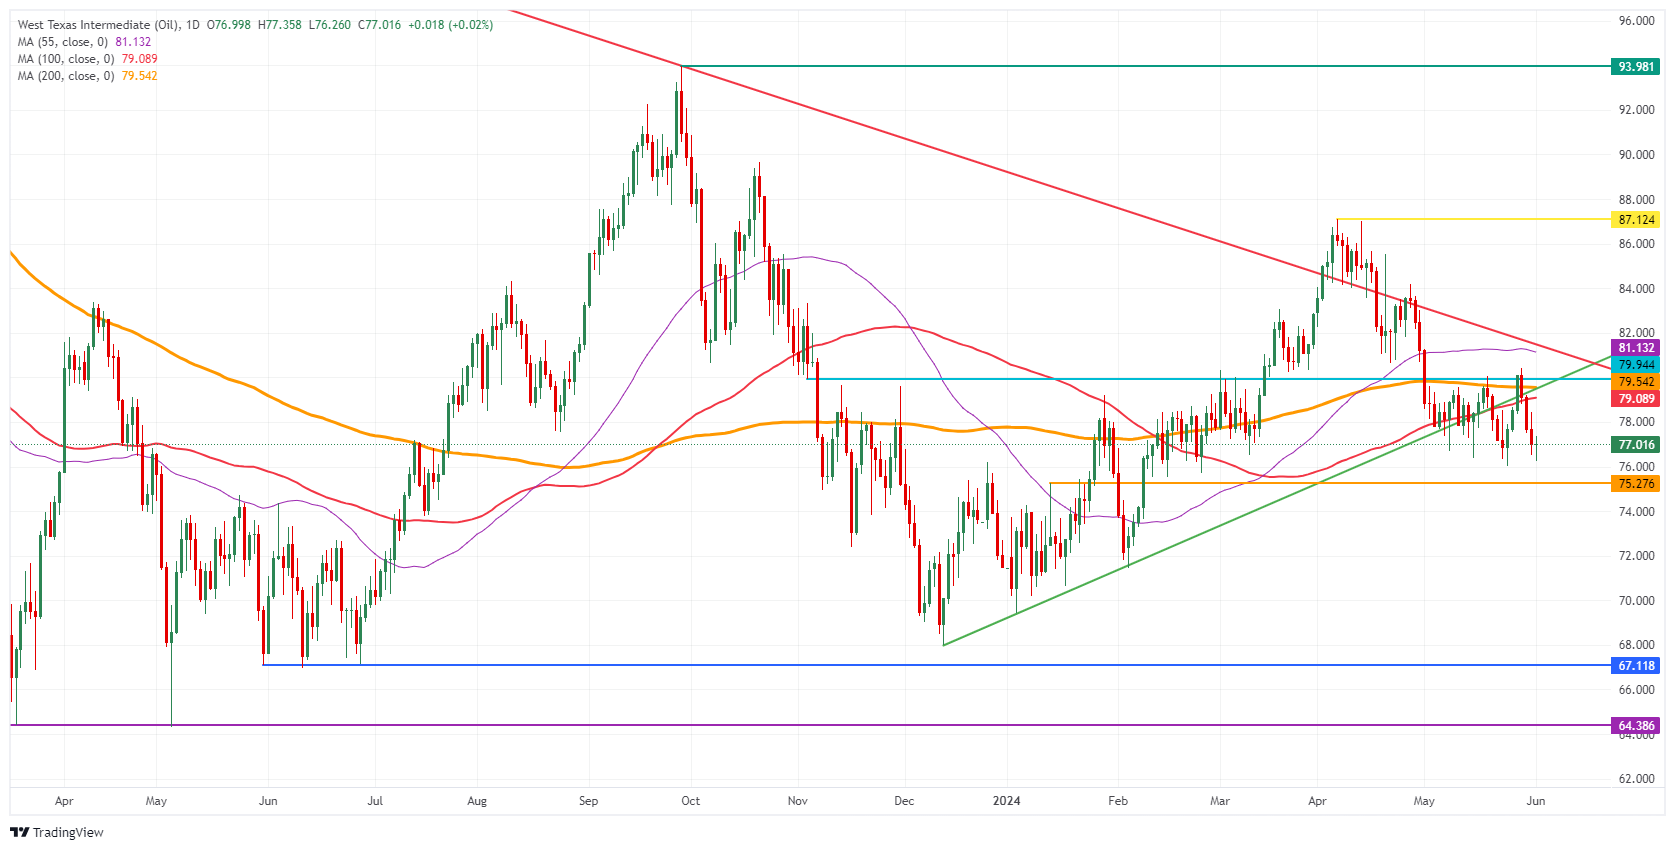
US WTI Crude Oil: Daily Chart
WTI Oil FAQs
WTI Oil is a type of Crude Oil sold on international markets. The WTI stands for West Texas Intermediate, one of three major types including Brent and Dubai Crude. WTI is also referred to as “light” and “sweet” because of its relatively low gravity and sulfur content respectively. It is considered a high quality Oil that is easily refined. It is sourced in the United States and distributed via the Cushing hub, which is considered “The Pipeline Crossroads of the World”. It is a benchmark for the Oil market and WTI price is frequently quoted in the media.
Like all assets, supply and demand are the key drivers of WTI Oil price. As such, global growth can be a driver of increased demand and vice versa for weak global growth. Political instability, wars, and sanctions can disrupt supply and impact prices. The decisions of OPEC, a group of major Oil-producing countries, is another key driver of price. The value of the US Dollar influences the price of WTI Crude Oil, since Oil is predominantly traded in US Dollars, thus a weaker US Dollar can make Oil more affordable and vice versa.
The weekly Oil inventory reports published by the American Petroleum Institute (API) and the Energy Information Agency (EIA) impact the price of WTI Oil. Changes in inventories reflect fluctuating supply and demand. If the data shows a drop in inventories it can indicate increased demand, pushing up Oil price. Higher inventories can reflect increased supply, pushing down prices. API’s report is published every Tuesday and EIA’s the day after. Their results are usually similar, falling within 1% of each other 75% of the time. The EIA data is considered more reliable, since it is a government agency.
OPEC (Organization of the Petroleum Exporting Countries) is a group of 13 Oil-producing nations who collectively decide production quotas for member countries at twice-yearly meetings. Their decisions often impact WTI Oil prices. When OPEC decides to lower quotas, it can tighten supply, pushing up Oil prices. When OPEC increases production, it has the opposite effect. OPEC+ refers to an expanded group that includes ten extra non-OPEC members, the most notable of which is Russia.
- AUD/USD slips below 0.6650 amid US Dollar’s recovery.
- The US Dollar rebounds even though the Fed’s rate-cut prospects for September edge higher.
- Market speculation for the RBA tightening policy further has strengthened.
The AUD/USD pair falls to near 0.6635 in Monday’s European session. The Aussie asset is expected to witness more downside as the US Dollar recovers despite slight improvement in expectations that the Federal Reserve (Fed) will start reducing interest rates from the September meeting
The CME FedWatch tool shows that traders see a 52% for the central bank announcing a rate-cut move in September, which has improved from 49% recorded a week ago. Mild recovery in the Fed rate-cut speculation for September is driven by weak revised estimates for Q1 Gross Domestic Product (GDP) and slower Personal Spending growth for April.
The United States Q1 GDP grew by 1.3%, slower than preliminary estimates of 1.6%. US Personal Spending grew at a slower pace of 0.2% from the estimates of 0.3% and the former release of 0.7%. Consumer spending accounts for two-thirds of the US economic activity. Weak data has raised doubts over the US maintaining its strong economic outlook in the long-run.
In today’s session, investors will focus on the US ISM Manufacturing PMI for May, which will be published at 14:00 GMT. The factory data is estimated to have improved to 49.8 from the former reading of 49.2. However, a figure below the 50.0 threshold is considered as contraction.
Meanwhile, the near-term outlook of the Australian Dollar remains strong as investors hope that the Reserve Bank of Australia (RBA) could announce one more interest rate-hike due to stubbornly higher inflation data.
This week, the Australian Dollar will be guided by the Q1 GDP data, which will be published on Wednesday. The Australian economy is estimated to have expanded at a steady pace of 0.2%.
- Gold spikes to a high of $2,359 on Friday after US PCE inflation data undershoots expectations, suggesting interest rates might fall.
- Gold then rolls over and declines to three-week lows, however, as safe-haven demand declines, bulls take flight.
- Asian demand and cooling inflation expectations could put a floor under the rout.
- Technicals remain bearish after a breakout from a Bear Flag.
Gold (XAU/USD) slides lower to trade in the $2,320s on Monday as a positive risk-on environment inherited from the Asian session lowers safe-haven demand for the metal.
Gold rolls over after hitting temporary high
Gold pumped after the release of marginally lower-than-expected US core Personal Consumption Expenditures (PCE) data on Friday, the Federal Reserve’s (Fed) preferred gauge of inflation. Core PCE came out at 0.2% month-over-month in April instead of 0.3% forecast. The data lifted the precious metal temporarily to a peak of $2,359, however, it promptly tumbled back down.
The lower inflation data recalibrated expectations of when the Fed will cut interest rates, increasing the probability of a September cut to 55% from around 50% previously. This is positive for Gold, which as a non yielding asset tends to appreciate when interest rates fall. That said, Gold investors remain cautious about the trajectory of interest rates amid still-high inflation and a Fed that is still hazy about its intentions.
Gold to be supported during the summer
Gold is likely to be supported during the summer as investors weigh the odds of future interest rate moves from major central banks and Asian demand stays bouyant, according to Bart Malek, Head of Commodity Strategy at TD Securities.
Whilst Gold tumbled from all-time highs in April after the Fed signaled it would be delaying expected interest-rate cuts indefinitely, it has found a floor as speculators have short-covered following a poor run of US data including Friday’s core PCE undershoot. Thus the metal is both capped and supported, suggests the strategist.
“Considering that the Fed's favorite inflation measure is showing a consistent move lower, the Gold market should be well supported through the summer. But, since policy makers will need more proof that their economic modeling is reflecting reality and that rates are indeed restrictive sufficiently to control inflation, no large rally is expected for now. Gold moves and investor positioning will very much be data dependent,” says Malek.
Gold is further supported by Asian buying as a hedge against currency depreciation. Most recently Chinese buying has been noted as a counter-weight against the devaluation of the Renminbi, adds Malek.
Technical Analysis: Gold makes lower lows
Gold price broke out of a rectangular consolidation (red-shaded area in the chart below) – probably a Bear Flag continuation price pattern – on May 29. Bear flags are like upside-down flags with a steep decline – the “flagpole” – followed by a rectangle or square price consolidation – the “flag square”.
The breakout of the flag square activated the Bear Flag’s downside target at $2,295 (the 0.618 Fibonacci extrapolation of the flagpole that formed from May 21-23).
The target for the break below the trendline lies nearby at $2,303 (the 0.618 Fib. extrapolation of the down-move prior to the break).
Gold has step-declined to lower lows since then, providing further bearish confirmation following the breakout. Recently bears managed to push the price down to $2,314, only $11 away from the first downside target.
XAU/USD 4-hour Chart
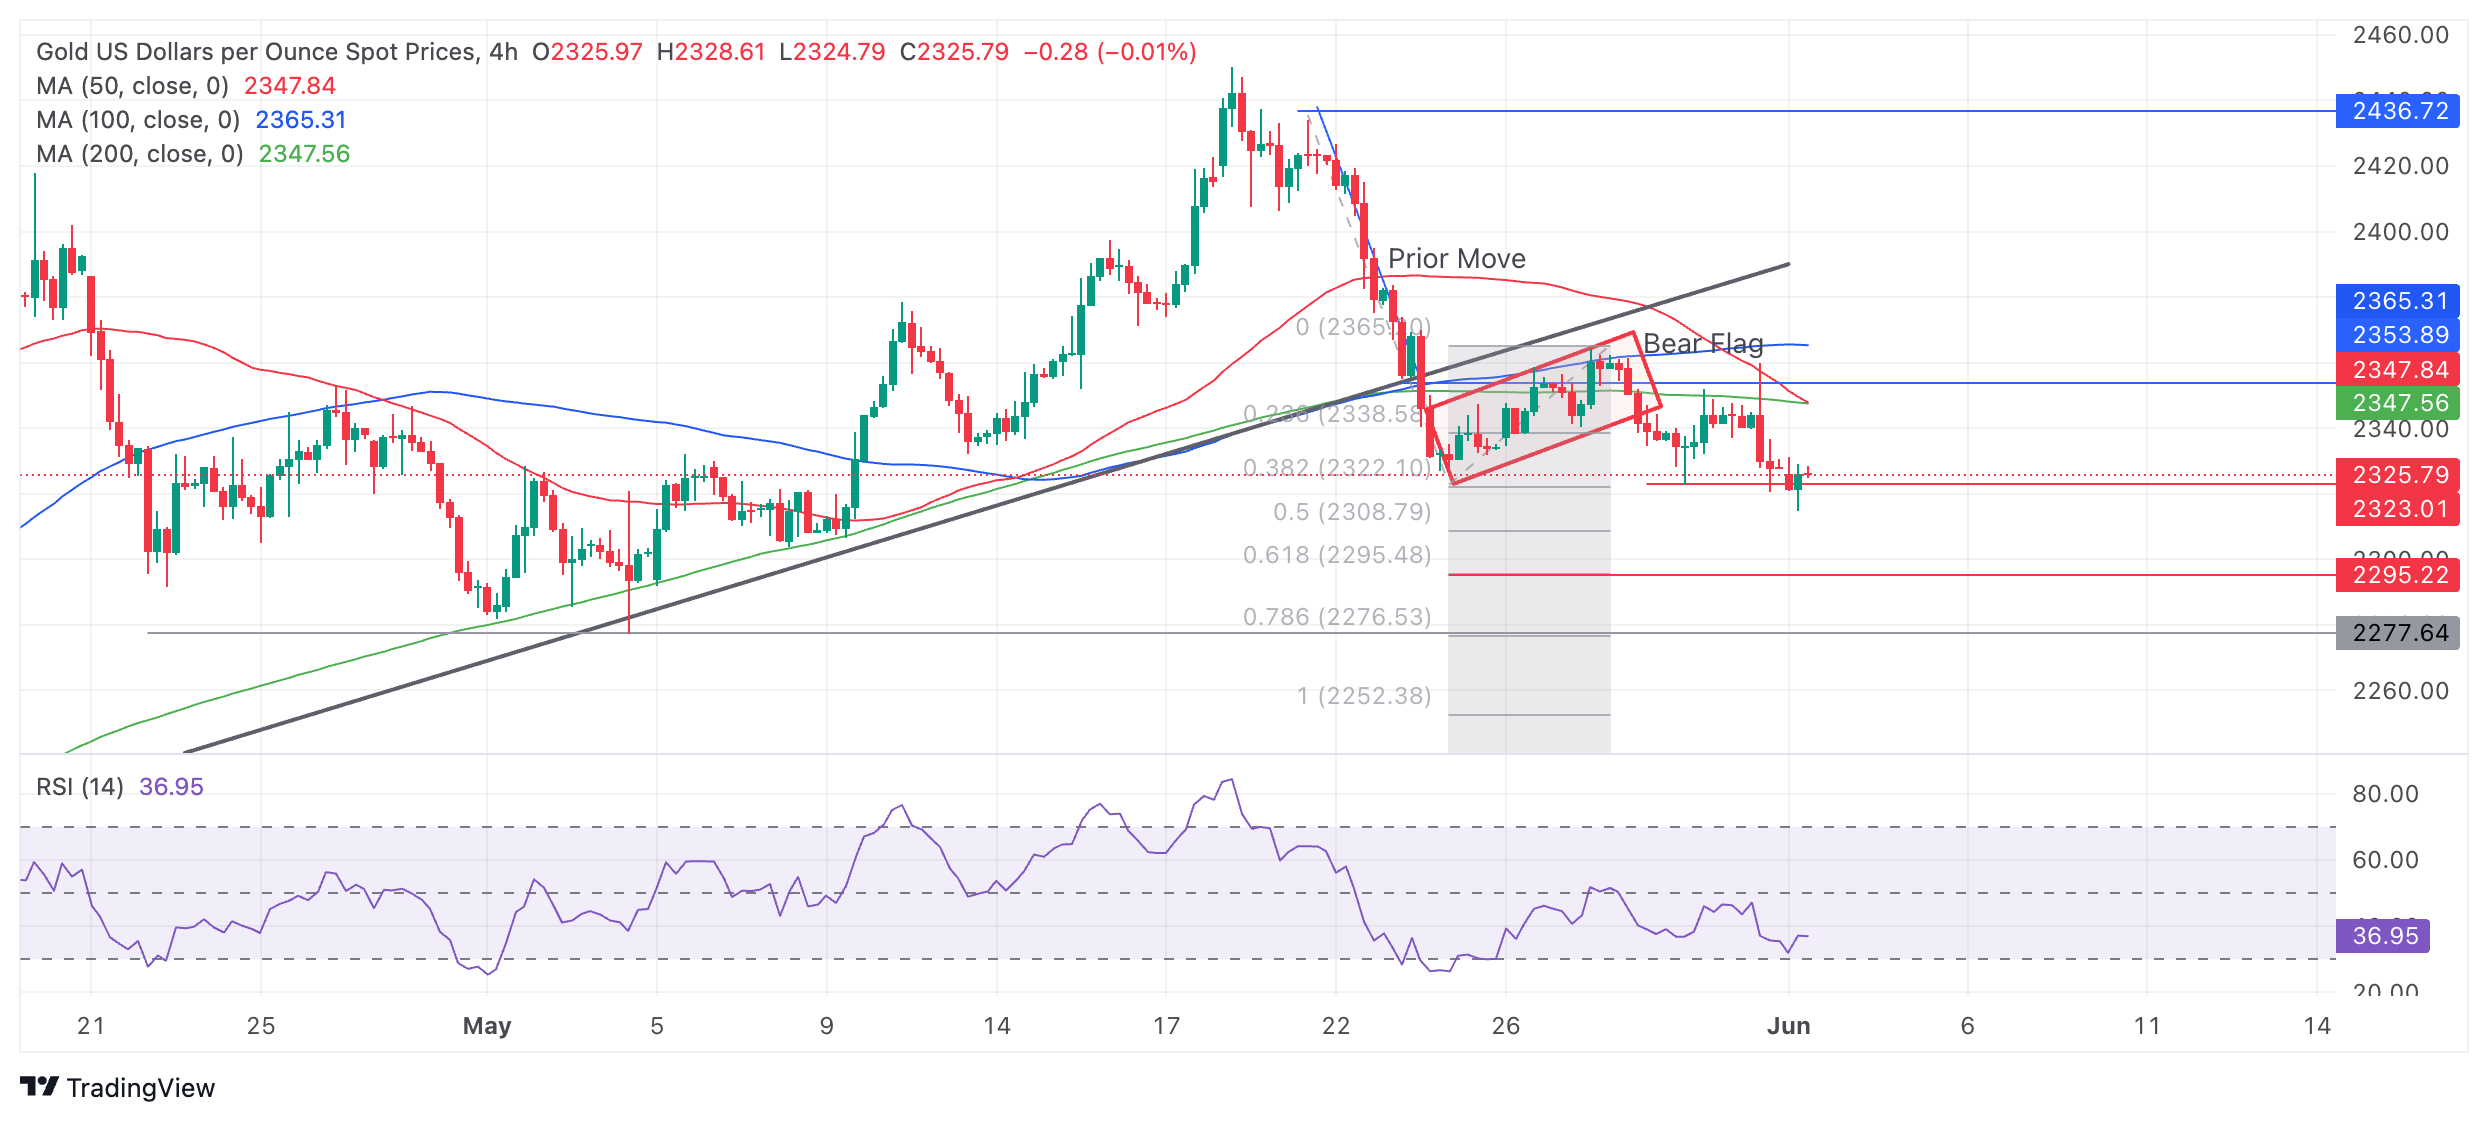
Gold's 4-hour chart now exhibits a sequence of declining peaks and troughs and a major trendline break, suggesting the precious metal is in a short-term downtrend and favoring short positions over longs.
More bearish moves could very well be on the way, suggesting Gold could even fall to $2,272-$2,277 (the 100% extrapolatin of the move prior to the trend-line break, historical support and resistance).
The precious metal’s medium and long-term trends are still bullish, however, and the risk of a recovery remains high. That said, price action is not supporting a resumption hypothesis at the moment.
A break above the peak of the rectangular consolidation zone at $2,362 would be required to bring into doubt the integrity of the short-term downtrend, otherwise further weakness is foreseen.
Gold FAQs
Gold has played a key role in human’s history as it has been widely used as a store of value and medium of exchange. Currently, apart from its shine and usage for jewelry, the precious metal is widely seen as a safe-haven asset, meaning that it is considered a good investment during turbulent times. Gold is also widely seen as a hedge against inflation and against depreciating currencies as it doesn’t rely on any specific issuer or government.
Central banks are the biggest Gold holders. In their aim to support their currencies in turbulent times, central banks tend to diversify their reserves and buy Gold to improve the perceived strength of the economy and the currency. High Gold reserves can be a source of trust for a country’s solvency. Central banks added 1,136 tonnes of Gold worth around $70 billion to their reserves in 2022, according to data from the World Gold Council. This is the highest yearly purchase since records began. Central banks from emerging economies such as China, India and Turkey are quickly increasing their Gold reserves.
Gold has an inverse correlation with the US Dollar and US Treasuries, which are both major reserve and safe-haven assets. When the Dollar depreciates, Gold tends to rise, enabling investors and central banks to diversify their assets in turbulent times. Gold is also inversely correlated with risk assets. A rally in the stock market tends to weaken Gold price, while sell-offs in riskier markets tend to favor the precious metal.
The price can move due to a wide range of factors. Geopolitical instability or fears of a deep recession can quickly make Gold price escalate due to its safe-haven status. As a yield-less asset, Gold tends to rise with lower interest rates, while higher cost of money usually weighs down on the yellow metal. Still, most moves depend on how the US Dollar (USD) behaves as the asset is priced in dollars (XAU/USD). A strong Dollar tends to keep the price of Gold controlled, whereas a weaker Dollar is likely to push Gold prices up.
- EUR/GBP appreciates as Eurozone Manufacturing PMI increased to 47.3 in May, the highest reading since March 2023.
- ECB is expected to deliver a 25-basis point rate cut on Thursday.
- Citi/YouGov survey indicated UK public expectations for inflation for the next 12 months have declined to the lowest since July 2021.
EUR/GBP continues to rise for the third successive session, trading around 0.8530 during the European hours on Monday. The appreciation in the currency cross can be attributed to the HCOB Eurozone Manufacturing PMI, which increased to 47.3 in May from 45.7 in April, slightly below the preliminary estimate of 47.4. This is the highest reading since March 2023, indicating the slowest decline in the Eurozone manufacturing sector in over a year.
Investors have factored in the European Central Bank (ECB) to cut interest rates on Thursday, but it may signal a halt in July and slower rate reductions in the coming months. Financial markets have priced in nearly 25 basis points (bps) of ECB rate cuts in June and 57 bps of cuts in 2024, according to Reuters.
Traders will closely monitor ECB President Christine Lagarde's press conference for fresh signals on the pace of rate cuts after June. Any dovish message from the ECB is likely to weigh on the Euro and create a headwind for the EUR/GBP cross.
In the United Kingdom (UK), investors remain uncertain about the Bank of England’s (BoE) rate-cut time frame. Although UK annual headline inflation significantly dropped to 2.3% in April, BoE policymakers are still concerned about the slower progress in the disinflation process within the services sector. As per Citi/YouGov survey, UK public expectations for inflation for the next 12 months have declined to 3.1% in May, the lowest level since July 2021, per a Reuters report on Friday.
- USD/CAD rises to 1.3660 due to the US Dollar’s recovery and firm speculation BoC’s rate-cut on Wednesday.
- The BoC is expected to announce a rate-cut move for the first time after two year-long policy-tightening stance.
- The next move in the US Dollar will be guided by US ISM Manufacturing PMI for May
The USD/CAD pair jumps to 1.3660 in Monday’s European session. The Loonie asset strengthens as the US Dollar (USD) extends recovery due to uncertainty among market participants ahead of a United States (US) data-packed week.
Market sentiment has improved due to stronger-than-expected China’s Caixin PMI data for May. However, an asset-specific action is recorded in the global economy. While risk-perceived currencies are facing pressure, S&P 500 futures have posted significant gains in the London session. The US Dollar Index (DXY) recovers to 104.70 but is still stuck inside Friday’s trading range.
10-year US Treasury yields tumble to 4.48% as market speculation for the Federal Reserve (Fed) to begin reducing interest rates from the September meeting improves. Positive change in Fed rate-cut prospects for September is driven by slower growth in the US Personal Spending data. In April, the consumer spending grew at a slower pace of 0.2% from the estimates of 0.3% and the former release of 0.7%.
This week, investors will focus on the US ISM Manufacturing and Services PMI and the Nonfarm Payrolls (NFP) data for May. In today’s session, investors will focus on the Manufacturing PMI data for May, which will be published at 14:00 GMT. The PMI is estimated to have improved to 49.8 from the former reading of 49.2. However, a figure below the 50.0 threshold is considered as contraction.
Meanwhile, the Canadian Dollar will dance to the tunes of the Bank of Canada’s (BoC) interest rate decision, which will be announced on Wednesday. The BoC is expected to announce an interest rate-cut decision for the first time since March 22 as it maintained a restrictive policy framework due to Covid-led inflation. Investors will also focus on fresh cues about the BoC’s rate-cut path beyond June’ meeting.
- EUR/USD faces pressure above 1.0850 ahead of key US economic events and the ECB’s monetary policy decision.
- The ECB is widely anticipated to announce interest rate cuts on Thursday.
- The US NFP will provide fresh cues about Fed rate-cut timing on Friday.
EUR/USD struggles to sustain above 1.0850 in Monday’s European session. The major currency pair faces pressure as the revised HCOB Manufacturing Purchasing Managers Index (PMI) showed that factory data dropped slightly to 47.3 from the consensus and the preliminary reading of 47.4.
This week, the shared currency pair is expected to remain volatile as investors shift focus to the European Central Bank’s (ECB) interest rate decision, which will be announced on Thursday.
Financial markets anticipate the ECB will cut its key Main Refinancing Operations Rate by 25 basis points (bps) to 4.25%. Therefore, market participants remain more interested in cues for the rate-cut path beyond the June meeting.
Expectations for the ECB to deliver subsequent rate cuts in the July meeting have waned after the Eurozone’s preliminary Harmonized Index of Consumer Prices (HICP) report for May showed that the journey towards achieving the 2% inflation is expected to remain bumpy.
Eurostat reported on Friday that the annual preliminary Eurozone HICP grew at a faster pace than expected in May. Headline HICP rose by 2.6%, stronger than the estimates of 2.5% and April's reading of 2.4%. In the same period, the core HICP data – which excludes volatile components such as food, energy, alcohol and tobacco – accelerated to 2.9%, from expectations of 2.8% and the prior reading of 2.7%.
Daily digest market movers: EUR/USD drops after sluggish Eurozone PMI
- EUR/USD comes under pressure amid caution ahead of the ECB’s interest rate decision and the United States Nonfarm Payrolls (NFP) report for May, which will be released on Thursday and Friday, respectively. The labor market data will provide fresh cues about when the Federal Reserve (Fed) could start reducing interest rates.
- The CME FedWatch tool shows that the probability of a rate cut by the Fed in the September meeting has increased to 52% from 49% recorded a week ago. Market speculation for the Fed reducing interest rates in September improved after the Personal Consumption Expenditures Price Index (PCE) report showed on Friday that the Personal Spending growth momentum slowed to 0.2% in April from the estimates of 0.3% and the prior reading of 0.7%. However, the core PCE inflation, the Fed’s preferred inflation gauge, rose expectedly by 2.8% on a year-over-year basis.
- Meanwhile, the US Dollar Index (DXY), which tracks the Greenback’s value against six major currencies, rose slightly to 104.70. In Monday’s session, investors will focus on the US Institute for Supply Management (ISM) Manufacturing PMI data for May, which will be published at 14:00 GMT.
- The ISM Manufacturing PMI is estimated to have risen to 49.8 from 49.2. However, a figure below the 50.0 threshold is considered a contraction in the sector. Investors will also focus on other sub-components, such as New Orders and Prices Paid indexes, which are leading inflation indicators.
Technical Analysis: EUR/USD extends correction below 1.0850
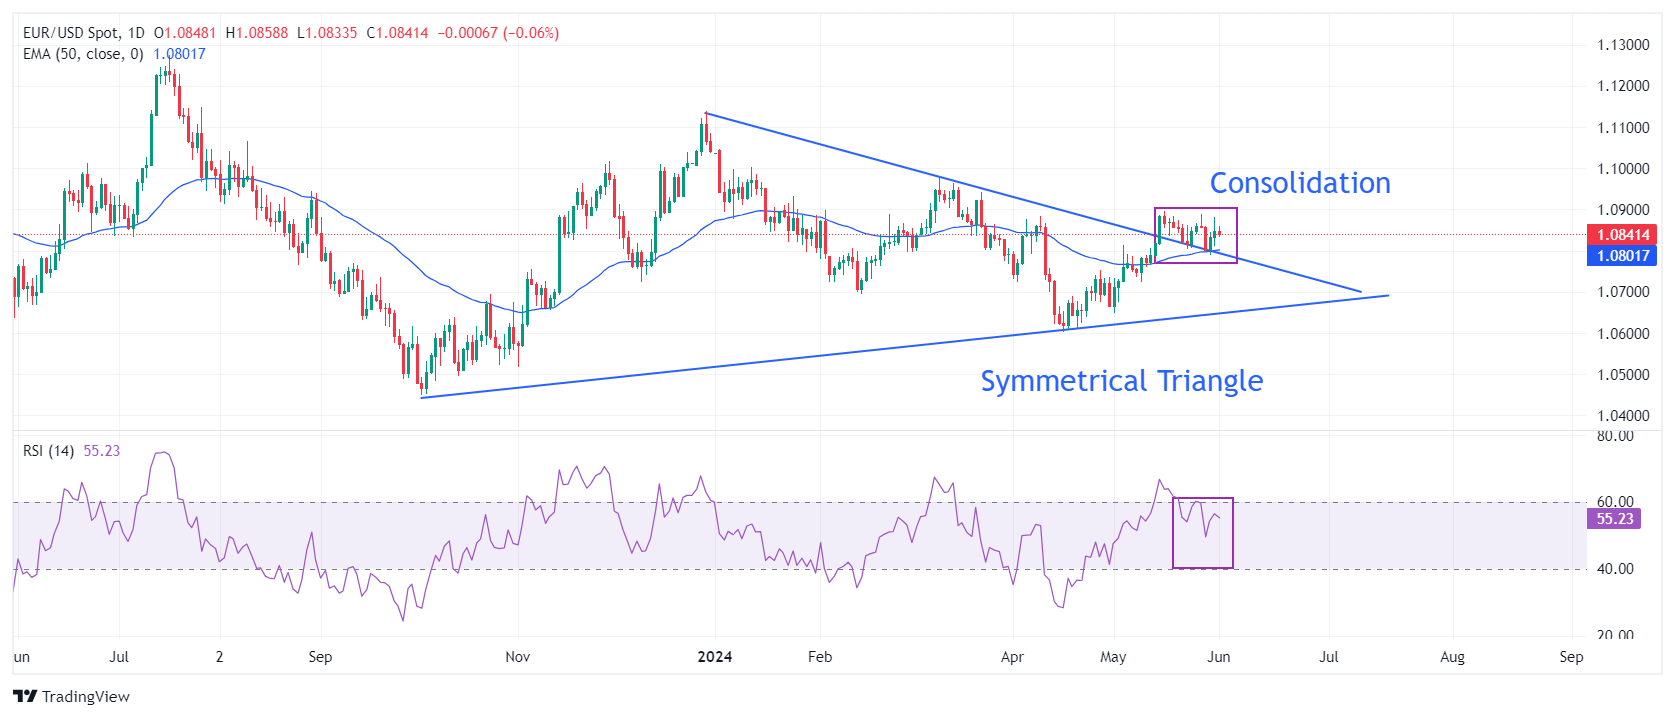
EUR/USD drops to 1.0835 after failing to hold strength above the crucial support of 1.0850. The major currency pair has been consolidating in a tight range of 1.0788-1.0900 in the last three weeks, suggesting a sharp volatility contraction. The asset holds the breakout move of the Symmetrical Triangle chart formation on a daily timeframe, indicating the upside bias is still intact.
The near-term outlook remains firm as the 50-day Exponential Moving Average (EMA) near 1.0800 is sloping higher.
The 14-period Relative Strength Index (RSI) has slipped into the 40.00-60.00 range, suggesting that the momentum, which was leaned toward the upside, has faded for now.
The major currency pair would strengthen if it recaptures a two-month high around 1.0900. A decisive break above this level would drive the asset towards the March 21 high, around 1.0950, and the psychological resistance of 1.1000. However, a downside move below the 200-day EMA at 1.0800 could push it further down.
Euro FAQs
The Euro is the currency for the 20 European Union countries that belong to the Eurozone. It is the second most heavily traded currency in the world behind the US Dollar. In 2022, it accounted for 31% of all foreign exchange transactions, with an average daily turnover of over $2.2 trillion a day. EUR/USD is the most heavily traded currency pair in the world, accounting for an estimated 30% off all transactions, followed by EUR/JPY (4%), EUR/GBP (3%) and EUR/AUD (2%).
The European Central Bank (ECB) in Frankfurt, Germany, is the reserve bank for the Eurozone. The ECB sets interest rates and manages monetary policy. The ECB’s primary mandate is to maintain price stability, which means either controlling inflation or stimulating growth. Its primary tool is the raising or lowering of interest rates. Relatively high interest rates – or the expectation of higher rates – will usually benefit the Euro and vice versa. The ECB Governing Council makes monetary policy decisions at meetings held eight times a year. Decisions are made by heads of the Eurozone national banks and six permanent members, including the President of the ECB, Christine Lagarde.
Eurozone inflation data, measured by the Harmonized Index of Consumer Prices (HICP), is an important econometric for the Euro. If inflation rises more than expected, especially if above the ECB’s 2% target, it obliges the ECB to raise interest rates to bring it back under control. Relatively high interest rates compared to its counterparts will usually benefit the Euro, as it makes the region more attractive as a place for global investors to park their money.
Data releases gauge the health of the economy and can impact on the Euro. Indicators such as GDP, Manufacturing and Services PMIs, employment, and consumer sentiment surveys can all influence the direction of the single currency. A strong economy is good for the Euro. Not only does it attract more foreign investment but it may encourage the ECB to put up interest rates, which will directly strengthen the Euro. Otherwise, if economic data is weak, the Euro is likely to fall. Economic data for the four largest economies in the euro area (Germany, France, Italy and Spain) are especially significant, as they account for 75% of the Eurozone’s economy.
Another significant data release for the Euro is the Trade Balance. This indicator measures the difference between what a country earns from its exports and what it spends on imports over a given period. If a country produces highly sought after exports then its currency will gain in value purely from the extra demand created from foreign buyers seeking to purchase these goods. Therefore, a positive net Trade Balance strengthens a currency and vice versa for a negative balance.
Silver prices (XAG/USD) fell on Monday, according to FXStreet data. Silver trades at $30.25 per troy ounce, down 0.53% from the $30.41 it cost on Friday.
Silver prices have increased by 18.77% since the beginning of the year.
| Unit measure | Today Price |
|---|---|
| Silver price per troy ounce | $30.25 |
| Silver price per gram | $0.97 |
The Gold/Silver ratio, which shows the number of troy ounces of Silver needed to equal the value of one troy ounce of Gold, stood at 76.88 on Monday, up from 76.53 on Friday.
Investors might use this ratio to determine the relative valuation of Gold and Silver. Some may consider a high ratio as an indicator that Silver is undervalued – or Gold is overvalued – and might buy Silver or sell Gold accordingly. Conversely, a low ratio might suggest that Gold is undervalued relative to Silver.
Silver FAQs
Silver is a precious metal highly traded among investors. It has been historically used as a store of value and a medium of exchange. Although less popular than Gold, traders may turn to Silver to diversify their investment portfolio, for its intrinsic value or as a potential hedge during high-inflation periods. Investors can buy physical Silver, in coins or in bars, or trade it through vehicles such as Exchange Traded Funds, which track its price on international markets.
Silver prices can move due to a wide range of factors. Geopolitical instability or fears of a deep recession can make Silver price escalate due to its safe-haven status, although to a lesser extent than Gold's. As a yieldless asset, Silver tends to rise with lower interest rates. Its moves also depend on how the US Dollar (USD) behaves as the asset is priced in dollars (XAG/USD). A strong Dollar tends to keep the price of Silver at bay, whereas a weaker Dollar is likely to propel prices up. Other factors such as investment demand, mining supply – Silver is much more abundant than Gold – and recycling rates can also affect prices.
Silver is widely used in industry, particularly in sectors such as electronics or solar energy, as it has one of the highest electric conductivity of all metals – more than Copper and Gold. A surge in demand can increase prices, while a decline tends to lower them. Dynamics in the US, Chinese and Indian economies can also contribute to price swings: for the US and particularly China, their big industrial sectors use Silver in various processes; in India, consumers’ demand for the precious metal for jewellery also plays a key role in setting prices.
Silver prices tend to follow Gold's moves. When Gold prices rise, Silver typically follows suit, as their status as safe-haven assets is similar. The Gold/Silver ratio, which shows the number of ounces of Silver needed to equal the value of one ounce of Gold, may help to determine the relative valuation between both metals. Some investors may consider a high ratio as an indicator that Silver is undervalued, or Gold is overvalued. On the contrary, a low ratio might suggest that Gold is undervalued relative to Silver.
(An automation tool was used in creating this post.)
Gold prices fell in India on Monday, according to data compiled by FXStreet.
The price for Gold stood at 6,216.10 Indian Rupees (INR) per gram, down INR 3.82 compared with the INR 6,219.92 it cost on Friday.
The price for Gold decreased to INR 72,503.40 per tola from INR 72,547.98 per tola.
| Unit measure | Gold Price in INR |
|---|---|
| 1 Gram | 6,216.10 |
| 10 Grams | 62,159.96 |
| Tola | 72,503.40 |
| Troy Ounce | 193,352.50 |
FXStreet calculates Gold prices in India by adapting international prices (USD/INR) to the local currency and measurement units. Prices are updated daily based on the market rates taken at the time of publication. Prices are just for reference and local rates could diverge slightly.
Global Market Movers: Comex Gold price struggles to lure buyers despite softer US Dollar
- The US inflation report was in line with estimates and reinforced expectations that the Federal Reserve will cut interest rates this year, which is undermining the US Dollar and acting as a tailwind for the Comex Gold price.
- The US Bureau of Economic Analysis (BEA) reported on Friday that the Personal Consumption Expenditures (PCE) Price Index rose 0.3% in April and held steady at 2.7% on a yearly basis, matching consensus estimates.
- The Core PCE Price Index, which excludes volatile food and energy prices, also matched expectations, and rose 2.8% on a yearly basis, while Personal Income and Personal Spending grew 0.3% and 0.2% respectively.
- The data lifts bets for an imminent Fed rate cut this year and leads to a further decline in the US Treasury bond yields, keeping the USD bulls on the defensive and lending support to the non-yielding yellow metal.
- Adding to this, tensions surrounding the Middle East turn out to be another factor limiting the downside for the safe-haven XAU/USD, though a generally positive tone around the equity markets should cap the upside.
- China's Caixin S&P Global Manufacturing Purchasing Managers' Index (PMI) rose to 51.7 in May from 51.4 previous and pointed to signs of stabilization in the world's second-largest economy, boosting investors' confidence.
- Furthermore, the latest optimism over a new ceasefire plan for Gaza announced by US President Joe Biden is holding back traders from placing aggressive bullish bets around the commodity.
- Market participants now look forward to the release of the final global Manufacturing PMI prints for short-term trading opportunities ahead of the US ISM Manufacturing PMI later during the day.
- Investors this week will also confront important US macro releases, including the NFP report and key central bank event risks – the BoC policy decision on Wednesday, followed by the ECB meeting on Thursday.
Gold FAQs
Gold has played a key role in human’s history as it has been widely used as a store of value and medium of exchange. Currently, apart from its shine and usage for jewelry, the precious metal is widely seen as a safe-haven asset, meaning that it is considered a good investment during turbulent times. Gold is also widely seen as a hedge against inflation and against depreciating currencies as it doesn’t rely on any specific issuer or government.
Central banks are the biggest Gold holders. In their aim to support their currencies in turbulent times, central banks tend to diversify their reserves and buy Gold to improve the perceived strength of the economy and the currency. High Gold reserves can be a source of trust for a country’s solvency. Central banks added 1,136 tonnes of Gold worth around $70 billion to their reserves in 2022, according to data from the World Gold Council. This is the highest yearly purchase since records began. Central banks from emerging economies such as China, India and Turkey are quickly increasing their Gold reserves.
Gold has an inverse correlation with the US Dollar and US Treasuries, which are both major reserve and safe-haven assets. When the Dollar depreciates, Gold tends to rise, enabling investors and central banks to diversify their assets in turbulent times. Gold is also inversely correlated with risk assets. A rally in the stock market tends to weaken Gold price, while sell-offs in riskier markets tend to favor the precious metal.
The price can move due to a wide range of factors. Geopolitical instability or fears of a deep recession can quickly make Gold price escalate due to its safe-haven status. As a yield-less asset, Gold tends to rise with lower interest rates, while higher cost of money usually weighs down on the yellow metal. Still, most moves depend on how the US Dollar (USD) behaves as the asset is priced in dollars (XAU/USD). A strong Dollar tends to keep the price of Gold controlled, whereas a weaker Dollar is likely to push Gold prices up.
(An automation tool was used in creating this post.)
- Silver price loses ground as Fed is expected to maintain higher rates for longer.
- Fed officials suggested maintaining a restrictive monetary policy is needed to achieve a 2% inflation target.
- Silver loses its appeal as Israeli Prime Minister Benjamin Netanyahu's administration accepts the US proposal for a Gaza cease-fire.
Silver price extends losses to near $30.20 per troy ounce during the European trading session on Monday. The prices of the grey metal depreciated after the US Personal Consumption Expenditure (PCE) data was released on Friday. This inflation report indicated that price pressures eased in April.
The Federal Reserve (Fed) may need more time to meet its 2% inflation target since the mixed inflation statistics did not lead to a mood of a rate cut from the central bank. Higher interest rates are having a detrimental effect on non-yielding assets such as silver.
Furthermore, Federal Reserve (Fed) representatives conveyed last week that the central bank may continue its tight policy for a longer duration in order to meet its inflation target. In an interview with Fox Business, Atlanta Fed President Raphael Bostic stated that the Fed must continue to take a restrictive position and that the inflation forecast will decrease very gradually. New York Fed President John Williams also said that while inflation is currently too high, he thinks the present Fed policy is well-positioned to gradually return price increases to the Fed's target.
The safe-haven Silver weakens as investors might move toward other riskier assets after Israeli Prime Minister Benjamin Netanyahu's administration reluctantly accepted US President Joe Biden's proposal for a Gaza cease-fire on Sunday. According to the BBC, this decision was made in the midst of continuous attacks in Rafah as a result of strong Israeli bombings over the weekend.
- The Mexican Peso weakens after the news that Claudia Sheinbaum has won the Mexican presidential election.
- Sheinbaum is likely to be more “disciplined” than her predecessor but continue his generous welfare programmes, say analysts.
- Her plans to raise the minimum wage are likely to drive growth and consumer spending but could increase inflation, economists say.
The Mexican Peso (MXN) edges lower in its key pairs on Monday after the news that Claudia Sheinbaum is set to win the Mexican presidential election with a comfortable majority. Sheinbaum is expected to continue the legacy of her predecessor, mentor and fellow Morena party colleague, Andrés Manuel López Obrador.
Asian stock markets have mostly had a positive session, maintaining the good mood of the US markets at the end of last week. Chinese Caixin Manufacturing PMI data for May released on Monday beat expectations, showing further expansion in the sector. Despite MXN falling, a positive market mood is generally supportive of the Mexican Peso.
USD/MXN is exchanging hands at 17.05 at the time of writing, EUR/MXN is trading at 18.51 and GBP/MXN at 21.71.
Mexican Peso weakness after Sheinbaum wins presidential election
The Mexican election was held on Sunday, and a quick count by the National Electoral Institute shows Sheinbaum leading with 58.3%-60.7% of the vote – an unassailable lead, according to Associated Press (AP) News.
Andrés Manuel López Obrador, the current incumbent, posted a video on X on Monday morning congratulating Sheinbaum on winning, saying today is “a day of glory” for all the people of Mexico, according to Aljazeera News. Sheinbaum will be the first female president to be elected in the country.
Whilst on the campaign trail, Sheinbaum often repeated she will continue with most of Obrador’s social policies, including his generous welfare programme. She has also pledged to increase the minimum wage by circa 11%. According to economists, this is likely to boost consumer spending, a key driver of growth in recent quarters.
From a monetary perspective, however, it could make it difficult for the Banco de México (Banxico) to bring down inflation, says Kimberley Sperrfechter, Emerging Markets Economist at Capital Economics.
Greater discipline
Analysts say that Sheibaum may bring more order and discipline to the office than Obrador, because of her more quantitative and scientific background.
“She describes herself as someone who loves data, who makes decisions and implements policies based on data and that’s certainly in contrast to Lopez Obrador. She is someone who has an environmental science and engineering background. She has spoken about the need for Mexico to lead more in multilateral spaces on the climate emergency. She’s someone who, despite endorsing militarisation, did strengthen and take action on the civilian police in Mexico City as mayor here. So there’s reason to think that there could be some differences, but the jury is still out,” according to Stephanie Brewer, director for Mexico at the Washington Office of Latin America (WOLA).
Mexican Peso slowed its decline after US core PCE miss
The Mexican Peso stopped leaking lower against the US Dollar (USD) on Friday after US core Personal Consumption Expenditures (PCE) data for April missed expectations on a monthly basis, coming out at 0.2% rather than the 0.3% forecast.
PCE is the Federal Reserve’s preferred gauge of inflation so it tends to have an outsized impact on interest-rate expectations and USD pairs – the data weighed on the USD/MXN.
Technical Analysis: USD/MXN forms triangle within uptrend
USD/MXN – or the number of Pesos that can be bought with one US Dollar – forms a triangle price pattern within a short-term uptrend. It is unclear whether the triangle is symmetrical or right-angled, and so it is slightly biased to break out higher in line with the dominant short-term uptrend, rather than lower, as would be the case if it were clearly of the right-angled variety.
Overall, given that “the trend is your friend”, the odds favor a continuation higher in the short-term.
USD/MXN 4-hour Chart
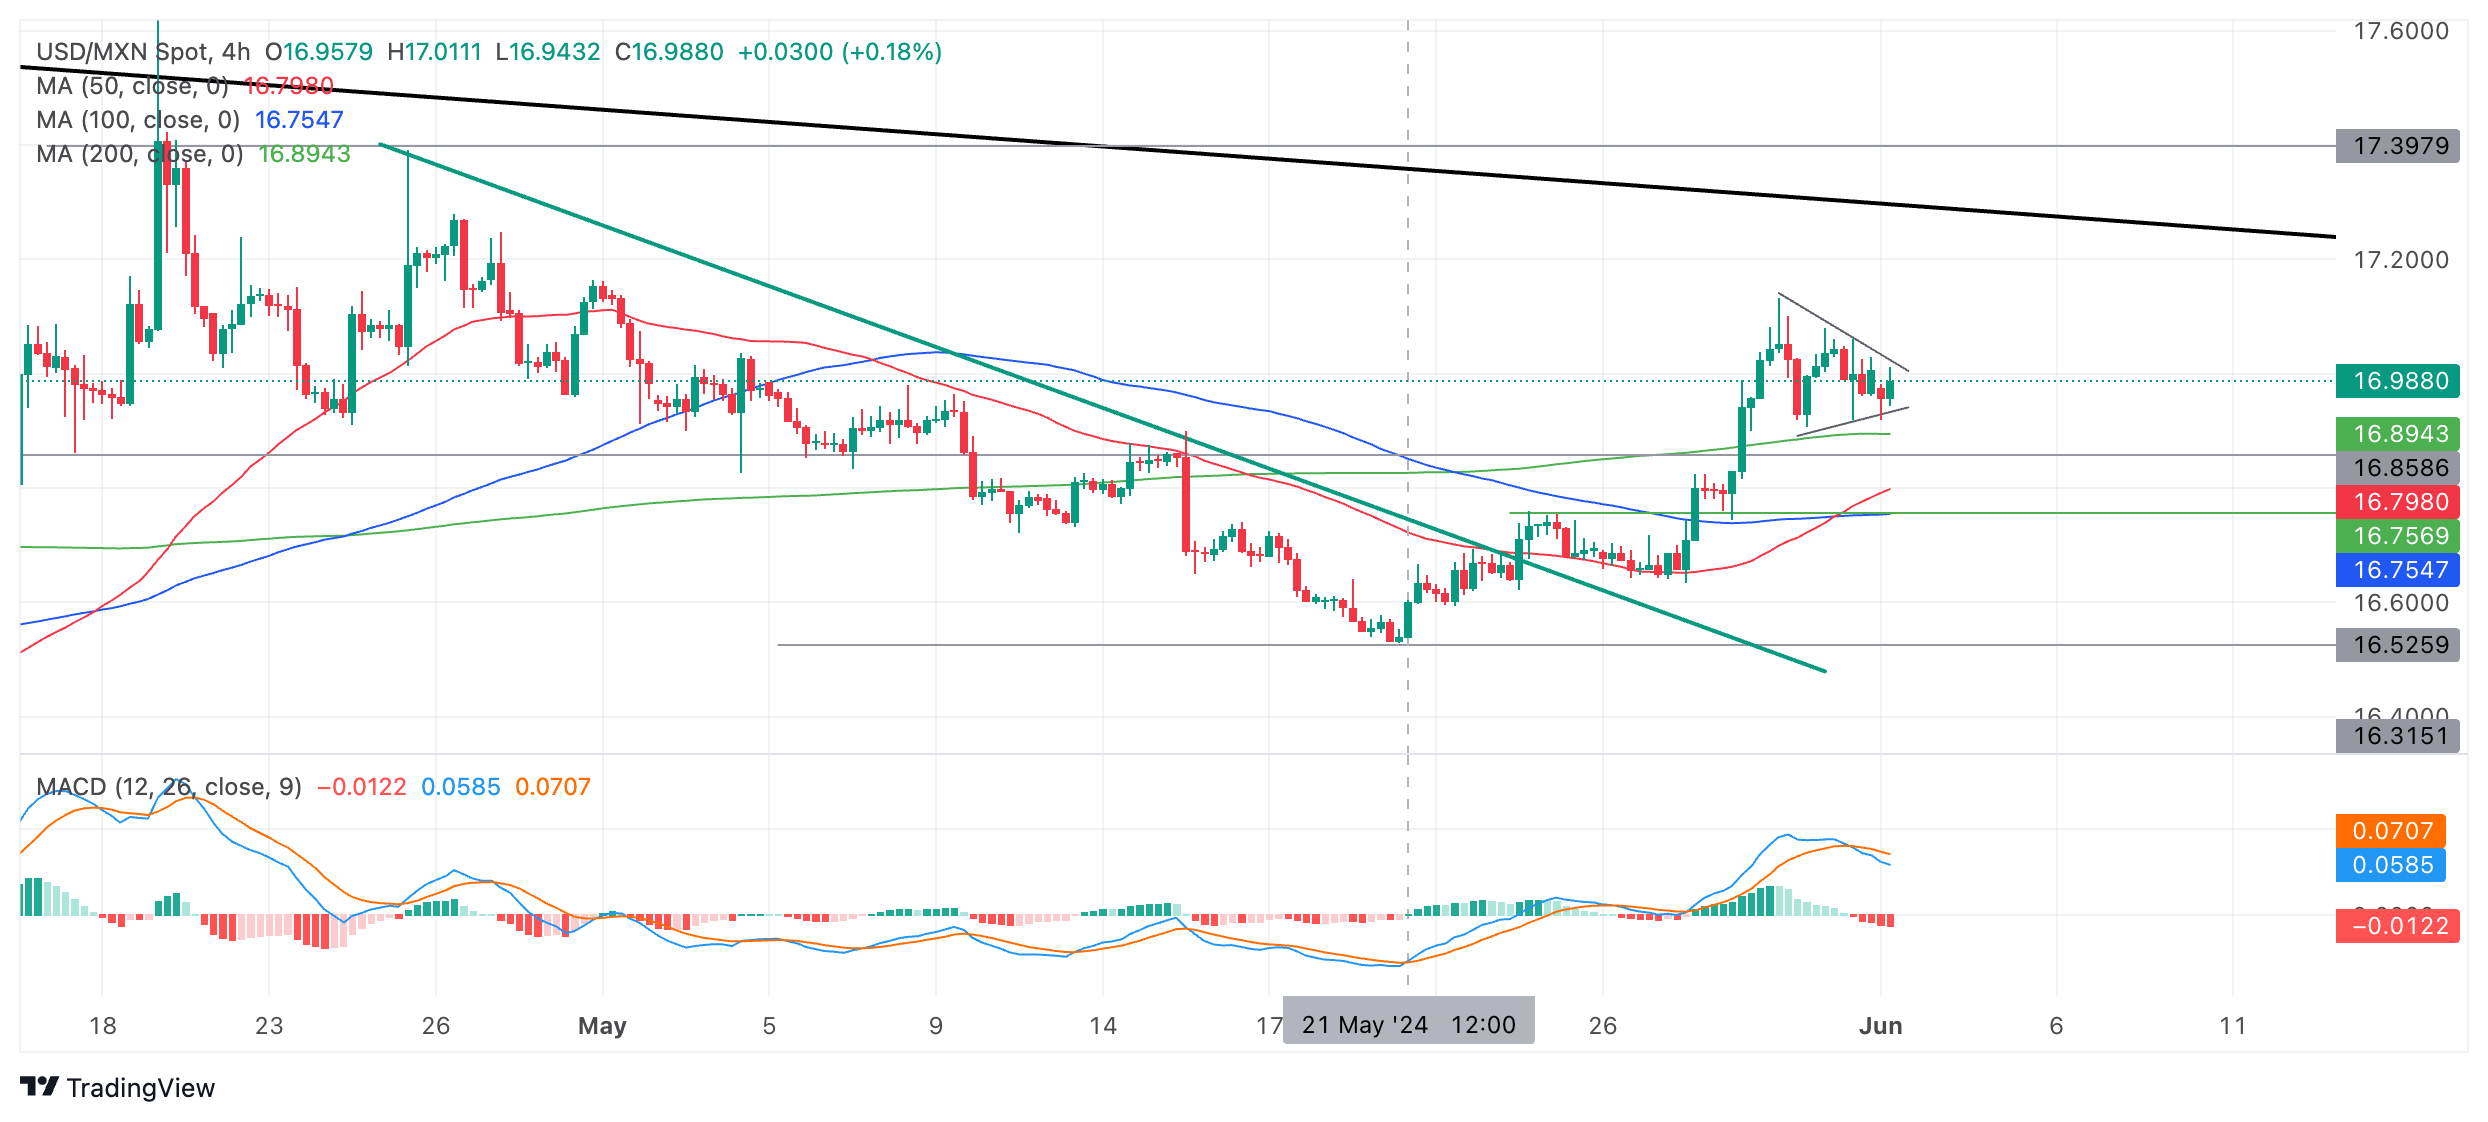
USD/MXN could rise up to a major trendline (black) situated at around 17.25. A break above the May 30 high at 17.13 would probably confirm an extension towards the trendline target.
The medium and long-term trends remain bearish, however, raising the prospect of a reversal lower once the short-term uptrend runs out of steam. However, there are no signs of this happening yet, so the uptrend is likely to continue. A decisive break above the major trendline would solidify the bullish case and indicate a bullish reversal in the medium-term time frame as well.
A decisive break would be one accompanied by a long green bar that closed near its high or three consecutive green bars in a row.
Mexican Peso FAQs
The Mexican Peso (MXN) is the most traded currency among its Latin American peers. Its value is broadly determined by the performance of the Mexican economy, the country’s central bank’s policy, the amount of foreign investment in the country and even the levels of remittances sent by Mexicans who live abroad, particularly in the United States. Geopolitical trends can also move MXN: for example, the process of nearshoring – or the decision by some firms to relocate manufacturing capacity and supply chains closer to their home countries – is also seen as a catalyst for the Mexican currency as the country is considered a key manufacturing hub in the American continent. Another catalyst for MXN is Oil prices as Mexico is a key exporter of the commodity.
The main objective of Mexico’s central bank, also known as Banxico, is to maintain inflation at low and stable levels (at or close to its target of 3%, the midpoint in a tolerance band of between 2% and 4%). To this end, the bank sets an appropriate level of interest rates. When inflation is too high, Banxico will attempt to tame it by raising interest rates, making it more expensive for households and businesses to borrow money, thus cooling demand and the overall economy. Higher interest rates are generally positive for the Mexican Peso (MXN) as they lead to higher yields, making the country a more attractive place for investors. On the contrary, lower interest rates tend to weaken MXN.
Macroeconomic data releases are key to assess the state of the economy and can have an impact on the Mexican Peso (MXN) valuation. A strong Mexican economy, based on high economic growth, low unemployment and high confidence is good for MXN. Not only does it attract more foreign investment but it may encourage the Bank of Mexico (Banxico) to increase interest rates, particularly if this strength comes together with elevated inflation. However, if economic data is weak, MXN is likely to depreciate.
As an emerging-market currency, the Mexican Peso (MXN) tends to strive during risk-on periods, or when investors perceive that broader market risks are low and thus are eager to engage with investments that carry a higher risk. Conversely, MXN tends to weaken at times of market turbulence or economic uncertainty as investors tend to sell higher-risk assets and flee to the more-stable safe havens.
Here is what you need to know on Monday, June 3:
Following the previous week's choppy action, financial markets remain subdued on the first trading day of June. S&P Global will release revisions to May Manufacturing PMI data for Germany, the Eurozone, the UK and the US on Monday. Later in the session, the ISM Manufacturing PMI report will be featured in the US economic docket, alongside Construction Spending data for April.
The US Bureau of Economic Analysis reported on Friday that inflation in the US, as measured by the change in the Personal Consumption Expenditures (PCE) Price Index, rose 2.7% on a yearly basis in April, matching March's increase and the market expectation. In the same period, the core PCE Price Index increased 2.8% as forecast. The US Dollar (USD) struggled to preserve its strength following the PCE inflation data. After registering small losses for the week, the USD Index holds steady above 104.50 in the European morning on Monday. Meanwhile, US stock index futures trade in positive territory at the beginning of the week.
US Dollar PRICE Last 7 days
The table below shows the percentage change of US Dollar (USD) against listed major currencies last 7 days. US Dollar was the strongest against the Japanese Yen.
| USD | EUR | GBP | JPY | CAD | AUD | NZD | CHF | |
|---|---|---|---|---|---|---|---|---|
| USD | -0.02% | 0.08% | 0.13% | -0.12% | -0.17% | -0.36% | -1.28% | |
| EUR | 0.02% | 0.07% | 0.19% | -0.08% | -0.22% | -0.43% | -1.23% | |
| GBP | -0.08% | -0.07% | 0.06% | -0.19% | -0.28% | -0.44% | -1.33% | |
| JPY | -0.13% | -0.19% | -0.06% | -0.30% | -0.32% | -0.41% | -1.43% | |
| CAD | 0.12% | 0.08% | 0.19% | 0.30% | -0.07% | -0.24% | -1.21% | |
| AUD | 0.17% | 0.22% | 0.28% | 0.32% | 0.07% | -0.14% | -1.08% | |
| NZD | 0.36% | 0.43% | 0.44% | 0.41% | 0.24% | 0.14% | -0.93% | |
| CHF | 1.28% | 1.23% | 1.33% | 1.43% | 1.21% | 1.08% | 0.93% |
The heat map shows percentage changes of major currencies against each other. The base currency is picked from the left column, while the quote currency is picked from the top row. For example, if you pick the US Dollar from the left column and move along the horizontal line to the Japanese Yen, the percentage change displayed in the box will represent USD (base)/JPY (quote).
Stock Market Today: Nifty opens at record highs, cheers a likely PM Modi third term.
EUR/USD edged higher on Friday and closed the week virtually unchanged. The pair holds steady at around 1.0850 to start the European session.
GBP/USD failed to make a decisive move in either direction in the previous week. The pair fluctuates in a narrow channel slightly below 1.2750 early Monday.
Bank of Japan (BoJ) Executive Director Takashi Kato said on Monday that the BoJ has no plans to immediately unload its exchange traded funds (ETF) holdings. USD/JPY ignored those comments and was last seen trading flat on the day near 157.30.
The data from China showed that Caixin Manufacturing PMI edged higher to 51.7 in May from 51.4 in April. This reading came in slightly better than the market expectation of 51.5. AUD/USD showed no reaction to this data and was last seen trading marginally lower on the day at 0.6640.
Australian Dollar remains flat, while US Dollar improves ahead of ISM PMI.
Gold spent the previous week moving up and down in a narrow channel. XAU/USD continues to move sideways above $2,320 to start the new week.
Economic Indicator
ISM Manufacturing PMI
The Institute for Supply Management (ISM) Manufacturing Purchasing Managers Index (PMI), released on a monthly basis, is a leading indicator gauging business activity in the US manufacturing sector. The indicator is obtained from a survey of manufacturing supply executives based on information they have collected within their respective organizations. Survey responses reflect the change, if any, in the current month compared to the previous month. A reading above 50 indicates that the manufacturing economy is generally expanding, a bullish sign for the US Dollar (USD). A reading below 50 signals that factory activity is generally declining, which is seen as bearish for USD.
Read more.Last release: Wed May 01, 2024 14:00
Frequency: Monthly
Actual: 49.2
Consensus: 50
Previous: 50.3
Source: Institute for Supply Management
The Institute for Supply Management’s (ISM) Manufacturing Purchasing Managers Index (PMI) provides a reliable outlook on the state of the US manufacturing sector. A reading above 50 suggests that the business activity expanded during the survey period and vice versa. PMIs are considered to be leading indicators and could signal a shift in the economic cycle. Stronger-than-expected prints usually have a positive impact on the USD. In addition to the headline PMI, the Employment Index and the Prices Paid Index numbers are watched closely as they shine a light on the labour market and inflation.
- The Pound Sterling trades broadly unchanged near 1.2750 ahead of a US data-packed week.
- UK’s stubborn service inflation keeps the uncertainty about the timing of BoE rate cuts.
- Investors await the US ISM Manufacturing PMI data for fresh guidance.
The Pound Sterling (GBP) trades lacklustre in Monday’s London session but holds the crucial support of 1.2700 against the US Dollar (USD). The GBP/USD pair turns sideways at the beginning of a data-packed week in the United States (US), which will kick off with the Institute for Supply Management (ISM) Manufacturing Purchasing Managers Index (PMI) data for May, to be published at 14:00 GMT.
Economists expect the PMI, which gauges factory activity, to rise to 49.8 from the prior reading of 49.2 but to remain below the 50.0 threshold that separates expansion from contraction. However, the preliminary S&P Global PMI report for May – another survey that also gauges activity in the US manufacturing sector – showed that the PMI rose to a two-month high at 50.9 from April’s reading of 50.0.
In the PMI report, investors will also focus on other subcomponents, such as the New Orders and Price Paid indexes, as they give insights into the demand outlook and change in input prices of the manufacturing sector. Analysts take both indexes as good leading indicators of upcoming inflation pressures.
Later this week, investors will keenly watch the US ISM Services PMI and the official Employment data to be published on Wednesday and Friday, respectively. Meanwhile, there aren’t any top-tier events in the United Kingdom (UK) economic calendar.
Daily digest market movers: Pound Sterling trades back and forth ahead of Manufacturing PMI
- The Pound Sterling exhibits little movement against the US Dollar. The US Dollar Index (DXY), which tracks the Greenback’s value against six major currencies, also exhibits a mute performance of around 104.60.
- The US Dollar struggles for direction as investors look for fresh cues about when the Fed will start reducing interest rates. Investors remain uncertain about the timing after the US Personal Consumption Expenditure Price Index (PCE) report showed on Friday that price pressures remained elevated in April. Still, the report also showed weak Personal Spending data.
- Annual core PCE inflation, the Fed’s preferred inflation measure, grew expectedly by 2.8%. On a month-on-month basis, the underlying data grew by 0.2%, missing estimates and less than the prior reading of 0.3%.
- Personal Spending rose at a slower pace of 0.2% in April, less than estimates of 0.3% and the former release of 0.7%. A significant deceleration in consumer spending, which accounts for more than two-thirds of US economic activity, raised concerns over a deepening household crisis due to the Fed maintaining interest rates higher for a longer period.
- After weak consumer spending data, investors have become slightly more confident that the Fed will cut interest rates at least once this year. The CME FedWatch tool shows that the probability of a rate cut in the September meeting has increased to 52% from 49% a week ago.
- In the UK, investors remain uncertain about the Bank of England’s (BoE) rate-cut time frame. Financial markets expect that the BoE could start reducing interest rates from the August meeting. UK annual headline inflation has come down significantly to 2.3% in April but BoE policymakers remain worried about slower progress in the service disinflation process. UK service inflation is at 5.9%, broadly driven by wage growth, is much higher than what is needed to ensure that inflation will return to the desired rate of 2%.
- Meanwhile, UK inflation expectations for the next 12 months have dropped significantly. A monthly Citi/YouGov survey showed that public expectations for next year decelerated to 3.1% in May, which is the lowest level since July 2021.
Technical Analysis: Pound Sterling stays sideways near 1.2750
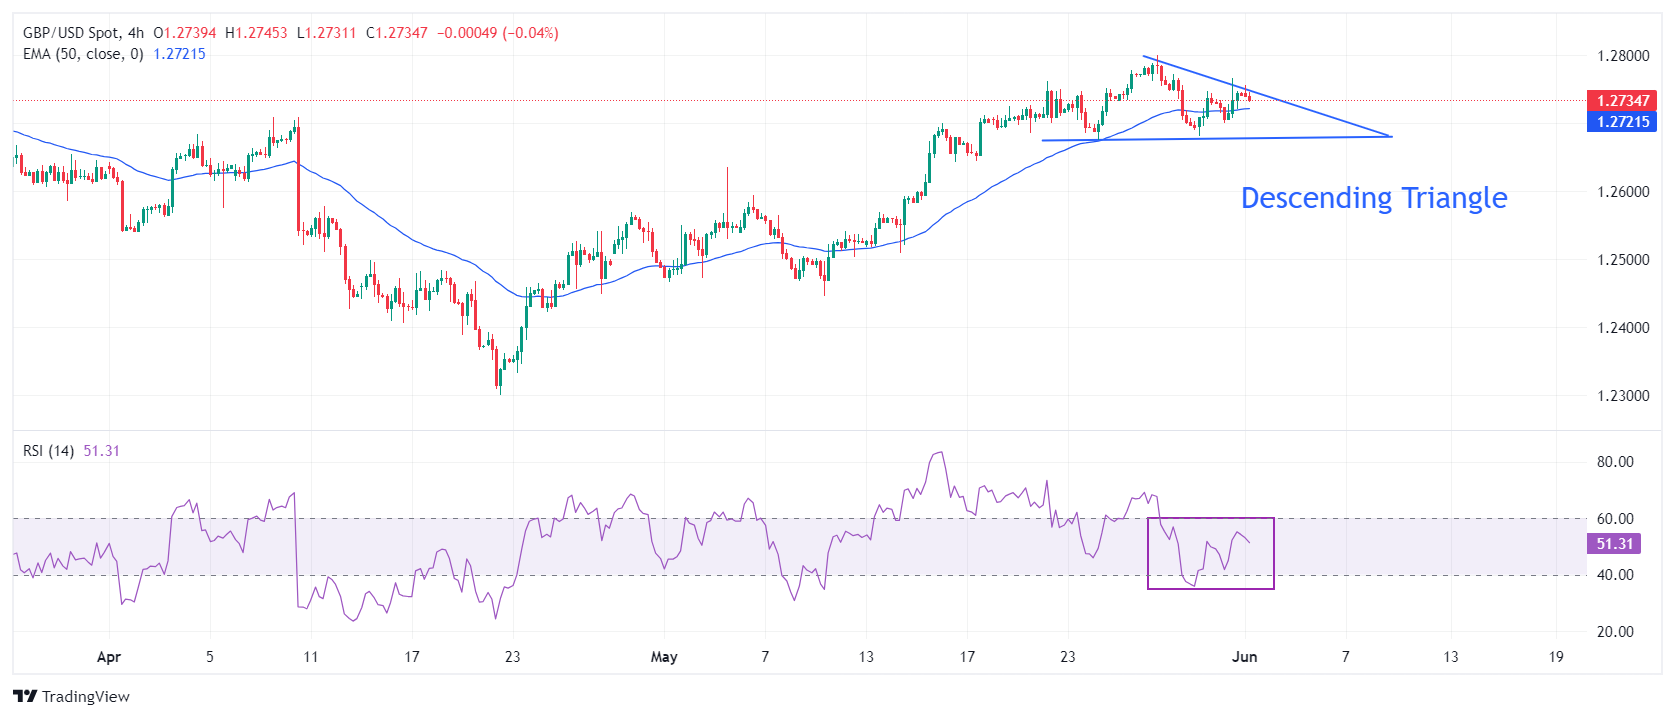
The Pound Sterling trades sideways near 1.2750. The GBP/USD pair exhibits a sharp volatility contraction as it trades in a Descending Triangle formation in the 4-hour time frame. The downward-sloping border of the above-mentioned chart pattern is plotted from May 28 high near 1.2800, while the horizontal support is marked from May 24 low at 1.2676.
The 50-day Exponential Moving Average (EMA) trades closely to the spot price near 1.2720, suggesting a sideways trend.
Meanwhile, the 14-period Relative Strength Index (RSI) oscillates in the 40.00-60.00 range, indicating indecisiveness among market participants.
Pound Sterling FAQs
The Pound Sterling (GBP) is the oldest currency in the world (886 AD) and the official currency of the United Kingdom. It is the fourth most traded unit for foreign exchange (FX) in the world, accounting for 12% of all transactions, averaging $630 billion a day, according to 2022 data. Its key trading pairs are GBP/USD, aka ‘Cable’, which accounts for 11% of FX, GBP/JPY, or the ‘Dragon’ as it is known by traders (3%), and EUR/GBP (2%). The Pound Sterling is issued by the Bank of England (BoE).
The single most important factor influencing the value of the Pound Sterling is monetary policy decided by the Bank of England. The BoE bases its decisions on whether it has achieved its primary goal of “price stability” – a steady inflation rate of around 2%. Its primary tool for achieving this is the adjustment of interest rates. When inflation is too high, the BoE will try to rein it in by raising interest rates, making it more expensive for people and businesses to access credit. This is generally positive for GBP, as higher interest rates make the UK a more attractive place for global investors to park their money. When inflation falls too low it is a sign economic growth is slowing. In this scenario, the BoE will consider lowering interest rates to cheapen credit so businesses will borrow more to invest in growth-generating projects.
Data releases gauge the health of the economy and can impact the value of the Pound Sterling. Indicators such as GDP, Manufacturing and Services PMIs, and employment can all influence the direction of the GBP. A strong economy is good for Sterling. Not only does it attract more foreign investment but it may encourage the BoE to put up interest rates, which will directly strengthen GBP. Otherwise, if economic data is weak, the Pound Sterling is likely to fall.
Another significant data release for the Pound Sterling is the Trade Balance. This indicator measures the difference between what a country earns from its exports and what it spends on imports over a given period. If a country produces highly sought-after exports, its currency will benefit purely from the extra demand created from foreign buyers seeking to purchase these goods. Therefore, a positive net Trade Balance strengthens a currency and vice versa for a negative balance.
- USD/CHF weakens to 0.9020 in Monday’s early European session.
- Traders raised their bets on the Fed rate in September after the recent US PCE data for April.
- The Swiss Real Retail Sales rose to 2.7% YoY in April, compared to -0.2% in March.
The USD/CHF pair extends the decline around 0.9020 during the early European trading hours on Monday. The softer US dollar (USD) after the US Personal Consumption Expenditures (PCE) Price Index inflation data drags the pair lower. Switzerland’s Consumer Price Index for May will be the highlight on Tuesday ahead of the US employment data.
The uncertainties over the timing of the US Federal Reserve's (Fed) interest rate cut weigh on the US Dollar (USD) after the recent PCE report showed that US inflation remained steady in April. The headline US PCE rose 0.3% MoM in April, matching the unrevised gain in March, the Commerce Department reported on Friday.
Additionally, the Core PCE, the Fed's preferred inflation gauge, rose 0.2% MoM in April, compared to a 0.3% gain in March. The core PCE price index climbed 2.8% on a yearly basis, matching the expectation. Investors have priced in nearly a 53% possibility of a Fed rate cut in September, an increase from 49% before the inflation report. Traders will watch the US ISM Manufacturing PMI for fresh impetus, which is expected to improve to 49.8 in May from 49.2 in April. In case of a stronger-than-expected outcome, this might dampen the expectation of the Federal Reserve (Fed) rate cut this year and cap the downside for the Greenback.
On Friday, the Swiss Real Retail Sales improved to 2.7% YoY in April from a decline of 0.2% in March. The figure came in better than the estimation and supported the Swiss Franc (CHF) against its rivals. Apart from this, investors will closely watch the development surrounding Middle East geopolitical tensions. The BBC reported that Israeli Prime Minister Benjamin Netanyahu's administration reluctantly agreed to President Biden's proposal for a Gaza cease-fire on Sunday. Any signals of rising concerns might further lift safe-haven currencies like the CHF.
FX option expiries for June 3 NY cut at 10:00 Eastern Time, via DTCC, can be found below
- EUR/USD: EUR amounts
- 1.0805 1.4b
- 1.0850 585m
- 1.0860 650m
- 1.0870 1.4b
- 1.0900 585m
- USD/JPY: USD amounts
- 157.00 932m
- 158.00 861m
- AUD/USD: AUD amounts
- 0.6625 540m
- USD/CAD: USD amounts
- 1.3520 545m
- The EUR/USD pair could retest the upper boundary of the ascending triangle, followed by a key level of 1.0900.
- Based on a technical analysis of the daily chart, there appears to be a bullish bias for the pair.
- Immediate support is observed at the 21-day EMA at 1.0819, followed by the psychological level of 1.0800.
EUR/USD extends its gains for the third straight day, trading around 1.0850 during the Asian session on Monday. A technical analysis of a daily chart suggests a bullish bias for the pair, as it moves upward within the ascending triangle. Additionally, the momentum indicator 14-day Relative Strength Index (RSI) is positioned above the 50 level, confirming a bullish bias.
The EUR/USD pair could retest the upper boundary of the ascending triangle, followed by the psychological level of 1.0900. A breakthrough above the latter could support the pair to explore the region around March’s high of 1.0981.
On the downside, immediate support is seen at the 21-day Exponential Moving Average (EMA) at 1.0819, followed by the psychological level of 1.0800 nearing the lower threshold of the ascending triangle.
If the EUR/USD pair breaks below the lower boundary of the ascending triangle, it could face downward pressure, potentially descending toward the vicinity of the notable level of 1.0700. Additional support is likely to be found at the throwback support level around 1.0601.
EUR/USD: Daily Chart
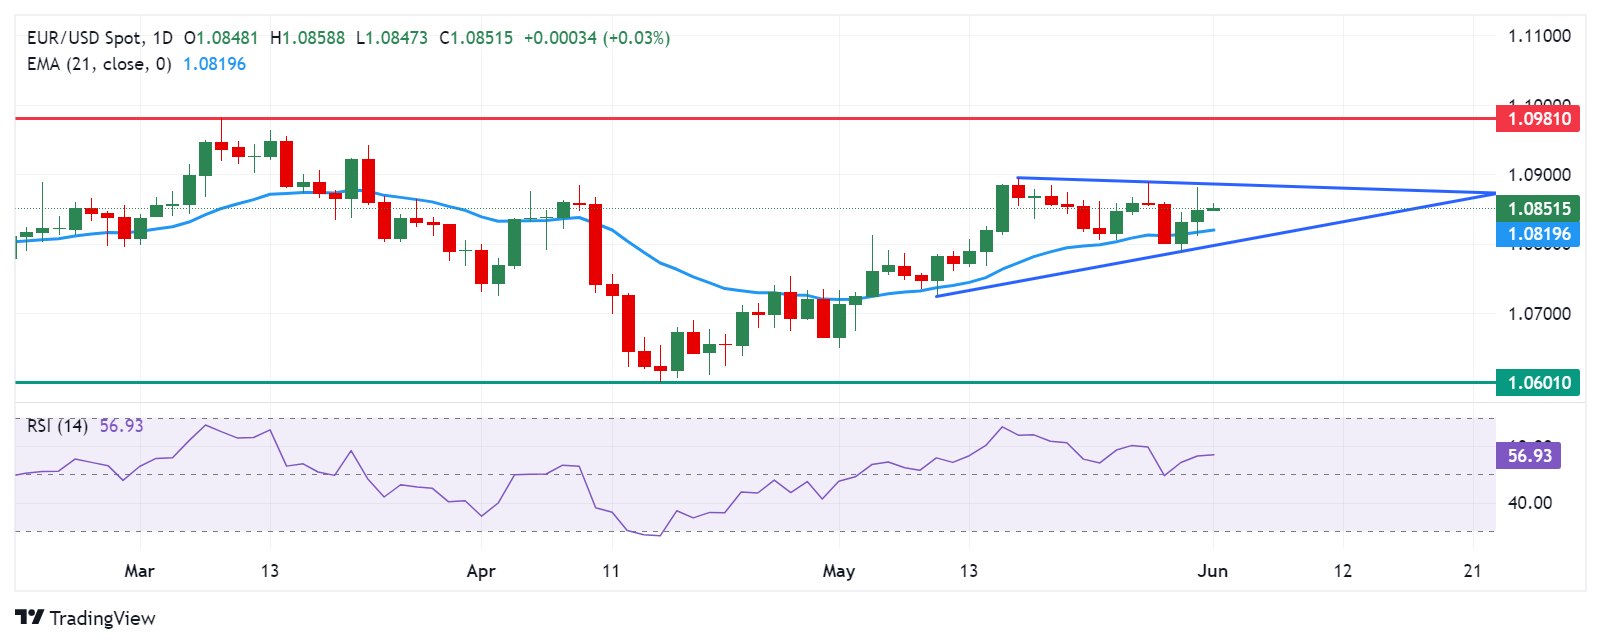
- USD/CAD edges lower to 1.3625 in Monday’s early European session.
- The US PCE increased 0.3% MoM in April, in line with the consensus.
- Canadian economy grew at a slower-than-expected pace in Q1, boosting expectations for the first rate cut by the BoC.
The USD/CAD pair trades with a mild bearish bias around 1.3625 during the early European session on Monday. The downtick of the pair is backed by the weaker US Dollar (USD) after the release of the US Personal Consumption Expenditures (PCE) Price Index. Investors will take more cues from the Canadian S&P Global Manufacturing PMI and US ISM Manufacturing PMI for May, which are due later on Monday.
The US inflation remained steady in April, prompting the expectation that the Federal Reserve (Fed) will cut interest rates later in the year and drag the Greenback lower. The Commerce Department showed on Friday that the US PCE increased 0.3% MoM in April, matching the unrevised gain in March. Meanwhile, the Core PCE, excluding the volatile food and energy, rose 0.2% MoM in April, compared to a 0.3% gain in March. On an annual basis, the core PCE price index climbed 2.8% for the third consecutive month. The markets are now pricing in nearly a 53% odds of Fed rate cut in September, up from 49% before the inflation report.
On the Loonie front, the weaker Canadian Gross Domestic Product (GDP) for the first quarter triggered the first interest rate cut by the Bank of Canada (BoC) on Wednesday. The Canadian economy expanded at an annualized rate of 1.7%, missing the estimation of 2.2% expansion and the central bank's 2.8% forecast. Apart from the downbeat GDP data that weighs on the Canadian Dollar (CAD). The CAD is pressured by the decline of crude oil prices as Canada is the largest oil exporter to the United States.
- NZD/USD consolidates around 0.6150 with a focus on US Manufacturing PMI.
- China’s upbeat Manufacturing PMI data improves global economic outlook.
- The Fed is less-likely to start reducing interest rates from the September meeting.
The NZD/USD pair is stuck in a tight range near 0.6150 in Monday’s Asian session. The Kiwi asset trades inside Friday’s trading range, suggesting indecisiveness among market participants ahead of a busy United States (US) data-packed week.
S&P 500 futures have posted significant gains in the Asian session, exhibiting investors' strong risk appetite. The US Dollar Index (DXY), which tracks the Greenback’s value against six major currencies, demonstrates a subdued performance around 104.60. 10-year US Treasury Yields declined to 4.49% even though uncertainty over the Federal Reserve (Fed) pivoting to policy normalization has deepened.
Strong appeal for risk-perceived assets is majorly driven by upbeat Caixin Manufacturing PMI data for May. The IHS Markit reported that factory activity in the world’s second-largest economy rose at a faster pace to 51.7 from the consensus of 51.5 and the prior reading of 51.4. This has improved global economic prospects.
This has also improved the New Zealand Dollar’s appeal. The NZ economy is one of China's leading trading partners, and the latter’s strong economic outlook improves the Kiwi dollar’s prospects.
Doubts over the Fed beginning to reduce interest rates from their current levels in September deepened after the US Personal Consumption Expenditure Price Index (PCE) report for August showed that price pressures were stubbornly elevated. The core PCE inflation, which strips off volatile food and energy items and is the Fed’s preferred inflation gauge, grew steadily by 2.8%. However, on a month-on-month basis, the underlying inflation data rose at a slower pace of 0.2% from the estimates and the former reading of 0.3%. The growth rate was consistent with the pace required for inflation to sustainably return to the 2% target.
In today’s session, investors will shift focus to the US ISM Manufacturing PMI data for May, which will be published at 14:00 GMT. The PMI is estimated to have improved to 49.8 from the former reading of 49.2. However, a figure below the 50.0 threshold is considered a contraction.
- India’s Nifty rebounded to open at record highs on Monday.
- Exit polls point to a stronger return for the PM Modi-led BJP government.
- All eyes remain on the June 4 India’s general election outcome.
Nifty 50, India’s key benchmark index, firmed up to hit a new record high above 23,300 at the open on Monday, snapping the previous week’s 2% decline.
Nifty recorded its biggest jump in four years during the market opening.
A potential win, with a majority, for the Bharatiya Janata Party (BJP)-led Prime Minister Narendra Modi’s government ramped up the optimism on the Indian stock market.
The National Stock Exchange (NSE) Nifty 50 is up 2.62% on the day, trading near 23,120, as of writing.
Stock market news
- Early gainers on Nifty are Adani Ports, Adani Enterprises, Powergrid, NTPC and Shriram Finance. Meanwhile, the main laggards in early dealings are Eicher Motors and LTiMindtree.
- Exit polls over the weekend predicted that PM Modi will retain power for a third straight term, with BJP-led NDA winning anywhere between 350-401 seats.
- The Indian rupee opened 47 paise higher, which was a near three-month high for the currency.
- Markets also cheer upbeat Chinese Caixin Manufacturing PMI, which improved from 51.4 in April to 51.7 in May, beating the estimates of 51.5.
- Last week, India’s economy grew by 8.2% in the fiscal year ended March 2024, sharply higher than 7% expansion recorded in the previous year, led by a robust performance of manufacturing and construction sectors, per Reuters.
- All eyes remain on the results of the 2024 India’s general election due on Tuesday and the Reserve Bank of India’s (RBI) monetary policy announcements on June 7 for fresh trading impulse.
Nifty 50 FAQs
The Nifty 50, or simply Nifty, is the most commonly followed stock index in India. It was launched in 1996 by the National Stock Exchange of India (NSE). It plots the weighted average share price of 50 of the largest Indian corporations, offering investors comprehensive exposure to 13 sectors of the economy. Each corporation's weighting is based on its "free-float capitalization", or the value of all its shares readily available for trading.
The Nifty is a composite so its value is dependent on the performance of the companies that make up the index, as revealed in their quarterly and annual results. Another factor is government policies, such as when in 2016 the government decided to demonetize 500 and 1000 Rupee banknotes. This led to a temporary cash shortage which negatively impacted the Nifty. The level of interest rates set by the Reserve Bank of India is a further factor as it determines the cost of borrowing. Climate change, pandemics and natural disasters are also drivers.
The Nifty 50 was launched on April 22, 1996 at a base level of 1,000. Its highest recorded level to date is 22,097 achieved on January 15, 2024 (this is being written in Feb 2024). The index first closed above the 10,000 level on October 17, 2017. The Nifty recorded its biggest daily decline on March 23, 2020 during the Covid pandemic, when it fell 1,125 points or 12.37%. The Nifty’s biggest gain in a single day occurred on May 18, 2009, when it rose 651 points after the results of the Indian elections.
Major corporations in the Nifty 50 include HDFC Bank, Reliance Industries, ICICI Bank, Tata Consultancy Services, Larsen and Toubro, ITC Ltd, Housing Development Finance Corporation Ltd and Kotak Mahendra Bank.
- The Japanese Yen weakened as Minister Yoshitaka Shindo expressed the goal for the primary balance to achieve surplus territory by 2025.
- The Jibun Bank Manufacturing PMI rose 50.4 MoM in May, indicating the first expansion since May 2023.
- The US Dollar depreciated as Fed officials suggested no further interest rate hikes.
The Japanese Yen (JPY) depreciates, with Japanese Economy Minister Yoshitaka Shindo announcing on Monday that the government will “continue efforts for primary balance to reach within surplus territory in FY 2025.” Shindo also expressed optimism, stating that “Real economic growth of 1.3% in FY 2025 is not so unrealistic,” per Reuters.
Japan's Tokyo Consumer Price Index (CPI), released on Friday, rose to 2.2% year-over-year in May, up from April's 1.8% rise. If nationwide inflation in Japan were to decline, it would likely deter the Bank of Japan (BoJ) from raising interest rates. The substantial interest rate differential between Japan and other countries continues to exert pressure on the Japanese Yen, supporting the USD/JPY pair.
US Dollar Index (DXY), which measures the value of the US Dollar (USD) against six other major currencies, lost ground after the release of the Federal Reserve's preferred US Personal Consumption Expenditure (PCE) data, showing a moderation in price pressures in April.
Last week, Federal Reserve (Fed) officials suggested that the central bank could potentially achieve its 2% annual inflation target without implementing additional interest rate hikes. This stance has led to downward pressure on US Treasury yields, weakening the Greenback.
Daily Digest Market Movers: Japanese Yen depreciates amid dovish BoJ officials
- The Jibun Bank Japan Manufacturing PMI rose 50.4 month-on-month in May from April’s 49.6, indicating the first expansion in manufacturing activity since May 2023.
- Reuters reported on Monday that Bank of Japan Executive Director Takashi Kato stated that “BoJ has no plan to immediately unload its exchange-traded funds (ETF) holdings.” Kato said, “I hope to spend time examining how to unload BoJ’s ETF holdings in the future.”
- Japan’s Retail Sales (YoY) grew 2.4% in April, accelerating from a downwardly revised 1.1% rise in March and surpassing market forecasts of 1.9% growth. This marks the 26th consecutive month of expansion, indicating a sustained period of healthy consumption in Japan.
- On Friday, the US PCE Index rose 0.3% MoM and 2.7% YoY in April, matching the expectations. The Core PCE, excluding the volatile food and energy, climbed 0.2% MoM in April, lower than the expected 0.3% rise. On an annual basis, the index jumped 2.8% as expected.
- On Thursday, Atlanta Fed President Raphael Bostic remarked in an interview with Fox Business that he doesn't believe further rate hikes should be required to reach the Fed's 2% annual inflation target. Additionally, New York Fed President John Williams stated that inflation is still too high, but should moderate over the second half of 2024. Williams doesn't feel the urgency to act on monetary policy.
Technical Analysis: USD/JPY tests the key level of 157.50
The USD/JPY pair trades around 157.40 on Monday. Analysis of the daily chart shows a symmetrical triangle pattern, indicating a temporary pause in the prevailing bullish trend. However, the 14-day Relative Strength Index (RSI) remains above 50, suggesting a continued bullish bias for the pair.
In terms of potential price movements, the USD/JPY pair is testing the upper boundary of the symmetrical triangle, with the psychological level of 158.00 acting as the next target. A breach above this level could provide support for the pair to retest 160.32, which represents its highest level in over thirty years.
Conversely, immediate support is seen at the psychological level of 157.00, followed by the 14-day Exponential Moving Average (EMA) at 156.72. Further downward movement could lead the USD/JPY pair to navigate the area around the lower boundary of the symmetrical triangle.
USD/JPY: Daily Chart
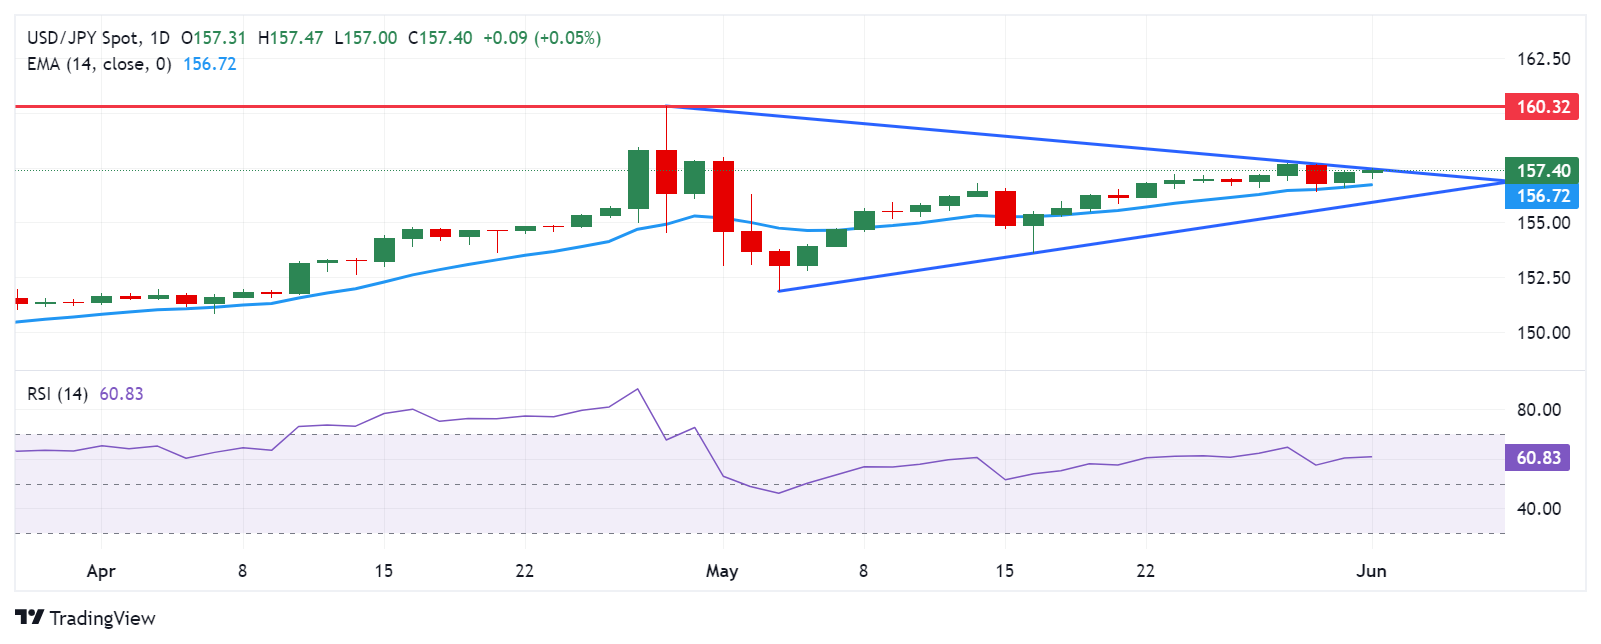
Japanese Yen price today
The table below shows the percentage change of the Japanese Yen (JPY) against listed major currencies today. Japanese Yen was the weakest against the Euro.
| USD | EUR | GBP | CAD | AUD | JPY | NZD | CHF | |
| USD | 0.00% | 0.02% | 0.05% | 0.11% | 0.13% | 0.03% | 0.00% | |
| EUR | 0.00% | 0.02% | 0.05% | 0.10% | 0.13% | 0.03% | 0.00% | |
| GBP | -0.02% | -0.02% | 0.03% | 0.09% | 0.12% | 0.01% | -0.02% | |
| CAD | -0.05% | -0.05% | -0.04% | 0.05% | 0.09% | -0.02% | -0.05% | |
| AUD | -0.11% | -0.10% | -0.09% | -0.05% | 0.05% | -0.06% | -0.11% | |
| JPY | -0.14% | -0.14% | -0.14% | -0.10% | -0.06% | -0.11% | -0.14% | |
| NZD | -0.03% | -0.03% | -0.02% | 0.02% | 0.08% | 0.11% | -0.03% | |
| CHF | 0.00% | 0.00% | 0.01% | 0.05% | 0.10% | 0.14% | 0.03% |
The heat map shows percentage changes of major currencies against each other. The base currency is picked from the left column, while the quote currency is picked from the top row. For example, if you pick the Euro from the left column and move along the horizontal line to the Japanese Yen, the percentage change displayed in the box will represent EUR (base)/JPY (quote).
Japanese Yen FAQs
The Japanese Yen (JPY) is one of the world’s most traded currencies. Its value is broadly determined by the performance of the Japanese economy, but more specifically by the Bank of Japan’s policy, the differential between Japanese and US bond yields, or risk sentiment among traders, among other factors.
One of the Bank of Japan’s mandates is currency control, so its moves are key for the Yen. The BoJ has directly intervened in currency markets sometimes, generally to lower the value of the Yen, although it refrains from doing it often due to political concerns of its main trading partners. The current BoJ ultra-loose monetary policy, based on massive stimulus to the economy, has caused the Yen to depreciate against its main currency peers. This process has exacerbated more recently due to an increasing policy divergence between the Bank of Japan and other main central banks, which have opted to increase interest rates sharply to fight decades-high levels of inflation.
The BoJ’s stance of sticking to ultra-loose monetary policy has led to a widening policy divergence with other central banks, particularly with the US Federal Reserve. This supports a widening of the differential between the 10-year US and Japanese bonds, which favors the US Dollar against the Japanese Yen.
The Japanese Yen is often seen as a safe-haven investment. This means that in times of market stress, investors are more likely to put their money in the Japanese currency due to its supposed reliability and stability. Turbulent times are likely to strengthen the Yen’s value against other currencies seen as more risky to invest in.
- Gold price is oscillating in a range near a three-week low touched on Friday.
- Fed rate cut bets undermine the USD, which, along with geopolitical risks, lends support.
- A positive risk tone caps the upside ahead of the global PMIs and the US ISM PMI.
Gold price (XAU/USD) struggles to gain any meaningful traction during the Asian session on Monday amid a combination of diverging forces and languishes near a three-week low touched on Friday. Growing acceptance that the Federal Reserve (Fed) will start cutting rates later this year, bolstered by signs of easing inflationary pressures in the United States (US), continues to undermine the US Dollar (USD). This, along with persistent geopolitical risks, turn out to be key factors lending some support to the safe-haven precious metal.
The upside for the Gold price, however, remains capped in the wake of a generally positive risk tone and hopes for a cease-fire in Gaza. Traders also seem reluctant and prefer to wait for this week's release of important US macro data scheduled at the beginning of a new month, including the Nonfarm Payrolls (NFP) report on Friday. Apart from this, key central bank event risks – the Bank of Canada (BoC) decision on Wednesday and the European Central Bank (ECB) meeting on Thursday – should influence the non-yielding yellow metal.
Daily Digest Market Movers: Gold price struggles to lure buyers despite weaker US Dollar
- The US inflation report was in line with estimates and reinforced expectations that the Federal Reserve will cut interest rates this year, which is undermining the US Dollar and acting as a tailwind for the Gold price.
- The US Bureau of Economic Analysis (BEA) reported on Friday that the Personal Consumption Expenditures (PCE) Price Index rose 0.3% in April and held steady at 2.7% on a yearly basis, matching consensus estimates.
- The Core PCE Price Index, which excludes volatile food and energy prices, also matched expectations, and rose 2.8% on a yearly basis, while Personal Income and Personal Spending grew 0.3% and 0.2% respectively.
- The data lifts bets for an imminent Fed rate cut this year and leads to a further decline in the US Treasury bond yields, keeping the USD bulls on the defensive and lending support to the non-yielding yellow metal.
- Adding to this, tensions surrounding the Middle East turn out to be another factor limiting the downside for the safe-haven XAU/USD, though a generally positive tone around the equity markets should cap the upside.
- China's Caixin S&P Global Manufacturing Purchasing Managers' Index (PMI) rose to 51.7 in May from 51.4 previous and pointed to signs of stabilization in the world's second-largest economy, boosting investors' confidence.
- Furthermore, the latest optimism over a new ceasefire plan for Gaza announced by US President Joe Biden is holding back traders from placing aggressive bullish bets around the commodity.
- Market participants now look forward to the release of the final global Manufacturing PMI prints for short-term trading opportunities ahead of the US ISM Manufacturing PMI later during the day.
- Investors this week will also confront important US macro releases, including the NFP report and key central bank event risks – the BoC policy decision on Wednesday, followed by the ECB meeting on Thursday.
Technical Analysis: Gold price could weaken further once $2,320 support is broken decisively
From a technical perspective, some follow-through selling below the $2,320 level will confirm a breakdown through the 50-day Simple Moving Average (SMA) and pave the way for deeper losses. Given that oscillators on the daily chart have just started gaining negative traction, the Gold price might then weaken further below the $2,300 round-figure mark and test the next relevant support near the $2,285-$2,284 horizontal zone.
On the flip side, momentum beyond the $2,343-$2,344 area is likely to confront stiff resistance near the $2,360 region (Friday's swing high). Some follow-through buying beyond the $2,364 level will be seen as a fresh trigger for bullish traders and lift the Gold price towards the $2,385 intermediate hurdle en route to the $2,400 mark. The momentum could extend to the $2,425 zone en route to the $2,450 region or the all-time peak touched in May.
Gold FAQs
Gold has played a key role in human’s history as it has been widely used as a store of value and medium of exchange. Currently, apart from its shine and usage for jewelry, the precious metal is widely seen as a safe-haven asset, meaning that it is considered a good investment during turbulent times. Gold is also widely seen as a hedge against inflation and against depreciating currencies as it doesn’t rely on any specific issuer or government.
Central banks are the biggest Gold holders. In their aim to support their currencies in turbulent times, central banks tend to diversify their reserves and buy Gold to improve the perceived strength of the economy and the currency. High Gold reserves can be a source of trust for a country’s solvency. Central banks added 1,136 tonnes of Gold worth around $70 billion to their reserves in 2022, according to data from the World Gold Council. This is the highest yearly purchase since records began. Central banks from emerging economies such as China, India and Turkey are quickly increasing their Gold reserves.
Gold has an inverse correlation with the US Dollar and US Treasuries, which are both major reserve and safe-haven assets. When the Dollar depreciates, Gold tends to rise, enabling investors and central banks to diversify their assets in turbulent times. Gold is also inversely correlated with risk assets. A rally in the stock market tends to weaken Gold price, while sell-offs in riskier markets tend to favor the precious metal.
The price can move due to a wide range of factors. Geopolitical instability or fears of a deep recession can quickly make Gold price escalate due to its safe-haven status. As a yield-less asset, Gold tends to rise with lower interest rates, while higher cost of money usually weighs down on the yellow metal. Still, most moves depend on how the US Dollar (USD) behaves as the asset is priced in dollars (XAU/USD). A strong Dollar tends to keep the price of Gold controlled, whereas a weaker Dollar is likely to push Gold prices up.
Japanese Economy Minister Yoshitaka Shindo said on Monday that the government will “continue efforts for primary balance to reach within surplus territory in FY 2025.”
“Real economic growth of 1.3% in FY 2025 is not so unrealistic,” Shindo added.
Market reaction
USD/JPY is little affected by the downbeat comments from the Japanese official, currently trading flat near 157.25.
Japanese Yen FAQs
The Japanese Yen (JPY) is one of the world’s most traded currencies. Its value is broadly determined by the performance of the Japanese economy, but more specifically by the Bank of Japan’s policy, the differential between Japanese and US bond yields, or risk sentiment among traders, among other factors.
One of the Bank of Japan’s mandates is currency control, so its moves are key for the Yen. The BoJ has directly intervened in currency markets sometimes, generally to lower the value of the Yen, although it refrains from doing it often due to political concerns of its main trading partners. The current BoJ ultra-loose monetary policy, based on massive stimulus to the economy, has caused the Yen to depreciate against its main currency peers. This process has exacerbated more recently due to an increasing policy divergence between the Bank of Japan and other main central banks, which have opted to increase interest rates sharply to fight decades-high levels of inflation.
The BoJ’s stance of sticking to ultra-loose monetary policy has led to a widening policy divergence with other central banks, particularly with the US Federal Reserve. This supports a widening of the differential between the 10-year US and Japanese bonds, which favors the US Dollar against the Japanese Yen.
The Japanese Yen is often seen as a safe-haven investment. This means that in times of market stress, investors are more likely to put their money in the Japanese currency due to its supposed reliability and stability. Turbulent times are likely to strengthen the Yen’s value against other currencies seen as more risky to invest in.
Most recent article: 2024 Indian election: Continuity expected as Modi looks set to win third term
- Indian Rupee rebounds on Monday on the softer USD.
- The success of Narendra Modi's (BJP) third-term election might boost the INR.
- The final reading on Indian and US Manufacturing PMI for May will be in the spotlight on Monday.
Indian Rupee (INR) recovers on Monday amid the weaker US dollar (USD). On Friday, the INR closed the week with its worst weekly performance in over two months, pressured by month-end USD demand from importers. However, the decline of the INR might be limited as the Reserve Bank of India (RBI) is likely to intervene in the local currency from depreciation.
Market players await India's general election outcome, with vote counting on June 4. Analysts expect the Indian Rupee to rally this week as exit polls revealed Prime Minister Narendra Modi's Bharatiya Janata Party would win a third term.
The final reading of India’s Manufacturing Purchasing Managers Index (PMI) for May is due on Monday, which is expected to remain unchanged from the first estimate of 58.4.
On the US docket, the ISM Manufacturing PMI will be released. The stronger-than-expected reading might dampen the expectation of the Federal Reserve (Fed) rate cut this year and boost the Greenback.
Daily Digest Market Movers: Indian Rupee gains ground ahead of India's general election result
- Most exit polls projected the governing NDA would win a two-thirds majority in the 543-member lower house of parliament, where 272 is required for a simple majority.
- The 10-year Indian government bond yield closed Friday at 6.9809%, marking the sixth straight weekly decline and having its biggest monthly loss in four years.
- The US Personal Consumption Expenditures (PCE) Price Index came in as expected, advancing 0.3% on a monthly basis in April and rising 2.7% on a yearly basis.
- The Core PCE, excluding the volatile food and energy, rose 0.2% MoM in April, compared to a 0.3% gain in March. On an annual basis, the core PCE price index climbed 2.8% for the third consecutive month.
- Personal Income rose 0.3% on a monthly basis in April, while Personal Spending grew by 0.2%.
- The US ISM Manufacturing PMI is expected to improve to 49.8 in May from 49.2 in April.
Technical analysis: USD/INR’s bullish outlook prevails
The Indian Rupee trades stronger on the day. The USD/INR pair keeps the bullish vibe above the key 100-day Exponential Moving Average (EMA) on the daily timeframe. The upward momentum is supported by the 14-day Relative Strength Index (RSI), which stands around 55.0, supporting the buyers for the time being.
A decisive break above a descending trend channel that has been established since mid-April at 83.40 will see a rally to 83.54 (high of May 13), followed by 83.72 (high of April 17), and finally at 84.00 (psychological mark).
On the flip side, the 100-day EMA around 83.21 acts as an initial support level for USD/INR. The key contention level to watch is the 83.00 round figure, A breach of the mentioned level could expose 82.78 (low of January 15).
US Dollar price today
The table below shows the percentage change of US Dollar (USD) against listed major currencies today. US Dollar was the weakest against the New Zealand Dollar.
| USD | EUR | GBP | CAD | AUD | JPY | NZD | CHF | |
| USD | -0.01% | -0.03% | 0.03% | -0.02% | 0.01% | -0.08% | -0.03% | |
| EUR | 0.02% | -0.01% | 0.03% | -0.01% | 0.03% | -0.06% | 0.01% | |
| GBP | 0.03% | 0.02% | 0.06% | 0.01% | 0.05% | -0.05% | 0.01% | |
| CAD | -0.02% | -0.03% | -0.05% | -0.04% | 0.00% | -0.10% | -0.04% | |
| AUD | 0.02% | 0.01% | 0.00% | 0.05% | 0.05% | -0.06% | 0.01% | |
| JPY | -0.02% | -0.02% | -0.04% | 0.00% | -0.06% | -0.10% | -0.04% | |
| NZD | 0.08% | 0.07% | 0.05% | 0.11% | 0.07% | 0.10% | 0.06% | |
| CHF | 0.02% | 0.01% | -0.01% | 0.04% | 0.00% | 0.04% | -0.06% |
The heat map shows percentage changes of major currencies against each other. The base currency is picked from the left column, while the quote currency is picked from the top row. For example, if you pick the Euro from the left column and move along the horizontal line to the Japanese Yen, the percentage change displayed in the box will represent EUR (base)/JPY (quote).
Indian Rupee FAQs
The Indian Rupee (INR) is one of the most sensitive currencies to external factors. The price of Crude Oil (the country is highly dependent on imported Oil), the value of the US Dollar – most trade is conducted in USD – and the level of foreign investment, are all influential. Direct intervention by the Reserve Bank of India (RBI) in FX markets to keep the exchange rate stable, as well as the level of interest rates set by the RBI, are further major influencing factors on the Rupee.
The Reserve Bank of India (RBI) actively intervenes in forex markets to maintain a stable exchange rate, to help facilitate trade. In addition, the RBI tries to maintain the inflation rate at its 4% target by adjusting interest rates. Higher interest rates usually strengthen the Rupee. This is due to the role of the ‘carry trade’ in which investors borrow in countries with lower interest rates so as to place their money in countries’ offering relatively higher interest rates and profit from the difference.
Macroeconomic factors that influence the value of the Rupee include inflation, interest rates, the economic growth rate (GDP), the balance of trade, and inflows from foreign investment. A higher growth rate can lead to more overseas investment, pushing up demand for the Rupee. A less negative balance of trade will eventually lead to a stronger Rupee. Higher interest rates, especially real rates (interest rates less inflation) are also positive for the Rupee. A risk-on environment can lead to greater inflows of Foreign Direct and Indirect Investment (FDI and FII), which also benefit the Rupee.
Higher inflation, particularly, if it is comparatively higher than India’s peers, is generally negative for the currency as it reflects devaluation through oversupply. Inflation also increases the cost of exports, leading to more Rupees being sold to purchase foreign imports, which is Rupee-negative. At the same time, higher inflation usually leads to the Reserve Bank of India (RBI) raising interest rates and this can be positive for the Rupee, due to increased demand from international investors. The opposite effect is true of lower inflation.
Bank of Japan (BoJ) Executive Director Kato said on Monday that the “BoJ has no plan to immediately unload its exchange traded funds (ETF) holdings.”
Kato said “I hope to spend time examining how to unload BoJ’s ETF holdings in the future.”
Market reaction
USD/JPY was last seen trading at around 157.25, modestly flat on the day.
Japanese Yen PRICE Today
The table below shows the percentage change of Japanese Yen (JPY) against listed major currencies today. Japanese Yen was the strongest against the US Dollar.
| USD | EUR | GBP | JPY | CAD | AUD | NZD | CHF | |
|---|---|---|---|---|---|---|---|---|
| USD | -0.05% | -0.04% | -0.02% | -0.06% | -0.05% | -0.25% | -0.23% | |
| EUR | 0.05% | 0.04% | 0.05% | -0.01% | -0.13% | -0.20% | -0.20% | |
| GBP | 0.04% | -0.04% | 0.06% | -0.06% | -0.10% | -0.30% | -0.24% | |
| JPY | 0.02% | -0.05% | -0.06% | -0.09% | 0.00% | -0.09% | -0.05% | |
| CAD | 0.06% | 0.01% | 0.06% | 0.09% | -0.02% | -0.19% | -0.18% | |
| AUD | 0.05% | 0.13% | 0.10% | 0.00% | 0.02% | -0.08% | -0.09% | |
| NZD | 0.25% | 0.20% | 0.30% | 0.09% | 0.19% | 0.08% | -0.03% | |
| CHF | 0.23% | 0.20% | 0.24% | 0.05% | 0.18% | 0.09% | 0.03% |
The heat map shows percentage changes of major currencies against each other. The base currency is picked from the left column, while the quote currency is picked from the top row. For example, if you pick the Japanese Yen from the left column and move along the horizontal line to the US Dollar, the percentage change displayed in the box will represent JPY (base)/USD (quote).
- The Australian Dollar edges higher due to positive market sentiment on Monday.
- Australian minimum wage increased by 3.75%, aligning with the expected range of 3.5%-4.0%.
- The US Dollar lost ground following the release of the Fed’s preferred US PCE, indicating price pressures eased in April.
The Australian Dollar (AUD) extended its gains for the third consecutive day on Monday as the minimum wage increased by 3.75% in Australia, aligning with market estimates that ranged from 3.5% to 4.0%. The AUD/USD pair strengthened as the US Personal Consumption Expenditure (PCE) data, the Federal Reserve's preferred measure of inflation, showed that price pressures eased in April. Moreover, Australia's monthly inflation rate also accelerated to 3.6%, increasing the likelihood that the Reserve Bank of Australia (RBA) might need to raise interest rates again.
The Australian Dollar also benefited from the Caixin Manufacturing Purchasing Managers Index (PMI) in China, which posted a higher-than-expected reading for May. However, on Friday, lower-than-expected NBS PMI data from China dented import demand for Australia, a top commodity producer. Given the close trade relationship between Australia and China, any changes in the Chinese economy can significantly impact the Australian market.
The US Dollar (USD) continues to lose ground due to the depreciation in the US Treasury yields. Federal Reserve (Fed) officials indicated last week that the central bank may reach its 2% annual inflation target without further interest rate hikes. Investors are expected to closely monitor the ISM Manufacturing PMI on Monday, with attention potentially shifting to the US Nonfarm Payrolls report on Friday.
Daily Digest Market Movers: Australian Dollar advances due to positive market sentiment
- Australia’s Judo Bank Manufacturing PMI released on Monday, edging up slightly to 49.7 in May from 49.6 in April, marking the fourth consecutive month of declining conditions in the manufacturing sector.
- On Monday, the Caixin China Manufacturing PMI rose to 51.7 in May from 51.4 in April, marking the seventh consecutive month of expansion in factory activity and surpassing the estimates of 51.5. Friday’s NBS PMI data showed that manufacturing activity fell to 49.5 in May from 50.4 in April, missing the market consensus of an increase to 50.5. Meanwhile, the Non-Manufacturing PMI declined to 51.1 from the previous reading of 51.2, falling short of the estimated 51.5.
- On Friday, the US PCE Index rose 0.3% MoM and 2.7% YoY in April, matching the expectations. The Core PCE, excluding the volatile food and energy, climbed 0.2% MoM in April, lower than the expected 0.3% rise. On an annual basis, the index jumped 2.8% as expected.
- On Thursday, Atlanta Fed President Raphael Bostic remarked in an interview with Fox Business that he doesn't believe further rate hikes should be required to reach the Fed's 2% annual inflation target. Additionally, New York Fed President John Williams stated that inflation is still too high, but should moderate over the second half of 2024. Williams doesn't feel the urgency to act on monetary policy.
- As per a Bloomberg report, RBA Assistant Governor Sarah Hunter said at a conference in Sydney on Thursday that “inflationary pressures" are the key issue. “We’re very mindful of that." Hunter also stated that the RBA Board is concerned about inflation remaining above the target range of 1%-3%, suggesting persistent inflationary pressure. Wages growth appears to be near its peak.
Technical Analysis: Australian Dollar remains above 0.6650
The Australian Dollar trades around 0.6660 on Monday. A daily chart analysis suggests a bullish bias for the AUD/USD pair, as it appears to be moving upward from the lower boundary of a rising wedge pattern. Furthermore, the 14-day Relative Strength Index (RSI) is positioned above the 50 level, confirming this bullish bias.
The AUD/USD pair could aim for the psychological level of 0.6700, followed by the four-month high of 0.6714 and the upper limit of the rising wedge around 0.6750.
On the downside, immediate support is seen at the 21-day Exponential Moving Average (EMA) at 0.6624, followed by the psychological level of 0.6600 around the lower boundary of the rising wedge. Further decline might exert downward pressure on the AUD/USD pair, potentially leading it toward the throwback support region at 0.6470.
AUD/USD: Daily Chart
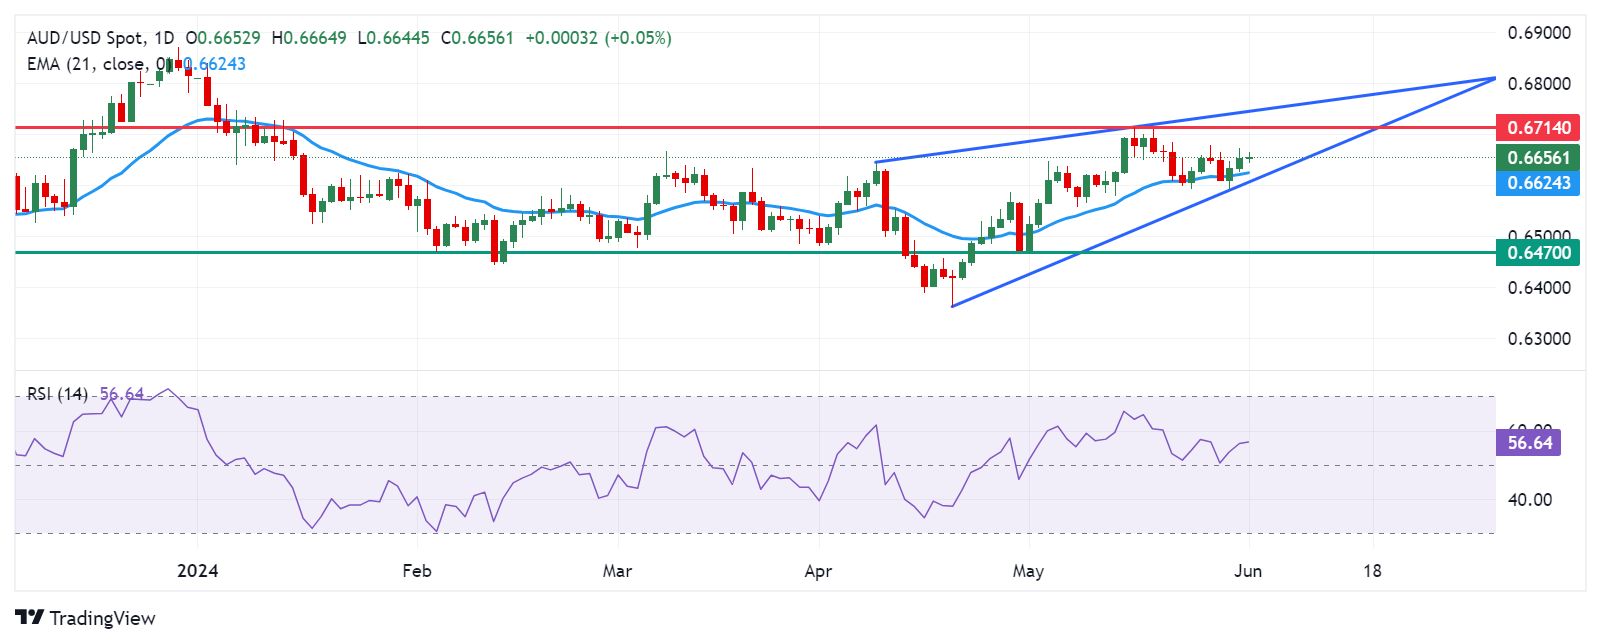
Australian Dollar price today
The table below shows the percentage change of the Australian Dollar (AUD) against listed major currencies today. The Australian Dollar was the strongest against the Japanese Yen.
| USD | EUR | GBP | CAD | AUD | JPY | NZD | CHF | |
| USD | -0.02% | -0.04% | 0.00% | -0.02% | 0.01% | -0.10% | -0.03% | |
| EUR | 0.02% | -0.02% | 0.02% | -0.01% | 0.03% | -0.08% | 0.00% | |
| GBP | 0.04% | 0.02% | 0.04% | 0.00% | 0.05% | -0.05% | 0.02% | |
| CAD | -0.01% | -0.02% | -0.04% | -0.04% | 0.00% | -0.10% | -0.03% | |
| AUD | 0.02% | 0.02% | 0.00% | 0.04% | 0.05% | -0.06% | 0.01% | |
| JPY | -0.01% | -0.02% | -0.04% | -0.02% | -0.06% | -0.11% | -0.03% | |
| NZD | 0.10% | 0.08% | 0.06% | 0.10% | 0.07% | 0.10% | 0.08% | |
| CHF | 0.00% | 0.00% | -0.04% | 0.01% | -0.03% | 0.01% | -0.09% |
The heat map shows percentage changes of major currencies against each other. The base currency is picked from the left column, while the quote currency is picked from the top row. For example, if you pick the Euro from the left column and move along the horizontal line to the Japanese Yen, the percentage change displayed in the box will represent EUR (base)/JPY (quote).
Australian Dollar FAQs
One of the most significant factors for the Australian Dollar (AUD) is the level of interest rates set by the Reserve Bank of Australia (RBA). Because Australia is a resource-rich country another key driver is the price of its biggest export, Iron Ore. The health of the Chinese economy, its largest trading partner, is a factor, as well as inflation in Australia, its growth rate, and Trade Balance. Market sentiment – whether investors are taking on more risky assets (risk-on) or seeking safe havens (risk-off) – is also a factor, with risk-on positive for AUD.
The Reserve Bank of Australia (RBA) influences the Australian Dollar (AUD) by setting the level of interest rates that Australian banks can lend to each other. This influences the level of interest rates in the economy as a whole. The main goal of the RBA is to maintain a stable inflation rate of 2-3% by adjusting interest rates up or down. Relatively high interest rates compared to other major central banks support the AUD, and the opposite for relatively low. The RBA can also use quantitative easing and tightening to influence credit conditions, with the former AUD-negative and the latter AUD-positive.
China is Australia’s largest trading partner so the health of the Chinese economy is a major influence on the value of the Australian Dollar (AUD). When the Chinese economy is doing well it purchases more raw materials, goods and services from Australia, lifting demand for the AUD, and pushing up its value. The opposite is the case when the Chinese economy is not growing as fast as expected. Positive or negative surprises in Chinese growth data, therefore, often have a direct impact on the Australian Dollar and its pairs.
Iron Ore is Australia’s largest export, accounting for $118 billion a year according to data from 2021, with China as its primary destination. The price of Iron Ore, therefore, can be a driver of the Australian Dollar. Generally, if the price of Iron Ore rises, AUD also goes up, as aggregate demand for the currency increases. The opposite is the case if the price of Iron Ore falls. Higher Iron Ore prices also tend to result in a greater likelihood of a positive Trade Balance for Australia, which is also positive of the AUD.
The Trade Balance, which is the difference between what a country earns from its exports versus what it pays for its imports, is another factor that can influence the value of the Australian Dollar. If Australia produces highly sought after exports, then its currency will gain in value purely from the surplus demand created from foreign buyers seeking to purchase its exports versus what it spends to purchase imports. Therefore, a positive net Trade Balance strengthens the AUD, with the opposite effect if the Trade Balance is negative.
On Friday, US President Joe Biden outlined a three-stage ceasefire plan aimed at de-escalating the conflict between Israel and Hamas that seemed to have claimed about 36,000 lives since the war began last October.
A senior US administration official confirmed that the four-and-a-half-page proposal had been endorsed by the Israeli government and presented to Hamas on Friday.
President Biden's proposal included an initial six-week phase in which Israeli forces would withdraw from populated areas of Gaza. It also involved a prisoner exchange, releasing several hostages, including women, the elderly, and the wounded, in exchange for hundreds of Palestinian prisoners, per CNBC News.
Israeli Prime Minister Benjamin Netanyahu, however, rejected the idea of a permanent ceasefire, noting that "Israel’s conditions for ending the war have not changed: the destruction of Hamas’s military and governing capabilities, the freeing of all hostages, and ensuring that Gaza no longer poses a threat to Israel."
Speaking to ABC News on Sunday morning, US National Security Council spokesman John Kirby said that the US had "every expectation" that Israel would "say yes" to the proposed ceasefire deal if Hamas accepts.
"We're waiting for an official response from Hamas," he said, adding that the US hopes that both sides agree to start the first phase of the plan "as soon as possible".
Hamas welcomed US President Biden's cease-fire proposal for Gaza, affirming its readiness to deal positively with any proposal that offers a permanent cease-fire, complete withdrawal of Israel forces from Gaza, restructuring of the strip, return of displaced and a serious prisoner hostage exchange, Reuters reports.
Despite Hamas's positive response, Netanyahu's rejection of the ceasefire plan points to a significant obstacle to the proposed roadmap's implementation.
Market reaction
Amidst Israel’s firm stance on the ceasefire proposal, Hamas’s response is adding to the market’s optimism on hopes of a likely ceasefire. The US Dollar Index is losing 0.10% on the day to trade near 104.50 while the US S&P 500 futures, a risk barometer is up 0.30% so far. Meanwhile, Gold price is testing the key support near $2,330, as of writing.
Risk sentiment FAQs
In the world of financial jargon the two widely used terms “risk-on” and “risk off'' refer to the level of risk that investors are willing to stomach during the period referenced. In a “risk-on” market, investors are optimistic about the future and more willing to buy risky assets. In a “risk-off” market investors start to ‘play it safe’ because they are worried about the future, and therefore buy less risky assets that are more certain of bringing a return, even if it is relatively modest.
Typically, during periods of “risk-on”, stock markets will rise, most commodities – except Gold – will also gain in value, since they benefit from a positive growth outlook. The currencies of nations that are heavy commodity exporters strengthen because of increased demand, and Cryptocurrencies rise. In a “risk-off” market, Bonds go up – especially major government Bonds – Gold shines, and safe-haven currencies such as the Japanese Yen, Swiss Franc and US Dollar all benefit.
The Australian Dollar (AUD), the Canadian Dollar (CAD), the New Zealand Dollar (NZD) and minor FX like the Ruble (RUB) and the South African Rand (ZAR), all tend to rise in markets that are “risk-on”. This is because the economies of these currencies are heavily reliant on commodity exports for growth, and commodities tend to rise in price during risk-on periods. This is because investors foresee greater demand for raw materials in the future due to heightened economic activity.
The major currencies that tend to rise during periods of “risk-off” are the US Dollar (USD), the Japanese Yen (JPY) and the Swiss Franc (CHF). The US Dollar, because it is the world’s reserve currency, and because in times of crisis investors buy US government debt, which is seen as safe because the largest economy in the world is unlikely to default. The Yen, from increased demand for Japanese government bonds, because a high proportion are held by domestic investors who are unlikely to dump them – even in a crisis. The Swiss Franc, because strict Swiss banking laws offer investors enhanced capital protection.
| Raw materials | Closed | Change, % |
|---|---|---|
| Silver | 30.381 | -2.52 |
| Gold | 2327.29 | -0.69 |
| Palladium | 915.19 | -3.93 |
China's Caixin S&P Global Manufacturing Purchasing Managers' Index (PMI) rose from 51.4 in April to 51.7 in May, according to the latest data released on Monday.
The reading beat the market consensus of 51.5 in the reported month.
Key highlights (via Caixin)
Production expands at most pronounced pace since June 2022.
Fastest purchasing activity growth in three years as confidence improves.
Input price inflation rises to seven-month high.
"Both supply and demand expanded amid the upturn. Growth in manufacturers’ output reached a 23-month high in May, with particularly strong increases in consumption goods production,” said Wang Zhe, an economist at Caixin Insight Group.
Wang added, “total new orders registered the 10th straight month of growth, although demand for intermediate goods was relatively weak.”
AUD/USD reaction to China’s PMI data
The upbeat Chinese Manufacturing PMI underpins the sentiment around the Aussie Dollar, as AUD/USD flirts with intraday highs near 0.6665, at the time of writing, up 0.18% on the day.
Australian Dollar FAQs
One of the most significant factors for the Australian Dollar (AUD) is the level of interest rates set by the Reserve Bank of Australia (RBA). Because Australia is a resource-rich country another key driver is the price of its biggest export, Iron Ore. The health of the Chinese economy, its largest trading partner, is a factor, as well as inflation in Australia, its growth rate and Trade Balance. Market sentiment – whether investors are taking on more risky assets (risk-on) or seeking safe-havens (risk-off) – is also a factor, with risk-on positive for AUD.
The Reserve Bank of Australia (RBA) influences the Australian Dollar (AUD) by setting the level of interest rates that Australian banks can lend to each other. This influences the level of interest rates in the economy as a whole. The main goal of the RBA is to maintain a stable inflation rate of 2-3% by adjusting interest rates up or down. Relatively high interest rates compared to other major central banks support the AUD, and the opposite for relatively low. The RBA can also use quantitative easing and tightening to influence credit conditions, with the former AUD-negative and the latter AUD-positive.
China is Australia’s largest trading partner so the health of the Chinese economy is a major influence on the value of the Australian Dollar (AUD). When the Chinese economy is doing well it purchases more raw materials, goods and services from Australia, lifting demand for the AUD, and pushing up its value. The opposite is the case when the Chinese economy is not growing as fast as expected. Positive or negative surprises in Chinese growth data, therefore, often have a direct impact on the Australian Dollar and its pairs.
Iron Ore is Australia’s largest export, accounting for $118 billion a year according to data from 2021, with China as its primary destination. The price of Iron Ore, therefore, can be a driver of the Australian Dollar. Generally, if the price of Iron Ore rises, AUD also goes up, as aggregate demand for the currency increases. The opposite is the case if the price of Iron Ore falls. Higher Iron Ore prices also tend to result in a greater likelihood of a positive Trade Balance for Australia, which is also positive of the AUD.
The Trade Balance, which is the difference between what a country earns from its exports versus what it pays for its imports, is another factor that can influence the value of the Australian Dollar. If Australia produces highly sought after exports, then its currency will gain in value purely from the surplus demand created from foreign buyers seeking to purchase its exports versus what it spends to purchase imports. Therefore, a positive net Trade Balance strengthens the AUD, with the opposite effect if the Trade Balance is negative.
The People’s Bank of China (PBoC) set the USD/CNY central rate for the trading session ahead on Monday at 7.1086, as against the previous day's fix of 7.1088 and 7.2378 Reuters estimates.
- WTI edges higher as OPEC+ continues its oil output cuts of 3.66 million barrels per day into 2025.
- Oil prices could face pressure as Fed officials suggested maintaining restrictive monetary policy for now.
- Israeli Prime Minister Benjamin Netanyahu's administration accepted US President Joe Biden's proposal for a Gaza cease-fire on Sunday.
West Texas Intermediate (WTI Oil price grapples to halt its three-day losing streak, trading around $77.10 per barrel during the Asian hours on Monday. Reuters reported on Sunday that the Organization of the Petroleum Exporting Countries and its allies, including Russia (OPEC+), agreed to extend its Oil output cuts into 2025 to support the prices amid sluggish demand growth. OPEC+ decided to prolong the cuts of 3.66 million barrels per day (bpd) until the end of 2025 and extend the cuts of 2.2 million bpd by three months until September 2024.
On Friday, US Personal Consumption Expenditure (PCE) data indicated that price pressures eased in April. Despite this, the report did not prompt a rate cut from the Federal Reserve (Fed), suggesting that the central bank may need more time to achieve its inflation goals. The higher interest rates are negatively impacting the United States's (US) economic outlook and dampening the demand for liquid Gold.
Last week, Federal Reserve (Fed) officials communicated that the central bank might maintain its restrictive policy for an extended period to achieve its 2% inflation target. Atlanta Fed President Raphael Bostic remarked in an interview with Fox Business that the inflation outlook will decline very slowly and emphasized the need for the Fed to remain in a restrictive stance. Additionally, New York Fed President John Williams stated that although inflation is still too high, he believes the current Fed policy is appropriately positioned to gradually bring price growth back to the Fed's target.
Israeli Prime Minister Benjamin Netanyahu's administration reluctantly accepted US President Joe Biden's proposal for a Gaza cease-fire on Sunday. This decision comes amid ongoing attacks in Rafah following intense Israeli airstrikes over the weekend, according to the BBC. Investors will closely watch the developments in these geopolitical tensions, as any signs of escalating risks could potentially drive up crude Oil prices.
- EUR/USD gains traction near 1.0850 in Monday’s early Asian session.
- Markets believe the Fed needs more evidence to gain confidence that inflation is on course to its 2% target.
- The European Central Bank (ECB) is widely expected to cut the rate on Thursday.
The EUR/USD pair extends the upside around 1.0850 on Monday during the early Asian session. The cooler US PCE inflation data and the better-than-expected Eurozone HICP inflation data provide some support for the major pair. The US ISM Manufacturing PMI for May will take center stage on Monday ahead of the European Central Bank interest rate decision on Wednesday.
The Commerce Department's Bureau of Economic Analysis revealed on Friday that US inflation, as measured by the Personal Consumption Expenditures (PCE) Price Index, rose 0.3% on a monthly basis, as expected in April. On an annual basis, the PCE figure held steady at 2.7% YoY in April, matching March's increase and coming in line with the estimation.
The Core PCE Price Index, which excludes volatile food and energy prices, rose 2.8% on a yearly basis, in line with the market consensus. Core inflation was at its lowest level since March 2021. However, the recent data was not sufficient to trigger the Fed rate cut expectation, as investors believe the Fed needs more evidence to gain confidence that inflation is on course to reach its 2% target.
The hotter-than-expected inflation in the Eurozone might not stop the ECB from cutting interest rates this week, but it may signal a halt in July and slower rate reductions in the coming months. Financial markets have priced in nearly 25 basis point (bps) ECB rate cuts in June and 57 bps cuts in 2024, according to Reuters. Traders will closely monitor Lagarde's press conference for fresh signals on the pace of rate cuts after June. Any dovish message from the ECB is likely to weigh on the Euro (EUR) and create a headwind for the EUR/USD pair.
- GBP/USD draws support from a softer USD and bets for a delayed BoE rate cut.
- The UK political uncertainty keeps a lid on any meaningful upside for the GBP.
- Traders now look forward to the release of the US ISM PMI for a fresh impetus.
The GBP/USD pair kicks off the new week on a subdued note and oscillates in a narrow band, around mid-1.2700s during the Asian session. The downside, meanwhile, remains cushioned in the wake of a modest US Dollar (USD) weakness, weighed down by signs of easing inflationary pressures in the United States (US).
The US Bureau of Economic Analysis reported on Friday that the Personal Consumption Expenditure Price Index (PCE) held steady at 2.7% on a yearly basis in April. Adding to this, the Core PCE Price Index, which excludes volatile food and energy prices, matched consensus estimates and rose 2.8% on a yearly basis. The data should allow the Federal Reserve (Fed) to cut interest rates later this year. Apart from this, a generally positive risk tone seems to undermine the safe-haven USD, which, in turn, is seen acting as a tailwind for the GBP/USD pair.
The British Pound (GBP), on the other hand, draws support from expectations that more persistent price pressures in the United Kingdom (UK) might force the Bank of England (BoE) to keep interest rates at their current level for a little bit longer. That said, the uncertainty ahead of the UK general election on July 4 is holding back the GBP bulls from placing aggressive bets and capping the upside for the GBP/USD pair. Traders now look to the release of the Manufacturing PMIs from the UK and the US for some impetus ahead of the US ISM Manufacturing PMI.
| Index | Change, points | Closed | Change, % |
|---|---|---|---|
| NIKKEI 225 | 433.77 | 38487.9 | 1.14 |
| Hang Seng | -150.58 | 18079.61 | -0.83 |
| KOSPI | 1.08 | 2636.52 | 0.04 |
| ASX 200 | 73.5 | 7701.7 | 0.96 |
| DAX | 1.15 | 18497.94 | 0.01 |
| CAC 40 | 14.36 | 7992.87 | 0.18 |
| Dow Jones | 574.84 | 38686.32 | 1.51 |
| S&P 500 | 42.03 | 5277.51 | 0.8 |
| NASDAQ Composite | -2.06 | 16735.02 | -0.01 |
| Pare | Closed | Change, % |
|---|---|---|
| AUDUSD | 0.66533 | 0.31 |
| EURJPY | 170.616 | 0.44 |
| EURUSD | 1.08496 | 0.15 |
| GBPJPY | 200.372 | 0.37 |
| GBPUSD | 1.2742 | 0.08 |
| NZDUSD | 0.61441 | 0.48 |
| USDCAD | 1.36261 | -0.39 |
| USDCHF | 0.90234 | -0.1 |
| USDJPY | 157.26 | 0.29 |


© 2000-2026. Sva prava zaštićena.
Sajt je vlasništvo kompanije Teletrade D.J. LLC 2351 LLC 2022 (Euro House, Richmond Hill Road, Kingstown, VC0100, St. Vincent and the Grenadines).
Svi podaci koji se nalaze na sajtu ne predstavljaju osnovu za donošenje investicionih odluka, već su informativnog karaktera.
The company does not serve or provide services to customers who are residents of the US, Canada, Iran, The Democratic People's Republic of Korea, Yemen and FATF blacklisted countries.
Izvršenje trgovinskih operacija sa finansijskim instrumentima upotrebom marginalne trgovine pruža velike mogućnosti i omogućava investitorima ostvarivanje visokih prihoda. Međutim, takav vid trgovine povezan je sa potencijalno visokim nivoom rizika od gubitka sredstava. Проведение торговых операций на финанcовых рынках c маржинальными финанcовыми инcтрументами открывает широкие возможноcти, и позволяет инвеcторам, готовым пойти на риcк, получать выcокую прибыль, но при этом неcет в cебе потенциально выcокий уровень риcка получения убытков. Iz tog razloga je pre započinjanja trgovine potrebno odlučiti o izboru odgovarajuće investicione strategije, uzimajući u obzir raspoložive resurse.
Upotreba informacija: U slučaju potpunog ili delimičnog preuzimanja i daljeg korišćenja materijala koji se nalazi na sajtu, potrebno je navesti link odgovarajuće stranice na sajtu kompanije TeleTrade-a kao izvora informacija. Upotreba materijala na internetu mora biti praćena hiper linkom do web stranice teletrade.org. Automatski uvoz materijala i informacija sa stranice je zabranjen.
Ako imate bilo kakvih pitanja, obratite nam se pr@teletrade.global.
транcфери