- Analiza
- Novosti i instrumenti
- Vesti sa tržišta
Forex-novosti i prognoze od 01-11-2019
Analysts at TD Securities suggest the BoE's hiking bias is likely to be diluted even further at the November meeting, with more of a balanced message instead and a rewrite of the rate guidance in the final paragraph of the Monetary Policy Summary.
- "When the Bank of England meets again on Thursday, the big question of the day - Brexit - remains unsettled, with a deal on the table that parliament was unable to pass, and another deadline extension from the EU.
- At the same time, growth momentum has slowed further and some of the previously solid areas of the economy, like the labour market, have begun to falter.
- Once again, we think the FX market is only likely to give the November MPC meeting a passing glance. With the campaign ahead of the 12 December general election now gearing up rapidly, investors remain intensely focused on UK political risks. Ultimately, the outcome there - and what that implies for the future of Brexit - will continue to be the overwhelmingly dominant driver of sterling for the foreseeable future."
James Knightley, the Chief International Economist at ING, notes the U.S. ISM manufacturing index may have risen for the first time in March, but it remains in contraction territory at 48.3 (50 is the break-even level). Moreover, it was weaker than the 48.9 consensus estimate and it has only been weaker twice in the past ten years, he adds.
- "Adding to the sense of gloom for the sector, the report shows that this is the third sub-50 reading in a row with the production component dropping to its lowest level since April 2009. Orders and employment continue to contract with the one bright spot being a remarkable surge in export orders – tariff truce related? – to 50.4 from 41.0.
- Given the weakness in European and Asian indicators and the fact the dollar remains strong, it is difficult to see a sustainable improvement in export orders while there is broadening evidence that activity is decelerating domestically. There has been a truce called in the US-China trade tensions, but we see little scope for an imminent scaling back of the tariffs already enacted. As such this survey, together with the non-manufacturing ISM index which will be released next week (consensus looks for a small rise to 53.6 from 52.6), still suggests that GDP growth overall will trend lower. With inflation and inflation expectations remaining subdued, the Fed has scope to offer more support to the economy."
Analyst at TD Securities (TDS) provided their views on Friday's mostly upbeat US monthly jobs report, showing that the economy added 128K jobs in October.
- "Nonfarm payrolls surprised notably to the upside, coming in at 128k for October. The trend in job growth remains robust at 156k during the last six months — more than enough to absorb new entrants to the labor force. This should lend support to the FOMC's message this week that "monetary policy is in a good place."
- The strong payroll report should flatten the curve and keep Treasury yields somewhat elevated. Nevertheless, with global growth continuing to slow and the market waiting for confirmation that global growth weakness is not impacting the US consumer, rates should remain capped.
- On the whole, this number is supportive for the USD. Against a backdrop where expectations for payrolls were already bleak (in part due to GM strike), positive revisions and firming wages do look encouraging in that context. Overall, this number helps to reaffirm the Fed's hawkish cut and extended pause. By extension, today's number should also help to reinforce our current biases - EURUSD looks toppish around 1.12 and USDCAD poised to trade higher with an eye towards 1.33 near-term (as the BOC flips more dovish while other central banks stand pat)."
- U.S. economy is not immune to the slowdown in the global growth
- U.S. manufacturing is weakest in a decade
- The good news is the U.S. consumer is strong, the job market is tight
- If consumers stay strong, we will have solid growth
- Monetary policy is now basically appropriate, I strongly advocate we remain patient from here
- Official statements from China sound more optimisitc, positive than in past, a 'leading indicator' for a deal
- Tariff hikes still on the table until Phase One completed
- Issues to go on enforcement, forced tech transfer may be put into Phase Two
- Financial services and FX chapters of trade deal are virtually wrapped up, along with agriculture
- U.S. monetary policy moving in the right direction
- There have been no conversations to get rid of Powell
The Commerce
Department announced on Friday that construction spending rose 0.5 percent
m-o-m in September after a revised 0.3 percent m-o-m decline in August (originally
a 0.1 percent m-o-m gain).
Economists had
forecast construction spending increasing 0.2 percent m-o-m in September.
According to
the report, investment in public construction surged 1.5 percent m-o-m, while
spending on private construction increased 0.2 percent m-o-m.
On a y-o-y
basis, construction spending dropped 2.0 percent in September.
A report from
the Institute for Supply Management (ISM) showed on Friday the U.S.
manufacturing sector’s activity contracted in October.
The ISM's index of manufacturing activity came in at 48.3 percent last month, up 0.5 percentage point from the September reading of 47.8 percent, but missed economists' forecast for a 48.9 percent reading.
A reading above 50 percent indicates expansion, while a reading below 50 percent indicates contraction.
According to
the report, the Production Index came in at 46.2 percent, down 1.1 percentage
points from the September reading, the Deliveries Index registered 49.5
percent, a 1.6-percentage point decrease from the September reading, and the Prices
Index recorded 45.5 percent, a 4.2-percentage point decrease from the September
reading of 49.7 percent. At the same time, the New Orders Index stood at 49.1
percent, up 1.8 percentage points from the September reading, the Employment
Index registered 47.7 percent, a 1.4-percentage point increase from the
September reading, and the Inventories Index recorded 48.9 percent, an increase
of 2 percentage points from the September reading.
Timothy R.
Fiore, Chair of the ISM Manufacturing Business Survey Committee said, “The past
relationship between the PMI and the overall economy indicates that the PMI for
for October (48.3 percent) corresponds to a 1.6-percent increase in real gross
domestic product (GDP) on an annualized basis."
- U.S. economy is very resilient
- Risks still tilted to the downside 'somewhat'
- We will be data-dependent, every meeting is live
- Economy and monetary policy are in a good place
- Watching for cumulative evidence of missing on goals
- We don't see a crack in the consumer
- U.S. consumer has never been in better shape
- Seen a rebound in housing, which is now contributing to growth
James Knightley, the Chief International Economist at ING, notes that U.S. non-farm payrolls beat expectations in October, rising 128,000 versus the consensus forecast of 85,000.
- "What’s more impressive is that this was despite the GM strike (and the associated knock-on at suppliers), which subtracted 41,600 from the figure – if you aren’t working then you aren’t counted as employed for this survey. Moreover, with a net 95,000 upward revision to jobs numbers for August and September it suggests that the US labour market is more resilient than feared and offers support to the view that the Fed well may leave interest rates unchanged in December after three consecutive cuts.
- Nonetheless, payrolls growth remains on a softening trend. Having averaged 223,000 jobs per month through 2018, employment creation is running at a net 167,000 for 2019. Interestingly, this can be broadly seen in all components expect one – leisure and hospitality – which has recorded consecutive gains of 48,000, 45,000 and 61,000 per month. The fact that this one, relatively modest-sized component was responsible for half of all the jobs created is perhaps a signal that we shouldn’t get too excited by today’s figures.
- The other parts of the report weren’t quite as positive. The unemployment rate ticked higher by a tenth of a point to 3.6% while wage growth rose 0.2% versus the 0.3% consensus. This leaves the annual rate of wage growth at 3%, which is respectable, but still low by historical standards and when considering the low unemployment rate.
- Wednesday’s FOMC press release and Jerome Powell’s press conference clearly indicated the Federal Reserve’s preference is to take stock of the impact of the July, September and October interest rate cuts and probably pause in December. Today’s report seemingly supports that assessment. However, we continue to highlight that the data flow indicates that the slowdown that started in manufacturing is spreading to other sectors of the economy and with little to suggest an imminent turnaround in global economic prospects, we still see a strong chance that the Fed will need to cut rates further. We continue to have a December 25 basis point cut in our forecasts, but obviously there is a growing likelihood that slips into 1Q 2020."
U.S. stock-index futures rose on Friday, supported by better-than-expected employment report for October.
Global Stocks:
Index/commodity | Last | Today's Change, points | Today's Change, % |
Nikkei | 22,850.77 | -76.27 | -0.33% |
Hang Seng | 27,100.76 | +194.04 | +0.72% |
Shanghai | 2,958.20 | +29.14 | +0.99% |
S&P/ASX | 6,669.10 | +5.70 | +0.09% |
FTSE | 7,278.18 | +29.80 | +0.41% |
CAC | 5,764.13 | +34.27 | +0.60% |
DAX | 12,943.43 | +76.64 | +0.60% |
Crude oil | $54.88 | +1.29% | |
Gold | $1,508.70 | -0.40% |
FX Strategists at UOB Group suggest that, in light of the recent performance, there is the possibility that USD/JPY could drop and test the mid-107.00s in the next weeks.
- "24-hour view: The sharp and rapid decline in USD came as a surprise as it registered the largest 1-day decline in 10 weeks (108.02, -0.74%). While oversold, the decline has scope to extend lower even though the strong 107.75 support may not yield so easily (next support is at 107.50). On the upside, only a move back above 108.35 (minor resistance at 108.20) would indicate the current weakness has stabilized.
- Next 1-3 weeks: We highlighted on Tuesday (29 Oct, spot at 109.00) that USD is expected to “trade with an upside bias towards 109.30”. We added, “the prospect for a sustained advance above this level is not that high”. While USD touched 109.28 on Wednesday (30 Oct), the subsequent sharp plunge came as a surprise. The risk has swing quickly to the downside and from here, USD could trade lower towards 107.50 within the next several days (next support is at 107.00). Only a move above 108.60 would indicate that our view is wrong."
(company / ticker / price / change ($/%) / volume)
3M Co | MMM | 165.94 | 0.95(0.58%) | 830 |
ALCOA INC. | AA | 20.91 | 0.12(0.58%) | 3939 |
ALTRIA GROUP INC. | MO | 44.85 | 0.06(0.13%) | 3767 |
Amazon.com Inc., NASDAQ | AMZN | 1,787.84 | 11.18(0.63%) | 18713 |
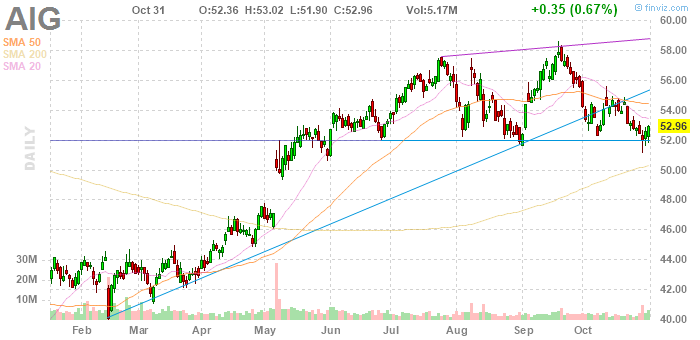
AMERICAN INTERNATIONAL GROUP | AIG | 51.65 | -1.31(-2.47%) | 88767 |
Apple Inc. | AAPL | 249.55 | 0.79(0.32%) | 242751 |
AT&T Inc | T | 38.61 | 0.12(0.31%) | 71053 |
Boeing Co | BA | 341.78 | 1.87(0.55%) | 14028 |
Caterpillar Inc | CAT | 138.43 | 0.63(0.46%) | 2430 |
Chevron Corp | CVX | 115.05 | -1.09(-0.94%) | 19575 |
Cisco Systems Inc | CSCO | 46.63 | -0.88(-1.85%) | 81228 |
Citigroup Inc., NYSE | C | 71.9 | 0.55(0.77%) | 30352 |
Deere & Company, NYSE | DE | 174.62 | 0.48(0.28%) | 890 |
Exxon Mobil Corp | XOM | 67.95 | 0.38(0.56%) | 110781 |
Facebook, Inc. | FB | 193.2 | 1.55(0.81%) | 135089 |
FedEx Corporation, NYSE | FDX | 153 | 0.34(0.22%) | 852 |
Ford Motor Co. | F | 8.63 | 0.04(0.47%) | 46678 |
Freeport-McMoRan Copper & Gold Inc., NYSE | FCX | 9.9 | 0.08(0.81%) | 711 |
General Electric Co | GE | 9.99 | 0.01(0.10%) | 130060 |
Goldman Sachs | GS | 214.55 | 1.17(0.55%) | 2831 |
Google Inc. | GOOG | 1,264.00 | 3.89(0.31%) | 2655 |
Home Depot Inc | HD | 235.65 | 1.07(0.46%) | 257 |
Intel Corp | INTC | 56.39 | -0.14(-0.25%) | 57342 |
International Business Machines Co... | IBM | 134.41 | 0.68(0.51%) | 1636 |
Johnson & Johnson | JNJ | 132.6 | 0.56(0.42%) | 3460 |
JPMorgan Chase and Co | JPM | 125.91 | 0.99(0.79%) | 17085 |
McDonald's Corp | MCD | 197.3 | 0.60(0.31%) | 4510 |
Merck & Co Inc | MRK | 87.1 | 0.44(0.51%) | 5395 |
Microsoft Corp | MSFT | 144.12 | 0.75(0.52%) | 75708 |
Nike | NKE | 89.8 | 0.25(0.28%) | 2406 |
Pfizer Inc | PFE | 38.58 | 0.21(0.55%) | 9656 |
Procter & Gamble Co | PG | 124.5 | -0.01(-0.01%) | 873 |
Starbucks Corporation, NASDAQ | SBUX | 84.7 | 0.14(0.17%) | 10789 |
Tesla Motors, Inc., NASDAQ | TSLA | 316.93 | 2.01(0.64%) | 24796 |
The Coca-Cola Co | KO | 54.55 | 0.12(0.22%) | 1882 |
Twitter, Inc., NYSE | TWTR | 30.12 | 0.15(0.50%) | 76095 |
United Technologies Corp | UTX | 143.4 | -0.18(-0.13%) | 6411 |
Verizon Communications Inc | VZ | 60.4 | -0.07(-0.12%) | 2186 |
Visa | V | 179.2 | 0.34(0.19%) | 2298 |
Wal-Mart Stores Inc | WMT | 117.9 | 0.64(0.55%) | 1401 |
Walt Disney Co | DIS | 130.4 | 0.48(0.37%) | 11878 |
Yandex N.V., NASDAQ | YNDX | 33.38 | -0.01(-0.03%) | 1101 |
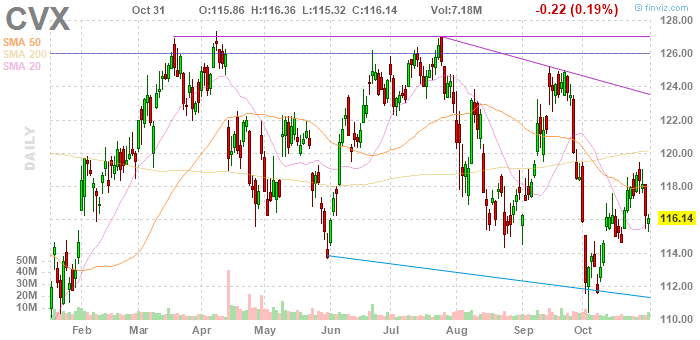
Chevron (CVX) reported Q3 FY 2019 earnings of $1.36 per share (versus $2.11 in Q3 FY 2018), missing analysts’ consensus estimate of $1.46.
The company’s quarterly revenues amounted to $36.116 bln (-17.9% y/y), missing analysts’ consensus estimate of $37.690 bln.
CVX fell to $115.00 (-0.98%) in pre-market trading.
The U.S. Labor
Department announced on Friday that nonfarm payrolls increased by 128,000 in
October after an upwardly revised 180,000 gain in the prior month (originally
an increase of 136,000).
According to
the report, significant job gains occurred in food services and drinking places
(+48,000 jobs), social assistance (+20,000), and financial activities (+16,000).
Meanwhile, within manufacturing (-36,000 jobs), employment in motor vehicles
and parts (-42,000) decreased due to strike activity at General Motors. Federal
government employment also dropped (-17,000 jobs), as 20,000 temporary workers
who had been preparing for the 2020 Census completed their work.
The
unemployment rate rose to 3.6 percent in October from 3.5 percent in September.
Economists had
forecast 89,000 new jobs and the jobless rate to increase to 3.6 percent.
The labor force
participation rate edged up to 63.3 percent in October from 63.2 percent in September,
while hourly earnings for private-sector workers rose 0.2 percent m-o-m (+6
cent) to $28.18, following a revised 0.4 percent m-o-m gain in September
(originally unchanged m-o-m). Economists had forecast a 0.3 percent m-o-m advance
in the average hourly earnings. Over the year, average hourly earnings have
increased by 3.0 percent, the same pace as in September.
The average
workweek remained unchanged at 34.4 hours in October, matching economists’
forecast.
FX Strategists at UOB Group suggested that, following the recent price action, the Aussie Dollar is to move to the 0.6950 area vs. the Greenback in the next weeks.
- "24-hour view: AUD surged and touched a 3-month high of 0.6929 before retreating quickly to end lower at 0.6894 (-0.13%). Upward momentum has dissipated and 0.6929 is viewed as an interim top. For today, AUD is likely to trade sideways to slightly lower, expected to be between 0.6865 and 0.6920.
- Next 1-3 weeks: While AUD cracked the 0.6900 resistance yesterday (high of 0.6930), it dropped back quickly and ended the day just below 0.6900 (NY close of 0.6895, -0.13%). While the daily closing is on the soft side, the price action suggests AUD is likely to trade with an upside bias towards 0.6950. That said, ‘hesitant’ upward momentum suggests that the prospect for a sustained break above 0.6950 (next resistance is at 0.6970) is not high for now. On the downside, a move below 0.6835 (‘strong support’ level) would indicate that our view is wrong."
- U.S. pretty comfortable with the deal
- Hopes to resurrect date to sign deal around same timeframe as APEC schedule
- Fed rate cut will be good for housing sector
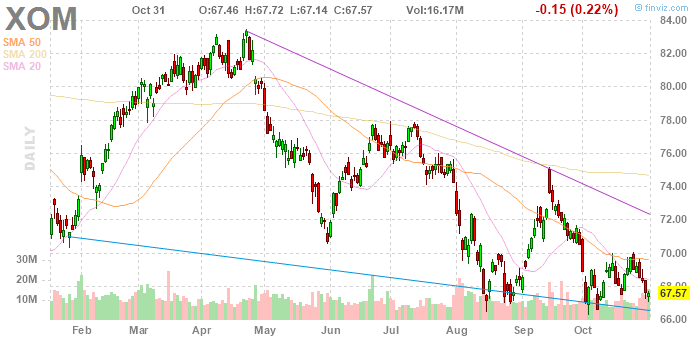
Exxon Mobil (XOM) reported Q3 FY 2019 earnings of $0.75 per share (versus $1.46 in Q3 FY 2018), beating analysts’ consensus estimate of $0.66.
The company’s quarterly revenues amounted to $65.049 bln (-15.1% y/y), missing analysts’ consensus estimate of $65.864 bln.
XOM rose to $67.97 (+0.59%) in pre-market trading.
Economists at Standard Chartered provide key insights into the official Chinese Manufacturing PMI report released on Wednesday.
- “Official manufacturing PMI edged down to lowest level since February on slower production activity.
- Trade performance likely deteriorated, with related PMI sub-indexes falling to lower levels.
- Real activity growth may have moderated; CPI inflation likely edged up further to a 7-year high.
- We expect money growth to have eased in October, credit growth to have stayed flat.”
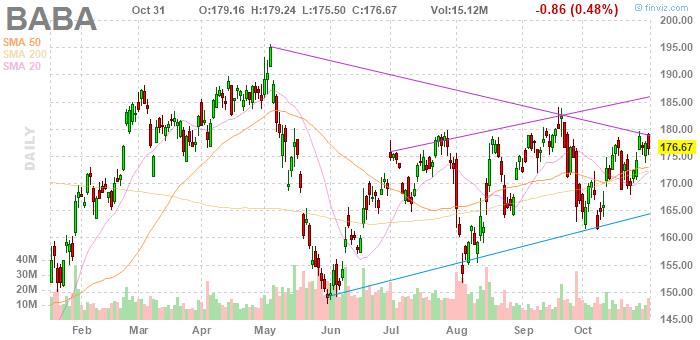
Alibaba (BABA) reported Q2 FY 2019 earnings of RMB13.10 per share (versus RMB9.60 in Q2 FY 2018), beating analysts’ consensus estimate of RMB10.68.
The company’s quarterly revenues amounted to RMB119.017 bln (+39.8% y/y), beating analysts’ consensus estimate of RMB116.512 bln.
BABA rose to $179.38 (+1.53%) in pre-market trading.
- Says Labour promised to deliver Brexit but they are now promising another referendum
- Labour is betraying its own voters over Brexit
- Brexit Party poses a very big problem for Labour in 'Leave' seats
- Now if this Brexit treaty passes, it will lead to massive pressure for an independence referendum in Scotland
- This deal is not true Brexit
- PM Johnson's deal doesn't get Brexit done
- Proposes to PM Johnson to form an alliance
- Says if PM agreed to an alliance, we could win this election
- We will contest for every single seat
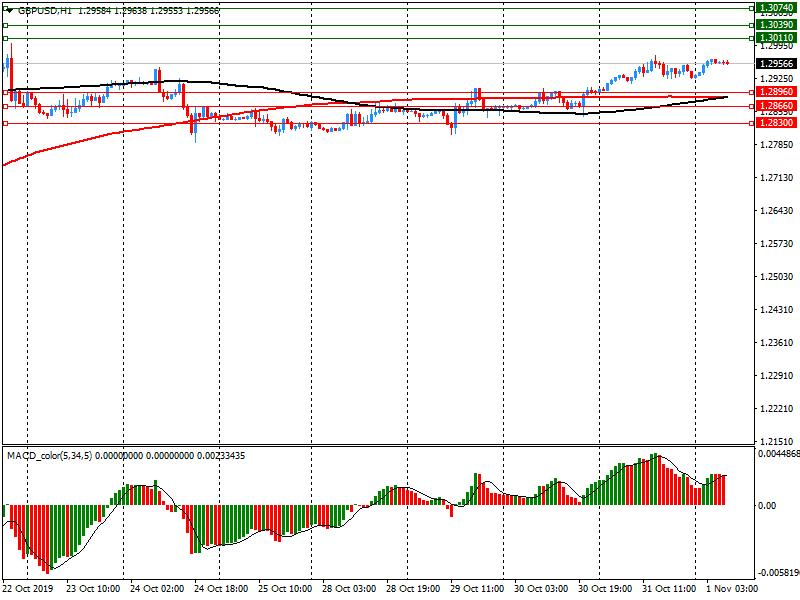
Cable is seen extending the sideline trading in the next week, in opinion of FX Strategists at UOB Group.
24-hour view: “GBP briefly touched 1.2975 but eased off to close at 1.2939 (+0.28%). Despite the relatively firm daily closing, upward momentum is lackluster and the prospect for GBP to move beyond 1.2975 is not high. From here, GBP is more likely to trade sideways to slightly lower, expected to be within a 1.2895/1.2965 range”.
Next 1-3 weeks: “While the underlying tone in GBP has improved as it closed higher for the fourth straight day yesterday (31 Oct), we continue hold the view that last Monday’s (21 Oct) 1.3012 peak is a short-term top. As highlighted on Tuesday (29 Oct, spot at 1.2855), “Looking ahead, further GBP strength is not ruled out even though the 1.3000/10 level is acting as a ‘high-water mark’ and would be a tough level to crack”. In other words, GBP is expected to trade sideways for now, likely between 1.2800 and 1.3000 (range narrowed from 1.2700/1.3000 previously). Even if GBP were to crack 1.3000 again, there is another formidable resistance at 1.3050”.
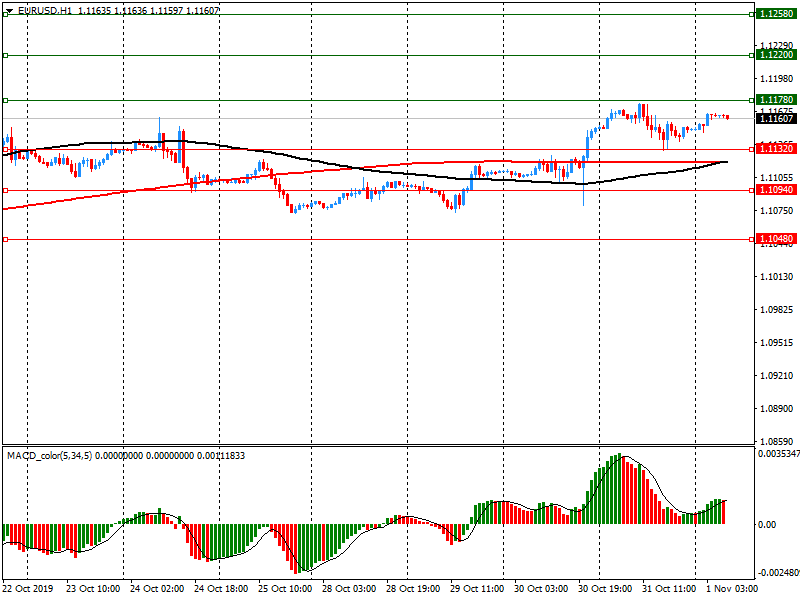
FX Strategists at UOB Group remarked the need of EUR/USD to surpass the 1.1180 region to allow for extra gains.
24-hour view: “EUR rose to 1.1174 yesterday, just a few pips below last month’s peak near 1.1180. The rapid retreat from the high has resulted in a loss in momentum. That said, it is too early to expect a significant pullback. The current movement is viewed as part of a consolidation phase. In other words, EUR is likely to trade sideways for today, expected to be within a 1.1125/1.1175 range”.
Next 1-3 weeks: “There is not much to add to the update from yesterday (31 Oct, spot at 1.1155). As highlighted, EUR has to punch through last month’s peak at 1.1179 or the current upward momentum could deteriorate quickly. Note that the positive phase in EUR that started earlier last month is in its fourth week now and if EUR were hover below the 1.1179 peak, the risk of a top would increase quickly. Looking ahead, a clear break of 1.1179 would increase the odds for a break of 1.1200 (the next resistance is at 1.1250). On the downside, only a move below 1.1090 (‘strong support’ level finally moved higher from 1.1070) would indicate that the current EUR strength has run its course”.
In opinion of Karen Jones, Team Head FICC Technical Analysis Research at Commerzbank, the cross could extend losses to, initially, the 120.00 neighbourhood.
“EUR/JPY is at last showing signs of failure at tough resistance which extends from current levels all the way up to the 200 day ma at 122.11. It currently remains capped by the 121.34/ 50% Fibonacci retracement and the 121.38 late July high (on a closing basis). Yesterday’s price action constituted an outside day to the downside, which is negative. We should see a test of the 20 day ma at 120.07 and the 55 day ma at 118.79 and eventually the 118.06 uptrend. The October low at 117.06 guards the 116.58/115.87 recent lows”.
Economist Ho Woei Chen at UOB Group evaluated the recent PMI releases in China and the outlook on the economic activity.
“China’s official PMIs for October showed further signs of weakness in both the manufacturing and non-manufacturing sectors. The US and China still face significant challenges in addressing bilateral trade concerns but there are enough positive developments to point to the likely success of a “Phase 1” trade deal. The cancellation of the 16-17 November APEC summit may lead to some delays but the interim agreement is expected to be signed before 15 December when the US is scheduled to implement new additional tariffs of 15% on approximately US$160 of Chinese goods. The cancellation of these new additional tariffs will help to further de-escalate the trade tensions. Looking ahead, China’s manufacturing outlook is dependent on the sustainability of the US-China trade truce and prospect of an eventual trade agreement. As there remains significant uncertainties, China’s growth outlook may stay weak into 2020 should existing tariffs stay in force. China’s economy expanded by 6.2% y/y in the first three quarters of 2019. For now, we maintain our growth forecast for China to expand 6.1% in 2019 (4Q19f: 6.0%) and 5.9% in 2020”.
According to the report from IHS Markit, ongoing uncertainties surrounding Brexit, the economic outlook and the political situation continued to weigh on the UK manufacturing sector during October. Output and new order inflows contracted, leading to further job losses. Firms also ramped up stock-building and purchasing activity in the lead-up to the (postponed) October Brexit departure date.
The headline seasonally adjusted IHS Markit/CIPS PMI rose to 49.6 in October, up for the second successive month but remaining below the neutral 50.0 mark separating expansion from contraction. Economists had expected a decrease to 48.1. Please note that data for the latest survey were collected from 11-28 October. This was before the confirmation of the latest Brexit extension on the 28th and the passing of the Early Parliamentary General Election Bill by the UK House of Commons on the 29th.
The downturn in manufacturing production continued, although the rate of contraction slowed. Firms reported that weaker inflows of new business, especially from the domestic market, had led to a further scaling back of output. This was partly offset by manufacturers who raised production to build-up stocks in advance of the October Brexit deadline.
Francesco Pesole, FX Strategist at ING, expects the dollar weakness to be mainly channelled via the activity currencies, with the NZD possibly leading the pack.
"Our economics team is expecting today's US jobs data to be below market expectations, with the headline employment increase at 70k in October versus the consensus 85k (according to a Bloomberg survey). The Oct ISM manufacturing will also be closely watched. Consensus overestimated the index in five of the past six reads, and our economists believe this could be the case again as they see the widely expected rebound in the gauge limited to 48.5 (vs cons. 49). We expect today’s slew of data to weigh on the dollar whilst possibly undermining the freshly-formed expectations that the Fed will pause in December. The slew of Fed speakers (Kaplan, Clarida, Quarles, Daly, Williams) may also attract some attention as markets seek clarity after this week’s FOMC announcement. The kiwi dollar has outperformed risk-sensitive peers AUD and CAD, gaining good momentum. NZD/USD is now stabilizing above 0.64, mostly thanks to a strong repricing of RBNZ rate expectations and some short-squeezing effect (the NZD is the most oversold currency in G10). We expect such momentum to help NZD outperform the G10 block if payrolls disappoint".
China's Foreign Ministry said on Friday China and the United States have maintained close contact on a potential meeting of U.S. President Donald Trump and Chinese President Xi Jinping.
Trump said on Thursday that the two countries would soon announce a new location at which he and Xi would sign a "Phase One" trade deal.
But speaking at a daily news briefing in Beijing, ministry spokesman Geng Shuang dismissed as speculation talk the two leaders will meet in Macau.
Britain's government will not name a successor to Bank of England Governor Mark Carney before a national election due on Dec. 12, a finance ministry official said.
Earlier on Thursday, a spokesman for Prime Minister Boris Johnson said the process for the appointment remained on track to be made this autumn.
The BoE's current governor, Mark Carney, is due to leave the central bank on Jan. 31, which is also the latest deadline for Britain to leave the European Union.
By convention, British governments do not make major appointments in the run-up to elections.
Finance Minister Sajid Javid said earlier this month that he was looking for an independent-minded new BoE governor.
The U.S. dollar index could fall to as low as 85 as the Federal Reserve grows its balance sheet again by purchasing more bond assets, a Citi strategist said.
“Our latest projections are that it would weaken even further — maybe to the high 80s, perhaps even as low as 85,” Mohammed Apabhai, head of Asia Pacific trading strategies group at Citi, told CNBC.
Technical analyst Daryl Guppy said last year that 85 is a “historical support level” for the dollar.
The Fed increases its balance sheet by buying up bonds and Treasurys as a way of pumping cash into the market. That in turn makes bond yields — which move inversely to prices — drop as the bond prices rise. The dollar usually weakens when bond yields fall.
“We’re basically saying that the Fed is probably going to be the most dovish of all the central banks, regardless of the fact that … they’ve put rates on pause,” he said.
That’s because the Fed’s balance sheet has expanded quickly, by more than $205 billion since the beginning of September, Apabhai explained. In comparison, an increase of that size would take the European Central Bank more than a year to complete, he said.
“For us, the fact that the Fed has gone into pause mode is not really as significant as the fact that the balance sheet of the Fed is going to expand,” he said. “We’re basically looking at substantially weaker levels on the dollar.”
If the dollar index were to weaken to 85, the euro could strengthen to 1.21 against the greenback, Apabhai predicted. “That’s … going to be very positive for emerging market equities.”
Cable is expected to keep the bullish view unchanged while above 1.2582, noted Karen Jones, Team Head FICC Technical Analysis Research at Commerzbank.
“GBP/USD has recovered from near term support offered by the 1.2784 25th June high. This leaves the market well placed to tackle psychological resistance at 1.30. Directly above here we have the 200 week ma at 1.3138 and the 1.3187 May high and these remain our short term targets. The 200 day ma at 1.2711 guards 1.2582. For now, provided dips lower hold over 1.2582 (20th September high) an immediate upside bias is maintained. The 1.3187 May high guards the 1.3382 2019 high. Below 1.2582 lies the 1.2382 17th July low and the 1.2348 uptrend. The uptrend guards 1.2196/94”.
According to the report from Federal Statistical Office (FSO), turnover adjusted for sales days and holidays rose in the retail sector by 0.6% in nominal terms in September 2019 compared with the previous year. Seasonally adjusted, nominal turnover fell by 0.5% compared with the previous month.
Real turnover adjusted for sales days and holidays rose in the retail sector by 0.9% in September 2019 compared with the previous year. Real growth takes inflation into consideration. Compared with the previous month, real, seasonally adjusted retail trade turnover registered a decline of 0.3%.
Adjusted for sales days and holidays, the retail sector excluding service stations showed a 1.3% increase in nominal turnover in September 2019 compared with September 2018 (in real terms +1.4%). Retail sales of food, drinks and tobacco registered an increase in nominal and real turnover of 0.3% whereas the non-food sector registered a nominal plus of 2.3% (in real terms +2.9%).
Excluding service stations, the retail sector showed a seasonally adjusted decline in nominal turnover of 0.6% compared with the previous month (in real terms –0.5%). Retail sales of food, drinks and tobacco registered a nominal minus of 0.5% (in real terms –0.6%). The non-food sector showed a minus of 0.3% (in real terms 0.0%).
A separate report from the FSO showed, the consumer price index (CPI) fell by 0.2% in October 2019 compared with the previous month, reaching 101.8 points (December 2015 = 100). Inflation was –0.3% compared with the same month of the previous year. Prices were expected to remain unchanged.
The decrease of 0.2% compared with the previous month can be explained by several factors including falling prices for international package holidays and hotel accommodation. The prices of vegetables and pasta also declined. In contrast, prices for clothing and footwear increased.
U.S. President Donald Trump is fighting an “all-front” trade war and that may not be a bad thing for China, said one professor at the London School of Economics.
Washington has locked itself into trade disputes with multiple countries, which has weakened historical ties and prevented some of those nations from aligning themselves against China, said Keyu Jin, associate professor of economics at LSE, told CNBC.
“Trump is fighting an all-front war. What could not be better for China? If there were not such a strong alliance with Europe, which is what China’s more concerned about — everyone ganging up against China. Now, Trump is not making that possible, so that’s why he’s the least worst option,” Jin said.
The U.S. and China have slapped tariffs on billions of dollars of one another’s goods. But key sticking points in trade talks include other issues like intellectual property protection and forced technology transfers.
“It is pushing China’s strive for self-sufficiency, technological independence,” Jin said.
For one, China is developing its own chip industry to increase domestic semiconductor production, she said.
In light of the ongoing performance, DXY faces increasing risks of a sharp pullback, suggested Quek Ser Leang of Global Economics & Markets Research at UOB Group.
“USD Index (DXY) rose to a 29-month high of 99.67 in October before dropping back to end the month sharply lower at 97.35. The weak monthly closing is not only the largest 1-month decline in 21 months but is also an ‘outside reversal bar’. On the weekly chart, the decline took out the 20-month rising trend line connecting the low of 88.25 (Feb 2018) and the high of 99.67 (Oct 2019). The break of the strong rising trend line support coincided with weekly MACD crossing into negative territory. All in, the above suggests 99.67 could be a significant top and the current price action is likely the early stages of a pull-back that appears to have ample room to extend lower. From here, the next weekly support is at 95.84 but the stronger support is further down at 95.02. On the upside, resistance is at 98.80 and we doubt the October peak of 99.67 would come back into the picture for the next several months”.
EUR/USD
Resistance levels (open interest**, contracts)
$1.1257 (2956)
$1.1217 (2825)
$1.1187 (3049)
Price at time of writing this review: $1.1159
Support levels (open interest**, contracts):
$1.1122 (1716)
$1.1088 (2859)
$1.1045 (2465)
Comments:
- Overall open interest on the CALL options and PUT options with the expiration date November, 8 is 72985 contracts (according to data from October, 31) with the maximum number of contracts with strike price $1,1000 (4058);
GBP/USD
Resistance levels (open interest**, contracts)
$1.3074 (686)
$1.3039 (1929)
$1.3011 (1671)
Price at time of writing this review: $1.2957
Support levels (open interest**, contracts):
$1.2896 (1192)
$1.2866 (175)
$1.2830 (240)
Comments:
- Overall open interest on the CALL options with the expiration date November, 8 is 26824 contracts, with the maximum number of contracts with strike price $1,3200 (3252);
- Overall open interest on the PUT options with the expiration date November, 8 is 32073 contracts, with the maximum number of contracts with strike price $1,2100 (3166);
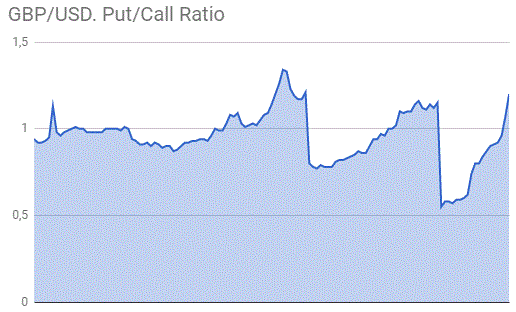
- The ratio of PUT/CALL was 1.20 versus 1.07 from the previous trading day according to data from October, 31
* - The Chicago Mercantile Exchange bulletin (CME) is used for the calculation.
** - Open interest takes into account the total number of option contracts that are open at the moment.
| Raw materials | Closed | Change, % |
|---|---|---|
| Brent | 59.29 | -1.28 |
| WTI | 54.08 | -1.4 |
| Silver | 18.08 | 1.35 |
| Gold | 1512.006 | 1.11 |
| Palladium | 1795.27 | -0.51 |
| Index | Change, points | Closed | Change, % |
|---|---|---|---|
| NIKKEI 225 | 83.92 | 22927.04 | 0.37 |
| Hang Seng | 239.01 | 26906.72 | 0.9 |
| KOSPI | 3.21 | 2083.48 | 0.15 |
| ASX 200 | -26.1 | 6663.4 | -0.39 |
| FTSE 100 | -82.4 | 7248.38 | -1.12 |
| DAX | -43.44 | 12866.79 | -0.34 |
| Dow Jones | -140.46 | 27046.23 | -0.52 |
| S&P 500 | -9.21 | 3037.56 | -0.3 |
| NASDAQ Composite | -11.62 | 8292.36 | -0.14 |
| Pare | Closed | Change, % |
|---|---|---|
| AUDUSD | 0.6891 | -0.12 |
| EURJPY | 120.46 | -0.77 |
| EURUSD | 1.11511 | -0 |
| GBPJPY | 139.638 | -0.54 |
| GBPUSD | 1.29262 | 0.22 |
| NZDUSD | 0.64132 | 0.21 |
| USDCAD | 1.31637 | 0.03 |
| USDCHF | 0.98643 | -0.29 |
| USDJPY | 108.015 | -0.77 |
© 2000-2026. Sva prava zaštićena.
Sajt je vlasništvo kompanije Teletrade D.J. LLC 2351 LLC 2022 (Euro House, Richmond Hill Road, Kingstown, VC0100, St. Vincent and the Grenadines).
Svi podaci koji se nalaze na sajtu ne predstavljaju osnovu za donošenje investicionih odluka, već su informativnog karaktera.
The company does not serve or provide services to customers who are residents of the US, Canada, Iran, The Democratic People's Republic of Korea, Yemen and FATF blacklisted countries.
Izvršenje trgovinskih operacija sa finansijskim instrumentima upotrebom marginalne trgovine pruža velike mogućnosti i omogućava investitorima ostvarivanje visokih prihoda. Međutim, takav vid trgovine povezan je sa potencijalno visokim nivoom rizika od gubitka sredstava. Проведение торговых операций на финанcовых рынках c маржинальными финанcовыми инcтрументами открывает широкие возможноcти, и позволяет инвеcторам, готовым пойти на риcк, получать выcокую прибыль, но при этом неcет в cебе потенциально выcокий уровень риcка получения убытков. Iz tog razloga je pre započinjanja trgovine potrebno odlučiti o izboru odgovarajuće investicione strategije, uzimajući u obzir raspoložive resurse.
Upotreba informacija: U slučaju potpunog ili delimičnog preuzimanja i daljeg korišćenja materijala koji se nalazi na sajtu, potrebno je navesti link odgovarajuće stranice na sajtu kompanije TeleTrade-a kao izvora informacija. Upotreba materijala na internetu mora biti praćena hiper linkom do web stranice teletrade.org. Automatski uvoz materijala i informacija sa stranice je zabranjen.
Ako imate bilo kakvih pitanja, obratite nam se pr@teletrade.global.
