- Analiza
- Novosti i instrumenti
- Vesti sa tržišta
Forex-novosti i prognoze od 01-10-2024
- EUR/USD tumbled 0.6% on Tuesday as risk-off flows drag Fiber down.
- Middle East escalations crimped already-hobbled investor sentiment.
- EU HICP inflation and US ISM PMIs broadly miss the mark.
EUR/USD tumbled six-tenths of one percent on Tuesday, finding a minor bounce from the 1.1050 level as geopolitical tensions and souring economic data crimp risk appetite flows, bolstering the Greenback and dragging the Fiber to its lowest prices in almost a month.
European Harmonized Index of Consumer Price (HICP) inflation ticked lower at a faster pace than expected in September. YoY core HICP inflation ticked down to 2.7% on an annual basis, while MoM headline HICP inflation swooned to just 1.8% in September, an even faster drop from the previous 2.2% than the forecast 1.9%.
Forex Today: The US labour market will be in the spotlight along with Fed speakers
European economic data will take a backseat for the remainder of the week as investors pivot to face Friday’s upcoming Nonfarm Payrolls (NFP) report. A trickle of meaningful-in-the-aggregate yet individually meaningless economic data litters the landscape on the road to Friday’s NFP jobs report, and investors are grappling with middling releases that are routinely missing the mark.
In September, the US ISM Manufacturing PMI remained at 47.2 for the second consecutive month, falling short of the expected increase to 47.5. Additionally, ISM Manufacturing Prices Paid dropped to 48.3, down from the previous 54.0, indicating a contraction. Shifting focus to US employment data, JOLTS Job Openings in August surged to 8.04 million, surpassing the revised 7.7 million from the previous period. Despite this, the increase in job openings may not directly translate into new hires as the ISM Manufacturing Employment Index for September declined to 43.9 from the previous 46.0, failing to meet the anticipated rise to 47.0.
Turning to geopolitical concerns, investor attention has pivoted towards the Middle East following reports of Iran launching a missile attack against Israel in response to Israel's recent incursion into Lebanon. The US has pledged to respond in support of Israel, leading to apprehension among investors about a potential rapid escalation of the conflict.
EUR/USD price forecast
Tuesday’s backslide saw Fiber price action come within inches of the 50-day Exponential Moving Average (EMA) near 1.1045. EUR/USD found some bids late in the day, but the pair remains firmly off-balance, entirely reversing the latest bullish push into yearly highs above 1.1200.
With highs slipping out of reach of intraday bidders, buyers are now on the defensive and near-term momentum is leaning increasingly bearish. The immediate near-term goal for bidding pressure will be to drag the bidding line back above the 1.1100 handle.
EUR/USD daily chart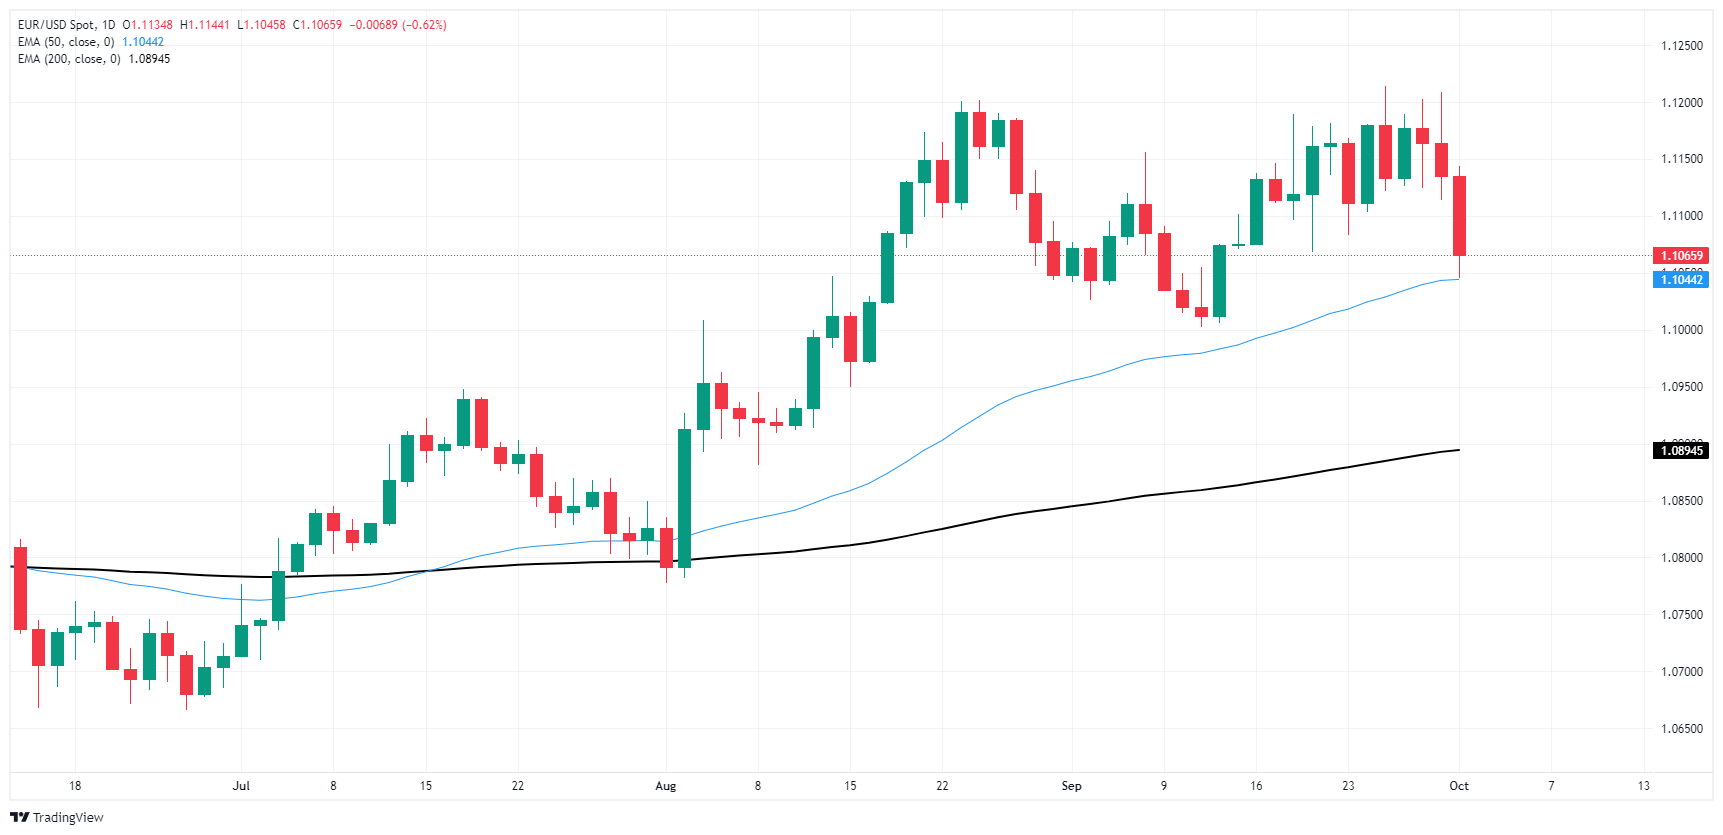
Euro FAQs
The Euro is the currency for the 19 European Union countries that belong to the Eurozone. It is the second most heavily traded currency in the world behind the US Dollar. In 2022, it accounted for 31% of all foreign exchange transactions, with an average daily turnover of over $2.2 trillion a day. EUR/USD is the most heavily traded currency pair in the world, accounting for an estimated 30% off all transactions, followed by EUR/JPY (4%), EUR/GBP (3%) and EUR/AUD (2%).
The European Central Bank (ECB) in Frankfurt, Germany, is the reserve bank for the Eurozone. The ECB sets interest rates and manages monetary policy. The ECB’s primary mandate is to maintain price stability, which means either controlling inflation or stimulating growth. Its primary tool is the raising or lowering of interest rates. Relatively high interest rates – or the expectation of higher rates – will usually benefit the Euro and vice versa. The ECB Governing Council makes monetary policy decisions at meetings held eight times a year. Decisions are made by heads of the Eurozone national banks and six permanent members, including the President of the ECB, Christine Lagarde.
Eurozone inflation data, measured by the Harmonized Index of Consumer Prices (HICP), is an important econometric for the Euro. If inflation rises more than expected, especially if above the ECB’s 2% target, it obliges the ECB to raise interest rates to bring it back under control. Relatively high interest rates compared to its counterparts will usually benefit the Euro, as it makes the region more attractive as a place for global investors to park their money.
Data releases gauge the health of the economy and can impact on the Euro. Indicators such as GDP, Manufacturing and Services PMIs, employment, and consumer sentiment surveys can all influence the direction of the single currency. A strong economy is good for the Euro. Not only does it attract more foreign investment but it may encourage the ECB to put up interest rates, which will directly strengthen the Euro. Otherwise, if economic data is weak, the Euro is likely to fall. Economic data for the four largest economies in the euro area (Germany, France, Italy and Spain) are especially significant, as they account for 75% of the Eurozone’s economy.
Another significant data release for the Euro is the Trade Balance. This indicator measures the difference between what a country earns from its exports and what it spends on imports over a given period. If a country produces highly sought after exports then its currency will gain in value purely from the extra demand created from foreign buyers seeking to purchase these goods. Therefore, a positive net Trade Balance strengthens a currency and vice versa for a negative balance.
Iran launched over 200 ballistic missiles at Israel on Tuesday. The attack began at 7:30 p.m. Israel time, after the US had warned just hours before that a strike was imminent. The Israel Defence Forces reported several of the missiles were intercepted, and reports said one person was killed in the West Bank, per Bloomberg.
Israeli Prime Minister Benjamin Netanyahu vows to retaliate against Iran for a missile attack on Tuesday, but Tehran warned that any response would result in "vast destruction," fuelling fears of a wider war.
Market reaction
At the time of press, the Gold price was down 0.06% on the day at $2,661.
Risk sentiment FAQs
In the world of financial jargon the two widely used terms “risk-on” and “risk off'' refer to the level of risk that investors are willing to stomach during the period referenced. In a “risk-on” market, investors are optimistic about the future and more willing to buy risky assets. In a “risk-off” market investors start to ‘play it safe’ because they are worried about the future, and therefore buy less risky assets that are more certain of bringing a return, even if it is relatively modest.
Typically, during periods of “risk-on”, stock markets will rise, most commodities – except Gold – will also gain in value, since they benefit from a positive growth outlook. The currencies of nations that are heavy commodity exporters strengthen because of increased demand, and Cryptocurrencies rise. In a “risk-off” market, Bonds go up – especially major government Bonds – Gold shines, and safe-haven currencies such as the Japanese Yen, Swiss Franc and US Dollar all benefit.
The Australian Dollar (AUD), the Canadian Dollar (CAD), the New Zealand Dollar (NZD) and minor FX like the Ruble (RUB) and the South African Rand (ZAR), all tend to rise in markets that are “risk-on”. This is because the economies of these currencies are heavily reliant on commodity exports for growth, and commodities tend to rise in price during risk-on periods. This is because investors foresee greater demand for raw materials in the future due to heightened economic activity.
The major currencies that tend to rise during periods of “risk-off” are the US Dollar (USD), the Japanese Yen (JPY) and the Swiss Franc (CHF). The US Dollar, because it is the world’s reserve currency, and because in times of crisis investors buy US government debt, which is seen as safe because the largest economy in the world is unlikely to default. The Yen, from increased demand for Japanese government bonds, because a high proportion are held by domestic investors who are unlikely to dump them – even in a crisis. The Swiss Franc, because strict Swiss banking laws offer investors enhanced capital protection.
- USD/CAD trades stronger to around 1.3495 in Wednesday’s early Asian session.
- The US ISM Manufacturing PMI remains unchanged in September.
- Higher crude oil prices provide some support to the Loonie.
The USD/CAD pair trades with mild gains near 1.3495 during the early Asian session on Wednesday. The escalating geopolitical tensions in the Middle East boost the safe-haven currency like the US Dollar (USD).
Data released by the Institute for Supply Management (ISM) on Tuesday showed that the US Manufacturing Purchasing Managers Index (PMI) came in at 47.2 in September versus 47.2 prior, below the market consensus of 47.5. This figure was below the 50% threshold for the sixth consecutive month.
The US Federal Reserve (Fed) Chair, Jerome Powell, stated that more rate cuts are likely as the economy remains on solid ground, yet he cautioned against rapid changes. Atlanta Fed President Raphael Bostic said on Monday that he would be open to another half-percentage-point interest rate cut at the November meeting if upcoming data show job growth slowing faster than expected.
The US ADP Employment Change data will be in the spotlight later on Wednesday. Also, the US Federal Reserve (Fed) Thomas Barkin, Raphael Bostic, Beth Hammack, Alberto Musalem, and Michelle Bowman are set to speak.
On the other hand, crude oil prices rise after Iran launches rockets at Israel in a direct attack, raising fear of supply disruptions in the region. This, in turn, boosts the commodity-linked Canadian Dollar (CAD) against the Greenback. Iran launched over 200 ballistic missiles at Israel on Tuesday. This action was a reprisal after Israel carried out a dramatic series of attacks on Lebanon in recent days, killing Hezbollah leader Hassan Nasrallah in a Beirut airstrike and sending ground forces across the border, per Bloomberg.
Canadian Dollar FAQs
The key factors driving the Canadian Dollar (CAD) are the level of interest rates set by the Bank of Canada (BoC), the price of Oil, Canada’s largest export, the health of its economy, inflation and the Trade Balance, which is the difference between the value of Canada’s exports versus its imports. Other factors include market sentiment – whether investors are taking on more risky assets (risk-on) or seeking safe-havens (risk-off) – with risk-on being CAD-positive. As its largest trading partner, the health of the US economy is also a key factor influencing the Canadian Dollar.
The Bank of Canada (BoC) has a significant influence on the Canadian Dollar by setting the level of interest rates that banks can lend to one another. This influences the level of interest rates for everyone. The main goal of the BoC is to maintain inflation at 1-3% by adjusting interest rates up or down. Relatively higher interest rates tend to be positive for the CAD. The Bank of Canada can also use quantitative easing and tightening to influence credit conditions, with the former CAD-negative and the latter CAD-positive.
The price of Oil is a key factor impacting the value of the Canadian Dollar. Petroleum is Canada’s biggest export, so Oil price tends to have an immediate impact on the CAD value. Generally, if Oil price rises CAD also goes up, as aggregate demand for the currency increases. The opposite is the case if the price of Oil falls. Higher Oil prices also tend to result in a greater likelihood of a positive Trade Balance, which is also supportive of the CAD.
While inflation had always traditionally been thought of as a negative factor for a currency since it lowers the value of money, the opposite has actually been the case in modern times with the relaxation of cross-border capital controls. Higher inflation tends to lead central banks to put up interest rates which attracts more capital inflows from global investors seeking a lucrative place to keep their money. This increases demand for the local currency, which in Canada’s case is the Canadian Dollar.
Macroeconomic data releases gauge the health of the economy and can have an impact on the Canadian Dollar. Indicators such as GDP, Manufacturing and Services PMIs, employment, and consumer sentiment surveys can all influence the direction of the CAD. A strong economy is good for the Canadian Dollar. Not only does it attract more foreign investment but it may encourage the Bank of Canada to put up interest rates, leading to a stronger currency. If economic data is weak, however, the CAD is likely to fall.
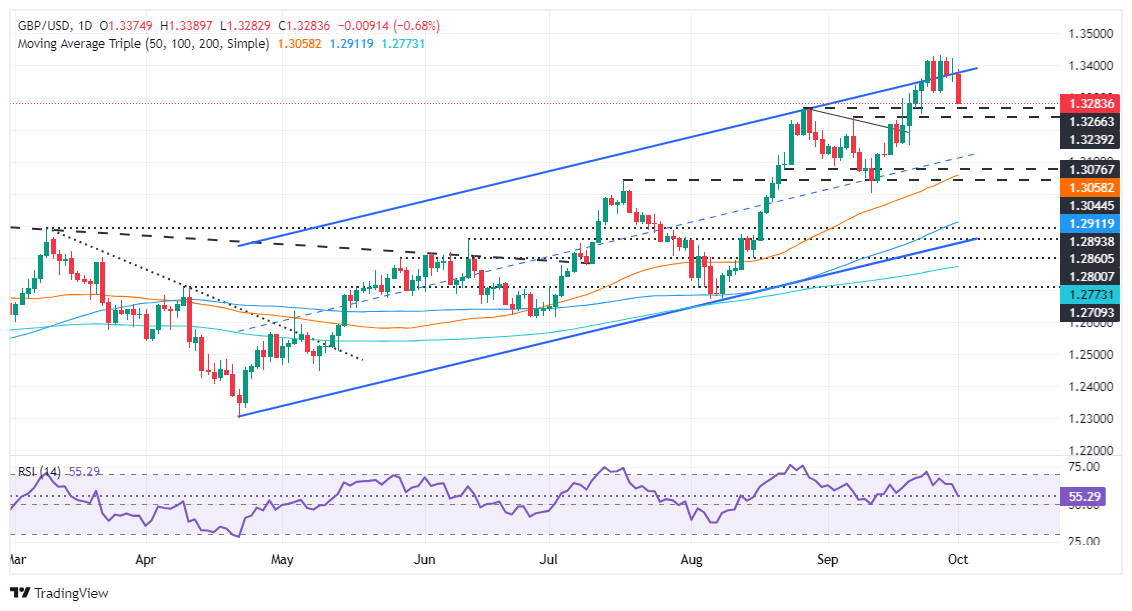
- GBP/USD fell back below 1.3300 on Tuesday as risk-off flows bubble over.
- Reports of Iranian missile strikes on Israel have bolstered fears of further geopolitical conflict.
- US data ahead of Friday’s NFP labor roundup did little to inspire investor confidence.
GBP/USD took a tumble on Tuesday, backsliding to its lowest bids in over a week after US ISM Purchasing Managers Index (PMI) figures misfired and broadly missed forecasts. Geopolitical tensions took center stage during the US market session, further plunging risk appetite lower following reports that Iran has fired on Israel in a clear escalation of ongoing Middle East tensions.
The economic calendar remains relatively free and clear on the Pound Sterling side, with GBP traders forced to wait until the Bank of England’s (BoE) Monetary Policy Report Hearings, due early Thursday. On the US side of things, a trickle of meaningful-in-the-aggregate yet individually meaningless economic data litters the landscape on the road to Friday’s Nonfarm Payrolls (NFP), and investors are grappling with middling releases that are routinely missing the mark.
Forex Today: The US labour market will be in the spotlight along with Fed speakers
September’s US ISM Manufacturing PMI remained stubbornly entrenched at 47.2 for a second consecutive month, entirely missing the expected uptick to 47.5. ISM Manufacturing Prices Paid also backslid more than expected over the same period, falling into contractionary territory at 48.3, down from the previous 54.0.
Looking further into US data, JOLTS Job Openings in August rose to 8.04 million, over and above the previous period’s revised 7.7 million. Still, the widening expanse of listed job openings may not translate directly into new hires after the ISM Manufacturing Employment Index for September fell to 43.9 from the previous 46.0, entirely missing the forecast upswing to 47.0.
Investor attention has swung around to focus entirely on Middle East geopolitical tensions after early reports that Iran has executed a first missile barrage against Israel in response to Israel’s recent invasion of Lebanon. The US has declared it will retaliate on Israel’s behalf, and investors are balking at the prospect of a rapid escalation of the ongoing conflict.
GBP/USD price forecast
Cable’s backslide on Tuesday has dragged the pair back below the 1.3300 handle. Price action is now poised for a downside extension back into the 50-day Exponential Moving Average (EMA) near 1.3100. However, the way is anything but straightforward for an extended bearish push into the previous swing low just north of 1.3000.
GBP/USD daily chart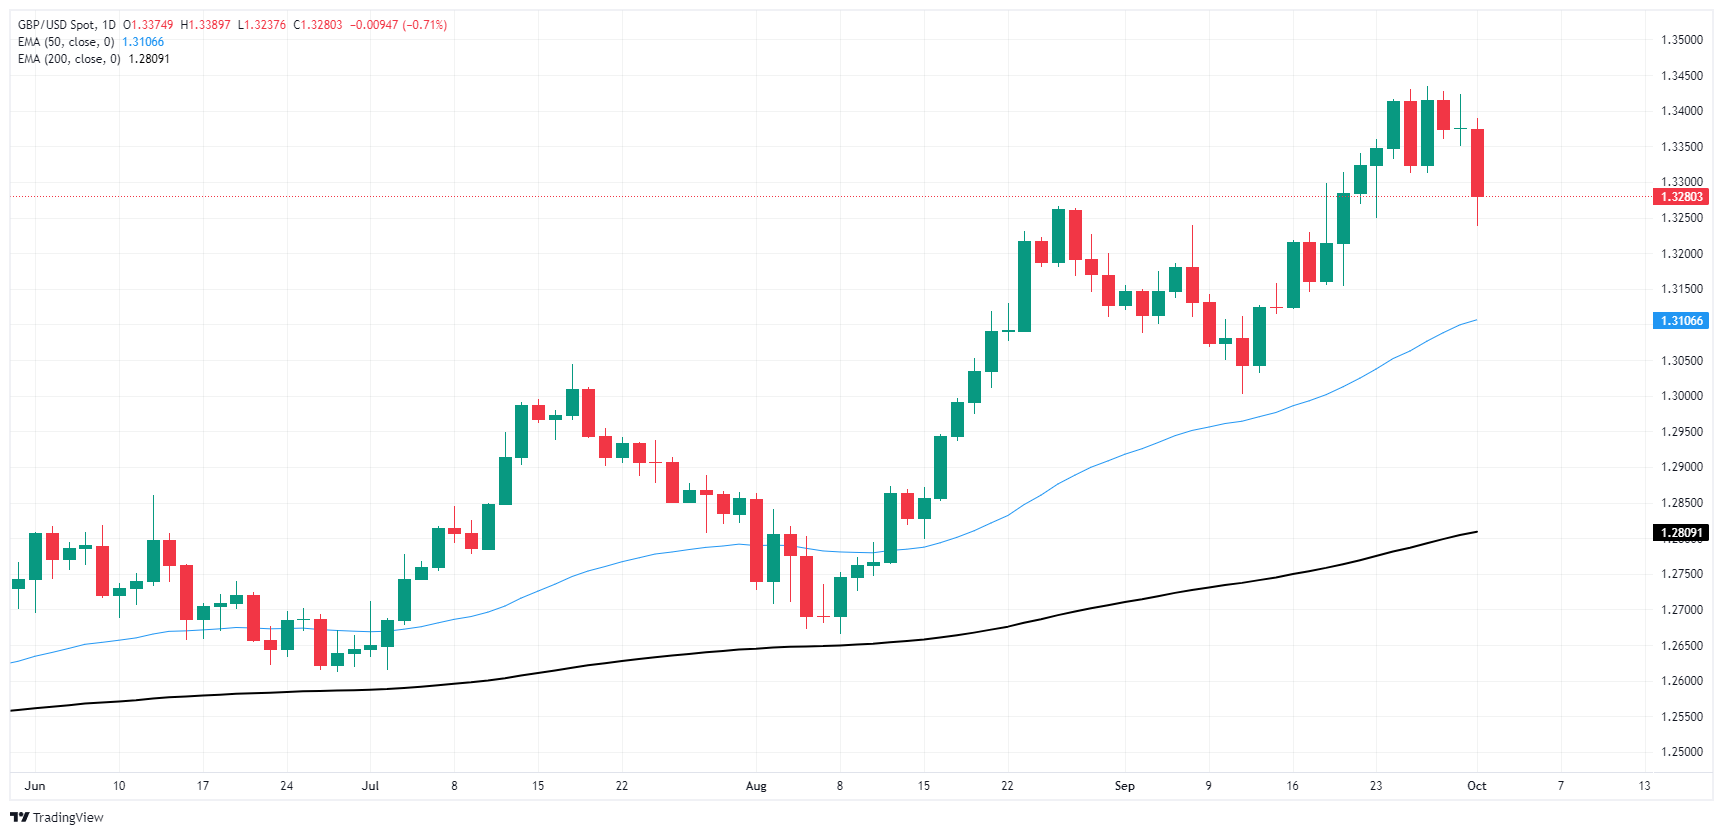
Pound Sterling FAQs
The Pound Sterling (GBP) is the oldest currency in the world (886 AD) and the official currency of the United Kingdom. It is the fourth most traded unit for foreign exchange (FX) in the world, accounting for 12% of all transactions, averaging $630 billion a day, according to 2022 data. Its key trading pairs are GBP/USD, also known as ‘Cable’, which accounts for 11% of FX, GBP/JPY, or the ‘Dragon’ as it is known by traders (3%), and EUR/GBP (2%). The Pound Sterling is issued by the Bank of England (BoE).
The single most important factor influencing the value of the Pound Sterling is monetary policy decided by the Bank of England. The BoE bases its decisions on whether it has achieved its primary goal of “price stability” – a steady inflation rate of around 2%. Its primary tool for achieving this is the adjustment of interest rates. When inflation is too high, the BoE will try to rein it in by raising interest rates, making it more expensive for people and businesses to access credit. This is generally positive for GBP, as higher interest rates make the UK a more attractive place for global investors to park their money. When inflation falls too low it is a sign economic growth is slowing. In this scenario, the BoE will consider lowering interest rates to cheapen credit so businesses will borrow more to invest in growth-generating projects.
Data releases gauge the health of the economy and can impact the value of the Pound Sterling. Indicators such as GDP, Manufacturing and Services PMIs, and employment can all influence the direction of the GBP. A strong economy is good for Sterling. Not only does it attract more foreign investment but it may encourage the BoE to put up interest rates, which will directly strengthen GBP. Otherwise, if economic data is weak, the Pound Sterling is likely to fall.
Another significant data release for the Pound Sterling is the Trade Balance. This indicator measures the difference between what a country earns from its exports and what it spends on imports over a given period. If a country produces highly sought-after exports, its currency will benefit purely from the extra demand created from foreign buyers seeking to purchase these goods. Therefore, a positive net Trade Balance strengthens a currency and vice versa for a negative balance.
- USD/JPY closes unchanged at 143.58, forming a ‘doji’ candlestick, signaling indecision amid geopolitical risks.
- RSI suggests potential consolidation, with the pair expected to trade between 142.98 and 144.53 in the short term.
- A break above 144.53 could target 145.00 and the 50-DMA at 145.47, while a drop below 142.98 exposes the 141.65 support level.
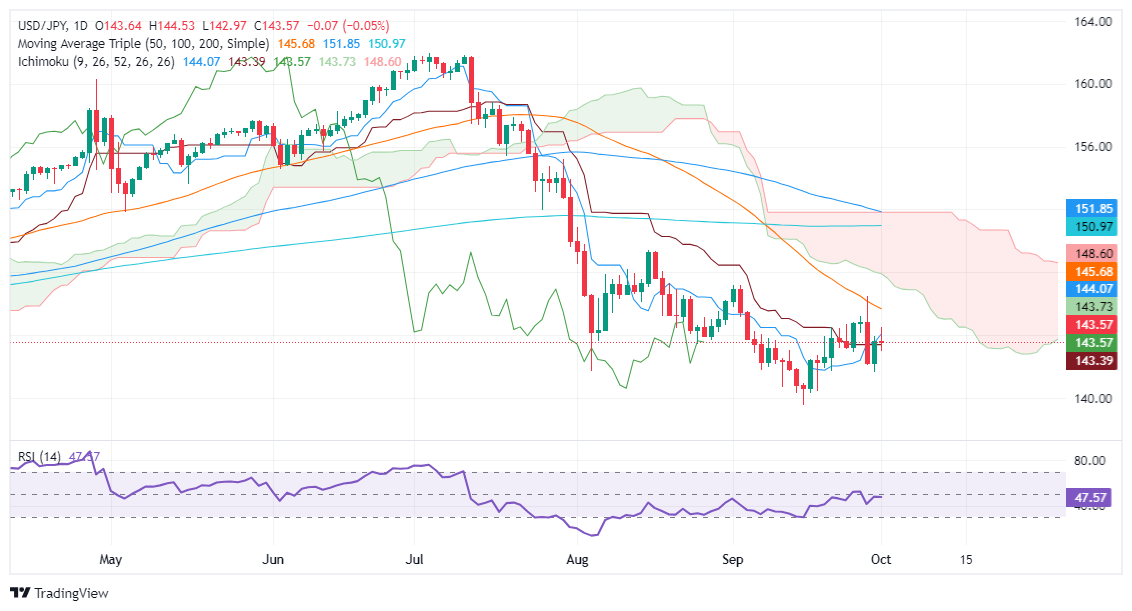
On Tuesday, the USD/JPY formed a ‘doji’ and finished the day unchanged at around 143.58. During the session, the major seesawed at around a 150-pip range before ending the trading day with minimal gains of 0.02%.
USD/JPY Price Forecast: Technical outlook
The downtrend remains intact. Even though the pair was headed to sustain losses, the USD/JPY rallied on risk aversion amidst Iran's attack on Israel. That sponsored a leg-up toward the current exchange rate.
The Relative Strength Index (RSI) favors further downside, though its slope is flat. This hints at consolidation ahead. That said, the USD/JPY might trade within the 142.98-144.53 area in the near term.
If buyers clear the top of the range, that will expose the 145.00, followed by the 50-day moving average (DMA) at 145.47. A breach of the latter will expose the bottom of the Kumo at around 147.80-148.00.
Conversely, if USD/JPY tumbles below 142.98, the September 30 cycle low at 141.65 will be exposed. On further weakness, the next stop would be the September 16 pivot low at 139.58.
USD/JPY Price Action – Daily Chart
Japanese Yen FAQs
The Japanese Yen (JPY) is one of the world’s most traded currencies. Its value is broadly determined by the performance of the Japanese economy, but more specifically by the Bank of Japan’s policy, the differential between Japanese and US bond yields, or risk sentiment among traders, among other factors.
One of the Bank of Japan’s mandates is currency control, so its moves are key for the Yen. The BoJ has directly intervened in currency markets sometimes, generally to lower the value of the Yen, although it refrains from doing it often due to political concerns of its main trading partners. The BoJ ultra-loose monetary policy between 2013 and 2024 caused the Yen to depreciate against its main currency peers due to an increasing policy divergence between the Bank of Japan and other main central banks. More recently, the gradually unwinding of this ultra-loose policy has given some support to the Yen.
Over the last decade, the BoJ’s stance of sticking to ultra-loose monetary policy has led to a widening policy divergence with other central banks, particularly with the US Federal Reserve. This supported a widening of the differential between the 10-year US and Japanese bonds, which favored the US Dollar against the Japanese Yen. The BoJ decision in 2024 to gradually abandon the ultra-loose policy, coupled with interest-rate cuts in other major central banks, is narrowing this differential.
The Japanese Yen is often seen as a safe-haven investment. This means that in times of market stress, investors are more likely to put their money in the Japanese currency due to its supposed reliability and stability. Turbulent times are likely to strengthen the Yen’s value against other currencies seen as more risky to invest in.
- Gold rises over 1% after Iran launched missiles at Israel, intensifying Middle East conflict.
- Market focus shifts from strong US jobs data to geopolitical uncertainty, driving risk aversion and boosting safe-haven demand for Gold.
- A daily close below $2,665 could trigger a pullback, but ongoing tensions keep bullish momentum alive for new record highs.
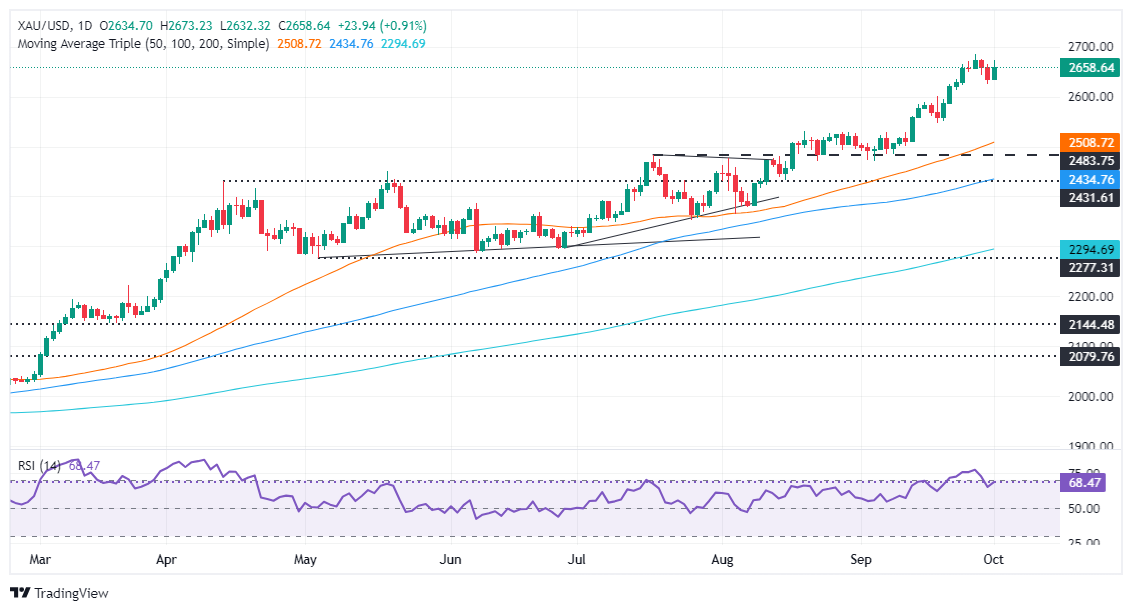
Gold price rallied over 1% on Tuesday amid growing tensions in the Middle East as Israel’s attack on Hezbollah spurred Iran’s reaction, which launched nearly two hundred missiles. This sponsored a leg-up in the non-yielding metal, shrugging off overall US Dollar strength. At the time of writing, the XAU/USD trades at $2,662 after bouncing off daily lows of $2,632.
Risk aversion is the name of the game, as investors' focus shifted from better-than-expected US jobs data to stabilized business activity in the manufacturing sector, according to the Institute for Supply Management (ISM).
Newswires revealed that Iran attacked Israel. According to ABC sources, Iran will launch 240-250 missiles at Israel. In the meantime, Israel revealed that the air force will continue striking targets in Lebanon, while US National Security Adviser Sullivan said, “There will be severe consequences for this attack.”
Jim Wyckoff, Kitco Analyst, wrote, “It’s very likely gold prices will hit new record highs if Iran strikes Israel. Silver prices would also likely hit new for-the-move highs.”
Gold prices extended their gains, printing a weekly high of $2,673. However, a daily close below the September 30 high of $2,665 could open the door for a pullback if geopolitical risks calm.
The Greenback, as measured by the US Dollar Index (DXY), rises 0.43% to 101.19, capping the non-yielding metal rally.
Daily digest market movers: Gold price rises on Mideast hostilities
- The US Department of Labor revealed that the August Job Openings & Labor Turnover Survey (JOLTS) increased from 7.711 million to 8.04 million, exceeding estimates of 7.655 million.
- The ISM Manufacturing PMI for September remained steady at 47.2, unchanged from the previous reading, but fell short of estimates of 47.5.
- Market participants have placed the odds of a 25 bps rate cut at 61.6%. According to the CME FedWatch Tool, the chances of a larger 50 bps cut have diminished to 38.4%.
XAU/USD technical analysis: Gold price climbs above $2,660
Gold price reversed Monday’s pullback toward $2,624 amid risk aversion. An escalation of the Middle East conflict could pave the way for higher prices. Although momentum favors buyers, as depicted by the Relative Strength Index (RSI), downside risks remain.
If Gold clears the all-time high of $2,685, it could extend its gains to $2,700. Conversely, if XAU/USD drops below $2,650, the door opened to testing the daily September 18 high at $2,600. Once surrendered, the following support will be the September 18 low of $2,546, followed by the 50-day Simple Moving Average (SMA) at $2,503.
Gold FAQs
Gold has played a key role in human’s history as it has been widely used as a store of value and medium of exchange. Currently, apart from its shine and usage for jewelry, the precious metal is widely seen as a safe-haven asset, meaning that it is considered a good investment during turbulent times. Gold is also widely seen as a hedge against inflation and against depreciating currencies as it doesn’t rely on any specific issuer or government.
Central banks are the biggest Gold holders. In their aim to support their currencies in turbulent times, central banks tend to diversify their reserves and buy Gold to improve the perceived strength of the economy and the currency. High Gold reserves can be a source of trust for a country’s solvency. Central banks added 1,136 tonnes of Gold worth around $70 billion to their reserves in 2022, according to data from the World Gold Council. This is the highest yearly purchase since records began. Central banks from emerging economies such as China, India and Turkey are quickly increasing their Gold reserves.
Gold has an inverse correlation with the US Dollar and US Treasuries, which are both major reserve and safe-haven assets. When the Dollar depreciates, Gold tends to rise, enabling investors and central banks to diversify their assets in turbulent times. Gold is also inversely correlated with risk assets. A rally in the stock market tends to weaken Gold price, while sell-offs in riskier markets tend to favor the precious metal.
The price can move due to a wide range of factors. Geopolitical instability or fears of a deep recession can quickly make Gold price escalate due to its safe-haven status. As a yield-less asset, Gold tends to rise with lower interest rates, while higher cost of money usually weighs down on the yellow metal. Still, most moves depend on how the US Dollar (USD) behaves as the asset is priced in dollars (XAU/USD). A strong Dollar tends to keep the price of Gold controlled, whereas a weaker Dollar is likely to push Gold prices up.
The Greenback extended Monday’s optimism and advanced to two-day highs supported by rising geopolitical concerns ahead of key data releases and a slew of Fed speakers.
Here is what you need to know on Wednesday, October 2:
The US Dollar Index (DXY) surpassed the key 101.00 barrier amidst increasing safe haven demand in response to geopolitical concerns. The ADP Employment Change takes centre stage seconded by the weekly Mortgage Applications tracked by MBA and the EIA’s report on US crude oil inventories. In addition, the Fed’s Barkin, Bostic, Hammack, Musalem, and Bowman are all due to speak.
EUR/USD plummeted to two-week lows near 1.1040 following the stronger US Dollar and the prevailing risk-off sentiment. The Unemployment Rate in the euro area will be published along with speeches by the ECB’s De Guindos, Buch, Elderson, and Schnabel.
In line with its risk-associated peers, GBP/USD tumbled to multi-day lows and revisited the 1.3240-1/3230 band on Tuesday. The next key data release in the UK will be the final S&P Global Services PMI on October 3.
USD/JPY rose marginally amidst a volatile session, which saw the Greenback pick up extra pace and global yields retreat further. The September’s Consumer Confidence gauge is due.
AUD/USD reversed three consecutive daily advances and revisited the 0.6860 zone following the stronger Dollar and the offered stance in the risk complex. The Ai Group survey will be the only release Down Under.
Prices of WTI advanced markedly to fresh highs around the $72.00 mark per barrel following Iran’s attack on Israel.
Gold prices regain composure on the back of safe haven demand and revisited the $2,670 zone per ounce troy. Silver prices followed suit, advancing to the vicinity of the $32.00 mark per ounce following two straight days of losses.
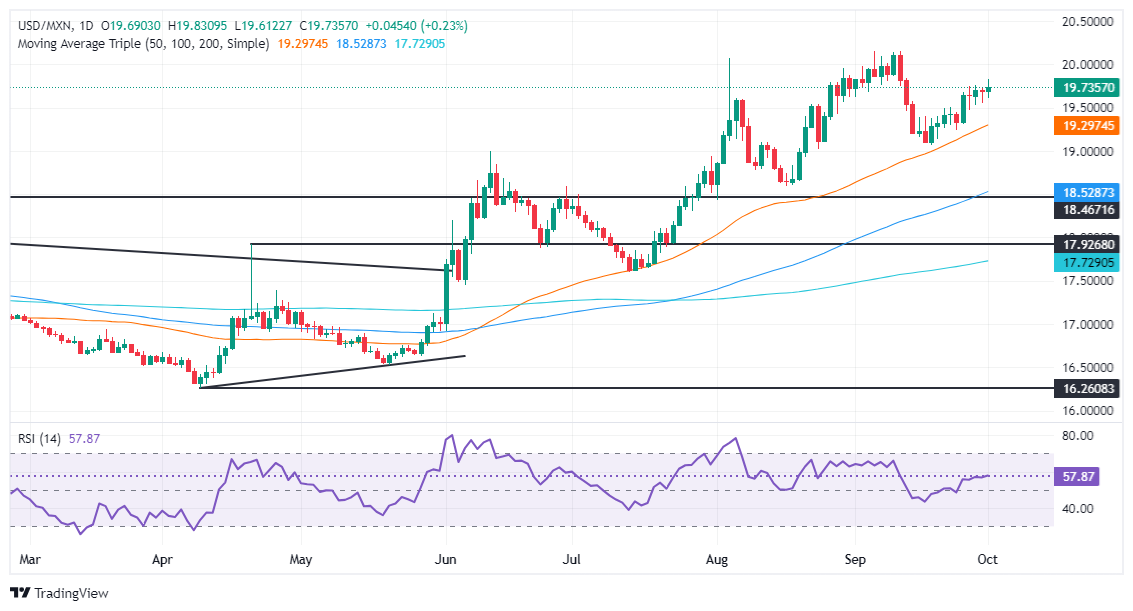
- Mexican Peso drops as the market mood shifts sour as Iran attacks Israel.
- Traders await President-Elect Claudia Sheinbaum’s inaugural remarks.
- Stronger than expected US JOLTS data and Powell’s comments support a bullish bias in USD/MXN.
The Mexican Peso loses some ground versus the US Dollar on Tuesday as the Mexican Congress begins its General Session ahead of President-Elect Claudia Sheinbaum's swearing-in ceremony. The exotic pair advances following Middle East headlines suggesting an Iranian missile attack on Israel. The USD/MXN trades at 19.70, up 0.15%.
Wall Street reflects a downbeat market mood due to heightened geopolitical risks. This sparked flows toward the Greenback due to its safe-haven status, which was detrimental to the Peso’s emerging market status.
Mexico’s economic docket remains absent, with traders awaiting remarks from President Claudia Sheinbaum as she takes office. Across the north of the border, the US schedule featured the release of the August JOLTS report, which was better than expected and exceeded the July number.
The Institute for Supply Management (ISM) revealed the September Manufacturing PMI, which remained in contractionary territory but was unchanged compared to August.
On Monday, Federal Reserve (Fed) Chair Jerome Powell revealed that the central bank is in no rush to lower borrowing costs while foreseeing 50 basis points of easing toward the end of 2024.
Given the backdrop, the USD/MXN is expected to remain upwardly biased after Powell resisted expectations of aggressive easing by the Fed.
Daily digest market movers: Mexican Peso drops on geopolitical risks
- Mexican political turmoil eases as market participants prepare for the change of president on October 1, a bank holiday in Mexico.
- According to the swaps markets, Banxico is expected to lower borrowing costs by 175 bps by the end of 2025.
- The US Department of Labor revealed that the August Job Openings & Labor Turnover Survey (JOLTS) increased from 7.711 million to 8.04 million, exceeding estimates of 7.655 million.
- The ISM Manufacturing PMI in September rose by 47.2, unchanged from the previous reading, but it missed estimates of 47.5.
- Last week Atlanta Fed President Raphael Bostic commented that he will closely monitor jobs data to assess the Fed's policy stance. He indicated that he is open to cutting rates by 50 basis points (bps) while acknowledging that he is not yet ready to declare victory on inflation.
- Market participants have put the odds of a 25 bps cut at 61.6%. According to the CME FedWatch Tool, the chances for a larger 50 bps cut diminished to 38.4%.
USD/MXN technical analysis: Mexican Peso falls as USD/MXN rises above 19.75
The USD/MXN uptrend remains intact and resumed for the fifth consecutive day, with buyers gaining momentum. The Relative Strength Index (RSI) shows that bulls are in charge. This means that the exotic pair could test higher prices in the near term.
If USD/MXN clears the psychological 20.00 figure, the next resistance would be the YTD peak of 20.22. Further strength will expose the September 28, 2022, high of 20.57, followed by the 21.00 mark.
Conversely, If USD/MXN drops below 19.50, the next support would be the September 24 swing low of 19.23 before the pair moves toward the September 18 low of 19.06. Once those levels are surpassed, the 19.00 figure emerges as the following line of defense.
Mexican Peso FAQs
The Mexican Peso (MXN) is the most traded currency among its Latin American peers. Its value is broadly determined by the performance of the Mexican economy, the country’s central bank’s policy, the amount of foreign investment in the country and even the levels of remittances sent by Mexicans who live abroad, particularly in the United States. Geopolitical trends can also move MXN: for example, the process of nearshoring – or the decision by some firms to relocate manufacturing capacity and supply chains closer to their home countries – is also seen as a catalyst for the Mexican currency as the country is considered a key manufacturing hub in the American continent. Another catalyst for MXN is Oil prices as Mexico is a key exporter of the commodity.
The main objective of Mexico’s central bank, also known as Banxico, is to maintain inflation at low and stable levels (at or close to its target of 3%, the midpoint in a tolerance band of between 2% and 4%). To this end, the bank sets an appropriate level of interest rates. When inflation is too high, Banxico will attempt to tame it by raising interest rates, making it more expensive for households and businesses to borrow money, thus cooling demand and the overall economy. Higher interest rates are generally positive for the Mexican Peso (MXN) as they lead to higher yields, making the country a more attractive place for investors. On the contrary, lower interest rates tend to weaken MXN.
Macroeconomic data releases are key to assess the state of the economy and can have an impact on the Mexican Peso (MXN) valuation. A strong Mexican economy, based on high economic growth, low unemployment and high confidence is good for MXN. Not only does it attract more foreign investment but it may encourage the Bank of Mexico (Banxico) to increase interest rates, particularly if this strength comes together with elevated inflation. However, if economic data is weak, MXN is likely to depreciate.
As an emerging-market currency, the Mexican Peso (MXN) tends to strive during risk-on periods, or when investors perceive that broader market risks are low and thus are eager to engage with investments that carry a higher risk. Conversely, MXN tends to weaken at times of market turbulence or economic uncertainty as investors tend to sell higher-risk assets and flee to the more-stable safe havens.
- The Dow Jones shed over 300 points on Tuesday, with geopolitical tensions on the rise.
- Equities are slowly bouncing back but remain mired in the low side.
- Meager US ISM data did little to provide support for investors.
The Dow Jones Industrial Average (DJIA) plunged early Tuesday, driven into the low end by a mix of disappointing US industrial figures and renewed threats of a spillover in the Israel-Hamas conflict. US ISM Manufacturing Purchasing Managers Index (PMI) figures failed to rebound in September, as many market participants had hoped for. Israel’s recent military strikes on alleged Hamas targets in Lebanon have sparked a threat of retaliation from Iran, significantly widening the scope of the Middle East conflict.
September’s US ISM Manufacturing PMI remained stubbornly entrenched at 47.2 for a second consecutive month, entirely missing the expected uptick to 47.5. ISM Manufacturing Prices Paid also backslid more than expected over the same period, falling into contractionary territory at 48.3, down from the previous 54.0.
Looking further into US data, JOLTS Job Openings in August rose to 8.04 million, over and above the previous period’s revised 7.7 million, but the widening expanse of listed job openings may not be translating directly into new hires after the ISM Manufacturing Employment Index for September fell to 43.9 from the previous 46.0, entirely missing the forecast upswing to 47.0.
Investor attention has swung around to focus fully on Middle East geopolitical tensions after early reports that Iran has executed a first missile barrage against Israel in response to Israel’s recent invasion of Lebanon. The US has declared it will retaliate on Israel’s behalf, and investors are balking at the prospect of a rapid escalation of the ongoing conflict.
Dow Jones news
Roughly two-thirds of the Dow Jones stock index is in the red on Tuesday, with limited gains for the winners. Chevron (CVX) has been on the rise recently, gaining ground after announcing last week that the company would not be shelling out the capital to make heavy investments in developing LNG refineries within the US. Investors rewarded the energy company for keeping its cash resources close to the chest, and Chevron is up a further 1.6% on Tuesday, rising toward $150 per share.
Going in the opposite direction, Intel (INTC) is back into the red, declining 4.7% on Tuesday and tumbling below $22.50 per share as shareholders, who were recently spurred on by hopes of a mega-merger between Intel and competing chipmaker Qualcomm (QCOM). However, the reality that regulators are unlikely to allow a single company to dominate the overwhelming majority of global silicon chip printing is weighing heavily on traders.
Dow Jones price forecast
Dow Jones’ flub sees the major equity index testing back into the 42,000 handle, and bidders are struggling to recover balance despite etching in fresh all-time highs late last week. Despite a bearish intraday shock on Tuesday, the DJIA remains well-bid overall, up over 5% from the last notable swing low in mid-September into the 40,000 handle.
Dow Jones daily chart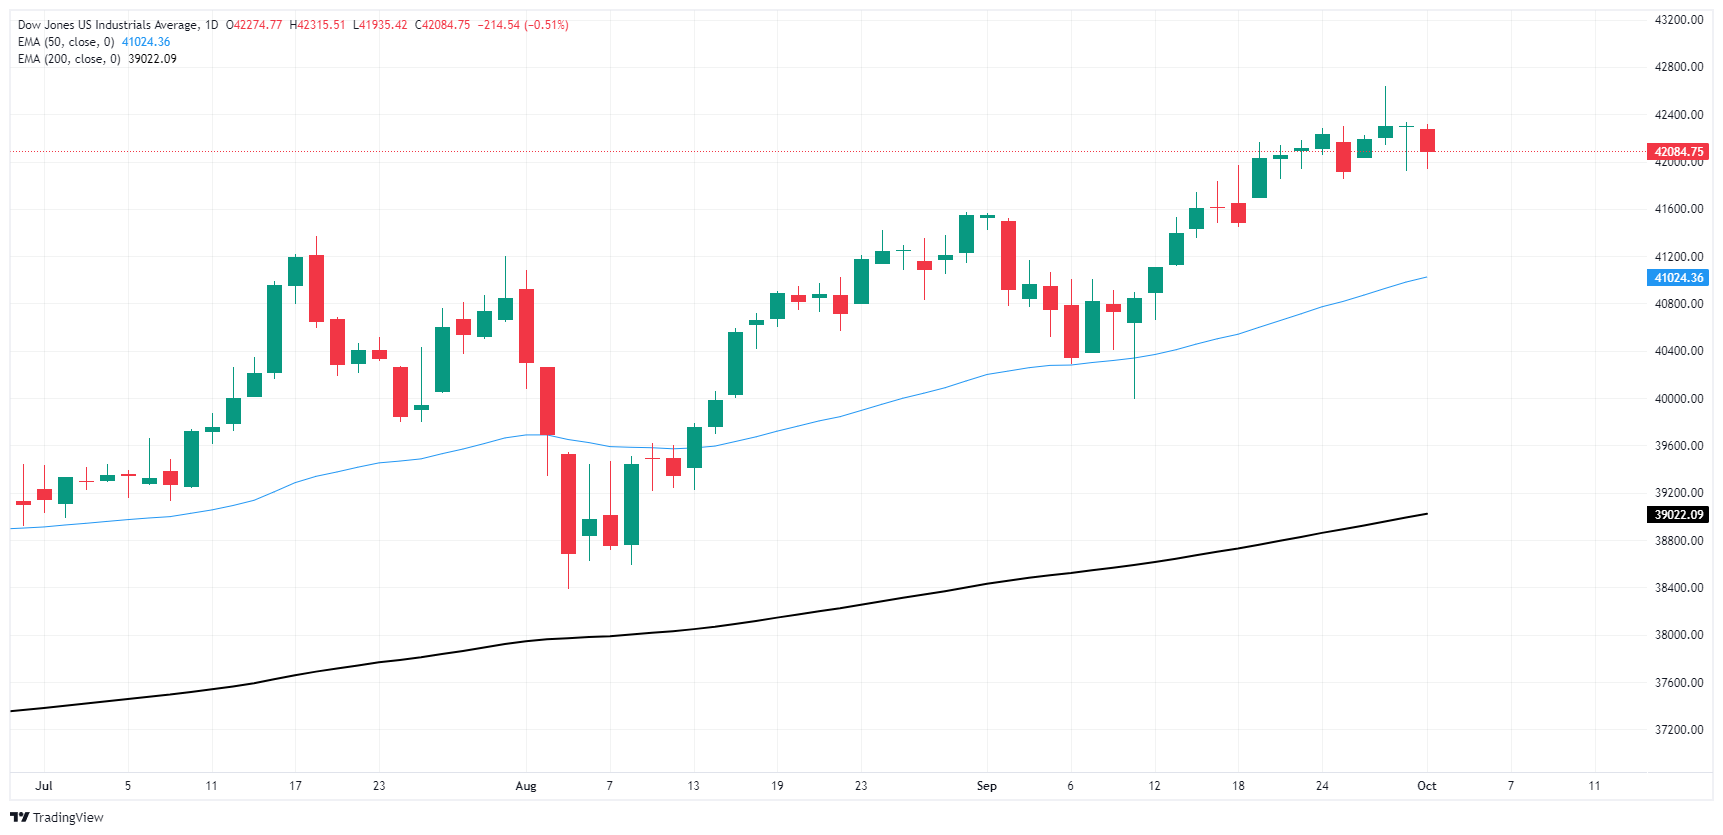
Dow Jones FAQs
The Dow Jones Industrial Average, one of the oldest stock market indices in the world, is compiled of the 30 most traded stocks in the US. The index is price-weighted rather than weighted by capitalization. It is calculated by summing the prices of the constituent stocks and dividing them by a factor, currently 0.152. The index was founded by Charles Dow, who also founded the Wall Street Journal. In later years it has been criticized for not being broadly representative enough because it only tracks 30 conglomerates, unlike broader indices such as the S&P 500.
Many different factors drive the Dow Jones Industrial Average (DJIA). The aggregate performance of the component companies revealed in quarterly company earnings reports is the main one. US and global macroeconomic data also contributes as it impacts on investor sentiment. The level of interest rates, set by the Federal Reserve (Fed), also influences the DJIA as it affects the cost of credit, on which many corporations are heavily reliant. Therefore, inflation can be a major driver as well as other metrics which impact the Fed decisions.
Dow Theory is a method for identifying the primary trend of the stock market developed by Charles Dow. A key step is to compare the direction of the Dow Jones Industrial Average (DJIA) and the Dow Jones Transportation Average (DJTA) and only follow trends where both are moving in the same direction. Volume is a confirmatory criteria. The theory uses elements of peak and trough analysis. Dow’s theory posits three trend phases: accumulation, when smart money starts buying or selling; public participation, when the wider public joins in; and distribution, when the smart money exits.
There are a number of ways to trade the DJIA. One is to use ETFs which allow investors to trade the DJIA as a single security, rather than having to buy shares in all 30 constituent companies. A leading example is the SPDR Dow Jones Industrial Average ETF (DIA). DJIA futures contracts enable traders to speculate on the future value of the index and Options provide the right, but not the obligation, to buy or sell the index at a predetermined price in the future. Mutual funds enable investors to buy a share of a diversified portfolio of DJIA stocks thus providing exposure to the overall index.
Newly-minted Chairman of the Swiss National Bank (SNB) Martin Schlegel hit newswires on Tuesday, cautioning that further rate cuts haven't been ruled out. The incoming Chairman of the SNB officially took the reins of Switzerland's central bank on early Tuesday, and has inherited a central bank still caught in the wake of last year's lopsided management of the merger between 167-year-old Credit Suisse and UBS.
Key highlights
The services sector is solid and the industrial sector subdued.
I expect Swiss growth to be subdued in coming quarters.
The biggest risk for Swiss economy is developments abroad.
Last week we did not rule out further interest rate cuts.
We cannot rule out negative rates at the moment, we rule nothing out.
Reason for last week's rate cut was reduced inflationary pressure.
Without interest rate cut, inflation forecasts would have been slower.
Main problem for Swiss exporters is lower demand abroad.
Federal Reserve (Fed) Bank of Atlanta President Raphael Bostic noted on Tuesday that the Fed should be willing to explore more outsized rate cuts if the jobs market deteriorates. The Fed's Bostic also assured markets that his business contacts continue to say they do not expect layoffs, a poorly timed soundbite that comes on the back of ISM data early Tuesday showing a deterioration of the employment outlook within the US manufacturing space.
Key highlights
Recent PCE data show disinflation still on track.
Business contacts continue to say they do not expect layoffs.
Will be watching upcoming jobs data closely.
If employment growth slows much below 100K jobs, would warrant closer questioning of what is happening.
Does not want to get overconfident on inflation given core Personal Consumption Expenditures Price Index remains 2.7%.
Baseline case is for an 'orderly' easing with inflation expected to continue slowing and job market to hold up.
Bostic is open to another half-percentage point rate cut if labor market shows unexpected weakness.
- GBP/USD declines by over 0.50%, on sour sentiment due to Middle East tensions.
- UK Manufacturing PMI expanded but slowed, while US ISM Manufacturing PMI improved yet remained in contractionary territory.
- A break below 1.3300 could lead to testing support at 1.3266, with further downside risk toward 1.3200 and 1.3145.
The Pound Sterling fell against the Greenback during the North American session, losing over 0.50% amid a risk-off mood due to heightened tensions in the Middle East. At the time of writing, the GBP/USD trades at 1.3300.
Business activity remains resilient, according to S&P Global, which revealed September’s Manufacturing PMI expanded as expected but slowed compared to the previous reading. Across the pond, the ISM Manufacturing PMI improved yet remained in contractionary territory.
GBP/USD Price Forecast: Technical outlook
The GBP/USD extended its losses below 1.3300, opening the door for further downside. Sellers are eyeing August 27’s peak of 1.3266. In the short term, momentum shifted to be bearish, as portrayed by the Relative Strength Index (RSI), which aimed toward its neutral line. However, the RSI is still in bullish territory.
Once the GBP/USD clears the August 27 high, the next support would be the 1.3200 figure. On further weakness, the next stop would be the September 17 daily low of 1.3145, followed by the 1.3100 mark.
Conversely, for a bullish continuation, the GBP/USD must climb past 1.3300 and clear the top-trendline of the ascending channel at around 1.3380-90.
GBP/USD Price Action – Daily Chart
British Pound PRICE Today
The table below shows the percentage change of British Pound (GBP) against listed major currencies today. British Pound was the strongest against the New Zealand Dollar.
| USD | EUR | GBP | JPY | CAD | AUD | NZD | CHF | |
|---|---|---|---|---|---|---|---|---|
| USD | 0.53% | 0.67% | 0.01% | -0.16% | 0.43% | 0.96% | -0.04% | |
| EUR | -0.53% | 0.12% | -0.53% | -0.70% | -0.09% | 0.41% | -0.58% | |
| GBP | -0.67% | -0.12% | -0.65% | -0.82% | -0.22% | 0.30% | -0.69% | |
| JPY | -0.01% | 0.53% | 0.65% | -0.15% | 0.44% | 0.95% | -0.03% | |
| CAD | 0.16% | 0.70% | 0.82% | 0.15% | 0.60% | 1.13% | 0.10% | |
| AUD | -0.43% | 0.09% | 0.22% | -0.44% | -0.60% | 0.51% | -0.49% | |
| NZD | -0.96% | -0.41% | -0.30% | -0.95% | -1.13% | -0.51% | -0.98% | |
| CHF | 0.04% | 0.58% | 0.69% | 0.03% | -0.10% | 0.49% | 0.98% |
The heat map shows percentage changes of major currencies against each other. The base currency is picked from the left column, while the quote currency is picked from the top row. For example, if you pick the British Pound from the left column and move along the horizontal line to the US Dollar, the percentage change displayed in the box will represent GBP (base)/USD (quote).
Western investors love the prospect of 'panic cuts without the panic', but Shanghai traders are on the offer in precious metals. This morning, the prospect of a direct military confrontation between Israel and Iran is driving safe-haven inflows into Gold, TDS commodity analyst Daniel Ghali notes.
Prospect of monetary inflation has historically benefited Gold
“Selling activity in Gold has been a bit limited, but the top traders still liquidated nearly 5t of notional Gold over the last week This contrasts with Western investor sentiment. Our read of macro fund positioning remains at its highest levels since the Brexit referendum in July 2016; re-levering from risk parity and vol-target funds is supporting a reaccumulation from CTAs and prices continue to rally without challenge.”
“For Western investors, concerns surrounding monetary inflation are mounting as participants read the Fed's reaction function as asymmetric, at a time when the US economy remains decent by many measures. We expected a more measured normalization of monetary policy to challenge bloated positions, given an aggressive global easing akin to current market expectations has typically occurred in response to deteriorating economic or financial conditions.”
“This prospect of monetary inflation has historically benefited Gold prices, but make no mistake, in real terms, prices are already challenging levels not seen since the 1980s, macro fund positioning is already extreme, central bank buying activity has slowed, and rebooting confidence in Asia could sap a major driver of demand for Gold. In the immediate-term, the prospect of a direct confrontation between Iran and Israel is driving even more capital towards Gold.”
- The business activity in the US manufacturing sector continued to contract in September.
- The US Dollar Index clings to daily gains near 101.00.
The business activity in the US manufacturing sector continued to contract in September, with the ISM Manufacturing PMI coming in at 47.2. This reading matched August's print but came in below the market expectation of 47.5.
The Employment Index of the PMI survey slumped to 43.9 from 46 in the same period and the Prices Paid Index fell sharply to 48.3 from 54. Finally, the New Orders Index improved to 46.1 from 44.6.
Commenting on the survey's findings, "demand remains subdued, as companies showed an unwillingness to invest in capital and inventory due to federal monetary policy — which the U.S. Federal Reserve addressed by the time of this report — and election uncertainty," said Timothy R. Fiore, Chair of the Institute for Supply Management Manufacturing Business Survey Committee.
"Production execution stabilized in September. Suppliers continue to have capacity, with lead times improving and shortages reappearing," Fiore added.
Market reaction
The US Dollar Index stays in the upper half of its daily range at around 101.00 following this report.
Market focus has shifted from tourism, Suez Canal revenues to declining FX proceeds from LNG exports. Hydrocarbon exports fell by 60% y/y in FY24; we estimate foregone revenue at USD 1bn a month. We revise our C/A deficit forecasts as the hydrocarbon trade balance has swung to a deficit, Standard Chartered economists Carla Slim and Bader Al Sarraf note.
FX liquidity concerns persist, notwithstanding improvement
“Egypt went from being a net hydrocarbon importer to a net hydrocarbon exporter in 2020-23. This was driven by a sharp rise in LNG exports (largely to Europe) on expanded domestic LNG output from its Al Zohr field on the East Mediterranean. Still, Egypt relies on hydrocarbon imports, including from Israel, for domestic consumption, and exports any remainder after meeting domestic demand.”
“We estimate foregone LNG export revenue at USD 1bn per month this year, as the regional conflict exacerbates the pressure on Egypt’s LNG trade, via more volatile pipeline imports from Israel. LNG exports began declining in early 2023 (see Figure 2) and have come under further pressure in 2024. Hydrocarbon exports were down by 60% y/y to USD 5.7bn in FY24 (year ending June 2024), turning the hydrocarbon trade balance to a USD 7.6bn deficit from a USD 0.4bn surplus a year earlier. Lower LNG exports and a recovery in imports on improved FX availability led to a widening of the current account (C/A) deficit to USD 20.8bn in FY24 from USD 4.7bn in FY23. As such, we raise our FY24 and FY25 C/A deficit forecasts to 7.0% (-3.0%) and 4.5% of GDP (-3.0%), respectively.”
“Market concerns related to Egypt’s FX liquidity have turned to its widening hydrocarbon trade deficit, in addition to losses in Suez Canal revenues (-24.3% y/y in FY24), although tourism revenue has held up (+5.5% y/y). Tourism revenues reached USD 14.4bn in FY24, from the prior peak of USD 13.6bn; however, the widening of the conflict in the Middle East in recent days could still pose downside risk to tourism. Suez Canal revenues are also likely to decline further (down to USD 6.6bn in FY24 from a peak of USD 8.7bn in FY23); President Sisi recently stated Egypt faces Suez Canal losses of up to USD 6bn YTD.”
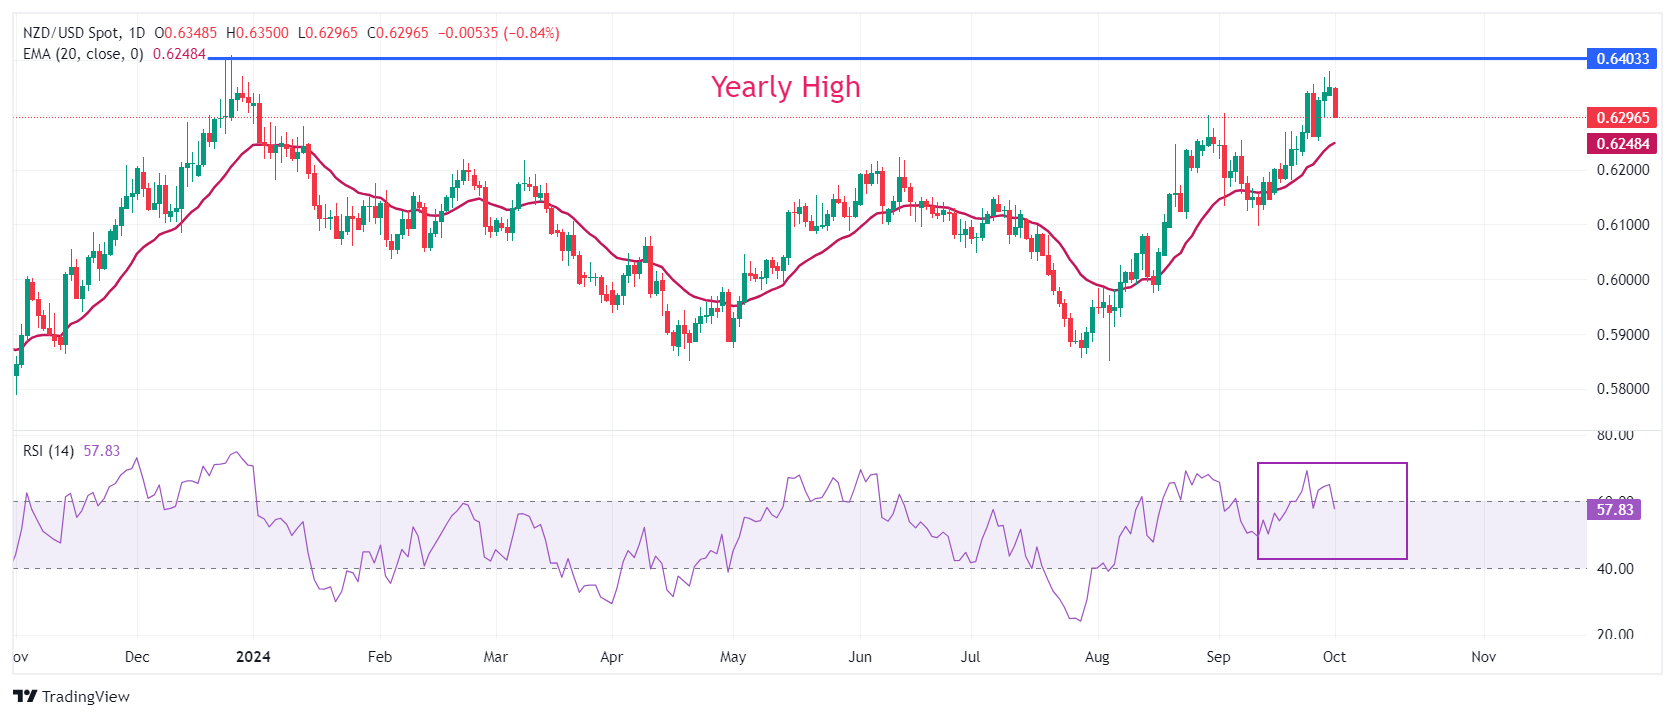
- NZD/USD falls sharply to near 0.6300 with a focus on US ISM Manufacturing PMI and the JOLTS Job Openings data.
- The US Dollar refreshes weekly high ahead of a slew of US data.
- China’s massive stimulus announcement has kept strength in the Kiwi dollar intact.
The NZD/USD pair tumbles to near the crucial support of 0.6300 in Tuesday’s New York session after facing selling pressure above the key resistance of 0.6350. The Kiwi asset weakens as the US Dollar (USD) posts a fresh weekly high, with investors turning cautious ahead of a slew of United States (US) economic data.
Investors will pay close attention to the US data as it will influence market expectations for the Federal Reserve (Fed) interest rate outlook. In today’s session, investors will focus on the US ISM Manufacturing PMI for September and the JOLTS Job Openings data for August, which will be published at 14:00 GMT.
The ISM Manufacturing PMI is estimated to have improved slightly to 47.5 from 47.2 in August. Still, the measure would suggest that activity in the factory sector continued to sink. Meanwhile, the Job Openings are expected to have grown at a steady pace, as seen in July, to 7.67 million.
Later this week, the US ADP Employment Change, ISM Services PMI, and the Nonfarm Payrolls (NFP) data for September will be under the spotlight.
In the Asia-Pacific region, the outlook of the New Zealand Dollar (NZD) is still upbeat on China’s massive stimulus for the economic revival. It is worth noting that New Zealand is one of the leading trading partners of China.
NZD/USD witnesses a sharp decline after failing to sustain above the crucial resistance of 0.6350. However, the near-term outlook of the Kiwi asset is still upbeat as the 20-day Exponential Moving Average (EMA) near 0.6250 is sloping higher.
The 14-day Relative Strength Index (RSI) slips into the 40.00-60.00 range, suggesting a weakening of momentum.
A fresh upside could appear if the asset breaks above the December 2023 high of 0.6400, which will drive the major toward the August 2022 high of 0.6470, followed by the psychological resistance of 0.6500.
In an alternate scenario, the asset could decline to near the 20-day EMA around 0.6250 if sustains below 0.6300. A downside move below the former will expose it to near the round-level support of 0.6200.
NZD/USD daily chart
New Zealand Dollar FAQs
The New Zealand Dollar (NZD), also known as the Kiwi, is a well-known traded currency among investors. Its value is broadly determined by the health of the New Zealand economy and the country’s central bank policy. Still, there are some unique particularities that also can make NZD move. The performance of the Chinese economy tends to move the Kiwi because China is New Zealand’s biggest trading partner. Bad news for the Chinese economy likely means less New Zealand exports to the country, hitting the economy and thus its currency. Another factor moving NZD is dairy prices as the dairy industry is New Zealand’s main export. High dairy prices boost export income, contributing positively to the economy and thus to the NZD.
The Reserve Bank of New Zealand (RBNZ) aims to achieve and maintain an inflation rate between 1% and 3% over the medium term, with a focus to keep it near the 2% mid-point. To this end, the bank sets an appropriate level of interest rates. When inflation is too high, the RBNZ will increase interest rates to cool the economy, but the move will also make bond yields higher, increasing investors’ appeal to invest in the country and thus boosting NZD. On the contrary, lower interest rates tend to weaken NZD. The so-called rate differential, or how rates in New Zealand are or are expected to be compared to the ones set by the US Federal Reserve, can also play a key role in moving the NZD/USD pair.
Macroeconomic data releases in New Zealand are key to assess the state of the economy and can impact the New Zealand Dollar’s (NZD) valuation. A strong economy, based on high economic growth, low unemployment and high confidence is good for NZD. High economic growth attracts foreign investment and may encourage the Reserve Bank of New Zealand to increase interest rates, if this economic strength comes together with elevated inflation. Conversely, if economic data is weak, NZD is likely to depreciate.
The New Zealand Dollar (NZD) tends to strengthen during risk-on periods, or when investors perceive that broader market risks are low and are optimistic about growth. This tends to lead to a more favorable outlook for commodities and so-called ‘commodity currencies’ such as the Kiwi. Conversely, NZD tends to weaken at times of market turbulence or economic uncertainty as investors tend to sell higher-risk assets and flee to the more-stable safe havens.
Eurozone Manufacturing PMI was revised up in September to 45.0 (from 44.8) after Spain reported a solid gain and German and French data were nudged up marginally from preliminary reports, Scotiabank’s Chief FX Strategist Shaun Osborne notes.
Soft EZ inflation bolster October ECB cut bets
“Eurozone Manufacturing PMI was revised up in September to 45.0 (from 44.8). But generally soft activity data and weaker than forecast Eurozone CPI today (-0.1% M/M for September) are bolstering expectations that the ECB will cut rates again this month, with 23bps of easing now priced into swaps.”
“Wider EZ/US spreads (2Y bond spreads have widened 20bps since September 18th) have undercut the EUR and reinforced the ceiling on the EUR around the 1.12 area for now.”
“Another strong rejection of the 1.12 area this week leaves the EUR looking prone to a little more weakness at least in the short run. A weak close for the EUR yesterday (bearish outside range session) signals a firm top on the EUR on the daily chart. A push back to the lower end of the recent range to 1.10 (and major support) is likely to develop in the short run.”
- USD/CAD has pulled back after bottoming on September 25.
- The correction that ensued now seems to have run its course and the pair could be vulnerable to recapitulation.
USD/CAD suddenly reversed course in the midst of a strong downtrend and recovered on September 25. The pair quickly rose up from 1.3420 to 1.3539 but now the rebound appears to have stalled after peaking at a similar level for the past two consecutive days (blue box on chart below).
USD/CAD Daily Chart
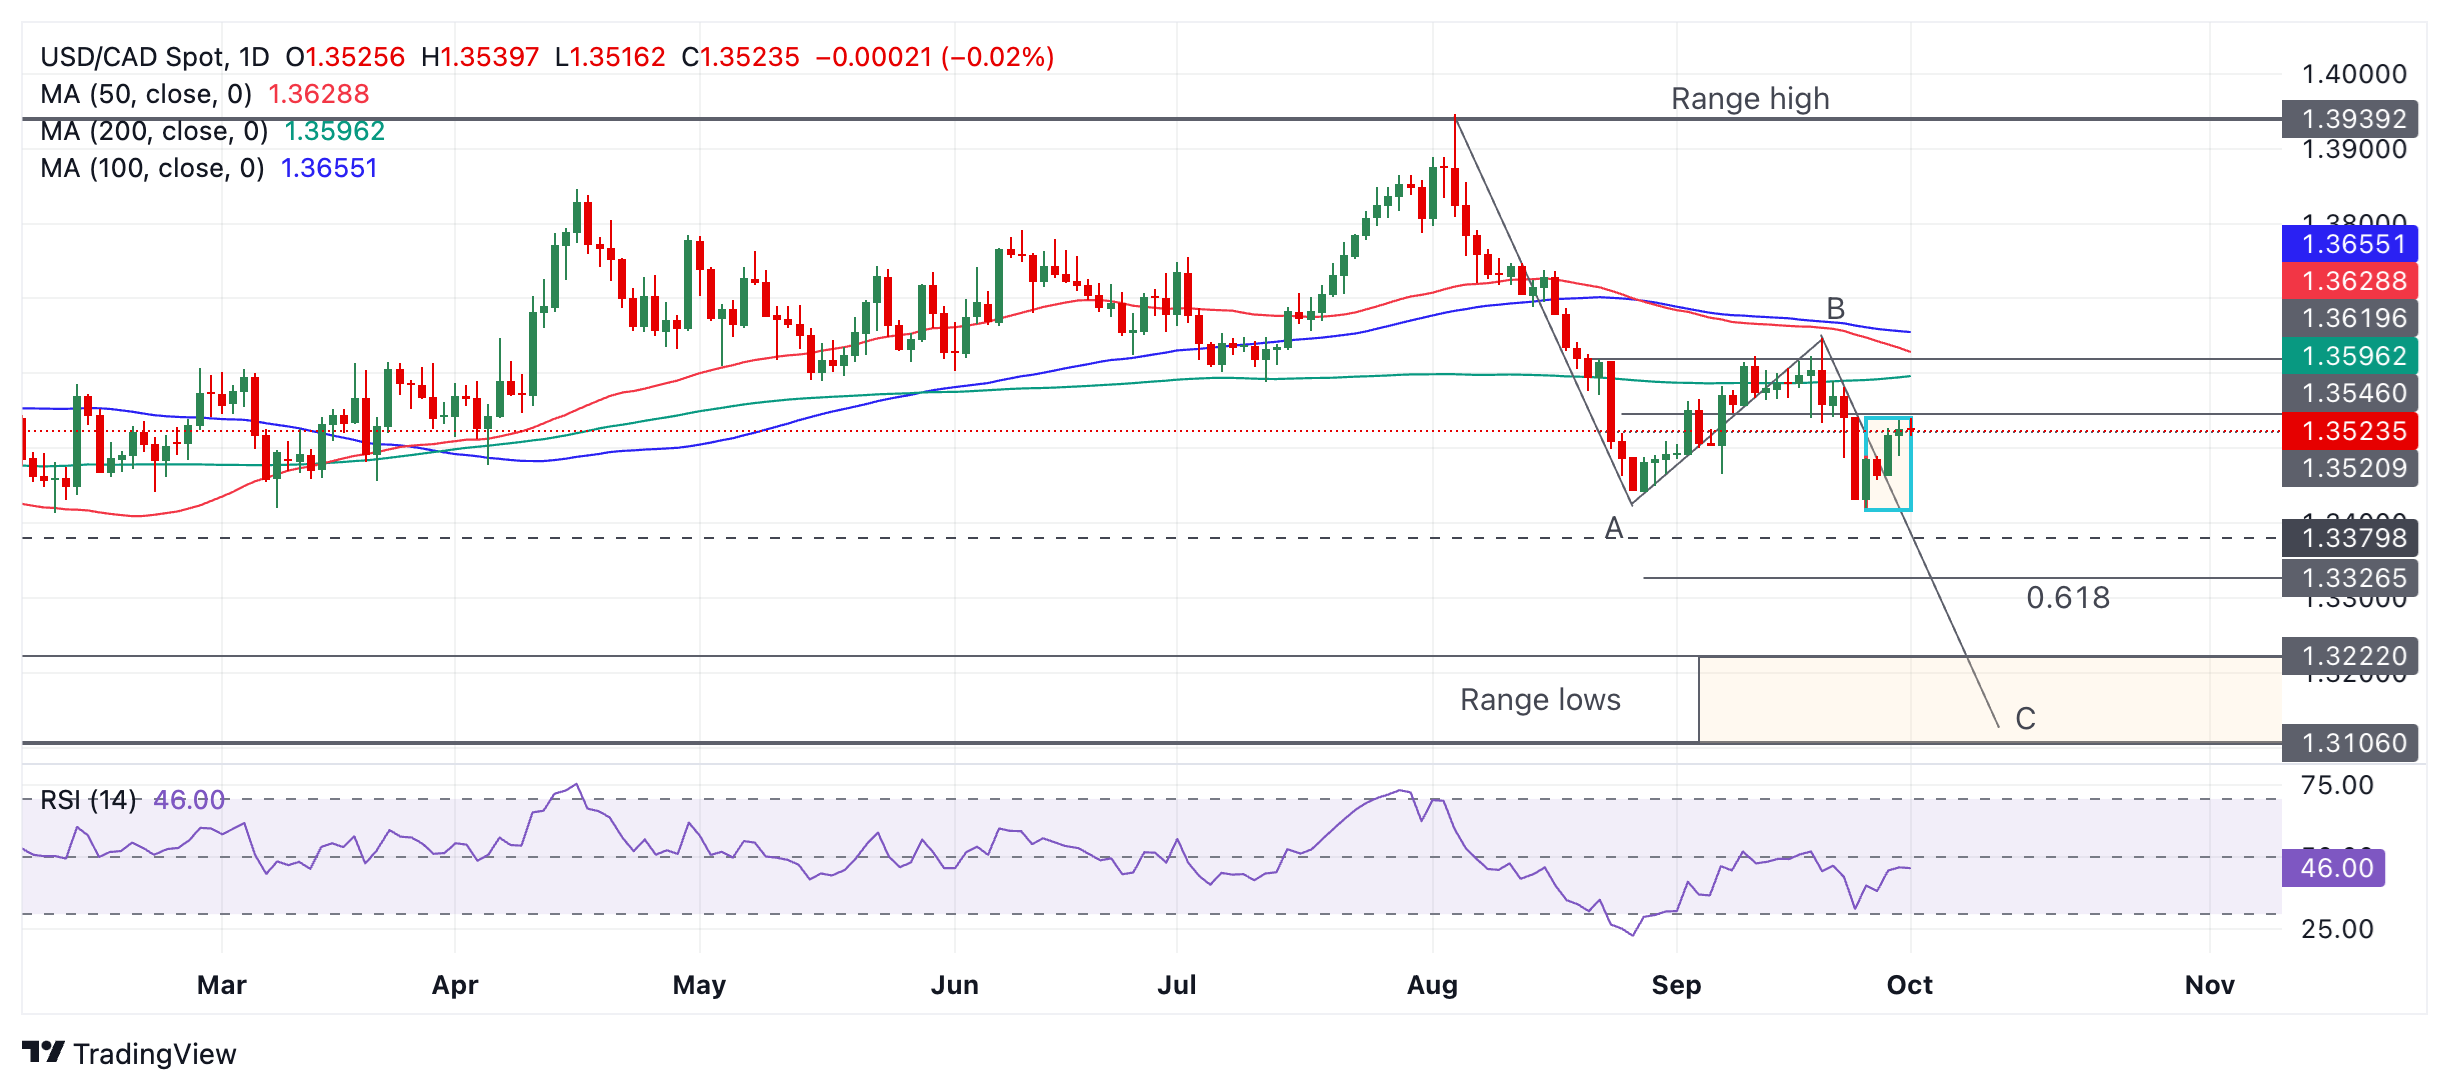
There is a chance that the pullback has run its course and given the medium-term trend remains bearish prices might now start falling again.
A move below 1.3457 (September 26 low) would confirm a resumption of the downtrend, probably to at least the 1.3420 low of September 25. A close below that would provide bearish confirmation of more downside to the range lows – a zone beginning at around 1.3222 and ending at 1.3106.
USD/CAD seems to have formed a large zig-zag pattern known as a Measured Move since peaking on August 5. If so, then it augurs bearish for the pair as the downside target for the last wave C of the pattern is at a minimum 1.3326, the 61.8% Fibonacci extension of wave A.
One reason for the price weakness last week was the agreement reached by the conflict parties in Libya in the dispute over the leadership of the central bank, Commerzbank’s commodity analyst Carsten Fritsch notes.
Additional supply from Libya is likely to weigh on oil prices
“The agreement was reached by the conflict parties in Libya in the dispute over the leadership of the central bank. This had led to an interruption in oil production in the east of the country, causing nationwide oil production to fall from 1.2 million to less than 450 thousand barrels per day.”
“Yesterday, the parliament based in eastern Libya approved the appointment of the new central bank governor, which should enable oil production there to be ramped up. According to people familiar with the matter, this is expected to begin today. The additional supply from Libya is likely to weigh on oil prices.”
“A similar observation can be made for US oil production in the Gulf of Mexico. Hurricane Helene curtailed production there for several days last week. According to the relevant authority, the outages on Thursday amounted to about a quarter of US production in the Gulf of Mexico. By Sunday, production had almost returned to normal levels.”
- EUR/GBP has broken lower and extended its downtrend on Tuesday.
- The RSI is showing a lack of bearish momentum accompanies the move and is converging with price.
EUR/GBP breaks lower after a brief pullback and continues its broader downtrend on Tuesday.
EUR/GBP 4-hour Chart
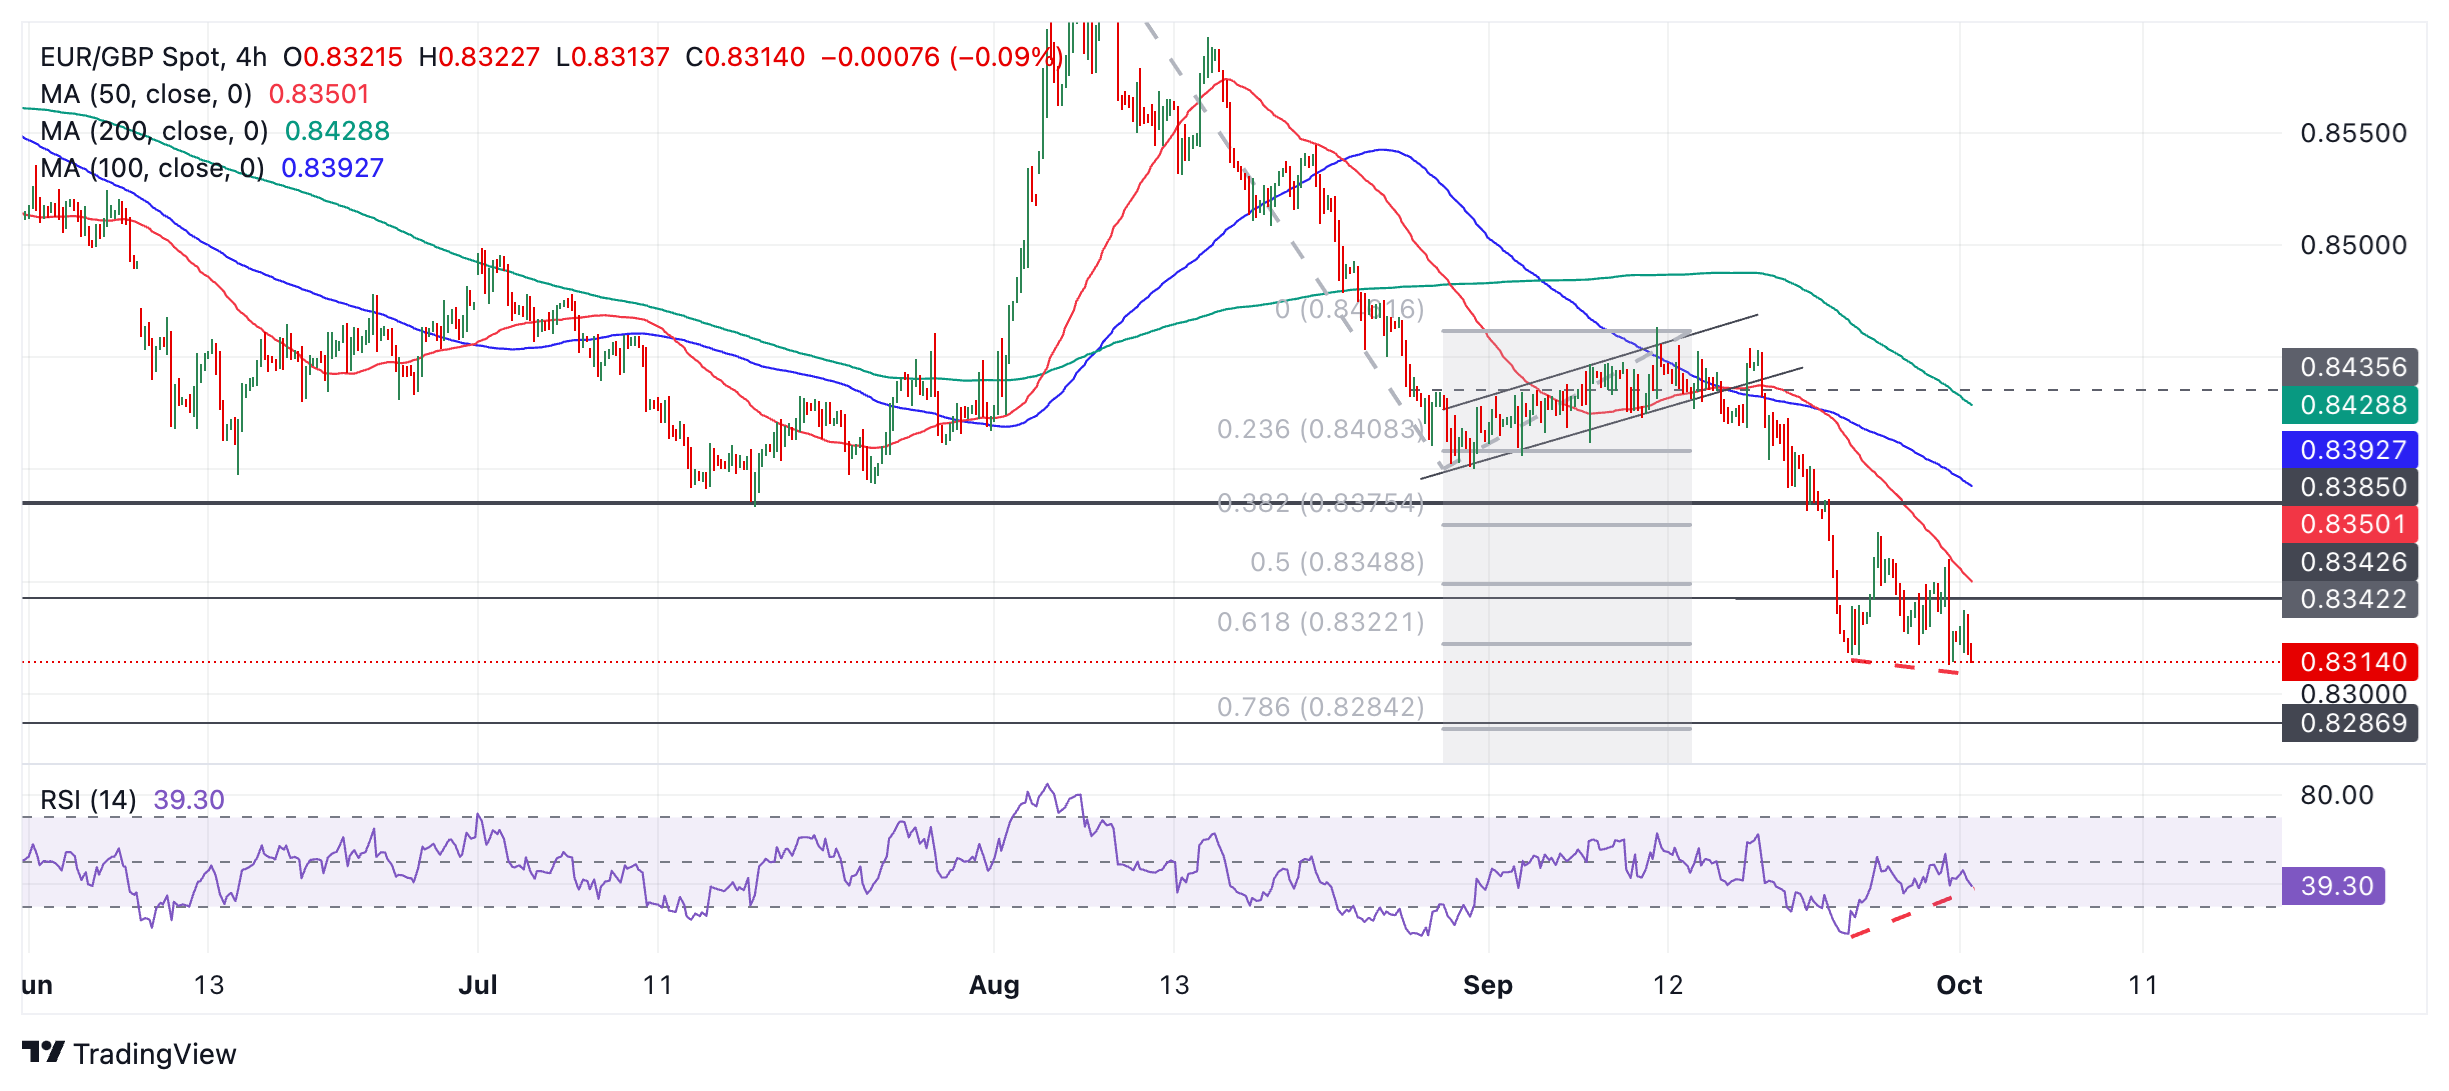
The pair breaks below the 0.8317 September 24 low, confirming an extension of the downtrend towards the next target at 0.8287, the August 2022 low.
The Relative Strength Index (RSI) is converging bullishly with price when comparing the September 24 low and the current low (red dashed lines on chart). Although the current low is below that of September 24 the RSI is not. This non-confirmation signifies a lack of downside momentum accompanies the current sell-off and it might be a sign it will soon run out of steam.
EUR/GBP has already reached the first downside target for the move that began at the August 5 high, at 0.8322. This is the 61.8% extrapolation of the August sell-off before the shallow channel formed in early September. Further downside beyond the target could be a sign, therefore, of overextension.
The Pound Sterling (GBP) is trading lower on the session, tracking the broader tone of the US Dollar (USD), Scotiabank’s Chief FX Strategist Shaun Osborne notes.
Rrisk of easing further on the break of 1.3313 support
“UK Manufacturing PMI was left unchanged at 51.5 in September. BoE policymaker Greene (a dissenter when the MPC voted to cut rates in August) commented that a rebound in consumer demand could lift inflation again and noted that while prices are ‘moving in the right direction’, it was questionable how quickly progress was being made.”
“Sterling gains have stalled in the low 1.34 area. A potential double top at 1.3430 warrants attention on the short-term chart. Loss of support at 1.3313 will open up the downside a little more for Cable and target a drop in the pound to 1.3195/00.”
- EUR/JPY falls after the release of lower-than-expected Eurozone inflation data.
- Cooling inflation suggests the ECB will be more likely to cut interest rates, leading to outflows for the Euro.
- The Japanese Yen weakens itself after a fake rally following Ishiba’s victory as he adopts an accommodative stance.
EUR/JPY trades just over a third of a percent lower on Tuesday, in the 159.30s. The pair declines after the release of Eurozone inflation data shows lower-than-expected inflation in the bloc, which suggests the European Central Bank (ECB) will be more likely to cut interest rates in future meetings. This, in turn, is likely to lead to outflows of capital and a weaker Euro.
The Eurozone Harmonized Index of Consumer Prices (HICP) came out at 1.8% in September from 2.2% previously and 1.9% forecast, according to Eurostat. Core HICP fell to 2.7% from 2.8% previously and the same expected. The data backs up comments from the ECB President Christine Lagarde who hinted that inflation was falling back to the central bank’s 2.0% target, as expected. "The latest developments strengthen our confidence that inflation will return to target in a timely manner," she said on Monday.
EUR/JPY had been rising at the start of the week after Japan’s incoming Prime Minister, Shigeru Ishiba wrong-footed markets which had expected him to take a neutral approach. The Yen rallied after the news of Ishiba’s victory over rival Sanae Takaichi due to Takaichi’s explicit favoring of a weak Yen to help Japanese exporters. However, on Monday Ishiba said that monetary policy ought to be kept accommodative (interest rates low) because the economic conditions didn’t warrant higher rates. His comments took investors by surprise and gave EUR/JPY a lift.
The Japanese Jibun Manufacturing Purchasing Manager Index (PMI) showed a slight rise in manufacturing activity, pushing up to 49.7 in September according to data released on Tuesday during the Asian session, which was higher than the 49.6 in the previous month, and expectations of the same. The data, though still in contraction territory, may have further put pressure on EUR/JPY.
The Canadian Dollar (CAD) is little changed on the USD on the day, with spot holding close to Monday’s close in the low 1.35 zone, Scotiabank’s Chief FX Strategist Shaun Osborne notes.
CAD holds near fair value on wider US/Can spreads
“The CAD’s push to the low 1.34 area last week has steadily reversed after yield spreads widened in the USD’s favour. The CAD remains generally range bound between the low/mid 1.34s and the mid-1.36s at the moment. Spot is trading close to its fair value estimate (1.3546) today.”
“Steady USD gains from last week’s low have recovered about half of the last September drop in USDCAD from the 1.3647 peak. Momentum is leaning USD-bullish but looks relatively weak. More USD gains may be possible in the near-term through the upper 1.35 area but the broader, sideways range trade in spot below 1.3650 is likely to remain intact for now.”
The International Copper Study Group (ICSG) then followed with the publication of its forecasts for the copper market, Commerzbank’s commodity analyst Carsten Fritsch notes.
Demand is expected to increase even more next year
“The ICSG had to adjust its forecast significantly upwards due to an already significant oversupply in the first half of the year: it now expects a supply surplus of 470,000 tons; in spring it had still assumed a surplus of around 160,000 tons. This is largely due to significantly stronger production growth: instead of around 2%, (adjusted) global production is now expected to increase by 4.2%.”
“On the one hand, this year's losses are significantly lower than usual, and on the other hand, the Democratic Republic of Congo and China have further expanded their capacities. At 2.2%, the forecasted increase in demand is largely in line with expectations in spring. Next year, demand is expected to increase even more: the ICSG expects an increase of 2.7% compared to 2024. At the same time, production growth is expected to lose significant momentum and only reach 1.6%.”
“Even if capacities continue to grow, the shortage of concentrates would slow down the expansion of production. The ICSG consequently expects a smaller supply surplus of just under 200,000 tons in 2025. However, this would be twice as high as expected in spring and even slightly higher than previously expected for the current year. Even if these figures have not immediately been able to curb the euphoria on the copper market, they cannot be ignored in the long term.”
Softer than expected US PCE data Friday undercut the US Dollar (USD) broadly at the start of the week but the USD has recovered this morning to trade higher overall against its major currency peers, Scotiabank’s Chief FX Strategist Shaun Osborne notes.
USD may strengthen a little more as spreads move favourably
“Fed Chair Powell commented Monday that the Fed was in no hurry to cut rates and will lower rates over time. Meanwhile, soft Eurozone CPI data has boosted expectations that the ECB could cut rates again in October. After winning the leadership vote for Japan’s ruling LDP Party, new Japan PM Ishiba’s government appears more cautious on the economy and the need for tighter monetary policy.”
“Yield spreads have shifted relatively significantly in favour of the USD over the past few sessions, suggesting the DXY may be able to recover a little more ground in the short run at least. Broader trends in the DXY remain negative and index gains may be limited to the 102 area in the coming week or two, however. US equity futures are negative on the session, adding to support for the USD at the margin.”
“Israel’s ground incursion into Lebanon does not appear to be a major factor for markets at this point. Crude oil prices are down in the day but off earlier lows. The data run today brings a little more information on the US labour market via ISM/PMI and JOLTS data. There are a number of Fed policymakers speaking over the course of the day (among them, Bostic, Cook and Barkin are voters this year). US NFP data Friday are the primary focus markets this week, however.”
- USD/CHF is rising within a range-bound market.
- It has encountered resistance at a cluster of MAs but will probably continue higher.
USD/CHF is rising up within its sideways range. It has reached a cluster of major Moving Averages which are providing firm resistance.
USD/CHF 4-hour Chart
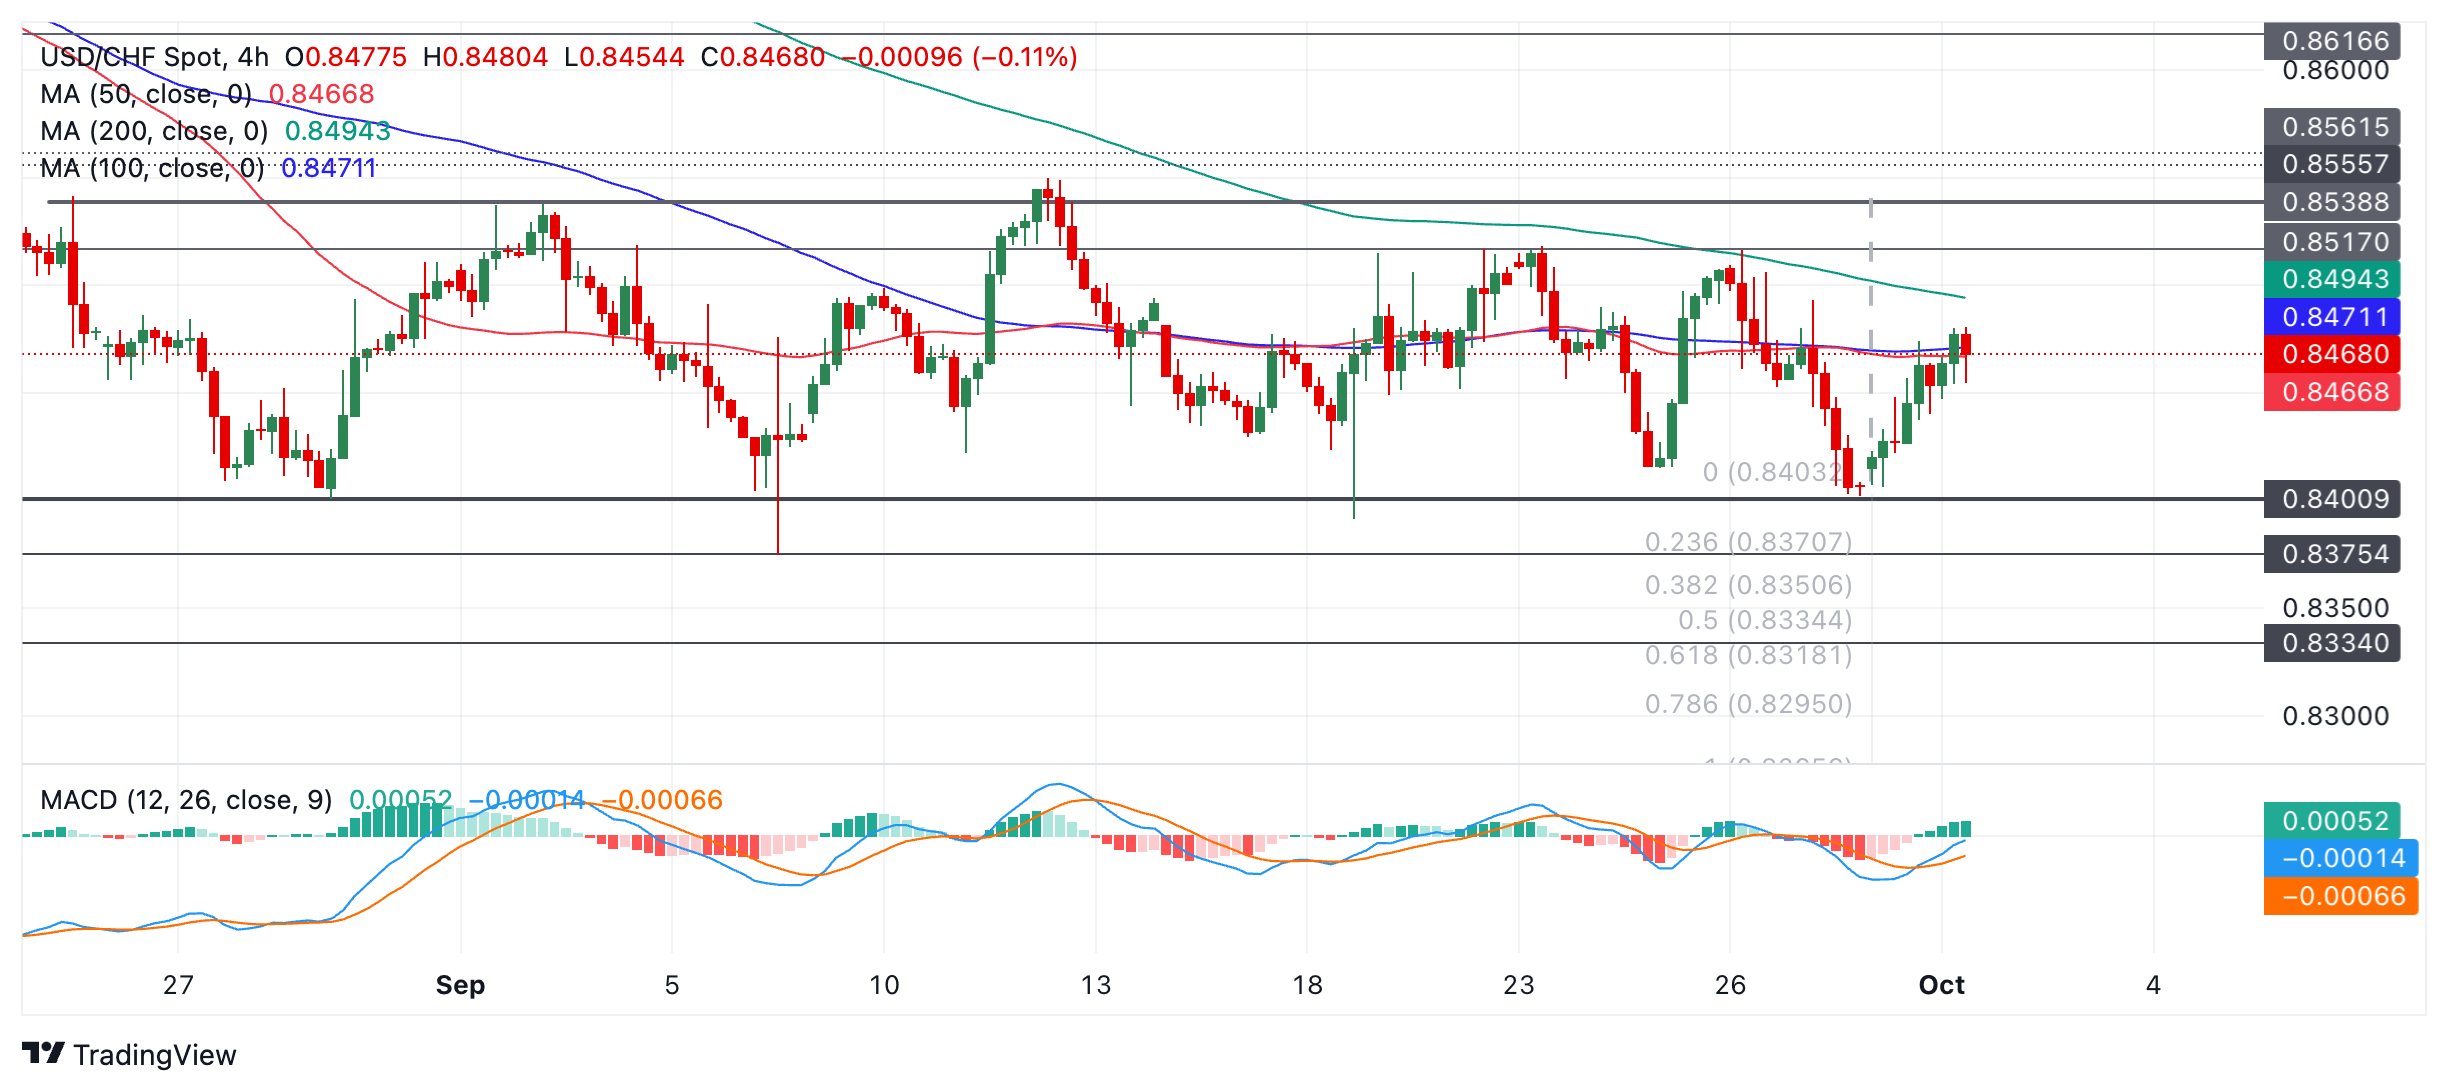
The trend is neither up nor down but rather sideways and so the oscillating character of the market is likely to extend, given the principle that “the trend is your friend.”
The blue Moving Average Convergence Divergence (MACD) momentum indicator line recently crossed above the red signal line, providing a buy signal. MACD is a more reliable indicator within sideways markets.
USD/CHF will probably continue higher. A break above the 0.8480 high would lead to an extension up to a target at about 0.8517 (September 23 and 26 highs) followed by the roof of the range at 0.8539.
- USD/JPY aims to recapture 145.00 as Fed Powell smashes large rate cut bets for November.
- The US Dollar bounces back ahead of key US data.
- An absence of immediate plans for more rate hikes in BoJ’s SOP weighed on the Japanese Yen.
The USD/JPY pair gathers strength to extend its upside towards the crucial resistance of 145.00 in Tuesday’s European session. The asset witnesses strong buying interest as the US Dollar (USD) rises further amid uncertainty ahead of the United States (US) Purchasing Managers’ Index (PMI) and the labor market data for September this week, which will indicate whether risks of an economic slowdown are intact.
Market sentiment is cautious as traders rollback bets supporting another large interest rate cut from the Federal Reserve (Fed) in November. S&P 500 futures have posted some losses in European trading hours. The US Dollar Index (DXY), which tracks the Greenback’s value against six major currencies, climbs to near 101.00.
The Fed started its rate-cut cycle with a decline in interest rates by 50 basis points (bps) to 4.75%-5.00% last month. Market participants were anticipating the Fed to continue with an aggressive policy easing stance to prevent further deterioration in job growth.
However, the comments from Fed Chair Jerome Powell on Monday suggested that policymakers are not in rush for reducing interest rates quickly. Powell said that he sees interest rates further declining by 50 bps by the year-end, which indicates that there will be two 25 bps rate cuts in each of the remaining two meetings this year.
On the Tokyo front, the Japanese Yen (JPY) weakens as the Bank of Japan (BoJ) Summary Of Opinions (SOP) of the monetary policy meeting that took place on September 19 indicated that officials have no immediate plans to tighten interest rates further. The BoJ intends to maintain its accommodative stance but remains open to adjustments if economic conditions show significant improvement, BoJ SOP showed.
China is now accelerating its services rebalancing efforts. Ministry of Finance to announce a new fiscal package next week, TDS macro analysts note.
The full impact of the stimulus to anchor growth in the 5% region
“China is accelerating its services rebalancing efforts which will lift long-term economic prospects. We expect the Ministry of Finance to announce a new fiscal package next week of CNY4tn (US$569bn) with a heavy focus on the consumer, equivalent to 3.2% of GDP to complement the aggressive monetary easing.”
“We expect asset price recovery and aggressive monetary stimulus to lift GDP growth for 2024 to 4.9% (prior: 4.7%), a modest boost considering there is only 1 quarter left in 2024 and most of the fiscal funds won't be disbursed in time. For 2025, the full impact of the fiscal stimulus and greater monetary stimulus should filter through and anchor growth in the 5% region.”
“The jury is still out if the private sector buys into Chinese's leaders' narrative shift (especially the consumer), and investors will keep a watchful eye on Q4 retail sales momentum and property prices to gauge the success of the policy moves.”
- The US Dollar strengthens on the back of overnight comments from Fed Chairman Powell.
- Israel has started its ground offensive in Lebanon, escalating tensions in the region.
- The US Dollar Index prints a four-day high ahead of ISM Manufacturing PMI data.
The US Dollar (USD) trades broadly positive on Tuesday ahead of the Manufacturing Purchasing Managers Index (PMI) numbers from the Institute for Supply Management (ISM). The positive turnaround for the Greenback took place after traders priced in less interest rate cuts from the Federal Reserve (Fed) on the back of Chairman Jerome Powell comments.
On the geopolitical side, Israel has started its incursion into Israel in what it calls “a limited ground offensive,” the Financial Times reports. Any further escalation of violence in the region could trigger safe-haven flows that generally tend to support the Greenback.
Looking at the economic calendar ahead, the ISM Manufacturing survey will be the main driver this Tuesday. Still, other elements will take up some attention as well. The JOLTS Job Openings report will give clues about how the demand for labor is evolving, while traders’ eyes and ears will need to be kept open as five Fed members are set to take the stage.
Daily digest market movers: Markets to become even more data driven
- Fed Chairman Powell left some remarkable comments overnight. One was that the Fed is even taking data into consideration for its upcoming policy meeting during its blackout period. This will make markets even more data dependent in the runup to the event.
- Israel is carrying out a “targeted” ground offensive in Lebanon, while Hezbollah is firing back with artillery and rockets targeting Israeli soldiers near the town of Metula. The United Arab Emirates, meanwhile, has issued a statement expressing deep concerns over Israel’s ground operation, warning of repercussions of this dangerous situation for the region, Bloomberg reports.
- At 13:45 GMT, the final reading of the S&P Global Manufacturing Purchasing Managers Index (PMI) for September will be released. Economists expect the number to be unchanged from its preliminary estimate of 47.
- At 14:00 GMT, the ISM Manufacturing numbers for September will be released:
- The headline PMI is expected to increase slightly to 47.5 from 47.2 a month earlier.
- Among the main subindexes, the Prices Paid component is expected to ease to 53.5 from 54, while the Employment Index is expected to rise to 47 from 46.
- In the slipstream of ISM, the JOLTS Job Openings for August will be released as well. Expectations are for a steady 7.670 million job openings against 7.673 million in July.
- Several Fed speakers will take the stage this Tuesday:
- At 15:00 GMT, Federal Reserve Bank of Atlanta Raphael Bostic delivers welcoming remarks and moderates a conversation with Federal Reserve Board Governor Lisa Cook at the Technology-Enabled Disruption conference in Atlanta.
- Near 22:15 GMT, Federal Reserve Bank of Richmond Thomas Barkin participates in a panel discussion with Atlanta Fed President Raphael Bostic and Boston Fed President Susan Collins at the Technology-Enabled Disruption conference in Atlanta.
- European equities are looking for direction, unsure on whether a possible rate cut from the European Central Bank (ECB) in October needs to be considered positive or to be perceived as a sign on the wall that activity in the eurozone is deteriorating quickly. US Futures are trading flat ahead of the US opening bell.
- The CME Fedwatch Tool shows a 63.0% chance of a 25 basis-point rate cut at the next Fed meeting on November 7, while 37.0% is pricing in another 50-basis-point rate cut.
- The US 10-year benchmark rate trades at 3.75%, looking to test the three-week high at 3.81%.
US Dollar Index Technical Analysis: Four-day high
The US Dollar Index (DXY) gets help from Fed Chairman Jerome Powell, whose comments have eased market expectations of another big rate cut for the upcoming rate decision in November. Fewer odds for a bigger cut support the US Dollar, as it subdues performance from other currencies in the DXY basket such as the Euro (EUR). Markets are increasingly pricing in that the European Central Bank (ECB) might be set to deliver a surprise rate cut in October, which widens the rate differential in favour of a stronger US Dollar.
The recovery looks to be a fierce one with the DXY already taking out four previous daily highs during Tuesday’s Asian trading. In case Dollar bulls can turn things further around, look at 101.90 for the next resistance level on the upside. Just above there, the 55-day Simple Moving Average (SMA) at 102.22 will come in.
On the downside, 100.62 is flipping back from resistance into support, in case the DXY closes above it this Tuesday. The fresh low of 2024 is at 100.16, so a test will take place before more downside takes place. Further down, and that means giving up the big 100.00 level, the July 14, 2023, low at 99.58 comes into play.
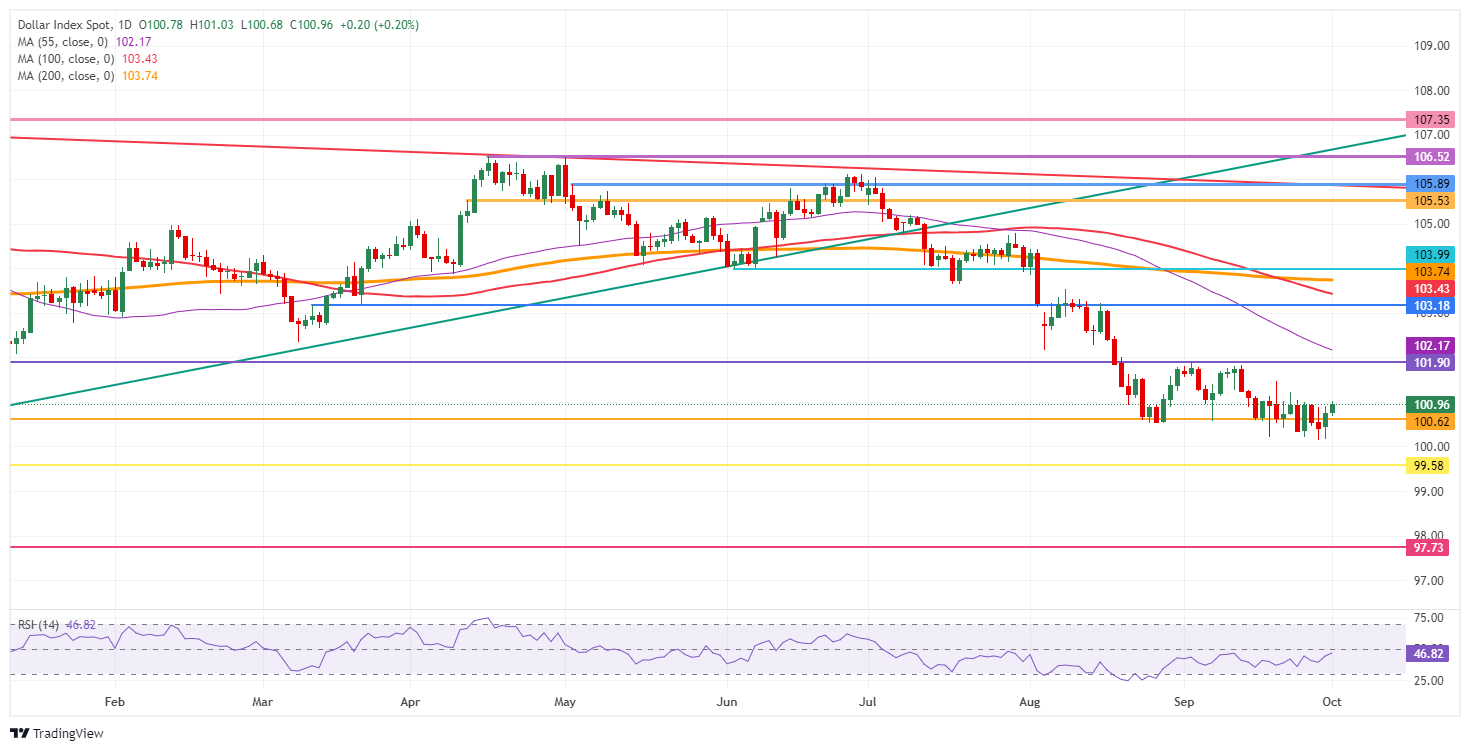
US Dollar Index: Daily Chart
Banking crisis FAQs
The Banking Crisis of March 2023 occurred when three US-based banks with heavy exposure to the tech-sector and crypto suffered a spike in withdrawals that revealed severe weaknesses in their balance sheets, resulting in their insolvency. The most high profile of the banks was California-based Silicon Valley Bank (SVB) which experienced a surge in withdrawal requests due to a combination of customers fearing fallout from the FTX debacle, and substantially higher returns being offered elsewhere.
In order to fulfill the redemptions, Silicon Valley Bank had to sell its holdings of predominantly US Treasury bonds. Due to the rise in interest rates caused by the Federal Reserve’s rapid tightening measures, however, Treasury bonds had substantially fallen in value. The news that SVB had taken a $1.8B loss from the sale of its bonds triggered a panic and precipitated a full scale run on the bank that ended with the Federal Deposit Insurance Corporation (FDIC) having to take it over.The crisis spread to San-Francisco-based First Republic which ended up being rescued by a coordinated effort from a group of large US banks. On March 19, Credit Suisse in Switzerland fell foul after several years of poor performance and had to be taken over by UBS.
The Banking Crisis was negative for the US Dollar (USD) because it changed expectations about the future course of interest rates. Prior to the crisis investors had expected the Federal Reserve (Fed) to continue raising interest rates to combat persistently high inflation, however, once it became clear how much stress this was placing on the banking sector by devaluing bank holdings of US Treasury bonds, the expectation was the Fed would pause or even reverse its policy trajectory. Since higher interest rates are positive for the US Dollar, it fell as it discounted the possibility of a policy pivot.
The Banking Crisis was a bullish event for Gold. Firstly it benefited from demand due to its status as a safe-haven asset. Secondly, it led to investors expecting the Federal Reserve (Fed) to pause its aggressive rate-hiking policy, out of fear of the impact on the financial stability of the banking system – lower interest rate expectations reduced the opportunity cost of holding Gold. Thirdly, Gold, which is priced in US Dollars (XAU/USD), rose in value because the US Dollar weakened.
The Gold price rose by 13% in the past quarter, the strongest increase in eight and a half years. Since Friday, the Gold price has been on the retreat, Commerzbank’s commodity analyst Carsten Fritsch notes.
Gold consolidation phase is now imminent
“From the all-time high of $2,685 per troy ounce recorded last Thursday, it has lost a good $50. We had pointed out that the last part of the price increase was no longer justified by interest rate expectations. These had also already gone much too far and were therefore scaled back again somewhat in the last few days. This means that Gold currently lacks a key driving force.”
“Although the CFTC's market positioning data showed a further increase in speculative net long positions in Gold to 219,000 contracts in the last reporting week, the highest level since February 2020, the increase was significantly lower than in the previous week, suggesting that speculative financial investors are becoming more cautious. Should positions now be closed, this would weigh on the price.”
“Physical demand for Gold in Asia is likely to be curbed by the strong price increase and the record high price level. As we reported on Friday, this was already visible in August in the sharp drop in China's Gold imports. The Gold ETFs tracked by Bloomberg recorded inflows for the seventh week in a row. However, the world's largest Gold ETF reported the strongest daily outflow since the end of May on Friday. There are currently several indications that the Gold rally has ended for the time being and that a consolidation phase is now imminent.”
Oil prices rose in response to the escalation of the Middle East conflict over the weekend, although the price increase at the beginning of the week was limited. The price of Brent oil rose briefly to $73 per barrel, but then shed its gains again, Commerzbank’s commodity analyst Carsten Fritsch notes.
The impact on oil supply to remain limited
“The start of an Israeli ground offensive in southern Lebanon, which was reported this morning, also had little impact on the price. Apparently, the market does not expect the increased tensions in the Middle East to affect oil supply in the foreseeable future. The killing of the leader of the Shiite terrorist militia Hezbollah by a targeted rocket attack by Israel in Beirut has certainly further intensified tensions in the region.”
“Iran, which supports Hezbollah in Lebanon financially and militarily, has so far avoided announcing a retaliatory attack. It appears that Iran is not interested in a military confrontation with Israel at present. It is also consistent with this that there has not yet been a retaliatory attack in response to the killing of a high-ranking Hamas leader in Tehran at the end of July, for which Israel is being blamed.”
“Provided that there is no direct confrontation between Iran and Israel, the impact on oil supply should remain limited. Consequently, there is no reason to add a larger risk premium to the oil price. The muted reaction of the oil market to the latest events is therefore reasonable. However, this does not mean that a situation cannot arise that would require a reassessment of the situation. The news from the Middle East should therefore continue to be watched closely.”
The US Dollar (USD) could continue to rebound; there does not appear to be enough momentum for it to threaten the resistance at 7.0350. In the longer run, downward momentum is beginning to slow; if USD breaches 7.0350, it would suggest that it could trade in a range for a period, UOB Group FX analysts Quek Ser Leang and Lee Sue Ann note.
Downward momentum is beginning to slow
24-HOUR VIEW: “We expected USD to edge lower yesterday. We were incorrect, as instead of edging lower, USD rebounded strongly to 7.0120. The strong rebound has resulted in an increase in momentum. Today, USD could continue to rebound, but it does not appear to have enough momentum to threaten the strong resistance at 7.0350. Note that there is another resistance level at 7.0240. Support is at 6.9980, a breach of 6.9850 would indicate that the current upward pressure has eased.”
1-3 WEEKS VIEW: “We have held a negative USD view for more than a week now (as annotated in the chart below). In our most recent narrative from last Friday (27 Sep, spot at 6.9810), we indicated that ‘the recent price action continues to suggest USD weakness, albeit likely at a slower pace.’ We added, ‘the levels to monitor are 6.9400 and 6.9200, and a breach of 7.0350 (‘strong resistance’ level) would mean that USD is not weakening further.’ USD has not been able to make any further headway on the downside. Downward momentum is beginning to slow, and if it breaches 7.0350 (no change in ‘strong resistance’ level), it would suggest that it could trade in a range for a period.”
Poland’s recent inflation data had been entirely dovish, and that the hawkish stance being maintained by NBP governor Adam Glapinski (and his faction within the MPC) – allegedly based on some concern about possible inflation pressure in future – had no fundamental basis, Commerzbank’s FX analyst Tatha Ghose notes.
Glapinski faces parliamentary pressure
“Inflation spiked briefly when erstwhile anti-inflation policies, such as reduced VAT on food, were discontinued. We see little chance of this factor producing a long-lived burst of inflation. This is why we labelled Glapinski’s stance blatantly political. As a follow-up, yesterday’s flash CPI reading for September supports our view on Polish inflation. Media headlines emphasize that inflation had accelerated from 4.3%y/y to 4.9%y/y. But in contrast with what the media suggested, this does not showcase pro-inflation risks. Nothing could be further from the truth.”
“The year-on-year rate of change is misleading. The recent momentum of prices – represented by the month-on-month change of seasonally-adjusted price level – recorded a within-target 0.1%m/m. This rate of change had, indeed, spiked to nearly 2%m/m immediately after the VAT rate increased, but that impulse has since faded. The broader pattern of Polish inflation falls near the dovish end of the regional peer spectrum.”
“Hence, it does not make sense that the Polish central bank will be cutting rates a year after peer central banks have done so. In our view, this artificial hawkish monetary stance should not be supporting the zloty’s valuation as it represents the failure, the politicisation of monetary policy. The monetary stance could flip towards dovish in coming months as Glapinski faces parliamentary pressure to explain himself. This is a source of risk for the currency.”
The US Dollar (USD) could rebound further; a sustained rise above 144.50 is unlikely. In the longer run, upward momentum has dissipated; USD could continue to trade choppily but is likely to stay within a 140.00/146.00 range, UOB Group FX analysts Quek Ser Leang and Lee Sue Ann note.
USD to continue to trade choppily
24-HOUR VIEW: “Yesterday, we indicated that ‘the weakness in USD could retest the 142.00 level before stabilisation is likely.’ We also indicated that ‘a sustained decline below 142.00 is unlikely.’ USD then dropped to 141.63 before rebounding strongly, reaching a high of 143.91 in NY trade. There has been an increase in momentum, and USD could rebound further to 144.50. Today, a sustained rise above this level is unlikely. Support levels are at 143.30 and 142.80.”
1-3 WEEKS VIEW: “Our update from yesterday (30 Sep, spot at 142.60) remains valid. As highlighted, the recent buildup in upward momentum has dissipated. From here, USD could continue to trade in a choppy manner, but it is expected to stay within a range of 141.00/146.00 range.”
- AUD/USD edges lower to 0.6900 as the US Dollar gains firm footing.
- The US Dollar bounces back as traders brace for a slew of US data.
- Fed Powell pushed back large rate cut expectations for November.
The AUD/USD pair exhibits a subdued performance near the crucial support of 0.6900 in Tuesday’s European session. The Aussie asset faces slight selling pressure as the US Dollar (USD) bounces back strongly after the Federal Reserve (Fed) Chair Jerome Powell pushed back market speculation for another interest rate cut of 50 basis points (bps) in November.
The CME FedWatch tool shows that the probability of the Fed reducing interest rates by 50 basis points (bps) to 4.25%-4.50% in November has eased to 39% from 58% a week ago.
S&P 500 futures have posted some losses in the European session, portraying a cautious market mood. The US Dollar Index (DXY), which tracks the Greenback’s value against six major currencies, rises sharply to near 101.00. However, 10-year US Treasury yields tumble to near 3.75%.
Fed Powell commented on Monday at the National Association for Business Economics conference that policymakers don’t feel for cutting interest rates quickly. In the latest Fed dot plot, officials forecasted the Federal Fund Rate heading to 4.4% by the year-end, indicating that there will be two quarter-to-a-percentage rate cuts in each of the two meetings remaining this year.
On the economic front, investors will focus on the United States (US) JOLTS Job Openings data for August and the ISM Manufacturing PMI for September, which will be published at 14:00 GMT.
Meanwhile, the near-term appeal of the Australian Dollar (AUD) remains firm as Australia’s economic outlook has been improved by China’s massive liquidity stimulus. China's cabinet reported on Sunday that it will focus on solving outstanding economic problems and strive to complete annual economic and social development goals, Reuters reported. Being a proxy for China’s economic growth, the Australian Dollar has benefitted from the stimulus announcement.
Australian Dollar FAQs
One of the most significant factors for the Australian Dollar (AUD) is the level of interest rates set by the Reserve Bank of Australia (RBA). Because Australia is a resource-rich country another key driver is the price of its biggest export, Iron Ore. The health of the Chinese economy, its largest trading partner, is a factor, as well as inflation in Australia, its growth rate and Trade Balance. Market sentiment – whether investors are taking on more risky assets (risk-on) or seeking safe-havens (risk-off) – is also a factor, with risk-on positive for AUD.
The Reserve Bank of Australia (RBA) influences the Australian Dollar (AUD) by setting the level of interest rates that Australian banks can lend to each other. This influences the level of interest rates in the economy as a whole. The main goal of the RBA is to maintain a stable inflation rate of 2-3% by adjusting interest rates up or down. Relatively high interest rates compared to other major central banks support the AUD, and the opposite for relatively low. The RBA can also use quantitative easing and tightening to influence credit conditions, with the former AUD-negative and the latter AUD-positive.
China is Australia’s largest trading partner so the health of the Chinese economy is a major influence on the value of the Australian Dollar (AUD). When the Chinese economy is doing well it purchases more raw materials, goods and services from Australia, lifting demand for the AUD, and pushing up its value. The opposite is the case when the Chinese economy is not growing as fast as expected. Positive or negative surprises in Chinese growth data, therefore, often have a direct impact on the Australian Dollar and its pairs.
Iron Ore is Australia’s largest export, accounting for $118 billion a year according to data from 2021, with China as its primary destination. The price of Iron Ore, therefore, can be a driver of the Australian Dollar. Generally, if the price of Iron Ore rises, AUD also goes up, as aggregate demand for the currency increases. The opposite is the case if the price of Iron Ore falls. Higher Iron Ore prices also tend to result in a greater likelihood of a positive Trade Balance for Australia, which is also positive of the AUD.
The Trade Balance, which is the difference between what a country earns from its exports versus what it pays for its imports, is another factor that can influence the value of the Australian Dollar. If Australia produces highly sought after exports, then its currency will gain in value purely from the surplus demand created from foreign buyers seeking to purchase its exports versus what it spends to purchase imports. Therefore, a positive net Trade Balance strengthens the AUD, with the opposite effect if the Trade Balance is negative.
The figures published yesterday morning on the Swiss National Bank's (SNB) foreign exchange market operations in the second quarter confirmed what the statements made at the last press conference had already indicated, Commerzbank’s FX analyst Michael Pfister notes.
SNB reluctant to take action against the strong franc
“For the time being, the SNB appears to be continuing to rely mainly on the key interest rate as its preferred instrument, with interventions even lower than the already quite low level in the first quarter. And this is despite the fact that, in the first quarter, one might have assumed that the SNB was slow to switch to foreign currency purchases, i.e. that it was first buying CHF and then selling CHF later in the quarter, thereby distorting the quarterly aggregate. In short, the SNB seems reluctant to take stronger action against the strong franc, at least for the time being.”
“Although the data are published with a long lag and the picture may look different in the third quarter, the SNB's current focus on the policy rate as a means of combating the strong franc – and the fact that most market participants are aware that the scope for rate cuts is much more limited here than in other G10 currencies – suggests that the scope for franc weakness is also more limited than recently thought.
“The SNB must therefore hope for a stronger euro and US dollar if it wants to see higher EUR/CHF and USD/CHF levels.”
- Crude Oil falls over 2% as Israel breaches Lebanon’s borders for a military operation.
- Traders are sending Crude Oil lower with anticipations of a full-scale invasion being priced out.
- The US Dollar Index jumps driven by Fed Chairman Powell’s cautious outlook over interest rate cuts and geopolitics.
Crude Oil slides lower on Tuesday, extending Monday’s losses, even as Israel began its ground incursion into Lebanon. Traders seemed to be expecting a much bigger or even full-blown ground offensive, which doesn’t seem to be the case. Rather, the incursion seems to be based on several special operations and very specific targets being taken out around border posts and villages in Lebanon, limiting the actual impact on other countries in the Middle East.
The US Dollar Index (DXY), which tracks the performance of the Greenback against six other currencies, is enjoying some inflow on the back of comments from Federal Reserve (Fed) Chairman Jerome Powell. The Fed Chairman pushed back against calls for another big rate cut in November, pointing out that the Fed remains data dependent. On the docket for this Tuesday, Manufacturing data from the Institute for Supply Management and the JOLTS Job openings for August will shed more light on the state of the US economy.
At the time of writing, Crude Oil (WTI) trades at $67.48 and Brent Crude at $71.22.
Oil news and market movers: How a military excursion can be negative for Oil
- Israel Defense Forces are striking local villages close to the border that potentially could pose an immediate threat to Israeli communities in Northern Israel, Reuters reports.
- The United Arab Emirates has expressed “deep concern” over Israel’s ground operation in Lebanon, pointing out the possible repercussions of this dangerous situation for the region, Bloomberg reports.
- Hezbollah is retaliating with missles being fired deep into Israel, Reuters reports.
- From the demand side, bad news came from China with manufacturing activity shrinking in September as new orders both domestically and abroad cooled down, Reuters reports.
Oil Technical Analysis: You can’t buy the dip
Crude Oil prices is showcasing a textbook example here of “buy the rumour, sell the fact” wisdom when trading financial product assets. Tensions were building up towards this incursion from Israel into Lebanon over the past few days. With the actual event now being less severe and less impactful as first anticipated, the risk premium that got priced in last week is now fully being priced out.
At current levels, $71.46 remains in focus after a brief false break last week. If a supportive catalyst remains present, a return to $75.27 (the January 12 high) could play out. Along the way towards that level, the 55-day Simple Moving Average (SMA) at $73.36 could ease the rally a bit. Once above $75.27, the first resistance to follow is $76.03, with the 100-day SMA in play.
On the downside, $67.11, a triple bottom in the summer of 2023, could still hold as support once traders that want to buy the dip push price action back above this level. If that is not the case, further down the next level is $64.38, the low from March and May 2023. Even $61.65 could come into play should a ceasefire emerge or if Israel signals it is done with its special operation into Lebanon.
US WTI Crude Oil: Daily Chart
WTI Oil FAQs
WTI Oil is a type of Crude Oil sold on international markets. The WTI stands for West Texas Intermediate, one of three major types including Brent and Dubai Crude. WTI is also referred to as “light” and “sweet” because of its relatively low gravity and sulfur content respectively. It is considered a high quality Oil that is easily refined. It is sourced in the United States and distributed via the Cushing hub, which is considered “The Pipeline Crossroads of the World”. It is a benchmark for the Oil market and WTI price is frequently quoted in the media.
Like all assets, supply and demand are the key drivers of WTI Oil price. As such, global growth can be a driver of increased demand and vice versa for weak global growth. Political instability, wars, and sanctions can disrupt supply and impact prices. The decisions of OPEC, a group of major Oil-producing countries, is another key driver of price. The value of the US Dollar influences the price of WTI Crude Oil, since Oil is predominantly traded in US Dollars, thus a weaker US Dollar can make Oil more affordable and vice versa.
The weekly Oil inventory reports published by the American Petroleum Institute (API) and the Energy Information Agency (EIA) impact the price of WTI Oil. Changes in inventories reflect fluctuating supply and demand. If the data shows a drop in inventories it can indicate increased demand, pushing up Oil price. Higher inventories can reflect increased supply, pushing down prices. API’s report is published every Tuesday and EIA’s the day after. Their results are usually similar, falling within 1% of each other 75% of the time. The EIA data is considered more reliable, since it is a government agency.
OPEC (Organization of the Petroleum Exporting Countries) is a group of 12 Oil-producing nations who collectively decide production quotas for member countries at twice-yearly meetings. Their decisions often impact WTI Oil prices. When OPEC decides to lower quotas, it can tighten supply, pushing up Oil prices. When OPEC increases production, it has the opposite effect. OPEC+ refers to an expanded group that includes ten extra non-OPEC members, the most notable of which is Russia.
- EUR/USD faces selling pressure as flash Eurozone annual headline HICP came in lower at 1.8% than estimates of 1.9% in September.
- The ECB is highly expected to cut interest rates again in October.
- Investors await the US labor market data for fresh interest rate guidance.
EUR/USD slides below the round-level support of 1.1100 in Tuesday’s European session. The major currency pair weakens due to further deceleration in the preliminary annual Eurozone headline Harmonized Index of Consumer Prices (HICP) below the European Central Bank’s (ECB) target of 2%, which has boosted market speculation for the ECB cutting interest rates again in October.
The report showed that the annual headline HICP inflation decelerated at a faster-than-expected pace to 1.8% from the estimates of 1.9% and August's reading of 2.2%. The core HICP – which excludes volatile items such as food, energy, alcohol, and tobacco – rose by 2.7%, slower than expectations and the August reading of 2.8%. Monthly headline HICP deflated by 0.1% in September, while the core HICP grew at a similar pace.
The ECB delivered the second interest rate cut of its current policy-easing cycle in September and is expected to cut again in October. The return of the annual HICP below 2% is not the sole reason for an increase in the ECB rate cut bets. The Old Continent is underperforming on various parameters, such as the labor market and overall economic activity. Therefore, more rate cuts are needed for the economic revival.
On Monday, ECB President Christine Lagarde acknowledged, “Some survey indicators suggest that the recovery is facing headwinds,” at the European Union parliamentary hearing in Brussels. "The latest developments strengthen our confidence that inflation will return to target in a timely manner," and "we will take that into account in our next monetary policy meeting in October," she added.
Daily digest market movers: EUR/USD weakens on US Dollar’s recovery
- EUR/USD remains under pressure as the US Dollar (USD) bounces back after traders pare Federal Reserve (Fed) large rate cut bets for November. The US Dollar Index (DXY), which tracks the Greenback’s value against six major currencies, jumps above 101.00. According to the CME FedWatch tool, 30-day Federal Fund futures pricing data shows that the likelihood of the Fed reducing interest rates by 50 bps in November waned to 35.3% from 58% a week ago.
- Market speculation for Fed outsize interest rate cuts eased after Fed Chair Jerome Powell's comments at the National Association for Business Economics conference on Monday, which indicated that the central bank will reduce key rates by quarter-to-a-percentage in both meetings remaining this year. Powell said, "If the economy evolves as expected, that would be two more cuts by year's end, for a total reduction of half a percentage point more", Reuters reported.
- On the contrary, Atlanta Fed Bank President Raphael Bostic backed a second straight interest rate cut by 50 bps if the labor market data weakens unexpectedly. For fresh insights about the current labor market health, investors will focus on the United States (US) ADP Employment Change and the Nonfarm Payrolls (NFP) data for September, which will be published on Wednesday and Friday, respectively.
- In Tuesday’s New York session, the US Dollar will be influenced by the US ISM Manufacturing Purchasing Managers Index (PMI) for September and the JOLTS Job Openings data for August, which will be published at 14:00 GMT.
Technical Analysis: EUR/USD falls from 1.1200
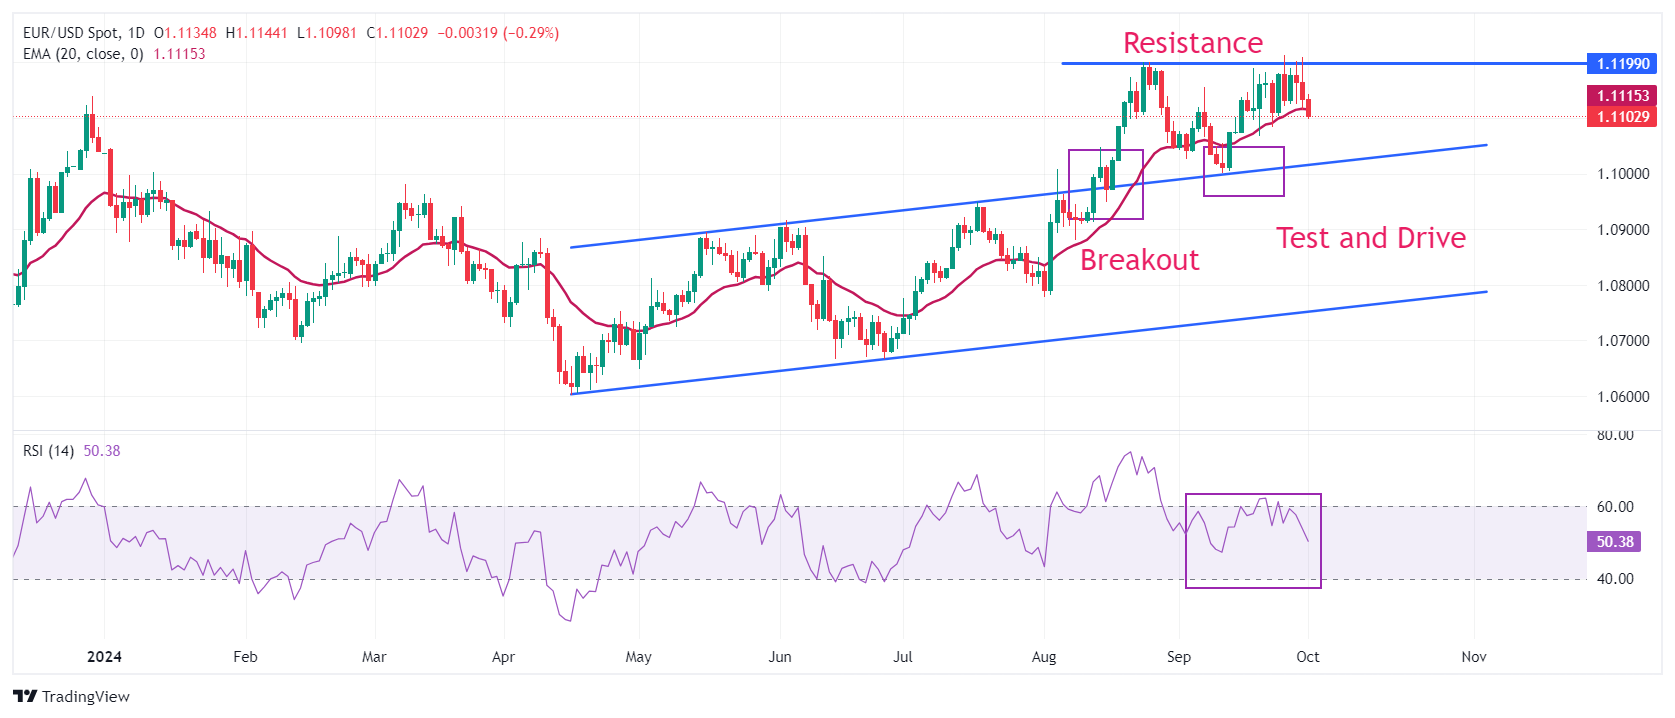
EUR/USD drops sharply to near 1.1100 after failing to recapture the key resistance of 1.1200 on Monday. The major currency pair drops slightly below the upward-sloping 20-day Exponential Moving Average (EMA) near 1.1110, suggesting that the near-term outlook has become uncertain.
The long-term outlook of the shared currency pair remains firm till it holds the breakout of the Rising Channel chart pattern formed on a daily time frame near the psychological support of 1.1000.
The 14-day Relative Strength Index (RSI) edges lower below 60.00, suggesting momentum is weakening.
Looking up, a decisive break above the round-level resistance of 1.1200 will result in further appreciation toward the July 2023 high of 1.1276. On the downside, the psychological level of 1.1000 and the July 17 high near 1.0950 will be major support zones.
Euro FAQs
The Euro is the currency for the 19 European Union countries that belong to the Eurozone. It is the second most heavily traded currency in the world behind the US Dollar. In 2022, it accounted for 31% of all foreign exchange transactions, with an average daily turnover of over $2.2 trillion a day. EUR/USD is the most heavily traded currency pair in the world, accounting for an estimated 30% off all transactions, followed by EUR/JPY (4%), EUR/GBP (3%) and EUR/AUD (2%).
The European Central Bank (ECB) in Frankfurt, Germany, is the reserve bank for the Eurozone. The ECB sets interest rates and manages monetary policy. The ECB’s primary mandate is to maintain price stability, which means either controlling inflation or stimulating growth. Its primary tool is the raising or lowering of interest rates. Relatively high interest rates – or the expectation of higher rates – will usually benefit the Euro and vice versa. The ECB Governing Council makes monetary policy decisions at meetings held eight times a year. Decisions are made by heads of the Eurozone national banks and six permanent members, including the President of the ECB, Christine Lagarde.
Eurozone inflation data, measured by the Harmonized Index of Consumer Prices (HICP), is an important econometric for the Euro. If inflation rises more than expected, especially if above the ECB’s 2% target, it obliges the ECB to raise interest rates to bring it back under control. Relatively high interest rates compared to its counterparts will usually benefit the Euro, as it makes the region more attractive as a place for global investors to park their money.
Data releases gauge the health of the economy and can impact on the Euro. Indicators such as GDP, Manufacturing and Services PMIs, employment, and consumer sentiment surveys can all influence the direction of the single currency. A strong economy is good for the Euro. Not only does it attract more foreign investment but it may encourage the ECB to put up interest rates, which will directly strengthen the Euro. Otherwise, if economic data is weak, the Euro is likely to fall. Economic data for the four largest economies in the euro area (Germany, France, Italy and Spain) are especially significant, as they account for 75% of the Eurozone’s economy.
Another significant data release for the Euro is the Trade Balance. This indicator measures the difference between what a country earns from its exports and what it spends on imports over a given period. If a country produces highly sought after exports then its currency will gain in value purely from the extra demand created from foreign buyers seeking to purchase these goods. Therefore, a positive net Trade Balance strengthens a currency and vice versa for a negative balance.
- Gold is recovering on Tuesday as safe-haven demand increases following Israel’s invasion of Lebanon.
- Fed Chairman Powell adopts a more cautious, data-dependent stance, which caps gains for the yellow metal.
- Technically, XAU/USD is at risk of reversing its short-term uptrend and pushing lower.
Gold (XAU/USD) recovers marginally to trade in the $2,640s per troy ounce on Tuesday after the Israeli army mounts a ground invasion of Lebanon, stoking geopolitical tensions and increasing safe-haven demand for Gold. This, and the fading effect of China’s stimulus program, which temporarily diverted capital back into property and rallying Chinese equity markets, combine to help the yellow metal recover after two consecutive days of losses.
Gold may see upside limited by Fed commentary
Gold will probably see upside capped, however, by comments from the Federal Reserve (Fed) Chairman Jerome Powell, who said on Monday that although the Fed made a larger-than-standard 50 basis points (bps) (0.50%) cut to interest rates at its last meeting, that did not automatically imply the same would happen at future meetings.
Powell said the FOMC is “not a committee that feels like it is in a hurry to cut rates quickly,” during his speech at the NABE conference. The Fed Chairman inferred that the Fed would probably make two more 25 bps cuts to interest rates before the year-end, but that it was not on a “pre-set course.”
The market-based probabilities of the Fed reducing interest rates by 50 bps at its November meeting have fallen from over 60% last week to the mid-30% level on Tuesday, according to the CME FedWatch tool.
Apart from Powell’s comments, stronger-than-expected data has also reduced bets of another “jumbo” rate cut. The decline in chances of a larger cut has weighed on Gold, which is negatively correlated to interest rates. The yellow metal is a non-interest-bearing asset, so when interest rates are lower, it becomes more attractive to investors, and vice versa if rates remain high or rise.
Technical Analysis: Gold correction threatens to reverse short-term uptrend
Gold pulls back to the 50-period Simple Moving Average (SMA) at the 4-hour chart. The correction has unfolded a sequence of lower lows and lower highs since the September 26 all-time high and brings into doubt the precious metal’s short-term uptrend.
The market is quite balanced, but more weakness could possibly follow, bringing Gold down to the trendline at about $2,615-$2,620. A break below the $2,625 Monday’s low would provide bearish confirmation of such a move.
XAU/USD 4-hour Chart
A break below the trendline could lead to yet further weakness until firm support is reached at $2,600 (September 18 high), followed by $2,550 and then $2,544 (0.382 Fibonacci retracement of the September rally).
The Relative Strength Index (RSI) momentum indicator is in neutral territory, further suggesting ample downside space before it becomes oversold.
On a medium and long-term basis, Gold remains in an uptrend, however, and since it is a foundational principle of technical analysis that “the trend is your friend,” the odds favor resumption higher eventually. A break above the $2,685 all-time high would confirm a bullish continuation to round-number targets at $2,700 and then $2,750.
Gold FAQs
Gold has played a key role in human’s history as it has been widely used as a store of value and medium of exchange. Currently, apart from its shine and usage for jewelry, the precious metal is widely seen as a safe-haven asset, meaning that it is considered a good investment during turbulent times. Gold is also widely seen as a hedge against inflation and against depreciating currencies as it doesn’t rely on any specific issuer or government.
Central banks are the biggest Gold holders. In their aim to support their currencies in turbulent times, central banks tend to diversify their reserves and buy Gold to improve the perceived strength of the economy and the currency. High Gold reserves can be a source of trust for a country’s solvency. Central banks added 1,136 tonnes of Gold worth around $70 billion to their reserves in 2022, according to data from the World Gold Council. This is the highest yearly purchase since records began. Central banks from emerging economies such as China, India and Turkey are quickly increasing their Gold reserves.
Gold has an inverse correlation with the US Dollar and US Treasuries, which are both major reserve and safe-haven assets. When the Dollar depreciates, Gold tends to rise, enabling investors and central banks to diversify their assets in turbulent times. Gold is also inversely correlated with risk assets. A rally in the stock market tends to weaken Gold price, while sell-offs in riskier markets tend to favor the precious metal.
The price can move due to a wide range of factors. Geopolitical instability or fears of a deep recession can quickly make Gold price escalate due to its safe-haven status. As a yield-less asset, Gold tends to rise with lower interest rates, while higher cost of money usually weighs down on the yellow metal. Still, most moves depend on how the US Dollar (USD) behaves as the asset is priced in dollars (XAU/USD). A strong Dollar tends to keep the price of Gold controlled, whereas a weaker Dollar is likely to push Gold prices up.
Momentum is turning neutral; the New Zealand Dollar (NZD) is expected to trade sideways between 0.6310 and 0.6365. In the longer run, there has been no further increase in momentum; it remains unclear if NZD could rise further to 0.6410, UOB Group FX analysts Quek Ser Leang and Lee Sue Ann note.
Unclear if NZD can rise further to 0.6410
24-HOUR VIEW: “After NZD rose sharply last Friday, we indicated yesterday (Monday) that ‘the rapid rise seems to be overdone, but NZD could test the resistance at 0.6370 before the risk of a pullback increases.’ We also indicated that ‘a sustained break above 0.6370 is unlikely today.’ Our view was not wrong, even though NZD rose slightly more than expected to 0.6379 before pulling back. Momentum indicators are turning neutral, and we expect NZD to trade sideways today, probably between 0.6310 and 0.6365.”
1-3 WEEKS VIEW: “Last Friday (27 Sep, spot at 0.6325), we indicated that ‘to continue to advance, NZD must break clearly above 0.6355.’ After NZD broke above 0.6355, we indicated yesterday (30 Sep, spot at 0.6350) that NZD ‘is likely to rise above 0.6370, but it is unclear for now if there is sufficient momentum for it to reach last July’s high, near 0.6410.’ NZD subsequently rose, reaching 0.6379 before pulling back. There has been no further increase in momentum, and it remains unclear if NZD could rise further to 0.6410. Overall, only a breach of 0.6280 (no change in ‘strong support’ level) would mean that 0.6410 is not coming into view.”
“USD/SGD rebounded. Pair was last at 1.2863, OCBC FX strategists Frances Cheung and Christopher Wong note.
Mild bearish momentum on daily chart fades
“Mild bearish momentum on daily chart faded while RSI rose from near oversold conditions. Near rebound risks likely to play out but broader trend remains skewed to the downside.”
“Resistance at 1.29, 1.30 levels. Support at 1.28, 1.2740 levels (76.4% fibo retracement of 2012 low to 2020 high). S$NEER was last estimated at ~1.96% above our model-implied mid.”
Silver prices (XAG/USD) rose on Tuesday, according to FXStreet data. Silver trades at $31.36 per troy ounce, up 0.64% from the $31.16 it cost on Monday.
Silver prices have increased by 31.78% since the beginning of the year.
| Unit measure | Silver Price Today in USD |
|---|---|
| Troy Ounce | 31.36 |
| 1 Gram | 1.01 |
The Gold/Silver ratio, which shows the number of ounces of Silver needed to equal the value of one ounce of Gold, stood at 84.43 on Tuesday, down from 84.56 on Monday.
Silver FAQs
Silver is a precious metal highly traded among investors. It has been historically used as a store of value and a medium of exchange. Although less popular than Gold, traders may turn to Silver to diversify their investment portfolio, for its intrinsic value or as a potential hedge during high-inflation periods. Investors can buy physical Silver, in coins or in bars, or trade it through vehicles such as Exchange Traded Funds, which track its price on international markets.
Silver prices can move due to a wide range of factors. Geopolitical instability or fears of a deep recession can make Silver price escalate due to its safe-haven status, although to a lesser extent than Gold's. As a yieldless asset, Silver tends to rise with lower interest rates. Its moves also depend on how the US Dollar (USD) behaves as the asset is priced in dollars (XAG/USD). A strong Dollar tends to keep the price of Silver at bay, whereas a weaker Dollar is likely to propel prices up. Other factors such as investment demand, mining supply – Silver is much more abundant than Gold – and recycling rates can also affect prices.
Silver is widely used in industry, particularly in sectors such as electronics or solar energy, as it has one of the highest electric conductivity of all metals – more than Copper and Gold. A surge in demand can increase prices, while a decline tends to lower them. Dynamics in the US, Chinese and Indian economies can also contribute to price swings: for the US and particularly China, their big industrial sectors use Silver in various processes; in India, consumers’ demand for the precious metal for jewellery also plays a key role in setting prices.
Silver prices tend to follow Gold's moves. When Gold prices rise, Silver typically follows suit, as their status as safe-haven assets is similar. The Gold/Silver ratio, which shows the number of ounces of Silver needed to equal the value of one ounce of Gold, may help to determine the relative valuation between both metals. Some investors may consider a high ratio as an indicator that Silver is undervalued, or Gold is overvalued. On the contrary, a low ratio might suggest that Gold is undervalued relative to Silver.
(An automation tool was used in creating this post.)
The Japanese Yen (JPY) would be the other go-to currency in a geopolitical risk escalation, but Japanese markets are currently trading mostly on domestic news, ING’s FX strategist Francesco Pesole notes.
Short-term JPY swap rates are inching lower
“The Nikkei has rebounded after yesterday’s selloff and short-term JPY swap rates are inching lower after the Bank of Japan (BoJ) summary of opinions was slightly hawkish, with one member explicitly signalling downside risks. This is partly offsetting bets that the new Prime Minister Sanae Takaichi will favour fighting inflation.”
“Ultimately, our view on the BoJ remains more hawkish than the market’s pricing for 13bp of tightening over the next three meetings, so even if the tactical picture is turning more skewed to the upside for USD/JPY – not least because of risks of correction higher in USD rates – we are not ready to call for a sustained, multi-month JPY underperformance.”
The Australian Dollar (AUD) is expected to trade in a sideways range of 0.6885/0.6935. In the longer run, AUD is likely to edge higher; it remains to be seen if there is enough momentum for it to reach 0.6980, UOB Group FX analysts Quek Ser Leang and Lee Sue Ann note.
May have enough momentum for AUD to reach 0.6980
24-HOUR VIEW: “Two days ago, AUD rose to 0.6937 and then pulled back slightly. Yesterday, we highlighted that ‘although upward momentum has not increased much, there is room for AUD to test 0.6940 before another pullback is likely.’ AUD subsequently rose to 0.6944, pulling back to close at 0.6913 (+0.13%). There has been no further increase in momentum, and instead of continuing to rise today, AUD is expected to trade in a sideways range of 0.6885/0.6935.”
1-3 WEEKS VIEW: “We continue to hold the same view as yesterday (30 Sep, spot at 0.6910). As indicated, while the recent price action suggests that AUD is likely to edge higher, it remains to be seen if there is enough momentum for AUD to reach 0.6980. On the downside, a breach of 0.6860 (‘strong support’ level was at 0.6845 yesterday) would mean that AUD is not advancing further.”
Euro (EUR) slipped amid broad US Dollar (USD) rebound. EUR was last at 1.1109 levels, OCBC FX strategists Frances Cheung and Christopher Wong note.
Resistance is at 1.12 double-top
“ECB speaks are also of interest. Lagarde told a parliamentary hearing yesterday that the suppressed level of some survey indicators suggests that the recovery is facing headwinds. She added the latest developments strengthen our confidence that inflation will return to target in a timely manner. We will take that into account in our next monetary policy meeting in October.”
“Daily momentum is not showing a clear bias while RSI turned lower. Risks remain skewed towards the downside. Double-top pattern observed – typically associated with bearish reversal. Support at 1.11 (21 DMA), 1.1030,60 levels (50 DMA, 23.6% fibo retracement of 2024 low to high). Resistance at 1.12 (double-top).”
The two-year EUR:USD swap rate continued to widen in favour of the dollar yesterday, and is now around -110bp, some 25bp below the -85bp mid-September levels, ING’s FX strategist Francesco Pesole notes.
EUR can fall below 1.110 in the coming days
“The notion that an inflation-concerned ECB would move more carefully than the Fed on easing is crumbling, as Powell continued to signal no interest to cut by 50bp again and inflation figures in Germany, France, Spain and Italy are all endorsing the ECB doves’ case for a cut in October. Even ECB President Christine Lagarde struck a more dovish tone yesterday as she pointed to greater confidence in disinflation, which will taken ‘into account in our next monetary policy meeting in October’.”
“The large moves in the EUR:USD short-term rate differentials are pointing to a weaker EUR/USD now. Incidentally, we could see some fresh political risk premium being built into the euro as new French Prime Minister Michel Barnier is facing an even worse than expected deficit situation, and a likely political battle ahead to push forward any budget consolidation measures.”
“Our rates team does not expect any respite in French bond spreads. Barnier delivers a key Parliamentary speech at 3PM CET today: expect some debt market volatility spilling into the euro. All in all, barring surprise in EZ and US data, we think EUR/USD can trade back below 1.110 in the next couple of days, and test 1.100 if US unemployment doesn’t tick higher on Friday.”
The Eurozone Harmonized Index of Consumer Prices (HICP) rose 1.8% over the year in September after increasing by 2.2% in August, the official data released by Eurostat showed Tuesday. The reading came in below the market expectations of 1.9% in the reported period.
The Core HICP advanced 2.7% YoY in September, a tad slower than the 2.8% increase in August and below the 2.8% forecast.
On a monthly basis, the bloc’s HICP dropped 0.1% in September, as against August’s 0.1% acceleration. The core HICP inflation arrived at 0.1% MoM in the same period, compared to a 0.3% growth in August.
The European Central Bank’s (ECB) inflation target is 2.0%. The old continent’s HICP inflation data have a significant impact on the market’s pricing of the ECB's second interest rate cut.
Key details from the Eurozone inflation report (via Eurostat)
Looking at the main components of euro area inflation, services are expected to have the highest annual rate in September (4.0%, compared with 4.1% in August), followed by food, alcohol & tobacco (2.4%, compared with 2.3% in August), non-energy industrial goods (0.4%, stable compared with August) and energy (-6.0%, compared with -3.0% in August).
EUR/USD reaction to the Eurozone inflation report
Softer Eurozone inflation data fails to move the needle around the Euro, with EUR/USD battling 1.1100, as of writing. The pair is down 0.25% on the day.
Euro PRICE Today
The table below shows the percentage change of Euro (EUR) against listed major currencies today. Euro was the weakest against the US Dollar.
| USD | EUR | GBP | JPY | CAD | AUD | NZD | CHF | |
|---|---|---|---|---|---|---|---|---|
| USD | 0.25% | 0.28% | 0.07% | 0.06% | 0.00% | 0.48% | 0.03% | |
| EUR | -0.25% | 0.04% | -0.18% | -0.19% | -0.24% | 0.24% | -0.22% | |
| GBP | -0.28% | -0.04% | -0.21% | -0.23% | -0.28% | 0.22% | -0.24% | |
| JPY | -0.07% | 0.18% | 0.21% | -0.01% | -0.06% | 0.43% | -0.02% | |
| CAD | -0.06% | 0.19% | 0.23% | 0.00% | -0.05% | 0.44% | -0.02% | |
| AUD | -0.00% | 0.24% | 0.28% | 0.06% | 0.05% | 0.48% | 0.00% | |
| NZD | -0.48% | -0.24% | -0.22% | -0.43% | -0.44% | -0.48% | -0.45% | |
| CHF | -0.03% | 0.22% | 0.24% | 0.02% | 0.02% | -0.01% | 0.45% |
The heat map shows percentage changes of major currencies against each other. The base currency is picked from the left column, while the quote currency is picked from the top row. For example, if you pick the Euro from the left column and move along the horizontal line to the US Dollar, the percentage change displayed in the box will represent EUR (base)/USD (quote).
- WTI slumps to a multi-week low amid supply concerns, tepid global demand growth.
- The formation of a descending channel supports prospects for a further near-term fall.
- Any attempted recovery is likely to confront stiff resistance near the $67.30 region.
West Texas Intermediate (WTI) US crude Oil prices come under heavy selling pressure on Tuesday and drop to a nearly three-week low, around mid-$66.00s during the first half of the European session.
Against the backdrop of sluggish global fuel demand growth, reports that OPEC+ is set to increase output by 180,000 barrels per day (bpd) in December overshadow fears that a widening conflict in the Middle East could curtail crude supply. This, along with some follow-through US Dollar (USD) buying, bolstered by the Federal Reserve (Fed) Chair Jerome Powell's relatively hawkish remarks on Monday, turn out to be key factors weighing on Crude Oil prices.
From a technical perspective, the recent decline witnessed over the past three months or so, along a downward-sloping channel, points to a well-established bearish trend and supports prospects for deeper losses. Moreover, oscillators on the daily chart are holding in negative territory and are still far from being in the oversold zone. This, in turn, validates the bearish outlook and suggests that the path of least resistance for Crude Oil prices remains to the downside.
Meanwhile, some follow-through selling below the $66.00 round figure will reaffirm the negative bias and could drag the black liquid to the $65.00 psychological mark en route to the $64.75 region, or the lowest level since May 2023 touched last month. The downward trajectory could eventually drag Crude Oil prices below the $64.00 mark, towards challenging the lower boundary of the aforementioned trend-channel, currently pegged near the $63.00-$62.90 region.
On the flip side, any attempted recovery now seems to confront resistance near the $67.00 mark ahead of the $67.30 horizontal zone. A sustained strength beyond the latter might trigger a short-covering rally towards the $68.00 mark, though is more likely to remain capped near the $68.40-$68.45 region. The latter should act as a pivotal point, which if cleared could allow Crude Oil prices to reclaim the $69.00 mark and climb further towards the $7.000 psychological mark.
WTI daily chart
WTI Oil FAQs
WTI Oil is a type of Crude Oil sold on international markets. The WTI stands for West Texas Intermediate, one of three major types including Brent and Dubai Crude. WTI is also referred to as “light” and “sweet” because of its relatively low gravity and sulfur content respectively. It is considered a high quality Oil that is easily refined. It is sourced in the United States and distributed via the Cushing hub, which is considered “The Pipeline Crossroads of the World”. It is a benchmark for the Oil market and WTI price is frequently quoted in the media.
Like all assets, supply and demand are the key drivers of WTI Oil price. As such, global growth can be a driver of increased demand and vice versa for weak global growth. Political instability, wars, and sanctions can disrupt supply and impact prices. The decisions of OPEC, a group of major Oil-producing countries, is another key driver of price. The value of the US Dollar influences the price of WTI Crude Oil, since Oil is predominantly traded in US Dollars, thus a weaker US Dollar can make Oil more affordable and vice versa.
The weekly Oil inventory reports published by the American Petroleum Institute (API) and the Energy Information Agency (EIA) impact the price of WTI Oil. Changes in inventories reflect fluctuating supply and demand. If the data shows a drop in inventories it can indicate increased demand, pushing up Oil price. Higher inventories can reflect increased supply, pushing down prices. API’s report is published every Tuesday and EIA’s the day after. Their results are usually similar, falling within 1% of each other 75% of the time. The EIA data is considered more reliable, since it is a government agency.
OPEC (Organization of the Petroleum Exporting Countries) is a group of 12 Oil-producing nations who collectively decide production quotas for member countries at twice-yearly meetings. Their decisions often impact WTI Oil prices. When OPEC decides to lower quotas, it can tighten supply, pushing up Oil prices. When OPEC increases production, it has the opposite effect. OPEC+ refers to an expanded group that includes ten extra non-OPEC members, the most notable of which is Russia.
- Silver price receives support from safe-haven flows amid rising Middle-East conflict.
- Israel has announced a “limited” ground operation targeting Hezbollah positions in the southern Lebanon border region.
- Fed Chair Powell indicated that any forthcoming rate cuts are expected to be modest, reducing the appeal of non-yielding Silver.
Silver price (XAG/USD) snaps its two-day losing streak, trading around $31.40 per troy ounce during Tuesday’s European session. Silver prices receive support from safe-haven flows amid rising geopolitical tensions in the Middle East.
Israel has announced a “limited” ground operation targeting Hezbollah positions in the southern Lebanon border region, with troops crossing into the area, according to local news agency Al Jazeera. In addition, Israeli warplanes launched extensive airstrikes on southern Beirut after civilians were instructed to evacuate. On Monday, Israeli attacks in Lebanon resulted in the deaths of at least 95 people.
However, the prices of Silver received downward pressure following the recent remarks from the Federal Reserve (Fed) Chairman Jerome Powell. Powell said the central bank is not in a hurry and will lower its benchmark rate ‘over time.’ He added that the recent 50 basis point interest rate cut should not be seen as an indication of similarly aggressive future actions, noting that upcoming rate changes are likely to be more modest. Prolonged higher interest rates make non-yielding Silver less appealing to investors seeking more attractive alternatives.
Silver prices have been under pressure due to weaker-than-expected demand growth in China, exacerbated by data showing a decline in manufacturing activity. On Monday, China’s Caixin Manufacturing Purchasing Managers' Index (PMI) fell to 49.3 in September, indicating a contraction, down from 50.4 in August. Given China’s position as one of the world's largest manufacturing hubs, the country's industrial demand for Silver is substantial, making these demand concerns particularly impactful.
Silver FAQs
Silver is a precious metal highly traded among investors. It has been historically used as a store of value and a medium of exchange. Although less popular than Gold, traders may turn to Silver to diversify their investment portfolio, for its intrinsic value or as a potential hedge during high-inflation periods. Investors can buy physical Silver, in coins or in bars, or trade it through vehicles such as Exchange Traded Funds, which track its price on international markets.
Silver prices can move due to a wide range of factors. Geopolitical instability or fears of a deep recession can make Silver price escalate due to its safe-haven status, although to a lesser extent than Gold's. As a yieldless asset, Silver tends to rise with lower interest rates. Its moves also depend on how the US Dollar (USD) behaves as the asset is priced in dollars (XAG/USD). A strong Dollar tends to keep the price of Silver at bay, whereas a weaker Dollar is likely to propel prices up. Other factors such as investment demand, mining supply – Silver is much more abundant than Gold – and recycling rates can also affect prices.
Silver is widely used in industry, particularly in sectors such as electronics or solar energy, as it has one of the highest electric conductivity of all metals – more than Copper and Gold. A surge in demand can increase prices, while a decline tends to lower them. Dynamics in the US, Chinese and Indian economies can also contribute to price swings: for the US and particularly China, their big industrial sectors use Silver in various processes; in India, consumers’ demand for the precious metal for jewellery also plays a key role in setting prices.
Silver prices tend to follow Gold's moves. When Gold prices rise, Silver typically follows suit, as their status as safe-haven assets is similar. The Gold/Silver ratio, which shows the number of ounces of Silver needed to equal the value of one ounce of Gold, may help to determine the relative valuation between both metals. Some investors may consider a high ratio as an indicator that Silver is undervalued, or Gold is overvalued. On the contrary, a low ratio might suggest that Gold is undervalued relative to Silver.
Japan's newly appointed Economy Minister Ryosei Akazawa said on Tuesday that he wants the Bank of Japan (BoJ) to decide on future rate hikes carefully.
Additional quotes
Should not do anything that would cool economy for a while.
Taking Japan completely out of deflation is top priority.
Market reaction
USD/JPY was last seen trading at 143.75, up 0.08% on the day.
European Central Bank (ECB) policymaker Oli Rehn said in a speech on Tuesday that the “pace and scale of rate cuts will be decided meeting by meeting.”
Additional comments
Sees euro area inflation rate stabilizing at ECB 2% target during 2025.
The direction of monetary policy is clear, rate cuts have begun.
Our monetary policy stance is becoming less restrictive.
Draghi report is a necessary wake-up call to all Europeans about Europe's low growth.
Draghi report will provide a good basis for next commission work programme.
Market reaction
EUR/USD is defending 1.1100 following these comments, down 0.23% on the day, at the press time.
The Pound Sterling (GBP) is expected to trade in a 1.3325/1.3410 range. In the longer run, current price movements are likely part of a range trading phase between 1.3300 and 1.3430, UOB Group FX analysts Quek Ser Leang and Lee Sue Ann note.
Trading sideways for the time being
24-HOUR VIEW: “Yesterday, GBP traded between 1.3350 and 1.3423, close to our expected range of 1.3340/1.3420. Momentum indicators are mostly neutral, and further range trading appears likely. Expected range for today: 1.3325/1.3410.
1-3 WEEKS VIEW: “Last Thursday (26 Sep, spot at 1.3325), we indicated that ‘the more than week-long GBP strength has ended.’ We expected GBP to ‘trade in a 1.3200/1.3430 range for the time being.’ After GBP rose to 1.3434, we indicated last Friday (27 Sep, spot at 1.3410) that ‘while upward momentum seems to be building again, it is not enough to indicate the resumption of GBP strength.’ We also indicated that GBP ‘must break and hold above 1.3455 before further advance to 1.3500 can be expected, and the likelihood of it breaking clearly above 1.3455 appears low for now, but it will remain intact as long as 1.3310 is not breached within these few days.’ Yesterday, GBP rose to 1.3423, then pulled back to close largely unchanged at 1.3377 (+0.04%). Although our ‘strong support’ level at 1.3310 has not been breached, the buildup in momentum has largely dissipated. In other words, the current price movements are likely part of a range trading phase, probably between 1.3300 and 1.3430.”
Fed Chair Jerome Powell explicitly pushed back against a 50bp rate cut by year-end, and Israel started a ground offensive in Lebanon. In other conditions, the US Dollar (USD) would have rallied on such a combination of events, but sensitivity to Fedspeak and Middle East turmoil has been reduced, ING’s FX strategist Francesco Pesole notes.
Geopolitics-FX link is also rather weak at the moment
“On the Fed side, the 50bp reduction in September means that market pricing is more structurally dovish-leaning, perhaps also on the premises that the Fed wouldn’t want to underdeliver on easing should a 50bp move be priced in by the FOMC date. On Monday, Powell said the base case is two 25bp moves by year-end, which is unusually specific guidance that signals his discontent with market dovish pricing.”
“The geopolitics-FX link is also rather weak at the moment. Israel’s ground raids in Lebanese territory were a highly-anticipated risk by US authorities, and the escalation was somewhat expected. The lack of substantial repercussions on commodities, with oil prices staying weak, means that FX markets are also not responding to the latest developments. There are upside risks for the dollar here too.”
“On the US data side, we’ll see the August JOLTS job openings print today, which is expected at an unchanged 7673k after a surprise drop last month. Markets may be more sensitive to those job opening numbers than the ISM Manufacturing index, which is also expected to have stabilised around 47.5.”
(This story was corrected on October 1 at 08:57 GMT to say, in the title, that Powell pushes back against 50bp cut, not hike.)
- NZD/USD loses ground following the remarks from Fed’s Powell saying lowering interest rate ‘over time.’
- US ISM Manufacturing PMI is expected to improve to 47.5 in September, from the previous 47.2 reading.
- New Zealand’s Building Permits declined 5.3% MoM in August, swinging from a significant 26.4% increase in the prior month.
NZD/USD trades around 0.6310 during the European hours on Tuesday, breaking its three-day winning streak. On Monday, Federal Reserve (Fed) Chairman Jerome Powell said the central bank is not in a hurry and will lower its benchmark rate ‘over time,’ which has supported the US Dollar (USD) and undermined the NZD/USD pair.
However, the subdued US Treasury yields may limit the upside of the US Dollar. The US Dollar Index (DXY), which measures the value of the US Dollar (USD) against other six major currencies, extends its gains for the second successive day. The DXY trades around 101.00 with 2-year and 10-year yields on US Treasury bonds standing at 3.62% and 3.76%, respectively, at the time of writing.
Traders await US manufacturing data including ISM Manufacturing PMI later in the North American session, which is expected to improve to 47.5 in September, from the previous 47.2 reading. This report may provide a reliable outlook on the state of the US manufacturing sector.
Seasonally adjusted Building Permits in New Zealand showed a 5.3% month-on-month decline in August, following a significant 26.4% increase in the prior month. This reflects a slowdown in the issuance of consents for new dwellings. Additionally, the NZIER Business Confidence index dropped by 1% quarter-on-quarter in the third quarter, showing an improvement compared to the 44% decline observed in the previous quarter, though overall sentiment remains cautious.
The Reserve Bank of New Zealand (RBNZ) responded to slowing economic growth by beginning to ease its policy in August, a trend that may extend into the fourth quarter. The main uncertainty lies in the speed of rate cuts, with most economists predicting a 25 basis point reduction at each of the two remaining meetings this year, aligning with Governor Adrian Orr's commitment to a gradual approach.
The New Zealand (NZ) Treasury’s economic assessment, released on Tuesday, indicated that they “don't expect activity to have picked up much in the latest quarter.” While GDP for the June quarter declined by 0.2%, the drop was smaller than anticipated, with population growth concealing underlying economic weakness. As a substantial amount of data is set to be released in the next two weeks, we should soon have a clearer understanding of where the economy stands in the current cycle.
Economic Indicator
ISM Manufacturing PMI
The Institute for Supply Management (ISM) Manufacturing Purchasing Managers Index (PMI), released on a monthly basis, is a leading indicator gauging business activity in the US manufacturing sector. The indicator is obtained from a survey of manufacturing supply executives based on information they have collected within their respective organizations. Survey responses reflect the change, if any, in the current month compared to the previous month. A reading above 50 indicates that the manufacturing economy is generally expanding, a bullish sign for the US Dollar (USD). A reading below 50 signals that factory activity is generally declining, which is seen as bearish for USD.
Read more.Next release: Tue Oct 01, 2024 14:00
Frequency: Monthly
Consensus: 47.5
Previous: 47.2
Source: Institute for Supply Management
The Institute for Supply Management’s (ISM) Manufacturing Purchasing Managers Index (PMI) provides a reliable outlook on the state of the US manufacturing sector. A reading above 50 suggests that the business activity expanded during the survey period and vice versa. PMIs are considered to be leading indicators and could signal a shift in the economic cycle. Stronger-than-expected prints usually have a positive impact on the USD. In addition to the headline PMI, the Employment Index and the Prices Paid Index numbers are watched closely as they shine a light on the labour market and inflation.
The US Dollar (USD) gets a bump up as market took cues from NABE speech from Fed Chair Powell to take profit on USD shorts. MYR and THB led declines today. DXY was last at 101.00, OCBC FX strategists Frances Cheung and Christopher Wong note.
Daily momentum turns mild bullish
“The main message exudes no sense of panic about the US economy and conveys a sense of no rush to loosen monetary policy quickly. He also referred to the dot plot to indicate 2 more 25bp cut if ‘economy is as expected’.”
“This somewhat dampened markets’ enthusiasm in pricing over 75bp cut for the year remaining. This week’s JOLTS job openings (Tue), ADP employment (Wed), initial jobless claims (Thu) and payrolls report (Fri) will be of interest. Dovish bets will further be reduced if labour-related data comes in hotter, and this may add to USD rebound momentum in the near term.”
“Daily momentum turned mild bullish while RSI rose. Risks are somewhat skewed to the upside. Resistance at 101.10 (21 DMA), 101.90 levels. Near term support at 100.20 (recent low). Break-out puts next support at 99.60, 99.20 levels. In the interim, some profit-taking on Asian FX is likely ahead of data event risks.”
- The Mexican Peso closed Monday slightly higher in its key pairs.
- President-elect Claudia Sheinbaum takes over from outgoing President Andres Manuel Lopez Obrador on Tuesday.
- USD/MXN pauses in its uptrend, but the bias remains bullish.
The Mexican Peso (MXN) fluctuates between modest gains and losses on Tuesday after closing the previous day marginally higher in its major trading pairs – USD/MXN, EUR/MXN and GBP/MXN. The lack of volatility is probably due to the fact that October 1 is a public holiday in Mexico, and many financial market participants are absent from their desks for both days at the start of the week.
The news flow out of Mexico is mainly concerned with the outgoing President Andres Manuel Lopez Obrador’s (AMLO) handover of power to his successor, President-elect Claudia Sheinbaum, who officially takes office on October 1. Global investors will probably watch her inauguration speech with interest in an attempt to discern the broad policy trajectory of her administration. On Monday, news of her cabinet reshuffle indicated she is keeping some of AMLO’s old personnel alongside some new hires.
However, Sheinbaum has always made it clear she supports most of AMLO’s contentious constitutional reforms, which rocked the Peso after her election win in June.
Mexican Peso closed marginally higher as currency peers weaken
The Mexican Peso strengthened slightly versus the Euro (EUR) on Monday after German inflation data came out lower than estimated in September. This raised the possibility that Eurozone-wide inflation may also be falling, which, in turn, could pressure the European Central Bank (ECB) to accelerate cuts to interest rates. Lower interest rates tend to lead to capital outflows and a weaker Euro. The situation will be clarified when the official Eurozone Harmonized Index of Consumer Prices (HICP) inflation data is released on Tuesday.
The single currency further weakened after ECB President Christine Lagarde hinted that inflation was falling back to the central bank’s 2.0% target, as expected, in her speech to the European Parliament's Committee on Economic and Monetary Affairs on Monday. "The latest developments strengthen our confidence that inflation will return to target in a timely manner," she said, suggesting a greater chance the ECB would move to ease policy in its next meeting.
The Mexican Peso closed Monday marginally higher against the US Dollar (USD) despite a relatively hawkish speech from the Federal Reserve (Fed) Chairman Jerome Powell. The Fed chair struck a cautious tone, advocating a data-driven, meeting-by-meeting approach to monetary policy. The market-based probability of the Fed cutting interest rates by 0.50% again in November fell to around the mid-30% mark from being over 60% at one point last week, according to the CME FedWatch tool. On the economic data front, Tuesday sees the release of September’s US ISM Manufacturing Purchasing Managers Index (PMI) data and August’s JOLTS Job Openings.
With GBP/MXN, it was a similar story as the Peso closed a few pips higher on Monday. The Pound Sterling (GBP) was sold after the UK Gross Domestic Product (GDP) growth data’s final reading for Q2 revealed a downward revision to 0.7% YoY from its previous 0.9% estimate. That said, other UK data showed Business Investment growing and UK borrowing data revealed consumers continuing to access credit.
Technical Analysis: USD/MXN pauses within uptrend
USD/MXN pauses and consolidates during its steady climb within a rising channel. The pair is in a short, medium and long-term bullish trend, and according to technical analysis theory, it is more likely to resume its bullish momentum eventually.
USD/MXN Daily Chart
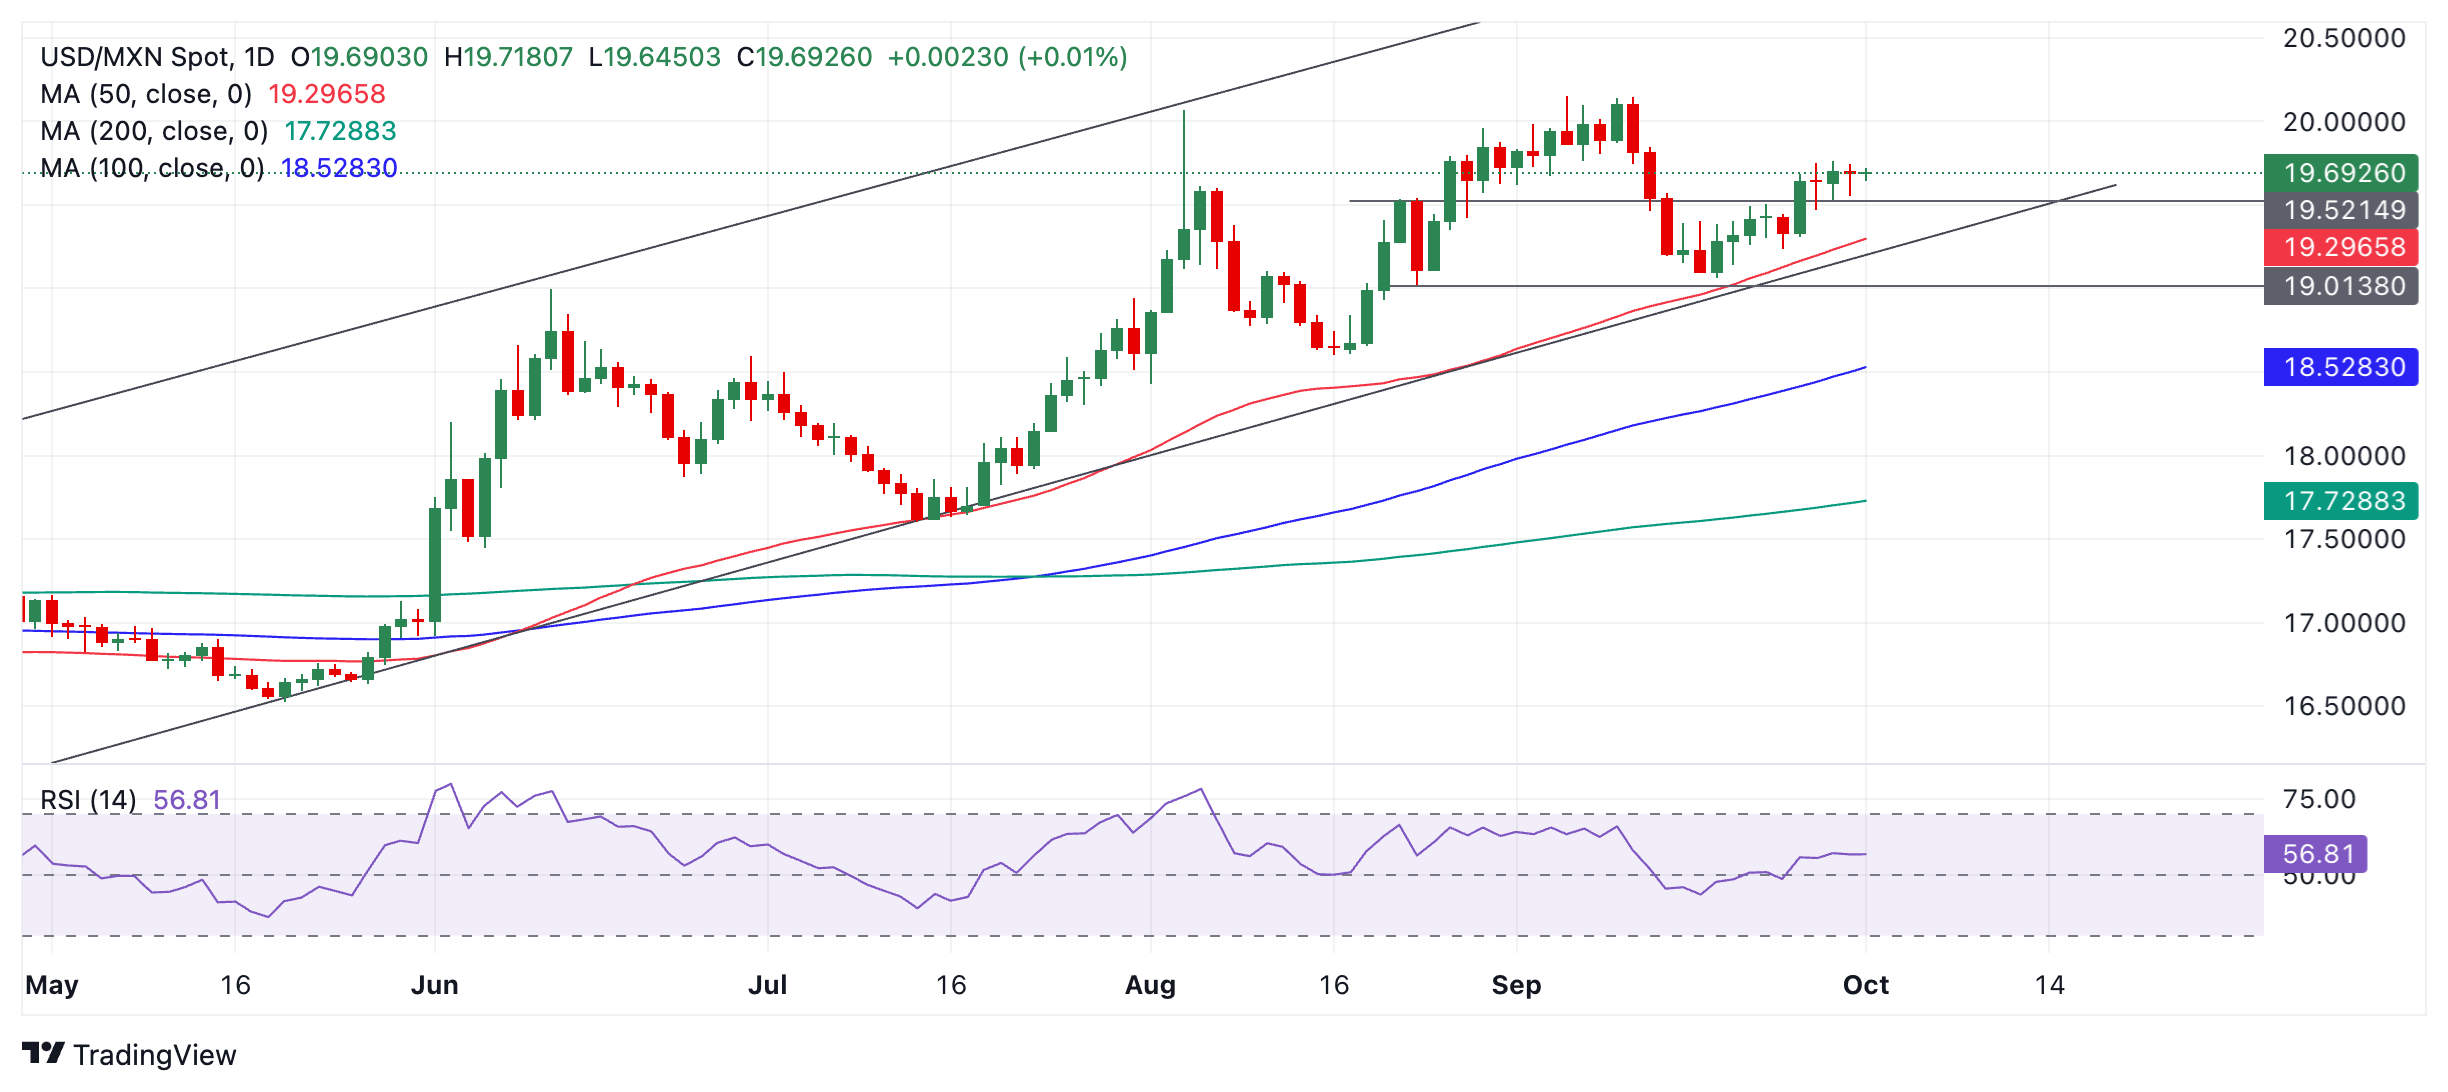
Friday’s close above 19.68 (September 25 high) provided more bullish certainty of the pair’s near-term upside bias towards a target at 20.15, the high of the year reached in early September.
A further break above 19.76 (the September 27 high) would create a higher high and provide yet more proof of an extension of the uptrend.
Mexican Peso FAQs
The Mexican Peso (MXN) is the most traded currency among its Latin American peers. Its value is broadly determined by the performance of the Mexican economy, the country’s central bank’s policy, the amount of foreign investment in the country and even the levels of remittances sent by Mexicans who live abroad, particularly in the United States. Geopolitical trends can also move MXN: for example, the process of nearshoring – or the decision by some firms to relocate manufacturing capacity and supply chains closer to their home countries – is also seen as a catalyst for the Mexican currency as the country is considered a key manufacturing hub in the American continent. Another catalyst for MXN is Oil prices as Mexico is a key exporter of the commodity.
The main objective of Mexico’s central bank, also known as Banxico, is to maintain inflation at low and stable levels (at or close to its target of 3%, the midpoint in a tolerance band of between 2% and 4%). To this end, the bank sets an appropriate level of interest rates. When inflation is too high, Banxico will attempt to tame it by raising interest rates, making it more expensive for households and businesses to borrow money, thus cooling demand and the overall economy. Higher interest rates are generally positive for the Mexican Peso (MXN) as they lead to higher yields, making the country a more attractive place for investors. On the contrary, lower interest rates tend to weaken MXN.
Macroeconomic data releases are key to assess the state of the economy and can have an impact on the Mexican Peso (MXN) valuation. A strong Mexican economy, based on high economic growth, low unemployment and high confidence is good for MXN. Not only does it attract more foreign investment but it may encourage the Bank of Mexico (Banxico) to increase interest rates, particularly if this strength comes together with elevated inflation. However, if economic data is weak, MXN is likely to depreciate.
As an emerging-market currency, the Mexican Peso (MXN) tends to strive during risk-on periods, or when investors perceive that broader market risks are low and thus are eager to engage with investments that carry a higher risk. Conversely, MXN tends to weaken at times of market turbulence or economic uncertainty as investors tend to sell higher-risk assets and flee to the more-stable safe havens.
The Euro (EUR) has likely entered a range trading phase, probably between 1.1060 and 1.1215, UOB Group FX analysts Quek Ser Leang and Lee Sue Ann note.
The major support at 1.1060 is unlikely to come into view
24-HOUR VIEW: “We expected EUR to trade in a range between 1.1130 and 1.1195 yesterday. However, EUR traded in a wider range than expected (1.1113/1.1208), closing on a soft note at 1.1134 (-0.26%). The slight increase in momentum suggests EUR could drift lower today. Given the mild momentum, any decline is likely limited to a test of 1.1105. The major support at 1.1060 is highly unlikely to come into view. Resistance is at 1.1160; a breach of 1.1180 would mean that the mild downward pressure has faded.”
1-3 WEEKS VIEW: “In our most recent narrative from last Thursday (26 Sep, spot at 1.1130), we highlighted that EUR ‘has likely entered a range trading phase, probably between 1.1060 and 1.1215.’ EUR rose above 1.1200 last Friday and again yesterday, but on both occasions, it retreated quickly. While the price action supports our view that EUR is trading in a range, after retreating from the upper limit of the expected 1.1060/1.1215 range, it could now test the lower end instead.”
- USD/CAD wobbles above 1.3500 as US labor market data takes center stage.
- Fed Powell pushed back market speculation for large rate cuts in November.
- The Canadian Dollar will be influenced by the S&P Global Manufacturing PMI data for September.
The USD/CAD pair trades in a tight range above the psychological support of 1.3500 in Tuesday’s European session. The Loonie asset turns sideways as investors await the United States (US) labor market and the Purchasing Managers’ Index (PMI) data, which will indicate whether the Federal Reserve (Fed) will continue with an aggressive monetary policy stance or shift to a gradual rate cut path.
Market sentiment appears to be cautious as S&P 500 futures have posted nominal losses in European trading hours. The US Dollar Index (DXY), which tracks the Greenback’s value against six major currencies, extends recovery to near 101.00.
According to the CME FedWatch tool, the probability of the Fed reducing interest rates by 50 basis points (bps) to 4.25%-4.50% in November, as they did on September 18, has eased to 35% from 58% a week ago.
Market expectations for the Fed’s large rate cut have slightly waned after Fed Chair Jerome Powell’s speech at the National Association for Business Economics conference on Monday, in which his comments indicated that the central bank is in no rush to reduce rates quickly. Powell expects that there will be two rate cuts of 25 bps in each of the remaining two meetings this year, if the economy performs as expected.
Going forward, investors will focus on the US ISM Manufacturing PMI for September and the JOLTS Job Openings data for August, which will be published at 14:00 GMT.
Meanwhile, the Canadian Dollar (CAD) will be guided by the S&P Global Manufacturing PMI data for September, which is scheduled for release at 13:30 GMT. The Manufacturing PMI has been correcting for 16 straight months.
Canadian Dollar FAQs
The key factors driving the Canadian Dollar (CAD) are the level of interest rates set by the Bank of Canada (BoC), the price of Oil, Canada’s largest export, the health of its economy, inflation and the Trade Balance, which is the difference between the value of Canada’s exports versus its imports. Other factors include market sentiment – whether investors are taking on more risky assets (risk-on) or seeking safe-havens (risk-off) – with risk-on being CAD-positive. As its largest trading partner, the health of the US economy is also a key factor influencing the Canadian Dollar.
The Bank of Canada (BoC) has a significant influence on the Canadian Dollar by setting the level of interest rates that banks can lend to one another. This influences the level of interest rates for everyone. The main goal of the BoC is to maintain inflation at 1-3% by adjusting interest rates up or down. Relatively higher interest rates tend to be positive for the CAD. The Bank of Canada can also use quantitative easing and tightening to influence credit conditions, with the former CAD-negative and the latter CAD-positive.
The price of Oil is a key factor impacting the value of the Canadian Dollar. Petroleum is Canada’s biggest export, so Oil price tends to have an immediate impact on the CAD value. Generally, if Oil price rises CAD also goes up, as aggregate demand for the currency increases. The opposite is the case if the price of Oil falls. Higher Oil prices also tend to result in a greater likelihood of a positive Trade Balance, which is also supportive of the CAD.
While inflation had always traditionally been thought of as a negative factor for a currency since it lowers the value of money, the opposite has actually been the case in modern times with the relaxation of cross-border capital controls. Higher inflation tends to lead central banks to put up interest rates which attracts more capital inflows from global investors seeking a lucrative place to keep their money. This increases demand for the local currency, which in Canada’s case is the Canadian Dollar.
Macroeconomic data releases gauge the health of the economy and can have an impact on the Canadian Dollar. Indicators such as GDP, Manufacturing and Services PMIs, employment, and consumer sentiment surveys can all influence the direction of the CAD. A strong economy is good for the Canadian Dollar. Not only does it attract more foreign investment but it may encourage the Bank of Canada to put up interest rates, leading to a stronger currency. If economic data is weak, however, the CAD is likely to fall.
- GBP/JPY struggles to capitalize on its modest intraday gains beyond the 200-day SMA.
- The GBP is pressured by a modest USD strength and acts as a headwind for the cross.
- The BoJ rate hike uncertainty keeps the JPY bulls on the defensive and lends support.
The GBP/JPY cross attracts some intraday sellers on Tuesday and retreats over 100 pips from the daily peak, around the 159.35 region amid the emergence of some selling around the British Pound (GBP). Spot prices drop to a fresh daily low during the early European session and currently trade just below the 192.00 mark, down nearly 0.20% for the day.
The US Dollar (USD) gains follow-through traction in the wake of the Federal Reserve (Fed) Chair Jerome Powell's overnight hawkish remains and turns out to be a key factor weighing on the British Pound (GBP). Apart from this, the intraday GBP fall lacks any obvious fundamental catalyst and is likely to remain limited amid expectations that the Bank of England's (BoE) rate-cutting cycle is likely to be slower than in the US and the Eurozone. This, along with the offered tone surrounding the Japanese Yen (JPY), should help limit the downside for the GBP/JPY cross.
Japan's incoming Prime Minister (PM) Shigeru Ishiba expressed a cautious view about interest rate hikes by the Bank of Japan (BoJ) and said on Monday that he intends to call a general election on October 27. This, along with the optimism over a stimulus bonanza from China, undermines the safe-haven JPY and acts as a tailwind for the GBP/JPY cross. Spot prices, meanwhile, move little following the release of the final UK Manufacturing PMI, which was revised up to 45.0 for September as compared to the 44.8 flash print and the previous month's reading.
Nevertheless, the aforementioned fundamental backdrop makes it prudent to wait for a strong follow-through selling before positioning for any meaningful downside for the GBP/JPY cross. From a technical perspective, the recent repeated failures to find acceptance above the very important 200-day Simple Moving Average (SMA) and the formation of a 'Death Cross' on the daily chart – the 50-day SMA crossing below the 200-day SMA – warrant caution for aggressive bullish traders.
Bank of Japan FAQs
The Bank of Japan (BoJ) is the Japanese central bank, which sets monetary policy in the country. Its mandate is to issue banknotes and carry out currency and monetary control to ensure price stability, which means an inflation target of around 2%.
The Bank of Japan embarked in an ultra-loose monetary policy in 2013 in order to stimulate the economy and fuel inflation amid a low-inflationary environment. The bank’s policy is based on Quantitative and Qualitative Easing (QQE), or printing notes to buy assets such as government or corporate bonds to provide liquidity. In 2016, the bank doubled down on its strategy and further loosened policy by first introducing negative interest rates and then directly controlling the yield of its 10-year government bonds. In March 2024, the BoJ lifted interest rates, effectively retreating from the ultra-loose monetary policy stance.
The Bank’s massive stimulus caused the Yen to depreciate against its main currency peers. This process exacerbated in 2022 and 2023 due to an increasing policy divergence between the Bank of Japan and other main central banks, which opted to increase interest rates sharply to fight decades-high levels of inflation. The BoJ’s policy led to a widening differential with other currencies, dragging down the value of the Yen. This trend partly reversed in 2024, when the BoJ decided to abandon its ultra-loose policy stance.
A weaker Yen and the spike in global energy prices led to an increase in Japanese inflation, which exceeded the BoJ’s 2% target. The prospect of rising salaries in the country – a key element fuelling inflation – also contributed to the move.
- The US JOLTS data will be watched closely by investors ahead of the September employment report.
- Job openings are forecast to stay below 8 million for the third consecutive month in August.
- Markets try to figure out whether the Fed will opt for another large rate cut at the next meeting.
The Job Openings and Labor Turnover Survey (JOLTS) will be released on Tuesday by the US Bureau of Labor Statistics (BLS). The publication will provide data about the change in the number of job openings in August, alongside the number of layoffs and quits.
JOLTS data is scrutinized by market participants and Federal Reserve (Fed) policymakers because it can provide valuable insights regarding the supply-demand dynamics in the labor market, a key factor impacting salaries and inflation. Job openings have been declining steadily since coming in above 12 million in March 2022, pointing to a steady cooldown in labor market conditions. In July, the number of job openings declined to 7.673 million, marking the lowest reading since January 2021.
What to expect in the next JOLTS report?
"Over the month, hires changed little at 5.5 million," the BLS noted in its July JOLTS report. "Separations increased to 5.4 million. Within separations, quits (3.3 million) and layoffs and discharges (1.8 million) changed little."
Markets expect job openings slightly lower at around 7.65 million on the last business day of August. Federal Reserve (Fed) policymakers have made it clear after the July policy meeting that they are shifting their focus to the labor market, given the encouraging signs of inflation retreating toward the central bank’s target. While speaking at the post-meeting press conference after the September meeting, “upside risks to inflation have diminished and downside risks to labor market have risen,” Fed Chair Jerome Powell said.
The CME FedWatch Tool currently shows that markets are pricing in a nearly 40% probability of one more 50 basis points (bps) rate reduction at the next policy meeting in early November. In case there is a significant decline, toward 7 million, in the JOLTS Job Openings data, the immediate reaction could hurt the US Dollar (USD) with investors leaning toward a large interest rate cut. On the other hand, a reading above analysts' expectations could ease concerns over the labor market outlook and support the USD.
When will the JOLTS report be released and how could it affect EUR/USD?
Job openings numbers will be published on Tuesday, October 1, at 14:00 GMT. Eren Sengezer, European Session Lead Analyst at FXStreet, shares his view on the potential impact of JOLTS data on EUR/USD:
“Unless there is a significant divergence between the market expectation and the actual print, the market reaction to JOLTS data is likely to remain subdued, with investors refraining from taking large positions ahead of the September employment report on Friday.”
“Nevertheless, EUR/USD’s near-term technical outlook suggests that the bullish bias remains intact. The Relative Strength Index (RSI) indicator on the daily chart holds near 60 and the pair trades within the ascending regression channel started in late June. In case EUR/USD stabilizes above 1.1200 (static level) and starts using this level as support, it could target 1.1275 (July 18, 2023, high) and 1.1320 (upper limit of the ascending channel) next. On the downside, the 20-day Simple Moving Average (SMA) aligns as interim support at 1.1100 before 1.1070 (lower limit of the ascending channel) and 1.1030 (50-day SMA).”
US Dollar FAQs
The US Dollar (USD) is the official currency of the United States of America, and the ‘de facto’ currency of a significant number of other countries where it is found in circulation alongside local notes. It is the most heavily traded currency in the world, accounting for over 88% of all global foreign exchange turnover, or an average of $6.6 trillion in transactions per day, according to data from 2022. Following the second world war, the USD took over from the British Pound as the world’s reserve currency. For most of its history, the US Dollar was backed by Gold, until the Bretton Woods Agreement in 1971 when the Gold Standard went away.
The most important single factor impacting on the value of the US Dollar is monetary policy, which is shaped by the Federal Reserve (Fed). The Fed has two mandates: to achieve price stability (control inflation) and foster full employment. Its primary tool to achieve these two goals is by adjusting interest rates. When prices are rising too quickly and inflation is above the Fed’s 2% target, the Fed will raise rates, which helps the USD value. When inflation falls below 2% or the Unemployment Rate is too high, the Fed may lower interest rates, which weighs on the Greenback.
In extreme situations, the Federal Reserve can also print more Dollars and enact quantitative easing (QE). QE is the process by which the Fed substantially increases the flow of credit in a stuck financial system. It is a non-standard policy measure used when credit has dried up because banks will not lend to each other (out of the fear of counterparty default). It is a last resort when simply lowering interest rates is unlikely to achieve the necessary result. It was the Fed’s weapon of choice to combat the credit crunch that occurred during the Great Financial Crisis in 2008. It involves the Fed printing more Dollars and using them to buy US government bonds predominantly from financial institutions. QE usually leads to a weaker US Dollar.
Quantitative tightening (QT) is the reverse process whereby the Federal Reserve stops buying bonds from financial institutions and does not reinvest the principal from the bonds it holds maturing in new purchases. It is usually positive for the US Dollar.
- The Pound Sterling trades in a tight range near 1.3400 against the US Dollar as investors await key US econmic data.
- Economists expect US Manufacturing activity to have contracted again in September.
- BoE MPC member Megan Greene said inflation could rise again due to a sharp recovery in consumption.
The Pound Sterling (GBP) consolidates in a tight range near the crucial resistance of 1.3400 against the US Dollar (USD) in Tuesday’s London session. The GBP/USD pair struggles for direction as investors await the United States (US) labor market data, which will provide fresh cues about how much the Federal Reserve (Fed) will reduce interest rates further this year.
The Fed started the policy-easing cycle with an interest rate cut of 50 basis points (bps) to 4.75%-5.00% on September 18. Policymakers decided to opt for a larger-than-usual cut amid growing concerns over slowing job growth and as confidence increases about inflation returning to the bank’s target of 2%.
To get cues about current labor market health, investors will pay close attention to the US ADP Employment Change and Nonfarm Payrolls (NFP) data for September, which will be published on Wednesday and Friday, respectively.
On Monday, Fed Chair Jerome Powell pushed back market expectations of an aggressive rate-cut cycle. "This is not a committee that feels like it is in a hurry to cut rates quickly,” Powell said at the National Association for Business Economics conference. "If the economy evolves as expected, that would be two more cuts by year's end, for a total reduction of half a percentage point more,” he added.
In today’s session, investors will focus on the US JOLTS Job Openings data for August and the ISM Manufacturing PMI data for September, which will be published at 14:00 GMT. Economists expect the job openings to have remained broadly steady in August compared to July at around 7.67 million.
Meanwhile, the ISM Manufacturing PMI is expected to improve slightly to 47.5 from 47.2. Still, the measure would suggest that activity in the factory sector continued to sink.
Daily digest market movers: Pound Sterling strengthens as BoE Greene spurts risks of inflation rising again
- The Pound Sterling outperforms its major peers on Tuesday. The British currency strengthens as market expectations for the Bank of England (BoE) to reduce interest rates in November have eased further after the speech from BoE external policy member Megan Greene at the National Association for Business Economics conference.
- Megan Greene, who voted for leaving interest rates unchanged in the last two policy meetings, indicated that the United Kingdom’s (UK) consumption-driven recovery could spurt price pressures again. Greene warned that the return of the headline inflation to the bank’s target of 2% was due to a temporary decline in Oil prices. Also, inflation in the service sector – which is closely tracked by BoE policymakers – at 5.6% is “worrisome,” she said. However, she remained confident that prices are “moving in the right direction,” Bloomberg reported.
- Financial market participants expect the BoE to cut interest rates one more time in the last quarter of the year, most probably in the December meeting. The BoE pivoted to policy normalization with a 25 bps interest rate cut on August 1 but left borrowing rates unchanged on September 19.
- Going forward, the next major trigger for the Pound Sterling will be the BoE Chief Economist Huw Pill’s speech, which is scheduled at 14:00 GMT. Pill’s speech could provide more guidance on the interest rate outlook for the remainder of the year.
- On the economic data front, investors will focus on the revised estimate of S&P Global/CIPS Manufacturing PMI data for September, which will be published at 08:30 GMT. The Manufacturing PMI is estimated to have remained at 51.5, unchanged from the flash estimate.
Technical Analysis: Pound Sterling turns sideways near 1.3400
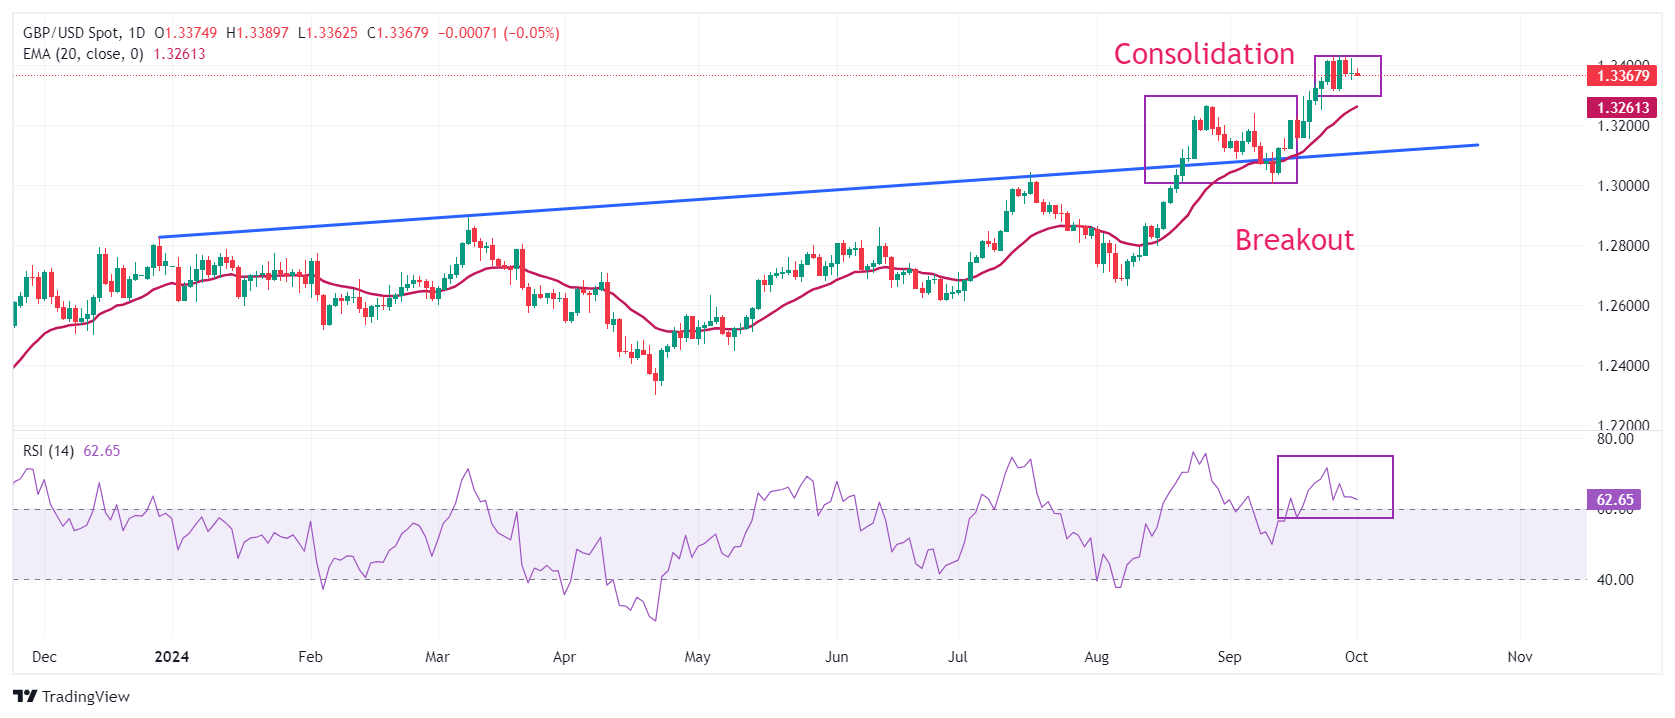
The Pound Sterling trades sideways near the key resistance of 1.3400 against the US Dollar in European trading hours. The near-term outlook of the GBP/USD pair remains firm as the 20-day Exponential Moving Average (EMA) near 1.3250 is sloping higher.
The Cable is expected to remain firm as it holds the breakout of the trendline plotted from the December 28, 2023, high of 1.2828, delivered on August 21.
The 14-day Relative Strength Index (RSI) tilts down but remains above 60.00, suggesting an active bullish momentum.
Looking up, the Cable will face resistance near the psychological level of 1.3500. On the downside, the 20-day EMA near 1.3235 will be the key support for Pound Sterling bulls.
Pound Sterling FAQs
The Pound Sterling (GBP) is the oldest currency in the world (886 AD) and the official currency of the United Kingdom. It is the fourth most traded unit for foreign exchange (FX) in the world, accounting for 12% of all transactions, averaging $630 billion a day, according to 2022 data. Its key trading pairs are GBP/USD, also known as ‘Cable’, which accounts for 11% of FX, GBP/JPY, or the ‘Dragon’ as it is known by traders (3%), and EUR/GBP (2%). The Pound Sterling is issued by the Bank of England (BoE).
The single most important factor influencing the value of the Pound Sterling is monetary policy decided by the Bank of England. The BoE bases its decisions on whether it has achieved its primary goal of “price stability” – a steady inflation rate of around 2%. Its primary tool for achieving this is the adjustment of interest rates. When inflation is too high, the BoE will try to rein it in by raising interest rates, making it more expensive for people and businesses to access credit. This is generally positive for GBP, as higher interest rates make the UK a more attractive place for global investors to park their money. When inflation falls too low it is a sign economic growth is slowing. In this scenario, the BoE will consider lowering interest rates to cheapen credit so businesses will borrow more to invest in growth-generating projects.
Data releases gauge the health of the economy and can impact the value of the Pound Sterling. Indicators such as GDP, Manufacturing and Services PMIs, and employment can all influence the direction of the GBP. A strong economy is good for Sterling. Not only does it attract more foreign investment but it may encourage the BoE to put up interest rates, which will directly strengthen GBP. Otherwise, if economic data is weak, the Pound Sterling is likely to fall.
Another significant data release for the Pound Sterling is the Trade Balance. This indicator measures the difference between what a country earns from its exports and what it spends on imports over a given period. If a country produces highly sought-after exports, its currency will benefit purely from the extra demand created from foreign buyers seeking to purchase these goods. Therefore, a positive net Trade Balance strengthens a currency and vice versa for a negative balance.
- USD/CHF advances due to the waning likelihood of more bumper Fed rate cuts.
- CME FedWatch Tool indicates a 38.2% probability of a 50 basis point rate hike, down from 53.3% the previous day.
- Swiss Real Retail Sales increased by 3.2% YoY, marking the strongest growth since February 2022.
USD/CHF extends its gains for the second successive day, trading around 0.8470 during the early European hours on Tuesday. This upside of the USD/CHF pair is attributed to the latest speech from the Federal Reserve (Fed) Chairman Jerome Powell.
Fed Chair Powell said the central bank is not in a hurry and will lower its benchmark rate ‘over time.’ Fed Chair Powell added that the recent 50 basis point interest rate cut should not be seen as an indication of similarly aggressive future actions, noting that upcoming rate changes are likely to be more modest.
The CME FedWatch Tool indicates that markets are assigning a 61.8% probability to a 25 basis point rate cut by the Federal Reserve in November, while the likelihood of a 50 basis point is 38.2%, down from 53.3% a day ago.
Switzerland's economic indicators have been showing positive momentum recently. In August, Real Retail Sales rose by 3.2% year-on-year, surpassing the expected 2.6% increase. This is the strongest growth since February 2022 and reflects an upwardly revised gain of 2.9% in July. The boost in retail sales highlights increasing consumer spending, which is a vital driver for the economy.
On Monday, the KOF Leading Indicator for September also pointed to a brighter economic outlook, with a reading of 105.5, up from 105.0 in August. This exceeded market expectations of 102.0, signaling a continuation of the recovery seen in recent months. The steady improvement in this indicator, suggests that Switzerland's economy is on a positive trajectory, supported by both consumer activity and broader economic factors.
In September, the Swiss National Bank (SNB) reduced its key interest rate by 25 basis points (bps) for the third consecutive time. The move came as part of the SNB's ongoing efforts to maintain price stability and mitigate the impact of the strong Swiss Franc (CHF), which has posed challenges for exporters.
The SNB also signaled its readiness to further cut interest rates if needed, indicating a proactive approach to ensuring that the economy remains on track. By keeping borrowing costs lower, the SNB aims to encourage spending and investment, while also managing the exchange rate to protect the competitiveness of Swiss goods and services.
Swiss Franc FAQs
The Swiss Franc (CHF) is Switzerland’s official currency. It is among the top ten most traded currencies globally, reaching volumes that well exceed the size of the Swiss economy. Its value is determined by the broad market sentiment, the country’s economic health or action taken by the Swiss National Bank (SNB), among other factors. Between 2011 and 2015, the Swiss Franc was pegged to the Euro (EUR). The peg was abruptly removed, resulting in a more than 20% increase in the Franc’s value, causing a turmoil in markets. Even though the peg isn’t in force anymore, CHF fortunes tend to be highly correlated with the Euro ones due to the high dependency of the Swiss economy on the neighboring Eurozone.
The Swiss Franc (CHF) is considered a safe-haven asset, or a currency that investors tend to buy in times of market stress. This is due to the perceived status of Switzerland in the world: a stable economy, a strong export sector, big central bank reserves or a longstanding political stance towards neutrality in global conflicts make the country’s currency a good choice for investors fleeing from risks. Turbulent times are likely to strengthen CHF value against other currencies that are seen as more risky to invest in.
The Swiss National Bank (SNB) meets four times a year – once every quarter, less than other major central banks – to decide on monetary policy. The bank aims for an annual inflation rate of less than 2%. When inflation is above target or forecasted to be above target in the foreseeable future, the bank will attempt to tame price growth by raising its policy rate. Higher interest rates are generally positive for the Swiss Franc (CHF) as they lead to higher yields, making the country a more attractive place for investors. On the contrary, lower interest rates tend to weaken CHF.
Macroeconomic data releases in Switzerland are key to assessing the state of the economy and can impact the Swiss Franc’s (CHF) valuation. The Swiss economy is broadly stable, but any sudden change in economic growth, inflation, current account or the central bank’s currency reserves have the potential to trigger moves in CHF. Generally, high economic growth, low unemployment and high confidence are good for CHF. Conversely, if economic data points to weakening momentum, CHF is likely to depreciate.
As a small and open economy, Switzerland is heavily dependent on the health of the neighboring Eurozone economies. The broader European Union is Switzerland’s main economic partner and a key political ally, so macroeconomic and monetary policy stability in the Eurozone is essential for Switzerland and, thus, for the Swiss Franc (CHF). With such dependency, some models suggest that the correlation between the fortunes of the Euro (EUR) and the CHF is more than 90%, or close to perfect.
Here is what you need to know on Tuesday, October 1:
Following Monday's choppy action in financial markets, investors shift their attention to key macroeconomic data releases as the fourth quarter gets underway. Eurostat will publish Harmonized Index of Consumer Prices (HICP), the European Central Bank's (ECB) preferred gauge of inflation, on Tuesday. Later in the day, the ISM Manufacturing PMI for September and JOLTS Job Openings data for August will be featured in the US economic docket. Several Federal Reserve (Fed) policymakers are scheduled to deliver speeches as well.
US Dollar PRICE This week
The table below shows the percentage change of US Dollar (USD) against listed major currencies this week. US Dollar was the strongest against the Japanese Yen.
| USD | EUR | GBP | JPY | CAD | AUD | NZD | CHF | |
|---|---|---|---|---|---|---|---|---|
| USD | 0.28% | -0.06% | 1.52% | 0.06% | -0.34% | 0.08% | 0.67% | |
| EUR | -0.28% | -0.33% | 1.24% | -0.19% | -0.56% | -0.17% | 0.47% | |
| GBP | 0.06% | 0.33% | 1.72% | 0.14% | -0.23% | 0.16% | 0.80% | |
| JPY | -1.52% | -1.24% | -1.72% | -1.39% | -1.90% | -1.40% | -0.79% | |
| CAD | -0.06% | 0.19% | -0.14% | 1.39% | -0.36% | 0.02% | 0.66% | |
| AUD | 0.34% | 0.56% | 0.23% | 1.90% | 0.36% | 0.39% | 1.03% | |
| NZD | -0.08% | 0.17% | -0.16% | 1.40% | -0.02% | -0.39% | 0.62% | |
| CHF | -0.67% | -0.47% | -0.80% | 0.79% | -0.66% | -1.03% | -0.62% |
The heat map shows percentage changes of major currencies against each other. The base currency is picked from the left column, while the quote currency is picked from the top row. For example, if you pick the US Dollar from the left column and move along the horizontal line to the Japanese Yen, the percentage change displayed in the box will represent USD (base)/JPY (quote).
While speaking at the National Association for Business Economics Annual Meeting on Monday, Fed Chairman Jerome Powell said that the Fed is not in a hurry to cut rates quickly, adding that their decisions will be guided by data. The US Dollar (USD) Index edged higher during the American trading hours and ended the last day of the third quarter in positive territory. Early Tuesday, the USD Index stays relatively quiet below 101.00. In the meantime, US stock index futures trade marginally lower on the day, pointing to a cautious mood.
After testing 1.1200 during the European trading hours on Monday, EUR/USD turned south in the American session and closed in negative territory. Early Tuesday, the pair fluctuates in a tight channel below 1.1150. Markets expect the annual core HICP inflation to remain unchanged at 2.8% in September in the Eurozone.
GBP/USD edged higher at the beginning of the week but lost its traction to close virtually unchanged on Monday. The pair moves sideways below 1.3400 in the European morning.
In the Summary of Opinions from the September policy meeting, the Bank of Japan's (BoJ) reiterated that they will maintain its current accommodative stance but will adjust policy settings if economic conditions improve. USD/JPY gathers bullish momentum after posting gains on Monday and trades at around 144.50 in the European morning, gaining over 0.5% on the day.
Gold extended its correction following Friday's decline and lost nearly 1% on Monday. XAU/USD holds its ground early Tuesday and trades above $2,640.
During the Asian trading hours, the data from Australia showed that Retail Sales rose 0.7% on a monthly basis in August, surpassing the market expectation for an increase of 0.4%. On a negative note, Building Permits declined by 6.1% in the same period. AUD/USD trades marginally higher on the day above 0.6900 to start the European session.
Inflation FAQs
Inflation measures the rise in the price of a representative basket of goods and services. Headline inflation is usually expressed as a percentage change on a month-on-month (MoM) and year-on-year (YoY) basis. Core inflation excludes more volatile elements such as food and fuel which can fluctuate because of geopolitical and seasonal factors. Core inflation is the figure economists focus on and is the level targeted by central banks, which are mandated to keep inflation at a manageable level, usually around 2%.
The Consumer Price Index (CPI) measures the change in prices of a basket of goods and services over a period of time. It is usually expressed as a percentage change on a month-on-month (MoM) and year-on-year (YoY) basis. Core CPI is the figure targeted by central banks as it excludes volatile food and fuel inputs. When Core CPI rises above 2% it usually results in higher interest rates and vice versa when it falls below 2%. Since higher interest rates are positive for a currency, higher inflation usually results in a stronger currency. The opposite is true when inflation falls.
Although it may seem counter-intuitive, high inflation in a country pushes up the value of its currency and vice versa for lower inflation. This is because the central bank will normally raise interest rates to combat the higher inflation, which attract more global capital inflows from investors looking for a lucrative place to park their money.
Formerly, Gold was the asset investors turned to in times of high inflation because it preserved its value, and whilst investors will often still buy Gold for its safe-haven properties in times of extreme market turmoil, this is not the case most of the time. This is because when inflation is high, central banks will put up interest rates to combat it. Higher interest rates are negative for Gold because they increase the opportunity-cost of holding Gold vis-a-vis an interest-bearing asset or placing the money in a cash deposit account. On the flipside, lower inflation tends to be positive for Gold as it brings interest rates down, making the bright metal a more viable investment alternative.
- EUR/GBP flat lines near 0.8330 in Tuesday’s early European session.
- ECB’s Lagarde signaled the October rate cut as inflation slows.
- Less dovish stance of the BoE might underpin the Pound Sterling in the near term.
The EUR/GBP cross trades on a flat note around 0.8330 on Tuesday during the early European session. Nonetheless, the rising speculation that the European Central Bank (ECB) will lower the interest rates in October might cap the upside for the Euro (EUR) against the Pound Sterling (GBP).
The ECB President Christine Lagarde on Monday hinted about additional rate cuts at its next policy meeting in October amid increasing signs that inflation is beaten and that the economy is struggling. Lagarde added that the central bank is more confident that inflation is going to settle at its target after a series of recent data releases, and will take that into account when it next sets policy. The rising bets on ECB rate reduction are likely to weigh on the shared currency for the time being.
Traders will closely watch the preliminary Eurozone inflation data for fresh impetus. The headline Harmonized Index of Consumer Prices (HICP) is expected to see an increase of 1.9% YoY in September, while the Core HICP is estimated to rise 2.9% YoY in the same period.
On the other hand, the expectation that the easing cycle of the Bank of England (BoE) will be lower than other central banks from Group of Seven (G-7) nations provides some support to the GBP. Investors anticipate the BoE to cut interest rates one more time by 25 bps in the remainder of this year.
ECB FAQs
The European Central Bank (ECB) in Frankfurt, Germany, is the reserve bank for the Eurozone. The ECB sets interest rates and manages monetary policy for the region. The ECB primary mandate is to maintain price stability, which means keeping inflation at around 2%. Its primary tool for achieving this is by raising or lowering interest rates. Relatively high interest rates will usually result in a stronger Euro and vice versa. The ECB Governing Council makes monetary policy decisions at meetings held eight times a year. Decisions are made by heads of the Eurozone national banks and six permanent members, including the President of the ECB, Christine Lagarde.
In extreme situations, the European Central Bank can enact a policy tool called Quantitative Easing. QE is the process by which the ECB prints Euros and uses them to buy assets – usually government or corporate bonds – from banks and other financial institutions. QE usually results in a weaker Euro. QE is a last resort when simply lowering interest rates is unlikely to achieve the objective of price stability. The ECB used it during the Great Financial Crisis in 2009-11, in 2015 when inflation remained stubbornly low, as well as during the covid pandemic.
Quantitative tightening (QT) is the reverse of QE. It is undertaken after QE when an economic recovery is underway and inflation starts rising. Whilst in QE the European Central Bank (ECB) purchases government and corporate bonds from financial institutions to provide them with liquidity, in QT the ECB stops buying more bonds, and stops reinvesting the principal maturing on the bonds it already holds. It is usually positive (or bullish) for the Euro.
FX option expiries for Oct 1 NY cut at 10:00 Eastern Time, via DTCC, can be found below.
EUR/USD: EUR amounts
- 1.1080 646m
- 1.1085 1.1b
- 1.1100 2.6b
- 1.1155 480m
- 1.1175 591m
- 1.1200 974m
USD/JPY: USD amounts
- 143.40 931m
- 143.90 469m
- 144.00 510m
AUD/USD: AUD amounts
- 0.6790 547m
- 0.6810 1.5b
USD/CAD: USD amounts
- 1.3390 614m
- 1.3525 938m
NZD/USD: NZD amounts
- 0.6435 531m
EUR/GBP: EUR amounts
- 0.8280 512m
- EUR/JPY gains traction to around 160.70 in Tuesday’s early European session, up 0.49% on the day.
- Ishiba’s comments undermine the Japanese Yen.
- ECB’s Lagarde said she is increasingly confident that inflation will ease to its 2% target.
The EUR/JPY cross extends the rally to near 160.70 during the early European session on Tuesday. The remarks from Japan's incoming Prime Minister (PM) Shigeru Ishiba weigh on the Japanese Yen (JPY). Investors await the Eurozone Harmonized Index of Consumer Prices (HICP) for September for fresh impetus. Also, the European Central Bank (ECB) policymakers Luis de Guindos and Isabel Schnabel are set to speak later on Tuesday.
The dovish comments from Japan's upcoming Prime Minister Shigeru Ishiba exert some selling pressure on the JPY. Ishiba said that the Bank of Japan's (BoJ) monetary policy must remain accommodative to underpin a fragile economic recovery.
Elsewhere, Japan’s Tankan Large Manufacturing Index showed that overall business conditions for large manufacturing companies remained steady in the third quarter (Q3) of 2024. The headline large Manufacturers' Sentiment Index arrived at 13.0 in Q3 from 13.0 in Q2, matching the expectations.
On the Euro front, the softer German CPI inflation data triggers the expectation for a 25 basis points (bps) rate cut at the next ECB policy meeting in October. This, in turn, might cap the upside for the shared currency. The ECB President Lagarde noted on Monday that the central bank is increasingly confident that inflation will fall to its 2% target and this will be reflected in its next policy move, hinting yet about a coming interest rate reduction. The markets raise their bets on a reduction in borrowing costs at the October meeting after Lagarde's speech.
ECB FAQs
The European Central Bank (ECB) in Frankfurt, Germany, is the reserve bank for the Eurozone. The ECB sets interest rates and manages monetary policy for the region. The ECB primary mandate is to maintain price stability, which means keeping inflation at around 2%. Its primary tool for achieving this is by raising or lowering interest rates. Relatively high interest rates will usually result in a stronger Euro and vice versa. The ECB Governing Council makes monetary policy decisions at meetings held eight times a year. Decisions are made by heads of the Eurozone national banks and six permanent members, including the President of the ECB, Christine Lagarde.
In extreme situations, the European Central Bank can enact a policy tool called Quantitative Easing. QE is the process by which the ECB prints Euros and uses them to buy assets – usually government or corporate bonds – from banks and other financial institutions. QE usually results in a weaker Euro. QE is a last resort when simply lowering interest rates is unlikely to achieve the objective of price stability. The ECB used it during the Great Financial Crisis in 2009-11, in 2015 when inflation remained stubbornly low, as well as during the covid pandemic.
Quantitative tightening (QT) is the reverse of QE. It is undertaken after QE when an economic recovery is underway and inflation starts rising. Whilst in QE the European Central Bank (ECB) purchases government and corporate bonds from financial institutions to provide them with liquidity, in QT the ECB stops buying more bonds, and stops reinvesting the principal maturing on the bonds it already holds. It is usually positive (or bullish) for the Euro.
- The US Dollar Index advances as the Fed’s Powell said that the central bank will lower interest rates ‘over time.’
- CME FedWatch Tool suggests a 61.8% probability to a 25 basis point rate cut by the Fed in November.
- US ISM Manufacturing PMI is expected to improve to 47.5 in September, from the previous 47.2 reading.
The US Dollar Index (DXY), which measures the value of the US Dollar (USD) against other six major currencies, extends its gains for the second successive day. The DXY trades around 100.80 during the Asian hours on Tuesday. The US Dollar (USD) gains ground following the latest speech from the Federal Reserve (Fed) Chairman Jerome Powell.
Fed Chair Powell stated the central bank is not in a hurry and will lower its benchmark rate ‘over time.’ Powell added that the recent 50 basis point interest rate cut should not be seen as an indication of similarly aggressive future actions, noting that upcoming rate changes are likely to be more modest.
The CME FedWatch Tool indicates that markets are assigning a 61.8% probability to a 25 basis point rate cut by the Federal Reserve in November, while the likelihood of a 50-basis-point is 38.2%, down from 53.3% a day ago.
However, last week’s US Core Personal Consumption Expenditures (PCE) Price Index increased by 0.1% MoM in August, falling short of the expected 0.2% rise, aligning with the Federal Reserve's outlook that inflation is easing in the US economy. This reinforced the possibility of an aggressive rate-cutting cycle by the Fed.
Traders would likely observe US manufacturing data including ISM Manufacturing PMI later in the North American session, which is expected to improve to 47.5 in September, from the previous 47.2 reading. This report may provide a reliable outlook on the state of the US manufacturing sector.
Economic Indicator
ISM Manufacturing PMI
The Institute for Supply Management (ISM) Manufacturing Purchasing Managers Index (PMI), released on a monthly basis, is a leading indicator gauging business activity in the US manufacturing sector. The indicator is obtained from a survey of manufacturing supply executives based on information they have collected within their respective organizations. Survey responses reflect the change, if any, in the current month compared to the previous month. A reading above 50 indicates that the manufacturing economy is generally expanding, a bullish sign for the US Dollar (USD). A reading below 50 signals that factory activity is generally declining, which is seen as bearish for USD.
Read more.Next release: Tue Oct 01, 2024 14:00
Frequency: Monthly
Consensus: 47.5
Previous: 47.2
Source: Institute for Supply Management
The Institute for Supply Management’s (ISM) Manufacturing Purchasing Managers Index (PMI) provides a reliable outlook on the state of the US manufacturing sector. A reading above 50 suggests that the business activity expanded during the survey period and vice versa. PMIs are considered to be leading indicators and could signal a shift in the economic cycle. Stronger-than-expected prints usually have a positive impact on the USD. In addition to the headline PMI, the Employment Index and the Prices Paid Index numbers are watched closely as they shine a light on the labour market and inflation.
- EUR/USD lacks firm direction as traders await Eurozone inflation data before placing fresh bets.
- Fed Chair Jerome Powell’s hawkish remarks on Monday underpins the USD and caps the major.
- Bets for more rate cuts by the ECB contribute to keeping a lid on the pair ahead of the key data.
The EUR/USD pair struggles to gain any meaningful traction following the previous day's pullback from the vicinity of the 14-month peak – levels just above the 1.1200 mark and oscillates in a narrow band during the Asian session on Tuesday. Spot prices currently trade around the 1.1135-1.1140 area, nearly unchanged for the day as traders keenly await the release of the Eurozone inflation data before placing directional bets.
The flash version is expected to show that the Eurozone Consumer Price Index (CPI) probably fell below the European Central Bank's (ECB) 2% target in September. Against the backdrop of a fall in the German CPI to the lowest level since February 2021, a softer Eurozone CPI print will reaffirm bets for a 25 bps rate cut at the next ECB policy meeting in October. Conversely, the reaction to a higher reading is likely to remain limited amid a modest US Dollar (USD) strength, suggesting that the path of least resistance for the EUR/USD pair is to the upside.
The Federal Reserve (Fed) Chair Jerome Powell adopted a more hawkish tone on Monday and said that he sees only two more 25 basis point interest rate cuts this year as a baseline if the economy performs as expected. Investors were quick to react and pared bets for a more aggressive policy easing by the US central bank. This, along with the risk of a further escalation of geopolitical tensions in the Middle East and a broader conflict in the region, assists the safe-haven Greenback to build on the previous day's goodish rebound from its lowest level since July 2023.
Later during the early North American session, traders will take cues from the US economic docket – featuring the release of the ISM Manufacturing PMI and JOLTS Job Openings data. Apart from this, speeches by a slew of influential FOMC members will drive the USD demand and provide some meaningful impetus to the EUR/USD pair, which remains confined in a familiar range held over the past two weeks or so. Nevertheless, the fundamental backdrop, along with the recent repeated failures to find acceptance above the 1.1200 mark warrant caution for bulls.
Economic Indicator
Harmonized Index of Consumer Prices (YoY)
The Harmonized Index of Consumer Prices (HICP) measures changes in the prices of a representative basket of goods and services in the European Monetary Union. The HICP, released by Eurostat on a monthly basis, is harmonized because the same methodology is used across all member states and their contribution is weighted. The YoY reading compares prices in the reference month to a year earlier. Generally, a high reading is seen as bullish for the Euro (EUR), while a low reading is seen as bearish.
Read more.Next release: Tue Oct 01, 2024 09:00 (Prel)
Frequency: Monthly
Consensus: 1.9%
Previous: 2.2%
Source: Eurostat
Gold prices rose in India on Tuesday, according to data compiled by FXStreet.
The price for Gold stood at 7,110.69 Indian Rupees (INR) per gram, up compared with the INR 7,099.21 it cost on Monday.
The price for Gold increased to INR 82,937.67 per tola from INR 82,803.78 per tola a day earlier.
| Unit measure | Gold Price in INR |
|---|---|
| 1 Gram | 7,110.69 |
| 10 Grams | 71,106.61 |
| Tola | 82,937.67 |
| Troy Ounce | 221,167.30 |
FXStreet calculates Gold prices in India by adapting international prices (USD/INR) to the local currency and measurement units. Prices are updated daily based on the market rates taken at the time of publication. Prices are just for reference and local rates could diverge slightly.
Gold FAQs
Gold has played a key role in human’s history as it has been widely used as a store of value and medium of exchange. Currently, apart from its shine and usage for jewelry, the precious metal is widely seen as a safe-haven asset, meaning that it is considered a good investment during turbulent times. Gold is also widely seen as a hedge against inflation and against depreciating currencies as it doesn’t rely on any specific issuer or government.
Central banks are the biggest Gold holders. In their aim to support their currencies in turbulent times, central banks tend to diversify their reserves and buy Gold to improve the perceived strength of the economy and the currency. High Gold reserves can be a source of trust for a country’s solvency. Central banks added 1,136 tonnes of Gold worth around $70 billion to their reserves in 2022, according to data from the World Gold Council. This is the highest yearly purchase since records began. Central banks from emerging economies such as China, India and Turkey are quickly increasing their Gold reserves.
Gold has an inverse correlation with the US Dollar and US Treasuries, which are both major reserve and safe-haven assets. When the Dollar depreciates, Gold tends to rise, enabling investors and central banks to diversify their assets in turbulent times. Gold is also inversely correlated with risk assets. A rally in the stock market tends to weaken Gold price, while sell-offs in riskier markets tend to favor the precious metal.
The price can move due to a wide range of factors. Geopolitical instability or fears of a deep recession can quickly make Gold price escalate due to its safe-haven status. As a yield-less asset, Gold tends to rise with lower interest rates, while higher cost of money usually weighs down on the yellow metal. Still, most moves depend on how the US Dollar (USD) behaves as the asset is priced in dollars (XAU/USD). A strong Dollar tends to keep the price of Gold controlled, whereas a weaker Dollar is likely to push Gold prices up.
(An automation tool was used in creating this post.)
- WTI Oil prices receive downward pressure as OPEC+ is likely to increase output by 180,000 barrels per day in December.
- The US has purchased 6 million barrels of oil for the Strategic Petroleum Reserve, with delivery scheduled through May 2025.
- Israel has declared a “limited” ground operation aimed at Hezbollah positions in the southern Lebanon border area.
West Texas Intermediate (WTI) Oil price maintains position around $68.00 per barrel during the Asian session on Tuesday. Crude Oil prices are muted as expectations of increased supply and sluggish global demand growth offset concerns over supply disruptions amid the escalating Middle East conflict.
OPEC+, which includes the Organization of the Petroleum Exporting Countries and its allies like Russia, is set to increase output by 180,000 barrels per day (bpd) in December. According to a report from the Financial Times, citing unnamed sources familiar with Saudi Arabia's plans, the kingdom is determined to resume production on December 1, even if it leads to a temporary decline in prices.
Oil prices faced downward pressure due to weaker-than-expected demand growth this year, especially in China, the world’s largest crude importer. These demand concerns were further heightened by data indicating a decline in manufacturing activities in China for September. On Monday, the Caixin Manufacturing Purchasing Managers' Index (PMI) dropped to 49.3 in September, signaling a contraction, compared to 50.4 in August.
The United States (US) has acquired 6 million barrels of Oil for the Strategic Petroleum Reserve (SPR) for delivery through May 2025. This purchase is part of an initiative to replenish stockpiles following President Joe Biden's directive in 2022 for the largest-ever sale from the reserve, totaling 180 million barrels.
US crude Oil and fuel stockpiles were projected to have decreased by approximately 2.1 million barrels during the week ending September 27, according to a preliminary Reuters poll released on Monday. The poll was conducted ahead of reports from the American Petroleum Institute (API) and the US Energy Information Administration (EIA), both set to release data on crude Oil stock changes for the same period on Tuesday.
Israel has announced a “limited” ground operation targeting Hezbollah positions in the southern Lebanon border region, with troops crossing into the area, according to local news agency Al Jazeera. In addition, Israeli warplanes launched extensive airstrikes on southern Beirut after civilians were instructed to evacuate. On Monday, Israeli attacks in Lebanon resulted in the deaths of at least 95 people.
WTI Oil FAQs
WTI Oil is a type of Crude Oil sold on international markets. The WTI stands for West Texas Intermediate, one of three major types including Brent and Dubai Crude. WTI is also referred to as “light” and “sweet” because of its relatively low gravity and sulfur content respectively. It is considered a high quality Oil that is easily refined. It is sourced in the United States and distributed via the Cushing hub, which is considered “The Pipeline Crossroads of the World”. It is a benchmark for the Oil market and WTI price is frequently quoted in the media.
Like all assets, supply and demand are the key drivers of WTI Oil price. As such, global growth can be a driver of increased demand and vice versa for weak global growth. Political instability, wars, and sanctions can disrupt supply and impact prices. The decisions of OPEC, a group of major Oil-producing countries, is another key driver of price. The value of the US Dollar influences the price of WTI Crude Oil, since Oil is predominantly traded in US Dollars, thus a weaker US Dollar can make Oil more affordable and vice versa.
The weekly Oil inventory reports published by the American Petroleum Institute (API) and the Energy Information Agency (EIA) impact the price of WTI Oil. Changes in inventories reflect fluctuating supply and demand. If the data shows a drop in inventories it can indicate increased demand, pushing up Oil price. Higher inventories can reflect increased supply, pushing down prices. API’s report is published every Tuesday and EIA’s the day after. Their results are usually similar, falling within 1% of each other 75% of the time. The EIA data is considered more reliable, since it is a government agency.
OPEC (Organization of the Petroleum Exporting Countries) is a group of 12 Oil-producing nations who collectively decide production quotas for member countries at twice-yearly meetings. Their decisions often impact WTI Oil prices. When OPEC decides to lower quotas, it can tighten supply, pushing up Oil prices. When OPEC increases production, it has the opposite effect. OPEC+ refers to an expanded group that includes ten extra non-OPEC members, the most notable of which is Russia.
- GBP/USD trades with mild negative bias near 1.3370 in Tuesday’s Asian session.
- Lower expectations of a jumbo Fed rate cut lift the US Dollar.
- BOE’s Greene said strong UK consumers could fuel price pressures.
The GBP/USD pair struggles to gain ground around 1.3370 during the Asian session on Tuesday. Less dovish remarks from Federal Reserve (Fed) Chair Jerome Powell provide some support to the Greenback and drag the major pair lower. Investors brace for the US September ISM Manufacturing Purchasing Managers Index (PMI) data and the speeches from Fed’s Raphael Bostic and Lisa Cook later on Tuesday.
Fed Chair Jerome Powell said on Monday that the US central bank intends to do what it takes to keep the economy "in solid shape," but it is not in a hurry and will lower its benchmark rate ‘over time.’ Atlanta Federal Reserve President Raphael Bostic noted on Monday he would be open to another 50 basis point (bps) rate reduction at the November meeting if upcoming data show job growth slowing faster than expected. However. Bostic said he previously penciled in just one more 25 bps rate cut this year.
The US labor market data will take center stage on Friday and will likely influence the US rate cut path. The US Nonfarm Payrolls (NFP) is estimated to see 140K job additions in September, while the Unemployment Rate is forecast to remain unchanged at 4.2%. If the jobs report showed a weaker-than-expected outcome, this could prompt the central bank to consider cutting rates more deeply, which might exert some selling pressure on the USD.
On the Cable front, the Bank of England (BoE) policymaker Megan Greene said that a consumption-driven recovery in the UK could set off a renewed bout of inflation, but further interest rate cuts are likely as prices are “moving in the right direction, per Bloomberg. Nonetheless, traders have lowered their bets on a BOE rate cut in November in the last few days.
Pound Sterling FAQs
The Pound Sterling (GBP) is the oldest currency in the world (886 AD) and the official currency of the United Kingdom. It is the fourth most traded unit for foreign exchange (FX) in the world, accounting for 12% of all transactions, averaging $630 billion a day, according to 2022 data. Its key trading pairs are GBP/USD, also known as ‘Cable’, which accounts for 11% of FX, GBP/JPY, or the ‘Dragon’ as it is known by traders (3%), and EUR/GBP (2%). The Pound Sterling is issued by the Bank of England (BoE).
The single most important factor influencing the value of the Pound Sterling is monetary policy decided by the Bank of England. The BoE bases its decisions on whether it has achieved its primary goal of “price stability” – a steady inflation rate of around 2%. Its primary tool for achieving this is the adjustment of interest rates. When inflation is too high, the BoE will try to rein it in by raising interest rates, making it more expensive for people and businesses to access credit. This is generally positive for GBP, as higher interest rates make the UK a more attractive place for global investors to park their money. When inflation falls too low it is a sign economic growth is slowing. In this scenario, the BoE will consider lowering interest rates to cheapen credit so businesses will borrow more to invest in growth-generating projects.
Data releases gauge the health of the economy and can impact the value of the Pound Sterling. Indicators such as GDP, Manufacturing and Services PMIs, and employment can all influence the direction of the GBP. A strong economy is good for Sterling. Not only does it attract more foreign investment but it may encourage the BoE to put up interest rates, which will directly strengthen GBP. Otherwise, if economic data is weak, the Pound Sterling is likely to fall.
Another significant data release for the Pound Sterling is the Trade Balance. This indicator measures the difference between what a country earns from its exports and what it spends on imports over a given period. If a country produces highly sought-after exports, its currency will benefit purely from the extra demand created from foreign buyers seeking to purchase these goods. Therefore, a positive net Trade Balance strengthens a currency and vice versa for a negative balance.
Atsushi Mimura, Japan’s Vice Finance Minister For International Affairs and top foreign exchange official, said on Tuesday, it is “desirable for currencies to move in a stable manner reflecting fundamentals.”
Further comments
Our job is reduce uncertain factors as much as possible in FX policies.
Global policymakers are all trying to reduce uncertainties in communications.
No comment on current FX moves.
Yen short positions that had built up till mid July have been unwound.
Closely monitoring market volatility.
Undesirable for market volatility to affect corporate activities.
Hope that forex rates will reflect changing phase of Japanese economy as Japan moves out of deflation.
Will respond appropriately if needed.
- Silver attracts fresh buyers on Tuesday, though the setup warrants some caution for bulls.
- The overnight breakdown through the 23.6% Fibo. supports prospects for further losses.
- Bears need to wait for weakness and acceptance below the $30.90-$30.80 support zone.
Silver (XAG/USD) gains some positive traction during the Asian session on Tuesday and moves away from a multi-day low, around the $30.90-$30.85 region touched the previous day. The white metal currently trades around the $31.35 region, up 0.60% for the day, snapping a two-day losing streak and stalling its recent corrective pullback from the highest level since December 2012 touched last week.
From a technical perspective, the overnight breakdown through the 23.6% Fibonacci retracement level of the strong rally from the September monthly swing low favors bearish traders. Moreover, oscillators on the 4-hour chart have been gaining negative traction and support prospects for the emergence of some selling at higher levels. This, in turn, warrants some caution before positioning for the resumption of the recent upward trajectory witnessed over the past month or so.
That said, the overnight bounce from sub-$31.00 levels, or the vicinity of the 38.2% Fibo. level, and positive oscillators on the daily chart, suggest that the path of least resistance for the XAG/USD is to the upside. Any further move up, however, might confront resistance near the $31.80 horizontal zone ahead of the $32.00 mark. A sustained strength beyond the latter could push the XAG/USD to the $32.25 intermediate hurdle en route to the multi-year peak, around the $32.70 region.
On the flip side, the $30.90-$30.85 region, nearing 38.2% Fibo. level now seems to protect the immediate downside, below which the XAG/USD could accelerate the fall towards 50% Fibo. level, around the $30.25 area. The downward trajectory could extend further toward the $30.00 psychological mark en route to the $29.70-$29.65 confluence support – comprising the 61.8% Fibo. level and the 200-period Simple Moving Average (SMA) on the 4-hour chart.
Silver 4-hour chart
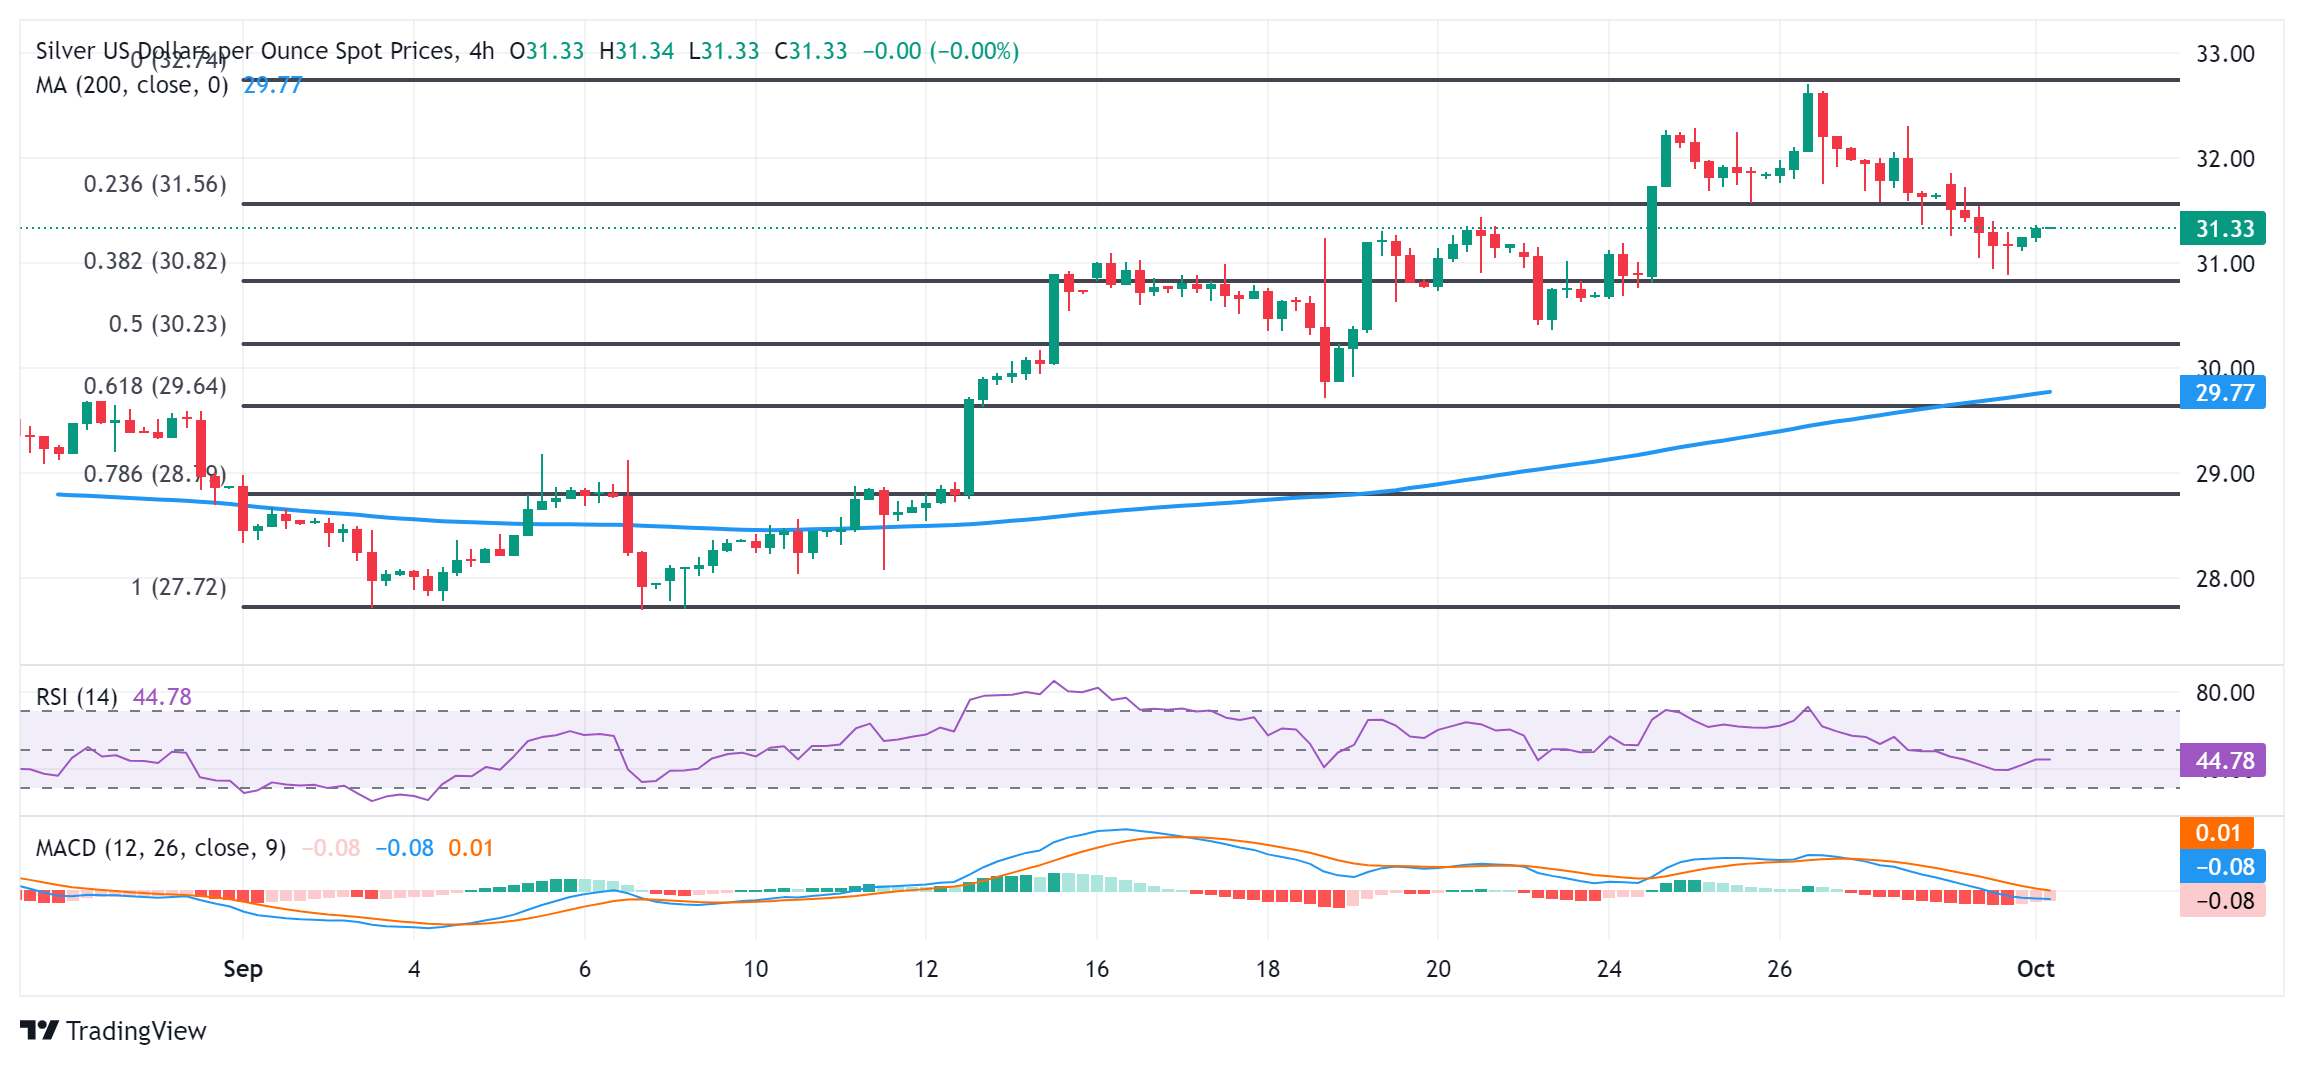
Silver FAQs
Silver is a precious metal highly traded among investors. It has been historically used as a store of value and a medium of exchange. Although less popular than Gold, traders may turn to Silver to diversify their investment portfolio, for its intrinsic value or as a potential hedge during high-inflation periods. Investors can buy physical Silver, in coins or in bars, or trade it through vehicles such as Exchange Traded Funds, which track its price on international markets.
Silver prices can move due to a wide range of factors. Geopolitical instability or fears of a deep recession can make Silver price escalate due to its safe-haven status, although to a lesser extent than Gold's. As a yieldless asset, Silver tends to rise with lower interest rates. Its moves also depend on how the US Dollar (USD) behaves as the asset is priced in dollars (XAG/USD). A strong Dollar tends to keep the price of Silver at bay, whereas a weaker Dollar is likely to propel prices up. Other factors such as investment demand, mining supply – Silver is much more abundant than Gold – and recycling rates can also affect prices.
Silver is widely used in industry, particularly in sectors such as electronics or solar energy, as it has one of the highest electric conductivity of all metals – more than Copper and Gold. A surge in demand can increase prices, while a decline tends to lower them. Dynamics in the US, Chinese and Indian economies can also contribute to price swings: for the US and particularly China, their big industrial sectors use Silver in various processes; in India, consumers’ demand for the precious metal for jewellery also plays a key role in setting prices.
Silver prices tend to follow Gold's moves. When Gold prices rise, Silver typically follows suit, as their status as safe-haven assets is similar. The Gold/Silver ratio, which shows the number of ounces of Silver needed to equal the value of one ounce of Gold, may help to determine the relative valuation between both metals. Some investors may consider a high ratio as an indicator that Silver is undervalued, or Gold is overvalued. On the contrary, a low ratio might suggest that Gold is undervalued relative to Silver.
- The Japanese Yen extends its losses as the BoJ Summary of Opinions indicates no immediate plans for further rate hikes.
- Japan’s Tankan Large Manufacturing Index remained steady at 13 points in Q3, as expected.
- Fed Chair Powell said that upcoming rate changes are likely to be more modest.
The Japanese Yen (JPY) continues to lose ground for the second successive day following the release of the Bank of Japan's (BoJ) Summary of Opinions from September’s Monetary Policy Meeting, along with mixed economic data on Tuesday.
The summary indicates no immediate plans for additional rate hikes, stressing a focus on stability and cautious communication. The BoJ intends to maintain its accommodative stance but remains open to adjustments if economic conditions show significant improvement.
Japan’s Tankan Large Manufacturing Index showed that overall business conditions for large manufacturing companies remained steady at 13 points in the third quarter, in line with expectations. Additionally, Japan's Unemployment Rate fell to 2.5% in August, down from 2.7% in July, which was better than market forecasts of 2.6%.
Additionally, the dovish comments from Japan's upcoming Prime Minister, former Defense Chief Shigeru Ishiba, are putting downward pressure on the JPY and underpinning the USD/JPY pair. Ishiba stated on Sunday that the country's monetary policy should continue to be accommodative, indicating the necessity of maintaining low borrowing costs to support a fragile economic recovery, The Japan Times.
Daily Digest Market Movers: Japanese Yen depreciates due to rising doubts over BoJ’s rate hikes
- The US Dollar (USD) gains ground following the latest remarks from the Federal Reserve (Fed) Chairman Jerome Powell on Monday. Powell said the central bank is not in a hurry and will lower its benchmark rate ‘over time.’ Fed Chair Powell added that the recent 50 basis point interest rate cut should not be seen as an indication of similarly aggressive future actions, noting that upcoming rate changes are likely to be more modest.
- The CME FedWatch Tool indicates that markets are assigning a 61.8% probability to a 25 basis point rate cut by the Federal Reserve in November, while the likelihood of a 50-basis-point dropped to 38.2%, down from 53.3% a day ago.
- Japan's Retail Trade increased by 2.8% year-on-year in August, surpassing market expectations of 2.3% and slightly exceeding the upwardly revised 2.7% rise from the previous month. On a month-over-month basis, seasonally adjusted Retail Trade rose by 0.8%, marking the largest increase in three months, following a 0.2% gain in July.
- Japan's Chief Cabinet Secretary, Yoshimasa Hayashi, refrained from commenting on Monday's daily stock market fluctuations. Hayashi emphasized the importance of closely monitoring the economic and financial situation both domestically and internationally with a sense of urgency. He also noted the need for ongoing collaboration with the Bank of Japan.
- St. Louis Federal Reserve President Alberto Musalem stated on Friday, according to the Financial Times, that the Fed should begin cutting interest rates "gradually" following a larger-than-usual half-point reduction at the September meeting. Musalem acknowledged the possibility of the economy weakening more than anticipated, saying, "If that were the case, then a faster pace of rate reductions might be appropriate."
- The US Core Personal Consumption Expenditures (PCE) Price Index for August increased by 0.1% month-over-month, falling short of market expectations of a 0.2% rise and lower than the previous 0.2% increase. Meanwhile, the Core PCE on a year-over-year basis rose by 2.7%, matching expectations and slightly above the prior reading of 2.6%.
- On Thursday, the BoJ Monetary Policy Meeting Minutes expressed the members’ consensus on the importance of remaining vigilant regarding the risks of inflation exceeding targets. Several members indicated that raising rates to 0.25% would be suitable as a way to adjust the level of monetary support. A few others suggested that a moderate adjustment to monetary support would also be appropriate.
Technical Analysis: USD/JPY moves above 144.00, nine-day EMA
USD/JPY trades around 144.10 on Tuesday. Analysis of the daily chart shows that the pair has re-entered the ascending channel pattern, indicating that the bullish bias remains intact. Additionally, the 14-day Relative Strength Index (RSI) is slightly below the 50 level, and a break above this could further confirm the continuation of the bullish trend.
In terms of resistance, the USD/JPY pair could explore the area around the upper boundary of the ascending channel at 146.50, followed by its five-week high of 147.21 level, which was recorded on September 3.
On the downside, the immediate support appears at the nine-day Exponential Moving Average (EMA) at the 143.51 level, followed by the lower boundary of the ascending channel at the 142.80 level. A break below this level could lead the USD/JPY pair to navigate around the 139.58 region, the lowest point since June 2023.
USD/JPY: Daily Chart
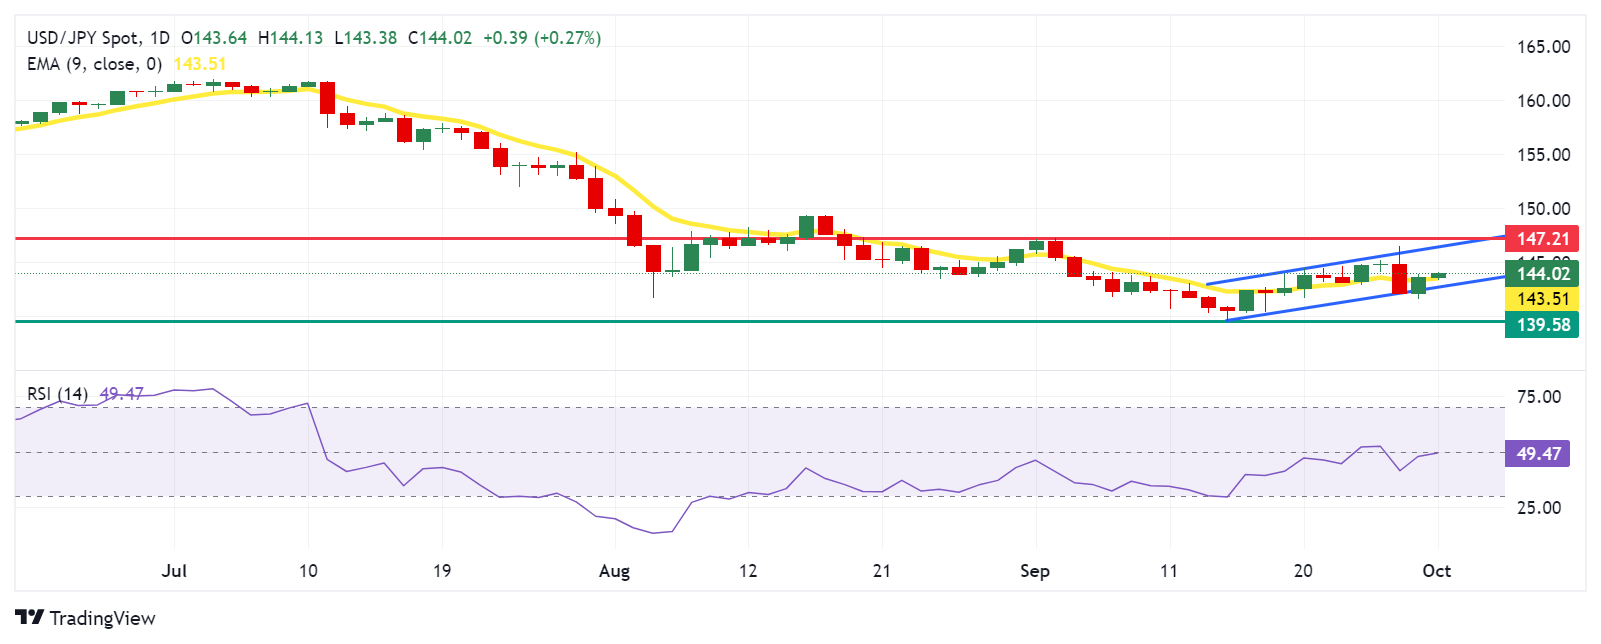
Japanese Yen PRICE Today
The table below shows the percentage change of Japanese Yen (JPY) against listed major currencies today. Japanese Yen was the weakest against the Australian Dollar.
| USD | EUR | GBP | JPY | CAD | AUD | NZD | CHF | |
|---|---|---|---|---|---|---|---|---|
| USD | -0.02% | 0.02% | 0.43% | 0.04% | -0.03% | 0.45% | 0.10% | |
| EUR | 0.02% | 0.02% | 0.45% | 0.06% | -0.01% | 0.45% | 0.10% | |
| GBP | -0.02% | -0.02% | 0.42% | 0.02% | -0.05% | 0.44% | 0.09% | |
| JPY | -0.43% | -0.45% | -0.42% | -0.38% | -0.46% | 0.01% | -0.33% | |
| CAD | -0.04% | -0.06% | -0.02% | 0.38% | -0.07% | 0.41% | 0.06% | |
| AUD | 0.03% | 0.01% | 0.05% | 0.46% | 0.07% | 0.47% | 0.11% | |
| NZD | -0.45% | -0.45% | -0.44% | -0.01% | -0.41% | -0.47% | -0.34% | |
| CHF | -0.10% | -0.10% | -0.09% | 0.33% | -0.06% | -0.11% | 0.34% |
The heat map shows percentage changes of major currencies against each other. The base currency is picked from the left column, while the quote currency is picked from the top row. For example, if you pick the Japanese Yen from the left column and move along the horizontal line to the US Dollar, the percentage change displayed in the box will represent JPY (base)/USD (quote).
Economic Indicator
BoJ Summary of Opinions
This report includes the BOJ's projection for inflation and economic growth. It is scheduled 8 times per year, about 10 days after the Monetary Policy Statement is released.
Read more.Last release: Mon Sep 30, 2024 23:50
Frequency: Irregular
Actual: -
Consensus: -
Previous: -
Source: Bank of Japan
- AUD/JPY draws support from a combination of factors and moves back closer to a two-month top.
- Ishiba's comments about BoJ rate hikes overshadow upbeat domestic data and undermine the JPY.
- The stronger Australian Retail Sales data boosts the Aussie amid optimism over Chinese stimulus.
The AUD/JPY cross attracts buyers for the second straight day on Tuesday and climbs to the 99.75-99.80 region during the Asian session, closer to a technically significant 200-day Simple Moving Average (SMA).
The Japanese Yen (JPY) continues to be undermined by comments from Japan's incoming Prime Minister (PM) Shigeru Ishiba, saying that the Bank of Japan's (BoJ) monetary policy must remain accommodative to underpin a fragile economic recovery. Furthermore, Ishiba said on Monday that he intends to call a general election on October 27, which overshadows mostly upbeat Japanese macro data and does little to provide any meaningful impetus to the JPY.
A government report published earlier today showed that Japan's Unemployment rate dropped to 2.5% in August from the 2.7% previous. Separately, a BoJ's Tankan survey indicated that sentiment among Japan's big manufacturers was steady and slight improvement in large non-manufacturers' mood during the third quarter. Meanwhile, BoJ's Summary of Opinions revealed that the central bank will adjust its accommodative stance if economic conditions improve.
The Australian Dollar (AUD), on the other hand, strengthened a bit following the release of domestic Retail Sales, which rose 0.7% in August as compared to a modest 0.1% increase in the previous month. This comes on top of the Reserve Bank of Australia's (RBA) hawkish stance and the optimism over a slew of stimulus measures from China last week, which continues to benefit the Aussie and turns out to be a key factor acting as a tailwind for the AUD/JPY cross.
It, however, remains to be seen if bulls can build on the momentum or once again face rejection near the 100.00 psychological mark amid the growing market conviction that the BoJ will hike interest rates again by the end of this year. Furthermore, the formation of a 'Death Cross' on the daily chart – the 50-day Simple Moving Average (SMA) crossing below the 200-day SMA – warrants caution before placing bullish bets around the AUD/JPY cross and positioning for further gains.
Economic Indicator
Retail Sales s.a. (MoM)
The Retail Sales data, released by the Australian Bureau of Statistics on a monthly basis, measures the value of goods sold by retailers in Australia. Changes in Retail Sales are widely followed as an indicator of consumer spending. Percent changes reflect the rate of changes in such sales, with the MoM reading comparing sales values in the reference month with the previous month. Generally, a high reading is seen as bullish for the Australian Dollar (AUD), while a low reading is seen as bearish.
Read more.Last release: Tue Oct 01, 2024 01:30
Frequency: Monthly
Actual: 0.7%
Consensus: 0.4%
Previous: 0%
Source: Australian Bureau of Statistics
The primary gauge of Australia’s consumer spending, the Retail Sales, is released by the Australian Bureau of Statistics (ABS) about 35 days after the month ends. It accounts for approximately 80% of total retail turnover in the country and, therefore, has a significant bearing on inflation and GDP. This leading indicator has a direct correlation with inflation and the growth prospects, impacting the Reserve Bank of Australia’s (RBA) interest rates decision and AUD valuation. The stats bureau uses the forward factor method, ensuring that the seasonal factors are not distorted by COVID-19 impacts.
- Gold price ticks higher on Tuesday and stalls its recent corrective slide from the all-time top.
- Bets for further rate cuts by the Fed and geopolitical risks continue to benefit the XAU/USD.
- Traders now look forward to the release of key US macro data for some meaningful impetus.
Gold price (XAU/USD) ended in the red for the second straight day on Monday amid optimism over China's stimulus and the Federal Reserve (Fed) Chair Jerome Powell's relatively hawkish remarks. This, in turn, prompted some follow-through profit-taking after the recent runup to the all-time peak touched last week, though the corrective pullback stalls near the $2,625-2,624 support zone. Nevertheless, the precious metal registered its best quarterly gains since early 2020 and seems poised to prolong its well-established uptrend.
The incoming weaker US economic data, along with a continued slowdown in inflation, should allow the Fed to cut interest rates further. This, along with escalating geopolitical tensions in the Middle East and the risk of a broader conflict, should continue to benefit the safe-haven Gold price. This, along with expectations that China's stimulus measures will revive physical demand, assists the XAU/USD to attract some buyers during the Asian session on Tuesday and validates the near-term positive outlook ahead of the key US macro data.
Daily Digest Market Movers: Gold price might continue to attract haven flows amid escalating tensions in the Middle East
- A slew of stimulus measures from China last week continued to boost investors' appetite for riskier assets and drove some flows away from the traditional safe-haven Gold price for the second successive day on Monday.
- Furthermore, Federal Reserve Chair Jerome Powell adopted a more hawkish tone on the economy and said that he sees two more 25 basis point interest rate cuts this year as a baseline if the economy performs as expected.
- The markets were quick to react and scaled back expectations for a more aggressive policy easing by the Fed, prompting some follow-through profit-taking around the non-yielding yellow metal and contributing to the slide.
- Meanwhile, the markets are still pricing in the possibility of an oversized Fed rate cut by the end of this year, which, along with persistent geopolitical tensions, acts as a tailwind for the safe-haven precious metal.
- Israeli forces have begun limited, localized, and targeted ground raids in Lebanon two days after they killed the head of the armed group Hezbollah Hassan Nasrallah in an airstrike, threatening to worsen the Middle East crisis.
- Israel last week had rejected a proposal by the US and France, calling for a 21-day ceasefire on the Lebanon border to give time for a diplomatic settlement that would allow displaced civilians on both sides to return home.
- Traders now look to the US economic docket – featuring the release of the ISM Manufacturing PMI and JOLTS Jobs Opening – for some impetus ahead of other key macro data scheduled at the beginning of a new month.
Technical Outlook: Gold price finds support near ascending trend-channel resistance breakpoint, around $2,625-2,624 area
From a technical perspective, the emergence of some buying near the $2,625-2,624 area reaffirms a support marked by a short-term ascending trend-channel resistance breakpoint and should act as a pivotal point. Some follow-through selling could drag the Gold price to the $2,600 mark, which if broken decisively could pave the way for some meaningful downside in the near term. The XAU/USD might then decline to the $2,560 intermediate support en route to the $2,535-2,530 region.
On the flip side, the $2,656-2,657 horizontal zone could offer some resistance ahead of the $2,672 area and the $2,685-2,686 region, or the record peak touched last week. This is closely followed by the $2,700 mark, which if conquered will be seen as a fresh trigger for bullish traders and set the stage for an extension of a multi-month-old uptrend.
Gold FAQs
Gold has played a key role in human’s history as it has been widely used as a store of value and medium of exchange. Currently, apart from its shine and usage for jewelry, the precious metal is widely seen as a safe-haven asset, meaning that it is considered a good investment during turbulent times. Gold is also widely seen as a hedge against inflation and against depreciating currencies as it doesn’t rely on any specific issuer or government.
Central banks are the biggest Gold holders. In their aim to support their currencies in turbulent times, central banks tend to diversify their reserves and buy Gold to improve the perceived strength of the economy and the currency. High Gold reserves can be a source of trust for a country’s solvency. Central banks added 1,136 tonnes of Gold worth around $70 billion to their reserves in 2022, according to data from the World Gold Council. This is the highest yearly purchase since records began. Central banks from emerging economies such as China, India and Turkey are quickly increasing their Gold reserves.
Gold has an inverse correlation with the US Dollar and US Treasuries, which are both major reserve and safe-haven assets. When the Dollar depreciates, Gold tends to rise, enabling investors and central banks to diversify their assets in turbulent times. Gold is also inversely correlated with risk assets. A rally in the stock market tends to weaken Gold price, while sell-offs in riskier markets tend to favor the precious metal.
The price can move due to a wide range of factors. Geopolitical instability or fears of a deep recession can quickly make Gold price escalate due to its safe-haven status. As a yield-less asset, Gold tends to rise with lower interest rates, while higher cost of money usually weighs down on the yellow metal. Still, most moves depend on how the US Dollar (USD) behaves as the asset is priced in dollars (XAU/USD). A strong Dollar tends to keep the price of Gold controlled, whereas a weaker Dollar is likely to push Gold prices up.
| Raw materials | Closed | Change, % |
|---|---|---|
| Silver | 31.148 | -1.87 |
| Gold | 263.458 | -1.02 |
| Palladium | 1001.22 | -1.86 |
- Indian Rupee softens in Tuesday’s Asian session.
- The renewed USD demand, volatile crude oil prices, foreign outflows of funds undermine the INR.
- The HSBC India Manufacturing PMI and US ISM Manufacturing PMI for September will be in the spotlight on Tuesday.
The Indian Rupee (INR) trades in negative territory for the third consecutive day on Tuesday. The downtick of the local currency is pressured by strong US Dollar (USD) demand from foreign banks. Additionally, the volatile crude oil prices amid rising tensions in the Middle East and the outflow of foreign funds contribute to the INR’s downside.
However, the anticipation of additional interest rate reduction by the Federal Reserve might cap the upside for the pair. Investors will keep an eye on the US ISM Manufacturing Purchasing Managers Index (PMI), which is due on Tuesday. Also, the Fed’s Raphael Bostic and Lisa Cook are scheduled to speak. On the Indian front, HSBC India Manufacturing PMI for September will be released.
Daily Digest Market Movers: Indian Rupee remains sensitive to global factors
- "The rupee, after experiencing a decent appreciation, has begun drifting back toward its typical range. This shift is driven by month-end dollar demand from importers, coupled with the RBI’s active management of the currency," said Amit Pabari, managing director at FX advisory firm CR Forex.
- India’s current account balance moved into a deficit of $9.7 billion in the April-June quarter (Q1) of 2024-25 (FY25), accounting for 1.1% of Gross Domestic Product (GDP), according to the Reserve Bank of India (RBI).
- Fed Chair Jerome Powell said on Monday that the recent half-percentage point interest rate cut shouldn’t be interpreted as a sign that future moves will be as aggressive. Powell added that further rate cuts are in the pipeline, though their size and pace would depend on the evolution of the economy.
- Powell further stated that the Fed's current goal is to support a largely healthy economy and job market, rather than rescue a struggling economy or prevent a recession.
- Interest rate futures contracts have priced in a nearly 35.4% chance of a half-point cut in November, versus a 64.6% possibility of a quarter-point cut, according to the CME FedWatch Tool.
Technical Analysis: USD/INR’s positive outlook prevails
The Indian Rupee trades on a weaker note on the day. The USD/INR pair keeps the bullish vibe on the daily timeframe as the price holds above the key 100-day Exponential Moving Average (EMA). Nonetheless, further consolidation cannot be ruled out as the 14-day Relative Strength Index (RSI) hovers around the midline, indicating neutral momentum.
The 84.00 psychological mark appears to be a tough nut to crack for USD/INR bulls. A decisive break above this level could see a rally to 84.15, the high of August 5. The next upside barrier is seen at 84.50.
On the flip side, the 100-day EMA at 83.62 acts as an initial support level for USD/INR. Extended losses could pave the way to 83.00, representing the psychological level and the low of May 24.
Indian Rupee FAQs
The Indian Rupee (INR) is one of the most sensitive currencies to external factors. The price of Crude Oil (the country is highly dependent on imported Oil), the value of the US Dollar – most trade is conducted in USD – and the level of foreign investment, are all influential. Direct intervention by the Reserve Bank of India (RBI) in FX markets to keep the exchange rate stable, as well as the level of interest rates set by the RBI, are further major influencing factors on the Rupee.
The Reserve Bank of India (RBI) actively intervenes in forex markets to maintain a stable exchange rate, to help facilitate trade. In addition, the RBI tries to maintain the inflation rate at its 4% target by adjusting interest rates. Higher interest rates usually strengthen the Rupee. This is due to the role of the ‘carry trade’ in which investors borrow in countries with lower interest rates so as to place their money in countries’ offering relatively higher interest rates and profit from the difference.
Macroeconomic factors that influence the value of the Rupee include inflation, interest rates, the economic growth rate (GDP), the balance of trade, and inflows from foreign investment. A higher growth rate can lead to more overseas investment, pushing up demand for the Rupee. A less negative balance of trade will eventually lead to a stronger Rupee. Higher interest rates, especially real rates (interest rates less inflation) are also positive for the Rupee. A risk-on environment can lead to greater inflows of Foreign Direct and Indirect Investment (FDI and FII), which also benefit the Rupee.
Higher inflation, particularly, if it is comparatively higher than India’s peers, is generally negative for the currency as it reflects devaluation through oversupply. Inflation also increases the cost of exports, leading to more Rupees being sold to purchase foreign imports, which is Rupee-negative. At the same time, higher inflation usually leads to the Reserve Bank of India (RBI) raising interest rates and this can be positive for the Rupee, due to increased demand from international investors. The opposite effect is true of lower inflation.
The latest economic assessment from the New Zealand (NZ) Treasury showed on Tuesday that they “don't expect activity to have picked up much in the latest quarter.”
Additional takeaways
The June quarter GDP fell by 0.2%, less than expected, with population growth masking economic weakness.
With a significant amount of data due in the next fortnight, we should know more about where we are at in the cycle.
Consumer and business expectations are improving, indicating a potential economic bottoming.
The current account deficit remained high at 6.7% of GDP due to slow recovery in service exports and strong import volumes.
OECD forecasts stable global growth, with easing inflation and supportive policies in China and the US.
US and China implemented policy easing to support their economies.
Market reaction
NZD/USD was last seen trading at 0.6340, down 0.09% on the day, slightly undermined by the above headlines.
- The Australian Dollar gains ground as Retail Sales exceeded the expected increase in August.
- The AUD remains solid as the RBA to keep the monetary policy restrictive in the near term.
- The US Dollar advances as Fed Chair Powell said the central bank will lower its benchmark rate ‘over time.’
The Australian Dollar (AUD) holds gains against the US Dollar (USD) on Tuesday, following better-than-expected Retail Sales data. Australian Bureau of Statistics (ABS) reported the primary gauge of Australia’s consumer spending, which rose 0.7% month-over-month in August, exceeding the market expectations of a 0.4% increase.
The AUD receives support from the hawkish sentiment surrounding the Reserve Bank of Australia (RBA) regarding its interest rate trajectory. The RBA kept its cash rate at 4.35% for a seventh consecutive meeting and stated that the policy would need to stay restrictive to ensure inflation slowed. Additionally, China’s stimulus measures have improved the demand outlook in Australia's largest trading partner, driving up commodity prices and strengthening the commodity-linked Australian Dollar.
The uptick of the AUD/USD pair could be restrained due to the stronger US Dollar (USD), which could be attributed to the latest remarks from the Federal Reserve (Fed) Chairman Jerome Powell. On Monday, Powell said that the central bank is not in a hurry and will lower its benchmark rate ‘over time.’ Fed Chair Powell added that the recent half-point interest rate cut should not be seen as an indication of similarly aggressive future actions, noting that upcoming rate changes are likely to be more modest.
Daily Digest Market Movers: Australian Dollar appreciates due to hawkish RBA’s policy outlook
- The CME FedWatch Tool indicates that markets are assigning a 61.8% probability to a 25 basis point rate cut by the Federal Reserve in November, while the likelihood of a 50-basis-point decreased to 38.2%, down from 53.3% a day ago.
- China's Caixin Manufacturing Purchasing Managers' Index (PMI) fell to 49.3 in September, indicating contraction, down from 50.4 in August. Meanwhile, China’s NBS Manufacturing PMI improved to 49.8 in September, up from 49.1 in the previous month and surpassing the market consensus of 49.5.
- St. Louis Federal Reserve President Alberto Musalem stated on Friday, according to the Financial Times, that the Fed should begin cutting interest rates "gradually" following a larger-than-usual half-point reduction at the September meeting. Musalem acknowledged the possibility of the economy weakening more than anticipated, saying, "If that were the case, then a faster pace of rate reductions might be appropriate."
- On Friday, the US Core Personal Consumption Expenditures (PCE) Price Index for August, increased by 0.1% MoM, falling short of the expected 0.2% rise, aligning with the Federal Reserve's outlook that inflation is easing in the US economy. This has reinforced the possibility of an aggressive rate-cutting cycle by the Fed.
- During his China visit, Australian Treasurer Jim Chalmers had candid and productive discussions with the National Development and Reform Commission (NDRC). Chalmers highlighted China's economic slowdown as a key factor in weaker global growth while welcoming the country's new stimulus measures as a "really welcome development."
- China plans to inject over CNY 1 trillion in capital into its largest state banks, facing challenges such as shrinking margins, declining profits, and increasing bad loans. This substantial capital infusion would mark the first of its kind since the 2008 global financial crisis.
- According to the Reserve Bank of Australia's Financial Stability Review from September 2024, the Australian financial system remains resilient, with risks largely contained. However, notable concerns include stress in China's financial sector and the limited response from Beijing to address these issues. Domestically, a small but growing portion of Australian home borrowers are falling behind on their payments, though only about 2% of owner-occupier borrowers are at serious risk of default.
Technical Analysis: Australian Dollar holds position above 0.6900, lower boundary of an ascending channel
The AUD/USD pair trades near 0.6930 on Tuesday. A daily chart technical analysis shows that the pair is trending upwards within an ascending channel. The pair has held above the lower boundary of the channel, suggesting that the bullish bias remains intact. Moreover, the 14-day Relative Strength Index (RSI) is slightly below the 70 level, reinforcing the positive momentum.
In terms of resistance, the AUD/USD pair may aim for the area near the upper boundary of the ascending channel, around the 0.7020 level. A successful break above the ascending channel could indicate further bullish momentum. However, if the pair fails to breach this resistance, a pullback within the channel is possible.
On the downside, the immediate support appears at the lower boundary of the ascending channel around the level of 0.6890, followed by the nine-day Exponential Moving Average (EMA) at the 0.6866 level. A break below this EMA could weaken the bullish bias and lead the AUD/USD pair to navigate the region around its six-week low of 0.6622.
AUD/USD: Daily Chart
Australian Dollar PRICE Today
The table below shows the percentage change of Australian Dollar (AUD) against listed major currencies today. Australian Dollar was the strongest against the Japanese Yen.
| USD | EUR | GBP | JPY | CAD | AUD | NZD | CHF | |
|---|---|---|---|---|---|---|---|---|
| USD | -0.05% | -0.09% | 0.16% | -0.03% | -0.25% | 0.04% | -0.07% | |
| EUR | 0.05% | -0.04% | 0.22% | 0.02% | -0.19% | 0.12% | -0.03% | |
| GBP | 0.09% | 0.04% | 0.27% | 0.06% | -0.16% | 0.17% | 0.02% | |
| JPY | -0.16% | -0.22% | -0.27% | -0.18% | -0.41% | -0.10% | -0.23% | |
| CAD | 0.03% | -0.02% | -0.06% | 0.18% | -0.21% | 0.10% | -0.04% | |
| AUD | 0.25% | 0.19% | 0.16% | 0.41% | 0.21% | 0.31% | 0.16% | |
| NZD | -0.04% | -0.12% | -0.17% | 0.10% | -0.10% | -0.31% | -0.14% | |
| CHF | 0.07% | 0.03% | -0.02% | 0.23% | 0.04% | -0.16% | 0.14% |
The heat map shows percentage changes of major currencies against each other. The base currency is picked from the left column, while the quote currency is picked from the top row. For example, if you pick the Australian Dollar from the left column and move along the horizontal line to the US Dollar, the percentage change displayed in the box will represent AUD (base)/USD (quote).
Australian Dollar FAQs
One of the most significant factors for the Australian Dollar (AUD) is the level of interest rates set by the Reserve Bank of Australia (RBA). Because Australia is a resource-rich country another key driver is the price of its biggest export, Iron Ore. The health of the Chinese economy, its largest trading partner, is a factor, as well as inflation in Australia, its growth rate and Trade Balance. Market sentiment – whether investors are taking on more risky assets (risk-on) or seeking safe-havens (risk-off) – is also a factor, with risk-on positive for AUD.
The Reserve Bank of Australia (RBA) influences the Australian Dollar (AUD) by setting the level of interest rates that Australian banks can lend to each other. This influences the level of interest rates in the economy as a whole. The main goal of the RBA is to maintain a stable inflation rate of 2-3% by adjusting interest rates up or down. Relatively high interest rates compared to other major central banks support the AUD, and the opposite for relatively low. The RBA can also use quantitative easing and tightening to influence credit conditions, with the former AUD-negative and the latter AUD-positive.
China is Australia’s largest trading partner so the health of the Chinese economy is a major influence on the value of the Australian Dollar (AUD). When the Chinese economy is doing well it purchases more raw materials, goods and services from Australia, lifting demand for the AUD, and pushing up its value. The opposite is the case when the Chinese economy is not growing as fast as expected. Positive or negative surprises in Chinese growth data, therefore, often have a direct impact on the Australian Dollar and its pairs.
Iron Ore is Australia’s largest export, accounting for $118 billion a year according to data from 2021, with China as its primary destination. The price of Iron Ore, therefore, can be a driver of the Australian Dollar. Generally, if the price of Iron Ore rises, AUD also goes up, as aggregate demand for the currency increases. The opposite is the case if the price of Iron Ore falls. Higher Iron Ore prices also tend to result in a greater likelihood of a positive Trade Balance for Australia, which is also positive of the AUD.
The Trade Balance, which is the difference between what a country earns from its exports versus what it pays for its imports, is another factor that can influence the value of the Australian Dollar. If Australia produces highly sought after exports, then its currency will gain in value purely from the surplus demand created from foreign buyers seeking to purchase its exports versus what it spends to purchase imports. Therefore, a positive net Trade Balance strengthens the AUD, with the opposite effect if the Trade Balance is negative.
Australia’s Retail Sales, a measure of the country’s consumer spending, rose 0.7% MoM in August after staying unchanged in July, the official data published by the Australian Bureau of Statistics (ABS) showed on Tuesday.
The reading came in above the market expectations of a 0.4% growth.
Market reaction to Australia’s Retail Sales data
At the time of writing, the AUD/USD pair is up 0.13% on the day at 0.6922.
Australian Dollar FAQs
One of the most significant factors for the Australian Dollar (AUD) is the level of interest rates set by the Reserve Bank of Australia (RBA). Because Australia is a resource-rich country another key driver is the price of its biggest export, Iron Ore. The health of the Chinese economy, its largest trading partner, is a factor, as well as inflation in Australia, its growth rate and Trade Balance. Market sentiment – whether investors are taking on more risky assets (risk-on) or seeking safe-havens (risk-off) – is also a factor, with risk-on positive for AUD.
The Reserve Bank of Australia (RBA) influences the Australian Dollar (AUD) by setting the level of interest rates that Australian banks can lend to each other. This influences the level of interest rates in the economy as a whole. The main goal of the RBA is to maintain a stable inflation rate of 2-3% by adjusting interest rates up or down. Relatively high interest rates compared to other major central banks support the AUD, and the opposite for relatively low. The RBA can also use quantitative easing and tightening to influence credit conditions, with the former AUD-negative and the latter AUD-positive.
China is Australia’s largest trading partner so the health of the Chinese economy is a major influence on the value of the Australian Dollar (AUD). When the Chinese economy is doing well it purchases more raw materials, goods and services from Australia, lifting demand for the AUD, and pushing up its value. The opposite is the case when the Chinese economy is not growing as fast as expected. Positive or negative surprises in Chinese growth data, therefore, often have a direct impact on the Australian Dollar and its pairs.
Iron Ore is Australia’s largest export, accounting for $118 billion a year according to data from 2021, with China as its primary destination. The price of Iron Ore, therefore, can be a driver of the Australian Dollar. Generally, if the price of Iron Ore rises, AUD also goes up, as aggregate demand for the currency increases. The opposite is the case if the price of Iron Ore falls. Higher Iron Ore prices also tend to result in a greater likelihood of a positive Trade Balance for Australia, which is also positive of the AUD.
The Trade Balance, which is the difference between what a country earns from its exports versus what it pays for its imports, is another factor that can influence the value of the Australian Dollar. If Australia produces highly sought after exports, then its currency will gain in value purely from the surplus demand created from foreign buyers seeking to purchase its exports versus what it spends to purchase imports. Therefore, a positive net Trade Balance strengthens the AUD, with the opposite effect if the Trade Balance is negative.
- USD/JPY attracts some follow-through buyers for the second straight day on Tuesday.
- Fed Chair Powell’s hawkish remarks on Monday underpin the USD and lend support.
- The uncertainty over the BoJ’s rate-hike path contributes to the modest intraday uptick.
The USD/JPY pair is seen building on the overnight goodish bounce from the 141.65 area, or a nearly two-week low and gaining traction for the second straight day on Tuesday. The move-up lifts spot prices beyond the 144.00 mark during the Asian session and is sponsored by a combination of factors.
The US Dollar (USD) draws support from the Federal Reserve (Fed) Chair Jerome Powell's relatively hawkish tone on Monday, which forced investors to scale back their bets for another oversized rate cut in November. The Japanese Yen (JPY), on the other hand, remains on the defensive in the wake of comments from Japan's incoming Prime Minister (PM) Shigeru Ishiba, saying that the Bank of Japan's (BoJ) monetary policy must remain accommodative to underpin a fragile economic recovery.
Furthermore, Ishiba said on Monday that he intends to call a general election on October 27. Apart from this, the underlying bullish sentiment across the global financial markets is seen undermining demand for the safe-haven JPY and acting as a tailwind for the USD/JPY pair. The JPY bulls remained on the sidelines after BoJ's Summary of Opinions from its September meeting revealed that the central bank will adjust its accommodative stance if economic conditions improve.
On the economic data front, Japan's Unemployment rate fell more than expected, to 2.5% in August from 2.7% in the previous month. Adding to this, a closely watched BoJ's Tankan survey showed that sentiment among Japan's big manufacturers was steady in the three months to September and a slight improvement in large non-manufacturers' mood. This, however, does little to provide any impetus to the JPY or the USD/JPY pair, supporting prospects for further intraday gains.
Market participants now look to the US economic docket – featuring the release of the ISM Manufacturing PMI and JOLTS Job Openings data. This, along with speeches by influential FOMC members, will drive the USD demand and produce short-term trading opportunities around the USD/JPY pair. Apart from this, important US macro releases scheduled at the start of a new month, including the Nonfarm Payrolls (NFP) report, should determine the next leg of a directional move.
Economic Indicator
BoJ Summary of Opinions
This report includes the BOJ's projection for inflation and economic growth. It is scheduled 8 times per year, about 10 days after the Monetary Policy Statement is released.
Read more.Last release: Mon Sep 30, 2024 23:50
Frequency: Irregular
Actual: -
Consensus: -
Previous: -
Source: Bank of Japan
Japan’s Finance Minister Shunichi Suzuki said on Tuesday that the foreign exchange (FX) level should be determined by markets.
Key quotes
FX interventions during the term were significant decisions, were meaningful.
FX intervention should be infrequent.
The aim is for economic growth combined with fiscal health.
A weak yen has positive and negative impacts on the economy.
Market reaction
At the time of writing, USD/JPY is trading 0.24% higher on the day at 144.0.
Japanese Yen FAQs
The Japanese Yen (JPY) is one of the world’s most traded currencies. Its value is broadly determined by the performance of the Japanese economy, but more specifically by the Bank of Japan’s policy, the differential between Japanese and US bond yields, or risk sentiment among traders, among other factors.
One of the Bank of Japan’s mandates is currency control, so its moves are key for the Yen. The BoJ has directly intervened in currency markets sometimes, generally to lower the value of the Yen, although it refrains from doing it often due to political concerns of its main trading partners. The BoJ ultra-loose monetary policy between 2013 and 2024 caused the Yen to depreciate against its main currency peers due to an increasing policy divergence between the Bank of Japan and other main central banks. More recently, the gradually unwinding of this ultra-loose policy has given some support to the Yen.
Over the last decade, the BoJ’s stance of sticking to ultra-loose monetary policy has led to a widening policy divergence with other central banks, particularly with the US Federal Reserve. This supported a widening of the differential between the 10-year US and Japanese bonds, which favored the US Dollar against the Japanese Yen. The BoJ decision in 2024 to gradually abandon the ultra-loose policy, coupled with interest-rate cuts in other major central banks, is narrowing this differential.
The Japanese Yen is often seen as a safe-haven investment. This means that in times of market stress, investors are more likely to put their money in the Japanese currency due to its supposed reliability and stability. Turbulent times are likely to strengthen the Yen’s value against other currencies seen as more risky to invest in.
- NZD/USD loses ground near 0.6340 in Tuesday’s early Asian session.
- Fed’s Powell said the central bank is not in a hurry to cut rates quickly, will be guided by data.
- The Chinese fresh stimulus measure might cap the downside for the Kiwi.
The NZD/USD pair trades on a softer note around 0.6340, snapping the three-day winning streak during the early Asian session on Tuesday. The modest rebound in the US Dollar (USD) after US Federal Reserve (Fed) Chair Jerome Powell’s speech weighs on the pair. Investors will keep an eye on the US September ISM Manufacturing Purchasing Managers Index (PMI), which is due on Tuesday.
Fed’s Powell on Monday signaled that additional rate cuts are in the pipeline, though their size and pace would depend on the evolution of the economy. Powell further stated that the Fed's current goal is to support a largely healthy economy and job market, rather than rescue a struggling economy or prevent a recession.
Interest rate futures contracts have priced in a nearly 35.4% chance of a half-point cut in November, versus a 64.6% possibility of a quarter-point cut, according to the CME FedWatch Tool. The US September labor market data will be closely watched on Friday. The US economy is expected to see 140K job additions in September, while the Unemployment Rate is projected to remain unchanged at 4.2%.
On the Kiwi front, optimism over more stimulus from China might cap the downside of the New Zealand Dollar (NZD). China's central bank stated that it would tell banks to lower mortgage rates for existing home loans before October 31, as part of sweeping policies to support the country's beleaguered property market. This, in turn, acts as a tailwind for NZD/USD as China is the largest export partner of New Zealand.
New Zealand Dollar FAQs
The New Zealand Dollar (NZD), also known as the Kiwi, is a well-known traded currency among investors. Its value is broadly determined by the health of the New Zealand economy and the country’s central bank policy. Still, there are some unique particularities that also can make NZD move. The performance of the Chinese economy tends to move the Kiwi because China is New Zealand’s biggest trading partner. Bad news for the Chinese economy likely means less New Zealand exports to the country, hitting the economy and thus its currency. Another factor moving NZD is dairy prices as the dairy industry is New Zealand’s main export. High dairy prices boost export income, contributing positively to the economy and thus to the NZD.
The Reserve Bank of New Zealand (RBNZ) aims to achieve and maintain an inflation rate between 1% and 3% over the medium term, with a focus to keep it near the 2% mid-point. To this end, the bank sets an appropriate level of interest rates. When inflation is too high, the RBNZ will increase interest rates to cool the economy, but the move will also make bond yields higher, increasing investors’ appeal to invest in the country and thus boosting NZD. On the contrary, lower interest rates tend to weaken NZD. The so-called rate differential, or how rates in New Zealand are or are expected to be compared to the ones set by the US Federal Reserve, can also play a key role in moving the NZD/USD pair.
Macroeconomic data releases in New Zealand are key to assess the state of the economy and can impact the New Zealand Dollar’s (NZD) valuation. A strong economy, based on high economic growth, low unemployment and high confidence is good for NZD. High economic growth attracts foreign investment and may encourage the Reserve Bank of New Zealand to increase interest rates, if this economic strength comes together with elevated inflation. Conversely, if economic data is weak, NZD is likely to depreciate.
The New Zealand Dollar (NZD) tends to strengthen during risk-on periods, or when investors perceive that broader market risks are low and are optimistic about growth. This tends to lead to a more favorable outlook for commodities and so-called ‘commodity currencies’ such as the Kiwi. Conversely, NZD tends to weaken at times of market turbulence or economic uncertainty as investors tend to sell higher-risk assets and flee to the more-stable safe havens.
| Index | Change, points | Closed | Change, % |
|---|---|---|---|
| NIKKEI 225 | -1910.01 | 37919.55 | -4.8 |
| Hang Seng | 501.38 | 21133.68 | 2.43 |
| KOSPI | -56.51 | 2593.27 | -2.13 |
| ASX 200 | 57.6 | 8269.8 | 0.7 |
| DAX | -148.7 | 19324.93 | -0.76 |
| CAC 40 | -156.04 | 7635.75 | -2 |
| Dow Jones | 17.15 | 42330.15 | 0.04 |
| S&P 500 | 24.31 | 5762.48 | 0.42 |
| NASDAQ Composite | 69.58 | 18189.17 | 0.38 |
| Pare | Closed | Change, % |
|---|---|---|
| AUDUSD | 0.69134 | 0.01 |
| EURJPY | 159.888 | 0.45 |
| EURUSD | 1.11346 | -0.3 |
| GBPJPY | 192.027 | 0.72 |
| GBPUSD | 1.33718 | -0.04 |
| NZDUSD | 0.6344 | -0.04 |
| USDCAD | 1.35249 | 0.11 |
| USDCHF | 0.84552 | 0.6 |
| USDJPY | 143.595 | 0.75 |
The Bank of Japan (BoJ) published the Summary of Opinions from its September monetary policy meeting on September 19 and 20, with the key findings noted below.
Key quotes
Japan's economy has been recovering moderately, with steady price rises.
Economic activity and prices are generally on track, with moderate growth expected.
Concerns exist regarding the impact of U.S. economic uncertainties on Japan, including exchange rates and corporate profits.
The Bank will maintain its current accommodative stance but will adjust if economic conditions improve.
There are no immediate plans for further rate hikes, emphasizing stability and careful communication.
Market reaction
Following the BoJ’s Summary of Opinions, the USD/JPY pair is gaining 0.08% on the day to trade at 143.75, as of writing.
Bank of Japan FAQs
The Bank of Japan (BoJ) is the Japanese central bank, which sets monetary policy in the country. Its mandate is to issue banknotes and carry out currency and monetary control to ensure price stability, which means an inflation target of around 2%.
The Bank of Japan embarked in an ultra-loose monetary policy in 2013 in order to stimulate the economy and fuel inflation amid a low-inflationary environment. The bank’s policy is based on Quantitative and Qualitative Easing (QQE), or printing notes to buy assets such as government or corporate bonds to provide liquidity. In 2016, the bank doubled down on its strategy and further loosened policy by first introducing negative interest rates and then directly controlling the yield of its 10-year government bonds. In March 2024, the BoJ lifted interest rates, effectively retreating from the ultra-loose monetary policy stance.
The Bank’s massive stimulus caused the Yen to depreciate against its main currency peers. This process exacerbated in 2022 and 2023 due to an increasing policy divergence between the Bank of Japan and other main central banks, which opted to increase interest rates sharply to fight decades-high levels of inflation. The BoJ’s policy led to a widening differential with other currencies, dragging down the value of the Yen. This trend partly reversed in 2024, when the BoJ decided to abandon its ultra-loose policy stance.
A weaker Yen and the spike in global energy prices led to an increase in Japanese inflation, which exceeded the BoJ’s 2% target. The prospect of rising salaries in the country – a key element fuelling inflation – also contributed to the move.


© 2000-2026. Sva prava zaštićena.
Sajt je vlasništvo kompanije Teletrade D.J. LLC 2351 LLC 2022 (Euro House, Richmond Hill Road, Kingstown, VC0100, St. Vincent and the Grenadines).
Svi podaci koji se nalaze na sajtu ne predstavljaju osnovu za donošenje investicionih odluka, već su informativnog karaktera.
The company does not serve or provide services to customers who are residents of the US, Canada, Iran, The Democratic People's Republic of Korea, Yemen and FATF blacklisted countries.
Izvršenje trgovinskih operacija sa finansijskim instrumentima upotrebom marginalne trgovine pruža velike mogućnosti i omogućava investitorima ostvarivanje visokih prihoda. Međutim, takav vid trgovine povezan je sa potencijalno visokim nivoom rizika od gubitka sredstava. Проведение торговых операций на финанcовых рынках c маржинальными финанcовыми инcтрументами открывает широкие возможноcти, и позволяет инвеcторам, готовым пойти на риcк, получать выcокую прибыль, но при этом неcет в cебе потенциально выcокий уровень риcка получения убытков. Iz tog razloga je pre započinjanja trgovine potrebno odlučiti o izboru odgovarajuće investicione strategije, uzimajući u obzir raspoložive resurse.
Upotreba informacija: U slučaju potpunog ili delimičnog preuzimanja i daljeg korišćenja materijala koji se nalazi na sajtu, potrebno je navesti link odgovarajuće stranice na sajtu kompanije TeleTrade-a kao izvora informacija. Upotreba materijala na internetu mora biti praćena hiper linkom do web stranice teletrade.org. Automatski uvoz materijala i informacija sa stranice je zabranjen.
Ako imate bilo kakvih pitanja, obratite nam se pr@teletrade.global.
транcфери