- Analiza
- Novosti i instrumenti
- Vesti sa tržišta
- GBP/JPY Price Forecast: Retreats below 193.50 after struggling near 195.00
GBP/JPY Price Forecast: Retreats below 193.50 after struggling near 195.00
- GBP/JPY falls to 193.28, ending three-day rally after failing to surpass 195.00 and 200-day SMA at 194.18.
- Trading sideways; support at 193.23 (100-day SMA) and 192.28 (Senkou Span B) maintains range-bound status.
- Break below 192.28 could target 191.83 (Tenkan-sen); push above 194.89 may challenge 195.00 resistance.
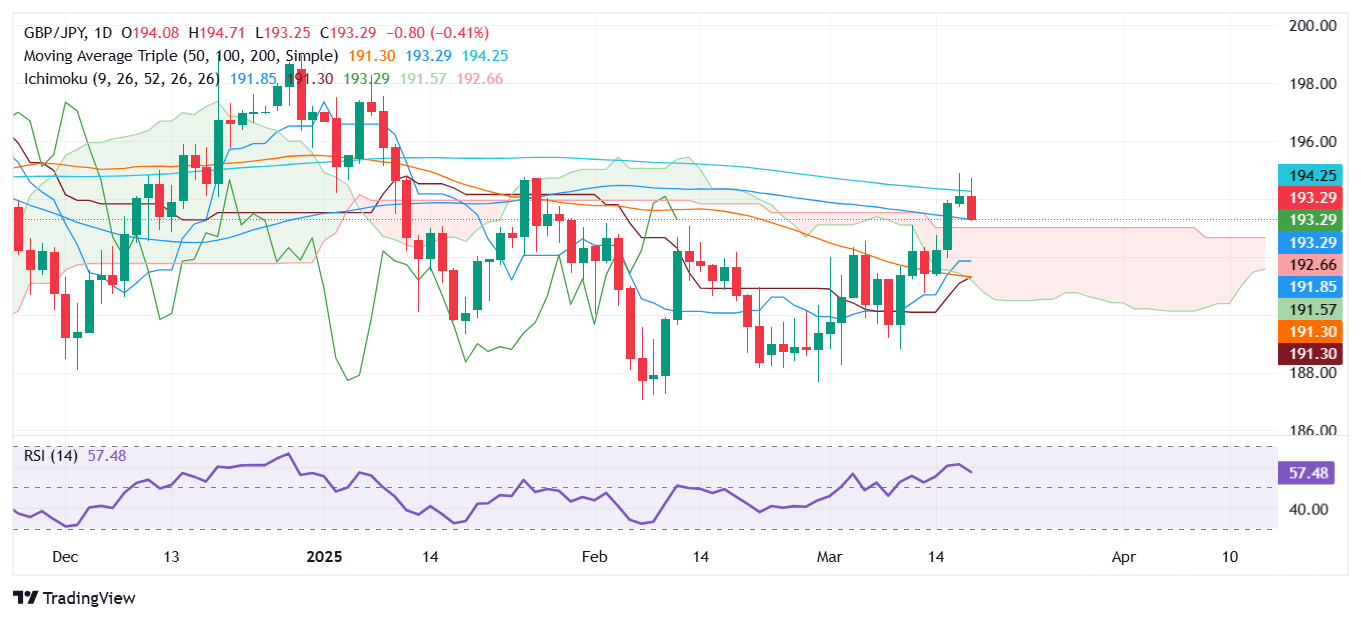
The GBP/JPY retreats after rallying for three straight trading days since last Friday. However, it struggled to clear the 195.00 figure and the 200-day Simple Moving Average (SMA), which exacerbated a drop in the cross pair beneath the 193.50 area. At the time of writing, the pair hovers near 193.28, virtually unchanged.
GBP/JPY Price Forecast: Technical outlook
The GBP/JPY trades sideways for the second straight day, capped on the downside by the 100-day Simple Moving Average (SMA) at 193.23 and the Senkou Span B near 192.28. On the top side, the 200-day SMA at 194.18 would likely keep the pair trading range bound.
Additionally, despite being bullish, the Relative Strength Index (RSI) is flat. Hence, buyers and sellers lack the strength to break the trading range.
If GBP/JPY falls below 192.28, the next support would be the Tenkan-sen at 191.83, followed by the Kijun-sen at 191.24. Conversely, if GBP/JPY climbs past the 200-day SMA, the next resistance would be the March 18 peak at 194.89, ahead of 195.00.
GBP/JPY Price Chart – Daily
British Pound PRICE This week
The table below shows the percentage change of British Pound (GBP) against listed major currencies this week. British Pound was the strongest against the US Dollar.
| USD | EUR | GBP | JPY | CAD | AUD | NZD | CHF | |
|---|---|---|---|---|---|---|---|---|
| USD | -0.28% | -0.54% | -0.10% | -0.44% | -0.46% | -1.27% | -0.94% | |
| EUR | 0.28% | -0.38% | -0.21% | -0.15% | -0.31% | -1.00% | -0.68% | |
| GBP | 0.54% | 0.38% | 0.48% | 0.02% | 0.05% | -0.63% | -0.37% | |
| JPY | 0.10% | 0.21% | -0.48% | -0.34% | -0.56% | -1.12% | -0.96% | |
| CAD | 0.44% | 0.15% | -0.02% | 0.34% | -0.20% | -0.82% | -1.05% | |
| AUD | 0.46% | 0.31% | -0.05% | 0.56% | 0.20% | -0.67% | -0.35% | |
| NZD | 1.27% | 1.00% | 0.63% | 1.12% | 0.82% | 0.67% | 0.32% | |
| CHF | 0.94% | 0.68% | 0.37% | 0.96% | 1.05% | 0.35% | -0.32% |
The heat map shows percentage changes of major currencies against each other. The base currency is picked from the left column, while the quote currency is picked from the top row. For example, if you pick the British Pound from the left column and move along the horizontal line to the US Dollar, the percentage change displayed in the box will represent GBP (base)/USD (quote).


© 2000-2026. Sva prava zaštićena.
Sajt je vlasništvo kompanije Teletrade D.J. LLC 2351 LLC 2022 (Euro House, Richmond Hill Road, Kingstown, VC0100, St. Vincent and the Grenadines).
Svi podaci koji se nalaze na sajtu ne predstavljaju osnovu za donošenje investicionih odluka, već su informativnog karaktera.
The company does not serve or provide services to customers who are residents of the US, Canada, Iran, The Democratic People's Republic of Korea, Yemen and FATF blacklisted countries.
Izvršenje trgovinskih operacija sa finansijskim instrumentima upotrebom marginalne trgovine pruža velike mogućnosti i omogućava investitorima ostvarivanje visokih prihoda. Međutim, takav vid trgovine povezan je sa potencijalno visokim nivoom rizika od gubitka sredstava. Проведение торговых операций на финанcовых рынках c маржинальными финанcовыми инcтрументами открывает широкие возможноcти, и позволяет инвеcторам, готовым пойти на риcк, получать выcокую прибыль, но при этом неcет в cебе потенциально выcокий уровень риcка получения убытков. Iz tog razloga je pre započinjanja trgovine potrebno odlučiti o izboru odgovarajuće investicione strategije, uzimajući u obzir raspoložive resurse.
Upotreba informacija: U slučaju potpunog ili delimičnog preuzimanja i daljeg korišćenja materijala koji se nalazi na sajtu, potrebno je navesti link odgovarajuće stranice na sajtu kompanije TeleTrade-a kao izvora informacija. Upotreba materijala na internetu mora biti praćena hiper linkom do web stranice teletrade.org. Automatski uvoz materijala i informacija sa stranice je zabranjen.
Ako imate bilo kakvih pitanja, obratite nam se pr@teletrade.global.
транcфери