- Analiza
- Novosti i instrumenti
- Vesti sa tržišta
- EUR/USD Price Analysis: Rises above 1.0850 while remaining in overbought territory
EUR/USD Price Analysis: Rises above 1.0850 while remaining in overbought territory
- EUR/USD moves below an ascending channel pattern, suggesting a bearish momentum shift.
- The 14-day RSI holding above the 70 mark signals a potential downward correction.
- The pair may find its primary support at the nine-day EMA of 1.0716 level,
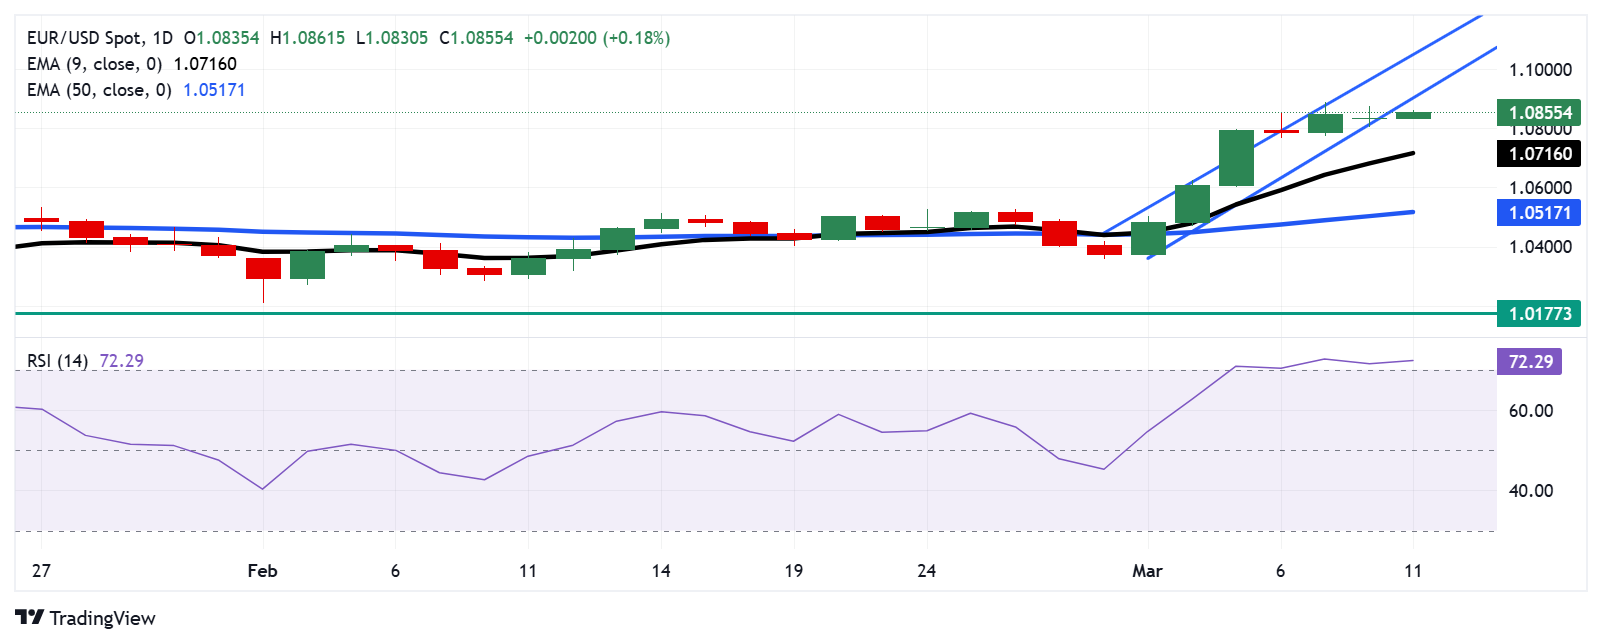
The EUR/USD pair gains ground for the third successive session, trading around 1.0860 during the Asian hours on Tuesday. A technical examination of the daily chart indicates a bearish breakout as the pair breaks below an ascending channel pattern, suggesting a shift in momentum from buyers to sellers.
Additionally, the 14-day Relative Strength Index (RSI), a key momentum indicator, is positioned slightly above 70, indicating an overbought situation and downward correction for the EUR/USD pair. However, the pair remains above both the nine-day and 14-day Exponential Moving Averages (EMAs), reinforcing strong short-term momentum.
A successful return to the ascending channel could reinforce the bullish bias and support the EUR/USD pair to explore the region around the upper boundary of the ascending channel at the 1.1050 level.
On the downside, the EUR/USD pair could find the primary support at the nine-day EMA of 1.0716 level, followed by the 50-day EMA at 1.0517 level. A break below this level would weaken the short-term price momentum and put downward pressure on the pair to navigate the area around the 1.0177 level—the lowest since November 2022, last recorded on January 1.
EUR/USD: Daily Chart
Euro PRICE Today
The table below shows the percentage change of Euro (EUR) against listed major currencies today. Euro was the strongest against the New Zealand Dollar.
| USD | EUR | GBP | JPY | CAD | AUD | NZD | CHF | |
|---|---|---|---|---|---|---|---|---|
| USD | -0.17% | -0.12% | -0.19% | -0.06% | 0.04% | 0.08% | -0.22% | |
| EUR | 0.17% | 0.07% | 0.02% | 0.12% | 0.22% | 0.26% | -0.04% | |
| GBP | 0.12% | -0.07% | -0.06% | 0.05% | 0.16% | 0.20% | -0.09% | |
| JPY | 0.19% | -0.02% | 0.06% | 0.13% | 0.23% | 0.27% | -0.02% | |
| CAD | 0.06% | -0.12% | -0.05% | -0.13% | 0.11% | 0.14% | -0.15% | |
| AUD | -0.04% | -0.22% | -0.16% | -0.23% | -0.11% | 0.05% | -0.25% | |
| NZD | -0.08% | -0.26% | -0.20% | -0.27% | -0.14% | -0.05% | -0.29% | |
| CHF | 0.22% | 0.04% | 0.09% | 0.02% | 0.15% | 0.25% | 0.29% |
The heat map shows percentage changes of major currencies against each other. The base currency is picked from the left column, while the quote currency is picked from the top row. For example, if you pick the Euro from the left column and move along the horizontal line to the US Dollar, the percentage change displayed in the box will represent EUR (base)/USD (quote).


© 2000-2026. Sva prava zaštićena.
Sajt je vlasništvo kompanije Teletrade D.J. LLC 2351 LLC 2022 (Euro House, Richmond Hill Road, Kingstown, VC0100, St. Vincent and the Grenadines).
Svi podaci koji se nalaze na sajtu ne predstavljaju osnovu za donošenje investicionih odluka, već su informativnog karaktera.
The company does not serve or provide services to customers who are residents of the US, Canada, Iran, The Democratic People's Republic of Korea, Yemen and FATF blacklisted countries.
Izvršenje trgovinskih operacija sa finansijskim instrumentima upotrebom marginalne trgovine pruža velike mogućnosti i omogućava investitorima ostvarivanje visokih prihoda. Međutim, takav vid trgovine povezan je sa potencijalno visokim nivoom rizika od gubitka sredstava. Проведение торговых операций на финанcовых рынках c маржинальными финанcовыми инcтрументами открывает широкие возможноcти, и позволяет инвеcторам, готовым пойти на риcк, получать выcокую прибыль, но при этом неcет в cебе потенциально выcокий уровень риcка получения убытков. Iz tog razloga je pre započinjanja trgovine potrebno odlučiti o izboru odgovarajuće investicione strategije, uzimajući u obzir raspoložive resurse.
Upotreba informacija: U slučaju potpunog ili delimičnog preuzimanja i daljeg korišćenja materijala koji se nalazi na sajtu, potrebno je navesti link odgovarajuće stranice na sajtu kompanije TeleTrade-a kao izvora informacija. Upotreba materijala na internetu mora biti praćena hiper linkom do web stranice teletrade.org. Automatski uvoz materijala i informacija sa stranice je zabranjen.
Ako imate bilo kakvih pitanja, obratite nam se pr@teletrade.global.
транcфери