- Analiza
- Novosti i instrumenti
- Vesti sa tržišta
- US Dollar Index (DXY) Price Forecast: Hangs near multi-month low, around mid-103.00s
US Dollar Index (DXY) Price Forecast: Hangs near multi-month low, around mid-103.00s
- USD remains under some selling pressure for the fifth straight day on Monday.
- Fed rate cut bets drag the US bond yields lower and undermine the Greenback.
- The recent break below the 200-day SMA supports prospects for further losses.
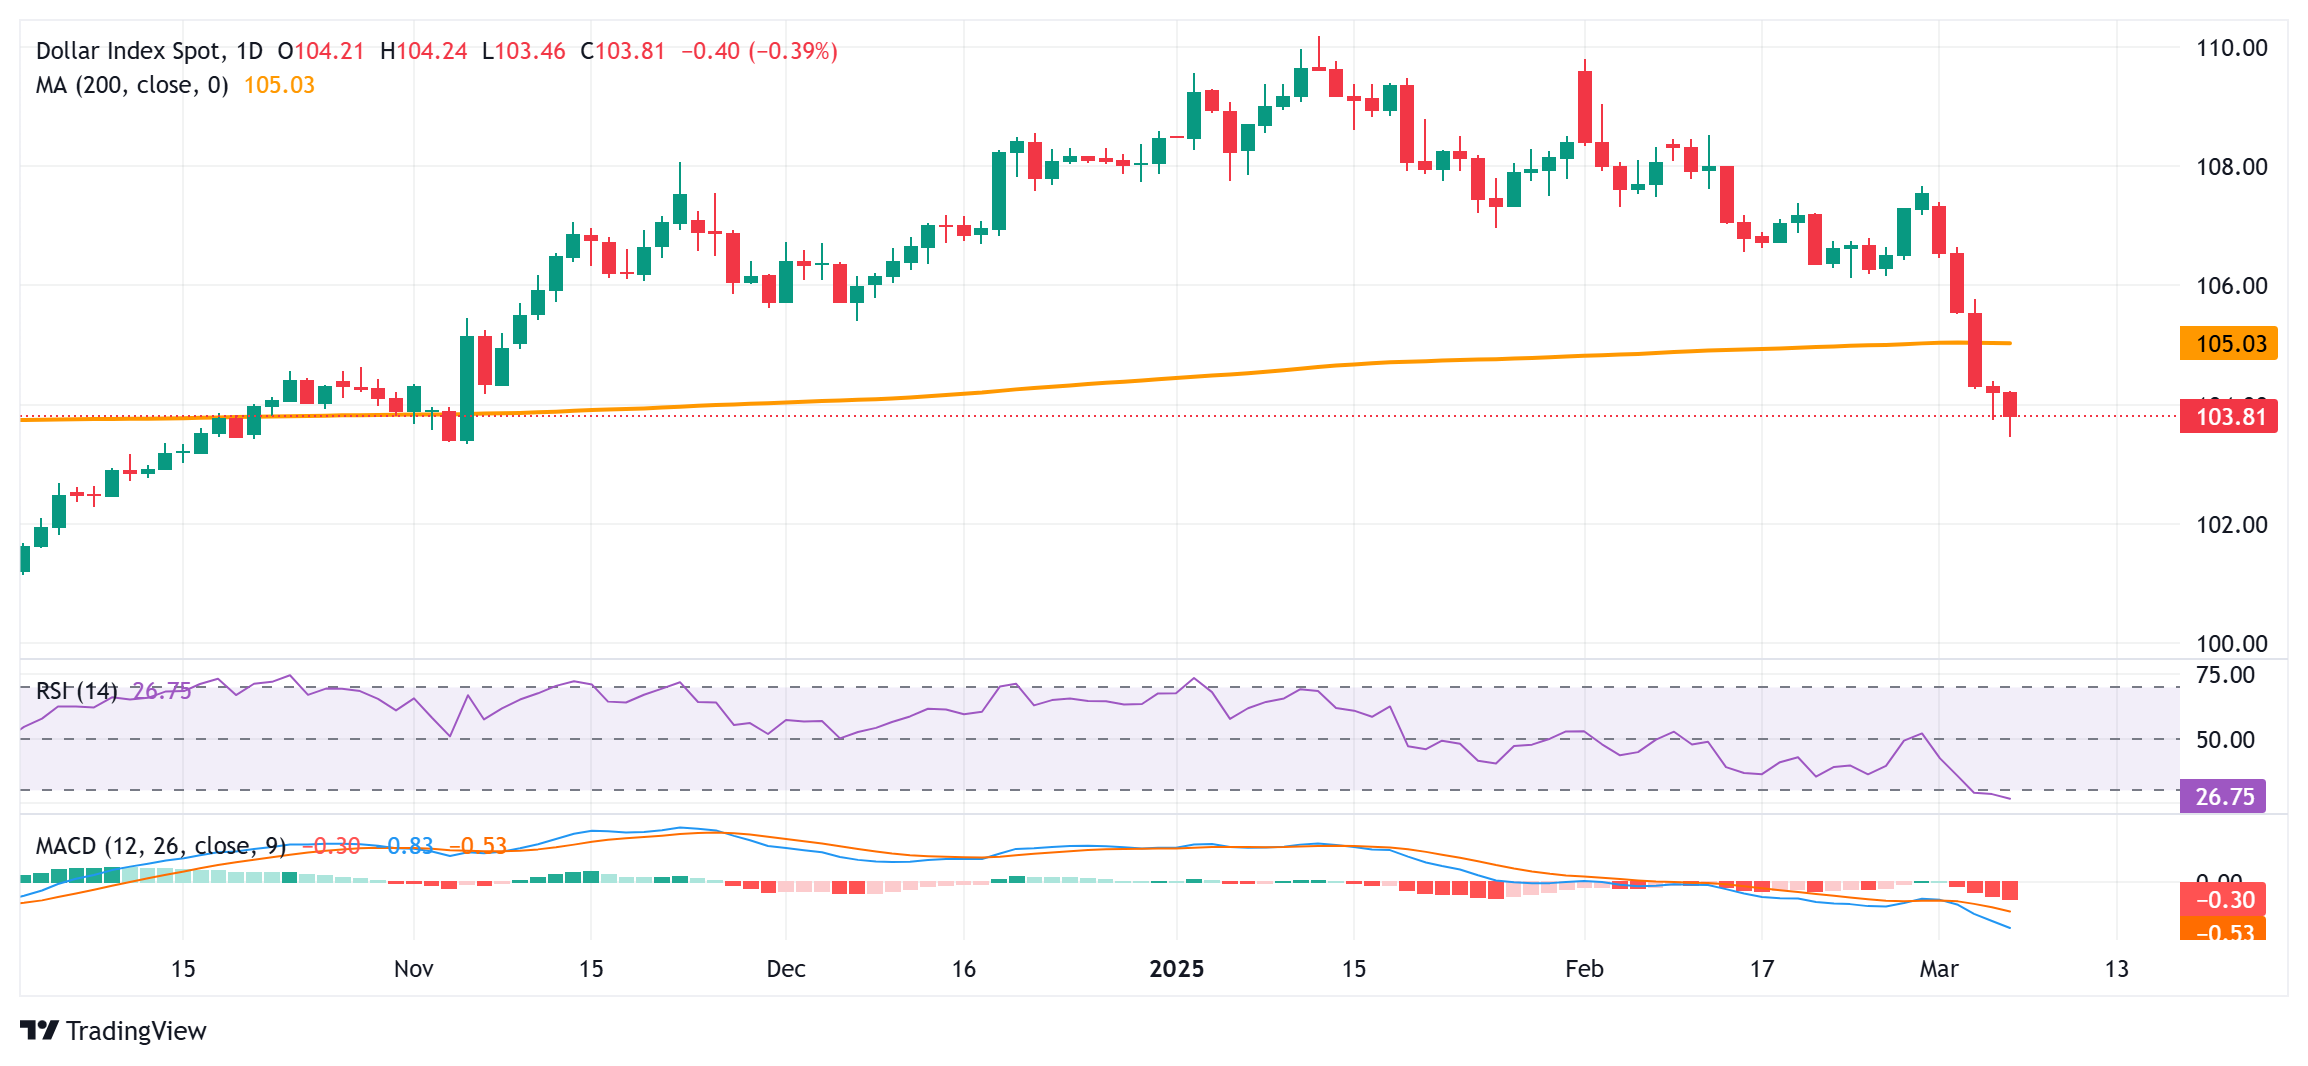
The US Dollar Index (DXY), which tracks the Greenback against a basket of currencies, adds to last week's heavy losses and attracts some follow-through sellers for the fifth successive day on Monday. The downward trajectory drags the index to its lowest level since early November, around the 103.45 region, during the Asian session and validates the recent breakdown below the very important 200-day Simple Moving Average (SMA).
The weaker-than-expected US monthly employment details released on Friday reaffirmed market bets that the Federal Reserve (Fed) will cut interest rates multiple times this year, which triggers a fresh leg down in the US Treasury bond yields. Apart from this, worries that US President Donald Trump's trade policies might slow the US economic activity exert some downward pressure on the USD.
That said, the Relative Strength Index (RSI) on the daily chart has slipped below the 30 mark and points to slightly oversold conditions and warrants caution for bearish traders. This, in turn, makes it prudent to wait for some near-term consolidation or a modest bounce before positioning further losses. Any attempted recovery beyond the 104.00 mark could be seen as a selling opportunity near the 104.40 area.
This, in turn, should keep a lid on the USD near the 105.00 psychological mark, or the 200-day SMA. The latter should act as a key pivotal point, which if cleared decisively could suggest that the USD has formed a near-term bottom and trigger a short-covering rally towards the 105.75-105.80 region en route to the 106.00-106.10 horizontal support breakpoint, now turned resistance.
On the flip side, acceptance below the 103.40-103.35 area, or the November 2024 swing low, would be seen as a fresh trigger for bearish traders and drag the USD towards the 103.00 round figure. The downward trajectory could extend further towards the next relevant support near the 102.50-102.45 region before the index weakens below the 102.00 mark, towards testing the 101.85-101.80 support zone.
US Dollar Index (DXY) daily chart
US Dollar PRICE This month
The table below shows the percentage change of US Dollar (USD) against listed major currencies this month. US Dollar was the strongest against the Canadian Dollar.
| USD | EUR | GBP | JPY | CAD | AUD | NZD | CHF | |
|---|---|---|---|---|---|---|---|---|
| USD | -3.95% | -2.30% | -1.33% | -0.55% | -1.20% | -1.47% | -2.27% | |
| EUR | 3.95% | 1.71% | 2.74% | 3.55% | 2.85% | 2.58% | 1.74% | |
| GBP | 2.30% | -1.71% | 0.99% | 1.80% | 1.12% | 0.85% | 0.03% | |
| JPY | 1.33% | -2.74% | -0.99% | 0.82% | 0.12% | -0.15% | -0.95% | |
| CAD | 0.55% | -3.55% | -1.80% | -0.82% | -0.68% | -0.93% | -1.74% | |
| AUD | 1.20% | -2.85% | -1.12% | -0.12% | 0.68% | -0.26% | -1.10% | |
| NZD | 1.47% | -2.58% | -0.85% | 0.15% | 0.93% | 0.26% | -0.81% | |
| CHF | 2.27% | -1.74% | -0.03% | 0.95% | 1.74% | 1.10% | 0.81% |
The heat map shows percentage changes of major currencies against each other. The base currency is picked from the left column, while the quote currency is picked from the top row. For example, if you pick the US Dollar from the left column and move along the horizontal line to the Japanese Yen, the percentage change displayed in the box will represent USD (base)/JPY (quote).


© 2000-2026. Sva prava zaštićena.
Sajt je vlasništvo kompanije Teletrade D.J. LLC 2351 LLC 2022 (Euro House, Richmond Hill Road, Kingstown, VC0100, St. Vincent and the Grenadines).
Svi podaci koji se nalaze na sajtu ne predstavljaju osnovu za donošenje investicionih odluka, već su informativnog karaktera.
The company does not serve or provide services to customers who are residents of the US, Canada, Iran, The Democratic People's Republic of Korea, Yemen and FATF blacklisted countries.
Izvršenje trgovinskih operacija sa finansijskim instrumentima upotrebom marginalne trgovine pruža velike mogućnosti i omogućava investitorima ostvarivanje visokih prihoda. Međutim, takav vid trgovine povezan je sa potencijalno visokim nivoom rizika od gubitka sredstava. Проведение торговых операций на финанcовых рынках c маржинальными финанcовыми инcтрументами открывает широкие возможноcти, и позволяет инвеcторам, готовым пойти на риcк, получать выcокую прибыль, но при этом неcет в cебе потенциально выcокий уровень риcка получения убытков. Iz tog razloga je pre započinjanja trgovine potrebno odlučiti o izboru odgovarajuće investicione strategije, uzimajući u obzir raspoložive resurse.
Upotreba informacija: U slučaju potpunog ili delimičnog preuzimanja i daljeg korišćenja materijala koji se nalazi na sajtu, potrebno je navesti link odgovarajuće stranice na sajtu kompanije TeleTrade-a kao izvora informacija. Upotreba materijala na internetu mora biti praćena hiper linkom do web stranice teletrade.org. Automatski uvoz materijala i informacija sa stranice je zabranjen.
Ako imate bilo kakvih pitanja, obratite nam se pr@teletrade.global.
транcфери