- Analiza
- Novosti i instrumenti
- Vesti sa tržišta
- Silver Price Forecast: XAG/USD tests nine-day EMA near $33.50
Silver Price Forecast: XAG/USD tests nine-day EMA near $33.50
- Silver price tests immediate support around the nine-day EMA at the $33.60 level.
- The 14-day RSI remains above the 50 mark, suggesting the bullish outlook prevails.
- Silver price may explore the region around the upper boundary of the ascending channel at $35.10.
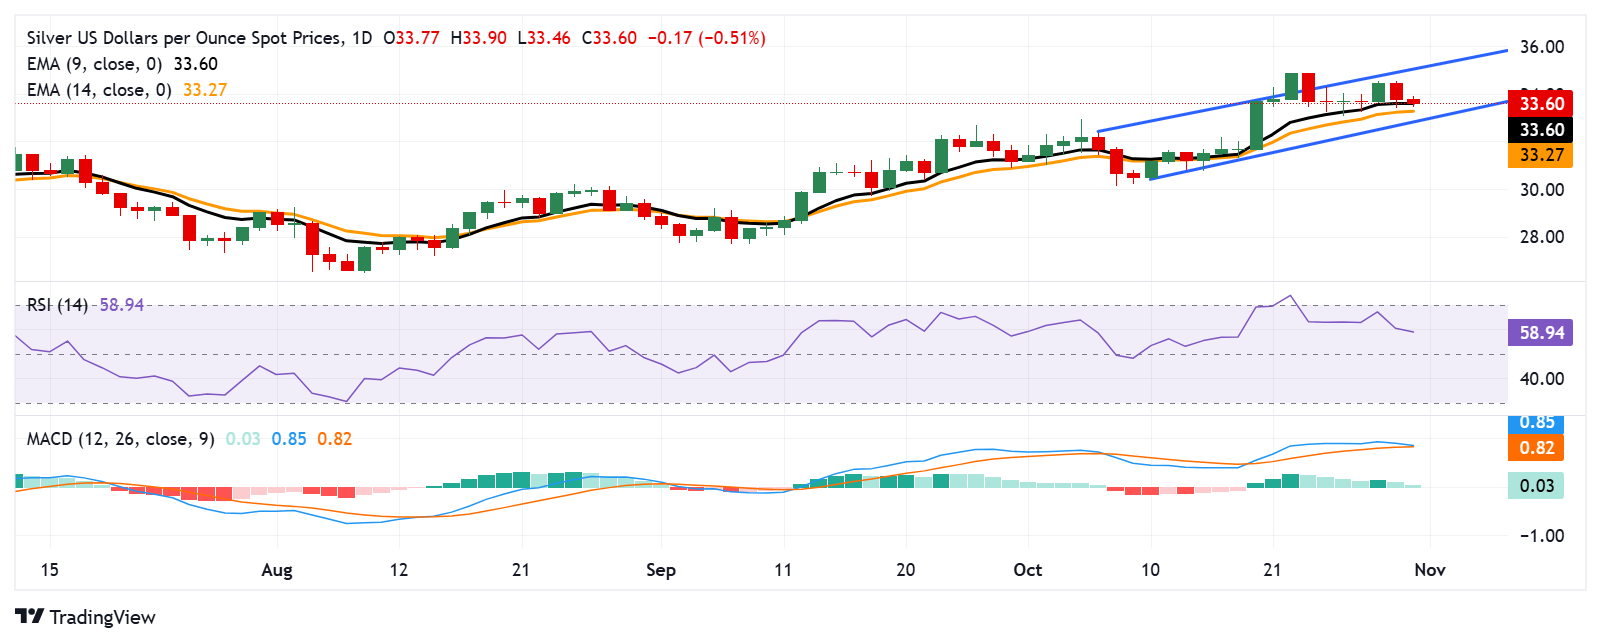
Silver price (XAG/USD) continues to decline, trading at around $33.60 during the European session on Thursday. Analysis of the daily chart indicates a bullish bias, as Silver price consolidates within an ascending channel.
Furthermore, the 14-day Relative Strength Index (RSI) remains above the 50 mark, supporting the prevailing bullish outlook. However, a decline below 50 could signal a shift toward bearish sentiment.
However, the Moving Average Convergence Divergence (MACD) line is positioned above the signal line, indicating a potential bearish signal. A bearish crossover could suggest a shift in momentum from bullish to bearish, signaling a possible sell opportunity. Nonetheless, since both lines remain above the centerline (zero line), this suggests that the overall trend remains bullish.
On the upside, the Silver price may target the psychological level of $35.00, followed by the upper boundary of the ascending channel at $35.10. A breakout above this level could propel the price of the grey metal toward the psychological level of $36.00.
Regarding support, Silver price is testing the nine-day Exponential Moving Average (EMA) at $33.60, with the 14-day EMA at $33.27 serving as the next support level. A drop below this latter level could increase selling pressure, potentially pushing XAG/USD down to the lower boundary of the ascending channel around the psychological level of $33.00.
XAG/USD: Daily Chart
Silver FAQs
Silver is a precious metal highly traded among investors. It has been historically used as a store of value and a medium of exchange. Although less popular than Gold, traders may turn to Silver to diversify their investment portfolio, for its intrinsic value or as a potential hedge during high-inflation periods. Investors can buy physical Silver, in coins or in bars, or trade it through vehicles such as Exchange Traded Funds, which track its price on international markets.
Silver prices can move due to a wide range of factors. Geopolitical instability or fears of a deep recession can make Silver price escalate due to its safe-haven status, although to a lesser extent than Gold's. As a yieldless asset, Silver tends to rise with lower interest rates. Its moves also depend on how the US Dollar (USD) behaves as the asset is priced in dollars (XAG/USD). A strong Dollar tends to keep the price of Silver at bay, whereas a weaker Dollar is likely to propel prices up. Other factors such as investment demand, mining supply – Silver is much more abundant than Gold – and recycling rates can also affect prices.
Silver is widely used in industry, particularly in sectors such as electronics or solar energy, as it has one of the highest electric conductivity of all metals – more than Copper and Gold. A surge in demand can increase prices, while a decline tends to lower them. Dynamics in the US, Chinese and Indian economies can also contribute to price swings: for the US and particularly China, their big industrial sectors use Silver in various processes; in India, consumers’ demand for the precious metal for jewellery also plays a key role in setting prices.
Silver prices tend to follow Gold's moves. When Gold prices rise, Silver typically follows suit, as their status as safe-haven assets is similar. The Gold/Silver ratio, which shows the number of ounces of Silver needed to equal the value of one ounce of Gold, may help to determine the relative valuation between both metals. Some investors may consider a high ratio as an indicator that Silver is undervalued, or Gold is overvalued. On the contrary, a low ratio might suggest that Gold is undervalued relative to Silver.
© 2000-2026. Sva prava zaštićena.
Sajt je vlasništvo kompanije Teletrade D.J. LLC 2351 LLC 2022 (Euro House, Richmond Hill Road, Kingstown, VC0100, St. Vincent and the Grenadines).
Svi podaci koji se nalaze na sajtu ne predstavljaju osnovu za donošenje investicionih odluka, već su informativnog karaktera.
The company does not serve or provide services to customers who are residents of the US, Canada, Iran, The Democratic People's Republic of Korea, Yemen and FATF blacklisted countries.
Izvršenje trgovinskih operacija sa finansijskim instrumentima upotrebom marginalne trgovine pruža velike mogućnosti i omogućava investitorima ostvarivanje visokih prihoda. Međutim, takav vid trgovine povezan je sa potencijalno visokim nivoom rizika od gubitka sredstava. Проведение торговых операций на финанcовых рынках c маржинальными финанcовыми инcтрументами открывает широкие возможноcти, и позволяет инвеcторам, готовым пойти на риcк, получать выcокую прибыль, но при этом неcет в cебе потенциально выcокий уровень риcка получения убытков. Iz tog razloga je pre započinjanja trgovine potrebno odlučiti o izboru odgovarajuće investicione strategije, uzimajući u obzir raspoložive resurse.
Upotreba informacija: U slučaju potpunog ili delimičnog preuzimanja i daljeg korišćenja materijala koji se nalazi na sajtu, potrebno je navesti link odgovarajuće stranice na sajtu kompanije TeleTrade-a kao izvora informacija. Upotreba materijala na internetu mora biti praćena hiper linkom do web stranice teletrade.org. Automatski uvoz materijala i informacija sa stranice je zabranjen.
Ako imate bilo kakvih pitanja, obratite nam se pr@teletrade.global.


