- Analiza
- Novosti i instrumenti
- Vesti sa tržišta
- US Dollar Index Price Forecast: Flashing signs the trend could be changing
US Dollar Index Price Forecast: Flashing signs the trend could be changing
- The US Dollar Index is flashing signs it could be changing trend and moving higher.
- The weekly and daily charts are showing bullish Japanese candlestick patterns after the recent touchdown on support at 100.
- The 4-hour chart is showing the formation of a possible new short-term uptrend.
The US Dollar Index (DXY) has bounced off support at the floor of its multi-year range and formed some reversal patterns which indicate the possibility it may be reversing the bearish move down from the July highs. Overall, however, it is still a little too early to say for sure and there remains a risk bears could take hold of the reins again and push price back down.
US Dollar Index Weekly Chart
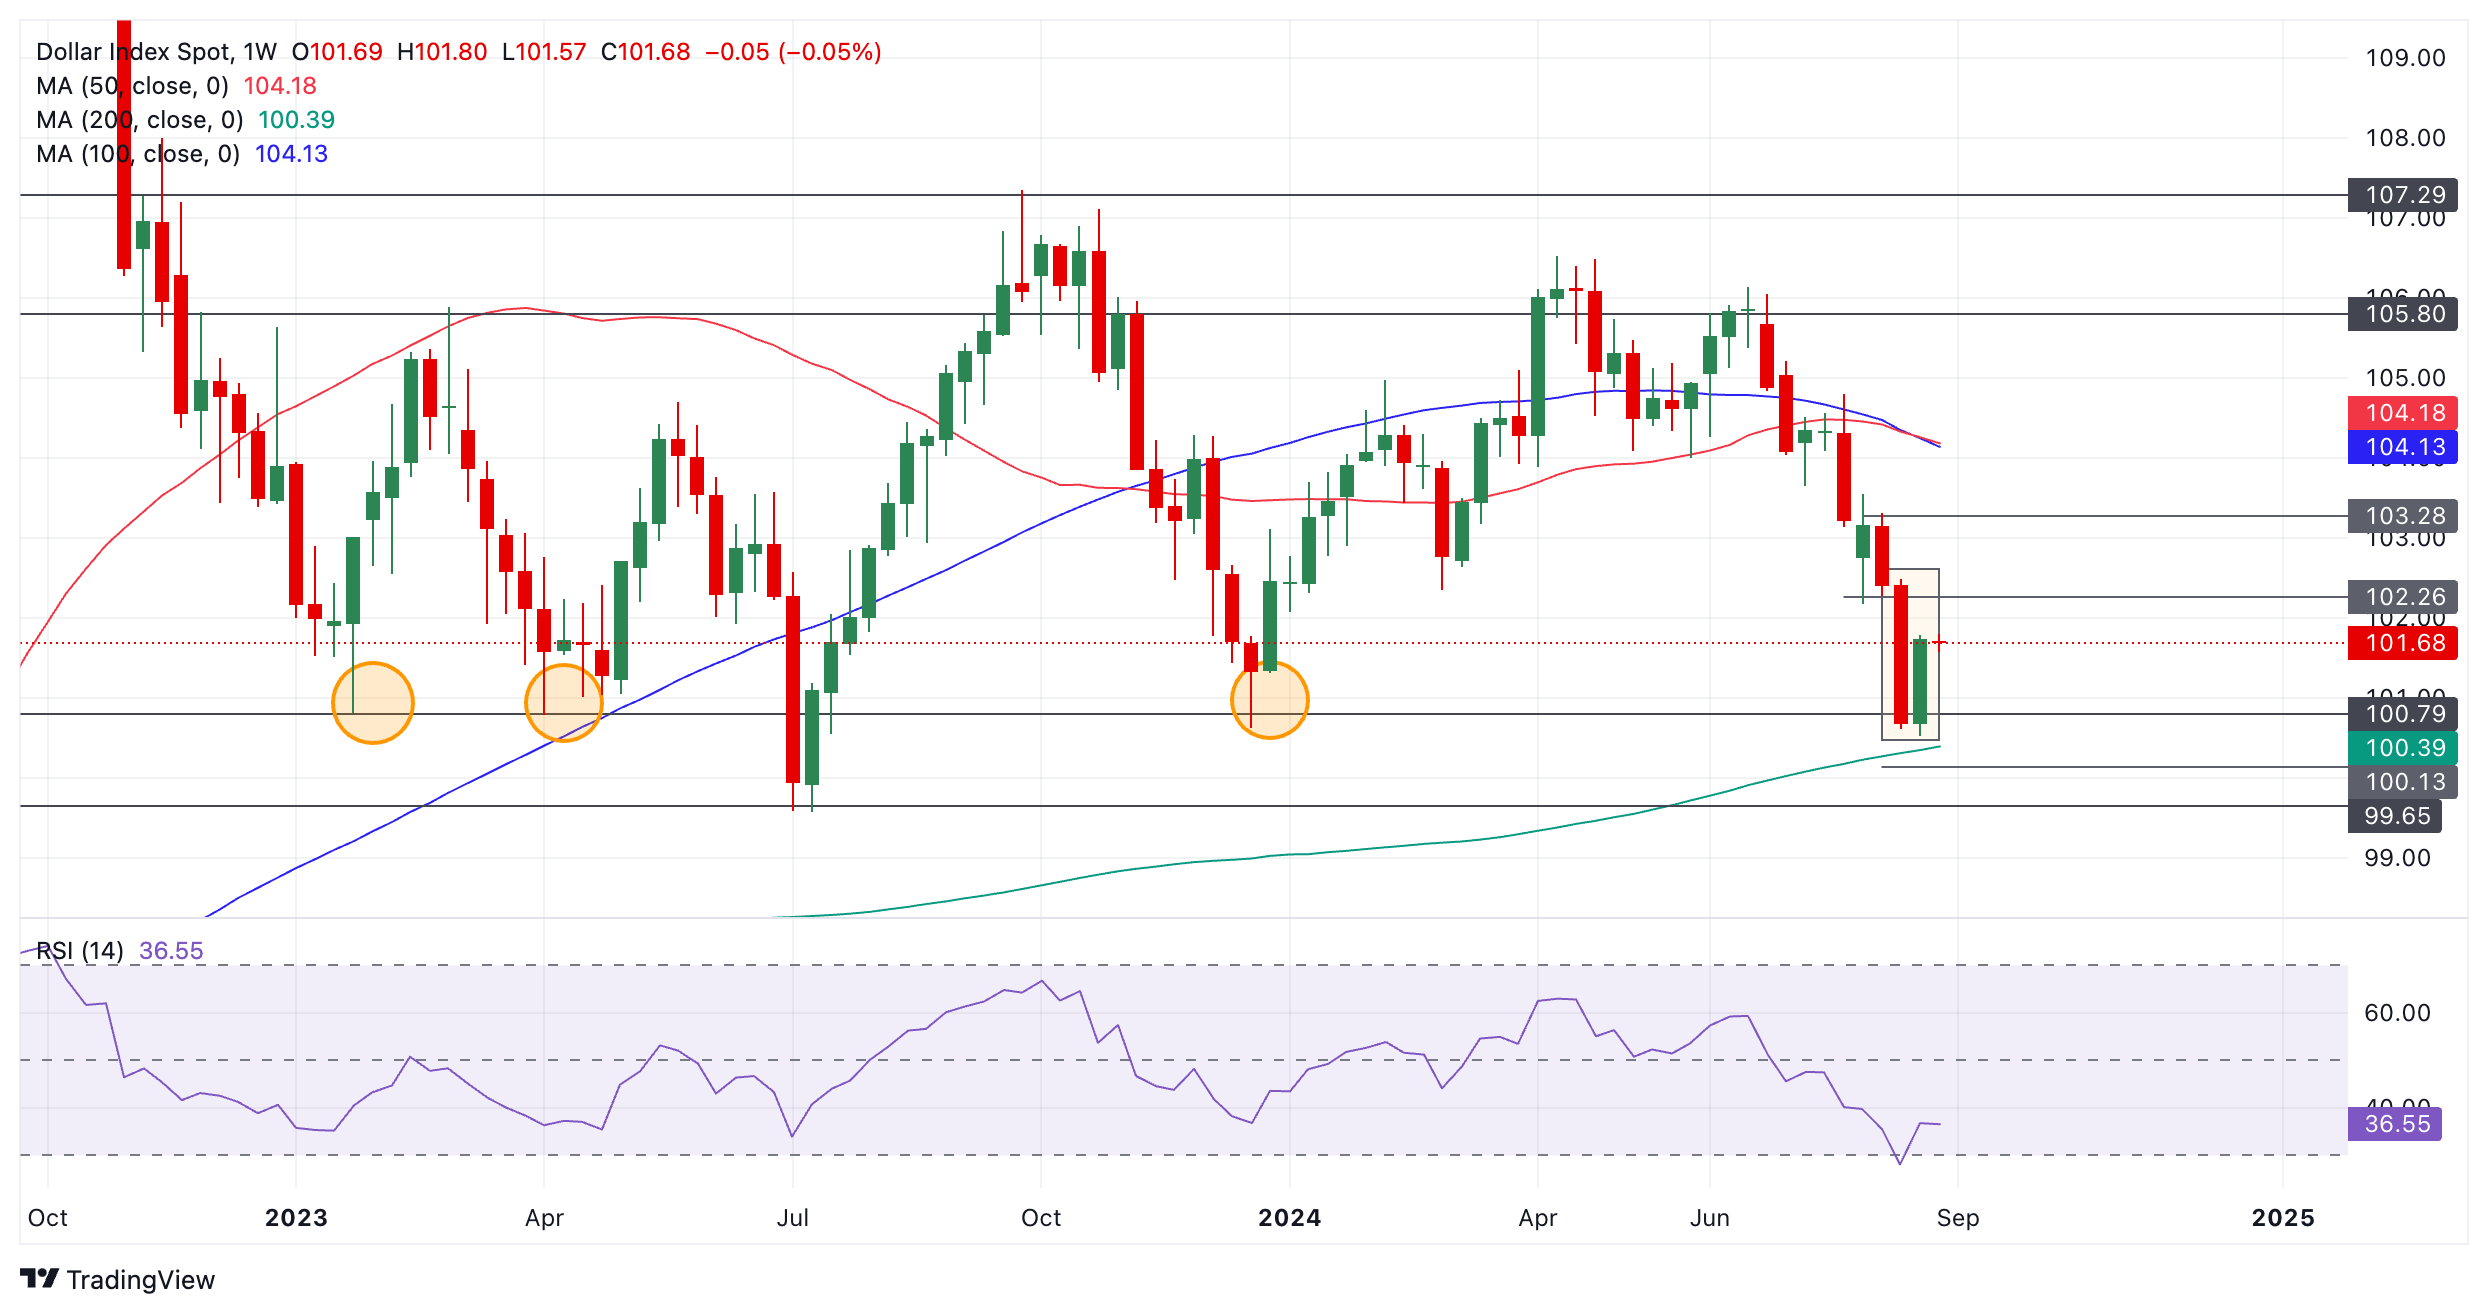
DXY has formed an unconfirmed bullish Piercing Line Japanese candlestick pattern (shaded rectangle) on the weekly chart at a historic support level in the 100s. This level has been tested multiple times in the past (orange bubbles).
The Piercing Line pattern forms after a down move when a red candlestick is followed by a green candlestick that closes above the midpoint of the initial red candle. It is a sign of a bullish reversal. For confirmation, however, the pattern should be followed by another green candlestick which cannot be verified until the end of the current week.
The Relative Strength Index (RSI) momentum indicator exited oversold last week providing a buy signal and adding further evidence to the possibility of a bullish recovery evolving.
Dollar Index Daily Chart
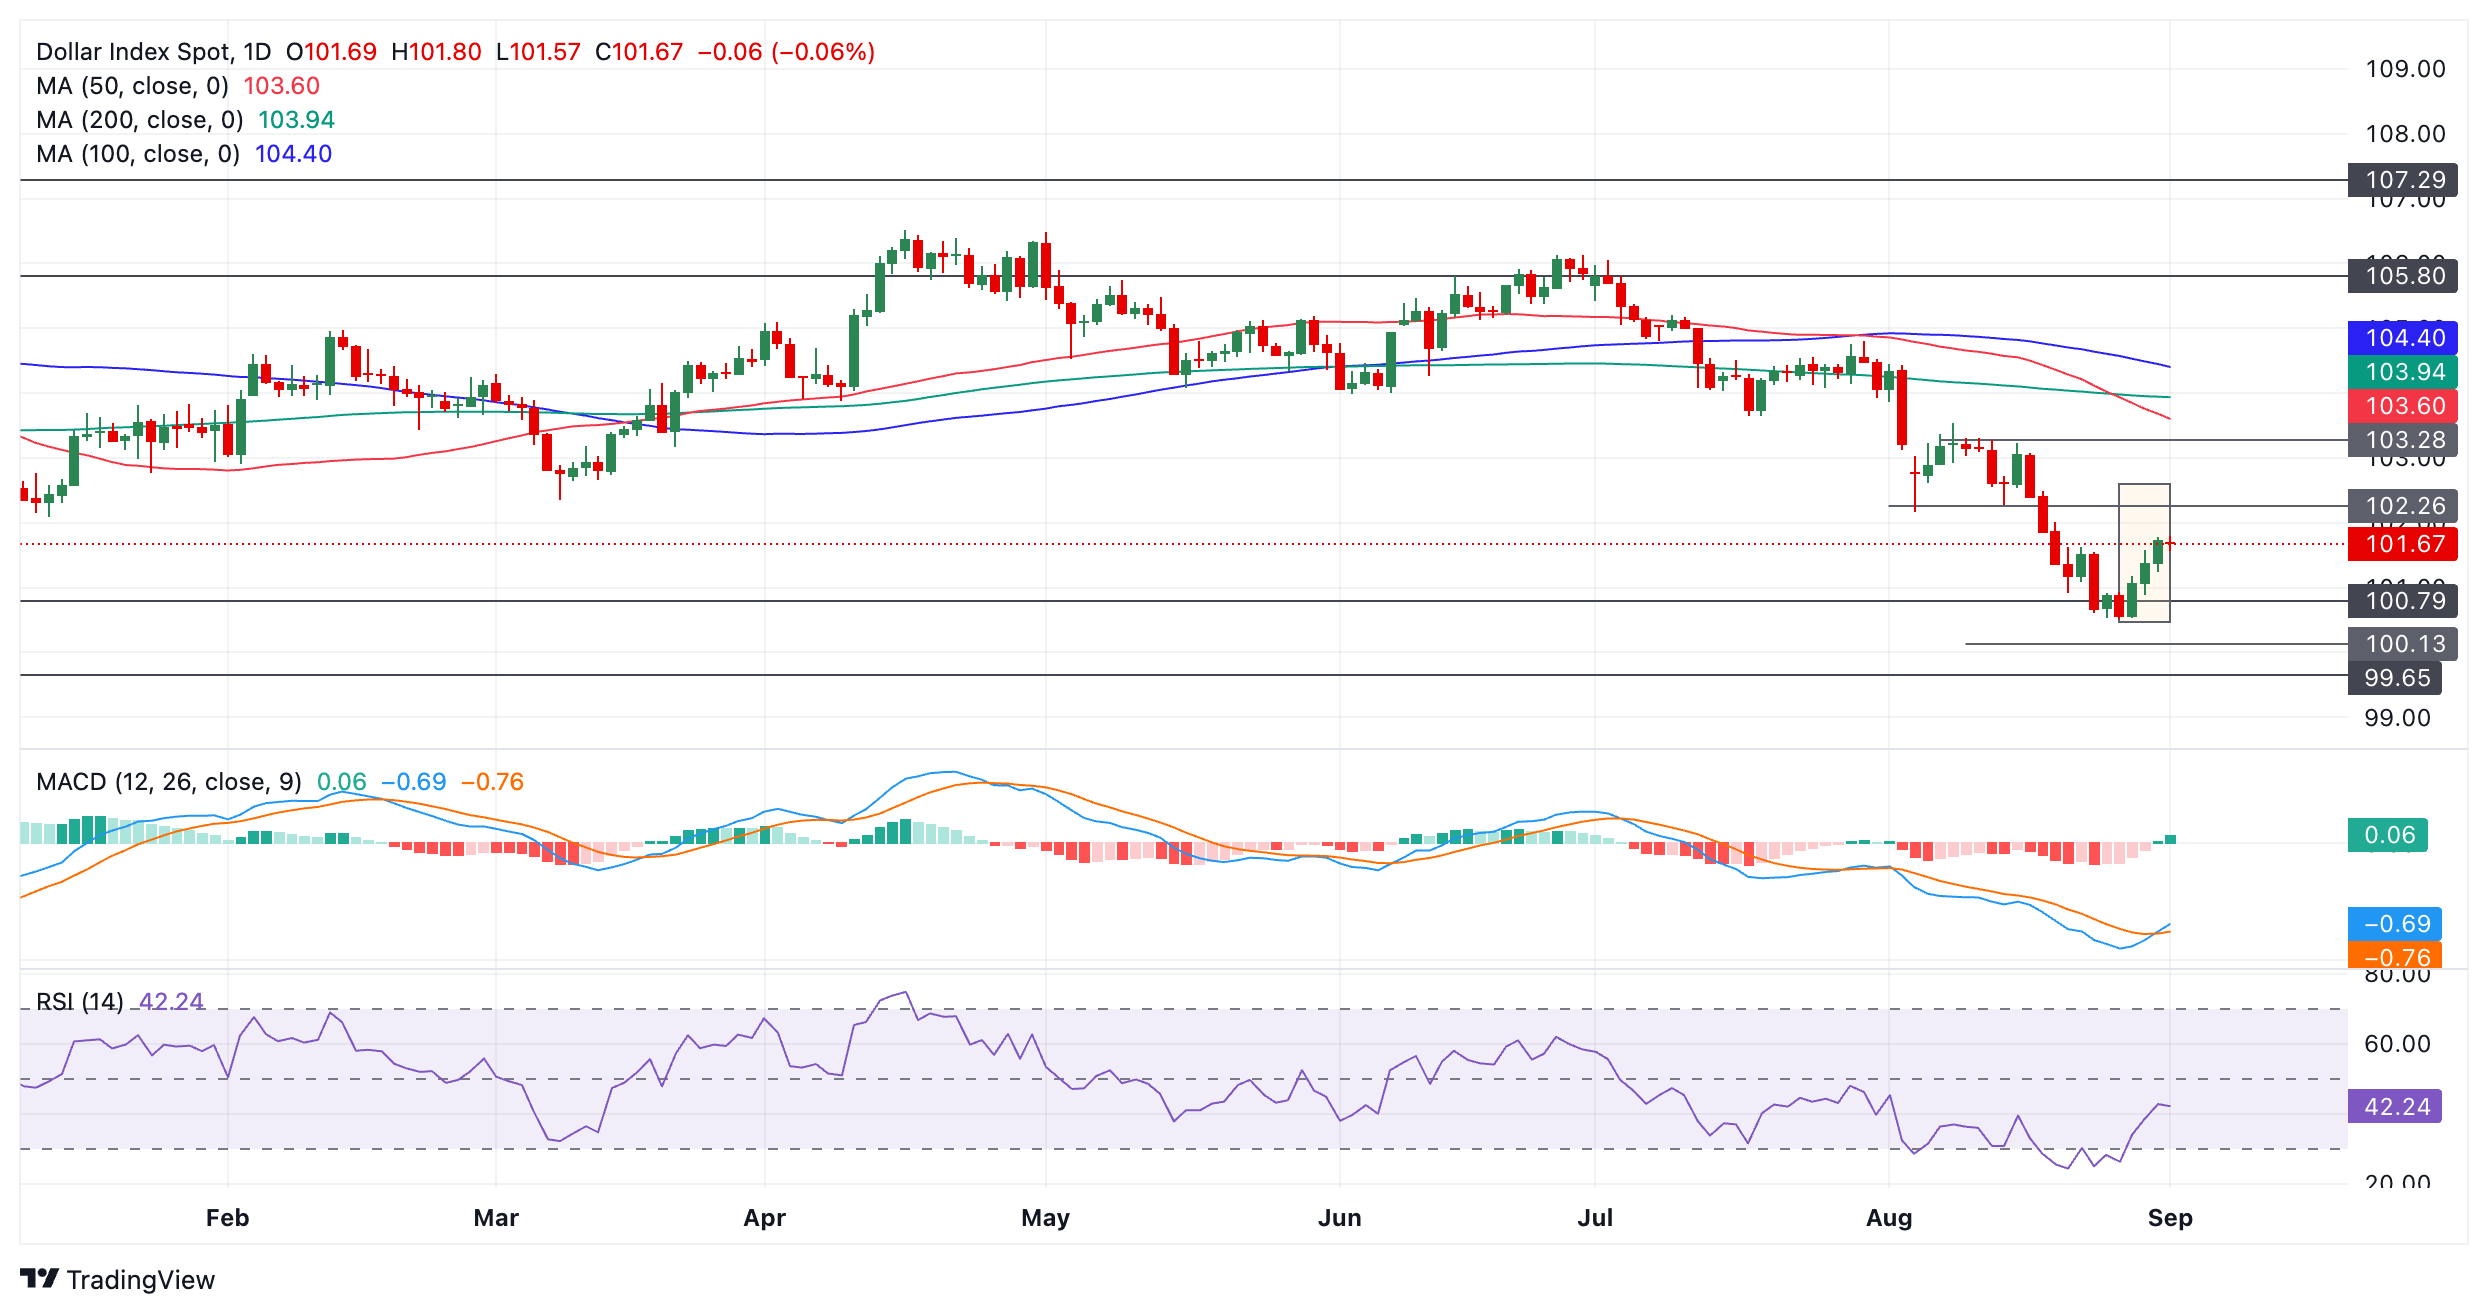
The DXY daily chart is showing that a Three White Soldiers Japanese candlestick pattern has formed during the recovery over the last three days. Such a pattern forms after a market bottom when three rising green candlesticks form in a row that are of a similar size. It is a bullish reversal sign.
The Moving Average Convergence Divergence (MACD) momentum oscillator has crossed above its red signal line giving further evidence to the bullish hypothesis.
The RSI also recently exited oversold, providing a buy signal.
Dollar Index 4-hour Chart
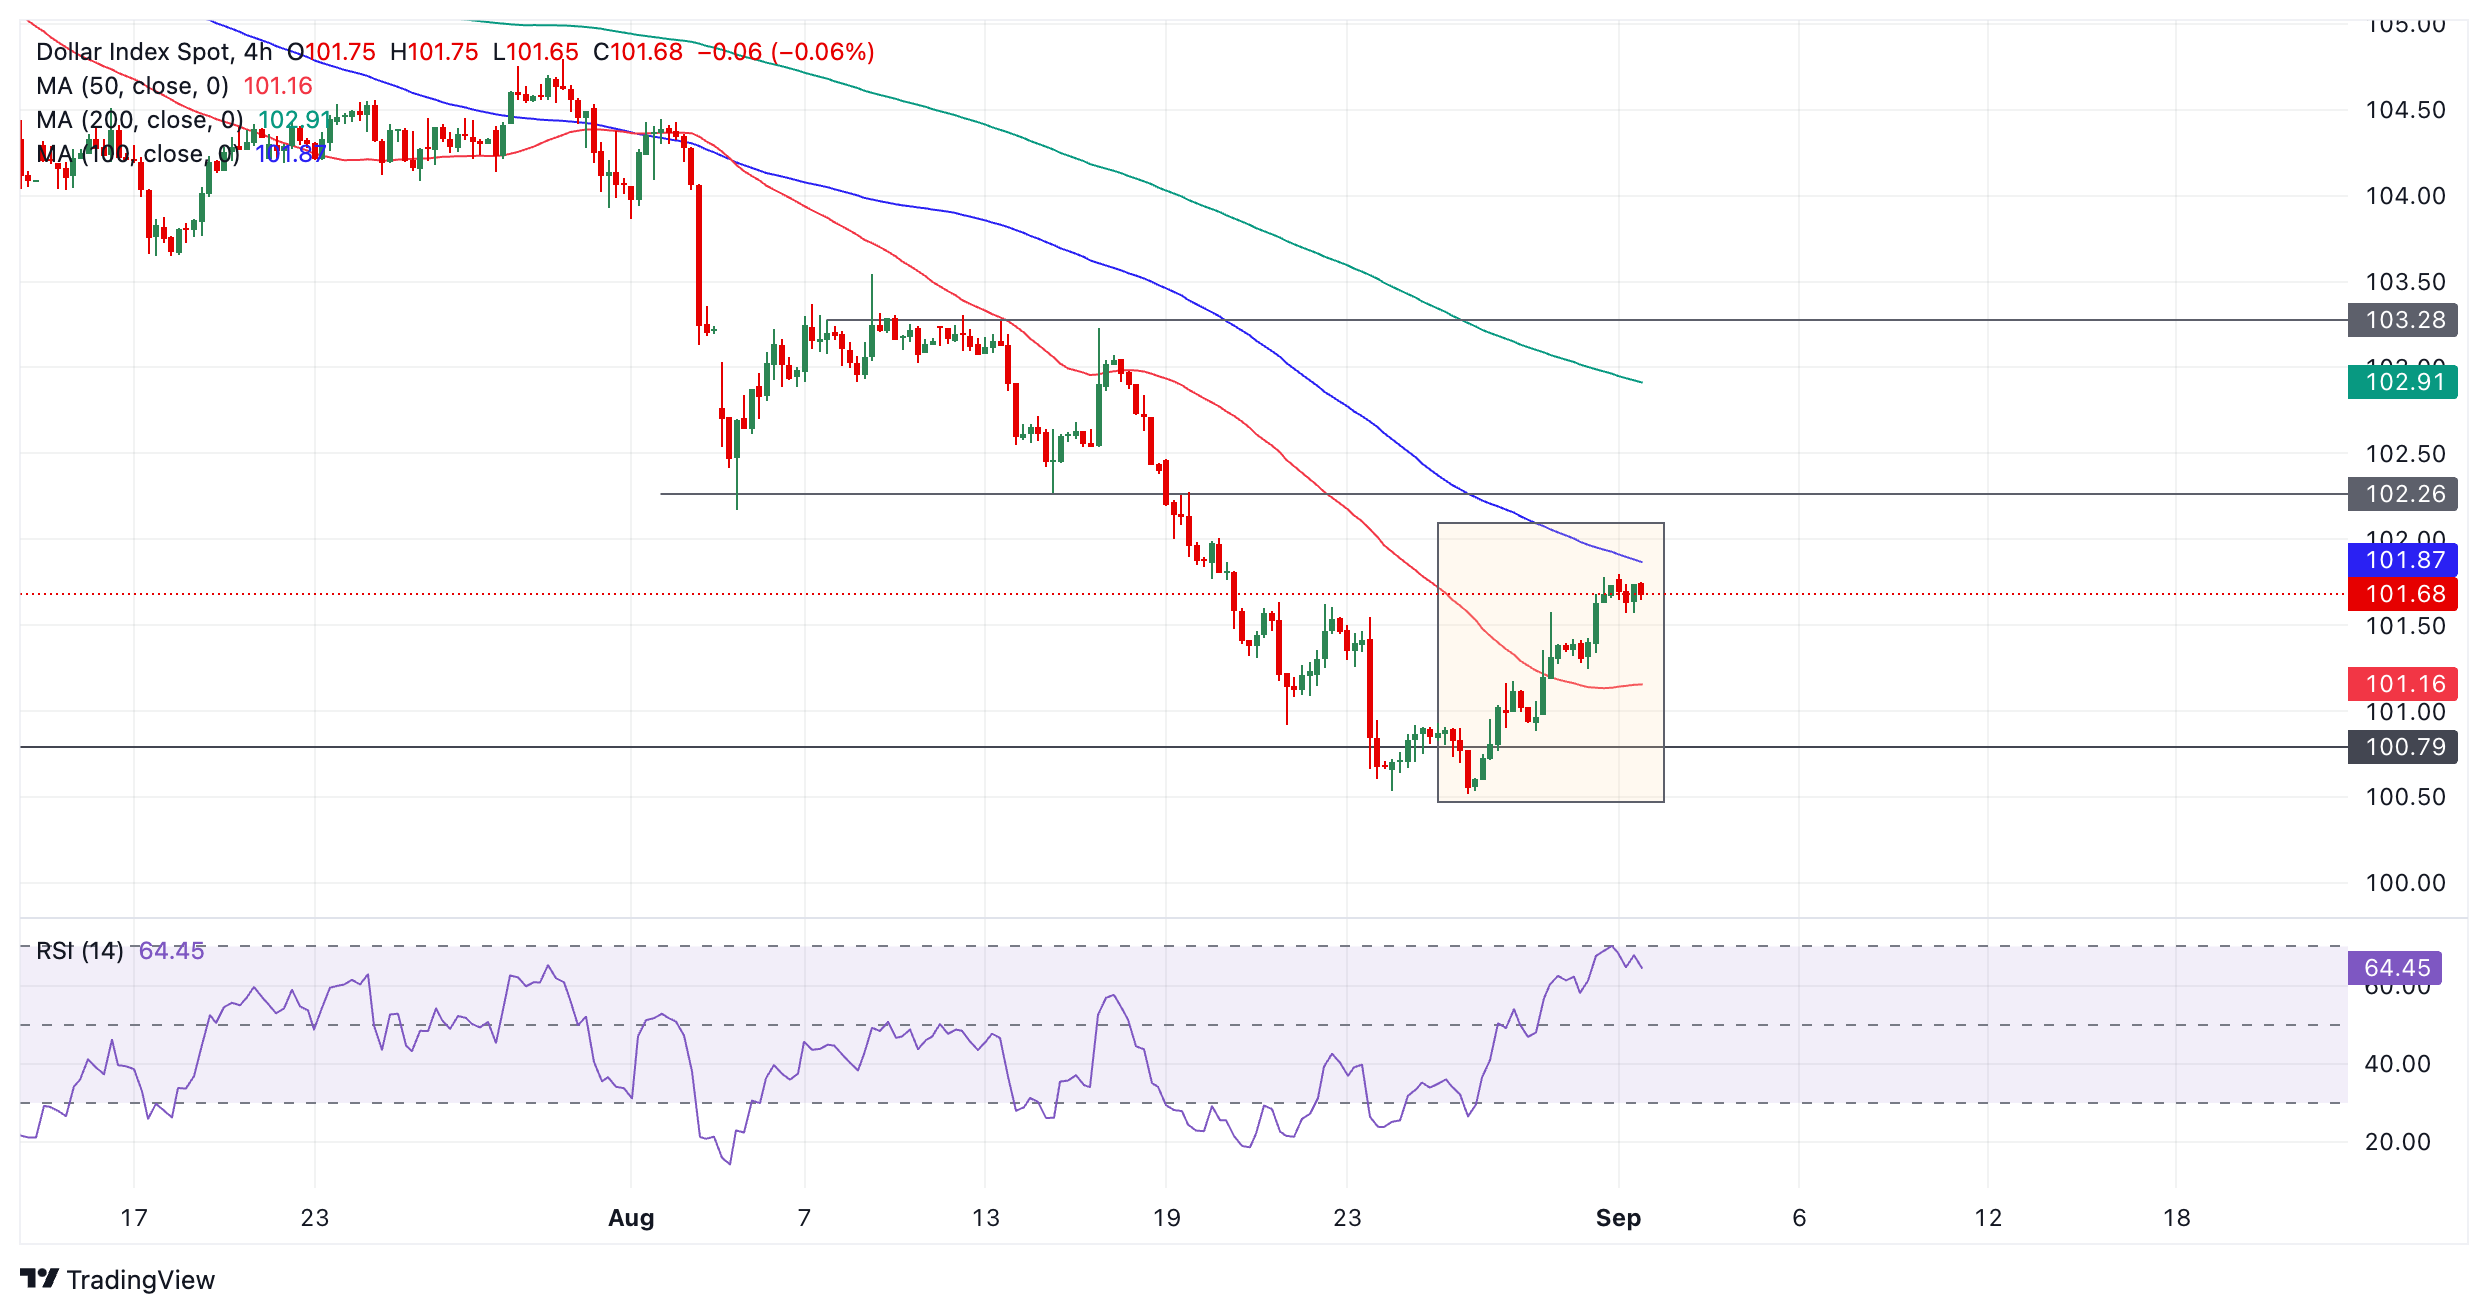
The 4-hour chart of DXY is showing the possible formation of a tender, new uptrend (shaded box). The sequence of peaks and troughs is now rising suggesting the short-term trend may be bullish. DXY has also broken above the key August 22 high.
Given “the trend is your friend” this could indicate the evolution of higher highs, with the next target at the 102.26 level (August 14 low).
The RSI has just exited overbought, however, raising the risk of a deeper pull back evolving.
© 2000-2026. Sva prava zaštićena.
Sajt je vlasništvo kompanije Teletrade D.J. LLC 2351 LLC 2022 (Euro House, Richmond Hill Road, Kingstown, VC0100, St. Vincent and the Grenadines).
Svi podaci koji se nalaze na sajtu ne predstavljaju osnovu za donošenje investicionih odluka, već su informativnog karaktera.
The company does not serve or provide services to customers who are residents of the US, Canada, Iran, The Democratic People's Republic of Korea, Yemen and FATF blacklisted countries.
Izvršenje trgovinskih operacija sa finansijskim instrumentima upotrebom marginalne trgovine pruža velike mogućnosti i omogućava investitorima ostvarivanje visokih prihoda. Međutim, takav vid trgovine povezan je sa potencijalno visokim nivoom rizika od gubitka sredstava. Проведение торговых операций на финанcовых рынках c маржинальными финанcовыми инcтрументами открывает широкие возможноcти, и позволяет инвеcторам, готовым пойти на риcк, получать выcокую прибыль, но при этом неcет в cебе потенциально выcокий уровень риcка получения убытков. Iz tog razloga je pre započinjanja trgovine potrebno odlučiti o izboru odgovarajuće investicione strategije, uzimajući u obzir raspoložive resurse.
Upotreba informacija: U slučaju potpunog ili delimičnog preuzimanja i daljeg korišćenja materijala koji se nalazi na sajtu, potrebno je navesti link odgovarajuće stranice na sajtu kompanije TeleTrade-a kao izvora informacija. Upotreba materijala na internetu mora biti praćena hiper linkom do web stranice teletrade.org. Automatski uvoz materijala i informacija sa stranice je zabranjen.
Ako imate bilo kakvih pitanja, obratite nam se pr@teletrade.global.


