- Analiza
- Novosti i instrumenti
- Vesti sa tržišta
- Dow Jones Industrial Average soars as rate cut hopes resume
Dow Jones Industrial Average soars as rate cut hopes resume
- Dow Jones climbs nearly 700 points on Friday in a recovery bid.
- September rate cut is still being priced in as a sure thing after US inflation print.
- With US PCE inflation in the books, markets will pivot to next Friday’s NFP.
The Dow Jones Industrial Average (DJIA) scorched 700 points higher on Friday after a close-enough-to-expectations print in US Personal Consumption Expenditures Price Index (PCE) inflation came in cool enough to allow investors to keep hopes for a September rate cut pinned to the ceiling. Markets are expecting the Federal Reserve (Fed) to hold rates steady for one more meeting in July before delivering the first quarter-point trim in a new rate-cutting cycle beginning in September.
Core US PCE inflation held steady at 2.6% YoY in June, flouting median market forecasts of a tick down to 2.5%. Near-term PCE inflation also accelerated MoM in June, rising to 0.2% from the forecast hold at 0.1%.
The University of Michigan’s (UoM) Consumer Sentiment Index fell less than expected in July, falling to an eight-month low of 66.4 instead of the forecast 66.0, but still lower than the previous 68.4. UoM 5-year Consumer Inflation Expectations also ticked higher to 3.0% in July, rising from the previous 2.9%.
Despite all the warning signs of a possible upturn in inflation pressures, markets decided on Friday that the figures weren’t enough to be worried about, and resumed pivoting firmly into risk-on sentiment and keep holding out hope for a September rate cut. According to the CME’s FedWatch Tool, rate markets are still pricing in one more hold from the Federal Open Market Committee (FOMC) on July 31, with 100% odds of at least a 25-basis-point cut on September 18. A particularly rate-cut-hopeful contingent sees 12% odds of a double cut in September for 50 bps.
Economic Indicator
Core Personal Consumption Expenditures - Price Index (YoY)
The Core Personal Consumption Expenditures (PCE), released by the US Bureau of Economic Analysis on a monthly basis, measures the changes in the prices of goods and services purchased by consumers in the United States (US). The PCE Price Index is also the Federal Reserve’s (Fed) preferred gauge of inflation. The YoY reading compares the prices of goods in the reference month to the same month a year earlier. The core reading excludes the so-called more volatile food and energy components to give a more accurate measurement of price pressures." Generally, a high reading is bullish for the US Dollar (USD), while a low reading is bearish.
Read more.Last release: Fri Jul 26, 2024 12:30
Frequency: Monthly
Actual: 2.6%
Consensus: 2.5%
Previous: 2.6%
Source: US Bureau of Economic Analysis
After publishing the GDP report, the US Bureau of Economic Analysis releases the Personal Consumption Expenditures (PCE) Price Index data alongside the monthly changes in Personal Spending and Personal Income. FOMC policymakers use the annual Core PCE Price Index, which excludes volatile food and energy prices, as their primary gauge of inflation. A stronger-than-expected reading could help the USD outperform its rivals as it would hint at a possible hawkish shift in the Fed’s forward guidance and vice versa.
Dow Jones news
The Dow Jones firmly recovered from a mid-week plunge, climbing over 700 points and outperforming the rest of the US equity indexes. The index climbed 1.8% on Friday, with nearly all of the DJIA’s constituent securities finding the green as the trading week winds down.
3M Co. (MMM) is single-handedly dragging the Dow Jones deep into the high end on Friday after reporting a $400 million revenue beat over estimates and raising the low end of the company’s forward guidance band. MMM rose 21% in Friday trading to cross over $125.00 per share and trading into a 23-month high.
Dow Jones technical outlook
The Dow Jones soared back over the 40,000.00 mega price handle on Tuesday, shrugging off mid-week declines and clawing back significant ground from a near-term decline from record peaks at 41,371.38. Friday’s rally etched in a fresh peak for the week, reversing several days of cautious declines and setting the DJIA up for a technical recovery heading into next week.
The Dow Jones continues to test chart paper on the high end, deep in bull country and trading 7% above the 200-day Exponential Moving Average (EMA) at 37,837.12. If short pressures resumes and drags the major equity index back into the low side, buyers will be looking to step in from the 50-day EMA at 39,527.96.
Dow Jones five minute chart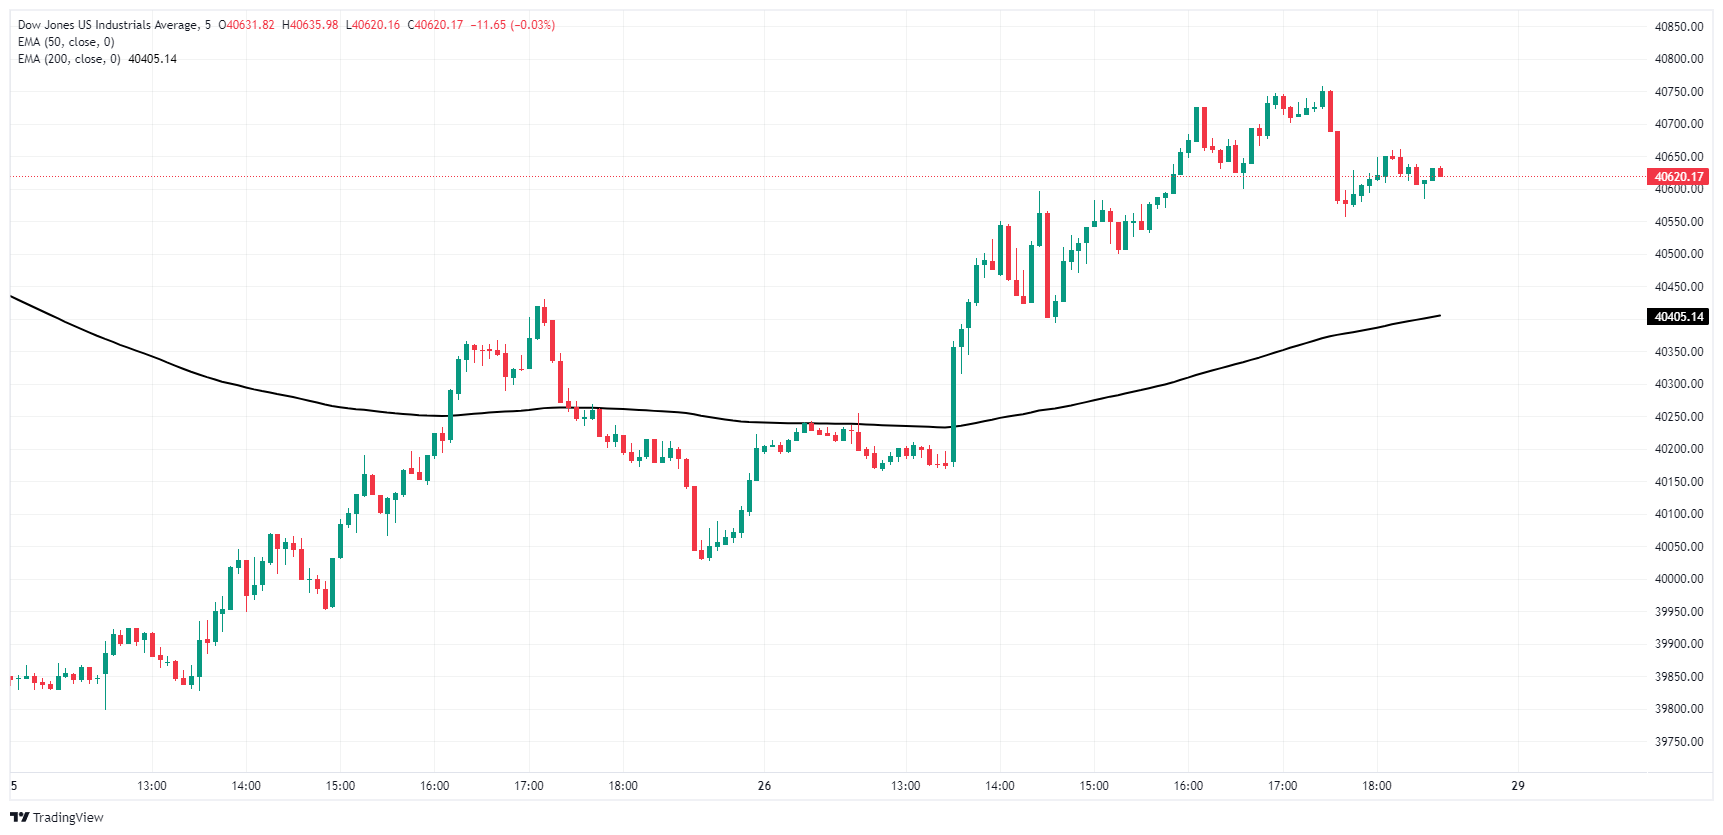
Dow Jones daily chart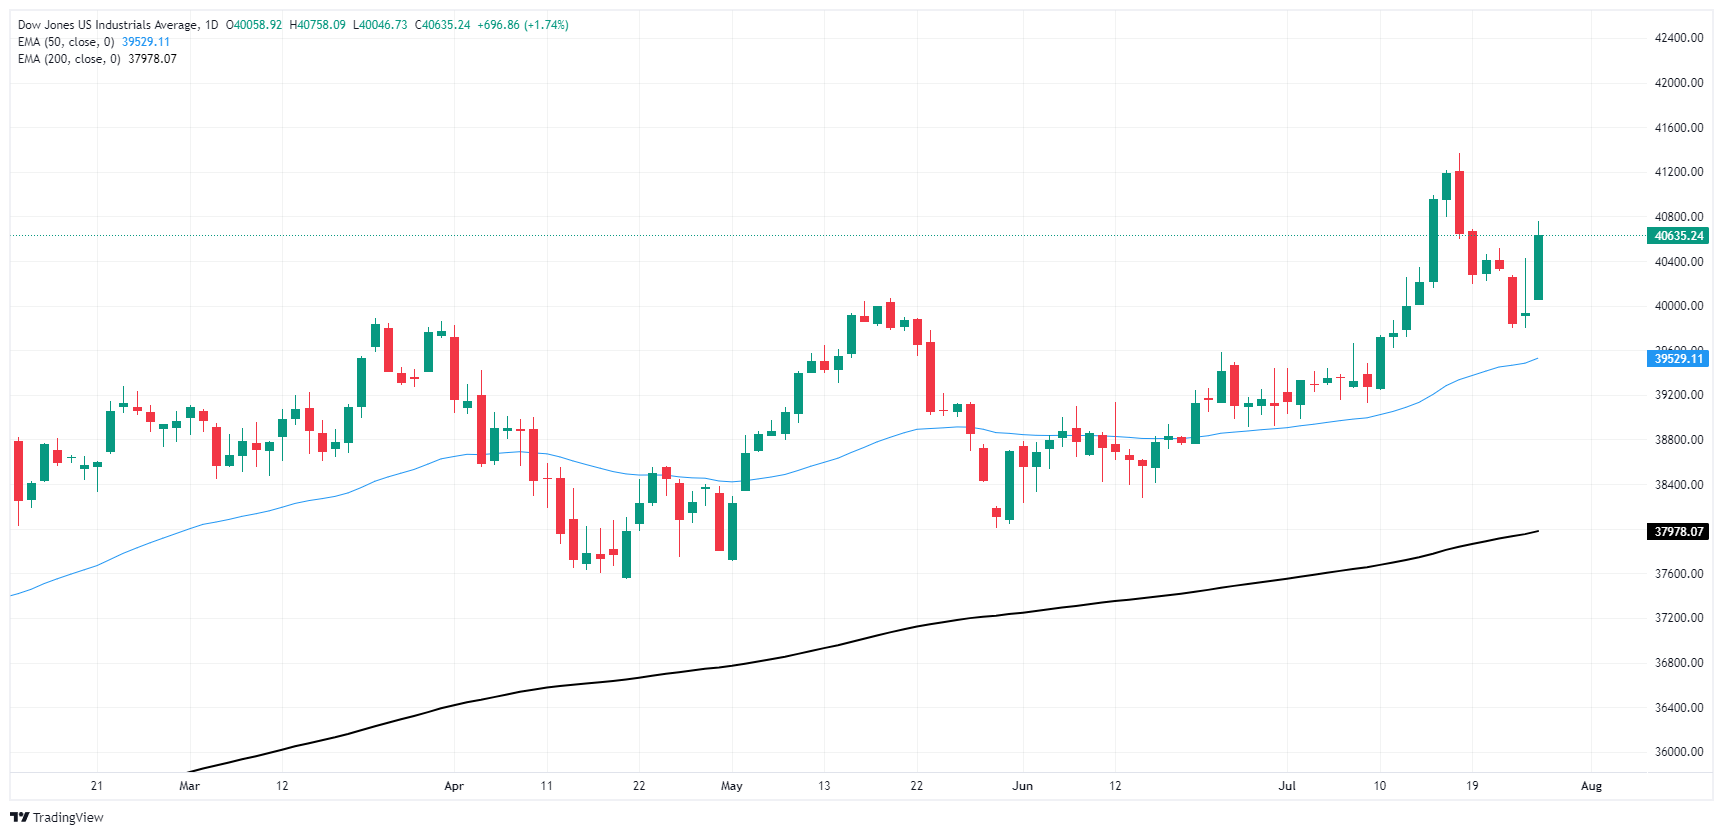
Dow Jones FAQs
The Dow Jones Industrial Average, one of the oldest stock market indices in the world, is compiled of the 30 most traded stocks in the US. The index is price-weighted rather than weighted by capitalization. It is calculated by summing the prices of the constituent stocks and dividing them by a factor, currently 0.152. The index was founded by Charles Dow, who also founded the Wall Street Journal. In later years it has been criticized for not being broadly representative enough because it only tracks 30 conglomerates, unlike broader indices such as the S&P 500.
Many different factors drive the Dow Jones Industrial Average (DJIA). The aggregate performance of the component companies revealed in quarterly company earnings reports is the main one. US and global macroeconomic data also contributes as it impacts on investor sentiment. The level of interest rates, set by the Federal Reserve (Fed), also influences the DJIA as it affects the cost of credit, on which many corporations are heavily reliant. Therefore, inflation can be a major driver as well as other metrics which impact the Fed decisions.
Dow Theory is a method for identifying the primary trend of the stock market developed by Charles Dow. A key step is to compare the direction of the Dow Jones Industrial Average (DJIA) and the Dow Jones Transportation Average (DJTA) and only follow trends where both are moving in the same direction. Volume is a confirmatory criteria. The theory uses elements of peak and trough analysis. Dow’s theory posits three trend phases: accumulation, when smart money starts buying or selling; public participation, when the wider public joins in; and distribution, when the smart money exits.
There are a number of ways to trade the DJIA. One is to use ETFs which allow investors to trade the DJIA as a single security, rather than having to buy shares in all 30 constituent companies. A leading example is the SPDR Dow Jones Industrial Average ETF (DIA). DJIA futures contracts enable traders to speculate on the future value of the index and Options provide the right, but not the obligation, to buy or sell the index at a predetermined price in the future. Mutual funds enable investors to buy a share of a diversified portfolio of DJIA stocks thus providing exposure to the overall index.


© 2000-2026. Sva prava zaštićena.
Sajt je vlasništvo kompanije Teletrade D.J. LLC 2351 LLC 2022 (Euro House, Richmond Hill Road, Kingstown, VC0100, St. Vincent and the Grenadines).
Svi podaci koji se nalaze na sajtu ne predstavljaju osnovu za donošenje investicionih odluka, već su informativnog karaktera.
The company does not serve or provide services to customers who are residents of the US, Canada, Iran, The Democratic People's Republic of Korea, Yemen and FATF blacklisted countries.
Izvršenje trgovinskih operacija sa finansijskim instrumentima upotrebom marginalne trgovine pruža velike mogućnosti i omogućava investitorima ostvarivanje visokih prihoda. Međutim, takav vid trgovine povezan je sa potencijalno visokim nivoom rizika od gubitka sredstava. Проведение торговых операций на финанcовых рынках c маржинальными финанcовыми инcтрументами открывает широкие возможноcти, и позволяет инвеcторам, готовым пойти на риcк, получать выcокую прибыль, но при этом неcет в cебе потенциально выcокий уровень риcка получения убытков. Iz tog razloga je pre započinjanja trgovine potrebno odlučiti o izboru odgovarajuće investicione strategije, uzimajući u obzir raspoložive resurse.
Upotreba informacija: U slučaju potpunog ili delimičnog preuzimanja i daljeg korišćenja materijala koji se nalazi na sajtu, potrebno je navesti link odgovarajuće stranice na sajtu kompanije TeleTrade-a kao izvora informacija. Upotreba materijala na internetu mora biti praćena hiper linkom do web stranice teletrade.org. Automatski uvoz materijala i informacija sa stranice je zabranjen.
Ako imate bilo kakvih pitanja, obratite nam se pr@teletrade.global.
транcфери