- Analiza
- Novosti i instrumenti
- Vesti sa tržišta
- GBP/USD Price Analysis: Surges toward 1.2700 on US Dollar weakness
GBP/USD Price Analysis: Surges toward 1.2700 on US Dollar weakness
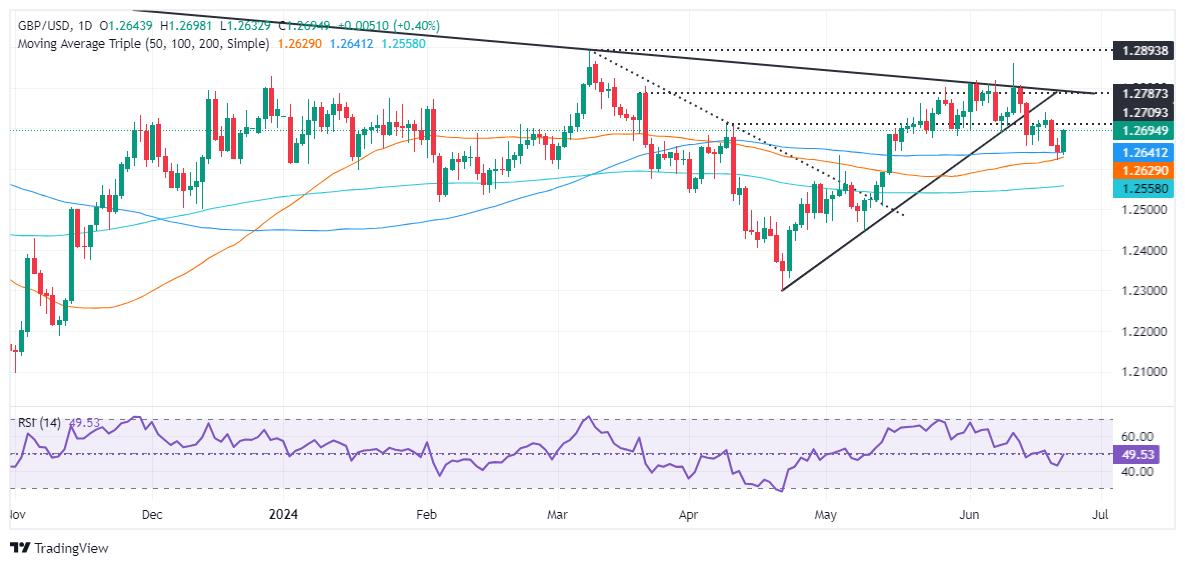
- GBP/USD up 0.40%, boosted as the US Dollar Index (DXY) hits a new two-day low.
- Technical outlook neutral to slightly bearish, with RSI signaling bearish momentum.
- Key support levels at 100-DMA (1.2664), 50-DMA (1.2627), 1.2600, and 200-DMA (1.2553).
- Resistance at 1.2700 and 1.2750, with less likelihood of being tested in the near term.
The Pound Sterling climbs sharply against the US Dollar as US Treasury bond yields remain unchanged, but the Greenback remains softer as it falls to a fresh two-day low, as depicted by the US Dollar Index (DXY). With the DXY dropping below 105.50, the GBP/USD rose and traded at 1.2691, up 0.40%.
GBP/USD Price Analysis: Technical outlook
From a daily chart perspective, the GBP/USD is neutral to slightly downward biased, even though the exchange rate trades above the daily moving averages (DMA).
The Relative Strength Index (RSI) turned bearish, hinting that sellers are in charge. It is eyeing a break of key support levels, which, once cleared, could cause the GBP/USD to re-test year-to-date (YTD) lows.
The first support would be the 100-DMA at 1.26643, ahead of the 50-DMA at 1.2627. A further downside lies beneath at 1.2600, exposing the 200-DMA at 1.2553 once surpassed. A breach of the latter, the pair will test 1.2500.
Conversely, and the less likely path in the near term, the GBP/USD first resistance level would be 1.2700. Once hurdle, the next stop would be 1.2750.
GBP/USD Price Action – Daily Chart


© 2000-2026. Sva prava zaštićena.
Sajt je vlasništvo kompanije Teletrade D.J. LLC 2351 LLC 2022 (Euro House, Richmond Hill Road, Kingstown, VC0100, St. Vincent and the Grenadines).
Svi podaci koji se nalaze na sajtu ne predstavljaju osnovu za donošenje investicionih odluka, već su informativnog karaktera.
The company does not serve or provide services to customers who are residents of the US, Canada, Iran, The Democratic People's Republic of Korea, Yemen and FATF blacklisted countries.
Izvršenje trgovinskih operacija sa finansijskim instrumentima upotrebom marginalne trgovine pruža velike mogućnosti i omogućava investitorima ostvarivanje visokih prihoda. Međutim, takav vid trgovine povezan je sa potencijalno visokim nivoom rizika od gubitka sredstava. Проведение торговых операций на финанcовых рынках c маржинальными финанcовыми инcтрументами открывает широкие возможноcти, и позволяет инвеcторам, готовым пойти на риcк, получать выcокую прибыль, но при этом неcет в cебе потенциально выcокий уровень риcка получения убытков. Iz tog razloga je pre započinjanja trgovine potrebno odlučiti o izboru odgovarajuće investicione strategije, uzimajući u obzir raspoložive resurse.
Upotreba informacija: U slučaju potpunog ili delimičnog preuzimanja i daljeg korišćenja materijala koji se nalazi na sajtu, potrebno je navesti link odgovarajuće stranice na sajtu kompanije TeleTrade-a kao izvora informacija. Upotreba materijala na internetu mora biti praćena hiper linkom do web stranice teletrade.org. Automatski uvoz materijala i informacija sa stranice je zabranjen.
Ako imate bilo kakvih pitanja, obratite nam se pr@teletrade.global.
транcфери