- Analiza
- Novosti i instrumenti
- Vesti sa tržišta
- NZD/JPY Price Analysis: Cross extends gains, establishes fresh highs above 97.00
NZD/JPY Price Analysis: Cross extends gains, establishes fresh highs above 97.00
- The cross resumed its gains, establishing new cycle highs at levels exceeding 97.00.
- The daily chart continues to display resilience, increasing chances for the upward trend to persist.
On Thursday, the NZD/JPY cross made further gains, moving past the previous resistance at 97.00 and setting a fresh cycle high. At the start of the week, support around the 20-day Simple Moving Average (SMA) at 96.30 held strong as buyers swiftly stepped in to overpower the sellers' efforts to breach this level.
The daily Relative Strength Index (RSI) for NZD/JPY currently stands at 62, denoting a climb from Wednesday's reading and overall positive momentum. Meanwhile, the Moving Average Convergence Divergence (MACD) for today prints decreasing red bars, signifying a reduction in selling pressure.
NZD/JPY daily chart
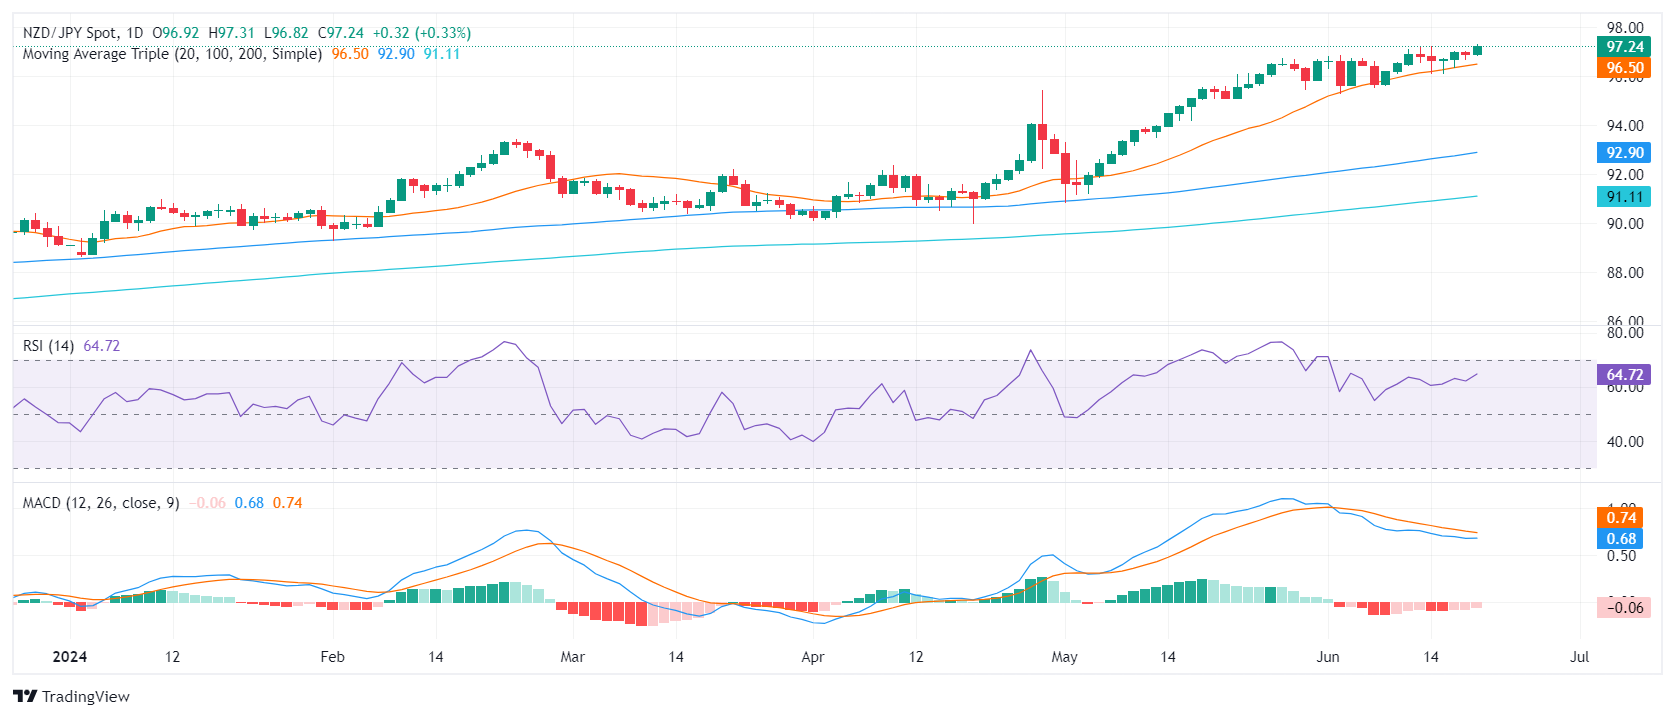
The bull's resolve to keep its position above the 20-day SMA remains steadfast. This, coupled with the resilience of the daily technical indicators, highlights a clear technical strength of the Kiwi over the Yen. The three consecutive failed attempts from the sellers to breach the 96.30 mark fuelled the buyers' momentum, which paved the way for the climb to fresh highs.
Going forward, the trading sessions may witness the cross oscillate between the immediate support at 97.00 and the resistance target of 98.00. Close monitoring of the breach above the current consolidation range or a dip below the 20-SMA mark could potentially provide insights into future movements.


© 2000-2026. Sva prava zaštićena.
Sajt je vlasništvo kompanije Teletrade D.J. LLC 2351 LLC 2022 (Euro House, Richmond Hill Road, Kingstown, VC0100, St. Vincent and the Grenadines).
Svi podaci koji se nalaze na sajtu ne predstavljaju osnovu za donošenje investicionih odluka, već su informativnog karaktera.
The company does not serve or provide services to customers who are residents of the US, Canada, Iran, The Democratic People's Republic of Korea, Yemen and FATF blacklisted countries.
Izvršenje trgovinskih operacija sa finansijskim instrumentima upotrebom marginalne trgovine pruža velike mogućnosti i omogućava investitorima ostvarivanje visokih prihoda. Međutim, takav vid trgovine povezan je sa potencijalno visokim nivoom rizika od gubitka sredstava. Проведение торговых операций на финанcовых рынках c маржинальными финанcовыми инcтрументами открывает широкие возможноcти, и позволяет инвеcторам, готовым пойти на риcк, получать выcокую прибыль, но при этом неcет в cебе потенциально выcокий уровень риcка получения убытков. Iz tog razloga je pre započinjanja trgovine potrebno odlučiti o izboru odgovarajuće investicione strategije, uzimajući u obzir raspoložive resurse.
Upotreba informacija: U slučaju potpunog ili delimičnog preuzimanja i daljeg korišćenja materijala koji se nalazi na sajtu, potrebno je navesti link odgovarajuće stranice na sajtu kompanije TeleTrade-a kao izvora informacija. Upotreba materijala na internetu mora biti praćena hiper linkom do web stranice teletrade.org. Automatski uvoz materijala i informacija sa stranice je zabranjen.
Ako imate bilo kakvih pitanja, obratite nam se pr@teletrade.global.
транcфери