- Analiza
- Novosti i instrumenti
- Vesti sa tržišta
- NZD/JPY Price Analysis: Cross dips towards 20-day SMA, sellers strengthen
NZD/JPY Price Analysis: Cross dips towards 20-day SMA, sellers strengthen
- Kiwi's grip loosens against the Yen on Friday, moving towards the 20-day SMA.
- The cross cruises through a consolidation phase while the stance of the bear is strengthening.
- Defense around the 20-day SMA starts showing signs of weakness, hinting at potential declines.
On Friday, the NZD/JPY pair faced selling pressure, with the cross declining towards the 20-day Simple Moving Average (SMA) at 95.70. It appears that the consolidation phase might have tightened its grip around the pair, restricting the buyers' ability to keep the cross afloat.
The Relative Strength Index (RSI) for NZD/JPY on the daily chart currently stands at 53, reflecting a decrease from the previous session's RSI value of 62. The RSI's movement towards the neutral zone, away from the oversold or overbought regions, hints at a moderation in buying pressure. Meanwhile, the Moving Average Convergence Divergence (MACD) has started to print rising red bars, indicating a growing selling momentum and reinforcing the possibility of extended consolidation or even possible declines.
NZD/JPY daily chart
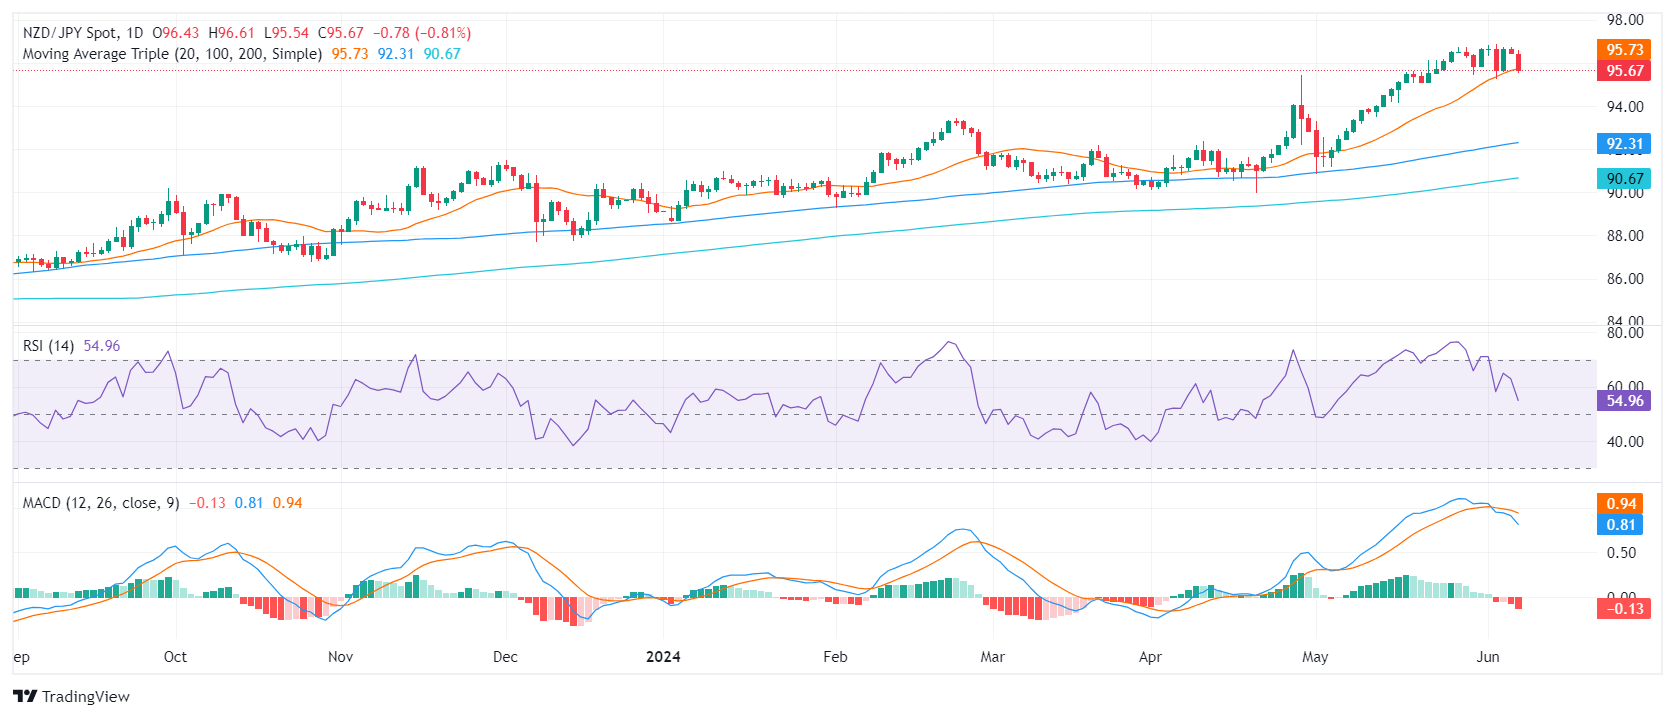
The cross's decline towards 20-day SMA coupled with strengthening selling pressure could potentially disrupt buyers' defense of the mentioned support. Despite the recent jump from around 91.00 to 96.00 since early May, it seems that consolidation has started to reign, marking a pause in the uptrend as gains are consolidated.


© 2000-2026. Sva prava zaštićena.
Sajt je vlasništvo kompanije Teletrade D.J. LLC 2351 LLC 2022 (Euro House, Richmond Hill Road, Kingstown, VC0100, St. Vincent and the Grenadines).
Svi podaci koji se nalaze na sajtu ne predstavljaju osnovu za donošenje investicionih odluka, već su informativnog karaktera.
The company does not serve or provide services to customers who are residents of the US, Canada, Iran, The Democratic People's Republic of Korea, Yemen and FATF blacklisted countries.
Izvršenje trgovinskih operacija sa finansijskim instrumentima upotrebom marginalne trgovine pruža velike mogućnosti i omogućava investitorima ostvarivanje visokih prihoda. Međutim, takav vid trgovine povezan je sa potencijalno visokim nivoom rizika od gubitka sredstava. Проведение торговых операций на финанcовых рынках c маржинальными финанcовыми инcтрументами открывает широкие возможноcти, и позволяет инвеcторам, готовым пойти на риcк, получать выcокую прибыль, но при этом неcет в cебе потенциально выcокий уровень риcка получения убытков. Iz tog razloga je pre započinjanja trgovine potrebno odlučiti o izboru odgovarajuće investicione strategije, uzimajući u obzir raspoložive resurse.
Upotreba informacija: U slučaju potpunog ili delimičnog preuzimanja i daljeg korišćenja materijala koji se nalazi na sajtu, potrebno je navesti link odgovarajuće stranice na sajtu kompanije TeleTrade-a kao izvora informacija. Upotreba materijala na internetu mora biti praćena hiper linkom do web stranice teletrade.org. Automatski uvoz materijala i informacija sa stranice je zabranjen.
Ako imate bilo kakvih pitanja, obratite nam se pr@teletrade.global.
транcфери