- Analiza
- Novosti i instrumenti
- Vesti sa tržišta
- USD/CAD Price Analysis: Consolidates around 1.3650 within a horizontal channel
USD/CAD Price Analysis: Consolidates around 1.3650 within a horizontal channel
- USD/CAD move sideways within a horizontal channel pattern.
- The technical indicator MACD suggests an emergence of a bullish bias.
- The psychological level of 1.3700 appears as the key resistance level.
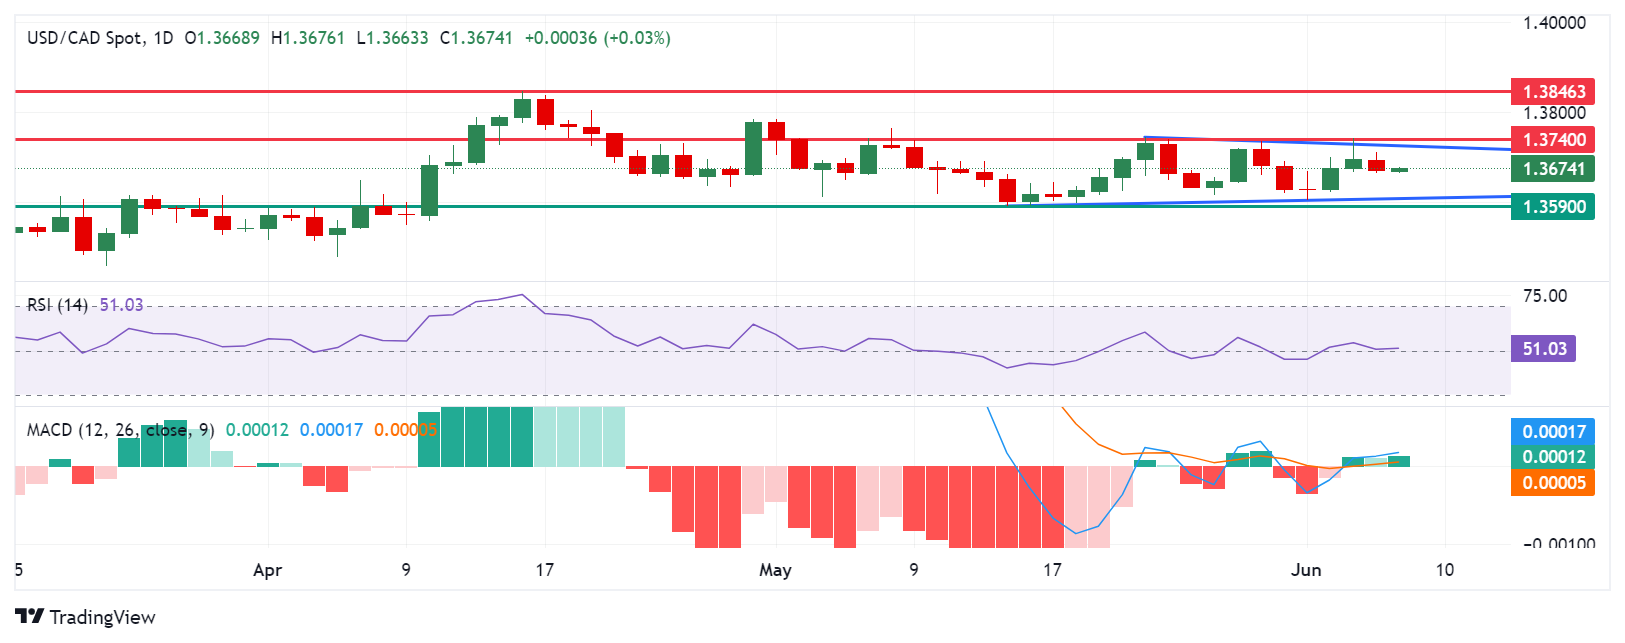
USD/CAD retraces its recent losses, trading around 1.3670 during the early European hours on Friday. Analysis of the daily chart suggests a sideways direction for the USD/CAD pair, as it remains within a horizontal channel pattern.
However, the momentum indicator 14-day Relative Strength Index (RSI) is positioned at the 50 level, and further movement may indicate a clear direction.
Additionally, the Moving Average Convergence Divergence (MACD) indicator suggests an emergence of the bullish bias for the USD/CAD pair. While the MACD line is positioned above the centerline, it shows divergence above the signal line.
On the upside, the USD/CAD pair could find the key barrier at the psychological level of 1.3700. A breakthrough above this level could provide support for the pair to test the upper boundary of the horizontal channel around the level of 1.3720, followed by the pullback resistance at 1.3740.
A surpassing of the latter could lead the USD/CAD pair to explore the region around the key level of 1.3800, followed by April’s high of 1.3846.
On the downside, the USD/CAD pair could find key support around the lower threshold of the horizontal channel around the psychological level of 1.3600, aligned with the throwback support at 1.3590.
USD/CAD: Daily Chart


© 2000-2026. Sva prava zaštićena.
Sajt je vlasništvo kompanije Teletrade D.J. LLC 2351 LLC 2022 (Euro House, Richmond Hill Road, Kingstown, VC0100, St. Vincent and the Grenadines).
Svi podaci koji se nalaze na sajtu ne predstavljaju osnovu za donošenje investicionih odluka, već su informativnog karaktera.
The company does not serve or provide services to customers who are residents of the US, Canada, Iran, The Democratic People's Republic of Korea, Yemen and FATF blacklisted countries.
Izvršenje trgovinskih operacija sa finansijskim instrumentima upotrebom marginalne trgovine pruža velike mogućnosti i omogućava investitorima ostvarivanje visokih prihoda. Međutim, takav vid trgovine povezan je sa potencijalno visokim nivoom rizika od gubitka sredstava. Проведение торговых операций на финанcовых рынках c маржинальными финанcовыми инcтрументами открывает широкие возможноcти, и позволяет инвеcторам, готовым пойти на риcк, получать выcокую прибыль, но при этом неcет в cебе потенциально выcокий уровень риcка получения убытков. Iz tog razloga je pre započinjanja trgovine potrebno odlučiti o izboru odgovarajuće investicione strategije, uzimajući u obzir raspoložive resurse.
Upotreba informacija: U slučaju potpunog ili delimičnog preuzimanja i daljeg korišćenja materijala koji se nalazi na sajtu, potrebno je navesti link odgovarajuće stranice na sajtu kompanije TeleTrade-a kao izvora informacija. Upotreba materijala na internetu mora biti praćena hiper linkom do web stranice teletrade.org. Automatski uvoz materijala i informacija sa stranice je zabranjen.
Ako imate bilo kakvih pitanja, obratite nam se pr@teletrade.global.
транcфери