- Analiza
- Novosti i instrumenti
- Vesti sa tržišta
- EUR/JPY Price Analysis: The key upside barrier emerges above 170.00
EUR/JPY Price Analysis: The key upside barrier emerges above 170.00
- EUR/JPY attracts some buyers near 169.30 in Wednesday’s early European session, up 0.50% on the day.
- The cross keeps the negative picture unchanged below the 100-period EMA, with the bearish RSI on 4-hour chart.
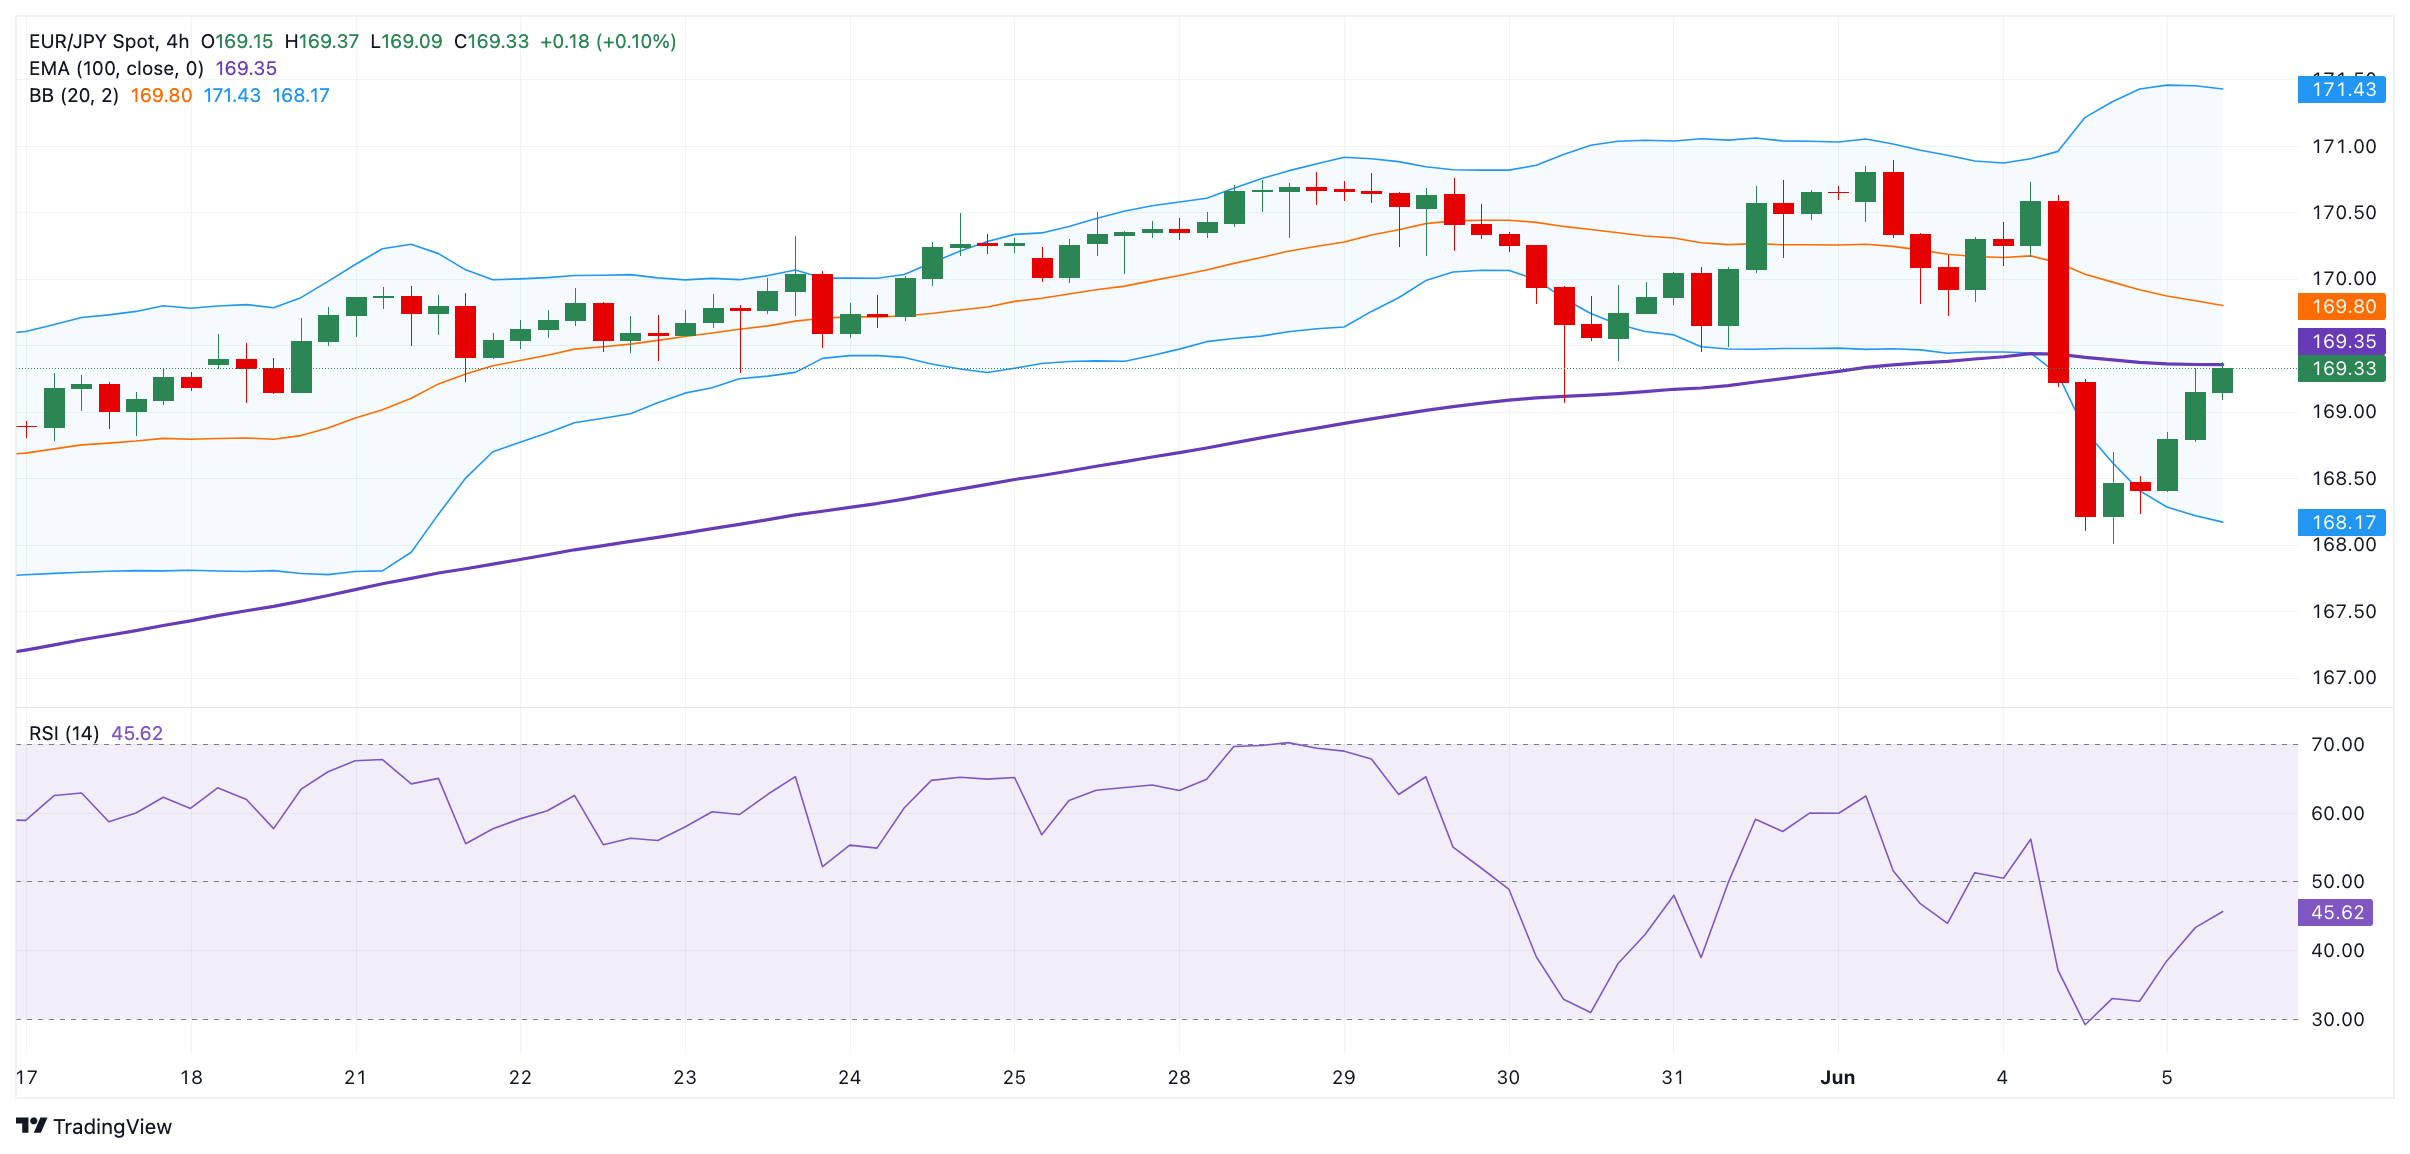
- The key upside barrier is seen at the 170.00 psychological level; the initial support level is located at 168.15.
The EUR/JPY cross snaps the two-day losing streak around 169.30 during the early European session on Wednesday. Traders closely watch the European Central Bank (ECB) interest rate decision on Thursday, which is more likely to cut interest rates by 25 basis points (bps).
Technically, EUR/JPY maintains the bearish outlook as the cross holds below the 100-period Exponential Moving Averages (EMA) on the four-hour chart. The downward momentum is backed by the Relative Strength Index (RSI), which stands in the bearish zone near 44.00, indicating the path of least resistance is to the downside.
The cross could resume the upside if it can break above the 100-period EMA at 169.35. Further north, the crucial hurdle is seen at the 170.00 psychological round mark. Any follow-through buying will see a rally to a high of June 4 at 170.72 en route to the upper boundary of Bollinger Band at 171.43.
On the other hand, the initial support level is located near the lower limit of Bollinger Band at 168.15. A breach of the mentioned level could expose a low of May 16 at 167.33. The additional downside filter to watch is a low of May 7 at 165.64.
EUR/JPY 4-hour chart


© 2000-2026. Sva prava zaštićena.
Sajt je vlasništvo kompanije Teletrade D.J. LLC 2351 LLC 2022 (Euro House, Richmond Hill Road, Kingstown, VC0100, St. Vincent and the Grenadines).
Svi podaci koji se nalaze na sajtu ne predstavljaju osnovu za donošenje investicionih odluka, već su informativnog karaktera.
The company does not serve or provide services to customers who are residents of the US, Canada, Iran, The Democratic People's Republic of Korea, Yemen and FATF blacklisted countries.
Izvršenje trgovinskih operacija sa finansijskim instrumentima upotrebom marginalne trgovine pruža velike mogućnosti i omogućava investitorima ostvarivanje visokih prihoda. Međutim, takav vid trgovine povezan je sa potencijalno visokim nivoom rizika od gubitka sredstava. Проведение торговых операций на финанcовых рынках c маржинальными финанcовыми инcтрументами открывает широкие возможноcти, и позволяет инвеcторам, готовым пойти на риcк, получать выcокую прибыль, но при этом неcет в cебе потенциально выcокий уровень риcка получения убытков. Iz tog razloga je pre započinjanja trgovine potrebno odlučiti o izboru odgovarajuće investicione strategije, uzimajući u obzir raspoložive resurse.
Upotreba informacija: U slučaju potpunog ili delimičnog preuzimanja i daljeg korišćenja materijala koji se nalazi na sajtu, potrebno je navesti link odgovarajuće stranice na sajtu kompanije TeleTrade-a kao izvora informacija. Upotreba materijala na internetu mora biti praćena hiper linkom do web stranice teletrade.org. Automatski uvoz materijala i informacija sa stranice je zabranjen.
Ako imate bilo kakvih pitanja, obratite nam se pr@teletrade.global.
транcфери