- Analiza
- Novosti i instrumenti
- Vesti sa tržišta
- NZD/USD Price Analysis: Tests Bullish Flag breakout region
NZD/USD Price Analysis: Tests Bullish Flag breakout region
- NZD/USD drops as the US Dollar steadies ahead of US JOLTS Job Openings data.
- Weak US factory PMI report prompts Fed rate-cut bets.
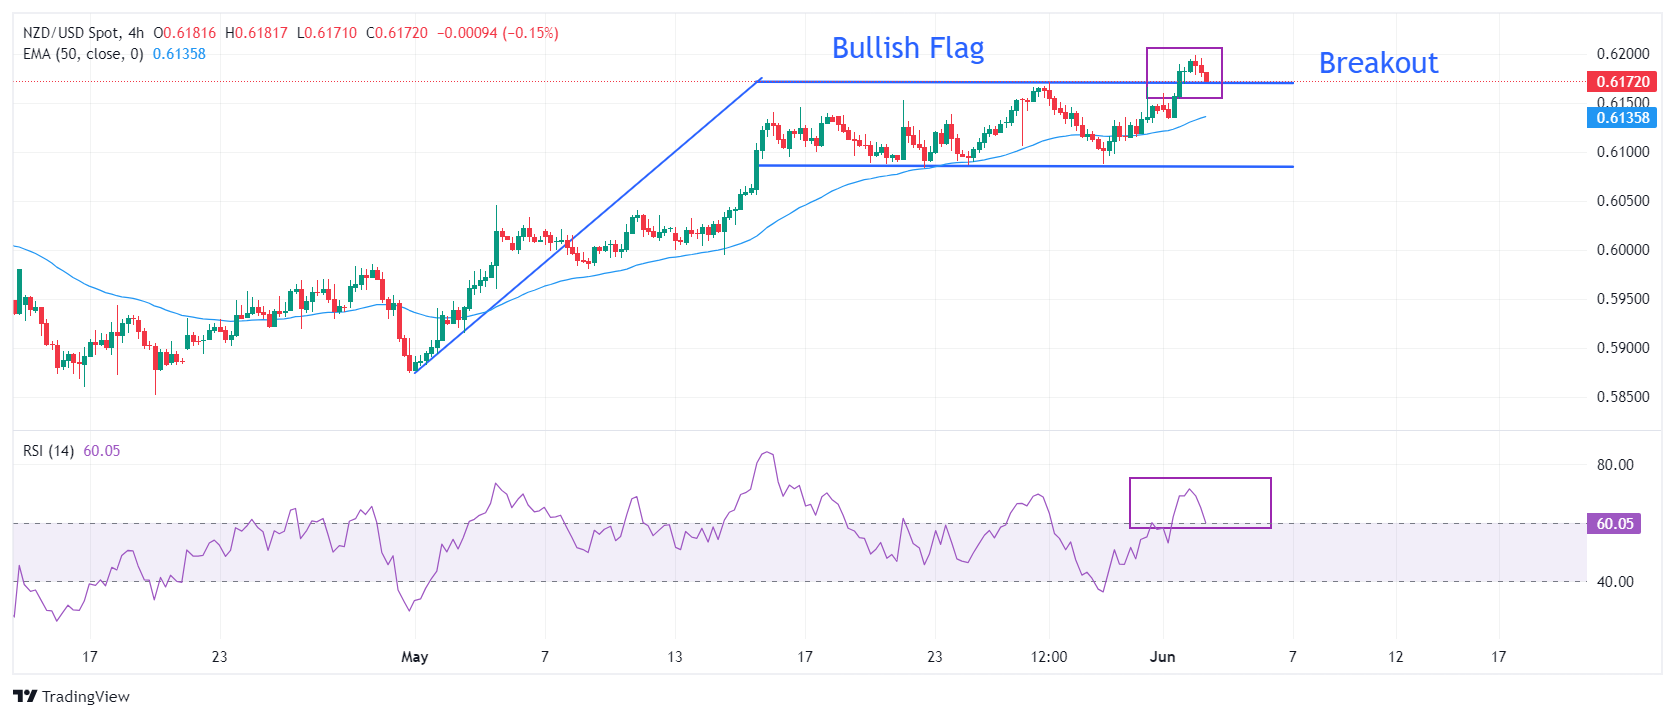
- NZD/USD tests the Bullish Flag breakout region near 0.6170
The NZD/USD pair corrects modestly from fresh almost three-month high of 0.6200 in Tuesday’s European session. The Kiwi asset drops as the US Dollar (USD) gains ground after a sharp sell-off move on Monday. The US Dollar Index (DXY) finds a temporary cushion near 104.00. While the broader outlook of the US Dollar remains poor amid growing speculation that the Federal Reserve (Fed) will begin lowering its key interest rates in the September meeting.
Firm speculation for Fed rate-cuts in September is boosted by diminishing confidence of investors in the United States (US) economic strength. Weak US ISM Manufacturing PMI report for May and downwardly revised Q1 Gross Domestic Product (GDP) estimates have shaken investors’ confidence.
In today’s session, investors shift focus to the US JOLTS Job Openings data for April, which will be published at 14:00 GMT. US employers are estimated to have posted 8.34 million jobs, lower than the prior reading of 8.49 million. Lower job postings suggest easing labor market conditions.
Meanwhile, the New Zealand Dollar has performed strongly in last few trading sessions as investors worry about persistent price pressures in the kiwi economy, which keeps possibility of more rates hikes by the Reserve Bank of New Zealand (RBNZ) on the table.
NZD/USD delivers a modest corrective move and tests the strength of the Bullish Flag chart pattern breakout delivered on Monday. The above-mentioned chart formation exhibits an inventory adjustment process between institutional investors and retail participants. This pattern indicates a consolidation after a sharp upside move and it generally breaks towards the direction of the trend, which in this is upwards.
The 50-period Exponential Moving Average (EMA) near 0.6126 continues to provide support to the New Zealand Dollar bulls.
Meanwhile, the 14-period Relative Strength Index (RSI) has climbed above 60.00. A sustainable move above 60.00 will strengthen Kiwi bulls further.
An upside move above the round-level resistance of 0.6200 will drive the asset January 15 high near 0.6250, followed by January 12 high near 0.6280.
On the contrary, fresh downside would appear if the asset breaks below April 4 high around 0.6050 This would drag the asset towards the psychological support of 0.6000 and April 25 high at 0.5969.
NZD/USD four-hour chart


© 2000-2026. Sva prava zaštićena.
Sajt je vlasništvo kompanije Teletrade D.J. LLC 2351 LLC 2022 (Euro House, Richmond Hill Road, Kingstown, VC0100, St. Vincent and the Grenadines).
Svi podaci koji se nalaze na sajtu ne predstavljaju osnovu za donošenje investicionih odluka, već su informativnog karaktera.
The company does not serve or provide services to customers who are residents of the US, Canada, Iran, The Democratic People's Republic of Korea, Yemen and FATF blacklisted countries.
Izvršenje trgovinskih operacija sa finansijskim instrumentima upotrebom marginalne trgovine pruža velike mogućnosti i omogućava investitorima ostvarivanje visokih prihoda. Međutim, takav vid trgovine povezan je sa potencijalno visokim nivoom rizika od gubitka sredstava. Проведение торговых операций на финанcовых рынках c маржинальными финанcовыми инcтрументами открывает широкие возможноcти, и позволяет инвеcторам, готовым пойти на риcк, получать выcокую прибыль, но при этом неcет в cебе потенциально выcокий уровень риcка получения убытков. Iz tog razloga je pre započinjanja trgovine potrebno odlučiti o izboru odgovarajuće investicione strategije, uzimajući u obzir raspoložive resurse.
Upotreba informacija: U slučaju potpunog ili delimičnog preuzimanja i daljeg korišćenja materijala koji se nalazi na sajtu, potrebno je navesti link odgovarajuće stranice na sajtu kompanije TeleTrade-a kao izvora informacija. Upotreba materijala na internetu mora biti praćena hiper linkom do web stranice teletrade.org. Automatski uvoz materijala i informacija sa stranice je zabranjen.
Ako imate bilo kakvih pitanja, obratite nam se pr@teletrade.global.
транcфери