- Analiza
- Novosti i instrumenti
- Vesti sa tržišta
- AUD/JPY Price Analysis: Downward momentum resumes, consolidation still possible
AUD/JPY Price Analysis: Downward momentum resumes, consolidation still possible
- Daily chart indicators suggest a downward trend; the decline in RSI is marking a downward momentum
- Signs of bullish exhaustion after the recent gains have strengthened the consolidation outlook.
- The pair currently targets support around the 103.70 area, which aligns with the 20-day SMA.
In Monday's trading session, the AUD/JPY pair slipped to the 104.35 region due to the resumption of a downward momentum. The pair's upward trajectory appears increasingly exhausted, and a consolidation phase seems more probable moving forward.
As per the daily chart, the RSI has descended to 59 from the previous session's reading of 65, suggesting a continued downward momentum. Along with this, the MACD prints rising red bars, indicating an increase in the selling traction
AUD/JPY daily chart
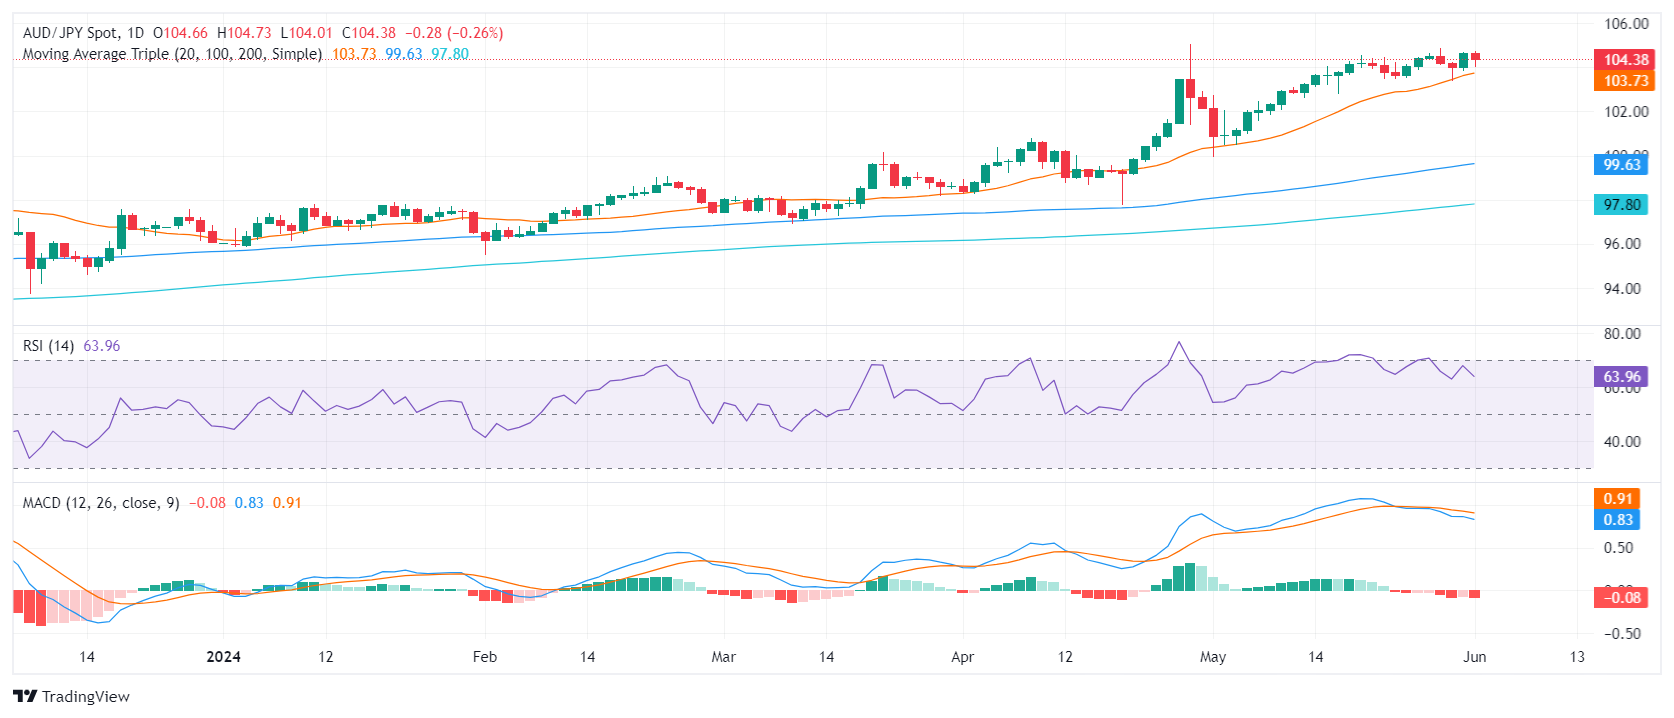
The 20-day SMA has now established a sturdy support base around the 103.70 region, which could potentially halt the ongoing losses. Any breakthrough below the 20-day SMA could prompt a short-term bearish atmosphere.
In the case of a further decline, the 100 and 200-day SMA might act as barriers to cushion losses. On the other hand, the bulls might face resistance in trying to push the pair back above the 105.00 mark. If the pair fails to break through these integral points, traders might witness the pair entering into a consolidation phase.


© 2000-2026. Sva prava zaštićena.
Sajt je vlasništvo kompanije Teletrade D.J. LLC 2351 LLC 2022 (Euro House, Richmond Hill Road, Kingstown, VC0100, St. Vincent and the Grenadines).
Svi podaci koji se nalaze na sajtu ne predstavljaju osnovu za donošenje investicionih odluka, već su informativnog karaktera.
The company does not serve or provide services to customers who are residents of the US, Canada, Iran, The Democratic People's Republic of Korea, Yemen and FATF blacklisted countries.
Izvršenje trgovinskih operacija sa finansijskim instrumentima upotrebom marginalne trgovine pruža velike mogućnosti i omogućava investitorima ostvarivanje visokih prihoda. Međutim, takav vid trgovine povezan je sa potencijalno visokim nivoom rizika od gubitka sredstava. Проведение торговых операций на финанcовых рынках c маржинальными финанcовыми инcтрументами открывает широкие возможноcти, и позволяет инвеcторам, готовым пойти на риcк, получать выcокую прибыль, но при этом неcет в cебе потенциально выcокий уровень риcка получения убытков. Iz tog razloga je pre započinjanja trgovine potrebno odlučiti o izboru odgovarajuće investicione strategije, uzimajući u obzir raspoložive resurse.
Upotreba informacija: U slučaju potpunog ili delimičnog preuzimanja i daljeg korišćenja materijala koji se nalazi na sajtu, potrebno je navesti link odgovarajuće stranice na sajtu kompanije TeleTrade-a kao izvora informacija. Upotreba materijala na internetu mora biti praćena hiper linkom do web stranice teletrade.org. Automatski uvoz materijala i informacija sa stranice je zabranjen.
Ako imate bilo kakvih pitanja, obratite nam se pr@teletrade.global.
транcфери