- Analiza
- Novosti i instrumenti
- Vesti sa tržišta
- AUD/USD price Analysis: Volatility contracts amid Descending Triangle formation
AUD/USD price Analysis: Volatility contracts amid Descending Triangle formation
- AUD/USD jumps to near 0.6650 ahead of US core PCE Inflation data.
- The US Dollar weakens as a downwardly revised Q1 GDP keeps hopes of the Fed cutting rates at least once this year on the table.
- Australia’s hot CPI report for April pushes back RBA’s rate-cut prospects.
The AUD/USD pair climbs to near 0.6650 in Friday’s London session. The Aussie asset strengthens as the US Dollar weakens ahead of United States core Personal Consumption Expenditure Price Index (PCE) data for April, which will be published at 12:30 GMT.
The US core PCE Inflation will provide cues about when the Federal Reserve (Fed) will start reducing interest rates. Currently, financial markets are mixed about September’s policy meeting.
Economists expect that core PCE inflation rose steadily by 0.3% and 2.8% monthly and annually, respectively.
The US Dollar Index (DXY) seems vulnerable near day’s low around 104.65. The near-term outlook of the US Dollar turned uncertain after US Bureau of Economic Analysis (BEA) reported its second estimates report for Q1 Gross Domestic Product (GDP) that the economy expanded at a slower pace of 1.3% due to lower consumer spendings from the preliminary estimates of 1.6%.
Meanwhile, the Australian Dollar’s appeal is upbeat as hot monthly Consumer Price Index (CPI) data for April has forced traders to pare Reserve Bank of Australia’s (RBA) early rate-cut bets. Annually, price pressures rose at a higher pace of 3.6% than estimates of 3.5% and the former reading of 3.4%.
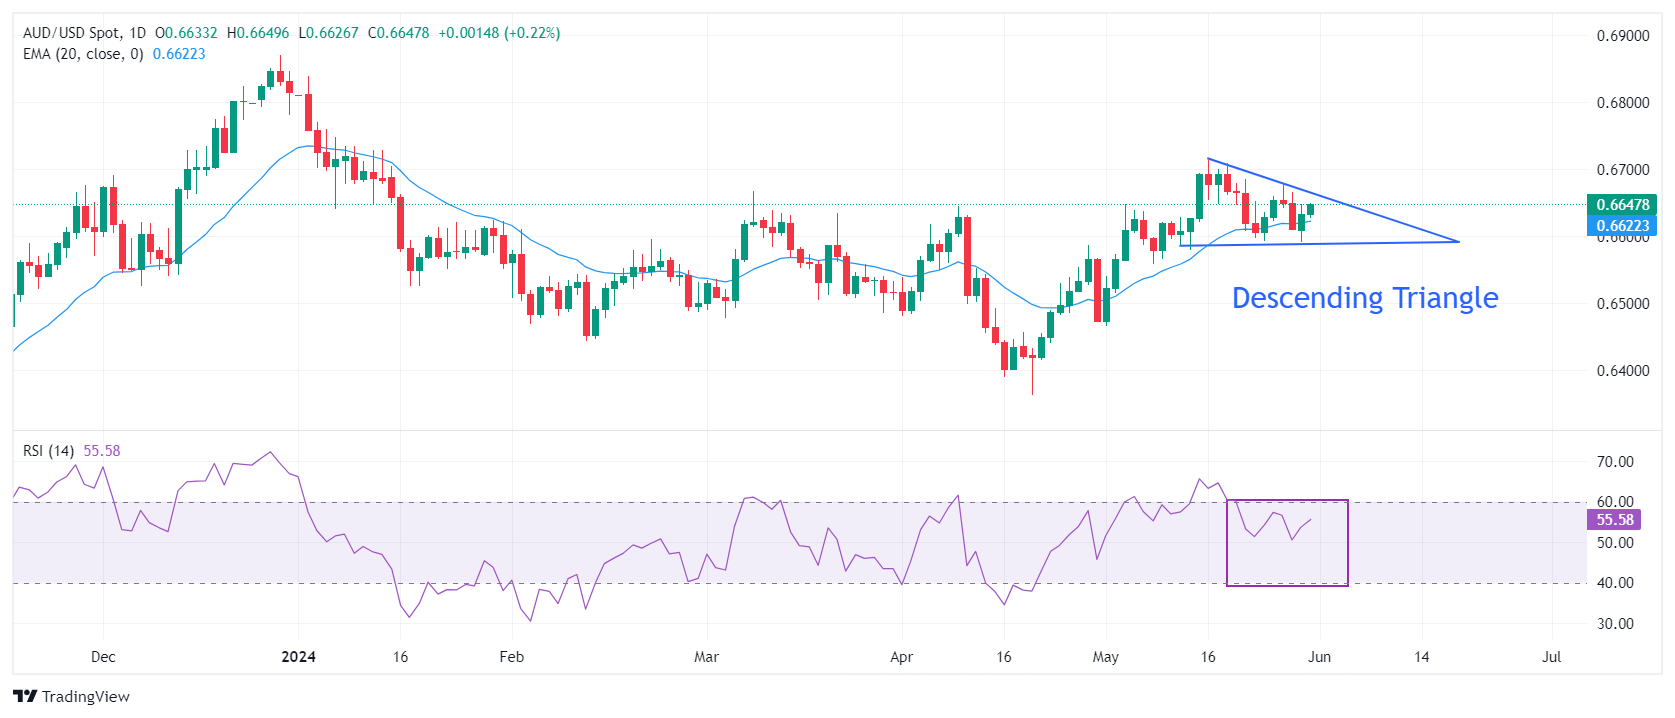
AUD/USD advances toward the downward-sloping border of the Descending Triangle chart pattern, which is plotted from May 16 high at 0.6714, formed on a daily timeframe. The horizontal support of the above-mentioned chart formation is marked from May 13 low at 0.6586.
Upward-sloping 20-day Exponential Moving Average (EMA) near 0.6620 suggests that the near-term trend is bullish.
The 14-period Relative Strength Index (RSI) oscillates in the 40.00-60.00 range, indicating a sharp volatility contraction.
Going forward, a decisive move above May’s high at 0.6714 will drive the asset towards January 3 high at 0.6771 and the round-level resistance of 0.6800.
Alternatively, a downside move would appear if the major breaks below May 14 low at 0.6580, which will expose it to May 1 high at 0.6540, followed by the psychological support of 0.6500.
AUD/USD daily chart


© 2000-2026. Sva prava zaštićena.
Sajt je vlasništvo kompanije Teletrade D.J. LLC 2351 LLC 2022 (Euro House, Richmond Hill Road, Kingstown, VC0100, St. Vincent and the Grenadines).
Svi podaci koji se nalaze na sajtu ne predstavljaju osnovu za donošenje investicionih odluka, već su informativnog karaktera.
The company does not serve or provide services to customers who are residents of the US, Canada, Iran, The Democratic People's Republic of Korea, Yemen and FATF blacklisted countries.
Izvršenje trgovinskih operacija sa finansijskim instrumentima upotrebom marginalne trgovine pruža velike mogućnosti i omogućava investitorima ostvarivanje visokih prihoda. Međutim, takav vid trgovine povezan je sa potencijalno visokim nivoom rizika od gubitka sredstava. Проведение торговых операций на финанcовых рынках c маржинальными финанcовыми инcтрументами открывает широкие возможноcти, и позволяет инвеcторам, готовым пойти на риcк, получать выcокую прибыль, но при этом неcет в cебе потенциально выcокий уровень риcка получения убытков. Iz tog razloga je pre započinjanja trgovine potrebno odlučiti o izboru odgovarajuće investicione strategije, uzimajući u obzir raspoložive resurse.
Upotreba informacija: U slučaju potpunog ili delimičnog preuzimanja i daljeg korišćenja materijala koji se nalazi na sajtu, potrebno je navesti link odgovarajuće stranice na sajtu kompanije TeleTrade-a kao izvora informacija. Upotreba materijala na internetu mora biti praćena hiper linkom do web stranice teletrade.org. Automatski uvoz materijala i informacija sa stranice je zabranjen.
Ako imate bilo kakvih pitanja, obratite nam se pr@teletrade.global.
транcфери