- Analiza
- Novosti i instrumenti
- Vesti sa tržišta
- AUD/JPY Price Analysis: Hits two-week low, yet regain 104.00
AUD/JPY Price Analysis: Hits two-week low, yet regain 104.00
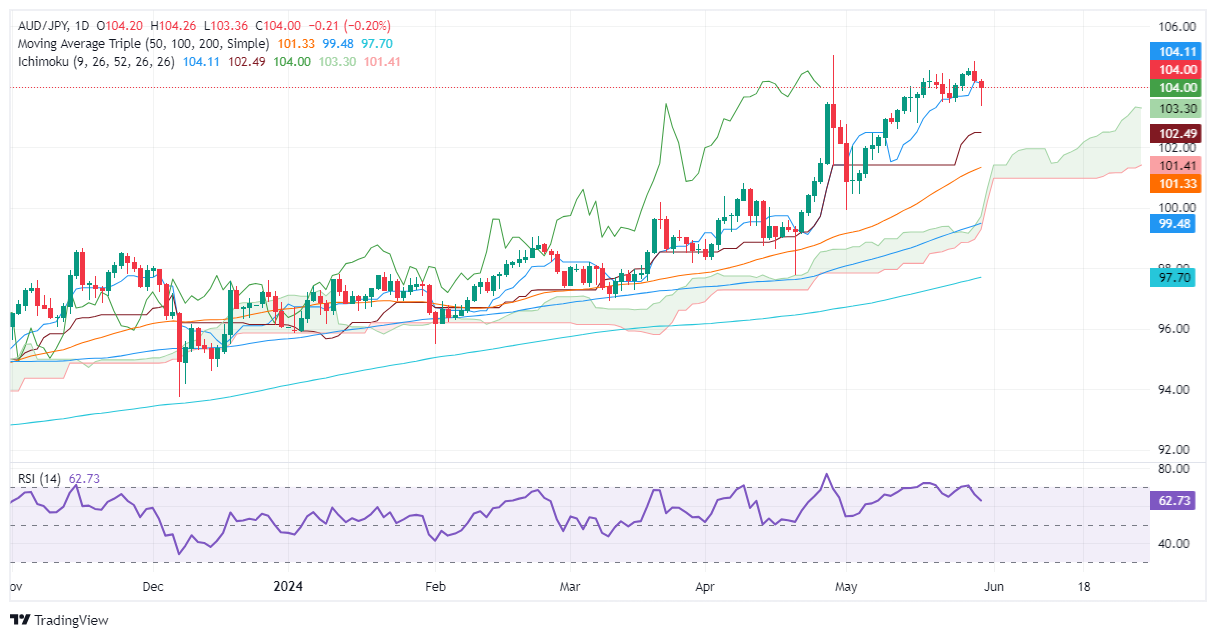
- AUD/JPY registers losses, hitting a two-week low of 103.89 before stabilizing at 104.00.
- Technical outlook shows upward bias, but recent 'evening star' pattern indicates potential for further downside.
- Key levels to watch: Resistance at 104.50 and 104.94 YTD high; support at 103.27 (Senkou Span A) and 102.42 (Kijun-Sen).
The Australian Dollar registered modest losses of around 0.17% against the Japanese Yen on Thursday and slipped below 104.00 to hit a two-week low of 103.89. As Friday’s Asian session begins, the AUD/JPY trades at 104.00, virtually flat.
AUD/JPY Price Analysis: Technical outlook
The pair is upward biased as shown by the daily chart, yet it remains shy of cracking the current year-to-date (YTD) high of 104.94. Three days ago, the AUD/JPY climbed sharply toward 104.84, but buyers were unable to continue to push prices higher, finishing the session in the red.
That formed a two-candle chart pattern called an ‘evening star’, pushing the exchange rate lower on Thursday, but buyers ultimately regained control.
From a momentum standpoint, the Relative Strength Index (RSI) shows that bulls are in charge.
That said, the AUD/JPY's next resistance level would be 104.50, followed by the YTD high at 104.94. Conversely, if the cross extends its losses past Thursday’s low of 103.89, that could exacerbate the pair’s downfall toward the Senkou Span A support level at 103.27 before challenging the Kijun-Sen at 102.42.
AUD/JPY Price Action – Daily Chart


© 2000-2026. Sva prava zaštićena.
Sajt je vlasništvo kompanije Teletrade D.J. LLC 2351 LLC 2022 (Euro House, Richmond Hill Road, Kingstown, VC0100, St. Vincent and the Grenadines).
Svi podaci koji se nalaze na sajtu ne predstavljaju osnovu za donošenje investicionih odluka, već su informativnog karaktera.
The company does not serve or provide services to customers who are residents of the US, Canada, Iran, The Democratic People's Republic of Korea, Yemen and FATF blacklisted countries.
Izvršenje trgovinskih operacija sa finansijskim instrumentima upotrebom marginalne trgovine pruža velike mogućnosti i omogućava investitorima ostvarivanje visokih prihoda. Međutim, takav vid trgovine povezan je sa potencijalno visokim nivoom rizika od gubitka sredstava. Проведение торговых операций на финанcовых рынках c маржинальными финанcовыми инcтрументами открывает широкие возможноcти, и позволяет инвеcторам, готовым пойти на риcк, получать выcокую прибыль, но при этом неcет в cебе потенциально выcокий уровень риcка получения убытков. Iz tog razloga je pre započinjanja trgovine potrebno odlučiti o izboru odgovarajuće investicione strategije, uzimajući u obzir raspoložive resurse.
Upotreba informacija: U slučaju potpunog ili delimičnog preuzimanja i daljeg korišćenja materijala koji se nalazi na sajtu, potrebno je navesti link odgovarajuće stranice na sajtu kompanije TeleTrade-a kao izvora informacija. Upotreba materijala na internetu mora biti praćena hiper linkom do web stranice teletrade.org. Automatski uvoz materijala i informacija sa stranice je zabranjen.
Ako imate bilo kakvih pitanja, obratite nam se pr@teletrade.global.
транcфери