- Analiza
- Novosti i instrumenti
- Vesti sa tržišta
- NZD/JPY Price Analysis: Bullish momentum eases, buyers and sellers find consolidation
NZD/JPY Price Analysis: Bullish momentum eases, buyers and sellers find consolidation
- The daily chart escapes overbought signals as the overall trend begins to consolidate.
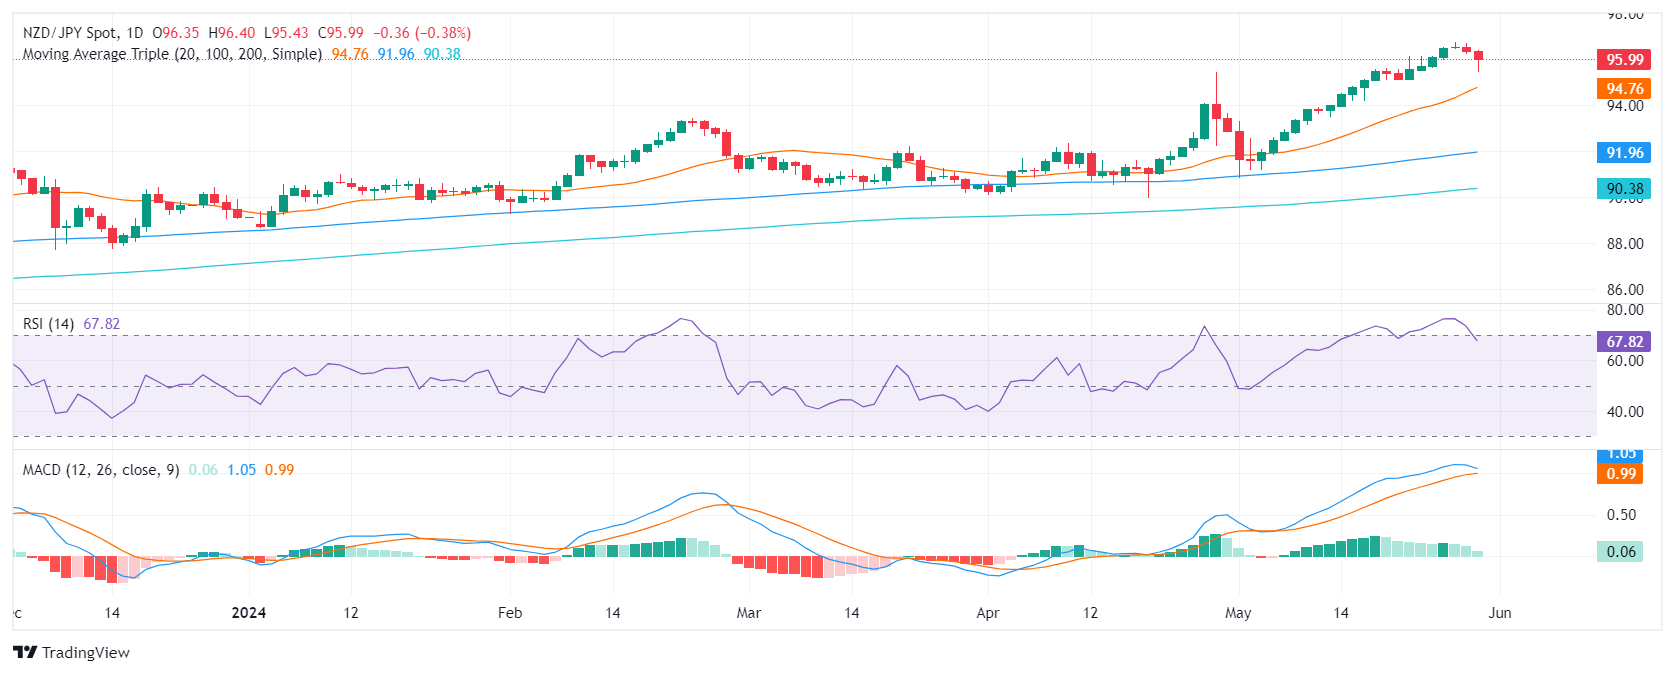
- After reaching multi-year highs above 96.70, NZD/JPY enters a phase of consolidation with support found at 95.50.
- The 95.00 offers strong support to prevent further losses.
On Thursday's trading session, the NZD/JPY pair underwent further corrections, with sellers gaining momentum. Nonetheless, the pair managed to clear some losses and found strong support at 95.50. Traders are also eying the 95.00 threshold to prevent further losses. While signs of a possible reversal in momentum have waned, the overall outlook remains a phase of consolidation.
According to the daily chart indicators, the Relative Strength Index (RSI) now stands below 70, reflecting a change from previous overbought conditions. This coincides with a potential pause or slow in price gains. Simultaneously, the Moving Average Convergence Divergence (MACD) indicates a decrease in positive momentum with shrinking green bars.
NZD/JPY daily chart
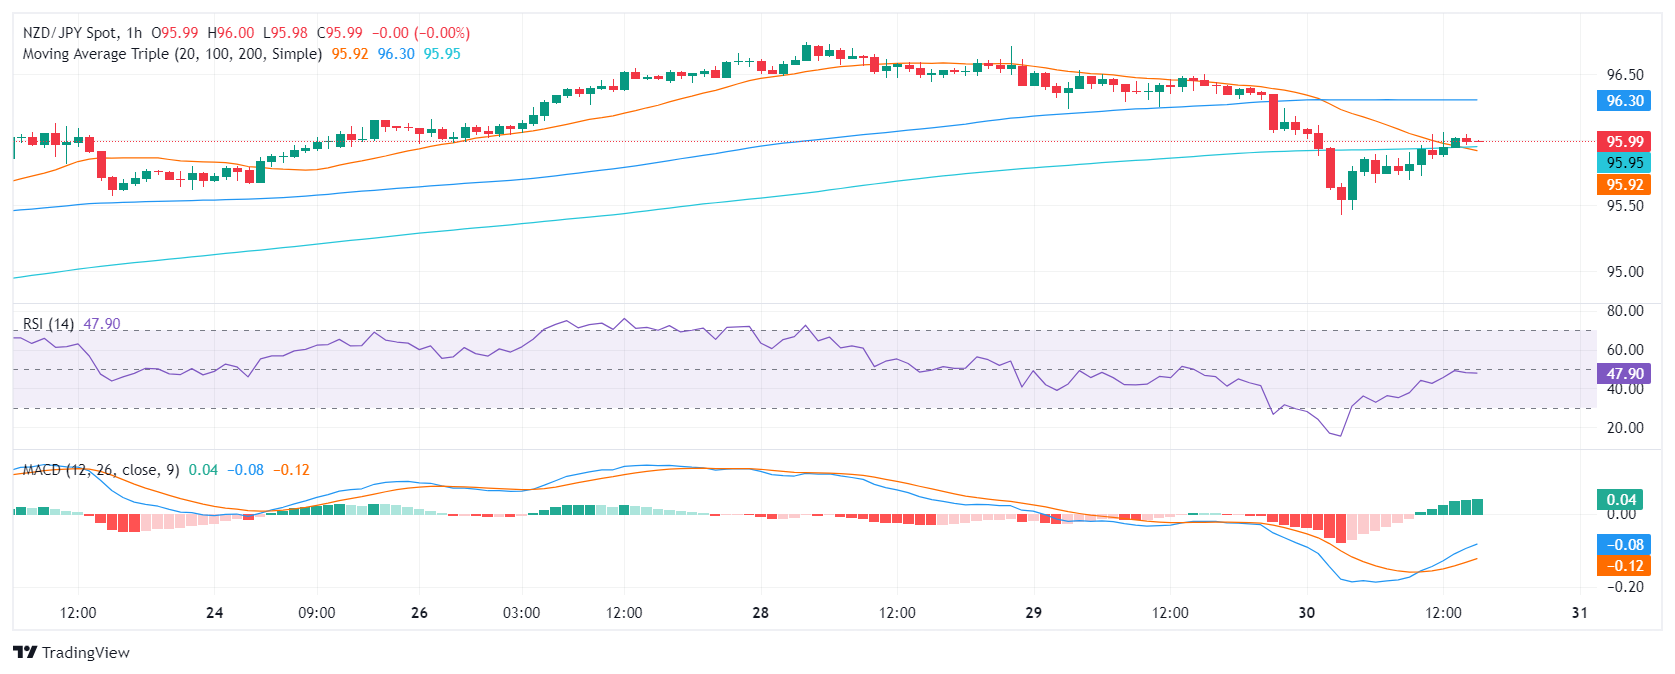
Glancing at the hourly chart, the RSI and MACD histograms have both flattened in negative territory. This suggests that sellers may be losing traction on an hourly basis, indicating consolidation.
NZD/JPY hourly chart
As the consolidation phase continues, any downward movements that keep the pair above its Simple Moving Averages (SMAs) could be considered corrective, providing the pair stays above the key support level of 95.00.


© 2000-2026. Sva prava zaštićena.
Sajt je vlasništvo kompanije Teletrade D.J. LLC 2351 LLC 2022 (Euro House, Richmond Hill Road, Kingstown, VC0100, St. Vincent and the Grenadines).
Svi podaci koji se nalaze na sajtu ne predstavljaju osnovu za donošenje investicionih odluka, već su informativnog karaktera.
The company does not serve or provide services to customers who are residents of the US, Canada, Iran, The Democratic People's Republic of Korea, Yemen and FATF blacklisted countries.
Izvršenje trgovinskih operacija sa finansijskim instrumentima upotrebom marginalne trgovine pruža velike mogućnosti i omogućava investitorima ostvarivanje visokih prihoda. Međutim, takav vid trgovine povezan je sa potencijalno visokim nivoom rizika od gubitka sredstava. Проведение торговых операций на финанcовых рынках c маржинальными финанcовыми инcтрументами открывает широкие возможноcти, и позволяет инвеcторам, готовым пойти на риcк, получать выcокую прибыль, но при этом неcет в cебе потенциально выcокий уровень риcка получения убытков. Iz tog razloga je pre započinjanja trgovine potrebno odlučiti o izboru odgovarajuće investicione strategije, uzimajući u obzir raspoložive resurse.
Upotreba informacija: U slučaju potpunog ili delimičnog preuzimanja i daljeg korišćenja materijala koji se nalazi na sajtu, potrebno je navesti link odgovarajuće stranice na sajtu kompanije TeleTrade-a kao izvora informacija. Upotreba materijala na internetu mora biti praćena hiper linkom do web stranice teletrade.org. Automatski uvoz materijala i informacija sa stranice je zabranjen.
Ako imate bilo kakvih pitanja, obratite nam se pr@teletrade.global.
транcфери