- Analiza
- Novosti i instrumenti
- Vesti sa tržišta
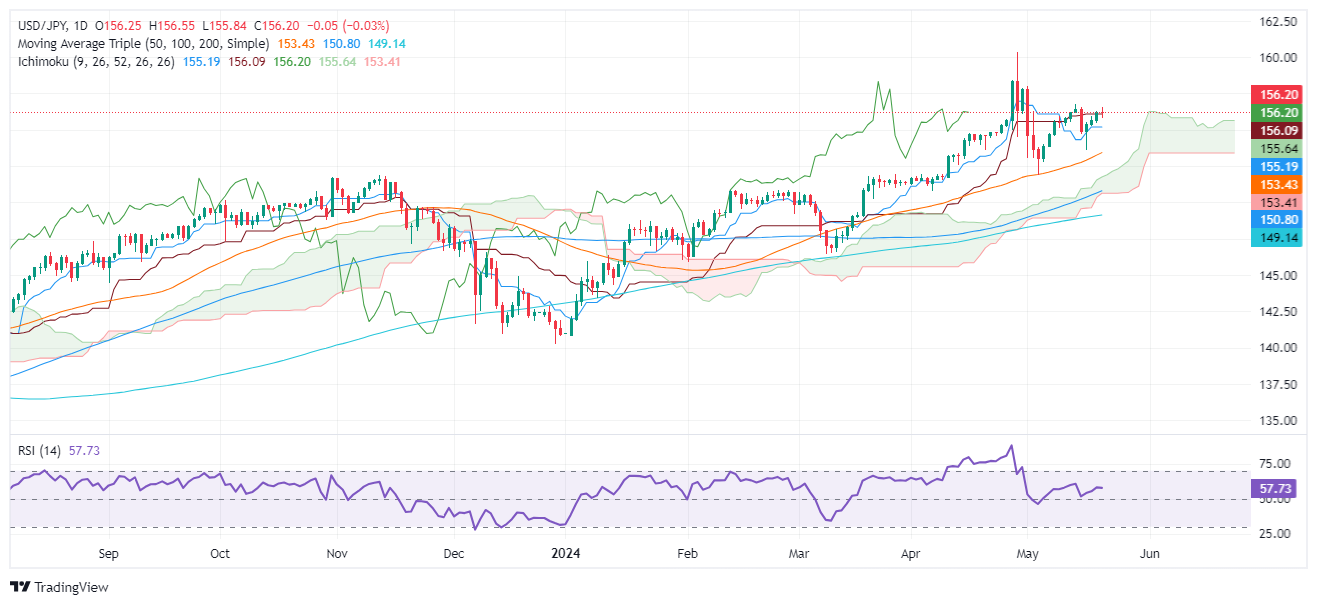
- USD/JPY Price Analysis: Sideways below 156.50 as US yields fall
USD/JPY Price Analysis: Sideways below 156.50 as US yields fall
- USD/JPY faces resistance at 156.50 as 10-year Treasury yields decline.
- Bullish technical outlook with waning momentum; RSI under 50 could signal potential losses.
- Resistance levels lie at 156.76, 157.00, and YTD high of 160.32.
- Key support emerges at 156.00, Senkou Span A (155.61), and Kijun-Sen (155.18).
The USD/JPY pair faces stir resistance at around 156.50 retreats as the US 10-year Treasury note yield drops three and a half basis points, a headwind for the Greenback. The positive correlation between the major and the US 10-year note yield weighed on the pair, down 0.06%, and trades at 156.19.
USD/JPY Price Analysis: Technical outlook
The USD/JPY remains upward biased, but buyers seem to have lost some momentum. They remain unable to bring the pair upwards and challenge the latest cycle high of 156.76, the May 14 high. The Relative Strength Index (RSI) suggests that buying pressure is fading. Despite standing in bullish territory, if the RSI punches below the 50-midline, that could pave the way for USD/JPY losses.
For a bullish continuation, the USD/JPY first resistance would be 156.76, followed by 157.00. Up next would be the May 1 high at 157.98, ahead of challenging the year-to-date (YTD) high of 160.32.
On the flip side, and the most likely path in the near term, if USD/JPY tumbles below 156.00, the first support would be the Senkou Span A at 155.61. Once cleared, the next stop would be the Kijun-Sen at 155.18 ahead of 155.00.
USD/JPY Price Action – Daily Chart


© 2000-2026. Sva prava zaštićena.
Sajt je vlasništvo kompanije Teletrade D.J. LLC 2351 LLC 2022 (Euro House, Richmond Hill Road, Kingstown, VC0100, St. Vincent and the Grenadines).
Svi podaci koji se nalaze na sajtu ne predstavljaju osnovu za donošenje investicionih odluka, već su informativnog karaktera.
The company does not serve or provide services to customers who are residents of the US, Canada, Iran, The Democratic People's Republic of Korea, Yemen and FATF blacklisted countries.
Izvršenje trgovinskih operacija sa finansijskim instrumentima upotrebom marginalne trgovine pruža velike mogućnosti i omogućava investitorima ostvarivanje visokih prihoda. Međutim, takav vid trgovine povezan je sa potencijalno visokim nivoom rizika od gubitka sredstava. Проведение торговых операций на финанcовых рынках c маржинальными финанcовыми инcтрументами открывает широкие возможноcти, и позволяет инвеcторам, готовым пойти на риcк, получать выcокую прибыль, но при этом неcет в cебе потенциально выcокий уровень риcка получения убытков. Iz tog razloga je pre započinjanja trgovine potrebno odlučiti o izboru odgovarajuće investicione strategije, uzimajući u obzir raspoložive resurse.
Upotreba informacija: U slučaju potpunog ili delimičnog preuzimanja i daljeg korišćenja materijala koji se nalazi na sajtu, potrebno je navesti link odgovarajuće stranice na sajtu kompanije TeleTrade-a kao izvora informacija. Upotreba materijala na internetu mora biti praćena hiper linkom do web stranice teletrade.org. Automatski uvoz materijala i informacija sa stranice je zabranjen.
Ako imate bilo kakvih pitanja, obratite nam se pr@teletrade.global.
транcфери