- Analiza
- Novosti i instrumenti
- Vesti sa tržišta
- USD/NOK trades mildly lower after Norwegian CPI data
USD/NOK trades mildly lower after Norwegian CPI data
- Despite hot inflation readings from Norway, the Fed’s hawkish stance limits the downside.
- Markets are gearing up for next week’s US CPI reading which may likely set the pace of the pair.
The USD/NOK pair is trading with mild losses around 10.85. The Federal Reserve's (Fed) hawkish approach seems to be aiding the USD, while strong economic recovery signals in Norway aren't offsetting this impact on the NOK. As the American calendar remains empty, all eyes are on next week’s Consumer Price Index (CPI) report from April from the US.
Norway's April CPI showed that the headline number rose to 3.6% year-on-year, which was slightly higher than anticipated, although it showed a slight drop from March's 3.9%. Meanwhile, the underlying inflation rate surprised by coming in at 4.4% year-on-year, two ticks higher than expected, and up from March's 4.5%.
Last week, the Norges Bank opted to maintain rates at 4.5% and highlighted the possibility of needing to sustain a tight monetary policy stance for a longer duration than previously anticipated, citing the current data trends. Markets are expecting only 50 bps of easing in the next 12 months.
On the US side, US Fed officials are keeping the hawkish bets steady and as for now, investors are delaying the start of the easing cycle to September.
USD/NOK technical analysis
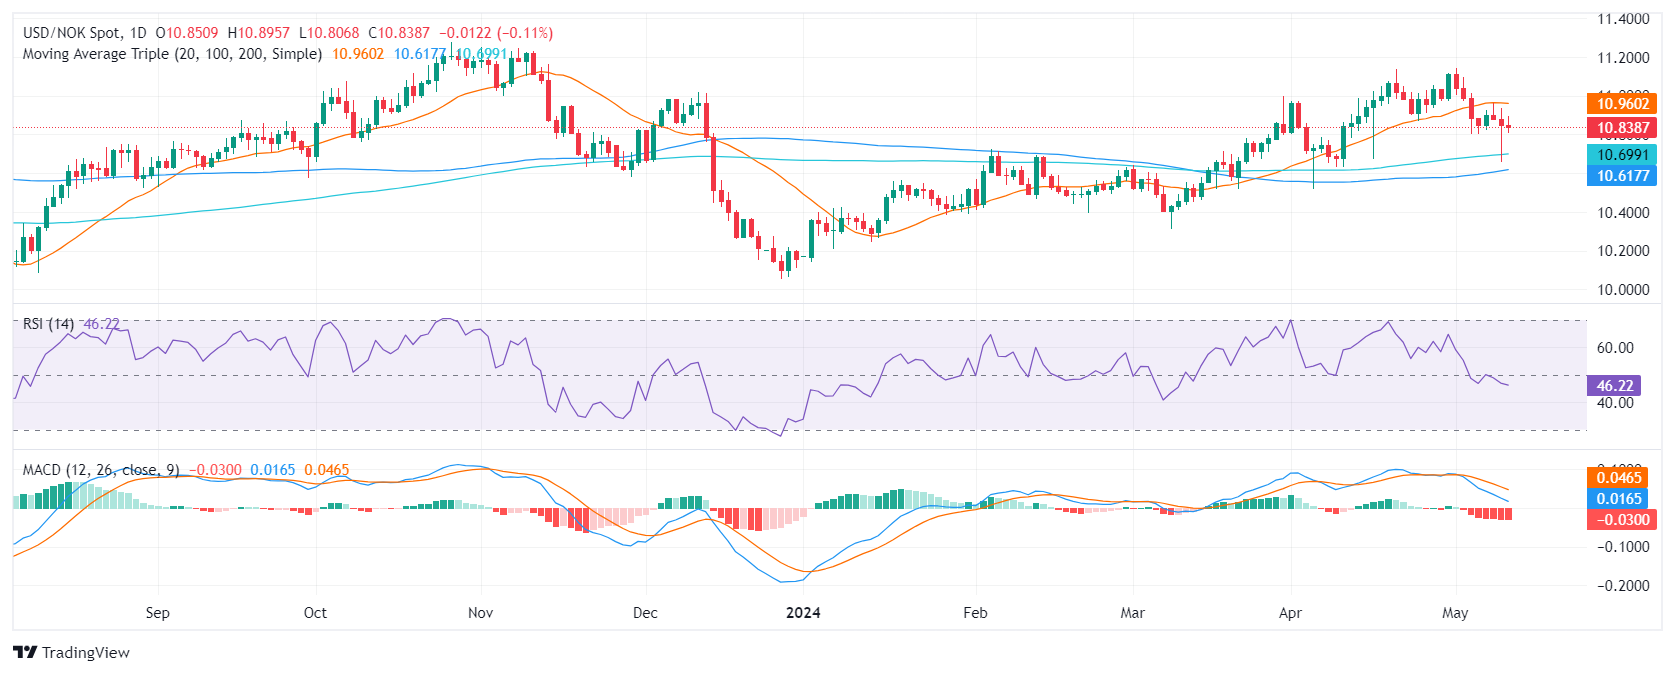
The daily Relative Strength Index (RSI) for the USD/NOK pair remains largely within the negative territory. Today's reading is at 46.66, which suggests a somewhat bearish short-term outlook. Due to its fluctuation, with an initial high near-overbought conditions and a subsequent drop, the RSI indicates the potential for bearish pressure. However, the consistent presence within the negative territory also warns of a continuous downtrend possibility.
Simultaneously, the Moving Average Convergence Divergence (MACD) histogram strengthens this view. Rising red bars signify an increasing negative momentum, with sellers gaining a more dominant position in the market.
USD/NOK technical analysis
Upon evaluation of the bigger picture, the USD/NOK chart exhibits a strong stance above the 20, 100, and 200-day Simple Moving Averages (SMAs). As the pair trades above these key moving averages, it indicates a bullish long-term trend, considering both minor and major aspects. However, given the significant trading above these levels, traders should be mindful of the potential pullback risks, which could provide possible buying opportunities.
In conclusion, despite a bearish short-term view provided by the daily RSI and MACD indicators, the placement above the SMAs suggests an overall bullish trajectory for the USD/NOK pair. Caution is warranted due to possible volatility and the likelihood of pullbacks, hence the need for continuous monitoring of market trends and indicators.
USD/NOK daily chart

© 2000-2026. Sva prava zaštićena.
Sajt je vlasništvo kompanije Teletrade D.J. LLC 2351 LLC 2022 (Euro House, Richmond Hill Road, Kingstown, VC0100, St. Vincent and the Grenadines).
Svi podaci koji se nalaze na sajtu ne predstavljaju osnovu za donošenje investicionih odluka, već su informativnog karaktera.
The company does not serve or provide services to customers who are residents of the US, Canada, Iran, The Democratic People's Republic of Korea, Yemen and FATF blacklisted countries.
Izvršenje trgovinskih operacija sa finansijskim instrumentima upotrebom marginalne trgovine pruža velike mogućnosti i omogućava investitorima ostvarivanje visokih prihoda. Međutim, takav vid trgovine povezan je sa potencijalno visokim nivoom rizika od gubitka sredstava. Проведение торговых операций на финанcовых рынках c маржинальными финанcовыми инcтрументами открывает широкие возможноcти, и позволяет инвеcторам, готовым пойти на риcк, получать выcокую прибыль, но при этом неcет в cебе потенциально выcокий уровень риcка получения убытков. Iz tog razloga je pre započinjanja trgovine potrebno odlučiti o izboru odgovarajuće investicione strategije, uzimajući u obzir raspoložive resurse.
Upotreba informacija: U slučaju potpunog ili delimičnog preuzimanja i daljeg korišćenja materijala koji se nalazi na sajtu, potrebno je navesti link odgovarajuće stranice na sajtu kompanije TeleTrade-a kao izvora informacija. Upotreba materijala na internetu mora biti praćena hiper linkom do web stranice teletrade.org. Automatski uvoz materijala i informacija sa stranice je zabranjen.
Ako imate bilo kakvih pitanja, obratite nam se pr@teletrade.global.


