- Analiza
- Novosti i instrumenti
- Vesti sa tržišta
- AUD/USD Price Analysis: Despite signs this is probably not a bullish reversal
AUD/USD Price Analysis: Despite signs this is probably not a bullish reversal
- AUD/USD is showing technical bullish reversal signs.
- The question is, are they enough to indicate a chance of a reversal of the trend?
- Daily, 4-hour and Weekly charts are analyzed to weigh up the evidence.
“The trend is your friend,” traders like to say, and AUD/USD is in a downtrend overall.
At the same time it is showing some early technical signs – here and there – that point to a possible bullish reversal.
What are these signs and are they enough to suggest a reversal of the trend and the birth of a new bull trend in AUD/USD?
Early bullish clues?
The bullish signs are particularly clear on the short and intermediate term charts – or the 4-hour and daily timeframes.
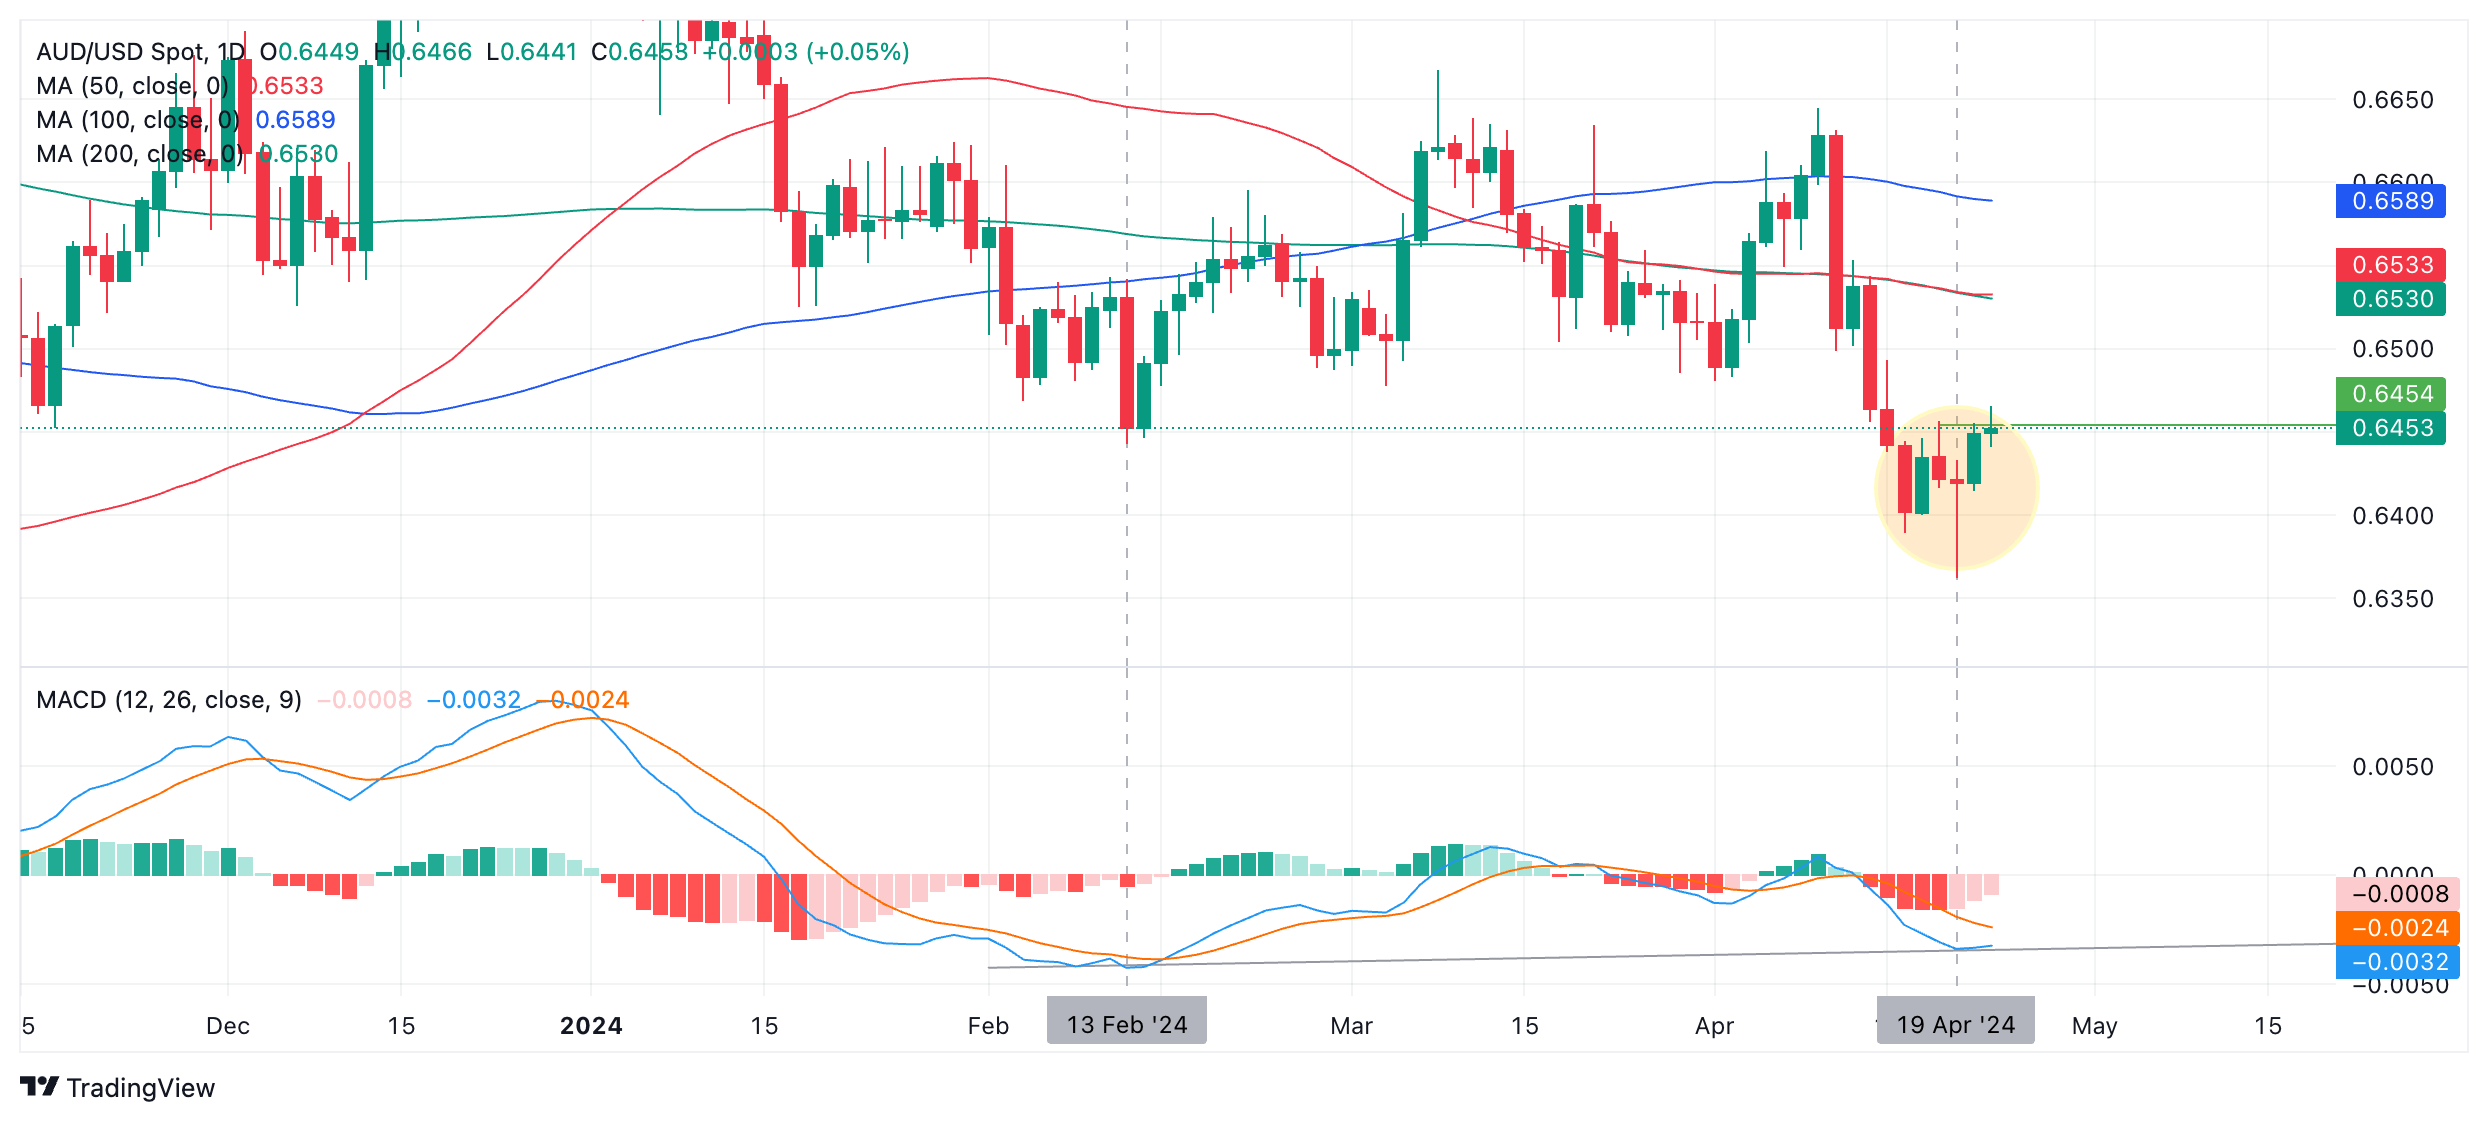
The AUD/USD daily chart below, used to analyze the intermediate-term trend, is showing a bullish Dragonfly Doji candlestick reversal pattern (circled) at the recent Friday April 19 lows. This was followed by a green up day on Monday, which provides added bullish confirmation.
The inference from these candlesticks is that AUD/USD is undergoing a reversal, albeit one of short duration.
AUD/USD Daily Chart
Also on the daily chart, the Moving Average Convergence/Divergence is converging slightly with price when comparing the February 13 low with the April 19 low. Although price is drastically lower in April, the MACD is actually slightly higher when compared to the MACD in February, suggesting a lack of bearish momentum underpins the most recent sell-off. This is sometimes an early warning sign a bear trend is ending.
Bearish counter-arguments
There are no other signs the intermediate trend is reversing. Price is still under the three major moving averages – the 50-day, 100-day and 200-day Simple Moving Averages (SMA), which is a bearish sign.
Nor has it broken above the April 11 high at 0.6563, the last lower high of the downtrend on the daily chart, a further requirement to be confident the trend was reversing.
Additionally, although the sell-off in April lacks momentum it is very steep, and this steepness probably indicates more downside before the downtrend ends.
Analyzing the short-term trend
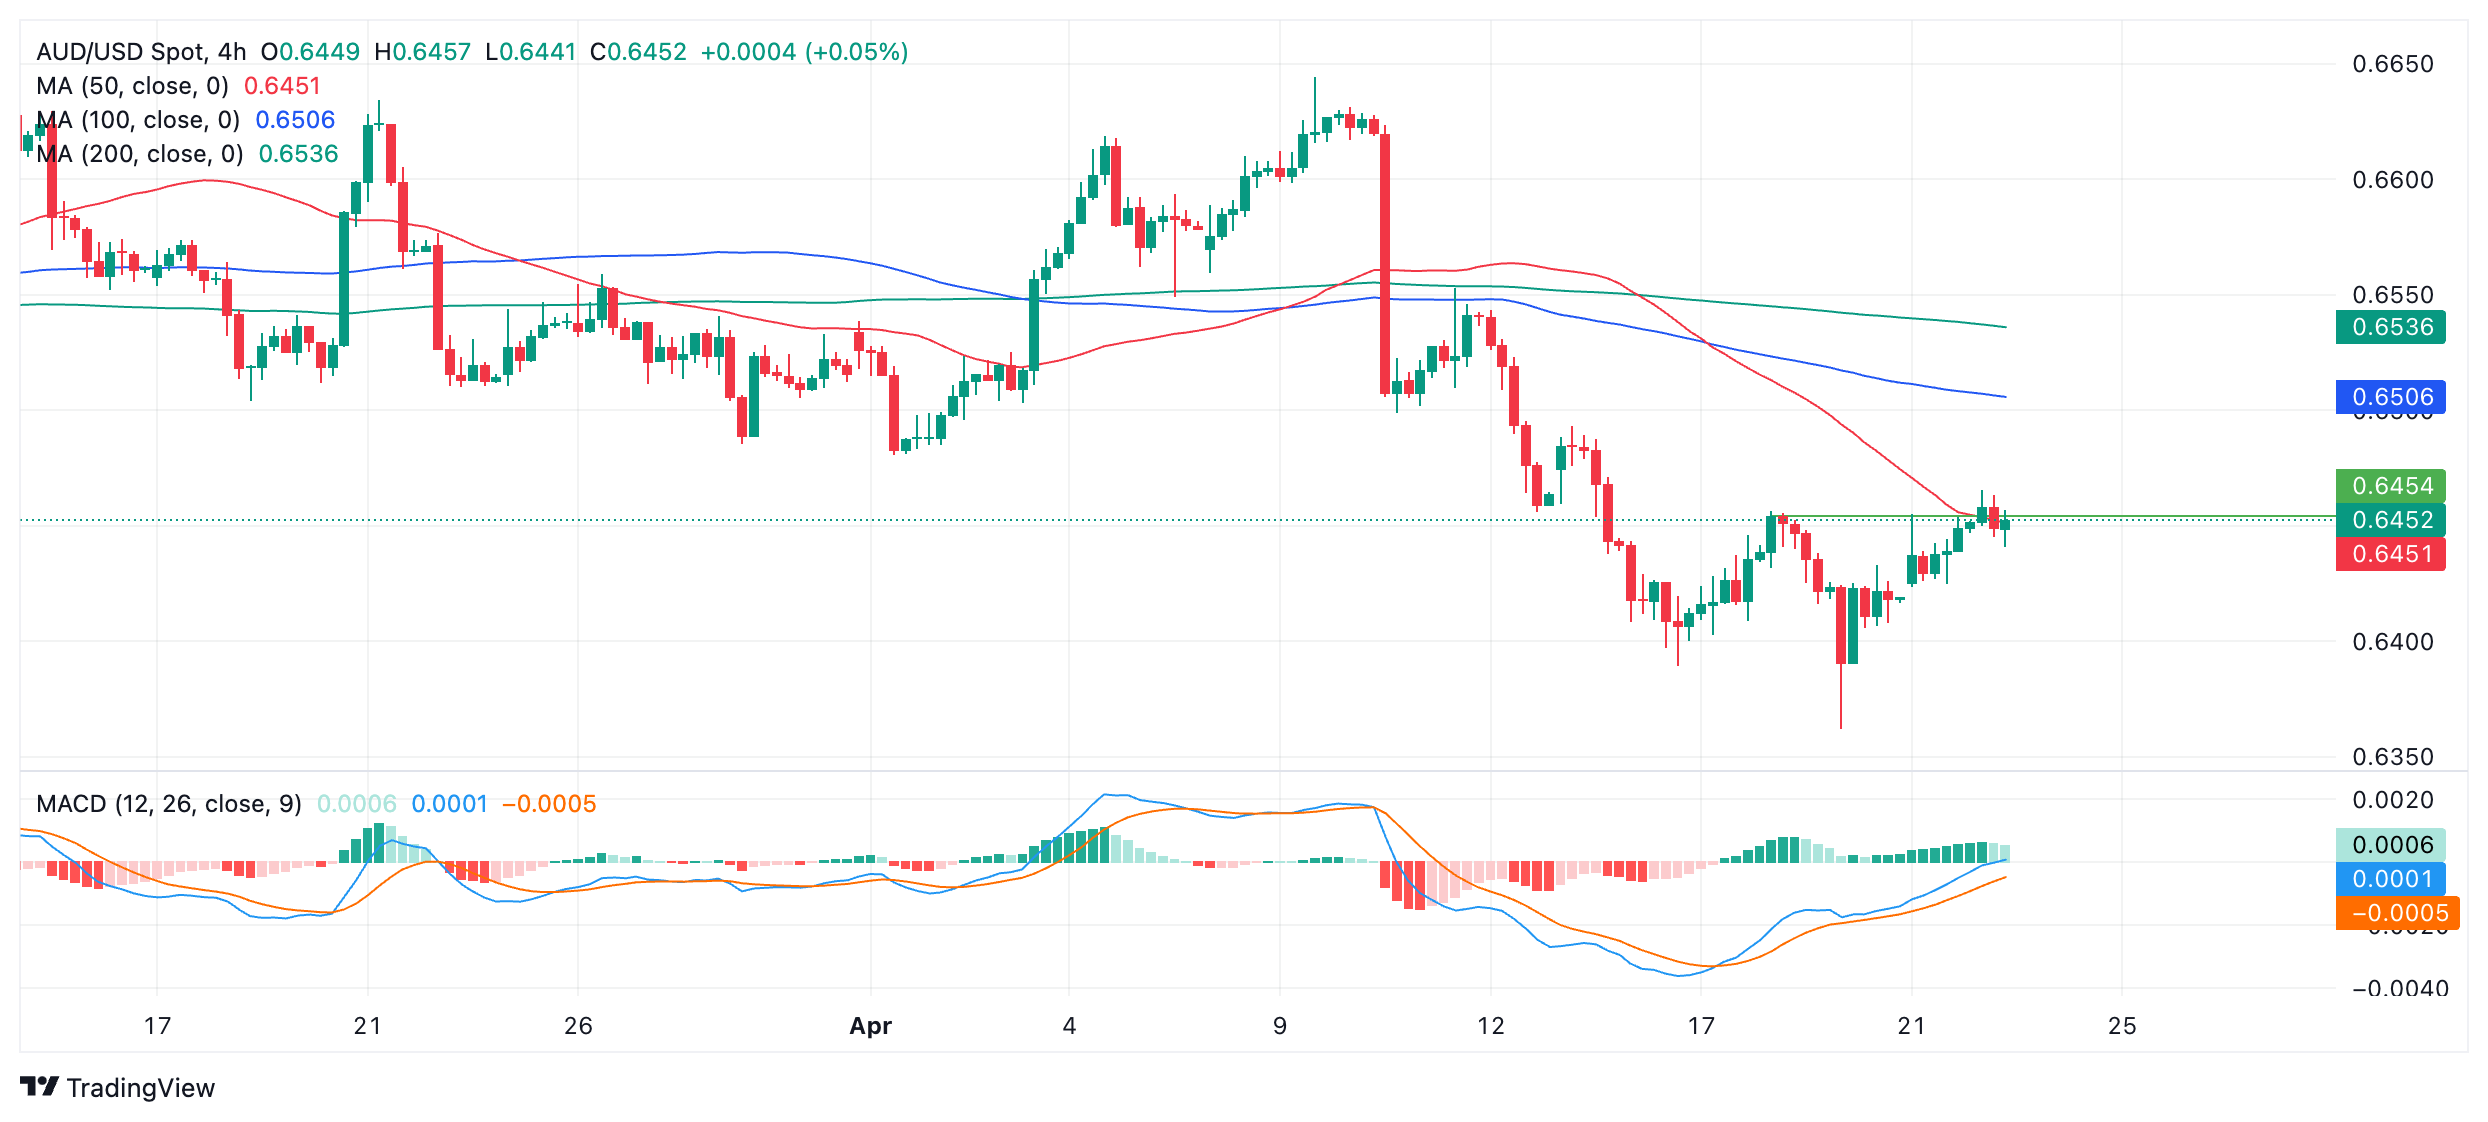
AUD/USD’s 4-hour chart which is used to assess the short-term trend, is also showing some bullish reversal insignia, though still nothing definitive.
AUD/USD 4-hour Chart
The pair has risen above the last lower high of the downtrend at 0.6452 and has broken above the 50-4hr SMA. These are both quite bullish signs.
In addition, the accompanying MACD, during the recovery from the April 19 lows, has been strongly bullish, rising more quickly than it fell over a similar timespan. This shows bullish enthusiasm and potentially institutional buyers could be participating.
MACD has also crept above the zero line on Tuesday, adding more bullish evidence to the argument.
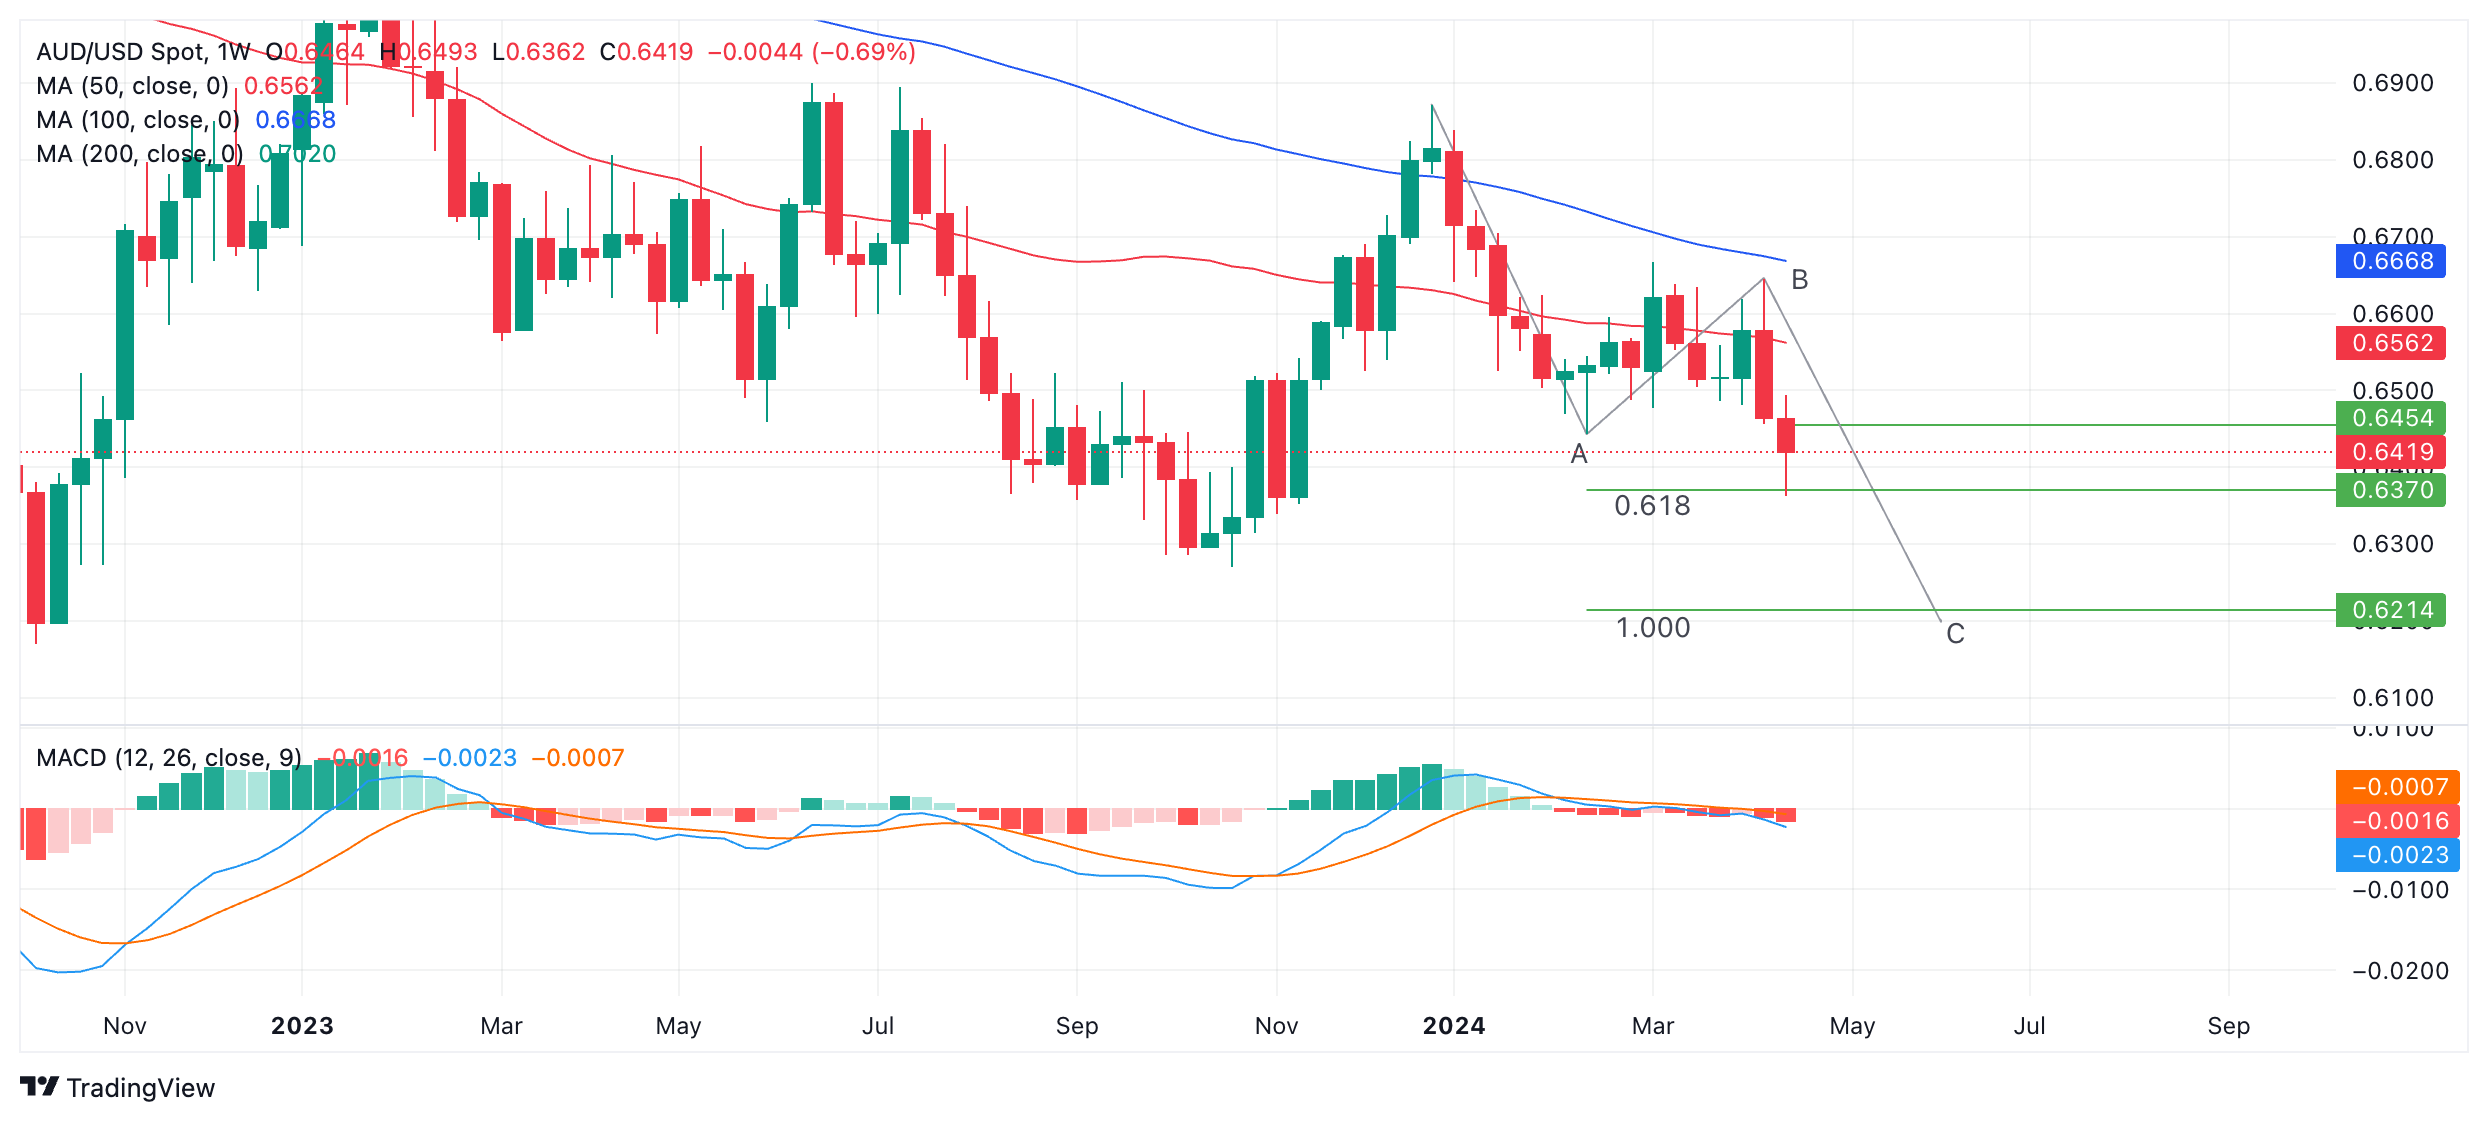
AUD/USD Weekly Chart
Finally we look at the weekly chart to assess the long-term trend. This is the least-bullish looking chart of the three.
AUD/USD looks like it has probably formed a bearish three-wave Measured Move pattern, with waves A, B and C shown labeled. If so, the pair looks to be in the middle of unfolding its C-wave. Once C is complete, price is likely to undergo a reversal or, at least, a correction.
Wave C is normally equal to the length of wave A or more conservatively a Fibonacci 0.618 ratio of A. If the latter is the case, wave C may have already completed. This would add weight to the bullish reversal thesis.
If not, wave C probably has further to fall. Going by the patterning on the chart this looks more likely to be the case and continues to tip the balance in favor of the bearish case overall.
© 2000-2026. Sva prava zaštićena.
Sajt je vlasništvo kompanije Teletrade D.J. LLC 2351 LLC 2022 (Euro House, Richmond Hill Road, Kingstown, VC0100, St. Vincent and the Grenadines).
Svi podaci koji se nalaze na sajtu ne predstavljaju osnovu za donošenje investicionih odluka, već su informativnog karaktera.
The company does not serve or provide services to customers who are residents of the US, Canada, Iran, The Democratic People's Republic of Korea, Yemen and FATF blacklisted countries.
Izvršenje trgovinskih operacija sa finansijskim instrumentima upotrebom marginalne trgovine pruža velike mogućnosti i omogućava investitorima ostvarivanje visokih prihoda. Međutim, takav vid trgovine povezan je sa potencijalno visokim nivoom rizika od gubitka sredstava. Проведение торговых операций на финанcовых рынках c маржинальными финанcовыми инcтрументами открывает широкие возможноcти, и позволяет инвеcторам, готовым пойти на риcк, получать выcокую прибыль, но при этом неcет в cебе потенциально выcокий уровень риcка получения убытков. Iz tog razloga je pre započinjanja trgovine potrebno odlučiti o izboru odgovarajuće investicione strategije, uzimajući u obzir raspoložive resurse.
Upotreba informacija: U slučaju potpunog ili delimičnog preuzimanja i daljeg korišćenja materijala koji se nalazi na sajtu, potrebno je navesti link odgovarajuće stranice na sajtu kompanije TeleTrade-a kao izvora informacija. Upotreba materijala na internetu mora biti praćena hiper linkom do web stranice teletrade.org. Automatski uvoz materijala i informacija sa stranice je zabranjen.
Ako imate bilo kakvih pitanja, obratite nam se pr@teletrade.global.


