- Analytics
- News and Tools
- Market News
CFD Markets News and Forecasts — 31-03-2021
| Time | Country | Event | Period | Previous value | Forecast |
|---|---|---|---|---|---|
| 00:30 (GMT) | Australia | Home Loans | February | 10.9% | |
| 00:30 (GMT) | Australia | Retail Sales, M/M | February | 0.3% | -1.1% |
| 00:30 (GMT) | Australia | Trade Balance | February | 10.142 | |
| 00:30 (GMT) | Japan | Manufacturing PMI | March | 51.4 | |
| 01:45 (GMT) | China | Markit/Caixin Manufacturing PMI | March | 50.9 | |
| 06:00 (GMT) | Germany | Retail sales, real unadjusted, y/y | February | -8.7% | |
| 06:00 (GMT) | Germany | Retail sales, real adjusted | February | -4.5% | |
| 06:30 (GMT) | Switzerland | Retail Sales (MoM) | February | -5.3% | |
| 06:30 (GMT) | Switzerland | Retail Sales Y/Y | February | -0.5% | |
| 06:30 (GMT) | Switzerland | Consumer Price Index (MoM) | March | 0.2% | |
| 06:30 (GMT) | Switzerland | Consumer Price Index (YoY) | March | -0.5% | |
| 07:30 (GMT) | Switzerland | Manufacturing PMI | March | 61.3 | |
| 07:50 (GMT) | France | Manufacturing PMI | March | 56.1 | 58.8 |
| 07:55 (GMT) | Germany | Manufacturing PMI | March | 60.7 | 66.6 |
| 08:00 (GMT) | Eurozone | Manufacturing PMI | March | 57.9 | 62.4 |
| 08:30 (GMT) | United Kingdom | Purchasing Manager Index Manufacturing | March | 55.1 | 57.9 |
| 12:00 (GMT) | OPEC | OPEC Meetings | |||
| 12:30 (GMT) | U.S. | Continuing Jobless Claims | March | ||
| 12:30 (GMT) | Canada | Building Permits (MoM) | February | 8.2% | |
| 12:30 (GMT) | U.S. | Initial Jobless Claims | March | ||
| 13:45 (GMT) | U.S. | Manufacturing PMI | March | 58.6 | |
| 14:00 (GMT) | U.S. | Construction Spending, m/m | February | 1.7% | -1% |
| 14:00 (GMT) | U.S. | ISM Manufacturing | March | 60.8 | 61 |
| 17:00 (GMT) | U.S. | Baker Hughes Oil Rig Count | April | 324 | |
| 17:00 (GMT) | U.S. | FOMC Member Harker Speaks | |||
| 22:05 (GMT) | U.S. | FOMC Member Kaplan Speak |
FXStreet reports that Axel Rudolph, Senior FICC Technical Analyst, notes that gold remains under pressure as XAU/USD flirts with the March low at $1676.80 a fall through which would eye the 50% retracement at $1616.18.
“Gold continues to slide and currently flirts with the early March low at $1676.80, a fall through which would have the 50 % retracement of the 2018-2021 advance at $1616.18 in its sights.”
“Immediate downside pressure should remain in play while gold stays below the 2021 resistance line at $1730.57. Overall downside pressure will be felt while the price of gold remains below the November low, mid-March high and 55-day moving average at $1755.76/$1774.77.”
The U.S. Energy
Information Administration (EIA) revealed on Wednesday that crude inventories fell
by 0.876 million barrels in the week ended March 26, following a build of 1.912
million barrels in the previous week. Economists had forecast a gain of 0.107
million barrels.
At the same
time, gasoline stocks decreased by 1.735 million barrels, while analysts had
expected an advance of 0.730 million barrels. Distillate stocks jumped by 2.542
million barrels, while analysts had forecast an increase of 0.171 million
barrels.
Meanwhile, oil
production in the U.S. grew by 100,000 barrels a day to 11.100 million barrels
a day.
U.S. crude oil
imports averaged 6.1 million barrels per day last week, increased by 0.5
million barrels per day from the previous week.
The National
Association of Realtors (NAR) announced on Wednesday its seasonally adjusted
pending home sales index (PHSI) tumbled 10.6 percent m-o-m to 110.3 in February,
after a revised 2.4 percent m-o-m drop in January (originally a 2.8 percent
m-o-m decrease).
Economists had
expected pending home sales to decline 3.5 percent m-o-m in February.
On y-o-y basis,
the index fell 0.5 percent after a revised 13.5 percent surge in January
(originally a 13.0 percent m-o-m climb). This marked the first decrease since
May 2020.
According to
the report, all four regional indices recorded month-over-month decreases in February but were mixed year-over-year. The Northeast PHSI plunged 9.2 percent m-o-m to 92.3
in February, a 3.9 percent drop from a year ago. The PHSI for the Midwest declined
9.5 percent to 102.4 last month, down 6.1 percent from February 2020. Pending
home sales in the South shrank 13.0 percent to an index of 133.2 in February,
up 2.9 percent from February 2020. The index in the West went down 7.4 percent
in February to 96.9, up 1.9 percent from a year prior.
"The
demand for a home purchase is widespread, multiple offers are prevalent, and
days-on-market are swift but contracts are not clicking due to record-low
inventory," said Lawrence Yun, NAR's chief economist. "Only the
upper-end market is experiencing more activity because of reasonable supply. Demand,
interestingly, does not yet appear to be impacted by recent modest rises in
mortgage rates."
MNI Indicators’
report revealed on Wednesday that business activity in Chicago expanded in
March, recording its ninth straight month of growth.
The MNI Chicago
Business Barometer, also known as Chicago purchasing manager's index (PMI) came
in at 66.3 in March, up from an unrevised 59.5 in February. This was the highest reading since
July 2018.
Economists had
forecast the index to increase to 60.7.
A reading above
50 indicates improving conditions, while a reading below this level shows
worsening of the situation.
According to
the report, Production (+10.1 points, to a three-year high) recorded the largest
gain in March. New Orders (+7.1 points) and Inventories (+5.1 points) also
posted advances. In addition, Employment (+5.5 points) shifted into expansion
territory in March, posting its first reading above 50 since June 2019. At the
same time, Order Backlogs (-6 points) was the only major category to fall in March.
- Main issue is not the scale of our fiscal response but the speed of its execution
U.S. stock-index futures rose on Wednesday, as investors digested the latest report from ADP, which showed the U.S. private employers boosted hiring in March, while awaiting the announcement of a key infrastructure spending plan by the U.S. President Joe Biden later today.
Global Stocks:
Index/commodity | Last | Today's Change, points | Today's Change, % |
Nikkei | 29,178.80 | -253.90 | -0.86% |
Hang Seng | 28,378.35 | -199.15 | -0.70% |
Shanghai | 3,441.91 | -14.77 | -0.43% |
S&P/ASX | 6,790.70 | +52.30 | +0.78% |
FTSE | 6,771.29 | -0.83 | -0.01% |
CAC | 6,080.60 | -7.44 | -0.12% |
DAX | 14,996.34 | -12.27 | -0.08% |
Crude oil | $60.43 | -0.20% | |
Gold | $1,687.70 | +0.10% |
FXStreet reports that S&P 500 remains capped as expected at its record high and two-month channel top at 3984/93 and economists at Credit Suisse look for the market to stay capped here for now for a fresh pullback into the range.
“The S&P 500 stays sidelined near-term with the market still capped as expected at key resistance from the range highs and two-month channel top at 3984/93. Whilst our broader outlook stays bullish for an eventual move to 4070/75, we suspect this resistance remains intact for now and we see a fresh pullback into the range.”
“Support remains at 3943/33 initially, below which can see a fall back to the price gap from last Friday morning at 3918/10. We look for this to then ideally hold to keep the immediate risk higher in the range. Below though would instead open the door to a retest of last week’s low and the 63-day average at 3858/54.”
(company / ticker / price / change ($/%) / volume)
3M Co | MMM | 194.31 | -0.33(-0.17%) | 2801 |
ALCOA INC. | AA | 33.6 | 0.63(1.91%) | 72043 |
ALTRIA GROUP INC. | MO | 51.19 | -0.07(-0.14%) | 21536 |
Amazon.com Inc., NASDAQ | AMZN | 3,075.00 | 19.71(0.65%) | 15506 |
American Express Co | AXP | 142.2 | -0.86(-0.60%) | 6006 |
Apple Inc. | AAPL | 121.71 | 1.81(1.51%) | 1163554 |
AT&T Inc | T | 30.75 | 0.02(0.07%) | 79176 |
Boeing Co | BA | 255.3 | 3.29(1.31%) | 115162 |
Caterpillar Inc | CAT | 233.99 | 0.91(0.39%) | 13964 |
Chevron Corp | CVX | 105.75 | -0.18(-0.17%) | 10106 |
Citigroup Inc., NYSE | C | 72.86 | -0.10(-0.14%) | 24353 |
Deere & Company, NYSE | DE | 374.12 | 0.20(0.05%) | 1839 |
Exxon Mobil Corp | XOM | 56.67 | -0.02(-0.04%) | 25840 |
Facebook, Inc. | FB | 289.88 | 1.88(0.65%) | 74571 |
FedEx Corporation, NYSE | FDX | 286.8 | 0.88(0.31%) | 4031 |
Ford Motor Co. | F | 12.45 | -0.01(-0.08%) | 166471 |
Freeport-McMoRan Copper & Gold Inc., NYSE | FCX | 33.32 | 0.64(1.96%) | 58227 |
General Electric Co | GE | 13.32 | 0.02(0.15%) | 112023 |
General Motors Company, NYSE | GM | 58.1 | -0.41(-0.70%) | 70565 |
Goldman Sachs | GS | 332.97 | 0.96(0.29%) | 8532 |
Google Inc. | GOOG | 2,063.79 | 8.25(0.40%) | 3965 |
Hewlett-Packard Co. | HPQ | 31.57 | 0.01(0.03%) | 1686 |
Home Depot Inc | HD | 303.58 | -1.24(-0.41%) | 6823 |
HONEYWELL INTERNATIONAL INC. | HON | 217.81 | -0.28(-0.13%) | 2131 |
Intel Corp | INTC | 64.15 | 0.38(0.60%) | 51780 |
International Business Machines Co... | IBM | 134.52 | -0.20(-0.15%) | 4472 |
International Paper Company | IP | 55.29 | 0.29(0.53%) | 519 |
Johnson & Johnson | JNJ | 164.75 | -0.26(-0.16%) | 6216 |
JPMorgan Chase and Co | JPM | 154.36 | -0.12(-0.08%) | 15381 |
McDonald's Corp | MCD | 224.25 | -0.73(-0.32%) | 4116 |
Merck & Co Inc | MRK | 77.13 | 0.17(0.22%) | 5571 |
Microsoft Corp | MSFT | 232.98 | 1.13(0.49%) | 79766 |
Pfizer Inc | PFE | 36.27 | 0.16(0.44%) | 601246 |
Procter & Gamble Co | PG | 135.33 | -0.12(-0.09%) | 3767 |
Starbucks Corporation, NASDAQ | SBUX | 110.22 | -0.05(-0.05%) | 1940 |
Tesla Motors, Inc., NASDAQ | TSLA | 647.25 | 11.63(1.83%) | 479275 |
The Coca-Cola Co | KO | 53.04 | -0.11(-0.21%) | 26023 |
Twitter, Inc., NYSE | TWTR | 63.62 | 0.63(1.00%) | 49820 |
UnitedHealth Group Inc | UNH | 372.53 | -1.03(-0.28%) | 881 |
Verizon Communications Inc | VZ | 58.54 | -0.05(-0.09%) | 27900 |
Visa | V | 212.12 | 0.22(0.10%) | 13588 |
Wal-Mart Stores Inc | WMT | 135.57 | -0.17(-0.13%) | 8245 |
Walt Disney Co | DIS | 185.9 | 0.37(0.20%) | 23697 |
Yandex N.V., NASDAQ | YNDX | 63.09 | -0.05(-0.08%) | 123775 |
+Apple (AAPL) upgraded to Buy from Neutral at UBS; target raised to $142
Statistics
Canada announced on Wednesday that the country’s gross domestic product (GDP)
grew 0.7 percent m-o-m in January 2021, following an unrevised 0.1 percent
m-o-m advance in December 2020.
This was above economists’
forecast for a 0.5 percent m-o-m advance and marked the ninth consecutive
monthly gain. However, overall economic activity was still about 3 percent
below February's pre-pandemic level.
In y-o-y terms,
the Canadian GDP fell 2.3 percent in January.
According to
the report, both goods-producing (+1.5 percent m-o-m) and services-producing
(+0.4 percent m-o-m) industries rose in January as the 20 industrial sectors
were nearly evenly split between expansions and contractions.
It was also
reported that preliminary data indicates an approximate 0.5 percent m-o-m gain
in real GDP for February.
The employment
report prepared by Automatic Data Processing Inc. (ADP) and Moody's Analytics
showed on Wednesday the U.S. private employers added 517,000 jobs in March. This
marked the largest increase in private-sector employment since September 2020.
Economists had
expected an increase of 550,000.
The February
number saw an upward revision to 176,000 from the originally reported 117,000.
“We saw marked
improvement in March’s labor market data, reporting the strongest gain since September
2020,” noted Nela Richardson, chief economist, ADP. “Job growth in the service
sector significantly outpaced its recent monthly average, led with notable increase
by the leisure and hospitality industry. This sector has the most opportunity
to improve as the economy continues to gradually reopen and the vaccine is made
more widely available. We are continuing to keep a close watch on the hardest hit
sectors but the groundwork is being laid for a further boost in the monthly
pace of hiring in the months ahead.”
| Time | Country | Event | Period | Previous value | Forecast | Actual |
|---|---|---|---|---|---|---|
| 06:00 | United Kingdom | Nationwide house price index, y/y | March | 6.9% | 6.4% | 5.7% |
| 06:00 | United Kingdom | Nationwide house price index | March | 0.7% | 0.4% | -0.2% |
| 06:00 | United Kingdom | Business Investment, y/y | Quarter IV | -12.8% | -7.4% | |
| 06:00 | United Kingdom | Business Investment, q/q | Quarter IV | 13.2% | 5.9% | |
| 06:00 | United Kingdom | Current account, bln | Quarter IV | -14.3 | -34 | -26.3 |
| 06:00 | United Kingdom | GDP, q/q | Quarter IV | 16.9% | 1% | 1.3% |
| 06:00 | United Kingdom | GDP, y/y | Quarter IV | -8.5% | -7.8% | -7.3% |
| 06:45 | France | CPI, m/m | March | 0% | 0.7% | 0.6% |
| 06:45 | France | Consumer spending | February | -4.9% | 2% | 0% |
| 06:45 | France | CPI, y/y | March | 0.6% | 1.1% | 1.1% |
| 07:55 | Germany | Unemployment Change | March | 9 | -3 | -8 |
| 07:55 | Germany | Unemployment Rate s.a. | March | 6% | 6% | 6% |
| 08:00 | Switzerland | Credit Suisse ZEW Survey (Expectations) | March | 55.5 | 66.7 | |
| 09:00 | Eurozone | Harmonized CPI | March | 0.2% | 0.9% | |
| 09:00 | Eurozone | Harmonized CPI ex EFAT, Y/Y | March | 1.1% | 1.1% | 0.9% |
| 09:00 | Eurozone | Harmonized CPI, Y/Y | March | 0.9% | 1.3% | 1.3% |
USD fell against most of its major counterparts in the European session on Wednesday as market participants awaited the announcement of a key infrastructure spending plan by the U.S. President Joe Biden.
The U.S. Dollar Index (DXY), measuring the U.S. currency's value relative to a basket of foreign currencies, edged down 0.1% to 93.22.
Biden is to unveil details of his $2.25 trillion infrastructure plan later today in Pittsburgh. The plan includes projects for roads and bridges, high-speed broadband, research and development. The White House stated that the plan would be paid for over 15 years by raising the corporate tax rate to 28% from 21% and increasing taxes on foreign earnings.
Investors worry that a significant increase in U.S. spending will lead to higher inflation. Renewed inflation concerns pushed Treasury bond yields higher. Benchmark 10-year Treasury note yields are holding at around 1.73% at the moment. Yesterday, yields hit a 14-month high of 1.776%.
FXStreet notes that the failure of GBP/USD to recover past the secondary highs of 1.4005 has motioned a corrective retreat, with technical support pivots at 1.3876 and 1.3812 breached. A move under support pegged at 1.3652 oils the downside correction further, with 1.3542 a possible target of a prior triangle pattern breakdown, as reported by DBS Bank.
“Take note that GBP has edged lower under the 40-day moving average (dma) of 1.3876 which glued several support rebounds since last October. And, if GBP stays under trend support drawn from 1.2855 (early November lows) around 1.3812, there is room for further corrective pressure. Both the technical indicators show for now the downside is the path of least resistance.”
“A quick look at the monthly chart shows that GBP’s upside progress is tamed as it contoured into the 100-month moving average at 1.4119. Nonetheless, GBP’s inherent major bull trend remains intact unless GBP breaks determinedly under its trend support around 1.3322 and its 200-dma at 1.3286. The price path for GBP appears to be a combination of two. Prices should continue to glide lower via a channel, but it is a prior sideway triangle that provides a stronger hint of a near-term target. A 100% mapping lower of the triangle’s girth delivers 1.3542 as a target with over-shooting granting 1.3460.”
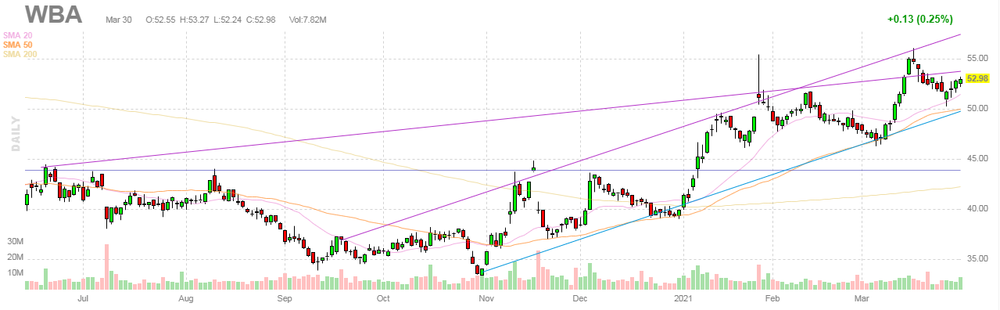
Walgreens Boots Alliance (WBA) reported Q2 FY 2021 earnings of $1.40 per share (versus $1.52 per share in Q2 FY 2020), beating analysts’ consensus estimate of $1.12 per share.
The company’s quarterly revenues amounted to $32.779 bln (-8.5% y/y), missing analysts’ consensus estimate of $36.159 bln.
The company also raised its FY 2021 guidance to mid-to-high single-digit growth in constant currency-adjusted EPS from both total and continuing operations. Previous guidance was for low single-digit growth.
WBA rose to $54.28 (+2.45%) in pre-market trading.
The Mortgage
Bankers Association (MBA) reported on Wednesday the mortgage application volume
in the U.S. dropped 2.2 percent in the week ended March 26, following a 2.5
percent decline in the previous week.
According
to the report, refinance applications fell 2.5 percent, while applications to
purchase a home declined 1.5 percent.
Meanwhile, the
average fixed 30-year mortgage rate edged down from 3.36 percent to 3.33
percent, breaking
a seven-week rising streak.
“Higher mortgage
rates continue to shut down refinance activity, as the pool of borrowers who
can benefit from a refinance further shrinks,” noted Joel Kan, an MBA
economist.
“Many
prospective homebuyers this spring are feeling the effects of higher rates and
rapidly accelerating home prices,” Kan added. “Record-low inventory is pushing
home-price growth at double the rate from a year ago, and even above the 10%
growth rates seen in 2005. The housing market is in desperate need of more
inventory to cool price growth and preserve affordability.”
FXStreet reports that the Credit Suisse analyst team expects EUR/GBP to see an eventual sustained break below the 38.2% retracement of the entire 2015/2020 bull trend at 0.8520.
“With the EUR now holding a large top as looked for we continue to look for an eventual sustained break below the 38.2% retracement of the entire 2015/2020 bull trend at 0.8520 for a fall to the ‘measured objective’ from the 2020 top at 0.8430. Whilst this should be allowed to hold at first, our broader bias would be for an eventual test of long-term support from the 2019 and 2020 low s at 0.8281/39. Removal of here would see a much larger and long-lasting top complete.”
“Initial resistance is seen at 0.8557, then the 13-day exponential average and price resistance at 0.8565/80."
FXStreet notes that EUR/AUD has trended firmly lower since November 2020, with the aussie benefiting more than the euro from increased confidence in the global vaccine rollout and the greater fiscal support of the Biden administration. Therefore, economists at Westpac expect the pair to trade at 1.49 by end-2021.
“Any bounces to 1.5600 may be a selling opportunity. The EU continues to struggle with both the current spread of COVID-19 and the vaccine rollout. An increase in new cases in Q1 has prompted renewed activity restrictions in e.g. Germany, France and Italy.”
“Once the global recovery becomes more synchronised in H2 21, AUD’s leverage to industrial growth should underpin gains on crosses.”
“Our base case is 1.51 mid-year, 1.49 year-end.”
FXStreet reports that USD/JPY has broken with ease above its downtrend from October 2018 and analysts at Credit Suisse stay bullish for what should be tougher resistance, starting at 111.68 and stretching up to 112.40.
“A further dramatic surge higher has seen USD/JPY break with ease its long-term downtrend from October 2018 and the trend is seen staying directly higher for a test of long-term resistance, seen starting at the 111.68/72 March 2020 high and stretching up to the 112.40 high of 2019, also the 61.8% retracement of the 2016/2020 bear trend.”
“We look for the 112.40 level to finally cap and for a consolidation/corrective phase to emerge. Should strength instead directly extend, we see resistance next at 114.00/05.”
FXStreet reports that strategists at Capital Economics expect the precious metal to fall further as the US real yield curve continues to steepen.
“Short-dated real yields have fallen amid repeated signals from the FOMC that monetary policy is likely to remain very loose for a long time yet. By contrast, long-dated real yields have risen. This pivoting of the real yield curve has been accompanied by a slump in gold. Our expectation is that the US real yield curve will continue to steepen. Indeed, we suspect that most of the ~50bp increase we project in the nominal yield of 10-year conventional Treasuries between now and the end of this year will result from a higher real yield. We expect this to heap more pressure on the price of gold. Our end-2021 forecast for the price of the yellow metal is $1,600/oz.”
Proposes US corporate tax rate to go up to 28% from 21%
Tax increases to "fully pay for the investments in this plan over the next 15 years"
$650 billion to be used for initiatives to improve quality of life at home
$620 billion to be dedicated to transportation
$400 billion to address improved care for the elderly, people with disabilities
$580 billion to strengthen US manufacturing, research and development
eFXdata reports that Barclays Research expects 900k for NFP print and unemployment rate at 5.9%.
"We think several factors justify a strong employment forecast for March. Among the most important are vaccinations and declining COVID case counts, which have led states to ease restrictions. Progress on vaccinations likely helped fuel the pickup in hiring in February, and we suspect that this trend improved further in March. In addition, hiring in sectors outside of leisure and hospitality last month was likely held back by adverse weather. We expect employment in these sectors to rebound in March. Finally, we think reported jobless claims may understate the actual improvement in labor market conditions during the survey period, partly because the further extension of federal unemployment benefits may have contributed to some misclassification of new applicants," Barclays adds.
Аccording to a flash estimate from Eurostat, euro area annual inflation is expected to be 1.3% in March 2021, up from 0.9% in February. Economists had also expected a 1.3% increase. The core figures rose by 0.9%% YoY in March when compared to 1.2% expectations and 1.1% booked in February.
Looking at the main components of euro area inflation, energy is expected to have the highest annual rate in March (4.3%, compared with -1.7% in February), followed by services (1.3%, compared with 1.2% in February), food, alcohol & tobacco (1.1%, compared with 1.3% in February) and non-energy industrial goods (0.3%, compared with 1.0% in February).
FXStreet reports that in the view of economists at MUFG Bank, USD support is set to persist.
“The passing of the $1.9trn package earlier this month no doubt helped lift US consumer confidence. The data yesterday revealed confidence surged from 90.4 to 109.7 – the highest since the COVID-19 crisis began and the biggest one-month gain since April 2003. The jump in the Present Conditions Index – seen as a good proxy of job market conditions, jumped by over 20pts, the largest since April 1974. So with Biden encouraged we see no reason to expect any caution now.”
“Short-term of course this all paints a positive picture for growth expectations in the US and with FX momentum, positioning and technicals all pointing in favour of further USD strength, the near-term outlook for the dollar remains positive.”
Bloomberg reports that according to the Federal Labor Agency, German joblessness declined in March, signaling economic resilience even as thousands of businesses remain affected by recently-extended pandemic restrictions.
The drop of 8,000 put the total number of unemployed people at 2.75 million and kept the rate at 6%. Economists had expected a drop of 3,000.
“The labor market experienced a noticeable spring revival -- despite rising infections and persistent curbs for some sectors of the economy,” agency chief Detlef Scheele said in a statement. “Overall though, the labor market continues to show significant evidence of the year-old crisis.”
Germany has been in a lockdown since the middle of November, with most retail stores, restaurants, bars, gyms and cultural venues shut to limit the spread of the coronavirus. The government recently extended those curbs until at least April 18 after a surge in infections, and Chancellor Angela Merkel has criticized regional officials for not following through on imposing tougher restrictions. That means companies and their staff may well continue to face pressure in the coming weeks, before a recovery can take hold.
FXStreet reports that strategists at ANZ Bank suspect OPEC will be inclined to keep most of the output curbs in place for another month when they meet later this week.
“Overall, the physical market remains well supplied. We see global growth in crude oil demand remaining subdued; with Q1 2021 levels still nearly 5mb/d below the same period last year. Nevertheless, we expect a strong recovery in oil demand for the rest of the year.”
“As the pace of the vaccine deployment accelerates, we see Q2 demand rising 1.3mb/d in y/y terms from the previous quarter. We expect the Saudis to extend their unilateral cut again and OPEC+ to roll over most of its April quota for May. However, the concessions ceded to Russia and Kazakhstan are likely to be repeated. We also expect compliance will start to slip. This has led us to revise lower our forecasts for global supply by 1.2mb/d for Q2 and about 0.2mb/d for full year 2021 compared to last month’s case. For 2022, we have raised supply forecasts by 0.5mb/d on higher US production.”
“We expect the increase in OPEC production to remain gradual until there are clear signs that demand has recovered and supply risks have eased. Until that scenario, the market will likely remain tight through 2021.”
| Time | Country | Event | Period | Previous value | Forecast | Actual |
|---|---|---|---|---|---|---|
| 00:30 | Australia | Private Sector Credit, m/m | February | 0.2% | 0.2% | |
| 00:30 | Australia | Private Sector Credit, y/y | February | 1.7% | 1.6% | |
| 00:30 | Australia | Building Permits, m/m | February | -19.4% | 5% | 21.6% |
| 01:00 | China | Non-Manufacturing PMI | March | 51.4 | 56.3 | |
| 01:00 | China | Manufacturing PMI | March | 50.6 | 51 | 51.9 |
| 05:00 | Japan | Housing Starts, y/y | February | -3.1% | -4.8% | -3.7% |
| 06:00 | United Kingdom | Nationwide house price index, y/y | March | 6.9% | 6.4% | 5.7% |
| 06:00 | United Kingdom | Nationwide house price index | March | 0.7% | 0.4% | -0.2% |
| 06:00 | United Kingdom | Business Investment, y/y | Quarter IV | -12.8% | -7.4% | |
| 06:00 | United Kingdom | Business Investment, q/q | Quarter IV | 13.2% | 5.9% | |
| 06:00 | United Kingdom | Current account, bln | Quarter IV | -14.3 | -34 | -26.3 |
| 06:00 | United Kingdom | GDP, q/q | Quarter IV | 16.9% | 1% | 1.3% |
| 06:00 | United Kingdom | GDP, y/y | Quarter IV | -8.5% | -7.8% | -7.3% |
| 06:45 | France | CPI, m/m | March | 0% | 0.7% | 0.6% |
| 06:45 | France | Consumer spending | February | -4.9% | 2% | 0% |
| 06:45 | France | CPI, y/y | March | 0.6% | 1.1% | 1.1% |
During today's Asian trading, the dollar rose to a new one-year high against the yen and multi-month highs against other rivals as investors bet that massive fiscal stimulus and aggressive vaccinations will help the United States lead the global recovery.President Joe Biden is set to outline later on Wednesday how he intends to pay for a $ 3-4 trillion infrastructure plan, after saying earlier this week that 90% of American adults will be eligible for vaccination by April 19.
"US economic indicators may continue to support the US dollar in the near term," Commonwealth Bank of Australia currency strategist Carol Kong said.
"The JPY will depend on the overall trend of the US dollar strengthening," she said.
The dollar was also supported by a sharp rise in US bond yields, which makes the currency more attractive as an investment.
Investors will watch closely monthly U.S. nonfarm payrolls data on Friday, with Federal Reserve policymakers so far citing slack in the jobs market for their continued lower-for-longer stance on interest rates, which has boosted the growth outlook but also stoked worries about inflation.
According to the report from Insee, over a year, the Consumer Price Index (CPI) should rise by 1.1% in March 2021, after +0.6% in the previous month, according to the provisional estimate made at the end of the month. This increase in inflation should result from the acceleration in the service prices and from a marked rebound of those of the energy. The decrease in manufactured goods prices should soften as compared to the previous month. The food prices and those of tobacco should slow down.
Over one month, consumer prices should rise by 0.6% after being stable in February. The prices of manufactured goods should rebound sharply due to the end of the winter sales. The tobacco prices should be stable and those of food should decrease at the same rate as in February. The service prices and those of energy should slow down slightly.
Year on year, the Harmonised Index of Consumer Prices should rise by 1.4% after +0.8% in February. Over one month, it should increase by 0.7% after being stable in the previous month.
EUR/USD
Resistance levels (open interest**, contracts)
$1.1861 (56)
$1.1821 (337)
$1.1790 (229)
Price at time of writing this review: $1.1721
Support levels (open interest**, contracts):
$1.1669 (2219)
$1.1633 (3152)
$1.1591 (1152)
Comments:
- Overall open interest on the CALL options and PUT options with the expiration date April, 9 is 65732 contracts (according to data from March, 30) with the maximum number of contracts with strike price $1,1750 (4856);
GBP/USD
$1.3912 (832)
$1.3834 (47)
$1.3779 (559)
Price at time of writing this review: $1.3744
Support levels (open interest**, contracts):
$1.3691 (461)
$1.3672 (1239)
$1.3646 (1091)
Comments:
- Overall open interest on the CALL options with the expiration date April, 9 is 9718 contracts, with the maximum number of contracts with strike price $1,4100 (1179);
- Overall open interest on the PUT options with the expiration date April, 9 is 15593 contracts, with the maximum number of contracts with strike price $1,3750 (1239);
- The ratio of PUT/CALL was 1.60 versus 1.59 from the previous trading day according to data from March, 30
* - The Chicago Mercantile Exchange bulletin (CME) is used for the calculation.
** - Open interest takes into account the total number of option contracts that are open at the moment.
According to the report from Nationwide Building Society, house prices down 0.2% month-on-month, after taking account of seasonal factors. Economists had expected a 0.4% increase. Annual house price growth slowed to 5.7% in March, from 6.9% in February. Economists had expected a 6.4% increase.
Nationwide said that policy support is likely to boost the housing market over the next six months, but the longer-term outlook remains highly uncertain.
Commenting on the figures, Robert Gardner, Nationwide's Chief Economist, said: “Annual house price growth slowed to 5.7% in March, from 6.9% in February. Prices fell by 0.2% month-on-month, after taking account of seasonal effects, following a 0.7% rise in February. Given that the wider economy and the labour market has performed better than expected in recent months, the slowdown in March probably reflects a softening of demand ahead of the original end of the stamp duty holiday before the Chancellor announced the extension in the Budget. Recent signs of economic resilience and the stimulus measures announced in the Budget, including the extension of the furlough scheme and the stamp duty holiday, as well as the introduction of a mortgage guarantee scheme, suggest that housing market activity is likely to remain buoyant over the next six months. The longer-term outlook remains highly uncertain. It may be that the recovery continues to gather momentum and that shifts in housing demand resulting from the pandemic continue to lift the market. However, if the labour market weakens towards the end of the year as policy support is withdrawn, as most analysts expect, then activity is likely to slow nearer the end of 2021, perhaps sharply“.
According to the report from Office for National Statistics, GDP is estimated to have increased by 1.3% in Quarter 4 (Oct to Dec) 2020, an upwards revision of 0.3 percentage points. Economists had expected a 1.0% increase.
There is little change to earlier estimate of UK gross domestic product (GDP) for 2020 as whole, which is now estimated to have contracted by 9.8%, slightly revised from the first estimate of a 9.9% decline; there are, though, revisions to the quarterly path through the year.
GDP in Quarter 2 (Apr to June 2020) is estimated to have fallen 19.5%, a downwards revision of 0.5 percentage points, and in Quarter 3 (July to Sept) is estimated to have grown by 16.9%, an upwards revision of 0.8 percentage points.
The household saving ratio increased to 16.1% in Quarter 4 2020, an increase from a revised 14.3% in Quarter 3 2020; over the year 2020, the household saving ratio rose sharply, reaching a record high of 16.3%, compared with 6.8% in 2019.
Non-financial corporations switched from a net lending position in Quarter 3 to a net borrowing position in Quarter 4; general government saw a decrease in their net borrowing position to 11.0% of GDP compared with 12.9% in Quarter 3.
| Raw materials | Closed | Change, % |
|---|---|---|
| Brent | 64.12 | -1.99 |
| Silver | 23.998 | -2.68 |
| Gold | 1684.938 | -1.6 |
| Palladium | 2577.64 | 2.25 |
| Time | Country | Event | Period | Previous value | Forecast |
|---|---|---|---|---|---|
| 00:30 (GMT) | Australia | Private Sector Credit, m/m | February | 0.2% | |
| 00:30 (GMT) | Australia | Private Sector Credit, y/y | February | 1.7% | |
| 00:30 (GMT) | Australia | Building Permits, m/m | February | -19.4% | |
| 01:00 (GMT) | China | Non-Manufacturing PMI | March | 51.4 | |
| 01:00 (GMT) | China | Manufacturing PMI | March | 50.6 | |
| 05:00 (GMT) | Japan | Construction Orders, y/y | February | 14.1% | |
| 05:00 (GMT) | Japan | Housing Starts, y/y | February | -3.1% | |
| 06:00 (GMT) | United Kingdom | Nationwide house price index, y/y | March | 6.9% | 6.5% |
| 06:00 (GMT) | United Kingdom | Nationwide house price index | March | 0.7% | 0.5% |
| 06:00 (GMT) | United Kingdom | Business Investment, y/y | Quarter IV | -11.6% | |
| 06:00 (GMT) | United Kingdom | Business Investment, q/q | Quarter IV | 14.5% | |
| 06:00 (GMT) | United Kingdom | Current account, bln | Quarter IV | -15.7 | |
| 06:00 (GMT) | United Kingdom | GDP, q/q | Quarter IV | 16% | 1% |
| 06:00 (GMT) | United Kingdom | GDP, y/y | Quarter IV | -8.7% | -7.8% |
| 06:45 (GMT) | France | CPI, m/m | March | 0% | |
| 06:45 (GMT) | France | Consumer spending | February | -4.6% | |
| 06:45 (GMT) | France | CPI, y/y | March | 0.6% | |
| 07:55 (GMT) | Germany | Unemployment Change | March | 9 | |
| 07:55 (GMT) | Germany | Unemployment Rate s.a. | March | 6% | |
| 08:00 (GMT) | Switzerland | Credit Suisse ZEW Survey (Expectations) | March | 55.5 | |
| 09:00 (GMT) | Eurozone | Harmonized CPI | March | 0.2% | |
| 09:00 (GMT) | Eurozone | Harmonized CPI ex EFAT, Y/Y | March | 1.1% | |
| 09:00 (GMT) | Eurozone | Harmonized CPI, Y/Y | March | 0.9% | |
| 12:15 (GMT) | U.S. | ADP Employment Report | March | 117 | 403 |
| 12:30 (GMT) | Canada | GDP (m/m) | January | 0.1% | |
| 13:45 (GMT) | U.S. | Chicago Purchasing Managers' Index | March | 59.5 | 60.1 |
| 14:00 (GMT) | Switzerland | SNB Quarterly Bulletin | |||
| 14:00 (GMT) | U.S. | Pending Home Sales (MoM) | February | -2.8% | -3.5% |
| 14:30 (GMT) | U.S. | Crude Oil Inventories | March | 1.912 | |
| 14:45 (GMT) | U.S. | FOMC Member Bostic Speaks | |||
| 21:30 (GMT) | Australia | AIG Manufacturing Index | March | 58.8 | |
| 23:50 (GMT) | Japan | BoJ Tankan. Non-Manufacturing Index | Quarter I | -5 | -5 |
| 23:50 (GMT) | Japan | BoJ Tankan. Manufacturing Index | Quarter I | -10 |
| Pare | Closed | Change, % |
|---|---|---|
| AUDUSD | 0.75946 | -0.5 |
| EURJPY | 129.297 | 0.07 |
| EURUSD | 1.17158 | -0.42 |
| GBPJPY | 151.55 | 0.3 |
| GBPUSD | 1.37353 | -0.17 |
| NZDUSD | 0.69799 | -0.2 |
| USDCAD | 1.26229 | 0.26 |
| USDCHF | 0.94203 | 0.31 |
| USDJPY | 110.343 | 0.48 |


© 2000-2026. All rights reserved.
This site is managed by Teletrade D.J. LLC 2351 LLC 2022 (Euro House, Richmond Hill Road, Kingstown, VC0100, St. Vincent and the Grenadines).
The information on this website is for informational purposes only and does not constitute any investment advice.
The company does not serve or provide services to customers who are residents of the US, Canada, Iran, The Democratic People's Republic of Korea, Yemen and FATF blacklisted countries.
Making transactions on financial markets with marginal financial instruments opens up wide possibilities and allows investors who are willing to take risks to earn high profits, carrying a potentially high risk of losses at the same time. Therefore you should responsibly approach the issue of choosing the appropriate investment strategy, taking the available resources into account, before starting trading.
Use of the information: full or partial use of materials from this website must always be referenced to TeleTrade as the source of information. Use of the materials on the Internet must be accompanied by a hyperlink to teletrade.org. Automatic import of materials and information from this website is prohibited.
Please contact our PR department if you have any questions or need assistance at pr@teletrade.global.
transfers