- Analytics
- News and Tools
- Market News
CFD Markets News and Forecasts — 30-05-2024
Japan's Tokyo Consumer Price Index (CPI) inflation rose to 2.2% YoY in May, climbing from the previous 1.8%. May's CPI inflation in Tokyo rebounded from April's 1.8%, a 26-month low.
Tokyo CPI inflation trends higher than national-level CPI inflation figures, which tend to be released three weeks after the Tokyo inflation, which serves as a preview of Japanese inflation trends. The Bank of Japan (BoJ) has been deeply entrenched in a monetary policy stance, and fear of declining inflation has kept the BoJ from raising rates and trimming the wide rate differential that exists between the Japanese Yen (JPY) and other major global currencies.
Economic Indicator
Tokyo Consumer Price Index (YoY)
The Tokyo Consumer Price Index (CPI), released by the Statistics Bureau of Japan on a monthly basis, measures the price fluctuation of goods and services purchased by households in the Tokyo region. The index is widely considered as a leading indicator of Japan’s overall CPI as it is published weeks before the nationwide reading. The YoY reading compares prices in the reference month to the same month a year earlier. Generally, a high reading is seen as bullish for the Japanese Yen (JPY), while a low reading is seen as bearish.
Read more.Last release: Thu May 30, 2024 23:30
Frequency: Monthly
Actual: 2.2%
Consensus: -
Previous: 1.8%
Source: Statistics Bureau of Japan
Recovering CPI inflation could provide confidence in future policy adjustment expectations from the BoJ.
Core Tokyo CPI inflation also rose to 1.9% from 1.6% Yoy, while 'core-core' Tokyo CPI inflation (headline CPI inflation less volatile food and energy prices) also rose 2.2% on an annual basis from 1.8%.
Market reaction
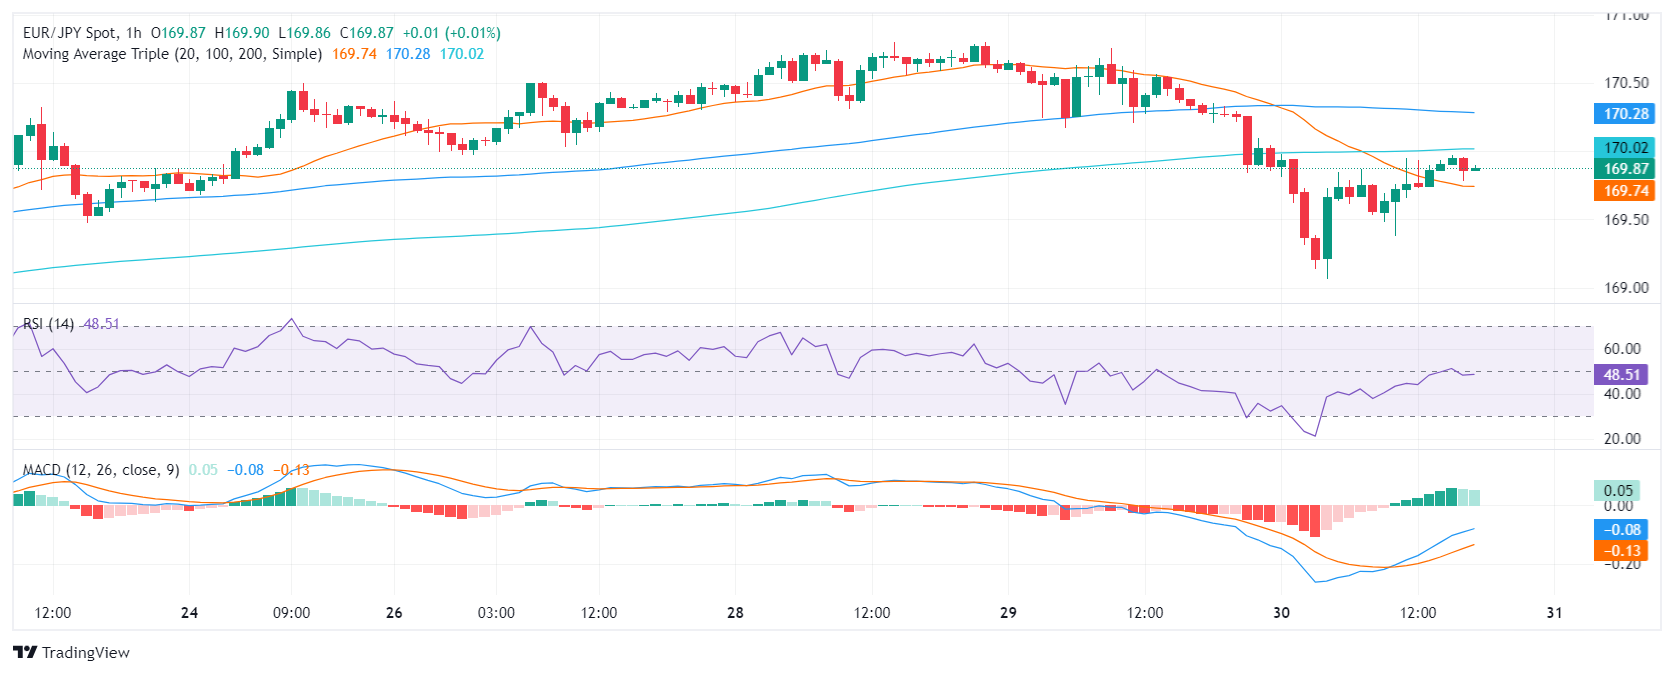
USD/JPY is trading on the high side in the early Friday Pacific market session, testing near the 157.00 handle after slipping to an intraday low of 156.37.
USD/JPY hourly chart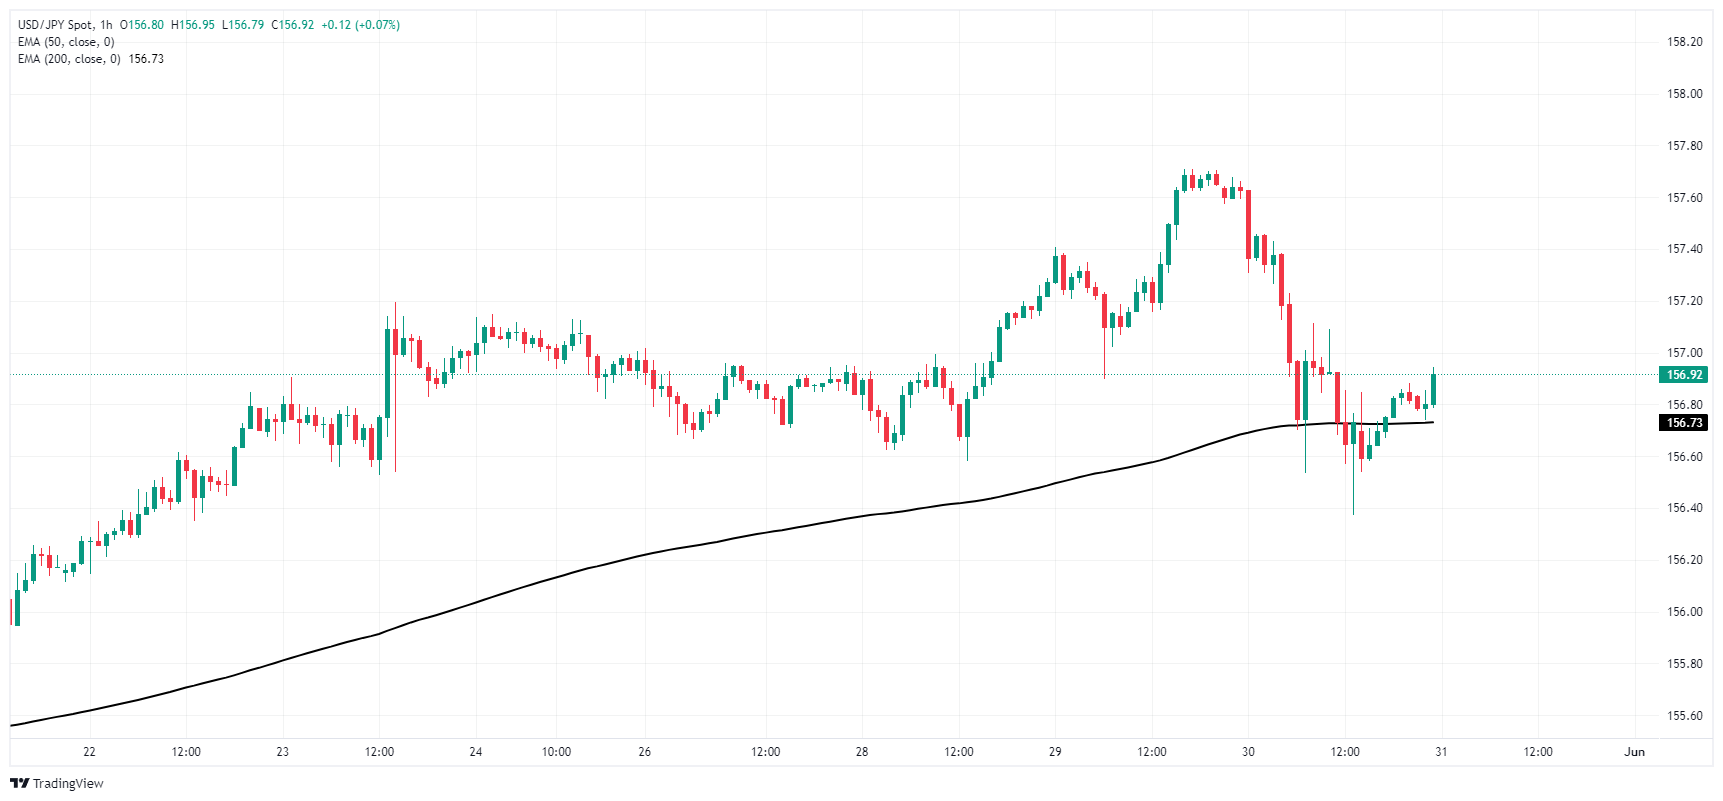
About Tokyo CPI inflation
The Tokyo Consumer Price Index (CPI), released by the Statistics Bureau of Japan on a monthly basis, measures the price fluctuation of goods and services purchased by households in the Tokyo region. The index is widely considered as a leading indicator of Japan’s overall CPI as it is published weeks before the nationwide reading. The YoY reading compares prices in the reference month to the same month a year earlier. Generally, a high reading is seen as bullish for the Japanese Yen (JPY), while a low reading is seen as bearish.
- GBP/USD trades with a mild positive bias around 1.2730 on the softer USD on Friday.
- The US economy grew at an annualized pace of 1.3% in Q1 versus 1.6% prior.
- Markets pared bets on the BoE June rate cuts as the UK April CPI eased at a slower pace than estimates.
The GBP/USD pair edges higher near 1.2730 during the early Asian session on Friday. The USD Index (DXY) faces some selling pressure, and this provides some support to the major pair. Investors will closely monitor the US Core Personal Consumption Expenditures Price Index (Core PCE) for April, which is due later on Friday.
The US economy grew at a slower pace than initially thought during the first quarter (Q1). The second estimate of US Gross Domestic Product (GDP) showed the economy expanded at an annualized pace of 1.3% in Q1 from 1.6% in the previous reading, in line with market expectations, the Bureau of Economic Analysis reported Thursday.
Additionally, the US weekly Initial Jobless Claims for the week ending May 25 rose to 219K from the previous week of 216K, above the market consensus of 218K. Pending Home Sales dropped to -7.7% MoM in April from 3.6% in March.
Many Federal Reserve (Fed) officials highlighted the need to keep borrowing costs higher for longer to curb persistently elevated inflation. This, in turn, might lift the Greenback and cap the upside for the pair. The US Core PCE, the Fed’s preferred inflation measure, is expected to show an increase of 0.3% MoM in April. This figure might offer some insight into the inflation trajectory.
On the other hand, the expectation that the Bank of England (BoE) will start cutting the interest rate from the August meeting might weigh on the Pound Sterling (GBP). Nonetheless, investors lowered their bets on June rate cuts as the UK Consumer Price Index (CPI) report for April showed that price pressures eased at a slower pace than estimates.
- AUD/USD rises to 0.6632 as US Q1 GDP growth slows to 1.3%, below expectations.
- US Initial Jobless Claims increase slightly to 219K; Pending Home Sales plunge in April.
- Traders focus on upcoming Australian Housing Credit data and China’s NBS PMIs, alongside US PCE Price Index release.
The Australian Dollar recovered against the US Dollar on Thursday trading, as US Q1 2024 GDP data was softer than expected, sparking a fall in US Treasury yields and the US Dollar. At the time of writing, the AUD/USD trades at 0.6632, virtually unchanged, following gains of 0.35%.
AUD/USD gains 0.35% on weaker US data and Fedspekaing
The economy in the United States posted weaker-than-expected figures. The Gross Domestic Product for the first quarter in the second estimate expanded by just 1.3%, lower than the 1.6% expected, and trailed last year's fourth quarter's 3.4% increase.
At the same time, Initial Jobless Claims for the last week were revealed, portraying an increase of 219K, slightly above the consensus estimate of 218K and higher than the previous week's reading of 216K.
Other data showed that Pending Home Sales for April tumbled from 3.6% to -7.7% MoM and, on an annual basis, plunged -7.4% from a 0.1% expansion.
Elsewhere, Fed officials crossed the wires. New York Fed President John Williams commented that monetary policy is well-positioned, that inflation is too high, and that he doesn’t feel urgency to slash interest rates. He added that inflation would reach the Fed’s 2% goal in early 2026.
Recently, Chicago’s Fed President Austan Goolsbee added that prices could still fall without rising unemployment.
What’s ahead for AUD/USD traders?
The economic schedule will feature Housing Credit data for April on the Australian front. Alongside that, AUD/USD traders would be eying China’s NBS Manufacturing and Non-Manufacturing PMIs, which are expected to expand by 50.5 and 51.5, respectively.
On the US front, traders are anticipating the release of April’s Personal Consumption Expenditures (PCE) Price Index, which is the Fed’s preferred measure of inflation.
Australian Dollar FAQs
One of the most significant factors for the Australian Dollar (AUD) is the level of interest rates set by the Reserve Bank of Australia (RBA). Because Australia is a resource-rich country another key driver is the price of its biggest export, Iron Ore. The health of the Chinese economy, its largest trading partner, is a factor, as well as inflation in Australia, its growth rate and Trade Balance. Market sentiment – whether investors are taking on more risky assets (risk-on) or seeking safe-havens (risk-off) – is also a factor, with risk-on positive for AUD.
The Reserve Bank of Australia (RBA) influences the Australian Dollar (AUD) by setting the level of interest rates that Australian banks can lend to each other. This influences the level of interest rates in the economy as a whole. The main goal of the RBA is to maintain a stable inflation rate of 2-3% by adjusting interest rates up or down. Relatively high interest rates compared to other major central banks support the AUD, and the opposite for relatively low. The RBA can also use quantitative easing and tightening to influence credit conditions, with the former AUD-negative and the latter AUD-positive.
China is Australia’s largest trading partner so the health of the Chinese economy is a major influence on the value of the Australian Dollar (AUD). When the Chinese economy is doing well it purchases more raw materials, goods and services from Australia, lifting demand for the AUD, and pushing up its value. The opposite is the case when the Chinese economy is not growing as fast as expected. Positive or negative surprises in Chinese growth data, therefore, often have a direct impact on the Australian Dollar and its pairs.
Iron Ore is Australia’s largest export, accounting for $118 billion a year according to data from 2021, with China as its primary destination. The price of Iron Ore, therefore, can be a driver of the Australian Dollar. Generally, if the price of Iron Ore rises, AUD also goes up, as aggregate demand for the currency increases. The opposite is the case if the price of Iron Ore falls. Higher Iron Ore prices also tend to result in a greater likelihood of a positive Trade Balance for Australia, which is also positive of the AUD.
The Trade Balance, which is the difference between what a country earns from its exports versus what it pays for its imports, is another factor that can influence the value of the Australian Dollar. If Australia produces highly sought after exports, then its currency will gain in value purely from the surplus demand created from foreign buyers seeking to purchase its exports versus what it spends to purchase imports. Therefore, a positive net Trade Balance strengthens the AUD, with the opposite effect if the Trade Balance is negative.
Australian Dollar PRICE This week
The table below shows the percentage change of Australian Dollar (AUD) against listed major currencies this week. Australian Dollar was the strongest against the Euro.
| USD | EUR | GBP | JPY | CAD | AUD | NZD | CHF | |
|---|---|---|---|---|---|---|---|---|
| USD | 0.13% | 0.07% | -0.13% | 0.11% | -0.03% | 0.00% | -1.22% | |
| EUR | -0.13% | -0.09% | -0.22% | -0.01% | -0.23% | -0.22% | -1.33% | |
| GBP | -0.07% | 0.09% | -0.20% | 0.04% | -0.13% | -0.06% | -1.27% | |
| JPY | 0.13% | 0.22% | 0.20% | 0.19% | 0.07% | 0.22% | -1.13% | |
| CAD | -0.11% | 0.00% | -0.04% | -0.19% | -0.16% | -0.10% | -1.39% | |
| AUD | 0.03% | 0.23% | 0.13% | -0.07% | 0.16% | 0.09% | -1.14% | |
| NZD | -0.01% | 0.22% | 0.06% | -0.22% | 0.10% | -0.09% | -1.24% | |
| CHF | 1.22% | 1.33% | 1.27% | 1.13% | 1.39% | 1.14% | 1.24% |
The heat map shows percentage changes of major currencies against each other. The base currency is picked from the left column, while the quote currency is picked from the top row. For example, if you pick the Australian Dollar from the left column and move along the horizontal line to the US Dollar, the percentage change displayed in the box will represent AUD (base)/USD (quote).
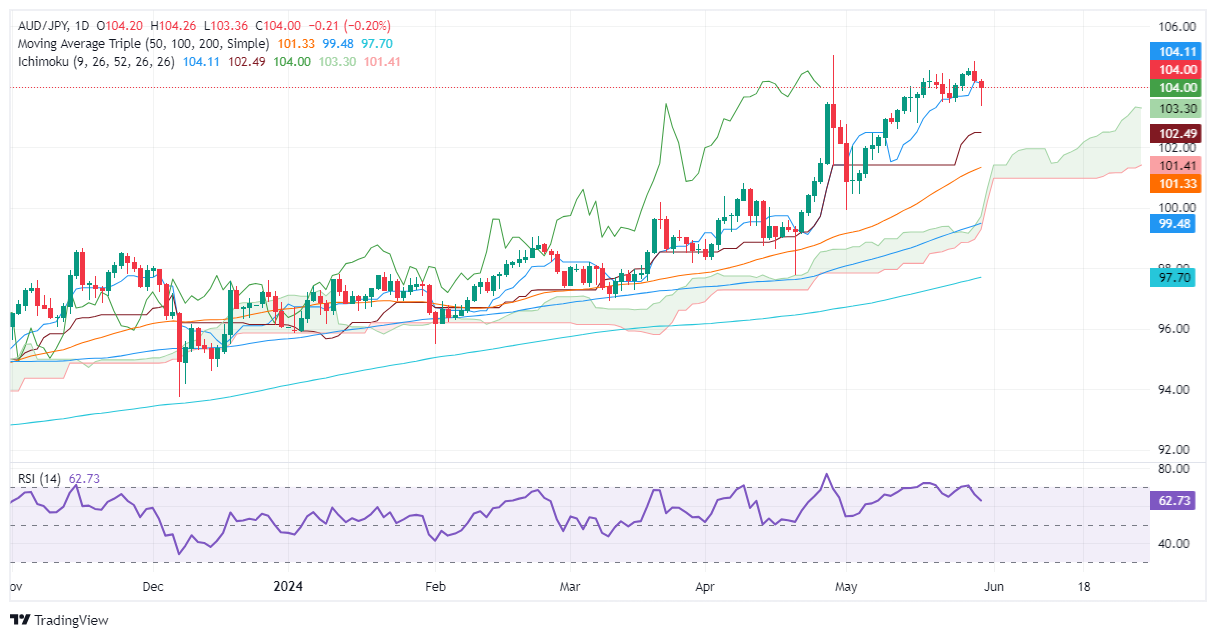
- AUD/JPY registers losses, hitting a two-week low of 103.89 before stabilizing at 104.00.
- Technical outlook shows upward bias, but recent 'evening star' pattern indicates potential for further downside.
- Key levels to watch: Resistance at 104.50 and 104.94 YTD high; support at 103.27 (Senkou Span A) and 102.42 (Kijun-Sen).
The Australian Dollar registered modest losses of around 0.17% against the Japanese Yen on Thursday and slipped below 104.00 to hit a two-week low of 103.89. As Friday’s Asian session begins, the AUD/JPY trades at 104.00, virtually flat.
AUD/JPY Price Analysis: Technical outlook
The pair is upward biased as shown by the daily chart, yet it remains shy of cracking the current year-to-date (YTD) high of 104.94. Three days ago, the AUD/JPY climbed sharply toward 104.84, but buyers were unable to continue to push prices higher, finishing the session in the red.
That formed a two-candle chart pattern called an ‘evening star’, pushing the exchange rate lower on Thursday, but buyers ultimately regained control.
From a momentum standpoint, the Relative Strength Index (RSI) shows that bulls are in charge.
That said, the AUD/JPY's next resistance level would be 104.50, followed by the YTD high at 104.94. Conversely, if the cross extends its losses past Thursday’s low of 103.89, that could exacerbate the pair’s downfall toward the Senkou Span A support level at 103.27 before challenging the Kijun-Sen at 102.42.
AUD/JPY Price Action – Daily Chart
- EUR/USD recovered into familiar technical levels after a dip to 1.0790.
- Investor appetite is testing higher after US data teased slowing growth.
- Friday brings a full docket with EU HICP inflation and US PCE inflation.
EUR/USD dipped to 1.0790 on Thursday before a broad-market recovery forced the Greenback lower across the board. US Gross Domestic Product (GDP) growth eased in-line with market expectations, and rate-cut-hopeful investors are taking a cautious step forward ahead of Friday’s key data prints.
Friday brings a fresh print of pan-European Harmonized Index of Consumer Prices (HICP) inflation. May’s YoY Core EU HICP inflation is expected to tick higher to 2.8% from 2.7%, with headline HICP inflation also expected to rise 2.5% YoY versus the previous 2.4%.
Key US data will follow-up later Friday, with US Core Personal Consumption Expenditure (PCE) Price Index inflation due during the American market session. Median market forecasts expect Core PCE Price Index inflation to hold steady at 2.8% for the year ended in April, with MoM Core PCE Price Index inflation forecast to hold at 0.3%.
US GDP growth eased to 1.3% in the first quarter from the previous 1.6%, matching market forecasts and sending broad-market hopes for a Federal Reserve (Fed) rate cut. According to the CME’s FedWatch Tool, rate traders are pricing in higher odds of a rate trim from the Federal Open Market Committee (FOMC) in September. At current cut, rate markets are betting there is only a 49% chance of the FOMC holding steady on rates in September, with over 50% odds of at least a quarter-point cut.
EUR/USD technical outlook
EUR/USD caught a bounce to 1.0840 on Thursday after an early dip to 1.0790. The pair is strung in the middle of a rough sideways grind with the midpoint at the 200-hour Exponential Moving Average (EMA) near 1.0835.
Daily candlesticks caught a bounce from the 200-day EMA at 1.0805, but technical support remains thin as the 50-day EMA consolidates with the long-term moving average. EUR/USD is up from April’s swing low into the 1.0600 handle, but still remains down from 2024’s January peak of 1.1045.
EUR/USD hourly chart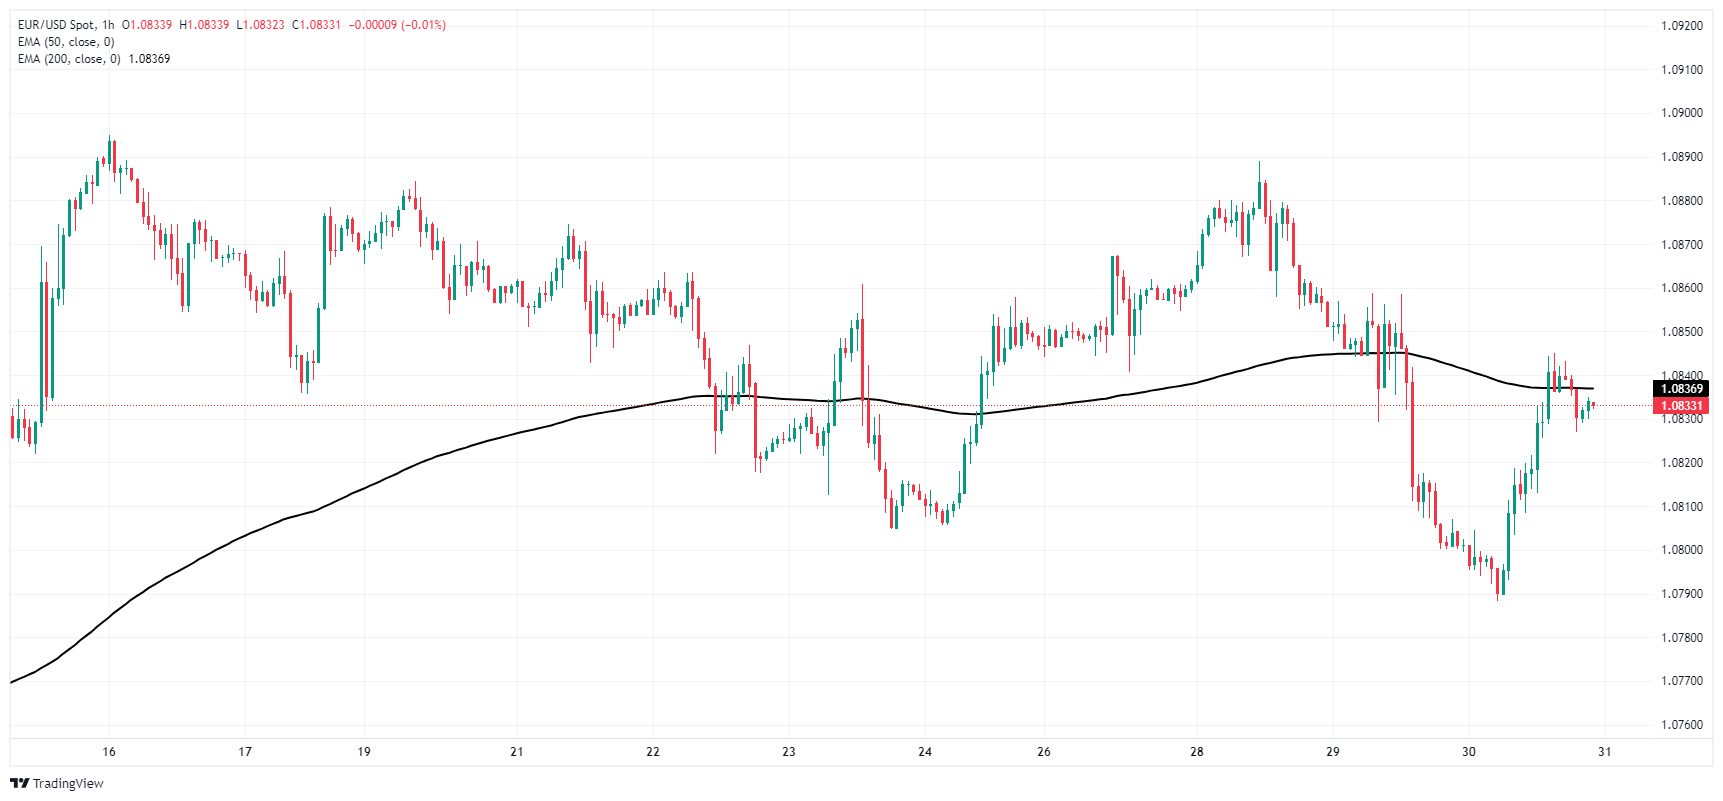
EUR/USD daily chart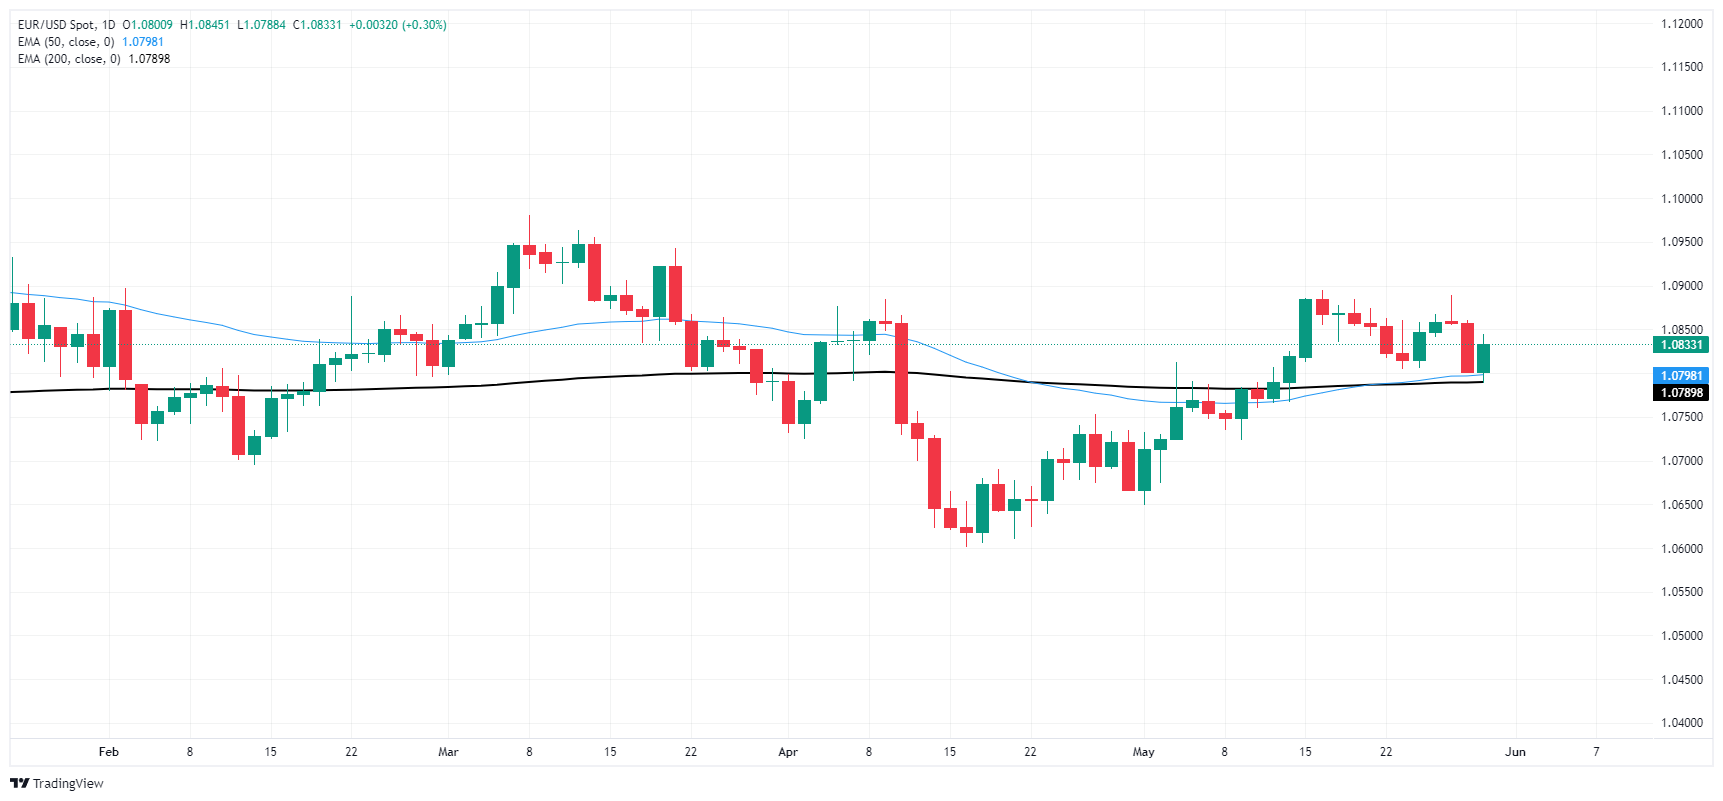
- The NZD/USD is taking a breather after last week’s rally.
- The pair are building a fortification around the 0.6100 area following multiple bullish crossovers of the 20-day SMA.
- Multiple bullish SMA crossovers confirm the positive outlook.
On Thursday, the NZD/USD pair traded neutrally around the 0.6115 level as bullish momentum paused. The outlook turned positive after the pair surged above the 100 and 200-day Simple Moving Averages (SMA) last week, with the 20-day SMA forming a bullish crossover, solidifying support at 0.6100.
In the daily analysis, the Relative Strength Index (RSI) shows a neutral trend with the recent RSI readings at 60, indicating that buying pressure has steadied. The slope has flattened compared to previous sessions, suggesting stability in bullish momentum. This neutral tendency in the RSI coincides with flat green bars on the Moving Average Convergence Divergence (MACD), hinting at a continued yet steady upward trend.
NZD/USD daily chart
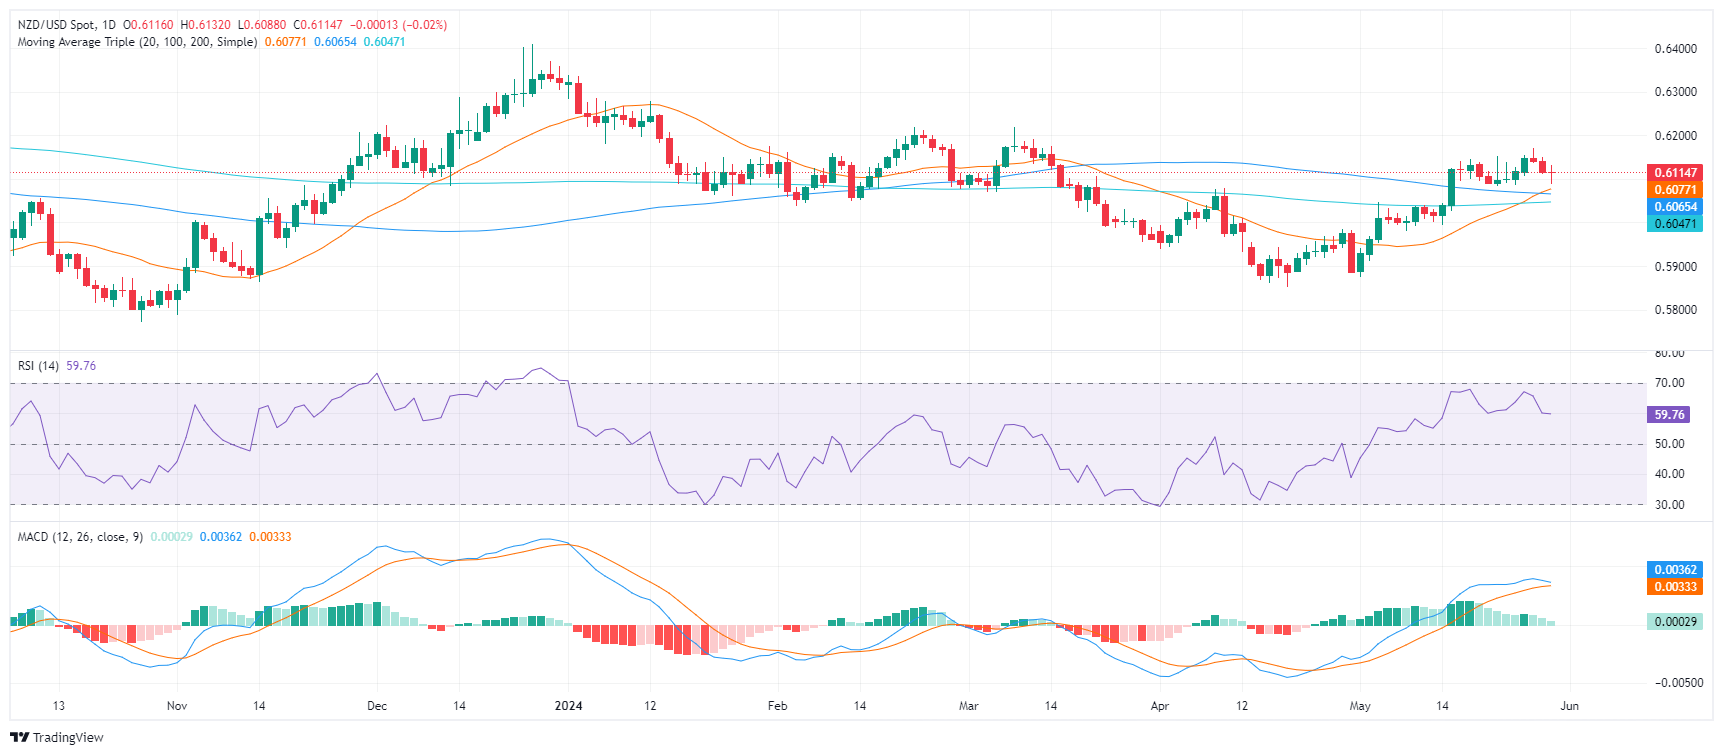
Further support comes from the NZD/USD pair maintaining its position above last week's 100 and 200-day SMA. This was fortified by the 20-day SMA completing a bullish crossover with the 100 and 200-day averages, building robust support around the 0.6100 mark. Any movements that keep the pair above these levels won’t threaten the overall bullish trend.
- WTI slumps back below $78.00 per barrel as Crude Oil markets recede.
- A sharp decline in US Crude Oil supplies couldn’t prop up barrel bids.
- Investor concerns are growing that a reported extention in OPEC cuts will be enough.
West Texas Intermediate (WTI) US Crude Oil backslid on Thursday, with energy markets shrugging off a sharp downturn in reported US Crude Oil stocks. An upcoming meeting of the Organization of the Petroeum Exporting Countries (OPEC) and its extended network of non-member ally states, OPEC+, is broadly expected to extend current voluntary production cuts. OPEC+ kicks off its online-only meeting on Sunday, June 2.
The American Petroleum Institute (API) and Energy Information Administration (EIA) both reported sharp declines in US Crude Oil stocks this week, but energy traders are balking at a huge runup in refined products as refinery runs steeply outproduce demand. The API reported a -6.49 million barrel decline in US Weekly Crude Oil Stocks for the week ended May 24, while the EIA noted a -4.156 million barrel drawdown in Crude Oil Stocks Change for the same period. However, despite the sharp pulldown in Crude Oil supplies, energy traders were knocked back after the EIA reported that refinery-held Crude Oil rose 601,000 per day, notching in the highest level of held refinery crude since December of 2019. The EIA also reported that refinery utilization rates rose by 2.6%.
Holdings of refined Crude Oil products, including gasoline and Natural Gas storage holdings, both rose over the week through May 24, hobbling investment sentiment of Crude Oil markets. OPEC+’s upcoming production meeting is unlikely to resolve energy markets’ concerns.
According to three unnamed sources, OPEC+ is considering extending some Crude Oil output cuts into 2025, on top of an extension of current voluntary production cuts into Q3 or Q4 of 2024. OPEC+’s current voluntary cuts are already feeling underweight to barrel traders, and Crude Oil bids will be looking for more drastic action from the global oil cartel to crimp an possible overhang in production against global demand.
WTI technical outlook
WTI has steepened a near-term decline from this week’s early peak near $80.40, with US Crude Oil tumbling to an intraday low of $77.50 per barrel on Thursday. WTI is still holding above last week’s swing low near $76.00, but topside momentum remains limited and prone to whipsaws.
Thursday’s decline drags WTI firmly south of the 200-day Exponential Moving Average (EMA) at $79.15. A recent consolidation pattern is firming up between the 200-day EMA and recent swing lows below $77.00 per barrel.
WTI hourly chart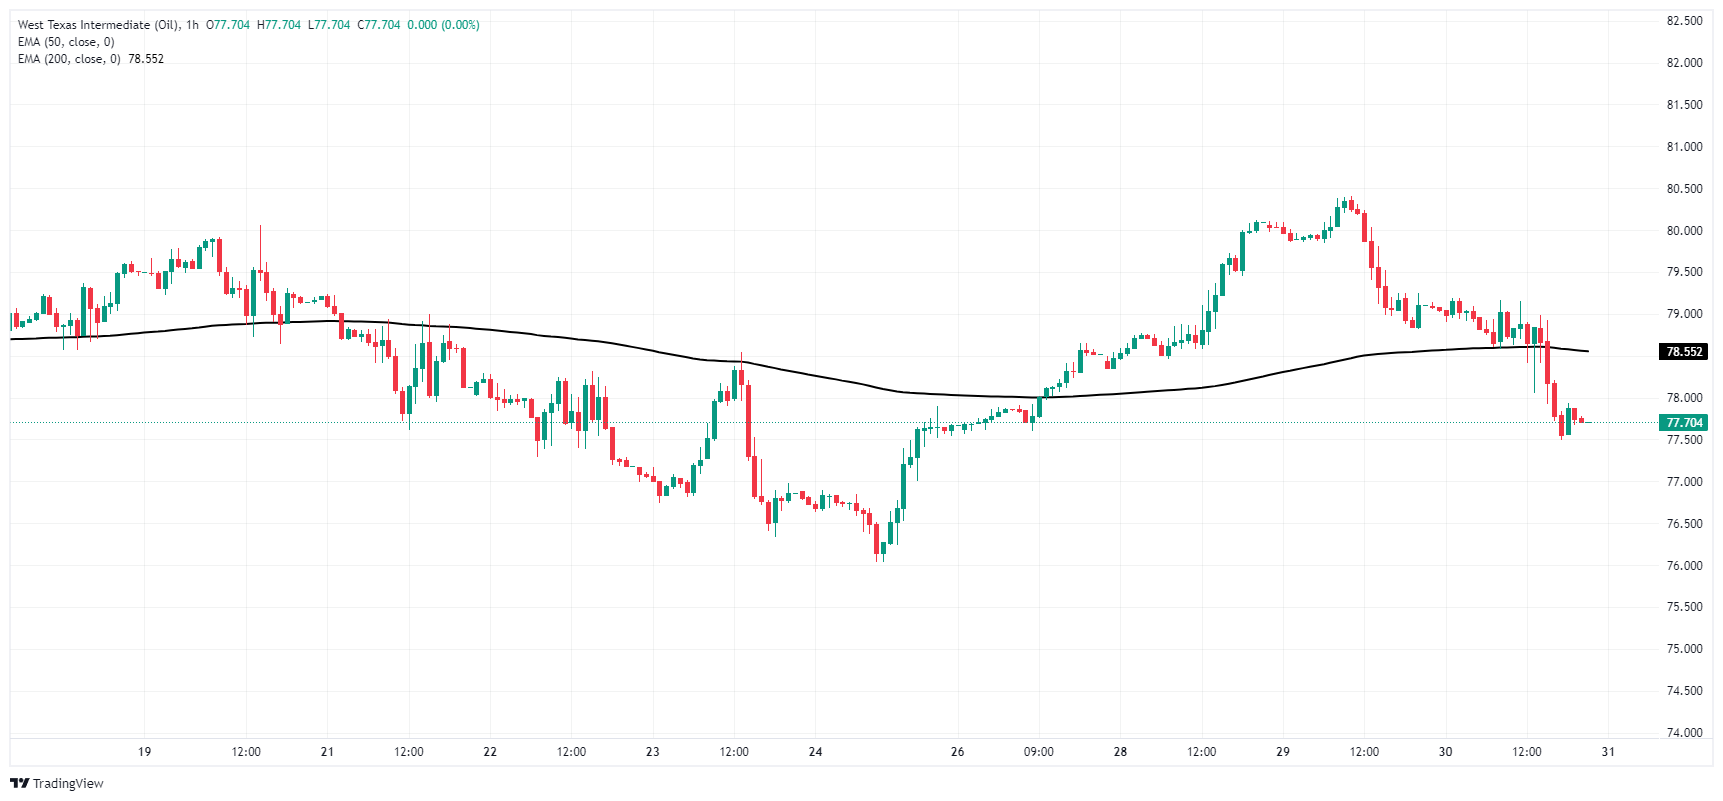
WTI daily chart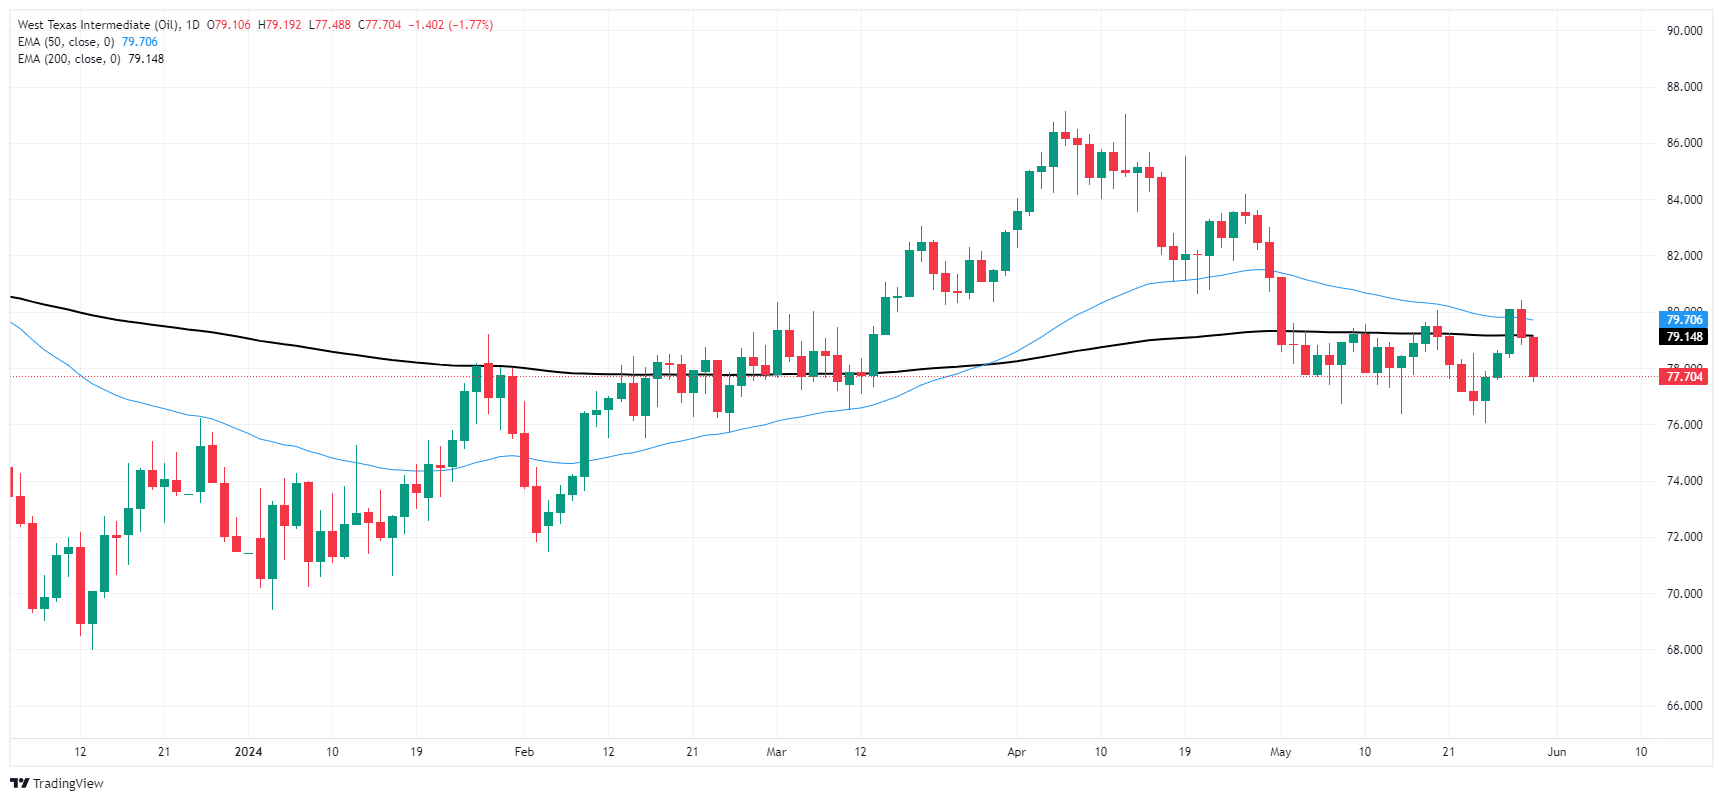
- The daily RSI is pointing downwards, standing near 70, and the MACD has printed a fresh red bar, indicating a deeper consolidation phase.
- On the hourly chart, indicators have flattened in the negative terrain, affirming an extended correction phase.
- The EUR/JPY's position above main SMAs continues to support a long-term bullish sentiment.
During Thursday's session, the EUR/JPY pair extended its correction to a daily low of 169.00 before stabilizing around 170.00. This indicates a continuation of the previous session's retreating bullish momentum. The main focus should be observed around the 170-169.00 range, anticipating further correction movements before confirming alterations to the trend.
In the daily analysis, the Relative Strength Index (RSI) and the Moving Average Convergence Divergence (MACD) point toward a deeper correction phase. The RSI is pointing downwards near 70 while the MACD has printed a fresh red bar. Both reflect the curbed bullish trend leading to a consolidation phase.
EUR/JPY daily chart
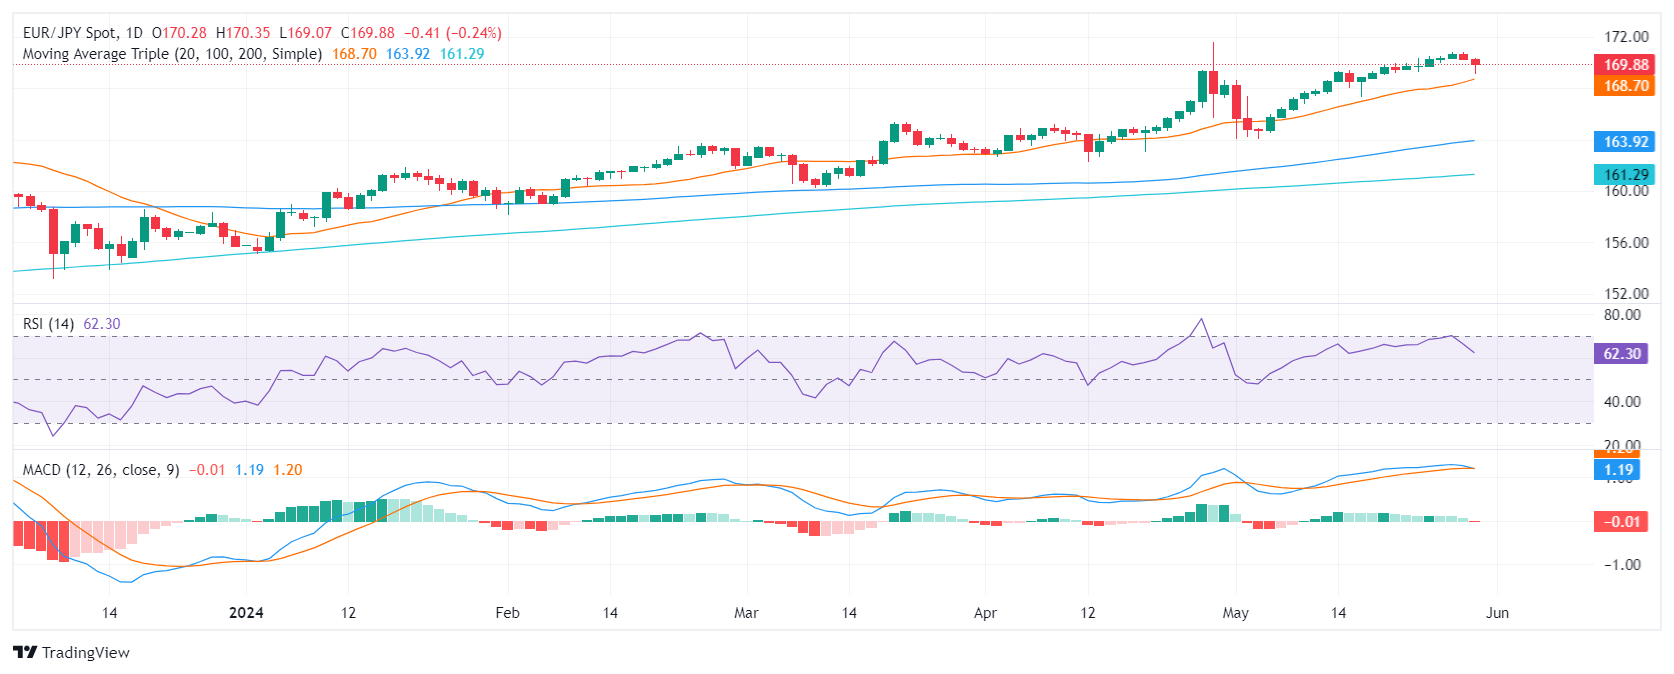
On the hourly chart, indicators have flattened in the negative area. This signals a reinforcing of the ongoing correction phase, likely a response to recent gains.
EUR/JPY hourly chart
Significantly, the current position of the EUR/JPY pair above the 20-day SMA at 168.70, although being tested, keeps the near-term bullish sentiment intact. Movements below this might fundamentally shift the bullish scenario. Below this market point, the 100 and 200-day SMA provide extra safety barriers for potential sellers.
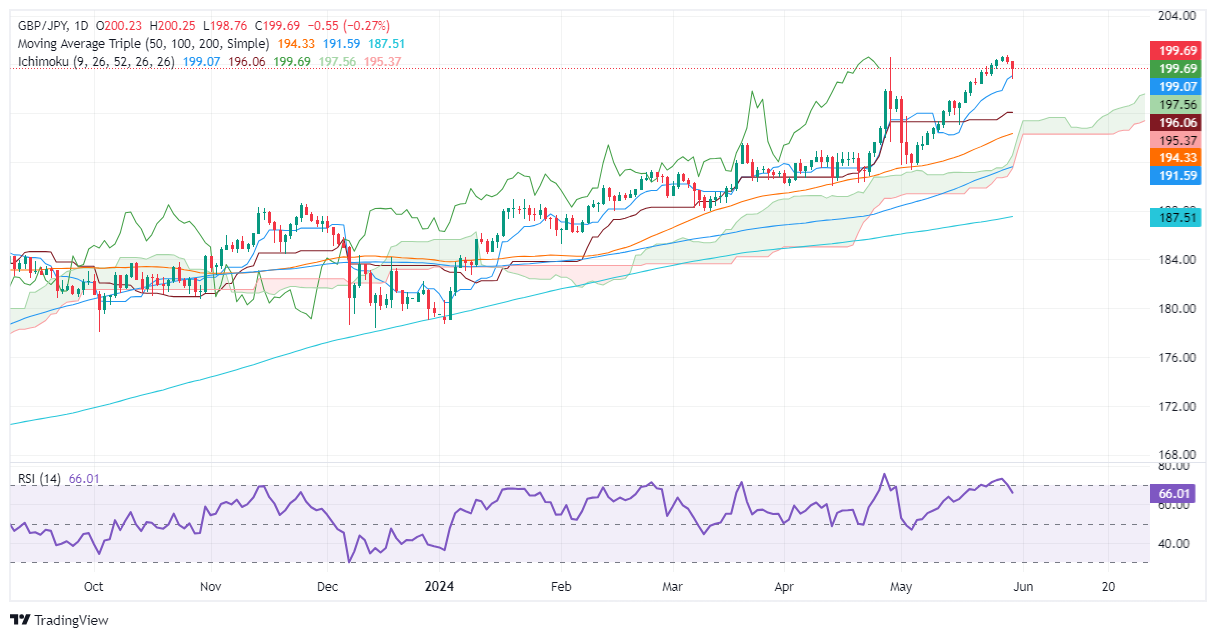
- GBP/JPY slips to 199.68 after hitting YTD high of 200.74 on May 29.
- Technical indicators show momentum fading, with RSI exiting overbought conditions.
- Key support levels: Kijun-Sen at 199.03, Senkou Span A at 197.54, and Tenkan-Sen at 196.05.
The GBP/JPY extended its losses for the second straight day after the cross-pair retreated from around the year-to-date (YTD) high of 200.74, hit on May 29. At the time of writing, the pair trades at 199.68, posting modest losses of 0.24%.
GBP/JPY Price Analysis: Technical outlook
The GBP/JPY uptrend remains intact after buyers achieved fourteen positive trading sessions, opening the door to new yearly highs. Despite that, momentum seems to be fading as the Relative Strength Index (RSI) exited from overbought conditions, opening the door for a mean reversion move. Therefore, the cross registered back-to-back negative sessions, dragging the exchange rate below 200.00.
If GBP/JPY drops below the Kijun-Sen of 199.03, that would sponsor a dip to the Senkou Span A at 197.54. Further losses lie below 197.00, kike the Tenkan-Sen at 196.05.
On the other hand, if buyers reclaim 200.00, look for renewed buying that can push the exchange rate to challenge the YTD high of 200.74.
GBP/JPY Price Action – Daily Chart
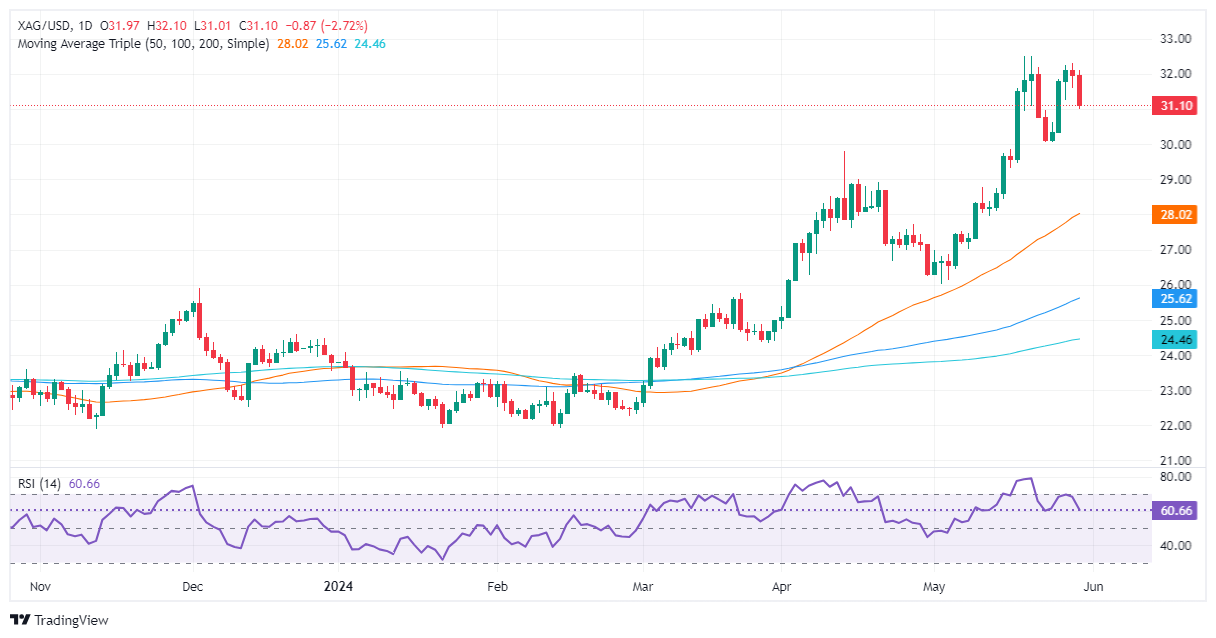
- Silver prices tumbled even though US bond yields fell.
- The formation of an ‘evening star’ can pave the way to challenge lower prices.
- XAG/USD to consolidate around $31.00 if buyers hold firm around the latter.
Silver prices dropped from daily highs that had reached around $32.09 earlier, even though US Treasury bond yields tumbled. A late recovery of the US Dollar, trimming some of its losses, weighed on the grey metal, which is down more than 2.80%. At the time of writing, the XAG/USD trades at $31.06 and falls to three-day lows.
XAG/USD Price Analysis: Technical outlook
After rallying toward the year-to-date (YTD) high of $32.51, the non-yielding metal dipped to $30.05 before launching another attack toward the YTD highs. However, bullish momentum seems to be fading, as depicted by the Relative Strength Index (RSI), which, despite remaining above the 50-midline, aims lower, showing sellers’ strength. Alongside that, the formation of an ‘evening star’ hints that a further downside is seen.
If XAG/USD drops below $31.00, further losses lie beneath. The next support would be the May 24 latest cycle low of $30.05, followed by the April 12 high of $29.79. Once cleared, the next stop would be the $29.00 psychological level.
On the flip side, if buyers keep silver spot prices above $31.00, that would pave the way for consolidation, around the $31.00/$32.00 range.
XAG/USD Price Action – Daily Chart
Federal Reserve (Fed) Bank of Atlanta President Raphael Bostic noted on Thursday during an interview with Fox Business that the Atlanta Fed head doesn't believe further rate hikes should be required to reach the Fed's 2% annual inflation target.
Key highlights
The inflation outlook will come down very slowly.
The Fed needs to stay in a restrictive stance.
I don't think a rate hike will be required to reach the 2% goal.
The economy continues to grow, but it's growing at a slower pace.
I expect to reach the inflation goal without an unemployment jump.
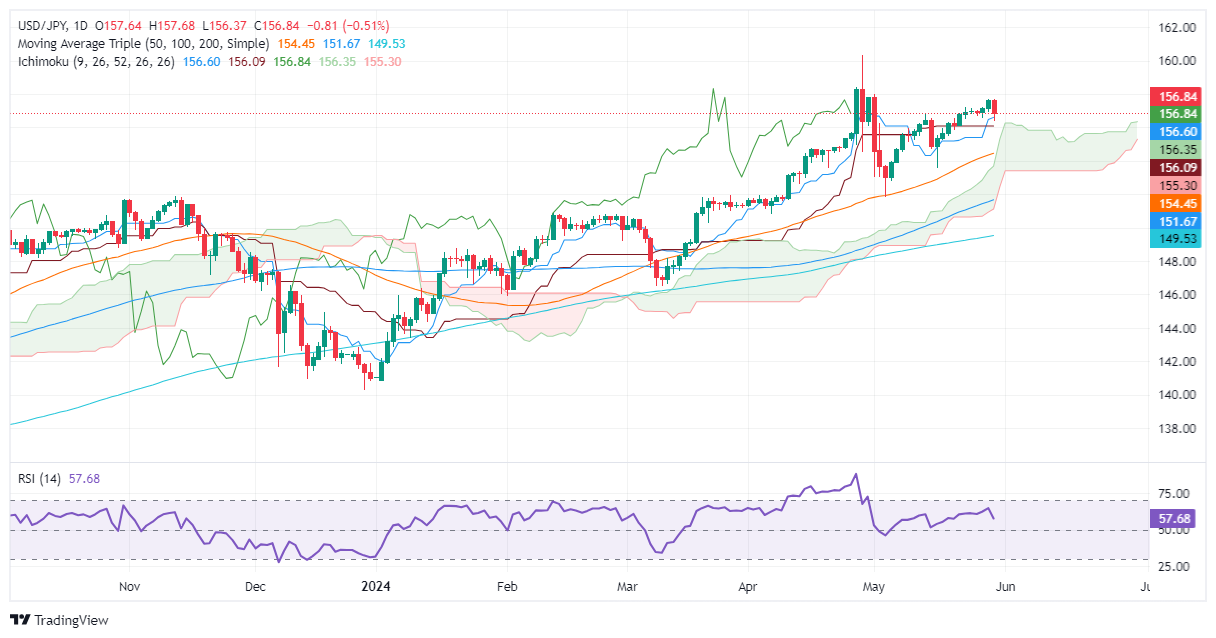
- USD/JPY slips from weekly highs of 157.71, down 0.30%.
- Technical outlook remains neutral to upward, with key resistance at 157.00 and 157.71.
- Support levels to watch: Tenkan and Kijun-Sen at 156.76/60, Senkou Span A at 156.32, and 156.00 mark.
The USD/JPY dropped from weekly highs of 157.71 on May 29 after data from the United States (US) painted an ongoing economic slowdown, which sent US Treasury yields plunging. Consequently, the Greenback is feeling the pain, as the pair is trading at 156.83, down 0.30%.
USD/JPY Price Analysis: Technical outlook
The major remains neutral to upward bias after cracking the May 14 high of 156.76. That opened the door to challenge 157.00 and beyond, but the drop in the US 10-year yield, which correlates closely to the USD/JPY, weighed on the pair.
Momentum suggests that buyers remain in charge, as the Relative Strength Index (RSI) is bullish but aiming down.
If USD/JPY buyers reclaim 157.00, that could pave the way for further gains and expose overhead resistance at the current week’s high of 157.71. Once hurdled, the next stop would be 158.00, followed by the year-to-date (YTD) high of 160.32.
On the flip side, sellers could push the exchange rate as a ‘bearish engulfing’ chart pattern loom. A drop below the Tenkan and Kijun-Sen at around 156.76/60 will sponsor a leg down. The next line of defense for bulls would be the Senkou Span A at 156.32 before challenging the 156.00 mark.
USD/JPY Price Action – Daily Chart
- The AUD/NZD rebounded to a high of 1.0840 after dipping to 1.0815 on Wednesday.
- Strong data from Australia following the report of hot inflation figures reported at the beginning of the week benefited the AUD.
- New Zealand's newly announced tax cut policy may delay the RBNZ's rate cuts.
The AUD/NZD was seen trading higher during Thursday's session as markets digested mid-tier Australian data and a fresh fiscal policy from New Zealand.
In Australia, the robust Q1 business investment and higher-than-expected private capital expenditure figures supported the AUD. On Tuesday, the country reported higher-than-expected inflation figures which coupled with strong economic data may prompt the Reserve Bank of Australia (RBA) to turn more hawkish. On Wednesday Gross Domestic Product (GDP) will be closely followed.
Simultaneously, New Zealand's new government announced an NZD 14.7 billion tax cut package for low and middle-income households. A more lax fiscal policy has softened expectations of imminent rate cuts by the Reserve Bank of New Zealand (RBNZ) which could eventually limit the losses for the Kiwi. The odds of a cut in November fell slightly but remain priced at around 70%.
AUD/NZD technical analysis
On the daily chart, the Relative Strength Index (RSI) remains in negative territory, indicating a firm downtrend. The persistent rise of the red bars of the Moving Average Convergence Divergence (MACD) histogram further solidifies this downward momentum.
However, as the pair approached oversold territory on Wednesday indicators saw a slight upward correction on Thursday, which is in line with the latest market developments as sellers seem to be taking a breather.
AUD/NZD daily chart
A corrective move saw the US Dollar lose some upside impetus on Thursday, helping the risk complex recoup some ground prior to the release of advanced inflation figures in the euro area and US PCE, all due on Friday.
Here is what you need to know on Friday, May 31:
The USD Index (DXY) came under pressure and retreated from weekly highs past the 105.00 hurdle against the backdrop of declining US yields. On May 31, all the attention will be on the release of inflation data tracked by the PCE along with Personal Income and Personal Spending.
EUR/USD briefly tested the 200-day SMA around 1.0790 before staging a marked comeback to the area beyond 1.0800 the figure. The EMU’s advanced Inflation Rate and Retail Sales in Germany will be at the centre of the debate on May 31.
GBP/USD set aside two daily drops in a row and advanced further north of the 1.2700 barrier following the offered stance in the Greenback. In the UK, Mortgage Approvals and Mortgage Lending are due on May 31 along with Nationwide Housing Prices.
The upside impulse in USD/JPY lost some traction and sparked a pullback to weekly lows amidst lower US and Japanese yields. In the Japanese docket, the Unemployment Rate, preliminary Industrial Production and Housing Starts will all be published on May 31.
Following a brief drop below 0.6600, AUD/USD managed to regain balance and end the session with marked gains around the 0.6650 area. On May 31, Housing Credit is only due Down Under.
Prices of WTI retreated further and broke below the $78.00 mark per barrel following rising demand concerns in the wake of rising stockpiles in gasoline and distillate stocks, according to the EIA.
Prices of gold rose modestly on the back of the weaker dollar and diminishing US yields, briefly revisiting the $2,350 area per troy ounce. Silver, instead, accelerated their losses to three-day lows near the $31.00 mark per ounce.
- Dow Jones is looking up from the bottom after another gap lower.
- US GDP growth eased as-expected, keeping investors hopeful for rate cuts.
- Steep losses in key equities are keeping indexes sharply lower.
The Dow Jones Industrial Average (DJIA) kicked off Thursday with another bearish gap after overnight trading dragged key securities steeply lower. However, market action in the US session is finding a floor in prices as investors dare to hope for signs of further easing in the US economy.
US Q1 Gross Domestic Product (GDP) grew by 1.3%, in-line with market forecasts and easing from the previous 1.6%. Core Personal Consumption Expenditures (PCE) QoQ also ticked lower to 3.6% when markets expected a hold at 3.7%. With US growth and price inflation showing further signs of cooling off, investors are stepping back into hopes for rate cuts from the Federal Reserve (Fed).
According to the CME’s FedWatch Tool, rate markets are once again pricing in better-than-even odds of at least a 25–basis-point rate trim from the Fed in September. The target rate probability sees only a 49% chance of rates holding at their current level when the Federal Open Market Committee (FOMC) meets in September.
With Thursday figures in the rearview mirror, investors will be pivoting to Friday’s key inflation print, the US PCE Price Index. April’s Core PCE Price Index inflation is expected to hold steady at 0.3% MoM, with YoY Core PCE Price Index inflation also expected to hold at 2.8%. As the Fed’s preferred method of measuring inflation, markets will be watching Friday’s data print closely.
Dow Jones news
Of the 30 constituent securities that make up the Dow Jones, nearly all of them are in the green on Thursday, but steep losses in key equities are keeping the index hobbled.
Salesforce Inc. (CRM), a key cloud-based software company that is a principal player in customer relationship management software, is steeply lower after reported quarterly revenues missed Wall Street expectations. Salesforce reported Q1 earnings of $9.13 billion, slightly lower than analyst estimates of $9.17 billion. CRM also issued lower-than-expected guidance, and this is the first time that CRM has missed expectations since 2006. CRM is down nearly -21.5% on Thursday, falling to $213.62 per share.
Dow Jones technical outlook
The Dow Jones is moderating near 38,100.00 on Thursday, holding steady after a bearish gap down to kick off the day’s trading session. The DJIA is still down from Wednesday’s closing bids near 38,500.00, but priced in an early floor near the 38,000.00 handle.
The Dow Jones is down sharply from record highs set just above 40,000.00 nearly two weeks ago, falling over 5% peak-to-trough. The DJIA is grinding back towards the 200-day Exponential Moving Average (EMA) at 37,233.38, a key technical barrier the Dow Jones hasn’t hit since November of 2023.
Dow Jones five minute chart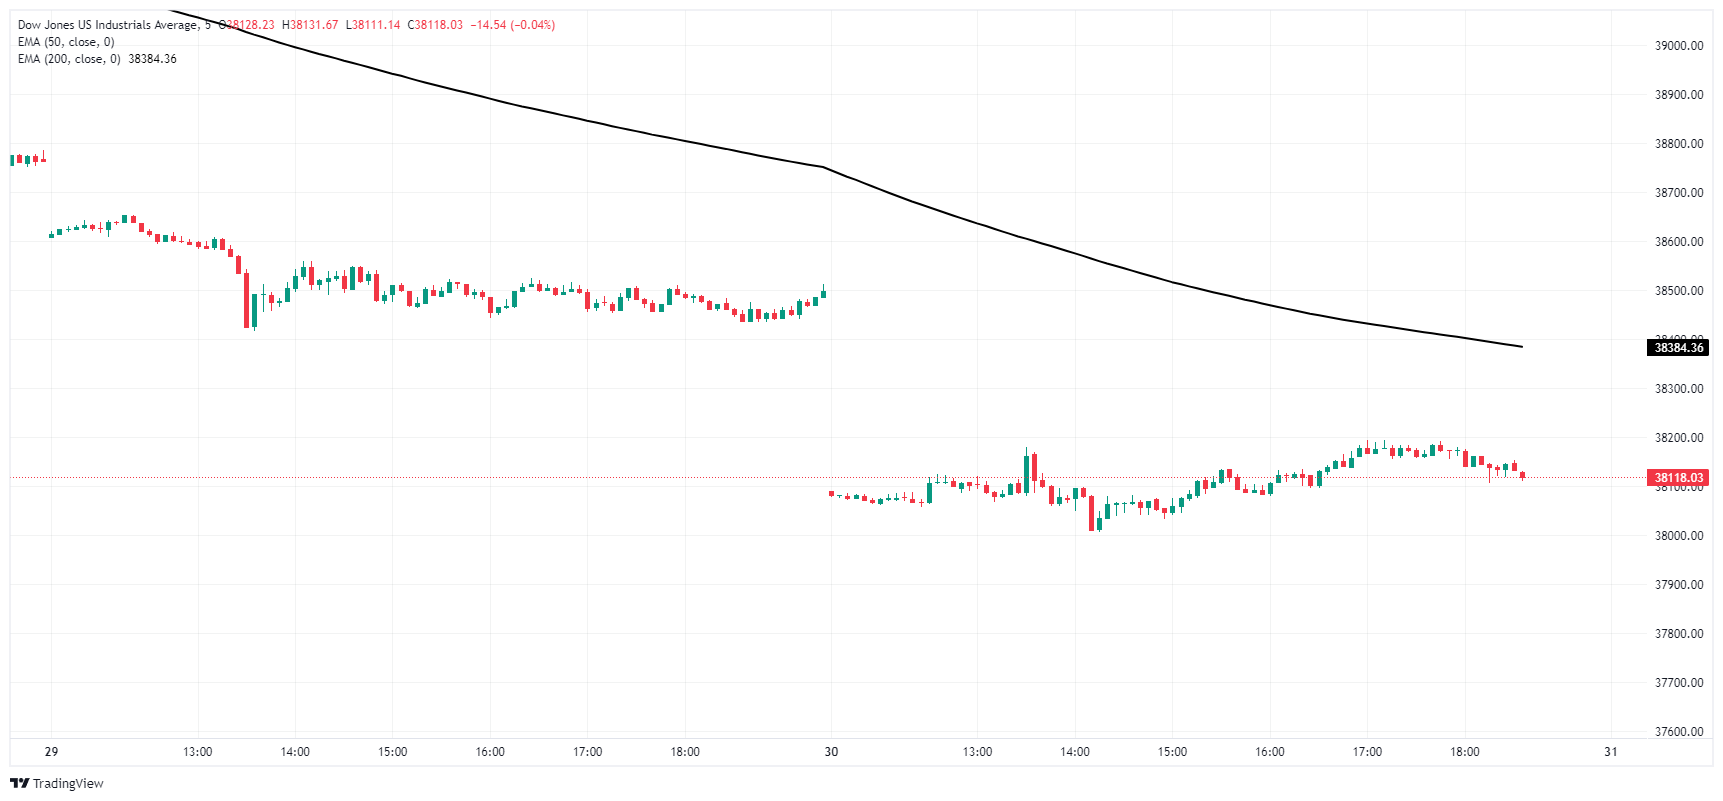
Dow Jones daily chart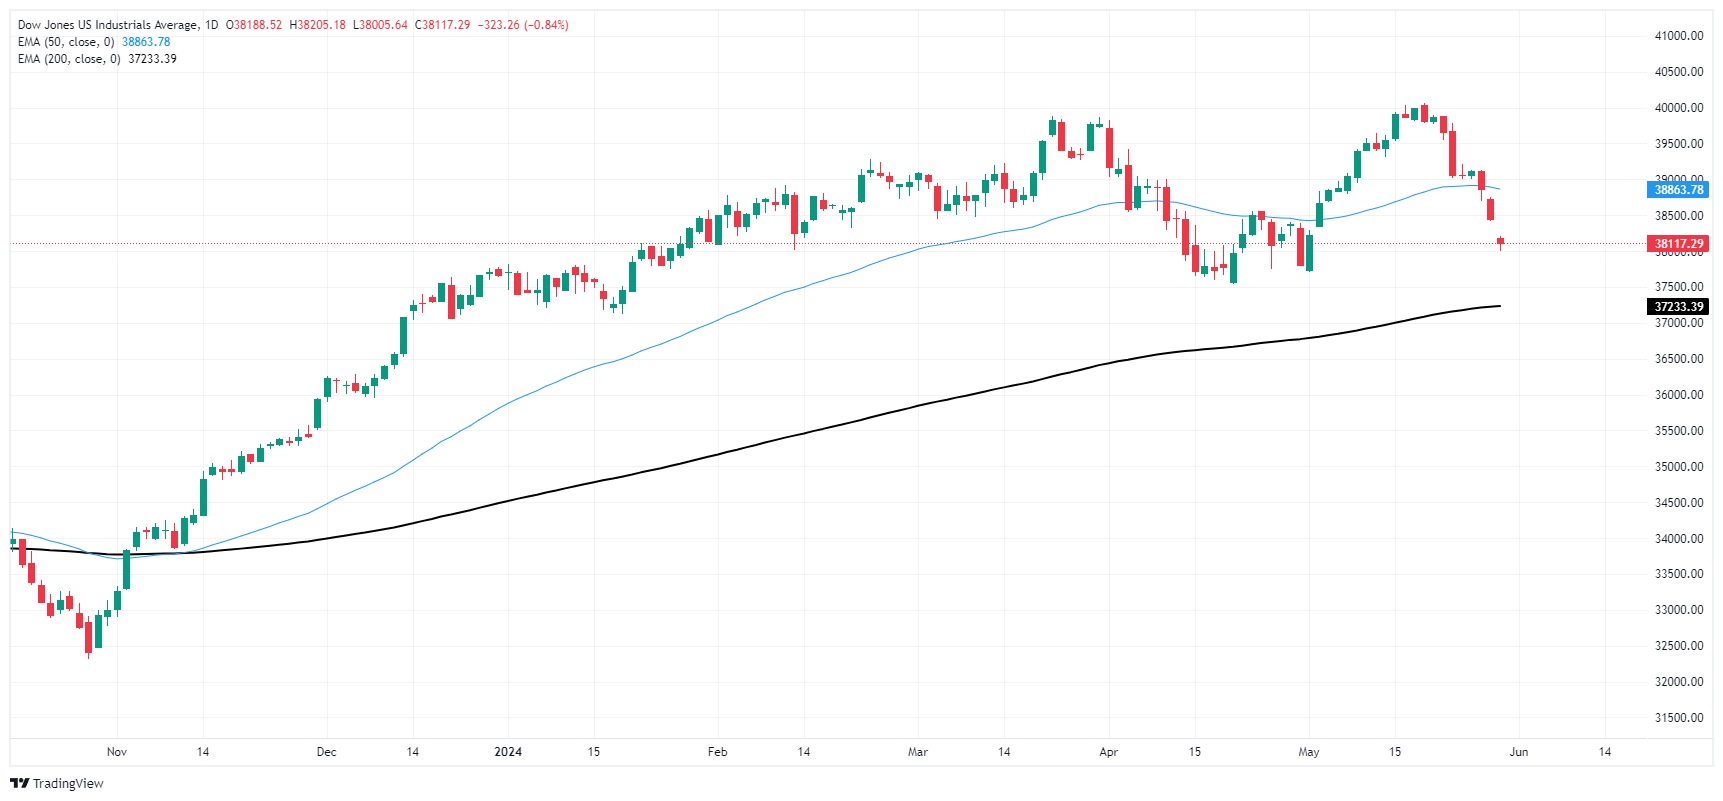
Dow Jones FAQs
The Dow Jones Industrial Average, one of the oldest stock market indices in the world, is compiled of the 30 most traded stocks in the US. The index is price-weighted rather than weighted by capitalization. It is calculated by summing the prices of the constituent stocks and dividing them by a factor, currently 0.152. The index was founded by Charles Dow, who also founded the Wall Street Journal. In later years it has been criticized for not being broadly representative enough because it only tracks 30 conglomerates, unlike broader indices such as the S&P 500.
Many different factors drive the Dow Jones Industrial Average (DJIA). The aggregate performance of the component companies revealed in quarterly company earnings reports is the main one. US and global macroeconomic data also contributes as it impacts on investor sentiment. The level of interest rates, set by the Federal Reserve (Fed), also influences the DJIA as it affects the cost of credit, on which many corporations are heavily reliant. Therefore, inflation can be a major driver as well as other metrics which impact the Fed decisions.
Dow Theory is a method for identifying the primary trend of the stock market developed by Charles Dow. A key step is to compare the direction of the Dow Jones Industrial Average (DJIA) and the Dow Jones Transportation Average (DJTA) and only follow trends where both are moving in the same direction. Volume is a confirmatory criteria. The theory uses elements of peak and trough analysis. Dow’s theory posits three trend phases: accumulation, when smart money starts buying or selling; public participation, when the wider public joins in; and distribution, when the smart money exits.
There are a number of ways to trade the DJIA. One is to use ETFs which allow investors to trade the DJIA as a single security, rather than having to buy shares in all 30 constituent companies. A leading example is the SPDR Dow Jones Industrial Average ETF (DIA). DJIA futures contracts enable traders to speculate on the future value of the index and Options provide the right, but not the obligation, to buy or sell the index at a predetermined price in the future. Mutual funds enable investors to buy a share of a diversified portfolio of DJIA stocks thus providing exposure to the overall index.
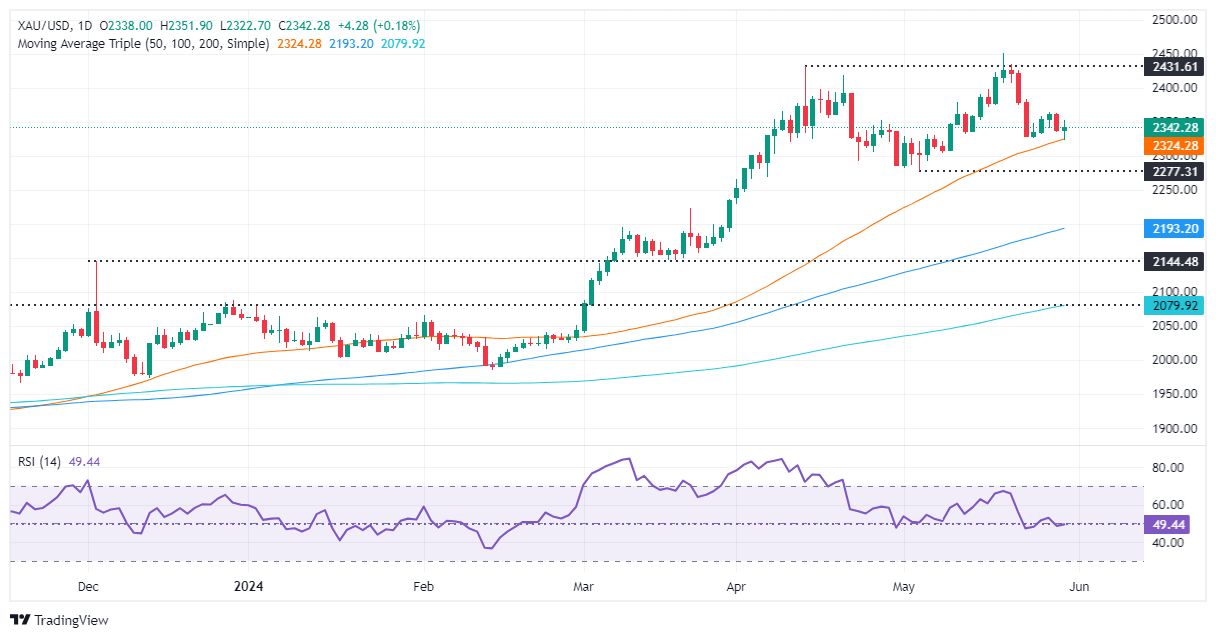
- Gold bounces to $2,347 from daily lows of $2,322, up 0.41%.
- Slower US GDP growth and rising unemployment claims weaken the Greenback.
- Traders eye April’s PCE inflation data, which could dictate XAU/USD’s direction.
Gold prices trimmed some of Wednesday’s losses and rose 0.41% on Thursday after the US Gross Domestic Product (GDP) showed the economy is slowing, reigniting hopes that the US Federal Reserve (Fed) may cut rates later in the year.
The XAU/USD trades at $2,347, bouncing off daily lows of $2,322. The yield of the US 10-year note collapsed almost seven basis points (bps) to 4.548%, while the Greenback followed suit. The US Dollar Index (DXY) lost 0.43%, at 104.67.
The US economy grew at a slower rate than in the fourth quarter of last year, indicating that higher borrowing costs set by the Fed are taking their toll on the economy. Meanwhile, the US Department of Labor revealed an increase in the number of people applying for unemployment benefits.
Recently, New York Fed President John Williams grabbed the headlines. He said that monetary policy is well-positioned, that inflation is too high, and that he doesn’t feel urgency to slash interest rates. He added that inflation would reach the Fed’s 2% goal in early 2026.
Even though he was hawkish, Gold prices barely heeded his words, standing at current spot prices. The US housing market is also weakening, according to the Pending Home Sales data revealed by the National Association of Realtors.
Ahead in the week, traders are anticipating the release of April’s Personal Consumption Expenditures (PCE) Price Index, which is the Fed’s preferred measure of inflation. The core PCE figure is expected to be 2.8% YoY, while the headline PCE is projected to increase by 0.3% MoM.
Daily digest market movers: Gold price rises as US Treasury yields retreat from multi-week high
- Gold prices advance after bouncing off 50-day Simple Moving Average (SMA) at $2,324.
- US economic docket includes second estimate of Gross Domestic Product (GDP) for Q1 2024, which showed a decline from 3.4% to 1.3% quarter-over-quarter and aligned with analyst expectations.
- Initial Jobless Claims for the week ending May 25 increased to 219K, slightly above the consensus estimate of 218K and higher than the previous week's reading of 216K.
- Pending Home Sales for April tumbled from 3.6% to -7.7% MoM and, on an annual basis, plunged -7.4% from a 0.1% expansion.
- Fed funds rate futures estimate just 27 basis points of interest rate cuts in 2024, according to data provided by the Chicago Board of Trade (CBOT).
Technical analysis: Gold price climbs, yet remains below $2,350
Gold’s rally is set to continue, yet buyers are struggling to crack the psychological $2,350 mark, which could pave the way for further gains. Short-term momentum favors sellers as the Relative Strength Index (RSI) remains bearish after punching below the 50 midline on Wednesday.
Further gains could be anticipated if XAU/USD buyers reclaim the psychological mark of $2,350. The next target would be the $2,400 level, followed by the year-to-date high of $2,450 and, subsequently, the $2,500 mark.
Conversely, if XAU/USD falls below the 50-day Simple Moving Average (SMA) at $2,321, that could pave the way to challenge the May 8 low of $2,303, followed by the May 3 cycle low of $2,277.
Gold FAQs
Gold has played a key role in human’s history as it has been widely used as a store of value and medium of exchange. Currently, apart from its shine and usage for jewelry, the precious metal is widely seen as a safe-haven asset, meaning that it is considered a good investment during turbulent times. Gold is also widely seen as a hedge against inflation and against depreciating currencies as it doesn’t rely on any specific issuer or government.
Central banks are the biggest Gold holders. In their aim to support their currencies in turbulent times, central banks tend to diversify their reserves and buy Gold to improve the perceived strength of the economy and the currency. High Gold reserves can be a source of trust for a country’s solvency. Central banks added 1,136 tonnes of Gold worth around $70 billion to their reserves in 2022, according to data from the World Gold Council. This is the highest yearly purchase since records began. Central banks from emerging economies such as China, India and Turkey are quickly increasing their Gold reserves.
Gold has an inverse correlation with the US Dollar and US Treasuries, which are both major reserve and safe-haven assets. When the Dollar depreciates, Gold tends to rise, enabling investors and central banks to diversify their assets in turbulent times. Gold is also inversely correlated with risk assets. A rally in the stock market tends to weaken Gold price, while sell-offs in riskier markets tend to favor the precious metal.
The price can move due to a wide range of factors. Geopolitical instability or fears of a deep recession can quickly make Gold price escalate due to its safe-haven status. As a yield-less asset, Gold tends to rise with lower interest rates, while higher cost of money usually weighs down on the yellow metal. Still, most moves depend on how the US Dollar (USD) behaves as the asset is priced in dollars (XAU/USD). A strong Dollar tends to keep the price of Gold controlled, whereas a weaker Dollar is likely to push Gold prices up.
President of the Federal Reserve (Fed) Bank of Chicago Austan Goolsbee noted on Thursday that housing inflation remains a key sticking point in price growth, and that the US labor market remains quite strong. Chicago Fed President Goolsbee noted that inflation could fall without a meaningful increase in unemployment.
Key highlights
Issue now is whether the US will face a "traditional" trade off between inflation and unemployment.
Research is "quite clear" across countries and time that political intereference in monetary policy creates worse economic outcomes.
"Extremely important" that the Fed hit its 2% inflation target since it has centered expectations around that number.
The strongest part of the economy right now is the job market.
Overall the US has had a strong post-COVID recovery.
There are industries, parts of the country, and people that are "hurting" in the current economy.
The Fed is not trying to return the price level to where it was; that would require deflation.
Housing inflation is still "well elevated" compared to pre-COVID levels; will be hard to get to 2% unless that changes.
Still optimistic that housing inflation will slow.
- The daily chart escapes overbought signals as the overall trend begins to consolidate.
- After reaching multi-year highs above 96.70, NZD/JPY enters a phase of consolidation with support found at 95.50.
- The 95.00 offers strong support to prevent further losses.
On Thursday's trading session, the NZD/JPY pair underwent further corrections, with sellers gaining momentum. Nonetheless, the pair managed to clear some losses and found strong support at 95.50. Traders are also eying the 95.00 threshold to prevent further losses. While signs of a possible reversal in momentum have waned, the overall outlook remains a phase of consolidation.
According to the daily chart indicators, the Relative Strength Index (RSI) now stands below 70, reflecting a change from previous overbought conditions. This coincides with a potential pause or slow in price gains. Simultaneously, the Moving Average Convergence Divergence (MACD) indicates a decrease in positive momentum with shrinking green bars.
NZD/JPY daily chart
Glancing at the hourly chart, the RSI and MACD histograms have both flattened in negative territory. This suggests that sellers may be losing traction on an hourly basis, indicating consolidation.
NZD/JPY hourly chart
As the consolidation phase continues, any downward movements that keep the pair above its Simple Moving Averages (SMAs) could be considered corrective, providing the pair stays above the key support level of 95.00.
- Canadian Dollar pivots into high side on Thursday amid fresh risk appetite.
- Canada finds better-than-expected Current Account figures.
- US GDP growth cooled as expected, sparking fresh rate cut hopes.
The Canadian Dollar (CAD) is rebounding on Thursday, recovering ground previously lost in the midweek market session as broad market flows in the Greenback dictate overall market sentiment. Canadian trade balance numbers fell in the first quarter, but less than expected, helping to bolster the CAD.
Canada saw a -5.37 billion contraction in its Q1 Current Account, worse than the previous quarter but still better than median market estimates. US Gross Domestic Product (GDP) growth in the first quarter eased slightly, in-line with market forecasts, prompting a flurry of re-ignited hopes for rate cuts from the Federal Reserve (Fed).
Daily digest market movers: Canadian Dollar pushed higher by broad Greenback selling
- Canadian Q1 Current Account declined -5.37 billion compared to the previous quarter’s revised -4.51 billion, but better than the forecast -5.5 billion.
- US Annualized Q1 GDP growth eased to 1.3% as expected, falling back from the previous 1.6% print.
- US Core Personal Consumption Expenditures (PCE) in Q1 also eased, ticking down to 3.6% from the forecast for a hold at 3.7%, sparking hopes of further inflation easing.
- US Initial Jobless Claims for the week ended May 24 also rose to 219K, over the forecast of 218K and weaker than the previous week’s revised 216K, helping to provide support to the “bad news is good news” market narrative.
- Friday will close off the trading week with a hectic schedule. Canadian Q1 GDP growth figures will be released side-by-side with US PCE Price Index inflation data for April.
- Canadian Annualized Q1 GDP is expected to rebound to 2.2% from the previous 1.0%.
- US core PCE Price Index inflation in April is forecast to hold steady at 0.3% MoM.
Canadian Dollar PRICE Today
The table below shows the percentage change of Canadian Dollar (CAD) against listed major currencies today. Canadian Dollar was the weakest against the Swiss Franc.
| USD | EUR | GBP | JPY | CAD | AUD | NZD | CHF | |
|---|---|---|---|---|---|---|---|---|
| USD | -0.38% | -0.33% | -0.61% | -0.38% | -0.53% | -0.20% | -1.06% | |
| EUR | 0.38% | 0.05% | -0.20% | -0.00% | -0.14% | 0.16% | -0.68% | |
| GBP | 0.33% | -0.05% | -0.26% | -0.07% | -0.21% | 0.11% | -0.73% | |
| JPY | 0.61% | 0.20% | 0.26% | 0.20% | 0.06% | 0.33% | -0.46% | |
| CAD | 0.38% | 0.00% | 0.07% | -0.20% | -0.13% | 0.17% | -0.68% | |
| AUD | 0.53% | 0.14% | 0.21% | -0.06% | 0.13% | 0.30% | -0.52% | |
| NZD | 0.20% | -0.16% | -0.11% | -0.33% | -0.17% | -0.30% | -0.84% | |
| CHF | 1.06% | 0.68% | 0.73% | 0.46% | 0.68% | 0.52% | 0.84% |
The heat map shows percentage changes of major currencies against each other. The base currency is picked from the left column, while the quote currency is picked from the top row. For example, if you pick the Canadian Dollar from the left column and move along the horizontal line to the US Dollar, the percentage change displayed in the box will represent CAD (base)/USD (quote).
Technical analysis: Canadian Dollar regains familiar chart territory in Thursday pivot
The Canadian Dollar (CAD) is rebounding in a broad-market risk appetite recovery, climbing four-tenths of a percent against the US Dollar amid Greenback weakness across the board. The CAD is still down six-tenths of a percent against the Swiss Franc (CHF) and around a fifth of a percent against the Japanese Yen (JPY).
USD/CAD has fallen back to familiar levels near 1.3660 on Thursday in a quick turnaround from Wednesday’s peak near 1.3735. The pair is running into near-term technical resistance at the 200-hour Exponential Moving Average (EMA) at 1.3670, with an intraday floor priced in at this week’s swing low into 1.3615.
Daily candles continue to etch in a rough consolidation pattern, and USD/CAD is mired in a sideways grind near the 50-day EMA at 1.3646. Long-term technical support is coming from the 200-day EMA at 1.3557.
USD/CAD hourly chart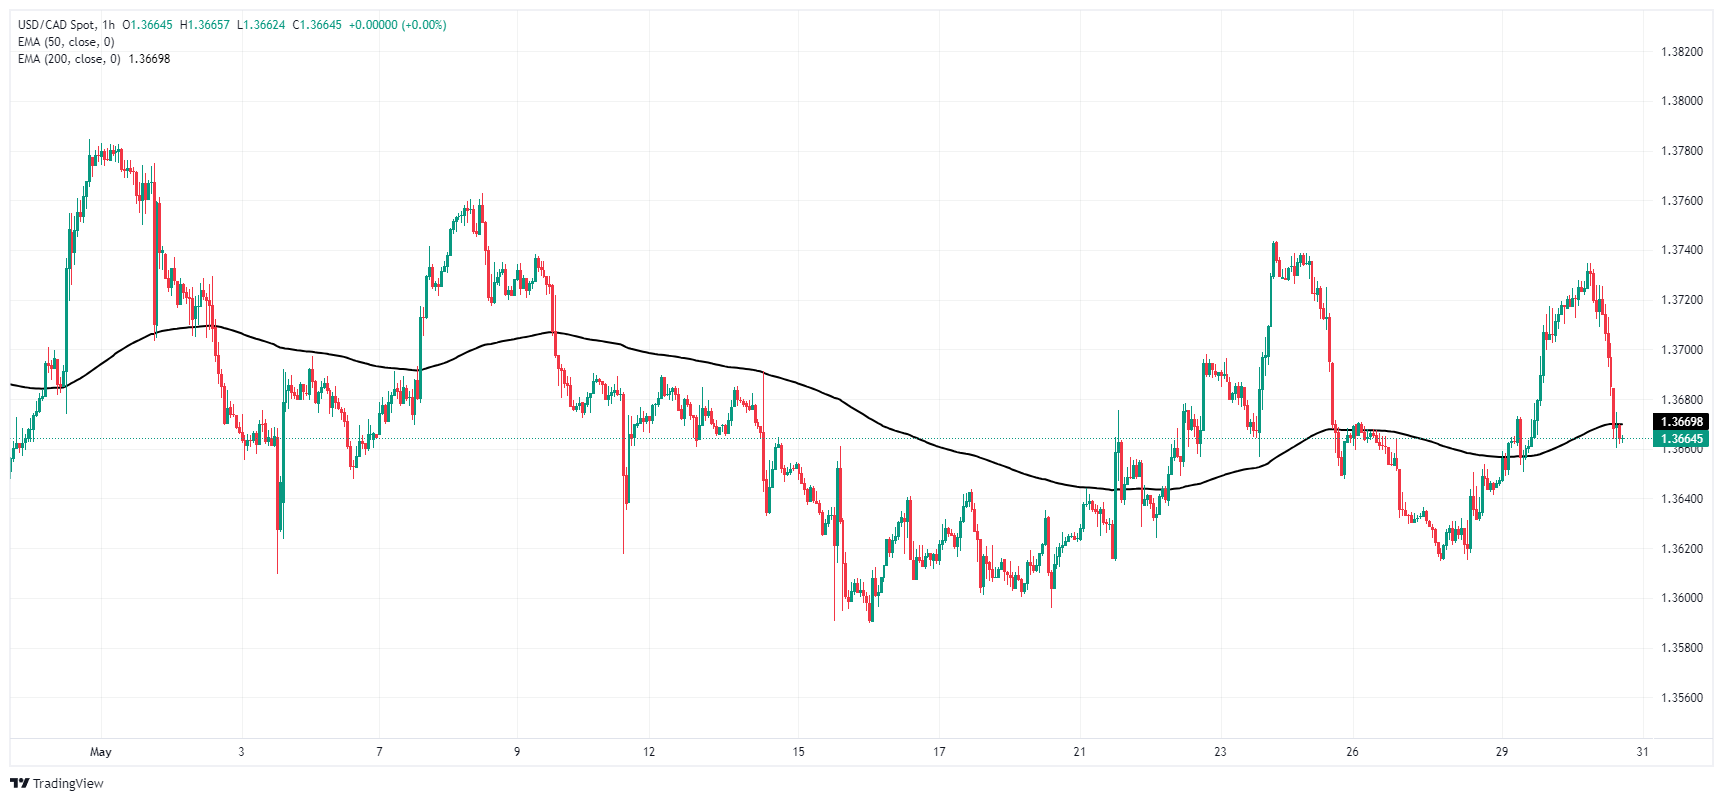
USD/CAD daily chart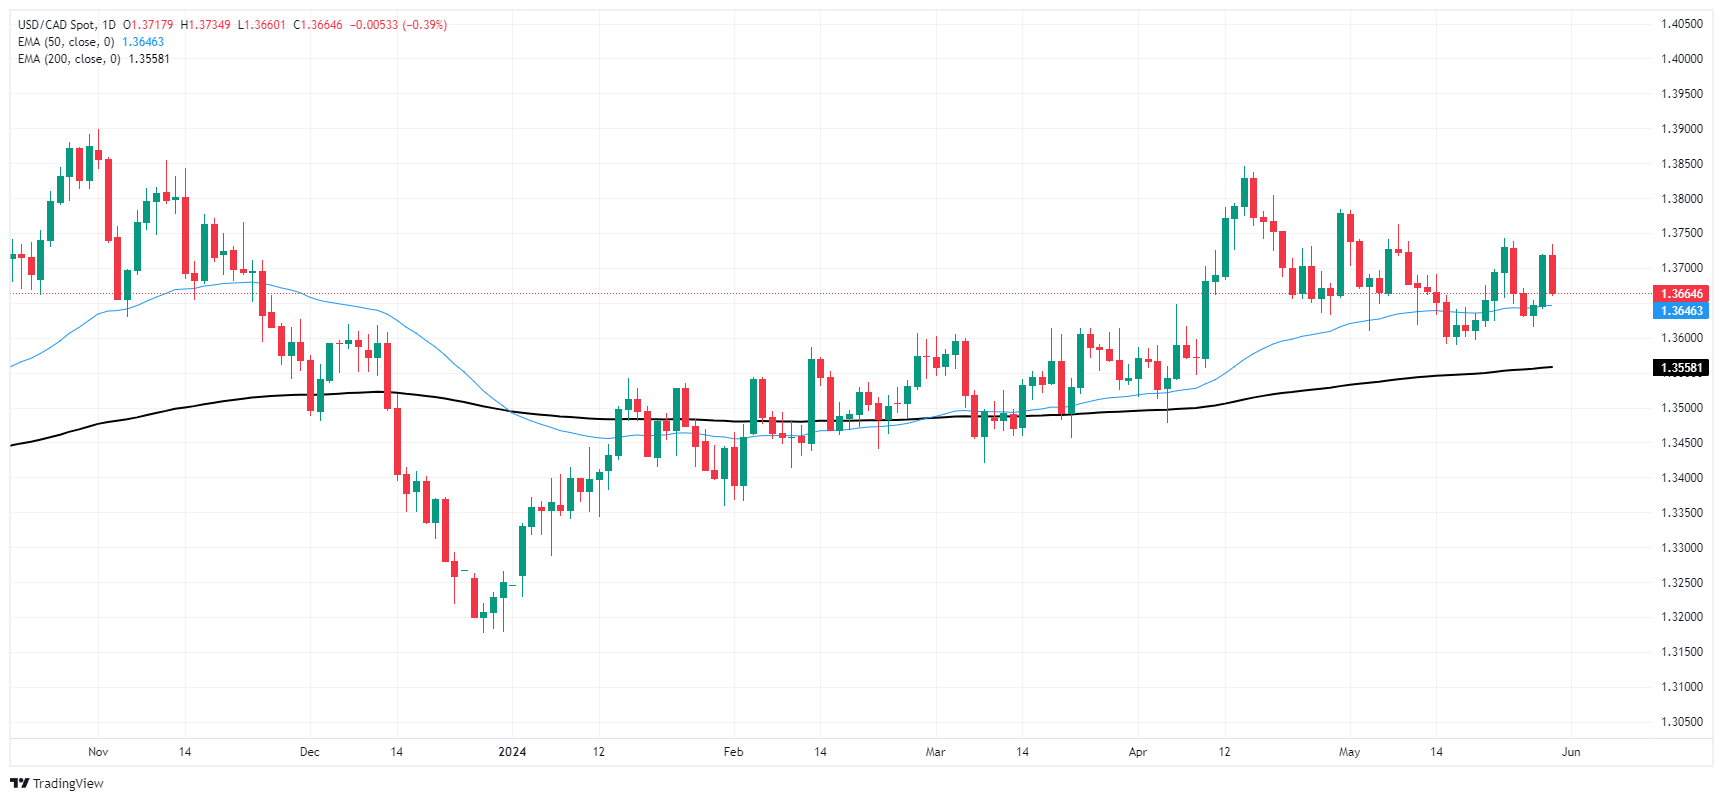
Canadian Dollar FAQs
The key factors driving the Canadian Dollar (CAD) are the level of interest rates set by the Bank of Canada (BoC), the price of Oil, Canada’s largest export, the health of its economy, inflation and the Trade Balance, which is the difference between the value of Canada’s exports versus its imports. Other factors include market sentiment – whether investors are taking on more risky assets (risk-on) or seeking safe-havens (risk-off) – with risk-on being CAD-positive. As its largest trading partner, the health of the US economy is also a key factor influencing the Canadian Dollar.
The Bank of Canada (BoC) has a significant influence on the Canadian Dollar by setting the level of interest rates that banks can lend to one another. This influences the level of interest rates for everyone. The main goal of the BoC is to maintain inflation at 1-3% by adjusting interest rates up or down. Relatively higher interest rates tend to be positive for the CAD. The Bank of Canada can also use quantitative easing and tightening to influence credit conditions, with the former CAD-negative and the latter CAD-positive.
The price of Oil is a key factor impacting the value of the Canadian Dollar. Petroleum is Canada’s biggest export, so Oil price tends to have an immediate impact on the CAD value. Generally, if Oil price rises CAD also goes up, as aggregate demand for the currency increases. The opposite is the case if the price of Oil falls. Higher Oil prices also tend to result in a greater likelihood of a positive Trade Balance, which is also supportive of the CAD.
While inflation had always traditionally been thought of as a negative factor for a currency since it lowers the value of money, the opposite has actually been the case in modern times with the relaxation of cross-border capital controls. Higher inflation tends to lead central banks to put up interest rates which attracts more capital inflows from global investors seeking a lucrative place to keep their money. This increases demand for the local currency, which in Canada’s case is the Canadian Dollar.
Macroeconomic data releases gauge the health of the economy and can have an impact on the Canadian Dollar. Indicators such as GDP, Manufacturing and Services PMIs, employment, and consumer sentiment surveys can all influence the direction of the CAD. A strong economy is good for the Canadian Dollar. Not only does it attract more foreign investment but it may encourage the Bank of Canada to put up interest rates, leading to a stronger currency. If economic data is weak, however, the CAD is likely to fall.
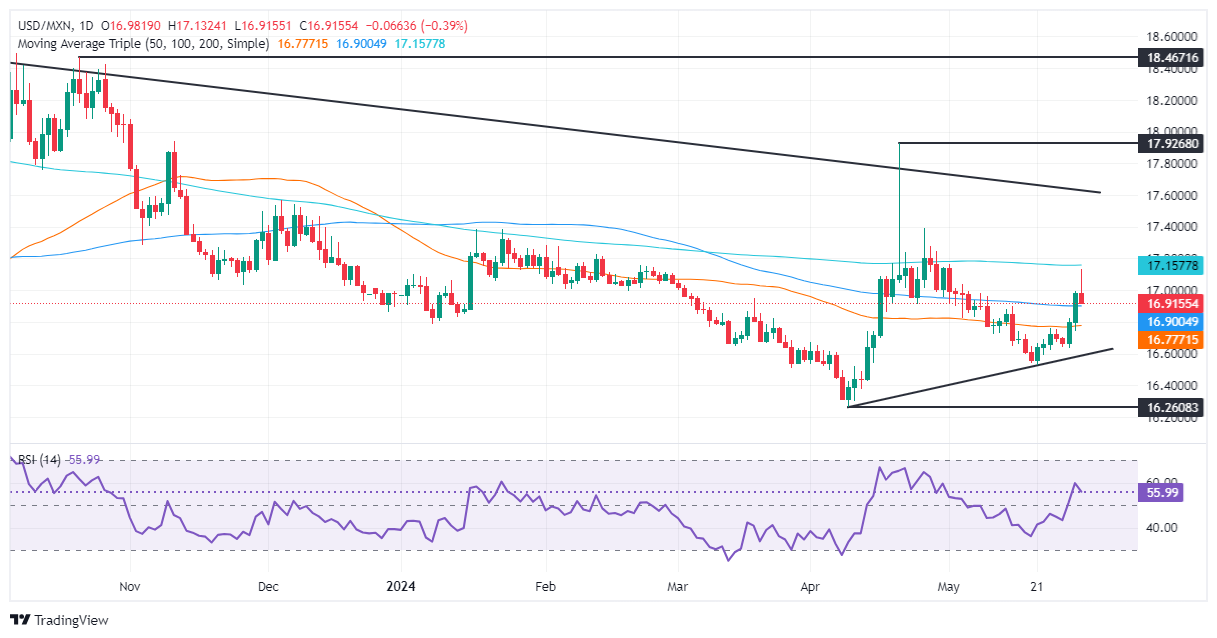
- Mexican Peso strengthens to 16.92 after hitting four-week low of 17.13.
- US GDP data unchanged; higher unemployment claims suggest economic slowdown, weakening the US Dollar.
- Banxico revises inflation forecasts upward, hinting at potential split decision on rate cuts in June.
The Mexican Peso (MXN) erased some of its earlier losses against the US Dollar (USD) and rose some 0.20% after GDP data from the United States (US) showed the economy is slowing. Mexico’s economic docket featured the release of jobs data, which came as expected, and an improvement in risk appetite and a softer Greenback are a tailwind for the Mexican currency. The USD/MXN trades at 16.92 after reaching a four-week high of 17.13.
The US Bureau of Economic Analysis (BEA) revealed the Gross Domestic Product (GDP) second estimate for the first quarters, which was unchanged, aligned with the preliminary reading. At the same time, the US Bureau of Labor Statistics (BLS) revealed that the number of Americans filing for unemployment increased compared to expectations, an indication of weakness.
Following the data, US Treasury yields edged lower, while the US Dollar Index (DXY), which tracks the buck’s value against a basket of six currencies, erased Wednesday’s gains, down 0.41% at 104.68. That boosted the Peso, as the emerging market currency retreated below 17.00, strengthening sharply.
Mexico’s National Statistics Agency (INEGI) revealed that the labor market continued to cool down, according to April’s jobs data.
On Wednesday, the Bank of Mexico (Banxico) revealed its quarterly report, in which it revised its inflation forecasts upward. Elevated and stubbornly high inflation has split Banxico’s Governing Council.
Banxico sees headline inflation at 4% toward the end of 2024, up from 3.5% in its previous report. Underlying prices are foreseen to rise from 3.5% to 3.8%.
Banxico Governor Victoria Rodriguez Ceja added that progress in bringing inflation down has been made, adding that it will "assess the inflation outlook as a whole and [...] discuss adjustments to the reference rate at our next meetings.”
Goldman Sachs analysts suggested that the June meeting would be lively. They added, "If a rate cut does materialize, it will likely emanate from a split decision."
Meanwhile, traders brace for the release of April’s Personal Consumption Expenditures Price Index (PCE), the Federal Reserve’s (Fed) preferred inflation gauge. That, along with Mexico’s general election on Sunday, could dictate the USD/MXN path toward the second half of the year as the Mexican currency remains one of the strongest against the US Dollar.
Daily digest market movers: Mexican Peso on the offensive after soft US GDP data
- Mexico’s Unemployment Rate in April came as expected at 2.6%, up from 2.3% in March.
- The latest economic data from Mexico paint a mixed economic outlook. Although the economy continued to grow, higher prices and a widening trade deficit could depreciate the Mexican Peso.
- That and speculation of another Banxico rate cut in June could pave the way for further upside in the USD/MXN.
- May’s Citibanamex poll showed that most economists estimate Banxico will cut rates on June 27 from 11% to 10.75%. The median expects headline inflation at 4.21% and core at 4.07% in 2024.
- US economic docket featured the second estimate of Gross Domestic Product (GDP) for Q1 2024, which dipped from 3.4% to 1.3% QoQ, as analysts expected.
- Initial Jobless Claims for the week ending May 25 rose by 219K, exceeding the consensus 218K and the previous 216K reading.
- Despite that, fed funds rate futures estimated 27 basis points of easing toward the end of the year.
Technical analysis: Mexican Peso appreciates as USD/MXN tumbles back below 17.00
The USD/MXN downtrend remains in play, although buyers gathered steam and pushed the exchange rate toward 17.13, shy of testing the 200-day Simple Moving Average (SMA) at 17.14. Momentum remains bullish, yet buyers are taking a breather after lifting prices close to 3% in three days, trumped by weak US data.
If buyers regain 17.00, that could pave the way to challenging the weekly high of 17.13. Once cleared, the 200-day SMA at 17.14 would be next, ahead of challenging the December 7 high of 17.56, followed by the psychological 18.00 figure.
On the other hand, a bearish continuation would happen if sellers kept the exchange rate below the 100-day SMA, which could pave the way for a dip to the 2023 low of 16.62, followed by the May 21 cycle low at 16.52 and the year-to-date low of 16.25.
Mexican Peso FAQs
The Mexican Peso (MXN) is the most traded currency among its Latin American peers. Its value is broadly determined by the performance of the Mexican economy, the country’s central bank’s policy, the amount of foreign investment in the country and even the levels of remittances sent by Mexicans who live abroad, particularly in the United States. Geopolitical trends can also move MXN: for example, the process of nearshoring – or the decision by some firms to relocate manufacturing capacity and supply chains closer to their home countries – is also seen as a catalyst for the Mexican currency as the country is considered a key manufacturing hub in the American continent. Another catalyst for MXN is Oil prices as Mexico is a key exporter of the commodity.
The main objective of Mexico’s central bank, also known as Banxico, is to maintain inflation at low and stable levels (at or close to its target of 3%, the midpoint in a tolerance band of between 2% and 4%). To this end, the bank sets an appropriate level of interest rates. When inflation is too high, Banxico will attempt to tame it by raising interest rates, making it more expensive for households and businesses to borrow money, thus cooling demand and the overall economy. Higher interest rates are generally positive for the Mexican Peso (MXN) as they lead to higher yields, making the country a more attractive place for investors. On the contrary, lower interest rates tend to weaken MXN.
Macroeconomic data releases are key to assess the state of the economy and can have an impact on the Mexican Peso (MXN) valuation. A strong Mexican economy, based on high economic growth, low unemployment and high confidence is good for MXN. Not only does it attract more foreign investment but it may encourage the Bank of Mexico (Banxico) to increase interest rates, particularly if this strength comes together with elevated inflation. However, if economic data is weak, MXN is likely to depreciate.
As an emerging-market currency, the Mexican Peso (MXN) tends to strive during risk-on periods, or when investors perceive that broader market risks are low and thus are eager to engage with investments that carry a higher risk. Conversely, MXN tends to weaken at times of market turbulence or economic uncertainty as investors tend to sell higher-risk assets and flee to the more-stable safe havens.
Federal Reserve (Fed) Bank of New York President John Williams noted on Thursday that, while inflation is still too high, he belives Fed policy is positioned to slowly get price growth back to the Fed's 2% annual target.
Key highlights
I expect unemployment at 4% by the end of the year.
I expect the US economy to grow 2%-2.5% in 2024.
Fed policy is well-positioned to get inflation back to the 2% target.
Inflation is still too high, but should moderate over the second half of 2024.
I expect inflation at 2.5% this year, closer to 2% next year.
Recently there's been a dearth of progress on lowering inflation.
The Fed will watch all of the data to make decisions on monetary policy.
Monetary policy remains restrictive on economy activity.
Risks to achieving the Fed mandates are moving into better balance.
Wage gains are still too high relative to the 2% inflation goal.
The economy is moving into better balance.
Inflation expectations data has been stable.
I feel god about where monetary policy is now.
Monetary policy is clearly working how the Fed wants it to work.
I don't feel urgency to act on monetary policy.
We don't need to be exactly at 2% to cut rates.
- US GDP Q1 revisions and increasing Jobless Claims affects USD negatively.
- Weekly Jobless Claims rose higher than expected.
- Markets look forward to PCE figures on Friday.
On Thursday, the US Dollar Index (DXY) experienced a retreat after a sharp recovery on Wednesday. The gains linked to the bond market surge on Wednesday are now being undone following the release of US Gross Domestic Product (GDP) revisions and soft Jobless Claims figures.
Despite some signs of a softening labor market, the likelihood of cuts in June and July remains low. However, there is heightened anticipation for the Personal Consumption Expenditure (PCE) figures due out on Friday, which have the potential to influence the next Federal Reserve (Fed) expectations.
Daily digest market movers: DXY retreats following disappointing data
- Investors are showing signs of nervousness with a disappointing GDP report due to signs of softening Consumer Spending. The headline GDP was revised to 1.3%.
- Markets eagerly anticipate PCE figures from April, which are due on Friday and could sway the Fed's decisions.
- Unemployment data revealed an increase in Initial Jobless Claims from last week's 216K to 219K.
- Despite the increased claims, odds of a cut for June and July remain low while standing around 50% for September.
DXY technical analysis: US Dollar struggles amid negative indicators
The DXY's gains from Wednesday have been mostly trimmed in light of the less-than-favorable data for the US economy. The Relative Strength Index (RSI) is below the 50-level, indicating increased selling pressure and a shift in momentum. The index lost the 20-day Simple Moving Average (SMA), and the Moving Average Convergence Divergence (MACD) is showing red bars, signifying that bearish sentiment has returned.
US Dollar FAQs
The US Dollar (USD) is the official currency of the United States of America, and the ‘de facto’ currency of a significant number of other countries where it is found in circulation alongside local notes. It is the most heavily traded currency in the world, accounting for over 88% of all global foreign exchange turnover, or an average of $6.6 trillion in transactions per day, according to data from 2022. Following the second world war, the USD took over from the British Pound as the world’s reserve currency. For most of its history, the US Dollar was backed by Gold, until the Bretton Woods Agreement in 1971 when the Gold Standard went away.
The most important single factor impacting on the value of the US Dollar is monetary policy, which is shaped by the Federal Reserve (Fed). The Fed has two mandates: to achieve price stability (control inflation) and foster full employment. Its primary tool to achieve these two goals is by adjusting interest rates. When prices are rising too quickly and inflation is above the Fed’s 2% target, the Fed will raise rates, which helps the USD value. When inflation falls below 2% or the Unemployment Rate is too high, the Fed may lower interest rates, which weighs on the Greenback.
In extreme situations, the Federal Reserve can also print more Dollars and enact quantitative easing (QE). QE is the process by which the Fed substantially increases the flow of credit in a stuck financial system. It is a non-standard policy measure used when credit has dried up because banks will not lend to each other (out of the fear of counterparty default). It is a last resort when simply lowering interest rates is unlikely to achieve the necessary result. It was the Fed’s weapon of choice to combat the credit crunch that occurred during the Great Financial Crisis in 2008. It involves the Fed printing more Dollars and using them to buy US government bonds predominantly from financial institutions. QE usually leads to a weaker US Dollar.
Quantitative tightening (QT) is the reverse process whereby the Federal Reserve stops buying bonds from financial institutions and does not reinvest the principal from the bonds it holds maturing in new purchases. It is usually positive for the US Dollar.
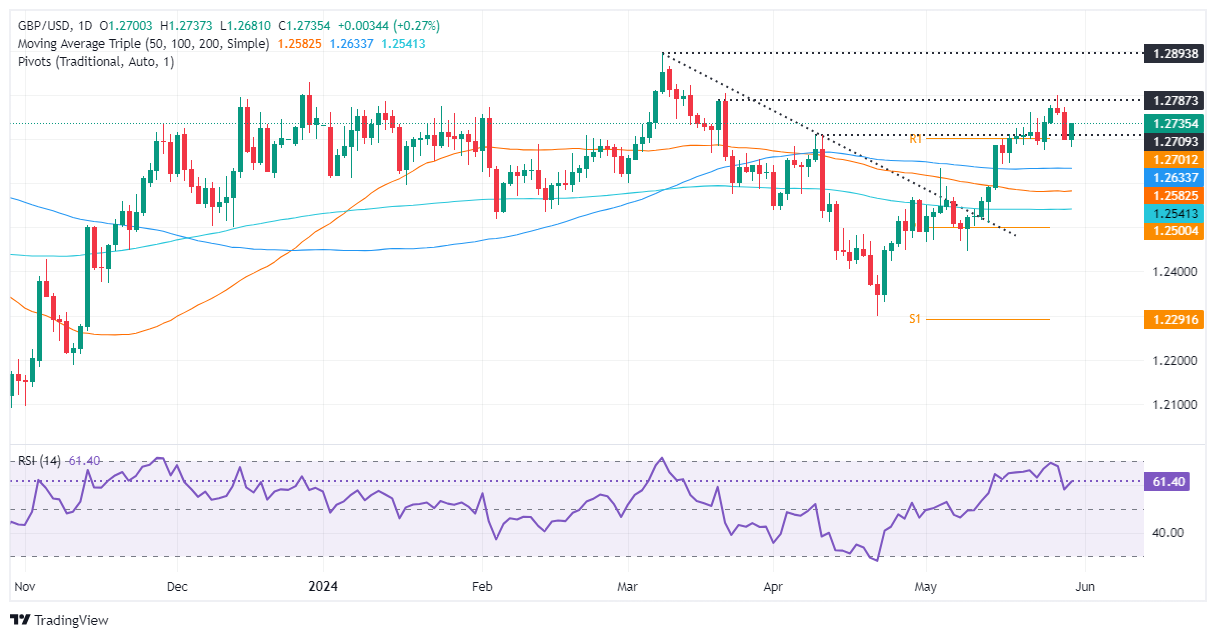
- GBP/USD bounces back off weekly lows around 1.2680.
- Technical outlook shows neutral to upward bias, with key resistance at 1.2803.
- Critical support levels include May 24 low at 1.2674 and the 50-DMA at 1.2581.
The Pound Sterling recovered some ground against the US Dollar on Thursday, as US Treasury yields are sliding, undermining the Greenback. Consequently, the GBP/USD bounced off weekly lows, reached 1.2680, and traded at 1.2728, gaining 0.20%.
GBP/USD Price Analysis: Technical outlook
The daily chart suggests the GBP/USD is neutral to upward bias, but the buyer's failure to crack the March 21 daily high at 1.2803 opened the door for a pullback. Although momentum remains bullish, as shown by the Relative Strength Index (RSI), buying pressure begins to fade after testing 1.2800.
For a bullish continuation, the GBP/USD needs to surpass 1.2803. That would sponsor a rally to the year-to-date (YTD) high of 1.2893, followed by 1.2900. Overhead resistance lies ahead, with 1.3000 seen as a crucial resistance.
Conversely, if sellers move in decisively and push the major below 1.2700, further losses lie ahead. Key support levels would be tested. Initially, the May 24 low of 1.2674, followed by the 1.2600 mark. Down below, the 50-day moving average (DMA) at 1.2581 awaits.
GBP/USD Price Action – Daily Chart
- USD/CHF plummets to near 0.9040 due to multiple headwinds.
- The US Dollar weakness due to soft US Q1 GDP (second estimates) reading.
- The Swiss economy expanded strongly by 0.5% in the first quarter of this year.
The USD/CHF pair has been hit hard and has plunged to near 0.9040 in Thursday’s American session. The reasoning behind steep fall in the Swiss Franc asset is sharp correction in the US Dollar and the outperformance of the Swiss economy in the first quarter of the year.
The US Dollar Index (DXY), which tracks the US Dollar’s value against six major currencies, corrects further to 104.70. A sharp sell-off in the US Dollar is driven by slower United States Q1 Gross Domestic Product (GDP) growth. The revised GDP estimates report has indicated that the economy expanded at a slower pace of 1.3% against 1.6% recorded from flash estimates.
The optimism over the US economic outlook that was built on expectations of 1.6% GDP growth has been impacted. However, the impact of the lower real GDP growth is expected to remain limited as it is a lagging indicator which exhibits the economy’s health.
Going forward, the US Dollar is expected to remain highly volatile ahead of US core Personal Consumption Expenditure Price Index (PCE) data for April, which will significantly influence speculation for Fed rate cuts in September. The underlying inflation data is scheduled to be published on Friday. Annual and monthly core PCE inflation readings are estimated to have grown steadily by 2.8% and 0.3% respectively. Steady inflation growth data would negatively impact market speculation for the Federal Reserve (Fed) to begin reducing interest rates from the September meeting.
Meanwhile, the Swiss Franc strengthened after the Q1 GDP report showed that the Swiss economy outperformed the consensus and the prior reading. The report showed that the economy expanded by 0.5% against the estimates and the former release of 0.3%. This has deepened upside risks to inflation, which could force the Swiss National Bank (SNB) to avoid subsequent rate-cut plans.
(This story was corrected on May 30 at 14:43 GMT to say that the Swiss economy expanded by 0.5% QoQ in Q1 2024 after 0.3% in the previous quarter. The original version said 1.5% actual versus 1.3% previous)
- AUD/USD is trading in a range and may have begun a sideways trend.
- It has bounced off the floor of a prospective range and is probably rising up to the ceiling.
- It would require a decisive breakout from the range to renew directionality.
AUD/USD trades about a third of a percent higher in the 0.6630s on Thursday after finding support and bouncing from the May 24 swing lows.
It is possible the pair has entered a sideways trend with a range high at the May 26 high of 0.6680 and a floor at 0.6591 (May 30 low).
AUD/USD 4-hour Chart
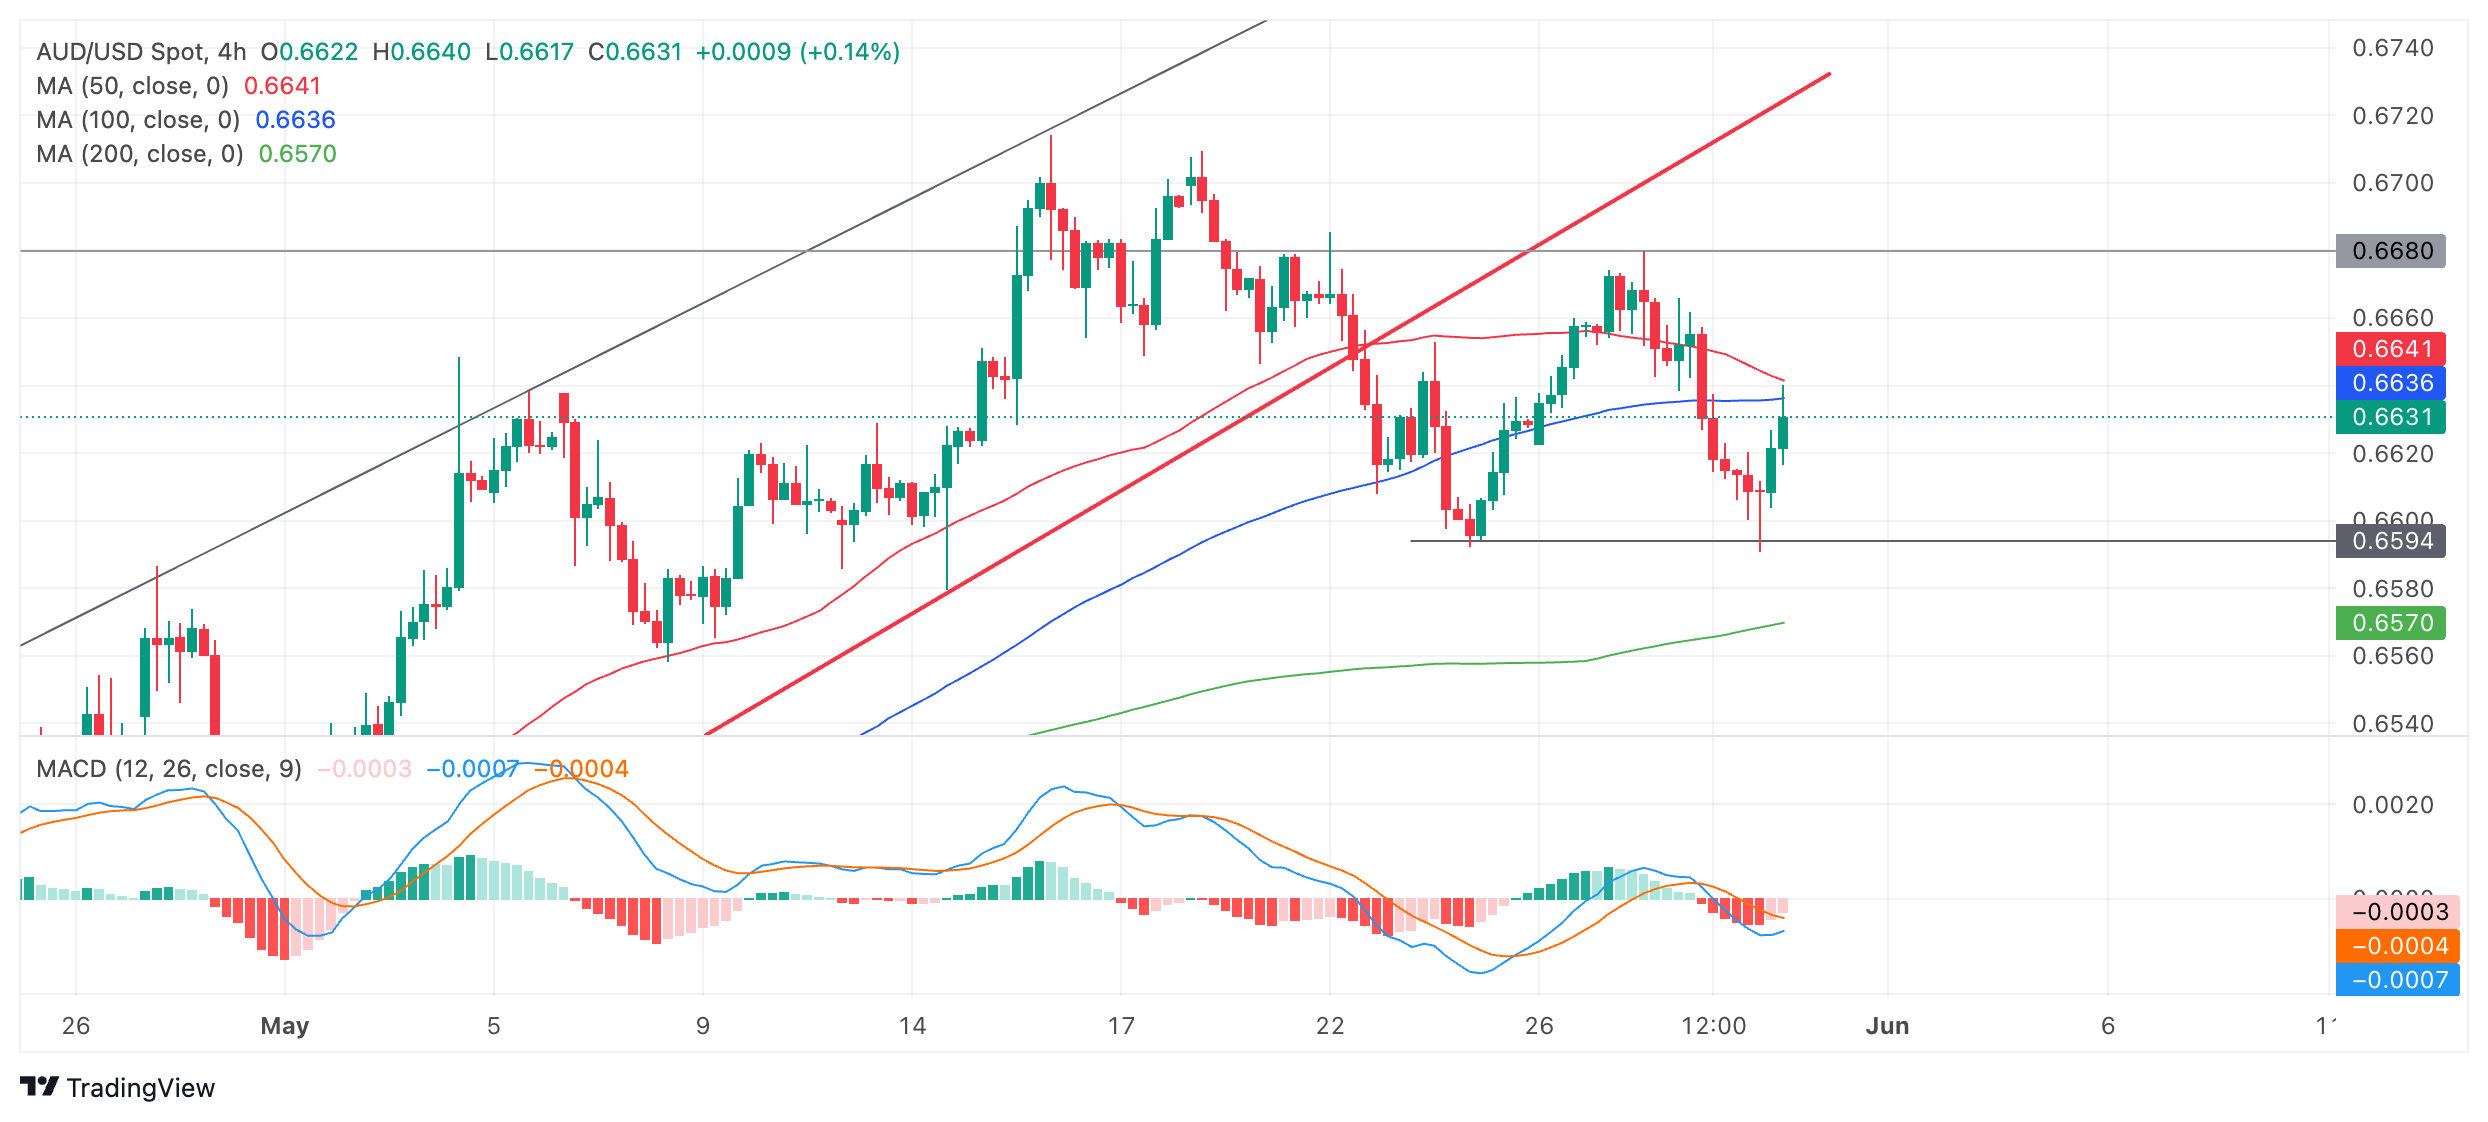
If AUD/USD is in a short-term sideways trend it will probably extend its range. The next move is likely to be a continuation of the rally from the range floor up to the range ceiling at 0.6680.
AUD/USD is currently facing resistance from the 100 and 50 Simple Moving Averages, however, which will probably impede progress higher. A break above the 50 SMA at 0.6641 would be necessary to reconfirm the bullish bias and indicate odds favor a move back up to the range highs.
AUD/USD broke down from its rising channel on May 22, bringing the established uptrend into doubt. Follow-through lower was weak and the pair recovered. There is no clear short-term directional trend suggesting the trend may actually be sideways.
It would require a decisive break below 0.6591 to confirm more downside, with the next target probably at 0.6560 where the 100 and 50-day SMAs are located (not shown).
Alternatively, a decisive break above the range ceiling would reassert the bullish bias and probably lead to 0.6714 (May 14 high).
Decisive breaks are accompanied by long candles that break through the level and close near their high or low or three consecutive candles that pierce the level in question and are all of the same color (red for a bearish decisive break and green if bullish).
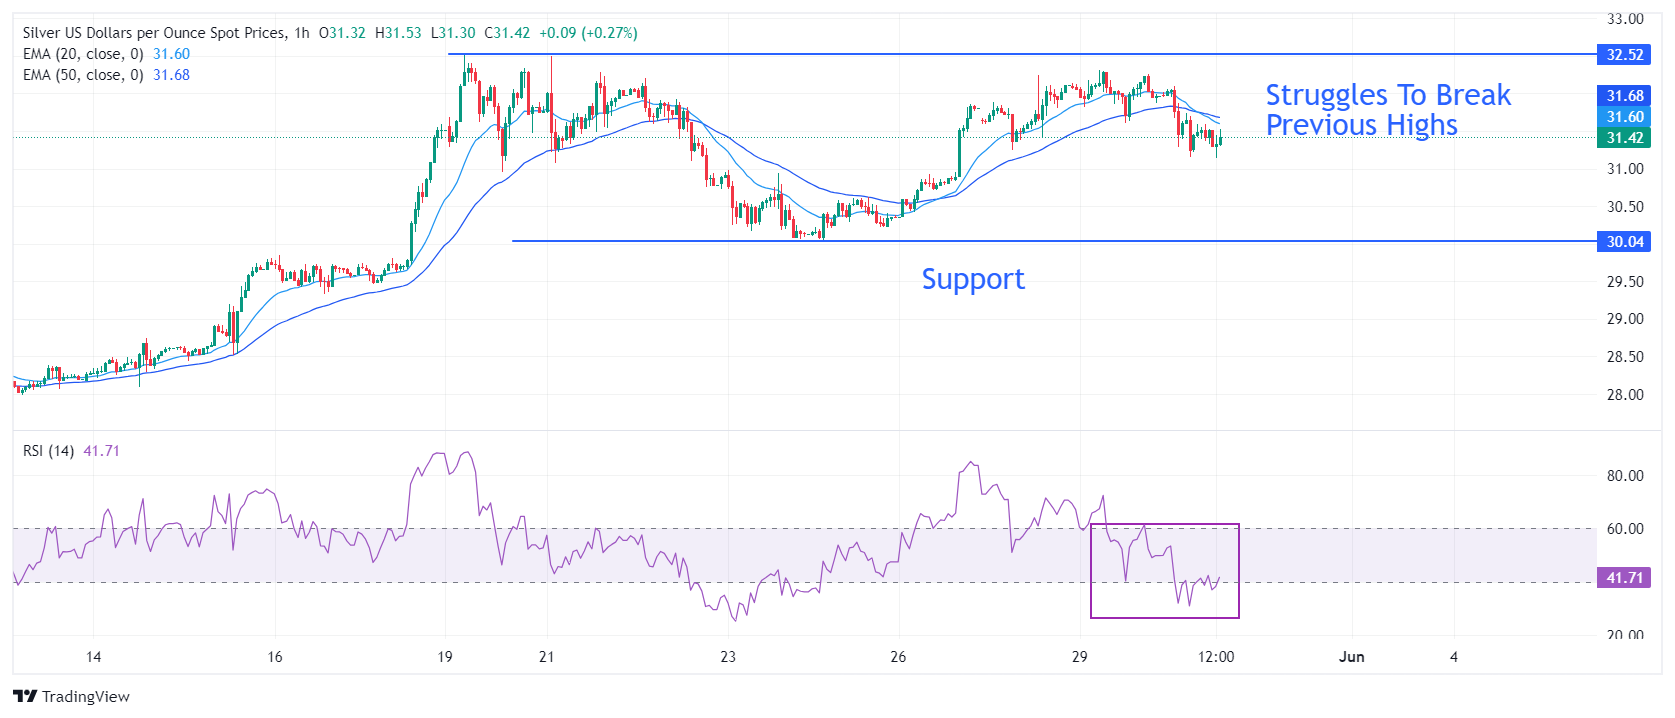
- Silver price finds interim support near $31.00 as US Dollar corrects further.
- The US Dollar comes under pressure after revised estimate for Q1 US GDP showed that the economy grew at a slower pace of 1.3%.
- Silver price could fall on backfoot if it breaks below the psychological support of $30.00.
Silver price (XAG/USD) finds a temporary support near $31.20 in Thursday’s American session after correcting from a weekly high of $32.30. The white metal discovers support after the US Dollar declines further after the United States (US) Department of Labor reported that individuals claiming jobless benefits for the first time for the week ending May 24 were higher at 219K from the estimates of 218K and the former reading of 216K.
Separately, the outcome of a slower US growth rate in the first quarter of the year in the second estimate against preliminary readings has also weighed on the US Dollar. The second estimate for the Q1 real GDP shows that the economy expanded at a slower pace of 1.3% from 1.6% growth recorded in advance estimates.
The US Dollar Index (DXY) has corrected further to 104.76. A downside move in the US Dollar is favorable for dollar-denominated assets such as Silver.
Meanwhile, the uncertainty over the near-term outlook of the Silver price remains intact ahead of the United States core Personal Consumption Expenditure Price Index (PCE) data for April, which will be published on Friday. Annual and monthly core PCE inflation readings are estimated to have grown steadily by 2.8% and 0.3% respectively.
The Federal Reserve’s (Fed) preferred inflation gauge will significantly influence speculation for Fed rate cuts in September. Currently, financial markets expect that the Fed will start reducing interest rates from the last quarter of the year.
Silver technical analysis
Silver price faces selling pressure while attempting to break previous highs of $32.50. The outlook of the white metal is uncertain as the 20- and 50-period Exponential Moving Averages (EMAs) have delivered a bearish crossover near $31.75.
The 14-period Relative Strength Index (RSI) has shifted into the 20.00-60.00 range from the bullish range of 40.00-80.00.
A breakdown below the horizontal support marked from May 23 low around $30.00 would result in a bearish reversal.
Silver hourly chart
- Initial Jobless Claims rose by 219K vs. the previous week.
- Continuing Jobless Claims rose by around 1.79M.
US citizens that applied for unemployment insurance benefits increased by 219K in the week ending May 25 according to the US Department of Labor (DoL) on Thursday. The prints came in just above initial estimates (218K) and above the previous weekly gain of 216K (revised from 215K).
Further details of the publication revealed that the advance seasonally adjusted insured unemployment rate was 1.2% and the 4-week moving average stood at 222.50, an increase of 2.5K from the previous week's revised average.
In addition, Continuing Claims increased by 4K to 1.791M in the week ended May 18.
Market reaction
The US Dollar Index (DXY) maintains its negative bias so far on Thursday, coming under pressure after hitting multi-day peaks near 105.20 barrier earlier in the session. The corrective decline in the Greenback also comes amidst a bearish performance of US yields across the curve.
- The BEA revised Q1 US GDP growth lower to 1.3%.
- US Dollar Index stays in negative territory below 105.00.
The US' real Gross Domestic Product expanded at an annual rate of 1.3% in the first quarter, the US Bureau of Economic Analysis' (BEA) second estimate on Thursday. This reading followed the 1.6% growth recorded in the first estimate and came in line with the market expectation.
"With the second estimate, downward revisions to consumer spending, private inventory investment, and federal government spending were partly offset by upward revisions to state and local government spending, nonresidential fixed investment, residential fixed investment, and exports," the BEA explained. "Imports were revised up."
Market reaction
The US Dollar (USD) came under bearish pressure with the immediate reaction. At the time of press, the USD Index was down 0.3% on the day at 104.80.
- Gold price falls as interest rates are expected to remain high, increasing the opportunity cost of holding Gold.
- Fed speakers continue calling for a delay in lowering interest rates, Eurozone inflation is probably rising.
- Gold breaks out of its Bear Flag pattern and starts declining towards its bearish targets.
Gold (XAU/USD) edges lower into the $2,330s on Thursday and finds support at the 50-day Simple Moving Average (SMA). Gold’s decline continues to be driven by higher global interest-rate expectations, which raise the opportunity cost of holding the non-yielding precious metal.
Gold pressured as interest rates to remain elevated
Gold has resumed its short-term bearish bias after a few days of backing and filling. The main drivers appear to be Federal Reserve (Fed) commentaries suggesting that US interest rates are set to remain high, and higher-than-expected inflation readings in Europe.
Minneapolis Fed President Neel Kashkari surprised markets on Tuesday when he said Fed officials had not disregarded hiking interest rates. He then added that if the Fed did cut borrowing costs, it would be twice toward the end of 2024.
Meanwhile, German and Spanish inflation data showed higher-than-expected readings in Europe, which reduces the probability that the European Central Bank (ECB) will follow their widely publicized June interest rate cut with a string of further cuts.
The preliminary Harmonized Index of Consumer Prices (HICP) in Germany rose by 2.8% year-over-year in May, beating economists’ expectations of 2.7% and the previous 2.4% reading, data from Eurostat showed on Wednesday.
According to data released on Thursday, the preliminary HICP in Spain rose by 3.8% in May, beating the 3.7% forecast and well above the 3.4% of the previous month.
The German and Spanish data suggest that Eurozone-wide HICP will also show an above-consensus reading when released on Friday. This could prompt the ECB to put the breaks on lowering interest rates in order to manage persistent inflationary pressures.
Technical Analysis: Gold breaks out of Bear Flag
Gold price has broken out of a rectangular formation (red-shaded area in the chart below), which is probably a Bear Flag continuation price pattern formed between May 24 and 27.
Bear Flags look like upside-down flags composed of a sharp decline – the flagpole – and the consolidation phase or flag square.
XAU/USD 4-hour Chart
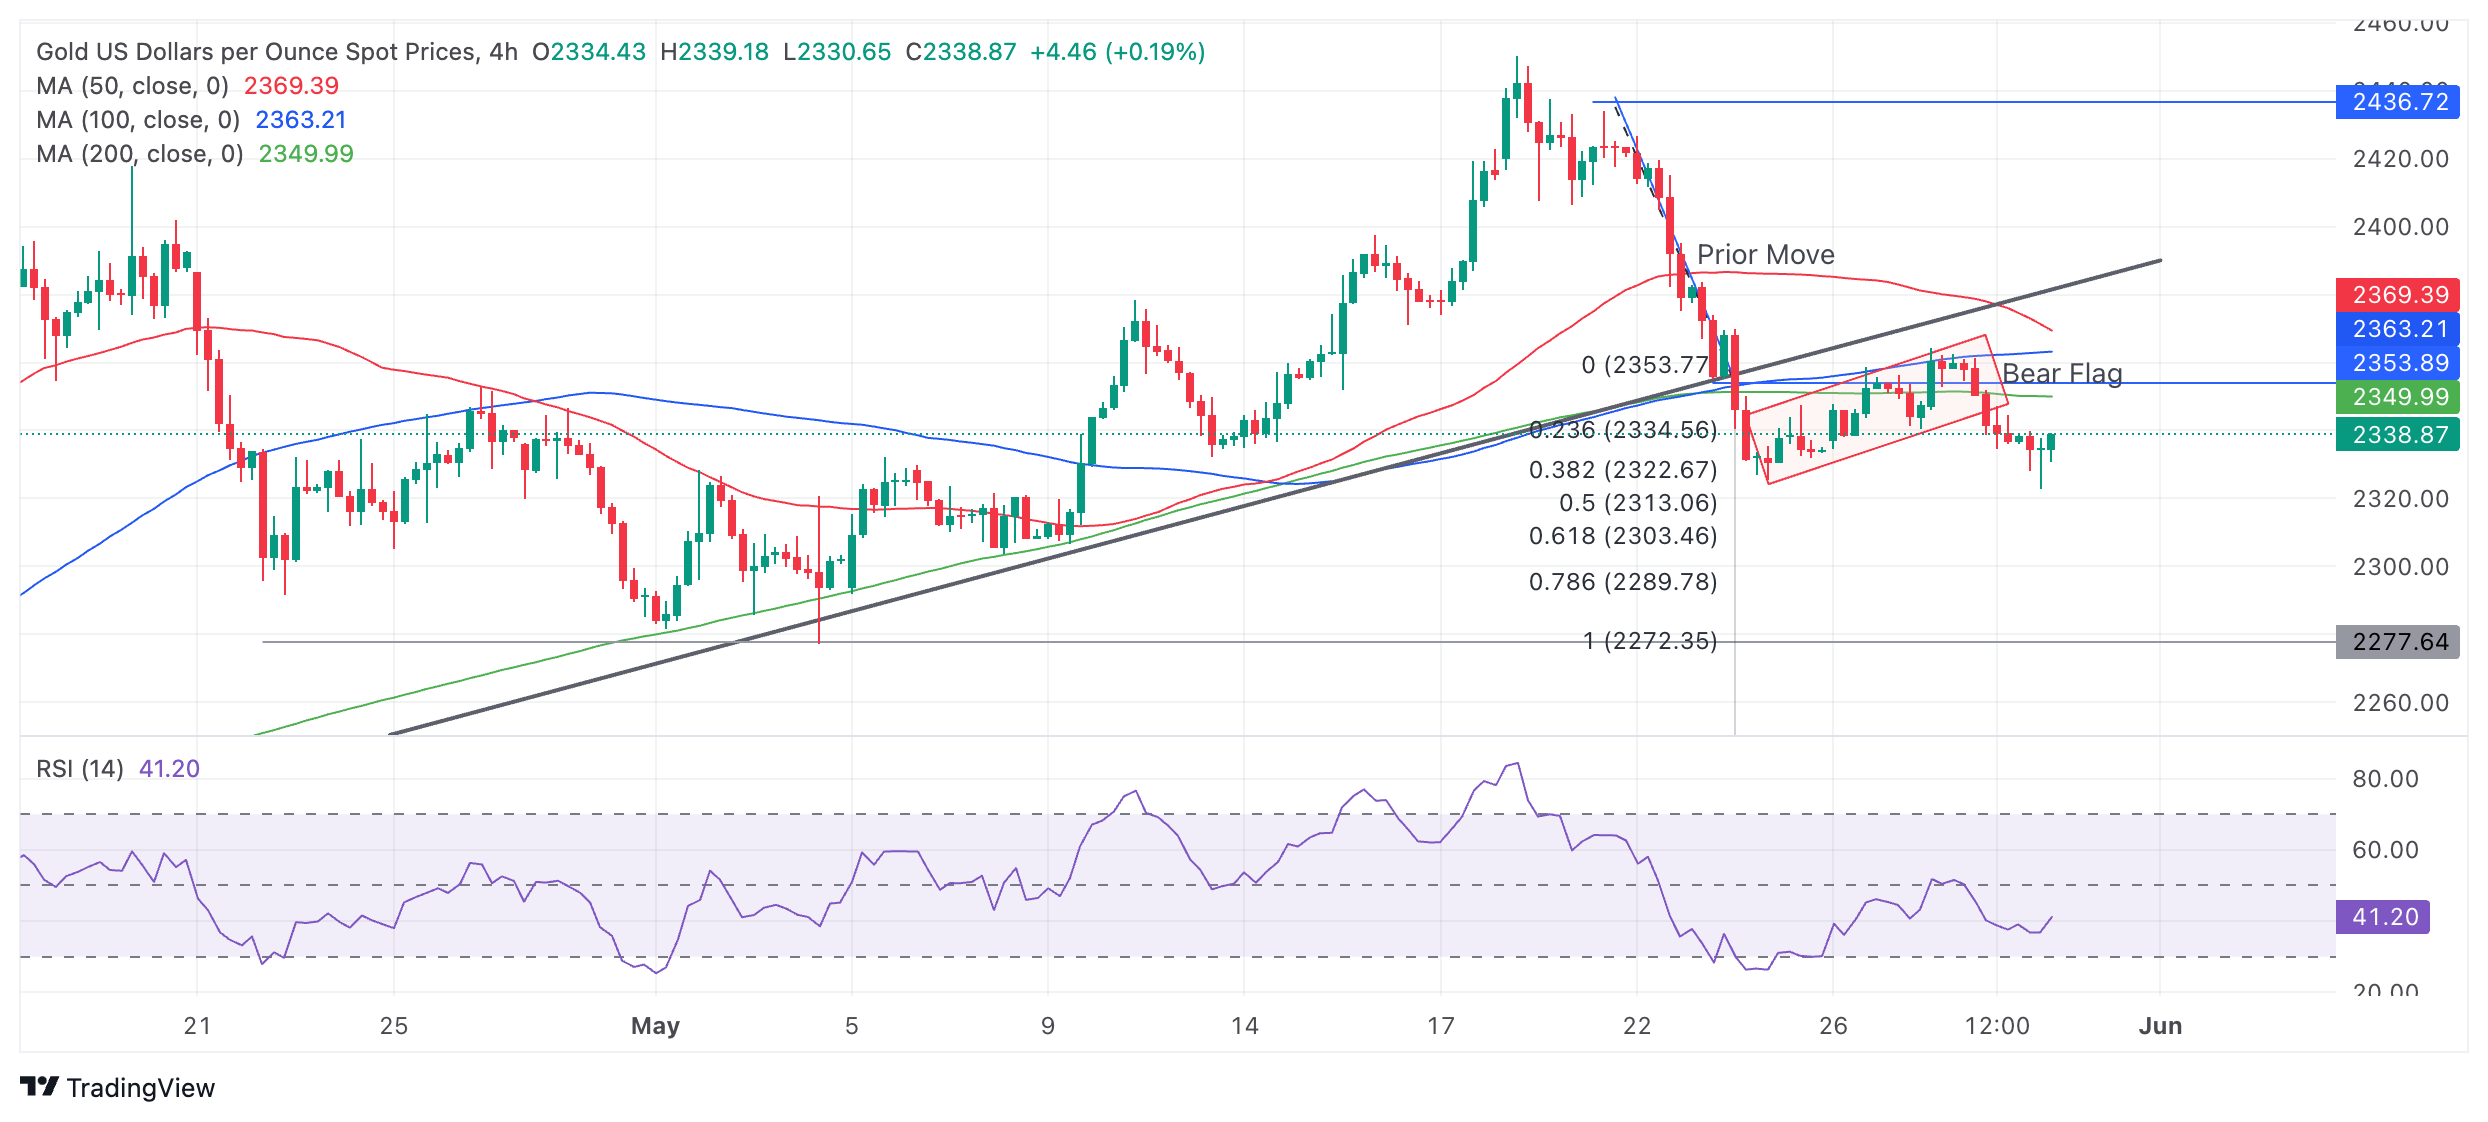
The breakout from the Bear Flag continuation pattern suggests a substantial downside to a target zone between $2,303 and $2,295. A break below Thursday’s $2,322 lows would provide bearish confirmation.
Last week’s decisive break below the major trend line provides the first target at $2,303 (the Fibonacci 0.618 extrapolation of the down move prior to the break). The second target is the 0.618 Fibonacci extension of the flagpole (move down between May 21 and 24).
A more bearish move could see Gold fall to $2,272 (the 100% extrapolation of the move prior to the trend-line break).
Gold's 4-hour chart, used to assess the short-term trend, exhibits a sequence of declining peaks and troughs. It is likely to be in a short-term downtrend now, favoring short positions over longs.
The precious metal’s medium and long-term trends are still bullish, however, suggesting the risk of a recovery remains high, yet price action is not supporting a resumption hypothesis at the moment.
A decisive break back above the trendline, now at around $2,385, would be required to provide evidence of a recovery and reversal of the short-term downtrend.
A decisive break would be one accompanied by a long green bullish candle or three green candles in a row.
Gold FAQs
Gold has played a key role in human’s history as it has been widely used as a store of value and medium of exchange. Currently, apart from its shine and usage for jewelry, the precious metal is widely seen as a safe-haven asset, meaning that it is considered a good investment during turbulent times. Gold is also widely seen as a hedge against inflation and against depreciating currencies as it doesn’t rely on any specific issuer or government.
Central banks are the biggest Gold holders. In their aim to support their currencies in turbulent times, central banks tend to diversify their reserves and buy Gold to improve the perceived strength of the economy and the currency. High Gold reserves can be a source of trust for a country’s solvency. Central banks added 1,136 tonnes of Gold worth around $70 billion to their reserves in 2022, according to data from the World Gold Council. This is the highest yearly purchase since records began. Central banks from emerging economies such as China, India and Turkey are quickly increasing their Gold reserves.
Gold has an inverse correlation with the US Dollar and US Treasuries, which are both major reserve and safe-haven assets. When the Dollar depreciates, Gold tends to rise, enabling investors and central banks to diversify their assets in turbulent times. Gold is also inversely correlated with risk assets. A rally in the stock market tends to weaken Gold price, while sell-offs in riskier markets tend to favor the precious metal.
The price can move due to a wide range of factors. Geopolitical instability or fears of a deep recession can quickly make Gold price escalate due to its safe-haven status. As a yield-less asset, Gold tends to rise with lower interest rates, while higher cost of money usually weighs down on the yellow metal. Still, most moves depend on how the US Dollar (USD) behaves as the asset is priced in dollars (XAU/USD). A strong Dollar tends to keep the price of Gold controlled, whereas a weaker Dollar is likely to push Gold prices up.
- USD/JPY falls as safe-haven demand preferences the Japanese Yen and the US Dollar bulls take a breather.
- BoJ official Adachi suggests higher interest rates could support the historically weak Yen.
- Investors still foresee the BoJ raising rates despite uneven inflation data.
USD/JPY slumps over half a percent to trade in the 156.70s on Thursday as the Japanese Yen gains on increased safe-haven demand amid a broad sell-off in risk assets whilst the US Dollar takes a breather from its rally on the previous day.
Rising Japanese Government Bond yields (JGB) also support the Yen, with the benchmark 10-year JGB yield at 1.05%. US 10-year yields meanwhile have fallen to 4.59% after making gains on Wednesday, due mainly to the lack of demand in recent Treasury auctions. Wednesday’s Fed Beige Book report supported a robust outlook for the US economy and higher-for-longer interest rates, helping to underpin the US Dollar.
Comments from Bank of Japan (BoJ) board member Seiji Adachi helped support the Yen on Wednesday, after he suggested raising interest rates to reduce imported inflation if JPY became overly weak. Adachi added the proviso, however, that excessive interest rate moves could also cause disruptions to household and corporate investment.
Traders have increased bets that the BoJ will raise interest rates despite Japan's Weighted Median Inflation Index, a significant gauge of the country’s trend inflation, increasing by 1.1% in April, representing a slowdown from the 1.3% increase recorded in March.
Japan’s Corporate Service Price Index (CSPI) posted a year-over-year reading of 2.8% in April, surpassing expectations of 2.3% and marking its fastest rate of increase since March 2015. Investors now turn their attention to Tokyo's inflation data out on Friday, which is seen as a key indicator of nationwide price trends.
Reuters reported that Minneapolis Fed President Neel Kashkari said Fed officials had not disregarded hiking interest rates. He then added that if the Fed did cut borrowing costs, it would be twice toward the end of 2024.
- Oil sinks back below $80, snapping technical support.
- Sluggish demand comes back into play as increasing bond yields risk Fed delaying the initial rate cut.
- The US Dollar Index edged up to 105.00 as the rate differential widens in favor of the Greenback.
Oil prices are retreating further on Thursday after bond traders on Wednesday took all asset classes for a rough ride. This week, the US bond market has seen quite a few big bond allocations, with bond traders starting to demand higher yields. This resurgence drove the rate differential wider between the US Dollar (USD) against other currencies and sent equities nosediving across the globe.
Meanwhile, the US Dollar Index (DXY) jumped higher on the back of this dynamic, which shows how correlated asset classes can be in specific scenarios. However, traders are on edge for some US data, namely the US Gross Domestic Product on Thursday and the Personal Consumption Expenditures (PCE) Price Index print on Friday. Both elements have the potential to be market-moving as volatility is picking up.
At the time of writing, Crude Oil (WTI) trades at $78.73 and Brent Crude at $83.03
Oil news and market movers: Aramco offers discounts
- Saudi Aramco might be set to reduce its official selling price by 40 cents per barrel for July sales to Asia, according to a Bloomberg survey.
- Bloomberg Intelligence Economist Ziad Daoud reports that more downside might be seen in Oil prices with US markets seeing ample supply while demand is weakening and war risks in both the Middle East and Ukraine are starting to fade.
- ConocoPhillips announced on Wednesday that it had agreed to buy Marathon Oil in a deal worth $22.5 billion, Reuters reports.
- Several traders and banks are reporting risk for more downturn should markets start to price out any rate cuts from the US Federal Reserve for 2024. A pickup in Oil demand is not foreseen until at least the first quarter of 2025, Reuters reports.
- The Energy Information Administration (EIA) will release its weekly Crude Stockpile Change numbers for this week on Thursday. The previous number was a build of 1.825 million barrels, and a drawdown of 1.9 million barrels is expected for this week.
Oil Technical Analysis: Recovery erased
Oil prices are sensitive, to say the least. The recent recovery was built on assumptions that interest rates are easing and that the Fed would cut at least once this year, achieving a soft landing for the US economy and holding up Oil demand.None of those assumptions look valid after the bond massacre on Wednesday, when bond traders said they had enough of all these US debt issuances and demanded more yield before buying. With doubts about an initial cut for 2024, markets are fearing that customers will not be able to consume and spend as much as they are doing now, which means that demand for Oil will decline. This leads to a lower repricing under these conditions.
First, the Simple Moving Averages (SMA) need to be regained under control. The 100-day SMA at $79.01 and the 200-day SMA at $79.57 are the first levels on the upside. Next, the 55-day Simple Moving Average (SMA) at $81.27 and the descending trendline at $81.75 are an area with a lot of resistance where any recovery rally could pause. Once broken through there, the road looks quite open to head to $87.12.
On the downside, the $76.00 marker is coming back into focus with the $75.27 level playing a crucial role if traders still want to have an option to head back to $80.00. Should that $75.27 pivotal level snap, expect to see a risk-full nosedive move that could sprint all the way down to $68, below $70.00.
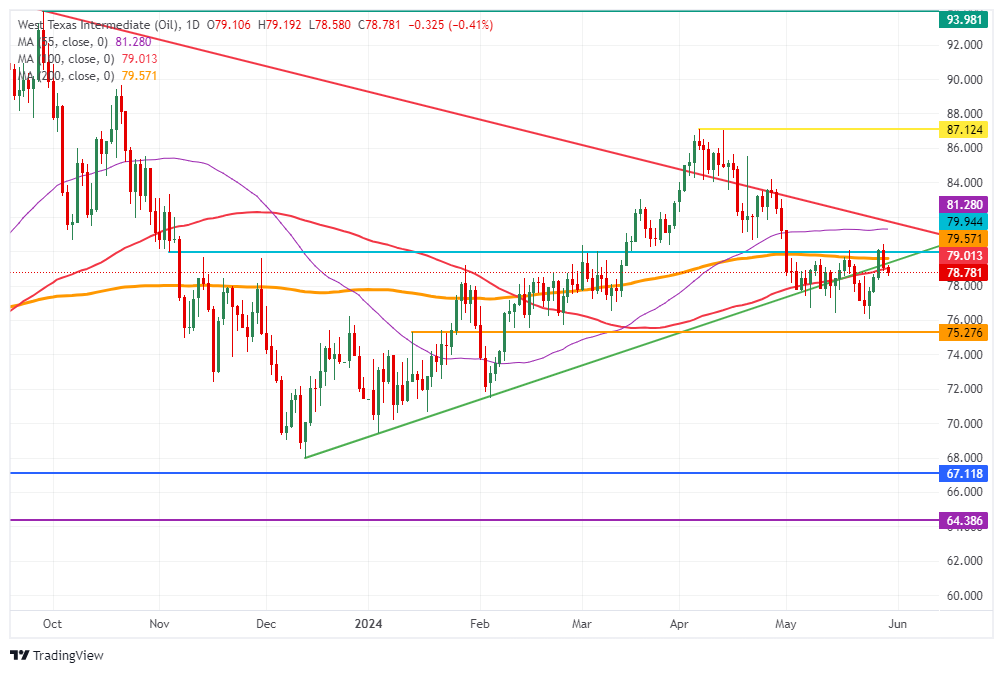
US WTI Crude Oil: Daily Chart
WTI Oil FAQs
WTI Oil is a type of Crude Oil sold on international markets. The WTI stands for West Texas Intermediate, one of three major types including Brent and Dubai Crude. WTI is also referred to as “light” and “sweet” because of its relatively low gravity and sulfur content respectively. It is considered a high quality Oil that is easily refined. It is sourced in the United States and distributed via the Cushing hub, which is considered “The Pipeline Crossroads of the World”. It is a benchmark for the Oil market and WTI price is frequently quoted in the media.
Like all assets, supply and demand are the key drivers of WTI Oil price. As such, global growth can be a driver of increased demand and vice versa for weak global growth. Political instability, wars, and sanctions can disrupt supply and impact prices. The decisions of OPEC, a group of major Oil-producing countries, is another key driver of price. The value of the US Dollar influences the price of WTI Crude Oil, since Oil is predominantly traded in US Dollars, thus a weaker US Dollar can make Oil more affordable and vice versa.
The weekly Oil inventory reports published by the American Petroleum Institute (API) and the Energy Information Agency (EIA) impact the price of WTI Oil. Changes in inventories reflect fluctuating supply and demand. If the data shows a drop in inventories it can indicate increased demand, pushing up Oil price. Higher inventories can reflect increased supply, pushing down prices. API’s report is published every Tuesday and EIA’s the day after. Their results are usually similar, falling within 1% of each other 75% of the time. The EIA data is considered more reliable, since it is a government agency.
OPEC (Organization of the Petroleum Exporting Countries) is a group of 13 Oil-producing nations who collectively decide production quotas for member countries at twice-yearly meetings. Their decisions often impact WTI Oil prices. When OPEC decides to lower quotas, it can tighten supply, pushing up Oil prices. When OPEC increases production, it has the opposite effect. OPEC+ refers to an expanded group that includes ten extra non-OPEC members, the most notable of which is Russia.
- USD/CAD rises to 1.3730 amid firm speculation that the BoC will start lowering interest rates from June.
- The US Dollar declines despite uncertainty ahead of the US core PCE Inflation data.
- USD/CAD holds the Descending Triangle breakout.
The USD/CAD pair extends its upside to 1.3730 in Thursday’s London session. The Loonie asset strengthens as investors expect that Bank of Canada (BoC) will start reducing interest rates from the June meeting. Sheer strength in the Loonie asset is driven by firm speculation of a prolonged policy divergence between the Federal Reserve (Fed) and the BoC.
The Loonie asset holds intraday gains even though the US Dollar slumps, suggesting that the Canadian Dollar is significantly weak. The US Dollar Index (DXY), which tracks the Greenback’s value against six major currencies, corrects to 105.00 after posting a fresh two-week high near 105.20.
The near-term outlook of the US Dollar is still upbeat amid uncertainty ahead of the United States core Personal Consumption Expenditure Price Index (PCE) data for April, which will significantly influence speculation for Fed rate cuts in September and is scheduled to be published on Friday. Annual and monthly core PCE inflation readings are estimated to have grown steadily by 2.8% and 0.3% respectively.
Currently, investors expect that the Fed will start reducing interest rates from the last quarter of the year.
USD/CAD strengthens after a breakout of the Descending Triangle chart formation on a daily timeframe. A breakout of the above-mentioned chart pattern results in heavy volume and wider ticks on the upside.
Upward-sloping 20-and 50-day Exponential Moving Average (EMA), which trade around 1.3675 and 1.3650, respectively, suggest that the near-term trend is bullish.
The 14-period Relative Strength Index (RSI) oscillates in the 40.00-60.00 range, indicating indecisiveness among market participants.
Fresh buying opportunity would emerge if the asset breaks above April 30 high at 1.3785. This would drive the asset towards April 17 high at 1.3838, followed by the round-level resistance of 1.3900.
In an alternate scenario, a breakdown below May 3 low around 1.3600 will expose the asset to the April 9 low around 1.3547 and the psychological support of 1.3500.
USD/CAD daily chart
- The US Dollar trades substantially stronger against most major G20 peers.
- Markets are stuck in a risk-off mood, with equities deep in red during the Asia-Pacific session.
- The US Dollar retreats slightly after rallying above 105.00.
The US Dollar (USD) eases slightly on Thursday after the strong rally seen on Wednesday, which led the DXY US Dollar Index to break above the 105.00 mark. The Greenback is strengthening as a well-known quote from Friends sitcom must come to mind to traders that are assessing the current market movements: “Well Judy you did it, she’s finally full!”. The bond markets are indeed full, full of US debt and investors gave signs to have had enough, sending yields higher in order to get all the debt allocated. The recent rise in Treasury yields is supporting the Greenback as the rate differential balance against other currencies widens.
On the economic data front, a busy economic calendar is ahead, with a pivotal data point to be released: the US Gross Domestic Product. Even though it is the second estimate for Q1, any significant revision from the preliminary reading could rattle markets. Add to that the weekly Jobless Claims numbers and a market moving Thursday looks to be in the making.
Daily digest market movers: Look at the PCE part in GDP
- 12:30 GMT is the time when most important data will be released:
- Weekly Jobless Claims:
- Initial Jobless Claims are expected to tick up to 218,000 from 215,000.
- Continuing Jobless Claims are seen rising to 1.800 million from 1.794 million.
- The second estimate of the US Gross Domestic Product numbers for the first quarter:
- The Price Index is expected to remain stable at 3.1%.
- Headline GDP is seen heading to 1.3% from the 1.6% expansion initially estimated.
- The headline Personal Consumption Expenditures (PCE) stood at 3.4% in the preliminary estimate, d.
- The core PCE is seen stable at 3.7%.
- The Goods Trade deficit for April is expected to narrow from $92.5 billion to $91.8 billion.
- Wholesale Inventories for April are expected to fall by a marginal 0.1%, less than the 0.4% decline seen in March.
- Weekly Jobless Claims:
- At 14:00 GMT, Pending Home Sales data is due to be released. Seeing the recent string of housing data, a negative print is expected. Pending home sales increased by 3.4% in March, but are expected to contract by 0.6% in April.
- Around 16:05 GMT, Federal Reserve Bank of New York President John Williams delivers keynote remarks at a lunch organized by the Economic Club of New York.
- Near 18:30 GMT comments are expected from Federal Reserve Bank of Dallas President Lorie Logan, who delivers a speech at an event organized by The Borderplex Alliance.
- Asian equities are yet again on the back foot, with the Japanese Nikkei and the Chinese Hang Seng Index both down over 1%. European equities are flirting with a turnaround and are flat to mildly in the green. US indices futures are down near 0.50%.
- According to the CME Fedwatch Tool, Fed Fund futures pricing data suggests a 52.5% chance for keeping rates unchanged in September, against 42.1% chance for a 25 basis points (bps) rate cut and a 4.9% chance for an even 50 bps rate cut. A marginal 0.6% price in an interest rate hike.
- The benchmark 10-year US Treasury Note trades around 4.59%, the highest level this week.
US Dollar Index Technical Analysis: It’s the bond market, stupid!
The US Dollar Index (DXY) has strengthened in the past few hours ever since markets saw yields soaring higher. This, in its turn, asked for a repricing of the Greenback in its stance against other currencies when looking at the rate differential. While US yields were sprinting higher, widening the gap with other countries, the US Dollar outperformed against other currencies.
On the upside, the DXY index reclaimed the key levels: the 55-day Simple Moving Average (SMA), currently at 104.96, and the 105.00 big round level. It will be important to see if these levels hold support should the US data weaken. Once that is proven, look for 105.52 and 105.88 on the upside.
On the downside, the 200-day SMA at 104.43 and the 100-day SMA around 104.37 are the last line of defence. Once that level snaps, an air pocket is placed between 104.30 and 103.00. Should the US Dollar decline persist, the low of March at 102.35 and the low from December at 100.62 are levels to consider.
US Dollar FAQs
The US Dollar (USD) is the official currency of the United States of America, and the ‘de facto’ currency of a significant number of other countries where it is found in circulation alongside local notes. It is the most heavily traded currency in the world, accounting for over 88% of all global foreign exchange turnover, or an average of $6.6 trillion in transactions per day, according to data from 2022. Following the second world war, the USD took over from the British Pound as the world’s reserve currency. For most of its history, the US Dollar was backed by Gold, until the Bretton Woods Agreement in 1971 when the Gold Standard went away.
The most important single factor impacting on the value of the US Dollar is monetary policy, which is shaped by the Federal Reserve (Fed). The Fed has two mandates: to achieve price stability (control inflation) and foster full employment. Its primary tool to achieve these two goals is by adjusting interest rates. When prices are rising too quickly and inflation is above the Fed’s 2% target, the Fed will raise rates, which helps the USD value. When inflation falls below 2% or the Unemployment Rate is too high, the Fed may lower interest rates, which weighs on the Greenback.
In extreme situations, the Federal Reserve can also print more Dollars and enact quantitative easing (QE). QE is the process by which the Fed substantially increases the flow of credit in a stuck financial system. It is a non-standard policy measure used when credit has dried up because banks will not lend to each other (out of the fear of counterparty default). It is a last resort when simply lowering interest rates is unlikely to achieve the necessary result. It was the Fed’s weapon of choice to combat the credit crunch that occurred during the Great Financial Crisis in 2008. It involves the Fed printing more Dollars and using them to buy US government bonds predominantly from financial institutions. QE usually leads to a weaker US Dollar.
Quantitative tightening (QT) is the reverse process whereby the Federal Reserve stops buying bonds from financial institutions and does not reinvest the principal from the bonds it holds maturing in new purchases. It is usually positive for the US Dollar.
- The Mexican Peso is at risk of reversing its long-term uptrend.
- Several analysts say MXN has peaked and is on the way down.
- Negative fundamentals include the Mexican and US presidential elections and a narrowing MXN-supportive interest-rate differential.
The Mexican Peso (MXN) backs off a cliff on Thursday, trading down over half a percent in its key pairs, as investors unwind their long bets due to multiple risk factors on the horizon.
The Mexican presidential elections on Sunday, the US presidential elections in November, and a growing shift in US interest-rate expectations are all weighing on the Peso, which is vulnerable to reversing its long-term uptrend, according to analysts.
USD/MXN is exchanging hands at 17.06 at the time of writing, EUR/MXN is trading at 18.46 and GBP/MXN at 21.69.
Mexican Peso subject to a growing number of risk factors
The Mexican Peso trades lower this week as investors close their long bets ahead of potentially market-moving events bleeping on the radar in the near and medium-term.
The Mexican presidential election on Sunday is likely to result in the election of Claudia Shienbaum of the Morena party, who leads by 20% in the polls. She’ll take over from her predecessor Andres Manuel Lopez Obrador (AMLO), also of Morena.
Shienbaum is likely to continue the generous social-welfare programme that made AMLO popular and has pledged to increase the minimum wage by circa 11%. This is likely to boost consumer spending, a key driver of growth in recent quarters, but could make it difficult for the Bank of Mexico (Banxico) to bring down inflation, says Kimberley Sperrfechter, Emerging Markets Economist at Capital Economics.
“A victory for Claudia Sheinbaum in Mexico’s election on Sunday is likely to see a continuation of Amlo’s generous social policies – which will also make Banxico’s fight against inflation harder,” says Sperrfechter.
Threat of being trumped
A clear and present danger for the Mexican Peso is the possibility of Donald Trump’s reelection in November. The US and Mexican trade agreement (USMCA) is up for review in 2026, and there is a risk Trump, if re-elected, might reintroduce tariffs on Mexican goods. Such a move would also hamper Mexico’s near-shoring prospects.
For this reason, Sperrfechter thinks that the Peso’s “period of outperformance has largely run its course” and expects the currency to substantially weaken to $19-$20 during the next president’s tenure.
Mexican Peso’s interest-rate advantage gap to close – Rabobank
The Mexican Peso’s long-term uptrend has been supported by the high interest rates (11.0%) in Mexico, which in turn attract foreign investor inflows.
Banxico lowered interest rates by 0.25% in March and is expected to cut them again in June, however, according to analysts at Rabobank, closing the interest-rate differential with counterparts.
“We maintain the view that we are at the peak of MXN strength and will see a move back above 16.8 in the coming months as the rate differential converges,” Rabobank said in a note on May 28.
The Mexican Peso could experience weakness against the US Dollar (USD) in particular as interest-rate expectations in the US undergo ossification. Whilst at the beginning of 2024 the Federal Reserve (Fed) was confident it would be able to cut interest rates three times in 2024, with the first rate cut potentially coming in June, these expectations have been radically delayed because of stubbornly high inflation.
On Tuesday, Minneapolis Fed President Neel Kashkari surprised markets when he said Fed officials hadn’t disregarded even hiking interest rates, while adding that if they did cut borrowing costs, it would be twice toward the end of 2024.
USD traders are now keenly awaiting the US Personal Consumption Expenditures (PCE) data for April, set to be released on Friday, for the latest snapshot of US inflation. If it comes out higher-than-expected, it could further weaken the Peso against the US Dollar.
In Mexico, meanwhile, Thursday sees the release of the unemployment data which is forecast to show a rise in the Unemployment Rate to 2.6% in April from 2.3% previously.
Technical Analysis: USD/MXN short-term uptrend extends
USD/MXN – or the number of Pesos that can be bought with one US Dollar – surges above the psychological 17.00 level, reinforcing the short-term bullish uptrend and favoring long positions over shorts.
USD/MXN 4-hour Chart
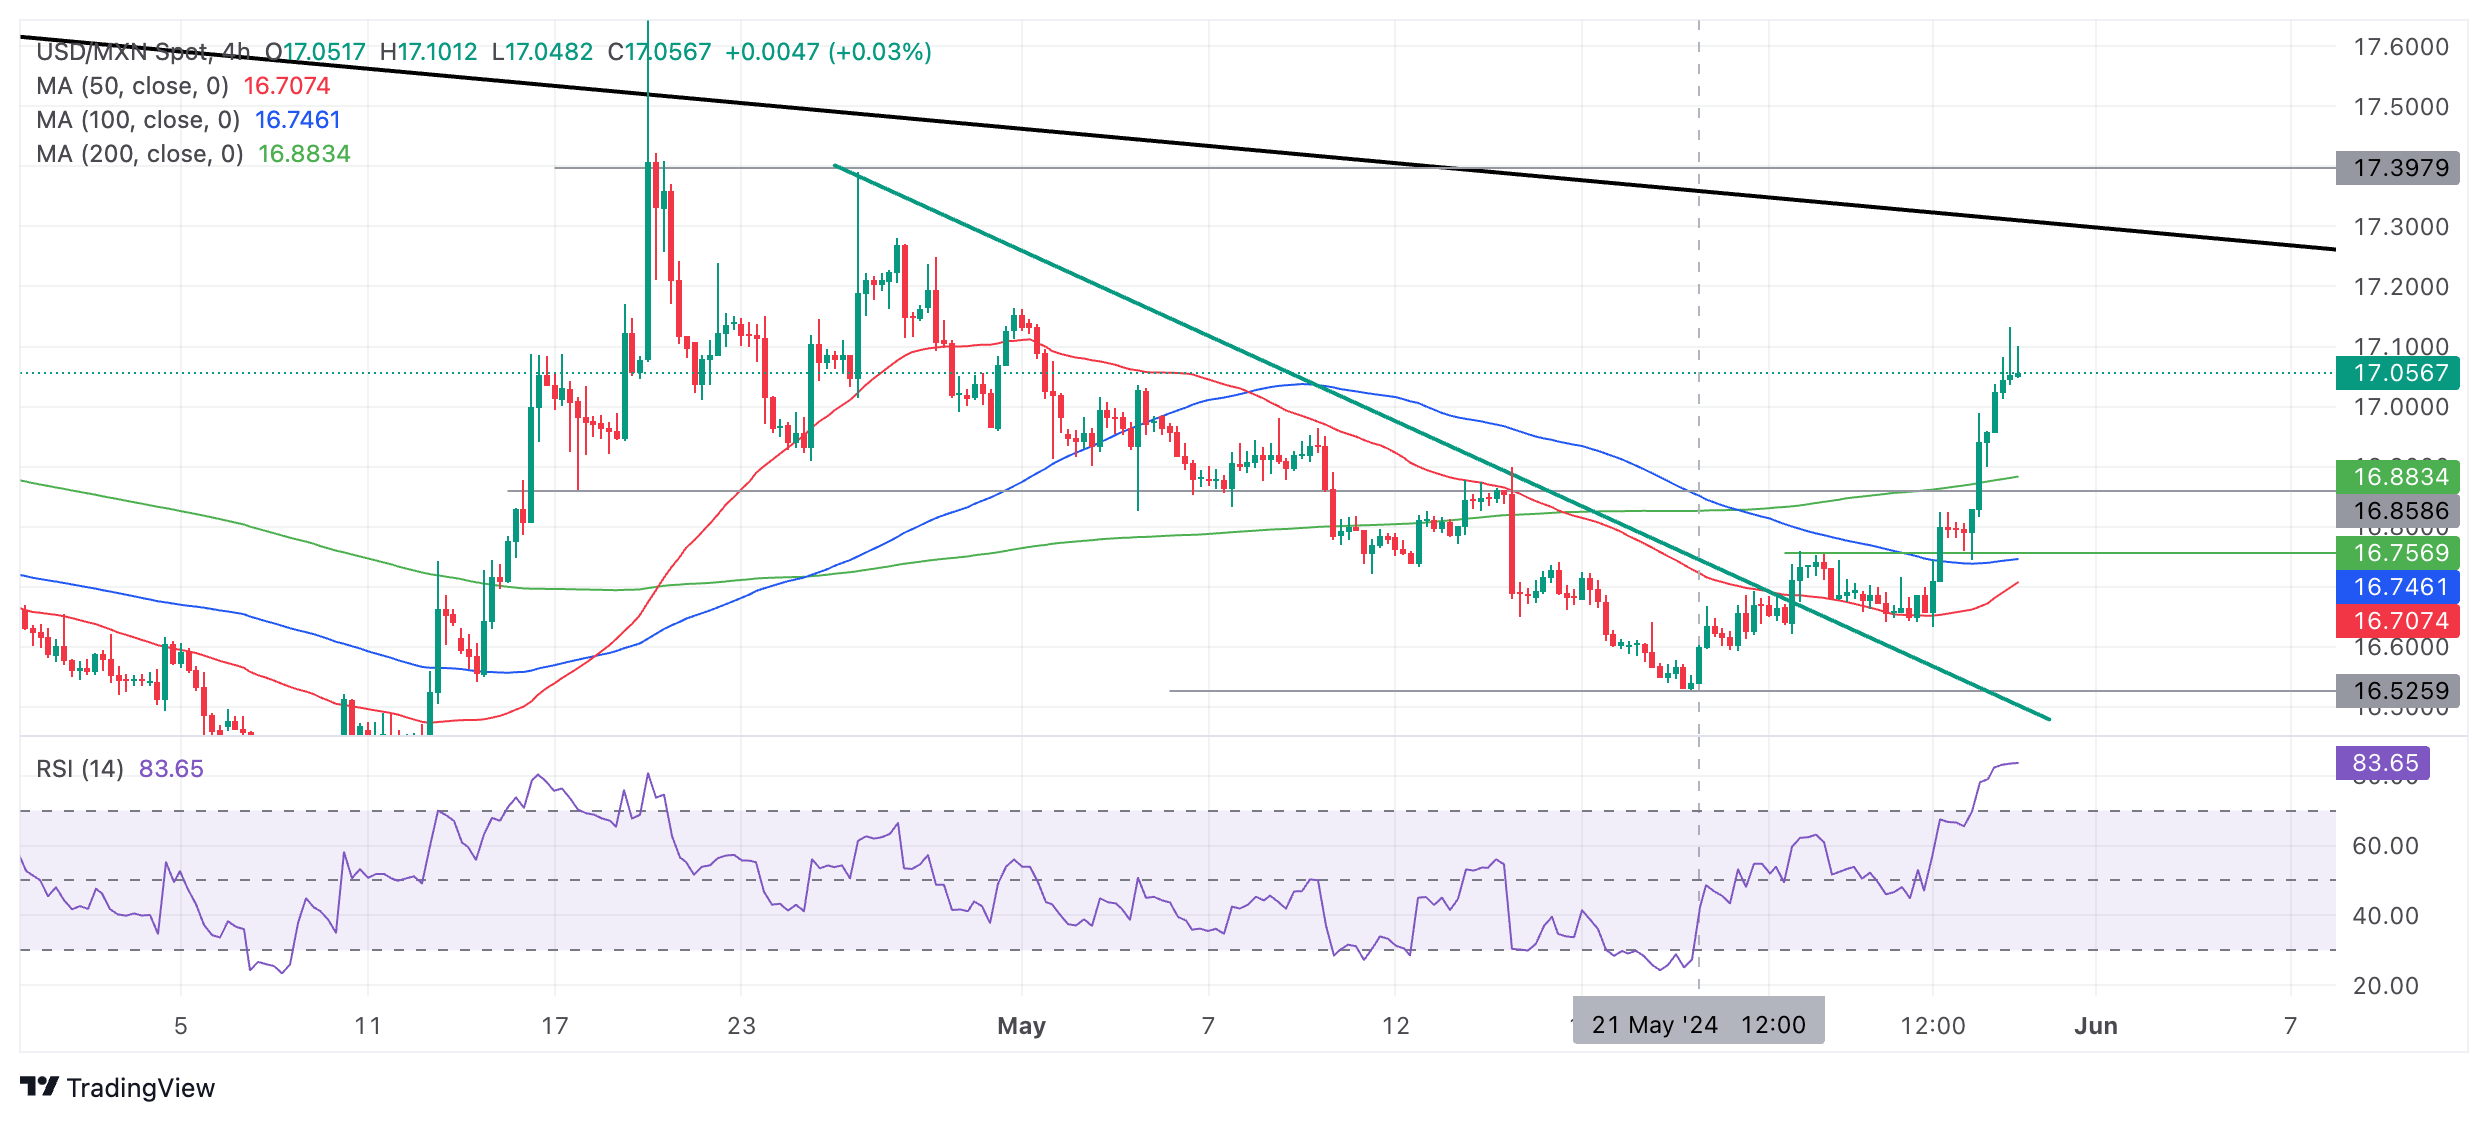
USD/MXN has surpassed the bullish target at 16.85 (previous range lows) and now sets its sights on the major trendline (black) at circa 17.25. A break above the 17.13 day’s highs would probably confirm an extension north towards the target.
The Relative Strength Index (RSI) momentum indicator has entered the overbought zone, suggesting a risk of a pullback. When RSI enters overbought conditions, it is a signal to long-holders not to add to their positions. If RSI exists overbought and falls below 70 again on a closing basis, it will be a signal to close longs and open shorts as a deeper correction is probably unfolding.
The medium and long-term trends remain bearish, maintaining a risk that the pair could capitulate and continue lower. However, a decisive break above the major trendline would solidify the bullish case and indicate a reversal of the medium-term trend to an uptrend.
A decisive break would be one accompanied by a long green bar that closed near its high or three consecutive green bars in a row.
Economic Indicator
Jobless Rate
The Jobless Rate released by INEGI is the number of unemployed workers compared to all the active workers in the economy. If the number rises, it indicates a lack of expansion within the Mexican labor market and thus a weakening in the economy. Normally, a decrease in the figure is seen as positive (or bullish) for the Mexican Peso, while an increase is seen as negative (or bearish).
Read more.Next release: Thu May 30, 2024 12:00
Frequency: Monthly
Consensus: 2.6%
Previous: 2.3%
Source: National Institute of Statistics and Geography of Mexico
- EUR/GBP stays sideways near 0.8500 as investors await the Eurozone Inflation data.
- The Eurozone inflation data will influence the ECB’s rate-cut path beyond June.
- Exit polls for UK elections suggest that the Labour Party will come into power.
The EUR/GBP pair trades inside Wednesday’s trading range in Thursday’s session, reflecting indecisiveness among market participants ahead of the release of the preliminary Eurozone inflation data for May, which will be published on Friday.
Investors remain certain about the European Central Bank (ECB) to begin reducing interest rates from the June meeting. Therefore, financial markets are discussing about how fast and far the ECB will cut interest rates beyond June. Majority of ECB policymakers have advocated for a gradual rate-cut approach to limit risks of inflation revamping again.
For fresh guidance on the interest rate outlook, investors await the Eurozone inflation data. Economists expect that annual Harmonized Index of Consumer Prices (HICP) rose at a stronger pace of 2.5% from the prior reading of 2.4%. The annual core HICP is estimated to have accelerated to 2.8% from 2.7% in April.
Hotter-than-expected inflation data would weaken speculation for the ECB deploying an aggressive policy easing approach. While soft numbers would prompt expectations that the ECB will announce subsequent rate cuts.
This week, investors have shifted focus to the United Kingdom (UK) election campaigns due to the absence of top-tier economic data. Exit polls show that the Labour Party will come in power after almost 15 years. The Pound Sterling could remain slightly volatile due to market expectations for elections but its impact on the monetary policy is expected to light.
The outlook of UK economy will change drastically if the Labour Party comes into power but their fiscal plans are expected to remain conservative to avoid any upside risk to price pressures.
- AUD/JPY could test the key level of 104.00, followed by the upper boundary of the ascending triangle.
- The momentum indicator 14-day RSI suggests the confirmation of the bullish bias for the pair.
- The immediate support appears around the 14-day EMA at 103.63 and the lower threshold of the ascending triangle.
AUD/JPY extends its losses to near 103.80 during European trading hours on Thursday. However, the analysis of the daily chart indicates a bullish bias for the AUD/JPY pair, as it remains within an ascending triangle. Furthermore, the momentum indicator 14-day Relative Strength Index (RSI) is above the 50 level, suggesting confirmation of the bullish outlook.
The AUD/JPY cross could test the immediate resistance at the psychological level of 104.00, followed by the upper boundary of the ascending triangle around 104.80. A breakthrough above this level could reinforce the bullish sentiment, potentially pushing the cross past the psychological level of 105.00, aligning with the highest level of 105.04, which has not been seen since April 2013.
On the downside, the 14-day Exponential Moving Average (EMA) at 103.62 serves as immediate support for the AUD/JPY cross, followed by the lower threshold of the ascending triangle around the key level of 103.50.
A break below the latter could lead the AUD/JPY cross to navigate the region around the psychological level of 100.00 and the throwback support at 99.93. Further decline could exert downward pressure on the cross, potentially driving it toward April's low of 97.78.
AUD/JPY: Daily Chart
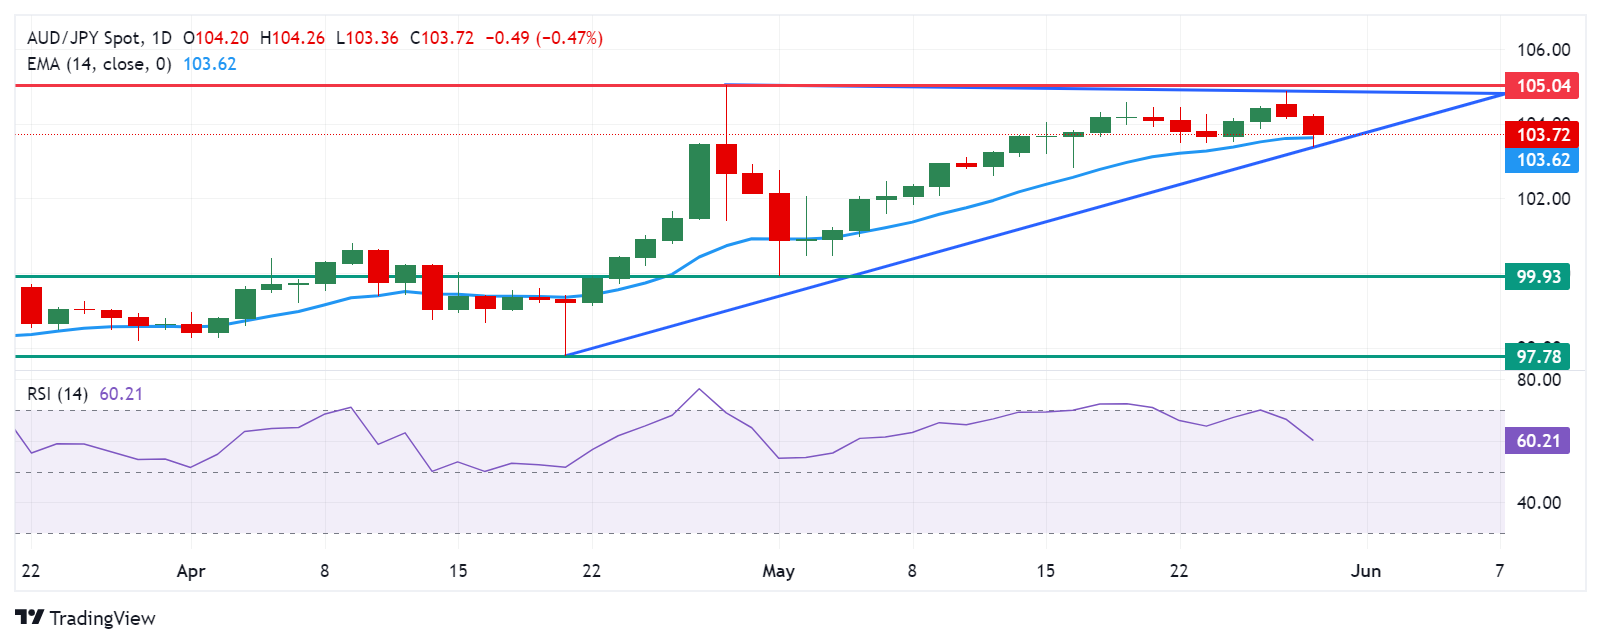
- The Pound Sterling exhibits choppiness around 1.2700 as the US core PCE Inflation comes under the spotlight.
- UK’s high service inflation remains a barrier to the sustainable return of price pressures toward the 2% target.
- Traders pare Fed rate-cut bets for September due to the stubborn inflation outlook.
The Pound Sterling (GBP) trades in a tight range near the round-level figure of 1.2700 against the US Dollar (USD) in Thursday’s European session. The GBP/USD pair is broadly under pressure due to uncertain market sentiment ahead of the United States (US) core Personal Consumption Expenditures Price Index (PCE) data for April, which will be published on Friday.
Sterling will seldom be influenced by market speculation about Bank of England (BoE) interest rate cuts, which financial markets expect will start from the August meeting. Earlier in the year, investors anticipated the BoE would begin lowering key borrowing rates in June. However, traders pare rate-cut bets for June after the United Kingdom (UK) Consumer Price Index (CPI) report for April showed that price pressures decelerated at a slower pace than estimates.
Though UK headline CPI has significantly declined, BoE policymakers still worry about a sharp slowdown in service inflation momentum, which is almost double the pace required to bring core inflation down to the 2% target.
Daily digest market movers: Pound Sterling struggle for direction
- The Pound Sterling consolidates in a tight range near 1.2700 as investors shift focus to the US core PCE Price Index data for April, which will be published on Friday. Annual and monthly core PCE inflation readings are estimated to have grown steadily by 2.8% and 0.3%, respectively.
- Investors will keenly focus on the US Federal Reserve’s (Fed) preferred inflation gauge as it will significantly influence speculation about Fed rate cuts in the September meeting. The CME FedWatch tool shows that the probability of interest rates being lower than current levels in September has come down to 47% from the previous week’s reading of 51%. Traders pare Fed rate-cut bets for September after the US Conference Board showed on Tuesday that Consumer Confidence for May surprisingly improved and the preliminary S&P Global PMI report for May outperformed expectations.
- US Consumer Confidence rose to 102.00 from 97.5 in April after deteriorating consecutively for three months. The Consumer Confidence report, which releases the Present Situation Index and the Expectations Index that reflects current and the near-term outlook, respectively, of business and labor market conditions, outperformed their prior readings.
- Meanwhile, the Fed’s hawkish guidance on interest rates has also weighed on Fed rate-cut bets. Policymakers want to see inflation slowing for months before leaning toward the policy normalization process. Officials maintained a hawkish stance despite a slowdown in price pressures in April. They argued that a one-time decline in inflation is insufficient to get confidence that the progress in the disinflation process has resumed after stalling for the entire first quarter.
Technical Analysis: Pound Sterling seems uncertain near 1.2700
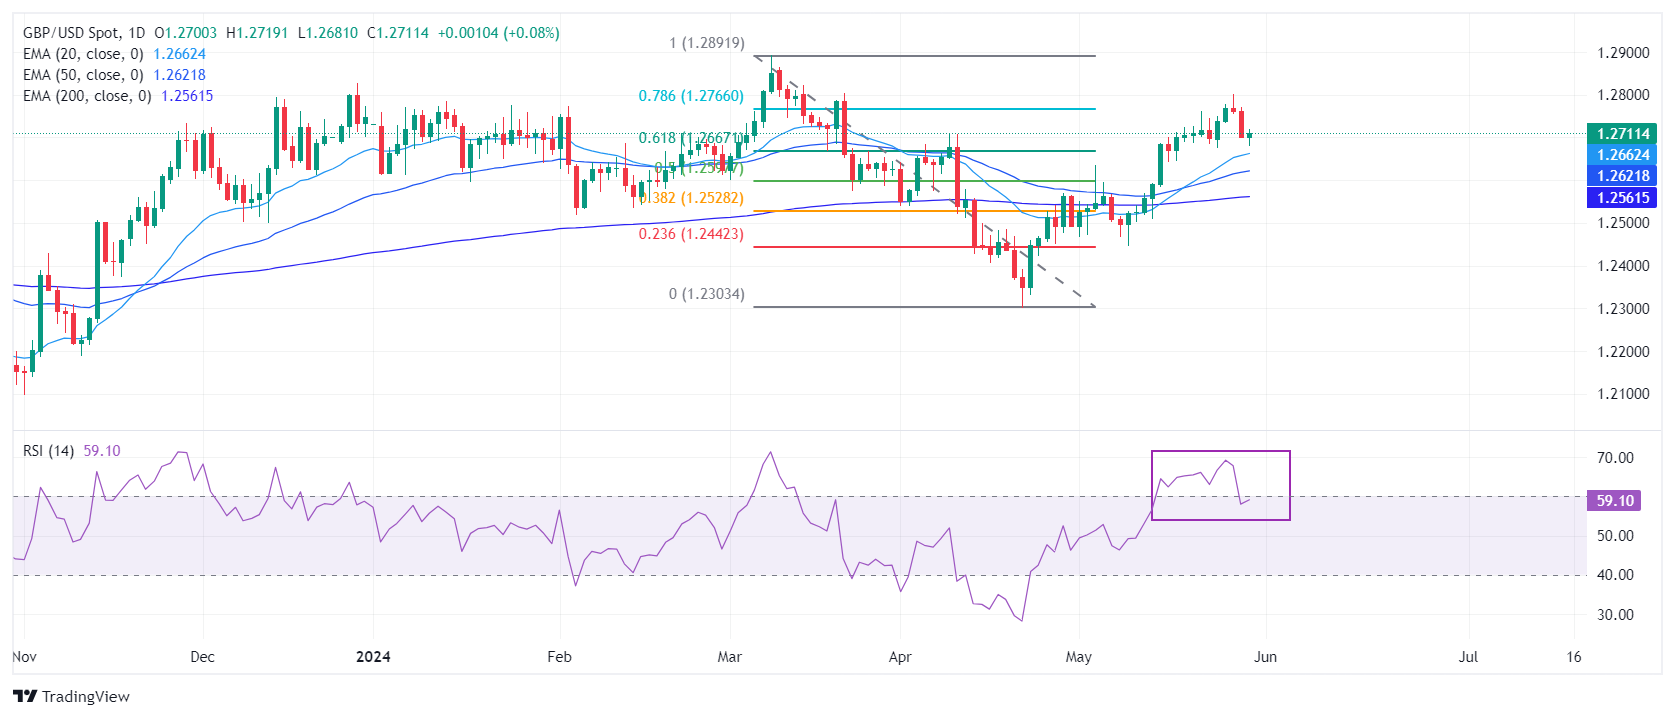
The Pound Sterling finds temporary support slightly below 1.2700 in Thursday’s European session after a sharp sell-off on Wednesday. The near-term outlook of the GBP/USD pair is still upbeat as it holds the 61.8% Fibonacci retracement support (plotted from the March 8 high of 1.2900 to the April 22 low at 1.2300) at 1.2670. The Cable is expected to remain bullish as all short-to-long-term Exponential Moving Averages (EMAs) are sloping higher, suggesting a strong uptrend.
The 14-period Relative Strength Index (RSI) has slipped into the 40.00-60.00 range, suggesting that the momentum, which was leaned toward the upside, has faded for now.
Pound Sterling FAQs
The Pound Sterling (GBP) is the oldest currency in the world (886 AD) and the official currency of the United Kingdom. It is the fourth most traded unit for foreign exchange (FX) in the world, accounting for 12% of all transactions, averaging $630 billion a day, according to 2022 data. Its key trading pairs are GBP/USD, aka ‘Cable’, which accounts for 11% of FX, GBP/JPY, or the ‘Dragon’ as it is known by traders (3%), and EUR/GBP (2%). The Pound Sterling is issued by the Bank of England (BoE).
The single most important factor influencing the value of the Pound Sterling is monetary policy decided by the Bank of England. The BoE bases its decisions on whether it has achieved its primary goal of “price stability” – a steady inflation rate of around 2%. Its primary tool for achieving this is the adjustment of interest rates. When inflation is too high, the BoE will try to rein it in by raising interest rates, making it more expensive for people and businesses to access credit. This is generally positive for GBP, as higher interest rates make the UK a more attractive place for global investors to park their money. When inflation falls too low it is a sign economic growth is slowing. In this scenario, the BoE will consider lowering interest rates to cheapen credit so businesses will borrow more to invest in growth-generating projects.
Data releases gauge the health of the economy and can impact the value of the Pound Sterling. Indicators such as GDP, Manufacturing and Services PMIs, and employment can all influence the direction of the GBP. A strong economy is good for Sterling. Not only does it attract more foreign investment but it may encourage the BoE to put up interest rates, which will directly strengthen GBP. Otherwise, if economic data is weak, the Pound Sterling is likely to fall.
Another significant data release for the Pound Sterling is the Trade Balance. This indicator measures the difference between what a country earns from its exports and what it spends on imports over a given period. If a country produces highly sought-after exports, its currency will benefit purely from the extra demand created from foreign buyers seeking to purchase these goods. Therefore, a positive net Trade Balance strengthens a currency and vice versa for a negative balance.
- Polls show the Labour party is likely to win the July 4 UK general election.
- The election outcome could have consequences for the UK economy, the Bank of England policy and the Pound Sterling valuation
- Some economists have suggested tiered remuneration at the BoE could be a source of extra revenue for the government.
The UK election will arrive on July 4 and will probably be dressed in red. According to bookmakers, the left-leaning Labour party has a 90% chance of winning. While this suggests a significant political change after almost 15 years of conservative-led governments, analysts doubt there will dramatically alter the outlook for the economy.
Still, any nuances over economic policy could shift growth expectations, the Bank of England (BoE) interest-rate outlook and thus impact the Pound Sterling (GBP) valuation.
The latest poll by the BBC puts Labour in the lead with 45% and the Conservatives second with only 24% – a 21 percentage-point difference.
The UK’s “first past the post” voting system tends to unduly reward the winning party when it comes to the alchemy of transforming votes into seats. This means if Labour actually gets 45% of the vote it will win a landslide victory. According to Electoralcalculas, with 44.3% of the vote, Labour would win 479 out of the 650 seats in the UK Parliament – a healthy majority.
Whilst the UK election result is looking like a done deal, what will it mean for the Bank of England (BoE) and its monetary-policy trajectory? Further, how might it affect the Pound Sterling (GBP), and financial markets in general?
UK election: Impact on Bank of England policy
Despite the UK election looking like an easy win for Labour, the party has announced scant details of its fiscal policy intentions, making it difficult to assess what – if any impact – the election will have on markets. Apart from a recent pledge to reduce National Health Service (NHS) waiting lists to a maximum of 18 weeks by the end of its first term, it has not released any detailed spending plans.
Labour does, however, support the BoE’s plans to launch its own central bank digital currency, the “digital pound”, according to investment app Stocklytics.
A Labour-party win is unlikely to alter market expectations around BoE monetary policy on interest rates, according to experts, who say that whichever party wins, will have to show a high degree of fiscal restraint.
“The markets don’t need to fret about the election leading to a sudden reduction in long-term productivity as they did ahead of the 2017 and 2019 elections. And as there won’t be much room for maneuver on fiscal policy for either party after the election, the fiscal plans of the winner are unlikely to significantly alter market interest rate expectations or Gilt yields,” Ruth Gregory, Deputy Chief UK Economist at Capital Economics, told FXStreet.
Gregory is not the only person expecting minimal market impact from the UK election.
“Implied Sterling volatility may rise before the vote, but the implication of the election outcome for Sterling and Gilts should be trivial,” says in a research note Kenneth Broux, FX Strategist at Societe Generale (SocGen).
A tail risk for Sterling and debt markets would be a hung parliament, “where no party wins a majority, and would be negative for the currency and rates,” says SocGen.
UK election manifestos will be key
It is only in an event where either party were to show “fiscal profligacy” in their manifestos, that financial markets might react.
“Investors will assess the election manifestos for signs of fiscal profligacy and for answers to the implausible scheduled squeeze on public spending. Our assumption is that a fall in CPI inflation below the 2.0% target will prompt the Bank of England to reduce interest rates from 5.25% now, to 3.00% in 2025. We think that will lead to 10-year gilt Yields falling from 4.23% now to around 3.50% by the end of this year and the Pound to weaken from $1.28 now to $1.22 by the end of the year,” says Gregory.
That either party will announce radical tax cuts is unlikely. Labour is more likely to raise rather than slash taxes and memories are still fresh of how such policies backfired on Lizz Truss’s administration. That said, if the two parties “get embroiled in a race to the bottom on tax policies”, the Pound could weaken from $1.28 (GBP/USD) to a below-forecast $1.22, adds Gregory.
Going to the banks cap in hand: “Tiered Remuneration”
One change to BoE policy that might find the extra money for Labour if it wins is “Tiered Remuneration” or “Reserve Tiering”.
Tiered remuneration involves reducing the interest the BoE pays commercial banks that hold reserves with them. These reserves, totalling an estimated £830 billion, were built up by UK banks from the BoE’s Quantitative Easing (QE) programe between 2009-2021. QE involved the BoE buying mainly government bonds from banks to provide them with liquidity during the credit crisis.
Under the current state of affairs, the BoE pays interest on the full amount of these reserves at Bank Rate (5.25%). Interest payments are backed by a state guarantee signed by the UK government in 2009.
The scheme worked well when interest rates were low.However, since 2019 when the BoE began raising interest rates to combat inflation, the scheme has made a loss – a loss the UK government has had to plug with taxpayer money.
“The crux is that QE creates money that goes onto banks’ balances (reserves) at the Bank of England, and those reserves are being fully remunerated at the central bank’s policy rate (Bank Rate),” explains Economist Paul Tucker, former Deputy Governor of the Bank of England for Financial Stability.
“Given the outstanding stock of QE (£838 billion), that has effectively shifted a large fraction of UK government debt from fixed-rate borrowing (where debt-servicing costs are ‘locked in’) to floating-rate borrowing (where debt-servicing costs rise and fall with Bank Rate). Increases in Bank Rate therefore lead immediately to higher debt-servicing costs for the government, leaving the British state with a large risk exposure to rising interest rates,” Tucker says in Chapter 7 of his 2022 book “Quantitative easing, monetary policy implementation, and the public finances.”
In “Tiered Remuneration”, however, the BoE would only pay interest on a fraction of these reserves, removing the government’s burden. The system is used by the European Central Bank (ECB), the Swiss National Bank (SNB), and the central banks of Denmark and Sweden.
Retired MP and Prime Minister Gordon Brown has floated the idea to use this extra money as a way of funding a reduction in the high levels of child poverty currently being experienced in the UK. Labour party leader Keir Starmer, however, has not formally adopted it. It was rejected by the current Chancellor of the Exchequer Jeremy Hunt because it could “impact the competitiveness of UK Banks,” and the Governor of the Bank of England, Andrew Bailey, once described it as a “tax on banks”.
Over £100 billion in savings
According to the Office of Budgetary Responsibility (OBR), however, a policy of reserve tiering would save the government £103 billion.
If introduced, it could make savings of between 1.2% and 1.6% of GDP in 2022-2023 and 2024-2025 respectively, according to Tucker. This is equivalent to 63%-84% of average UK government debt-servicing costs, or between 7.6% and 10.5% of the UK’s annual spending on defense, health and education.
Bank profits would take a hit as a consequence, however, according to Jason Napier, an equities analyst at Swiss lender UBS. A UK version of the ECB model, for example, would cost the major UK banks about £200 million each a year, the analyst adds.
Paul de Grauwe, a Professor of political economy at the London School of Economics, however, argues that tiered remuneration would sharpen the transmission of monetary policy and help restrain inflation, according to Bloomberg News.
- NZD/USD extends its losing streak following the NZ Yearly Budget on Thursday.
- New Zealand Treasury sees inflation falling to below 3% in Q3.
- The lower US Treasury yields put pressure on the US Dollar, limiting the downside of the pair.
NZD/USD continues its losing streak for the third consecutive day on Thursday. The pair trades around 0.6100 during European hours, following the release of the Yearly Budget by the New Zealand Treasury. According to the official transcript from the New Zealand Government's website (www.beehive.govt.nz), Finance Minister Nicola Willis stated that Budget 2024 outlines the Government’s plan to rebuild the economy, ease the cost of living, improve health and education services, and restore law and order.
New Zealand Government endures savings of $23 billion over four years to responsibly fund tax relief and provide an additional boost to priority frontline services. A $7 billion boost to capital funding, via a top-up to the Multi-Year Capital Allowance, so we can invest in the infrastructure needed for future growth and resilience.
New Zealand Finance Minister Nicola Willis stated that the Treasury sees inflation falling to below 3% in Q3 and easing to 2% around 2026. The New Zealand treasury sees NZ GDP contracting in H1 2024, and growth in H2 2024.
On USD’s front, the hawkish remarks from US Federal Reserve (Fed) officials have heightened concerns about potential rate hikes, fueling risk aversion sentiment. This supported the US Dollar (USD), undermining the NZD/USD pair.
However, the downward correction in the US Treasury yields put pressure on the US Dollar, limiting the losses of the NZD/USD pair. Traders await the release of US Gross Domestic Product Annualized (Q1) data on Thursday and the Core Personal Consumption Expenditures (PCE) Price Index data on Friday.
Silver prices (XAG/USD) fell on Thursday, according to FXStreet data. Silver trades at $31.43 per troy ounce, down 1.69% from the $31.97 it cost on Wednesday.
Silver prices have increased by 23.40% since the beginning of the year.
| Unit measure | Today Price |
|---|---|
| Silver price per troy ounce | $31.43 |
| Silver price per gram | $1.01 |
The Gold/Silver ratio, which shows the number of troy ounces of Silver needed to equal the value of one troy ounce of Gold, stood at 74.25 on Thursday, up from 73.13 on Wednesday.
Investors might use this ratio to determine the relative valuation of Gold and Silver. Some may consider a high ratio as an indicator that Silver is undervalued – or Gold is overvalued – and might buy Silver or sell Gold accordingly. Conversely, a low ratio might suggest that Gold is undervalued relative to Silver.
Silver FAQs
Silver is a precious metal highly traded among investors. It has been historically used as a store of value and a medium of exchange. Although less popular than Gold, traders may turn to Silver to diversify their investment portfolio, for its intrinsic value or as a potential hedge during high-inflation periods. Investors can buy physical Silver, in coins or in bars, or trade it through vehicles such as Exchange Traded Funds, which track its price on international markets.
Silver prices can move due to a wide range of factors. Geopolitical instability or fears of a deep recession can make Silver price escalate due to its safe-haven status, although to a lesser extent than Gold's. As a yieldless asset, Silver tends to rise with lower interest rates. Its moves also depend on how the US Dollar (USD) behaves as the asset is priced in dollars (XAG/USD). A strong Dollar tends to keep the price of Silver at bay, whereas a weaker Dollar is likely to propel prices up. Other factors such as investment demand, mining supply – Silver is much more abundant than Gold – and recycling rates can also affect prices.
Silver is widely used in industry, particularly in sectors such as electronics or solar energy, as it has one of the highest electric conductivity of all metals – more than Copper and Gold. A surge in demand can increase prices, while a decline tends to lower them. Dynamics in the US, Chinese and Indian economies can also contribute to price swings: for the US and particularly China, their big industrial sectors use Silver in various processes; in India, consumers’ demand for the precious metal for jewellery also plays a key role in setting prices.
Silver prices tend to follow Gold's moves. When Gold prices rise, Silver typically follows suit, as their status as safe-haven assets is similar. The Gold/Silver ratio, which shows the number of ounces of Silver needed to equal the value of one ounce of Gold, may help to determine the relative valuation between both metals. Some investors may consider a high ratio as an indicator that Silver is undervalued, or Gold is overvalued. On the contrary, a low ratio might suggest that Gold is undervalued relative to Silver.
Gold prices fell in India on Thursday, according to data compiled by FXStreet.
The price for Gold stood at 6,248.90 Indian Rupees (INR) per gram, down INR 15.35 compared with the INR 6,264.26 it cost on Wednesday.
The price for Gold decreased to INR 72,885.98 per tola from INR 73,065.05 per tola.
| Unit measure | Gold Price in INR |
|---|---|
| 1 Gram | 6,248.90 |
| 10 Grams | 62,489.04 |
| Tola | 72,885.98 |
| Troy Ounce | 194,367.70 |
FXStreet calculates Gold prices in India by adapting international prices (USD/INR) to the local currency and measurement units. Prices are updated daily based on the market rates taken at the time of publication. Prices are just for reference and local rates could diverge slightly.
Global Market Movers: Comex Gold price stays weak amid stronger US data
- The Israeli military said on Wednesday that it established “operational control” over the Philadelphi Corridor, a 14-kilometer (8.7 miles) strip of land along the border between Gaza and Egypt, per CNN.
- Global physically-backed gold Exchange-Traded Funds (ETFs) witnessed a net outflow of 11.3 metric tonnes last week, according to the World Gold Council.
- Fed Atlanta President Bostic said on Thursday that the breadth of price gains is still significant, but less inflation breadth would add to confidence for a rate cut.
- Economic activity continued to expand in the US and prices increased modestly from early April to mid-May. Overall outlooks were more pessimistic amid reports of rising uncertainty and greater downside risks, according to the Fed's Beige Book released Wednesday.
- Markets are pricing in a 50% chance that the Fed will hold interest rates in September, according to the CME FedWatch Tool.
- The US Gross Domestic Product (GDP) number is estimated to expand at a 1.3% annual pace in the first quarter of 2024.
Gold FAQs
Gold has played a key role in human’s history as it has been widely used as a store of value and medium of exchange. Currently, apart from its shine and usage for jewelry, the precious metal is widely seen as a safe-haven asset, meaning that it is considered a good investment during turbulent times. Gold is also widely seen as a hedge against inflation and against depreciating currencies as it doesn’t rely on any specific issuer or government.
Central banks are the biggest Gold holders. In their aim to support their currencies in turbulent times, central banks tend to diversify their reserves and buy Gold to improve the perceived strength of the economy and the currency. High Gold reserves can be a source of trust for a country’s solvency. Central banks added 1,136 tonnes of Gold worth around $70 billion to their reserves in 2022, according to data from the World Gold Council. This is the highest yearly purchase since records began. Central banks from emerging economies such as China, India and Turkey are quickly increasing their Gold reserves.
Gold has an inverse correlation with the US Dollar and US Treasuries, which are both major reserve and safe-haven assets. When the Dollar depreciates, Gold tends to rise, enabling investors and central banks to diversify their assets in turbulent times. Gold is also inversely correlated with risk assets. A rally in the stock market tends to weaken Gold price, while sell-offs in riskier markets tend to favor the precious metal.
The price can move due to a wide range of factors. Geopolitical instability or fears of a deep recession can quickly make Gold price escalate due to its safe-haven status. As a yield-less asset, Gold tends to rise with lower interest rates, while higher cost of money usually weighs down on the yellow metal. Still, most moves depend on how the US Dollar (USD) behaves as the asset is priced in dollars (XAU/USD). A strong Dollar tends to keep the price of Gold controlled, whereas a weaker Dollar is likely to push Gold prices up.
(An automation tool was used in creating this post.)
- EUR/USD falls below 1.0800 amid dismal market mood.
- The ECB is widely anticipated to deliver a rate-cut move in June’s policy meeting.
- The US core PCE price index is estimated to have grown steadily in April.
EUR/USD extends its downside below the crucial support of 1.0800 in Thursday’s European session. The major currency pair faces severe pressure as the US Dollar (USD) strengthens amid cautious market sentiment. The US Dollar Index (DXY), which tracks the Greenback’s value against six major currencies, jumps to a two-week high slightly above 105.00.
Investors rush to the US Dollar as they expect that the Federal Reserve (Fed) will not be leaning towards interest rate cuts anytime soon. Fed policymakers have made it clear that they want to see inflation slow for months to gain confidence that price pressures will sustainably return to the desired rate of 2%.
Fed officials see more rate hikes as less likely but have kept the possibility on the table if progress in the disinflation process stalls. For fresh cues on the interest rate outlook, investors shift focus to the United States core Personal Consumption Expenditure Price Index (PCE) data for April, which will published on Friday and significantly influence speculation for Fed rate cuts in September. Annual and monthly core PCE inflation readings are estimated to have grown steadily by 2.8% and 0.3%, respectively.
Daily digest market movers: EUR/USD exhibits weakness with eyes on Eurozone/US inflation data
- EUR/USD falls sharply below the round-level support of 1.0800. The shared currency pair comes under pressure as investors expect that the appeal of the Euro would weaken against the US Dollar. The speculation is based on the fact that the European Central Bank (ECB) looks set to start reducing interest rates from the June meeting, while the Fed has not committed timing of rate cuts.
- Noting that the Eurozone’s core inflation has already declined to 2.7% and the progress in the service disinflation process has resumed after stalling in the November-March period, ECB policymakers are comfortable with expectations of the central bank pivoting to policy normalization from June.
- As the June rate cut appears to be a done deal, speculation about the ECB’s rate-cut path beyond June will project the next move in the Euro. Currently, financial markets expect that the ECB will cut one more time this year. However, a Reuters poll of 82 economists from May 21 to 28 has suggested that the ECB will make two more rate cuts this year.
- At the start of the year, investors forecasted that the ECB would cut interest rates six times this year. However, the expectations for the number of rate cuts reduced as ECB policymakers warned that an aggressive policy easing approach could revamp price pressures again. Also, the uncertainty over wage growth momentum has prompted the odds of following a gradual rate-cut approach.
- On the economic front, investors will focus on the preliminary Eurozone inflation data for May, which will be published on Friday. The inflation data will provide cues about how far and fast the ECB will lower key borrowing rates. Economists expect that the annual Harmonized Index of Consumer Prices (HICP) rose at a stronger pace of 2.5% from the prior reading of 2.4%. The annual core HICP is estimated to have accelerated to 2.8% from 2.7% in April.
Technical Analysis: EUR/USD extends downside below 1.0800
EUR/USD sets a fresh swing low below the May 23 low around 1.0800, suggesting strong odds of a bearish reversal. The major currency pair fails to deliver a sharp upside move, generally observed after a Symmetrical Triangle chart pattern breakout. A downside move back into the triangle indicates that the breakout was fake, and the pair is set to return to the upward-sloping border of the above-mentioned chart pattern.
The shared currency pair has dropped below the 20-day and 50-day Exponential Moving Averages (EMAs), which trades around 1.0800, indicating that the near-term trend has turned bearish.
The 14-period Relative Strength Index (RSI) has slipped into the 40.00-60.00 range, suggesting that the momentum, which was leaned toward the upside, has faded for now.
Euro FAQs
The Euro is the currency for the 20 European Union countries that belong to the Eurozone. It is the second most heavily traded currency in the world behind the US Dollar. In 2022, it accounted for 31% of all foreign exchange transactions, with an average daily turnover of over $2.2 trillion a day. EUR/USD is the most heavily traded currency pair in the world, accounting for an estimated 30% off all transactions, followed by EUR/JPY (4%), EUR/GBP (3%) and EUR/AUD (2%).
The European Central Bank (ECB) in Frankfurt, Germany, is the reserve bank for the Eurozone. The ECB sets interest rates and manages monetary policy. The ECB’s primary mandate is to maintain price stability, which means either controlling inflation or stimulating growth. Its primary tool is the raising or lowering of interest rates. Relatively high interest rates – or the expectation of higher rates – will usually benefit the Euro and vice versa. The ECB Governing Council makes monetary policy decisions at meetings held eight times a year. Decisions are made by heads of the Eurozone national banks and six permanent members, including the President of the ECB, Christine Lagarde.
Eurozone inflation data, measured by the Harmonized Index of Consumer Prices (HICP), is an important econometric for the Euro. If inflation rises more than expected, especially if above the ECB’s 2% target, it obliges the ECB to raise interest rates to bring it back under control. Relatively high interest rates compared to its counterparts will usually benefit the Euro, as it makes the region more attractive as a place for global investors to park their money.
Data releases gauge the health of the economy and can impact on the Euro. Indicators such as GDP, Manufacturing and Services PMIs, employment, and consumer sentiment surveys can all influence the direction of the single currency. A strong economy is good for the Euro. Not only does it attract more foreign investment but it may encourage the ECB to put up interest rates, which will directly strengthen the Euro. Otherwise, if economic data is weak, the Euro is likely to fall. Economic data for the four largest economies in the euro area (Germany, France, Italy and Spain) are especially significant, as they account for 75% of the Eurozone’s economy.
Another significant data release for the Euro is the Trade Balance. This indicator measures the difference between what a country earns from its exports and what it spends on imports over a given period. If a country produces highly sought after exports then its currency will gain in value purely from the extra demand created from foreign buyers seeking to purchase these goods. Therefore, a positive net Trade Balance strengthens a currency and vice versa for a negative balance.
- USD/CHF weakens to 0.9102 in Thursday’s early European session.
- The Swiss economy grew 0.5% QoQ in Q1, stronger than the estimation and the previous reading of 0.3% expansion.
- The Fed's Bostic said the central bank has a ways to go to curb the inflation seen over the last few years.
The USD/CHF pair attracts some sellers around 0.9102 on Thursday during the early European trading hours. The Swiss Franc (CHF) gains traction after the release of a stronger-than-expected Switzerland’s Gross Domestic Product (GDP) report for the first quarter (Q1) of 2024. USD/CHF currently trades 0.32% lower on the day.
The Swiss economy continued to expand in Q1, the State Secretariat for Economic Affairs (SECO) revealed on Thursday. Switzerland’s GDP numbers grew 0.5% QoQ in Q1. The figure came in better than the estimation and the previous reading of 0.3% expansion. On an annual basis, the GDP figure arrived at 0.6% YoY in Q1, above the market consensus of 0.5%. The upbeat GDP reading provides some support to the CHF and drags the USD/CHF lower to weekly lows.
Additionally, Switzerland's trade surplus stood at $4,316M in April from $3,767M in March, the Federal Office for Customs and Border Security (FOCBS) announced in a report on Thursday.
Apart from this, the rising geopolitical tensions in the Middle East might boost safe-haven assets like the Swiss Franc (CHF). On Wednesday, the BBC reported that Israel's military has announced that it has taken control of the Philadelphi Corridor, a strategically significant buffer zone along the Gaza-Egypt border, thereby controlling Gaza's entire land border.
On the USD’s front, the hawkish messages from Fed officials and stronger-than-expected US economic data have triggered the expectation that the US central bank will delay the interest rate cut this year. On Wednesday, Fed Atlanta President Bostic said that he’s hopeful that the elevated price pressures seen during the COVID-19 pandemic will decline over the next year. Bostic added that the Fed still has a ways to go to curb the significant price growth seen over the last few years.
Financial markets are now pricing in a 50% possibility that the Fed will hold interest rates in September, according to the CME FedWatch Tool. The wait-and-see mode of the Fed might provide some support to the Greenback and cap the downside for the pair. Investors will shift their attention to the second estimate of the US Gross Domestic Product (GDP) for Q1 2024 on Thursday, which is estimated to expand 1.3% in the first quarter of 2024.
FX option expiries for May 30 NY cut at 10:00 Eastern Time, via DTCC, can be found below
- EUR/USD: EUR amounts
- 1.0700 1.2b
- 1.0740 1.3b
- 1.0750 1.4b
- 1.0775 963m
- 1.0800 1.2b
- 1.0825 1.6b
- 1.0850 2b
- 1.0900 2.2b
- GBP/USD: GBP amounts
- 1.2550 903m
- 1.2660 548m
- 1.2775 519m
- USD/JPY: USD amounts
- 156.00 1.9b
- 156.15 613m
- 156.55 846m
- 157.00 798m
- 157.50 531m
- 158.00 891m
- AUD/USD: AUD amounts
- 0.6525 877m
- 0.6600 438m
- 0.6625 484m
- 0.6700 1b
- USD/CAD: USD amounts
- 1.3550 608m
- 1.3615 541m
- 1.3660 580m
- 1.3700 790m
Here is what you need to know on Thursday, May 30:
Safe-haven flows dominate the financial markets in the second half of the week, allowing the US Dollar (USD) and the Japanese Yen to stay resilient against risk-sensitive currencies. Business and consumer sentiment data for May will be featured in the European economic docket, alongside the Unemployment Rate for April. Later in the day, the US Bureau of Economic Analysis will publish its second estimate of the first-quarter Gross Domestic Product (GDP) growth and the US Department of Labor will release the weekly Jobless Claims data.
US Dollar PRICE This week
The table below shows the percentage change of US Dollar (USD) against listed major currencies this week. US Dollar was the strongest against the Euro.
| USD | EUR | GBP | JPY | CAD | AUD | NZD | CHF | |
|---|---|---|---|---|---|---|---|---|
| USD | 0.48% | 0.41% | -0.16% | 0.46% | 0.45% | 0.31% | -0.37% | |
| EUR | -0.48% | -0.09% | -0.61% | -0.01% | -0.10% | -0.26% | -0.81% | |
| GBP | -0.41% | 0.09% | -0.58% | 0.07% | 0.00% | -0.10% | -0.75% | |
| JPY | 0.16% | 0.61% | 0.58% | 0.58% | 0.59% | 0.56% | -0.24% | |
| CAD | -0.46% | 0.01% | -0.07% | -0.58% | -0.03% | -0.15% | -0.88% | |
| AUD | -0.45% | 0.10% | -0.00% | -0.59% | 0.03% | -0.08% | -0.76% | |
| NZD | -0.31% | 0.26% | 0.10% | -0.56% | 0.15% | 0.08% | -0.69% | |
| CHF | 0.37% | 0.81% | 0.75% | 0.24% | 0.88% | 0.76% | 0.69% |
The heat map shows percentage changes of major currencies against each other. The base currency is picked from the left column, while the quote currency is picked from the top row. For example, if you pick the US Dollar from the left column and move along the horizontal line to the Japanese Yen, the percentage change displayed in the box will represent USD (base)/JPY (quote).
Following Tuesday's decline, major equity indexes in the US stretched lower on Wednesday. The USD Index gained 0.5% and climbed to a two-week-high, while the benchmark 10-year US Treasury bond yield extended its recovery toward 4.6%. Early Thursday, the USD Index consolidates its gains slightly above 105.00 and US stock index futures trade deep in negative territory, losing between 0.6% and 0.9%.
During the Asian trading hours, New Zealand (NZ) Finance Minister Nicola Willis presented the government’s annual Budget for 2024. According to the report, the Treasury sees inflation falling to below 3% in the third quarter of 2024 and retreating to the 2% target around 2026. After losing 0.4% on Wednesday, NZD/USD extended its slide and was last seen trading below 0.6100.
Despite the broad-based USD strength, USD/JPY turned south as the Japanese Yen benefited from safe-haven flows. At the time of press, USD/JPY was down 0.6% on the day at 156.70.
Japanese Yen rises as traders bet BoJ implementing rate hike, Tokyo's inflation looms.
EUR/USD came under heavy bearish pressure on Wednesday and registered its largest one-day decline since late April, losing 0.5% on the day. The pair struggles to stage a rebound early Thursday and trades slightly below 1.0800.
GBP/USD declined sharply on Wednesday and erased its weekly gains. The pair stays on the back foot in the European morning and trades below 1.2700
Rising US yields and the renewed USD strength weighed on XAU/USD on Wednesday and the pair lost nearly 1%. Early Thursday, Gold holds steady at around $2,330.
Risk sentiment FAQs
In the world of financial jargon the two widely used terms “risk-on” and “risk off'' refer to the level of risk that investors are willing to stomach during the period referenced. In a “risk-on” market, investors are optimistic about the future and more willing to buy risky assets. In a “risk-off” market investors start to ‘play it safe’ because they are worried about the future, and therefore buy less risky assets that are more certain of bringing a return, even if it is relatively modest.
Typically, during periods of “risk-on”, stock markets will rise, most commodities – except Gold – will also gain in value, since they benefit from a positive growth outlook. The currencies of nations that are heavy commodity exporters strengthen because of increased demand, and Cryptocurrencies rise. In a “risk-off” market, Bonds go up – especially major government Bonds – Gold shines, and safe-haven currencies such as the Japanese Yen, Swiss Franc and US Dollar all benefit.
The Australian Dollar (AUD), the Canadian Dollar (CAD), the New Zealand Dollar (NZD) and minor FX like the Ruble (RUB) and the South African Rand (ZAR), all tend to rise in markets that are “risk-on”. This is because the economies of these currencies are heavily reliant on commodity exports for growth, and commodities tend to rise in price during risk-on periods. This is because investors foresee greater demand for raw materials in the future due to heightened economic activity.
The major currencies that tend to rise during periods of “risk-off” are the US Dollar (USD), the Japanese Yen (JPY) and the Swiss Franc (CHF). The US Dollar, because it is the world’s reserve currency, and because in times of crisis investors buy US government debt, which is seen as safe because the largest economy in the world is unlikely to default. The Yen, from increased demand for Japanese government bonds, because a high proportion are held by domestic investors who are unlikely to dump them – even in a crisis. The Swiss Franc, because strict Swiss banking laws offer investors enhanced capital protection.
- Silver price lost ground due to investors’ caution ahead of US GDP Annualized due on Thursday.
- Hawkish remarks from Fed officials have supported US Treasury yields, negatively impacting non-yielding assets like Silver.
- The escalated geopolitical tensions in the Middle East could limit the losses of the safe-haven Silver.
Silver prices extended its losses for the second successive day, trading around $31.40 per troy ounce during the Asian hours on Thursday. The price of the grey metal is struggling as investors adopt caution ahead of the release of US Gross Domestic Product Annualized (Q1) data on Thursday and the Core Personal Consumption Expenditures (PCE) Price Index figures on Friday.
US economic growth on an annualized basis for the first quarter is expected to grow by 1.3%, lower than the previous quarter’s 1.6% rise. Federal Reserve's preferred measure of inflation, US Core PCE is expected to show an increase of 0.3% month-over-month and 2.8% year-over-year in April.
Hawkish remarks from US Federal Reserve (Fed) officials have heightened concerns about potential rate hikes, fueling risk aversion sentiment. This has supported US Treasury yields while negatively impacting non-yielding assets like Silver.
Reuters reported on Tuesday that Neel Kashkari, President of the Federal Reserve Bank of Minneapolis, hinted at the possibility of a rate hike. Kashkari remarked, “I don’t believe anyone has completely ruled out the option of increasing rates,” expressing doubts about the disinflationary trend. Additionally, Bloomberg reported on Wednesday that Atlanta Fed President Raphael Bostic stated that the path to 2% inflation is not assured and that the breadth of price gains is still significant.
In the ongoing geopolitical tensions in the Middle East, traditional safe-haven assets such as Silver could see an uptick in demand. The Israeli military announced on Wednesday that it had attained "operational control" over the Philadelphi Corridor, a 14-kilometer (8.7 miles) strip of land along the border between Gaza and Egypt, as reported by CNN.
- USD/CAD marches toward 1.3740, strengthen by the strong US Dollar.
- The US Dollar strengthens amid caution ahead of the US core PCE Inflation data.
- Canadian monthly and Q1 GDP data will exhibit its economic health.
The USD/CAD pair establishes itself above the round-level resistance of 1.3700 in Thursday’s Asian session. The Loonie asset aims to recapture weekly high near 1.3740 as the US Dollar strengthens. Strong demand of the US Dollar is driven by a sharp decline in traders’ bets for the Federal Reserve (Fed) reducing interest rates from the September meeting.
Investors remain risk-averse amid fears of the Fed delaying rate-cuts to the last quarter of the year. S&P 500 futures have posted significant losses in the Tokyo session, reflecting a sharp decline in investors’ risk-appetite. The US Dollar Index (DXY), which tracks the Greenback’s value against six major currencies, jumps above the critical resistance of 105.00.
The scenario of higher interest rates by the Fed for a longer period bodes well for the yields on interest-bearing assets. 10-year US Treasury yields are slightly down to 4.61% but is close to almost four-week high.
Meanwhile, investors await the United States core Personal Consumption Expenditure Price Index (PCE) data for April, which will significantly influence speculation for Fed rate cuts in September. The underlying inflation data is scheduled to be published on Friday. Annual and monthly core PCE inflation readings are estimated to have grown steadily by 2.8% and 0.3% respectively.
On the Canadian Dollar front, investors await the Gross Domestic Product (GDP) data for different timeframes, which will be published on Friday. On a month-on-month basis, the Canadian economy is projected to have remained stagnant after expanding 0.2% in February. For the first quarter of the year, the economy is forecasted to have expanded by 2.2% on an annualized basis. Weak GDP numbers would prompt the likelihood of the Bank of Canada (BoC) to begin reducing interest rates from the June meeting.
- WTI price lost ground as traders adopt risk-averse ahead of EIA crude Oil Stocks Change report due on Thursday.
- OPEC+ is expected to opt to maintain supply cuts of 2.2 million barrels per day on June 2.
- Risk aversion preceding US GDP and Core PCE data bolsters the US Dollar, which in turn undermines Oil prices.
West Texas Intermediate (WTI) crude Oil dipped slightly to around $79.00 per barrel in the Asian trading session on Thursday. Traders keep an eye out for the US crude Oil Stocks Change report from the Energy Information Administration later today. Market projections suggested that US energy firms would draw down 1.9 million barrels of crude from storage in the week ending May 24, following the addition of 1.825 million barrels the week before. In the previous week, the API Weekly Crude Oil Stock indicated a decrease of 6.49 million barrels, contrasting with the 2.48 million barrels added in the week prior.
Traders are also awaiting the upcoming meeting of the Organization of the Petroleum Exporting Countries (OPEC) and its allies, including Russia (OPEC+), scheduled for June 2. During this meeting, member producers will discuss prolonging voluntary output cuts of 2.2 million barrels per day into the latter half of 2024. It's anticipated that the group will opt to maintain supply cuts.
Hawkish remarks from Minneapolis Fed President Neel Kashkari further fueled concerns about potential rate hikes. Higher interest rates are negatively impacting the US economic outlook, which dampens the WTI price.
Reuters reported that Neel Kashkari, President of the Federal Reserve Bank of Minneapolis, hinted at the possibility of a rate hike. Kashkari remarked, “I don’t believe anyone has completely ruled out the option of increasing rates,” expressing doubts about the disinflationary trend.
The US Dollar's strength is bolstered by rising Treasury yields, driven by investor risk aversion as they adopt a cautious approach prior to the release of US Gross Domestic Product Annualized (Q1) data on Thursday and the Core Personal Consumption Expenditures (PCE) Price Index data scheduled for Friday. With the US Dollar gaining strength, Oil becomes more expensive for countries purchasing it with other currencies.
- Indian Rupee weakens for the fourth consecutive day on Thursday.
- The USD demand from importers, India’s election-related risks and foreign outflows in Indian equities weigh on the INR.
- The US Gross Domestic Product (GDP) for Q1 2024 will be in the spotlight on Thursday.
Indian Rupee (INR) extends the decline on Thursday. The sell-off in the INR is pressured by the persistent US Dollar (USD) demand from importers and India’s election-related uncertainties. Furthermore, the foreign outflows in Indian equities contribute to the INR’s downside. Market players will closely monitor India's weeks-long general elections, with the outcome set to be counted on June 4. Many analysts believe that the Indian Rupee could attract some buyers if Prime Minister Narendra Modi's Bharatiya Janata Party (BJP) wins the election and continues pro-growth policies.
The second estimate of the US Gross Domestic Product (GDP) for Q1 2024 will be published on Thursday. On Friday, attention will shift to the US Core Personal Consumption Expenditures Price Index (Core PCE) for April and India’s GDP number for the March quarter of the last financial year (Q4 FY24).
Daily Digest Market Movers: Indian Rupee struggles to gain momentum amid the multiple challenges
- The month-end USD purchases by oil importers had exacerbated the Indian rupee's recent slide, said Sugandha Sachdeva, founder of SS WealthStreet, a New Delhi-based research firm.
- S&P Global Ratings retained India's sovereign rating but raised its outlook from 'stable' to ‘positive’, highlighting the country's robust economic fundamentals.
- Foreign investors have sold about $2.8 billion of Indian equities in May on a net basis so far, citing concerns about the upcoming election.
- Fed Atlanta President Bostic said on Thursday that the central bank “still has a ways to go” to curb the significant price growth seen over the last few years, according to Bloomberg.
- The US economic activity continued to expand at a “slight or modest” pace, and consumers pushed back against higher prices since early April, according to the Fed's Beige Book released Wednesday.
- Investors have priced in 50% odds that the Fed will hold interest rates in September, according to the CME FedWatch Tool.
Technical analysis: USD/INR resumes its bullish stance on the daily chart
The Indian Rupee trades on a softer note on the day. The USD/INR pair turns bullish as it crosses above the key 100-day Exponential Moving Average (EMA) on the daily chart. The 14-day Relative Strength Index (RSI) bounces back to a bullish zone around 53.0, suggesting the support is likely to hold rather than break.
USD/INR has formed a descending trend channel since Mid-April. The upper boundary of the channel at 83.40 will be the first upside barrier for the pair. A decisive break above this level will expose a high of May 13 at 83.54 en route to a high of April 17 at 83.72, and finally the 84.00 figure.
In the bearish case, the 100-day EMA at 83.20 acts as an initial support level for the pair. The key contention level is seen at the 83.00 psychological mark. Extended losses could pave the way to a low of January 15 at 82.78, followed by a low of March 11 at 82.65.
US Dollar price today
The table below shows the percentage change of US Dollar (USD) against listed major currencies today. US Dollar was the strongest against the New Zealand Dollar.
| USD | EUR | GBP | CAD | AUD | JPY | NZD | CHF | |
| USD | 0.04% | 0.03% | 0.04% | 0.08% | -0.15% | 0.16% | 0.05% | |
| EUR | -0.04% | -0.01% | 0.02% | 0.04% | -0.19% | 0.13% | -0.01% | |
| GBP | -0.03% | 0.01% | 0.03% | 0.04% | -0.18% | 0.13% | 0.00% | |
| CAD | -0.06% | -0.01% | -0.02% | 0.02% | -0.20% | 0.10% | -0.02% | |
| AUD | -0.06% | -0.02% | -0.03% | 0.00% | -0.20% | 0.09% | -0.03% | |
| JPY | 0.14% | 0.19% | 0.16% | 0.18% | 0.23% | 0.30% | 0.17% | |
| NZD | -0.17% | -0.12% | -0.14% | -0.10% | -0.10% | -0.30% | -0.14% | |
| CHF | -0.03% | 0.01% | 0.00% | 0.02% | 0.06% | -0.18% | 0.13% |
The heat map shows percentage changes of major currencies against each other. The base currency is picked from the left column, while the quote currency is picked from the top row. For example, if you pick the Euro from the left column and move along the horizontal line to the Japanese Yen, the percentage change displayed in the box will represent EUR (base)/JPY (quote).
Indian Rupee FAQs
The Indian Rupee (INR) is one of the most sensitive currencies to external factors. The price of Crude Oil (the country is highly dependent on imported Oil), the value of the US Dollar – most trade is conducted in USD – and the level of foreign investment, are all influential. Direct intervention by the Reserve Bank of India (RBI) in FX markets to keep the exchange rate stable, as well as the level of interest rates set by the RBI, are further major influencing factors on the Rupee.
The Reserve Bank of India (RBI) actively intervenes in forex markets to maintain a stable exchange rate, to help facilitate trade. In addition, the RBI tries to maintain the inflation rate at its 4% target by adjusting interest rates. Higher interest rates usually strengthen the Rupee. This is due to the role of the ‘carry trade’ in which investors borrow in countries with lower interest rates so as to place their money in countries’ offering relatively higher interest rates and profit from the difference.
Macroeconomic factors that influence the value of the Rupee include inflation, interest rates, the economic growth rate (GDP), the balance of trade, and inflows from foreign investment. A higher growth rate can lead to more overseas investment, pushing up demand for the Rupee. A less negative balance of trade will eventually lead to a stronger Rupee. Higher interest rates, especially real rates (interest rates less inflation) are also positive for the Rupee. A risk-on environment can lead to greater inflows of Foreign Direct and Indirect Investment (FDI and FII), which also benefit the Rupee.
Higher inflation, particularly, if it is comparatively higher than India’s peers, is generally negative for the currency as it reflects devaluation through oversupply. Inflation also increases the cost of exports, leading to more Rupees being sold to purchase foreign imports, which is Rupee-negative. At the same time, higher inflation usually leads to the Reserve Bank of India (RBI) raising interest rates and this can be positive for the Rupee, due to increased demand from international investors. The opposite effect is true of lower inflation.
- The Japanese Yen gained ground after comments from BoJ board member Seiji Adachi on Wednesday.
- Adachi suggested that it might be appropriate to raise rates if a weaker JPY leads to heightened inflation.
- Hawkish remarks from Minneapolis Fed President Neel Kashkari fueled risk aversion sentiment, bolstering the US Dollar.
The Japanese Yen (JPY) snapped recent losses on Thursday, spurred by comments from Bank of Japan (BoJ) board member Seiji Adachi on Wednesday. Adachi emphasized the gradual reduction of bond purchases to ensure that long-term yields accurately reflect market signals. Additionally, he suggested that raising interest rates could be appropriate if a weaker JPY leads to increased inflation, per Reuters
Traders have increased bets on the Bank of Japan (BoJ) implementing another interest rate hike. Investors are now turning their attention to Tokyo's inflation data scheduled for release on Friday, which is seen as a key indicator of nationwide price trends.
Hawkish remarks from Minneapolis Fed President Neel Kashkari further fueled concerns about potential rate hikes, sustaining the significant yield gap between the US and Japan. This environment continues to foster JPY carry trades, where investors leverage low-interest Japanese Yen to invest in higher-yielding US Dollar assets.
The US Dollar (USD) strengthened on account of elevated US Treasury yields, partly driven by increased risk aversion ahead of the release of US Gross Domestic Product Annualized (Q1) data on Thursday. Additionally, market participants will likely observe the Core Personal Consumption Expenditures (PCE) Price Index data scheduled for Friday, which are anticipated to offer insights into the Federal Reserve's potential stance on interest rate adjustments.
Daily Digest Market Movers: Japanese Yen rebounds due to dovish comments from Fed’s Bostic
- According to Bloomberg, Federal Reserve Bank of Atlanta President Raphael Bostic stated on Thursday that the path of inflation is expected to be uneven, and a decrease in inflation breadth would bolster confidence in the necessity of a rate cut.
- On Wednesday, the Fed Beige Book report covering the period from April to mid-May showed that national economic activity experienced slight growth, with mixed conditions across industries and districts. The report also indicated that employment rose slightly, wage growth was moderate, and prices increased modestly as consumers resisted further price hikes.
- Reuters reported that Neel Kashkari, President of the Federal Reserve Bank of Minneapolis, hinted at the possibility of a rate hike. Kashkari remarked, “I don’t believe anyone has completely ruled out the option of increasing rates,” expressing doubts about the disinflationary trend and projecting only two rate cuts.
- On Tuesday, the US Housing Price Index (MoM) for March was underperforming, with March's number coming in at 0.1% against 1.2% for February, where 0.5% was expected.
- Japan's Weighted Median Inflation Index, a significant gauge of the country’s trend inflation, increased by 1.1% in April. This growth rate represents a slowdown from the 1.3% increase recorded in March.
- Japan’s Corporate Service Price Index (CSPI). The index posted a year-over-year reading of 2.8% in April, surpassing expectations of 2.3% and marking its fastest rate of increase since March 2015.
- Japan Finance Minister Shun'ichi Suzuki on Tuesday, emphasized the importance of currencies moving in a stable manner that reflects fundamentals, stating that he is closely monitoring foreign exchange (FX) movements. However, Suzuki refrained from commenting on whether Japan has conducted currency intervention.
Technical Analysis: USD/JPY remains below 157.50
The USD/JPY pair trades around 157.30 on Thursday. The daily chart shows a rising channel pattern, indicating the continuation of an upward trend in the market. Additionally, the 14-day Relative Strength Index (RSI) remains above 50, confirming a bullish bias.
The USD/JPY pair may potentially test the psychological level of 158.00, which aligns with the upper boundary of the rising channel. If this level is breached, the next target could be 160.32, marking its highest point in over thirty years.
On the downside, the immediate support appears at the psychological level of 157.00, followed by the nine-day Exponential Moving Average (EMA) at 156.90. Further decline in the USD/JPY pair could apply downward pressure, potentially testing the lower boundary of the rising channel.
USD/JPY: Daily Chart
Japanese Yen price today
The table below shows the percentage change of the Japanese Yen (JPY) against listed major currencies today. Japanese Yen was the strongest against the New Zealand Dollar.
| USD | EUR | GBP | CAD | AUD | JPY | NZD | CHF | |
| USD | 0.05% | 0.04% | 0.06% | 0.10% | -0.16% | 0.15% | 0.05% | |
| EUR | -0.05% | -0.01% | 0.03% | 0.04% | -0.19% | 0.11% | -0.02% | |
| GBP | -0.03% | 0.01% | 0.04% | 0.05% | -0.19% | 0.11% | -0.01% | |
| CAD | -0.06% | -0.01% | -0.02% | 0.03% | -0.21% | 0.10% | -0.03% | |
| AUD | -0.09% | -0.04% | -0.05% | -0.02% | -0.23% | 0.08% | -0.06% | |
| JPY | 0.14% | 0.20% | 0.17% | 0.20% | 0.25% | 0.28% | 0.17% | |
| NZD | -0.15% | -0.11% | -0.13% | -0.09% | -0.08% | -0.31% | -0.15% | |
| CHF | -0.03% | 0.02% | 0.01% | 0.04% | 0.07% | -0.18% | 0.12% |
The heat map shows percentage changes of major currencies against each other. The base currency is picked from the left column, while the quote currency is picked from the top row. For example, if you pick the Euro from the left column and move along the horizontal line to the Japanese Yen, the percentage change displayed in the box will represent EUR (base)/JPY (quote).
Japanese Yen FAQs
The Japanese Yen (JPY) is one of the world’s most traded currencies. Its value is broadly determined by the performance of the Japanese economy, but more specifically by the Bank of Japan’s policy, the differential between Japanese and US bond yields, or risk sentiment among traders, among other factors.
One of the Bank of Japan’s mandates is currency control, so its moves are key for the Yen. The BoJ has directly intervened in currency markets sometimes, generally to lower the value of the Yen, although it refrains from doing it often due to political concerns of its main trading partners. The current BoJ ultra-loose monetary policy, based on massive stimulus to the economy, has caused the Yen to depreciate against its main currency peers. This process has exacerbated more recently due to an increasing policy divergence between the Bank of Japan and other main central banks, which have opted to increase interest rates sharply to fight decades-high levels of inflation.
The BoJ’s stance of sticking to ultra-loose monetary policy has led to a widening policy divergence with other central banks, particularly with the US Federal Reserve. This supports a widening of the differential between the 10-year US and Japanese bonds, which favors the US Dollar against the Japanese Yen.
The Japanese Yen is often seen as a safe-haven investment. This means that in times of market stress, investors are more likely to put their money in the Japanese currency due to its supposed reliability and stability. Turbulent times are likely to strengthen the Yen’s value against other currencies seen as more risky to invest in.
Reserve Bank of Australia (RBA) Chief Economist Sarah Hunter said early Thursday that “we agree with the Treasury forecast on inflation.”
Additional comments
CPI confirmed there was strength in some price sectors.
The RBA Board is clearly focused on inflation staying out of the band, clearly there is strength in inflation.
Wages growth in around its peak.
Market reaction
AUD/USD was last seen trading at 6607, down 0.06% on the day.
People’s Bank of China’s deputy governor said on Thursday that they “will coordinate the relationship between short-term tasks and long-term goals, stable growth and risk prevention, and internal and external balances.”
Additional quotes
Will accelerate implementation and effectiveness of relending facility for science and technology innovation.
Will promote trade and investment facilitation.
Will support development of offshore Yuan market.
Will support small- and medium-sized tech firms' first-time loans and equipment upgrades in key areas with big efforts.
Will establish and improve financial infrastructure, improve service capacity of yuan cross-border interbank payment system.
Will strengthen the supervision of cross border Yuan business.
Will make financial markets more transparent, rule-based and predictable, and increase the liquidity yuan financial assets.
Will support more foreign central banks, international development institutions and multinational enterprises in issuing panda bonds in China.
Related reads
| Raw materials | Closed | Change, % |
|---|---|---|
| Silver | 31.953 | -0.48 |
| Gold | 2338.17 | -1 |
| Palladium | 957.55 | -2.61 |
- The Australian Dollar gains ground as the Aussie 10-year Government Bond Yield reaches a four-week high of 4.52%.
- Australia’s Private Capital Expenditure rose 1.0% in Q1, surpassing the expected 0.5% rise.
- The US Dollar’s strength is reinforced as Treasury yields appreciate on risk aversion.
The Australian Dollar (AUD) rebounded on Thursday, possibly driven by the Australian 10-year Government Bond Yield increase to a four-week high of 4.52%. This shift reflects investor sentiment that the Reserve Bank of Australia (RBA) will maintain higher interest rates for longer. Additionally, the AUD might gain ground as one of its largest trading partners, China, has lifted bans on beef shipments from five major Australian meat producers.
Australia's Monthly Consumer Price Index, released on Wednesday, showed robust figures that could prompt the RBA to consider another rate hike. The minutes from the RBA's May policy meeting suggested that the central bank had contemplated a potential interest rate increase.
The US Dollar Index (DXY), which measures the USD against six major currencies, trades higher around 105.10, with 2-year and 10-year US Treasury yields at 4.98% and 4.61%, respectively, at the time of reporting. Risk aversion sentiment supports the US Dollar (USD), limiting the advances of the AUD/USD pair.
On Wednesday, the Fed Beige Book report covering the period from April to mid-May showed that national economic activity experienced slight growth, with mixed conditions across industries and districts. The report also indicated that employment rose slightly, wage growth was moderate, and prices increased modestly as consumers resisted further price hikes.
Daily Digest Market Movers: Australian Dollar appreciates as RBA’s Hunter concerns about inflation
- RBA Assistant Governor (Economic) Sarah Hunter stated that they concur with the Treasury's inflation forecast. The CPI data indicates strength in certain price sectors. The RBA Board is clearly concerned about inflation remaining above the target range, suggesting persistent inflationary pressure. Wages growth appears to be near its peak.
- According to the CME FedWatch Tool, the likelihood of the Federal Reserve implementing a 25 basis-point rate cut in September decreased to 41.7%, down from 49.4% a week earlier.
- Australia’s Monthly Consumer Price Index rose 3.6% year-over-year in April, surpassing the expected reading of 3.4% and the previous reading of 3.5%.
- On Tuesday, Neel Kashkari, President of the Federal Reserve Bank of Minneapolis, suggested that a rate hike might still be possible. Kashkari stated, “I don’t think anybody has totally taken rate increases off the table,” and expressed uncertainty about the disinflationary process, predicting only two rate cuts, per MSN.
- US Housing Price Index (MoM) for March was underperforming, with March's number coming in at 0.1% against 1.2% for February, where 0.5% was expected.
- Australia's Retail Sales (MoM) rose by 0.1% in April, swinging from the previous 0.4% decline. This growth fell short of market expectations of 0.2%.
Technical Analysis: Australian Dollar could test the key level of 0.6600
The Australian Dollar trades around 0.6610 on Thursday. An analysis of the daily chart suggests the weakening of a bullish bias for the AUD/USD pair, as it has broken below the lower boundary of a rising wedge. The 14-day Relative Strength Index (RSI) is positioned on the 51 level, further decline may confirm the momentum shift.
The AUD/USD pair could potentially move back into the rising wedge to target the four-month high of 0.6714, followed by the upper limit of the rising wedge around 0.6740.
On the downside, the immediate support appears at the psychological level of 0.6600, followed by the 50-day Exponential Moving Average (EMA) at 0.6584. A further decline could exert downward pressure on the AUD/USD pair, potentially driving it toward the throwback support region at 0.6470.
AUD/USD: Daily Chart
Australian Dollar price today
The table below shows the percentage change of the Australian Dollar (AUD) against listed major currencies today. The Australian Dollar was the strongest against the Swiss Franc.
| USD | EUR | GBP | CAD | AUD | JPY | NZD | CHF | |
| USD | 0.03% | -0.01% | -0.01% | 0.01% | -0.12% | 0.08% | 0.10% | |
| EUR | -0.03% | -0.04% | -0.02% | -0.03% | -0.14% | 0.05% | 0.06% | |
| GBP | 0.02% | 0.04% | 0.03% | 0.00% | -0.10% | 0.10% | 0.10% | |
| CAD | -0.01% | 0.02% | -0.02% | -0.01% | -0.12% | 0.07% | 0.08% | |
| AUD | 0.00% | 0.03% | -0.01% | 0.01% | -0.10% | 0.08% | 0.09% | |
| JPY | 0.10% | 0.14% | 0.07% | 0.09% | 0.12% | 0.18% | 0.19% | |
| NZD | -0.08% | -0.04% | -0.09% | -0.08% | -0.09% | -0.18% | 0.01% | |
| CHF | -0.08% | -0.06% | -0.10% | -0.08% | -0.08% | -0.20% | -0.01% |
The heat map shows percentage changes of major currencies against each other. The base currency is picked from the left column, while the quote currency is picked from the top row. For example, if you pick the Euro from the left column and move along the horizontal line to the Japanese Yen, the percentage change displayed in the box will represent EUR (base)/JPY (quote).
Australian Dollar FAQs
One of the most significant factors for the Australian Dollar (AUD) is the level of interest rates set by the Reserve Bank of Australia (RBA). Because Australia is a resource-rich country another key driver is the price of its biggest export, Iron Ore. The health of the Chinese economy, its largest trading partner, is a factor, as well as inflation in Australia, its growth rate and Trade Balance. Market sentiment – whether investors are taking on more risky assets (risk-on) or seeking safe-havens (risk-off) – is also a factor, with risk-on positive for AUD.
The Reserve Bank of Australia (RBA) influences the Australian Dollar (AUD) by setting the level of interest rates that Australian banks can lend to each other. This influences the level of interest rates in the economy as a whole. The main goal of the RBA is to maintain a stable inflation rate of 2-3% by adjusting interest rates up or down. Relatively high interest rates compared to other major central banks support the AUD, and the opposite for relatively low. The RBA can also use quantitative easing and tightening to influence credit conditions, with the former AUD-negative and the latter AUD-positive.
China is Australia’s largest trading partner so the health of the Chinese economy is a major influence on the value of the Australian Dollar (AUD). When the Chinese economy is doing well it purchases more raw materials, goods and services from Australia, lifting demand for the AUD, and pushing up its value. The opposite is the case when the Chinese economy is not growing as fast as expected. Positive or negative surprises in Chinese growth data, therefore, often have a direct impact on the Australian Dollar and its pairs.
Iron Ore is Australia’s largest export, accounting for $118 billion a year according to data from 2021, with China as its primary destination. The price of Iron Ore, therefore, can be a driver of the Australian Dollar. Generally, if the price of Iron Ore rises, AUD also goes up, as aggregate demand for the currency increases. The opposite is the case if the price of Iron Ore falls. Higher Iron Ore prices also tend to result in a greater likelihood of a positive Trade Balance for Australia, which is also positive of the AUD.
The Trade Balance, which is the difference between what a country earns from its exports versus what it pays for its imports, is another factor that can influence the value of the Australian Dollar. If Australia produces highly sought after exports, then its currency will gain in value purely from the surplus demand created from foreign buyers seeking to purchase its exports versus what it spends to purchase imports. Therefore, a positive net Trade Balance strengthens the AUD, with the opposite effect if the Trade Balance is negative.
New Zealand (NZ) Finance Minister Nicola Willis presented the government’s annual Budget report for 2024, with key highlights enlisted below.
NZ sees 2023/24 operating balance before gains, losses NZ$-11.07 bln (HYEFU NZ$-9.32 bln).
NZ sees 2024/25 GDP 1.7% (HYEFU 1.5%).
NZ government forecasts return to obegal surplus in 2027/28 (HYEFU 2026/27).
NZ sees 2023/24 net debt 43.1% of GDP (HYEFU 43.5%).
NZ unemployment rate seen at 5.2% in 2024/25 (hyefu 5.2%).
Determined to return obegal to surplus in 2027-28.
Tax relief fully funded from savings, revenue initiatives.
NZ treasury sees NZ GDP contracting in H1 2024, growth in H2 2024.
NZ treasury sees inflation falling to below 3% in Q3 2024, to 2% around 2026.
Separately, New Zelanad’s Debt Management Office (DMO) said that the 2024/25 gross bond issuance increases to NZ$38 bln from NZ$36 bln in half-year update.
The NZ DMO planned gross bond issuance for four years to June 2028 now totals NZ$126 bln up from NZ$114 bln in half year update.
Market reaction
New Zealand Dollar paid little heed to the Budget release, with NZD/USD lurking flat near 0.6100 at the press time.
New Zealand Dollar FAQs
The New Zealand Dollar (NZD), also known as the Kiwi, is a well-known traded currency among investors. Its value is broadly determined by the health of the New Zealand economy and the country’s central bank policy. Still, there are some unique particularities that also can make NZD move. The performance of the Chinese economy tends to move the Kiwi because China is New Zealand’s biggest trading partner. Bad news for the Chinese economy likely means less New Zealand exports to the country, hitting the economy and thus its currency. Another factor moving NZD is dairy prices as the dairy industry is New Zealand’s main export. High dairy prices boost export income, contributing positively to the economy and thus to the NZD.
The Reserve Bank of New Zealand (RBNZ) aims to achieve and maintain an inflation rate between 1% and 3% over the medium term, with a focus to keep it near the 2% mid-point. To this end, the bank sets an appropriate level of interest rates. When inflation is too high, the RBNZ will increase interest rates to cool the economy, but the move will also make bond yields higher, increasing investors’ appeal to invest in the country and thus boosting NZD. On the contrary, lower interest rates tend to weaken NZD. The so-called rate differential, or how rates in New Zealand are or are expected to be compared to the ones set by the US Federal Reserve, can also play a key role in moving the NZD/USD pair.
Macroeconomic data releases in New Zealand are key to assess the state of the economy and can impact the New Zealand Dollar’s (NZD) valuation. A strong economy, based on high economic growth, low unemployment and high confidence is good for NZD. High economic growth attracts foreign investment and may encourage the Reserve Bank of New Zealand to increase interest rates, if this economic strength comes together with elevated inflation. Conversely, if economic data is weak, NZD is likely to depreciate.
The New Zealand Dollar (NZD) tends to strengthen during risk-on periods, or when investors perceive that broader market risks are low and are optimistic about growth. This tends to lead to a more favorable outlook for commodities and so-called ‘commodity currencies’ such as the Kiwi. Conversely, NZD tends to weaken at times of market turbulence or economic uncertainty as investors tend to sell higher-risk assets and flee to the more-stable safe havens.
Swiss National Bank (SNB) Thomas Jordan said early Thursday that there is a small upward risk to the bank's inflation forecast.
“There are reasons to believe that the natural rate of interest has increased or may well rise,” Jordan added.
Additional quotes
Weaker Ffranc is currently the most likely source of higher Swiss inflation.
The Bank could counteract this by “selling foreign exchange.
Market reaction
NZD/USD keeps its range below 0.9150 on these comments, up 0.07% on the day.
New Zealand Dollar PRICE Today
The table below shows the percentage change of New Zealand Dollar (NZD) against listed major currencies today. New Zealand Dollar was the strongest against the Swiss Franc.
| USD | EUR | GBP | JPY | CAD | AUD | NZD | CHF | |
|---|---|---|---|---|---|---|---|---|
| USD | 0.02% | 0.03% | -0.16% | 0.02% | -0.02% | 0.16% | 0.08% | |
| EUR | -0.02% | 0.00% | -0.15% | 0.03% | -0.03% | 0.11% | 0.06% | |
| GBP | -0.03% | -0.01% | -0.18% | -0.03% | -0.06% | 0.11% | 0.05% | |
| JPY | 0.16% | 0.15% | 0.18% | 0.15% | 0.13% | 0.24% | 0.24% | |
| CAD | -0.02% | -0.03% | 0.03% | -0.15% | -0.02% | 0.13% | 0.07% | |
| AUD | 0.02% | 0.03% | 0.06% | -0.13% | 0.02% | 0.15% | 0.09% | |
| NZD | -0.16% | -0.11% | -0.11% | -0.24% | -0.13% | -0.15% | -0.05% | |
| CHF | -0.08% | -0.06% | -0.05% | -0.24% | -0.07% | -0.09% | 0.05% |
The heat map shows percentage changes of major currencies against each other. The base currency is picked from the left column, while the quote currency is picked from the top row. For example, if you pick the New Zealand Dollar from the left column and move along the horizontal line to the US Dollar, the percentage change displayed in the box will represent NZD (base)/USD (quote).
The People’s Bank of China (PBoC) set the USD/CNY central rate for the trading session ahead on Thursday at 7.1111, as against the previous day's fix of 7.1106 and 7.2663 Reuters estimates.
- Gold price loses traction in Thursday’s Asian session.
- The downtick of yellow metal is backed by the stronger USD and higher US yields.
- Gold traders await the US Q1 GDP data for fresh impetus and monitor the Middle East geopolitical risks.
Gold price (XAU/USD) trades in negative territory on Thursday, supported by the firmer US Dollar (USD) and higher US yields. The diminishing expectation of the Federal Reserve's (Fed) rate cut in September exerts some selling pressure on the precious metal as it will increase gold's opportunity costs.
Investors will monitor the second estimate of the US Gross Domestic Product (GDP) for Q1 2024 on Thursday. In the event that the US economy shows a stronger-than-expected reading, this might further lift the USD and weigh on the USD-denominated gold price. Nonetheless, the ongoing geopolitical tensions in the Middle East might boost traditional safe-haven assets like gold. Also, the rising demand from the central bank might cap the downside for yellow metal in the near term.
Daily Digest Market Movers: Gold price remains vulnerable amid stronger US data
- The Israeli military said on Wednesday that it established “operational control” over the Philadelphi Corridor, a 14-kilometer (8.7 miles) strip of land along the border between Gaza and Egypt, per CNN.
- Global physically-backed gold Exchange-Traded Funds (ETFs) witnessed a net outflow of 11.3 metric tonnes last week, according to the World Gold Council.
- Fed Atlanta President Bostic said on Thursday that the breadth of price gains is still significant, but less inflation breadth would add to confidence for a rate cut.
- Economic activity continued to expand in the US and prices increased modestly from early April to mid-May. Overall outlooks were more pessimistic amid reports of rising uncertainty and greater downside risks, according to the Fed's Beige Book released Wednesday.
- Markets are pricing in a 50% chance that the Fed will hold interest rates in September, according to the CME FedWatch Tool.
- The US Gross Domestic Product (GDP) number is estimated to expand at a 1.3% annual pace in the first quarter of 2024.
Technical analysis: Gold price keeps the bullish vibe in the long term
The gold price trades with negative bias on the day. According to the 1-hour chart, the precious metal stays bullish above the key 100-day Exponential Moving Average (EMA). However, the further consolidation or directionlessness of the yellow metal cannot be ruled out as the 14-day Relative Strength Index (RSI) hovers around the 50-midline, indicating a neutral level between bullish and bearish positions.
Extended gains above the upper boundary of the Bollinger Band at $2,425 might visit the all-time high of $2,450. An upside breakout above the mentioned level will pave the way to the $2,500 psychological mark.
On the downside, the first downside target of XAU/USD is located at a low of May 24 at $2,325. The potential support level will emerge at the $2,300 figure. A breach of this level will see a drop to the lower limit of the Bollinger Band at $2,284, followed by the 100-day EMA of $2,227.
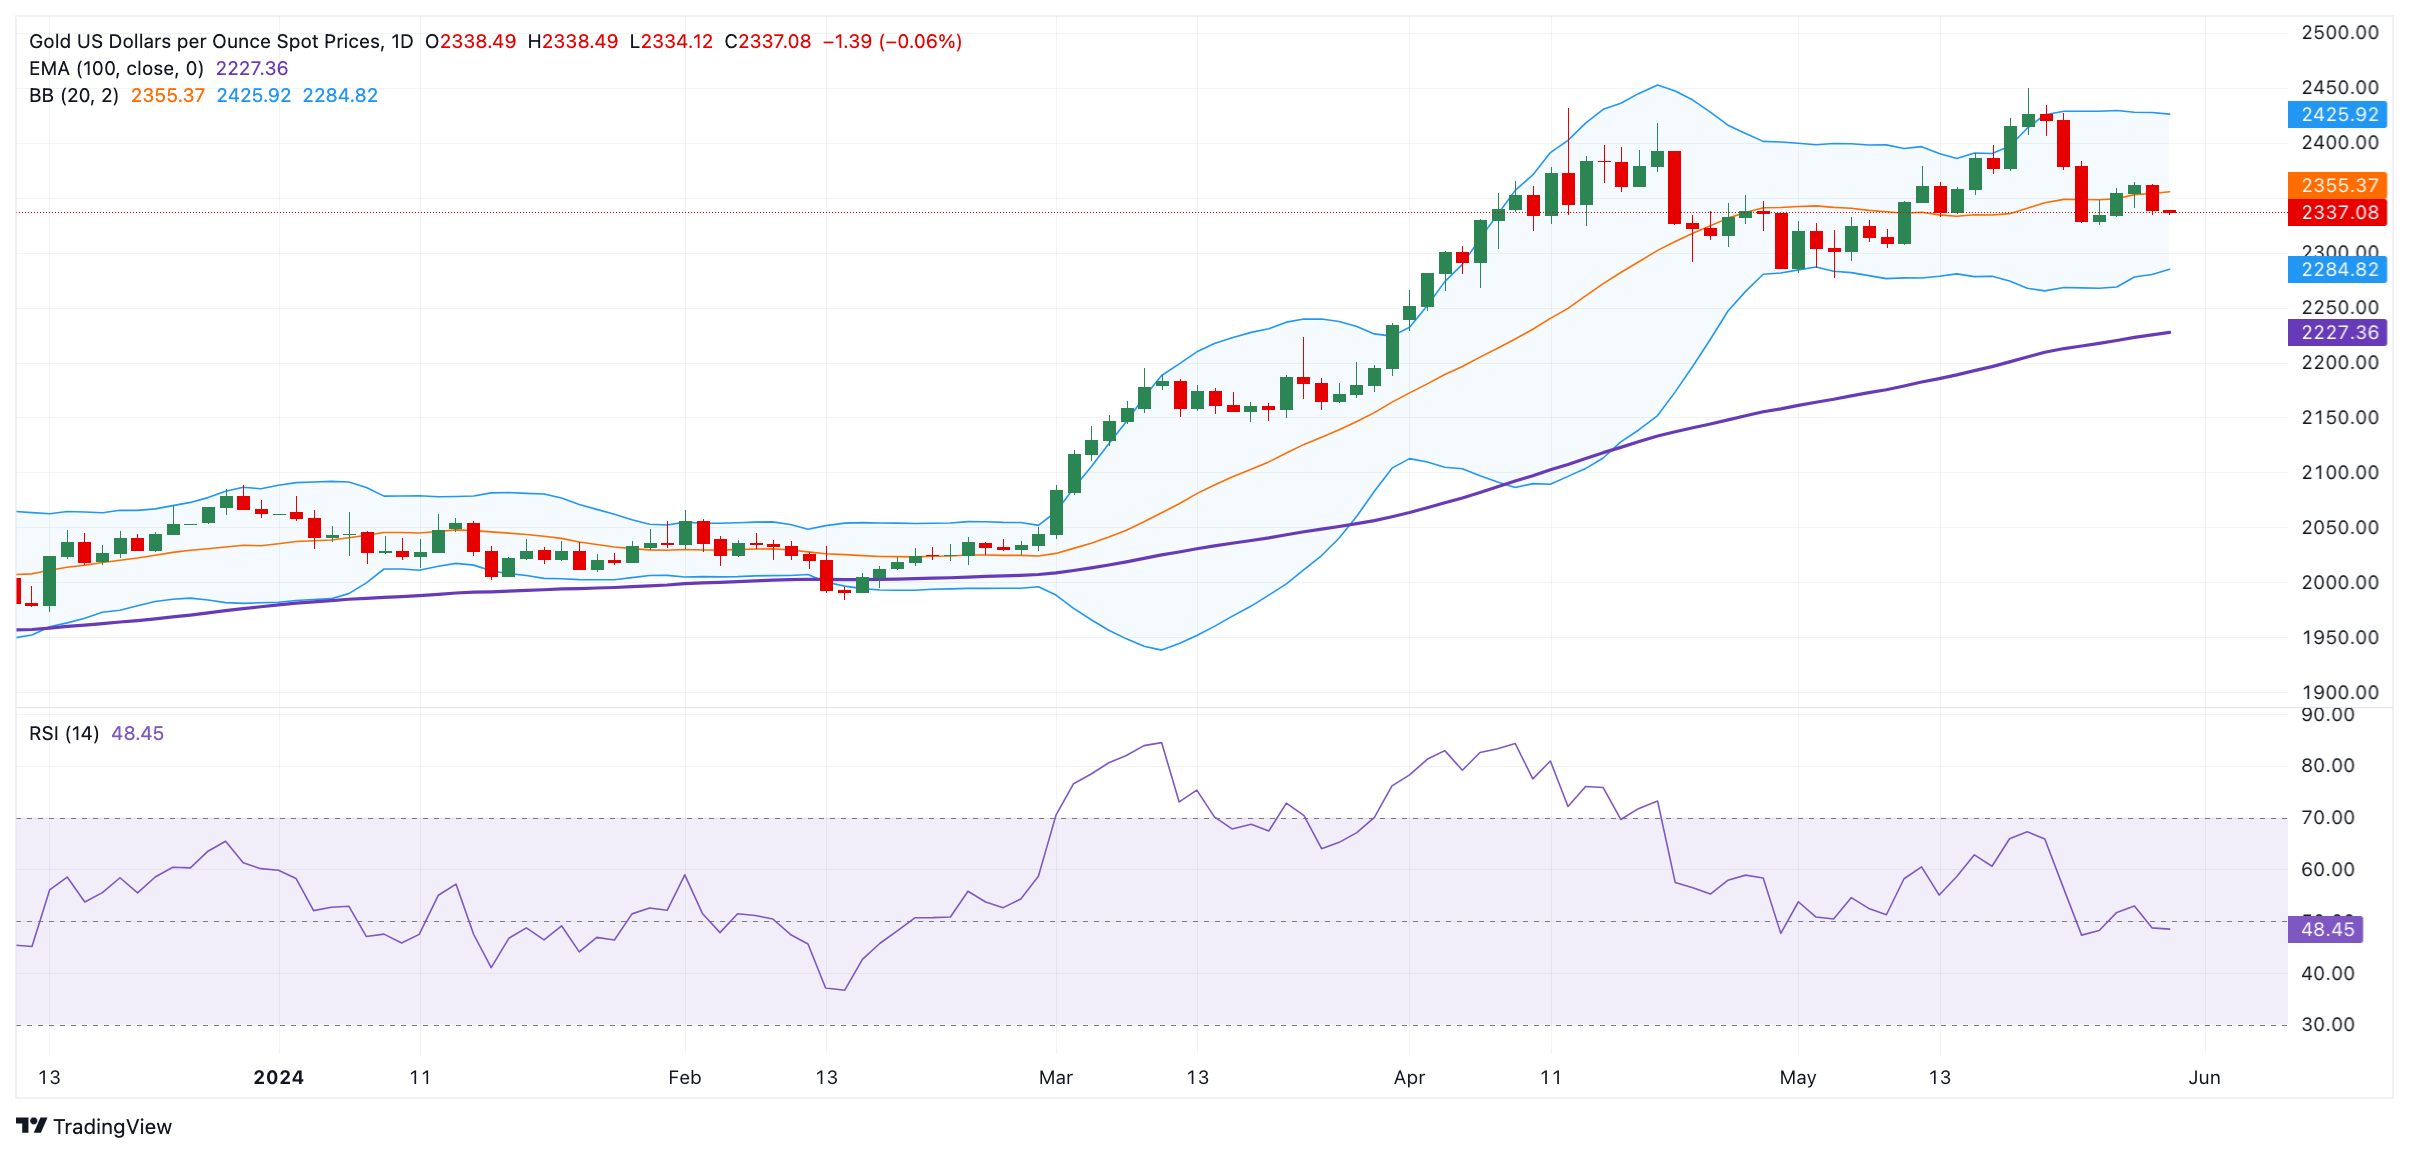
US Dollar price today
The table below shows the percentage change of US Dollar (USD) against listed major currencies today. US Dollar was the strongest against the New Zealand Dollar.
| USD | EUR | GBP | CAD | AUD | JPY | NZD | CHF | |
| USD | 0.04% | 0.01% | -0.01% | 0.01% | -0.14% | 0.06% | 0.04% | |
| EUR | -0.03% | -0.03% | -0.03% | -0.04% | -0.18% | 0.03% | 0.00% | |
| GBP | -0.01% | 0.03% | 0.00% | -0.02% | -0.15% | 0.06% | 0.02% | |
| CAD | 0.00% | 0.04% | 0.01% | -0.02% | -0.13% | 0.06% | 0.03% | |
| AUD | 0.00% | 0.05% | 0.02% | 0.01% | -0.13% | 0.06% | 0.04% | |
| JPY | 0.13% | 0.17% | 0.14% | 0.14% | 0.18% | 0.19% | 0.15% | |
| NZD | -0.08% | -0.03% | -0.06% | -0.07% | -0.08% | -0.19% | -0.03% | |
| CHF | -0.02% | 0.00% | -0.02% | -0.03% | -0.04% | -0.18% | 0.04% |
The heat map shows percentage changes of major currencies against each other. The base currency is picked from the left column, while the quote currency is picked from the top row. For example, if you pick the Euro from the left column and move along the horizontal line to the Japanese Yen, the percentage change displayed in the box will represent EUR (base)/JPY (quote).
Gold FAQs
Gold has played a key role in human’s history as it has been widely used as a store of value and medium of exchange. Currently, apart from its shine and usage for jewelry, the precious metal is widely seen as a safe-haven asset, meaning that it is considered a good investment during turbulent times. Gold is also widely seen as a hedge against inflation and against depreciating currencies as it doesn’t rely on any specific issuer or government.
Central banks are the biggest Gold holders. In their aim to support their currencies in turbulent times, central banks tend to diversify their reserves and buy Gold to improve the perceived strength of the economy and the currency. High Gold reserves can be a source of trust for a country’s solvency. Central banks added 1,136 tonnes of Gold worth around $70 billion to their reserves in 2022, according to data from the World Gold Council. This is the highest yearly purchase since records began. Central banks from emerging economies such as China, India and Turkey are quickly increasing their Gold reserves.
Gold has an inverse correlation with the US Dollar and US Treasuries, which are both major reserve and safe-haven assets. When the Dollar depreciates, Gold tends to rise, enabling investors and central banks to diversify their assets in turbulent times. Gold is also inversely correlated with risk assets. A rally in the stock market tends to weaken Gold price, while sell-offs in riskier markets tend to favor the precious metal.
The price can move due to a wide range of factors. Geopolitical instability or fears of a deep recession can quickly make Gold price escalate due to its safe-haven status. As a yield-less asset, Gold tends to rise with lower interest rates, while higher cost of money usually weighs down on the yellow metal. Still, most moves depend on how the US Dollar (USD) behaves as the asset is priced in dollars (XAU/USD). A strong Dollar tends to keep the price of Gold controlled, whereas a weaker Dollar is likely to push Gold prices up.
- New Zealand prepares for the latest NZ government budget announcement.
- NZ’s Fiscal Strategy Report will release alongside NZ’s updated budget.
- Investors will keep an eye out for key US data to cap off the trading week.
NZD/USD is on the soft side as markets pivot to Thursday’s early Pacific trading session, with the pair drifting into the 0.6100 region as the New Zealand government prepares to release its budget outline for the 2024 fiscal year alongside an updated Fiscal Strategy Report. New Zealand’s budget outline for 2024 will be announced by Minister of Finance Hon. Nicola Willis around 02:00 GMT.
According to analysts from Goldman Sachs, the NZD has been bolstered by a recent rise in dairy prices, but things could turn sour for the Kiwi if traders poke holes in the NZ government budget for 2024. Thursday’s joint budget and Financial Strategy Report follow up on the Budget Policy Statement for 2024 released in March.
Economic Indicator
Looking ahead, Reserve Bank of New Zealand (RBNZ) Governor Orr will appear early Friday, and broader markets will pivot to face key US Gross Domestic Product (GDP) growth figures and US Personal Consumption Expenditures (PCE) Price Index inflation.
US Annualized Q1 GDP, slated for Thursday, is forecast to ease to 1.3% versus the previous print of 1.6%, and Core PCE Price Index inflation on Friday is expected to hold steady at 0.3% MoM in April. With investors desperate for signs of future rate cuts from the Federal Reserve (Fed), investors will be looking for signs of further easing in the US economy and cooling inflation figures.
According to the CME’s FedWatch Tool, rate markets are pricing in slightly-worse-than-even odds of at least a quarter-point Fed rate trim in September, down sharply from the 70% odds that were priced in a week and a half ago. With the US economy still outperforming expectations, a still-tight labor market, and inflation still running hotter for longer than expected, rate-cut-hungry investors are hoping for signs of economic underperformance to bolster chances of at least two rate cuts in 2024 from the Fed.
NZD/USD technical outlook
NZD/USD is trading down in the early Thursday market session, drifting towards the 0.6100 handle as broad-market Greeback strength forces down the Kiwi. The pair is heading lower for a third consecutive trading day, and bearish momentum will drag NZD/USD into the 200-day Exponential Moving Average (EMA) at 0.6077.
Despite near-term bearishness, the pair is still trading up from the last swing low into 0.5850 in April, and it’s buyers’ game to lose with the pair making little progress on the high side of key technical levels.
NZD/USD hourly chart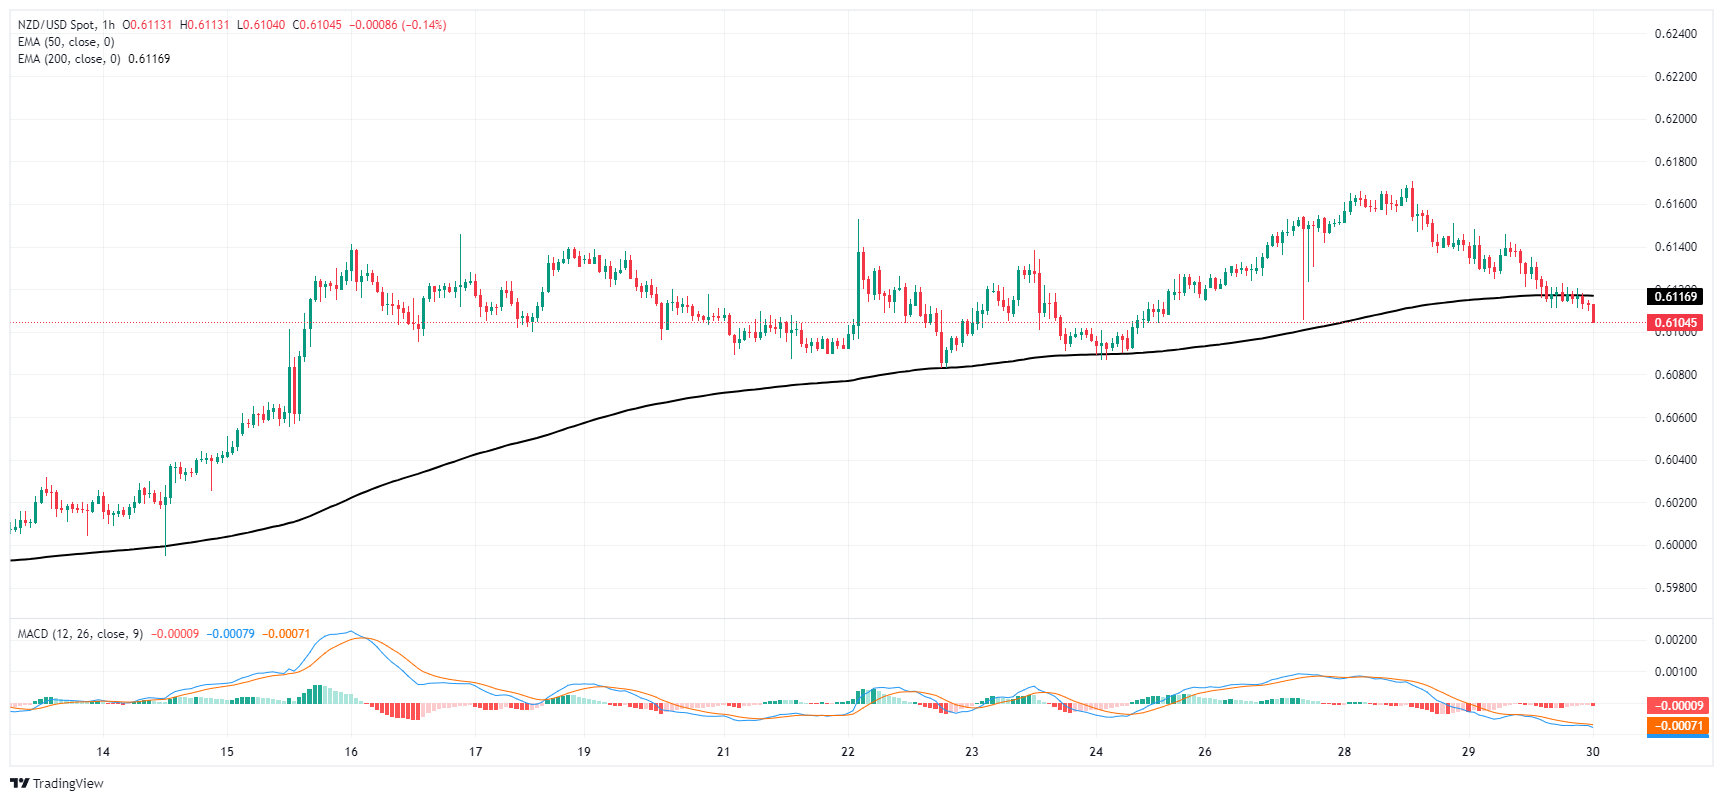
NZD/USD daily chart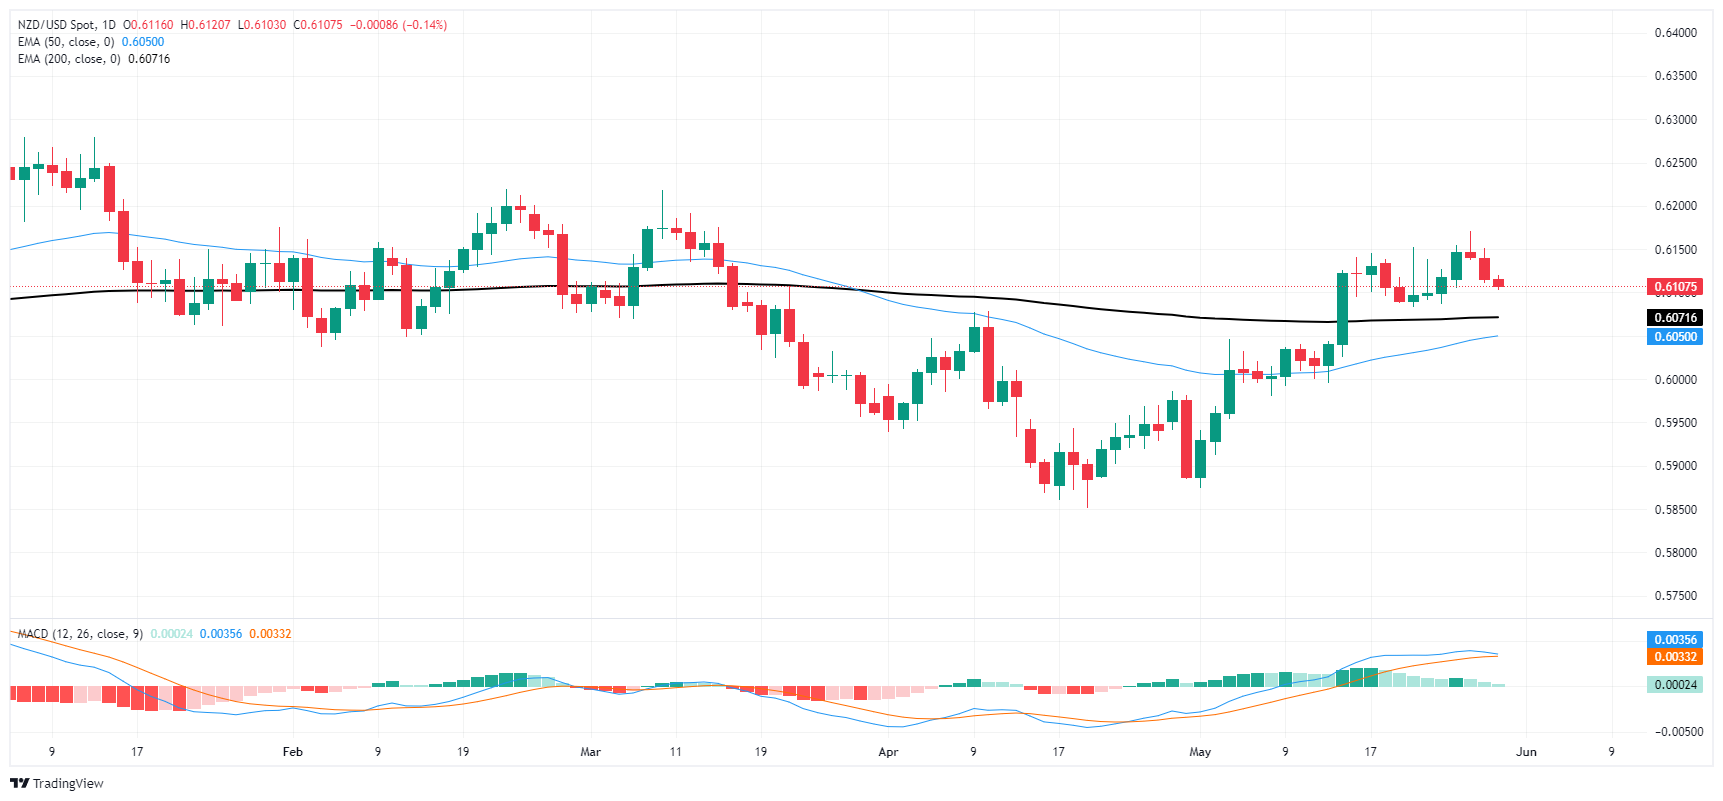
| Index | Change, points | Closed | Change, % |
|---|---|---|---|
| NIKKEI 225 | -298.5 | 38556.87 | -0.77 |
| Hang Seng | -344.15 | 18477.01 | -1.83 |
| KOSPI | -45.55 | 2677.3 | -1.67 |
| ASX 200 | -101.1 | 7665.6 | -1.3 |
| DAX | -204.58 | 18473.29 | -1.1 |
| CAC 40 | -122.77 | 7935.03 | -1.52 |
| Dow Jones | -411.32 | 38441.54 | -1.06 |
| S&P 500 | -39.09 | 5266.95 | -0.74 |
| NASDAQ Composite | -99.3 | 16920.58 | -0.58 |
| Pare | Closed | Change, % |
|---|---|---|
| AUDUSD | 0.66112 | -0.57 |
| EURJPY | 170.245 | -0.23 |
| EURUSD | 1.08028 | -0.51 |
| GBPJPY | 200.187 | -0.19 |
| GBPUSD | 1.27033 | -0.46 |
| NZDUSD | 0.6115 | -0.41 |
| USDCAD | 1.37144 | 0.5 |
| USDCHF | 0.91297 | 0.08 |
| USDJPY | 157.585 | 0.27 |
Federal Reserve Bank of Atlanta President Bostic said on Thursday that the inflation path will be bumpy and less inflation breadth would add to confidence for a rate cut.
Key quotes
Inflation path will be bumpy.
General inflation trend is down.
Path to 2% inflation is not assured.
Job market is tight, but not as much as it was.
Breadth of price gains still significant.
Less inflation breadth would add to confidence for a rate cut.
Market reaction
The US Dollar Index (DXY) is trading 0.01% higher on the day at 105.14, as of writing.
Fed FAQs
Monetary policy in the US is shaped by the Federal Reserve (Fed). The Fed has two mandates: to achieve price stability and foster full employment. Its primary tool to achieve these goals is by adjusting interest rates. When prices are rising too quickly and inflation is above the Fed’s 2% target, it raises interest rates, increasing borrowing costs throughout the economy. This results in a stronger US Dollar (USD) as it makes the US a more attractive place for international investors to park their money. When inflation falls below 2% or the Unemployment Rate is too high, the Fed may lower interest rates to encourage borrowing, which weighs on the Greenback.
The Federal Reserve (Fed) holds eight policy meetings a year, where the Federal Open Market Committee (FOMC) assesses economic conditions and makes monetary policy decisions. The FOMC is attended by twelve Fed officials – the seven members of the Board of Governors, the president of the Federal Reserve Bank of New York, and four of the remaining eleven regional Reserve Bank presidents, who serve one-year terms on a rotating basis.
In extreme situations, the Federal Reserve may resort to a policy named Quantitative Easing (QE). QE is the process by which the Fed substantially increases the flow of credit in a stuck financial system. It is a non-standard policy measure used during crises or when inflation is extremely low. It was the Fed’s weapon of choice during the Great Financial Crisis in 2008. It involves the Fed printing more Dollars and using them to buy high grade bonds from financial institutions. QE usually weakens the US Dollar.
Quantitative tightening (QT) is the reverse process of QE, whereby the Federal Reserve stops buying bonds from financial institutions and does not reinvest the principal from the bonds it holds maturing, to purchase new bonds. It is usually positive for the value of the US Dollar.


© 2000-2026. All rights reserved.
This site is managed by Teletrade D.J. LLC 2351 LLC 2022 (Euro House, Richmond Hill Road, Kingstown, VC0100, St. Vincent and the Grenadines).
The information on this website is for informational purposes only and does not constitute any investment advice.
The company does not serve or provide services to customers who are residents of the US, Canada, Iran, The Democratic People's Republic of Korea, Yemen and FATF blacklisted countries.
Making transactions on financial markets with marginal financial instruments opens up wide possibilities and allows investors who are willing to take risks to earn high profits, carrying a potentially high risk of losses at the same time. Therefore you should responsibly approach the issue of choosing the appropriate investment strategy, taking the available resources into account, before starting trading.
Use of the information: full or partial use of materials from this website must always be referenced to TeleTrade as the source of information. Use of the materials on the Internet must be accompanied by a hyperlink to teletrade.org. Automatic import of materials and information from this website is prohibited.
Please contact our PR department if you have any questions or need assistance at pr@teletrade.global.
transfers