- Analytics
- News and Tools
- Market News
CFD Markets News and Forecasts — 30-01-2025
- EUR/USD slumped back into the 1.0400 handle on Thursday.
- German data looms ahead on Friday, followed by key US inflation figures.
- Fiber traders wait to see if the Fed’s rate call this week was the right one.
EUR/USD shifted lower for a fourth consecutive trading day on Thursday, peaking near 1.0450 before softening to shed one-fifth of one percent on the day and ending just below the 1.0400 handle as the Euro’s near-term bull run draws to an end. A slate of German economic figures are due early Friday, followed by a key US inflation reading.
European Central Bank (ECB) President Christine Lagarde hit newswires during Thursday’s early US market session to soothe markets over the recent soft patch of European data, noting that a single month or quarter of souring data doesn’t necessarily mean a trend is being established. The ECB head may come to regret those remarks with German Retail Sales figures and Consumer Price Index (CPI) figures in the barrel for early Friday.
German Retail Sales are expected to hold steady at 2.5% YoY for the annualized period ending in December, while the MoM figure is expected to barely recover ground to 0.2% after November’s downside print of -0.6%. Headline German CPI inflation is likewise expected to hold steady at 2.6% for the year ended in December, holding frustratingly above the typical central bank targets of 2%.
US economic data was mixed on Thursday, leaving markets further confused. US Gross Domestic Product (GDP) growth for the fourth quarter of 2024 came in lower than expected, while weekly Initial Jobless Claims figures exceeded expectations and remained well within recent norms.
On Friday, US Personal Consumption Expenditure Price Index (PCEPI) inflation metrics will be released during the US market session. As the Federal Reserve’s (Fed) preferred method for measuring and tracking consumer-level inflation, this PCEPI report is likely to attract more attention than usual after the Fed boldly maintained interest rates earlier this week, despite President Trump’s strong objections.
EUR/USD price forecast
EUR/USD’s soft stance on Thursday marked another bearish rejection of the 50-day Exponential Moving Average (EMA) near 1.0450. The Fiber has soured for four consecutive sessions, leaving the pair on the low end of key technical levels as the latest bullish recover sputters.
The pair is still holding on the high side of the last major swing low into two-year bottoms south of 1.0200 reached earlier in the month. However, bulls are poised to fully run out of gas and drag the pair back into the 1.0300 region.
EUR/USD daily chart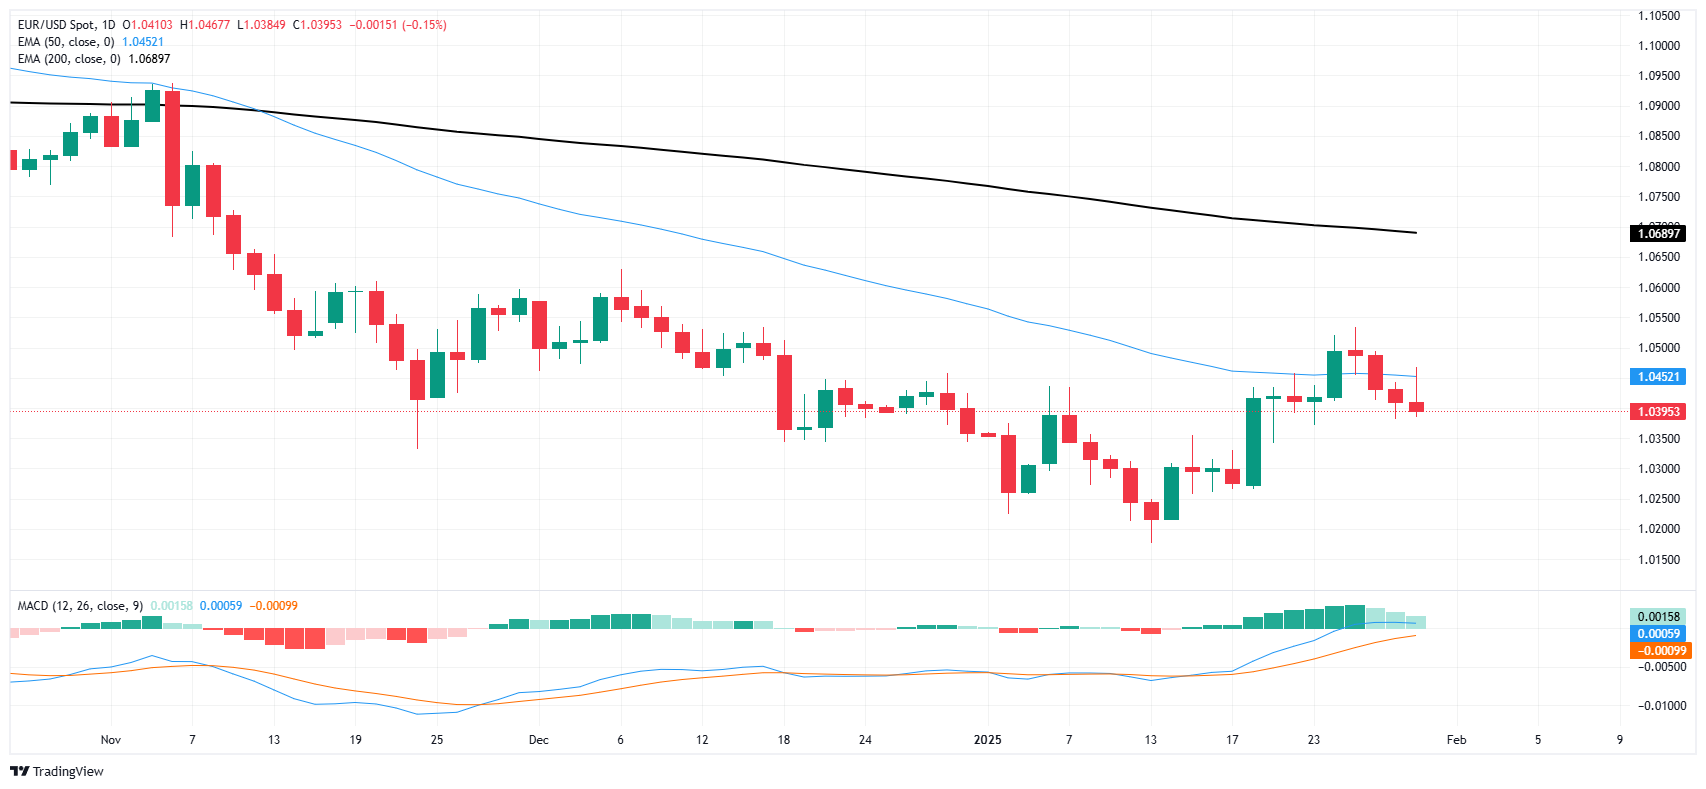
Euro FAQs
The Euro is the currency for the 19 European Union countries that belong to the Eurozone. It is the second most heavily traded currency in the world behind the US Dollar. In 2022, it accounted for 31% of all foreign exchange transactions, with an average daily turnover of over $2.2 trillion a day. EUR/USD is the most heavily traded currency pair in the world, accounting for an estimated 30% off all transactions, followed by EUR/JPY (4%), EUR/GBP (3%) and EUR/AUD (2%).
The European Central Bank (ECB) in Frankfurt, Germany, is the reserve bank for the Eurozone. The ECB sets interest rates and manages monetary policy. The ECB’s primary mandate is to maintain price stability, which means either controlling inflation or stimulating growth. Its primary tool is the raising or lowering of interest rates. Relatively high interest rates – or the expectation of higher rates – will usually benefit the Euro and vice versa. The ECB Governing Council makes monetary policy decisions at meetings held eight times a year. Decisions are made by heads of the Eurozone national banks and six permanent members, including the President of the ECB, Christine Lagarde.
Eurozone inflation data, measured by the Harmonized Index of Consumer Prices (HICP), is an important econometric for the Euro. If inflation rises more than expected, especially if above the ECB’s 2% target, it obliges the ECB to raise interest rates to bring it back under control. Relatively high interest rates compared to its counterparts will usually benefit the Euro, as it makes the region more attractive as a place for global investors to park their money.
Data releases gauge the health of the economy and can impact on the Euro. Indicators such as GDP, Manufacturing and Services PMIs, employment, and consumer sentiment surveys can all influence the direction of the single currency. A strong economy is good for the Euro. Not only does it attract more foreign investment but it may encourage the ECB to put up interest rates, which will directly strengthen the Euro. Otherwise, if economic data is weak, the Euro is likely to fall. Economic data for the four largest economies in the euro area (Germany, France, Italy and Spain) are especially significant, as they account for 75% of the Eurozone’s economy.
Another significant data release for the Euro is the Trade Balance. This indicator measures the difference between what a country earns from its exports and what it spends on imports over a given period. If a country produces highly sought after exports then its currency will gain in value purely from the extra demand created from foreign buyers seeking to purchase these goods. Therefore, a positive net Trade Balance strengthens a currency and vice versa for a negative balance.
The headline Tokyo Consumer Price Index (CPI) for January climbed 3.4% YoY as compared to 3.0% in the previous month, the Statistics Bureau of Japan showed on Friday. Meanwhile, the Tokyo CPI ex Fresh Food, Energy came in at 2.5% in January vs. 2.4% in December.
Additionally, Tokyo CPI ex Fresh Food rose 2.5% YoY in January against 2.5% expected and up from 2.4% in the prior month.
Market reaction to the Tokyo Consumer Price Index
As of writing, the USD/JPY pair was up 0.06% on the day at 154.36.
Japanese Yen FAQs
The Japanese Yen (JPY) is one of the world’s most traded currencies. Its value is broadly determined by the performance of the Japanese economy, but more specifically by the Bank of Japan’s policy, the differential between Japanese and US bond yields, or risk sentiment among traders, among other factors.
One of the Bank of Japan’s mandates is currency control, so its moves are key for the Yen. The BoJ has directly intervened in currency markets sometimes, generally to lower the value of the Yen, although it refrains from doing it often due to political concerns of its main trading partners. The BoJ ultra-loose monetary policy between 2013 and 2024 caused the Yen to depreciate against its main currency peers due to an increasing policy divergence between the Bank of Japan and other main central banks. More recently, the gradually unwinding of this ultra-loose policy has given some support to the Yen.
Over the last decade, the BoJ’s stance of sticking to ultra-loose monetary policy has led to a widening policy divergence with other central banks, particularly with the US Federal Reserve. This supported a widening of the differential between the 10-year US and Japanese bonds, which favored the US Dollar against the Japanese Yen. The BoJ decision in 2024 to gradually abandon the ultra-loose policy, coupled with interest-rate cuts in other major central banks, is narrowing this differential.
The Japanese Yen is often seen as a safe-haven investment. This means that in times of market stress, investors are more likely to put their money in the Japanese currency due to its supposed reliability and stability. Turbulent times are likely to strengthen the Yen’s value against other currencies seen as more risky to invest in.
- USD/CAD rises to around 1.4500 in Thursday’s late American session.
- Trump reiterates the threat of imposing tariffs on Canada and Mexico on Saturday.
- Fed left rates unchanged and sees no hurry to cut again.
The USD/CAD pair gains momentum to around 1.4500 during the late American session on Thursday. The Canadian Dollar (CAD) remains under selling pressure as US President Donald Trump repeated his threat of tariffs on goods from Canada and Mexico. Later on Friday, the US Personal Consumption Expenditures (PCE), Personal Income/Spending, and the Chicago Purchasing Managers' Index (PMI) will be released.
Trump said late Thursday that the US plans to impose a flat 25% import tax "because of fentanyl" on all goods crossing the border into the US from Canada or Mexico. The announcement of the first Canada and Mexico tariff policies is coming on Saturday.
The potential for a trade conflict triggered by new U.S. tariffs on Canadian exports could weigh on the Loonie and act as a tailwind for USD/CAD. The US and Canada are major trading partners, exchanging $2.7 billion in goods and services across their shared border each day in 2023, according to Canadian government figures.
Additionally, the US Federal Reserve (Fed) left its overnight borrowing rate unchanged in a range between 4.25%-4.50% at its January meeting on Wednesday. Fed Chair Jerome Powell noted that officials are not in a rush to lower interest rates, adding the central bank is pausing to see further progress on inflation following a string of rate cuts in 2024.
Wednesday’s hawkish hold by the Fed could underpin the US Dollar (USD) broadly in the near term. Markets are pricing in a funds rate of about 3.9% by the end of 2025, implying a 61% chance of two-quarter percentage point reductions this year, according to CME Group data.
Canadian Dollar FAQs
The key factors driving the Canadian Dollar (CAD) are the level of interest rates set by the Bank of Canada (BoC), the price of Oil, Canada’s largest export, the health of its economy, inflation and the Trade Balance, which is the difference between the value of Canada’s exports versus its imports. Other factors include market sentiment – whether investors are taking on more risky assets (risk-on) or seeking safe-havens (risk-off) – with risk-on being CAD-positive. As its largest trading partner, the health of the US economy is also a key factor influencing the Canadian Dollar.
The Bank of Canada (BoC) has a significant influence on the Canadian Dollar by setting the level of interest rates that banks can lend to one another. This influences the level of interest rates for everyone. The main goal of the BoC is to maintain inflation at 1-3% by adjusting interest rates up or down. Relatively higher interest rates tend to be positive for the CAD. The Bank of Canada can also use quantitative easing and tightening to influence credit conditions, with the former CAD-negative and the latter CAD-positive.
The price of Oil is a key factor impacting the value of the Canadian Dollar. Petroleum is Canada’s biggest export, so Oil price tends to have an immediate impact on the CAD value. Generally, if Oil price rises CAD also goes up, as aggregate demand for the currency increases. The opposite is the case if the price of Oil falls. Higher Oil prices also tend to result in a greater likelihood of a positive Trade Balance, which is also supportive of the CAD.
While inflation had always traditionally been thought of as a negative factor for a currency since it lowers the value of money, the opposite has actually been the case in modern times with the relaxation of cross-border capital controls. Higher inflation tends to lead central banks to put up interest rates which attracts more capital inflows from global investors seeking a lucrative place to keep their money. This increases demand for the local currency, which in Canada’s case is the Canadian Dollar.
Macroeconomic data releases gauge the health of the economy and can have an impact on the Canadian Dollar. Indicators such as GDP, Manufacturing and Services PMIs, employment, and consumer sentiment surveys can all influence the direction of the CAD. A strong economy is good for the Canadian Dollar. Not only does it attract more foreign investment but it may encourage the Bank of Canada to put up interest rates, leading to a stronger currency. If economic data is weak, however, the CAD is likely to fall.
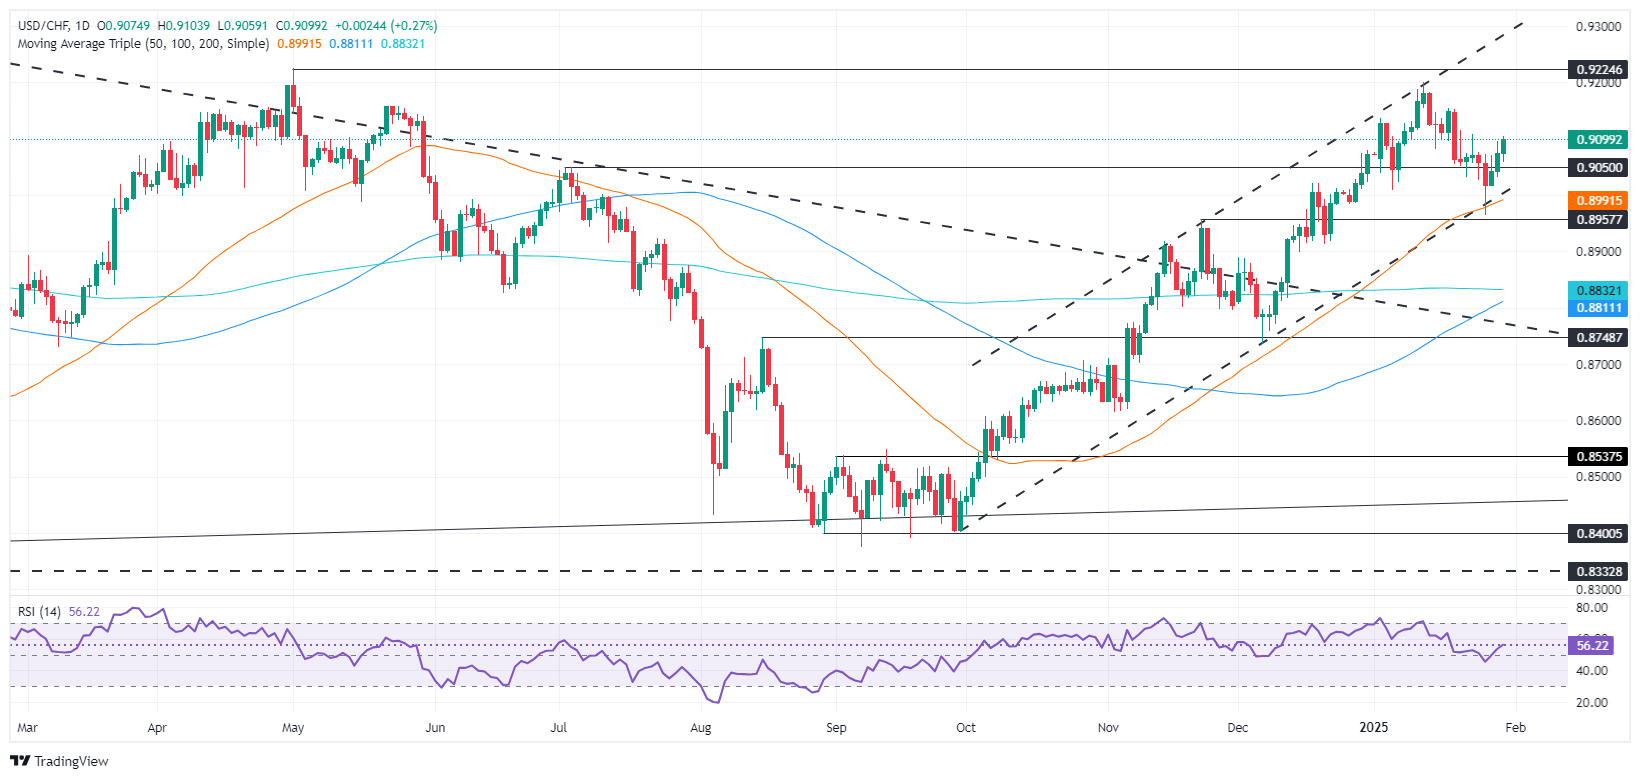
- USD/CHF approaches 0.9100, gaining 0.33% amid U.S. trade tensions with neighbors.
- Technical rebound as USD/CHF recaptures 0.9000 after dipping below 50-day SMA.
- Potential rise toward 0.9152 if bulls overcome the 0.9100 resistance, with 0.9200 in sight.
The USD/CHF rallied for the third consecutive day, edged towards the 0.9100 figure, and posted gains of over 0.33%. US President Donald Trump's tariff threats to Canada and Mexico bolstered the Greenback, which recovered after the US Dollar Index (DXY) dived to a three-day low of 107.50.
USD/CHF Price Forecast: Technical outlook
The USD/CHF uptrend remains intact, although the pair briefly edged below the 50-day Simple Moving Average (SMA) of 0.8963 on Tuesday before reclaiming the 0.9000 figure.
Momentum turned bullish after the Relative Strength Index (RSI) crossed above its neutral line, an indication that bulls are in charge.
Therefore, further upside in the USD/CHF is seen. Once bulls reclaim 0.9100, a rally toward the January 17 swing high of 0.9152 is on the cards. On further strength, the next resistance would be the 0.9200 mark.
Conversely, sellers must clear the 50-day SMA at 0.8984, followed by the January 27 swing low of 0.8964.
USD/CHF Price Chart – Daily
Swiss Franc FAQs
The Swiss Franc (CHF) is Switzerland’s official currency. It is among the top ten most traded currencies globally, reaching volumes that well exceed the size of the Swiss economy. Its value is determined by the broad market sentiment, the country’s economic health or action taken by the Swiss National Bank (SNB), among other factors. Between 2011 and 2015, the Swiss Franc was pegged to the Euro (EUR). The peg was abruptly removed, resulting in a more than 20% increase in the Franc’s value, causing a turmoil in markets. Even though the peg isn’t in force anymore, CHF fortunes tend to be highly correlated with the Euro ones due to the high dependency of the Swiss economy on the neighboring Eurozone.
The Swiss Franc (CHF) is considered a safe-haven asset, or a currency that investors tend to buy in times of market stress. This is due to the perceived status of Switzerland in the world: a stable economy, a strong export sector, big central bank reserves or a longstanding political stance towards neutrality in global conflicts make the country’s currency a good choice for investors fleeing from risks. Turbulent times are likely to strengthen CHF value against other currencies that are seen as more risky to invest in.
The Swiss National Bank (SNB) meets four times a year – once every quarter, less than other major central banks – to decide on monetary policy. The bank aims for an annual inflation rate of less than 2%. When inflation is above target or forecasted to be above target in the foreseeable future, the bank will attempt to tame price growth by raising its policy rate. Higher interest rates are generally positive for the Swiss Franc (CHF) as they lead to higher yields, making the country a more attractive place for investors. On the contrary, lower interest rates tend to weaken CHF.
Macroeconomic data releases in Switzerland are key to assessing the state of the economy and can impact the Swiss Franc’s (CHF) valuation. The Swiss economy is broadly stable, but any sudden change in economic growth, inflation, current account or the central bank’s currency reserves have the potential to trigger moves in CHF. Generally, high economic growth, low unemployment and high confidence are good for CHF. Conversely, if economic data points to weakening momentum, CHF is likely to depreciate.
As a small and open economy, Switzerland is heavily dependent on the health of the neighboring Eurozone economies. The broader European Union is Switzerland’s main economic partner and a key political ally, so macroeconomic and monetary policy stability in the Eurozone is essential for Switzerland and, thus, for the Swiss Franc (CHF). With such dependency, some models suggest that the correlation between the fortunes of the Euro (EUR) and the CHF is more than 90%, or close to perfect.
- GBP/USD lost around 0.2% on Thursday as Cable traders await meaningful news.
- US data came in mixed on Thursday; traders await Friday’s US PCEPI print.
- A data-light week for the UK leaves the Pound adrift.
GBP/USD soured slightly on Thursday, shedding a scant one-fifth of one percent as markets grapple with mixed headwinds and keep risk appetite underbid. US President Donald Trump reiterated threats to impose stiff tariffs on Canada and Mexico as soon as February 1, with fresh threats in the pipe for import fees on Chinese goods and Crude Oil products.
Read more: US President Donald Trump reiterates threat to impose tariffs on Canada and Mexico
US economic data came in mixed on Thursday, further flummoxing markets. US Gross Domestic Product (GDP) growth in the fourth quarter of 2024 came in below expectations, but weekly Initial Jobless Claims figures beat expectations while remaining well within recent norms.
US PCE inflation to be the key post-Fed data print
Coming up on Friday, US Personal Consumption Expenditure Price Index (PCEPI) inflation metrics will print during the US market session. As the Federal Reserve’s (Fed) favored method of measuring and tracking consumer-level inflation, this PCEPI print will likely draw more eyes than usual after the Fed boldly held interest rates steady earlier this week, despite President Trump’s vehement protestations.
GBP/USD price forecast
GBP/USD continues to grind lower amid half-hearted intraday momentum. The pair caught a clean bearish technical bounce from the 50-day Exponential Moving Average (EMA) early this week, and has continued to flub a recent bullish upswing from multi-month lows chalked in near 1.2100 earlier in January.
Momentum is still pointed toward the low side, and Cable is poised for a pullback to the 1.2250 region unless bidders return to the fold and push bids back above the 1.2500 handle and the 50-day EMA.
GBP/USD price forecast
Pound Sterling FAQs
The Pound Sterling (GBP) is the oldest currency in the world (886 AD) and the official currency of the United Kingdom. It is the fourth most traded unit for foreign exchange (FX) in the world, accounting for 12% of all transactions, averaging $630 billion a day, according to 2022 data. Its key trading pairs are GBP/USD, also known as ‘Cable’, which accounts for 11% of FX, GBP/JPY, or the ‘Dragon’ as it is known by traders (3%), and EUR/GBP (2%). The Pound Sterling is issued by the Bank of England (BoE).
The single most important factor influencing the value of the Pound Sterling is monetary policy decided by the Bank of England. The BoE bases its decisions on whether it has achieved its primary goal of “price stability” – a steady inflation rate of around 2%. Its primary tool for achieving this is the adjustment of interest rates. When inflation is too high, the BoE will try to rein it in by raising interest rates, making it more expensive for people and businesses to access credit. This is generally positive for GBP, as higher interest rates make the UK a more attractive place for global investors to park their money. When inflation falls too low it is a sign economic growth is slowing. In this scenario, the BoE will consider lowering interest rates to cheapen credit so businesses will borrow more to invest in growth-generating projects.
Data releases gauge the health of the economy and can impact the value of the Pound Sterling. Indicators such as GDP, Manufacturing and Services PMIs, and employment can all influence the direction of the GBP. A strong economy is good for Sterling. Not only does it attract more foreign investment but it may encourage the BoE to put up interest rates, which will directly strengthen GBP. Otherwise, if economic data is weak, the Pound Sterling is likely to fall.
Another significant data release for the Pound Sterling is the Trade Balance. This indicator measures the difference between what a country earns from its exports and what it spends on imports over a given period. If a country produces highly sought-after exports, its currency will benefit purely from the extra demand created from foreign buyers seeking to purchase these goods. Therefore, a positive net Trade Balance strengthens a currency and vice versa for a negative balance.
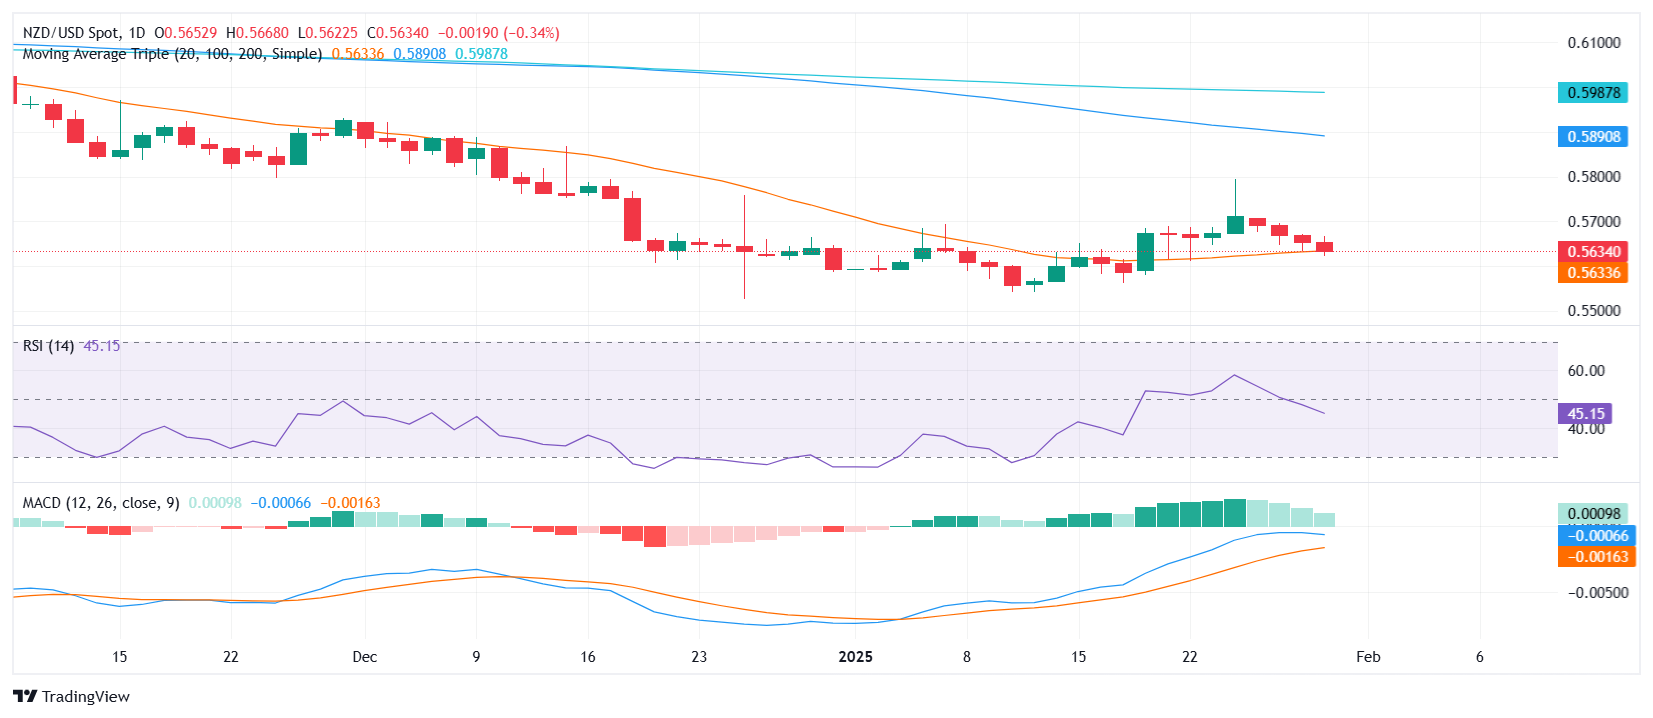
- NZD/USD eases to 0.5655 on Thursday, extending its pullback from recent highs.
- The pair is approaching the 20-day SMA, a key level that may determine its next move if breached.
- Technical indicators signal increasing bearish pressure, with RSI declining sharply and MACD showing weakening momentum.
The NZD/USD pair continued its downward drift on Thursday, edging lower to 0.5630 as selling pressure persisted. The pair has been consolidating after failing to maintain its previous upward momentum, and its approach toward the 20-day Simple Moving Average (SMA) could act as a pivotal point for traders. A break below this level may reinforce the bearish outlook, while a bounce could offer short-term support.
Technical indicators suggest growing downside risks. The Relative Strength Index (RSI) has dropped to 46, declining sharply and remaining in negative territory, indicating waning buying interest. Meanwhile, the Moving Average Convergence Divergence (MACD) histogram prints decreasing green bars, suggesting a loss of bullish momentum and a shift in favor of sellers.
Looking ahead, the 20-day SMA near 0.5630 stands as immediate support. A decisive move below this level could open the door for a decline toward 0.5600, while on the upside, resistance is seen at 0.5685, followed by the psychological barrier at 0.5700. Until the pair clears key resistance levels, downside risks remain dominant.
NZD/USD daily chart
United States (US) President Donald Trump took to social media late Thursday to make a fresh tariff threat against Canada and Mexico. According to President Trump's social media post, the US is set to impose a flat 25% import tax "because of fentanyl" on all goods crossing the border into the US from Canada or Mexico. President Trump also lumped renewed threats of tariffs against China in his afternoon posting tirade, and announced that specific moves on Crude Oil market restrictions could be in the pipe.
Key highlights
I'm to announce Canada and Mexico tariffs because of fentanyl.
25% tariffs on Canada and Mexico.
The first Canada and Mexico tariffs are coming Saturday.
I'm making a determination on oil tonight.
We have all the lumber we need.
Trump: China's going to end up paying a tariff as well.
We're in the process of doing a China tariff.
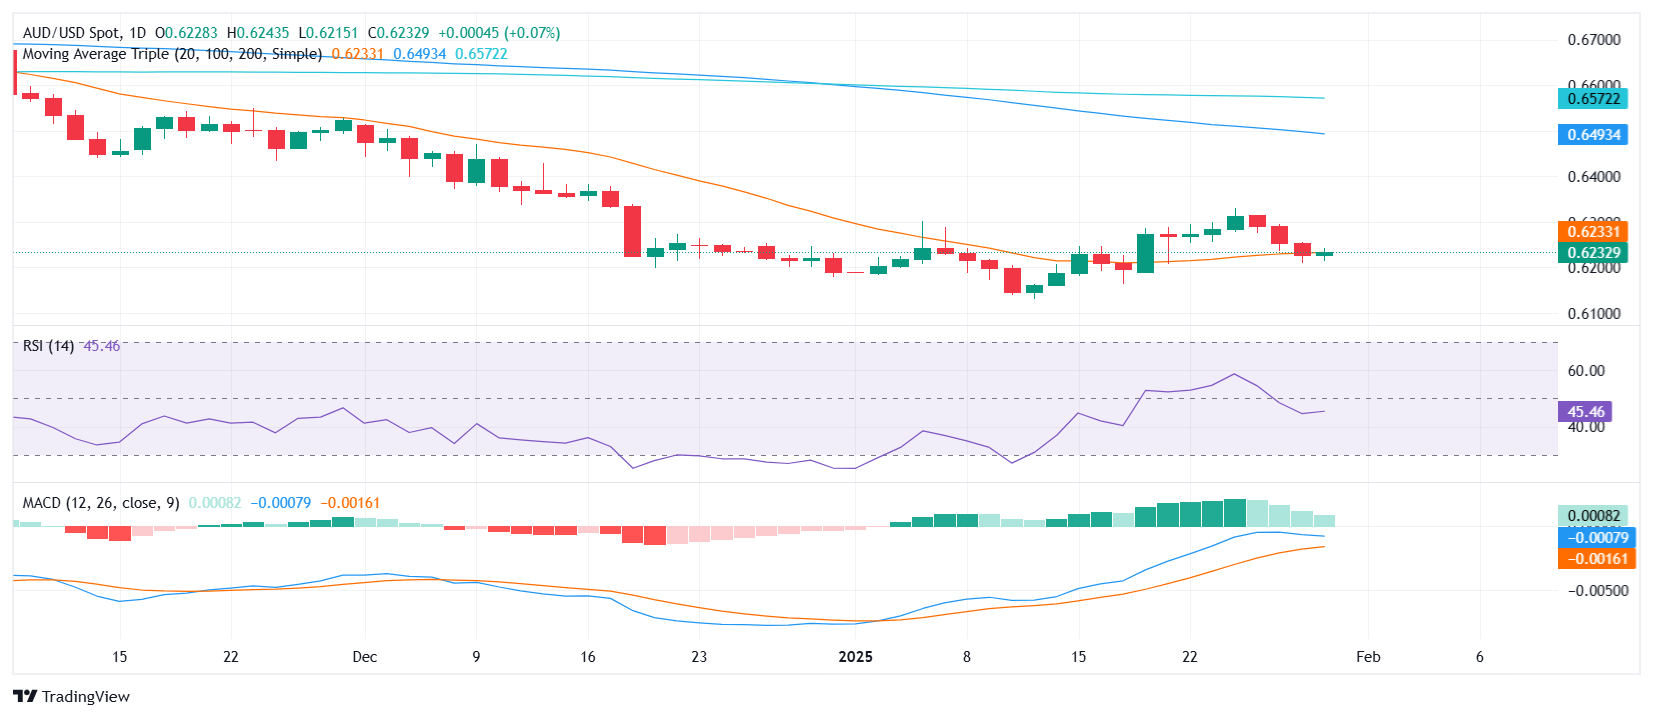
- Pair sees some upside around 0.6235, maintaining a tight range after key US data.
- Fed holds rates but adopts a more cautious stance on inflation progress.
- US GDP and jobless claims offer mixed signals, pressuring the US Dollar.
- RBA is expected to pivot toward policy easing next month as inflation cools.
AUD/USD remains range-bound above 0.6200 on Thursday as markets assess the United States (US) fourth-quarter GDP release, which could shape the Federal Reserve's (Fed) rate outlook. Despite holding rates at 4.25%-4.50%, the Fed’s latest statement signaled a more cautious approach toward inflation, fueling doubts over the timeline for rate cuts. On the other hand, markets are confident that the Reserve Bank of Australia (RBA) will deliver a rate cut in February.
Daily digest market movers: Aussie mildly soft after US data
- US GDP disappointed as the preliminary Q4 GDP figure slowed to 2.3%, missing expectations of 2.6% and sharply below the 3.1% growth seen in Q3.
- Inflation signals were mixed: Personal Consumption Expenditure (PCE) prices surged to 2.3% (from 1.5%), suggesting persistent inflationary pressures, while core PCE rose by 2.5%, matching estimates.
- Initial jobless claims fell to 207K, beating the forecasted 220K, while continuing claims eased to 1.858 million (from 1.900 million).
- On the Fed’s side, policymakers removed language indicating progress toward the 2% inflation target, signaling a more data-dependent approach. However, Fed Chair Jerome Powell downplayed this shift, stating it was not meant to indicate a significant policy change.
- Market bets on RBA easing rise as Q4 CPI data from Australia supports a rate-cut case, with headline inflation easing to 2.5% y/y (from 2.8%) and the trimmed-mean CPI slipping to a three-year low of 3.2%, below the RBA's forecast of 3.4%. Traders are now fully pricing in a 25bps cut in February.
AUD/USD technical outlook: Consolidation phase continues
The AUD/USD remains within a narrow 0.6230-0.6300 trading band, reflecting market hesitation ahead of key data releases. The MACD histogram shows green bars, hinting at underlying bullish momentum, while the RSI sits at 45 in negative territory, reflecting mild selling pressure.
Despite recent declines, the short-term outlook remains neutral-to-positive, with traders looking for a breakout above 0.6300 to validate further gains or a drop below 0.6200 to confirm renewed bearish sentiment.
Australian Dollar FAQs
One of the most significant factors for the Australian Dollar (AUD) is the level of interest rates set by the Reserve Bank of Australia (RBA). Because Australia is a resource-rich country another key driver is the price of its biggest export, Iron Ore. The health of the Chinese economy, its largest trading partner, is a factor, as well as inflation in Australia, its growth rate and Trade Balance. Market sentiment – whether investors are taking on more risky assets (risk-on) or seeking safe-havens (risk-off) – is also a factor, with risk-on positive for AUD.
The Reserve Bank of Australia (RBA) influences the Australian Dollar (AUD) by setting the level of interest rates that Australian banks can lend to each other. This influences the level of interest rates in the economy as a whole. The main goal of the RBA is to maintain a stable inflation rate of 2-3% by adjusting interest rates up or down. Relatively high interest rates compared to other major central banks support the AUD, and the opposite for relatively low. The RBA can also use quantitative easing and tightening to influence credit conditions, with the former AUD-negative and the latter AUD-positive.
China is Australia’s largest trading partner so the health of the Chinese economy is a major influence on the value of the Australian Dollar (AUD). When the Chinese economy is doing well it purchases more raw materials, goods and services from Australia, lifting demand for the AUD, and pushing up its value. The opposite is the case when the Chinese economy is not growing as fast as expected. Positive or negative surprises in Chinese growth data, therefore, often have a direct impact on the Australian Dollar and its pairs.
Iron Ore is Australia’s largest export, accounting for $118 billion a year according to data from 2021, with China as its primary destination. The price of Iron Ore, therefore, can be a driver of the Australian Dollar. Generally, if the price of Iron Ore rises, AUD also goes up, as aggregate demand for the currency increases. The opposite is the case if the price of Iron Ore falls. Higher Iron Ore prices also tend to result in a greater likelihood of a positive Trade Balance for Australia, which is also positive of the AUD.
The Trade Balance, which is the difference between what a country earns from its exports versus what it pays for its imports, is another factor that can influence the value of the Australian Dollar. If Australia produces highly sought after exports, then its currency will gain in value purely from the surplus demand created from foreign buyers seeking to purchase its exports versus what it spends to purchase imports. Therefore, a positive net Trade Balance strengthens the AUD, with the opposite effect if the Trade Balance is negative.
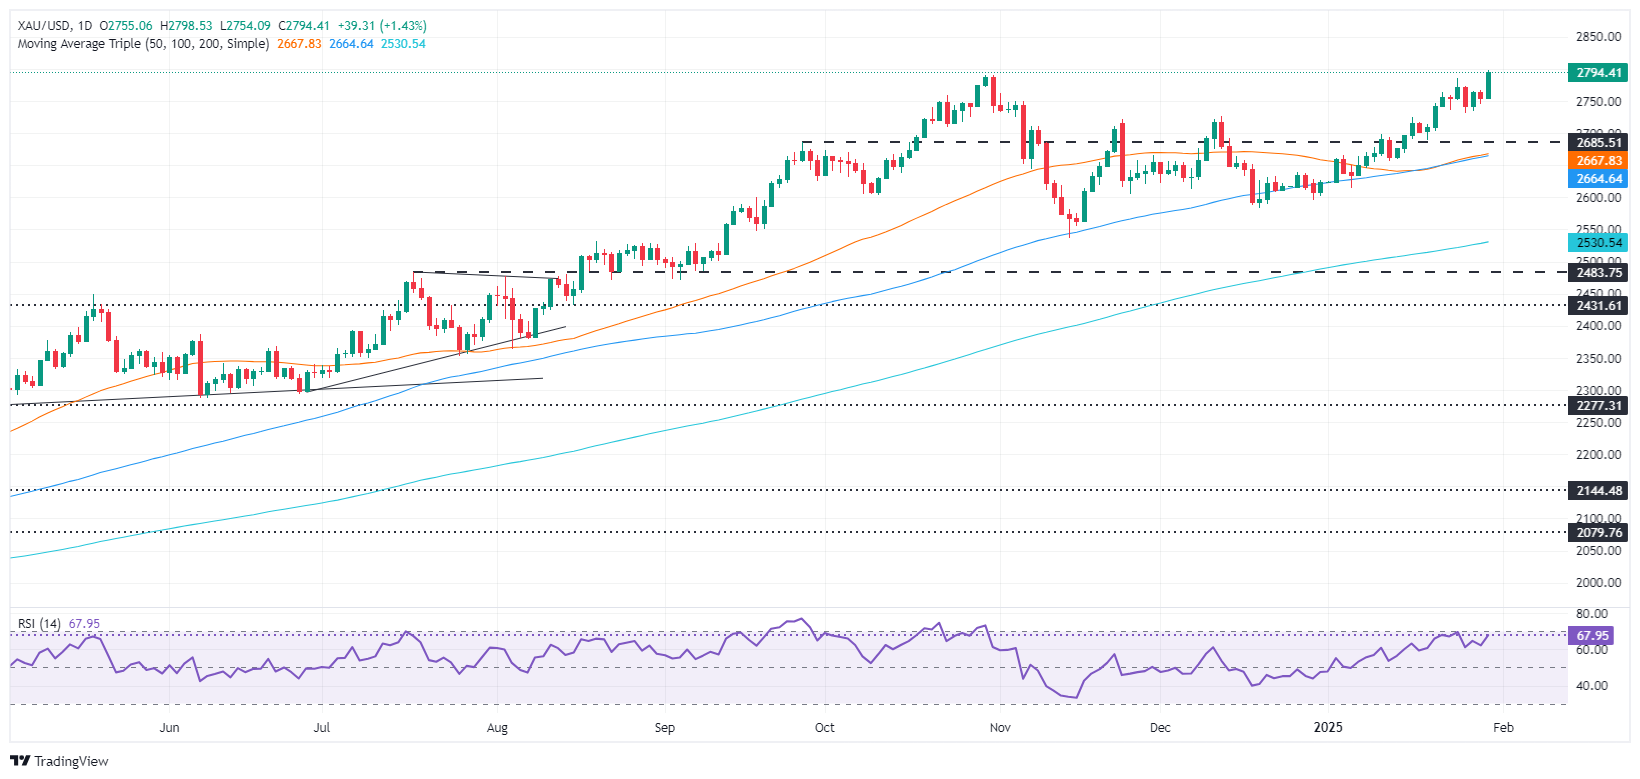
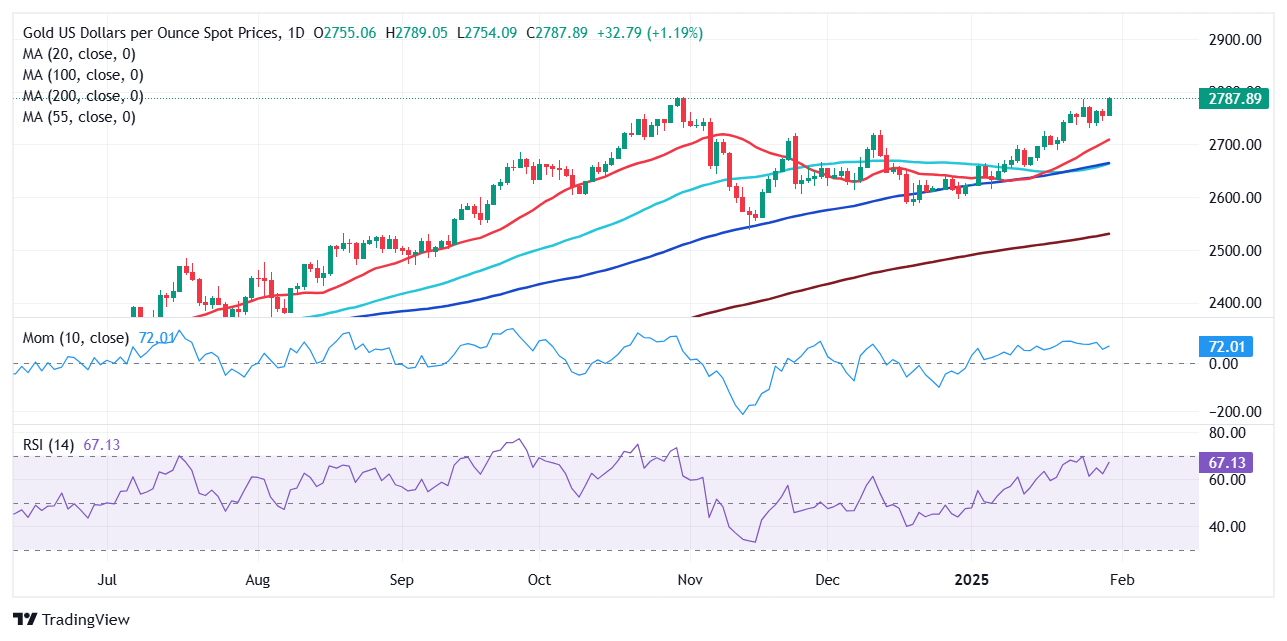
- XAU/USD climbs 1.31%, touching a record after US GDP growth disappoints in Q4 2024.
- US Treasury yields drop as markets adjust to Fed's steady stance despite economic signals.
- Despite robust job market, Gold rallies as Fed Chair Powell hints at cautious approach to rate cuts.
Gold price skyrockets to a new all-time high (ATH) of $2,798 on Thursday after economic data from the United States (US) indicated the economy is slowing down, warranting the Federal Reserve (Fed) to lower interest rates despite holding them steady at Wednesday’s meeting. At the time of writing, the XAU/USD trades at $2,794, up 1.31%.
The yellow metal exploded on Thursday after being contained by the $2,770 figure for the last three days. US Treasury yields edged lower as traders grew disappointed following the last reading of 2024 of the fourth quarter Gross Domestic Product (GDP), which, although expanding, did so at a lower rate than expected.
Meanwhile, the jobs market remains robust, as the number of people applying for unemployment benefits decreased compared to the previous reading, according to the US Department of Labor.
Bullion prices soared, although the Fed held rates unchanged on Wednesday. Fed Chair Jerome Powell stated that policy is well-positioned and that they are not in a rush to cut interest rates.
Daily digest market movers: Gold price ignores mixed US data
- US GDP for Q4 204 dipped from 3.1% in Q3 to 2.3%, missing the mark. According to the US Department of Labor, Initial Jobless Claims for the week ending January 24 fell to 207K, coming in lower than the expected 220K and the previous week's 223K.
- Gold’s advance is also sponsored by the fall of US yields. The US 10-year T-note yield dropped two basis points down to 4.516%. US real yields, as measured by the 10-year Treasury Inflation-Protected Securities (TIPS), followed suit, tumbling two basis points to 2.138%.
- Bullion prices are also unfazed by a hawkish Fed, which unanimously voted to keep interest rates steady at 4.25% - 4.50% on Wednesday. The central bank cited a resilient US economy, limited progress in reducing inflation, and a recovering labor market as key factors behind the decision.
- While Trump’s plans are still unclear, he set a deadline of Saturday for tariffs of 25% on Mexico and Canada, and has also said he intends to impose across-the-board levies that are “much bigger” than the 2.5% figure previously suggested by Treasury Secretary Scott Bessent.
- The swaps market is pricing 50 bps of Fed rate cuts in 2025.
XAU/USD technical outlook: Gold lurks near $2,800 as bulls’ eye $3,000
Gold’s uptrend has resumed with the precious metal hitting a record high of $2,798. Bulls path toward $2,800 is clear, and buyers could test key psychological levels like $2,850, $2,900 and $3,000.
Conversely, sellers must drag XAU/USD’s prices below $2,750, so they could remain hopeful of testing $2,700. Further downside is seen below the latter, with the next key support at $2,663, the confluence of the 50 and 100-day Simple Moving Averages (SMAs).
Gold FAQs
Gold has played a key role in human’s history as it has been widely used as a store of value and medium of exchange. Currently, apart from its shine and usage for jewelry, the precious metal is widely seen as a safe-haven asset, meaning that it is considered a good investment during turbulent times. Gold is also widely seen as a hedge against inflation and against depreciating currencies as it doesn’t rely on any specific issuer or government.
Central banks are the biggest Gold holders. In their aim to support their currencies in turbulent times, central banks tend to diversify their reserves and buy Gold to improve the perceived strength of the economy and the currency. High Gold reserves can be a source of trust for a country’s solvency. Central banks added 1,136 tonnes of Gold worth around $70 billion to their reserves in 2022, according to data from the World Gold Council. This is the highest yearly purchase since records began. Central banks from emerging economies such as China, India and Turkey are quickly increasing their Gold reserves.
Gold has an inverse correlation with the US Dollar and US Treasuries, which are both major reserve and safe-haven assets. When the Dollar depreciates, Gold tends to rise, enabling investors and central banks to diversify their assets in turbulent times. Gold is also inversely correlated with risk assets. A rally in the stock market tends to weaken Gold price, while sell-offs in riskier markets tend to favor the precious metal.
The price can move due to a wide range of factors. Geopolitical instability or fears of a deep recession can quickly make Gold price escalate due to its safe-haven status. As a yield-less asset, Gold tends to rise with lower interest rates, while higher cost of money usually weighs down on the yellow metal. Still, most moves depend on how the US Dollar (USD) behaves as the asset is priced in dollars (XAU/USD). A strong Dollar tends to keep the price of Gold controlled, whereas a weaker Dollar is likely to push Gold prices up.
The US Dollar traded with a tepid downside bias amid lower yields and further investors’ assessment of Wednesday’s hawkish hold by the Federal Reserve, while the release of Friday’s PCE also prompted some caution.
Here is what you need to know on Friday, January 31:
The US Dollar Index (DXY) remained inconclusive below the 108.00 mark and amid shrinking US yields. The publication of PCE figures will gather all the attention, seconded by Personal Income/Spending, the Chicago PMI, Employment Cost index and the speech by the Fed’s Bowman.
EUR/USD hovered around the low-1.0400s, up slightly, after the ECB lowered its key rates by 25 bps, as expected. Germany’s flash Inflation Rate takes centre stage, followed by the jobs report and Retail Sales. In addition, the ECB will release its Survey of Professional Forecasters (SPF).
GBP/USD added to Wednesday’s uptick and advanced modestly, briefly revisiting the 1.2480 zone. The Nationwide Housing Prices will be the only release across the Channel.
USD/JPY dropped markedly to three-day lows in the sub-154.00 region, adding to the previous day’s pullback. Japan’s Unemployment Rate, Industrial Production, Retail Sales, Housing Starts, Construction Orders, and Tokyo Inflation Rate are expected at the end of the week.
AUD/USD managed well to regain balance and set aside three consecutive daily pullbacks, retesting the 0.6250 zone. Producer Prices, Housing Credit figures and Private Sector Credit results are all due in Oz.
WTI oil dropped further and challenged the $72.00 mark per barrel, or four-week lows, on the back of steady concerns surrounding the US tariffs narrative.
Gold prices regained the uptrend and advanced to a record high just below the key $2,800 mark per ounce troy. Silver prices rallied past the $31.00 mark per ounce for the first time since early December.
- The Canadian Dollar is treading water against the Greenback near 1.44.
- The Bank of Canada cut interest rates again this week.
- A declining rate differential and looming tariff threats keep the Loonie pinned.
The Canadian Dollar (CAD) went nowhere fast on Thursday, cycling near the 1.4400 handle against the US Dollar (USD). Loonie markets have gone flat after the Bank of Canada’s (BoC) latest rate cut, adding another 25 bps rate trim to the pile, and looming threats of 25% tariffs on Canada from US President Donald Trump, set to allegedly take effect on February 1, are having a chilling effect on market flows.
US data dominated trading headlines on Thursday, leaving CAD traders to wait until Friday’s Canadian Gross Domestic Product (GDP) print, though the monthly figure is so back-dated that impact will be minimal. US unemployment claims beat expectations, but US GDP growth flashed a warning sign that things may be slowing down faster than investors expected.
Daily digest market movers: Canadian Dollar markets hung out to dry
- The Canadian Dollar flattened on Thursday, but remains down one-half of one percent against the Greenback for the week.
- Canadian economic data is entirely absent on Thursday.
- Canadian GDP growth due on Friday, expected to show a contraction in November’s monthly growth figure.
- US GDP missed the mark in Q4, settling to 2.3% versus the forecast 2.6% and missing the previous quarter’s 3.1%.
- US weekly Initial Jobless Claims sank to 207K, easing back from the previous week’s 223K.
Canadian Dollar price forecast
The Canadian Dollar continues to grind through a rough sideways range against the Greenback. USD/CAD has been caught in a consolidation phase for over six weeks straight after the Loonie fell to multi-year lows in mid-December.
Price action is now poised for a technical squeeze with the 50-day Exponential Moving Average (EMA) rising into 1.4300. 1.4500 is the key handle for Greenback bulls to beat, while Loonie bidders will be looking to chalk in a successful technical turnaround and send intraday bids back to 1.4300.
USD/CAD daily chart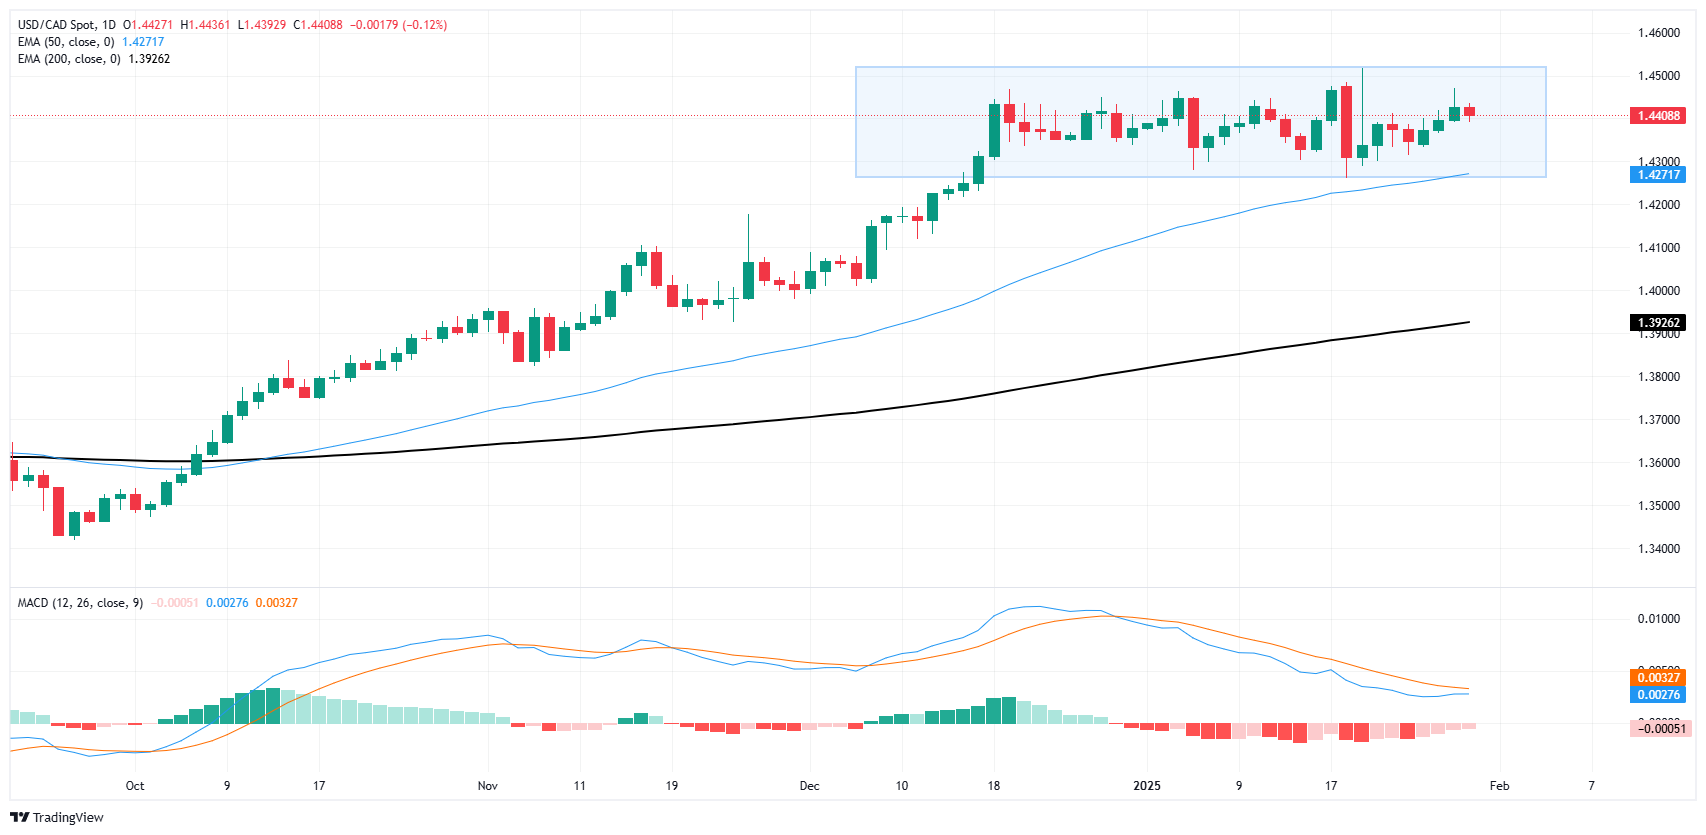
Canadian Dollar FAQs
The key factors driving the Canadian Dollar (CAD) are the level of interest rates set by the Bank of Canada (BoC), the price of Oil, Canada’s largest export, the health of its economy, inflation and the Trade Balance, which is the difference between the value of Canada’s exports versus its imports. Other factors include market sentiment – whether investors are taking on more risky assets (risk-on) or seeking safe-havens (risk-off) – with risk-on being CAD-positive. As its largest trading partner, the health of the US economy is also a key factor influencing the Canadian Dollar.
The Bank of Canada (BoC) has a significant influence on the Canadian Dollar by setting the level of interest rates that banks can lend to one another. This influences the level of interest rates for everyone. The main goal of the BoC is to maintain inflation at 1-3% by adjusting interest rates up or down. Relatively higher interest rates tend to be positive for the CAD. The Bank of Canada can also use quantitative easing and tightening to influence credit conditions, with the former CAD-negative and the latter CAD-positive.
The price of Oil is a key factor impacting the value of the Canadian Dollar. Petroleum is Canada’s biggest export, so Oil price tends to have an immediate impact on the CAD value. Generally, if Oil price rises CAD also goes up, as aggregate demand for the currency increases. The opposite is the case if the price of Oil falls. Higher Oil prices also tend to result in a greater likelihood of a positive Trade Balance, which is also supportive of the CAD.
While inflation had always traditionally been thought of as a negative factor for a currency since it lowers the value of money, the opposite has actually been the case in modern times with the relaxation of cross-border capital controls. Higher inflation tends to lead central banks to put up interest rates which attracts more capital inflows from global investors seeking a lucrative place to keep their money. This increases demand for the local currency, which in Canada’s case is the Canadian Dollar.
Macroeconomic data releases gauge the health of the economy and can have an impact on the Canadian Dollar. Indicators such as GDP, Manufacturing and Services PMIs, employment, and consumer sentiment surveys can all influence the direction of the CAD. A strong economy is good for the Canadian Dollar. Not only does it attract more foreign investment but it may encourage the Bank of Canada to put up interest rates, leading to a stronger currency. If economic data is weak, however, the CAD is likely to fall.
- The US Dollar remains soft after the Fed left rates unchanged and revised its inflation assessment.
- US GDP growth slowed to 2.3% in Q4, missing forecasts of 2.6% and down from 3.1% in Q3.
- The Fed removed prior language on inflation progress, stating it remains “somewhat elevated.”
- Powell’s mixed messaging led to uncertainty, initially pushing the DXY higher before erasing gains.
The US Dollar Index (DXY), which measures the value of the US Dollar against a basket of currencies, hovers below 108.00 as traders react to the Federal Reserve’s (Fed) latest decision and a weaker-than-expected US Gross Domestic Product (GDP) print. The Fed maintained its policy stance but removed previous references to inflation making progress toward the 2% goal, sparking hawkish speculation.
However, Powell later downplayed this shift, calling it a “language cleanup,” which softened the initial market reaction. Meanwhile, GDP growth missed expectations, while inflation components within the report suggested underlying price pressures persist.
Daily digest market movers: US Dollar struggles as GDP miss fuels uncertainty
- The Federal Reserve held interest rates steady at 4.25%-4.50% as widely expected but removed prior language stating that inflation was making progress toward the 2% target. This adjustment was initially seen as hawkish before Powell downplayed its significance.
- During the press conference, Powell clarified that the inflation language change was merely a “language cleanup” and not an intentional policy shift. His comments softened the market's hawkish reaction and led to a pullback in the US Dollar.
- Powell emphasized that the policy stance remains restrictive and that rate decisions will be data-dependent. He refrained from signaling any urgency to cut rates, reinforcing the Fed’s cautious approach.
- The United States Q4 GDP growth slowed to 2.3%, missing the 2.6% forecast and falling from 3.1% in Q3. This lower-than-expected reading raised concerns about slowing economic momentum.
- The Personal Consumption Expenditure (PCE) price index rose to 2.3%, accelerating from 1.5% in the prior quarter, suggesting that inflation remains persistent despite the overall GDP slowdown.
- Core PCE, the Fed’s preferred inflation measure, remained unchanged at 2.2%, missing expectations for 2.5%. This softer-than-expected inflation reading fueled mixed reactions in the market.
- Initial Jobless Claims dropped to 207,000 for the most recent week, below estimates of 220,000 and down from the prior week’s 223,000 reading, signaling continued strength in the labor market.
- Continuing Jobless Claims declined to 1.858 million from 1.900 million, suggesting that job market conditions remain stable despite broader economic uncertainty.
DXY technical outlook: Dollar struggles to hold 108.00
The US Dollar Index attempted to recover above 108.00 but remains under pressure as traders reassess Fed policy signals. The Relative Strength Index (RSI) is still below 50, indicating weak bullish momentum, while the MACD’s red bars show ongoing bearish pressure.
The index risks further downside if it fails to hold 107.80, with potential support at 107.50. However, if sentiment shifts, resistance near 108.50 could cap gains before any meaningful rally.
Fed FAQs
Monetary policy in the US is shaped by the Federal Reserve (Fed). The Fed has two mandates: to achieve price stability and foster full employment. Its primary tool to achieve these goals is by adjusting interest rates. When prices are rising too quickly and inflation is above the Fed’s 2% target, it raises interest rates, increasing borrowing costs throughout the economy. This results in a stronger US Dollar (USD) as it makes the US a more attractive place for international investors to park their money. When inflation falls below 2% or the Unemployment Rate is too high, the Fed may lower interest rates to encourage borrowing, which weighs on the Greenback.
The Federal Reserve (Fed) holds eight policy meetings a year, where the Federal Open Market Committee (FOMC) assesses economic conditions and makes monetary policy decisions. The FOMC is attended by twelve Fed officials – the seven members of the Board of Governors, the president of the Federal Reserve Bank of New York, and four of the remaining eleven regional Reserve Bank presidents, who serve one-year terms on a rotating basis.
In extreme situations, the Federal Reserve may resort to a policy named Quantitative Easing (QE). QE is the process by which the Fed substantially increases the flow of credit in a stuck financial system. It is a non-standard policy measure used during crises or when inflation is extremely low. It was the Fed’s weapon of choice during the Great Financial Crisis in 2008. It involves the Fed printing more Dollars and using them to buy high grade bonds from financial institutions. QE usually weakens the US Dollar.
Quantitative tightening (QT) is the reverse process of QE, whereby the Federal Reserve stops buying bonds from financial institutions and does not reinvest the principal from the bonds it holds maturing, to purchase new bonds. It is usually positive for the value of the US Dollar.
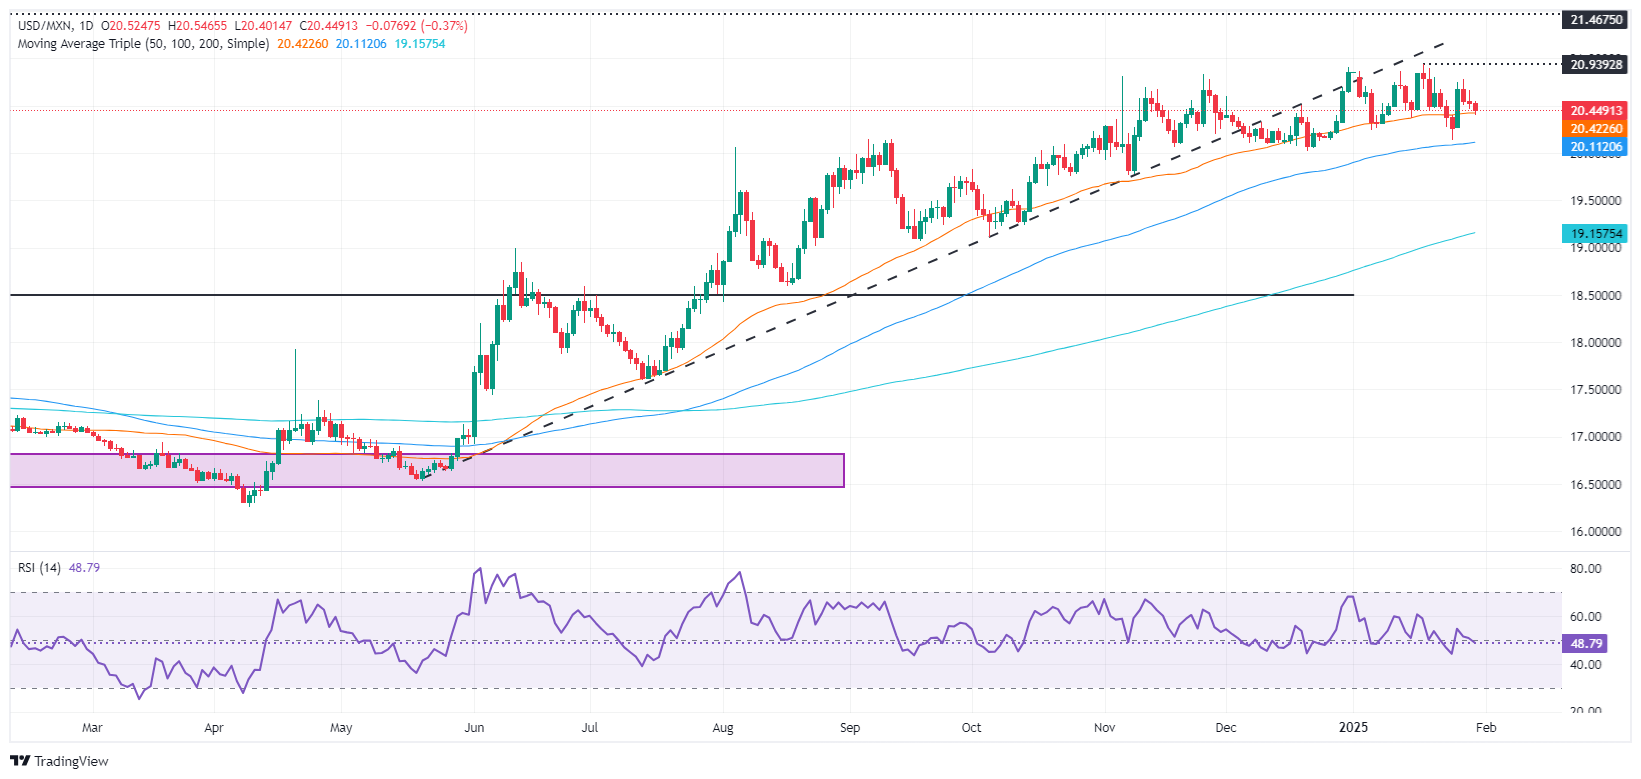
- The Mexican Peso strengthened for the third straight day despite Mexico’s Q4 GDP contraction.
- Banxico is expected to cut rates to stimulate the economic recovery amid global uncertainties.
- Monetary policy divergence between Fed and Banxico, plus US tariff threats, to boost USD/MXN.
The Mexican Peso (MXN) surged for the third consecutive day against the Greenback as the emerging market currency shrugged off Mexico’s economic contraction in Q4 2024, according to the Instituto Nacional de Estadistica Geografia e Informatica (INEGI). Weak growth figures in the United States (US) lent a lifeline to the Peso, as seen by the USD/MXN pair, trading at 20.41, down 0.42%.
The Gross Domestic Product (GDP) in Mexico contracted quarterly, justifying the latest actions taken by the Banco de Mexico (Banxico), which lowered rates by 25 basis points (bps) at the December meeting.
Although it would be tempting for Banxico to increase the size of the easing from 25 to 50 bps, potential US tariffs imposed on Mexico and Canada could impact the economy, exerting pressure on the Mexican Peso.
Across the north of the border, the US GDP for the fourth quarter missed forecasts, while the number of Americans filling for unemployment claims hinted the labor market remains solid, according to the US Department of Labor.
Given the backdrop, the USD/MXN pair extended its losses beneath the crucial 20.50 figure. However, the central bank divergence between the Federal Reserve (Fed) and Banxico suggests the exotic pair is poised for higher prices.
Toward the end of the week, the US economic docket will feature the release of the Fed’s favorite inflation gauge, the Personal Consumption Expenditures (PCE) Price Index, and Fed speakers. Regarding Mexico, the schedule is empty, but traders will await the release of Foreign Reserves on February 3.
Daily digest market movers: Mexico’s economic slowdown to weigh on Mexican Peso
- INEGI announced that Q4 2024 GDP shrank by -0.6% QoQ, more than the -0.2% contraction expected by economists and down from Q3 1.1% expansion. On a yearly comparison, GDP rose 0.6%, beneath forecasts for a 1.2% growth rate, its lowest rate since Q1 2021.
- The data supports Banxico’s dovish stance. The Mexican institution is expected to lower rates at least by 25 bps from 10% to 9.75%, though analysts from Capital Economics suggest that 50 bps of easing are on the table.
- Banxico Deputy Governor Omar Mejia Castelazo was dovish on Wednesday and said that Banxico has enough room to maneuver and calibrate monetary policy at upcoming monetary policy meetings.
- The US Department of Commerce revealed that Q4 GDP dipped from 3.1% to 2.3%, missing investors' estimates of 2.6%.
- Meanwhile, the US Department of Labor revealed that Initial Jobless Claims for the week ending January 24 increased by 207K, beneath forecasts of 220K and the previous week 223K.
- On Wednesday, the Fed kept rates unchanged at 4.25% - 4.50% on a unanimous vote, justifying their decision due to the strength of the US economy, the lack of progress on lowering inflation, and a recovery of the jobs market.
- Fed Chair Jerome Powell said the US central bank is in no rush to ease policy, reassuring that they don’t have a pre-set path regarding monetary policy.
- Money market futures have priced in 50 bps of Fed rate cuts in 2025, according to CME FedWatch Tool data.
USD/MXN technical outlook: Mexican Peso appreciates but is still poised to weaken to 20.50
The USD/MXN uptrend remains intact, although sellers pushed prices toward the 50-day Simple Moving Average at 20.39 but could not crack that area, opening the door for a recovery.
Although momentum shifted bearish, as depicted by the Relative Strength Index (RSI), bears need to clear the 50-day SMA and the January 24 swing low of 20.12. A breach of the latter could send the USD/MXN tumbling towards 20.00 and below.
Conversely, bulls seeking a recovery need to lift the exchange rate above 20.50 and challenge the January 29 high at 20.66, forming a ‘bullish engulfing’ chart pattern.
In that outcome, the USD/MXN's next resistance would be the year-to-date (YTD) high of 20.90, which is ahead of 21.00.
Mexican Peso FAQs
The Mexican Peso (MXN) is the most traded currency among its Latin American peers. Its value is broadly determined by the performance of the Mexican economy, the country’s central bank’s policy, the amount of foreign investment in the country and even the levels of remittances sent by Mexicans who live abroad, particularly in the United States. Geopolitical trends can also move MXN: for example, the process of nearshoring – or the decision by some firms to relocate manufacturing capacity and supply chains closer to their home countries – is also seen as a catalyst for the Mexican currency as the country is considered a key manufacturing hub in the American continent. Another catalyst for MXN is Oil prices as Mexico is a key exporter of the commodity.
The main objective of Mexico’s central bank, also known as Banxico, is to maintain inflation at low and stable levels (at or close to its target of 3%, the midpoint in a tolerance band of between 2% and 4%). To this end, the bank sets an appropriate level of interest rates. When inflation is too high, Banxico will attempt to tame it by raising interest rates, making it more expensive for households and businesses to borrow money, thus cooling demand and the overall economy. Higher interest rates are generally positive for the Mexican Peso (MXN) as they lead to higher yields, making the country a more attractive place for investors. On the contrary, lower interest rates tend to weaken MXN.
Macroeconomic data releases are key to assess the state of the economy and can have an impact on the Mexican Peso (MXN) valuation. A strong Mexican economy, based on high economic growth, low unemployment and high confidence is good for MXN. Not only does it attract more foreign investment but it may encourage the Bank of Mexico (Banxico) to increase interest rates, particularly if this strength comes together with elevated inflation. However, if economic data is weak, MXN is likely to depreciate.
As an emerging-market currency, the Mexican Peso (MXN) tends to strive during risk-on periods, or when investors perceive that broader market risks are low and thus are eager to engage with investments that carry a higher risk. Conversely, MXN tends to weaken at times of market turbulence or economic uncertainty as investors tend to sell higher-risk assets and flee to the more-stable safe havens.
- The Dow Jones Industrial Average treaded water near 44,800 on Thursday.
- Equities are tepid as markets digest recent developments and mixed earnings.
- US data split on Thursday, with better unemployment claims but lagging GDP growth.
The Dow Jones Industrial Average (DJIA) churned on Thursday, marking in tracks around 44,700 but sticking close to the day’s opening bids. Equity markets are still digesting this week’s earnings reports from heavy-hitters like Microsoft (MSFT) and Tesla (TSLA), both of which missed the bottom line on fourth-quarter performance.
Along with Microsoft and Tesla, Meta Platforms (META) was the third megacap tech company to report Q4 earnings during Wednesday’s overnight session. Meta traded into a new all-time high post-earnings, while Tesla managed to shrug off misses in both earnings growth and revenue. Microsoft’s share price backslid after missing market expectations, keeping the tech sector hobbled on Thursday.
United States (US) Gross Domestic Product (GDP) grew by just 2.3% QoQ on an annualized basis in Q4, missing the median forecast of 2.6% and falling even further from the previous quarter’s 3.1%. The sharp warning shot across the bow of headline growth flummoxed equities, sparking a deer-in-the-headlights freeze from traders expecting better.
US Initial Jobless Claims for the week ended January 24 beat expectations, helping to bolster investor sentiment somewhat, but the figure is well within recent norms. Week-over-week new unemployment benefits seekers clocked in at 207K, beating the market’s expected print of 220K. The previous week showed 223K net new unemployment claimants.
Dow Jones news
Most of the Dow Jones’ listed securities are trading into the green on Thursday, though concentrated losses in the tech sector are keeping the overall index hobbled in the midrange. Nvidia lost another 3.5%, falling below $120 per share as the tech glut continues, adding to previous losses after China’s DeepSeek threw a spanner in the market’s comfortable assumption that US-based AI tech companies had the industry on lockdown. Microsoft tumbled 6% after missing earnings expectations, falling into $415 per share.
Dow Jones price forecast
The Dow Jones Industrial Average is struggling to make headway in the back half of the trading week, with intraday bids getting stuck in the mire around 44,800. Despite near-term waffling, the overall index is still tilted firmly into the bullish side, free-floating close to record highs above 45,000. The Dow Jones is up over 7.5% from its last swing low below 42,000, and has closed in the green for all but three of the last 12 consecutive trading days.
Dow Jones daily chart
Dow Jones FAQs
The Dow Jones Industrial Average, one of the oldest stock market indices in the world, is compiled of the 30 most traded stocks in the US. The index is price-weighted rather than weighted by capitalization. It is calculated by summing the prices of the constituent stocks and dividing them by a factor, currently 0.152. The index was founded by Charles Dow, who also founded the Wall Street Journal. In later years it has been criticized for not being broadly representative enough because it only tracks 30 conglomerates, unlike broader indices such as the S&P 500.
Many different factors drive the Dow Jones Industrial Average (DJIA). The aggregate performance of the component companies revealed in quarterly company earnings reports is the main one. US and global macroeconomic data also contributes as it impacts on investor sentiment. The level of interest rates, set by the Federal Reserve (Fed), also influences the DJIA as it affects the cost of credit, on which many corporations are heavily reliant. Therefore, inflation can be a major driver as well as other metrics which impact the Fed decisions.
Dow Theory is a method for identifying the primary trend of the stock market developed by Charles Dow. A key step is to compare the direction of the Dow Jones Industrial Average (DJIA) and the Dow Jones Transportation Average (DJTA) and only follow trends where both are moving in the same direction. Volume is a confirmatory criteria. The theory uses elements of peak and trough analysis. Dow’s theory posits three trend phases: accumulation, when smart money starts buying or selling; public participation, when the wider public joins in; and distribution, when the smart money exits.
There are a number of ways to trade the DJIA. One is to use ETFs which allow investors to trade the DJIA as a single security, rather than having to buy shares in all 30 constituent companies. A leading example is the SPDR Dow Jones Industrial Average ETF (DIA). DJIA futures contracts enable traders to speculate on the future value of the index and Options provide the right, but not the obligation, to buy or sell the index at a predetermined price in the future. Mutual funds enable investors to buy a share of a diversified portfolio of DJIA stocks thus providing exposure to the overall index.
- US Q4 GDP growth slows to 2.3%, missing estimates of 2.6%.
- Fed holds rates at 4.25%-4.50%, maintaining cautious stance on inflation progress.
- AUD/USD stands soft around 0.6235, RBA rate cut expectations limits upside.
The AUD/USD pair stands neutral around 0.6235 on Thursday, struggling to gain traction ahead of the US Q4 GDP data release. The Federal Reserve opted to keep interest rates steady but maintained a cautious tone, expressing concerns over stalled disinflation progress. Meanwhile, the Reserve Bank of Australia (RBA) is widely expected to shift toward a policy-easing stance in the coming month, further weighing on the Aussie.
US GDP misses forecasts, Fed holds rates steady
The latest US economic data showed that growth slowed in the final quarter of 2024. Preliminary figures revealed that GDP expanded at an annualized pace of 2.3%, falling short of the 2.6% consensus and marking a notable drop from the 3.1% growth seen in the previous quarter. The Personal Consumption Expenditures (PCE) price index jumped to 2.3%, reflecting stronger inflationary pressures, while core PCE remained steady at 2.2%, below expectations of 2.5%.
Additionally, US jobless claims declined more than expected, with initial claims falling to 207,000 from 223,000 the previous week, reinforcing the Fed’s cautious stance on potential rate cuts. The central bank left rates unchanged as anticipated but removed language about inflation progress toward the 2% target, signaling a more watchful approach. Fed Chair Jerome Powell later clarified that this change was not intended to send a signal about policy direction, which slightly softened the initial hawkish interpretation.
Investors are closely monitoring upcoming economic data, particularly the US Personal Consumption Expenditures (PCE) report on Friday, for further clues on the Fed’s policy trajectory. Meanwhile, sentiment around the Aussie remains weak as RBA rate cut bets intensify, with analysts at ANZ predicting a 25-basis-point reduction in February.
Technical overview
AUD/USD remains range-bound, showing limited upside momentum. The Relative Strength Index (RSI) sits at 47, still in negative territory but rising. Meanwhile, the MACD histogram prints green bars, hinting at potential upside correction.
Key resistance stands at 0.6250. On the downside, 0.6200 serves as key support, with a break below opening the door toward 0.6170. Until a clear breakout occurs, the pair is likely to remain in consolidation mode.
AUD/USD daily chart
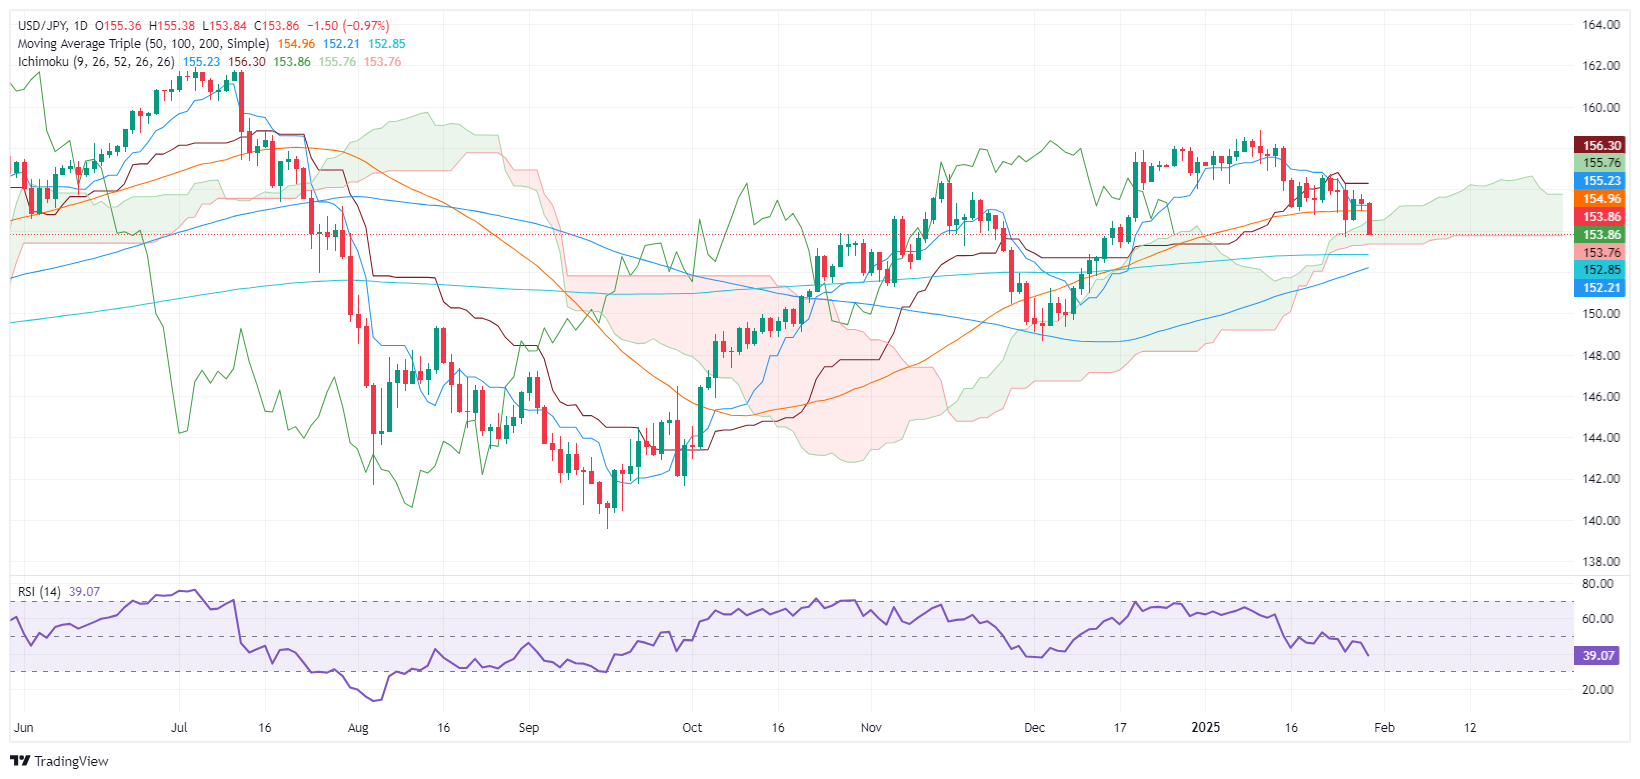
- USD/JPY falls as US GDP growth slows to 2.3%, below expected 2.6%.
- Improved jobless claims fail to boost dollar amid prevailing economic concerns.
- Yen strengthens from policy divergence; Fed holds rates while BoJ maintains tighter stance.
The USD/JPY retreats in early trading during the North American session after economic data showed the US economy grew lower than expected a day after the Federal Reserve (Fed) decided to keep rates unchanged. The pair trades at 154.09, down 0.76%.
USD/JPY dropped below 154.00 amid weaker-than-expected US economic growth
Data from the United States (US) weighed on the Greenback, as Gross Domestic Product (GDP) for the last quarter of 2024 dipped from 3.1% to 2.3%, missing investors' estimates of 2.6%. At the same time, the US Department of Labor revealed that Jobless Claims for the week ending January 25 increased by 207K beneath forecasts of 220K and the previous week 223K.
After the data, the USD/JPY extended its losses toward 153.83, but buyers reclaimed the 154.00 figure.
The Japanese Yen extended its gains as there was a divergence between the Bank of Japan (BoJ) and the Fed, favoring the former's appreciation. Therefore, further USD/JPY downside is seen, as US GDP data could signal the economy may be decelerating at a faster pace.
This week, the Japanese economic docket will feature the Unemployment Rate, Industrial Production, and Retail Sales. In the US, the Fed’s preferred inflation gauge, the Personal Consumption Expenditures (PCE) Price Index, and Fed speakers.
USD/JPY Price Forecast: Technical outlook
The USD/JPY has fallen inside the Ichimoku Cloud (Kumo), indicating that sellers are gathering momentum after clearing the 50-day Simple Moving Average (SMA) at 154.97. The Relative Strength Index (RSI) is bearish. Therefore, bears could be confident that they are in charge.
For a continuation they need to exit the Kumo, clearing the Senkou Span B at 153.76. Once done, sellers could drive the USD/JPY towards the 200-day SMA at 152.85 ahead of the 100-day SMA at 152.22.
Japanese Yen PRICE Today
The table below shows the percentage change of Japanese Yen (JPY) against listed major currencies today. Japanese Yen was the strongest against the US Dollar.
| USD | EUR | GBP | JPY | CAD | AUD | NZD | CHF | |
|---|---|---|---|---|---|---|---|---|
| USD | -0.24% | -0.22% | -0.97% | -0.11% | -0.04% | -0.00% | -0.12% | |
| EUR | 0.24% | 0.02% | -0.75% | 0.13% | 0.20% | 0.24% | 0.12% | |
| GBP | 0.22% | -0.02% | -0.79% | 0.11% | 0.18% | 0.22% | 0.09% | |
| JPY | 0.97% | 0.75% | 0.79% | 0.87% | 0.94% | 0.94% | 0.85% | |
| CAD | 0.11% | -0.13% | -0.11% | -0.87% | 0.07% | 0.10% | -0.02% | |
| AUD | 0.04% | -0.20% | -0.18% | -0.94% | -0.07% | 0.03% | -0.08% | |
| NZD | 0.00% | -0.24% | -0.22% | -0.94% | -0.10% | -0.03% | -0.13% | |
| CHF | 0.12% | -0.12% | -0.09% | -0.85% | 0.02% | 0.08% | 0.13% |
The heat map shows percentage changes of major currencies against each other. The base currency is picked from the left column, while the quote currency is picked from the top row. For example, if you pick the Japanese Yen from the left column and move along the horizontal line to the US Dollar, the percentage change displayed in the box will represent JPY (base)/USD (quote).
- The European Central Bank trimmed interest rates by 25 bps as widely anticipated.
- The preliminary estimate of the Q4 Gross Domestic Product resulted weaker than anticipated.
- XAU/USD pressures record highs and is on its way to test the $2,800 threshold.
XAU/USD trades dangerously close to its record high in the $2,790 region as the latest macroeconomic developments put pressure on the US Dollar (USD).
Ahead of Wall Street’s opening, the European Central Bank (ECB) announced its decision on monetary policy. The ECB lowered key rates by 25 basis points (bps) each, as expected. With this decision, the interest rate on the main refinancing operations and the interest rates on the marginal lending facility and the deposit facility stood at 2.9%, 3.15% and 2.75%, respectively.
The accompanying statement and the subsequent President Christine Lagarde’s press conference showed that European policymakers are still concerned about economic progress, although not that concerned about inflation. The presser had a dovish tilt and left the door open for additional rate cuts in the upcoming months.
At the same time, The United States (US) released the first preliminary of the Q4 Gross Domestic Product (GDP), which showed that the economy grew at an annualized pace of 2.3% in the three months to December, below the 2.6% expected and the 3.1% posted in Q3. Additionally, the core Personal Consumption Expenditures Price Index increased by 2.5% on a quarterly basis, matching the market consensus. The US also published Initial Jobless Claims for the week ended January 24, which unexpectedly improved to 207K from the previous 223K.
The weak growth-related data further undermined USD demand.
XAU/USD technical outlook
The bright metal is nearing its all-time high at $2,790.11 and seems poised to run beyond it, towards the $2,800 mark, the initial natural target. Sellers are likely to reappear around the latter, albeit the dominant market sentiment should keep the bullish trend alive. Additional gains in the near term should see XAU/USD reach the $2,810/20 region.
Pullbacks will likely attract buyers, with a near-term support level at $2,771.90, Jan 27 intraday high. As long as the area holds, bulls will retain control.
While a few false dawns have emerged in the past, spot and futures prices are both finally breaking out of the wedge that has contained Silver markets from the 2024's local top not reached since 2012, TDS' Senior Commodity Strategist Daniel Ghali notes.
A confirmed break from the wedge may attract further interest
"The breakout in futures markets is relevant as it is likely to catalyze CTA buying activity which directly attracts new directional inflows, which may become self-reinforcing. The break north of $31.55/oz in SIH5 will only force CTAs to buy +4% of their max size, but CTAs will continue to buy Silver in (nearly) every scenario for prices over the coming sessions, barring a sharp reversal (akin with a big downtape)."
A confirmed break from the wedge may also attract further discretionary trader interest, particularly with Gold prices pushing towards all-time highs, given evidence that while this cohort may be involved in the EFP dislocation, they remain directionally flat.
Gold prices are pushing to new all-time highs as we expected, TDS' Senior Commodity Strategist Daniel Ghali notes.
Downside risk still remains limited in Gold
"The time to throw caution to the wind was in early-January, which featured a rare set-up in which a higher USD/rates would attract 'Mystery Buying', whereas a reversal in the USD/rates would attract macro fund interest, and as CTA buying activity continued to intermittently hit the tapes."
"At new all-time highs, with every single trend signal already pointing to the upside, CTAs will have effectively reached their 'max long' position size, which will leave the onus on other cohorts to carry the torch. Looking forward, while no scenarios will lead CTAs to shed their recently acquired length over the coming week, macro funds only held ~20% of their max size remaining to deploy as of last week, which limits the scope of dry-powder that can still be deployed."
"Overall, downside risk still remains limited in Gold, but the upward impulse for the ongoing rally is starting to subside. Gold bulls need to reload some bullets. The set-up for flows in silver is superior."
- USD/CAD trades lower despite a sharp decline in the US Dollar after the US Q4 GDP and Initial Jobless Claims data.
- The US economy rose at a slower pace of 2.3% YoY, compared to estimates and the Q3 reading of 2024.
- BoC Macklem warned that Trump’s tariffs could lead to significant economic damage.
The USD/CAD pair trades in a subdued manner above the key support of 1.4400 in Thursday’s North American session. The Loonie pair is broadly sideways despite the US Dollar (USD) faces a sharp selling pressure after the release of the weak United States (US) Q4 Gross Domestic Product (GDP) data and lower Initial Jobless Claims for the week ending January 24, suggesting a significant weakness in the Canadian Dollar (CAD).
The US Bureau of Economic Analysis (BEA) has reported that the economy expanded at an annualized rate of 2.3%, slower than estimates of 2.6% and the 2.6% growth seen in the third quarter of 2024.
A slower pace in economic expansion is unlikely to boost the Federal Reserve (Fed) significantly as market participants expect US President Donald Trump’s economic policies, such as immigration controls, higher tariffs, and lower taxes, will be pro-growth and inflationary for the economy. A stubborn inflation outlook and strong growth prospects are unlikely to force the Fed to revert to the expansionary policy stance that it followed in the second half of 2024.
On Wednesday, the Fed announced a pause in the policy-easing cycle and left interest rates unchanged at 4.25%- 4.50%. Fed Chair Jerome Powell said the committee is very much in the “mode of waiting “to see what “policies are enacted” and how they will impact the economy.
Meanwhile, the Canadian Dollar (CAD) underperforms. Bank of Canada (BoC) Governor Tiff Macklem expressed concerns about the economic outlook due to the likely US tariffs in the monetary policy announcement on Wednesday, in which the BoC cut interest rates by 25 basis points (bps) to 3%.
"A long-lasting and broad-based trade conflict would badly hurt economic activity in Canada," Macklem said.
The BoC also reduced its growth forecasts for the current year and 2026 to 1.8%, without accounting the impact of likely US tariffs.
Canadian Dollar FAQs
The key factors driving the Canadian Dollar (CAD) are the level of interest rates set by the Bank of Canada (BoC), the price of Oil, Canada’s largest export, the health of its economy, inflation and the Trade Balance, which is the difference between the value of Canada’s exports versus its imports. Other factors include market sentiment – whether investors are taking on more risky assets (risk-on) or seeking safe-havens (risk-off) – with risk-on being CAD-positive. As its largest trading partner, the health of the US economy is also a key factor influencing the Canadian Dollar.
The Bank of Canada (BoC) has a significant influence on the Canadian Dollar by setting the level of interest rates that banks can lend to one another. This influences the level of interest rates for everyone. The main goal of the BoC is to maintain inflation at 1-3% by adjusting interest rates up or down. Relatively higher interest rates tend to be positive for the CAD. The Bank of Canada can also use quantitative easing and tightening to influence credit conditions, with the former CAD-negative and the latter CAD-positive.
The price of Oil is a key factor impacting the value of the Canadian Dollar. Petroleum is Canada’s biggest export, so Oil price tends to have an immediate impact on the CAD value. Generally, if Oil price rises CAD also goes up, as aggregate demand for the currency increases. The opposite is the case if the price of Oil falls. Higher Oil prices also tend to result in a greater likelihood of a positive Trade Balance, which is also supportive of the CAD.
While inflation had always traditionally been thought of as a negative factor for a currency since it lowers the value of money, the opposite has actually been the case in modern times with the relaxation of cross-border capital controls. Higher inflation tends to lead central banks to put up interest rates which attracts more capital inflows from global investors seeking a lucrative place to keep their money. This increases demand for the local currency, which in Canada’s case is the Canadian Dollar.
Macroeconomic data releases gauge the health of the economy and can have an impact on the Canadian Dollar. Indicators such as GDP, Manufacturing and Services PMIs, employment, and consumer sentiment surveys can all influence the direction of the CAD. A strong economy is good for the Canadian Dollar. Not only does it attract more foreign investment but it may encourage the Bank of Canada to put up interest rates, leading to a stronger currency. If economic data is weak, however, the CAD is likely to fall.
Christine Lagarde, President of the European Central Bank (ECB), explains the ECB's decision to lower key rates by 25 basis points at the January policy meeting and responds to questions from the press.
Key quotes
"There is recovery."
"Economy is not at potential yet."
"There is no stagflation."
"Yield increase is a global process spilled over from United States."
"Yield increase doesn't stop monetary policy from transmitting."
"Debate about neutral rate is entirely premature."
"I cannot tell you if we have to go below neutral."
Interest rates FAQs
Interest rates are charged by financial institutions on loans to borrowers and are paid as interest to savers and depositors. They are influenced by base lending rates, which are set by central banks in response to changes in the economy. Central banks normally have a mandate to ensure price stability, which in most cases means targeting a core inflation rate of around 2%. If inflation falls below target the central bank may cut base lending rates, with a view to stimulating lending and boosting the economy. If inflation rises substantially above 2% it normally results in the central bank raising base lending rates in an attempt to lower inflation.
Higher interest rates generally help strengthen a country’s currency as they make it a more attractive place for global investors to park their money.
Higher interest rates overall weigh on the price of Gold because they increase the opportunity cost of holding Gold instead of investing in an interest-bearing asset or placing cash in the bank. If interest rates are high that usually pushes up the price of the US Dollar (USD), and since Gold is priced in Dollars, this has the effect of lowering the price of Gold.
The Fed funds rate is the overnight rate at which US banks lend to each other. It is the oft-quoted headline rate set by the Federal Reserve at its FOMC meetings. It is set as a range, for example 4.75%-5.00%, though the upper limit (in that case 5.00%) is the quoted figure. Market expectations for future Fed funds rate are tracked by the CME FedWatch tool, which shapes how many financial markets behave in anticipation of future Federal Reserve monetary policy decisions.
Christine Lagarde, President of the European Central Bank (ECB), explains the ECB's decision to lower key rates by 25 basis points at the January policy meeting and responds to questions from the press.
Key quotes
"Premature to have a discussion about terminal rate."
"We know direction of travel, sequence and magnitude will be informed by data and analysis."
"We did not even utter 50 basis points."
"We are confident that inflation will hit target in 2025."
"Services and in particular domestic inflation are still resisting, have gone up a little bit."
"All indicators for wages are heading downward, confirming our confidence."
ECB FAQs
The European Central Bank (ECB) in Frankfurt, Germany, is the reserve bank for the Eurozone. The ECB sets interest rates and manages monetary policy for the region. The ECB primary mandate is to maintain price stability, which means keeping inflation at around 2%. Its primary tool for achieving this is by raising or lowering interest rates. Relatively high interest rates will usually result in a stronger Euro and vice versa. The ECB Governing Council makes monetary policy decisions at meetings held eight times a year. Decisions are made by heads of the Eurozone national banks and six permanent members, including the President of the ECB, Christine Lagarde.
In extreme situations, the European Central Bank can enact a policy tool called Quantitative Easing. QE is the process by which the ECB prints Euros and uses them to buy assets – usually government or corporate bonds – from banks and other financial institutions. QE usually results in a weaker Euro. QE is a last resort when simply lowering interest rates is unlikely to achieve the objective of price stability. The ECB used it during the Great Financial Crisis in 2009-11, in 2015 when inflation remained stubbornly low, as well as during the covid pandemic.
Quantitative tightening (QT) is the reverse of QE. It is undertaken after QE when an economic recovery is underway and inflation starts rising. Whilst in QE the European Central Bank (ECB) purchases government and corporate bonds from financial institutions to provide them with liquidity, in QT the ECB stops buying more bonds, and stops reinvesting the principal maturing on the bonds it already holds. It is usually positive (or bullish) for the Euro.
Christine Lagarde, President of the European Central Bank (ECB), explains the ECB's decision to lower key rates by 25 basis points at the January policy meeting and responds to questions from the press.
Key quotes
"Inflation to fluctuate around its current level in the near term."
"Longer-term inflation expectations continue to stand at around 2%."
"Risks to growth remain tilted to downside."
"Risk of a greater friction in global trade could weigh on Euro area growth."
"Wages, profits, geopolitical tensions among upside risks to inflation."
"Downside risks to inflation include low confidence, geopolitical stress."
"Frictions in global trade would make inflation outlook more uncertain."
Euro FAQs
The Euro is the currency for the 19 European Union countries that belong to the Eurozone. It is the second most heavily traded currency in the world behind the US Dollar. In 2022, it accounted for 31% of all foreign exchange transactions, with an average daily turnover of over $2.2 trillion a day. EUR/USD is the most heavily traded currency pair in the world, accounting for an estimated 30% off all transactions, followed by EUR/JPY (4%), EUR/GBP (3%) and EUR/AUD (2%).
The European Central Bank (ECB) in Frankfurt, Germany, is the reserve bank for the Eurozone. The ECB sets interest rates and manages monetary policy. The ECB’s primary mandate is to maintain price stability, which means either controlling inflation or stimulating growth. Its primary tool is the raising or lowering of interest rates. Relatively high interest rates – or the expectation of higher rates – will usually benefit the Euro and vice versa. The ECB Governing Council makes monetary policy decisions at meetings held eight times a year. Decisions are made by heads of the Eurozone national banks and six permanent members, including the President of the ECB, Christine Lagarde.
Eurozone inflation data, measured by the Harmonized Index of Consumer Prices (HICP), is an important econometric for the Euro. If inflation rises more than expected, especially if above the ECB’s 2% target, it obliges the ECB to raise interest rates to bring it back under control. Relatively high interest rates compared to its counterparts will usually benefit the Euro, as it makes the region more attractive as a place for global investors to park their money.
Data releases gauge the health of the economy and can impact on the Euro. Indicators such as GDP, Manufacturing and Services PMIs, employment, and consumer sentiment surveys can all influence the direction of the single currency. A strong economy is good for the Euro. Not only does it attract more foreign investment but it may encourage the ECB to put up interest rates, which will directly strengthen the Euro. Otherwise, if economic data is weak, the Euro is likely to fall. Economic data for the four largest economies in the euro area (Germany, France, Italy and Spain) are especially significant, as they account for 75% of the Eurozone’s economy.
Another significant data release for the Euro is the Trade Balance. This indicator measures the difference between what a country earns from its exports and what it spends on imports over a given period. If a country produces highly sought after exports then its currency will gain in value purely from the extra demand created from foreign buyers seeking to purchase these goods. Therefore, a positive net Trade Balance strengthens a currency and vice versa for a negative balance.
Christine Lagarde, President of the European Central Bank (ECB), explains the ECB's decision to lower key rates by 25 basis points at the January policy meeting and responds to questions from the press.
Key quotes
"The economy is set to remain weak in the near term."
"Manufacturing continues to contract, while services activity is expanding."
"Conditions for a recovery remain in place."
"Labor market remains robust."
"If trade tensions don't escalate, exports should support recovery as global demand rises."
ECB FAQs
The European Central Bank (ECB) in Frankfurt, Germany, is the reserve bank for the Eurozone. The ECB sets interest rates and manages monetary policy for the region. The ECB primary mandate is to maintain price stability, which means keeping inflation at around 2%. Its primary tool for achieving this is by raising or lowering interest rates. Relatively high interest rates will usually result in a stronger Euro and vice versa. The ECB Governing Council makes monetary policy decisions at meetings held eight times a year. Decisions are made by heads of the Eurozone national banks and six permanent members, including the President of the ECB, Christine Lagarde.
In extreme situations, the European Central Bank can enact a policy tool called Quantitative Easing. QE is the process by which the ECB prints Euros and uses them to buy assets – usually government or corporate bonds – from banks and other financial institutions. QE usually results in a weaker Euro. QE is a last resort when simply lowering interest rates is unlikely to achieve the objective of price stability. The ECB used it during the Great Financial Crisis in 2009-11, in 2015 when inflation remained stubbornly low, as well as during the covid pandemic.
Quantitative tightening (QT) is the reverse of QE. It is undertaken after QE when an economic recovery is underway and inflation starts rising. Whilst in QE the European Central Bank (ECB) purchases government and corporate bonds from financial institutions to provide them with liquidity, in QT the ECB stops buying more bonds, and stops reinvesting the principal maturing on the bonds it already holds. It is usually positive (or bullish) for the Euro.
The JPY has extended its better tone today, reinforcing its position as the best performing G10 currency on a 1 day, 5 day and month-to-date view, Rabobank's FX analyst Jane Foley notes.
JPY extends its better tone today
"This morning’s move took USD/JPY back below 155.00. So far this month, the currency pair has struggled to hold breaks of this level, with price action running into support at the upper boundary of the Ichimoku cloud."
"On the back of remarks from Deputy BoJ Governor Himino this morning, JPY bulls appear to be more confident about the resolve of policymakers to hike rates in 2025. That said, currently market implied policy rates suggest only 29 bps of policy tightening is priced in on a 1-year view. We maintain our year end forecast of USD/JPY145.00."
"We favour selling USD/JPY into rallies. A break below the Ichimoku cloud around USD/JPY 153.35 would be a bearish signal."
- Initial Jobless Claims came short of consensus, increasing to 207K.
- Continuing Jobless Claims climbed to 1.858M in the week ending January 18.
US citizens filing new applications for unemployment insurance rose to 207K for the week ending January 25, as reported by the US Department of Labor (DoL) on Thursday. This print missed initial estimates and was lower than the previous week's unrevised tally of 223K.
The report also highlighted a seasonally adjusted insured unemployment rate of 1.2%, while the four-week moving average retreated to 212.50K, marking a decrease of 1K from the prior week’s unrevised average.
Moreover, Continuing Jobless Claims went down by 42K to reach 1.858M for the week ending January 18.
Market reaction
The Greenback maintains its bullish bias for the third consecutive day around the 108.00 neighbourhood when measured by the US Dollar Index (DXY) amid the broad-based decline in US yields and investors' assessment of the Fed’s hawkish hold on Wednesday.
UK lending data was a bit firmer than expected in December; data showed stronger demand for mortgages and lending secured on housing, Scotiabank's Chief FX Strategist Shaun Osborne notes.
UK December lending data a little firmer than f/c
"Data also showed a strong jump in net foreign demand for UK gilts at the end of the year, suggesting foreign investors are looking through the recent concerns about the sustainability of the government’s fiscal plans amid the rise in global bond yields."
"GBP tested the 1.24 area briefly yesterday but the dip drew a positive reaction on the charts, forming a bullish “hammer” signal on the daily candle. Overnight gains have stalled around 1.2460— initial resistance now—however. Cable may have to retest the 1.2390/00 zone or 1.2460 before a stronger sense of direction can emerge."
The Canadian Dollar (CAD) is little changed. The BoC policy decision yesterday suggested a cautious outlook for monetary policy amid heightened uncertainty around tariffs. The Bank assumed risks around the 2% inflation target were balanced, suggesting little appetite for more easing, all else equal, Scotiabank's Chief FX Strategist Shaun Osborne notes.
Joly 'cautiously optimistic' after Rubio talks
"Of course, it may not be equal; tariff risks are significant and the Bank noted that a broad-based, long-lasting trade conflict would hurt Canadian growth significantly. How the Bank would respond hinges on the who, what and when of the tariff application and whether Canada responds. The MPR also noted that much of the CAD’s recent depreciation could be explained by uncertainty and the increased risk premium applied to the currency around the tariff outlook—rather than the Bank’s aggressive rate cutting strategy."
"The threat of 25% tariffs on Canada only really emerged late in the US election campaign, at which point USD/CAD had already risen around 4.5big figures—close to half of the late year rise. The Bank’s position suggests there might be significant room for the CAD to rebound if tariff threats were to disappear. I would contend that the wide, short-term rate spread would limit the CAD’s ability to recover in a meaningful way at this point. Foreign Affairs Minister Joly said she was 'cautiously optimistic' after meeting Secretary of State Rubio yesterday but acknowledged the risk of hefty tariffs coming this weekend remains."
"Choppy range trade is likely to extend in the short run. The CAD is marginally firmer on the day so far after USD gains yesterday peaked around 1.4475 resistance. Key resistance is 1.4515 ahead of 1.47. The 40-day MA provides initial support (1.4349 today) ahead of key support at 1.4250/60."
The US Dollar (USD) is trading mixed to a little higher overall. Trading remains relatively quiet and movement in the major currencies remains largely confined to recent ranges, Scotiabank's Chief FX Strategist Shaun Osborne notes.
Markets are waiting for tariff news
"Stocks are trading mostly higher while bond markets are firmer; US 10Y yields are 2-3bps lower but Treasurys are lagging European bonds following the release of soft Eurozone GDP data. The Fed left its policy rate on hold yesterday and no-one was surprised. The policy statement did read a little hawkish on the face of it, with the reference to making progress towards the 2% inflation goal removed. "
"The Fed also said that unemployment had stabilized while the labor market remained solid. Markets moved a little on the apparent hawkish tilt implied by the dropped reference to inflation but Chair Powell downplayed the change, saying policymakers were just cleaning up the statement’s language. Regardless, a period of steady policy at least seems likely as the Fed sits back and assesses the economy and developments—including the Trump team’s plans—and the window for lower US rates this year appears to have narrowed a little."
"Powell noted there was no need to hurry on policy adjustment. It’s month end but that is not generating a lot of market interest, on the face of it. Markets may hold in ranges ahead of the weekend as investors await for news on whether the US will slap tariffs on Canada and Mexico."
The ECB is expected to cut its policy rate 25bps today, Scotiabank's Chief FX Strategist Shaun Osborne notes.
ECB cut widely expected
"There have been enough comments from more hawkish policymakers to suggest there will be a robust debate about policy amid current, heightened uncertainties but that may only emerge from the usual post-meeting leaks from 'people familiar' with today’s discussion. President Lagarde may not offer much guidance on the path forward for rates."
"Yield differentials remain a strong source of support for the USD and an ECB cut today will sustain the EUR’s negative spread over the USD after the Fed hold yesterday. But USD gains are unlikely to extend too far at the moment. The main hinderance on a USD advance remains positioning; everyone already seems long. Eurozone GDP wasunchanged in Q4, a little weaker than consensus expectations for a 0.1% rise, and up 0.9%."
"Spot is holding a narrow range in the low 1.04 area. The reversal in the EUR from Monday’s 1.0533 high signaled a short -term top/reversal in spot so losses are more likely than gains for now as the EUR corrects its rebound from 1.0178 over the second half of this month. Losses may extend to the low/mid 1.03s in the short run."
- AUD/USD trades sideways above 0.6200 ahead of US Q4 GDP data.
- The Fed guided a cautious stance on interest rates amid fears of stalling disinflation trend.
- Market participants are confident that the RBA will pivot to policy-easing next month.
The AUD/USD pair trades in a tight range around 0.6220 in Thursday’s European session. The Aussie pair struggles for a direction, following the footprints of the US Dollar (USD), which is lacklustre after the Federal Reserve’s (Fed) monetary policy announcement in which it kept interest rates steady in the range of 4.25%-4.50%.
The Fed was already anticipated to maintain status quo as progress in the disinflation trend towards the central bank’s target of 2% has slowed. In the press conference, Fed Chair Jerome Powell guided to hold interest rates at their current levels until the central bank sees "real progress on inflation or at least some weakness in the labor market”.
Meanwhile, investors await the United States (US) Q4 Gross Domestic Product (GDP) data, which will be published at 13:30 GMT.
Economists expect the US economy to have expanded at an annualized rate of 2.6%, slower than 3.1% growth seen in the third quarter of 2024. Signs of strong GDP growth would add to expectations that the Federal Reserve (Fed) will keep interest rates at their current levels for longer. On the contrary, signals of slower growth rate are unlikely to impact expectations for Fed’s interest rate stance as investors see US President Donald Trump’s economic agenda as pro-growth and inflationary for the economy.
On the Aussie front, the Australian Dollar (AUD) performs weakly amid growing expectations that the Reserve Bank of Australia (RBA) will start reducing interest rates from the policy meeting in February. Analysts at ANZ said that a “sharper-than-expected” slowdown in inflation would provide the RBA with enough confidence to lower its Official Cash Rate by 25 basis points (bps) at its next meeting.
- The US Dollar trades flat after an uneventful Federal Reserve interest rate decision.
- Fed Chairman Powell did not kneel to President Trump’s pressure.
- The US Dollar Index (DXY) stuck at 108.00 and looking for direction.
The US Dollar Index (DXY), which tracks the performance of the US Dollar against six major currencies, trades flat at around 108.00 at the time of writing on Thursday. All eyes shift to the European Central Bank (ECB), where a 25 basis point (bps) interest rate cut is expected. After the rather hawkish pause from the Federal Reserve (Fed), markets want to see if the ECB will comment on the US political scene with Donald Trump back in office.
That is something Fed Chairman Jerome Powell did not do. He refused to comment on any question referring to President Donald Trump. Several traders are even seeing the hawkish hold from the Fed as a message to Trump that the central bank will remain data dependent, not White House dependent. All this is combined with the fourth quarter preliminary US Gross Domestic Product (GDP) release later this Thursday.
Daily digest market movers: US Consumer in focus
- Asian markets will remain quiet this week due to the Lunar New Year, which started on Tuesday, with Chinese traders returning to the markets on February 5.
- At 13:15 GMT, the European Central Bank will publish its interest rate decision and monetary policy statement.
- At 13:30 GMT, the fourth quarter preliminary US Gross Domestic Product will be released:
- Headline GDP is expected to soften to 2.6% from 3.1% in the previous quarter.
- The Personal Consumption Expenditure Prices (PCE) was at 1.5%, with no forecast available.
- The core PCE element is expected to increase by 2.5% from the previous 2.2%.
- The US Jobless Claims for the week ending July 24 are due as well at 13:30 GMT, with Initial Claims expected to ease to 220,000, from 223,000 last week. Continuing Claims are set to soften to 1.890 million, from 1.899 million last week.
- At 13:45 GMT, ECB Chairman Christine Lagarde will deliver her monetary policy speech and proceed with the usual Q&A round.
- Equities are off to a good start this Thursday, ahead of the expected ECB interest rate cut decision. All European indices are in the green with the German Dax reaching a fresh all-time high. US futures are all in the green as well.
- The CME FedWatch tool projects an 80.0% chance for no change in the Fed’s policy rate for its next meeting on March 19.
- The US 10-year yield is trading around 4.50% and looks to turn softer, flirting with a fresh low for this year, which stands at 4.496%.
US Dollar Index Technical Analysis: A clash to come
The US Dollar Index (DXY) is going nowhere while US yields are eking out more losses. The biggest concern for markets is the pressure from US President Trump over the Fed, with his demand to get rates and its borrowing cost lower. After last night’s Fed decision, things could heat up further as Trump could start to use more and more unconventional tools to influence the Fed, harming its credibility.
The psychological level of 108.00 is still to be recovered on a daily close, which proves to be a hard task. From there, 109.30 (July 14, 2022, high and rising trendline) is next to pare back last week’s losses. Further up, the next upside level to hit before advancing further remains at 110.79 (September 7, 2022, high).
On the downside, the 55-day Simple Moving Average (SMA) at 107.64 and the October 3, 2023, high at 107.35 acts as a double support the DXY price. For now, that looks to be holding, though the Relative Strength Index (RSI) still has some room for the downside. Hence, rather look for 106.52 or even 105.89 as better levels for US Dollar bulls to engage and trigger a reversal.
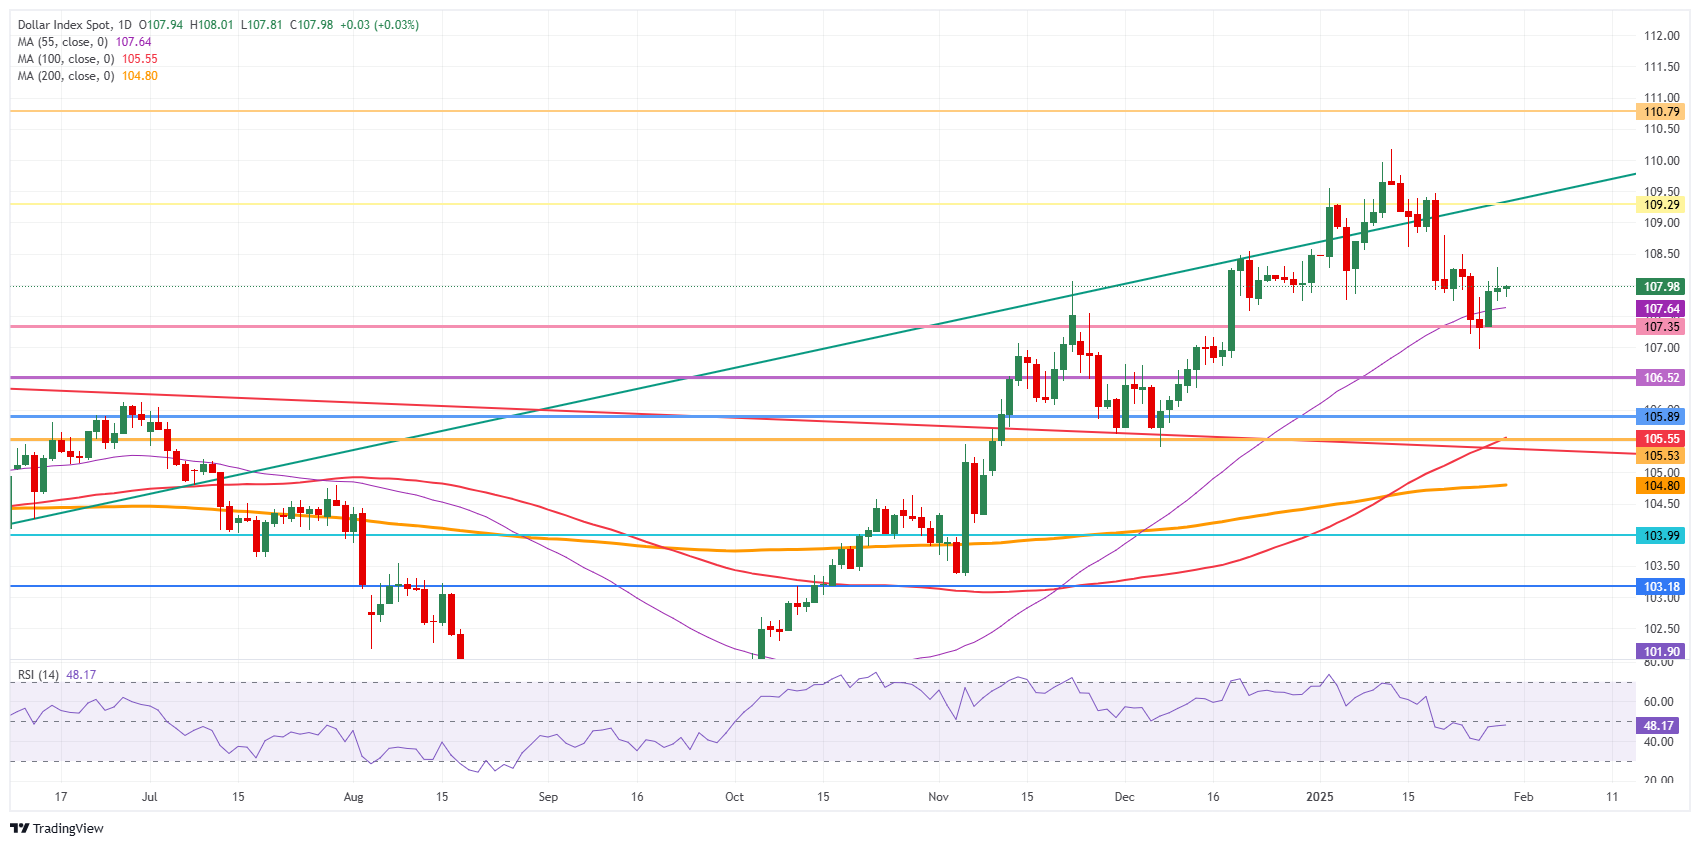
US Dollar Index: Daily Chart
US Dollar FAQs
The US Dollar (USD) is the official currency of the United States of America, and the ‘de facto’ currency of a significant number of other countries where it is found in circulation alongside local notes. It is the most heavily traded currency in the world, accounting for over 88% of all global foreign exchange turnover, or an average of $6.6 trillion in transactions per day, according to data from 2022. Following the second world war, the USD took over from the British Pound as the world’s reserve currency. For most of its history, the US Dollar was backed by Gold, until the Bretton Woods Agreement in 1971 when the Gold Standard went away.
The most important single factor impacting on the value of the US Dollar is monetary policy, which is shaped by the Federal Reserve (Fed). The Fed has two mandates: to achieve price stability (control inflation) and foster full employment. Its primary tool to achieve these two goals is by adjusting interest rates. When prices are rising too quickly and inflation is above the Fed’s 2% target, the Fed will raise rates, which helps the USD value. When inflation falls below 2% or the Unemployment Rate is too high, the Fed may lower interest rates, which weighs on the Greenback.
In extreme situations, the Federal Reserve can also print more Dollars and enact quantitative easing (QE). QE is the process by which the Fed substantially increases the flow of credit in a stuck financial system. It is a non-standard policy measure used when credit has dried up because banks will not lend to each other (out of the fear of counterparty default). It is a last resort when simply lowering interest rates is unlikely to achieve the necessary result. It was the Fed’s weapon of choice to combat the credit crunch that occurred during the Great Financial Crisis in 2008. It involves the Fed printing more Dollars and using them to buy US government bonds predominantly from financial institutions. QE usually leads to a weaker US Dollar.
Quantitative tightening (QT) is the reverse process whereby the Federal Reserve stops buying bonds from financial institutions and does not reinvest the principal from the bonds it holds maturing in new purchases. It is usually positive for the US Dollar.
- The Pound Sterling trades sideways against the US Dollar on Thursday as investors focus on the US Q4 GDP data.
- US President Trump vows to lower inflation himself through liberalization and ramping up Oil production.
- The BoE is expected to cut interest rates by 25 bps next week.
The Pound Sterling (GBP) ticks slightly higher to near 1.2460 against the US Dollar (USD) in European trading hours on Thursday. The GBP/USD consolidates as the US Dollar turns sideways ahead of the advanced Gross Domestic Product (GDP) report for the fourth quarter of 2024, which will be published at 13:30 GMT. Economists estimate the US economy expanded 2.6% year-over-year (YoY), slower than the 3.1% growth seen in the third quarter of 2024.
Investors should brace for more volatility in the US Dollar as the Personal Consumption Expenditure Price Index (PCE) data for December is scheduled to be released on Friday. The PCE price index data will show the current status of inflation. The core PCE inflation, the Federal Reserve’s (Fed) preferred inflation gauge is estimated to have grown in December by 0.2%, faster than 0.1% in November on a month-on-month basis, with yearly figures rising steadily by 2.8%.
On Wednesday, the Fed left interest rates unchanged in the range of 4.25%-4.50% as expected, and guided a cautious stance. Fed Chair Jerome Powell said in the press conference that further monetary policy adjustments would become appropriate only if the central bank sees "real progress on inflation or at least some weakness in the labor market”.
Fed’s decision to pause the current policy-easing cycle is opposite to President Donald Trump’s views who called for immediate rate cuts in his speech at the World Economic Forum (WEF) in Davos. Powell commented, “The committee is very much in the mode of waiting to see what policies are enacted.”
After Powell’s speech, Trump said in a post on his social media company, Truth Social, that the Fed has done a “terrible job on Bank Regulation”. Trump added that he would “lower inflation himself through various initiatives including energy production, American manufacturing and slashing regulation.”
Daily digest market movers: Pound Sterling gains as UK Reeves assures healthy trade relations with US
- The Pound Sterling trades strongly against its major peers, except for the Japanese Yen (JPY), in Thursday’s European session. The British currency strengthens as United Kingdom (UK) Chancellor of the Exchequer Rachel Reeves provides a roadmap to ramp up economic growth. Reeves unveiled various measures to boost growth prospects, including a "growth corridor" between the university cities of Oxford and Cambridge, in her speech at Oxfordshire.
- Rachel Reeves reiterated Prime Minister Keir Starmer's positive outlook on the economy, saying that the economy is on the brisk of a “turnaround” in a speech in Oxfordshire. She vowed to remove "stifling and unpredictable" regulations to boost productivity. Reeves also mentioned that she is looking to “deepen their relationship” with the United States (US) under the leadership of President Donald Trump and looks forward to working with the new Treasury Secretary Scott Bessent.
- However, the impact of Reeves’ economic agenda is unlikely to fix, at least immediately, the issues the nation is facing, which are forcing the Bank of England (BoE) to resume the rate-cut cycle from the policy meeting next week.
- BoE officials are scheduled to meet in February and are expected to cut interest rates by 25 basis points (bps) to 4.5%. This would be the third interest rate cut by the BoE since August when borrowing rates rose to 5.25%.
Technical Analysis: Pound Sterling consolidates around 1.2450
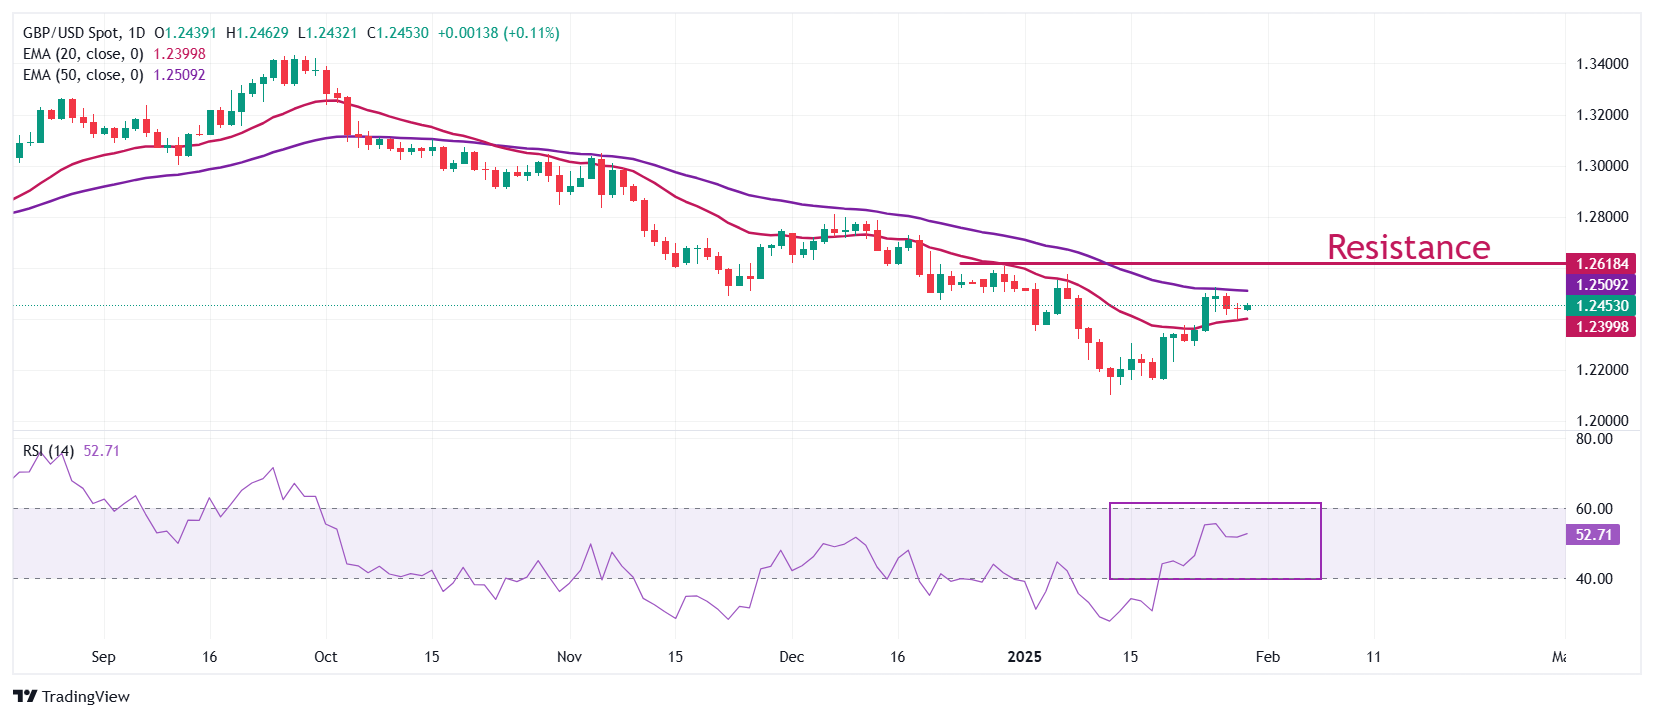
The Pound Sterling exhibits a sharp volatility contraction around 1.2450 against the US Dollar on Thursday. The near-term outlook for the GBP/USD pair remains firm as it holds the 20-day Exponential Moving Average (EMA), which trades around 1.2400. However, the 50-day EMA near 1.2510 continues to be a major barrier for Sterling bulls.
The 14-day Relative Strength Index (RSI) moves higher above 50.00 from the 20.00-40.00 range, suggesting that the bearish momentum has ended, at least for now.
Looking down, the January 13 low of 1.2100 and the October 2023 low of 1.2040 will act as key support zones for the pair. On the upside, the December 30 high of 1.2607 will act as key resistance.
The European Union’s carbon market has started the year strong, with prices rising above €82/t CO2e on several occasions after falling to an average of €67/t CO2e in 2024. A wind lull that swept over Europe so far this winter has lifted demand for fossil fuel generation and, with it, demand for carbon allowances, Rabobank's Energy Strategist Florence Schmit noes.
EU carbon market starts the year strong
"This shortfall in renewables, particularly in Germany, alongside higher gas prices, has lifted power prices across Europe above €100/MWh in January and reignited debates about the merits of interconnectors in some parts of the continent."
"Europe’s benchmark gas prices closed above €50/MWh on more than two days in January, as quicker-than-anticipated storage withdrawals alongside threats to LNG flows from the US to Malaysia have amplified supply concerns."
"The current high-price environment for power markets will ease once wind levels return and solar starts to make up a higher share of the power generation mix. Yet higher forecast gas prices for this year also lift our outlook for power markets. We forecast German baseload power prices to average €90/MWh and Spanish power to average €66/MWh in 2025."
The UK fiscal story and what it means for UK asset markets remain very much in play. UK Chancellor Rachel Reeves wants to change the narrative from painful tax rises for businesses to UK growth opportunities. That was the purpose of major policy announcements in Oxford yesterday. Those announcements could also be seen as an effort to sway the thinking of the Office of Budget Responsibility (OBR) as it scores the government's policy agenda ahead of a March review, ING's FX analyst Chris Turner notes.
GBP/USD and EUR/GBP to trade at 1.19/20 and 0.85 respectively
"Recall that the OBR still has relatively high UK growth forecasts up to 2030. And the government will be doing its utmost to persuade the OBR not to revise those forecasts down – which would only make the UK's fiscal position worse. We suspect the government will have to announce some fiscal consolidation in March, largely through real-time spending reductions in the later years of the forecast cycle."
"The relevance of the above is that it is also an effort to restore confidence to the UK gilt market. Another effort in this direction was the Bank of England's announcement on Tuesday of a new contingent facility – the CNRF – to lend cash to Non-Bank Financial Institutions (NBFIs) in the event of dislocation in the gilt market. This will be widely welcomed by the NBFI industry, although it seems less generous than the Fed's Bank Term Funding Progarmme, which lent cash against eligible collateral, without haircut, for a year. The BoE's CNRF tool only gets fired up if the BoE sees a crisis in the gilt market and seemingly only lends funds for one to weeks."
"While these efforts to restore confidence are very welcome – and have helped the sterling trade-weight index recover about 1% from lows earlier this month – we still feel sterling is vulnerable. Fiscal consolidation in March and a drop in services inflation through the second quarter should lead to a 100bp BoE easing cycle this year. This compares to just 68bp of easing priced by the market today. We see no reason to change our end-year GBP/USD and EUR/GBP forecasts of 1.19/20 and 0.85 respectively."
The Japanese Yen (JPY) is the top performing major currencies overnight. There is no fundamental trigger behind broad JPY strength, BBH FX analysts note.
BOJ policy rate to peak around 1.00% over the next two years
"Bank of Japan Deputy Governor Ryozo Himino reiterated the bank’s guidance that more hikes are in the pipeline if its economic and price outlooks are realized. Markets continues to imply the BOJ policy rate to peak around 1.00% over the next two years."
"This seems about right as the BOJ expects inflation to stabilize around its 2% target in 2026. Bottom line: the BOJ shallow policy normalization cycle is an ongoing headwind for JPY."
- USD/JPY falls sharply to near 154.30 amid strong performance by the Japanese Yen across the board.
- Bloating BoJ hawkish bets have increased the Yen’s appeal.
- The Fed kept its borrowing rates steady in the range of 4.25%-4.50% on Wednesday.
The USD/JPY pair slumps to near 154.30 in Thursday’s European session. The asset weakens as the Japanese Yen (JPY) performs strongly across the board amid growing expectations that the Bank of Japan (BoJ) will continue hiking interest rates this year.
Japanese Yen PRICE Today
The table below shows the percentage change of Japanese Yen (JPY) against listed major currencies today. Japanese Yen was the strongest against the New Zealand Dollar.
| USD | EUR | GBP | JPY | CAD | AUD | NZD | CHF | |
|---|---|---|---|---|---|---|---|---|
| USD | 0.00% | -0.03% | -0.62% | -0.13% | 0.02% | 0.07% | 0.03% | |
| EUR | -0.01% | -0.04% | -0.59% | -0.15% | 0.00% | 0.06% | 0.02% | |
| GBP | 0.03% | 0.04% | -0.60% | -0.11% | 0.04% | 0.10% | 0.02% | |
| JPY | 0.62% | 0.59% | 0.60% | 0.47% | 0.63% | 0.65% | 0.60% | |
| CAD | 0.13% | 0.15% | 0.11% | -0.47% | 0.16% | 0.21% | 0.12% | |
| AUD | -0.02% | -0.01% | -0.04% | -0.63% | -0.16% | 0.06% | -0.01% | |
| NZD | -0.07% | -0.06% | -0.10% | -0.65% | -0.21% | -0.06% | -0.08% | |
| CHF | -0.03% | -0.02% | -0.02% | -0.60% | -0.12% | 0.01% | 0.08% |
The heat map shows percentage changes of major currencies against each other. The base currency is picked from the left column, while the quote currency is picked from the top row. For example, if you pick the Japanese Yen from the left column and move along the horizontal line to the US Dollar, the percentage change displayed in the box will represent JPY (base)/USD (quote).
Dovish BoJ bets have accelerated on assumption that Japan's spring wage negotiations will result in strong hikes again this year. On Thursday, BoJ Deputy Governor Ryozo Himino also said that the central bank “will raise rates if economy and prices move in line with forecast”.
Meanwhile, the US Dollar (USD) trades sideways after the Federal Reserve’s (Fed) first monetary policy decision of the year in which it left interest rates unchanged in the range of 4.25%-4.50%, as expected. Fed Chair Jerome Powell guided that the central bank will resume the policy-easing cycle only when it sees some progress in disinflation towards the central bank’s target of 2% or some weakness in the labor market.
In Thursday’s session, investors will focus on the United States (US) Q4 Gross Domestic Product (GDP) data, which will be published at 13:30 GMT. On an annualized basis, the US economy is expected to have grown at a slower pace of 2.6%, compared to 3.1% growth seen in the third quarter of 2024.
USD/JPY trades below the upward-sloping trendline around 155.00, which is plotted from the September 13 low of 139.58 on a daily timeframe. The outlook of the asset has weakened as it trades below the 20- and 50-day Exponential Moving Averages (EMAs), which hovers around 155.90 and 155.10, respectively.
The 14-day Relative Strength Index (RSI) slides to near 40.00. A fresh bearish momentum would trigger if the RSI breaks below 40.00.
USD/JPY could see building of significant offers on a downside move below the January 27 low of 153.70, which would decline to near December 12 high of 151.80, followed by the December 11 low of 151.00.
On the contrary, an upside move above the January 23 high of 156.75 would drive the pair towards the January 15 high of 158.08 and the January 10 high of 158.88.
USD/JPY daily chart
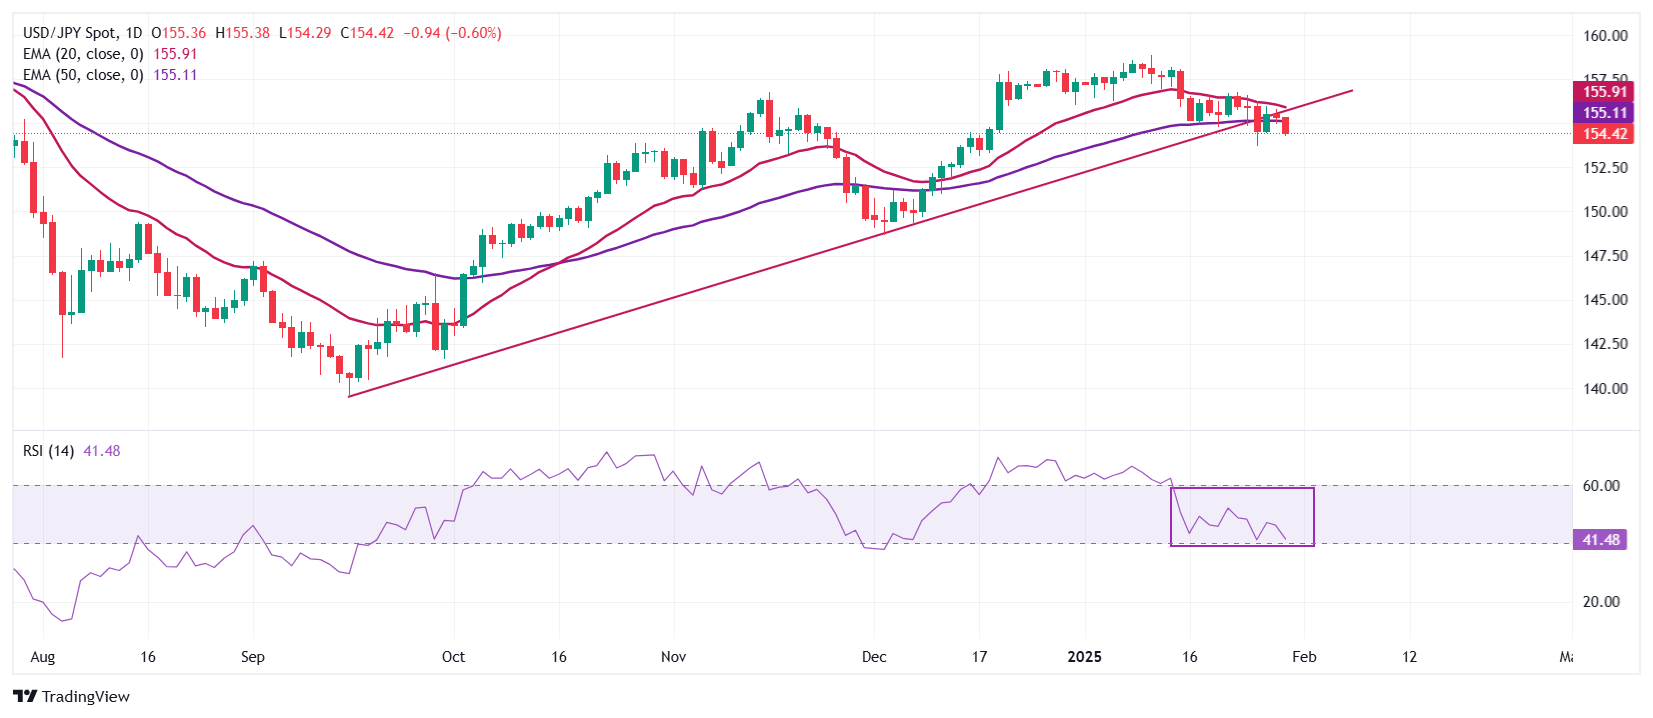
Japanese Yen FAQs
The Japanese Yen (JPY) is one of the world’s most traded currencies. Its value is broadly determined by the performance of the Japanese economy, but more specifically by the Bank of Japan’s policy, the differential between Japanese and US bond yields, or risk sentiment among traders, among other factors.
One of the Bank of Japan’s mandates is currency control, so its moves are key for the Yen. The BoJ has directly intervened in currency markets sometimes, generally to lower the value of the Yen, although it refrains from doing it often due to political concerns of its main trading partners. The BoJ ultra-loose monetary policy between 2013 and 2024 caused the Yen to depreciate against its main currency peers due to an increasing policy divergence between the Bank of Japan and other main central banks. More recently, the gradually unwinding of this ultra-loose policy has given some support to the Yen.
Over the last decade, the BoJ’s stance of sticking to ultra-loose monetary policy has led to a widening policy divergence with other central banks, particularly with the US Federal Reserve. This supported a widening of the differential between the 10-year US and Japanese bonds, which favored the US Dollar against the Japanese Yen. The BoJ decision in 2024 to gradually abandon the ultra-loose policy, coupled with interest-rate cuts in other major central banks, is narrowing this differential.
The Japanese Yen is often seen as a safe-haven investment. This means that in times of market stress, investors are more likely to put their money in the Japanese currency due to its supposed reliability and stability. Turbulent times are likely to strengthen the Yen’s value against other currencies seen as more risky to invest in.
As was widely expected, the Bank of Canada (BOC) slashed the policy rate 25bps to 3.00% yesterday. The BOC also announced two changes to its monetary policy implementation framework. These tweaks are technical and have no material monetary policy implications, BBH FX analysts report.
USD/CAD can move higher on risks of US/Canada trade war
"First, the BOC will end quantitative tightening and begin purchasing assets as part of normal balance sheet management in early March. Second, the BOC announced that the deposit rate will be set at a spread of 5bps below the policy rate (i.e.: 2.95%). The aim is to mitigate some of the upward pressure that has been seen on the overnight rate relative to the policy rate in recent months."
"More importantly, the BOC signaled it may pause easing while warning that US trade policy is a major source of uncertainty for Canada’s economy: (i) BOC emphasized again that “the cumulative reduction in the policy rate since last June is substantial” but scrapped previous easing guidance. (ii) BOC still projects inflation to remain close to the 2% target over the projection horizon. (iii) BOC projects GDP growth to rise above potential output in 2025 and 2026."
"Nonetheless, markets expect the BOC to deliver more rate cuts. We agree. Interest rate futures imply almost 75bps of BOC cuts over the next 12 months that should see the policy rate bottom near 2.25%. This would be at the lower end of the BOC’s neutral range estimate of 2.25% to 3.25%. While USD/CAD is extremely overvalued, the overshoot has more legs. FED/BOC policy trend, risk of all-out trade war between Canada and the US, and the Trump administration’s focus on lowering energy prices support a higher USD/CAD."
The Eurozone economy shows no growth in the three months to December of 2024 after reporting a 0.4% expansion in the third quarter, the preliminary estimate released by Eurostat showed Thursday.
The market consensus was for a 0.1% growth.
The bloc’s Gross Domestic Product (GDP) increased at an annual pace of 0.9% in Q4 versus 0.9% in Q3 and 1% expected.
Separately, the Eurozone Unemployment Rate increased to 6.3% in December, compared to November’s 6.2%.
EUR/USD reaction to the Eurozone GDP report
EUR/USD tests intraday lows near 1.0400 on the disappointing Eurozone data, down 0.12% on the day.
GDP FAQs
A country’s Gross Domestic Product (GDP) measures the rate of growth of its economy over a given period of time, usually a quarter. The most reliable figures are those that compare GDP to the previous quarter e.g Q2 of 2023 vs Q1 of 2023, or to the same period in the previous year, e.g Q2 of 2023 vs Q2 of 2022. Annualized quarterly GDP figures extrapolate the growth rate of the quarter as if it were constant for the rest of the year. These can be misleading, however, if temporary shocks impact growth in one quarter but are unlikely to last all year – such as happened in the first quarter of 2020 at the outbreak of the covid pandemic, when growth plummeted.
A higher GDP result is generally positive for a nation’s currency as it reflects a growing economy, which is more likely to produce goods and services that can be exported, as well as attracting higher foreign investment. By the same token, when GDP falls it is usually negative for the currency. When an economy grows people tend to spend more, which leads to inflation. The country’s central bank then has to put up interest rates to combat the inflation with the side effect of attracting more capital inflows from global investors, thus helping the local currency appreciate.
When an economy grows and GDP is rising, people tend to spend more which leads to inflation. The country’s central bank then has to put up interest rates to combat the inflation. Higher interest rates are negative for Gold because they increase the opportunity-cost of holding Gold versus placing the money in a cash deposit account. Therefore, a higher GDP growth rate is usually a bearish factor for Gold price.
- Gold is already up over 0.50% in the European trading session on Thursday.
- Markets read the Fed rate decision as hawkish ahead of the US GDP release.
- Gold's price could still reach a new all-time high and come as soon as a fresh catalyst appears.
Gold’s price (XAU/USD) trades back above $2,765 at the time of writing on Thursday and looks to be on its way again to a fresh all-time high. Bullion could not make that happen on Wednesday after a rather hawkish Federal Reserve (Fed) decision on interest rates. The main element that drew all the attention was Fed Chairman Jerome Powell’s reaction to questions about United States (US) President Donald Trump and his persistent call for substantially lower rates and borrowing costs.
A clash is coming, that looks to be certain, between the White House and the Federal Reserve. Fed Chairman Powell persistently refused to deliver any comments on questions from journalists around President Trump. The hawkish tilt from the Fed is a message to President Trump that the Fed remains independent and needs to see a clear and unambiguous weakening in the data to prompt further action.
Daily digest market movers: Ready for a fresh all-time high
- Markets perceived the Fed rate decision as rather hawkish as the Fed does not seem to be in a hurry to lower US interest rates, Bloomberg reports.
- A surge in Gold shipments to the US has led to a shortage of bullion in London, as traders amass a $82bn stockpile in New York due to fears of Trump administration tariffs, the Financial Times reports.
- The Gold Bar Integrity Database, developed by the London Bullion Market Association, has been launched. The database will trace the precious metal to prevent supply from criminal gangs or conflict zones ending up in bank vaults and stop counterfeit bars stamped with the logos of major refineries from entering the market, Bloomberg reports.
- The US Gross Domestic Product (GDP) data for the fourth quarter of 2024 will be released at 13:30 GMT.
Technical Analysis: Squeezing higher
Although the Fed’s interest rate decision on Wednesday was rather hawkish, that does not mean that Gold is barred from moving higher. In the US GDP report scheduled later this Thursday, the Personal Consumption Expenditures (PCE) component could trigger another leg up in Gold’s price, certainly if the number comes in softer than expected. That would mean a slowdown in the inflation metrics, which could quickly bring Gold up to the all-time high of $2,790.
The first line of support comes in at $2,721, a sort of double top in November and December broken on January 21. Just below that, $2,709 (October 23, 2024, low) is in focus as a second nearby support. In case both abovementioned levels snap, look for a dive back to $2,680 with a full-swing sell-off.
Conversely, that all-time high of $2,790 is very near now, less than 1% away from current levels. Once above that, a fresh all-time high will present itself. Meanwhile, some analysts and strategists have penciled in calls for $3,000, but $2,800 looks to be a good starting point as the next resistance on the upside.
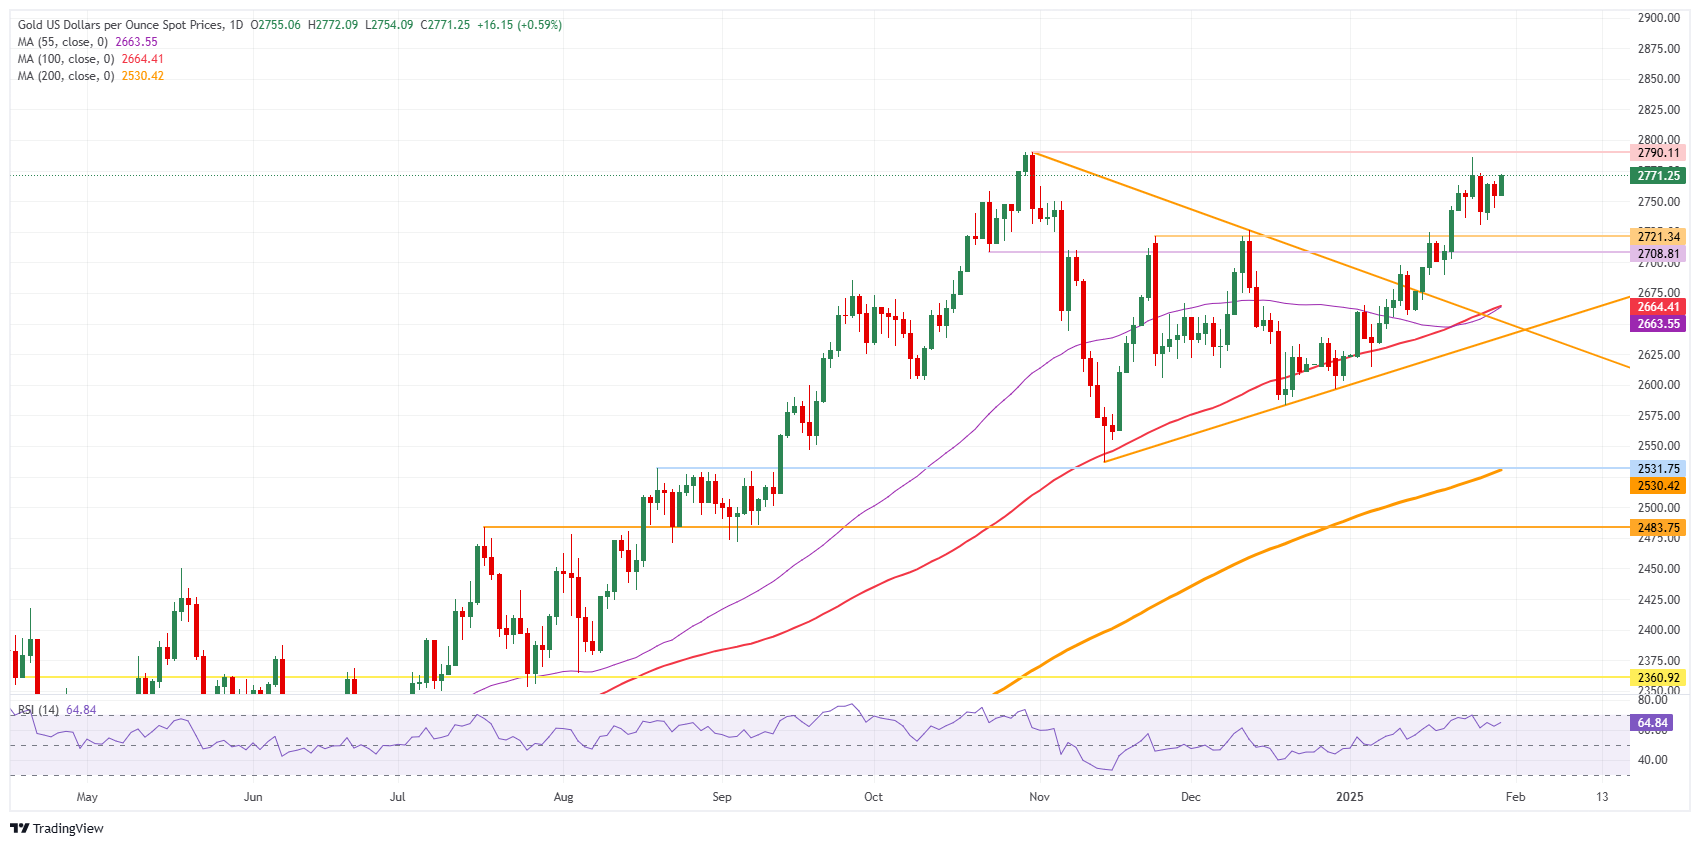
XAU/USD: Daily Chart
Fed FAQs
Monetary policy in the US is shaped by the Federal Reserve (Fed). The Fed has two mandates: to achieve price stability and foster full employment. Its primary tool to achieve these goals is by adjusting interest rates. When prices are rising too quickly and inflation is above the Fed’s 2% target, it raises interest rates, increasing borrowing costs throughout the economy. This results in a stronger US Dollar (USD) as it makes the US a more attractive place for international investors to park their money. When inflation falls below 2% or the Unemployment Rate is too high, the Fed may lower interest rates to encourage borrowing, which weighs on the Greenback.
The Federal Reserve (Fed) holds eight policy meetings a year, where the Federal Open Market Committee (FOMC) assesses economic conditions and makes monetary policy decisions. The FOMC is attended by twelve Fed officials – the seven members of the Board of Governors, the president of the Federal Reserve Bank of New York, and four of the remaining eleven regional Reserve Bank presidents, who serve one-year terms on a rotating basis.
In extreme situations, the Federal Reserve may resort to a policy named Quantitative Easing (QE). QE is the process by which the Fed substantially increases the flow of credit in a stuck financial system. It is a non-standard policy measure used during crises or when inflation is extremely low. It was the Fed’s weapon of choice during the Great Financial Crisis in 2008. It involves the Fed printing more Dollars and using them to buy high grade bonds from financial institutions. QE usually weakens the US Dollar.
Quantitative tightening (QT) is the reverse process of QE, whereby the Federal Reserve stops buying bonds from financial institutions and does not reinvest the principal from the bonds it holds maturing, to purchase new bonds. It is usually positive for the value of the US Dollar.
The latest data from the Shanghai Futures Exchange (SHFE) shows that weekly inventories for most of the base metals rose over the reporting week primarily due to weak consumption just ahead of the Lunar New Year holidays, ING's commodity experts Ewa Manthey and Warren Patterson note.
Base metals stocks rise across the board
"Copper stocks rose by 3,789 tons for a third consecutive week to 101,838 tons as of 29 January, the highest since 29 November 2024."
"Zinc inventories increased by 1,282 tons after declining for ten consecutive weeks to 21,781 tons and nickel inventories increased marginally by 101 tons for a third consecutive week to 36,150 tons (the highest since 14 February 2020) over the reporting week."
As the Bank of Canada concluded in two great articles in its Monetary Policy Report released yesterday, tariffs could be a massive game-changer, ING's FX analyst Chris Turner notes.
Investors are waiting for tariff news
"BoC calculated that 6% of the 7% rise in USD/CAD since October was down to a risk premium. Investors await tariff news either this weekend or, failing that, in April after the Commerce Department and the US Treasury conclude their review into why the US runs persistent trade deficits."
The US Dollar (USD) failed to hold very modest gains from the initially hawkish-sounding FOMC statement. Subsequent clarification comments from Chair Jay Powell through the press conference saw both USD rates and the dollar hand back those gains, ING's FX analyst Chris Turner notes.
DXY to head back to the 108.20 or even 108.50 area
"This leaves the market looking for two 25bp cuts this year – one in June and one in December – and awaiting both US data and the tariff story for their next big cues. Those dovish on the Fed will be hoping for some softer core PCE inflation data tomorrow (perhaps even a 0.1% MoM reading?) and expecting large and negative benchmark payroll revisions early next month to change the narrative on a robust US labour market."
"Elsewhere we note that Nvidia is struggling to reclaim much of Monday's sharp sell-off on the DeepSeek news – where most seem to be concluding that DeepSeek's progress could be good for productivity gains yet bad for those tech and energy companies in which those AI-centred profits are concentrated. In early Europe, S&P 500 futures are marked modestly higher after a mixed set of earnings results from MSFT, Tesla and META overnight."
"Today the US focus should be on a reasonably strong fourth-quarter GDP release, very much driven by strong consumption. This should prove another tick in the box for US exceptionalism and could see DXY heading back to the 108.20 or even 108.50 area – depending on ECB developments today."
Silver prices (XAG/USD) rose on Thursday, according to FXStreet data. Silver trades at $31.05 per troy ounce, up 0.94% from the $30.76 it cost on Wednesday.
Silver prices have increased by 7.46% since the beginning of the year.
| Unit measure | Silver Price Today in USD |
|---|---|
| Troy Ounce | 31.05 |
| 1 Gram | 1.00 |
The Gold/Silver ratio, which shows the number of ounces of Silver needed to equal the value of one ounce of Gold, stood at 89.39 on Thursday, down from 89.56 on Wednesday.
Silver FAQs
Silver is a precious metal highly traded among investors. It has been historically used as a store of value and a medium of exchange. Although less popular than Gold, traders may turn to Silver to diversify their investment portfolio, for its intrinsic value or as a potential hedge during high-inflation periods. Investors can buy physical Silver, in coins or in bars, or trade it through vehicles such as Exchange Traded Funds, which track its price on international markets.
Silver prices can move due to a wide range of factors. Geopolitical instability or fears of a deep recession can make Silver price escalate due to its safe-haven status, although to a lesser extent than Gold's. As a yieldless asset, Silver tends to rise with lower interest rates. Its moves also depend on how the US Dollar (USD) behaves as the asset is priced in dollars (XAG/USD). A strong Dollar tends to keep the price of Silver at bay, whereas a weaker Dollar is likely to propel prices up. Other factors such as investment demand, mining supply – Silver is much more abundant than Gold – and recycling rates can also affect prices.
Silver is widely used in industry, particularly in sectors such as electronics or solar energy, as it has one of the highest electric conductivity of all metals – more than Copper and Gold. A surge in demand can increase prices, while a decline tends to lower them. Dynamics in the US, Chinese and Indian economies can also contribute to price swings: for the US and particularly China, their big industrial sectors use Silver in various processes; in India, consumers’ demand for the precious metal for jewellery also plays a key role in setting prices.
Silver prices tend to follow Gold's moves. When Gold prices rise, Silver typically follows suit, as their status as safe-haven assets is similar. The Gold/Silver ratio, which shows the number of ounces of Silver needed to equal the value of one ounce of Gold, may help to determine the relative valuation between both metals. Some investors may consider a high ratio as an indicator that Silver is undervalued, or Gold is overvalued. On the contrary, a low ratio might suggest that Gold is undervalued relative to Silver.
(An automation tool was used in creating this post.)
NZD/USD is heavy under 0.5700 and trading close to the level implied by 2-year NZ-US bond yield spreads. New Zealand January ANZ business outlook survey was disappointing but still extremely high, BBH FX analysts report.
RBNZ/Fed policy trend remains drag for NZD/USD
"Business confidence dipped 8 points to a five-month low at 54.4 and the expected own activity fell 4 points high to a four-month low at 45.8. Reported past activity, which has the best correlation to GDP, improved slightly to 0.2 vs. 0 in December suggesting a modest recovery in economic activity is underway."
"In line with RBNZ guidance, markets continue to imply another 50bps rate cut to 3.75% in February and the policy rate to bottom around 3.00% over the next 12 months. RBNZ/Fed policy trend remains drag for NZD/USD."
Aluminum rose in yesterday’s trading after reports of the EU proposing a phased ban on imports of Russian Aluminum to the bloc. The proposal calls for an import quota for a year before the complete ban comes into effect. The plan would allow European buyers to import 275,000 metric tons of the Russian metal under a quota system for one year before a full ban comes into effect, ING's commodity experts Ewa Manthey and Warren Patterson note.
China is importing half of its Aluminum imports from Russia
"Although the EU continues to import Russian Aluminum, volumes have fallen over the past two years. The EU imported more than 320kt of unwrought Aluminum from Russia in the first 11 months of 2024, accounting for around 6% of total imports, a relatively small fraction of the global Aluminum market. This is down from 11% in 2023 and 19% in 2022."
"The gap left by Russian supplies has mostly been filled by imports from the Middle East, India and Southeast Asia and this trend is likely to continue. The US and the UK banned the import of metals produced in Russia in 2024. The EU has so far banned Aluminum products, including wire, tube, pipe and foil, which account for less than 15% of EU imports."
"Meanwhile, Russia has steadily increased sales to Asian consumers over the last three years, particularly China. China is now importing half of its Aluminum imports from Russia. We expect this trend to continue in 2025."
EUR/USD bounce has stalled after facing interim resistance near 1.0535 earlier this week, Société Générale's FX analysts note.
EUR/USD regains upward momentum
"Daily MACD has been posting positive divergence and has recently crossed above equilibrium line denoting regain of upward momentum. 1.0350/1.0310, the 50% retracement of recent rebound is first support. Defence of this can lead to persistence in rebound. Beyond 1.0535, next objectives could be located at December high of 1.0570/1.0630."
- EUR/USD remains on tenterhooks around 1.0420 as the ECB’s policy meeting looms large.
- The ECB is expected to cut interest rates by 25 bps and deliver a dovish guidance.
- The Fed kept interest rates steady in the range of 4.25%-4.50% on Wednesday.
EUR/USD trades cautiously around 1.0420 in Thursday’s European session as investors focus on the European Central Bank’s (ECB) monetary policy decision, which will be announced at 13:15 GMT. The ECB is widely anticipated to cut its Deposit Facility Rate by 25 basis points (bps) to 2.75%, with the Main Refinancing Operations Rate sliding to 2.9%, and leave the door open for further policy easing.
Traders have already priced in four interest rate cuts this year, see them coming by the summer, which would push the key Deposit Facility Rate to 2%. A string of ECB officials has been comfortable with dovish bets but not with the timeframe, and they see the 2% rate coming by year-end. ECB officials have also anticipated 2% as a neutral rate, which neither stimulates nor weighs on economic growth.
Dovish ECB bets are based on the assumption that inflationary pressures in the Eurozone are sustainably on track to return to the central bank’s target of 2%. Investors are also worried that potential tariffs by United States (US) President Donald Trump could falter the Eurozone economic outlook, which is already going through a rough phase as the growth of its powerhouse nation, Germany, is expected to shrink again.
The Federal of German Industries (BDI) forecasted on Tuesday that the German economy will shrink for the third year in a row as the government has been unable to address structural weaknesses in the national economy.
Ahead of the ECB’s policy decision, investors will pay close attention to the flash Eurozone Gross Domestic Product (GDP) data for the fourth quarter of 2024, which will be published at 10:00 GMT. Economists expect the shared bloc to have expanded by 0.1% quarterly compared to the 0.4% growth in the third quarter. Compared to the same quarter of 2023, the Eurozone economy is estimated to have risen by 1.0%, faster than 0.9% growth in the third quarter of 2024.
Daily digest market movers: EUR/USD follows US Dollar’s footprints
- The lackluster trend in the EUR/USD pair could also be attributed to a sideways trend in the US Dollar (USD) after the Federal Reserve’s (Fed) monetary policy announcement on Wednesday, in which the central bank left interest rates unchanged in the range of 4.25%-4.50%. The US Dollar Index (DXY), which tracks the Greenback’s value against six major currencies, wobbles around 108.00.
- The Fed was already expected to announce a pause in the policy-easing spell as market participants were worried about stalling progress in the disinflation trend towards the central bank’s target of 2%. In the press conference, Fed Chair Jerome Powell adopted a cautious stance on interest rates and said that the central bank would resume the rate-cut cycle only after seeing "real progress on inflation or at least some weakness in the labor market”.
- In December, the core Consumer Price Index (CPI), which excludes volatile food and energy prices, decelerated to 3.2% year-over-year but remained well above the Fed’s desired rate of 2%. For more cues on the current status of inflation, investors will focus on the US Personal Consumption Expenditure Price Index (PCE) data for December, which will be released on Friday.
- When asked about whether the Fed will follow President Trump’s call for immediate rate cuts, Powell said, “The committee is very much in the mode of waiting to see what policies are enacted.”
- In Thursday’s session, investors will focus on the preliminary US Q4 GDP data, which will be published at 13:30 GMT. The US economy is expected to have grown by 2.6% compared to the same quarter of 2023 but slower than the 3.1% growth in the previous quarter.
Technical Analysis: EUR/USD drops to near 20-day EMA
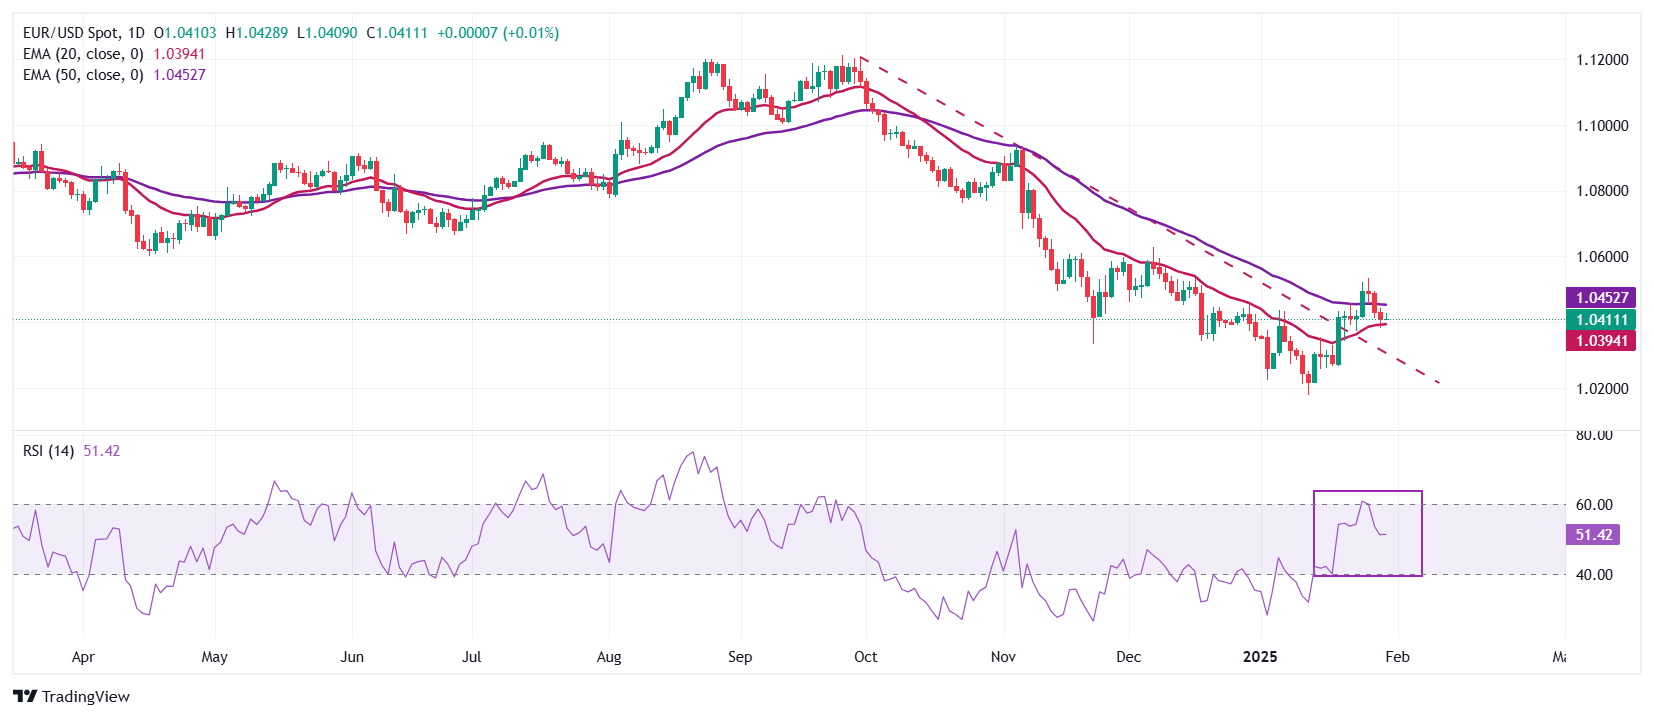
EUR/USD fell to near the 20-day Exponential Moving Average (EMA), which trades around 1.0395, on Wednesday in a corrective move from Monday's high of 1.0530. The major currency pair weakens after failing to sustain above the 50-day EMA, which trades around 1.0450.
The 14-day Relative Strength Index (RSI) failed to climb above the 60.00 hurdle after recovering from below the 40.00 level, suggesting that the trend would be sideways.
Looking down, the downward-sloping trendline from the September 30, 2024, high of 1.1209 will act as major support for the pair near the round level of 1.0300, followed by the January 20 low of 1.0266. Conversely, the December 6 high of 1.0630 will be the key barrier for the Euro bulls.
Euro FAQs
The Euro is the currency for the 19 European Union countries that belong to the Eurozone. It is the second most heavily traded currency in the world behind the US Dollar. In 2022, it accounted for 31% of all foreign exchange transactions, with an average daily turnover of over $2.2 trillion a day. EUR/USD is the most heavily traded currency pair in the world, accounting for an estimated 30% off all transactions, followed by EUR/JPY (4%), EUR/GBP (3%) and EUR/AUD (2%).
The European Central Bank (ECB) in Frankfurt, Germany, is the reserve bank for the Eurozone. The ECB sets interest rates and manages monetary policy. The ECB’s primary mandate is to maintain price stability, which means either controlling inflation or stimulating growth. Its primary tool is the raising or lowering of interest rates. Relatively high interest rates – or the expectation of higher rates – will usually benefit the Euro and vice versa. The ECB Governing Council makes monetary policy decisions at meetings held eight times a year. Decisions are made by heads of the Eurozone national banks and six permanent members, including the President of the ECB, Christine Lagarde.
Eurozone inflation data, measured by the Harmonized Index of Consumer Prices (HICP), is an important econometric for the Euro. If inflation rises more than expected, especially if above the ECB’s 2% target, it obliges the ECB to raise interest rates to bring it back under control. Relatively high interest rates compared to its counterparts will usually benefit the Euro, as it makes the region more attractive as a place for global investors to park their money.
Data releases gauge the health of the economy and can impact on the Euro. Indicators such as GDP, Manufacturing and Services PMIs, employment, and consumer sentiment surveys can all influence the direction of the single currency. A strong economy is good for the Euro. Not only does it attract more foreign investment but it may encourage the ECB to put up interest rates, which will directly strengthen the Euro. Otherwise, if economic data is weak, the Euro is likely to fall. Economic data for the four largest economies in the euro area (Germany, France, Italy and Spain) are especially significant, as they account for 75% of the Eurozone’s economy.
Another significant data release for the Euro is the Trade Balance. This indicator measures the difference between what a country earns from its exports and what it spends on imports over a given period. If a country produces highly sought after exports then its currency will gain in value purely from the extra demand created from foreign buyers seeking to purchase these goods. Therefore, a positive net Trade Balance strengthens a currency and vice versa for a negative balance.
- AUD/JPY depreciates amid rising odds that the BoJ will continue its rate-hiking cycle.
- BoJ Himino stated that the central bank would consider raising interest rates if economic conditions and inflation evolve as expected.
- The RBA could consider a rate cut in February amid easing inflationary pressures toward the end of 2024.
AUD/JPY declines for the second consecutive day, hovering around 96.30 during European trading hours on Thursday. The AUD/JPY cross’s downside is driven by growing expectations that the Bank of Japan (BoJ) will continue its rate-hiking cycle.
The Japanese Yen (JPY) gained strength after BoJ Deputy Governor Ryozo Himino stated that the central bank would raise interest rates if economic conditions and inflation align with expectations. However, Himino also emphasized that the BoJ remains committed to maintaining an accommodative monetary stance for now, given prevailing domestic and external risks.
Minutes of the December Bank of Japan meeting released on Wednesday showed that members emphasized the need for cautious monetary policy adjustments. Meanwhile, investors are more confident that the BoJ will continue its move toward normalization and deliver additional interest rate hikes in 2025.
Moreover, the AUD/JPY cross’s downside is reinforced by the subdued Australian Dollar (AUD) as easing inflationary pressures toward the end of 2024 have fueled speculation that the Reserve Bank of Australia (RBA) could consider a rate cut in February. The RBA maintained the Official Cash Rate (OCR) at 4.35% since November 2023, emphasizing that inflation must “sustainably” return to its 2%-3% target range before any policy easing.
ANZ, CBA, Westpac, and now National Australia Bank (NAB) all anticipate a 25 basis point (bps) rate cut from the Reserve Bank of Australia (RBA) in February. Previously, the NAB had forecasted a rate cut in May but has now moved its projection forward to the February RBA meeting.
Interest rates FAQs
Interest rates are charged by financial institutions on loans to borrowers and are paid as interest to savers and depositors. They are influenced by base lending rates, which are set by central banks in response to changes in the economy. Central banks normally have a mandate to ensure price stability, which in most cases means targeting a core inflation rate of around 2%. If inflation falls below target the central bank may cut base lending rates, with a view to stimulating lending and boosting the economy. If inflation rises substantially above 2% it normally results in the central bank raising base lending rates in an attempt to lower inflation.
Higher interest rates generally help strengthen a country’s currency as they make it a more attractive place for global investors to park their money.
Higher interest rates overall weigh on the price of Gold because they increase the opportunity cost of holding Gold instead of investing in an interest-bearing asset or placing cash in the bank. If interest rates are high that usually pushes up the price of the US Dollar (USD), and since Gold is priced in Dollars, this has the effect of lowering the price of Gold.
The Fed funds rate is the overnight rate at which US banks lend to each other. It is the oft-quoted headline rate set by the Federal Reserve at its FOMC meetings. It is set as a range, for example 4.75%-5.00%, though the upper limit (in that case 5.00%) is the quoted figure. Market expectations for future Fed funds rate are tracked by the CME FedWatch tool, which shapes how many financial markets behave in anticipation of future Federal Reserve monetary policy decisions.
- German GDP declines 0.2% QoQ in Q4 vs. -0.1% anticipated.
- Annual German GDP contracts 0.2% in Q4 vs. 0% estimate.
- EUR/USD stays defensive following the downbeat German Q4 GDP report.
The German economy contracted by 0.2% over the quarter in the fourth quarter of 2024, following a 0.1% expansion in the third quarter, according to the preliminary data published by Destatis on Thursday. Markets expected a 0.1% decline.
Meanwhile, the annual GDP rate fell by 0.2% in Q4 after -0.3% reported in Q3 and against the estimated 0% print.
EUR/USD reaction to the German GDP data
EUR/USD shows little to no reaction to the German data, trading 0.04% lower on the day near 1.0415 at the press time.
Euro PRICE Today
The table below shows the percentage change of Euro (EUR) against listed major currencies today. Euro was the weakest against the Japanese Yen.
| USD | EUR | GBP | JPY | CAD | AUD | NZD | CHF | |
|---|---|---|---|---|---|---|---|---|
| USD | -0.02% | -0.07% | -0.53% | -0.09% | -0.02% | 0.08% | -0.04% | |
| EUR | 0.02% | -0.06% | -0.50% | -0.08% | -0.01% | 0.09% | -0.03% | |
| GBP | 0.07% | 0.06% | -0.46% | -0.02% | 0.05% | 0.15% | 0.02% | |
| JPY | 0.53% | 0.50% | 0.46% | 0.43% | 0.50% | 0.56% | 0.47% | |
| CAD | 0.09% | 0.08% | 0.02% | -0.43% | 0.08% | 0.16% | 0.04% | |
| AUD | 0.02% | 0.01% | -0.05% | -0.50% | -0.08% | 0.10% | -0.02% | |
| NZD | -0.08% | -0.09% | -0.15% | -0.56% | -0.16% | -0.10% | -0.13% | |
| CHF | 0.04% | 0.03% | -0.02% | -0.47% | -0.04% | 0.02% | 0.13% |
The heat map shows percentage changes of major currencies against each other. The base currency is picked from the left column, while the quote currency is picked from the top row. For example, if you pick the Euro from the left column and move along the horizontal line to the US Dollar, the percentage change displayed in the box will represent EUR (base)/USD (quote).
The oil market traded little changed in the morning session after falling sharply yesterday as oil inventory rose while uncertainty continued over US trade policy. Meanwhile, trading volumes were relatively subdued as the Chinese market has been closed for the Lunar New Year Holidays, ING's commodity experts Ewa Manthey and Warren Patterson note.
US weekly inventory numbers remain fairly bearish
"US weekly inventory numbers from the EIA yesterday remained fairly bearish for the oil market. US commercial crude oil inventories (excluding SPR) increased by 3.5m barrels over the last week, well above the 2.86m barrels increase the API reported the previous day. This was the first weekly build reported since November. When factoring in the SPR, the build was even larger, with total US crude oil inventories rising by 3.7m barrels. Total US commercial crude oil stocks stand at 415m barrels, the highest level since late December."
"In refined products, stocks of gasoline increased by 2.9m barrels, against a forecast for a build of just 0.35m barrels. However, distillate fuel oil stockpiles fell by around 5m barrels last week, compared to the market expecting a drawdown of 2.2m barrels. Meanwhile, refineries operated at 83.5% of their capacity following the declines in East Coast and Midwest refining rates along with lower refining rates on the Gulf Coast. This was down from the refining rates of 85.9% seen in the previous week."
It is a busy day for the European calendar dominated by GDP releases and the ECB meeting. France has just released a weaker-than-expected fourth-quarter GDP reading of -0.1% QoQ. Consumption and business investment were the weak links, ING's FX analyst Chris Turner notes.
Downside risks to EUR/USD are evident
"Remember, the threat of trade tariffs is normally a negative for business investment – something the IMF has modelled. Let's see how the German and Italian numbers fare at 10CET and then the provisional eurozone release at 11CET. Here the consensus for eurozone fourth-quarter growth currently stands at 0.1% QoQ, with seemingly downside risks."
"Today's main event, however, is the ECB meeting – rate announcement 1415CET. A 25bp cut in the deposit rate to 2.75% is nailed on and instead the focus will be on ECB President Christine Lagarde's press conference. We see some downside risks if the market believes there is a chance of the ECB taking policy below neutral."
"EUR/USD should be driven by events in Europe today, with a slight bias to the 1.0345/55 area should Lagarde sound quite dovish."
European gas prices jumped to the highest level since October 2023 yesterday as unexpected supply disruptions and colder weather forecasts worsened the supply threats in an already tight market, ING's commodity experts Ewa Manthey and Warren Patterson note.
Rise in carbon prices is supporting the upward rally in gas
"TTF front-month futures rose over 6% to close above EUR51/MWh as of yesterday as market participants remained concerned about volatile supplies of liquified natural gas following the recent production issues at some export facilities affecting fuel flows."
"Meanwhile, the heating demand is expected to increase as temperatures are forecasted to drop over the coming days. Additionally, a rise in carbon prices is also supporting the upward rally in gas. Looking at inventories, the European gas storage is now only about 55% full, down from 72% at the same stage last year and below the five-year average of 62%."
- Silver attracts buyers for the third straight day and climbs to over a one-month top.
- The technical setup favors bulls and supports prospects for further appreciation.
- Any corrective pullback could be seen as a buying opportunity and remain limited.
Silver (XAG/USD) gains positive traction for the third consecutive day and climbs to its highest level since December 13 during the first half of the European session. The white metal currently trades around the $31.00 mark, with bulls now awaiting a move beyond the 100-day Simple Moving Average (SMA) before placing fresh bets.
Meanwhile, technical indicators on the daily chart have just started gaining positive traction and support prospects for an eventual breakout through the said barrier. The subsequent short-covering rally has the potential to lift the XAG/USD towards the next relevant hurdle near the $31.45-$31.50 area en route to the $32.00 mark and the December monthly swing high, around the $32.30 region.
Some follow-through buying will suggest that the corrective decline from a multi-year peak touched in October 2024 has run its course and pave the way for additional gains. The XAG/USD might then climb further towards the $32.75-$32.80 region before aiming to reclaim the $33.00 mark for the first time since early November.
On the flip side, the $30.70-$30.65 area now seems to protect the immediate downside. Any further pullback could be seen as a buying opportunity and remain limited near the 200-day SMA, currently pegged just ahead of the $30.00 psychological mark. A convincing break below the latter, however, could make the XAG/USD vulnerable to retesting the weekly swing low, around the $29.70 region touched on Monday.
Silver daily chart
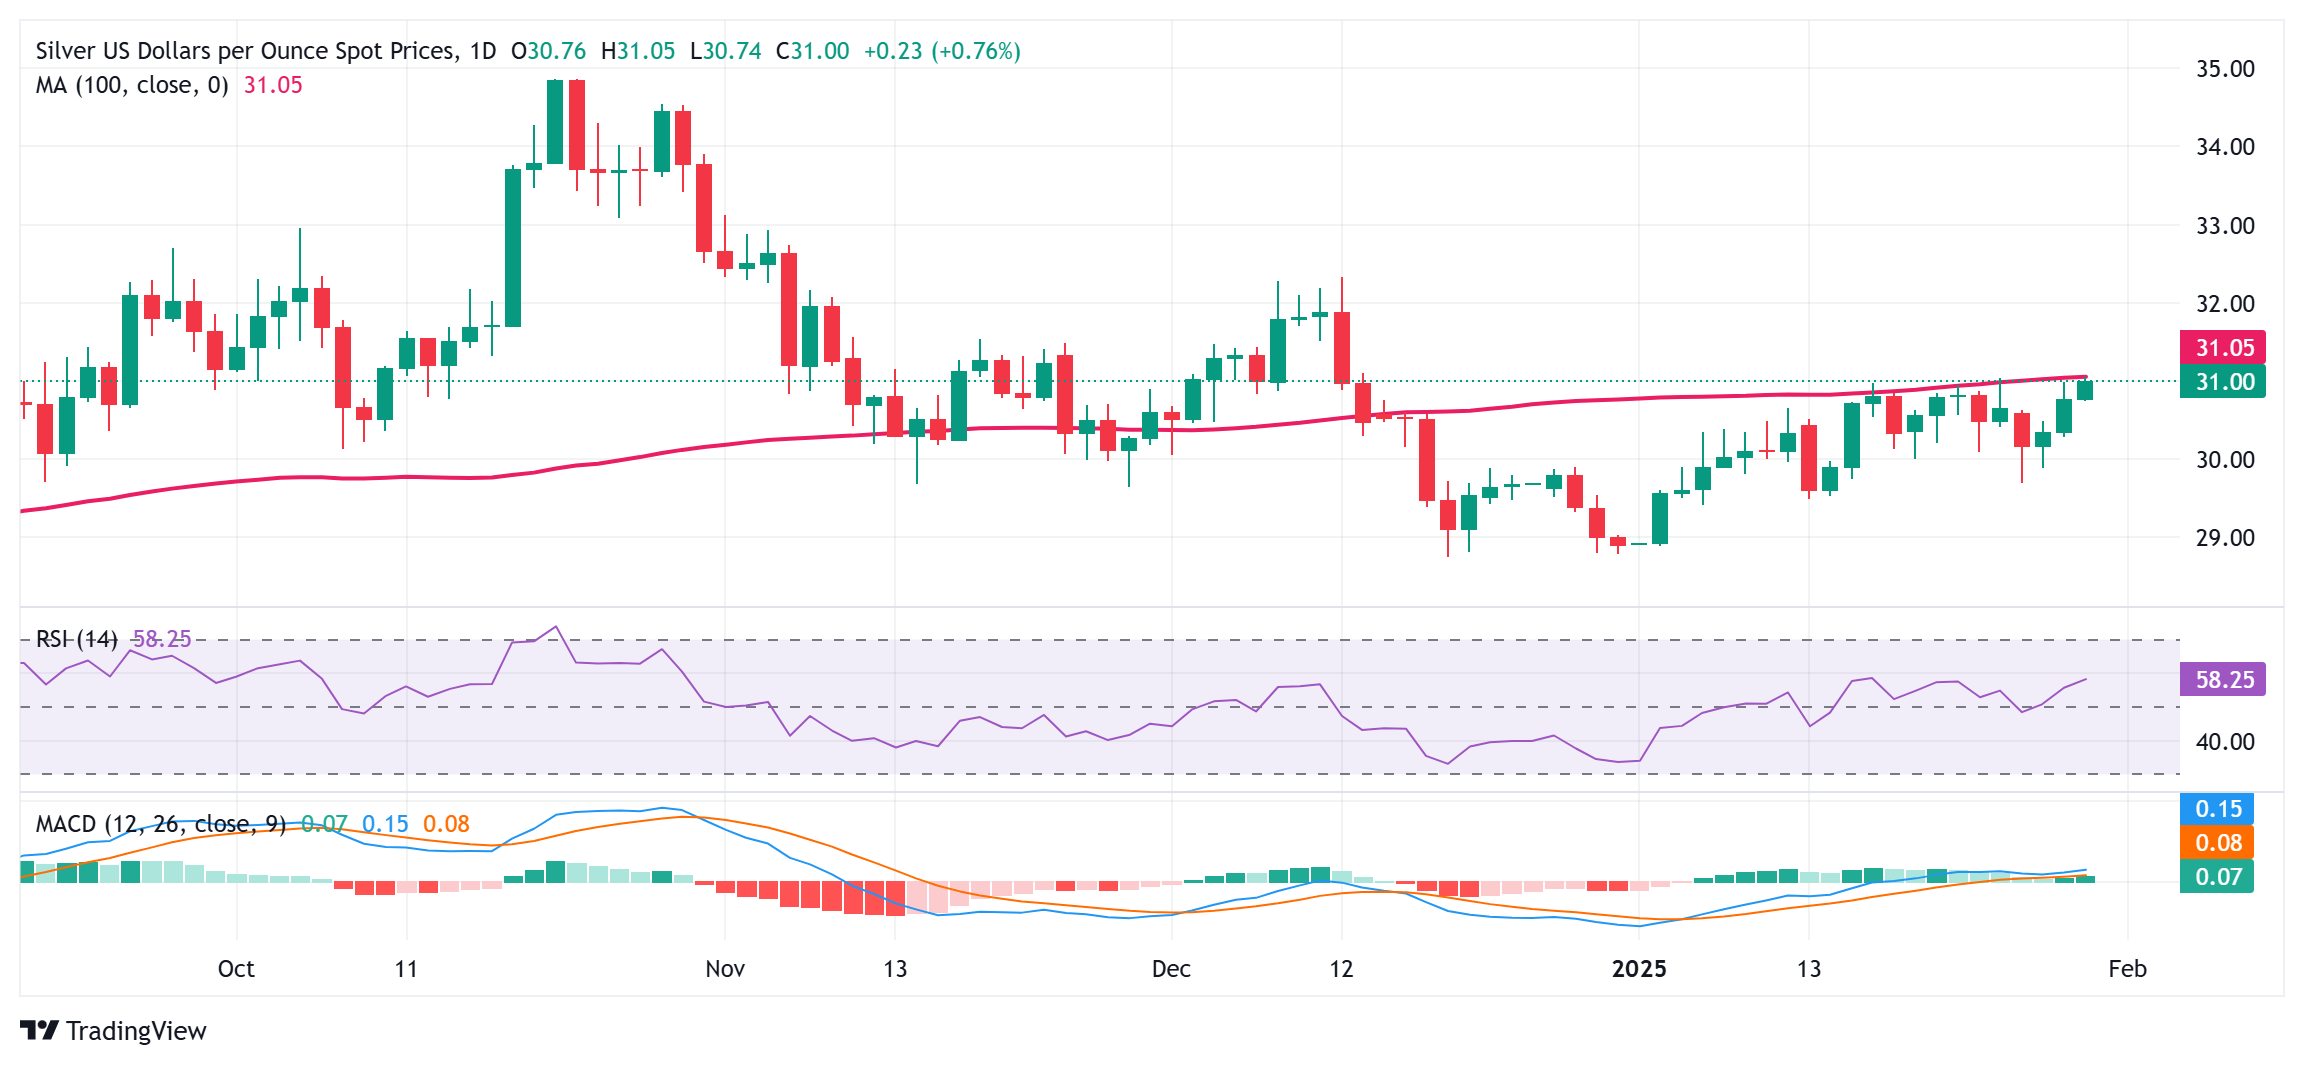
Silver FAQs
Silver is a precious metal highly traded among investors. It has been historically used as a store of value and a medium of exchange. Although less popular than Gold, traders may turn to Silver to diversify their investment portfolio, for its intrinsic value or as a potential hedge during high-inflation periods. Investors can buy physical Silver, in coins or in bars, or trade it through vehicles such as Exchange Traded Funds, which track its price on international markets.
Silver prices can move due to a wide range of factors. Geopolitical instability or fears of a deep recession can make Silver price escalate due to its safe-haven status, although to a lesser extent than Gold's. As a yieldless asset, Silver tends to rise with lower interest rates. Its moves also depend on how the US Dollar (USD) behaves as the asset is priced in dollars (XAG/USD). A strong Dollar tends to keep the price of Silver at bay, whereas a weaker Dollar is likely to propel prices up. Other factors such as investment demand, mining supply – Silver is much more abundant than Gold – and recycling rates can also affect prices.
Silver is widely used in industry, particularly in sectors such as electronics or solar energy, as it has one of the highest electric conductivity of all metals – more than Copper and Gold. A surge in demand can increase prices, while a decline tends to lower them. Dynamics in the US, Chinese and Indian economies can also contribute to price swings: for the US and particularly China, their big industrial sectors use Silver in various processes; in India, consumers’ demand for the precious metal for jewellery also plays a key role in setting prices.
Silver prices tend to follow Gold's moves. When Gold prices rise, Silver typically follows suit, as their status as safe-haven assets is similar. The Gold/Silver ratio, which shows the number of ounces of Silver needed to equal the value of one ounce of Gold, may help to determine the relative valuation between both metals. Some investors may consider a high ratio as an indicator that Silver is undervalued, or Gold is overvalued. On the contrary, a low ratio might suggest that Gold is undervalued relative to Silver.
- NZD/USD weakens as the RBNZ is widely expected to implement another 50 basis point rate cut in February.
- New Zealand’s Trade Balance recorded a surplus of NZ$219 million in December, driven by a robust 17% surge in exports.
- US Gross Domestic Product Annualized (Q4) could report a 2.6% growth, down from the previous 3.1%.
The NZD/USD pair extends its decline for the fourth consecutive day, trading near 0.5640 during European hours on Thursday. The New Zealand Dollar (NZD) continues to weaken amid dovish expectations regarding the Reserve Bank of New Zealand's (RBNZ) monetary policy. The RBNZ is expected to implement another 50 basis point (bps) rate cut on February 19, following two previous reductions in the current cycle.
On the economic front, New Zealand reported a trade surplus of NZ$219 million in December, driven by a robust 17% surge in exports, which outpaced a 6.5% increase in imports. However, ANZ Business Confidence fell to a five-month low of 54.4 in January, down from 62.3 in December. Similarly, the Business Outlook Index declined for the third consecutive month, reaching 54.4 in January 2025—its lowest level since August—amid signs of a slowing economy.
Traders await the release of the US fourth-quarter Gross Domestic Product (GDP) growth data, scheduled for Thursday. The market consensus expects a slowdown in annualized GDP growth, with a forecast of 2.6%, down from the previous 3.1%. Inflationary concerns persist, with the Q4 GDP Price Index expected to rise to 2.5%, up from 1.9%.
Further downside risks for NZD/USD appear as the USD could strengthen amid the Federal Reserve's (Fed) cautious approach to monetary policy. The Fed maintained its overnight borrowing rate at 4.25%-4.50% during its January meeting on Wednesday, as widely anticipated. This decision follows three consecutive rate cuts since September 2024, totaling a one-percentage-point reduction.
The Federal Reserve reinforced its hawkish stance by removing language that indicated confidence in inflation reaching its 2% target. Fed Chair Jerome Powell stressed in the press conference that the central bank would only consider policy changes if there was "real progress on inflation or signs of weakness in the labor market."
New Zealand Dollar FAQs
The New Zealand Dollar (NZD), also known as the Kiwi, is a well-known traded currency among investors. Its value is broadly determined by the health of the New Zealand economy and the country’s central bank policy. Still, there are some unique particularities that also can make NZD move. The performance of the Chinese economy tends to move the Kiwi because China is New Zealand’s biggest trading partner. Bad news for the Chinese economy likely means less New Zealand exports to the country, hitting the economy and thus its currency. Another factor moving NZD is dairy prices as the dairy industry is New Zealand’s main export. High dairy prices boost export income, contributing positively to the economy and thus to the NZD.
The Reserve Bank of New Zealand (RBNZ) aims to achieve and maintain an inflation rate between 1% and 3% over the medium term, with a focus to keep it near the 2% mid-point. To this end, the bank sets an appropriate level of interest rates. When inflation is too high, the RBNZ will increase interest rates to cool the economy, but the move will also make bond yields higher, increasing investors’ appeal to invest in the country and thus boosting NZD. On the contrary, lower interest rates tend to weaken NZD. The so-called rate differential, or how rates in New Zealand are or are expected to be compared to the ones set by the US Federal Reserve, can also play a key role in moving the NZD/USD pair.
Macroeconomic data releases in New Zealand are key to assess the state of the economy and can impact the New Zealand Dollar’s (NZD) valuation. A strong economy, based on high economic growth, low unemployment and high confidence is good for NZD. High economic growth attracts foreign investment and may encourage the Reserve Bank of New Zealand to increase interest rates, if this economic strength comes together with elevated inflation. Conversely, if economic data is weak, NZD is likely to depreciate.
The New Zealand Dollar (NZD) tends to strengthen during risk-on periods, or when investors perceive that broader market risks are low and are optimistic about growth. This tends to lead to a more favorable outlook for commodities and so-called ‘commodity currencies’ such as the Kiwi. Conversely, NZD tends to weaken at times of market turbulence or economic uncertainty as investors tend to sell higher-risk assets and flee to the more-stable safe havens.
- USD/CAD attracts some dip-buyers on Thursday, though it lacks bullish conviction.
- The BoC’s dovish stance and bearish Oil prices continue to undermine the Loonie.
- Declining US bond yields keep the USD bulls on the defensive and cap spot prices.
The USD/CAD pair rebounds over 40 pips from the intraday low and climbs to a fresh daily high, around the 1.4435 area during the early part of the European session on Thursday. Spot prices, however, lack follow-through and remain confined in a familiar range held over the past month or so.
The Canadian Dollar (CAD) continues to be weighed down by the Bank of Canada's (BoC) relative dovish stance and concerns about US President Donald Trump's threatened trade tariffs. In fact, the BoC decided to cut interest rates for the sixth time in a row since June and announced an end to its quantitative tightening program. Apart from this, a bearish sentiment surrounding Crude Oil prices turns out to be another factor undermining the commodity-linked Loonie and offering support to the USD/CAD pair.
Meanwhile, the Federal Reserve (Fed) decided to stand pat at the end of a two-day meeting on Wednesday and signaled that there would be no rush to lower borrowing costs until inflation and jobs data made it appropriate. This, in turn, is seen lending some support to the US Dollar (USD) and also acting as a tailwind for the USD/CAD pair. That said, the uncertainty about the Trump administration's policies triggers a fresh leg down in the US Treasury bond yields and holds back the USD bulls from placing fresh bets.
Moving ahead, traders now look forward to the release of the Advance US Q4 GDP print, due later during the early North American session. Apart from this, the US bond yields and Trump's tariff plans will influence the USD. Apart from this, Oil price dynamics should contribute to producing short-term trading opportunities around the USD/CAD pair.
Economic Indicator
Gross Domestic Product Annualized
The real Gross Domestic Product (GDP) Annualized, released quarterly by the US Bureau of Economic Analysis, measures the value of the final goods and services produced in the United States in a given period of time. Changes in GDP are the most popular indicator of the nation’s overall economic health. The data is expressed at an annualized rate, which means that the rate has been adjusted to reflect the amount GDP would have changed over a year’s time, had it continued to grow at that specific rate. Generally speaking, a high reading is seen as bullish for the US Dollar (USD), while a low reading is seen as bearish.
Read more.Next release: Thu Jan 30, 2025 13:30 (Prel)
Frequency: Quarterly
Consensus: 2.6%
Previous: 3.1%
Source: US Bureau of Economic Analysis
The US Bureau of Economic Analysis (BEA) releases the Gross Domestic Product (GDP) growth on an annualized basis for each quarter. After publishing the first estimate, the BEA revises the data two more times, with the third release representing the final reading. Usually, the first estimate is the main market mover and a positive surprise is seen as a USD-positive development while a disappointing print is likely to weigh on the greenback. Market participants usually dismiss the second and third releases as they are generally not significant enough to meaningfully alter the growth picture.
- WTI price faces challenges as traders adopt caution amid rising uncertainty over US trade policy.
- Trump’s commerce secretary nominee Howard Lutnick suggested that Canada and Mexico could avoid tariffs.
- Oil prices struggled as the EIA reported a 3.463 million-barrel increase in US stockpiles for the previous week.
West Texas Intermediate (WTI) crude Oil price continues to decline for the second consecutive session, trading around $72.20 per barrel during early European hours on Thursday. Investors remain cautious as uncertainty looms over United States (US) trade policy, following conflicting statements from the White House regarding President Donald Trump’s proposed tariffs on Canada and Mexico—two key crude suppliers to the United States.
White House spokeswoman Karoline Leavitt confirmed on Tuesday that Trump remains committed to implementing tariffs on Canada and Mexico as planned on Saturday. On Wednesday, Trump’s commerce secretary nominee, Howard Lutnick, suggested that Canada and Mexico could avoid tariffs if they swiftly tighten border controls on fentanyl and curb China’s advancements in artificial intelligence. Lutnick advocates for broad, across-the-board tariffs targeting countries rather than specific products, reinforcing a more aggressive stance toward China.
Crude Oil prices also remain under pressure after the Energy Information Administration (EIA) reported a 3.463 million-barrel increase in US stockpiles for the week ending January 24. This marks the first inventory build after nine consecutive weeks of declines, aligning closely with analysts’ expectations of a 3.19 million-barrel rise. The recent winter storms across the US have further dampened Oil demand.
On the supply front, Russia's crude Oil exports from western ports are expected to decline by 8% in February compared to January, as Moscow ramps up refining operations. The drop comes amid fresh US sanctions, which have tightened restrictions on Russian crude exports.
Meanwhile, Oil prices could face additional headwinds due to the Federal Reserve’s (Fed) cautious monetary policy approach. As widely anticipated, the Fed maintained its benchmark interest rate at 4.25%-4.50% during its January meeting. Elevated borrowing costs typically weigh on economic activity, subsequently reducing Oil demand.
WTI Oil FAQs
WTI Oil is a type of Crude Oil sold on international markets. The WTI stands for West Texas Intermediate, one of three major types including Brent and Dubai Crude. WTI is also referred to as “light” and “sweet” because of its relatively low gravity and sulfur content respectively. It is considered a high quality Oil that is easily refined. It is sourced in the United States and distributed via the Cushing hub, which is considered “The Pipeline Crossroads of the World”. It is a benchmark for the Oil market and WTI price is frequently quoted in the media.
Like all assets, supply and demand are the key drivers of WTI Oil price. As such, global growth can be a driver of increased demand and vice versa for weak global growth. Political instability, wars, and sanctions can disrupt supply and impact prices. The decisions of OPEC, a group of major Oil-producing countries, is another key driver of price. The value of the US Dollar influences the price of WTI Crude Oil, since Oil is predominantly traded in US Dollars, thus a weaker US Dollar can make Oil more affordable and vice versa.
The weekly Oil inventory reports published by the American Petroleum Institute (API) and the Energy Information Agency (EIA) impact the price of WTI Oil. Changes in inventories reflect fluctuating supply and demand. If the data shows a drop in inventories it can indicate increased demand, pushing up Oil price. Higher inventories can reflect increased supply, pushing down prices. API’s report is published every Tuesday and EIA’s the day after. Their results are usually similar, falling within 1% of each other 75% of the time. The EIA data is considered more reliable, since it is a government agency.
OPEC (Organization of the Petroleum Exporting Countries) is a group of 12 Oil-producing nations who collectively decide production quotas for member countries at twice-yearly meetings. Their decisions often impact WTI Oil prices. When OPEC decides to lower quotas, it can tighten supply, pushing up Oil prices. When OPEC increases production, it has the opposite effect. OPEC+ refers to an expanded group that includes ten extra non-OPEC members, the most notable of which is Russia.
- The European Central Bank is set to lower key rates by 25 bps at the January policy meeting.
- ECB President Christine Lagarde’s words will hold the key to offering fresh policy cues.
- ECB policy announcements are expected to rock the EUR/USD pair and infuse intense volatility.
The European Central Bank (ECB) interest rate decision will be announced on Thursday at 13:15 GMT following the conclusion of the January monetary policy meeting. Markets are anticipating another reduction in key rates, marking a continuation of the easing cycle after December’s rate cut. No updated staff economic projections will published at this meeting.
ECB President Christine Lagarde will hold a press conference at 13:45 GMT, where she will deliver the prepared statement on monetary policy and respond to media questions. The ECB announcements will likely inject intense volatility around the Euro (EUR) against the US Dollar (USD).
What to expect from the European Central Bank interest rate decision?
After lowering key rates in December, the ECB is widely expected to announce another 25 basis points (bps) cut, taking the benchmark rate on deposit facility from 3% to 2.75%. It would be the fourth straight interest rates cut after trimming them in September, October and December 2024.
In December’s post-policy meeting press conference, ECB President Christine Lagarde said that "risks to growth are tilted to the downside,” while the “risk to inflation is now two-sided.”
Speaking on the inflation and interest rate outlook in a CNBC interview last week, on the sidelines of the World Economic Forum (WEF) annual meetings in Davos, President Lagarde said: “We're confident Eurozone inflation will be at target over the course of 2025,” adding that “gradual moves in rates come to mind at the moment.”
Eurostat’s preliminary data released on January 7 showed that the Eurozone Harmonized Index of Consumer Prices (HICP) rose 2.4% year-over-year (YoY) in December after reporting a 2.2% increase in November. The data aligned with the market forecast. The annual core HICP inflation held steady at 2.7% in the same period.
Eurozone inflation remained elevated and moved slightly from the central bank’s 2.0% target in December. Economists at ABN Amro noted that “the rebound in headline inflation was driven largely by energy, with both the lower base from last year but also recent weakness in the Euro contributing to higher petrol prices, as well as higher gas and electricity prices with Europe running down its gas inventories somewhat faster than usual this winter. “
Subsequently, the accounts of the December ECB meeting published on January 16 showed: “There were still many upside and downside risks to the inflation outlook. More check points had to be passed to ascertain whether disinflation remained on track and kept open the optionality to make adjustments along the way.”
Against this backdrop, the ECB’s communication in the policy statement and President Lagarde’s comments will hold the key to determining the scope and timing of the next rate cuts as the Bank battles concerns over economic growth and potential tariffs by United States (US) President Donald Trump’s administration.
Previewing the ECB meeting, TD Securities analysts said: “This decision should be a fairly straightforward cut. Inflation data has been noisy but on net a touch weaker than expected in its December projections. Growth signs show no real signs of improving, either, adding to the soft backdrop.“ “We expect no real change in messaging around this one, but questions about the neutral rate are likely to crop up in the press conference,” the analysts added.
How could the ECB meeting impact EUR/USD?
In the lead-up to the ECB showdown, the EUR/USD pair is hovering near last Friday's five-week high of 1.0522. The pair’s further upside remains dependent on the outlook of ECB interest rates.
ECB President Christine Lagarde is expected to maintain the rhetoric that the Bank is not on any pre-determined path on interest rates and will likely remain data-dependent. Lagarde could also reiterate her view of “gradual moves in rates”. In such a scenario, EUR/USD is set to extend the recovery momentum. However, the main currency pair could witness a fresh downtrend if Lagarde mentions that a 50 bps rate cut was discussed as an option in the meeting or expresses concerns over the economic prospects.
Dhwani Mehta, Asian Session Lead Analyst at FXStreet, offers a brief technical outlook for EUR/USD:
“Despite EUR/USD’s recent corrective decline, the pair remains poised for further recovery as the Relative Strength Index (RSI) indicator managed to defend the 50 level on the daily chart. If buyers recapture the 50-day Simple Moving Average (SMA) at 1.0422 on a sustained basis, EUR/USD could make another run toward the 1.0500 level. Further up, the six-week high of 1.0533 will be challenged.”
“If the downside regains traction, the immediate support of the 21-day SMA at 1.0355 will be tested. A fresh sell-off could be seen below that level, opening doors toward the 1.0300 round level. The last line of defense for EUR/USD buyers is seen at the January 17 low of 1.0265.”
Economic Indicator
ECB Rate On Deposit Facility
One of the European Central Bank's three key interest rates, the rate on the deposit facility, is the rate at which banks earn interest when they deposit funds with the ECB. It is announced by the European Central Bank at each of its eight scheduled annual meetings.
Read more.Next release: Thu Jan 30, 2025 13:15
Frequency: Irregular
Consensus: 2.75%
Previous: 3%
Source: European Central Bank
Interest rates FAQs
Interest rates are charged by financial institutions on loans to borrowers and are paid as interest to savers and depositors. They are influenced by base lending rates, which are set by central banks in response to changes in the economy. Central banks normally have a mandate to ensure price stability, which in most cases means targeting a core inflation rate of around 2%. If inflation falls below target the central bank may cut base lending rates, with a view to stimulating lending and boosting the economy. If inflation rises substantially above 2% it normally results in the central bank raising base lending rates in an attempt to lower inflation.
Higher interest rates generally help strengthen a country’s currency as they make it a more attractive place for global investors to park their money.
Higher interest rates overall weigh on the price of Gold because they increase the opportunity cost of holding Gold instead of investing in an interest-bearing asset or placing cash in the bank. If interest rates are high that usually pushes up the price of the US Dollar (USD), and since Gold is priced in Dollars, this has the effect of lowering the price of Gold.
The Fed funds rate is the overnight rate at which US banks lend to each other. It is the oft-quoted headline rate set by the Federal Reserve at its FOMC meetings. It is set as a range, for example 4.75%-5.00%, though the upper limit (in that case 5.00%) is the quoted figure. Market expectations for future Fed funds rate are tracked by the CME FedWatch tool, which shapes how many financial markets behave in anticipation of future Federal Reserve monetary policy decisions.
Here is what you need to know on Thursday, January 30:
Markets turn relatively quiet early Thursday as investors gear up for the European Central Bank's (ECB) interest rate decision and the first estimate of the fourth-quarter Gross Domestic Product (GDP) data from the US, while assessing the Federal Reserve's (Fed) policy announcements. The US economic calendar will also feature weekly Initial Jobless Claims and December Pending Home Sales data.
US Dollar PRICE This week
The table below shows the percentage change of US Dollar (USD) against listed major currencies this week. US Dollar was the strongest against the Australian Dollar.
| USD | EUR | GBP | JPY | CAD | AUD | NZD | CHF | |
|---|---|---|---|---|---|---|---|---|
| USD | 0.78% | 0.36% | -0.71% | 0.45% | 1.55% | 1.17% | 0.17% | |
| EUR | -0.78% | -0.34% | -1.32% | -0.19% | 0.77% | 0.51% | -0.50% | |
| GBP | -0.36% | 0.34% | -1.31% | 0.16% | 1.12% | 0.88% | -0.15% | |
| JPY | 0.71% | 1.32% | 1.31% | 1.20% | 2.46% | 2.14% | 1.03% | |
| CAD | -0.45% | 0.19% | -0.16% | -1.20% | 0.91% | 0.72% | -0.31% | |
| AUD | -1.55% | -0.77% | -1.12% | -2.46% | -0.91% | -0.22% | -1.23% | |
| NZD | -1.17% | -0.51% | -0.88% | -2.14% | -0.72% | 0.22% | -1.23% | |
| CHF | -0.17% | 0.50% | 0.15% | -1.03% | 0.31% | 1.23% | 1.23% |
The heat map shows percentage changes of major currencies against each other. The base currency is picked from the left column, while the quote currency is picked from the top row. For example, if you pick the US Dollar from the left column and move along the horizontal line to the Japanese Yen, the percentage change displayed in the box will represent USD (base)/JPY (quote).
Following the January meeting, the Fed left the policy rate unchanged at 4.25%-4.5% as expected. In its policy statement, the Fed removed the language suggesting inflation had "made progress" toward its 2% target, instead stating that the pace of price increases "remains elevated." While responding to questions from the press later, Fed Chairman Jerome Powell said that there was elevated uncertainty because of significant policy shifts. "We don't need to be in a hurry to make any adjustments," he added. After the Fed event, the probability of a 25 basis points (bps) rate cut in March dropped below 20% from above-30%, according to the CME FedWatch Tool. Meanwhile, the US Dollar (USD) ended the day marginally higher before going into a consolidation phase at around 108.00 early Thursday.
The ECB is expected to lower key rates by 25 bps on Thursday. ECB President Christine Lagarde will deliver the policy statement and respond to questions in a press conference starting at 13:45 GMT. EUR/USD fluctuates in a tight range slightly above 1.0400 after closing virtually unchanged on Wednesday. Eurostat will publish preliminary Q4 GDP data later in the session.
GBP/USD continues to move up and down in a narrow range slightly below 1.2450 after failing to make a decisive move in either direction on Wednesday.
USD/JPY stays under bearish pressure and trades near 154.50. Bank of Japan (BoJ) Deputy Governor Ryozo Himino said on Thursday that the central bank will raise rates if the economy and prices move in line with forecasts.
The Bank of Canada (BoC) lowered the policy rate by 25 bps to 3% after the January meeting, as anticipated. BoC Governor Tiff Macklem noted that the Canadian Dollar's movements had not constrained them so far but added that they will have to take bigger moves in the exchange rate into account as they set policy going forward. USD/CAD posted small gains on Wednesday and was last seen trading marginally higher on the day above 1.4400.
After falling below $2,750 in the first half of the day on Wednesday, Gold regained its traction and erased a large portion of its daily losses. XAU/USD edges higher toward $2,770 in the early European session on Thursday.
Central banks FAQs
Central Banks have a key mandate which is making sure that there is price stability in a country or region. Economies are constantly facing inflation or deflation when prices for certain goods and services are fluctuating. Constant rising prices for the same goods means inflation, constant lowered prices for the same goods means deflation. It is the task of the central bank to keep the demand in line by tweaking its policy rate. For the biggest central banks like the US Federal Reserve (Fed), the European Central Bank (ECB) or the Bank of England (BoE), the mandate is to keep inflation close to 2%.
A central bank has one important tool at its disposal to get inflation higher or lower, and that is by tweaking its benchmark policy rate, commonly known as interest rate. On pre-communicated moments, the central bank will issue a statement with its policy rate and provide additional reasoning on why it is either remaining or changing (cutting or hiking) it. Local banks will adjust their savings and lending rates accordingly, which in turn will make it either harder or easier for people to earn on their savings or for companies to take out loans and make investments in their businesses. When the central bank hikes interest rates substantially, this is called monetary tightening. When it is cutting its benchmark rate, it is called monetary easing.
A central bank is often politically independent. Members of the central bank policy board are passing through a series of panels and hearings before being appointed to a policy board seat. Each member in that board often has a certain conviction on how the central bank should control inflation and the subsequent monetary policy. Members that want a very loose monetary policy, with low rates and cheap lending, to boost the economy substantially while being content to see inflation slightly above 2%, are called ‘doves’. Members that rather want to see higher rates to reward savings and want to keep a lit on inflation at all time are called ‘hawks’ and will not rest until inflation is at or just below 2%.
Normally, there is a chairman or president who leads each meeting, needs to create a consensus between the hawks or doves and has his or her final say when it would come down to a vote split to avoid a 50-50 tie on whether the current policy should be adjusted. The chairman will deliver speeches which often can be followed live, where the current monetary stance and outlook is being communicated. A central bank will try to push forward its monetary policy without triggering violent swings in rates, equities, or its currency. All members of the central bank will channel their stance toward the markets in advance of a policy meeting event. A few days before a policy meeting takes place until the new policy has been communicated, members are forbidden to talk publicly. This is called the blackout period.
- EUR/GBP edges higher to around 0.8370 in Thursday’s early European session.
- The ECB will likely cut interest rates on Wednesday, keeping the door open to further easing.
- The markets have priced in almost three quarter-point rate cuts by the BoE in 2025.
The EUR/GBP cross rebounds to near 0.8370, snapping the five-day losing streak during the early European trading hours on Thursday. However, the upside of the cross might be limited amid the dovish stance of the European Central Bank (ECB). The ECB interest rate decision and the preliminary reading of the Eurozone Gross Domestic Product (GDP) for the fourth quarter will be the highlights later on Thursday.
The ECB is expected to cut its key interest rate by another 25 basis points (bps) to 2.75% at its January meeting on Thursday and is likely to keep open the door to further policy easing amid an uncertain economic outlook and worries about persistent inflation. This, in turn, might weigh on the Euro (EUR) against the Pound Sterling (GBP). The ECB lowered borrowing costs four times in 2024, and up to four moves are anticipated this year.
On the GBP’s front, financial markets on Wednesday have priced in almost three quarter-point rate cuts by the Bank of England (BoE) this year, compared with fewer than two reductions in early January. The UK economy has stagnated and inflation eased last month, boosting the bets on BoE rate cuts. Economists polled by Reuters expect the BoE to cut its benchmark rate to 4.50% from 4.75% next week. "Although a dovish statement from the BoE can be expected to keep the pound on the back foot in the near term, it would also provide comfort for investors and the business community," said Jane Foley, senior FX strategist at Rabobank.
ECB FAQs
The European Central Bank (ECB) in Frankfurt, Germany, is the reserve bank for the Eurozone. The ECB sets interest rates and manages monetary policy for the region. The ECB primary mandate is to maintain price stability, which means keeping inflation at around 2%. Its primary tool for achieving this is by raising or lowering interest rates. Relatively high interest rates will usually result in a stronger Euro and vice versa. The ECB Governing Council makes monetary policy decisions at meetings held eight times a year. Decisions are made by heads of the Eurozone national banks and six permanent members, including the President of the ECB, Christine Lagarde.
In extreme situations, the European Central Bank can enact a policy tool called Quantitative Easing. QE is the process by which the ECB prints Euros and uses them to buy assets – usually government or corporate bonds – from banks and other financial institutions. QE usually results in a weaker Euro. QE is a last resort when simply lowering interest rates is unlikely to achieve the objective of price stability. The ECB used it during the Great Financial Crisis in 2009-11, in 2015 when inflation remained stubbornly low, as well as during the covid pandemic.
Quantitative tightening (QT) is the reverse of QE. It is undertaken after QE when an economic recovery is underway and inflation starts rising. Whilst in QE the European Central Bank (ECB) purchases government and corporate bonds from financial institutions to provide them with liquidity, in QT the ECB stops buying more bonds, and stops reinvesting the principal maturing on the bonds it already holds. It is usually positive (or bullish) for the Euro.
- The United States Gross Domestic Product is expected to grow at an annualised rate of 2.8% in Q4 2024.
- The US economy is expected to keep growing at a healthy pace.
- The US Dollar is in recovery mode amid ruling risk aversion.
The United States (US) Bureau of Economic Analysis (BEA) is scheduled to release the preliminary estimate of the US Gross Domestic Product (GDP) for the October-December quarter on Thursday. Analysts anticipate that the report will indicate an annualised economic growth rate of 2.8%, slightly below the 3.1% posted in the third quarter of the year.
What to expect from GDP figures this time
The BEA’s preliminary GDP release is the most important for financial markets, as the figure is the ultimate indicator of US economic health. Alongside growth data, the report includes fresh Personal Consumption Expenditures (PCE) - Price Index figures, the Federal Reserve's (Fed) favourite inflation gauge.
The current release is a bit tricky, as the Fed announced its monetary policy decision to keep interest rates on hold ahead of GDP and PCE updates, and financial markets are still digesting the latest on that front.
Back in December, the Fed published its latest Summary of Economic Projections (SEP) or dot plot, which showed upward revisions in 2025 year-end growth to 2.1% from 2% and to core inflation to 2.5% from 2.1%. Generally speaking, the latest SEP suggested policymakers expected continued economic expansion and inflation to remain above their 2% goal for some more time.
Beyond the headline GDP reading, market participants anticipate the Q4 core PCE Price Index will print at 2.5%, higher than the 2.2% posted in Q3.
Other than that, the report includes the GDP Price Index, which tracks changes in the prices of goods and services produced domestically, including exports but excluding imports. This index provides a clear view of how inflation is affecting GDP. For the fourth quarter, the GDP Price Index is expected to increase by 2.5%, up from the 1.9% rise seen in the third quarter.
It is worth adding that the GDPNow model from the Federal Reserve Bank of Atlanta estimates real GDP growth in the fourth quarter of 2024 is 3.2% on Tuesday, up from 3.0% on January 17.
When will the GDP print be released and how can it affect the USD?
The US GDP report will be published at 13:30 GMT on Wednesday. In addition to the headline real GDP figure, changes in private domestic purchases, the GDP Price Index and the Q4 PCE Price Index figures could impact the US Dollar’s (USD) valuation.
A better-than-anticipated GDP headline could support the Fed’s dovish case and pressure the USD while discouraging figures could have the opposite effect on the American currency.
Valeria Bednarik, FXStreet Chief Analyst, says: “The US Dollar Index (DXY) recovered amid a risk-averse environment at the beginning of the week but stands far below the monthly high posted in mid-January at 110.18. At the same time, the ongoing advance lacks momentum, according to technical readings in the daily chart. The January 23 intraday high at 108.50 comes as an immediate barrier ahead of the 109.00 figure. Should the index surpass the latter, market players will be looking at the 109.40-109.50 region as a potential bullish target.”
Bednarik adds: “A decline below 107.75, the January 29 intraday low, exposes the monthly bottom at 106.97. Still, and given the risk-averse environment, US Dollar dips could be seen as buying opportunities, with additional falls unlikely in the near term.”
US Dollar FAQs
The US Dollar (USD) is the official currency of the United States of America, and the ‘de facto’ currency of a significant number of other countries where it is found in circulation alongside local notes. It is the most heavily traded currency in the world, accounting for over 88% of all global foreign exchange turnover, or an average of $6.6 trillion in transactions per day, according to data from 2022. Following the second world war, the USD took over from the British Pound as the world’s reserve currency. For most of its history, the US Dollar was backed by Gold, until the Bretton Woods Agreement in 1971 when the Gold Standard went away.
The most important single factor impacting on the value of the US Dollar is monetary policy, which is shaped by the Federal Reserve (Fed). The Fed has two mandates: to achieve price stability (control inflation) and foster full employment. Its primary tool to achieve these two goals is by adjusting interest rates. When prices are rising too quickly and inflation is above the Fed’s 2% target, the Fed will raise rates, which helps the USD value. When inflation falls below 2% or the Unemployment Rate is too high, the Fed may lower interest rates, which weighs on the Greenback.
In extreme situations, the Federal Reserve can also print more Dollars and enact quantitative easing (QE). QE is the process by which the Fed substantially increases the flow of credit in a stuck financial system. It is a non-standard policy measure used when credit has dried up because banks will not lend to each other (out of the fear of counterparty default). It is a last resort when simply lowering interest rates is unlikely to achieve the necessary result. It was the Fed’s weapon of choice to combat the credit crunch that occurred during the Great Financial Crisis in 2008. It involves the Fed printing more Dollars and using them to buy US government bonds predominantly from financial institutions. QE usually leads to a weaker US Dollar.
Quantitative tightening (QT) is the reverse process whereby the Federal Reserve stops buying bonds from financial institutions and does not reinvest the principal from the bonds it holds maturing in new purchases. It is usually positive for the US Dollar.
Economic Indicator
Gross Domestic Product Annualized
The real Gross Domestic Product (GDP) Annualized, released quarterly by the US Bureau of Economic Analysis, measures the value of the final goods and services produced in the United States in a given period of time. Changes in GDP are the most popular indicator of the nation’s overall economic health. The data is expressed at an annualized rate, which means that the rate has been adjusted to reflect the amount GDP would have changed over a year’s time, had it continued to grow at that specific rate. Generally speaking, a high reading is seen as bullish for the US Dollar (USD), while a low reading is seen as bearish.
Read more.Next release: Thu Jan 30, 2025 13:30 (Prel)
Frequency: Quarterly
Consensus: 2.6%
Previous: 3.1%
Source: US Bureau of Economic Analysis
The US Bureau of Economic Analysis (BEA) releases the Gross Domestic Product (GDP) growth on an annualized basis for each quarter. After publishing the first estimate, the BEA revises the data two more times, with the third release representing the final reading. Usually, the first estimate is the main market mover and a positive surprise is seen as a USD-positive development while a disappointing print is likely to weigh on the greenback. Market participants usually dismiss the second and third releases as they are generally not significant enough to meaningfully alter the growth picture.
Bank of Japan (BoJ) Deputy Governor Ryozo Himino said on Thursday, the central bank “will raise rates if economy and prices move in line with forecast.
Additional comments
BoJ continues to support economy with accommodative monetary environment.
Still some distance for Japan to enter world of positive real interest rate.
When shock hits the economy or various deflationary factors remain, it might be necessary to keep real rates in negative territory.
If shocks, deflationary factors disappear, it's not normal for real rates to remain clearly negative for a prolonged period.
Level of real interest rate that is neutral to economy is affected by various factors, not just demographics.
Ideal outlook for Japan would be for economic growth to boost wages, corporate profits, thereby leading to moderate inflation.
There are questions as to why estimated output gap has not improved markedly despite real interest rates remaining clearly negative.
Market reaction
At the time of writing, USD/JPY is picking up fresh bids to trade near 154.75, still down 0.28% on the day.
- GBP/USD posts modest gains near 1.2445 in Thursday’s early European session.
- The pair keeps the negative outlook below the 100-day EMA with the bearish RSI indicator.
- The first downside target emerges at the 1.2400-1.2390 region; the upside barrier is located at 1.2570.
The GBP/USD pair trades with mild gains around 1.2445 during the early European trading hours on Thursday. A modest decline in the Greenback provides some support to the major pair. Investors will closely watch the advance US Gross Domestic Product (GDP) data for the fourth quarter (Q4), which is due later on Thursday. Also, the weekly Initial Jobless Claims and Pending Home Sales will be published.
According to the daily chart, the bearish outlook of GBP/USD remains in place, with the price holding below the key 100-day Exponential Moving Average (EMA). However, the 14-day Relative Strength Index (RSI) hovers around the midline, indicating that the consolidation cannot be ruled out.
The initial support level for the major pair emerges in the 1.2400-1.2390 zone, representing the psychological level and the low of January 29. A breach of this level could see a drop to 1.2307, the low of January 22. The additional downside filter to watch is 1.2160, the low of January 20, followed by 1.2125, the lower limit of the Bollinger Band.
On the bright side, the immediate resistance level is located at 1.2570, the upper boundary of the Bollinger Band. Further north, the next hurdle is seen at 1.2645, the 100-day EMA. The next upside barrier to watch is 1.2778, the high of December 10.
GBP/USD daily chart
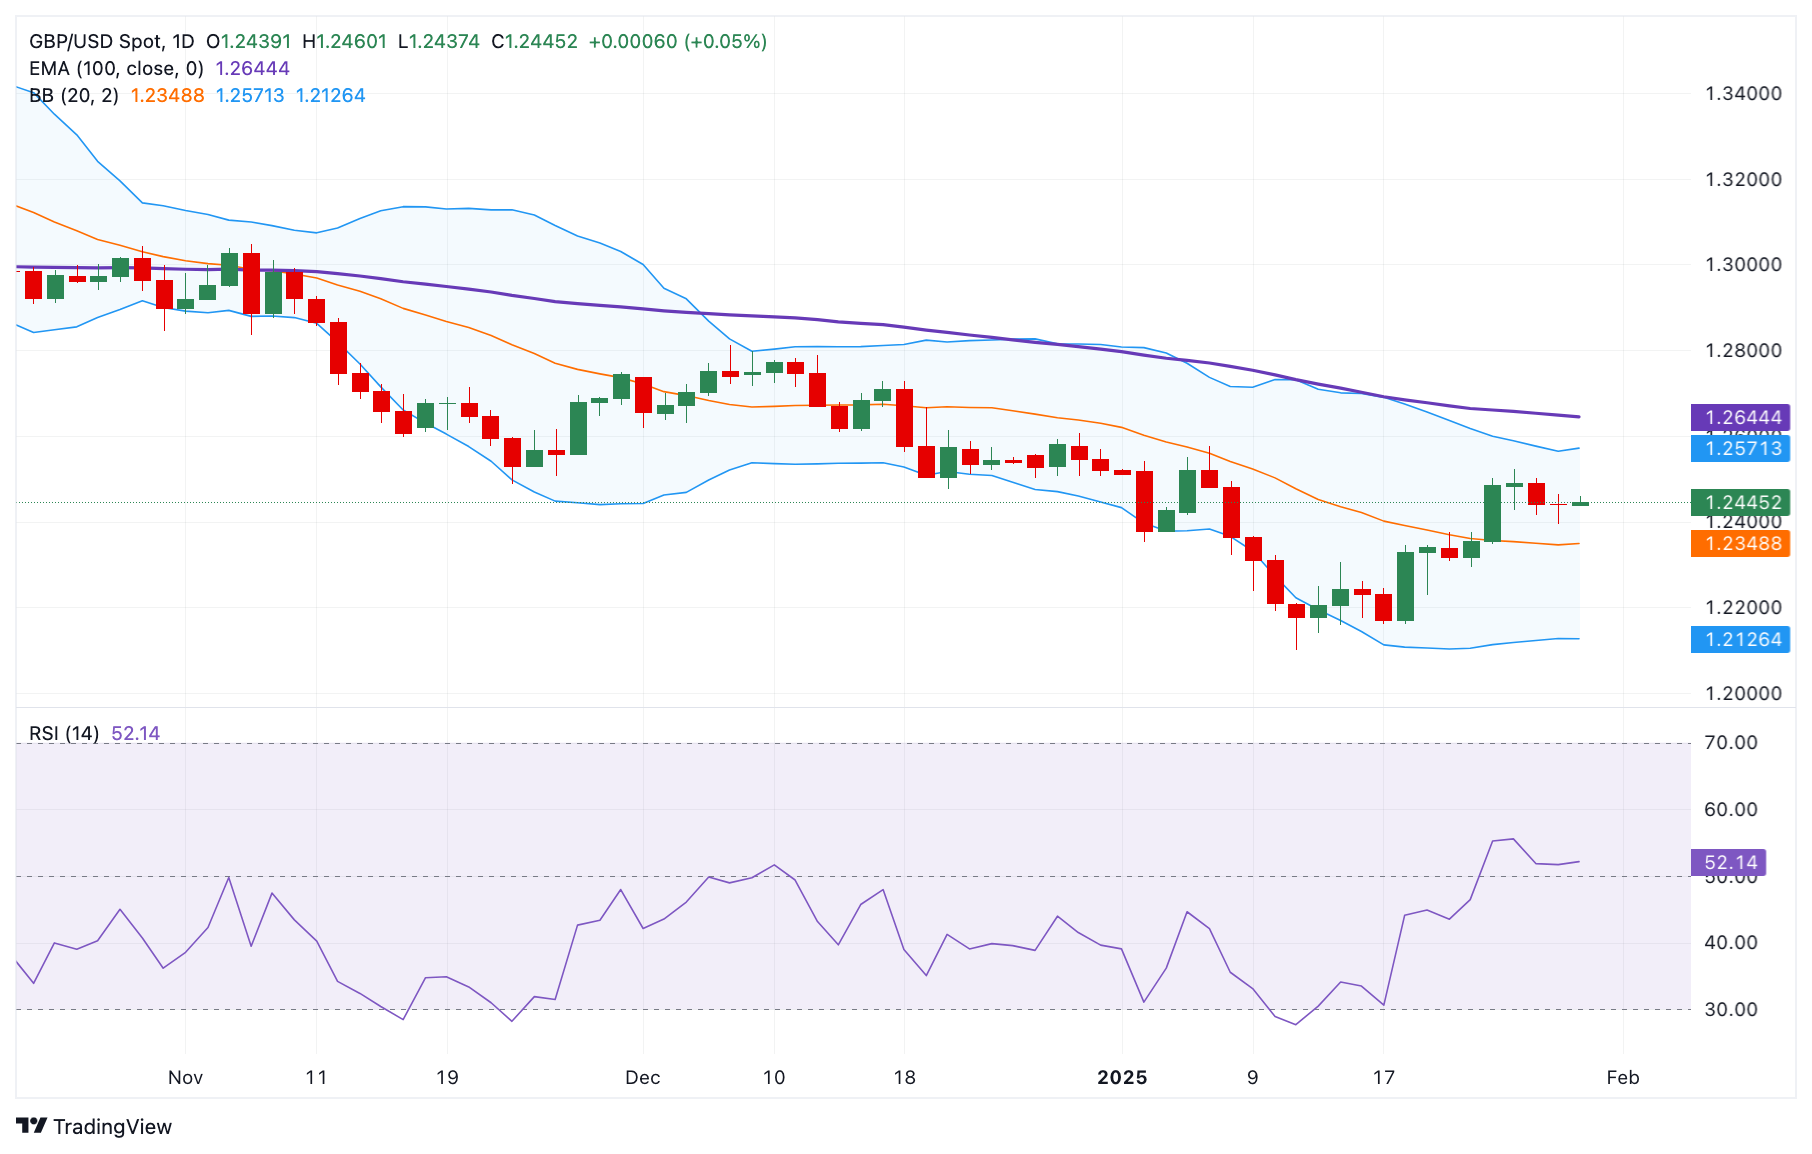
Pound Sterling FAQs
The Pound Sterling (GBP) is the oldest currency in the world (886 AD) and the official currency of the United Kingdom. It is the fourth most traded unit for foreign exchange (FX) in the world, accounting for 12% of all transactions, averaging $630 billion a day, according to 2022 data. Its key trading pairs are GBP/USD, also known as ‘Cable’, which accounts for 11% of FX, GBP/JPY, or the ‘Dragon’ as it is known by traders (3%), and EUR/GBP (2%). The Pound Sterling is issued by the Bank of England (BoE).
The single most important factor influencing the value of the Pound Sterling is monetary policy decided by the Bank of England. The BoE bases its decisions on whether it has achieved its primary goal of “price stability” – a steady inflation rate of around 2%. Its primary tool for achieving this is the adjustment of interest rates. When inflation is too high, the BoE will try to rein it in by raising interest rates, making it more expensive for people and businesses to access credit. This is generally positive for GBP, as higher interest rates make the UK a more attractive place for global investors to park their money. When inflation falls too low it is a sign economic growth is slowing. In this scenario, the BoE will consider lowering interest rates to cheapen credit so businesses will borrow more to invest in growth-generating projects.
Data releases gauge the health of the economy and can impact the value of the Pound Sterling. Indicators such as GDP, Manufacturing and Services PMIs, and employment can all influence the direction of the GBP. A strong economy is good for Sterling. Not only does it attract more foreign investment but it may encourage the BoE to put up interest rates, which will directly strengthen GBP. Otherwise, if economic data is weak, the Pound Sterling is likely to fall.
Another significant data release for the Pound Sterling is the Trade Balance. This indicator measures the difference between what a country earns from its exports and what it spends on imports over a given period. If a country produces highly sought-after exports, its currency will benefit purely from the extra demand created from foreign buyers seeking to purchase these goods. Therefore, a positive net Trade Balance strengthens a currency and vice versa for a negative balance.
- USD/CHF moves little as traders await economic releases seeking fresh impetus.
- US Gross Domestic Product Annualized (Q4) could report a 2.6% growth, down from the previous 3.1%.
- Swiss Trade Balance and the KOF Leading Indicator are scheduled to be released on Thursday.
USD/CHF steadies after two consecutive days of gains, trading around 0.9070 during the Asian session on Thursday. This decline is mainly attributed to a weaker US Dollar (USD). The US Dollar Index (DXY), which tracks the Greenback against six major currencies, hovers slightly below the 108.00 mark at the time of writing.
Traders are awaiting the release of the US fourth-quarter Gross Domestic Product (GDP) growth data, scheduled for Thursday. The market consensus expects a slowdown in annualized GDP growth, with a forecast of 2.6%, down from the previous 3.1%. Inflationary concerns persist, with the Q4 GDP Price Index expected to rise to 2.5%, up from 1.9%.
The downside for USD/CHF may be limited, as the USD could strengthen following the Federal Reserve's (Fed) cautious approach to monetary policy. The Fed maintained its overnight borrowing rate at 4.25%-4.50% during its January meeting on Wednesday, as widely anticipated. This decision follows three consecutive rate cuts since September 2024, totaling a one-percentage-point reduction.
The Fed's hawkish stance was further reinforced by its decision to remove language suggesting confidence in inflation reaching its 2% target. Fed Chair Jerome Powell also emphasized in the press conference that the central bank would require "real progress on inflation or some weakness in the labor market" before considering any policy changes.
In Switzerland, the ZEW Survey Expectations for January increased to 17.7, reversing the previous month's decline to -20, according to data released on Wednesday. Traders are also awaiting the Swiss Trade Balance for December and the KOF Leading Indicator for January, both scheduled for release on Thursday.
Swiss Franc FAQs
The Swiss Franc (CHF) is Switzerland’s official currency. It is among the top ten most traded currencies globally, reaching volumes that well exceed the size of the Swiss economy. Its value is determined by the broad market sentiment, the country’s economic health or action taken by the Swiss National Bank (SNB), among other factors. Between 2011 and 2015, the Swiss Franc was pegged to the Euro (EUR). The peg was abruptly removed, resulting in a more than 20% increase in the Franc’s value, causing a turmoil in markets. Even though the peg isn’t in force anymore, CHF fortunes tend to be highly correlated with the Euro ones due to the high dependency of the Swiss economy on the neighboring Eurozone.
The Swiss Franc (CHF) is considered a safe-haven asset, or a currency that investors tend to buy in times of market stress. This is due to the perceived status of Switzerland in the world: a stable economy, a strong export sector, big central bank reserves or a longstanding political stance towards neutrality in global conflicts make the country’s currency a good choice for investors fleeing from risks. Turbulent times are likely to strengthen CHF value against other currencies that are seen as more risky to invest in.
The Swiss National Bank (SNB) meets four times a year – once every quarter, less than other major central banks – to decide on monetary policy. The bank aims for an annual inflation rate of less than 2%. When inflation is above target or forecasted to be above target in the foreseeable future, the bank will attempt to tame price growth by raising its policy rate. Higher interest rates are generally positive for the Swiss Franc (CHF) as they lead to higher yields, making the country a more attractive place for investors. On the contrary, lower interest rates tend to weaken CHF.
Macroeconomic data releases in Switzerland are key to assessing the state of the economy and can impact the Swiss Franc’s (CHF) valuation. The Swiss economy is broadly stable, but any sudden change in economic growth, inflation, current account or the central bank’s currency reserves have the potential to trigger moves in CHF. Generally, high economic growth, low unemployment and high confidence are good for CHF. Conversely, if economic data points to weakening momentum, CHF is likely to depreciate.
As a small and open economy, Switzerland is heavily dependent on the health of the neighboring Eurozone economies. The broader European Union is Switzerland’s main economic partner and a key political ally, so macroeconomic and monetary policy stability in the Eurozone is essential for Switzerland and, thus, for the Swiss Franc (CHF). With such dependency, some models suggest that the correlation between the fortunes of the Euro (EUR) and the CHF is more than 90%, or close to perfect.
- EUR/JPY extends downside to around 161.05 in Thursday’s early European session, down 0.43% on the day.
- The ECB is expected to cut rates at its January meeting on Thursday.
- Rising bets for more BoJ rate hikes lift the Japanese Yen and act as a headwind for EUR/JPY.
The EUR/JPY cross extends the decline to near 161.05 during the early European session on Thursday. The rising expectation that the European Central Bank (ECB) is set to kick off its 2025 meetings with another interest rate cut on Thursday continues to undermine the Euro (EUR) against the Japanese Yen (JPY). Also, the preliminary reading of Gross Domestic Product (GDP) from the Eurozone for the fourth quarter will be released later in the day.
The ECB is widely anticipated to cut its key interest rate by another 25 basis points (bps) to 2.75% and continue its easing cycle amid an uncertain economic outlook and sticky service inflation. “We expect the ECB to cut by 25 basis points at each of the four governing council meetings in the first half of the year, lowering the policy rate to 2.00% by mid-year,” noted Mark Wall, chief economist at Deutsche Bank.
Furthermore, the cautious sentiment and the rising speculation that the Bank of Japan (BoJ) will further raise the interest rates provide some support to the JPY and create a headwind for the cross. On Tuesday, former BoJ board member Makoto Sakurai said that broadening wage hikes, prospects of sustained price rises, and solid economic growth give the BoJ scope to continue raising rates steadily.
ECB FAQs
The European Central Bank (ECB) in Frankfurt, Germany, is the reserve bank for the Eurozone. The ECB sets interest rates and manages monetary policy for the region. The ECB primary mandate is to maintain price stability, which means keeping inflation at around 2%. Its primary tool for achieving this is by raising or lowering interest rates. Relatively high interest rates will usually result in a stronger Euro and vice versa. The ECB Governing Council makes monetary policy decisions at meetings held eight times a year. Decisions are made by heads of the Eurozone national banks and six permanent members, including the President of the ECB, Christine Lagarde.
In extreme situations, the European Central Bank can enact a policy tool called Quantitative Easing. QE is the process by which the ECB prints Euros and uses them to buy assets – usually government or corporate bonds – from banks and other financial institutions. QE usually results in a weaker Euro. QE is a last resort when simply lowering interest rates is unlikely to achieve the objective of price stability. The ECB used it during the Great Financial Crisis in 2009-11, in 2015 when inflation remained stubbornly low, as well as during the covid pandemic.
Quantitative tightening (QT) is the reverse of QE. It is undertaken after QE when an economic recovery is underway and inflation starts rising. Whilst in QE the European Central Bank (ECB) purchases government and corporate bonds from financial institutions to provide them with liquidity, in QT the ECB stops buying more bonds, and stops reinvesting the principal maturing on the bonds it already holds. It is usually positive (or bullish) for the Euro.
- EUR/USD consolidates in a range ahead of the crucial ECB monetary policy meeting.
- The ECB is widely expected to cut rates for the fifth consecutive meeting, by 25 bps.
- This marks a divergence in comparison to the Fed’s hawkish pause and favors bears.
The EUR/USD pair struggles to capitalize on the overnight bounce from the 1.0380 area or the weekly low and oscillates in a narrow band during the Asian session on Thursday. Spot prices currently trade around the 1.420 region, nearly unchanged for the day as traders opt to wait on the sidelines ahead of the highly-anticipated European Central Bank (ECB) meeting.
The ECB is widely expected to lower borrowing costs for the fifth straight meeting on the back of persistent low inflation and subdued economic growth in the Eurozone. Moreover, the markets have been pricing in the possibility of three more rate cuts by the end of this year amid concerns over the potential economic fallout from US President Donald Trump’s threatened trade tariffs. This, in turn, is seen acting as a headwind for the shared currency and the EUR/USD pair amid a modest US Dollar (USD) uptick.
Despite Trump's demand for lower interest rates, the US central bank decided to stand pat at the end of a two-day meeting on Wednesday and signaled that there would be no rush to lower borrowing costs until inflation and jobs data made it appropriate. The Fed's hawkish pause acts as a tailwind for the USD and further contributes to capping the EUR/USD pair. That said, a fresh leg down in the US Treasury bond yields keeps a lid on the USD and supports the currency pair heading into the key central bank event risk.
Apart from the crucial ECB decision, traders on Thursday will look to the release of the Advance US Q4 GDP print, which might influence the USD price dynamics and provide some impetus to the EUR/USD pair later during the North American session, Nevertheless, the divergent ECB-Fed policy expectations suggest that the path of least resistance for the EUR/USD pair is to the downside. Hence, any attempted recovery move might still be seen as a selling opportunity and run the risk of fizzling out rather quickly.
Economic Indicator
ECB Rate On Deposit Facility
One of the European Central Bank's three key interest rates, the rate on the deposit facility, is the rate at which banks earn interest when they deposit funds with the ECB. It is announced by the European Central Bank at each of its eight scheduled annual meetings.
Read more.Next release: Thu Jan 30, 2025 13:15
Frequency: Irregular
Consensus: 2.75%
Previous: 3%
Source: European Central Bank
- EUR/USD gains some ground due to a technical downward correction the US Dollar.
- The USD could appreciate amid the Fed’s cautious stance on monetary policy.
- Traders expect the ECB to deliver a 25 basis point rate cut at its monetary policy meeting on Thursday.
EUR/USD inches higher after three consecutive losses, trading around 1.0420 during Asian hours on Thursday. The uptick is driven by a technical pullback in the US Dollar (USD). Meanwhile, the US Dollar Index (DXY), which measures the greenback against six major currencies, hovers slightly below 108.00 at the time of writing.
However, the pair’s gains may be limited as the USD could regain strength following the Federal Reserve’s (Fed) cautious stance on monetary policy. The Fed reinforced its hawkish outlook by removing language that signaled confidence in inflation reaching its 2% target.
During the press conference, Fed Chair Jerome Powell reiterated that the central bank would require “real progress on inflation or some weakness in the labor market” before considering any policy adjustments. As widely expected, the Fed kept its overnight borrowing rate unchanged at 4.25%-4.50% during its January meeting on Wednesday. This decision follows three consecutive rate cuts since September 2024, amounting to a total reduction of one percentage point.
Meanwhile, the Euro faces headwinds as the European Central Bank (ECB) is expected to cut rates by 25 basis points at its monetary policy meeting on Thursday, bringing the Deposit Rate down to 2.75%. Market participants anticipate further ECB rate cuts in the coming months, potentially pressuring the Euro.
Traders will also focus on the upcoming fourth-quarter Gross Domestic Product (GDP) data from the Eurozone and Germany, set for release on Thursday. Later in the North American session, attention will shift to the US Gross Domestic Product Annualized report.
Economic Indicator
ECB Rate On Deposit Facility
One of the European Central Bank's three key interest rates, the rate on the deposit facility, is the rate at which banks earn interest when they deposit funds with the ECB. It is announced by the European Central Bank at each of its eight scheduled annual meetings.
Read more.Next release: Thu Jan 30, 2025 13:15
Frequency: Irregular
Consensus: 2.75%
Previous: 3%
Source: European Central Bank
Gold prices rose in India on Thursday, according to data compiled by FXStreet.
The price for Gold stood at 7,688.76 Indian Rupees (INR) per gram, up compared with the INR 7,667.66 it cost on Wednesday.
The price for Gold increased to INR 89,680.16 per tola from INR 89,434.10 per tola a day earlier.
| Unit measure | Gold Price in INR |
|---|---|
| 1 Gram | 7,688.76 |
| 10 Grams | 76,887.57 |
| Tola | 89,680.16 |
| Troy Ounce | 239,145.50 |
FXStreet calculates Gold prices in India by adapting international prices (USD/INR) to the local currency and measurement units. Prices are updated daily based on the market rates taken at the time of publication. Prices are just for reference and local rates could diverge slightly.
Gold FAQs
Gold has played a key role in human’s history as it has been widely used as a store of value and medium of exchange. Currently, apart from its shine and usage for jewelry, the precious metal is widely seen as a safe-haven asset, meaning that it is considered a good investment during turbulent times. Gold is also widely seen as a hedge against inflation and against depreciating currencies as it doesn’t rely on any specific issuer or government.
Central banks are the biggest Gold holders. In their aim to support their currencies in turbulent times, central banks tend to diversify their reserves and buy Gold to improve the perceived strength of the economy and the currency. High Gold reserves can be a source of trust for a country’s solvency. Central banks added 1,136 tonnes of Gold worth around $70 billion to their reserves in 2022, according to data from the World Gold Council. This is the highest yearly purchase since records began. Central banks from emerging economies such as China, India and Turkey are quickly increasing their Gold reserves.
Gold has an inverse correlation with the US Dollar and US Treasuries, which are both major reserve and safe-haven assets. When the Dollar depreciates, Gold tends to rise, enabling investors and central banks to diversify their assets in turbulent times. Gold is also inversely correlated with risk assets. A rally in the stock market tends to weaken Gold price, while sell-offs in riskier markets tend to favor the precious metal.
The price can move due to a wide range of factors. Geopolitical instability or fears of a deep recession can quickly make Gold price escalate due to its safe-haven status. As a yield-less asset, Gold tends to rise with lower interest rates, while higher cost of money usually weighs down on the yellow metal. Still, most moves depend on how the US Dollar (USD) behaves as the asset is priced in dollars (XAU/USD). A strong Dollar tends to keep the price of Gold controlled, whereas a weaker Dollar is likely to push Gold prices up.
(An automation tool was used in creating this post.)
- Gold price extends its consolidative price move in the weekly trading range.
- The Fed’s hawkish pause acts as a headwind for the non-yielding commodity.
- Sliding US bond yields keep the USD bulls on the defensive and lend support.
Gold price (XAU/USD) ticks higher during the Asian session on Thursday, though it lacks follow-through and remains confined in the weekly range amid mixed fundamental cues. The Federal Reserve's (Fed) hawkish pause at the end of a two-day policy meeting on Wednesday acts as a tailwind for the US Dollar (USD) and caps the non-yielding yellow metal. That said, a fresh leg down in the US Treasury bond yields, along with concerns about US President Donald Trump's tariff plans, continue to offer support to the safe-haven commodity.
Furthermore, Trump's demand for lower interest rates and signs of abating inflation in the US support the prospect for further policy easing by the Fed. This, in turn, suggests that the path of least resistance for the Gold price remains to the upside. Hence, any corrective pullback might still be seen as a buying opportunity and remain limited. The market focus now shifts to the European Central Bank (ECB) policy meeting, which might infuse some volatility in the financial markets and produce short-term trading opportunities around the XAU/USD.
Gold price continues to draw support from trade war fears, sliding US bond yields
- The Federal Reserve held interest rates steady on Wednesday and signaled that there would be no rush to lower borrowing costs until inflation and jobs data made it appropriate.
- In the post-meeting press conference, Fed Chair Jerome Powell said that politics would not affect the central bank's interest-rate calls and downplayed expectations for future rate cuts.
- Powell's remarks reaffirmed the notion that rates will remain higher for longer amid caution over US President Donald Trump's protectionist policies, which could reignite inflation.
- The yield on the benchmark 10-year US government bond struggles to build on the post-FOMC bounce from over a one-month low, capping the US Dollar and supporting the Gold price.
- Investors remain concerned about the potential economic fallout from Trump's trade tariffs and protectionist policies, which further underpin the safe-haven precious metal.
- The highly-anticipated European Central Bank (ECB) monetary policy decision this Thursday could infuse some volatility in the markets and drive demand for the XAU/USD.
- The focus will then shift to the release of the closely-watched US Personal Consumption Expenditures (PCE) Price Index – the Fed's preferred inflation gauge – on Friday.
Gold price bulls await a move beyond the $2,772-2,773 immediate hurdle
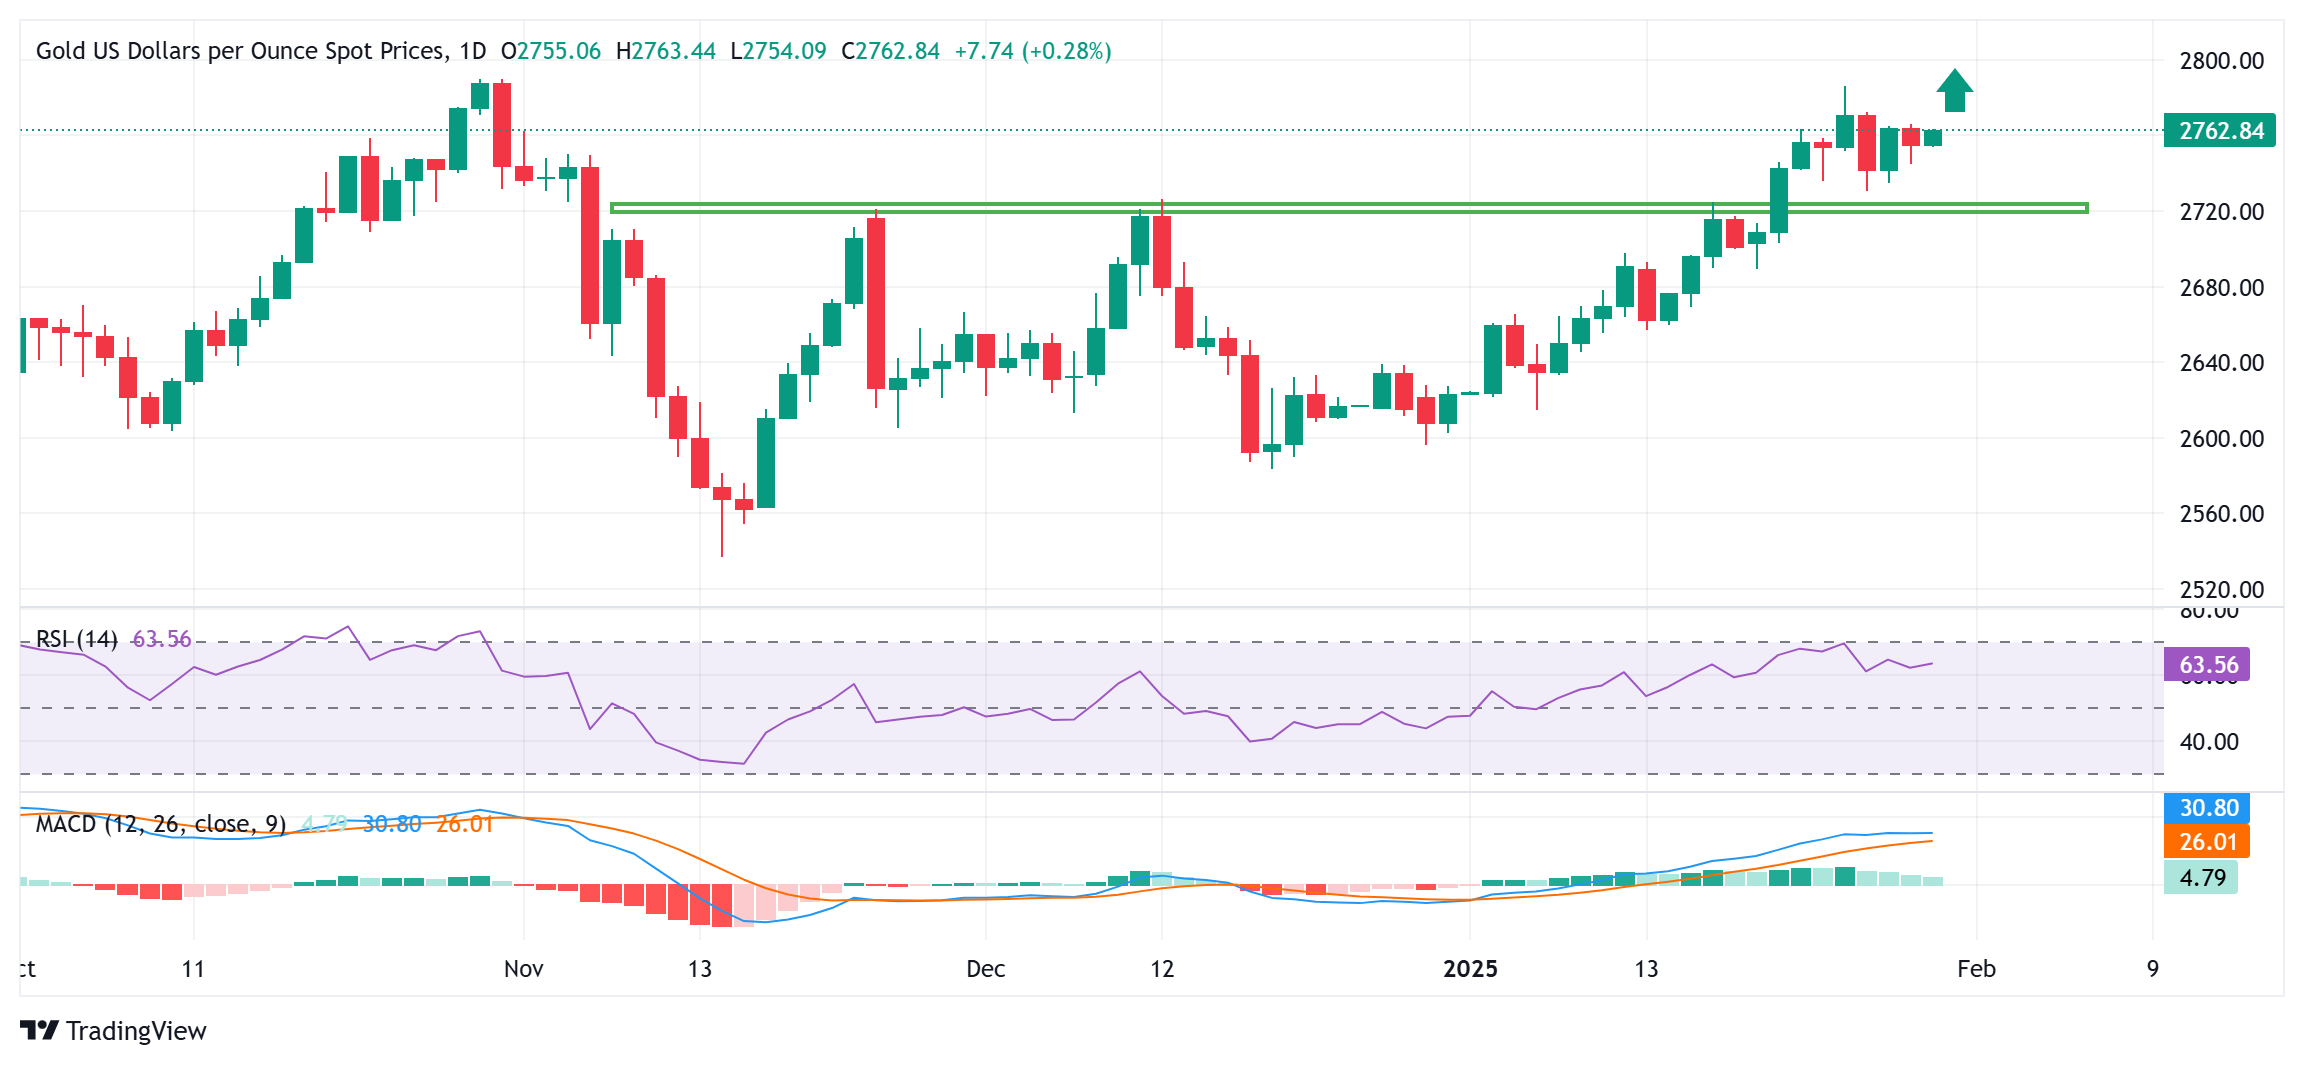
From a technical perspective, the recent breakout through the $2,720-2,725 horizontal barrier and positive oscillators on the daily chart validate the near-term positive outlook for the Gold price. That said, it will still be prudent to wait for a subsequent strength beyond the $2,772-2,773 immediate hurdle before positioning for a move towards the $2,786 area, or the highest level since October 2024 touched last Friday. The momentum could extend further towards the all-time peak, near the $2,790 zone. Some follow-through buying, leading to a move beyond the $2,800 mark, will be seen as a fresh trigger for bulls and pave the way for an extension of a well-established uptrend witnessed over the past month or so.
On the flip side, weakness below the overnight swing low, around the $2,745-2,744 area could be seen as a buying opportunity but limited near the $2,730 region, or the weekly trough touched on Monday. This is followed by the $2,725-2,750 resistance-turned-support, below which the Gold price could accelerate the fall towards the $2,707-2,705 area en route to the $2,684 support zone.
Gold FAQs
Gold has played a key role in human’s history as it has been widely used as a store of value and medium of exchange. Currently, apart from its shine and usage for jewelry, the precious metal is widely seen as a safe-haven asset, meaning that it is considered a good investment during turbulent times. Gold is also widely seen as a hedge against inflation and against depreciating currencies as it doesn’t rely on any specific issuer or government.
Central banks are the biggest Gold holders. In their aim to support their currencies in turbulent times, central banks tend to diversify their reserves and buy Gold to improve the perceived strength of the economy and the currency. High Gold reserves can be a source of trust for a country’s solvency. Central banks added 1,136 tonnes of Gold worth around $70 billion to their reserves in 2022, according to data from the World Gold Council. This is the highest yearly purchase since records began. Central banks from emerging economies such as China, India and Turkey are quickly increasing their Gold reserves.
Gold has an inverse correlation with the US Dollar and US Treasuries, which are both major reserve and safe-haven assets. When the Dollar depreciates, Gold tends to rise, enabling investors and central banks to diversify their assets in turbulent times. Gold is also inversely correlated with risk assets. A rally in the stock market tends to weaken Gold price, while sell-offs in riskier markets tend to favor the precious metal.
The price can move due to a wide range of factors. Geopolitical instability or fears of a deep recession can quickly make Gold price escalate due to its safe-haven status. As a yield-less asset, Gold tends to rise with lower interest rates, while higher cost of money usually weighs down on the yellow metal. Still, most moves depend on how the US Dollar (USD) behaves as the asset is priced in dollars (XAU/USD). A strong Dollar tends to keep the price of Gold controlled, whereas a weaker Dollar is likely to push Gold prices up.
Japan’s Chief Cabinet Secretary Yoshimasa Hayashi said on Thursday, he is “monitoring the Fed decision impact on Japan’s economy as the US is Japan's largest outbound investment destination.”
Additional comments
Will to finalize timing of meeting between Japanese PM Shigeru Ishiba and US President Donald Trump.
Emphasizes AI as a key factor for promoting innovation and addressing risks.
Market reaction
At press time, USD/JPY is trading 0.45% lower on the day, ranging at around 154.50.
The Reserve Bank of Australia published its January 2025 Bulletin, including an in-depth explainer on how:
- Changes to monetary policy affect interest rates in the economy.
- Changes to interest rates affect economic activity and inflation.
Market reaction
At the time of writing, AUD/USD trades better bid near 0.6232, up 0.05% on the day.
RBA FAQs
The Reserve Bank of Australia (RBA) sets interest rates and manages monetary policy for Australia. Decisions are made by a board of governors at 11 meetings a year and ad hoc emergency meetings as required. The RBA’s primary mandate is to maintain price stability, which means an inflation rate of 2-3%, but also “..to contribute to the stability of the currency, full employment, and the economic prosperity and welfare of the Australian people.” Its main tool for achieving this is by raising or lowering interest rates. Relatively high interest rates will strengthen the Australian Dollar (AUD) and vice versa. Other RBA tools include quantitative easing and tightening.
While inflation had always traditionally been thought of as a negative factor for currencies since it lowers the value of money in general, the opposite has actually been the case in modern times with the relaxation of cross-border capital controls. Moderately higher inflation now tends to lead central banks to put up their interest rates, which in turn has the effect of attracting more capital inflows from global investors seeking a lucrative place to keep their money. This increases demand for the local currency, which in the case of Australia is the Aussie Dollar.
Macroeconomic data gauges the health of an economy and can have an impact on the value of its currency. Investors prefer to invest their capital in economies that are safe and growing rather than precarious and shrinking. Greater capital inflows increase the aggregate demand and value of the domestic currency. Classic indicators, such as GDP, Manufacturing and Services PMIs, employment, and consumer sentiment surveys can influence AUD. A strong economy may encourage the Reserve Bank of Australia to put up interest rates, also supporting AUD.
Quantitative Easing (QE) is a tool used in extreme situations when lowering interest rates is not enough to restore the flow of credit in the economy. QE is the process by which the Reserve Bank of Australia (RBA) prints Australian Dollars (AUD) for the purpose of buying assets – usually government or corporate bonds – from financial institutions, thereby providing them with much-needed liquidity. QE usually results in a weaker AUD.
Quantitative tightening (QT) is the reverse of QE. It is undertaken after QE when an economic recovery is underway and inflation starts rising. Whilst in QE the Reserve Bank of Australia (RBA) purchases government and corporate bonds from financial institutions to provide them with liquidity, in QT the RBA stops buying more assets, and stops reinvesting the principal maturing on the bonds it already holds. It would be positive (or bullish) for the Australian Dollar.
- Silver price continues to gain ground amid dovish sentiment surrounding the major central banks’ policy outlook.
- The upside of the non-interest-bearing Silver could be limited amid the cautious tone surrounding the Fed.
- A stronger US Dollar may create headwinds for Silver, as it increases the metal's cost for investors holding other currencies.
Silver price (XAG/USD) extends its winning streak for the third consecutive session, trading around $30.90 per troy ounce during Asian trading hours on Thursday. The precious metal holds its gains amid dovish signals from major central banks.
The Bank of Canada (BoC) has ended its quantitative tightening and joined Sweden’s Riksbank in delivering a rate cut. Meanwhile, the European Central Bank (ECB) is also expected to lower rates this week, while the Reserve Bank of India (RBI) and the People’s Bank of China (PBoC) have signaled potential rate cuts ahead.
In the United States (US), the Federal Reserve (Fed) kept its benchmark interest rate steady at 4.25%-4.50% during its January meeting on Wednesday, as widely anticipated. This follows three consecutive rate cuts since September 2024, totaling a full percentage point.
However, Silver’s upside may be capped as the Fed delivered a hawkish message by removing language suggesting confidence in inflation moving toward its 2% target. Additionally, the central bank acknowledged strong economic growth and labor market conditions.
During his press conference, Fed Chair Jerome Powell emphasized that the US central bank would need to see “real progress on inflation or some weakness in the labor market” before considering further policy adjustments.
Meanwhile, the US Dollar Index (DXY), which tracks the greenback against six major currencies, remains steady at around 108.00. A stronger US Dollar could pose challenges for Silver, making it more expensive for foreign buyers.
Silver FAQs
Silver is a precious metal highly traded among investors. It has been historically used as a store of value and a medium of exchange. Although less popular than Gold, traders may turn to Silver to diversify their investment portfolio, for its intrinsic value or as a potential hedge during high-inflation periods. Investors can buy physical Silver, in coins or in bars, or trade it through vehicles such as Exchange Traded Funds, which track its price on international markets.
Silver prices can move due to a wide range of factors. Geopolitical instability or fears of a deep recession can make Silver price escalate due to its safe-haven status, although to a lesser extent than Gold's. As a yieldless asset, Silver tends to rise with lower interest rates. Its moves also depend on how the US Dollar (USD) behaves as the asset is priced in dollars (XAG/USD). A strong Dollar tends to keep the price of Silver at bay, whereas a weaker Dollar is likely to propel prices up. Other factors such as investment demand, mining supply – Silver is much more abundant than Gold – and recycling rates can also affect prices.
Silver is widely used in industry, particularly in sectors such as electronics or solar energy, as it has one of the highest electric conductivity of all metals – more than Copper and Gold. A surge in demand can increase prices, while a decline tends to lower them. Dynamics in the US, Chinese and Indian economies can also contribute to price swings: for the US and particularly China, their big industrial sectors use Silver in various processes; in India, consumers’ demand for the precious metal for jewellery also plays a key role in setting prices.
Silver prices tend to follow Gold's moves. When Gold prices rise, Silver typically follows suit, as their status as safe-haven assets is similar. The Gold/Silver ratio, which shows the number of ounces of Silver needed to equal the value of one ounce of Gold, may help to determine the relative valuation between both metals. Some investors may consider a high ratio as an indicator that Silver is undervalued, or Gold is overvalued. On the contrary, a low ratio might suggest that Gold is undervalued relative to Silver.
- The Indian Rupee strengthens in Thursday’s Asian session.
- Likely RBI intervention might help limit the INR’s losses.
- The advanced US Q4 GDP report is due later on Thursday.
The Indian Rupee (INR) recovers some lost ground on Thursday after facing some selling pressure in the previous session. US Dollar sales by public sector banks, likely on behalf of the Reserve Bank of India (RBI) helped contain excess volatility in the local currency.
However, the month-end USD demand, maturity of positions in the non-deliverable forwards (NDF) market and cautious mood could weigh on the INR. Meanwhile, persistent foreign outflows and uncertainty about US President Donald Trump's approach to trade tariffs might contribute to the INR’s downside.
Investors brace for the advance US Gross Domestic Product (GDP) data for the fourth quarter (Q4), including the weekly Initial Jobless Claims, and Pending Home Sales. On Friday, India’s Federal Fiscal Deficit will take center stage.
Indian Rupee rebounds despite Trump tariff threats
- Overseas investors have sold nearly $9 billion of local stocks and bonds so far in January.
- The Fed held its overnight borrowing rate in a range between 4.25%-4.50% at its January meeting on Wednesday, as widely anticipated.
- During the press conference, Fed Chair Jerome Powell said that the central bank would need to see “real progress on inflation or some weakness in the labor market before we consider making adjustments.”
- Powell further stated that the committee is in wait-and-see mode, citing the uncertainty surrounding tariffs, immigration, fiscal policy, and regulatory policy under the Trump administration.
- Late Wednesday, US President Donald Trump's administration plans to rescind a climate rule adopted by the administration of former President Joe Biden requiring states to measure and set declining targets for greenhouse gas emissions from vehicles using the national highway system, per Reuters.
USD/INR’s outlook remains positive in the longer term
The Indian Rupee trades on a positive note on the day. The USD/INR pair remains capped within a narrow trading range on the daily timeframe. The positive bias of the USD/INR pair prevails as the price is well-supported above the key 100-day Exponential Moving Average (EMA). The upward momentum is reinforced by the 14-day Relative Strength Index (RSI), which is located above the midline near 64.05, suggesting the path of least resistance is to the upside.
On the bright side, the immediate resistance level for USD/INR is seen at an all-time high of 86.69. Extended gains above this level could pave the way to the 87.00 psychological mark.
On the flip side, the first downside target to watch is 86.31, the low of January 28. Any follow-through selling will expose 86.14, the low of January 24, followed by 85.85, the low of January 10.
Indian Rupee FAQs
The Indian Rupee (INR) is one of the most sensitive currencies to external factors. The price of Crude Oil (the country is highly dependent on imported Oil), the value of the US Dollar – most trade is conducted in USD – and the level of foreign investment, are all influential. Direct intervention by the Reserve Bank of India (RBI) in FX markets to keep the exchange rate stable, as well as the level of interest rates set by the RBI, are further major influencing factors on the Rupee.
The Reserve Bank of India (RBI) actively intervenes in forex markets to maintain a stable exchange rate, to help facilitate trade. In addition, the RBI tries to maintain the inflation rate at its 4% target by adjusting interest rates. Higher interest rates usually strengthen the Rupee. This is due to the role of the ‘carry trade’ in which investors borrow in countries with lower interest rates so as to place their money in countries’ offering relatively higher interest rates and profit from the difference.
Macroeconomic factors that influence the value of the Rupee include inflation, interest rates, the economic growth rate (GDP), the balance of trade, and inflows from foreign investment. A higher growth rate can lead to more overseas investment, pushing up demand for the Rupee. A less negative balance of trade will eventually lead to a stronger Rupee. Higher interest rates, especially real rates (interest rates less inflation) are also positive for the Rupee. A risk-on environment can lead to greater inflows of Foreign Direct and Indirect Investment (FDI and FII), which also benefit the Rupee.
Higher inflation, particularly, if it is comparatively higher than India’s peers, is generally negative for the currency as it reflects devaluation through oversupply. Inflation also increases the cost of exports, leading to more Rupees being sold to purchase foreign imports, which is Rupee-negative. At the same time, higher inflation usually leads to the Reserve Bank of India (RBI) raising interest rates and this can be positive for the Rupee, due to increased demand from international investors. The opposite effect is true of lower inflation.
| Raw materials | Closed | Change, % |
|---|---|---|
| Silver | 30.822 | 1.33 |
| Gold | 2758.92 | -0.15 |
| Palladium | 960.79 | 0.36 |
- The Japanese Yen continues to be underpinned by bets on more BoJ rate hikes.
- The narrowing US-Japan yield differential further benefits the lower-yielding JPY.
- The Fed’s hawkish pause underpins the USD and could lend support to USD/JPY.
The Japanese Yen (JPY) remains on the front foot for the second successive day against its American counterpart and drags the USD/JPY pair below mid-154.00s during the Asian session on Thursday. Investors now seem convinced that the Bank of Japan (BoJ) will hike interest rates further, which, in turn, is seen underpinning the JPY. Moreover, the recent narrowing of the US-Japan yield differential turns out to be another factor driving flows towards the lower-yielding JPY.
Meanwhile, concerns that US President Donald Trump's trade policies could escalate into a global trade war might hold back the JPY bulls from placing aggressive bets. Furthermore, the Federal Reserve's (Fed) hawkish pause on Wednesday could act as a tailwind for the US Dollar (USD) and limit losses for the USD/JPY pair. Moving ahead, the highly anticipated European Central Bank (ECB) meeting might elevate market volatility and influence demand for the safe-haven JPY.
Japanese Yen bulls retain control amid BoJ rate hike bets
- Minutes of the December Bank of Japan meeting showed on Wednesday that board members discussed how to use estimates on the economy's neutral interest rate to determine further hikes in borrowing costs.
- Former BoJ board member Makoto Sakurai said on Tuesday that broadening wage hikes, prospects of sustained price rises and solid economic growth give the central bank scope to continue raising rates steadily.
- The Federal Reserve, as was widely expected, decided to keep rates steady at the end of a two-day meeting on Wednesday and struck a hawkish stance, signaling no immediate plans for further rate reductions.
- In the post-meeting press conference, Fed Chair Jerome Powell said that we do not need to be in a hurry to adjust our policy stance and that monetary policy is well positioned for the challenges at hand.
- Powell's remarks reaffirmed the notion that rates will remain higher for longer amid caution over US President Donald Trump's protectionist policies, which could boost inflation and act as a tailwind for the US Dollar.
- The yield on the benchmark 10-year US government bond struggles to capitalize on the post-FOMC bounce from over a one-month trough amid the uncertainty over the Trump administration's trade policies.
- The Asahi newspaper reported this Thursday that plans are being finalized for a meeting between Japan's Prime Minister Shigeru Ishiba and US President Donald Trump in Washington on February 7.
- The European Central Bank's policy decision later today might infuse some volatility in the financial markets. Apart from this, the Advance Q4 US GDP print should provide some impetus to the USD/JPY pair.
USD/JPY could retest multi-week low around the 153.70 area
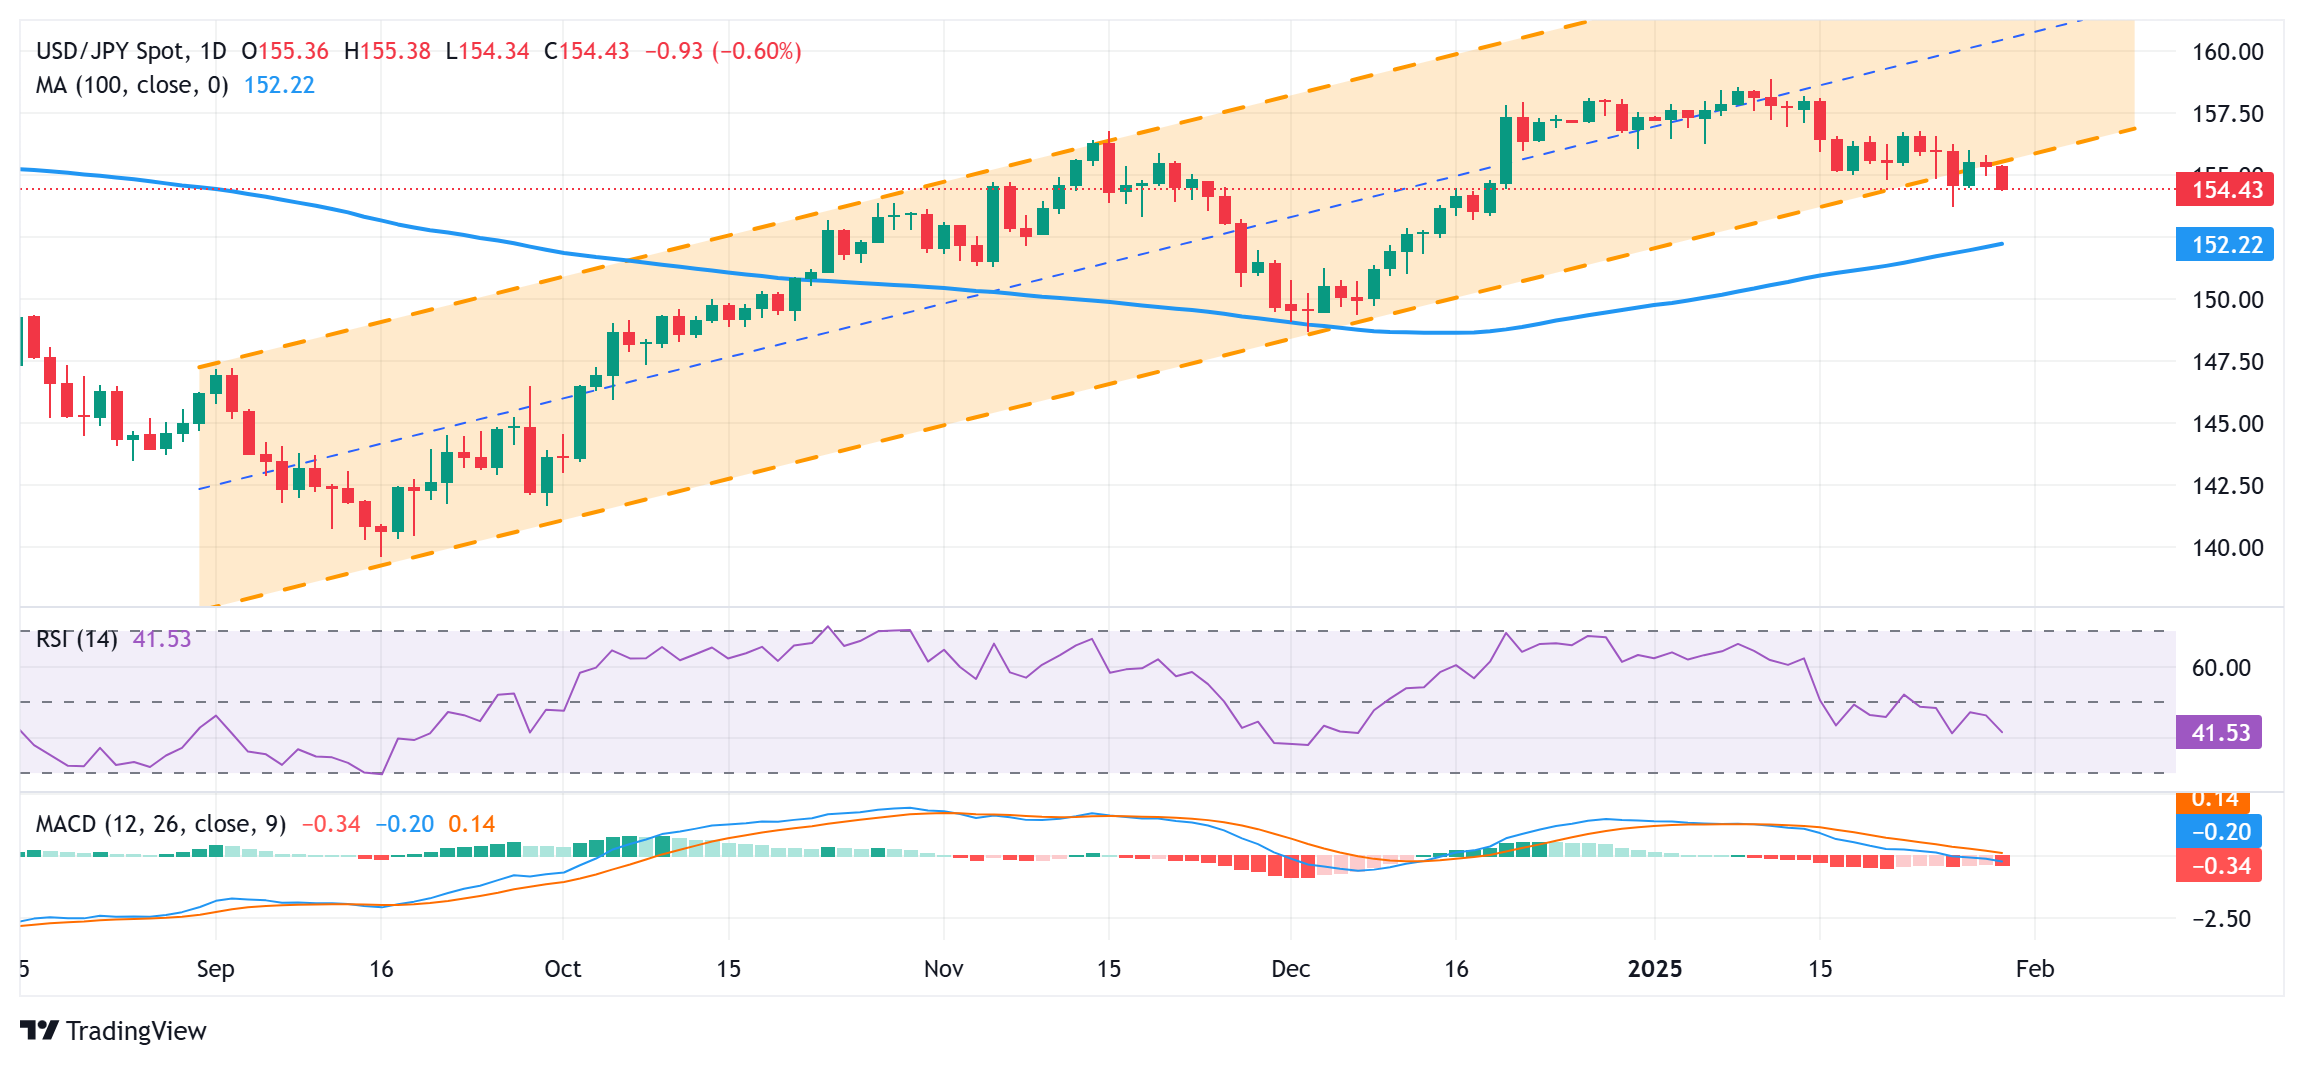
The emergence of fresh sellers near the 156.00 round figure and the subsequent fall below the 155.00 psychological mark confirms a breakdown through a multi-month-old ascending channel support. Moreover, oscillators on the daily chart have been gaining negative traction, suggesting that the path of least resistance for the USD/JPY pair remains to the downside. Hence, some follow-through weakness below the 154.00 mark, towards retesting a multi-week low around the 153.70 region touched on Monday, looks like a distinct possibility.
On the flip side, attempted recovery might now confront resistance near the 155.00 round figure ahead of the 155.35-155.40 region. Any further move up might still be seen as a selling opportunity and remain capped near the 156.00 mark. This is followed by the weekly top, around the 156.25 area, which should act as a key pivotal point. A sustained strength beyond the latter might trigger a fresh bout of a short-covering rally and lift the USD/JPY pair to the 156.70-156.75 region en route to the 157.00 round figure and the 157.60 horizontal barrier.
Japanese Yen FAQs
The Japanese Yen (JPY) is one of the world’s most traded currencies. Its value is broadly determined by the performance of the Japanese economy, but more specifically by the Bank of Japan’s policy, the differential between Japanese and US bond yields, or risk sentiment among traders, among other factors.
One of the Bank of Japan’s mandates is currency control, so its moves are key for the Yen. The BoJ has directly intervened in currency markets sometimes, generally to lower the value of the Yen, although it refrains from doing it often due to political concerns of its main trading partners. The BoJ ultra-loose monetary policy between 2013 and 2024 caused the Yen to depreciate against its main currency peers due to an increasing policy divergence between the Bank of Japan and other main central banks. More recently, the gradually unwinding of this ultra-loose policy has given some support to the Yen.
Over the last decade, the BoJ’s stance of sticking to ultra-loose monetary policy has led to a widening policy divergence with other central banks, particularly with the US Federal Reserve. This supported a widening of the differential between the 10-year US and Japanese bonds, which favored the US Dollar against the Japanese Yen. The BoJ decision in 2024 to gradually abandon the ultra-loose policy, coupled with interest-rate cuts in other major central banks, is narrowing this differential.
The Japanese Yen is often seen as a safe-haven investment. This means that in times of market stress, investors are more likely to put their money in the Japanese currency due to its supposed reliability and stability. Turbulent times are likely to strengthen the Yen’s value against other currencies seen as more risky to invest in.
- USD/CAD could appreciate to challenge 1.4518, its highest level since March 2020.
- The short-term price momentum is stronger as the pair remains above the nine- and 14-day EMAs.
- The immediate support is found at a psychological level of 1.4400, followed by the nine-day EMA at 1.4390.
The USD/CAD pair pauses its three-day winning streak, hovering around 1.4410 during Thursday's Asian session. On the daily chart, the pair continues to trade within an ascending channel, indicating a prevailing bullish trend.
USD/CAD remains slightly above the nine- and 14-day Exponential Moving Averages (EMAs), reinforcing bullish sentiment and suggesting strong short-term price action. This positioning reflects sustained buying interest and hints at further upside potential.
Additionally, the 14-day Relative Strength Index (RSI) stays above the 50 mark, signaling continued positive momentum and strengthening the bullish outlook.
The USD/CAD pair could navigate upwards to test 1.4518, its highest level since March 2020, recorded on January 21. Further resistance is seen near the upper boundary of the ascending channel at approximately 1.4870.
On the downside, immediate support is found at a psychological level of 1.4400. Further support appears at the nine-day EMA of 1.4390, followed closely by the 14-day EMA at 1.4384. This zone aligns with the lower boundary of the ascending channel near 1.4360, forming a strong support area.
USD/CAD: Daily Chart
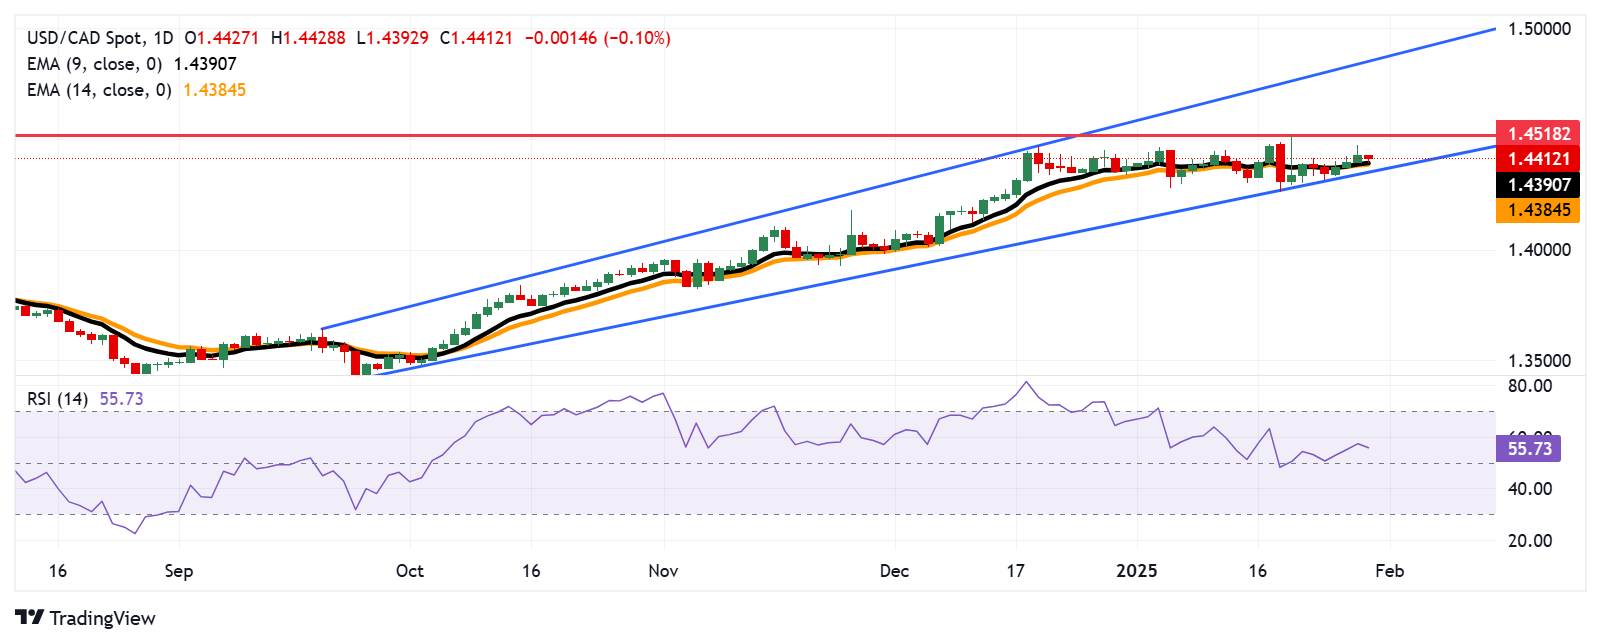
Canadian Dollar PRICE Today
The table below shows the percentage change of Canadian Dollar (CAD) against listed major currencies today. Canadian Dollar was the strongest against the US Dollar.
| USD | EUR | GBP | JPY | CAD | AUD | NZD | CHF | |
|---|---|---|---|---|---|---|---|---|
| USD | -0.13% | -0.12% | -0.59% | -0.11% | -0.20% | -0.15% | -0.11% | |
| EUR | 0.13% | 0.01% | -0.43% | 0.02% | -0.07% | -0.02% | 0.03% | |
| GBP | 0.12% | -0.01% | -0.46% | 0.00% | -0.08% | -0.04% | 0.00% | |
| JPY | 0.59% | 0.43% | 0.46% | 0.48% | 0.38% | 0.39% | 0.46% | |
| CAD | 0.11% | -0.02% | -0.01% | -0.48% | -0.09% | -0.05% | -0.01% | |
| AUD | 0.20% | 0.07% | 0.08% | -0.38% | 0.09% | 0.04% | 0.09% | |
| NZD | 0.15% | 0.02% | 0.04% | -0.39% | 0.05% | -0.04% | 0.04% | |
| CHF | 0.11% | -0.03% | -0.01% | -0.46% | 0.00% | -0.09% | -0.04% |
The heat map shows percentage changes of major currencies against each other. The base currency is picked from the left column, while the quote currency is picked from the top row. For example, if you pick the Canadian Dollar from the left column and move along the horizontal line to the US Dollar, the percentage change displayed in the box will represent CAD (base)/USD (quote).
- NZD/USD rebounds to near 0.5660 in Thursday's early Asian session.
- Fed left the policy rate steady on Wednesday.
- RBNZ’s Conway painted a dim picture of the country's economic outlook, citing weak productivity, investment and trade.
The NZD/USD pair recovers some lost ground to around 0.5660, snapping the three-day losing streak during the early Asian session on Thursday. The US Dollar (USD) retreats from the weekly high of 108.30 as investors await tariff certainty from US President Donald Trump.
The US Federal Reserve (Fed) decided to hold interest rates steady in the current 4.25%-4.50% range at its January meeting on Wednesday. During the press conference, Fed Chair Jerome Powell said that there would be no rush to cut them again until inflation and jobs data made it appropriate. Powell added that he believes the progress in lowering inflation will resume this year, but has now put rates on hold as he awaits data to confirm it.
"While we continue to think the Fed's easing cycle has not yet run its course, the FOMC will want to see further progress in the inflation data to deliver the next rate cut, highlighted by the fact they removed the reference on inflation making progress,” said Lindsay Rosner, head of multi-sector fixed-income investing at Goldman Sachs Asset Management.
Later on Thursday, market players will keep an eye on the advanced US Gross Domestic Product (GDP) for the fourth quarter (Q4), including the weekly Initial Jobless Claims, and Pending Home Sales. In case of a stronger-than-expected outcome, this could lift the Greenback against the New Zealand Dollar (NZD).
The Reserve Bank of New Zealand’s (RBNZ) chief economist Paul Conway painted a dim picture of the country's economic outlook, citing weak productivity, investment and trade. Conway further stated that easing domestic pricing intentions and a drop in inflation expectations will help open the way for some further easing of the OCR, as signalled in November.
The dovish expectation of the New Zealand central bank might cap the upside for the Kiwi in the near term. The RBNZ is anticipated to deliver another 50 basis points (bps) reduction on February 19, adding to the two delivered earlier in the cycle.
New Zealand Dollar FAQs
The New Zealand Dollar (NZD), also known as the Kiwi, is a well-known traded currency among investors. Its value is broadly determined by the health of the New Zealand economy and the country’s central bank policy. Still, there are some unique particularities that also can make NZD move. The performance of the Chinese economy tends to move the Kiwi because China is New Zealand’s biggest trading partner. Bad news for the Chinese economy likely means less New Zealand exports to the country, hitting the economy and thus its currency. Another factor moving NZD is dairy prices as the dairy industry is New Zealand’s main export. High dairy prices boost export income, contributing positively to the economy and thus to the NZD.
The Reserve Bank of New Zealand (RBNZ) aims to achieve and maintain an inflation rate between 1% and 3% over the medium term, with a focus to keep it near the 2% mid-point. To this end, the bank sets an appropriate level of interest rates. When inflation is too high, the RBNZ will increase interest rates to cool the economy, but the move will also make bond yields higher, increasing investors’ appeal to invest in the country and thus boosting NZD. On the contrary, lower interest rates tend to weaken NZD. The so-called rate differential, or how rates in New Zealand are or are expected to be compared to the ones set by the US Federal Reserve, can also play a key role in moving the NZD/USD pair.
Macroeconomic data releases in New Zealand are key to assess the state of the economy and can impact the New Zealand Dollar’s (NZD) valuation. A strong economy, based on high economic growth, low unemployment and high confidence is good for NZD. High economic growth attracts foreign investment and may encourage the Reserve Bank of New Zealand to increase interest rates, if this economic strength comes together with elevated inflation. Conversely, if economic data is weak, NZD is likely to depreciate.
The New Zealand Dollar (NZD) tends to strengthen during risk-on periods, or when investors perceive that broader market risks are low and are optimistic about growth. This tends to lead to a more favorable outlook for commodities and so-called ‘commodity currencies’ such as the Kiwi. Conversely, NZD tends to weaken at times of market turbulence or economic uncertainty as investors tend to sell higher-risk assets and flee to the more-stable safe havens.
- The Australian Dollar appreciates following the release of the Export Price Index on Thursday.
- Australian Bureau of Statistics showed export prices rose by 3.6% QoQ in Q4 2024, reversing a 4.3% decline in Q3.
- The Fed held its overnight borrowing rate steady in the 4.25%-4.50% range at its January meeting on Wednesday.
The Australian Dollar (AUD) breaks its three-day losing streak against the US Dollar (USD) after the release of the Export Price Index on Thursday. Data from the Australian Bureau of Statistics showed export prices rose by 3.6% quarter-over-quarter in Q4 2024, reversing a 4.3% decline in Q3 and marking the first increase since Q4 2023.
Australia’s Import Price Index rose by 0.2% QoQ in Q4 2024, rebounding from a 1.4% drop in Q3 and surpassing market expectations of a 1.5% decline. The increase was primarily driven by surging Gold prices, which hit an all-time high in October as investors sought safe-haven assets amid ongoing economic uncertainty.
The AUD/USD pair weakened as the US Dollar (USD) gained broadly. The US Federal Reserve (Fed) kept interest rates unchanged on Wednesday, as expected, but provided little indication of potential rate cuts this year, reinforcing USD strength.
Easing inflationary pressures toward the end of 2024 have fueled speculation that the Reserve Bank of Australia (RBA) could consider a rate cut in February. The RBA has maintained the Official Cash Rate (OCR) at 4.35% since November 2023, emphasizing that inflation must “sustainably” return to its 2%-3% target range before any policy easing.
Australian Dollar gains ground despite Fed’s cautious tone
- The US Dollar Index (DXY), which measures the US Dollar’s value against six major currencies, remains steady around 108.00 at the time of writing.
- US Federal Reserve held its overnight borrowing rate steady in the 4.25%-4.50% range at its January meeting on Wednesday, as widely expected. This decision followed three consecutive rate cuts since September 2024, totaling a full percentage point.
- The US Dollar strengthened after the Fed adopted a cautious tone. During the press conference, Fed Chair Jerome Powell emphasized that the central bank would need to see “real progress on inflation or some weakness in the labor market” before considering any further adjustments to monetary policy.
- Scott Bessent, the Treasury Secretary under Trump, stated that he aims to introduce new universal tariffs on US imports, starting at 2.5%. These tariffs could rise to as much as 20%, reflecting Trump’s aggressive stance on trade policies, consistent with his campaign rhetoric last year.
- Speaking with reporters aboard Air Force One early Tuesday, US President Donald Trump stated that he “wants tariffs ‘much bigger’ than 2.5%,” as Treasury Secretary Scott Bessent proposed. However, Trump has not yet decided on the specific tariff levels.
- Australia’s CPI rose by 0.2% quarter-on-quarter in the fourth quarter of 2024, matching the growth seen in the previous quarter but falling short of the market expectation of 0.3%. On an annual basis, CPI inflation eased to 2.4% in Q4 from 2.8% in Q3, also below the consensus forecast of 2.5%.
- Australia’s Monthly CPI for December 2024 increased by 2.5% year-over-year, in line with forecasts and up from November’s 2.3%. This marked the highest reading since August but remained within the Reserve Bank of Australia’s (RBA) target range of 2% to 3% for the fourth consecutive month. The RBA’s Trimmed Mean CPI rose by 3.2% YoY, the slowest pace in three years, slightly under the expected 3.3% but still above the central bank’s target range.
- Australian Treasurer Jim Chalmers stated on Wednesday that "the worst of the inflation challenge is well and truly behind us." Chalmers further emphasized that "the soft landing we have been planning and preparing for is looking more and more likely," according to Reuters.
- The AUD also faced challenges amid increased risk aversion due to tariff threats made by US President Donald Trump. President Trump announced plans on Monday evening to impose tariffs on imports of computer chips, pharmaceuticals, steel, aluminum, and copper. The goal is to shift production to the United States (US) and bolster domestic manufacturing.
Technical Analysis: Australian Dollar remains below 0.6250 and ascending channel
The AUD/USD pair trades near 0.6230 on Thursday, remaining slightly below the ascending channel on the daily chart, signaling a shift toward a bearish bias. Additionally, the 14-day Relative Strength Index (RSI) remains below the 50 level, reinforcing the bearish sentiment in the market.
A decisive break below the key support zone at the lower boundary of the ascending channel has further strengthened the bearish outlook. This could push the AUD/USD pair toward the 0.6131 level, its lowest since April 2020, recorded on January 13.
On the upside, immediate resistance lies at the nine-day Exponential Moving Average (EMA) at 0.6252, followed by the channel’s lower boundary at 0.6280. A rebound above this level and a return into the ascending channel could shift the bias back to bullish, with the pair potentially targeting the upper boundary near 0.6380.
AUD/USD: Daily Chart
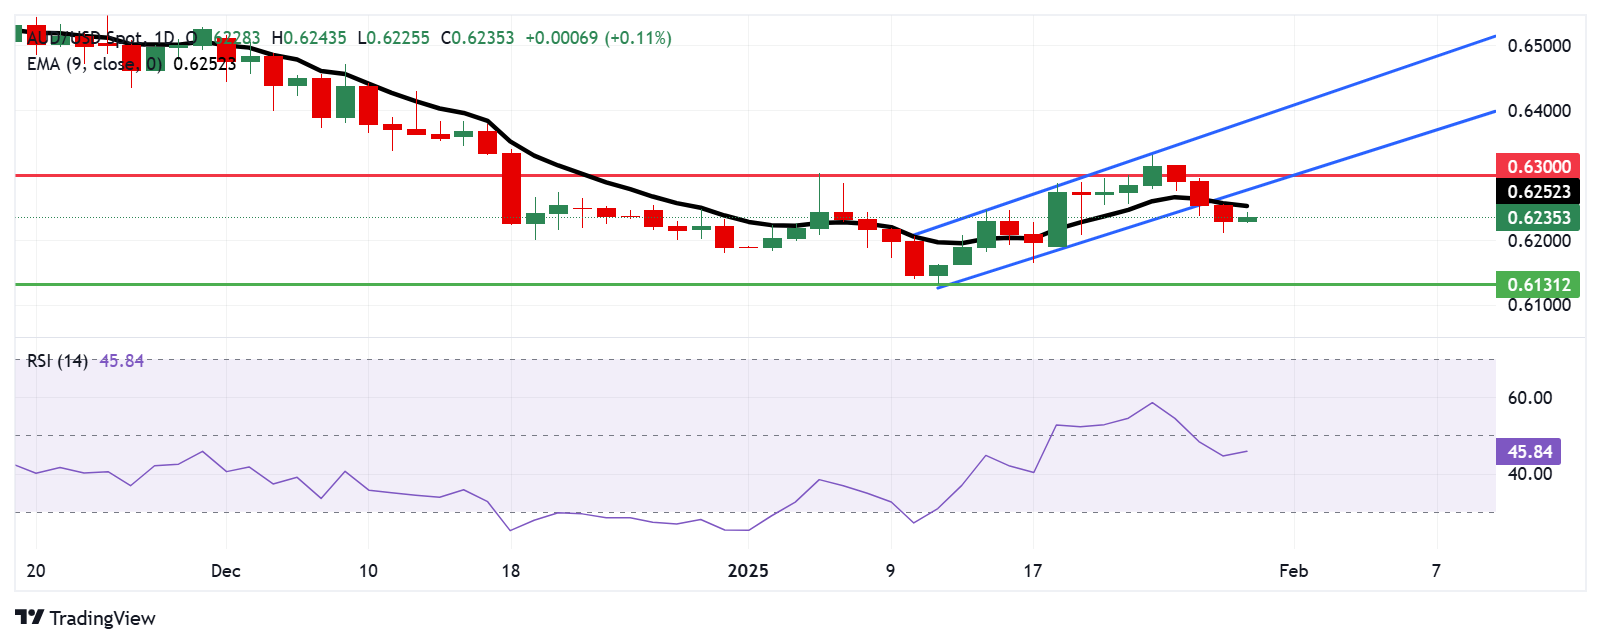
Australian Dollar PRICE Today
The table below shows the percentage change of Australian Dollar (AUD) against listed major currencies today. Australian Dollar was the strongest against the US Dollar.
| USD | EUR | GBP | JPY | CAD | AUD | NZD | CHF | |
|---|---|---|---|---|---|---|---|---|
| USD | -0.09% | -0.05% | -0.48% | -0.09% | -0.11% | -0.11% | -0.08% | |
| EUR | 0.09% | 0.04% | -0.35% | -0.00% | -0.03% | -0.02% | 0.00% | |
| GBP | 0.05% | -0.04% | -0.40% | -0.03% | -0.06% | -0.06% | -0.03% | |
| JPY | 0.48% | 0.35% | 0.40% | 0.39% | 0.35% | 0.32% | 0.38% | |
| CAD | 0.09% | 0.00% | 0.03% | -0.39% | -0.02% | -0.03% | -0.00% | |
| AUD | 0.11% | 0.03% | 0.06% | -0.35% | 0.02% | 0.00% | 0.03% | |
| NZD | 0.11% | 0.02% | 0.06% | -0.32% | 0.03% | -0.00% | 0.02% | |
| CHF | 0.08% | -0.01% | 0.03% | -0.38% | 0.00% | -0.03% | -0.02% |
The heat map shows percentage changes of major currencies against each other. The base currency is picked from the left column, while the quote currency is picked from the top row. For example, if you pick the Australian Dollar from the left column and move along the horizontal line to the US Dollar, the percentage change displayed in the box will represent AUD (base)/USD (quote).
Australian Dollar FAQs
One of the most significant factors for the Australian Dollar (AUD) is the level of interest rates set by the Reserve Bank of Australia (RBA). Because Australia is a resource-rich country another key driver is the price of its biggest export, Iron Ore. The health of the Chinese economy, its largest trading partner, is a factor, as well as inflation in Australia, its growth rate and Trade Balance. Market sentiment – whether investors are taking on more risky assets (risk-on) or seeking safe-havens (risk-off) – is also a factor, with risk-on positive for AUD.
The Reserve Bank of Australia (RBA) influences the Australian Dollar (AUD) by setting the level of interest rates that Australian banks can lend to each other. This influences the level of interest rates in the economy as a whole. The main goal of the RBA is to maintain a stable inflation rate of 2-3% by adjusting interest rates up or down. Relatively high interest rates compared to other major central banks support the AUD, and the opposite for relatively low. The RBA can also use quantitative easing and tightening to influence credit conditions, with the former AUD-negative and the latter AUD-positive.
China is Australia’s largest trading partner so the health of the Chinese economy is a major influence on the value of the Australian Dollar (AUD). When the Chinese economy is doing well it purchases more raw materials, goods and services from Australia, lifting demand for the AUD, and pushing up its value. The opposite is the case when the Chinese economy is not growing as fast as expected. Positive or negative surprises in Chinese growth data, therefore, often have a direct impact on the Australian Dollar and its pairs.
Iron Ore is Australia’s largest export, accounting for $118 billion a year according to data from 2021, with China as its primary destination. The price of Iron Ore, therefore, can be a driver of the Australian Dollar. Generally, if the price of Iron Ore rises, AUD also goes up, as aggregate demand for the currency increases. The opposite is the case if the price of Iron Ore falls. Higher Iron Ore prices also tend to result in a greater likelihood of a positive Trade Balance for Australia, which is also positive of the AUD.
The Trade Balance, which is the difference between what a country earns from its exports versus what it pays for its imports, is another factor that can influence the value of the Australian Dollar. If Australia produces highly sought after exports, then its currency will gain in value purely from the surplus demand created from foreign buyers seeking to purchase its exports versus what it spends to purchase imports. Therefore, a positive net Trade Balance strengthens the AUD, with the opposite effect if the Trade Balance is negative.
US President Donald Trump's administration late Wednesday plans to rescind a climate rule adopted by the administration of former President Joe Biden requiring states to measure and set declining targets for greenhouse gas emissions from vehicles using the national highway system, per Reuters.
Last week, Trump took aim at electric cars, withdrawing Biden's 2021 executive order that sought to ensure that half of all new vehicles sold in the United States by 2030 were electric.
Market reaction
At the press time, the DXY is down 0.06% on the day to trade at 107.89.
US Dollar FAQs
The US Dollar (USD) is the official currency of the United States of America, and the ‘de facto’ currency of a significant number of other countries where it is found in circulation alongside local notes. It is the most heavily traded currency in the world, accounting for over 88% of all global foreign exchange turnover, or an average of $6.6 trillion in transactions per day, according to data from 2022. Following the second world war, the USD took over from the British Pound as the world’s reserve currency. For most of its history, the US Dollar was backed by Gold, until the Bretton Woods Agreement in 1971 when the Gold Standard went away.
The most important single factor impacting on the value of the US Dollar is monetary policy, which is shaped by the Federal Reserve (Fed). The Fed has two mandates: to achieve price stability (control inflation) and foster full employment. Its primary tool to achieve these two goals is by adjusting interest rates. When prices are rising too quickly and inflation is above the Fed’s 2% target, the Fed will raise rates, which helps the USD value. When inflation falls below 2% or the Unemployment Rate is too high, the Fed may lower interest rates, which weighs on the Greenback.
In extreme situations, the Federal Reserve can also print more Dollars and enact quantitative easing (QE). QE is the process by which the Fed substantially increases the flow of credit in a stuck financial system. It is a non-standard policy measure used when credit has dried up because banks will not lend to each other (out of the fear of counterparty default). It is a last resort when simply lowering interest rates is unlikely to achieve the necessary result. It was the Fed’s weapon of choice to combat the credit crunch that occurred during the Great Financial Crisis in 2008. It involves the Fed printing more Dollars and using them to buy US government bonds predominantly from financial institutions. QE usually leads to a weaker US Dollar.
Quantitative tightening (QT) is the reverse process whereby the Federal Reserve stops buying bonds from financial institutions and does not reinvest the principal from the bonds it holds maturing in new purchases. It is usually positive for the US Dollar.
Bank of Canada Governor Tiff Macklem said late Wednesday that the central bank can’t repair the economic damage of a trade war with the US, but he will do his best to make it less painful, per Bloomberg.
Key quotes
A big increase in tariffs is a big disruption to the Canadian economy. Monetary policy can’t fix that.
Can mitigate impact of tariffs, avoid abrupt changes.
Aims to ensure any tariff-related CPI spike is temporary.
We have restored low inflation.
Tariff threat affects Canadian Dollar more than interest rate differences.
Household debt is not sustainable for consumption growth.
Trade battles would reduce economic efficiency.
Market reaction
At the time of writing, the USD/CAD pair is trading 0.14% lower on the day to trade at 1.4405.
Tariffs FAQs
Tariffs are customs duties levied on certain merchandise imports or a category of products. Tariffs are designed to help local producers and manufacturers be more competitive in the market by providing a price advantage over similar goods that can be imported. Tariffs are widely used as tools of protectionism, along with trade barriers and import quotas.
Although tariffs and taxes both generate government revenue to fund public goods and services, they have several distinctions. Tariffs are prepaid at the port of entry, while taxes are paid at the time of purchase. Taxes are imposed on individual taxpayers and businesses, while tariffs are paid by importers.
There are two schools of thought among economists regarding the usage of tariffs. While some argue that tariffs are necessary to protect domestic industries and address trade imbalances, others see them as a harmful tool that could potentially drive prices higher over the long term and lead to a damaging trade war by encouraging tit-for-tat tariffs.
During the run-up to the presidential election in November 2024, Donald Trump made it clear that he intends to use tariffs to support the US economy and American producers. In 2024, Mexico, China and Canada accounted for 42% of total US imports. In this period, Mexico stood out as the top exporter with $466.6 billion, according to the US Census Bureau. Hence, Trump wants to focus on these three nations when imposing tariffs. He also plans to use the revenue generated through tariffs to lower personal income taxes.
| Index | Change, points | Closed | Change, % |
|---|---|---|---|
| NIKKEI 225 | 397.91 | 39414.78 | 1.02 |
| ASX 200 | 47.9 | 8447 | 0.57 |
| DAX | 206.95 | 21637.53 | 0.97 |
| CAC 40 | -24.89 | 7872.48 | -0.32 |
| Dow Jones | -136.83 | 44713.52 | -0.31 |
| S&P 500 | -28.39 | 6039.31 | -0.47 |
| NASDAQ Composite | -101.27 | 19632.32 | -0.51 |
Canadian Foreign Minister Melanie Joly met with US Secretary of State Marco Rubio in Washington, DC on Wednesday. Her visit came as US President Donald Trump has threatened to impose 25% tariffs on imports from Canada as early as Saturday.
Joly said that she is “cautiously optimistic” about the talks related to tariffs.
According to Canadian government figures, the US and Canada are major trading partners, exchanging $2.7 billion in goods and services across their shared border each day in 2023.
Market reaction
At the time of writing, the USD/CAD pair is trading 0.15% lower on the day to trade at 1.4405.
Tariffs FAQs
Tariffs are customs duties levied on certain merchandise imports or a category of products. Tariffs are designed to help local producers and manufacturers be more competitive in the market by providing a price advantage over similar goods that can be imported. Tariffs are widely used as tools of protectionism, along with trade barriers and import quotas.
Although tariffs and taxes both generate government revenue to fund public goods and services, they have several distinctions. Tariffs are prepaid at the port of entry, while taxes are paid at the time of purchase. Taxes are imposed on individual taxpayers and businesses, while tariffs are paid by importers.
There are two schools of thought among economists regarding the usage of tariffs. While some argue that tariffs are necessary to protect domestic industries and address trade imbalances, others see them as a harmful tool that could potentially drive prices higher over the long term and lead to a damaging trade war by encouraging tit-for-tat tariffs.
During the run-up to the presidential election in November 2024, Donald Trump made it clear that he intends to use tariffs to support the US economy and American producers. In 2024, Mexico, China and Canada accounted for 42% of total US imports. In this period, Mexico stood out as the top exporter with $466.6 billion, according to the US Census Bureau. Hence, Trump wants to focus on these three nations when imposing tariffs. He also plans to use the revenue generated through tariffs to lower personal income taxes.
| Pare | Closed | Change, % |
|---|---|---|
| AUDUSD | 0.62308 | -0.3 |
| EURJPY | 161.791 | -0.22 |
| EURUSD | 1.04209 | -0.07 |
| GBPJPY | 193.292 | -0.08 |
| GBPUSD | 1.24502 | 0.1 |
| NZDUSD | 0.56575 | -0.16 |
| USDCAD | 1.44181 | 0.17 |
| USDCHF | 0.90675 | 0.33 |
| USDJPY | 155.249 | -0.16 |
- WTI price tumbles to around $72.60 in Wednesday’s late American session.
- US Crude oil stockpiles rose by 3.463 million barrels last week, according to the EIA.
- The firmer USD weighs on the commodity price.
West Texas Intermediate (WTI), the US crude oil benchmark, is trading around $72.60 during the late American session on Wednesday. The WTI price edges lower after US crude stockpiles rose more than expected last week.
US crude inventories rose last week. The US Energy Information Administration (EIA) weekly report showed crude oil stockpiles in the United States for the week ending January 24 increased by 3.463 million barrels, compared to a decline of 1.017 million barrels in the previous week. The market consensus estimated that stocks would rise by 3.7 million barrels.
The White House said later Tuesday that US President Donald Trump’s plan to impose 25% tariffs on imports from Canada and Mexico from February 1. The Trump tariff threats may disrupt the flow of crude supplies, which weigh on the black gold in the near term. “While we expect prices to stay supported at current levels, news flow related to Trump is likely to drive volatility in the near term,” said UBS analyst Giovanni Staunovo.
The US Federal Reserve left its benchmark rate unchanged at its January meeting on Wednesday and gave little insight on when it plans to lower borrowing costs. This, in turn, boosts the US Dollar (USD) broadly and might exert some selling pressure on the USD-denominated commodity price. Oil traders will keep an eye on the advanced US Gross Domestic Product (GDP) for the fourth quarter (Q4), followed by the weekly Initial Jobless Claims, and Pending Home Sales.
WTI Oil FAQs
WTI Oil is a type of Crude Oil sold on international markets. The WTI stands for West Texas Intermediate, one of three major types including Brent and Dubai Crude. WTI is also referred to as “light” and “sweet” because of its relatively low gravity and sulfur content respectively. It is considered a high quality Oil that is easily refined. It is sourced in the United States and distributed via the Cushing hub, which is considered “The Pipeline Crossroads of the World”. It is a benchmark for the Oil market and WTI price is frequently quoted in the media.
Like all assets, supply and demand are the key drivers of WTI Oil price. As such, global growth can be a driver of increased demand and vice versa for weak global growth. Political instability, wars, and sanctions can disrupt supply and impact prices. The decisions of OPEC, a group of major Oil-producing countries, is another key driver of price. The value of the US Dollar influences the price of WTI Crude Oil, since Oil is predominantly traded in US Dollars, thus a weaker US Dollar can make Oil more affordable and vice versa.
The weekly Oil inventory reports published by the American Petroleum Institute (API) and the Energy Information Agency (EIA) impact the price of WTI Oil. Changes in inventories reflect fluctuating supply and demand. If the data shows a drop in inventories it can indicate increased demand, pushing up Oil price. Higher inventories can reflect increased supply, pushing down prices. API’s report is published every Tuesday and EIA’s the day after. Their results are usually similar, falling within 1% of each other 75% of the time. The EIA data is considered more reliable, since it is a government agency.
OPEC (Organization of the Petroleum Exporting Countries) is a group of 12 Oil-producing nations who collectively decide production quotas for member countries at twice-yearly meetings. Their decisions often impact WTI Oil prices. When OPEC decides to lower quotas, it can tighten supply, pushing up Oil prices. When OPEC increases production, it has the opposite effect. OPEC+ refers to an expanded group that includes ten extra non-OPEC members, the most notable of which is Russia.


© 2000-2026. All rights reserved.
This site is managed by Teletrade D.J. LLC 2351 LLC 2022 (Euro House, Richmond Hill Road, Kingstown, VC0100, St. Vincent and the Grenadines).
The information on this website is for informational purposes only and does not constitute any investment advice.
The company does not serve or provide services to customers who are residents of the US, Canada, Iran, The Democratic People's Republic of Korea, Yemen and FATF blacklisted countries.
Making transactions on financial markets with marginal financial instruments opens up wide possibilities and allows investors who are willing to take risks to earn high profits, carrying a potentially high risk of losses at the same time. Therefore you should responsibly approach the issue of choosing the appropriate investment strategy, taking the available resources into account, before starting trading.
Use of the information: full or partial use of materials from this website must always be referenced to TeleTrade as the source of information. Use of the materials on the Internet must be accompanied by a hyperlink to teletrade.org. Automatic import of materials and information from this website is prohibited.
Please contact our PR department if you have any questions or need assistance at pr@teletrade.global.
transfers