- Analytics
- News and Tools
- Market News
CFD Markets News and Forecasts — 29-08-2024
The headline Tokyo Consumer Price Index (CPI) for August rose 2.6% YoY, compared to a 2.2% rise in the previous reading, the Statistics Bureau of Japan showed on Friday. Meanwhile, the Tokyo CPI ex Fresh Food, Energy increased 1.6% YoY, compared to the previous reading of 1.5% rise.
Additionally, Tokyo CPI ex Fresh Food rose 2.4% for the said month and came in above the market consensus of 2.2%.
Market reaction to the Tokyo Consumer Price Index
As of writing, the USD/JPY pair was down 0.01% on the day at 144.98.
Japanese Yen FAQs
The Japanese Yen (JPY) is one of the world’s most traded currencies. Its value is broadly determined by the performance of the Japanese economy, but more specifically by the Bank of Japan’s policy, the differential between Japanese and US bond yields, or risk sentiment among traders, among other factors.
One of the Bank of Japan’s mandates is currency control, so its moves are key for the Yen. The BoJ has directly intervened in currency markets sometimes, generally to lower the value of the Yen, although it refrains from doing it often due to political concerns of its main trading partners. The current BoJ ultra-loose monetary policy, based on massive stimulus to the economy, has caused the Yen to depreciate against its main currency peers. This process has exacerbated more recently due to an increasing policy divergence between the Bank of Japan and other main central banks, which have opted to increase interest rates sharply to fight decades-high levels of inflation.
The BoJ’s stance of sticking to ultra-loose monetary policy has led to a widening policy divergence with other central banks, particularly with the US Federal Reserve. This supports a widening of the differential between the 10-year US and Japanese bonds, which favors the US Dollar against the Japanese Yen.
The Japanese Yen is often seen as a safe-haven investment. This means that in times of market stress, investors are more likely to put their money in the Japanese currency due to its supposed reliability and stability. Turbulent times are likely to strengthen the Yen’s value against other currencies seen as more risky to invest in.
- USD/CAD trades on a stronger note around 1.3490 in Friday’s early Asian session.
- The second estimate of US GDP for Q2 2024 came in better than expected, growing by 3.0% vs. 2.8% prior.
- Higher crude oil prices might support the Loonie and cap the pair’s upside.
The USD/CAD pair trades with mild gains near 1.3490 during the early Asian session on Friday. The stronger-than-expected US economic growth provides some support to the US Dollar (USD). The markets might turn cautious ahead of the key US economic data, which is due later in the day.
Data released by the US Bureau of Economic Analysis (BEA) showed on Thursday that the US Gross Domestic Product Annualized for the second quarter (Q2) grew 3.0% in the second estimate from 2.8% in the initial estimate. This figure came in better than the expectation of 2.8%.
Meanwhile, the weekly Initial Jobless Claims for the week ending August 24 declined from 233K to 231K, below the market consensus of 232K. The US Dollar gains ground above the key 101.00 barrier in immediate reaction to the upbeat US economic data.
Federal Reserve Atlanta President Raphael Bostic, a leading FOMC hawk, said on Thursday that it might be "time to move" on rate cuts as inflation cools down further and the unemployment rate up more than he expected, but he wants to see confirmation from the monthly jobs report and two inflation reports due before the Fed September meeting.
Investors will closely monitor the release of the US Personal Consumption Expenditure (PCE) Price Index for July for some hints about the US interest rate path. A softer-than-expected PCE reading could trigger the Federal Open Market Committee (FOMC) to start a rate-cutting cycle, which acts as a headwind for the Greenback.
On the Loonie front, the rebound of crude oil prices might lift the commodity-linked Canadian Dollar (CAD) as Canada is the leading exporter of oil to the United States. However, economists anticipate the Bank of Canada (BoC) to cut additional interest rates for a third consecutive meeting next week due to persistent economic weakness, rising unemployment, and cooling down inflation. This, in turn, might drag the CAD lower against the USD.
Canadian Dollar FAQs
The key factors driving the Canadian Dollar (CAD) are the level of interest rates set by the Bank of Canada (BoC), the price of Oil, Canada’s largest export, the health of its economy, inflation and the Trade Balance, which is the difference between the value of Canada’s exports versus its imports. Other factors include market sentiment – whether investors are taking on more risky assets (risk-on) or seeking safe-havens (risk-off) – with risk-on being CAD-positive. As its largest trading partner, the health of the US economy is also a key factor influencing the Canadian Dollar.
The Bank of Canada (BoC) has a significant influence on the Canadian Dollar by setting the level of interest rates that banks can lend to one another. This influences the level of interest rates for everyone. The main goal of the BoC is to maintain inflation at 1-3% by adjusting interest rates up or down. Relatively higher interest rates tend to be positive for the CAD. The Bank of Canada can also use quantitative easing and tightening to influence credit conditions, with the former CAD-negative and the latter CAD-positive.
The price of Oil is a key factor impacting the value of the Canadian Dollar. Petroleum is Canada’s biggest export, so Oil price tends to have an immediate impact on the CAD value. Generally, if Oil price rises CAD also goes up, as aggregate demand for the currency increases. The opposite is the case if the price of Oil falls. Higher Oil prices also tend to result in a greater likelihood of a positive Trade Balance, which is also supportive of the CAD.
While inflation had always traditionally been thought of as a negative factor for a currency since it lowers the value of money, the opposite has actually been the case in modern times with the relaxation of cross-border capital controls. Higher inflation tends to lead central banks to put up interest rates which attracts more capital inflows from global investors seeking a lucrative place to keep their money. This increases demand for the local currency, which in Canada’s case is the Canadian Dollar.
Macroeconomic data releases gauge the health of the economy and can have an impact on the Canadian Dollar. Indicators such as GDP, Manufacturing and Services PMIs, employment, and consumer sentiment surveys can all influence the direction of the CAD. A strong economy is good for the Canadian Dollar. Not only does it attract more foreign investment but it may encourage the Bank of Canada to put up interest rates, leading to a stronger currency. If economic data is weak, however, the CAD is likely to fall.
- NZD/USD extended its winning streak in Thursday's session, rising to 0.6255.
- The RSI is near overbought territory and suggests selling pressure could emerge.
- Despite a looming correction, the overall outlook is bullish.
The NZD/USD pair extended its winning streak to three consecutive sessions on Thursday, rising to a high of 0.6300 and then stabilizing at 0.6250. As buyers got quickie rejected the buying steam seems to be running out of steam.
The technical indicators present a mixed picture. The Relative Strength Index (RSI) is rising and currently stands at 68 indicating that the pair is near overbought territory and selling pressure could emerge. In addition, the Moving Average Convergence Divergence (MACD) is almost flat, suggesting a weakening buying traction.
NZD/USD daily chart
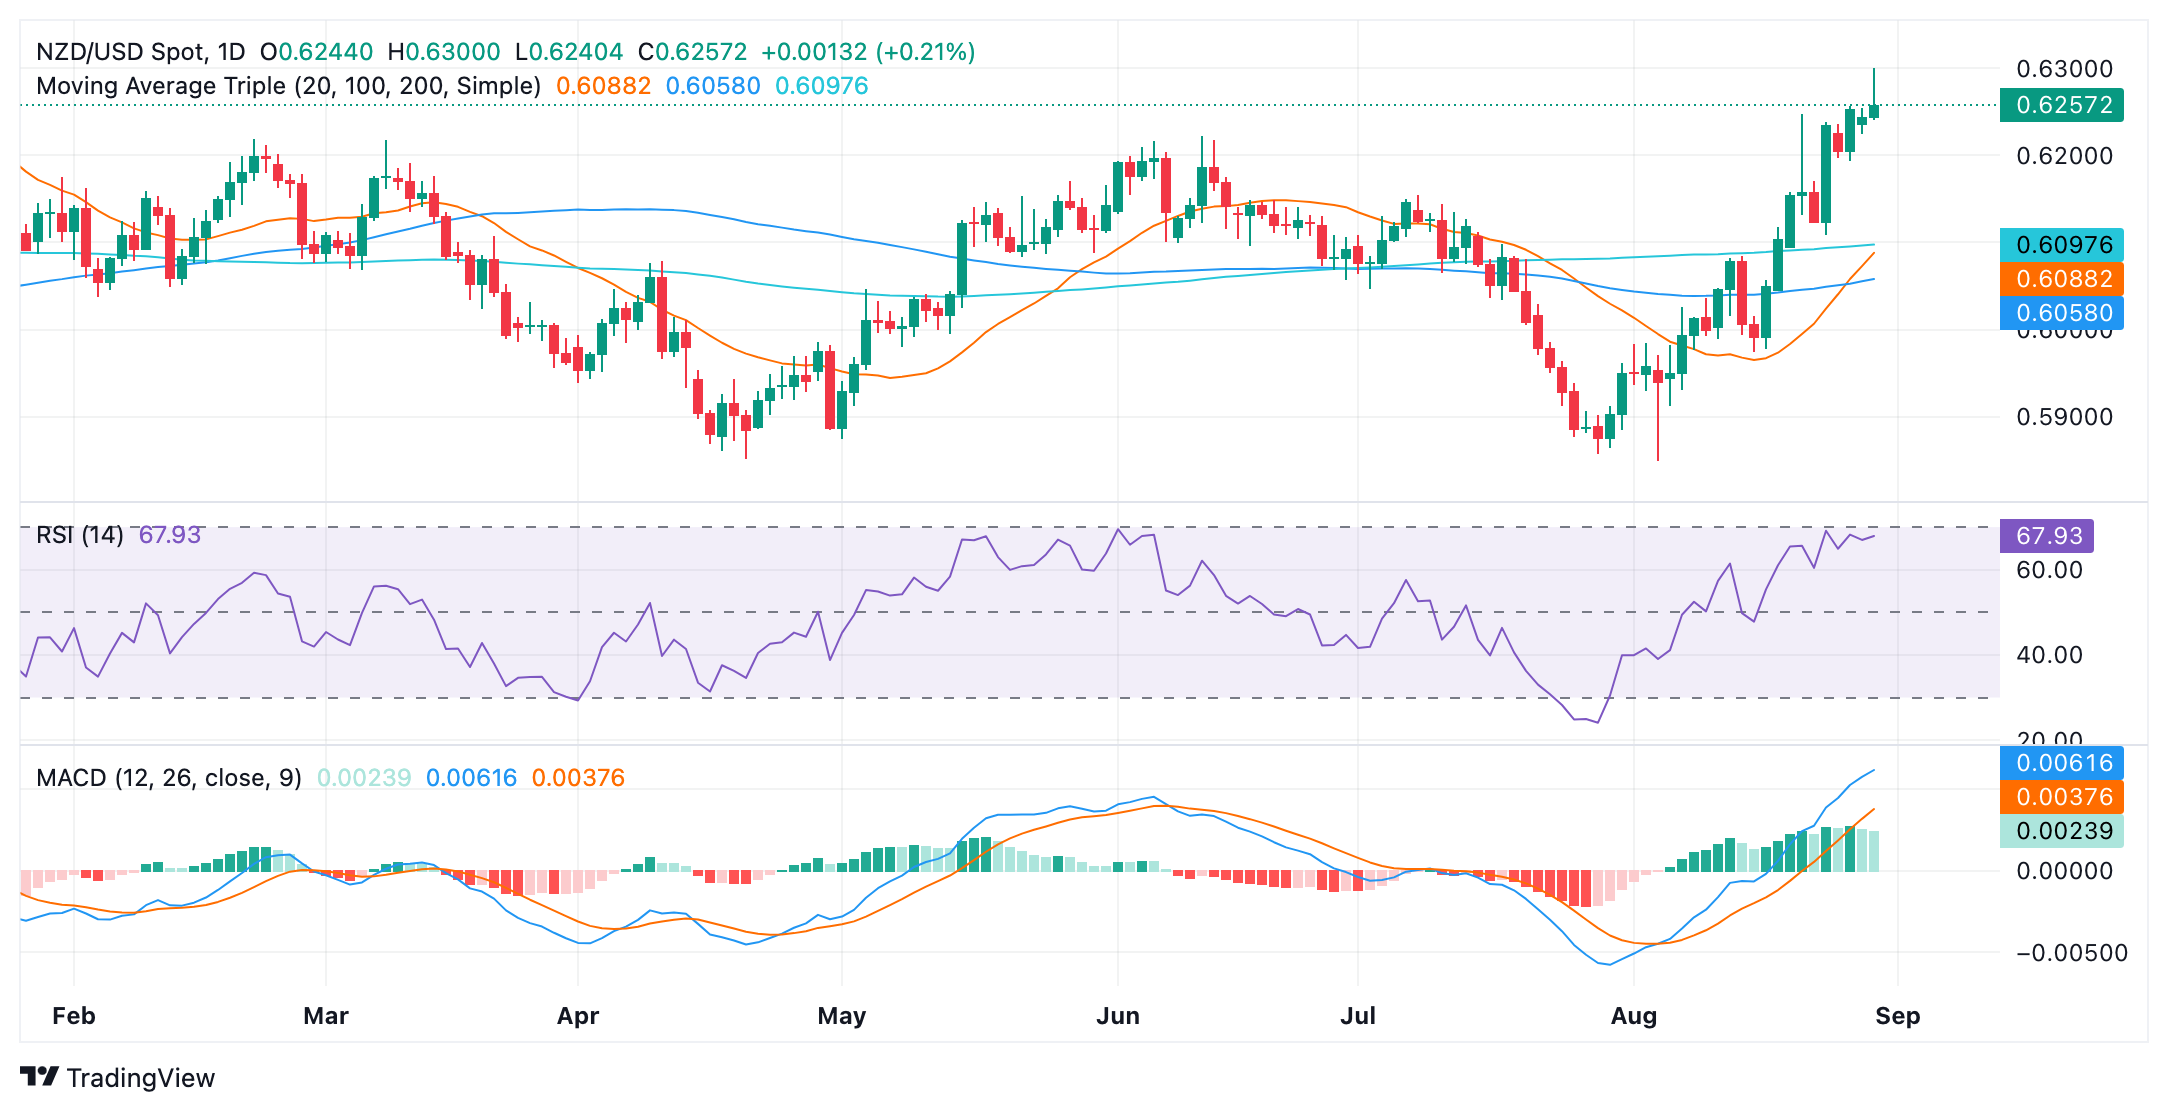
The key resistance level for the NZD/USD pair lies at 0.6250. A consolidation above this level could lead to a move towards 0.6270 and potentially back towards 0.6300. On the downside, immediate support is seen at the 0.6230- 0.6200 area.
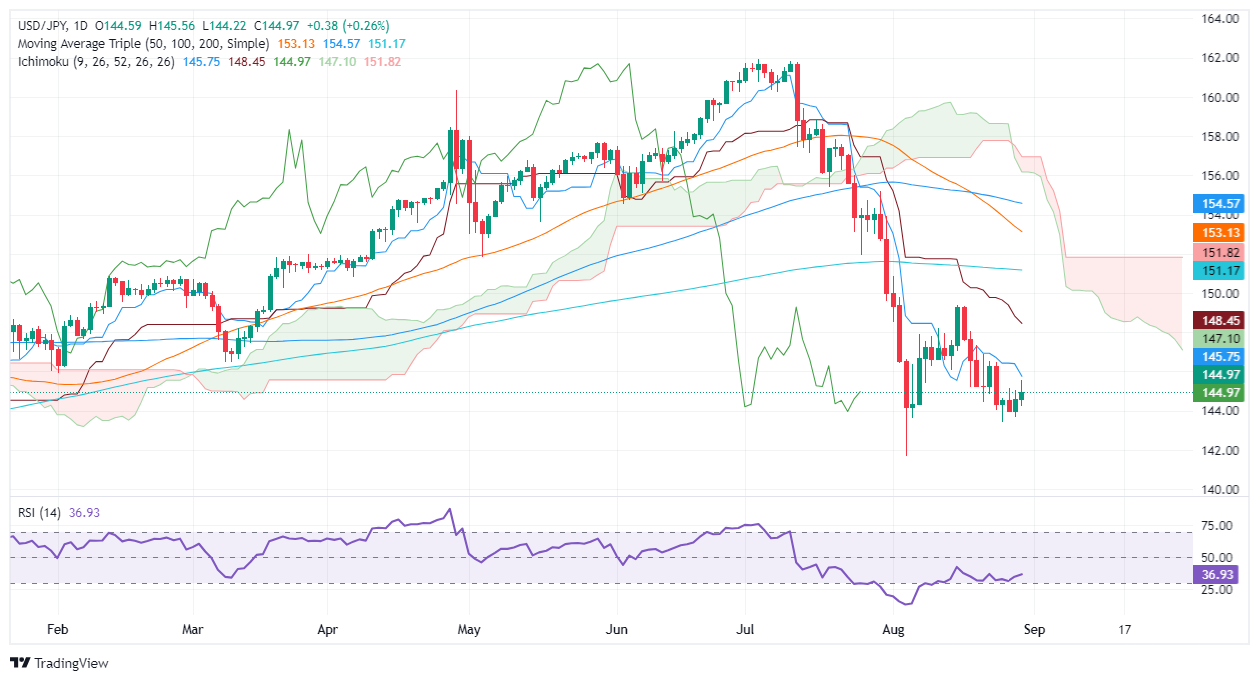
- Bearish technical outlook persists; pair remains below Ichimoku Cloud and 200-DMA, hinting at further declines.
- RSI suggests seller dominance, despite a temporary buyer-led recovery.
- Resistance levels to watch: 145.39 (Tenkan-Sen), 146.00, 146.92 (Senkou Span A), 148.45 (Kijun-Sen).
- Downside break below 144.00 targets 143.44 (August 26 low), with potential to test monthly low at 141.69.
The USD/JPY registered modest gains during the North American session on Thursday of over 0.27%. During the trading day, the pair retreated to a daily low of 144.22 but bounced off and ended the session near the 145.00 figure. At the time of writing, the major trades at 144.97 were virtually flat as Friday’s Asian session began.
USD/JPY Price Forecast: Technical outlook
From a technical perspective, the pair is downward biased despite registering a leg-up. Once the USD/JPY slid below the Ichimoku cloud and the 200-day moving average (DMA), it opened the door to posting a multi-month low of 141.69. Since then, the major enjoyed an uptick but failed to gain traction to clear the 150.00 figure.
The Relative Strength Index (RSI) shows sellers are in charge, although buyers enjoy a short-term leg-up.
If USD/JPY decisively clears 145.00, this could pave the way for further upside. Once it moves up, the first resistance would be the Tenkan-Sen at 145.39, followed by the 146.00 figure. Up next would be the Senkou Span A at 146.92, ahead of testing the Kijun-Sen at 148.45.
Conversely, if sellers push the exchange rate below 144.00, the next support would be the August 26 daily low of 143.44. A breach of the latter will expose the August monthly low of 141.69.
USD/JPY Price Action – Daily Chart
Japanese Yen FAQs
The Japanese Yen (JPY) is one of the world’s most traded currencies. Its value is broadly determined by the performance of the Japanese economy, but more specifically by the Bank of Japan’s policy, the differential between Japanese and US bond yields, or risk sentiment among traders, among other factors.
One of the Bank of Japan’s mandates is currency control, so its moves are key for the Yen. The BoJ has directly intervened in currency markets sometimes, generally to lower the value of the Yen, although it refrains from doing it often due to political concerns of its main trading partners. The current BoJ ultra-loose monetary policy, based on massive stimulus to the economy, has caused the Yen to depreciate against its main currency peers. This process has exacerbated more recently due to an increasing policy divergence between the Bank of Japan and other main central banks, which have opted to increase interest rates sharply to fight decades-high levels of inflation.
The BoJ’s stance of sticking to ultra-loose monetary policy has led to a widening policy divergence with other central banks, particularly with the US Federal Reserve. This supports a widening of the differential between the 10-year US and Japanese bonds, which favors the US Dollar against the Japanese Yen.
The Japanese Yen is often seen as a safe-haven investment. This means that in times of market stress, investors are more likely to put their money in the Japanese currency due to its supposed reliability and stability. Turbulent times are likely to strengthen the Yen’s value against other currencies seen as more risky to invest in.
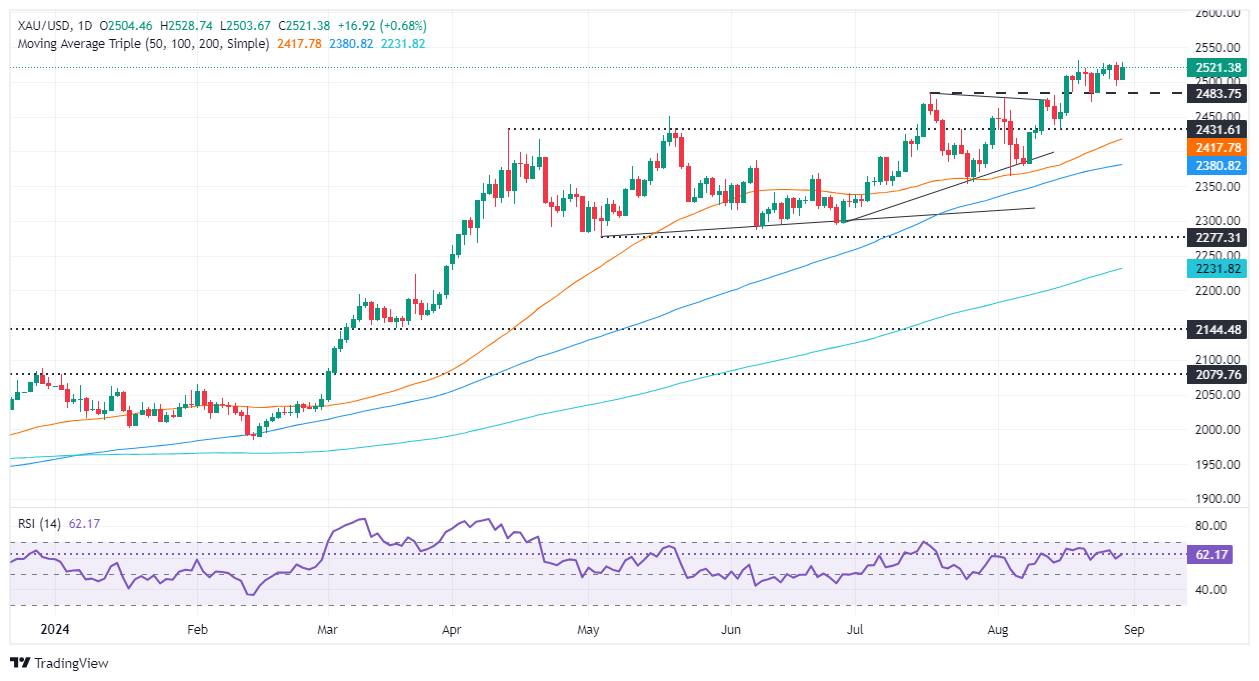
- Gold prices climb despite upbeat US Q2 GDP revision and drop in unemployment claims.
- Despite rising US Treasury yields (10-year at 3.86%) and DXY up 0.33% to 101.38, Gold's upward trend continues.
- Focus shifts to upcoming core PCE data, expected to slightly increase, potentially impacting Fed decisions.
- CME FedWatch Tool shows 65.5% likelihood of a 25 bps rate cut in September, bolstering Gold prices.
Gold prices rose late in the North American session even though the US economy remains resilient after Gross Domestic Product (GDP) figures propelled the Greenback higher. Despite this, Gold prices continue to grind higher amid expectations of the Fed's first rate cut. The XAU/USD posted gains of 0.78% and exchanged hands at $2,523.
Market sentiment is positive, as traders remain laser-focused on data that could confirm the size of the Federal Reserve’s (Fed) first rate cut. In the meantime, the US Bureau of Economic Analysis revealed the country grew in Q2 2024 above the preliminary release, lifting the Personal Consumption Expenditures Price Index (PCE) Deflator with it.
At the same time, the US Department of Labor revealed that fewer than expected Americans applied for unemployment benefits, which is a relief for the Fed, which acknowledged in Powell’s speech that employment risks are tilted to the upside.
Despite that, the golden metal extended its gains above $2,520 even though the US 10-year Treasury note yield rose two basis points to 3.86%. Meanwhile, the US Dollar Index (DXY), which tracks the buck’s value against a basket of six currencies, climbed 0.33% to 101.38.
Given the backdrop, traders should expect that the non-yielding metal would aim lower, but investors see a 65.5% chance of a 25-basis-point (bps) rate cut at the September meeting, according to the CME FedWatch Tool, which underpins the precious metal.
On Friday, the Fed’s preferred inflation gauge, the core Personal Consumption Expenditures Price Index (PCE) is expected to tick a tenth higher, according to the consensus.
The December 2024 Chicago Board of Trade (CBOT) fed funds future rates contract hints that investors are eyeing 98 basis points of Fed easing this year, up from Monday’s 97.
Daily digest market movers: Gold price advances as traders brace for US Core PCE data
- If US economic data continues to be weak, the Gold price uptrend is likely to persist, fueling speculation about a larger rate cut by the Fed.
- The second estimate of US GDP for Q2 2024 showed a significant increase from 1.4% in Q1 to 3%, surpassing estimates of 2.8%. The Personal Consumption Price Expenditures (PCE) Deflator indicated that inflation dipped from 3.1% to 2.5% QoQ, slightly higher than the anticipated 2.3%.
- Initial Jobless Claims for the week ending August 24 decreased from 233K to 231K, slightly below the estimate of 232K.
- Next week, the US economic docket will feature the August Nonfarm Payrolls report, which could be crucial to assess the size of the Fed’s first rate cut at the September meeting.
Technical outlook: Gold price uptrend extends, traders eye $2,550
Gold price uptrend remains in place on Thursday. As price action pushes above $2,520, buyers remain hopeful that XAU/USD could climb past the all-time high (ATH) at 2,531. Momentum suggests buyers are in charge as the Relative Strength Index (RSI) portrays. Given that backdrop, Bullion’s path of least resistance is tilted to the upside.
If XAU/USD clears the ATH, the next resistance would be the $2,550 mark. A breach of the latter will expose $2,600.
Conversely, if XAU/USD slumps beneath $2,500, the first support would be the July 17 peak at $2,483. O; once cleared, the next support would be the $2,450 psychological mark, followed by the 50-day Simple Moving Average (SMA) at $2,414.
Gold FAQs
Gold has played a key role in human’s history as it has been widely used as a store of value and medium of exchange. Currently, apart from its shine and usage for jewelry, the precious metal is widely seen as a safe-haven asset, meaning that it is considered a good investment during turbulent times. Gold is also widely seen as a hedge against inflation and against depreciating currencies as it doesn’t rely on any specific issuer or government.
Central banks are the biggest Gold holders. In their aim to support their currencies in turbulent times, central banks tend to diversify their reserves and buy Gold to improve the perceived strength of the economy and the currency. High Gold reserves can be a source of trust for a country’s solvency. Central banks added 1,136 tonnes of Gold worth around $70 billion to their reserves in 2022, according to data from the World Gold Council. This is the highest yearly purchase since records began. Central banks from emerging economies such as China, India and Turkey are quickly increasing their Gold reserves.
Gold has an inverse correlation with the US Dollar and US Treasuries, which are both major reserve and safe-haven assets. When the Dollar depreciates, Gold tends to rise, enabling investors and central banks to diversify their assets in turbulent times. Gold is also inversely correlated with risk assets. A rally in the stock market tends to weaken Gold price, while sell-offs in riskier markets tend to favor the precious metal.
The price can move due to a wide range of factors. Geopolitical instability or fears of a deep recession can quickly make Gold price escalate due to its safe-haven status. As a yield-less asset, Gold tends to rise with lower interest rates, while higher cost of money usually weighs down on the yellow metal. Still, most moves depend on how the US Dollar (USD) behaves as the asset is priced in dollars (XAU/USD). A strong Dollar tends to keep the price of Gold controlled, whereas a weaker Dollar is likely to push Gold prices up.
- Rising commodity prices are benefiting the Aussie.
- Weak Australia Q2 capex survey weighs on AUD and may limit its gains.
- Technicals suggest further AUD/USD upside is possible.
The AUD/USD rose by 0.30% to 0.6810 in Thursday's session. The Aussie has been supported by rising commodity prices, particularly iron ore, which is Australia's largest export. However, a weak Q2 capex survey and continued weakness in non-mining business investment might weigh on the currency. Despite these headwinds, technicals suggest that further AUD/USD upside is possible.
Amidst the ambiguous Australian economic outlook and the central bank's firm stance against high inflation, financial markets anticipate a modest easing of interest rates by only 0.25% in 2024.
Daily digest market movers: Australian Dollar gains despite weak investment data
- Business investment in Australia contracted for the second consecutive quarter in Q2, underscoring the challenges facing the domestic economy.
- Non-mining business spending recorded its first quarterly decline in three years, reflecting lower capex on building structures, plants and equipment.
- Weak capex survey adds to the view that the Reserve Bank of Australia (RBA) will likely cut interest rates by year-end as the central bank seeks to stimulate growth.
- On the positive side, monetary policy divergence might favor the AUD over its major counterparts.
AUD/USD technical outlook: Bullish momentum steady, buyers must secure 0.6800
Indicators are smiling on the pair. The Moving Average Convergence Divergence (MACD) is printing green bars, indicating that further gains are possible. The Relative Strength Index (RSI) also backs this up as it remains deep in positive terrain with some room before the overbought threshold.
The pair is facing resistance at 0.6800 and 0.6830, while support can be expected at 0.6790 and 0.6770.
Australian Dollar FAQs
One of the most significant factors for the Australian Dollar (AUD) is the level of interest rates set by the Reserve Bank of Australia (RBA). Because Australia is a resource-rich country another key driver is the price of its biggest export, Iron Ore. The health of the Chinese economy, its largest trading partner, is a factor, as well as inflation in Australia, its growth rate and Trade Balance. Market sentiment – whether investors are taking on more risky assets (risk-on) or seeking safe-havens (risk-off) – is also a factor, with risk-on positive for AUD.
The Reserve Bank of Australia (RBA) influences the Australian Dollar (AUD) by setting the level of interest rates that Australian banks can lend to each other. This influences the level of interest rates in the economy as a whole. The main goal of the RBA is to maintain a stable inflation rate of 2-3% by adjusting interest rates up or down. Relatively high interest rates compared to other major central banks support the AUD, and the opposite for relatively low. The RBA can also use quantitative easing and tightening to influence credit conditions, with the former AUD-negative and the latter AUD-positive.
China is Australia’s largest trading partner so the health of the Chinese economy is a major influence on the value of the Australian Dollar (AUD). When the Chinese economy is doing well it purchases more raw materials, goods and services from Australia, lifting demand for the AUD, and pushing up its value. The opposite is the case when the Chinese economy is not growing as fast as expected. Positive or negative surprises in Chinese growth data, therefore, often have a direct impact on the Australian Dollar and its pairs.
Iron Ore is Australia’s largest export, accounting for $118 billion a year according to data from 2021, with China as its primary destination. The price of Iron Ore, therefore, can be a driver of the Australian Dollar. Generally, if the price of Iron Ore rises, AUD also goes up, as aggregate demand for the currency increases. The opposite is the case if the price of Iron Ore falls. Higher Iron Ore prices also tend to result in a greater likelihood of a positive Trade Balance for Australia, which is also positive of the AUD.
The Trade Balance, which is the difference between what a country earns from its exports versus what it pays for its imports, is another factor that can influence the value of the Australian Dollar. If Australia produces highly sought after exports, then its currency will gain in value purely from the surplus demand created from foreign buyers seeking to purchase its exports versus what it spends to purchase imports. Therefore, a positive net Trade Balance strengthens the AUD, with the opposite effect if the Trade Balance is negative.
- The Canadian Dollar halted a midweek pullback but still struggling to find gains.
- Canada is set to release its latest GDP figures on Friday.
- Canadian data prints are likely to be overshadowed by a fresh round of US PCE inflation.
The Canadian Dollar (CAD) tested higher ground against the Greenback on Thursday, looking to put a stop to the midweek’s pullback. However progress remains limited as jittery markets keep one foot in the US Dollar as key US inflation data due on Friday could set the tone for the Federal Reserve’s (Fed) upcoming rate decision in September.
Canada is slated to print its latest round of Gross Domestic Product (GDP) figures on Friday, but a double-header of high impact US Personal Consumption Expenditure Price Index (PCE) inflation due at the same time will likely swamp out CAD flows as investors lean into bets that cooling inflation will keep the Fed on pace to deliver a first rate cut on September 18.
Daily digest market movers
- US GDP figures on Thursday showed the US economy grew slightly faster than expected, printing 3.0% in Q2 on an annualized basis.
- Markets broadly anticipated a steady print at 2.8%, in-line with the previous figure.
- Canadian Q2 GDP due on Friday is forecast to tick down to 1.6% from 1.7%, with the MoM figure in June easing to 0.1% from 0.2%.
- The big data print for the week is Friday’s US PCE inflation. Core US PCE for the year ended in July is expected to print at 2.7%, slightly higher than the previous period’s 2.6%.
- An upside swing in inflation data could crimp broad-market hopes for an extended rate cut from the Fed on September 18.
Canadian Dollar price forecast
With the Canadian Dollar (CAD) dumping out of an extended technical correction against the US Dollar, CAD bidders may be looking to chalk in some more gains against the Greenback as markets continue to tilt in a USD-negative stance. USD/CAD continues to churn just south of the 1.3500 handle in the near-term, and the pair has dropped well below the 200-day Exponential Moving Average (EMA) near 1.3625.
USD/CAD daily chart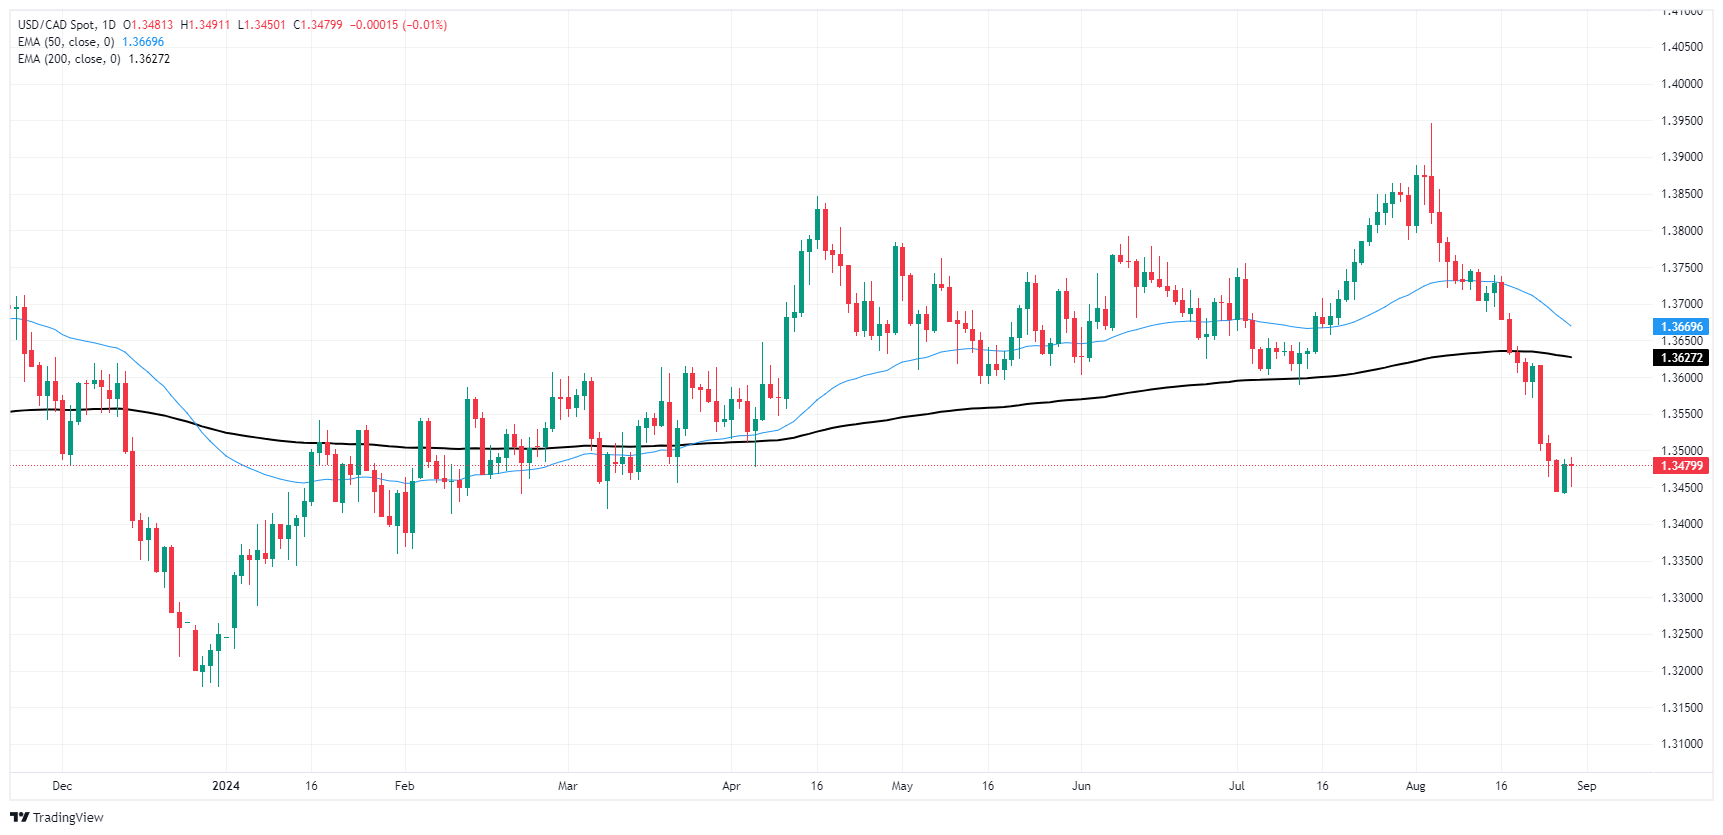
Canadian Dollar FAQs
The key factors driving the Canadian Dollar (CAD) are the level of interest rates set by the Bank of Canada (BoC), the price of Oil, Canada’s largest export, the health of its economy, inflation and the Trade Balance, which is the difference between the value of Canada’s exports versus its imports. Other factors include market sentiment – whether investors are taking on more risky assets (risk-on) or seeking safe-havens (risk-off) – with risk-on being CAD-positive. As its largest trading partner, the health of the US economy is also a key factor influencing the Canadian Dollar.
The Bank of Canada (BoC) has a significant influence on the Canadian Dollar by setting the level of interest rates that banks can lend to one another. This influences the level of interest rates for everyone. The main goal of the BoC is to maintain inflation at 1-3% by adjusting interest rates up or down. Relatively higher interest rates tend to be positive for the CAD. The Bank of Canada can also use quantitative easing and tightening to influence credit conditions, with the former CAD-negative and the latter CAD-positive.
The price of Oil is a key factor impacting the value of the Canadian Dollar. Petroleum is Canada’s biggest export, so Oil price tends to have an immediate impact on the CAD value. Generally, if Oil price rises CAD also goes up, as aggregate demand for the currency increases. The opposite is the case if the price of Oil falls. Higher Oil prices also tend to result in a greater likelihood of a positive Trade Balance, which is also supportive of the CAD.
While inflation had always traditionally been thought of as a negative factor for a currency since it lowers the value of money, the opposite has actually been the case in modern times with the relaxation of cross-border capital controls. Higher inflation tends to lead central banks to put up interest rates which attracts more capital inflows from global investors seeking a lucrative place to keep their money. This increases demand for the local currency, which in Canada’s case is the Canadian Dollar.
Macroeconomic data releases gauge the health of the economy and can have an impact on the Canadian Dollar. Indicators such as GDP, Manufacturing and Services PMIs, employment, and consumer sentiment surveys can all influence the direction of the CAD. A strong economy is good for the Canadian Dollar. Not only does it attract more foreign investment but it may encourage the Bank of Canada to put up interest rates, leading to a stronger currency. If economic data is weak, however, the CAD is likely to fall.
- Atlanta Fed President Bostic is cautious about rate cuts and prefers to see more data before easing.
- Revised GDP growth of 3% in Q2 highlights the resilience of the US economy.
- Jobless claims came in better than expected.
The US Dollar, measured by the US Dollar Index (DXY), saw further gains above 101.00 on Thursday. The 10-year US yield holds above 3.8%, supporting the Greenback. US stock index futures trade mixed following Nvidia earnings, which could impact risk appetite and the US Dollar's demand as a safe-haven currency. On the data front, Gross Domestic Product (GDP) revisions highlight US economic resilience.
The US economy remains robust, exceeding expectations. However, market sentiment appears overly optimistic, with expectations of aggressive monetary easing.
Daily digest market movers: US Dollar extends gains after GDP revisions
- Atlanta Fed President Raphael Bostic, a leading FOMC hawk, expressed caution about imminent rate cuts, citing robust labor market conditions and elevated inflation.
- About 100 bps of easing is anticipated by year-end and 200 basis points over the following year.
- The odds of a 50-basis-point cut in September remain within the 30-35% range.
- Contrary to expectations, the Bureau of Economic Analysis revised Q2 annualized real GDP growth upwards to 3% from 2.8%.
- New unemployment insurance claims in the US declined slightly to 231K for the week ending August 23, marginally below market estimates.
DXY technical outlook: Index indicates potential recovery, resistance at 101.50
Indicators suggest a potential recovery for the DXY, with the Relative Strength Index (RSI) trending upward and the Moving Average Convergence Divergence (MACD) indicator printing lower red bars.
A consolidation above the 101.00 support level could trigger a rally. Key supports include 100.50, 100.30 and 100.00, while resistances are located at 101.50, 101.80 and 102.00.
Fed FAQs
Monetary policy in the US is shaped by the Federal Reserve (Fed). The Fed has two mandates: to achieve price stability and foster full employment. Its primary tool to achieve these goals is by adjusting interest rates. When prices are rising too quickly and inflation is above the Fed’s 2% target, it raises interest rates, increasing borrowing costs throughout the economy. This results in a stronger US Dollar (USD) as it makes the US a more attractive place for international investors to park their money. When inflation falls below 2% or the Unemployment Rate is too high, the Fed may lower interest rates to encourage borrowing, which weighs on the Greenback.
The Federal Reserve (Fed) holds eight policy meetings a year, where the Federal Open Market Committee (FOMC) assesses economic conditions and makes monetary policy decisions. The FOMC is attended by twelve Fed officials – the seven members of the Board of Governors, the president of the Federal Reserve Bank of New York, and four of the remaining eleven regional Reserve Bank presidents, who serve one-year terms on a rotating basis.
In extreme situations, the Federal Reserve may resort to a policy named Quantitative Easing (QE). QE is the process by which the Fed substantially increases the flow of credit in a stuck financial system. It is a non-standard policy measure used during crises or when inflation is extremely low. It was the Fed’s weapon of choice during the Great Financial Crisis in 2008. It involves the Fed printing more Dollars and using them to buy high grade bonds from financial institutions. QE usually weakens the US Dollar.
Quantitative tightening (QT) is the reverse process of QE, whereby the Federal Reserve stops buying bonds from financial institutions and does not reinvest the principal from the bonds it holds maturing, to purchase new bonds. It is usually positive for the value of the US Dollar.
- The Dow Jones rose 450 points on Thursday as sentiment recovered.
- US GDP figures bolstered investor confidence after printing above expectations.
- US PCE inflation numbers still loom ahead on Friday.
The Dow Jones Industrial Average (DJIA) rose 1.1%, or 450 points, on Thursday, buoyed by a forecast beat in US Gross Domestic Product (GDP) growth numbers in Q2. US Personal Consumption Expenditure Price Index (PCE) inflation data, due on Friday, is still the key print of the week. Markets remain confident that the Federal Reserve (Fed) is on pace to kick off a rate-cutting cycle in September.
US Q2 GDP beat forecasts Thursday morning, propping up market sentiment and sending investors back into a bidding stance. Annualized Q2 GDP came in at 3.0% compared to the expected hold at 2.8%, and Initial Jobless Claims also ticked down to 231K for the week ended August 23. Investors had expected a print of 232K compared to the previous week’s revised 233K.
US core PCE inflation on Friday is expected to hold steady MoM and drift slightly higher on an annualized basis. July’s MoM core PCE inflation is forecast to hold at 0.2%, while the YoY figure for July is expected to tick up to 2.7% from the previous 2.6%. A below-expectations print will send markets piling back into hopes for an extended initial cut from the Fed on September 18, while an above-forecast release could send traders scurrying in the face of a potential resurgence in inflation, hobbling the Fed just before a widely-expected cut.
Dow Jones news
A risk-on Thursday has most of the Dow Jones index trading into the green in the back half of the trading week. Only one of the Dow’s listed securities are in the red for the day, with Home Depot (HD) shedding around one-fifth of one percent to trade below $370.00 per share.
Nvidia’s (NVDA) after-hours earnings call this week failed to jump-start tech-keen investors. Nvidia reported less-than-expected growth in earnings, with an overall uptick in profit failing to meet sky-high expectations set by runaway investors.
Dow Jones price forecast
The Dow Jones is back over 41,300 on Thursday after a brief midweek dip below the 41,000 handle. The index took a breather on Wednesday, but it has tilted back into the bullish side as daily candles continue to test chart paper near record highs set at the beginning of the trading week.
Traders hoping to capitalize on a bearish pullback run the risk of underestimating bullish market pressure, but risk-takers will be looking for signs of a technical breakdown to jump on the short train. Immediate technical targets are floating near the 50-day Exponential Moving Average (EMA) just above the 40,000 major price handle.
Dow Jones daily chart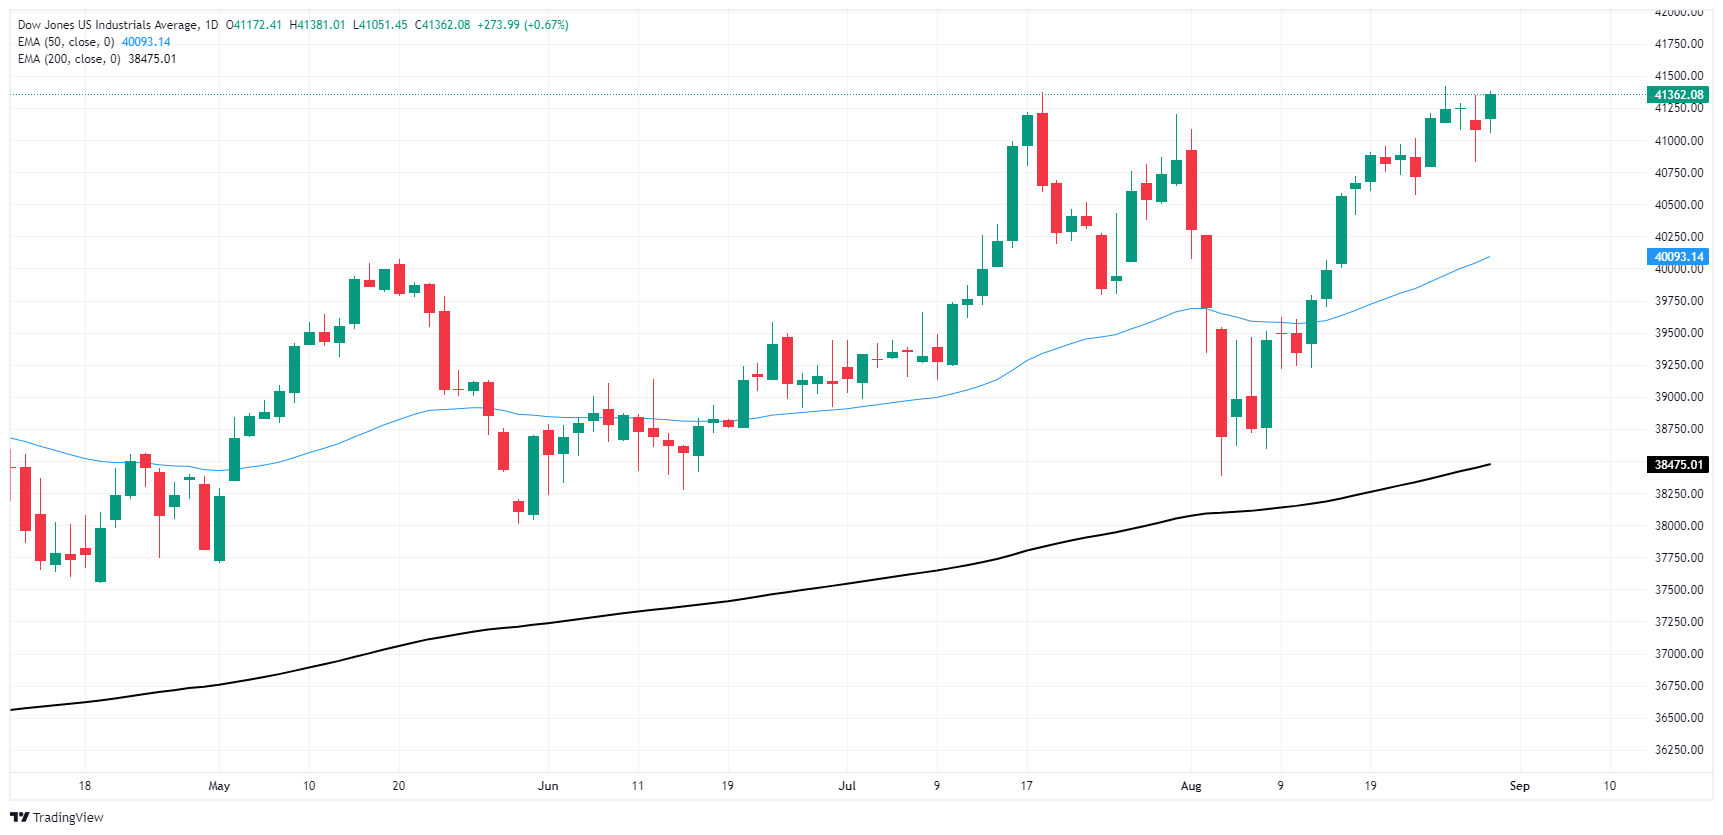
Dow Jones FAQs
The Dow Jones Industrial Average, one of the oldest stock market indices in the world, is compiled of the 30 most traded stocks in the US. The index is price-weighted rather than weighted by capitalization. It is calculated by summing the prices of the constituent stocks and dividing them by a factor, currently 0.152. The index was founded by Charles Dow, who also founded the Wall Street Journal. In later years it has been criticized for not being broadly representative enough because it only tracks 30 conglomerates, unlike broader indices such as the S&P 500.
Many different factors drive the Dow Jones Industrial Average (DJIA). The aggregate performance of the component companies revealed in quarterly company earnings reports is the main one. US and global macroeconomic data also contributes as it impacts on investor sentiment. The level of interest rates, set by the Federal Reserve (Fed), also influences the DJIA as it affects the cost of credit, on which many corporations are heavily reliant. Therefore, inflation can be a major driver as well as other metrics which impact the Fed decisions.
Dow Theory is a method for identifying the primary trend of the stock market developed by Charles Dow. A key step is to compare the direction of the Dow Jones Industrial Average (DJIA) and the Dow Jones Transportation Average (DJTA) and only follow trends where both are moving in the same direction. Volume is a confirmatory criteria. The theory uses elements of peak and trough analysis. Dow’s theory posits three trend phases: accumulation, when smart money starts buying or selling; public participation, when the wider public joins in; and distribution, when the smart money exits.
There are a number of ways to trade the DJIA. One is to use ETFs which allow investors to trade the DJIA as a single security, rather than having to buy shares in all 30 constituent companies. A leading example is the SPDR Dow Jones Industrial Average ETF (DIA). DJIA futures contracts enable traders to speculate on the future value of the index and Options provide the right, but not the obligation, to buy or sell the index at a predetermined price in the future. Mutual funds enable investors to buy a share of a diversified portfolio of DJIA stocks thus providing exposure to the overall index.
The Greenback extended its march north, helped by higher yields and firmer-than-expected results from GDP figures and weekly data of the labour market, all ahead of the publication of key PCE readings on Friday.
Here is what you need to know on Friday, August 30:
The US Dollar Index (DXY) remained firm and extended its breakout of the key 101.00 barrier amidst rising US yields across the board. The release of inflation figures tracked by the PCE takes centre stage on August 30, seconded by Personal Income, Personal Spending, the Chicago PMI, and the final Michigan Consumer Sentiment print.
EUR/USD suffered the Dollar’s rebound and broke below the 1.1100 support to reach multi-day lows. On August 30, Retail Sales are due in Germany, along with the labour market report. In the broader Euroland, the advanced Inflation Rate is expected, followed by the Unemployment Rate and the speech by the ECB’s af Jochnick.
GBP/USD bounced off weekly lows and managed to trim some losses and retreat just marginally on Thursday. Mortgage Approvals and Mortgage Lending will be published on August 30.
USD/JPY rose for the second day in a row, reaching multi-day highs near 145.50 on the back of the strong dollar and higher yields. Busy calendar in Japan on August 30 will release the Unemployment Rate, along with the Jobs/Applications Ratio and Tokyo inflation data. In addition, preliminary Industrial Production is also due, seconded by Retail Sales and Housing Starts.
AUD/USD resumed its robust rally and surpassed once again the key 0.6800 barrier, hitting new tops in levels not traded since early in the year. Housing Credit figures, and Retail Sales are coming on August 30.
Supply concerns stemming from Libya, as well as positive US data releases, lent legs to crude oil prices and lifted WTI to the vicinity of the $77.00 mark per barrel.
Prices of Gold traded in a cautious albeit positive tone near their recent all-time highs beyond the $2,500 mark per ounce troy despite the firm greenback and rising yields. Silver prices partially recouped ground lost in the previous day and approached the $29.70 zone.
Following the Bank of Mexico (Banxico) release of its Q2 2024 Quarterly Report, analysts of local and foreign banks estimated the central bank would not pause lowering rates for the remainder of the year.
Economists at Banorte expect a 25-basis-point (bps) rate cut in September and estimate that interest rates will end at 10.25%.
Citibanamex expects a quarter of percentage rate cuts in September, November, and December, with Banxico’s reference rate hitting 10.00%. It cites that the beginning of the Federal Reserve's easing cycle would ease pressures on the Mexican Peso, giving the Mexican central bank a green light to lower borrowing costs.
In Monex, they expect the bank’s reference rate to end the year at 10.25%, expecting cuts in September. The November and December meetings are live.
Goldman Sachs anticipates rate cuts of 25 bps each in the three remaining meetings of the year, bringing the interest rate down to 10.00% by year’s end.
Banxico FAQs
The Bank of Mexico, also known as Banxico, is the country’s central bank. Its mission is to preserve the value of Mexico’s currency, the Mexican Peso (MXN), and to set the monetary policy. To this end, its main objective is to maintain low and stable inflation within target levels – at or close to its target of 3%, the midpoint in a tolerance band of between 2% and 4%.
The main tool of the Banxico to guide monetary policy is by setting interest rates. When inflation is above target, the bank will attempt to tame it by raising rates, making it more expensive for households and businesses to borrow money and thus cooling the economy. Higher interest rates are generally positive for the Mexican Peso (MXN) as they lead to higher yields, making the country a more attractive place for investors. On the contrary, lower interest rates tend to weaken MXN. The rate differential with the USD, or how the Banxico is expected to set interest rates compared with the US Federal Reserve (Fed), is a key factor.
Banxico meets eight times a year, and its monetary policy is greatly influenced by decisions of the US Federal Reserve (Fed). Therefore, the central bank’s decision-making committee usually gathers a week after the Fed. In doing so, Banxico reacts and sometimes anticipates monetary policy measures set by the Federal Reserve. For example, after the Covid-19 pandemic, before the Fed raised rates, Banxico did it first in an attempt to diminish the chances of a substantial depreciation of the Mexican Peso (MXN) and to prevent capital outflows that could destabilize the country.
- Mexican Peso declines as Banxico cuts 2024, 2025 GDP forecast.
- Political unrest over judiciary reform and dismantling of autonomous bodies further pressures the Peso.
- Banxico sees inflation reaching 3% target by late 2025, with growth risks skewed downward due to slowing US economy.
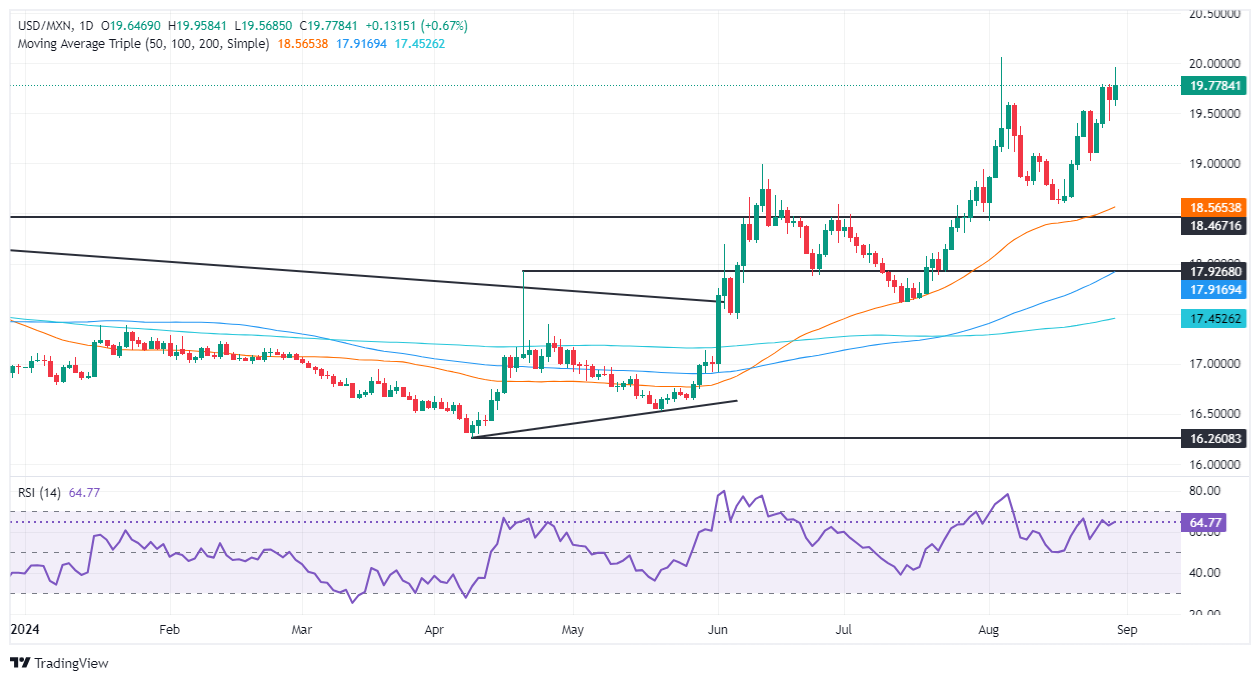
The Mexican Peso depreciated against the Greenback on Thursday, with the latter extending its gains for the second straight day on robust US data. Meanwhile, the emerging market currency dropped after the Bank of Mexico (Banxico) revised Mexico’s growth expectations to the downside for the rest of 2024, according to its quarterly report. The USD/MXN trades at 19.77 and gains over 0.70%.
Mexico’s political turmoil continues to dampen the prospects of the Mexican currency. President-elect Claudia Sheinbaum reassured foreign investors that their investments are secure, even though she approves the judiciary reform and the bill for the dissolution of autonomous bodies pushed by President Andres Manuel Lopez Obrador.
In addition, Banxico downwardly revised the Gross Domestic Product (GDP) for 2024 from 2.4% to 1.5% and from 1.5% to 1.2% for 2025 after revealing its Q2 2024 quarterly revision.
In the report, policymakers mentioned that “national economic activity is going through a period of market weakness and uncertainty.” They revisited inflation expectations higher and expect it to hit the bank’s 3% goal toward the end of 2025.
Furthermore, they added that risks to growth are tilted to the downside, adding that an economic deceleration in the US economy weighs on Mexico’s economic outlook.
Banxico Governor Victoria Rodriguez Ceja warned that adjustments to the main reference rates would be gradual only when macroeconomic conditions allowed them.
Across the border, the US Bureau of Economic Analysis (BEA) upwardly revised the second estimate for Gross Domestic Product (GDP). At the same time, the US Department of Labor revealed that the number of Americans filing for unemployment benefits dipped.
Daily digest market movers: Mexican Peso collapses as AMLO pauses relations with US-Canada ambassadors
- Mexican President Andres Manuel Lopez Obrador's decision to pause relations with the US and Canadian ambassadors this wee will continue to weigh on the Mexican Peso.
- Comments from US Ambassador Ken Salazar, expressed on August 22, were the reason behind AMLO’s decision. Salazar said that the judiciary reform threatens the rule of law and added that “the direct election of judges represents a major risk to the functioning of Mexico’s democracy. Any judicial reform must have safeguards that guarantee that the judiciary is strengthened and not subject to the corruption of politics.”
- US GDP for Q2 2024 saw a second estimate that jumped from 1.4% in Q1 to 3%, exceeding estimates of 2.8%. The Personal Consumption Price Expenditures (PCE) Deflator hinted that inflation dipped from 3.1% to 2.5% QoQ, slightly higher than the 2.3% foreseen.
- Initial Jobless Claims for the week ending August 24 dipped from 233K to 231K, below estimates of 232K.
- Traders will eye Fed speakers and the Fed’s preferred inflation gauge, the core Personal Consumption Expenditures Price Index (PCE), which arrives on Friday.
- Data from the Chicago Board of Trade (CBOT) suggests the Fed will cut at least 98 basis points (bps), according to the fed funds rate futures contract for December 2024.
Technical outlook: Mexican Peso slumps as USD/MXN hits two-week high at 19.95
The USD/MXN is at the risk of decisively clearing the 20.00 hurdle. From a technical standpoint, the uptrend remains intact as the Peso, although it has achieved some positive days, continues to register more significant losses.
The Relative Strength Index (RSI) suggests that buyers are in charge. The RSI is still bullish but not in overbought territory.
Therefore, the path of least resistance is to the upside. The USD/MXN first resistance would be 20.00. A breach of that level will expose the year-to-date (YTD) high at 20.22, followed by the September 28, 2022, daily high at 20.57. If those two levels are surrendered, the next stop would be the August 2, 2022, swing high at 20.82, ahead of 21.00.
Conversely, if USD/MXN tumbles below 19.50, this would expose the 19.00 figure. Further losses lie beneath that level, opening the door to test the August 19 low of 18.59, followed by the 50-day Simple Moving Average (SMA) at 18.48.
Mexican Peso FAQs
The Mexican Peso (MXN) is the most traded currency among its Latin American peers. Its value is broadly determined by the performance of the Mexican economy, the country’s central bank’s policy, the amount of foreign investment in the country and even the levels of remittances sent by Mexicans who live abroad, particularly in the United States. Geopolitical trends can also move MXN: for example, the process of nearshoring – or the decision by some firms to relocate manufacturing capacity and supply chains closer to their home countries – is also seen as a catalyst for the Mexican currency as the country is considered a key manufacturing hub in the American continent. Another catalyst for MXN is Oil prices as Mexico is a key exporter of the commodity.
The main objective of Mexico’s central bank, also known as Banxico, is to maintain inflation at low and stable levels (at or close to its target of 3%, the midpoint in a tolerance band of between 2% and 4%). To this end, the bank sets an appropriate level of interest rates. When inflation is too high, Banxico will attempt to tame it by raising interest rates, making it more expensive for households and businesses to borrow money, thus cooling demand and the overall economy. Higher interest rates are generally positive for the Mexican Peso (MXN) as they lead to higher yields, making the country a more attractive place for investors. On the contrary, lower interest rates tend to weaken MXN.
Macroeconomic data releases are key to assess the state of the economy and can have an impact on the Mexican Peso (MXN) valuation. A strong Mexican economy, based on high economic growth, low unemployment and high confidence is good for MXN. Not only does it attract more foreign investment but it may encourage the Bank of Mexico (Banxico) to increase interest rates, particularly if this strength comes together with elevated inflation. However, if economic data is weak, MXN is likely to depreciate.
As an emerging-market currency, the Mexican Peso (MXN) tends to strive during risk-on periods, or when investors perceive that broader market risks are low and thus are eager to engage with investments that carry a higher risk. Conversely, MXN tends to weaken at times of market turbulence or economic uncertainty as investors tend to sell higher-risk assets and flee to the more-stable safe havens.
- EUR/GBP bears pushed the cross near 0.8410 on Thursday.
- Indicators remain aligned with the bearish trend.
- Daily RSI is marching towards oversold terrain.
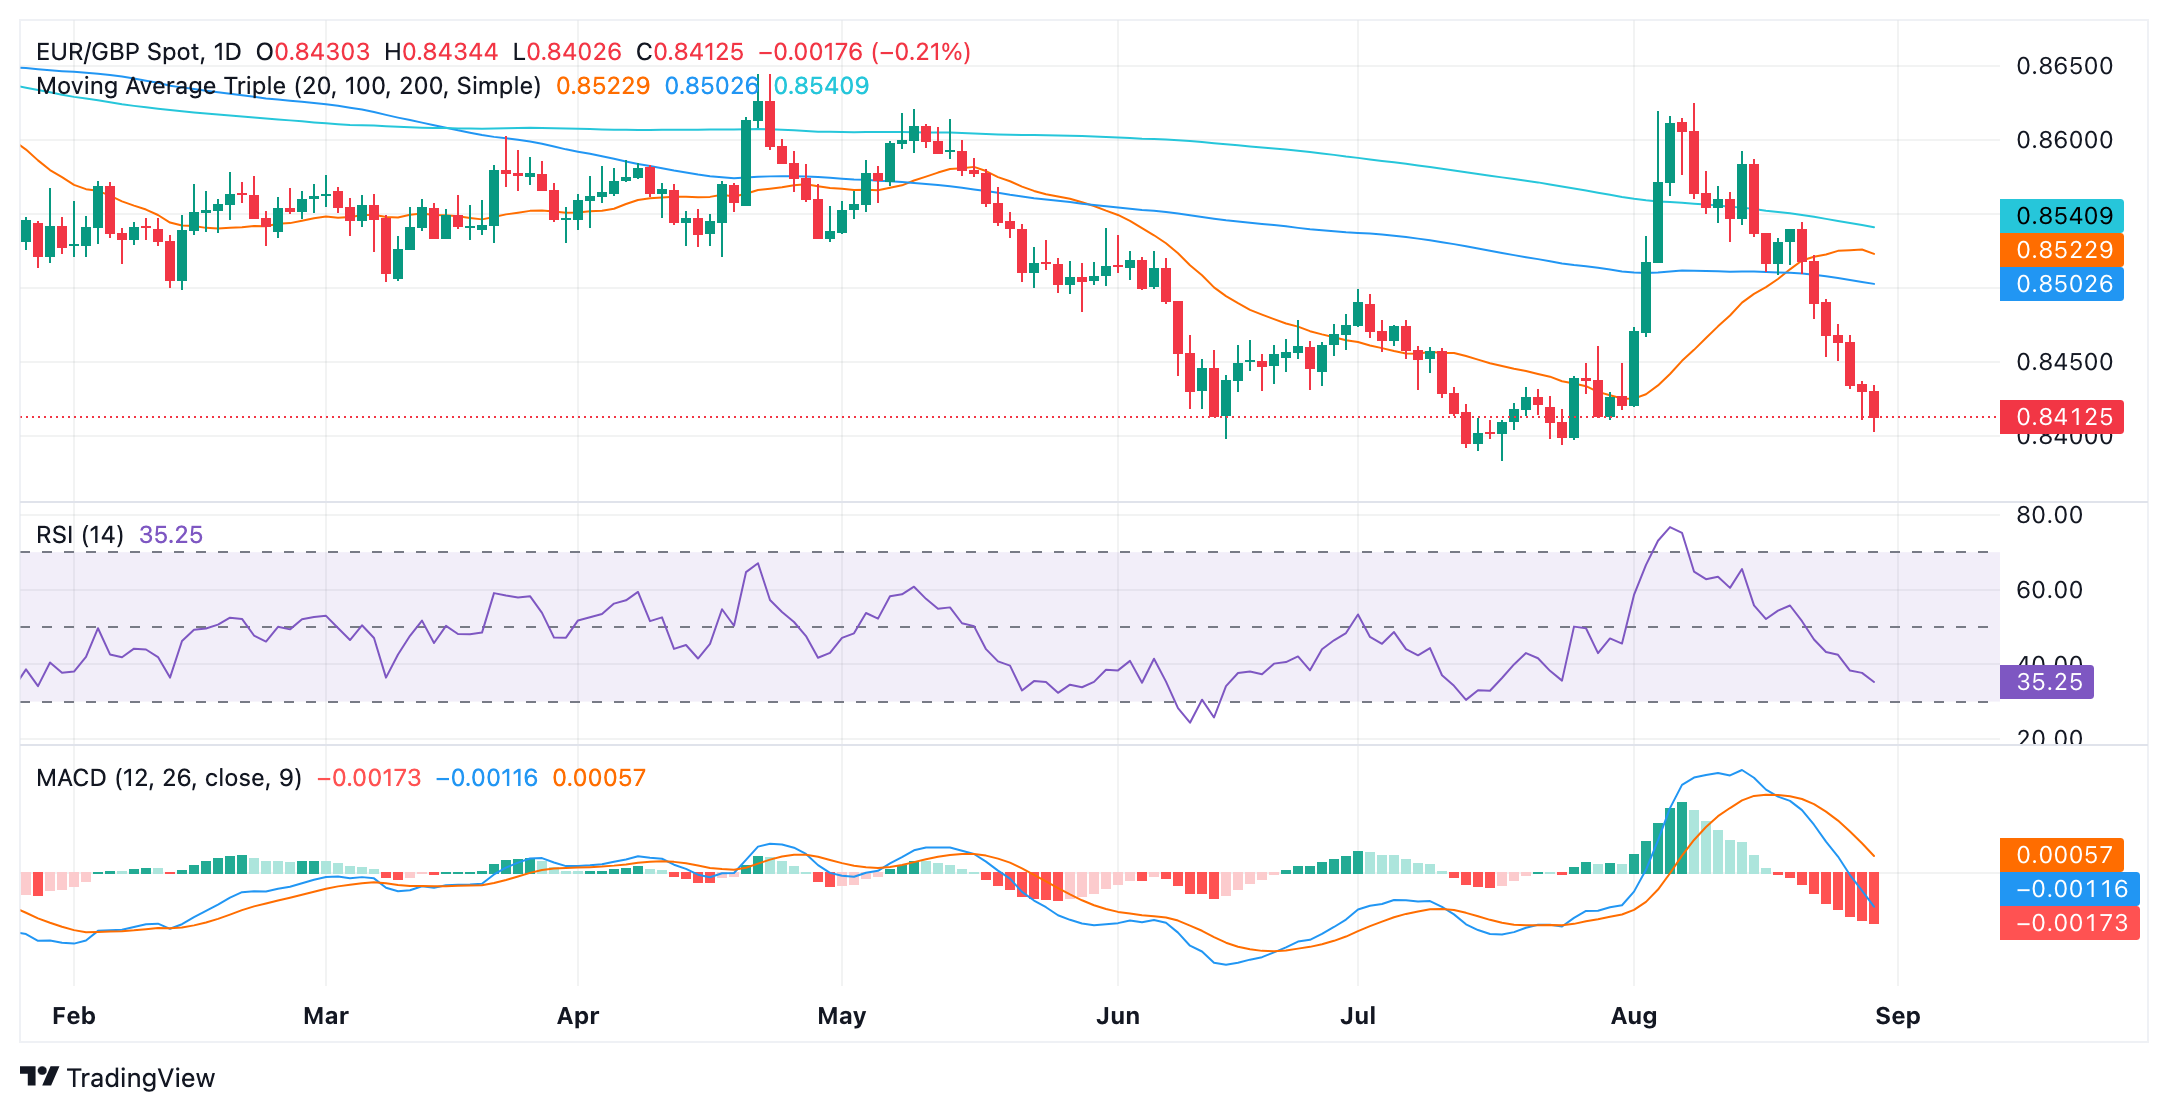
The EUR/GBP pair extended its losses on Thursday, declining by 0.20% to 0.84010. However, the pair remains above the 0.8400 mark, which is a key support level but selling pressure is increasing.
The Relative Strength Index (RSI) is currently at 35 and it is decreasing. This indicates that there is growing selling pressure. The Moving Average Convergence Divergence (MACD) is printing red bars, which also suggests that the bearish momentum is increasing.
Overall, the technical outlook for the EUR/GBP pair remains negative. The pair is likely to continue to decline in the near term, and if the bears breach the 0.8400 area the next support is seen at 0.8380. However, if the pair can hold above the 0.8400 level, the bearish traction might lose steam and with the RSI near 30, there are chances of an upward correction.
EUR/GBP daily chart
Aluminum prices are struggling to rally further following last week's signs of CTA buying exhaustion, Senior Commodity Strategist Daniel Ghali note.
Demand sentiment starts to decline again
“Under the hood, demand sentiment embedded within the cross-section of commodities prices has started to decline once again, following a brief recovery off the lows marked by the recent turmoil in August.”
“Supply risk premia has been an insulating force for Aluminum and certainly supported the recovery in prices, reflecting risks to European smelter output associated with higher energy prices. But our gauge of supply risk premia also points to the first signs of notable pressure since Ukraine's incursion in Russia.”
“While CTA flows are likely to remain muted over the next week barring a large downtape in prices, continued pressure from demand sentiment or easing supply risk premia could eventually catalyze renewed selling activity in a big downtape. Barring this catalyst, however, the balance of risks suggests LME3m prices may remain pinned to $2500/t in the near-term.”
Algo buying activity in palladium is now likely to hit the tapes, Senior Commodity Strategist Daniel Ghali notes.
Discretionary shorts are vulnerable
“Prices still need to break north of $1000/oz to catalyze the next large-scale buying program, but considering the massive net short position held by discretionary traders, we estimate substantial scope for subsequent buying in the current set-up. In fact, there are already signs that discretionary shorts are under pressure, in stark contrast to previous set-ups where this cohort held a large margin of safety in the form of paper profits to withstand an attempted squeeze.”
“This time around, recent swings in their positions have completely eroded their margin of safety. We estimate the aggregate entry price for discretionary shorts since May 2023 at only $1010/oz, but more recent shorts are worse-off. For those entering since May 2024, we calculate a weighted-average entry price of $940/oz. For those engaging in the latest round of short-acquisitions since July — only $915/oz.”
“Discretionary shorts are not only vulnerable, but are now underwater. This set-up could lead to explosive price action, given the critically low stockpile in CME vaults relative to the open interest in paper markets.”
- GBP/USD momentum favors sellers, possibly targeting the July 17 high of 1.3043.
- Further declines could test 1.3043; next major support at March 8 high of 1.2893.
- For an upside reversal, buyers need to breach 1.3200, aiming for two-year high at 1.3266, then 1.3293 and 1.3437.
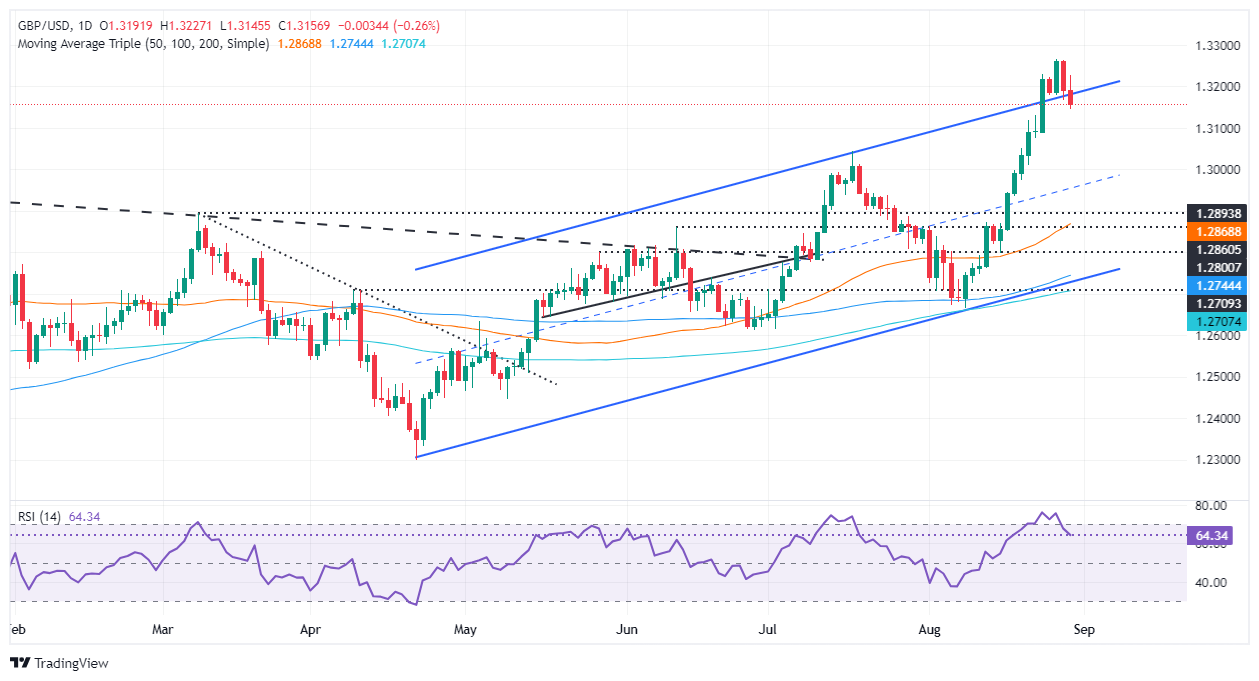
The GBP/USD extended its losses to two straight days and cleared the 1.3200 figure on the downside, as bears woke up after August’s 400-pip rally, crushed their expectations for lower prices. Despite the lack of UK economic data, the docket remains busy across the pond, with goodish data bolstering the Greenback. Therefore, the pair trades at 1.3151, down 0.30%.
GBP/USD Price Forecast: Technical outlook
The GBP/USD daily chart hints that in the short-term, the pair could aim and test the latest cycle high witnessed on July 17, at 1.3043. Momentum has shifted in sellers' favor as the Relative Strength Index (RSI) peaked at overbought territory. However, it has finally retraced below the 70 level, spurring the major’s two-day pullback to current exchange rates.
Although sellers are in charge, they must clear the 1.3100 figure and the psychological 1.3050 support before testing lower waters. If those two levels are taken out, the GBP/USD could aim for 1.3043, and on further weakness, the March 8 daily high emerges as the next demand zone at 1.2893.
On the other hand, if buyers want to counterattack, they must breach the 1.3200 figure. This will immediately expose the two-year high at 1.3266. A breach of the latter, and buyers could challenge the March 23, 2022, daily high at 1.3293 ahead of the March 1, 2022, swing high at 1.3437.
GBP/USD Price Action – Daily Chart
British Pound PRICE Today
The table below shows the percentage change of British Pound (GBP) against listed major currencies today. British Pound was the strongest against the Swiss Franc.
| USD | EUR | GBP | JPY | CAD | AUD | NZD | CHF | |
|---|---|---|---|---|---|---|---|---|
| USD | 0.44% | 0.25% | 0.54% | -0.02% | -0.13% | -0.21% | 0.75% | |
| EUR | -0.44% | -0.19% | 0.11% | -0.48% | -0.58% | -0.65% | 0.31% | |
| GBP | -0.25% | 0.19% | 0.31% | -0.28% | -0.39% | -0.46% | 0.53% | |
| JPY | -0.54% | -0.11% | -0.31% | -0.56% | -0.68% | -0.78% | 0.23% | |
| CAD | 0.02% | 0.48% | 0.28% | 0.56% | -0.10% | -0.18% | 0.82% | |
| AUD | 0.13% | 0.58% | 0.39% | 0.68% | 0.10% | -0.05% | 0.95% | |
| NZD | 0.21% | 0.65% | 0.46% | 0.78% | 0.18% | 0.05% | 0.99% | |
| CHF | -0.75% | -0.31% | -0.53% | -0.23% | -0.82% | -0.95% | -0.99% |
The heat map shows percentage changes of major currencies against each other. The base currency is picked from the left column, while the quote currency is picked from the top row. For example, if you pick the British Pound from the left column and move along the horizontal line to the US Dollar, the percentage change displayed in the box will represent GBP (base)/USD (quote).
Quiet markets have resulted in substantial price impacts from the recent whipsaws in Commodity Trading Advisor (CTA) positioning, Senior Commodity Strategist Daniel Ghali notes.
Prices are staging a recovery
“Massive algo buying activity at the turn of the week morphed into large-scale selling activity. Prices are staging a recovery this morning, but under the hood, the combination of likely CTA selling, a renewed slump in energy supply risk premia and deteriorating commodity demand sentiment still point to lower prices.”
“CTAs could sell up to -12% of their max size as they completely liquidate recent longs and build a net short.”
Commodity Trading Advisors (CTAs) are now set to buy Platinum in most scenarios for prices over the coming week, marking yet another whipsaw in trend follower positioning, Senior Commodity Strategist Daniel Ghali notes.
Little scope for additional outflows from speculators
“While we expect some algo selling activity this session, there is little scope for additional outflows from speculators with signs of a short covering trend from discretionary traders, who have built a modest net short position over the last few weeks.”
“Selling exhaustion from CTA trend followers may well be setting the stage for local lows to form.”
- USD/CAD licks its wounds as the US Dollar extends its upside.
- The upbeat second estimate of the US Q2 GDP boosted the US Dollar’s recovery.
- Investors await the US PCE inflation for July and Canada’s Q2 GDP data.
The USD/CAD pair recovers its entire intraday losses and attempts to reclaim the psychological resistance of 1.3500 in Thursday’s North American session. The Loonie asset bounces back strongly as the US Dollar (USD) extends its upside after the United States (US) Bureau of Economic Analysis (BEA) reported that the pace at which the economy grew in the second quarter was higher than it initially appeared.
The agency reported that the economy grew at a robust pace of 3% on an annualized basis against the preliminary estimates of 2.3%. The US Dollar Index (DXY), which tracks the Greenback’s value against six major currencies, climbs to near 101.50.
Meanwhile, major action in the US Dollar will be driven by the US Personal Consumption Expenditure Price Index (PCE) data for July, which will be published on Friday. The PCE report is expected to show that year-on-year core inflation rose at a faster pace of 2.7% from 2.6% in June, with monthly figures growing steadily by 0.2%. The inflation data would significantly influence market speculation for the Federal Reserve’s (Fed) September monetary policy.
Currently, financial markets seem to be confident that the Fed will start reducing interest rates in September. However, traders remain split over the potential size by which the Fed will pivot to policy-normalization.
In the neighboring nation, upbeat Oil prices continue to keep the Canadian Dollar’s (CAD) broader appeal upbeat. The Oil price bounces back strongly amid escalation in Middle East tensions. It is worth noting that Canada is the largest exporter of Oil to the US, and higher oil prices increase Greenback flows into Canada, strengthening the Canadian Dollar.
On the economic front, investors await the monthly and Q2 GDP data, which will be published on Friday. The Canadian economy is estimated to have barely grown in June. Annualized Q2 GDP is projected to have risen at a slower pace of 1.6% from the prior release of 1.7%.
Canadian Dollar FAQs
The key factors driving the Canadian Dollar (CAD) are the level of interest rates set by the Bank of Canada (BoC), the price of Oil, Canada’s largest export, the health of its economy, inflation and the Trade Balance, which is the difference between the value of Canada’s exports versus its imports. Other factors include market sentiment – whether investors are taking on more risky assets (risk-on) or seeking safe-havens (risk-off) – with risk-on being CAD-positive. As its largest trading partner, the health of the US economy is also a key factor influencing the Canadian Dollar.
The Bank of Canada (BoC) has a significant influence on the Canadian Dollar by setting the level of interest rates that banks can lend to one another. This influences the level of interest rates for everyone. The main goal of the BoC is to maintain inflation at 1-3% by adjusting interest rates up or down. Relatively higher interest rates tend to be positive for the CAD. The Bank of Canada can also use quantitative easing and tightening to influence credit conditions, with the former CAD-negative and the latter CAD-positive.
The price of Oil is a key factor impacting the value of the Canadian Dollar. Petroleum is Canada’s biggest export, so Oil price tends to have an immediate impact on the CAD value. Generally, if Oil price rises CAD also goes up, as aggregate demand for the currency increases. The opposite is the case if the price of Oil falls. Higher Oil prices also tend to result in a greater likelihood of a positive Trade Balance, which is also supportive of the CAD.
While inflation had always traditionally been thought of as a negative factor for a currency since it lowers the value of money, the opposite has actually been the case in modern times with the relaxation of cross-border capital controls. Higher inflation tends to lead central banks to put up interest rates which attracts more capital inflows from global investors seeking a lucrative place to keep their money. This increases demand for the local currency, which in Canada’s case is the Canadian Dollar.
Macroeconomic data releases gauge the health of the economy and can have an impact on the Canadian Dollar. Indicators such as GDP, Manufacturing and Services PMIs, employment, and consumer sentiment surveys can all influence the direction of the CAD. A strong economy is good for the Canadian Dollar. Not only does it attract more foreign investment but it may encourage the Bank of Canada to put up interest rates, leading to a stronger currency. If economic data is weak, however, the CAD is likely to fall.
The Pound Sterling (GBP) is little changed on the session, Scotiabank’s Chief FX Strategist Shaun Osborne notes.
Break below 1.3160 to signal a further drop
“Overnight price trends suggest the slide in the EUR dragged the GBP down in sympathy to some degree although EUR/GBP retains a better offered tone as the cross nears 0.84 and a potential retest of the July low at 0.8380 (lowest since August 2022).”
“Short-term trends in the GBP have turned flat after yesterday’s drop in Cable. Spot trends are holding a neutral pattern at the moment but loss of support at 1.3160 will signal potential for losses to extend a little more (towards 1.3050/60) in the coming days.”
Mexico's planned judicial reform continues to cause considerable volatility for the Peso. Earlier in the week the reform completed its first step through the parliamentary process, with a parliamentary committee approving the reform. At the same time, the US and Canadian ambassadors expressed their concerns about the reform. The response was quite harsh: relations with the ambassadors were 'suspended' for the time being. Neither of these developments did the Peso much good, Commerzbank’s FX analyst Michael Pfister notes.
Peso to benefit from reassuring statements in the short term
“Attempts were made yesterday to put the situation back on track. The outgoing Mexican president, Andrés Manuel López Obrador (AMLO), insisted that the suspension only concerned relations with the respective embassies and did not affect relations with the respective governments. At the same time, there were rumors that the president-elect, Claudia Sheinbaum, had asked that the judicial reform not be pushed through the parliamentary process in this way.”
“This would be a positive development, as it would indicate that policymakers are at least aware of the concerns of many market participants. The Peso could benefit somewhat as a result.We do not want to repeat here why we think the planned reform is problematic for the Peso. But we would still be cautious about taking such rumors at face value. Last week, Sheinbaum sought to allay market concerns about the reform.”
“And even before that, her statements tended to indicate that she too would like to see the reform through the parliamentary process as soon as possible. With this in mind, we could well see the Peso benefiting from reassuring statements in the short term, but we continue to see little upside potential for Mexico's currency in the medium term.”
- EUR/AUD is falling steeply after inflation data from Germany and Spain came in lower than expected.
- The cooler inflation data increases the chances of the ECB cutting interest rates in September.
- The RBA continues to hold back from cutting interest rates because of stubbornly high inflation in Australia.
EUR/AUD is down by almost three quarters of a percent on Thursday, trading in the 1.6270s, after the release of German and Spanish inflation data revised the outlook for interest rates in the Eurozone as a whole, weakening the Euro (EUR) in the process.
German preliminary Consumer Price Index (CPI) data fell to 1.9% YoY in August from 2.3% in July, and came in below economists expectations of 2.1%, according to data from Destatis.
The sharper-than-expected decline in German CPI followed similar data from Spain which showed Spanish CPI in the month of August falling to 2.2% from 2.8% in July, and also coming in well below estimates of 2.4%, according to INE. Data for the region as a whole is scheduled for release on Friday.
The disinflationary number has increased expectations that the European Central Bank (ECB) will lower interest rates by 0.25% at their September meeting. Such a move would weaken the Euro as lower interest rates attract less inflows of foreign capital.
At the last ECB meeting, the President of the ECB Christine Lagarde adopted a “wait and see approach” and said future interest rate decisions would be dependent on incoming data. Given the incoming data has been more disinflationary than expected, the market is pricing in a greater chance of the ECB moving to lower rates.
“With the growth outlook quite soggy, the ECB is widely expected to resume easing in September. 75 bp of total easing by year-end is nearly priced in,” says Dr. Win Thin, Global Head of Markets Strategy at Brown Brothers Harriman (BBH).
Commentary from ECB officials has fallen short of endorsing a rate cut so far.
ECB Executive Board Member Philip Lane, said on Thursday, that although wages in the Eurozone were expected to rise in the second half of 2024 they were “peaking now” and likely to lose momentum in 2024-5.
Earlier in the day, the Governor of the Central Bank of Cyprus, Christodoulos Patsalides said that if the ECB’s projections “continue to materialize, there’s nothing to prevent the Governing Council from reducing interest rates”, adding that “Policymaking is still data-dependent.”
EUR/AUD is falling because inflation in Australia is higher than in Europe. Australia’s monthly CPI rose 3.5% YoY in July, and although down from the 3.8% in June it came in above estimates 3.4%, and remains well above the levels for the Eurozone as a whole (2.6% in July).
Policymakers in Australia are less certain the time is right to reduce interest rates with the Minutes of the Reserve Bank of Australia’s last meeting revealing that members considered raising interest rates to tame inflation before ultimately deciding to hold steady.
RBA Governor Michelle Bullock also said recently that it was still “premature” to consider cutting rates. She warned that inflation remains “too high” and is not expected to return to the central bank’s 2%-3% target until the end of next year.
- US GDP growth for the second quarter got revised higher to 3%.
- US Dollar Index stays in positive territory above 101.00.
The US Bureau of Economic Analysis (BEA) announced on Thursday that it revised the annualized real Gross Domestic Product (GDP) growth for the second quarter to 3% from 2.8% in the initial estimate. Markets were expecting the BEA to confirm the GDP growth at 2.8%.
"Compared to the first quarter, the acceleration in real GDP in the second quarter primarily reflected an upturn in private inventory investment and an acceleration in consumer spending," the BEA noted its press release and explained that the update in the second estimate primarily reflected an upward revision to consumer spending.
Market reaction
The US Dollar preserves its strength after this report. At the time of press, the US Dollar Index was up 0.3% on the day at 101.35.
- Initial Jobless Claims rose by 231K vs. the previous week.
- Continuing Jobless Claims increased by 1.868M in the week ending August 17.
US citizens that applied for unemployment insurance benefits increased by 231K in the week ending August 24, according to the US Department of Labor (DoL) on Thursday. The prints came in a tad below initial consensus (232K) and were slightly lower than the previous weekly gain of 233K (revised from 232K).
Further details of the publication revealed that the advance seasonally adjusted insured unemployment rate was 1.2% and the 4-week moving average was 231.5K, a decrease of 4.750K from the previous week's revised average.
In addition, Continuing Claims increased by 13K to 1.868M in the week ended August 17.
Market reaction
The US Dollar Index (DXY) extends its daily recovery and surpasses the key 101.00 barrier, in the context of the mixed note in US yields across the curve.
The CAD has picked up a little ground in overnight trade, supported by a firmer risk backdrop and the USD’s overall drift, Scotiabank’s Chief FX Strategist Shaun Osborne notes.
Narrower spreads support gains.
“The compression in US/Canada yield spreads remains a key driver of broader CAD gains. The 2Y spread has eased to just under 60bps as US yield edge lower, the narrowest yield gap since May. Spread compression plus the general weakness in the USD is very likely driving CAD shortcovering demand. Spot continues to trade a little below our estimated fair value (1.3537 today).”
“The divergence is not significant but may constrain the CAD’s ability to extend gains significantly for now. Decent gains in the USD yesterday failed to deliver a definitive signal that USDCAD’s August slide was steadying. The shortterm downtrend remains intact and trend oscillators remain bearishly aligned for the USD across the intraday, daily and weekly DMIs.”
“It will take a lot more than Wednesday’s rally to lift the USD technically. Minor resistance is 1.3475 and 1.3490/00, with firmer resistance (potential bull trigger) distant at 1.3620. Intraday losses below 1.3440 may see USD losses resume towards 1.3350.”
Weak August regional CPI readings from Germany alerted markets to the risk that the national data (8.00ET) will undershoot expectations (unchanged M/M and 2.1% Y/Y, down from 2.3% in July), Scotiabank’s Chief FX Strategist Shaun Osborne notes.
Weak German regional CPI data disapoints
“Soft data weighed on Eurozone short rates (compressing EZ/US 2Y spreads somewhat) and drove the EUR back through the 1.11 area before spot steadied.”
“The softer EUR tone evident this week this week has edged spot below short-term support (August rally bull trend) at 1.1100 today.”
“EUR losses are not showing signs of picking up below the figure at this point but the soft undertone could extend back to the mid-1.10s unless the EUR can regain 1.11+ in fairly quick order.”
- Silver corrects back more deeply than was expected.
- The market is balanced, the correction is questioning the dominant uptrend.
- RSI is diverging bearishly suggesting potential underlying weakness.
Silver (XAG/USD) has corrected back after posting higher highs of $30.19 on August 26. During the pull back, the pair broke below key support at $29.23 (August 2 high) and this brought the short-term uptrend into doubt.
That said, given the price overall continues posting higher highs and higher lows the trend is probably still, on balance, probably still bullish – if weaker than it was.
Silver 4-hour Chart
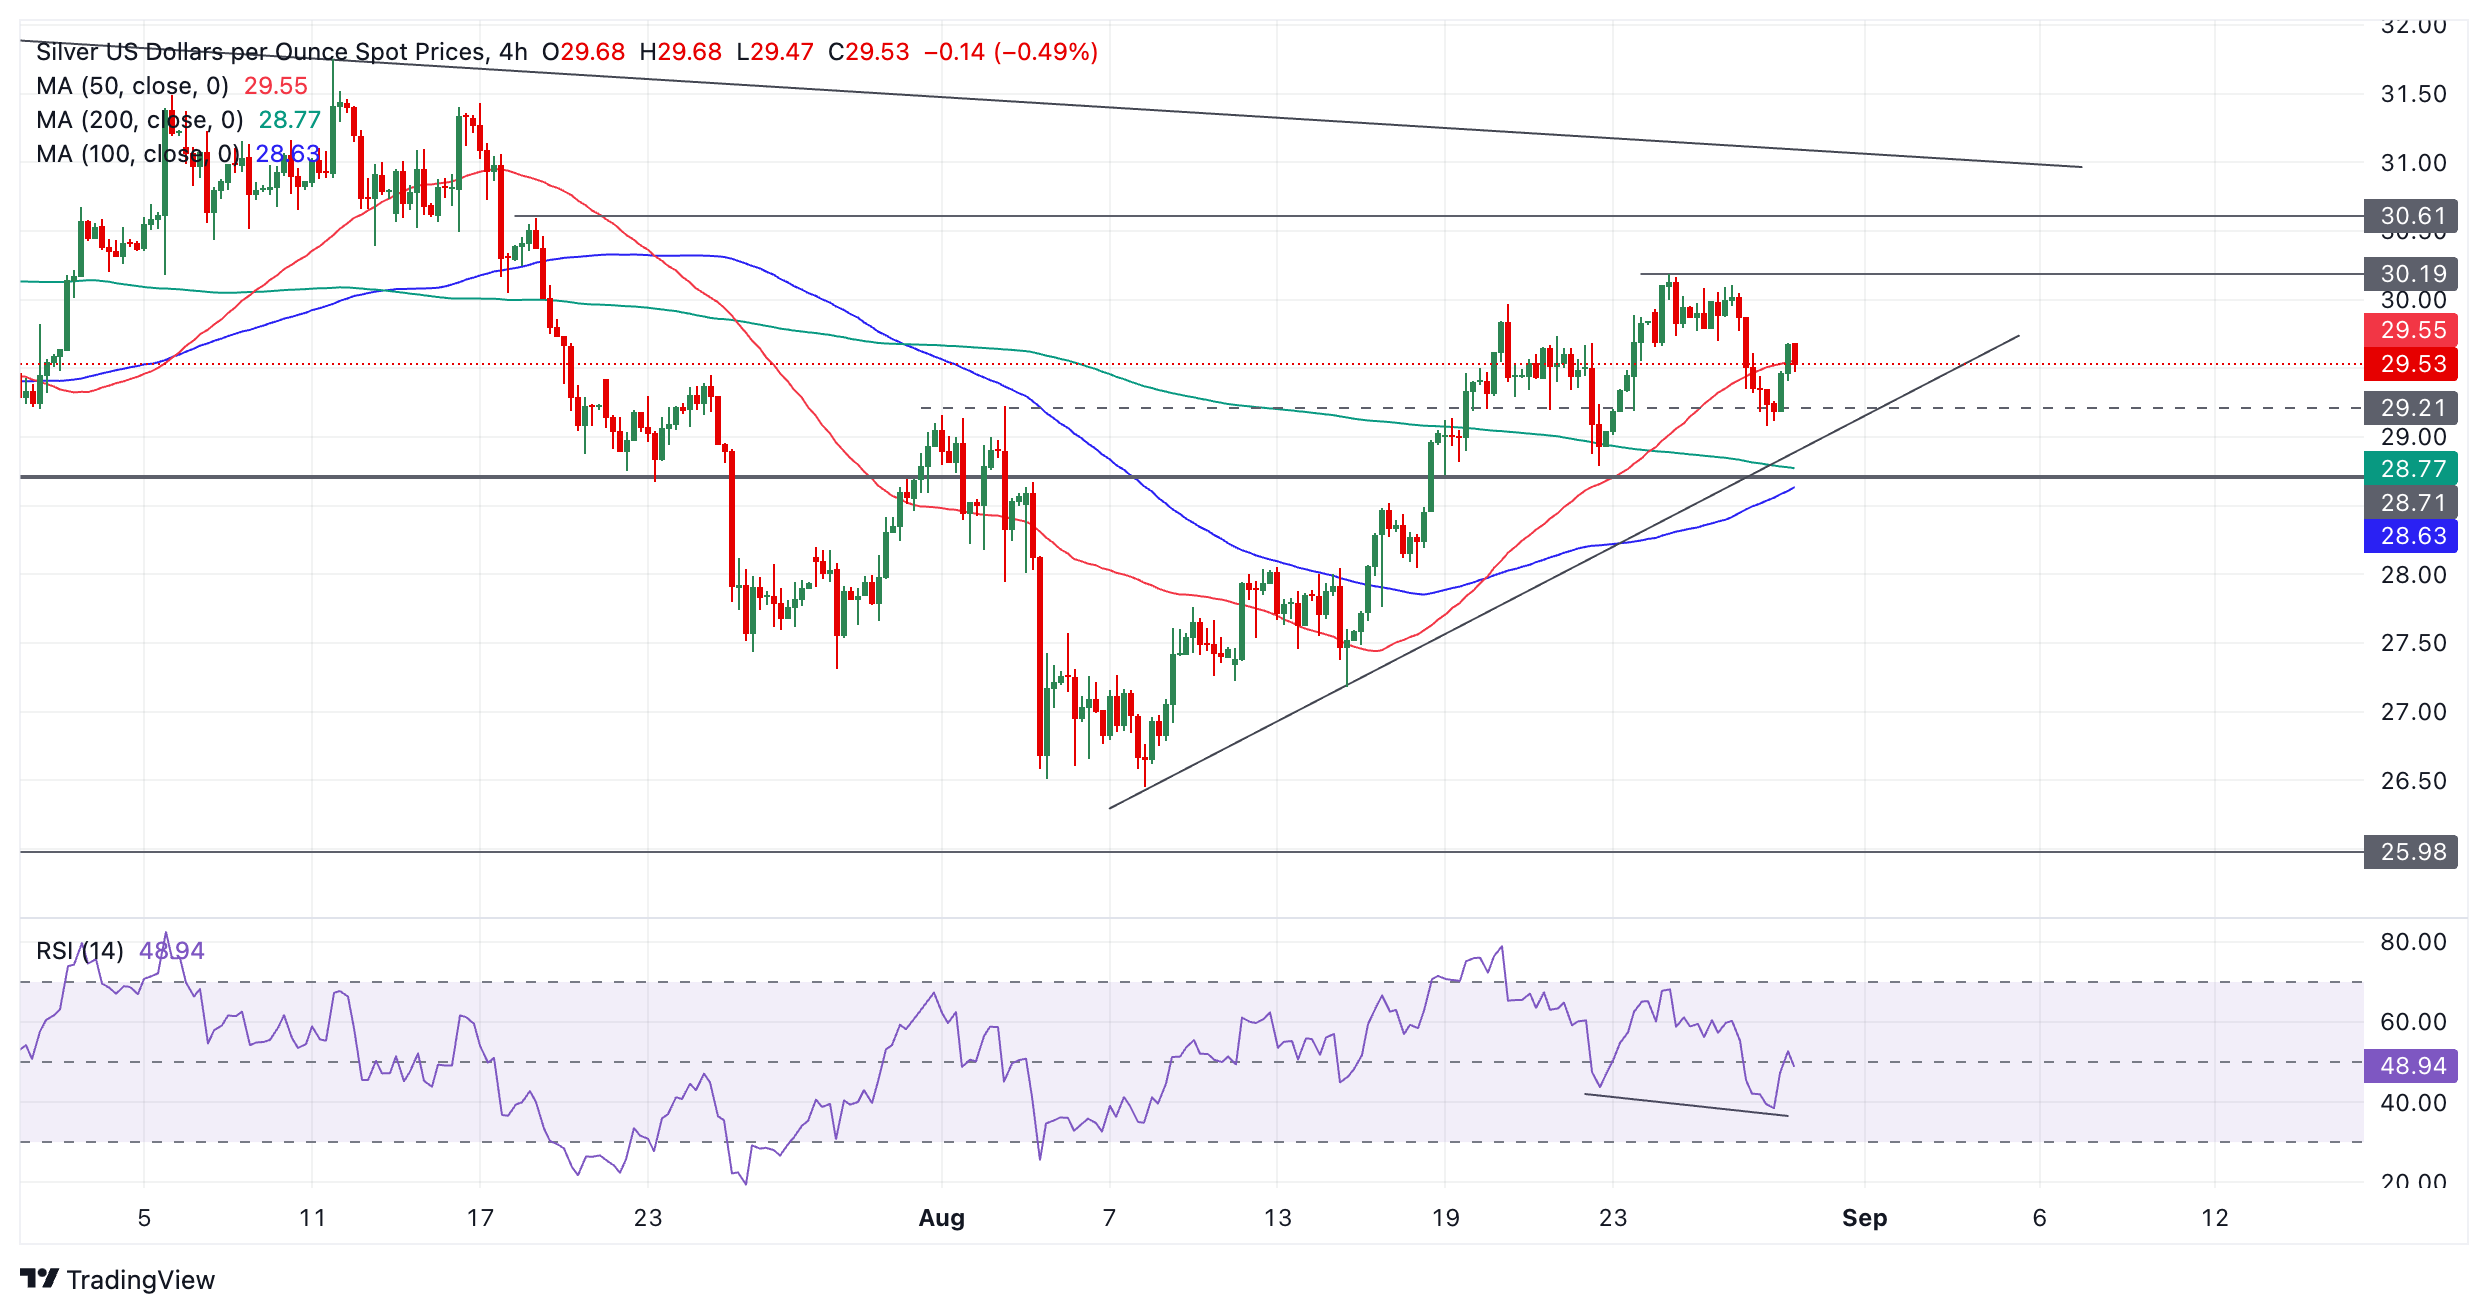
A break above the August high at $30.19 would confirm more upside and the continuation of the bull trend, with the next target coming into view at $30.61 the July 18 swing high.
A break below the August 22 swing low at $28.79, however, would indicate a break in the sequence of rising peaks and troughs. This could indicate a reversal in the short-term uptrend and more downside on the horizon.
The Relative Strength Index (RSI) momentum indicator is diverging bearishly with price when comparing the August 22 and August 28 lows. Although the price did not make a lower low on the 28th, the RSI did, suggesting underlying weakness in the price.
The trend on the medium and longer-term charts is unclear – possibly sideways – indicating little directional bias from higher time frames.
The JPY held on to earlier gains, with USD/JPY consolidating around mid-144, DBS FX & Credit Strategist Chang Wei Liang notes.
BOJ to continue normalizing monetary policy
“Markets will watch Tokyo CPI tomorrow closely, as BOJ Governor Ueda had expressed that further rate hikes could come if the Japanese economy moves in line with forecasts. Meanwhile, equity risks and tensions around the Middle East could keep the JPY supported on safe haven bids.”
“On the political front, former Foreign and Defense Minister Kono Taro announced his plans to run in the Sep 27 LDP leadership election, and stated that it is appropriate for the BOJ to continue normalizing monetary policy as long as inflation remains in line with the Bank’s expectations. He also said it is time to discuss how to balance the budget as interest rates rise.”
The USD is trading lower against the majority of its major currency peers so far today but the DXY is registering a small gain on the session, reflecting the underperforming EUR, which has slipped 0.2% to give the index a modest boost, Scotiabank’s Chief FX Strategist Shaun Osborne notes.
DXY gains on EUR weakness
“Weaker stocks and perhaps month-end flows helped the USD bid tone yesterday but the overall USD tone remains soft and minor gains so far this week in the DXY are barely challenging the downtrend that has developed over the past few weeks. Stocks look in better shape today, however, and there is not much talk or evidence of month-end USD demand. The USD is likely to retain a soft undertone while markets continue to price in the risk of aggressive Fed rate cuts over the balance of the year.”
“Next Friday’s Non-Farm Payrolls data will go a long way in shaping rate cut expectations. The second update of US Q2 GDP is released at 8.30ET (expected unchanged at 2.8%). Weekly claims data and July Wholesale Inventories are out at the same time. July Pending Home Sales are out at 10ET while Bostic (FOMC voter) speaks on the Fed’s economic outlook at 15.30ET. Bostic commented yesterday that he wanted to see more data confirming the need to cut rates in September.”
- The US Dollar trades on the back foot, weakening against most major peers, as traders focus on key US data.
- Markets cramped on Wednesday on the back of a miss in estimates for Nvidia earnings, benefiting the Dollar.
- The US Dollar Index popped above 101.00, but is unable to hold this level.
The US Dollar (USD) trades broadly unchanged on Thursday, easing somewhat against most of its peers, failing to extend Wednesday’s gains. The USD faces two days of a busy US economic calendar, with some data having the potential to be market-moving. Expect to see volatile moves unfolding as markets constantly flip-flop between bets of a 25-basis-point or a 50-basis-point interest-rate cut in September, depending on how incoming economic data plays out. Federal Reserve (Fed) Jerome Powell didn’t commit to any rate-cut size or forward guidance in his speech at Jackson Hole, so markets will have plenty of variables to speculate with.
On the US economic calendar front, a rough patch in terms of volatility will be offered this Thursday. Besides the weekly Jobless Claims, the second reading of the US Gross Domestic Product (GDP) will be released for the second quarter. The Personal Consumption Expenditure (PCE) number under that GDP umbrella will get a lot of attention ahead of the monthly PCE numbers on Friday.
Daily digest market movers: Hold on tight
- Inflation data from both Germany and Spain showed an intensifying disinflation trend, with even some German provinces posting price declines on a monthly basis. This triggered a sharp move lower for the Euro (EUR) against the US Dollar (USD), erasing nearly all gains booked last week.
- At 12:30 GMT, a chunky batch of data will be released:
- Weekly Jobless Claims for the week ending August 23:
- Initial Claims are expected to hold steady at 232,000.
- Continuing Claims were previously at 1.863 million.
- US Gross Domestic Product for the second quarter will see its second estimate, with economists not expecting any significant revisions:
- Headline GDP is expected to have grown at an annualised rate of 2.8% as previously estimated.
- The headline Personal Consumption Expenditure (PCE) Prices component is expected to come in at 2.6%, unchanged from the first reading. The Core PCE isn’t expected to be revised either from the 2.9% previously reported.
- The GDP Price Index component was at 2.3% in the first reading, with no forecast available for the second reading.
- Wholesale Inventories for July should grow by 0.2%, the same increase as in June. The Goods Trade Balance, meanwhile, is expected to widen slightly to $97.5 billion from $97.4 billion.
- Weekly Jobless Claims for the week ending August 23:
- At 14:00 GMT, Pending Home Sales for July will come in. Expectations are for sales to increase by 0.4%, down from the 4.8% rise seen a month earlier.
- Around 19:30, comments are expected from Federal Reserve Bank of Atlanta President Raphael Bostic, who delivers a presentation and participates in a Q&A about the Federal Reserve and the US economic outlook to Georgia Tech's Scheller College of Business Management of Financial Institutions class.
- Equities are trading flat in Asia, looking for directions after markets branded the Nvidia earnings report as a miss. European and US equities are trading flat to minor losses.
- The CME Fedwatch Tool shows a 65.5% chance of a 25 basis points (bps) interest rate cut by the Fed in September against a 34.5% chance for a 50 bps cut. Another 25 bps cut (if September is a 25 bps cut) is expected in November by 44.2%, while there is a 44.6% chance that rates will be 75 bps (25 bps + 50 bps) below the current levels and an 11.2% probability of rates being 100 (25 bps + 75 bps) basis points lower.
- The US 10-year benchmark rate trades at 3.84%, not that far off its peak for this week near 3.87%.
US Dollar Index Technical Analysis: You get what you give
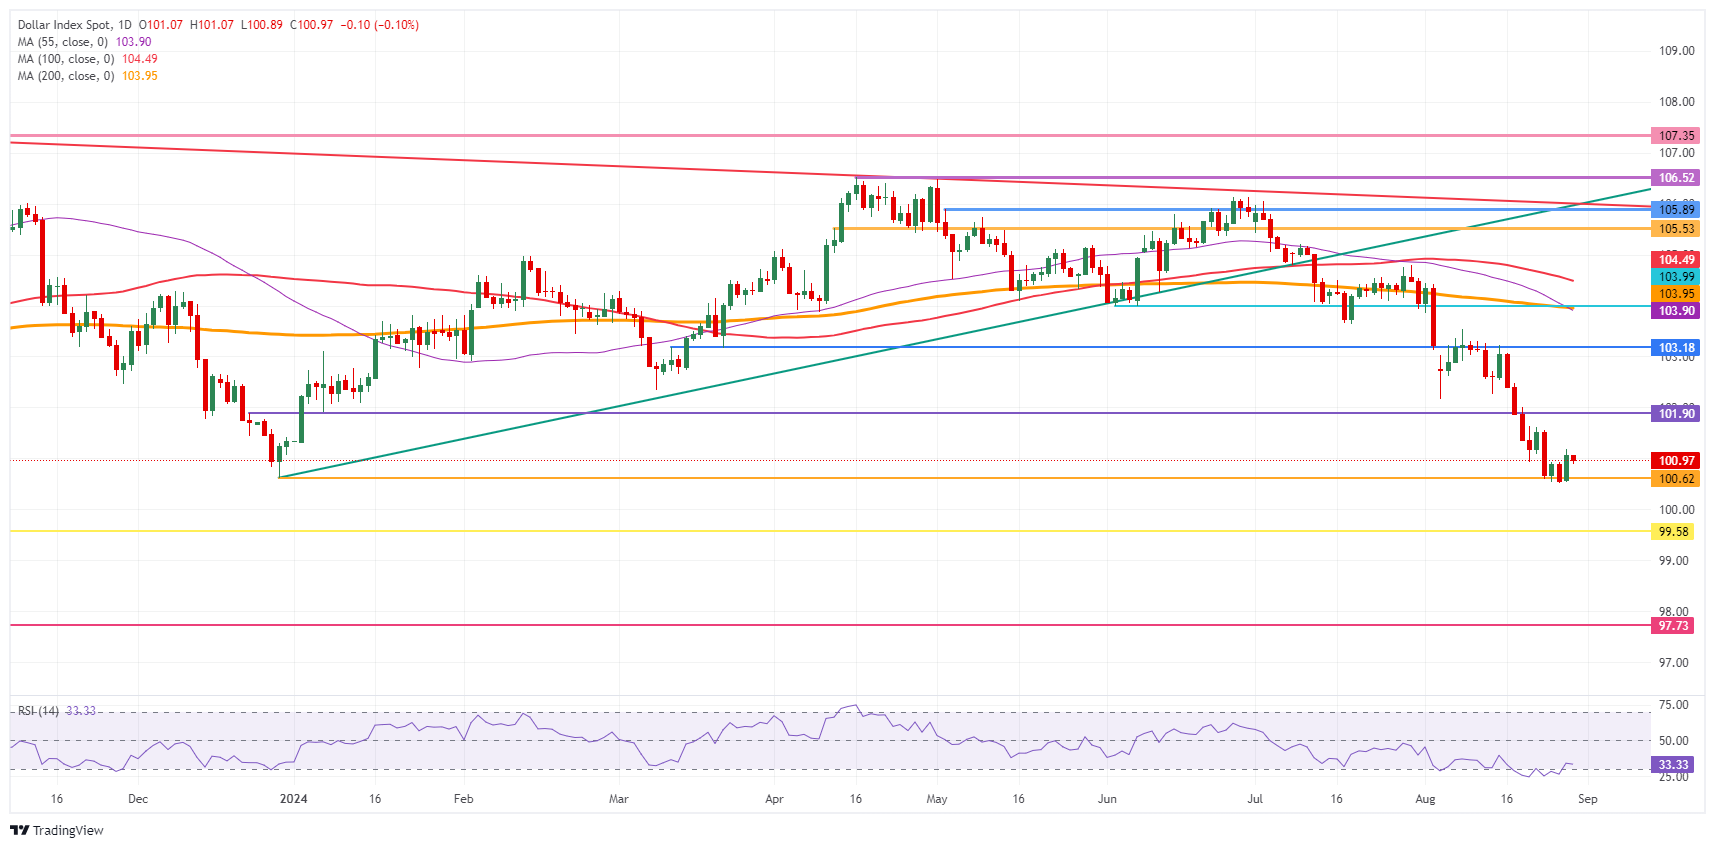
The US Dollar Index (DXY) could enter a rough volatile patch in the coming 48 hours with a bulk load of data making its way to markets. That the DXY is set to make some whipsaw moves is due to the Fed not committing to the size of its initial rate cut and also not clarifying if this is the start of a rate cutting cycle or could still end in a one-and-done cut. Markets were euphoric last week, and clearly have tuned down that cheerful mood with the DXY becoming the barometer on how markets foresee the next steps of the Fed.
For a recovery, the DXY faces a long road ahead. First, 101.90 is the level to reclaim. A steep 2% uprising would be needed to get the index to 103.18. A very heavy resistance level near 104.00 not only holds a pivotal technical value, but it also bears the 200-day Simple Moving Average (SMA) as the second heavyweight to cap price action.
On the downside, 100.62 (the low from December 28) tries to hold support, although it looks rather feeble. Should it break, the low from July 14, 2023, at 99.58 will be the ultimate level to look out for. Once that level gives way, early levels from 2023 are coming in near 97.73.
US Dollar Index: Daily Chart
US Dollar FAQs
The US Dollar (USD) is the official currency of the United States of America, and the ‘de facto’ currency of a significant number of other countries where it is found in circulation alongside local notes. It is the most heavily traded currency in the world, accounting for over 88% of all global foreign exchange turnover, or an average of $6.6 trillion in transactions per day, according to data from 2022. Following the second world war, the USD took over from the British Pound as the world’s reserve currency. For most of its history, the US Dollar was backed by Gold, until the Bretton Woods Agreement in 1971 when the Gold Standard went away.
The most important single factor impacting on the value of the US Dollar is monetary policy, which is shaped by the Federal Reserve (Fed). The Fed has two mandates: to achieve price stability (control inflation) and foster full employment. Its primary tool to achieve these two goals is by adjusting interest rates. When prices are rising too quickly and inflation is above the Fed’s 2% target, the Fed will raise rates, which helps the USD value. When inflation falls below 2% or the Unemployment Rate is too high, the Fed may lower interest rates, which weighs on the Greenback.
In extreme situations, the Federal Reserve can also print more Dollars and enact quantitative easing (QE). QE is the process by which the Fed substantially increases the flow of credit in a stuck financial system. It is a non-standard policy measure used when credit has dried up because banks will not lend to each other (out of the fear of counterparty default). It is a last resort when simply lowering interest rates is unlikely to achieve the necessary result. It was the Fed’s weapon of choice to combat the credit crunch that occurred during the Great Financial Crisis in 2008. It involves the Fed printing more Dollars and using them to buy US government bonds predominantly from financial institutions. QE usually leads to a weaker US Dollar.
Quantitative tightening (QT) is the reverse process whereby the Federal Reserve stops buying bonds from financial institutions and does not reinvest the principal from the bonds it holds maturing in new purchases. It is usually positive for the US Dollar.
- NZD/USD has broken out of a multi-month range and is following through to the upside.
- The breakout activates upside targets and indicates the trend has probably turned bullish.
NZD/USD finally breaks out of its sideways range of several months, after knocking on the ceiling for several sessions. The pair breaks above the August 20 high confirming a breakout and indicating substantial probable gains on the horizon.
NZD/USD 4-hour Chart
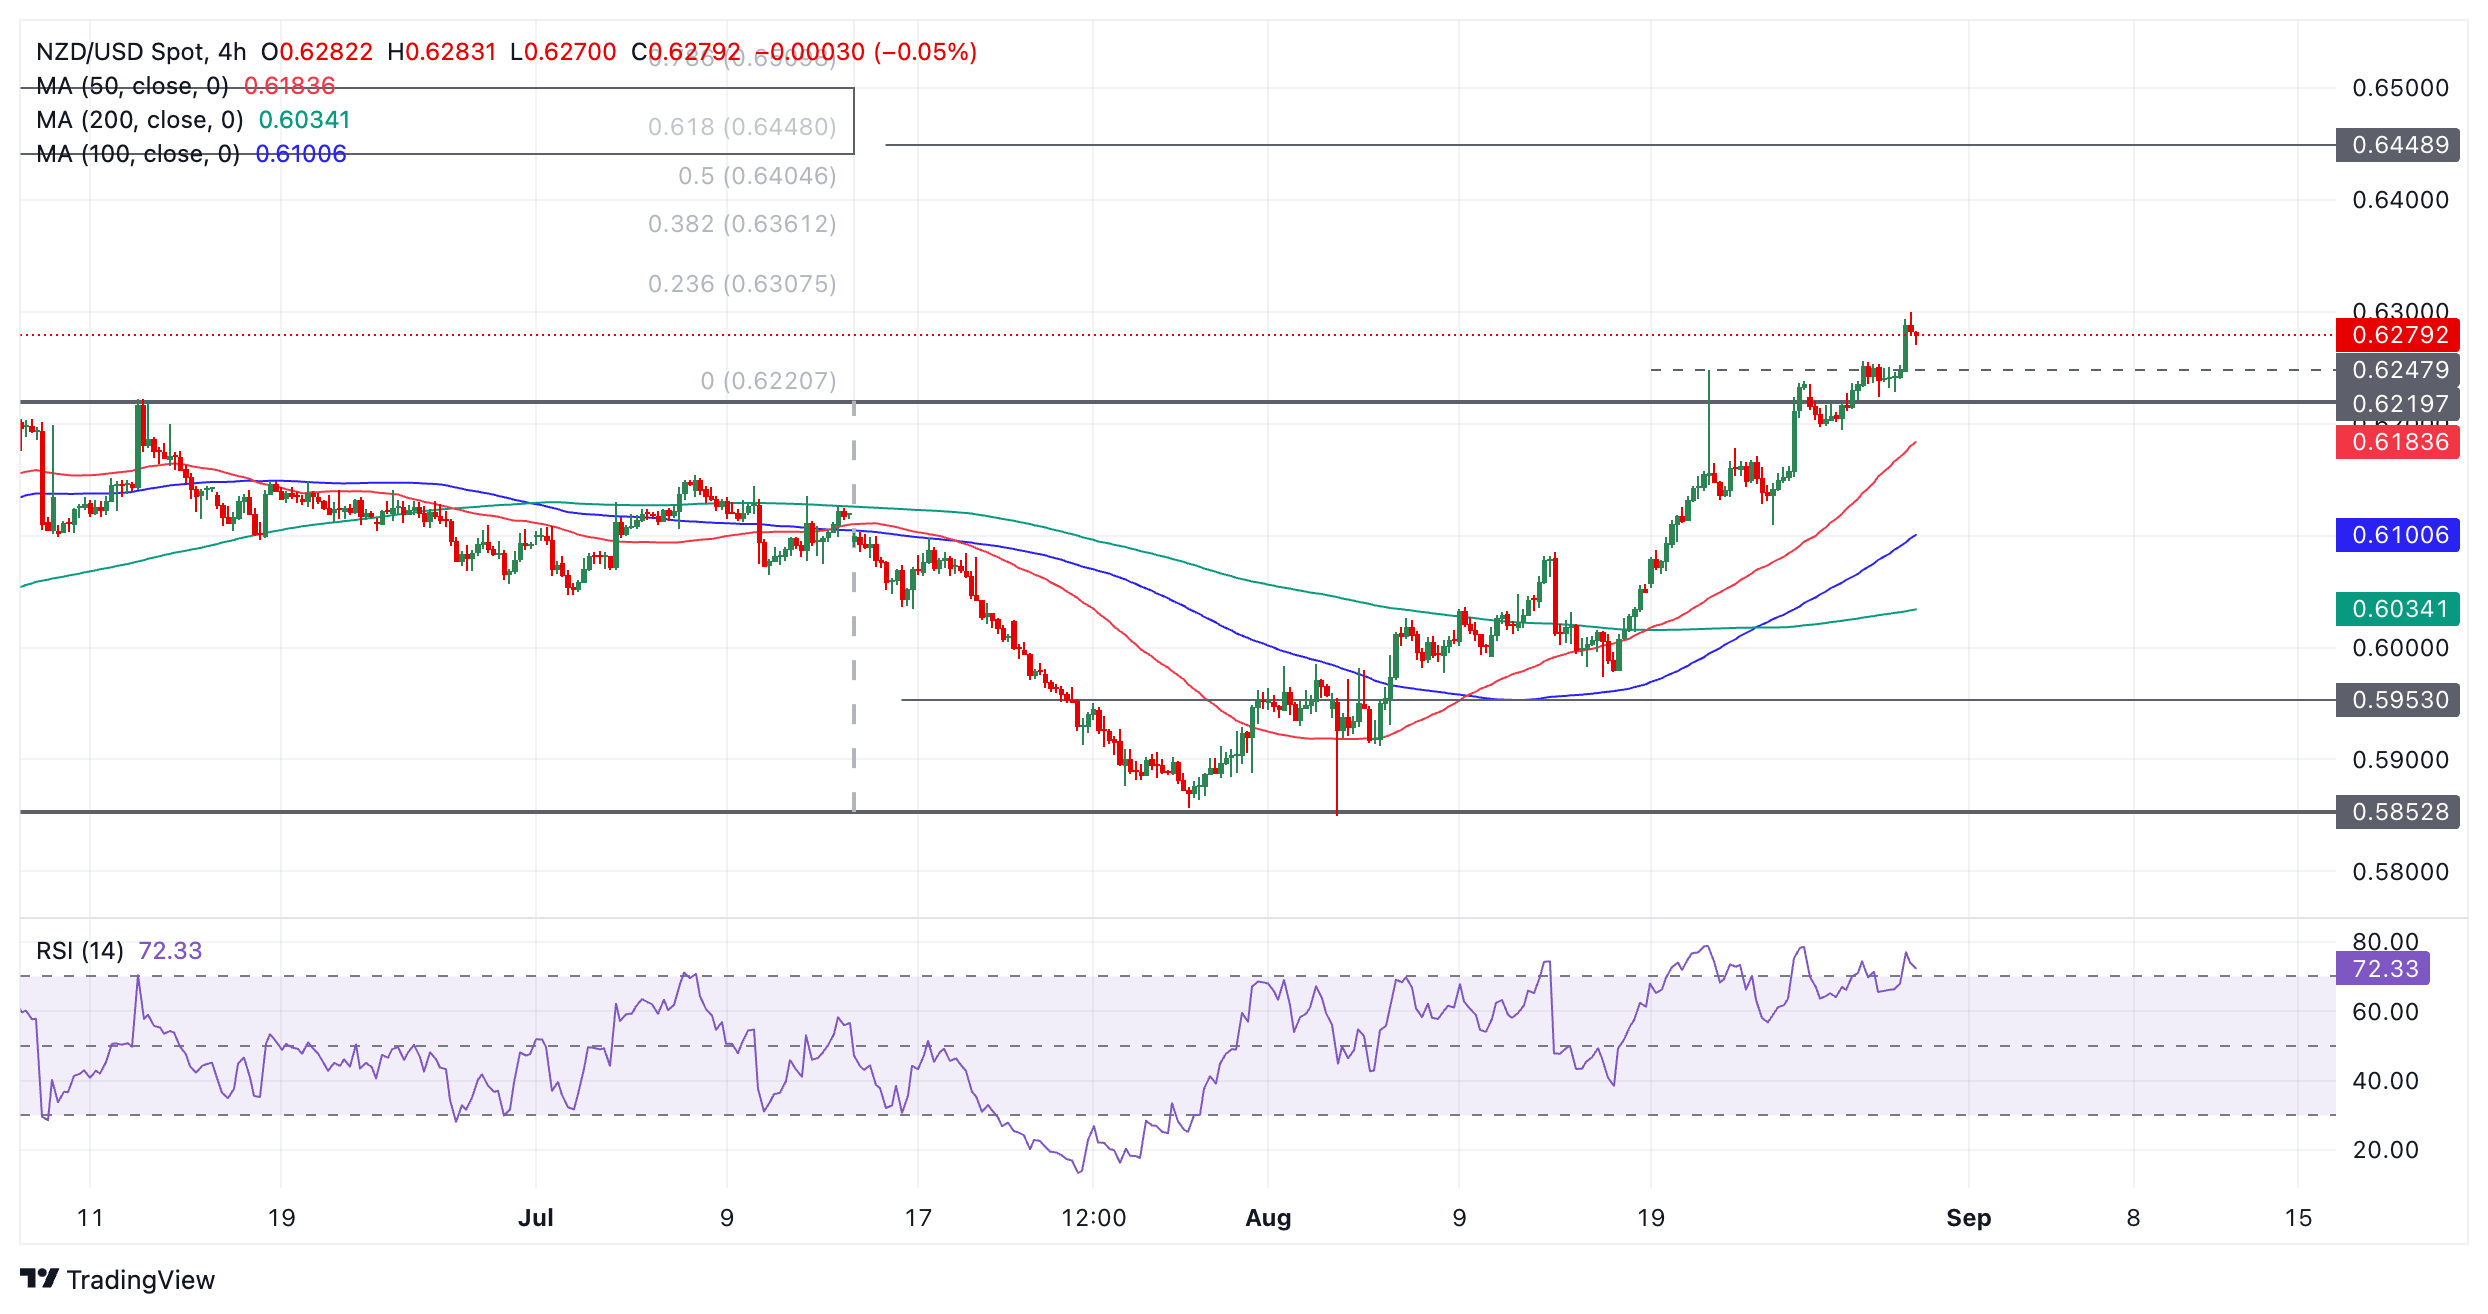
NZD/USD is likely to rally to the next target at 0.6409, the December 2023 high. This is a conservative target for the pair – the breakout from the range activates an upside target that is higher at 0.6448, calculated by taking the 0.618 ratio of the height of the range and extrapolating it higher.
Since the break the short-term trend has now probably transitioned from sideways to bullish. Given “the trend is your friend” the odds favor long positions over short positions.
The US Dollar (USD) rebounded slightly with DXY bumping back towards 101, DBS FX & Credit Strategist Chang Wei Liang notes.
USD consolidates amid caution
“Caution over equities could have contributed to some position paring in USD shorts, with a US mega semiconductor company reporting earnings that are not quite overwhelming.”
“Atlanta Fed Bostic, a voting FOMC member, also stated that he would want more data to be sure if it is time to cut, and would err on the side of waiting longer given still strong employment.”
“The contrast with Powell’s speech at Jackson Hole may hint at a slower pace of rate cuts than priced by markets. USD could thus see a period of consolidation unless jobless claims surprise on the upside.”
On Wednesday, US economist Brad Setser argued in the Financial Times that the interventions by the Japanese Ministry of Finance (MOF) in favor of the yen were very effective, regardless of the monetary policy of the Bank of Japan (BoJ). Time to roll up the stones again, then, Commerzbank’s Head of FX and Commodity Research Ulrich Leuchtmann notes.
JPY depends on the fundamentals
“The interventions have not had any lasting effect on JPY exchange rates so far. The MOF repeatedly let earlier intervention levels slip away. Their effect on USD/JPY only became sustainable when they were accompanied by idiosyncratic USD weakness and, in particular, when it became foreseeable that the BoJ's monetary policy would turn.”
“Most of the MOF's foreign exchange reserves may have been purchased at much lower USD/JPY rates.The MOF makes a profit from interventions if they are successful, i.e. if USD-JPY trades sustainably lower due to the interventions. Otherwise, it makes a loss.”
“A credible USD/JPY ceiling affects USD/PY prices well below this ceiling and that USD/JPY does not even come close to this ceiling. This is the old Krugman model of target zones for exchange rates, and we have not had a situation in which the Krugman model would apply. This all means that JPY depends on the fundamentals, mainly on the BoJ's monetary policy. The MOF cannot prevent fundamentally justified JPY levels in the medium to long term.”
- AUD/USD continues rising to new highs.
- The RSI has stopped its bearish divergence with price.
AUD/USD posts higher highs as it extends its rally and continues the uptrend it began at the start of August.
The pair has now broken above the previous monthly high of 0.6813 it reached on Wednesday. After a short pull back it resumed its uptrend and has broken to new highs. Given “the trend is your friend” is expected to continue rising.
AUD/USD 4-hour Chart
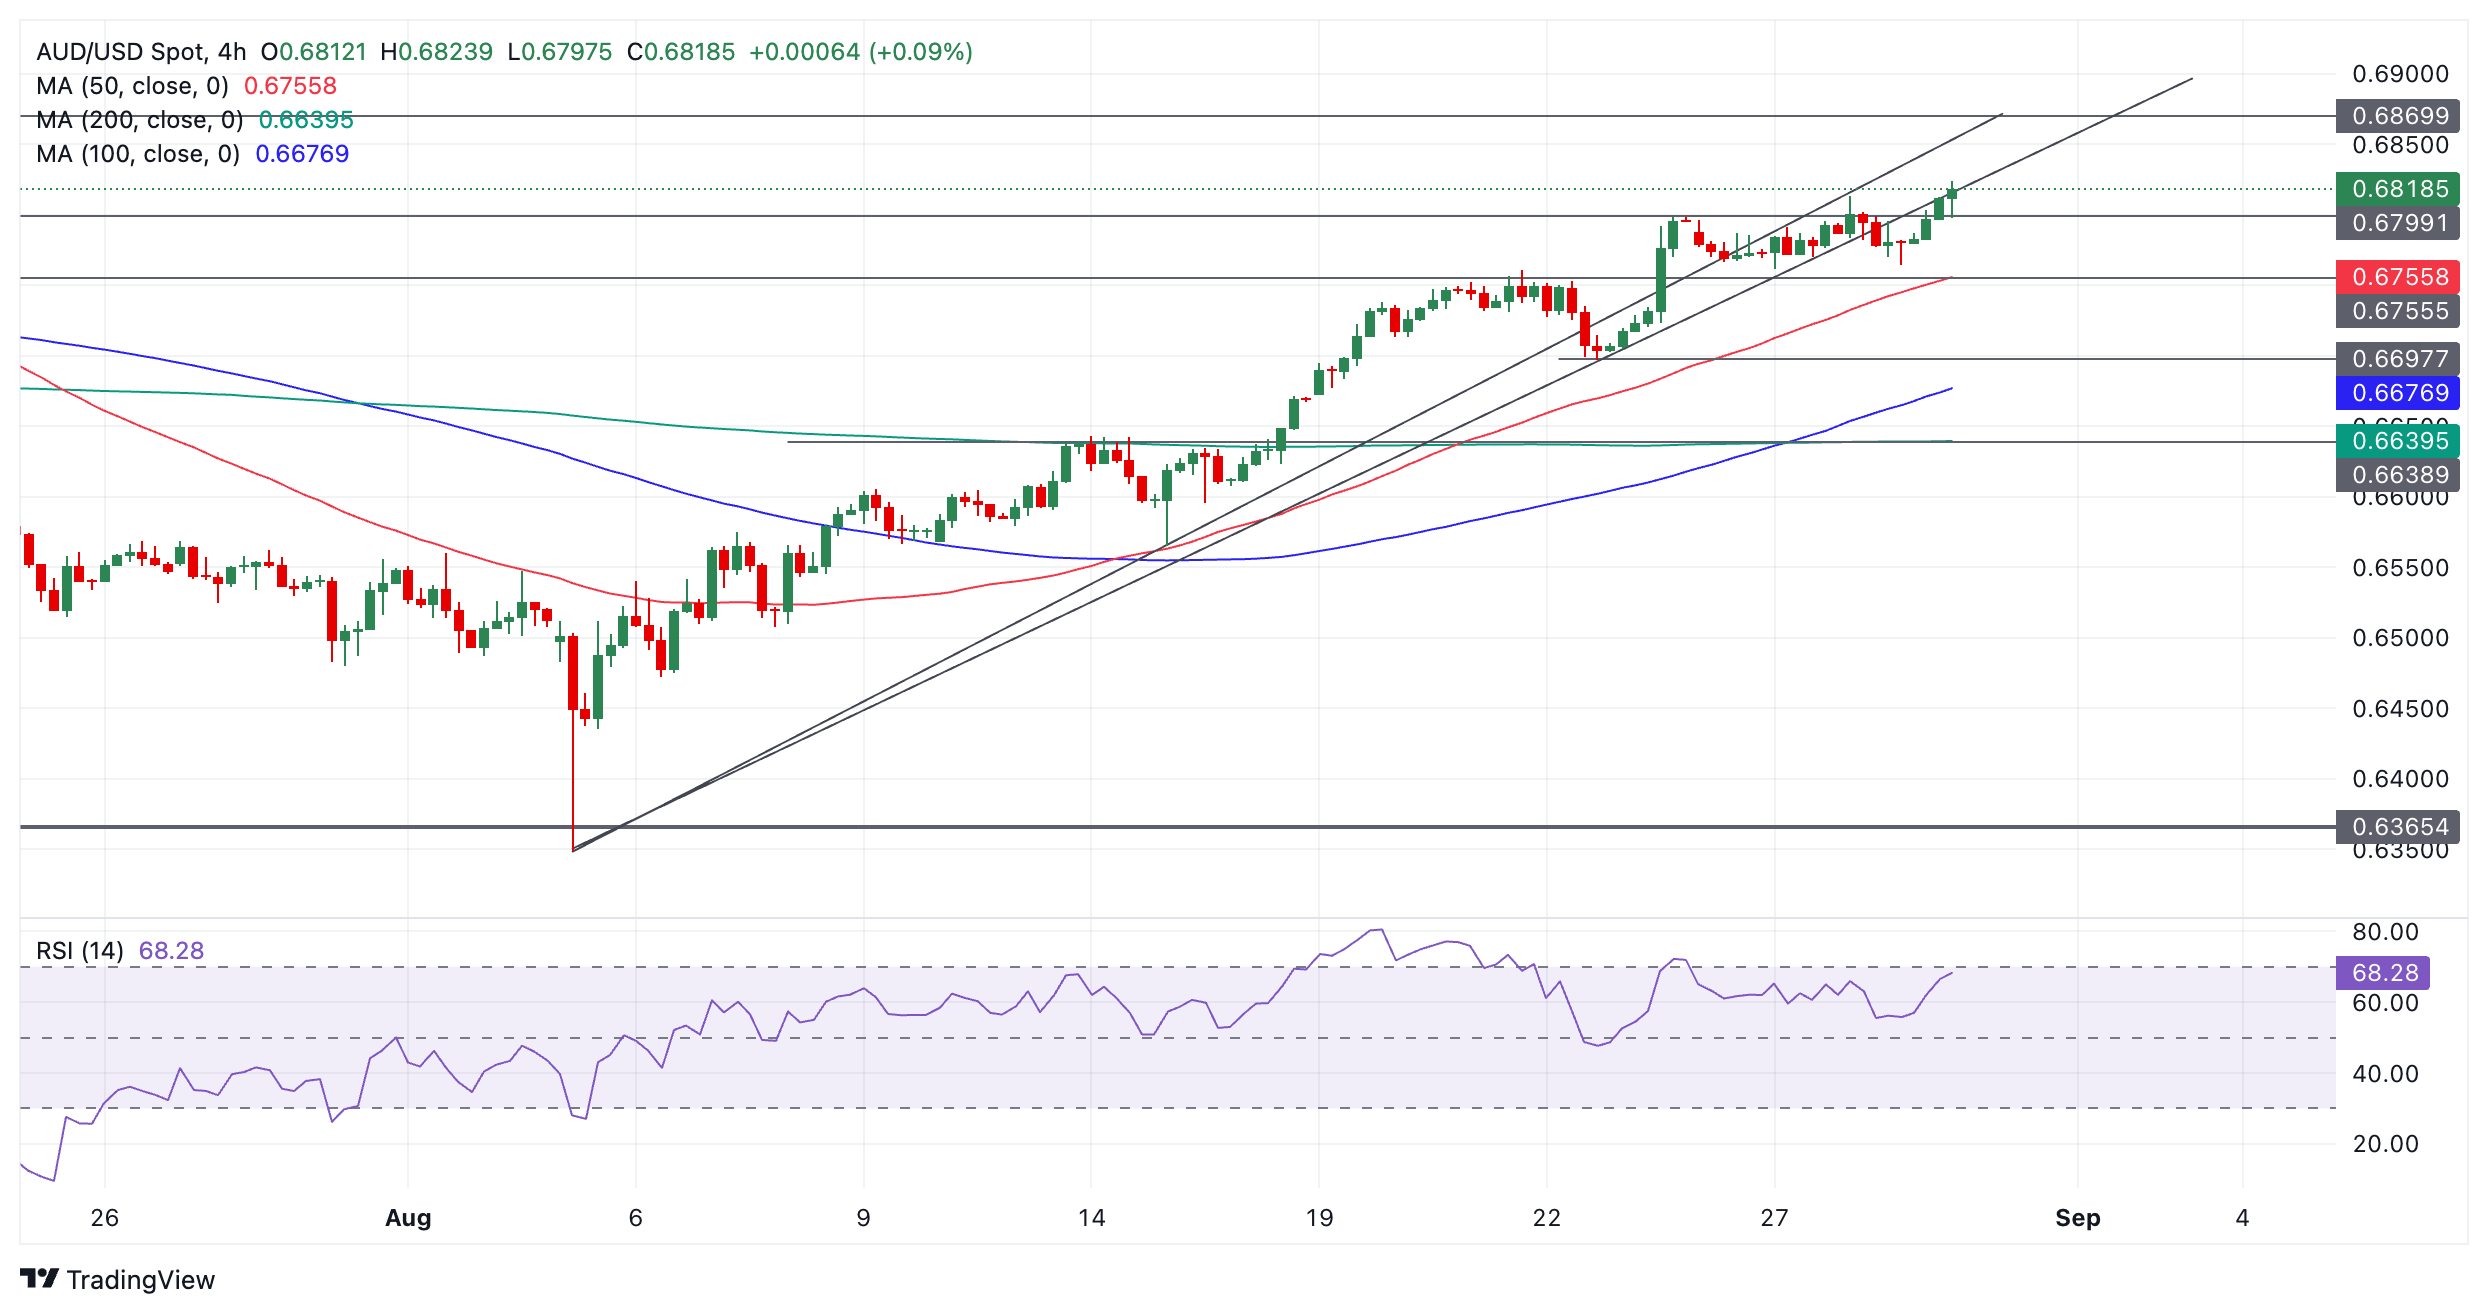
Now that AUD/USD has broken above the previous highs, it sets its sights on the next target at 0.6870, the December 2023 high.
The Relative Strength Index (RSI) momentum indicator has stopped showing bearish divergence with price since surpassing Wednesday’s high. This is a supportive sign for the bullish trend.
Any corrections of the trend would be expected to find support either at Wednesday’s 0.6813 high or 0.6755 if deeper.
- USD/JPY stays below 145.00 with US core PCE inflation on the horizon.
- Global market sentiment appears to be asset-specific.
- The BoJ is expected to raise interest rates again this year.
The USD/JPY pair trades sideways below the crucial resistance of 145.00 in Thursday’s European session. The asset struggles for direction as investors await the United States (US) Personal Consumption Expenditure inflation (PCE) report for July, which will be published on Friday.
Global market action appears to be asset-specific as risk-sensitive currencies have faced sharp selling pressure, while S&P 500 futures have posted significant gains in European trading hours. The US Dollar Index (DXY), which tracks the Greenback’s value against six major currencies, extends its recovery above 101.20.
The US PCE inflation is expected to drive the next move in the US Dollar (USD) as it would influence market speculation for the Federal Reserve’s (Fed) September policy meeting. According to the CME FedWatch tool, the Fed is certain to pivot to policy-normalization in September but traders remain split over the likely size of interest rate cuts. 30-day Federal Funds Futures pricing tool shows that the likelihood of a 50 basis points (bps) interest rate reduction is 34.5%, while the rest favors a 25 bps.
In today’s session, investors await revised estimates for Q2 Gross Domestic Product (GDP) and Initial Jobless Claims data for the week ending August 23. Investors will keenly watch the jobless claims data as the Fed is now more concerned about deteriorating labor market strength.
On the Japan front, firm expectations of more interest rate hikes by the Bank of Japan (BoJ) continue to support the Japanese Yen (JPY). On Wednesday, BoJ Deputy Governor Ryozo Himino said, "There is no change to our stance that we would adjust monetary easing if economic activity and prices are likely to meet projections."
Meanwhile, investors await the Tokyo Consumer Price Index (CPI) data for August, which will be published on Friday. The inflation report is expected to show that the CPI, excluding Fresh Food, grew steadily by 2.2%.
Japanese Yen FAQs
The Japanese Yen (JPY) is one of the world’s most traded currencies. Its value is broadly determined by the performance of the Japanese economy, but more specifically by the Bank of Japan’s policy, the differential between Japanese and US bond yields, or risk sentiment among traders, among other factors.
One of the Bank of Japan’s mandates is currency control, so its moves are key for the Yen. The BoJ has directly intervened in currency markets sometimes, generally to lower the value of the Yen, although it refrains from doing it often due to political concerns of its main trading partners. The current BoJ ultra-loose monetary policy, based on massive stimulus to the economy, has caused the Yen to depreciate against its main currency peers. This process has exacerbated more recently due to an increasing policy divergence between the Bank of Japan and other main central banks, which have opted to increase interest rates sharply to fight decades-high levels of inflation.
The BoJ’s stance of sticking to ultra-loose monetary policy has led to a widening policy divergence with other central banks, particularly with the US Federal Reserve. This supports a widening of the differential between the 10-year US and Japanese bonds, which favors the US Dollar against the Japanese Yen.
The Japanese Yen is often seen as a safe-haven investment. This means that in times of market stress, investors are more likely to put their money in the Japanese currency due to its supposed reliability and stability. Turbulent times are likely to strengthen the Yen’s value against other currencies seen as more risky to invest in.
New trade tariffs under a potential Trump 2.0 are a risk to exports, currently a key engine of growth. Still, trade diversion (through countries like Vietnam/Mexico) mitigates effects of trade tariffs over time. Meanwhile, domestic demand remains weak; we cut our 2024 growth forecast to 4.9% (from 5.1%), ABN AMRO Senior Economist Arjen van Dijkhuizen notes.
Beijing focuses more on the supply than the demand side
“As expected, quarterly GDP growth in Q2-24 slowed from an above trend pace of 1.5% qoq s.a. in Q1 to 0.7%, while annual growth slowed more than expected on revisions, to 4.7% yoy (Q1: 5.3%). We still expect some payback in Q3, but cut our 2024 annual growth forecast to 4.9%, from 5.1%.”
“Exports are currently a key driver of growth, although export growth slowed in July. What is more, China’s supply-focused strategy contributes to a broadening of trade spats, with the US/EU (and others) protecting strategic sectors against Chinese (over)supply. This risk would rise under a potential ‘Trump 2.0”. Trump threatens with a 10% universal tariff and higher (±60%), broader China-tariffs compared to his first tariff war in 2018-20.”
“So far, policy easing did not really ‘move the needle’, with Beijing focused more on the supply than the demand side. Policy rates were cut (further) marginally in July, but kept on hold in August. This ‘piecemeal’ easing takes place amidst weak loan demand, with lending growth coming down. Meanwhile, key focus of the CCP’s Third Plenum held in July was Xi’s (supply side) strategy of high-tech development, and self-reliance.”
- Oil broadly consolidates after dipping 3.60% in two days on profit-taking.
- Ukraine is stepping up efforts to attack Russian Oil installations.
- The US Dollar Index trades back below 101.00 after rebounding on the back of Nvidia earnings missing estimates.
Oil prices are starting the European session trading broadly flat, halting a two-day decline after traders were quick to take profit on the back of earlier news that Libyan Oil fields were set to shut down over local political issues. While that news has faded into the background,Ukraine and the Red Sea attacks are on the forefront again: The Greek ship attacked last week in the Red Sea seems to be leaking Oil, according to the Pentagon, while Ukraine is attacking Russian Oil and artillery depots in Rostov Kirov and Voronezh.
The US Dollar Index (DXY), which tracks the performance of the US Dollar against a bucket of currencies, is sliding back below 101.00. The DXY saw inflows on Wednesday after Nvidia earnings missed estimates. With two days ahead of very important economic data points, the US Dollar Index could make some substantial moves by Friday’s close.
At the time of writing, Crude Oil (WTI) trades at $74.05 and Brent Crude at $77.53.
Oil news and market movers: Ukraine is taunting Russia
- Ukraine’s military claims it has striked strategic oil and artillery depots in the Rostov Kirov and Voronezh regions, Reuters reports.
- Bloomberg reports that OPEC might rethink its cut-unwinding plans for Q4 in case a lack of growth in Oil demand takes place. OPEC will want to avoid a slump in prices at any cost.
- The US Energy Information Administration (EIA) reported a far lower drawdown than expected in its weekly report on Wednesday. The actual number came in at a decline of 846,000, way less than the 3 million drawdown expected. The previous release was a drawdown of 4.649 million barrels.
- Reuters reports that the Pentagon has released information on the Greek vessel in the Red Sea that was attacked last week, and might be losing oil. Still, it looks like an environmental disaster can be avoided, according to sources.
Oil Technical Analysis: Limited lifespan
Oil is trying to halt the profit taking that has occurred in the past two trading days. From a pure technical point of view, the risk is tilted to more downside. Seeing that the brief rally was unable to break any technical upside levels and even reversed ahead of them means that traders were in it for the short term move and will step out as quickly as they can, limiting the lifespan of this rally.
On the upside, the double level at $77.65 aligns with both a descending trendline and the 200-day Simple Moving Average (SMA). In case bulls are able to break above it, the 100-day SMA at $78.45 could trigger a rejection.
On the downside, the low from August 5 at $71.17 emerges as the first support. Under $70.00, the $68.00 big figure is the first level to watch followed by $67.11, which is the lowest point from the triple bottom seen back in June 2023.
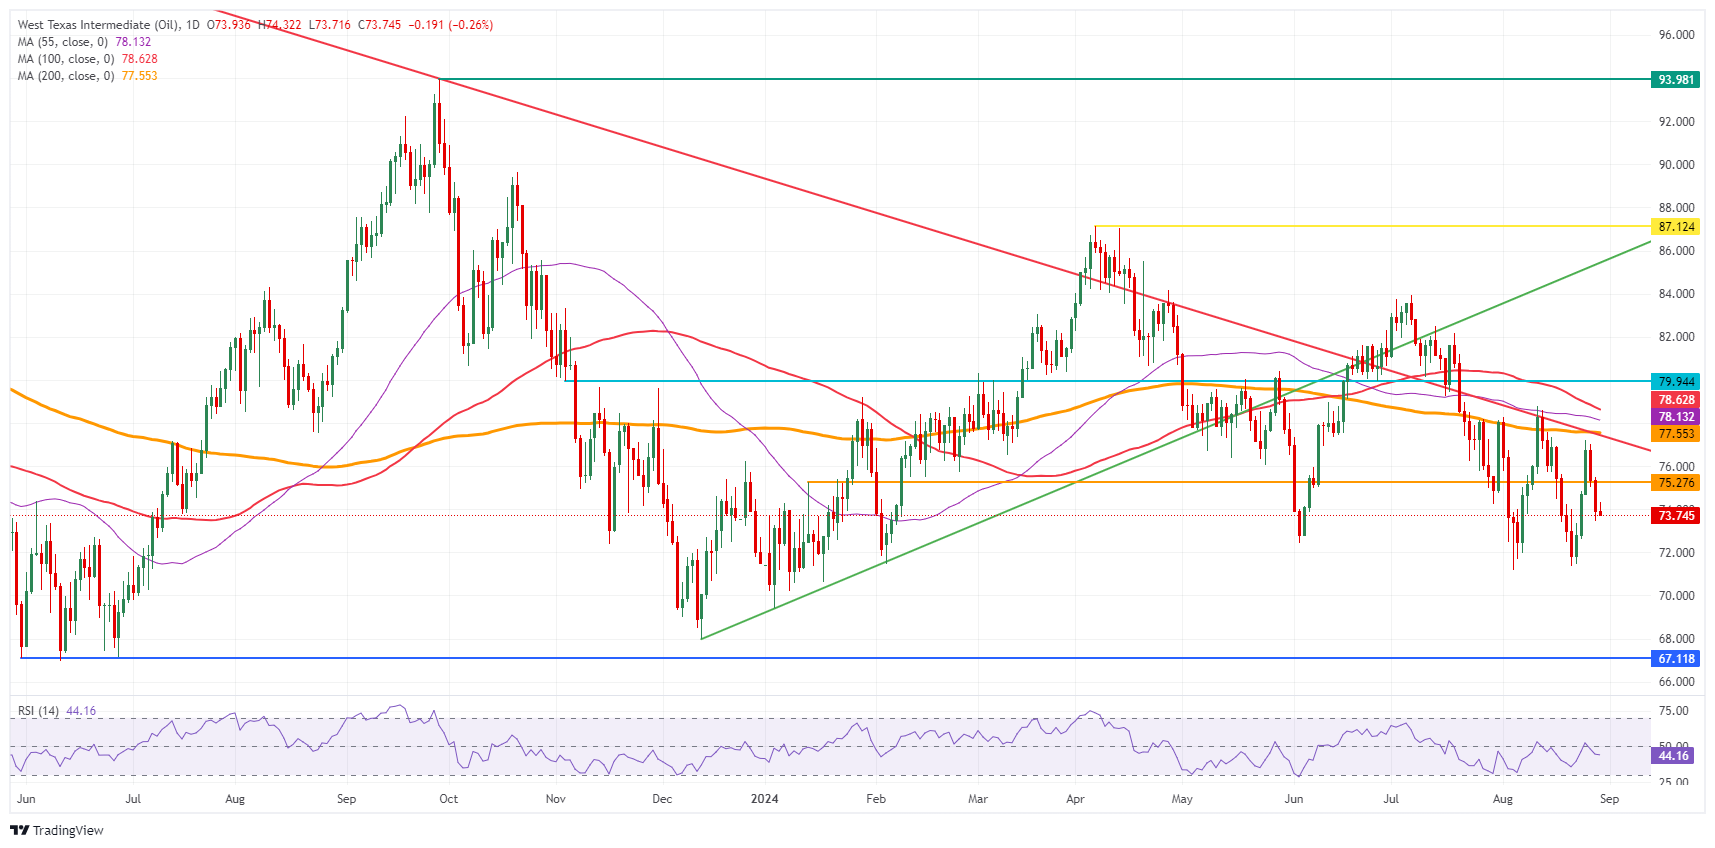
US WTI Crude Oil: Daily Chart
WTI Oil FAQs
WTI Oil is a type of Crude Oil sold on international markets. The WTI stands for West Texas Intermediate, one of three major types including Brent and Dubai Crude. WTI is also referred to as “light” and “sweet” because of its relatively low gravity and sulfur content respectively. It is considered a high quality Oil that is easily refined. It is sourced in the United States and distributed via the Cushing hub, which is considered “The Pipeline Crossroads of the World”. It is a benchmark for the Oil market and WTI price is frequently quoted in the media.
Like all assets, supply and demand are the key drivers of WTI Oil price. As such, global growth can be a driver of increased demand and vice versa for weak global growth. Political instability, wars, and sanctions can disrupt supply and impact prices. The decisions of OPEC, a group of major Oil-producing countries, is another key driver of price. The value of the US Dollar influences the price of WTI Crude Oil, since Oil is predominantly traded in US Dollars, thus a weaker US Dollar can make Oil more affordable and vice versa.
The weekly Oil inventory reports published by the American Petroleum Institute (API) and the Energy Information Agency (EIA) impact the price of WTI Oil. Changes in inventories reflect fluctuating supply and demand. If the data shows a drop in inventories it can indicate increased demand, pushing up Oil price. Higher inventories can reflect increased supply, pushing down prices. API’s report is published every Tuesday and EIA’s the day after. Their results are usually similar, falling within 1% of each other 75% of the time. The EIA data is considered more reliable, since it is a government agency.
OPEC (Organization of the Petroleum Exporting Countries) is a group of 13 Oil-producing nations who collectively decide production quotas for member countries at twice-yearly meetings. Their decisions often impact WTI Oil prices. When OPEC decides to lower quotas, it can tighten supply, pushing up Oil prices. When OPEC increases production, it has the opposite effect. OPEC+ refers to an expanded group that includes ten extra non-OPEC members, the most notable of which is Russia.
Sweden released GDP figures this morning, which confirmed expectations for a QoQ contraction in the second quarter. The print was -0.3% QoQ above the consensus -0.8%. A grim growth story in Sweden has been one of the key drivers of the Riksbank’s dovishness. When adding a loosening jobs market and disinflation, there are few doubts that more easing is on the way, ING’s FX strategist Francesco Pesole notes.
EUR/SEK trades close to the 11.30 target
“The question is, at this point, whether the Riksbank will cut two or three more times this year. Markets are pricing in easing in excess of 80bp over the last three meetings of 2024, which suggests there is some moderate speculation for a 50bp move too. That appears too dovish to us, considering Swedish rates have already been trimmed to 3.5%, and a potential slower-than-expected easing by the ECB may be a concern for the Riksbank.”
“Some hawkish repricing can help SEK in September, but the krona has been primarily responsive to external inputs, and conditions may not turn much more accommodative for high-beta currencies than they are now.”
“Markets may price in more Fed easing if they see higher US recession risks, which may, however, lead to more stock market instability and ultimately hit a highly risk-sensitive currency like SEK. Now that we are close to the 11.30 target we had set about a month ago for EUR/SEK, we think some short-term stabilisation looks more likely than another big directional move.”
The Bank of England's broad Pound Sterling (GBP) index is back to challenge the July high at around 84.65, ING’s FX strategist Chris Turner notes.
1.3300/3330 us the next short-term target for GBP/USD
“These mark the highest levels since the Brexit vote in June 2016. Driving the GBP higher has been the malaise both in the eurozone and now emerging in the US, too, combined with the BoE's reticence to signal a full-blooded easing cycle. Warmer relations with Europe might have helped, but this is harder to quantify.”
“Very much in focus now is UK Chancellor Reeves' first budget at the end of October. There is much speculation over £20bn of tax increases coming through – worth around 0.7% of GDP. However, this may not represent fiscal tightening since she will be using the money to address the real-terms cut in public spending under the previous Conservative government. Public sector pay rises alone may be worth as much as £10bn.”
“For the Pound Sterling (GBP), that may mean this is a fiscally neutral budget and one that could see the pound continue to outperform – especially against the US Dollar (USD). 1.3300/3330 may be the next short-term target for GBP/USD, with support being found at 1.3100/3120.”
- The Mexican Peso trades mildly higher as risk appetite improves on Thursday.
- Disappointing Nvidia earnings had weighed on equity markets during the Asian session, but they are recovering.
- Mexico’s high interest rates still attract carry-trade inflows, despite the Peso weakening.
The Mexican Peso (MXN) trades marginally higher in its key pairs on Thursday as market sentiment improves heading into the European session, benefiting the risk-on MXN. European equities are trading modestly higher after a shaky start as investors get over the bitter aftertaste of disappointing Nvidia earnings.
The Mexican Peso is rising the most against the Euro (EUR) after the release of preliminary Spanish Consumer Price Index (CPI) data for August revealed a sharper-than-expected slowdown of inflation in Spain, one of the member states with higher levels of inflation in the Eurozone. Several key German states also published inflation data ahead of the release for the whole of Germany later today, signaling that price pressures are abating as well in the Eurozone’s largest economy.
The data suggests the European Central Bank (ECB) is more likely to continue cutting interest rates, which is negative for the Euro as it would lower foreign capital inflows.
At the time of writing, one US Dollar (USD) buys 19.59 Mexican Pesos, EUR/MXN trades at 21.73, and GBP/MXN at 25.84.
Mexican Peso upside limited by political risk
The Mexican Peso may see upside potential limited by political risk factors. The government’s proposed reform to make judges and magistrates elected by popular vote has been criticized as undermining justice, democracy and investor confidence in Mexico.
Disagreement over the reforms has led to public demonstrations in Mexico City by members of the judiciary. The US ambassador to Mexico, Ken Salazar, said the “popular direct election of judges is a major risk to the functioning of Mexico's democracy.”
The Mexican government chose to “pause” diplomatic relations with both the US and Canada on Tuesday due to disagreements over the reforms. If the stand-off escalates, there is a chance it could negatively impact free trade between the three countries, with negative implications for the Mexican Peso.
At the same time, the Peso could benefit from an escalating trade war between North America and China. News on Tuesday revealed that Canada has decided to increase tariffs on Chinese electric vehicle (EV) and steel imports, by 100% and 25%, respectively.
The decision could benefit Mexico, however, because of its existing role as an intermediary manufacturer for Chinese goods entering North America.
Mexican Peso gains back wind from interest-rate differentials
The Peso is further supported by the high level of interest rates set by the Bank of Mexico (Banxico) at 10.75%, compared to counterparts. The interest-rate differential has gained particular importance as expectations increase that the (US) Federal Reserve (Fed) will make deep cuts to interest rates in the US.
According to data from the Chicago Board of Exchange (CBOT), for example, the market is pricing in 1.00% of cuts by the Fed before year-end. This would bring its key fed funds rate down from 5.25%-5.50% to 4.25%-4.50%, further widening the differential with Mexico. That said, the Banxico is also expected to cut interest rates, though according to advisory service Capital Economics, not as steeply as the Fed (0.50% by year-end instead of 1.00%).
Overall, the differential continues to favor foreign capital inflows into the Peso, although the Peso’s recent weakness has reduced the popularity of the MXN carry trade.
Technical Analysis: USD/MXN
USD/MXN is pulling back as it moves higher within a rising channel. It is in an established uptrend which given “the trend is your friend” favors longs over shorts.
USD/MXN 4-hour Chart
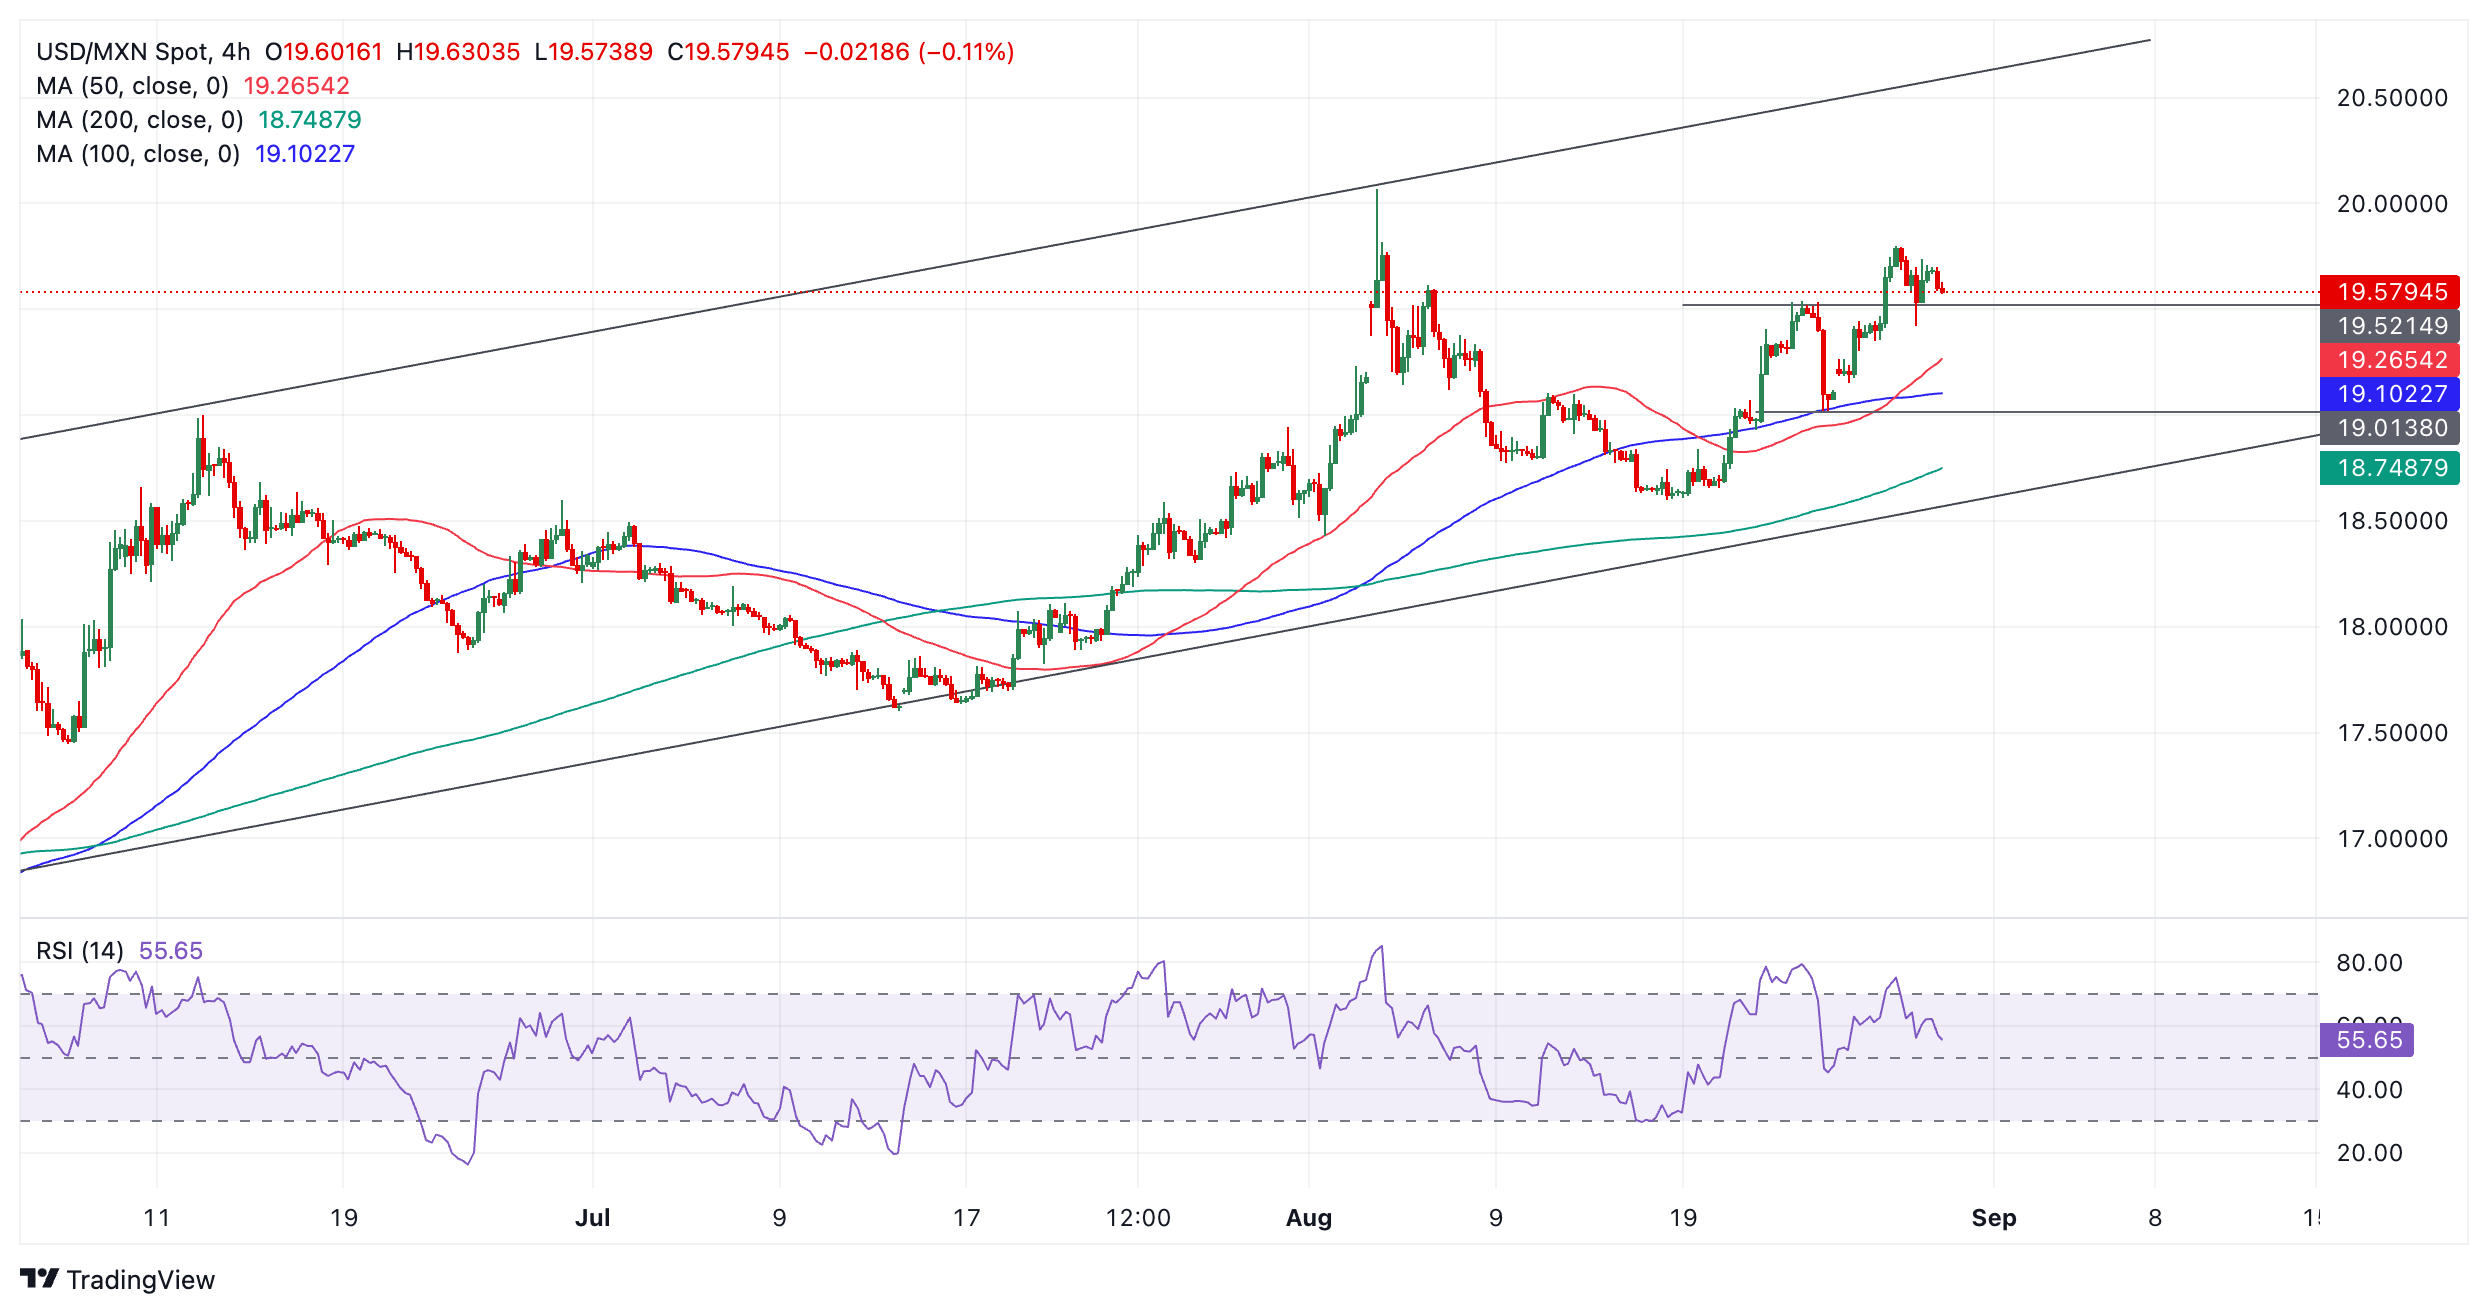
Of late the pair has pulled back down to support at circa 19.52 (August 22 high) and is churning in the 19.50s. Given the dominant uptrend, however, the odds favor an eventual recovery and resumption higher.
A break above 19.80 would confirm more gains towards the upper channel line in the 20.60s.
Mexican Peso FAQs
The Mexican Peso (MXN) is the most traded currency among its Latin American peers. Its value is broadly determined by the performance of the Mexican economy, the country’s central bank’s policy, the amount of foreign investment in the country and even the levels of remittances sent by Mexicans who live abroad, particularly in the United States. Geopolitical trends can also move MXN: for example, the process of nearshoring – or the decision by some firms to relocate manufacturing capacity and supply chains closer to their home countries – is also seen as a catalyst for the Mexican currency as the country is considered a key manufacturing hub in the American continent. Another catalyst for MXN is Oil prices as Mexico is a key exporter of the commodity.
The main objective of Mexico’s central bank, also known as Banxico, is to maintain inflation at low and stable levels (at or close to its target of 3%, the midpoint in a tolerance band of between 2% and 4%). To this end, the bank sets an appropriate level of interest rates. When inflation is too high, Banxico will attempt to tame it by raising interest rates, making it more expensive for households and businesses to borrow money, thus cooling demand and the overall economy. Higher interest rates are generally positive for the Mexican Peso (MXN) as they lead to higher yields, making the country a more attractive place for investors. On the contrary, lower interest rates tend to weaken MXN.
Macroeconomic data releases are key to assess the state of the economy and can have an impact on the Mexican Peso (MXN) valuation. A strong Mexican economy, based on high economic growth, low unemployment and high confidence is good for MXN. Not only does it attract more foreign investment but it may encourage the Bank of Mexico (Banxico) to increase interest rates, particularly if this strength comes together with elevated inflation. However, if economic data is weak, MXN is likely to depreciate.
As an emerging-market currency, the Mexican Peso (MXN) tends to strive during risk-on periods, or when investors perceive that broader market risks are low and thus are eager to engage with investments that carry a higher risk. Conversely, MXN tends to weaken at times of market turbulence or economic uncertainty as investors tend to sell higher-risk assets and flee to the more-stable safe havens.
The US Dollar (USD) is likely to trade in a range, probably between 143.80 and 145.20. In the longer run, USD remains under pressure; increase in momentum has increased the chance of it reaching 141.66, UOB Group analysts Quek Ser Leang and Lee Sue Ann note.
USD set to breach above 145.20
24-HOUR VIEW: “We expected USD to trade with a downward bias yesterday. However, instead of declining, USD rebounded from 143.67 to 145.04 and then pulled back to close at 144.57 (+0.43%). We are not able to glean much of the price action. Today, we expect USD to trade in a range, probably between 143.80 and 145.20.”
1-3 WEEKS VIEW: “In our most recent narrative was from Monday (26 Aug, spot at 143.85), we indicated that USD ‘remains under pressure.’ We also indicated that ‘the increase in momentum from last Friday has increased the chance of it reaching 141.66, the low registered early this month.’ Over the past couple of days, USD has not been able to make much headway on the downside. However, we will continue to hold the same view provided that 145.70 (no change in ‘strong resistance’ level) is intact.”
EUR/CHF is staying very soft and USD/CHF is continuing to plumb new lows, ING’s FX strategist Chris Turner notes.
SNB to intervenes in both USD/CHF and EUR/CHF
“We are not far away from the December 2023 low at 0.8333. We have no evidence for this, but we suspect that the Swiss National Bank (SNB) intervenes in both USD/CHF as well as EUR/CHF.”
“Watch out for any spikes in USD/CHF should it start to trade under 0.84.”
- EUR/USD dives below 1.1100 as lower inflation in Spain and in six key German states prompts expectations of another ECB rate cut.
- Eurozone and German inflation are estimated to have slowed further in August.
- The US core PCE inflation data could influence market expectations for Fed rate-cut size in September.
EUR/USD faces a sharp sell-off, sliding below the round-level support of 1.100 in Thursday’s European session. The major currency pair extends its correction after some preliminary inflation data from Spain and six important German states showed that price pressures continued to abate in August, increasing bets of an upcoming interest-rate cut by the European Central Bank (ECB). Meanwhile, the US Dollar increased further above Wednesday’s high, with the US Dollar Index (DXY) – which tracks the Greenback’s value against six major currencies – rising to near 101.30.
The sharp recovery in the US Dollar suggests that investors are turning risk-averse with United States (US) Personal Consumption Expenditure Price Index (PCE) data for July on the horizon. The underlying inflation data is expected to influence market speculation for the likely size of Federal Reserve (Fed) interest-rate cuts in September.
The PCE inflation report is expected to show that the annual core inflation rose by 2.7% in July, faster than the 2.6% seen in June. Month-over-month, core PCE is estimated to have grown steadily by 0.2%.
In Thursday’s session, investors will keenly focus on the revised estimates of Q2 Gross Domestic Product (GDP) and the Initial Jobless Claims data for the week ending August 23 at 12:30 GMT. Q2 GDP revised estimated are unlikely to impact the US Dollar unless there comes a substantial change. In Europe, the preliminary August inflation data for overall Germany will be published at 12:00 GMT.
Investors will also focus on the Jobless Claims data as the Fed is now vigilant to downside risks to the labor market.. Fed Chair Jerome Powell vowed to support deteriorating labor market strength in his speech at the Jackson Hole (JH) Symposium.
Daily digest market movers: EUR/USD weakens on Euro’s broader underperformance
- EUR/USD extends its downside below the crucial support of 1.1100 in European trading hours. The shared currency pair weakens on the Euro’s (EUR) underperformance against its major peers as traders seem to be certain that the European Central Bank (ECB) will cut interest rates in September.
- A sharp slowdown in price pressures in Spain and six important German states has boosted ECB September rate cut bets. The Annual Harmonized Index of Consumer Prices (HICP) in Spain came in at 2.4%, the slowest in year-to-date (YTD).
- Firm speculation for ECB September rate cuts was already prompted by consistently easing Eurozone price pressures and its poor economic outlook, as suggested by the flash HCOB PMI report for August. However, the Eurozone Economic Sentiment Indicator, Industry Confidence, and Services Sentiment have come in better than expected in August. On the contrary, Consumer Confidence deteriorated to -13.5 from the estimates and the former release of -13.4.
- The ECB is also expected to deliver an additional rate cut somewhere in the last quarter of the year. A few ECB policymakers appear to be comfortable with the central bank reducing its key borrowing rates further this year.
- Dutch policymaker Klaas Knot said to a conference panel on Tuesday that "as long as our disinflation path still converges to a return to 2% inflation at or before the end of 2025, then I'm comfortable with gradually taking our foot off the brake." When asked about September rate cut expectations, Knot said: "I will have to wait until I have the full data and information set going into that meeting to decide my position on whether September is appropriate,” adding that "I would have to do so again in October, December and whenever," reported Reuters.
- The German and Eurozone flash HICP data for August will be published at 12:00 GMT later today and on Friday, respectively. German annual HICP is estimated to have grown at a slower pace of 2.3% from 2.6% in July. Month-over-month, the HICP is forecasted to have remained flat after rising 0.5% in July.
Euro PRICE Today
The table below shows the percentage change of Euro (EUR) against listed major currencies today. Euro was the strongest against the Swiss Franc.
| USD | EUR | GBP | JPY | CAD | AUD | NZD | CHF | |
|---|---|---|---|---|---|---|---|---|
| USD | 0.23% | -0.04% | -0.09% | -0.18% | -0.52% | -0.56% | 0.09% | |
| EUR | -0.23% | -0.29% | -0.30% | -0.42% | -0.76% | -0.80% | -0.14% | |
| GBP | 0.04% | 0.29% | -0.02% | -0.14% | -0.47% | -0.50% | 0.19% | |
| JPY | 0.09% | 0.30% | 0.02% | -0.08% | -0.44% | -0.50% | 0.21% | |
| CAD | 0.18% | 0.42% | 0.14% | 0.08% | -0.33% | -0.38% | 0.32% | |
| AUD | 0.52% | 0.76% | 0.47% | 0.44% | 0.33% | -0.02% | 0.66% | |
| NZD | 0.56% | 0.80% | 0.50% | 0.50% | 0.38% | 0.02% | 0.69% | |
| CHF | -0.09% | 0.14% | -0.19% | -0.21% | -0.32% | -0.66% | -0.69% |
The heat map shows percentage changes of major currencies against each other. The base currency is picked from the left column, while the quote currency is picked from the top row. For example, if you pick the Euro from the left column and move along the horizontal line to the US Dollar, the percentage change displayed in the box will represent EUR (base)/USD (quote).
Technical Analysis: EUR/USD dips below 1.1100
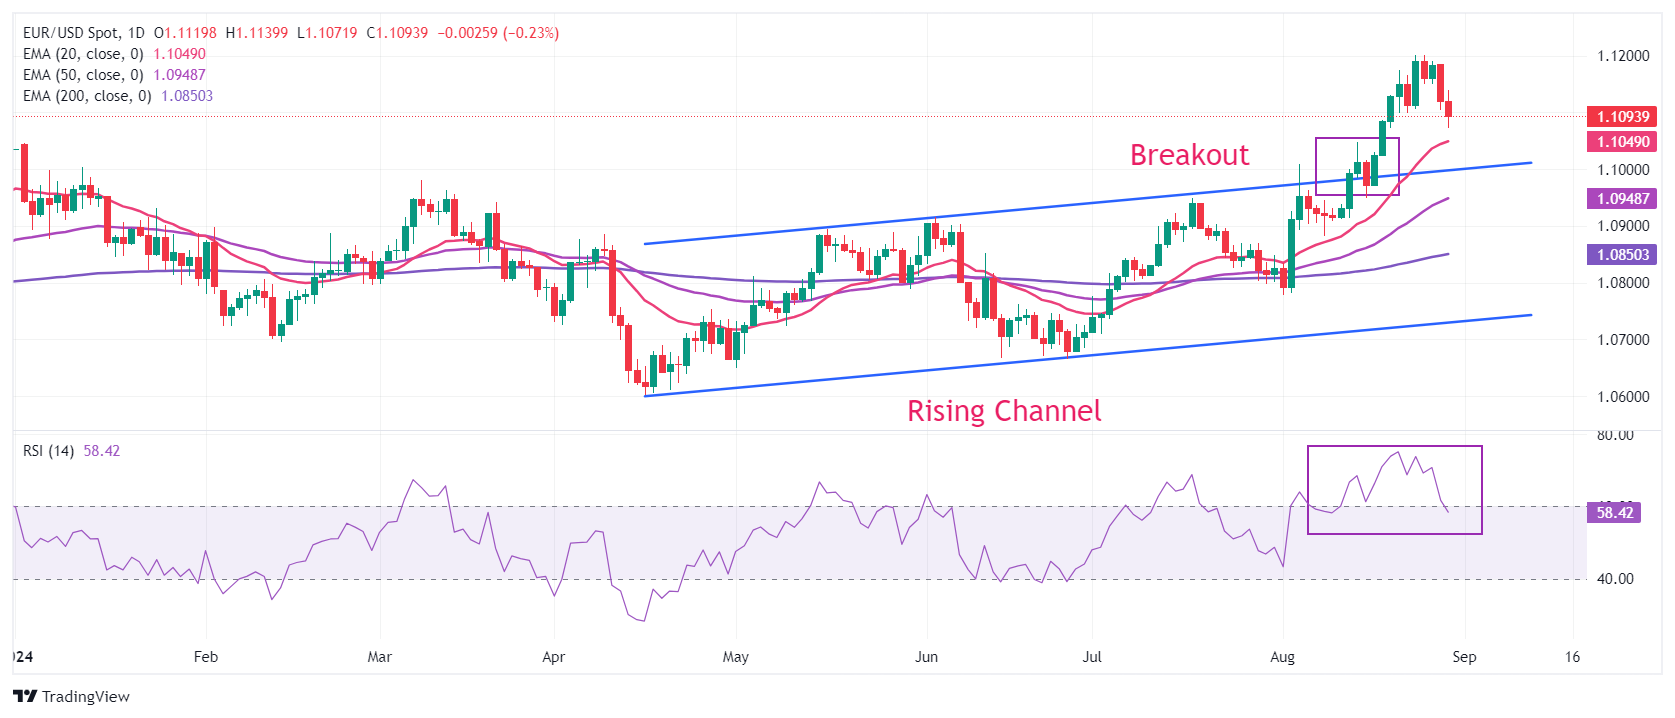
EUR/USD falls sharply below 1.1100 after failing to extend its upside above the crucial resistance of 1.1200. The near-term outlook of the major currency pair is still firm as all short-to-long-term Exponential Moving Averages (EMAs) are sloping higher.
Earlier, the major currency pair strengthened after breaking above the Rising Channel formation on a daily timeframe.
The 14-day Relative Strength Index (RSI) has declined below 60.00 after turning overbought near 75.00.
On the upside, the recent high of 1.1200 and the July 2023 high at 1.1275 will be the next stop for the Euro bulls. The downside is expected to remain cushioned near the psychological support of 1.1000.
Euro FAQs
The Euro is the currency for the 20 European Union countries that belong to the Eurozone. It is the second most heavily traded currency in the world behind the US Dollar. In 2022, it accounted for 31% of all foreign exchange transactions, with an average daily turnover of over $2.2 trillion a day. EUR/USD is the most heavily traded currency pair in the world, accounting for an estimated 30% off all transactions, followed by EUR/JPY (4%), EUR/GBP (3%) and EUR/AUD (2%).
The European Central Bank (ECB) in Frankfurt, Germany, is the reserve bank for the Eurozone. The ECB sets interest rates and manages monetary policy. The ECB’s primary mandate is to maintain price stability, which means either controlling inflation or stimulating growth. Its primary tool is the raising or lowering of interest rates. Relatively high interest rates – or the expectation of higher rates – will usually benefit the Euro and vice versa. The ECB Governing Council makes monetary policy decisions at meetings held eight times a year. Decisions are made by heads of the Eurozone national banks and six permanent members, including the President of the ECB, Christine Lagarde.
Eurozone inflation data, measured by the Harmonized Index of Consumer Prices (HICP), is an important econometric for the Euro. If inflation rises more than expected, especially if above the ECB’s 2% target, it obliges the ECB to raise interest rates to bring it back under control. Relatively high interest rates compared to its counterparts will usually benefit the Euro, as it makes the region more attractive as a place for global investors to park their money.
Data releases gauge the health of the economy and can impact on the Euro. Indicators such as GDP, Manufacturing and Services PMIs, employment, and consumer sentiment surveys can all influence the direction of the single currency. A strong economy is good for the Euro. Not only does it attract more foreign investment but it may encourage the ECB to put up interest rates, which will directly strengthen the Euro. Otherwise, if economic data is weak, the Euro is likely to fall. Economic data for the four largest economies in the euro area (Germany, France, Italy and Spain) are especially significant, as they account for 75% of the Eurozone’s economy.
Another significant data release for the Euro is the Trade Balance. This indicator measures the difference between what a country earns from its exports and what it spends on imports over a given period. If a country produces highly sought after exports then its currency will gain in value purely from the extra demand created from foreign buyers seeking to purchase these goods. Therefore, a positive net Trade Balance strengthens a currency and vice versa for a negative balance.
New Zealand Dollar (NZD) is expected to continue to advance; it remains to be seen if the y-t-d high of 0.6320 is within reach, UOB Group analysts Quek Ser Leang and Lee Sue Ann note.
NZD targets 0.6320
24-HOUR VIEW: “After NZD rose two days ago, we indicated yesterday that ‘despite the relatively sharp advance, upward momentum has not increased much.’ We held the view that ‘provided that 0.6215 is not breached, NZD could test 0.6265 before the advance might pause.’ NZD subsequently rose to 0.6254, closing at 0.6246 (-0.11%). The underlying tone still seems firm, and we continue to see chance for NZD to test 0.6265. A sustained rise above this level appears unlikely. Support levels are at 0.6235 and 0.6220.”
1-3 WEEKS VIEW: “Two days ago (26 Aug, spot at 0.6230), we highlighted that while we continue to expect NZD to advance, conditions are severely overbought, and it remains to be seen if the year-to-date high of 0.6320 is within reach. There is no change in our view. On the downside, should NZD break below 0.6180 (no change in ‘strong support’ level), it would indicate that NZD is not strengthening further.”
The People’s Bank of China, the Chinese central bank, said in a statement released on Thursday that they will stick with a supportive monetary stance.”
Additional takeaways
Will step up counter-cyclical adjustments.
Will strengthen financial support to the real economy.
Will study new policy measures, strengthen coordination and cooperation of macro policies.
Will support the consolidation and enhancement of the positive momentum of economic recovery.
Following his meeting with US National Security Adviser Jake Sullivan in Beijing on Thursday, China’s President Xi Jinping said that “China is committed to a stable relationship based on win-win cooperation.”
Additional quotes
In this changing and turbulent world countries need solidarity and coordination, not exclusion or regress.
In my statements on various occasions and my meetings with successive U.S. presidents, I have always expressed this view.
We hope that the US will work in the same direction as China.
Hope US will see Chinese development as 'possibility not a challenge' and work to get along.
President Biden is committed to managing this relationship and to make sure competition does not lead to conflict.
We are committed to maintaining high-level diplomacy.
Hope US will move in the same direction as China, look at China and its development in a positive and rational manner.
As two major countries, China and the US should be responsible to history, people, and the world.
China and US should become a source of stability for world peace and a propeller for common development.
Hope China and US can regard each other's development as an opportunity rather than a challenge.
China's commitment to the stable, sound, and sustainable development of China-US relations remains unchanged.
Market reaction
At the time of writing, AUD/USD stays strongly bid near 0.6825, up 0.53% on the day.
Australian Dollar FAQs
One of the most significant factors for the Australian Dollar (AUD) is the level of interest rates set by the Reserve Bank of Australia (RBA). Because Australia is a resource-rich country another key driver is the price of its biggest export, Iron Ore. The health of the Chinese economy, its largest trading partner, is a factor, as well as inflation in Australia, its growth rate and Trade Balance. Market sentiment – whether investors are taking on more risky assets (risk-on) or seeking safe-havens (risk-off) – is also a factor, with risk-on positive for AUD.
The Reserve Bank of Australia (RBA) influences the Australian Dollar (AUD) by setting the level of interest rates that Australian banks can lend to each other. This influences the level of interest rates in the economy as a whole. The main goal of the RBA is to maintain a stable inflation rate of 2-3% by adjusting interest rates up or down. Relatively high interest rates compared to other major central banks support the AUD, and the opposite for relatively low. The RBA can also use quantitative easing and tightening to influence credit conditions, with the former AUD-negative and the latter AUD-positive.
China is Australia’s largest trading partner so the health of the Chinese economy is a major influence on the value of the Australian Dollar (AUD). When the Chinese economy is doing well it purchases more raw materials, goods and services from Australia, lifting demand for the AUD, and pushing up its value. The opposite is the case when the Chinese economy is not growing as fast as expected. Positive or negative surprises in Chinese growth data, therefore, often have a direct impact on the Australian Dollar and its pairs.
Iron Ore is Australia’s largest export, accounting for $118 billion a year according to data from 2021, with China as its primary destination. The price of Iron Ore, therefore, can be a driver of the Australian Dollar. Generally, if the price of Iron Ore rises, AUD also goes up, as aggregate demand for the currency increases. The opposite is the case if the price of Iron Ore falls. Higher Iron Ore prices also tend to result in a greater likelihood of a positive Trade Balance for Australia, which is also positive of the AUD.
The Trade Balance, which is the difference between what a country earns from its exports versus what it pays for its imports, is another factor that can influence the value of the Australian Dollar. If Australia produces highly sought after exports, then its currency will gain in value purely from the surplus demand created from foreign buyers seeking to purchase its exports versus what it spends to purchase imports. Therefore, a positive net Trade Balance strengthens the AUD, with the opposite effect if the Trade Balance is negative.
Silver prices (XAG/USD) rose on Thursday, according to FXStreet data. Silver trades at $29.54 per troy ounce, up 1.37% from the $29.14 it cost on Wednesday.
Silver prices have increased by 24.12% since the beginning of the year.
| Unit measure | Silver Price Today in USD |
|---|---|
| Troy Ounce | 29.54 |
| 1 Gram | 0.95 |
The Gold/Silver ratio, which shows the number of ounces of Silver needed to equal the value of one ounce of Gold, stood at 85.22 on Thursday, down from 85.95 on Wednesday.
Silver FAQs
Silver is a precious metal highly traded among investors. It has been historically used as a store of value and a medium of exchange. Although less popular than Gold, traders may turn to Silver to diversify their investment portfolio, for its intrinsic value or as a potential hedge during high-inflation periods. Investors can buy physical Silver, in coins or in bars, or trade it through vehicles such as Exchange Traded Funds, which track its price on international markets.
Silver prices can move due to a wide range of factors. Geopolitical instability or fears of a deep recession can make Silver price escalate due to its safe-haven status, although to a lesser extent than Gold's. As a yieldless asset, Silver tends to rise with lower interest rates. Its moves also depend on how the US Dollar (USD) behaves as the asset is priced in dollars (XAG/USD). A strong Dollar tends to keep the price of Silver at bay, whereas a weaker Dollar is likely to propel prices up. Other factors such as investment demand, mining supply – Silver is much more abundant than Gold – and recycling rates can also affect prices.
Silver is widely used in industry, particularly in sectors such as electronics or solar energy, as it has one of the highest electric conductivity of all metals – more than Copper and Gold. A surge in demand can increase prices, while a decline tends to lower them. Dynamics in the US, Chinese and Indian economies can also contribute to price swings: for the US and particularly China, their big industrial sectors use Silver in various processes; in India, consumers’ demand for the precious metal for jewellery also plays a key role in setting prices.
Silver prices tend to follow Gold's moves. When Gold prices rise, Silver typically follows suit, as their status as safe-haven assets is similar. The Gold/Silver ratio, which shows the number of ounces of Silver needed to equal the value of one ounce of Gold, may help to determine the relative valuation between both metals. Some investors may consider a high ratio as an indicator that Silver is undervalued, or Gold is overvalued. On the contrary, a low ratio might suggest that Gold is undervalued relative to Silver.
(An automation tool was used in creating this post.)
The Euro has had a soft week and it is not entirely clear why. The ECB's trade-weighted Euro is off about 0.3% so far this week. Perhaps there is some month-end portfolio rebalancing underway, ING’s FX strategist Chris Turner notes.
Two events to define the EUR move
“Two events are on the eurozone agenda today. The first are the releases of the August flash CPI data for Germany, Spain and Belgium. The Eurozone figure will be released tomorrow. The second event is a speech from ECB Chief Economist Philip Lane (1115CET). Markets currently price 65bp of ECB easing. It seems a little too aggressive to us – yet we doubt ECB's Lane will feel the need to correct that right now.”
“EUR/USD has so far held support at 1.1100. We see a scenario where 1.1080/1100 does hold before EUR/USD moves higher still. That seems unlikely today, but the best chance of that happening is probably a higher-than-expected US jobless claims figure at 1430CET today.”
The Japanese Cabinet Office said in its monthly report on Thursday, the government upgraded its economic assessment for the first time in more than a year.
Key takeaways (via Reuters)
"The Japanese economy is recovering at a moderate pace, although it appears to be still pausing in parts.”
“Consumption is picking up as the impact of shipping stoppage at some automakers is easing.”
“The government also upgraded its assessment on housing construction ‘to almost flat’ from ‘in a weak tone’ for the first time in more than two years, attributing the change to a halt in the decline of owner-occupied house construction.”
“Assessments for the remaining sub-sectors, including exports, remained unchanged.”
Market reaction
The Japanese Yen erases losses against the US Dollar following the upbeat report. At the time of writing, the USD/JPY pair is trading flat on the day at around 144.60.
The Australian Dollar (AUD) is expected to consolidate in a range of 0.6760/0.6810. In the longer run, there has been no further increase in momentum; if AUD breaks below 0.6730, it would mean that 0.6870 is not coming into view, UOB Group analysts Quek Ser Leang and Lee Sue Ann note.
AUD can rise after a sustained breach of 0.6810
24-HOUR VIEW: “Yesterday, we detected ‘a slight increase in upward momentum.’ We indicated that ‘there is scope for AUD to edge higher, but any advance is likely limited to a test of 0.6815.’ Our view was not wrong, as AUD rose to 0.6813, pulling back to close at 0.6785 (-0.13%). AUD has likely entered a consolidation phase. Today, we expect AUD to trade in a range of 0.6760/0.6810.”
1-3 WEEKS VIEW: “Our most recent narrative was from Monday (26 Aug, spot at 0.6790), wherein ‘while the outsized advance from last Friday suggests further AUD strength, given the overbought conditions, it remains to be seen if 0.6870 is within reach in the next 1 to 2 weeks.’ Yesterday, AUD rose to 0.6813, then pulled back. There has been no further increase in momentum, and if AUD breaks below 0.6730 (no change in ‘strong support’ level) it would mean that 0.6870 is not coming into view.”
There is quite a popular view out there that with 100bp of Fed cuts priced by the end of this year and a terminal rate already priced at 3.00%, the dollar does not need to fall much further. Equally, however, we do not see the need for the dollar to rally too much either. And for the time being we are treating this week's dollar price action as bearish consolidation after the relatively sharp 5% fall since the start of July, ING’s FX strategist Chris Turner notes.
Dollar’s bearish holding pattern continues
“What gives us some comfort that this is a broad USD decline is the fact that the Asian FX laggards - including the Korean won - are all participating in the move. Even the Korean options market is showing the one-month risk reversal in favour of Korean won call options - something that rarely has been seen since 2007. Whether this represents investors rebalancing underweight Asian portfolios or Asian exporters catching up on some overdue dollar hedging remains to be seen.”
“As we have discussed recently, we will probably need to get some more downside surprises on US activity data to get the dollar bear trend moving again. That may not be the case where the calendar only shows revisions to second-quarter GDP data and the weekly initial claims. The latter seems resolutely stuck near the 235,000 area as broad job lay-offs are yet to emerge.”
“Yet these should rise at some point and Chair Powell's speech last Friday did sound a little nervous as to the speed with which the labour market was deteriorating. Expect DXY to stay relatively range-bound, and only a move above the 101.60/65 area would suggest we are seeing something more than bearish consolidation.”
The Pound Sterling (GBP) could weaken but does not appear to have enough momentum to break the strong support at 1.3145. In the longer run, rapid slowdown in momentum suggests the likelihood of GBP rising to 1.3320 has diminished, UOB Group analysts Quek Ser Leang and Lee Sue Ann note.
GBP may test 1.3145 near term
24-HOUR VIEW: “We did not anticipate GBP to tumble yesterday, as it fell by 0.53% (1.3191). There has been an increase in momentum, but it does not appear to be enough for GBP to break the strong support at 1.3145 (there is another support at 1.3165). Resistance is at 1.3220; a breach of 1.3245 would indicate that GBP is not weakening further.”
1-3 WEEKS VIEW: “After GBP soared last Friday, we indicated on Monday (26 Aug, spot at 1.3215) that ‘the sharp and rapid rise is coupled with strong momentum.’ We expected GBP to continue to rise and indicated that ‘the next level to monitor is 1.3320.’ The sharp drop of 0.53% (1.3191) yesterday was surprising. While our ‘strong support’ level at 1.3145 has not been breached yet, the rapid slowdown in momentum suggests the likelihood of GBP rising to 1.3320 has diminished. GBP must break and remain above 1.3250 in the next 1 to 2 days, or a breach of the ‘strong support’ level would not be surprising.”
- Germany’s statistics agency, Destatis, will publish the CPI data on Thursday.
- Headline CPI is set to rise by 2.1% YoY in August.
- The ECB is still far from decided over a move on rates in September.
The European Central Bank (ECB) is scheduled to meet next month for its monetary policy review, making the upcoming Harmonized Index of Consumer Prices (HICP) inflation data from Germany, set to be released on Thursday, particularly significant for its potential impact on the central bank’s policy decisions.
Meanwhile, the Euro (EUR) may relinquish part of its recent strong upward trend, particularly against the US Dollar (USD), if the inflation data from Eurozone economies, especially Germany, indicates a persistent disinflationary trend.
What can we expect from the upcoming German inflation report?
The Federal Statistical Office of Germany (Destatis) will release the official data on Thursday. The annual German Consumer Price Index (CPI) is projected to rise by 2.1% in August, down from the 2.3% increase reported in the previous month. Monthly CPI inflation is expected to show a humble increase of 0.1% during the reported period.
Germany’s annual Harmonized Index of Consumer Prices (HICP), in the meantime, is anticipated to drop to 2.3% in August, down from 2.6% in July. The monthly HICP is likely to come in flat last month, compared to a 0.5% increase in July.
A further cooling of inflation in Europe’s largest economy could suggest softer inflation readings for the entire Eurozone, which will be published on Friday. On this, the headline Eurozone headline CPI is expected to rise by 2.2% in the year to August, a slowdown from the 2.6% increase seen in July, while the core inflation, which strips food and energy costs, is also projected to decrease to 2.8% during the same period, down from a 2.9% uptick in the previous month.
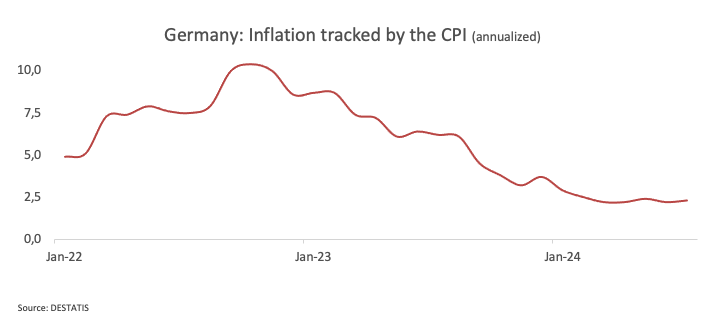
On Tuesday, Dutch policymaker Klaas Knot argued that the European Central Bank (ECB) could gradually lower interest rates as long as inflation is expected to reach its 2% target by the end of 2025 at the latest. He expressed his comfort with gradually easing off the brakes, provided that the disinflation path continues to align with a return to 2% inflation by that time. Knot also mentioned that he would need to wait for the complete set of data and information before deciding his position on whether a rate cut in September would be appropriate.
This cautious tone followed comments from ECB Chief Economist Philip Lane over the weekend, who remarked that it is not yet guaranteed that the central bank will successfully reduce inflation back to its 2% target, indicating that a restrictive monetary policy remains necessary. Lane also emphasized that the monetary stance must remain in restrictive territory for as long as necessary to guide the disinflation process towards a timely return to the target. However, he also cautioned against maintaining high rates for an extended period, as this could result in persistently below-target inflation.
Ahead of the release, TD analysts noted: “Heavy base effects in the energy components will help headline inflation get close to target in the eurozone—in the EZ, the headline rate will likely come down all the way to 2.1% y/y, whereas German HICP inflation should fall to 2.2% y/y. Core inflation should remain sticky though, but remain on a disinflationary path."
When will the HICP inflation report be released, and how could it affect EUR/USD?
The preliminary HICP inflation report for Germany is scheduled for release at 12:00 GMT. In the lead-up to this inflation data release, EUR/USD seems to have lost some upside impulse after hitting fresh 2024 tops just above 1.1200 the figure at the beginning of the week.
Markets have now pencilled in around 100 bps of easing by the US Federal Reserve (Fed) in the latter part of the year, with the kick-start of its easing cycle coming as soon as September. However, it is not that clear that the ECB will follow suit, as per recent prudent comments from rate-setters. So far, the broader debate seems to have shifted towards the health of both economies, where the US clearly exhibits a decent advantage.
If the headline and core inflation data come in hotter than expected, it could bolster expectations for one more ECB rate hike in the next few months, lending support to the European currency and therefore opening the door to the continuation of the ongoing uptrend in EUR/USD. On the flip side, a negative surprise, that is, an acceleration of the disinflationary trend, will carry the potential to remove some strength from the Euro and thus unveil a probable reversal to lower levels.
Pablo Piovano, Senior Analyst at FXStreet.com, notes that the surpass of the 2024 peak at 1.1201 (August 26) could prompt the pair to embark on a probable trip to the 2023 high of 1.1275 (July 18), seconded by the 1.1300 milestone.
In case of bearish attempts, Pablo suggests that there should be initial contention at the weekly low of 1.0881 (August 8), which appears reinforced by the provisional 55-day SMA at 1.0879 and comes before the critical 200-day SMA of 1.0851.
All in all, the pair’s constructive bias is expected to persist as long as it trades above the key 200-day SMA, concludes Pablo.
Economic Indicator
Consumer Price Index (MoM)
The Consumer Price Index (CPI), released by the German statistics office Destatis on a monthly basis, measures the average price change for all goods and services purchased by households for consumption purposes. The CPI is the main indicator to measure inflation and changes in purchasing trends. The MoM figure compares the prices of goods in the reference month to the previous month. A high reading is bullish for the Euro (EUR), while a low reading is bearish.
Read more.Last release: Fri Aug 09, 2024 06:00
Frequency: Monthly
Actual: 0.3%
Consensus: 0.3%
Previous: 0.3%
Inflation FAQs
Inflation measures the rise in the price of a representative basket of goods and services. Headline inflation is usually expressed as a percentage change on a month-on-month (MoM) and year-on-year (YoY) basis. Core inflation excludes more volatile elements such as food and fuel which can fluctuate because of geopolitical and seasonal factors. Core inflation is the figure economists focus on and is the level targeted by central banks, which are mandated to keep inflation at a manageable level, usually around 2%.
The Consumer Price Index (CPI) measures the change in prices of a basket of goods and services over a period of time. It is usually expressed as a percentage change on a month-on-month (MoM) and year-on-year (YoY) basis. Core CPI is the figure targeted by central banks as it excludes volatile food and fuel inputs. When Core CPI rises above 2% it usually results in higher interest rates and vice versa when it falls below 2%. Since higher interest rates are positive for a currency, higher inflation usually results in a stronger currency. The opposite is true when inflation falls.
Although it may seem counter-intuitive, high inflation in a country pushes up the value of its currency and vice versa for lower inflation. This is because the central bank will normally raise interest rates to combat the higher inflation, which attract more global capital inflows from investors looking for a lucrative place to park their money.
Formerly, Gold was the asset investors turned to in times of high inflation because it preserved its value, and whilst investors will often still buy Gold for its safe-haven properties in times of extreme market turmoil, this is not the case most of the time. This is because when inflation is high, central banks will put up interest rates to combat it. Higher interest rates are negative for Gold because they increase the opportunity-cost of holding Gold vis-a-vis an interest-bearing asset or placing the money in a cash deposit account. On the flipside, lower inflation tends to be positive for Gold as it brings interest rates down, making the bright metal a more viable investment alternative.
The Euro (EUR) is expected to trade in a range between 1.1040 and 1.1200, UOB Group analysts Quek Ser Leang and Lee Sue Ann note.
Rangebound in the 1.1040/1.1200 range
24-HOUR VIEW: "Our expectation for EUR to edge above 1.1200 yesterday was incorrect, as it fell sharply, closing lower by 0.57% (1.1120), its biggest 1- day drop in 2-1/2 months. The sharp and swift drop seems to be overextended, but there is room for EUR to decline further to 1.1095 before stabilisation is likely. The major support at 1.1040 is unlikely to come under threat. Resistance is at 1.1145, followed by 1.1165.”
1-3 WEEKS VIEW: “After EUR soared last Friday, we indicated on Monday (26 Aug, spot at 1.1185) that ‘the boost in momentum has increased the likelihood of EUR reaching 1.1275.’ We indicated that we ‘will hold the same view provided that the ‘strong support’ at 1.1105 is not breached.’ Yesterday, EUR fell sharply, tumbling to a low of 1.1104. While our ‘strong support’ level was only slightly breached, upward momentum has largely dissipated. For now, we expect EUR to trade in a range between 1.1040 and 1.1200. Looking ahead, as long as it does not break clearly below 1.1040, there is still chance for EUR to rise above 1.1200 later on.”
- Gold is rising as markets digest disappointing Nvidia earnings, now a macro event given the company’s size and importance.
- A revival of Chinese demand for the precious metal further supports the price.
- Technically, XAU/USD trends sideways, with odds still favoring an eventual break higher given the broader uptrend.
Gold (XAU/USD) trades about half a percent higher in the $2,510s on Thursday, gaining a lift from safe-haven inflows on the back of mildly negative sentiment driven by disappointing Nvidia earnings. Although the tech giant’s Q2 earnings beat estimates, the numbers weren’t enough for markets to justify the stock's exalted valuation. That said, European stocks are recovering after a shaky open and broader market sentiment could be shifting.
Gold gains after report shows revival in China demand
Gold is probably gaining support after data from the World Gold Council (WGC) on Tuesday showed China’s net Gold imports rose by 17% in July, the first month of increases since March. A modest increase in net inflows of 8 metric tons ($403 million) led by North American funds last week, was also noted.
The precious metal may be benefiting from a slide in the US Dollar (USD), to which it is negatively correlated. The US Dollar Index (DXY) is pulling back down on Thursday and trading in the 100.90s, rolling over from a peak of 101.18 reached Wednesday.
Traders are now looking ahead to US Jobless Claims and Gross Domestic Product (GDP) data out on Thursday for more clarity on the projected path of US interest rates. The jobs data could be of particular relevance given the Chairman of the Federal Reserve (Fed) Jerome Powell highlighted risks to the labor market from keeping rates high at his Jackson Hole speech. The GDP data is a revision of the first estimate for Q2 with economists expecting it to remain steady at 2.8%. Negative macro data could spur Gold higher because it will suggest the Fed will need to bring interest rates down more quickly than previously thought. The promise of lower interest rates makes Gold more attractive to investors because it is a non-interest-paying asset.
Although a rate cut from the Fed at their September 18 meeting is already fully priced in by markets, the size of the cut is a matter for speculation. A 0.50% “mega cut” is still a possibility with the probabilities standing at around 34.5%, according to the CME FedWatch tool – little changed from the previous day.
Another barometer of the future course of interest rates, the December 2024 Chicago Board of Trade (CBOT) fed funds future rates contract, is pricing a total of 100 basis points of Fed cuts, or 1.00%, by the end of the year. With only three scheduled Fed meetings remaining on 2024’s calendar, this pricing implies a 0.50% interest-rate cut in at least one of them.
Friday could be a big day for Gold, however, as it is then that the Fed’s preferred gauge of inflation, the Personal Consumption Expenditures (PCE) Price Index, is released. Economists expect the core PCE inflation to rise to 2.7% in July from 2.6% in June YoY – a divergence from the estimate will impact Gold price. Higher inflation will weaken Gold by suggesting the Fed needs to keep interest rates elevated for longer; the opposite would be the case from a lower-than-expected result.
A risk to Gold price is extreme long positioning, according to Daniel Ghali, Senior Commodity Strategist at TD Securities, who claims the long trade is now overcrowded.
“Downside risks are now more potent. The ship is crowded. In fact, it has scarcely been as crowded as it is today. Do you have a slot secured on the lifeboat?” adds the strategist.
In fact, in a follow-up note on Thursday, TD Securities announced they are entering a tactical short position in the commodity, with an entry at $2,533, a target at $2,300, and a stop loss at $2,675.
Technical Analysis: Mini-range between $2,500 and $2,531 extends
Gold (XAU/USD) is consolidating within a mini-range above its prior range. It is now debatable whether the short-term trend is still bullish – it could now be characterized as “sideways”.
Gold’s medium and long-term trends, however, remain bullish, which given “the trend is your friend,” means the odds favor an eventual breakout higher materializing.
XAU/USD 4-hour Chart

The breakout from the prior range (which also resembles an incomplete triangle pattern) that occurred on August 14 generated an upside target at roughly $2,550, calculated by taking the 0.618 Fibonacci ratio of the range’s height and extrapolating it higher. This target is the minimum expectation for the follow-through from a breakout based on principles of technical analysis.
A break above the $2,531 August 20 all-time high would provide confirmation of a continuation higher towards the $2,550 target.
Alternatively, a break back inside the range would negate the upside projected target. Such a move would be confirmed on a daily close below $2,470 (August 22 low). It would change the picture for Gold and suggest the commodity might be starting a short-term downtrend.
Economic Indicator
Initial Jobless Claims
The Initial Jobless Claims released by the US Department of Labor is a measure of the number of people filing first-time claims for state unemployment insurance. A larger-than-expected number indicates weakness in the US labor market, reflects negatively on the US economy, and is negative for the US Dollar (USD). On the other hand, a decreasing number should be taken as bullish for the USD.
Read more.Next release: Thu Aug 29, 2024 12:30
Frequency: Weekly
Consensus: 232K
Previous: 232K
Source: US Department of Labor
Every Thursday, the US Department of Labor publishes the number of previous week’s initial claims for unemployment benefits in the US. Since this reading could be highly volatile, investors may pay closer attention to the four-week average. A downtrend is seen as a sign of an improving labour market and could have a positive impact on the USD’s performance against its rivals and vice versa.
- The Pound Sterling moves higher back above 1.3200 against the US Dollar following Wednesday’s pullback.
- Traders focus on US core PCE inflation data for July, which can influence market speculation about the Fed’s rate cut size.
- Investors see the BoE delivering one more interest rate cut this year.
The Pound Sterling (GBP) rebounds from the key support of 1.3200 against the US Dollar (USD) in Thursday’s European session. The GBP/USD pair rises as the US Dollar (USD) edges lower after bouncing back strongly on Wednesday. The US Dollar Index (DXY), which tracks the Greenback’s value against six major currencies, faces pressure in an attempt to extend its recovery above the immediate resistance of 101.20.
The Greenback is expected to struggle to hold to its recent rebound as the Federal Reserve (Fed) is almost certain to begin reducing interest rates from the September meeting. While traders are split over whether the Fed will start the policy-easing spell with a 25 or a 50-basis-points (bps) cut, the rate reduction is fully priced in.
Firm speculation for the Fed to start cutting interest rates from September is driven by Fed Chair Jerome Powell’s dovish commentary on interest rates at the Jackson Hole (JH) Symposium held last week. Powell said that “the time has come for policy to adjust,” highlighting that the US central bank is now more worried about downside risks to the labor market as inflation looks on track to return to the desired rate of 2%.
Meanwhile, investors await the United States (US) Personal Consumption Expenditure Price Index (PCE) report for July, which will be published on Friday. The PCE report is expected to show that year-on-year core inflation rose at a faster pace of 2.7% from 2.6% in June, with monthly figures growing steadily by 0.2%. The inflation data could significantly influence market speculation for the Federal Reserve’s (Fed) September monetary policy decision.
In Thursday’s session the UK economic calendar is empty, but investors will focus on plenty of US data. One of the key points is the second estimate of the Q2 Gross Domestic Product (GDP) data, which will be published at 12:30 GMT. Economists expect that the data won’t be revised, confirming that the US economy expanded by 2.8% on an annualized basis. The GDP data is unlikely to impact the US Dollar significantly unless there is a significant revision. Apart from that, the weekly US Jobless Claims numbers are also due, which have the potential to move markets in case of a substantial increase.
Daily digest market movers: Pound Sterling outperforms its major peers
- The Pound Sterling performs strongly against its major peers, except Asia-Pacific currencies, in European trading hours. The British currency remains firm as the Bank of England (BoE) is expected to follow a gradual policy-easing cycle, given that the victory over the United Kingdom (UK) inflation isn’t certain.
- BoE Governor Andrew Bailey signaled in his speech at the JH Symposium on Friday that the second-round effects of inflationary pressures would be smaller than expected, but also said that the UK central bank should not rush for more interest rate cuts, Reuters reported. The BoE would "be careful not to cut interest rates too quickly or by too much," Bailey said.
- BoE officials have been reluctant to offer a preset rate-cut path as inflation in the service sector has remained higher due to wage pressures. Going forward, the Pound Sterling will be guided by market expectations for BoE rate cuts for the remainder of the year amid the absence of top-tier economic data this week. Markets expect the BoE to cut its borrowing rates one more time this year.
British Pound PRICE Today
The table below shows the percentage change of British Pound (GBP) against listed major currencies today. British Pound was the strongest against the Euro.
| GBP | EUR | USD | JPY | CAD | AUD | NZD | CHF | |
|---|---|---|---|---|---|---|---|---|
| GBP | 0.27% | 0.10% | 0.15% | -0.02% | -0.19% | -0.39% | 0.25% | |
| EUR | -0.27% | -0.17% | -0.11% | -0.28% | -0.45% | -0.66% | -0.06% | |
| USD | -0.10% | 0.17% | 0.03% | -0.12% | -0.30% | -0.51% | 0.09% | |
| JPY | -0.15% | 0.11% | -0.03% | -0.15% | -0.34% | -0.58% | 0.08% | |
| CAD | 0.02% | 0.28% | 0.12% | 0.15% | -0.17% | -0.39% | 0.25% | |
| AUD | 0.19% | 0.45% | 0.30% | 0.34% | 0.17% | -0.19% | 0.44% | |
| NZD | 0.39% | 0.66% | 0.51% | 0.58% | 0.39% | 0.19% | 0.63% | |
| CHF | -0.25% | 0.06% | -0.09% | -0.08% | -0.25% | -0.44% | -0.63% |
The heat map shows percentage changes of major currencies against each other. The base currency is picked from the left column, while the quote currency is picked from the top row. For example, if you pick the British Pound from the left column and move along the horizontal line to the US Dollar, the percentage change displayed in the box will represent GBP (base)/USD (quote).
Technical Analysis: Pound Sterling finds support near 1.3200
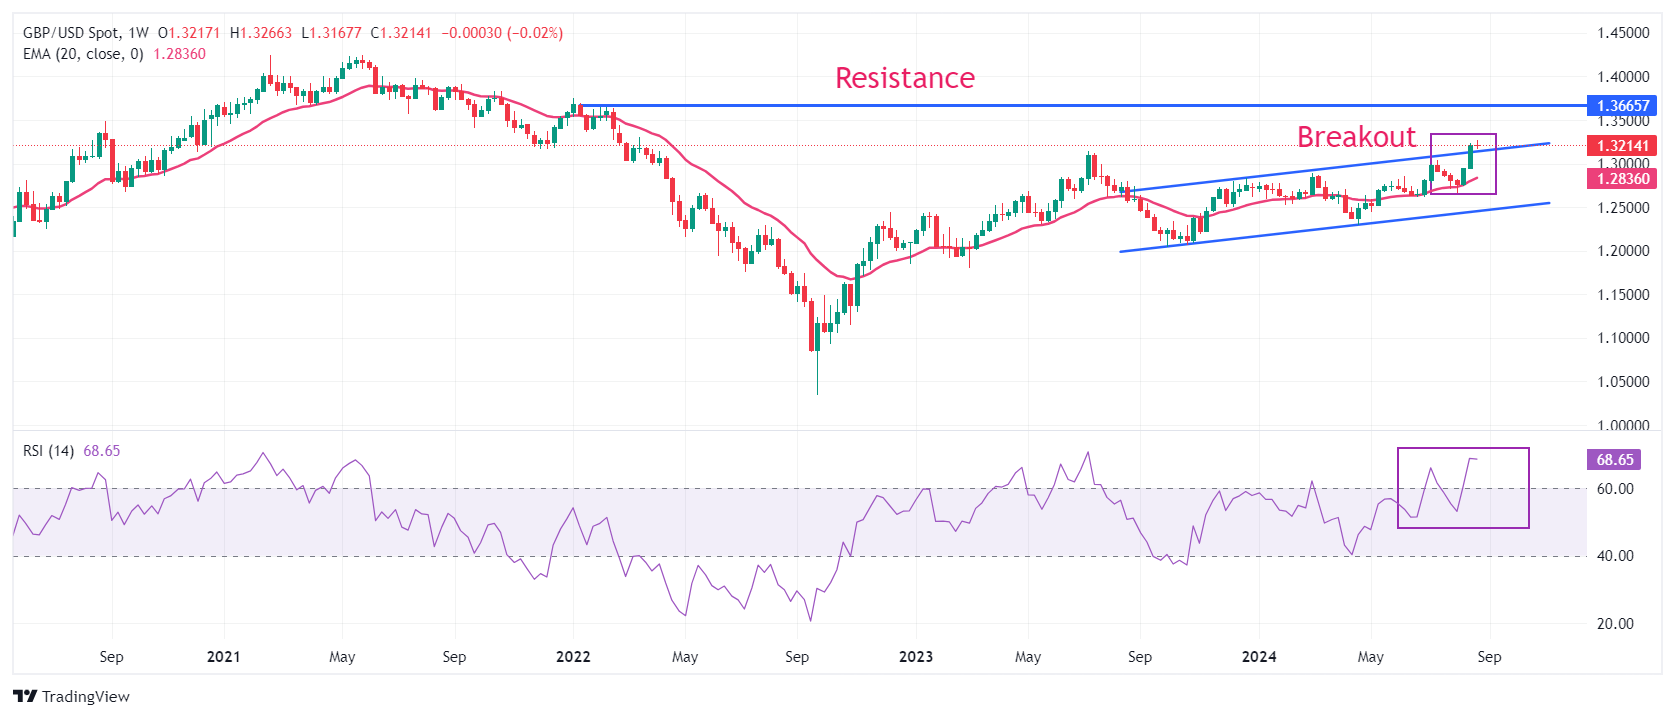
The Pound Sterling rebounds after a mild corrective move to near the round-level support of 1.3200. against the US Dollar. The near-term appeal of the GBP/USD pair remains firm as it holds the breakout of the Rising Channel chart formation on the weekly time frame. If bullish momentum resumes, the Cable is expected to extend its upside towards the psychological resistance of 1.3500 and the February 4, 2022, high of 1.3640 after breaking above a fresh two-and-a-half-year high of 1.3266 against the US Dollar.
The upward-sloping 20-week Exponential Moving Average (EMA) near 1.3000 suggests a strong upside trend.
The 14-period Relative Strength Index (RSI) oscillates in the bullish range of 60.00-80.00, suggesting a strong upside momentum. Still, it has reached overbought levels at around 70.00, increasing the chances of a corrective pullback. On the downside, the psychological level of 1.3000 will be the crucial support for the Pound Sterling bulls.
Pound Sterling FAQs
The Pound Sterling (GBP) is the oldest currency in the world (886 AD) and the official currency of the United Kingdom. It is the fourth most traded unit for foreign exchange (FX) in the world, accounting for 12% of all transactions, averaging $630 billion a day, according to 2022 data. Its key trading pairs are GBP/USD, aka ‘Cable’, which accounts for 11% of FX, GBP/JPY, or the ‘Dragon’ as it is known by traders (3%), and EUR/GBP (2%). The Pound Sterling is issued by the Bank of England (BoE).
The single most important factor influencing the value of the Pound Sterling is monetary policy decided by the Bank of England. The BoE bases its decisions on whether it has achieved its primary goal of “price stability” – a steady inflation rate of around 2%. Its primary tool for achieving this is the adjustment of interest rates. When inflation is too high, the BoE will try to rein it in by raising interest rates, making it more expensive for people and businesses to access credit. This is generally positive for GBP, as higher interest rates make the UK a more attractive place for global investors to park their money. When inflation falls too low it is a sign economic growth is slowing. In this scenario, the BoE will consider lowering interest rates to cheapen credit so businesses will borrow more to invest in growth-generating projects.
Data releases gauge the health of the economy and can impact the value of the Pound Sterling. Indicators such as GDP, Manufacturing and Services PMIs, and employment can all influence the direction of the GBP. A strong economy is good for Sterling. Not only does it attract more foreign investment but it may encourage the BoE to put up interest rates, which will directly strengthen GBP. Otherwise, if economic data is weak, the Pound Sterling is likely to fall.
Another significant data release for the Pound Sterling is the Trade Balance. This indicator measures the difference between what a country earns from its exports and what it spends on imports over a given period. If a country produces highly sought-after exports, its currency will benefit purely from the extra demand created from foreign buyers seeking to purchase these goods. Therefore, a positive net Trade Balance strengthens a currency and vice versa for a negative balance.
- EUR/GBP extends its downside around 0.8415 in Thursday’s early European session, losing 0.20% on the day.
- Rising expectation of additional rate cuts by the ECB weighs on the Euro.
- BoE’s Bailey 'cautiously optimistic' inflationary pressures in the UK are easing, but it’s too early to declare a victory.
- The Eurozone flash HICP inflation data for August will be in the spotlight on Friday.
The EUR/GBP cross trades in negative territory for the seventh consecutive day near 0.8415 during the early European session on Thursday. The higher bets that the European Central Bank (ECB) will cut interest rates again in its September meeting further weigh on the Euro (EUR) against the Pound Sterling (GBP).
ECB Governing Council member Klaas Knot said on Wednesday that he awaited more information before deciding on whether to support an interest rate cut in September. However, markets expect the ECB to lower the borrowing costs next month amid easing price pressures and an uncertain economic outlook.
The flash estimate of the Eurozone Harmonized Index of Consumer Prices (HICP) will be released on Friday. The headline inflation is estimated to ease to 2.2% YoY in August from 2.6% prior, while the core CPI inflation is expected to drop to 2.8% YoY in August from 2.9% in the previous reading. In case of the hotter-than-expected outcome, this might lift the shared currency and cap the downside for EUR/GBP.
On the other hand, stronger than forecast economic data in recent months and optimism about the new Labour government underpin the GBP. The comments from the Bank of England (BoE) Andrew Bailey also support the GBP. Bailey stated that “policy setting will need to remain restrictive for sufficiently long until the risks to inflation remaining sustainably around the 2% target in the medium term have dissipated further. The course will therefore be a steady one.” Economists anticipate one more 25 basis points (bps) rate cut from the BoE this year, according to a Reuters poll.
Pound Sterling FAQs
The Pound Sterling (GBP) is the oldest currency in the world (886 AD) and the official currency of the United Kingdom. It is the fourth most traded unit for foreign exchange (FX) in the world, accounting for 12% of all transactions, averaging $630 billion a day, according to 2022 data. Its key trading pairs are GBP/USD, aka ‘Cable’, which accounts for 11% of FX, GBP/JPY, or the ‘Dragon’ as it is known by traders (3%), and EUR/GBP (2%). The Pound Sterling is issued by the Bank of England (BoE).
The single most important factor influencing the value of the Pound Sterling is monetary policy decided by the Bank of England. The BoE bases its decisions on whether it has achieved its primary goal of “price stability” – a steady inflation rate of around 2%. Its primary tool for achieving this is the adjustment of interest rates. When inflation is too high, the BoE will try to rein it in by raising interest rates, making it more expensive for people and businesses to access credit. This is generally positive for GBP, as higher interest rates make the UK a more attractive place for global investors to park their money. When inflation falls too low it is a sign economic growth is slowing. In this scenario, the BoE will consider lowering interest rates to cheapen credit so businesses will borrow more to invest in growth-generating projects.
Data releases gauge the health of the economy and can impact the value of the Pound Sterling. Indicators such as GDP, Manufacturing and Services PMIs, and employment can all influence the direction of the GBP. A strong economy is good for Sterling. Not only does it attract more foreign investment but it may encourage the BoE to put up interest rates, which will directly strengthen GBP. Otherwise, if economic data is weak, the Pound Sterling is likely to fall.
Another significant data release for the Pound Sterling is the Trade Balance. This indicator measures the difference between what a country earns from its exports and what it spends on imports over a given period. If a country produces highly sought-after exports, its currency will benefit purely from the extra demand created from foreign buyers seeking to purchase these goods. Therefore, a positive net Trade Balance strengthens a currency and vice versa for a negative balance.
FX option expiries for Aug 29 NY cut at 10:00 Eastern Time, via DTCC, can be found below.
EUR/USD: EUR amounts
- 1.1050 438m
- 1.1100 618m
- 1.1160 888m
GBP/USD: GBP amounts
- 1.3050 406m
- 1.3200 562m
USD/JPY: USD amounts
- 143.80 625m
- 144.25 395m
- 145.00 525m
AUD/USD: AUD amounts
- 0.6770 316m
- 0.6840 704m
USD/CAD: USD amounts
- 1.3450 803m
- 1.3480 425m
- 1.3500 1b
- 1.3540 1.7b
Here is what you need to know on Thursday, August 29:
Major currency pairs turn quiet early Thursday as investors move to the sidelines ahead of key macroeconomic data releases. Later in the European session, Germany's Destatis will publish preliminary Consumer Price Index (CPI) data for August and the US Bureau of Economic Analysis will release the second estimate of the annualized Gross Domestic Product (GDP) growth for the second quarter. The US economic docket will also feature weekly Initial Jobless Claims figures and Pending Home Sales data for July.
US Dollar PRICE This week
The table below shows the percentage change of US Dollar (USD) against listed major currencies this week. US Dollar was the strongest against the Euro.
| USD | EUR | GBP | JPY | CAD | AUD | NZD | CHF | |
|---|---|---|---|---|---|---|---|---|
| USD | 0.55% | -0.02% | 0.25% | -0.37% | -0.14% | -0.94% | -0.84% | |
| EUR | -0.55% | -0.62% | -0.29% | -0.91% | -0.78% | -1.46% | -1.36% | |
| GBP | 0.02% | 0.62% | 0.23% | -0.36% | -0.16% | -0.91% | -0.81% | |
| JPY | -0.25% | 0.29% | -0.23% | -0.61% | -0.29% | -0.94% | -0.98% | |
| CAD | 0.37% | 0.91% | 0.36% | 0.61% | 0.24% | -0.51% | -0.47% | |
| AUD | 0.14% | 0.78% | 0.16% | 0.29% | -0.24% | -0.69% | -0.57% | |
| NZD | 0.94% | 1.46% | 0.91% | 0.94% | 0.51% | 0.69% | 0.09% | |
| CHF | 0.84% | 1.36% | 0.81% | 0.98% | 0.47% | 0.57% | -0.09% |
The heat map shows percentage changes of major currencies against each other. The base currency is picked from the left column, while the quote currency is picked from the top row. For example, if you pick the US Dollar from the left column and move along the horizontal line to the Japanese Yen, the percentage change displayed in the box will represent USD (base)/JPY (quote).
The US Dollar (USD) benefited from the cautious market stance on Wednesday and gathered strength against its major rivals. After touching its lowest level in over a year near 100.50 on Tuesday, the US Dollar Index gained nearly 0.5% on Wednesday before going into a consolidation phase at around 101.00. Meanwhile, US stock index futures trade mixed as investors assess chip-giant Nvidia's quarterly earnings report, which showed that the company's revenue hit a record of $30 billion for the three months to July, more than doubling from a year ago.
EUR/USD turned south and came within a few pips of 1.1100 on Wednesday. The pair holds its ground early Thursday but struggles to gather recovery momentum. At the time of press, EUR/USD was trading marginally higher on the day at around 1.1130.
GBP/USD lost its bullish momentum on Wednesday and fell more than 0.5%. The pair stages a rebound in the European morning and trades above 1.3200.
USD/JPY registered small gains on Wednesday but remained within its weekly range. The pair fluctuates in a narrow channel above 144.50 in the early European session. The data from Japan showed earlier in the day that the Consumer Confidence Index held steady at 36.7 in August.
Gold slumped below $2,500 during the American trading hours on Wednesday but managed to close the day above this key level. XAU/USD edges higher toward $2,520 on Thursday.
ANZ Business Confidence Index in New Zealand improved sharply to 50.6 in August from 27.1 in July. Following Wednesday's slight pullback, NZD/USD gathered bullish momentum and was last seen trading at its highest level since early January near 0.6300.
GDP FAQs
A country’s Gross Domestic Product (GDP) measures the rate of growth of its economy over a given period of time, usually a quarter. The most reliable figures are those that compare GDP to the previous quarter e.g Q2 of 2023 vs Q1 of 2023, or to the same period in the previous year, e.g Q2 of 2023 vs Q2 of 2022. Annualized quarterly GDP figures extrapolate the growth rate of the quarter as if it were constant for the rest of the year. These can be misleading, however, if temporary shocks impact growth in one quarter but are unlikely to last all year – such as happened in the first quarter of 2020 at the outbreak of the covid pandemic, when growth plummeted.
A higher GDP result is generally positive for a nation’s currency as it reflects a growing economy, which is more likely to produce goods and services that can be exported, as well as attracting higher foreign investment. By the same token, when GDP falls it is usually negative for the currency. When an economy grows people tend to spend more, which leads to inflation. The country’s central bank then has to put up interest rates to combat the inflation with the side effect of attracting more capital inflows from global investors, thus helping the local currency appreciate.
When an economy grows and GDP is rising, people tend to spend more which leads to inflation. The country’s central bank then has to put up interest rates to combat the inflation. Higher interest rates are negative for Gold because they increase the opportunity-cost of holding Gold versus placing the money in a cash deposit account. Therefore, a higher GDP growth rate is usually a bearish factor for Gold price.
- USD/CHF extends its downside around 0.8405 in Thursday’s early European session.
- Fed’s dovish stance and escalating Middle East geopolitical tensions weigh on the pair.
- The Swiss ZEW Survey Expectations came in at -3.4% in August vs. 9.4% prior.
The USD/CHF pair remains under selling pressure near 0.8405 during the early European trading hours on Thursday. The dovish remarks from US Federal Reserve (Fed) officials continue to undermine the US Dollar (USD).
The Fed Chair Jerome Powell said at the Fed’s annual retreat at Jackson Hole last week that “the time has come” for the US central bank to cut interest rates. According to the CME FedWatch Tool, financial markets are now fully priced in a 25 basis points (bps) rate cut in September, but the chance of a deeper rate cut stands at 36.5%.
Meanwhile, San Francisco Fed president Mary Daly said on Monday that "the direction of change is down, and the time to adjust is now.” Traders widely expect the Fed to move ahead with a rate cut in September, which is likely to drag the Greenback lower in the near term. Minneapolis Fed Neel Kashkari noted it was appropriate to discuss potentially cutting interest rates from as early as September due to a weakening labor market.
Meanwhile, the rising geopolitical tensions in the Middle East and economic uncertainties might boost the safe-haven demand, which benefits the currency like the Swiss Franc (CHF) against the USD. Israel's military launched raids and airstrikes in several parts of the occupied West Bank early Wednesday, killing at least 11 Palestinians in an offensive Israel says is its most expansive in years, per CNN.
Data released by the Centre for European Economic Research showed on Wednesday that Switzerland’s ZEW Survey Expectations came in at -3.4% in August from 9.4% in the previous reading. On Friday, the Swiss KOF Leading Indicator for August will be published. On the US docket, the US GDP Annualized is due on Thursday, which is projected to expand by 2.8% in Q2 in the second estimate.
Swiss Franc FAQs
The Swiss Franc (CHF) is Switzerland’s official currency. It is among the top ten most traded currencies globally, reaching volumes that well exceed the size of the Swiss economy. Its value is determined by the broad market sentiment, the country’s economic health or action taken by the Swiss National Bank (SNB), among other factors. Between 2011 and 2015, the Swiss Franc was pegged to the Euro (EUR). The peg was abruptly removed, resulting in a more than 20% increase in the Franc’s value, causing a turmoil in markets. Even though the peg isn’t in force anymore, CHF fortunes tend to be highly correlated with the Euro ones due to the high dependency of the Swiss economy on the neighboring Eurozone.
The Swiss Franc (CHF) is considered a safe-haven asset, or a currency that investors tend to buy in times of market stress. This is due to the perceived status of Switzerland in the world: a stable economy, a strong export sector, big central bank reserves or a longstanding political stance towards neutrality in global conflicts make the country’s currency a good choice for investors fleeing from risks. Turbulent times are likely to strengthen CHF value against other currencies that are seen as more risky to invest in.
The Swiss National Bank (SNB) meets four times a year – once every quarter, less than other major central banks – to decide on monetary policy. The bank aims for an annual inflation rate of less than 2%. When inflation is above target or forecasted to be above target in the foreseeable future, the bank will attempt to tame price growth by raising its policy rate. Higher interest rates are generally positive for the Swiss Franc (CHF) as they lead to higher yields, making the country a more attractive place for investors. On the contrary, lower interest rates tend to weaken CHF.
Macroeconomic data releases in Switzerland are key to assessing the state of the economy and can impact the Swiss Franc’s (CHF) valuation. The Swiss economy is broadly stable, but any sudden change in economic growth, inflation, current account or the central bank’s currency reserves have the potential to trigger moves in CHF. Generally, high economic growth, low unemployment and high confidence are good for CHF. Conversely, if economic data points to weakening momentum, CHF is likely to depreciate.
As a small and open economy, Switzerland is heavily dependent on the health of the neighboring Eurozone economies. The broader European Union is Switzerland’s main economic partner and a key political ally, so macroeconomic and monetary policy stability in the Eurozone is essential for Switzerland and, thus, for the Swiss Franc (CHF). With such dependency, some models suggest that the correlation between the fortunes of the Euro (EUR) and the CHF is more than 90%, or close to perfect.
- USD/CAD falls to near 1.3460 with US core PCE inflation and Canadian Q2 GDP data in focus.
- The Fed is widely anticipated to start reducing interest rates in September.
- Weak Canada GDP data would prompt the BoC to ease monetary policy further.
The USD/CAD pair falls to near 1.3460 in Thursday’s Asian session. The Loonie asset drops as the US Dollar (USD) struggles to hold Wednesday’s recovery move. The US Dollar Index (DXY), which tracks the Greenback’s value against six major currencies, edges lower from 101.18 after a strong recovery from the fresh annual low of 100.50.
The US Dollar is expected to remain on the tenterhooks as investors look for the United States (US) core Personal Consumption Expenditure price index (PCE) data for July, which will be published on Friday. The PCE report is expected to show that year-on-year core inflation rose at a faster pace of 2.7% from 2.6% in June, with monthly figures growing steadily by 0.2%. The inflation data would significantly influence market speculation for the Federal Reserve’s (Fed) September monetary policy.
Currently, financial market participants seem confident that the Fed will start reducing interest rates in September. However, traders remain split over whether the potential size of the rate-cut would be gradual or a hefty one.
According to the CME FedWatch tool, 30-day Federal Funds Futures pricing data shows that the probability of a 50-basis points (bps) interest rate reduction in September is 34.5%, while rest are favoring a cut by 25 bps.
On the Canadian Dollar (CAD) front, investors await the monthly and Q2 Gross Domestic Product (GDP) data, which will be published on Friday. The GDP report is expected to show that the economic barely expanded in June after 0.2% growth in May. On an annualized basis, the Canadian economy is estimated to have grown at a slower pace of 1.6% from the former release of 1.7%. Signs of cooling economic outlook would boost expectations of more interest rate cuts by the Bank of Canada (BoC).
Canadian Dollar FAQs
The key factors driving the Canadian Dollar (CAD) are the level of interest rates set by the Bank of Canada (BoC), the price of Oil, Canada’s largest export, the health of its economy, inflation and the Trade Balance, which is the difference between the value of Canada’s exports versus its imports. Other factors include market sentiment – whether investors are taking on more risky assets (risk-on) or seeking safe-havens (risk-off) – with risk-on being CAD-positive. As its largest trading partner, the health of the US economy is also a key factor influencing the Canadian Dollar.
The Bank of Canada (BoC) has a significant influence on the Canadian Dollar by setting the level of interest rates that banks can lend to one another. This influences the level of interest rates for everyone. The main goal of the BoC is to maintain inflation at 1-3% by adjusting interest rates up or down. Relatively higher interest rates tend to be positive for the CAD. The Bank of Canada can also use quantitative easing and tightening to influence credit conditions, with the former CAD-negative and the latter CAD-positive.
The price of Oil is a key factor impacting the value of the Canadian Dollar. Petroleum is Canada’s biggest export, so Oil price tends to have an immediate impact on the CAD value. Generally, if Oil price rises CAD also goes up, as aggregate demand for the currency increases. The opposite is the case if the price of Oil falls. Higher Oil prices also tend to result in a greater likelihood of a positive Trade Balance, which is also supportive of the CAD.
While inflation had always traditionally been thought of as a negative factor for a currency since it lowers the value of money, the opposite has actually been the case in modern times with the relaxation of cross-border capital controls. Higher inflation tends to lead central banks to put up interest rates which attracts more capital inflows from global investors seeking a lucrative place to keep their money. This increases demand for the local currency, which in Canada’s case is the Canadian Dollar.
Macroeconomic data releases gauge the health of the economy and can have an impact on the Canadian Dollar. Indicators such as GDP, Manufacturing and Services PMIs, employment, and consumer sentiment surveys can all influence the direction of the CAD. A strong economy is good for the Canadian Dollar. Not only does it attract more foreign investment but it may encourage the Bank of Canada to put up interest rates, leading to a stronger currency. If economic data is weak, however, the CAD is likely to fall.
- Silver price gains traction around $29.45 in Thursday’s early European session, up 1.03% on the day.
- Further decline of the USD, ongoing Middle East tensions support the silver price.
- Investors await the second estimate of US Q2 GDP growth numbers on Thursday ahead of PCE inflation data.
Silver price (XAG/USD) edges higher to near $29.45 during the early European session on Thursday. The ongoing geopolitical tensions in the Middle East and weaker US Dollar (USD) amid the Federal Reserve (Fed) rate cut expectation provide some support to the white metal.
The anticipation that the Fed would start easing its monetary policy in September exerts some selling pressure on the Greenback and is underpinned by the USD-denominated Silver price as it makes Silver cheaper for most buyers. Futures markets have fully priced in a 25 basis points (bps) rate cut in September, while the odds of a deeper rate cut stand at 36.5%, according to the CME FedWatch Tool.
Furthermore, the Middle East tensions remain high, and market players will closely monitor the development surrounding Israel and Hezbollah conflicts. Any sign of escalation could boost the white metal.
On the other hand, the firmer USD might drag the white metal down. The release of the US Gross Domestic Product (GDP) Annualized on Thursday and the Personal Consumption Expenditures (PCE) Price Index on Friday could offer some hints about the US interest rate path. The US economy for the second quarter in the second estimate is estimated to grow 2.8%, while the Fed’s preferred gauge of inflation, Core PCE, is projected to rise from 2.6% to 2.7% YoY in July.
Silver FAQs
Silver is a precious metal highly traded among investors. It has been historically used as a store of value and a medium of exchange. Although less popular than Gold, traders may turn to Silver to diversify their investment portfolio, for its intrinsic value or as a potential hedge during high-inflation periods. Investors can buy physical Silver, in coins or in bars, or trade it through vehicles such as Exchange Traded Funds, which track its price on international markets.
Silver prices can move due to a wide range of factors. Geopolitical instability or fears of a deep recession can make Silver price escalate due to its safe-haven status, although to a lesser extent than Gold's. As a yieldless asset, Silver tends to rise with lower interest rates. Its moves also depend on how the US Dollar (USD) behaves as the asset is priced in dollars (XAG/USD). A strong Dollar tends to keep the price of Silver at bay, whereas a weaker Dollar is likely to propel prices up. Other factors such as investment demand, mining supply – Silver is much more abundant than Gold – and recycling rates can also affect prices.
Silver is widely used in industry, particularly in sectors such as electronics or solar energy, as it has one of the highest electric conductivity of all metals – more than Copper and Gold. A surge in demand can increase prices, while a decline tends to lower them. Dynamics in the US, Chinese and Indian economies can also contribute to price swings: for the US and particularly China, their big industrial sectors use Silver in various processes; in India, consumers’ demand for the precious metal for jewellery also plays a key role in setting prices.
Silver prices tend to follow Gold's moves. When Gold prices rise, Silver typically follows suit, as their status as safe-haven assets is similar. The Gold/Silver ratio, which shows the number of ounces of Silver needed to equal the value of one ounce of Gold, may help to determine the relative valuation between both metals. Some investors may consider a high ratio as an indicator that Silver is undervalued, or Gold is overvalued. On the contrary, a low ratio might suggest that Gold is undervalued relative to Silver.
- GBP/USD is on a gradual recovery mode, as the US Dollar resumes the downside.
- The focus now shifts to the US Q2 GDP data for fresh trading impetus in GBP/USD.
- The Pound Sterling looks bullish against the US Dollar on the four-hour chart.
GBP/USD is making a headway back toward the 29-month high set on Tuesday at 1.3266. The pair is helped by a renewed selling seen in the US Dollar even as risk-off flows dominate, in the aftermath of the disappointing guidance shared by the American AI titan, Nvidia.
The divergent monetary policy outlooks between the US Federal Reserve (Fed) and the Bank of England (BoE) also remain in favor of the GBP/USD uptrend.
However, the further upside in the pair remains at the mercy of the upcoming second estimate of the US Q2 Gross Domestic Product (GDP) and the acceptance above the 21-Simple Moving Average (SMA) on the four-hour chart.
The 21-day SMA aligns at 1.3210, where it now wavers. Recapturing the latter is necessary on a four-hourly candlestick closing basis to take on the 1.3250 psychological level.
Fresh buyers will likely emerge above that level, calling for the test of the two-year high of 1.3266 en route to the 1.3300 round figure.
Conversely, a failure to gain a strong foothold above the 21-SMA, sellers will jump back into the game, dragging GBP/USD back toward the 50-SMA at 1.3120.
The Relative Strength Index (RSI), however, points north near 60, suggesting that the recovery mode could extend.
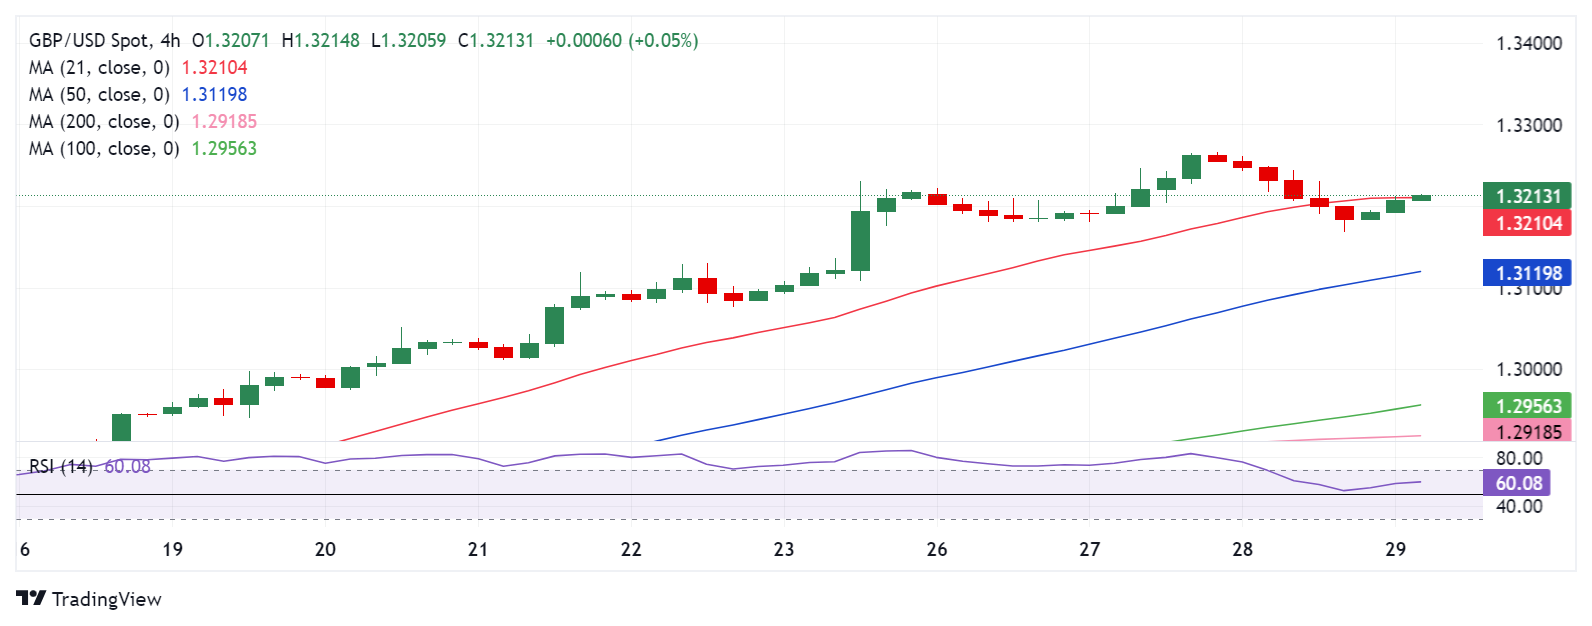
GBP/USD: Daily chart
British Pound PRICE Today
The table below shows the percentage change of British Pound (GBP) against listed major currencies today. British Pound was the strongest against the Japanese Yen.
| USD | EUR | GBP | JPY | CAD | AUD | NZD | CHF | |
|---|---|---|---|---|---|---|---|---|
| USD | -0.15% | -0.16% | 0.10% | -0.15% | -0.29% | -0.79% | -0.24% | |
| EUR | 0.15% | -0.02% | 0.24% | -0.02% | -0.15% | -0.64% | -0.07% | |
| GBP | 0.16% | 0.02% | 0.27% | 0.00% | -0.12% | -0.61% | -0.02% | |
| JPY | -0.10% | -0.24% | -0.27% | -0.23% | -0.39% | -0.91% | -0.30% | |
| CAD | 0.15% | 0.02% | -0.01% | 0.23% | -0.13% | -0.64% | -0.04% | |
| AUD | 0.29% | 0.15% | 0.12% | 0.39% | 0.13% | -0.48% | 0.13% | |
| NZD | 0.79% | 0.64% | 0.61% | 0.91% | 0.64% | 0.48% | 0.59% | |
| CHF | 0.24% | 0.07% | 0.02% | 0.30% | 0.04% | -0.13% | -0.59% |
The heat map shows percentage changes of major currencies against each other. The base currency is picked from the left column, while the quote currency is picked from the top row. For example, if you pick the British Pound from the left column and move along the horizontal line to the US Dollar, the percentage change displayed in the box will represent GBP (base)/USD (quote).
Gold prices rose in India on Thursday, according to data compiled by FXStreet.
The price for Gold stood at 6,792.24 Indian Rupees (INR) per gram, up compared with the INR 6,755.85 it cost on Wednesday.
The price for Gold increased to INR 79,225.68 per tola from INR 78,798.85 per tola a day earlier.
| Unit measure | Gold Price in INR |
|---|---|
| 1 Gram | 6,792.24 |
| 10 Grams | 67,924.40 |
| Tola | 79,225.68 |
| Troy Ounce | 211,271.50 |
FXStreet calculates Gold prices in India by adapting international prices (USD/INR) to the local currency and measurement units. Prices are updated daily based on the market rates taken at the time of publication. Prices are just for reference and local rates could diverge slightly.
Gold FAQs
Gold has played a key role in human’s history as it has been widely used as a store of value and medium of exchange. Currently, apart from its shine and usage for jewelry, the precious metal is widely seen as a safe-haven asset, meaning that it is considered a good investment during turbulent times. Gold is also widely seen as a hedge against inflation and against depreciating currencies as it doesn’t rely on any specific issuer or government.
Central banks are the biggest Gold holders. In their aim to support their currencies in turbulent times, central banks tend to diversify their reserves and buy Gold to improve the perceived strength of the economy and the currency. High Gold reserves can be a source of trust for a country’s solvency. Central banks added 1,136 tonnes of Gold worth around $70 billion to their reserves in 2022, according to data from the World Gold Council. This is the highest yearly purchase since records began. Central banks from emerging economies such as China, India and Turkey are quickly increasing their Gold reserves.
Gold has an inverse correlation with the US Dollar and US Treasuries, which are both major reserve and safe-haven assets. When the Dollar depreciates, Gold tends to rise, enabling investors and central banks to diversify their assets in turbulent times. Gold is also inversely correlated with risk assets. A rally in the stock market tends to weaken Gold price, while sell-offs in riskier markets tend to favor the precious metal.
The price can move due to a wide range of factors. Geopolitical instability or fears of a deep recession can quickly make Gold price escalate due to its safe-haven status. As a yield-less asset, Gold tends to rise with lower interest rates, while higher cost of money usually weighs down on the yellow metal. Still, most moves depend on how the US Dollar (USD) behaves as the asset is priced in dollars (XAU/USD). A strong Dollar tends to keep the price of Gold controlled, whereas a weaker Dollar is likely to push Gold prices up.
(An automation tool was used in creating this post.)
- EUR/USD rebounds from key Fibo support at 1.1107 amid renewed US Dollar selling.
- Risk aversion and pre-German inflation and US GDP nervousness could limit the pair’s upswing.
- The daily technical setup continues to stay constructive for EUR/USD in the near term.
EUR/USD is back in the green zone early Thursday, reversing a part of Wednesday’s steep sell-off. The further upside, however, appears elusive if risk aversion gathers steam and revives the safe-haven demand for the US Dollar (USD).
Markets trade with caution following the American AI giant’s, Nvidia, disappointing sales forecast and amid increased nervousness heading toward the release of this week’s top-tier economic data.
Germany is set to publish its preliminary inflation data while the US calendar will feature the second estimate of the Gross Domestic Product (GDP) later Thursday.
From a short-term technical perspective, the EUR/USD uptrend remains intact so long as the 1.1107 support holds. That level is the 23.6% Fibonacci Retracement (Fibo) level of the August rally from 1.0775 to 1.1202, 13-year highs.
The 14-day Relative Strength Index (RSI) stays firm above 50, currently near 63, justifying the major’s bullish potential.
Acceptance above the 1.1150 psychological level is needed on a daily closing basis to retest the yearly top just above 1.1200. Ahead of that, Wednesday’s high of 1.1186 could challenge the bearish commitments.
On the flip side, a sustained break below the abovementioned 23.6% Fibo support at 1.1107 could open up the downside toward the 38.2% Fibo level of the same advance, aligned at 1.1045.
EUR/USD buyers will then find immediate support at the 21-day Simple Moving Average (SMA) of 1.1026. Additional declines could thwart the 1.1000 round level.
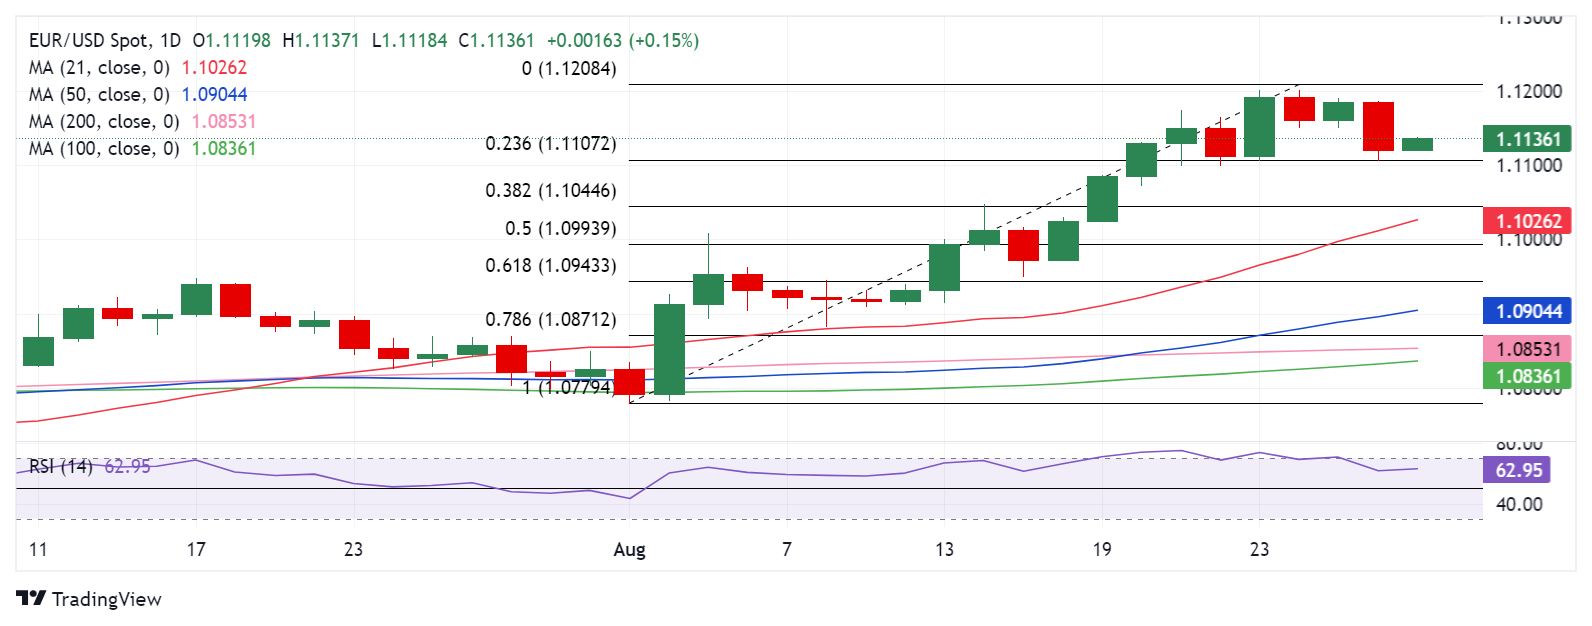
EUR/USD: Daily chart
Euro PRICE Today
The table below shows the percentage change of Euro (EUR) against listed major currencies today. Euro was the strongest against the US Dollar.
| USD | EUR | GBP | JPY | CAD | AUD | NZD | CHF | |
|---|---|---|---|---|---|---|---|---|
| USD | -0.14% | -0.12% | -0.04% | -0.13% | -0.26% | -0.80% | -0.26% | |
| EUR | 0.14% | 0.01% | 0.10% | -0.00% | -0.13% | -0.66% | -0.11% | |
| GBP | 0.12% | -0.01% | 0.08% | -0.02% | -0.14% | -0.66% | -0.08% | |
| JPY | 0.04% | -0.10% | -0.08% | -0.08% | -0.23% | -0.78% | -0.18% | |
| CAD | 0.13% | 0.00% | 0.02% | 0.08% | -0.12% | -0.65% | -0.08% | |
| AUD | 0.26% | 0.13% | 0.14% | 0.23% | 0.12% | -0.51% | 0.06% | |
| NZD | 0.80% | 0.66% | 0.66% | 0.78% | 0.65% | 0.51% | 0.57% | |
| CHF | 0.26% | 0.11% | 0.08% | 0.18% | 0.08% | -0.06% | -0.57% |
The heat map shows percentage changes of major currencies against each other. The base currency is picked from the left column, while the quote currency is picked from the top row. For example, if you pick the Euro from the left column and move along the horizontal line to the US Dollar, the percentage change displayed in the box will represent EUR (base)/USD (quote).
- NZD/USD gathers strength around 0.6280 in Thursday’s early Asian session, up 0.57% on the day.
- New Zealand’s Business confidence soars to the highest in a decade in a recent ANZ Business Outlook survey, boosting the Kiwi.
- The second estimate of US Q2 GDP growth numbers will be closely watched.
The NZD/USD pair gains momentum near 0.6280, the highest level since January 4, during the early Asian session on Thursday. The uptick of the New Zealand Dollar (NZD) is bolstered by firmer rate cut expectation from the Federal Reserve (Fed) and an encouraging New Zealand ANZ Business Outlook Survey.
New Zealand’s Business confidence for August, as measured by the ANZ Business Outlook Survey climbed to its highest level in a decade. The headline confidence measure in the survey rose to 51.0 in August. While the expected own activity measure surges to a seven-year high of 37.0. ANZ chief economist Sharon Zollner commented that the survey "showed a flurry of optimism." This development boosts the Kiwi against the US Dollar (USD).
The Fed Chair Jerome Powell said last week that the US central bank was ready to cut the interest rates. Meanwhile, Minneapolis Fed Neel Kashkari noted it was appropriate to discuss potentially cutting interest rates from as early as September due to a weakening labor market.
His comments echoed similar remarks by the Presidents of the St. Louis Fed, Alberto Musalem, and the Atlanta Fed president, Raphael Bostic. These dovish comments from Fed officials are likely to undermine the Greenback in the near term.
The second estimate of US Q2 GDP growth numbers will be the highlight on Thursday. The US economy is estimated to grow 2.8%. The stronger-than-expected outcome could lift the USD and cap the upside for NZD/USD.
New Zealand Dollar FAQs
The New Zealand Dollar (NZD), also known as the Kiwi, is a well-known traded currency among investors. Its value is broadly determined by the health of the New Zealand economy and the country’s central bank policy. Still, there are some unique particularities that also can make NZD move. The performance of the Chinese economy tends to move the Kiwi because China is New Zealand’s biggest trading partner. Bad news for the Chinese economy likely means less New Zealand exports to the country, hitting the economy and thus its currency. Another factor moving NZD is dairy prices as the dairy industry is New Zealand’s main export. High dairy prices boost export income, contributing positively to the economy and thus to the NZD.
The Reserve Bank of New Zealand (RBNZ) aims to achieve and maintain an inflation rate between 1% and 3% over the medium term, with a focus to keep it near the 2% mid-point. To this end, the bank sets an appropriate level of interest rates. When inflation is too high, the RBNZ will increase interest rates to cool the economy, but the move will also make bond yields higher, increasing investors’ appeal to invest in the country and thus boosting NZD. On the contrary, lower interest rates tend to weaken NZD. The so-called rate differential, or how rates in New Zealand are or are expected to be compared to the ones set by the US Federal Reserve, can also play a key role in moving the NZD/USD pair.
Macroeconomic data releases in New Zealand are key to assess the state of the economy and can impact the New Zealand Dollar’s (NZD) valuation. A strong economy, based on high economic growth, low unemployment and high confidence is good for NZD. High economic growth attracts foreign investment and may encourage the Reserve Bank of New Zealand to increase interest rates, if this economic strength comes together with elevated inflation. Conversely, if economic data is weak, NZD is likely to depreciate.
The New Zealand Dollar (NZD) tends to strengthen during risk-on periods, or when investors perceive that broader market risks are low and are optimistic about growth. This tends to lead to a more favorable outlook for commodities and so-called ‘commodity currencies’ such as the Kiwi. Conversely, NZD tends to weaken at times of market turbulence or economic uncertainty as investors tend to sell higher-risk assets and flee to the more-stable safe havens.
- AUD/USD strengthens near 0.6790 in Thursday’s early Asian session.
- Australia’s private capital spending dropped by 2.2% in Q2 vs. 1.0% prior, weaker than expected.
- The second estimate of US Q2 GDP growth numbers will be in the spotlight on Thursday.
The AUD/USD pair trades on a stronger note around 0.6790 on Thursday during the Asian trading hours. The hotter-than-expected Australian CPI inflation data push back the expectation of a rate cut by the Reserve Bank of Australia (RBA) and provide some support to the Aussie.
Australia’s private capital spending dropped by 2.2% in the second quarter (Q2) from an increase of 1.0% in the previous quarter, the Australian Bureau of Statistics showed Thursday. This figure was below the estimation of 1.0%. Meanwhile, spending on buildings and structures slid by 3.8%, while plant and machinery declined by 0.5%.
The Australian inflation data on Wednesday appeared insufficient to trigger the Reserve Bank of Australia (RBA) rate cut expectations, which has lifted the Aussie against the USD. The country’s monthly CPI inflation eased to 3.5% from 3.8% in June, but higher than expectations of 3.5%. Investors will take more cues from the Australian Retail Sales, which are due on Friday.
The US Federal Reserve (Fed) signaled that lower interest rates are finally on the horizon, which weighs on the USD broadly. Fed Chair Jerome Powell said at Jackson Hole last week that “the time has come for policy to adjust.” However, the weakness in the job market is also playing a role in nudging the Fed to ease borrowing costs. The US Nonfarm Payrolls for August next week will be closely watched. Later on Thursday, traders will focus on the US GDP growth numbers for the second quarter in the second estimate, which is forecast to expand by 2.8%.
Australian Dollar FAQs
One of the most significant factors for the Australian Dollar (AUD) is the level of interest rates set by the Reserve Bank of Australia (RBA). Because Australia is a resource-rich country another key driver is the price of its biggest export, Iron Ore. The health of the Chinese economy, its largest trading partner, is a factor, as well as inflation in Australia, its growth rate and Trade Balance. Market sentiment – whether investors are taking on more risky assets (risk-on) or seeking safe-havens (risk-off) – is also a factor, with risk-on positive for AUD.
The Reserve Bank of Australia (RBA) influences the Australian Dollar (AUD) by setting the level of interest rates that Australian banks can lend to each other. This influences the level of interest rates in the economy as a whole. The main goal of the RBA is to maintain a stable inflation rate of 2-3% by adjusting interest rates up or down. Relatively high interest rates compared to other major central banks support the AUD, and the opposite for relatively low. The RBA can also use quantitative easing and tightening to influence credit conditions, with the former AUD-negative and the latter AUD-positive.
China is Australia’s largest trading partner so the health of the Chinese economy is a major influence on the value of the Australian Dollar (AUD). When the Chinese economy is doing well it purchases more raw materials, goods and services from Australia, lifting demand for the AUD, and pushing up its value. The opposite is the case when the Chinese economy is not growing as fast as expected. Positive or negative surprises in Chinese growth data, therefore, often have a direct impact on the Australian Dollar and its pairs.
Iron Ore is Australia’s largest export, accounting for $118 billion a year according to data from 2021, with China as its primary destination. The price of Iron Ore, therefore, can be a driver of the Australian Dollar. Generally, if the price of Iron Ore rises, AUD also goes up, as aggregate demand for the currency increases. The opposite is the case if the price of Iron Ore falls. Higher Iron Ore prices also tend to result in a greater likelihood of a positive Trade Balance for Australia, which is also positive of the AUD.
The Trade Balance, which is the difference between what a country earns from its exports versus what it pays for its imports, is another factor that can influence the value of the Australian Dollar. If Australia produces highly sought after exports, then its currency will gain in value purely from the surplus demand created from foreign buyers seeking to purchase its exports versus what it spends to purchase imports. Therefore, a positive net Trade Balance strengthens the AUD, with the opposite effect if the Trade Balance is negative.
| Raw materials | Closed | Change, % |
|---|---|---|
| Silver | 29.126 | -2.9 |
| Gold | 250.475 | -0.81 |
| Palladium | 941.64 | -3.05 |
- USD/JPY weakens near 144.50 in Thursday’s early Asian session.
- BoJ’s Himino said central bank would continue to raise interest rates if inflation stayed on course.
- The Fed's dovish stance undermines the US dollar against the JPY.
The USD/JPY pair remains on the defensive around 144.50 during the Asian trading hours on Thursday. The dovish remarks from the Federal Reserve (Fed) officials continue to undermine the US Dollar (USD) in the near term. Investors await the preliminary US Gross Domestic Product (GDP) growth number for Q2, which is expected to grow 2.8%.
The Bank of Japan (BoJ) Deputy Governor Ryozo Himino stated on Wednesday that the Japanese central bank would continue to raise interest rates if inflation stayed on course, while also closely monitoring financial market conditions.
His comments echo those from BoJ Governor Kazuo Ueda last week, who said that recent market volatility would not derail its long-term rate hike plans. a majority of economists expect the BOJ to hike rates again this year, starting in December rather than October, according to a Reuters poll.
On the other hand, the dovish comments from the US central bank have weighed on the Greenback against the JPY. Fed Chair Jerome Powell said that “the time has come for policy to adjust.” The markets have fully priced in a 25 basis points (bps) rate cut in September, while the possibility of a deeper rate cut stands at 36.5%, according to the CME FedWatch Tool.
Japanese Yen FAQs
The Japanese Yen (JPY) is one of the world’s most traded currencies. Its value is broadly determined by the performance of the Japanese economy, but more specifically by the Bank of Japan’s policy, the differential between Japanese and US bond yields, or risk sentiment among traders, among other factors.
One of the Bank of Japan’s mandates is currency control, so its moves are key for the Yen. The BoJ has directly intervened in currency markets sometimes, generally to lower the value of the Yen, although it refrains from doing it often due to political concerns of its main trading partners. The current BoJ ultra-loose monetary policy, based on massive stimulus to the economy, has caused the Yen to depreciate against its main currency peers. This process has exacerbated more recently due to an increasing policy divergence between the Bank of Japan and other main central banks, which have opted to increase interest rates sharply to fight decades-high levels of inflation.
The BoJ’s stance of sticking to ultra-loose monetary policy has led to a widening policy divergence with other central banks, particularly with the US Federal Reserve. This supports a widening of the differential between the 10-year US and Japanese bonds, which favors the US Dollar against the Japanese Yen.
The Japanese Yen is often seen as a safe-haven investment. This means that in times of market stress, investors are more likely to put their money in the Japanese currency due to its supposed reliability and stability. Turbulent times are likely to strengthen the Yen’s value against other currencies seen as more risky to invest in.
The People’s Bank of China (PBOC) set the USD/CNY central rate for the trading session ahead on Thursday at 7.1280, as against the previous day's fix of 7.1216.
- The Gold price rebounds above $2,500 in Thursday’s early Asian session.
- Rising Fed rate cut expectations and ongoing conflicts in the Middle East underpin the yellow metal.
- Firmer US Dollar might limit the Gold’s upside.
The Gold price (XAU/USD) recovers some lost ground on Thursday after bouncing off the weekly lows in the sub-$2,500 region per ounce troy. The expectation of US interest rate cuts might lift the Gold demand as lower interest rates reduce the opportunity cost of holding non-yielding gold. Additionally, the current political uncertainty in the US, geopolitical tensions in the Middle East and global economic concerns contribute to the precious metal’s upside.
On the other hand, the renewed US Dollar (USD) demand could weigh on the USD-denominated Gold price as it makes gold more expensive for most buyers. Investors will closely monitor the preliminary US Gross Domestic Product for the second quarter (Q2) on Thursday for more cues about the size and pace of the Federal Reserve (Fed) rate cut. On Friday, the US Personal Consumption Expenditures (PCE) Price Index data for July will take center stage.
Daily Digest Market Movers: Gold price remains strong amid rising rate cut bets
- Demand for gold will continue to be driven by emerging markets, particularly China, India, and Turkey, noted John Reade, Chief Market Strategist at the World Gold Council.
- “US data has failed to give gold any further lift, so the temptation for traders to book some profit after a long run has been rising,” said Ole Hansen, head of commodities strategy at Saxo Bank A/S.
- The US Gross Domestic Product (GDP) growth number for Q2 in the second estimate is expected to grow 2.8%.
- The headline Personal Consumption Expenditures (PCE) Price Index is expected to show an increase of 2.6% YoY in July, compared to 2.5% in June. The core PCE inflation is projected to rise from 2.6% to 2.7% YoY.
- The rate futures markets have fully priced in a 25 basis points (bps) rate cut in September, while the possibility of a deeper rate cut stands at 36.5%, according to the CME FedWatch Tool. Traders see 100 bps Fed easing this year.
Technical Analysis: Gold price offers a bullish outlook in the longer term
The Gold price trades in positive territory on the day. The precious metal remains stuck under a five-month-old ascending channel upper boundary and the all-time high. However, the overall picture is bullish, with the price well above the key 100-day Exponential Moving Average (EMA) on the daily timeframe. The upward momentum is confirmed by the 14-day Relative Strength Index (RSI) positions above the midline near 61.00, indicating that there is potential room for further upside.
The confluence of the all-time high and the upper boundary of the trend channel in the $2,530-$2,535 zone acts as the crucial upside barrier for the yellow metal. Extended gains could see a rally to the $2,600 psychological mark.
The immediate support level for XAU/USD is located at the $2,500 round figure. A decisive break below this level could lead to a significant sell-off towards $2,432, the low of August 15. The next contention level is seen at $2,367, the 100-day EMA.
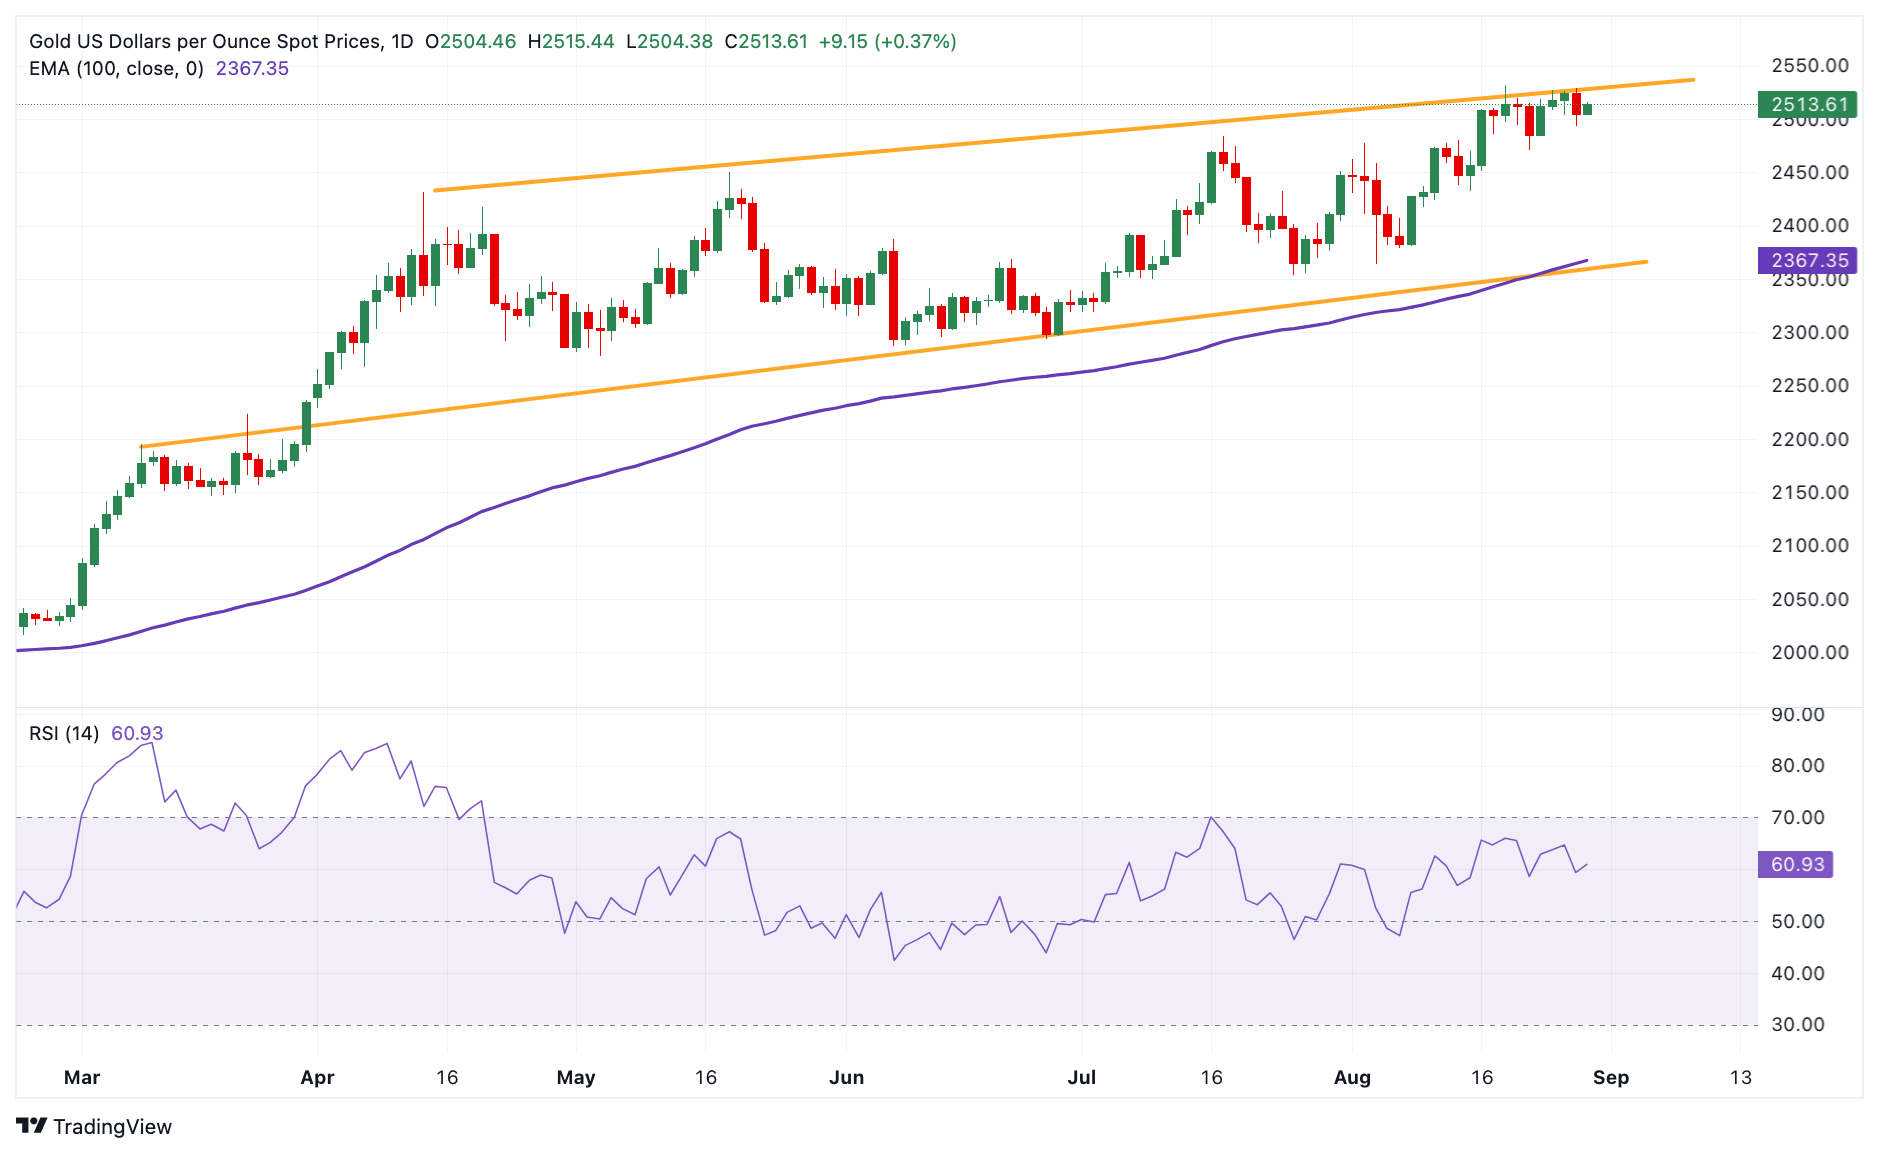
Gold FAQs
Gold has played a key role in human’s history as it has been widely used as a store of value and medium of exchange. Currently, apart from its shine and usage for jewelry, the precious metal is widely seen as a safe-haven asset, meaning that it is considered a good investment during turbulent times. Gold is also widely seen as a hedge against inflation and against depreciating currencies as it doesn’t rely on any specific issuer or government.
Central banks are the biggest Gold holders. In their aim to support their currencies in turbulent times, central banks tend to diversify their reserves and buy Gold to improve the perceived strength of the economy and the currency. High Gold reserves can be a source of trust for a country’s solvency. Central banks added 1,136 tonnes of Gold worth around $70 billion to their reserves in 2022, according to data from the World Gold Council. This is the highest yearly purchase since records began. Central banks from emerging economies such as China, India and Turkey are quickly increasing their Gold reserves.
Gold has an inverse correlation with the US Dollar and US Treasuries, which are both major reserve and safe-haven assets. When the Dollar depreciates, Gold tends to rise, enabling investors and central banks to diversify their assets in turbulent times. Gold is also inversely correlated with risk assets. A rally in the stock market tends to weaken Gold price, while sell-offs in riskier markets tend to favor the precious metal.
The price can move due to a wide range of factors. Geopolitical instability or fears of a deep recession can quickly make Gold price escalate due to its safe-haven status. As a yield-less asset, Gold tends to rise with lower interest rates, while higher cost of money usually weighs down on the yellow metal. Still, most moves depend on how the US Dollar (USD) behaves as the asset is priced in dollars (XAU/USD). A strong Dollar tends to keep the price of Gold controlled, whereas a weaker Dollar is likely to push Gold prices up.
| Index | Change, points | Closed | Change, % |
|---|---|---|---|
| NIKKEI 225 | 83.14 | 38371.76 | 0.22 |
| Hang Seng | -182.22 | 17692.45 | -1.02 |
| KOSPI | 0.58 | 2689.83 | 0.02 |
| ASX 200 | 0.2 | 8071.4 | 0 |
| DAX | 100.48 | 18782.29 | 0.54 |
| CAC 40 | 11.89 | 7577.67 | 0.16 |
| Dow Jones | -159.08 | 41091.42 | -0.39 |
| S&P 500 | -33.62 | 5592.18 | -0.6 |
| NASDAQ Composite | -198.79 | 17556.03 | -1.12 |
- WTI price loses ground near $75.15 in Thursday’s early Asian session.
- Soft demand in China weighs on the WTI price.
- The threat of supply disruptions in Libya and Middle East geopolitical risks might cap the downside.
West Texas Intermediate (WTI), the US crude oil benchmark, is trading around $75.15 on Thursday. The WTI price edges lower as investors are concerned about slower economic growth in China. However, oil supply risks in the Middle East and Libya might help limit the WTI’s losses.
The sluggish economy and slowing oil demand in China raise the fear of the economic health of the world’s largest importer of oil, which weighs on the WTI price. "Demand in China remains weak, and the expected second-half rebound has yet to show credible signs of commencing," Amarpreet Singh, an analyst at Barclays, said in a note.
US crude oil stocks fell less than expected last week. According to the Energy Information Administration (EIA), crude oil stockpiles in the United States for the week ending August 23 dropped by 0.846 million barrels to 425.2 million barrels, compared to a fall of 4.649 million barrels in the previous week. The market consensus estimated that stocks would decline by 3.0 million barrels.
On the other hand, the potential oil supply disruptions in Libya might cap the downside for the WTI price in the near term. UBS analyst Giovanni Staunovo noted that the Libyan disruptions should tighten the oil market, considering real barrels are removed, but here investors want to see a drop in Libyan crude exports first. Crude oil prices climbed on Monday amid increased rivalry between competing governments in Libya, which has Africa’s biggest crude oil reserves.
WTI Oil FAQs
WTI Oil is a type of Crude Oil sold on international markets. The WTI stands for West Texas Intermediate, one of three major types including Brent and Dubai Crude. WTI is also referred to as “light” and “sweet” because of its relatively low gravity and sulfur content respectively. It is considered a high quality Oil that is easily refined. It is sourced in the United States and distributed via the Cushing hub, which is considered “The Pipeline Crossroads of the World”. It is a benchmark for the Oil market and WTI price is frequently quoted in the media.
Like all assets, supply and demand are the key drivers of WTI Oil price. As such, global growth can be a driver of increased demand and vice versa for weak global growth. Political instability, wars, and sanctions can disrupt supply and impact prices. The decisions of OPEC, a group of major Oil-producing countries, is another key driver of price. The value of the US Dollar influences the price of WTI Crude Oil, since Oil is predominantly traded in US Dollars, thus a weaker US Dollar can make Oil more affordable and vice versa.
The weekly Oil inventory reports published by the American Petroleum Institute (API) and the Energy Information Agency (EIA) impact the price of WTI Oil. Changes in inventories reflect fluctuating supply and demand. If the data shows a drop in inventories it can indicate increased demand, pushing up Oil price. Higher inventories can reflect increased supply, pushing down prices. API’s report is published every Tuesday and EIA’s the day after. Their results are usually similar, falling within 1% of each other 75% of the time. The EIA data is considered more reliable, since it is a government agency.
OPEC (Organization of the Petroleum Exporting Countries) is a group of 13 Oil-producing nations who collectively decide production quotas for member countries at twice-yearly meetings. Their decisions often impact WTI Oil prices. When OPEC decides to lower quotas, it can tighten supply, pushing up Oil prices. When OPEC increases production, it has the opposite effect. OPEC+ refers to an expanded group that includes ten extra non-OPEC members, the most notable of which is Russia.
| Pare | Closed | Change, % |
|---|---|---|
| AUDUSD | 0.67831 | -0.15 |
| EURJPY | 160.616 | -0.22 |
| EURUSD | 1.11188 | -0.58 |
| GBPJPY | 190.533 | -0.17 |
| GBPUSD | 1.31902 | -0.53 |
| NZDUSD | 0.62407 | -0.18 |
| USDCAD | 1.34785 | 0.28 |
| USDCHF | 0.84182 | 0.03 |
| USDJPY | 144.443 | 0.36 |


© 2000-2026. All rights reserved.
This site is managed by Teletrade D.J. LLC 2351 LLC 2022 (Euro House, Richmond Hill Road, Kingstown, VC0100, St. Vincent and the Grenadines).
The information on this website is for informational purposes only and does not constitute any investment advice.
The company does not serve or provide services to customers who are residents of the US, Canada, Iran, The Democratic People's Republic of Korea, Yemen and FATF blacklisted countries.
Making transactions on financial markets with marginal financial instruments opens up wide possibilities and allows investors who are willing to take risks to earn high profits, carrying a potentially high risk of losses at the same time. Therefore you should responsibly approach the issue of choosing the appropriate investment strategy, taking the available resources into account, before starting trading.
Use of the information: full or partial use of materials from this website must always be referenced to TeleTrade as the source of information. Use of the materials on the Internet must be accompanied by a hyperlink to teletrade.org. Automatic import of materials and information from this website is prohibited.
Please contact our PR department if you have any questions or need assistance at pr@teletrade.global.
transfers