- Analytics
- News and Tools
- Market News
CFD Markets News and Forecasts — 29-06-2018
The MNI Chicago Business Barometer rose 1.4 points to 64.1 in June, up from 62.7 in May, hitting the highest level since January. Business activity expanded at a faster pace in June, with firms' operations up for a third consecutive month. Four of the five Barometer components strengthened on the month, leaving the Barometer up 0.8% on the year.
The falloff in confidence was minor, as the Sentiment Index has been virtually unchanged for the past three months.
The persistent strength has been due to favorable assessments of jobs and incomes. While consumers anticipated rising interest rates during the year ahead, those expected increases were associated with a modest decline in longer term prospects for the national economy. For the year ahead, consumers still anticipated that the economy would produce small additional declines in the unemployment rate as well as higher wage gains. Consumers also anticipated an uptick in inflation during the year ahead, partly due to rising energy prices and partly due to tariffs.
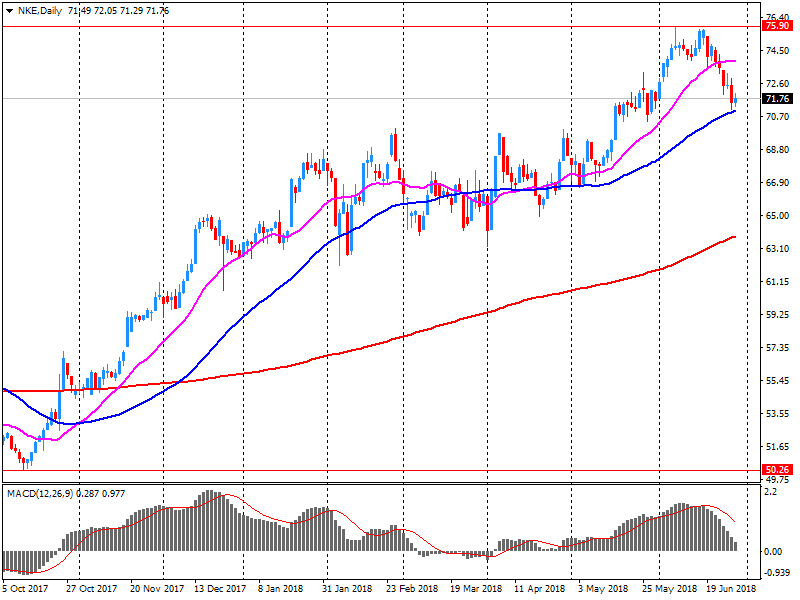
U.S. stock-index futures rose moderately on Friday, helped by solid gains in NIKE (NKE) and financials names.
Global Stocks:
| Index/commodity | Last | Today's Change, points | Today's Change, % |
| Nikkei | 22,304.51 | +34.12 | +0.15% |
| Hang Seng | 28,955.11 | +457.79 | +1.61% |
| Shanghai | 2,848.31 | +61.41 | +2.20% |
| S&P/ASX | 6,194.60 | -20.80 | -0.33% |
| FTSE | 7,665.52 | +49.89 | +0.66% |
| CAC | 5,335.65 | +60.01 | +1.14% |
| DAX | 12,324.01 | +146.78 | +1.21% |
| Crude | $73.69 | | +0.33% |
| Gold | $1,251.90 | | +0.07% |
(company / ticker / price / change ($/%) / volume)
| ALCOA INC. | AA | 47 | 0.53(1.14%) | 100 |
| Amazon.com Inc., NASDAQ | AMZN | 1,716.89 | 15.44(0.91%) | 56749 |
| American Express Co | AXP | 98.3 | 1.33(1.37%) | 12013 |
| Apple Inc. | AAPL | 186.54 | 1.04(0.56%) | 118018 |
| AT&T Inc | T | 32.29 | 0.10(0.31%) | 38051 |
| Barrick Gold Corporation, NYSE | ABX | 12.76 | 0.06(0.47%) | 394 |
| Boeing Co | BA | 337.8 | 3.15(0.94%) | 10062 |
| Caterpillar Inc | CAT | 136.78 | 0.75(0.55%) | 1130 |
| Chevron Corp | CVX | 125.76 | 0.10(0.08%) | 569 |
| Cisco Systems Inc | CSCO | 43.02 | 0.08(0.19%) | 8564 |
| Citigroup Inc., NYSE | C | 68.15 | 1.27(1.90%) | 175339 |
| Exxon Mobil Corp | XOM | 82.13 | 0.16(0.20%) | 1033 |
| Facebook, Inc. | FB | 197.48 | 1.25(0.64%) | 83760 |
| FedEx Corporation, NYSE | FDX | 227.93 | 1.26(0.56%) | 795 |
| Ford Motor Co. | F | 11.32 | 0.04(0.35%) | 24878 |
| Freeport-McMoRan Copper & Gold Inc., NYSE | FCX | 17 | 0.21(1.25%) | 23203 |
| General Electric Co | GE | 13.93 | 0.10(0.72%) | 54320 |
| General Motors Company, NYSE | GM | 40.7 | 0.18(0.44%) | 2611 |
| Goldman Sachs | GS | 223.98 | 0.56(0.25%) | 11304 |
| Google Inc. | GOOG | 1,121.00 | 6.78(0.61%) | 3406 |
| Home Depot Inc | HD | 195.88 | 0.67(0.34%) | 2162 |
| Intel Corp | INTC | 49.46 | 0.21(0.43%) | 17417 |
| International Business Machines Co... | IBM | 140.5 | 0.46(0.33%) | 1617 |
| Johnson & Johnson | JNJ | 122.32 | 0.32(0.26%) | 1552 |
| JPMorgan Chase and Co | JPM | 106.52 | 1.59(1.52%) | 65523 |
| McDonald's Corp | MCD | 157.14 | 0.82(0.52%) | 2427 |
| Merck & Co Inc | MRK | 60.51 | 0.21(0.35%) | 639 |
| Microsoft Corp | MSFT | 99.19 | 0.56(0.57%) | 46365 |
| Nike | NKE | 79.01 | 7.31(10.20%) | 218399 |
| Pfizer Inc | PFE | 36.34 | -0.02(-0.06%) | 1471 |
| Procter & Gamble Co | PG | 78.37 | 0.32(0.41%) | 5138 |
| Starbucks Corporation, NASDAQ | SBUX | 48.55 | 0.01(0.02%) | 10894 |
| Tesla Motors, Inc., NASDAQ | TSLA | 354.47 | 4.54(1.30%) | 65219 |
| The Coca-Cola Co | KO | 43.65 | 0.18(0.41%) | 17787 |
| Twitter, Inc., NYSE | TWTR | 45.25 | 0.46(1.03%) | 102088 |
| United Technologies Corp | UTX | 124.75 | 0.15(0.12%) | 475 |
| Verizon Communications Inc | VZ | 51.1 | 0.24(0.47%) | 9889 |
| Visa | V | 133.5 | 0.76(0.57%) | 5759 |
| Wal-Mart Stores Inc | WMT | 86.06 | 0.20(0.23%) | 1457 |
| Walt Disney Co | DIS | 105.19 | 0.42(0.40%) | 1286 |
NIKE (NKE) target raised to $76 from $68 at B. Riley FBR
NIKE (NKE) target raised to $87 from 82 at Telsey
Real gross domestic product (GDP) edged up 0.1% in April as 12 of 20 industrial sectors increased. After a decline in January, GDP has risen every month since the beginning of 2018. The output of goods-producing industries rose 0.2%, as gains in the manufacturing and utilities sectors more than offset declines in construction and in mining, quarrying, and oil and gas extraction.
Services-producing industries were essentially unchanged overall as a notable decline in retail trade was offset by increases in the majority of subsectors. Manufacturing was up 0.8% in April as the output of both durable and non-durable manufacturing grew.
Personal income increased $60.0 billion (0.4 percent) in May according to estimates released today by the Bureau of Economic Analysis. Disposable personal income (DPI) increased $63.2 billion (0.4 percent) and personal consumption expenditures (PCE) increased $27.8 billion (0.2 percent).
Real DPI increased 0.2 percent in May and Real PCE decreased less than 0.1 percent. The PCE price index increased 0.2 percent. Excluding food and energy, the PCE price index increased 0.2 percent.The increase in personal income in May primarily reflected increases in wages and salaries, personal dividend income, and nonfarm proprietors' income.
The $1.4 billion decrease in real PCE in May reflected a decrease in spending for services that was partially offset by an increase in spending for goods. Within goods, recreational goods and vehicles was theleading contributor to the increase. Within services, the largest contributor to the decrease was spending for household utilities.
NIKE (NKE) reported Q4 FY 2018 earnings of $0.69 per share (versus $0.60 in Q4 FY 2017), beating analysts' consensus estimate of $0.64.
The company's quarterly revenues amounted to $9.789 bln (+12.8% y/y), beating analysts' consensus estimate of $9.404 bln.
NKE (NKE) also moved up slightly its FY 2019 revenues expectations to a high single-digit range (prior mid- to high-single digit range); Q1 revenues growth is projected at same level versus analysts' consensus of +8%.
NKE rose to $78.90 (+10.04%) in pre-market trading.
Euro area annual inflation is expected to be 2.0% in June 2018, up from 1.9% in May 2018, according to a flash estimate from Eurostat, the statistical office of the European Union. Looking at the main components of euro area inflation, energy is expected to have the highest annual rate in June (8.0%, compared with 6.1% in May), followed by food, alcohol & tobacco (2.8%, compared with 2.5% in May), services (1.3%, compared with 1.6% in May) and non-energy industrial goods (0.4%, compared with 0.3% in May).
The UK's current account deficit was £17.7 billion (3.4% of gross domestic product (GDP)) in Quarter 1 (Jan to Mar) 2018, a narrowing of £1.8 billion from a revised deficit of £19.5 billion (3.8% of GDP) in Quarter 4 (Oct to Dec) 2017.
The UK's current account deficit narrowed primarily due to a narrowing of both the trade deficit and the primary income deficit, partially offset by a widening of the secondary income deficit in Quarter 1 (Jan to Mar) 2018.
The total trade deficit narrowed to £3.8 billion in Quarter 1 2018, from £5.7 billion in Quarter 4 2017.
In the three months to April 2018, services output increased by 0.2% compared with the three months ending January 2018; this is the lowest rate of growth since the three months to November 2017.
Government and other services made the largest contribution to the three-month on three-month growth, contributing 0.11 percentage points.
The Index of Services increased by 0.3% between March 2018 and April 2018; this is the highest month-on-month growth since November 2017.
Retail trade was the main contributor to the month-on-month increase, contributing 0.11 percentage points.
UK gross domestic product (GDP) in volume terms was estimated to have increased by 0.2% between Quarter 4 (Oct to Dec) 2017 and Quarter 1 (Jan to Mar) 2018; the 0.1 percentage points upward revision since the second estimate reflects improvements to the measurement of construction output.
The services industries increased by 0.3% in Quarter 1 2018, continuing to show a weakening in domestic consumer-facing activities; while construction decreased by 0.8%.
Household spending grew by 0.2%, while business investment decreased by 0.4% between Quarter 4 2017 and Quarter 1 2018.
GDP was estimated to have increased by 1.7% between 2016 and 2017, a downward revision of 0.1 percentage points from the second estimate; this was slightly lower than the 1.8% growth seen between 2015 and 2016.
The KOF Economic Barometer rose again in June for the first time in three months. It increased by 1.7 points to 101.7 points, stopping its downward tendency in spring. The current Barometer value is now slightly above the long-term average of 100.0. Thus, the KOF Economic Barometer indicates a slightly above-average economic development in Switzerland. The tailwind for the Swiss economy is no longer as strong as during winter.
Over a year, the Consumer Price Index (CPI) should accelerate barely in June 2018, to +2.1% after +2.0%, according to the provisional estimate made at the end of the month. This rise in the year-on-year inflation should result, as the previous month, from a year-on-year acceleration in energy prices, and to a lesser extent, in food product prices. In contrast, services prices should slowdown. In the end, manufactured product prices should drop at the same pace as in the previous month.
Over one month, consumer prices should slow down slightly in June, to +0.1% after +0.4% in May. This lower rise should come from a slowdown in energy prices and a seasonal downturn in food prices. Moreover, services prices should rise at the same pace as in the previous month: the drop in the rent prices in social housing should be offset by a seasonal rebound in transport services prices. Up in the previous month, manufactured product prices should be stable in June.
In May 2018, 3,407 new dwellings were consented - the highest monthly number since 3,447 in June 2004.
The 1,530 new dwellings consented in Auckland is the highest monthly number since 1,945 were consented in October 2002.
The seasonally adjusted number of new dwellings rose 7.1 percent, following a 3.6 percent fall in April, and 13 percent rise in March. For houses only, the seasonally adjusted number rose 6.5 percent.
EUR/USD
Resistance levels (open interest**, contracts)
$1.1730 (1747)
$1.1699 (1074)
$1.1675 (944)
Price at time of writing this review: $1.1637
Support levels (open interest**, contracts):
$1.1574 (2789)
$1.1548 (2519)
$1.1515 (4948)
Comments:
- Overall open interest on the CALL options and PUT options with the expiration date July, 9 is 100392 contracts (according to data from June, 28) with the maximum number of contracts with strike price $1,1550 (4948);
GBP/USD
Resistance levels (open interest**, contracts)
$1.3268 (540)
$1.3230 (396)
$1.3171 (271)
Price at time of writing this review: $1.3111
Support levels (open interest**, contracts):
$1.3066 (1654)
$1.3042 (2465)
$1.3011 (974)
Comments:
- Overall open interest on the CALL options with the expiration date July, 9 is 24185 contracts, with the maximum number of contracts with strike price $1,3650 (2456);
- Overall open interest on the PUT options with the expiration date July, 9 is 31233 contracts, with the maximum number of contracts with strike price $1,3250 (2606);
- The ratio of PUT/CALL was 1.29 versus 1.28 from the previous trading day according to data from June, 28.
* - The Chicago Mercantile Exchange bulletin (CME) is used for the calculation.
** - Open interest takes into account the total number of option contracts that are open at the moment.
As reported by the Federal Statistical Office (Destatis), the index of import prices increased by 3.2% in May 2018 compared with the corresponding month of the preceding year. In April and in March 2018 the annual rates of change were +0.6% and -0.1%, respectively. From April 2018 to May 2018 the index increased by 1.6%.
The index of import prices, excluding crude oil and mineral oil products, increased by 0.7% compared with the level of a year earlier.
The index of export prices increased by 1.3% in May 2018 compared with the corresponding month of the preceding year. In April and in March 2018 the annual rates of change were +0.7%, each. From April 2018 to May 2018 the export price index rose by 0.5%.
Consumer price inflation for Tokyo rose to 0.6 percent in June from 0.4 percent in May.
Excluding fresh food and energy, inflation climbed to 0.4 percent from 0.2 percent.
Japan's unemployment rate decreased in May to the lowest level in nearly twenty six years, according to rttnews.
The seasonally adjusted jobless rate dropped to 2.2 percent in May from 2.5 percent in April.
Moreover, this was the lowest unemployment rate since July 1992, when it marked 2.1 percent.
The number of unemployed people totaled 1.51 million in May, down from 1.72 million in the previous month.
The first half of 2018 has seen a downward trend in new house sales. Sales across the five mainland states declined by 4.4 per cent in May, representing a fifth consecutive monthly fall. Sales are now 14.1 per cent lower than in May 2017. The deterioration of sales over the year to date reflects the shifts in housing market conditions. The availability of credit has tightened over the past 12 months with banks responding to the decline in house prices and the Banking Royal Commission.


© 2000-2026. All rights reserved.
This site is managed by Teletrade D.J. LLC 2351 LLC 2022 (Euro House, Richmond Hill Road, Kingstown, VC0100, St. Vincent and the Grenadines).
The information on this website is for informational purposes only and does not constitute any investment advice.
The company does not serve or provide services to customers who are residents of the US, Canada, Iran, The Democratic People's Republic of Korea, Yemen and FATF blacklisted countries.
Making transactions on financial markets with marginal financial instruments opens up wide possibilities and allows investors who are willing to take risks to earn high profits, carrying a potentially high risk of losses at the same time. Therefore you should responsibly approach the issue of choosing the appropriate investment strategy, taking the available resources into account, before starting trading.
Use of the information: full or partial use of materials from this website must always be referenced to TeleTrade as the source of information. Use of the materials on the Internet must be accompanied by a hyperlink to teletrade.org. Automatic import of materials and information from this website is prohibited.
Please contact our PR department if you have any questions or need assistance at pr@teletrade.global.
transfers