- Analytics
- News and Tools
- Market News
CFD Markets News and Forecasts — 29-05-2024
- GBP/USD trades softer around 1.2695 on the firmer USD on Thursday.
- Investors await the US Q1 GDP on Thursday, which is expected to expand by 1.3%.
- A softer UK inflation outlook triggered the rate cut expectation from the BoE.
The GBP/USD pair weakens to 1.2695 during the early Asian session on Thursday. The downtick of the pair is supported by the stronger US Dollar (USD) amid the higher US yields and lower bets of the Federal Reserve (Fed) rate cut in September.
In recent weeks, Fed officials delivered a cautious tone on the inflation outlook, prompting traders to lower their bets on an easing cycle this year. Markets are pricing in a 50% chance that the Fed will hold interest rates in September, according to the CME FedWatch Tool. The combination of the Fed’s cautious stance and the stronger US economic data provide some support for the Greenback in the previous sessions.
Investors will take more cues from the second estimate of the US Gross Domestic Product (GDP) for Q1 2024 on Thursday, which is expected to grow 1.3%. If the report shows a stronger-than-expected reading, this might further boost the USD and create a headwind for GBP/USD. Apart from this, the US weekly Initial Jobless Claims, Goods Trade Balance, and Pending Home Sales are due later in the day. Also, the Fed’s Raphael Bostic, John Williams, and Lorie Logan are scheduled to speak.
On the GBP’s front, the growing speculation that the Bank of England (BoE) will start cutting interest rates in its August meeting due to a softer UK inflation outlook weighs on the Cable. The International Monetary Fund (IMF) expected two to three rate cuts from the BoE. In the absence of top-tier economic data releases from the UK, election speculation may influence the Pound Sterling (GBP). Concerns about political uncertainty might undermine the GBP and cap the upside for the pair in the near term.
New Zealand issued -1.9% fewer Building Permits in April than the previous month's -0.2% decline.
Stats NZ noted that the actual number of new dwellings consented during the year ended April 2024 was 35,401, down 23% from the same time last year.
According to Stats NZ, "The number of new dwellings consented per 1,000 residents across New Zealand was 6.7 for the year ended April 2024, compared with 8.9 in the year ended April 2023. The record number of new dwellings consented per 1,000 residents was 13.4 in the year ended December 1973."
Stats NZ also noted that investment in non-residential buildings fell 1.2% for the year ended April, with office space and administration declining -10% to $1.6 billion, while hospitals and healthcare rose 6.3% to $1.5 billion YoY in April.
Market reaction
The Kiwi is trading tightly just above the 0.6100 handle as NZD traders gear up for the latest NZ Budget Release, with Reserve Bank of New Zealand (RBNZ) Governor Adrian Orr expected to deliver talking points early Friday.
Economic Indicator
About New Zealand's seasonally-adjusted Building Permits
The Building Permits s.a. released by the Statistics New Zealand show the number of permits for new construction projects. It is considered as a leading indicator for the housing market. The more growing number of permits, the more positive (or bullish) for the NZD, while a low reading is seen as negative, or bearish.
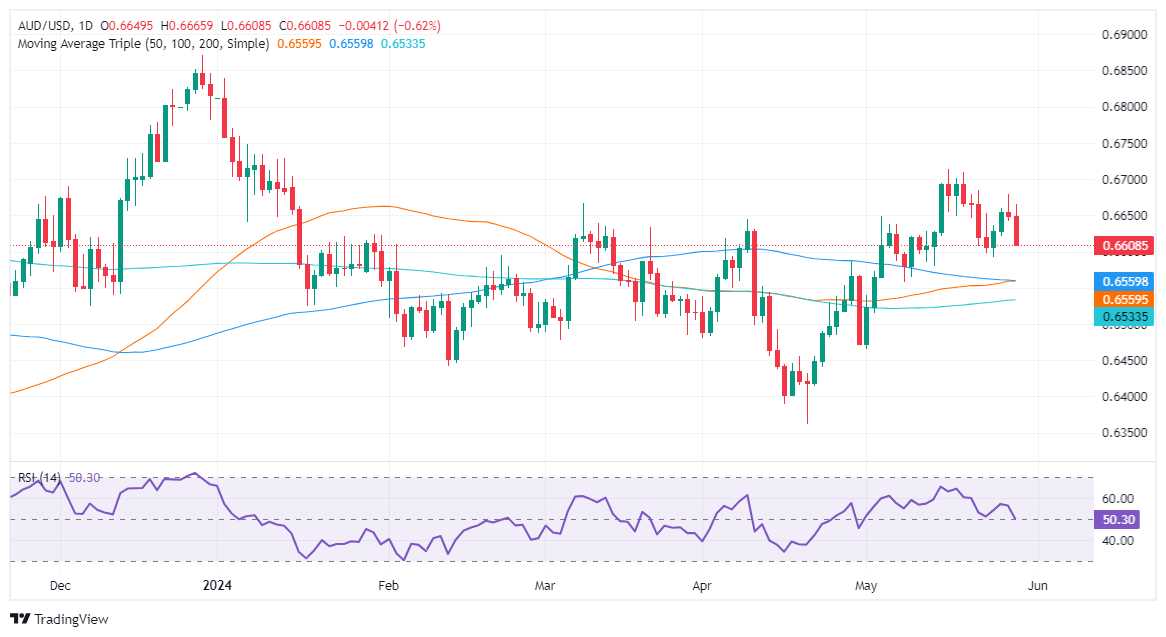
- AUD/USD declines to 0.6608 as US Treasury yields climb amid soft bond demand.
- Mixed regional Fed surveys and hawkish remarks from Fed’s Kashkari impact market sentiment.
- Australian CPI rises to 3.6% YoY in April; analysts expect rate cuts starting in November.
The Aussie Dollar tumbled more than 0.50% on Wednesday versus the Greenback amid elevated US Treasury yields, as another bond auction witnessed softer demand. A scarce economic docket in the United States (US) featured the release of regional Fed surveys, which were mixed. The AUD/USD trades at 0.6608, almost flat as Thursday’s Asian session commences.
AUD/USD falls towards 0.6600 on hawkish Fed comments, high US yields
Sentiment remains sour as Wall Street ended Wednesday's session in the red. Investors were rattled by Tuesday’s uber-hawkish tilt of Minneapolis Fed President Neel Kashkari, who commented that rate hikes are not off the table. When questioned about lowering interest rates, he said that he expects no more than two cuts.
Meanwhile, data from the Chicago Board of Trade (CBOT) shows that investors had priced in 25 basis points of rate cuts in 2024, according to December’s 2024 fed funds future contract.
Data-wise, the US economic schedule featured regional Fed activity surveys index for May, which were mixed. The Richmond Fed Manufacturing Index improved to 0, from a -7 plunge in the last print. The Dallas Fed Services Index weakened to -12.1, worse than April’s -10 contraction.
On the Aussie’s front, the monthly Consumer Price Index (CPI) rose to a five-month high of 3.6% YoY in April, up from 3.5% in March. According to ANZ analysts, “Disinflation in underlying inflation measures has also stalled. Our forecast for a November start to cash rate cuts is unchanged, although risks remain tilted towards a later start.”
The economic docket in Australia will feature a speech by Reserve Bank of Australia (RBA) Assistant Governor Sarah Hunter and data on Building Permits.
AUD/USD Price Analysis: Technical outlook
Despite remaining bullish-biased, the AUD/USD seems poised for a pullback if buyers fail to defend 0.6600. Momentum shows that sellers are stepping in, as the Relative Strength Index (RSI) pierced below the 50-midline. This could pave the way for increased selling pressure, driving prices lower.
In that event, key support levels emerge. The confluence of the 50- and 100-day moving averages (DMAs) is at around 0.6558/59, followed by the 200-DMA at 0.6531. Conversely, if buyers keep spot prices above 0.6600, if they gather traction, the pair could aim towards 0.6650.
Australian Dollar PRICE This week
The table below shows the percentage change of Australian Dollar (AUD) against listed major currencies this week. Australian Dollar was the strongest against the Euro.
| USD | EUR | GBP | JPY | CAD | AUD | NZD | CHF | |
|---|---|---|---|---|---|---|---|---|
| USD | 0.43% | 0.32% | 0.41% | 0.39% | 0.30% | 0.03% | -0.16% | |
| EUR | -0.43% | -0.14% | 0.00% | -0.05% | -0.19% | -0.49% | -0.54% | |
| GBP | -0.32% | 0.14% | 0.08% | 0.07% | -0.04% | -0.28% | -0.43% | |
| JPY | -0.41% | 0.00% | -0.08% | -0.05% | -0.12% | -0.29% | -0.58% | |
| CAD | -0.39% | 0.05% | -0.07% | 0.05% | -0.10% | -0.36% | -0.59% | |
| AUD | -0.30% | 0.19% | 0.04% | 0.12% | 0.10% | -0.22% | -0.39% | |
| NZD | -0.03% | 0.49% | 0.28% | 0.29% | 0.36% | 0.22% | -0.18% | |
| CHF | 0.16% | 0.54% | 0.43% | 0.58% | 0.59% | 0.39% | 0.18% |
The heat map shows percentage changes of major currencies against each other. The base currency is picked from the left column, while the quote currency is picked from the top row. For example, if you pick the Australian Dollar from the left column and move along the horizontal line to the US Dollar, the percentage change displayed in the box will represent AUD (base)/USD (quote).
- EUR/USD backslid into 1.0800 on Wednesday as risk appetite withers.
- German inflation figures mixed in May, vexing ECB rate cut hopes.
- US GDP growth, PCE inflation data key print this week.
EUR/USD pulled back sharply on Wednesday, falling back to the 1.0800 handle after broad risk appetite evaporated. The pair is trading firmly into technical resistance as investors gear up for a batch of mid-tier European economic indicators on Thursday, followed by an update to US quarterly Gross Domestic Product (GDP) growth.
Forex Today: Fed rate cut bets dominate the scene
Pan-European Consumer Confidence in May is expected to hold steady at -14.3, while the overall Economic Sentiment Indicator is expected to recover slightly to 96.2 from 95.6. After that, US quarterly GDP is expected later in the day, with Annualized Q1 GDP forecast to ease slightly to 1.3% from 1.6%. Markets hungry for rate cuts from the Federal Reserve (Fed) will be looking for signs of softening in the US economy as firm growth, a tight labor market, and still-high inflation figures hamper the Fed’s ability to deliver rate cuts at a pace that investors continue to look for.
At current cut, the CME’s FedWatch Tool is pricing in slightly-better-than-even odds that the Fed will be holding rates steady in September, but hopeful traders are continuing to look for reasons to step up rate cut bets.
The trading week will close off with German Retail Sales on Friday, which are expected to contract -0.1% MoM in May. Pan-European Core Harmonized Index of Consumer Prices (HICP) for the year ended in May is forecast to tick upwards to 2.8% from 2.7%. US inflation data will close out the trading week, with US Core Personal Consumption Expenditures (PCE) Price Index inflation expected to hold flat at 0.3% MoM in April.
EUR/USD technical outlook
EUR/USD has drifted back into the 200-day Exponential Moving Average (EMA) at 1.0802, falling sharply lower after failing to recapture the 1.0900 handle. The pair remains down in 2024, falling -2.15% from the year’s opening bids near 1.1035.
Despite being on the downside, the pair is holding on the high side in the near-term, up 1.8% from the April swing low into 1.0600.
EUR/USD daily chart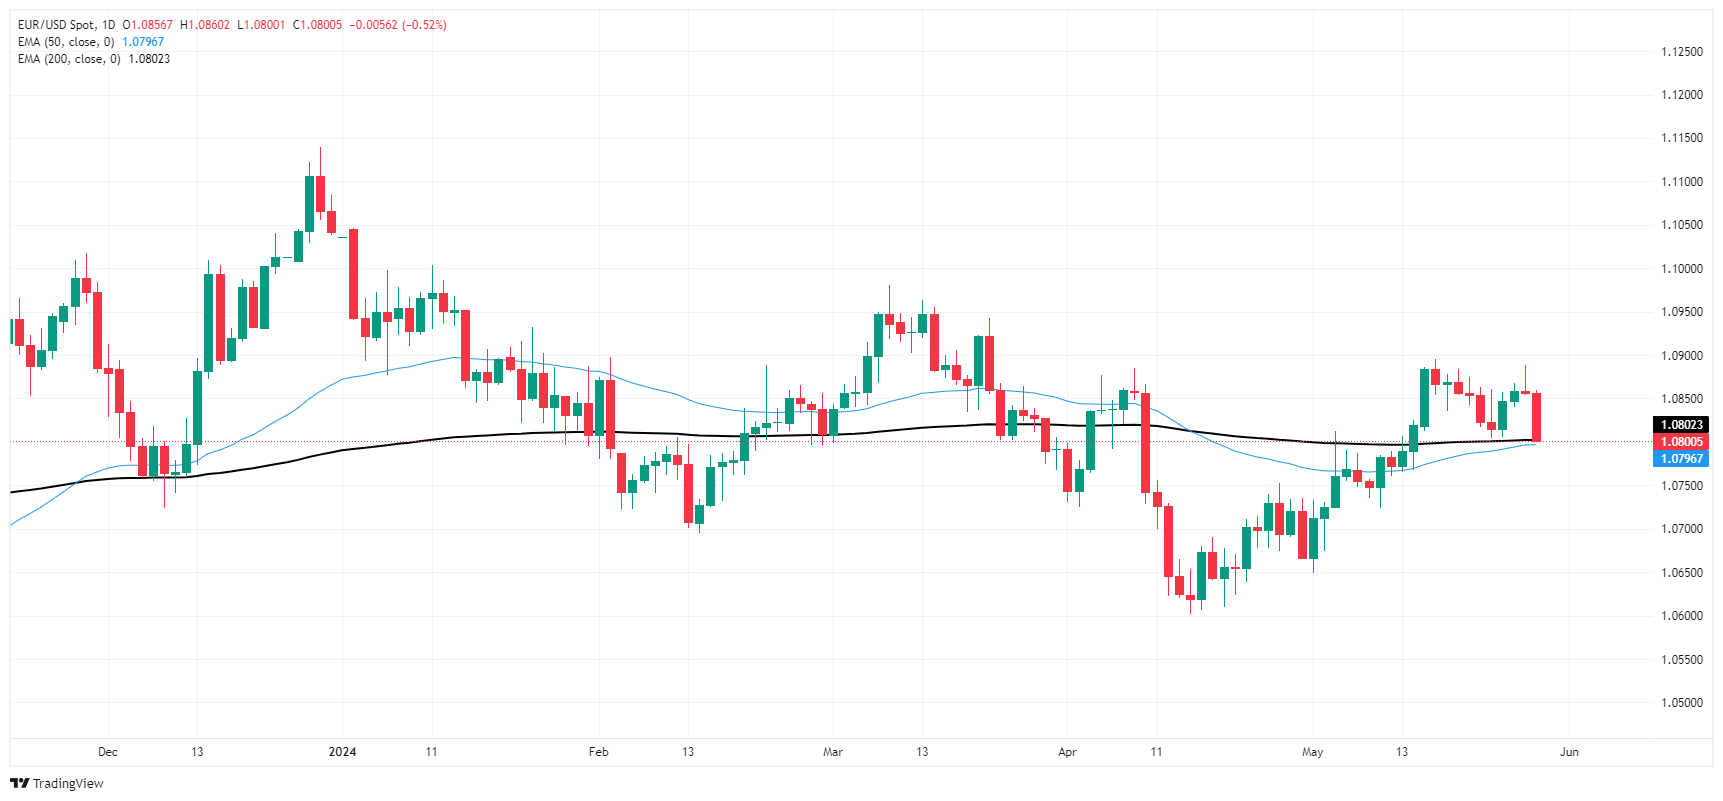
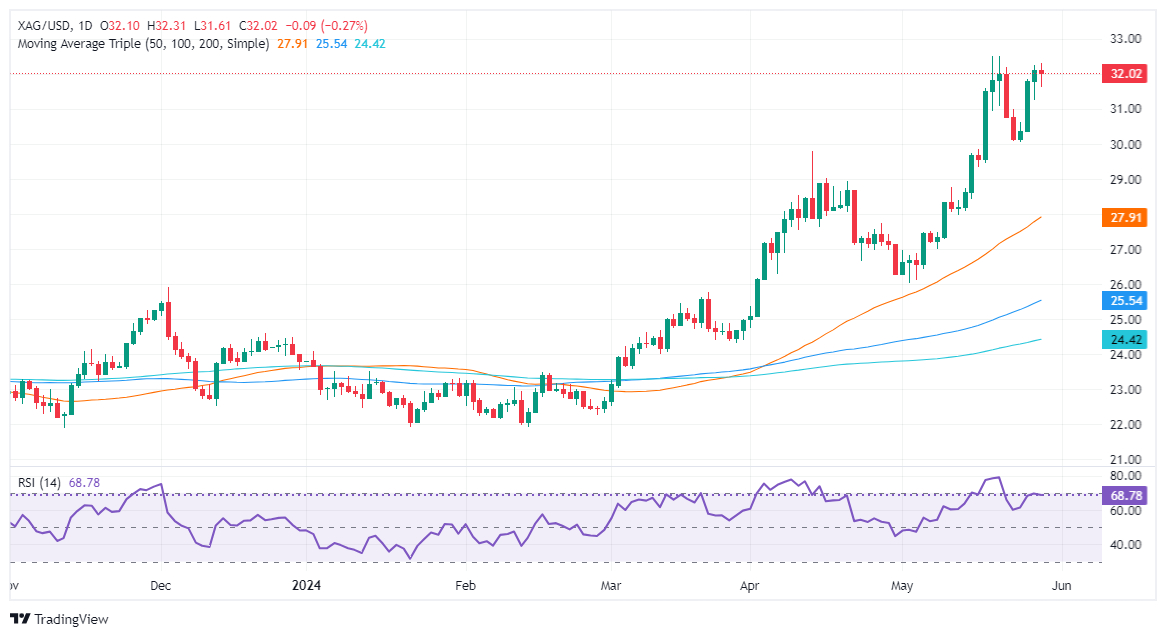
- Silver prices dropped on Wednesday, closing the session at $31.97.
- Price action suggests ‘double top’ looming, yet pending validation.
- Watch key levels: $31.00 psychological support, May 24 high at $30.61, and $30.00 for pattern confirmation.
Silver prices posted modest losses of 0.32% on Wednesday as US Treasury bond yields edged up, downward pressure on precious metals. Therefore, the XAG/USD retreated after hitting a six-day high of $32.29, and as the Asian session began, it traded at $31.97, almost flat.
XAG/USD Price Analysis: Technical outlook
Silver is upward based, but a ‘double top’ chart pattern seems to be forming on the daily chart. Momentum supports buyers, yet they’re losing steam as the Relative Strength Index (RSI) is flat near overbought conditions.
For confirmation of a ‘double top,’ the grey metal needs to drop below $30.00 a troy ounce. Nevertheless, on its way there, the XAG/USD needs to clear the $31.00 psychological level, followed by the May 24 high of $30.61, ahead of the $30.00 mark.
If XAG/USD buyers reclaim $32.00, that could pave the way to re-test the year-to-date (YTD) high of $32.51.
XAG/USD Price Action – Daily Chart
- The daily chart continues to flash overbought signals despite a slight correction, with the overall uptrend still intact.
- Despite a minor dip to 96.40, NZD/JPY remains near its multi-year peak.
- The critical support level for the pair remains firmly at 95.00, marking a pivotal level to ward off losses.
In Wednesday's session, the NZD/JPY pair saw a small correction to 96.40 but remains at its highest level since July 2007 at around 96.70. This adjustment doesn't quite alter the current outlook, merely turning it slightly cautious given the persistent overbought signals, but the overarching bullish trend carries on.
The daily chart's indicators confirm this narrative where the Relative Strength Index (RSI) remains in a deep overbought condition. Meanwhile, the Moving Average Convergence Divergence (MACD) keeps showing sustained positive momentum with its consistent green bars.
NZD/JPY daily chart
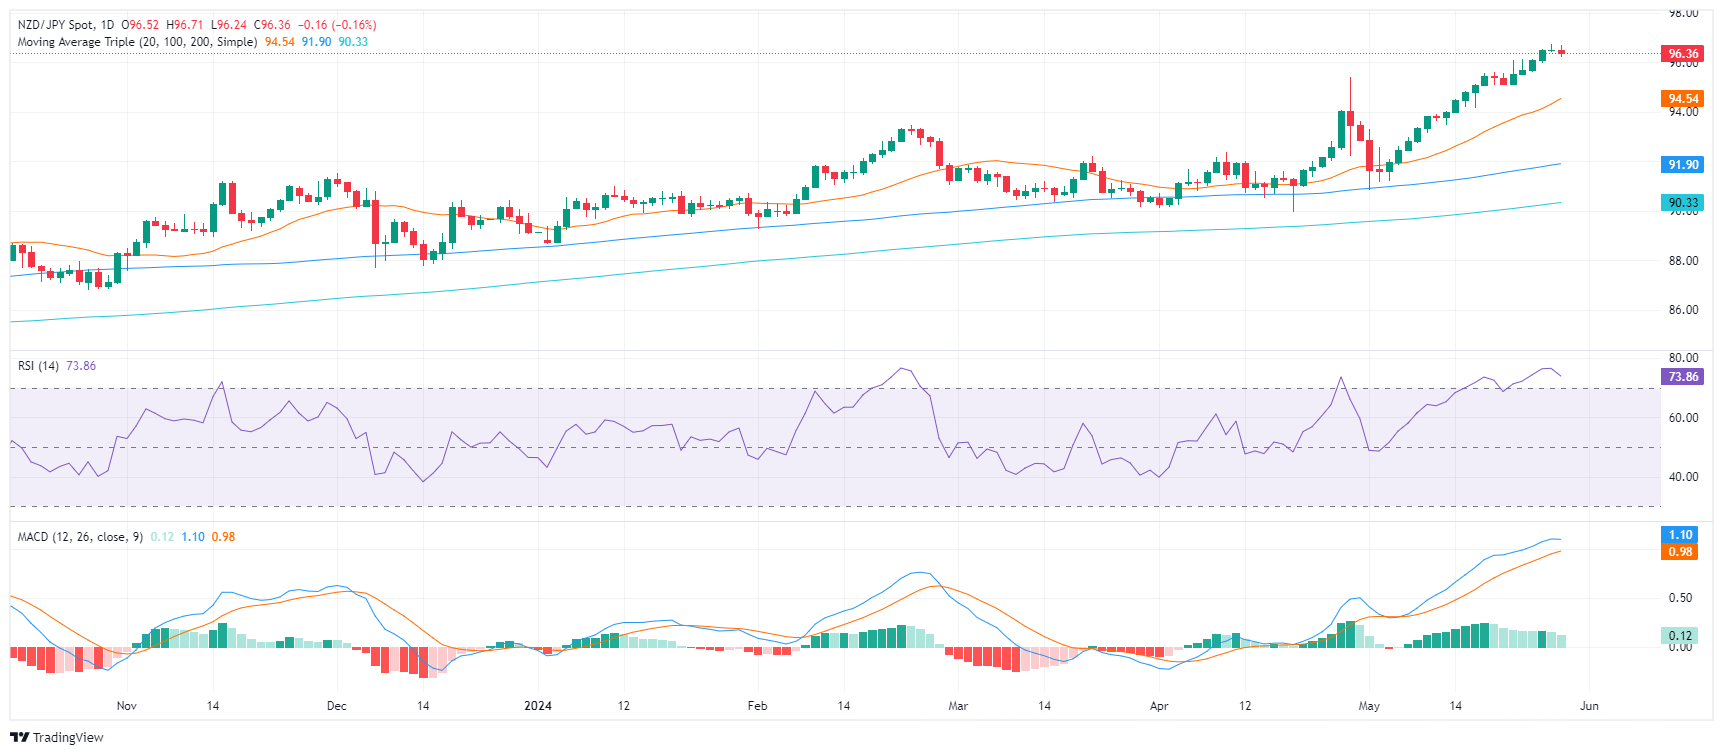
On the hourly chart, there is a visible weakening of strength compared to the daily perspective, and an ongoing edging downward can be observed.
NZD/JPY hourly chart
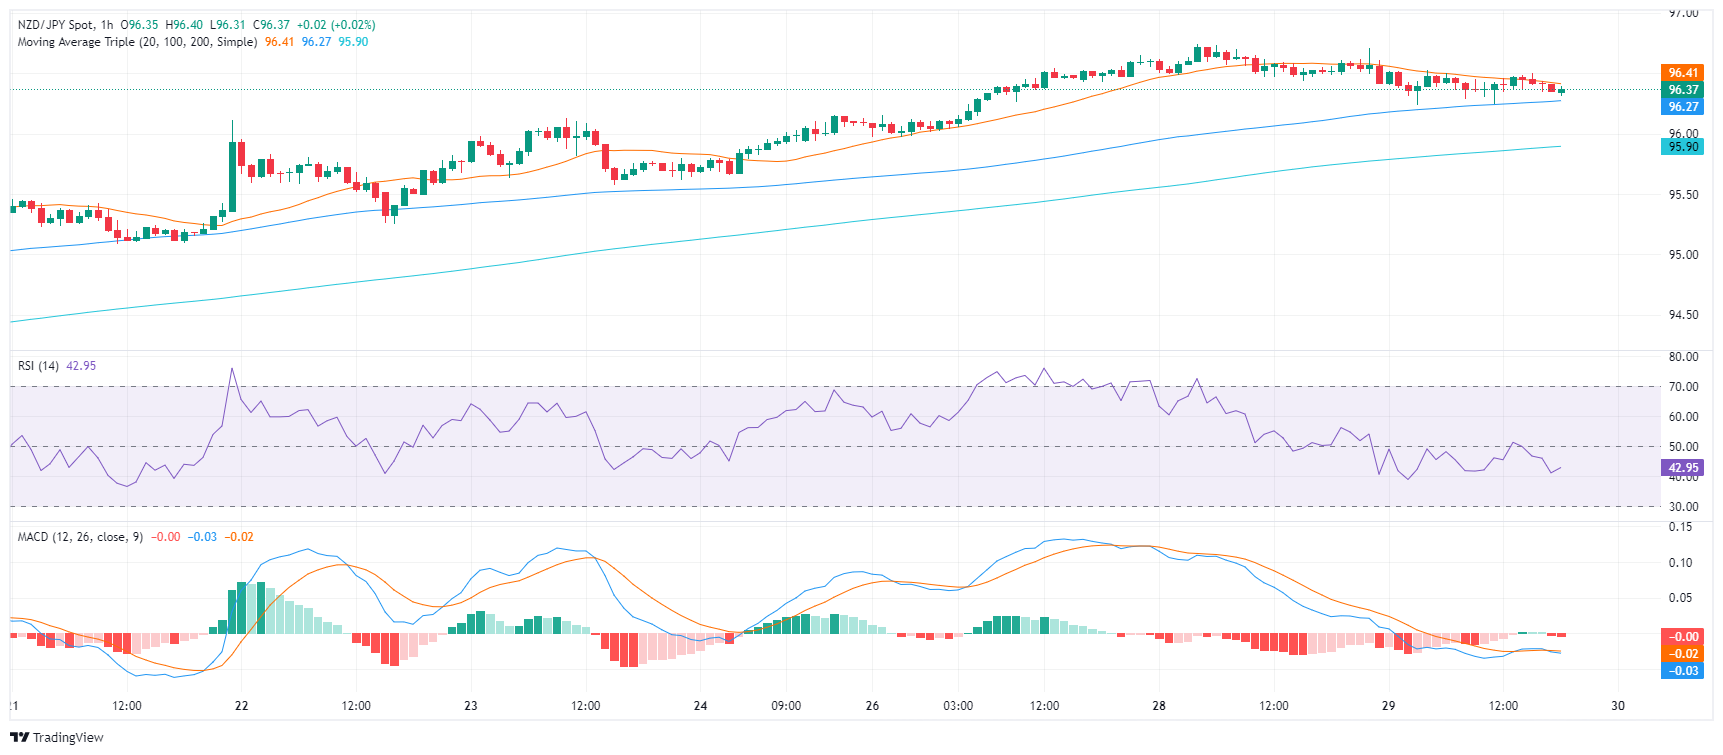
In a broader context, the NZD/JPY continues to display a strong uptrend, as shown by its position above the 20, 100, and 200-day Simple Moving Averages (SMA). Despite the slight correction, the pair's short-term gains still overshadow its medium and long-term averages.
As the looming correction gains momentum, any further downward movements should ideally keep the pair above its SMAs. Crucial to the monitoring is the first strong support level observed at 95.00, which the pair could potentially use to cushion any significant losses.
- GBP/JPY shifted back after hitting fresh 34-year highs.
- The Guppy is buried deep in bullish territory.
- JPY traders await Friday’s Japanese Tokyo CPI inflation.
GBP/JPY fell back slightly on Wednesday, easing to 200.30 through the day but sticking close to multi-decade highs near 200.75. The pair has drifted into bullish territory as markets shrug off suspected “Yenterventions” from the Bank of Japan (BoJ), which remain as-yet unconfirmed.
Despite potential direct intervention in global FX markets, the Yen continues to sag into the low end. A wide interest rate differential between the Yen and all other major global currencies is keeping JPY flows on the short side, and repeated warnings from BoJ policymakers is having a limited impact on markets that continue to sell the Yen across the board.
Japanese Tokyo Consumer Price Index (CPI) inflation due early Friday will draw attention from Yen traders. The BoJ has held interest rates at critically-low levels for years as the central bank tries to keep inflation from sinking back into stagnation levels, and this week’s Tokyo CPI inflation print will tell if the BoJ’s policies are working. At current cut, Tokyo CPI inflation for the year ended in May last printed at 1.8%. Core Tokyo CPI YoY in May is expected to rebound to 1.9% versus the previous 1.6%.
GBP/JPY technical outlook
GBP/JPY is tentatively down on Wednesday, but still remains buried deep in bull country, having closed in the green for all but four of the last 18 consecutive trading days. The pair is holding near the 200.00 major price handle, and remains up 11.5% in 2024.
The Guppy hit fresh 34-year highs of 200.75 this week, and the pair is trading steeply above the 200-day Exponential Moving Average (EMA) at 187.60.
GBP/JPY daily chart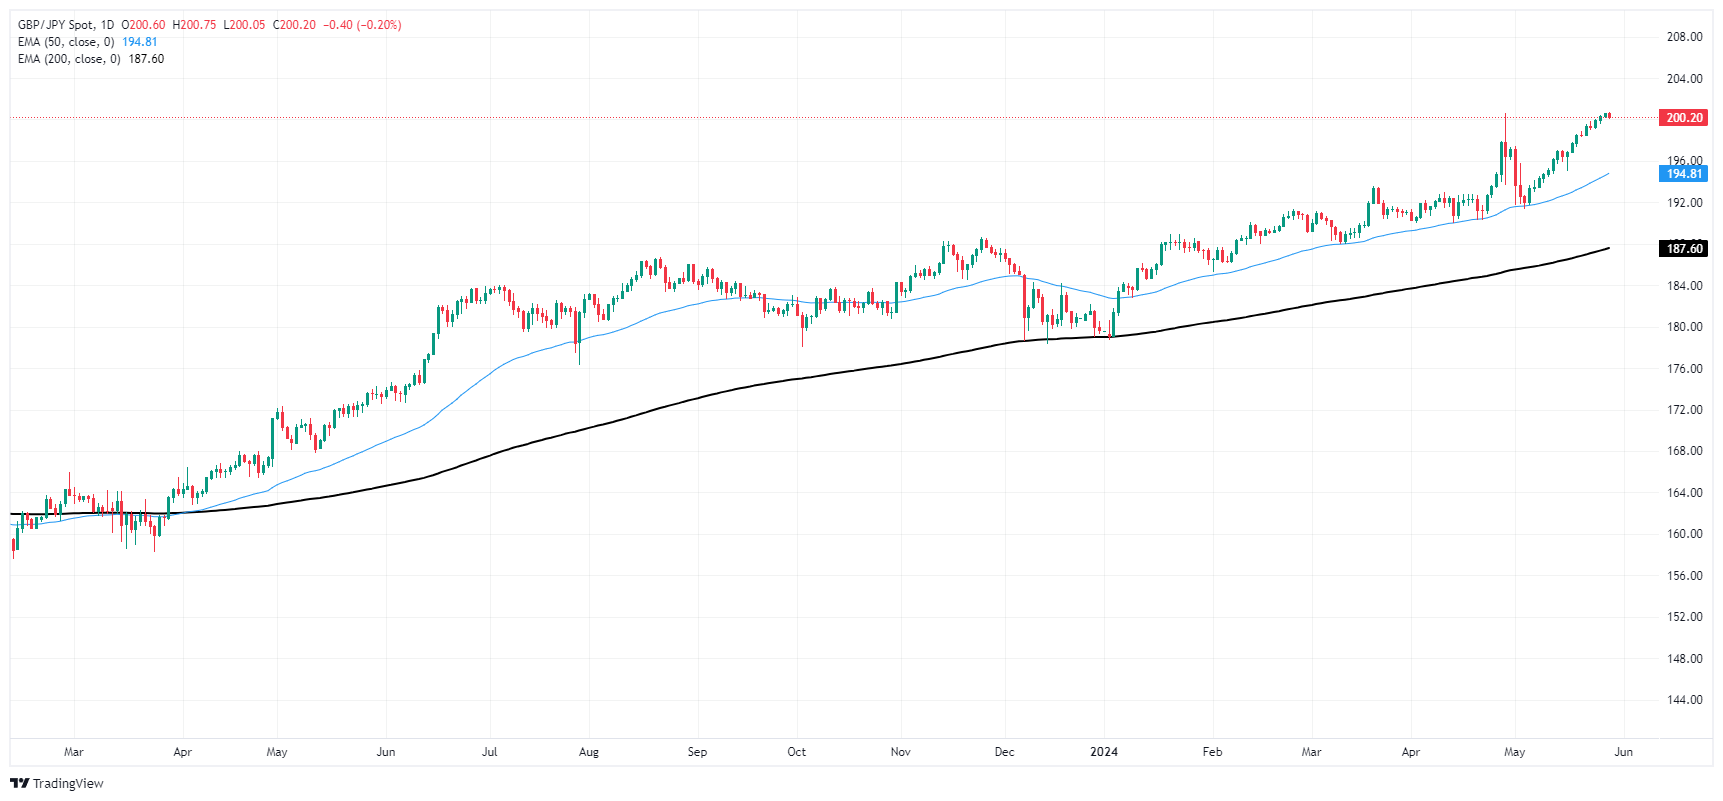
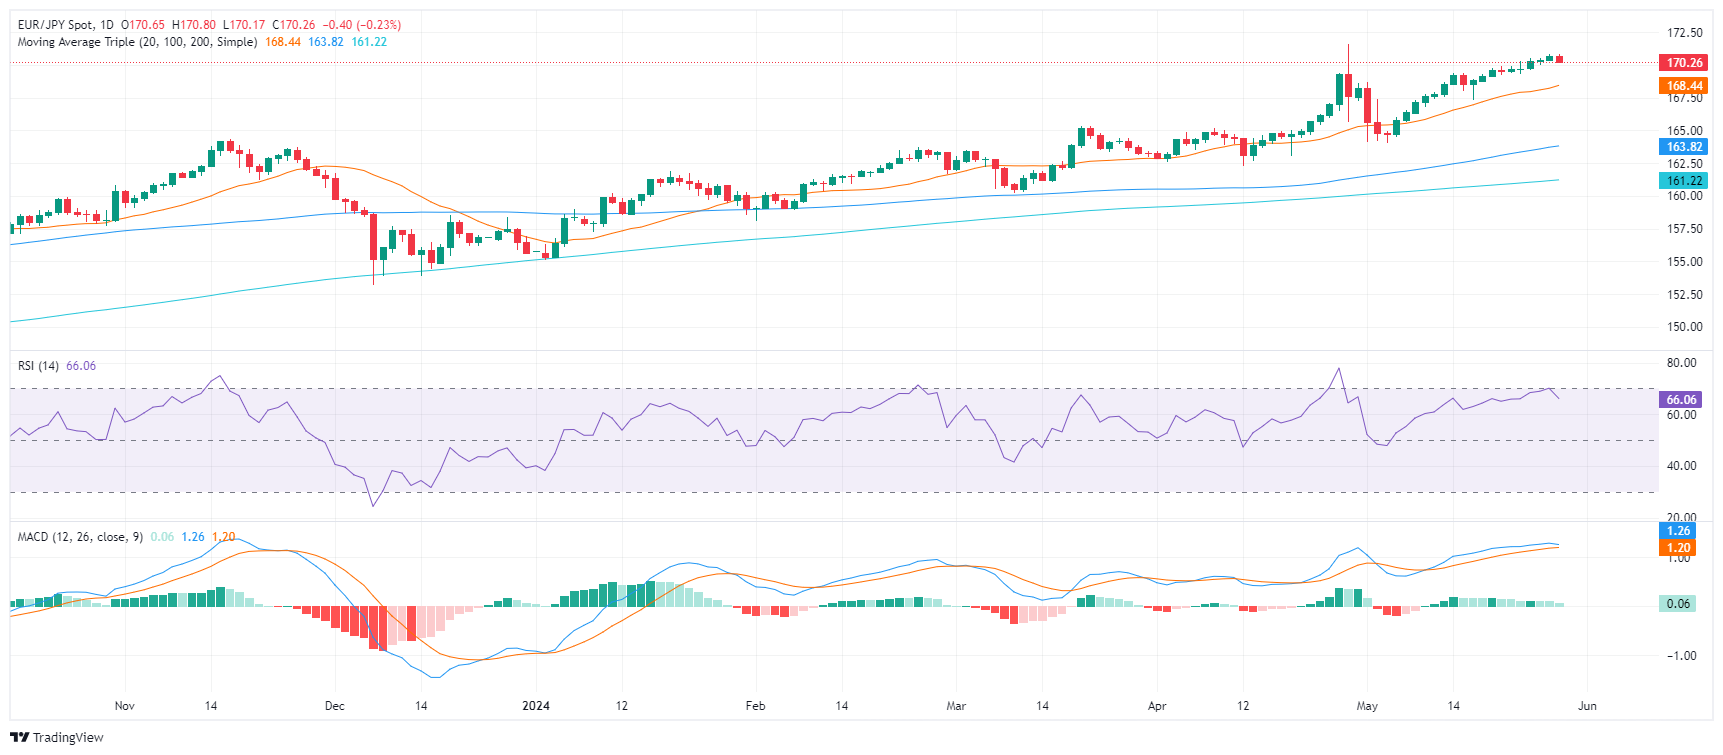
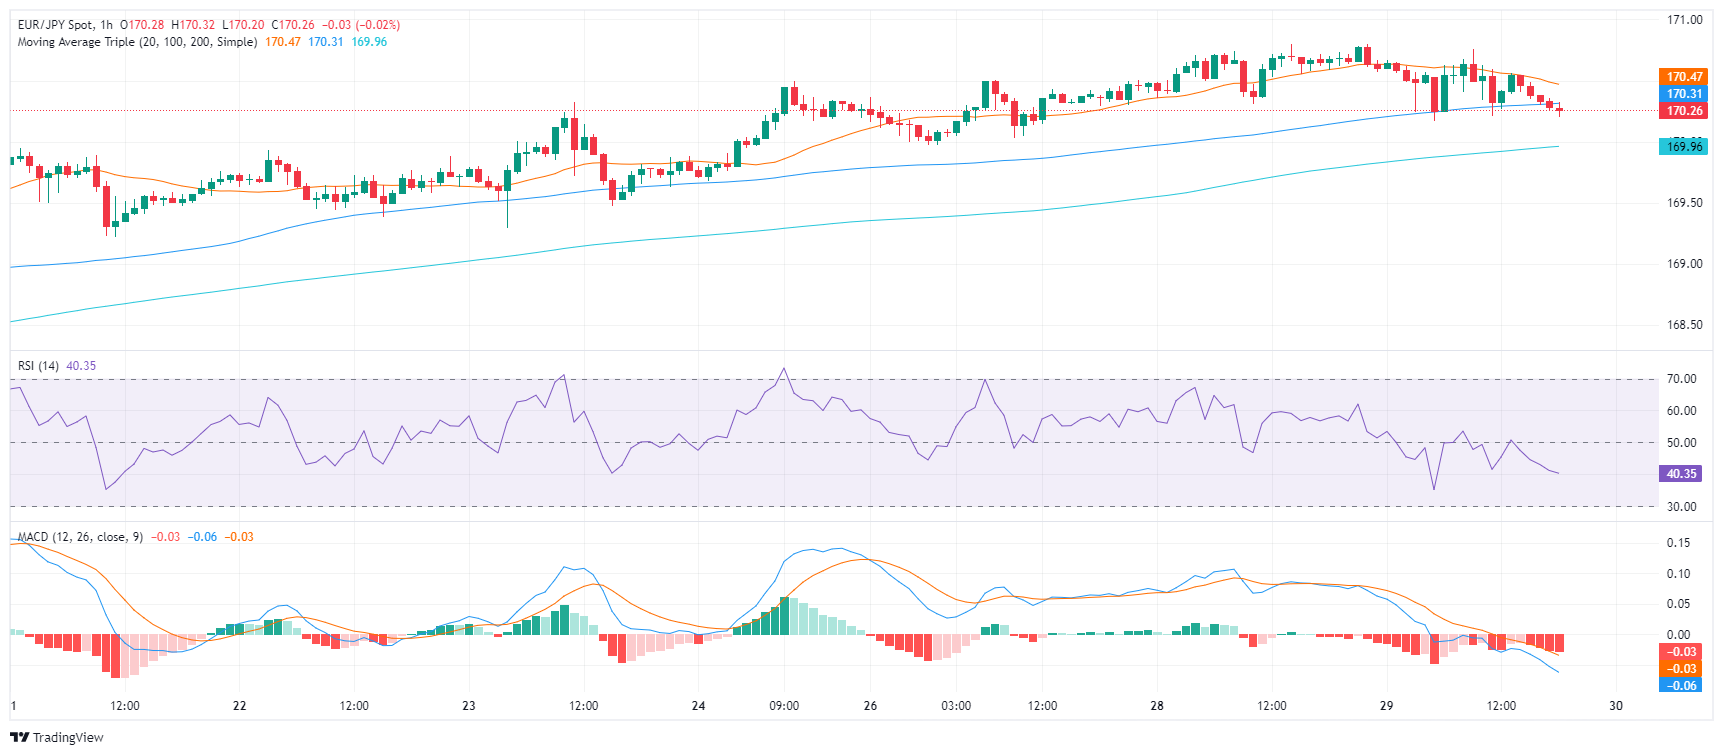
- The daily RSI and MACD are edging downwards but remain in positive territory hinting at a possible consolidation phase that could be brief.
- On the hourly chart, indicators have shifted into the negative zone, further pointing towards an ongoing correction phase.
- The EUR/JPY's position above main SMAs keeps a long-term bullish sentiment alive despite the recent pullback.
In Wednesday's session, the EUR/JPY pair retreated slightly to 170.29, demonstrating an immediate dampening of the bullish momentum. However, since it remains close to cycle highs of 171.60, the consolidation period might not last long. Traders should observe the 170-168.00 range for potential correction movements before affirming changes to the outlook.
In the daily analysis, the Relative Strength Index (RSI) and the Moving Average Convergence Divergence (MACD) indicate a slight downward movement but still remain in the positive region. Both demonstrate the stopped short bullish trend which may lead to a short consolidation phase.
EUR/JPY daily chart
On the hourly chart, both RSI and MACD have now edged into the negative zone, corroborating with the indication of an ongoing corrective phase, which is likely response to recent gains.
EUR/JPY hourly chart
Notably, the current position of the EUR/JPY pair above the 20-day SMA at 168.45, though threatened, maintains the short-term bullish sentiment. Any movements below this could, however, fundamentally shift the bullish scenario. Below it, the 100 and 200-day SMA offer additional supportive barriers in case sellers come in strong.
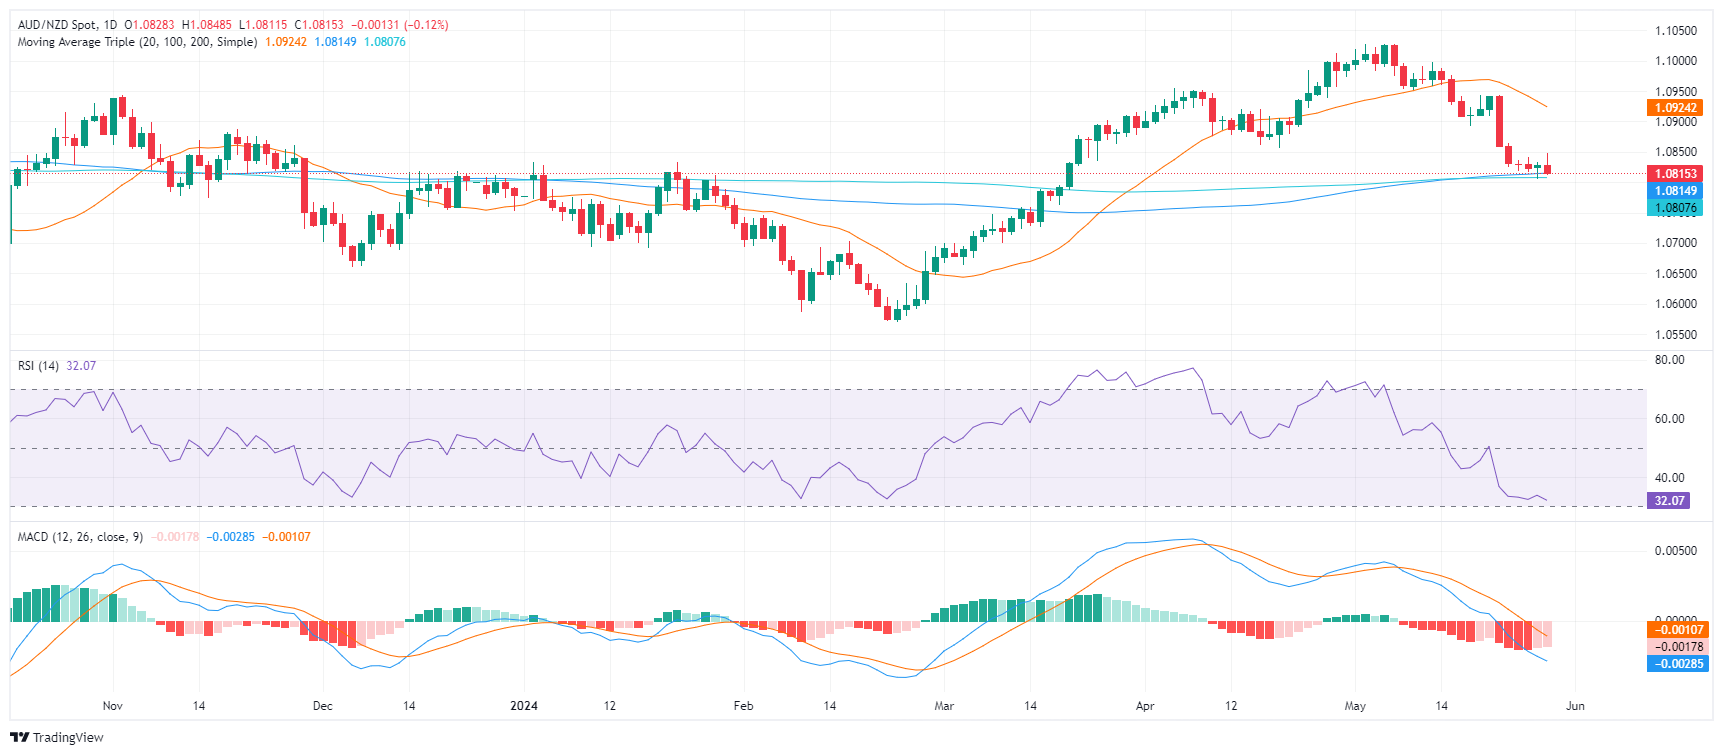
- The AUD/NZD declines to a low of 1.0815 after reaching a high of 1.0850 on Wednesday.
- Australian high-tier data tempers RBA's dovish expectations, while soft New Zealand data renews RBNZ policy divergence.
- Following downbeat ANZ data, the market bets over higher odds of an RBNZ rate cut in November.
The AUD/NZD was seen trading lower during Wednesday's trading session, as markets digest high-tier data from both Australia and New Zealand.
In Australia, April's Consumer Price Indxe (CPI) came in hot at 3.6% YoY, surpassing the 3.4% expectations and the previous month's 3.5%. This marked the second consecutive month of acceleration and is the highest inflation rate since November. With core inflation remaining sticky above 4%, there are strong signals that the Reserve Bank of Australia (RBA) might turn its tone to a more hawkish one.
Meanwhile, the disappointing ANZ business survey data for May became a focal point in New Zealand. The Own Activity Outlook index dropped to a low of 11.8 from 14.3 in April, hinting towards weaker growth. Recently sticky domestic inflation led to the RBNZ discussing a potential rate increase which led to a significant strengthening of the Kiwi, markets are betting that the first cut will come in November of this year, priced in by 65%.
AUD/NZD technical analysis
On the daily chart, the Relative Strength Index (RSI) remains in negative territory, indicating a robust downtrend. This is consolidated by the rising red bars of the Moving Average Convergence Divergence (MACD) histogram, which confirms the continued downward momentum.
That being said, as the pair approached oversold terrain, the pair may see a slight upward correction in the next sessions.
AUD/NZD daily chart
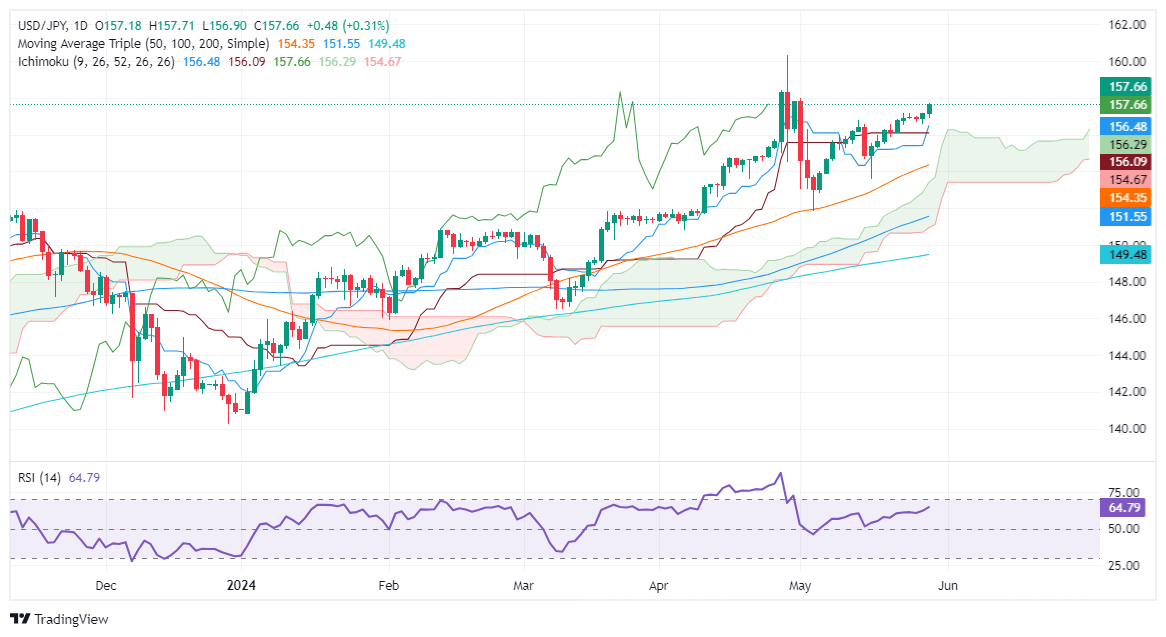
- USD/JPY rises to 157.67, driven by Federal Reserve's commitment to higher rates.
- Technical indicators show strong bullish momentum, with key resistance at 158.00.
- Intervention threats by Japanese authorities keep buyers cautious as pair advances.
The USD/JPY climbs to a four-week high yet it remains capped by intervention threats by Japanese authorities. Federal Reserve officials' tough stance on monetary policy, which was set to keep rates higher for longer, kept the US dollar bid. Therefore, the major rises some 0.30%, trading at 157.67.
USD/JPY Price Analysis: Technical outlook
After breaching stir resistance at the May 23 high of 157.19, the USD/JPY resumed its uptrend, yet buyers seem cautious as the pair advances moderately toward the 158.00 mark. Momentum is still on the buyer’s side, with price action standing above the Ichimoku Cloud (Kumo), the Tenkan-Sen crossing above the Kijun-Sen, and the Relative Strength Index (RSI) standing at bullish territory.
On further strength, the USD/JPY could challenge 158.00. Once surpassed, the next stop would be the April 26 high of 158.44, ahead of 159.00. Further gains lie overhead, like the year-to-date (YTD) high of 160.32.
Conversely, if sellers moved in and pushed prices below the 157.00 figure, that could pave the way for further losses. In that event, support is seen at the Kijun-Sen at 156.48, followed by the Senkou Span A at 156.25, ahead of the Tenkan-Sen at 156.05.
USD/JPY Price Action – Daily Chart
Japanese Yen PRICE Today
The table below shows the percentage change of Japanese Yen (JPY) against listed major currencies today. Japanese Yen was the strongest against the Euro.
| USD | EUR | GBP | JPY | CAD | AUD | NZD | CHF | |
|---|---|---|---|---|---|---|---|---|
| USD | 0.49% | 0.47% | 0.30% | 0.48% | 0.50% | 0.36% | 0.13% | |
| EUR | -0.49% | -0.02% | -0.20% | -0.02% | 0.00% | -0.14% | -0.37% | |
| GBP | -0.47% | 0.02% | -0.18% | -0.01% | 0.02% | -0.10% | -0.34% | |
| JPY | -0.30% | 0.20% | 0.18% | 0.16% | 0.20% | 0.11% | -0.18% | |
| CAD | -0.48% | 0.02% | 0.01% | -0.16% | 0.03% | -0.11% | -0.35% | |
| AUD | -0.50% | -0.01% | -0.02% | -0.20% | -0.03% | -0.14% | -0.33% | |
| NZD | -0.36% | 0.14% | 0.10% | -0.11% | 0.11% | 0.14% | -0.24% | |
| CHF | -0.13% | 0.37% | 0.34% | 0.18% | 0.35% | 0.33% | 0.24% |
The heat map shows percentage changes of major currencies against each other. The base currency is picked from the left column, while the quote currency is picked from the top row. For example, if you pick the Japanese Yen from the left column and move along the horizontal line to the US Dollar, the percentage change displayed in the box will represent JPY (base)/USD (quote).
- Crude Oil markets decline as investment sentiment recedes.
- Midweek market flows shed weight as Treasuries squeeze out risk appetite.
- WTI stumbles after hitting three-week highs.
West Texas Intermediate (WTI) US Crude Oil fell back on Wednesday, trimming recent gains and snapping a three-day bullish streak and falling back below $80.00 per barrel. Broad-market risk appetite is evaporating in the mid-week as investors balk at declining demand for US Treasuries and energy markets grow concerned ahead of US Crude Oil production counts.
Demand for US Treasuries declined this week, with bid-to-cover ratios on key bond auctions declining. Jittery investors are growing concerned about demand for US Treasuries, and pulling away from risk assets in search of safer pastures. The bid-to-cover on Wednesday’s 7-year Trasury note auction declined to 2.43 versus the previous 2.48.
The Organization of the Petroleum Exporting Countries (OPEC) and its extended network of non-member allies, OPEC+, are due to begin an online-only meeting this Sunday on June 2, and energy markets are broadly anticipating that OPEC+ will maintain voluntary production caps of a total 2.2 million bpd as the oil cartel grapples with supporting global Cruide Oil prices by crimping supply.
US Crude Oil production, meanwhile, continues to threaten to swamp out demand, and barrel traders are looking ahead to US Crude Oil barrel counts due this week.
Economic Indicator
EIA Crude Oil Stocks Change
The EIA Crude Oil stockpiles report is a weekly measure of the change in the number of barrels in stock of crude oil and its derivates, and it's released by the Energy Information Administration. This report tends to generate large price volatility, as oil prices impact on worldwide economies, affecting the most, commodity related currencies such as the Canadian dollar. Despite it has a limited impact among currencies, this report tends to affect the price of oil itself, and, therefore, had a more notorious impact on WTI crude futures.
Read more.Next release: Thu May 30, 2024 15:00
Frequency: Weekly
Consensus: -1.9M
Previous: 1.825M
WTI technical outlook
WTI US Crude Oil fell back under $80.00 per barrel on Wednesday, and crossing below the 200-day Exponential Moving Average (EMA) at $79.16. Crude Oil ius poised to end i nthe red for the first time in four straight trading days, and WTI remains down over 9% from the year’s peak bids just above $87.00.
WTI daily chart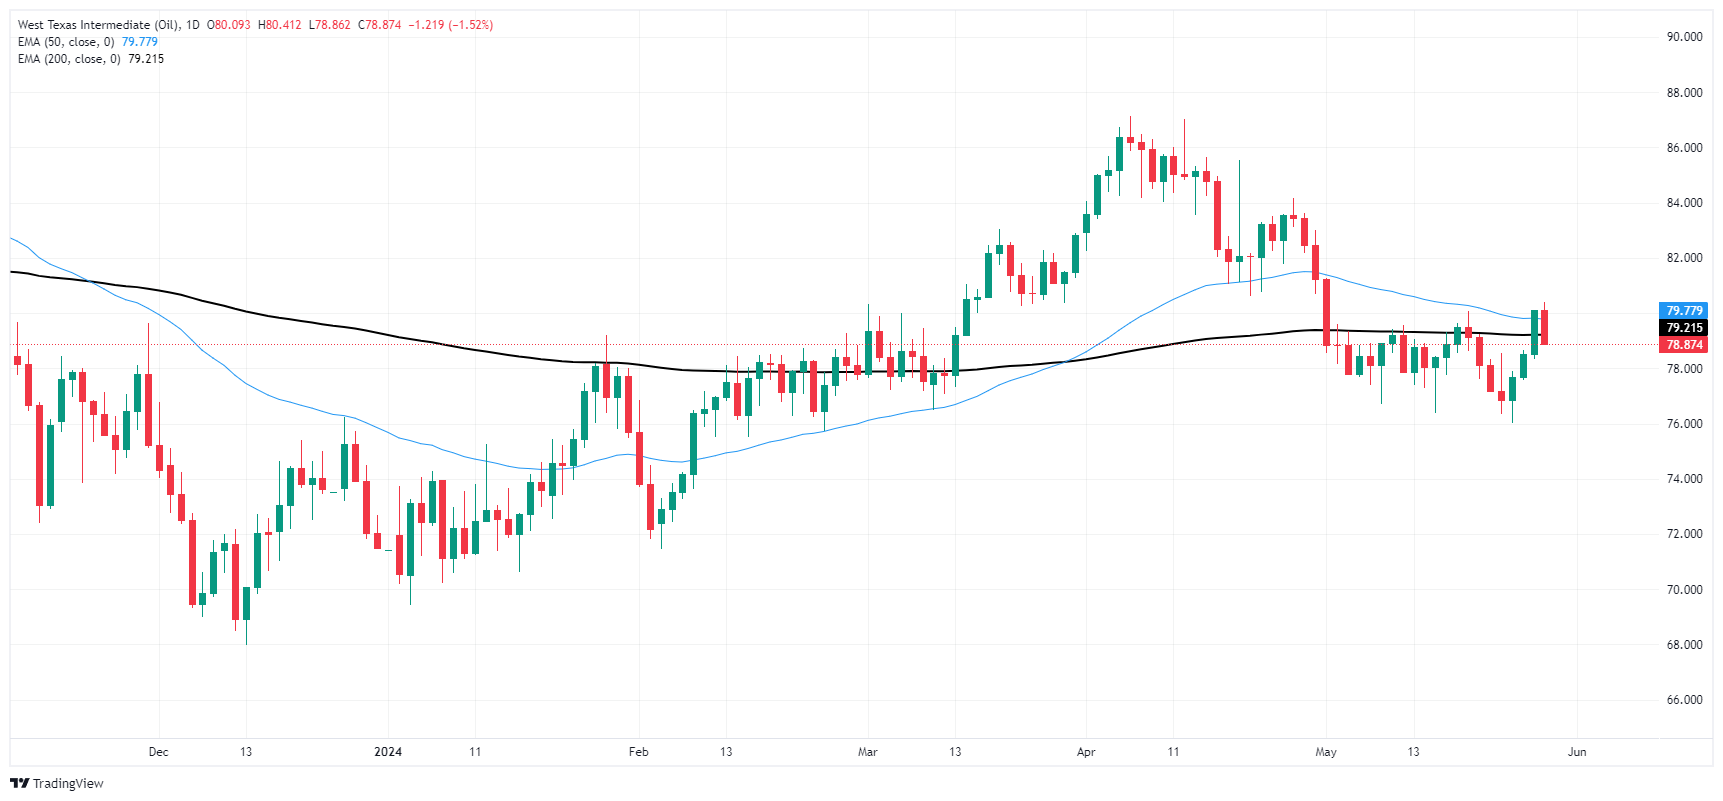
The Greenback extended its recovery and printed fresh multi-day highs amidst the persistent move higher in US yields and shrinking bets of a Fed rate cut in September.
Here is what you need to know on Thursday, May 30:
The USD Index (DXY) rose further and trespassed the key 105.00 barrier amidst multi-week tops in US yields. On May 30, another revision of the Q1 GDP Growth Rate is due, seconded by weekly Initial Jobless Claims, Goods Trade Balance, and Pending Home Sales. In addition, Fed’s Bostic, Williams, and Logan are due to speak.
EUR/USD traded well on the defensive and challenged the 1.0800 region despite the German flash CPI ticking higher in May.The EMU’s final Consumer Confidence, Economic and Industrial Sentiment and the Unemployment Rate will all be unveiled on May 30.
GBP/USD dropped to three-day lows and pierced the 1.2700 support on the back of the stronger Dollar. April’s Car Production will be the only release across the Channel on May 30.
Further gains in the Greenback and an extra advance in US yields prompted USD/JPY to climb to new highs around 157.70. In the Japanese calendar, the usual weekly Foreign Bond Investment figures are expected on May 30.
AUD/USD added to Tuesday’s pullback and put the 0.6600 contention zone to the test against the backdrop of further bearishness hurting the risk-associated assets. On May 30, Building Permits are due along with the speech by RBA’s Hunter.
The persevering march north in the Dollar prompted WTI prices to halt a three-session positive streak and return to the $79.00 region.
Gold prices succumbed to the Greenback’s sharp advance and the robust performance of US yields across the curve, revisiting once again the vicinity of $2,330 per troy ounce. Silver prices clung to the upper end of the range, receding marginally to the $32.00 zone per ounce.
- Gold falls 0.87%, pressured by climbing US Treasury yields.
- Fed Governor Neel Kashkari's hawkish remarks underpin US yields, US Dollar.
- Upcoming PCE inflation data will play a critical role in shaping future price movements.
Gold prices slump on Wednesday amid rising US Treasury yields, boosting demand for the Greenback due to hawkish comments by a Federal Reserve (Fed) official. Consequently, sentiment shifted sour, the US Dollar climbed, and the XAU/USD is down some 0.87%, trading at $2,339 at the time of writing.
Wall Street trades in the red, while US yields from the belly to the long end of the curve rise between four and six basis points. Meanwhile, a scarce economic docket on Wednesday keeps traders digesting Minnesota Fed President Neel Kashkari's hawkish comments from Tuesday.
He said that Fed officials hadn’t disregarded rate hikes while adding that if they cut borrowing costs, it would be twice toward the end of 2024.
Data-wise, the US Conference Board (CB) revealed that May’s consumer confidence improved, yet Americans began to worry about a possible recession in the next 12 to 18 months, wrote Dana Paterson, The Conference Board’s Chief Economist.
Ahead in the week, traders are bracing for the expected release of April’s Personal Consumption Expenditures (PCE) Price Index - the Federal Reserve’s (Fed) preferred measure of inflation. The core figure is expected to be 2.8% YoY, while headline PCE is projected to increase by 0.3% MoM.
Daily digest market movers: Gold price falls as US Treasury yields advance to multi-week high
- Gold prices dropped sharply after hitting a three-day high as US Treasury yields rose.
- US 10-year Treasury note yields 4.616%, rising six basis points and underpinning the Greenback. The US Dollar Index (DXY), which tracks the buck’s performance against a basket of peers, trades at 105.05, up 0.42%.
- Fed Governor Michelle Bowman said she would have supported either waiting to slow the quantitative tightening pace or a more tapered slowing in balance sheet run-off.
- The US Conference Board’s Consumer Confidence survey improved in May after three months of declines, rising to 102.0 from 97.0, exceeding estimates of 95.9.
- On Thursday, the US economic docket will feature the second estimate of the Gross Domestic Product (GDP) for Q1 2024, which is expected to be 1.3%.
- Additionally, traders will eye Initial Jobless Claims for the week ending May 25 and the Goods Trade Balance.
- Fed funds rate futures estimate just 25 basis points of interest rate cuts in 2024, according to data provided by the Chicago Board of Trade (CBOT).
Technical analysis: Gold price drops below $2,350 as buyers lose momentum
Gold price is upwardly biased despite retreating to $2,320. As mentioned on Tuesday, “the rally is showing signs of exhaustion, with momentum beginning to fade,” as the Relative Strength Index (RSI) turned bearish, punching below the 50 midline.
That said, the XAU/USD's first support would be the 50-day Simple Moving Average (SMA) at $2,321. A breach of the latter will expose the May 8 low of $2,303, followed by the May 3 cycle low of $2,277.
On the other hand, if XAU/USD reclaims the psychological mark of $2,350, further gains lie overhead. Up next would be the $2,400 mark, followed by the year-to-date high of $2,450 and then the $2,500 mark.
Gold FAQs
Gold has played a key role in human’s history as it has been widely used as a store of value and medium of exchange. Currently, apart from its shine and usage for jewelry, the precious metal is widely seen as a safe-haven asset, meaning that it is considered a good investment during turbulent times. Gold is also widely seen as a hedge against inflation and against depreciating currencies as it doesn’t rely on any specific issuer or government.
Central banks are the biggest Gold holders. In their aim to support their currencies in turbulent times, central banks tend to diversify their reserves and buy Gold to improve the perceived strength of the economy and the currency. High Gold reserves can be a source of trust for a country’s solvency. Central banks added 1,136 tonnes of Gold worth around $70 billion to their reserves in 2022, according to data from the World Gold Council. This is the highest yearly purchase since records began. Central banks from emerging economies such as China, India and Turkey are quickly increasing their Gold reserves.
Gold has an inverse correlation with the US Dollar and US Treasuries, which are both major reserve and safe-haven assets. When the Dollar depreciates, Gold tends to rise, enabling investors and central banks to diversify their assets in turbulent times. Gold is also inversely correlated with risk assets. A rally in the stock market tends to weaken Gold price, while sell-offs in riskier markets tend to favor the precious metal.
The price can move due to a wide range of factors. Geopolitical instability or fears of a deep recession can quickly make Gold price escalate due to its safe-haven status. As a yield-less asset, Gold tends to rise with lower interest rates, while higher cost of money usually weighs down on the yellow metal. Still, most moves depend on how the US Dollar (USD) behaves as the asset is priced in dollars (XAU/USD). A strong Dollar tends to keep the price of Gold controlled, whereas a weaker Dollar is likely to push Gold prices up.
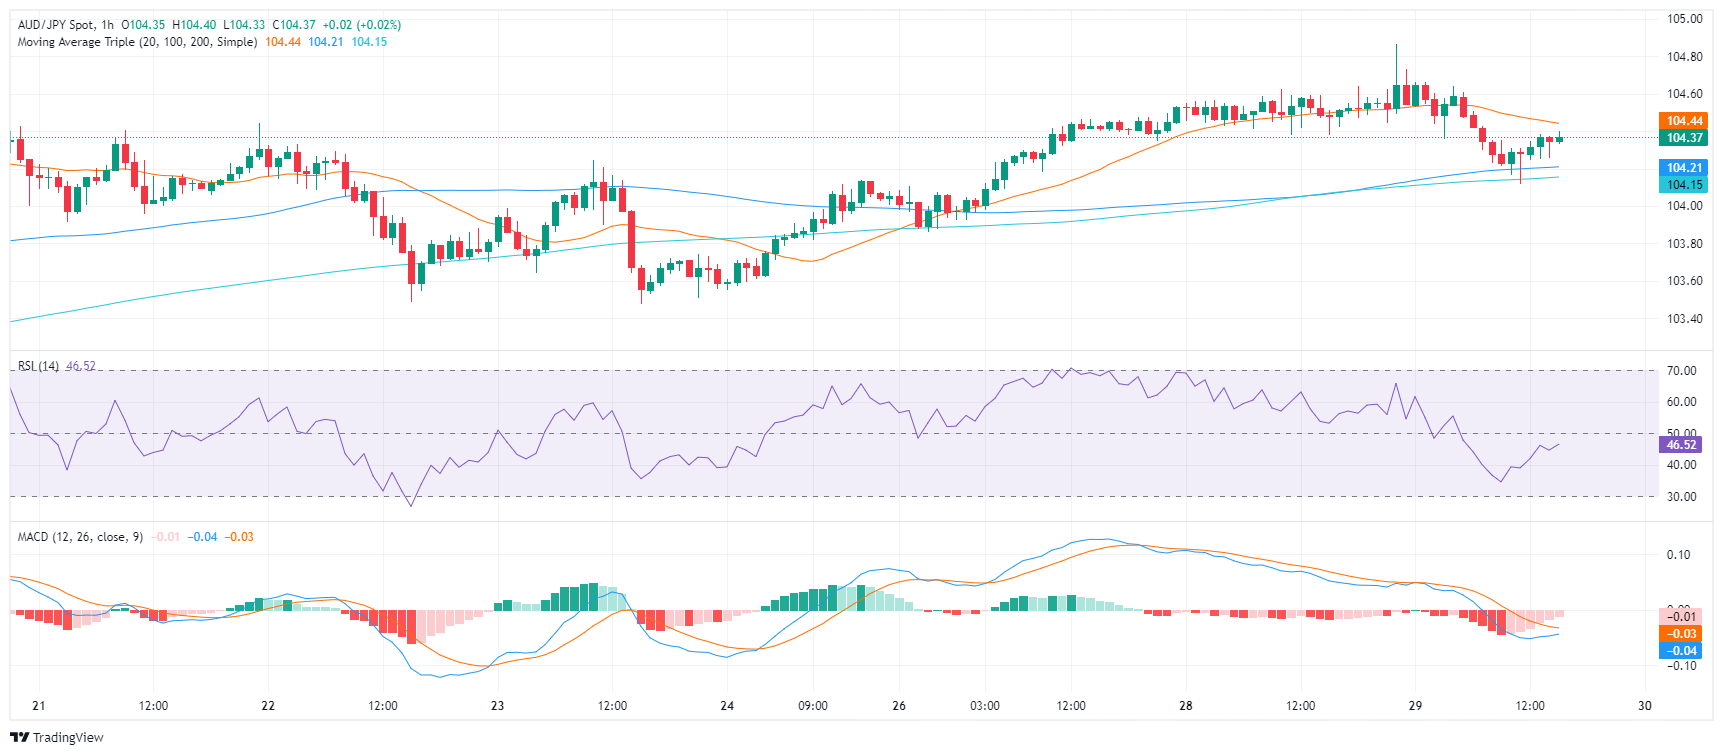
- Daily chart indicators suggest correction phase sets in; RSI drops signifying easing of overbought conditions.
- Hourly chart indicators remain in negative territory, signaling downside correction in the near term.
- Bulls show signs of exhaustion, unable to retest 105.00 highs.
In Wednesday's session, the AUD/JPY pair displayed signs of correction, retreating to the 104.30 mark following an earlier surge to 104.90. Seemingly, buyers are finding it tough to maintain upward traction. The market appears to have started a short-term correction phase.
On the daily chart, the RSI has edged down to 67 territory, indicating easing of earlier overbought conditions. In sync with this, MACD continues to print red bars, further solidifying the possibility of weakening buying power.
AUD/JPY daily chart
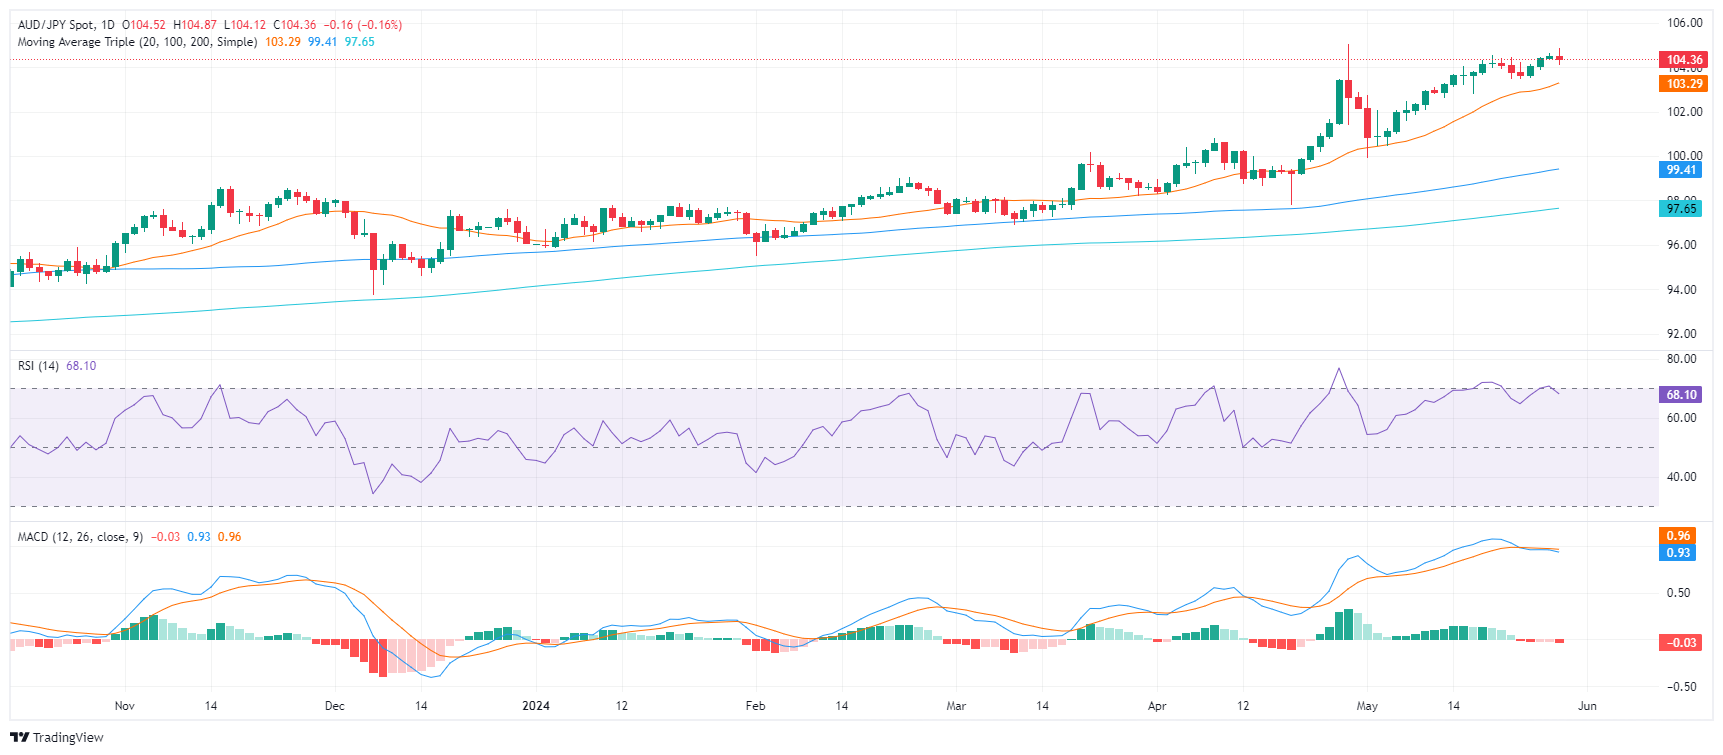
Reiterating these sentiments is the hourly chart. The RSI and MACD both remain in negative territory, indicating a probable near-term correction.
AUD/JPY hourly chart
The prominent resistance remains the cycle high just above 105.00 while the 20-day SMA, now at 103.29, continues to provide strong support.
- Dow Jones extends recent declines as investors pull back.
- US equities are broadly lower in the mid-week session.
- Declining bid-to-covers on Treasuries are spiking risk aversion.
The Dow Jones Industrial Average (DJIA) is broadly lower on Wednesday, shedding nearly 400 points and backsliding into 38,500.00. The major equity index is down nearly nine-tenths of a percent as investor sentiment sours.
Demand for Treasuries appears to be declining as bid-to-cover ratios on key Treasury auctions decline, putting downward pressure on equities and bolstering the safe haven US Dollar. An auction of 7-year Treasury notes on Wednesday showed a bid-to-cover ratio of 2.43, down from the previous 2.48. The US still has no trouble auctioning off bond issuance, but decreasing covering bids implies there could be declining interest in US bonds.
Wednesday is the last day of calm before the economic calendar kicks into high gear on US data, with Gross Domestic Product (GDP) and Personal Consumption Expenditures (PCE) inflation due on Thursday and Friday, respectively.
Annualized US Q1 GDP is expected to ease to 1.3% versus the previous 1.6% on Thursday. On Friday, US PCE Price Index inflation is forecast to hold steady at 0.3% MoM. With investors desperate for signs of rate cuts from the Federal Reserve (Fed), markets will be hoping that economic activity figures and inflation data will continue to ease.
Dow Jones news
The Dow Jones backslid to its lowest bids since the beginning of the month, and is sharply lower after hitting all-time highs above 40,000.00 recently. All but five of the Dow Jones’ component securities are in the red on Wednesday, with Unitedhealth Group Inc. (UNH) tumbling over -4.4% to $481.33 per share, and declining -22.3 points. On the high side, Apple Inc. gained 0.86% to $191.62 per share after the tech company revealed their latest product line of AI-enabled smartphones.
Dow Jones technical outlook
The Dow Jones’ Wednesday declines have dragged the index below the 50-day Exponential Moving Average (EMA) at 38,895.97, and the DJIA is on pace to add another red day to the chart. The index continues to hold above the 200-day EMA at 37,232.07, but equity losses have dragged the Dow Jones down -4% from a record peak just above 40,000.00.
Dow Jones five minute chart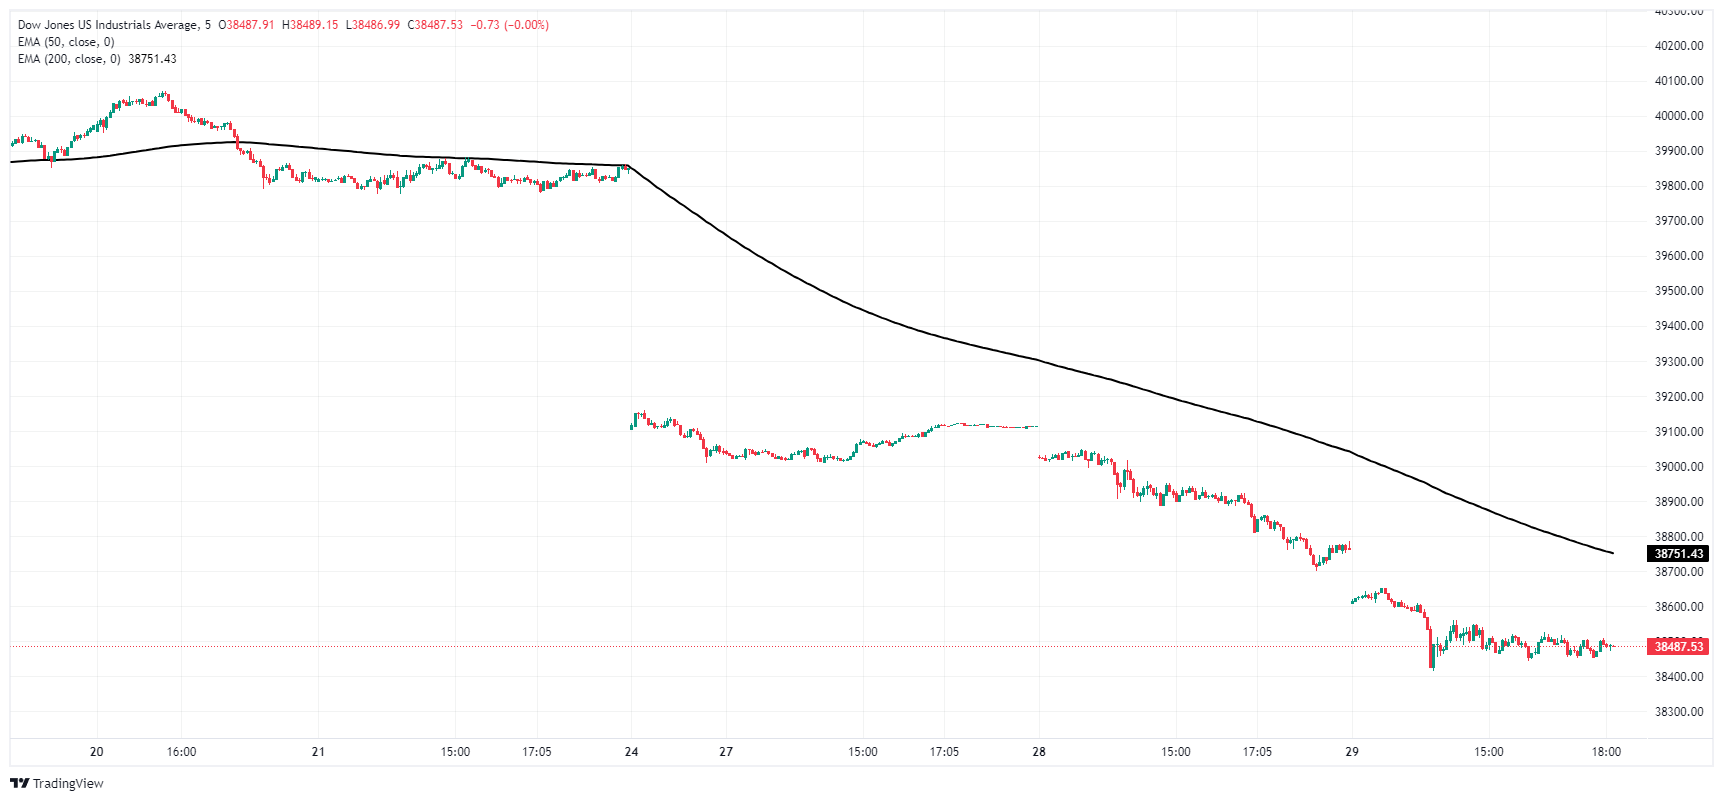
Dow Jones daily chart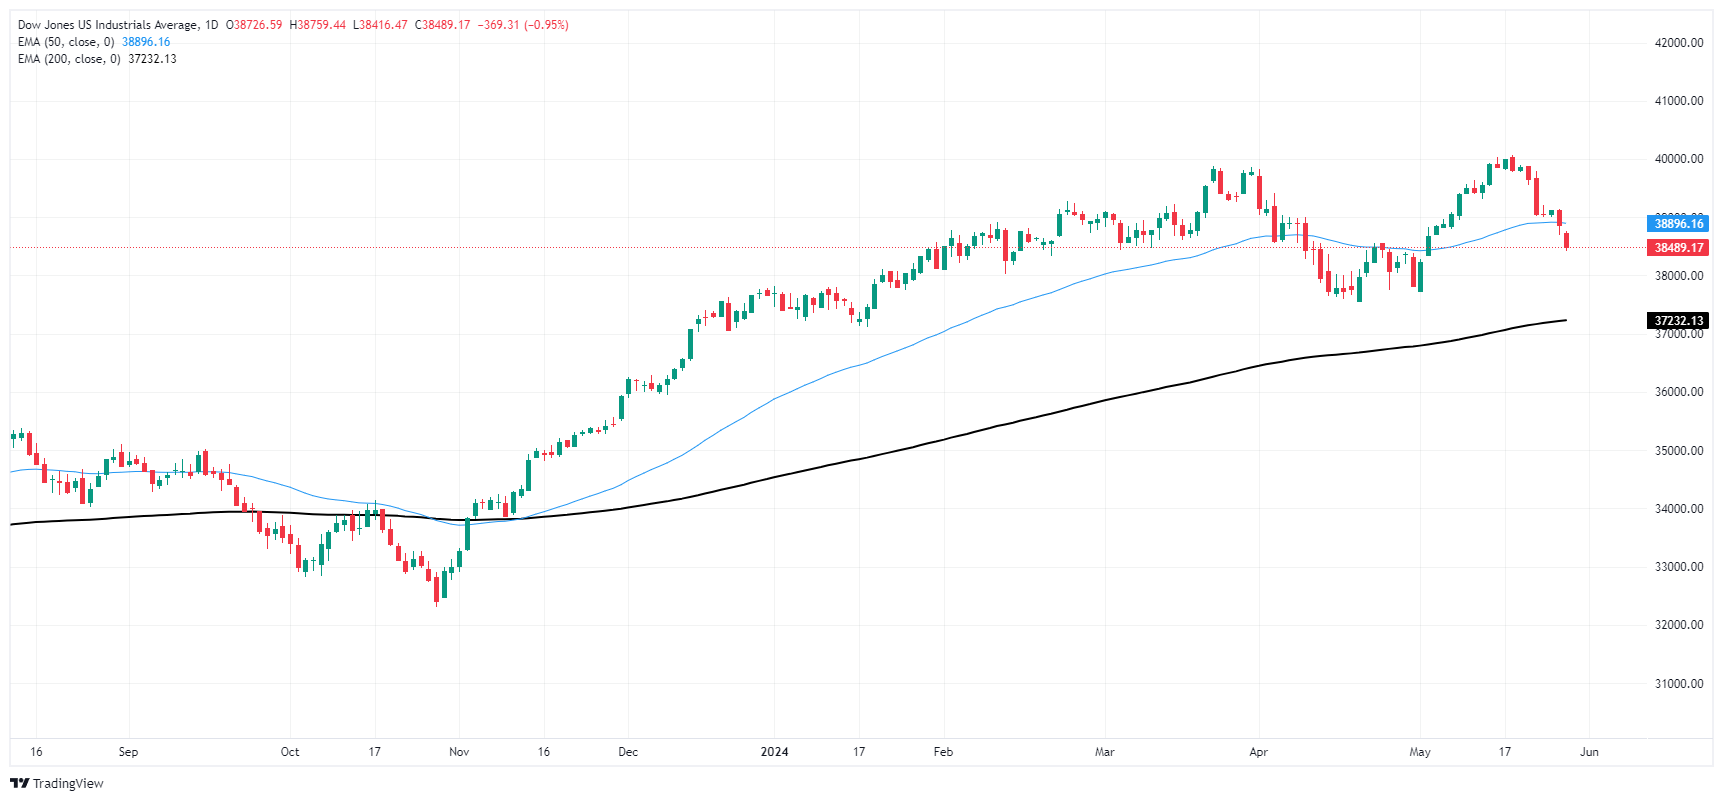
Dow Jones FAQs
The Dow Jones Industrial Average, one of the oldest stock market indices in the world, is compiled of the 30 most traded stocks in the US. The index is price-weighted rather than weighted by capitalization. It is calculated by summing the prices of the constituent stocks and dividing them by a factor, currently 0.152. The index was founded by Charles Dow, who also founded the Wall Street Journal. In later years it has been criticized for not being broadly representative enough because it only tracks 30 conglomerates, unlike broader indices such as the S&P 500.
Many different factors drive the Dow Jones Industrial Average (DJIA). The aggregate performance of the component companies revealed in quarterly company earnings reports is the main one. US and global macroeconomic data also contributes as it impacts on investor sentiment. The level of interest rates, set by the Federal Reserve (Fed), also influences the DJIA as it affects the cost of credit, on which many corporations are heavily reliant. Therefore, inflation can be a major driver as well as other metrics which impact the Fed decisions.
Dow Theory is a method for identifying the primary trend of the stock market developed by Charles Dow. A key step is to compare the direction of the Dow Jones Industrial Average (DJIA) and the Dow Jones Transportation Average (DJTA) and only follow trends where both are moving in the same direction. Volume is a confirmatory criteria. The theory uses elements of peak and trough analysis. Dow’s theory posits three trend phases: accumulation, when smart money starts buying or selling; public participation, when the wider public joins in; and distribution, when the smart money exits.
There are a number of ways to trade the DJIA. One is to use ETFs which allow investors to trade the DJIA as a single security, rather than having to buy shares in all 30 constituent companies. A leading example is the SPDR Dow Jones Industrial Average ETF (DIA). DJIA futures contracts enable traders to speculate on the future value of the index and Options provide the right, but not the obligation, to buy or sell the index at a predetermined price in the future. Mutual funds enable investors to buy a share of a diversified portfolio of DJIA stocks thus providing exposure to the overall index.
- Canadian Dollar broadly lower as Treasury yields bolster US Dollar bids.
- Canada absent from the economic calendar on Wednesday,
- Canadian Current Account, GDP update due later this week.
The Canadian Dollar is softening across the board on Wednesday, shedding weight as the safe haven Greenback catches a broad-market bid. Lackluster bid-to-cover ratios in a US Treasury auction on Tuesday is trimming market sentiment heading into the midweek, keeping risk appetite on the low side.
Canada remains absent from the economic calendar on Wednesday, leaving CAD traders to look ahead to Thursday’s Canadian Current Account, which is expected to fall to -5.5 billion after climbing to a six-month high of -1.62 billion in the previous quarter. Canadian Q1 Gross Domestic Product will follow on Friday, and is expected to settle to 0.0% MoM versus 0.2%. However, Canadian data is expected to be overshadowed by US data releases, with US GDP on Thursday and Personal Consumption Expenditure (PCE) Price Index inflation on Friday.
Daily digest market movers: Canadian Dollar recedes again as risk appetite withers
- Markets are keeping one foot in safe havens as investors grapple with declining bid-to-cover ratios on US Treasuries this week.
- Broad-market support for the Greenback is sending the CAD lower, extending Tuesday’s turnaround.
- A 7-year note auction will draw plenty of attention in the middle of the US session.
- Markets could push further into risk-off sentiment if bid-to-cover falls below 2.44.
- Investors will also be looking out for US quarterly GDP and PCE inflation in the latter half of the trading week.
- US Q1 GDP is expected to ease to 1.3% versus the previous 1.6%, while Core PCE inflation is expected to hold flat at 0.3% MoM.
Canadian Dollar PRICE Today
The table below shows the percentage change of Canadian Dollar (CAD) against listed major currencies today. Canadian Dollar was the weakest against the US Dollar.
| USD | EUR | GBP | JPY | CAD | AUD | NZD | CHF | |
|---|---|---|---|---|---|---|---|---|
| USD | 0.38% | 0.36% | 0.32% | 0.46% | 0.47% | 0.38% | 0.14% | |
| EUR | -0.38% | -0.03% | -0.09% | 0.08% | 0.10% | 0.00% | -0.24% | |
| GBP | -0.36% | 0.03% | -0.06% | 0.08% | 0.11% | 0.03% | -0.22% | |
| JPY | -0.32% | 0.09% | 0.06% | 0.15% | 0.16% | 0.07% | -0.18% | |
| CAD | -0.46% | -0.08% | -0.08% | -0.15% | 0.02% | -0.06% | -0.33% | |
| AUD | -0.47% | -0.10% | -0.11% | -0.16% | -0.02% | -0.09% | -0.31% | |
| NZD | -0.38% | -0.00% | -0.03% | -0.07% | 0.06% | 0.09% | -0.25% | |
| CHF | -0.14% | 0.24% | 0.22% | 0.18% | 0.33% | 0.31% | 0.25% |
The heat map shows percentage changes of major currencies against each other. The base currency is picked from the left column, while the quote currency is picked from the top row. For example, if you pick the Canadian Dollar from the left column and move along the horizontal line to the US Dollar, the percentage change displayed in the box will represent CAD (base)/USD (quote).
Technical analysis: Canadian Dollar finds room on the downside
The Canadian Dollar is weakening across the board on Wednesday, struggling to hold flat against the Australian Dollar (AUD) and shedding weight against all other major currency peers. The CAD is steeply lower against the US Dollar, sliding nearly half of a percent.
USD/CAD is sharply higher in the near-term, climbing nearly 0.7% from the last swing low below 1.3620. Whipsaws are populating the intraday charts as choppy trading weighs on the pair, and lower highs will crimp topside momentum beyond 1.3740.
Daily candles are pricing in a technical rebound from the 50-day Exponential Moving Average (EMA) at 1.3674, but long-term bullish momentum is limited as USD/CAD remains down from the year’s peak bids near 1.3850.
USD/CAD hourly chart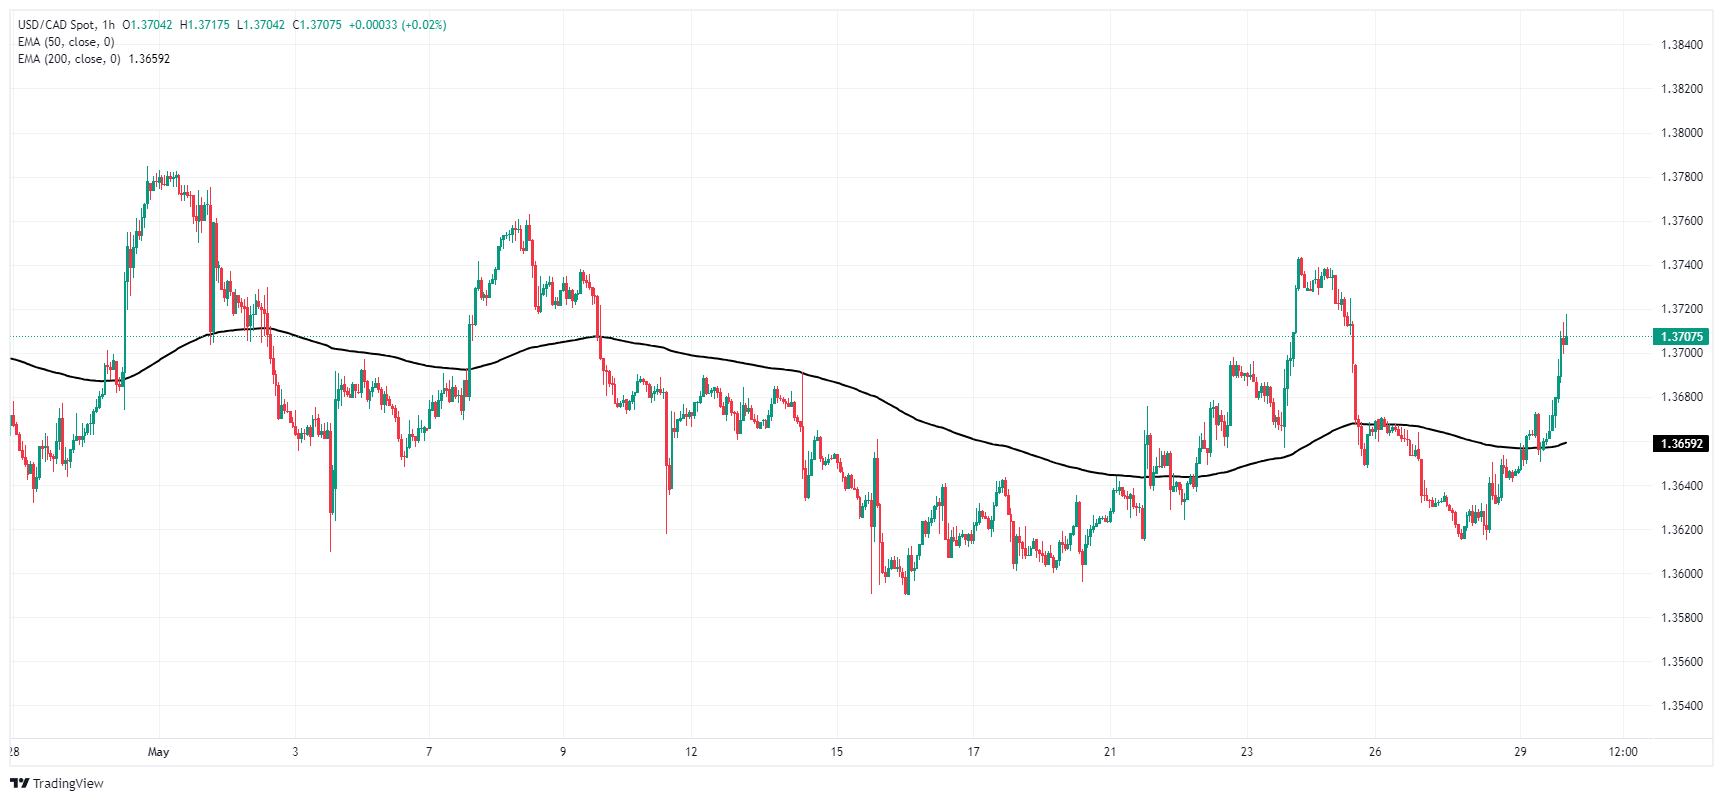
USD/CAD daily chart
Canadian Dollar FAQs
The key factors driving the Canadian Dollar (CAD) are the level of interest rates set by the Bank of Canada (BoC), the price of Oil, Canada’s largest export, the health of its economy, inflation and the Trade Balance, which is the difference between the value of Canada’s exports versus its imports. Other factors include market sentiment – whether investors are taking on more risky assets (risk-on) or seeking safe-havens (risk-off) – with risk-on being CAD-positive. As its largest trading partner, the health of the US economy is also a key factor influencing the Canadian Dollar.
The Bank of Canada (BoC) has a significant influence on the Canadian Dollar by setting the level of interest rates that banks can lend to one another. This influences the level of interest rates for everyone. The main goal of the BoC is to maintain inflation at 1-3% by adjusting interest rates up or down. Relatively higher interest rates tend to be positive for the CAD. The Bank of Canada can also use quantitative easing and tightening to influence credit conditions, with the former CAD-negative and the latter CAD-positive.
The price of Oil is a key factor impacting the value of the Canadian Dollar. Petroleum is Canada’s biggest export, so Oil price tends to have an immediate impact on the CAD value. Generally, if Oil price rises CAD also goes up, as aggregate demand for the currency increases. The opposite is the case if the price of Oil falls. Higher Oil prices also tend to result in a greater likelihood of a positive Trade Balance, which is also supportive of the CAD.
While inflation had always traditionally been thought of as a negative factor for a currency since it lowers the value of money, the opposite has actually been the case in modern times with the relaxation of cross-border capital controls. Higher inflation tends to lead central banks to put up interest rates which attracts more capital inflows from global investors seeking a lucrative place to keep their money. This increases demand for the local currency, which in Canada’s case is the Canadian Dollar.
Macroeconomic data releases gauge the health of the economy and can have an impact on the Canadian Dollar. Indicators such as GDP, Manufacturing and Services PMIs, employment, and consumer sentiment surveys can all influence the direction of the CAD. A strong economy is good for the Canadian Dollar. Not only does it attract more foreign investment but it may encourage the Bank of Canada to put up interest rates, leading to a stronger currency. If economic data is weak, however, the CAD is likely to fall.
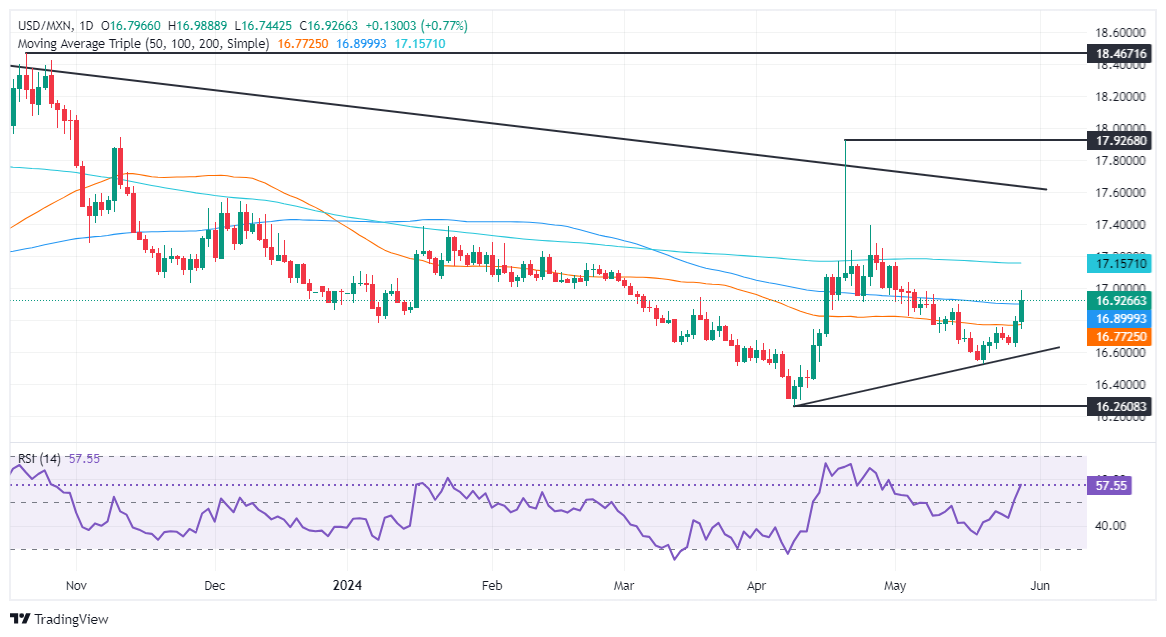
- Mexican Peso plummets sharply, posting losses of almost 1%.
- Investors reduce Peso exposure ahead of June 2 general election, favoring the Greenback.
- Upcoming PCE data and Mexico’s election results to dictate USD/MXN trajectory.
The Mexican Peso depreciated sharply against the US Dollar on Wednesday as US Treasury bond yields underpinned the Greenback. Investors began to turn cautious as Mexico’s general election loomed. The USD/MXN trades at 16.98 and gains more than 1%.
The Mexican currency is pressured due to a risk-off environment. Meanwhile, traders seem to be trimming their exposure to the Mexican Peso as Sunday, June 2, general election loom.
Most polls see Claudia Sheinbaum of Morena’s ruling party winning the presidential election. But Most analysts estimate that either way, Sheinbaum’s win or Xochitl Galvez's surprise upset, both candidates are seen as market friendly.
Mexico’s economic schedule remains light, with just the release of the Unemployment Rate, the Fiscal Balance, and the Foreign Exchange Reserve for April toward the end of the week.
Across the border, US Treasury bond yields along the whole curve continued to climb for the second straight day amid a scarce economic docket. Regional Manufacturing Indices revealed by the Richmond and Dallas Fed were mixed, while investors waited for New York Fed President John Williams's speech.
On Tuesday, Minneapolis Fed President Neel Kashkari was hawkish. He said that Fed officials hadn’t disregarded rate hikes, while adding that if they cut borrowing costs, it would be twice toward the end of 2024.
Meanwhile, traders brace for the release of April’s Personal Consumption Expenditures Price Index (PCE), the Federal Reserve’s (Fed) preferred inflation gauge. That, along with Mexico’s general election on Sunday, could dictate the USD/MXN path toward the second half of the year as the Mexican currency remains one of the strongest against the US Dollar.
Daily digest market movers: Mexican Peso drops on high US yields, Fed comments
- Last week’s data showed that Mexico’s economic outlook is turning uncertain as the mid-month headline inflation for May rose while underlying prices dipped.
- Mexico’s economic slowdown, as shown by the last Gross Domestic Product (GDP) report and a widening trade deficit, could exert pressure on Mexican Peso.
- May’s Citibanamex poll showed that most economists estimate Banxico will cut rates on June 27 from 11% to 10.75%. The median expects headline inflation at 4.21% and core at 4.07% in 2024.
- Mexico’s schedule will feature the Unemployment Rate, the Fiscal Balance, Foreign Exchange Reserves, and the general election on June 2.
- The Richmond Fed Manufacturing Index rose by 13 in May, exceeding April’s -10 contraction. The Services Index for the same period improved from -13 to 3.
- May’s Dallas Fed Services Index plunged from -12.1 to -10.6.
- In the week ahead, the US economic docket will feature the second estimate of Gross Domestic Product (GDP) for Q1 2024, unemployment claims for the last week, and the release of core PCE.
- Despite that, fed funds rate futures estimate just 24 basis points of easing toward the end of the year.
Technical analysis: Mexican Peso falls as USD/MXN climbs above 16.90
The USD/MXN downtrend remains intact, yet buyers are gathering steam as the pair tests the 100-day Simple Moving Average (SMA) at 16.76. Momentum shows that bulls are gaining traction as the Relative Strength Index (RSI) is about to pierce above the 50-midline to turn bullish.I
Buyers decisively surpassing the 100-day SMA at 16.70 could open the door for further gains. The next resistance would be the 50-day SMA at 16.89, the psychological figure at 17.00, and the 200-day SMA at 17.14.
On the other hand, a bearish continuation would happen if sellers keep the exchange rate below the 100-day SMA, which could pave the way for a dip to the 2023 low of 16.62, followed by the May 21 cycle low at 16.52 and the year-to-date low of 16.25.
Mexican Peso FAQs
The Mexican Peso (MXN) is the most traded currency among its Latin American peers. Its value is broadly determined by the performance of the Mexican economy, the country’s central bank’s policy, the amount of foreign investment in the country and even the levels of remittances sent by Mexicans who live abroad, particularly in the United States. Geopolitical trends can also move MXN: for example, the process of nearshoring – or the decision by some firms to relocate manufacturing capacity and supply chains closer to their home countries – is also seen as a catalyst for the Mexican currency as the country is considered a key manufacturing hub in the American continent. Another catalyst for MXN is Oil prices as Mexico is a key exporter of the commodity.
The main objective of Mexico’s central bank, also known as Banxico, is to maintain inflation at low and stable levels (at or close to its target of 3%, the midpoint in a tolerance band of between 2% and 4%). To this end, the bank sets an appropriate level of interest rates. When inflation is too high, Banxico will attempt to tame it by raising interest rates, making it more expensive for households and businesses to borrow money, thus cooling demand and the overall economy. Higher interest rates are generally positive for the Mexican Peso (MXN) as they lead to higher yields, making the country a more attractive place for investors. On the contrary, lower interest rates tend to weaken MXN.
Macroeconomic data releases are key to assess the state of the economy and can have an impact on the Mexican Peso (MXN) valuation. A strong Mexican economy, based on high economic growth, low unemployment and high confidence is good for MXN. Not only does it attract more foreign investment but it may encourage the Bank of Mexico (Banxico) to increase interest rates, particularly if this strength comes together with elevated inflation. However, if economic data is weak, MXN is likely to depreciate.
As an emerging-market currency, the Mexican Peso (MXN) tends to strive during risk-on periods, or when investors perceive that broader market risks are low and thus are eager to engage with investments that carry a higher risk. Conversely, MXN tends to weaken at times of market turbulence or economic uncertainty as investors tend to sell higher-risk assets and flee to the more-stable safe havens.
- A sharp recovery in US Dollar triggered by cautious market sentiment.
- Bets for interest rate cut at the September Fed meeting continue to receive pressure from Fed officials.
- US Treasury yields also fuel recovery in USD with 2-year yield rising to 5.00%.
The US Dollar Index (DXY) is showing a sharp recovery, hovering around the 105.00 mark on Wednesday. Amid this climate, investors remain risk-averse. As Federal Reserve (Fed) officials’ continuous asking for patience has resulted in reduced bets on a rate cut for the upcoming September Federal Open Market Committee (FOMC) session. As a reaction, US Treasury yields recovered.
As the US economy remains strong, the likelihood of cuts in June and July remains low, with markets keenly looking forward to data that would aid in placing bets for the September meeting. The Wednesday session should see subsequent highlights in the form of the Fed's Beige Book report.
Daily digest market movers: DXY recovers as markets await drivers
- Investor expectations see a rate cut to start in the last quarter of the year.
- As the economic calendar awaits highlights, markets will look for clues about the US economy in the Fed’s Beige book report, which will be released later in the session.
- US Treasury yields soared and the 2-year yield rose to 5%, while the 5 and 10-year rates gained to 4.63% and 4.62%, respectively.
DXY technical analysis: US Dollar makes remarkable recovery, bulls aim to consolidate above 105.00
The daily chart indicators signify a recovery in the DXY. The Relative Strength Index (RSI) rose above the 50 level, indicating reduced selling pressure and a potential shift in momentum. To further establish bullish momentum, the DXY managed to regain territory above the 20-day Simple Moving Average (SMA).
The Moving Average Convergence Divergence (MACD) displays fading red bars, suggesting a potential end of the bearish trend and an onset of bullish sentiment. For the bulls to continue gaining ground, consolidation above 105.00 would be required.
US Dollar FAQs
The US Dollar (USD) is the official currency of the United States of America, and the ‘de facto’ currency of a significant number of other countries where it is found in circulation alongside local notes. It is the most heavily traded currency in the world, accounting for over 88% of all global foreign exchange turnover, or an average of $6.6 trillion in transactions per day, according to data from 2022. Following the second world war, the USD took over from the British Pound as the world’s reserve currency. For most of its history, the US Dollar was backed by Gold, until the Bretton Woods Agreement in 1971 when the Gold Standard went away.
The most important single factor impacting on the value of the US Dollar is monetary policy, which is shaped by the Federal Reserve (Fed). The Fed has two mandates: to achieve price stability (control inflation) and foster full employment. Its primary tool to achieve these two goals is by adjusting interest rates. When prices are rising too quickly and inflation is above the Fed’s 2% target, the Fed will raise rates, which helps the USD value. When inflation falls below 2% or the Unemployment Rate is too high, the Fed may lower interest rates, which weighs on the Greenback.
In extreme situations, the Federal Reserve can also print more Dollars and enact quantitative easing (QE). QE is the process by which the Fed substantially increases the flow of credit in a stuck financial system. It is a non-standard policy measure used when credit has dried up because banks will not lend to each other (out of the fear of counterparty default). It is a last resort when simply lowering interest rates is unlikely to achieve the necessary result. It was the Fed’s weapon of choice to combat the credit crunch that occurred during the Great Financial Crisis in 2008. It involves the Fed printing more Dollars and using them to buy US government bonds predominantly from financial institutions. QE usually leads to a weaker US Dollar.
Quantitative tightening (QT) is the reverse process whereby the Federal Reserve stops buying bonds from financial institutions and does not reinvest the principal from the bonds it holds maturing in new purchases. It is usually positive for the US Dollar.
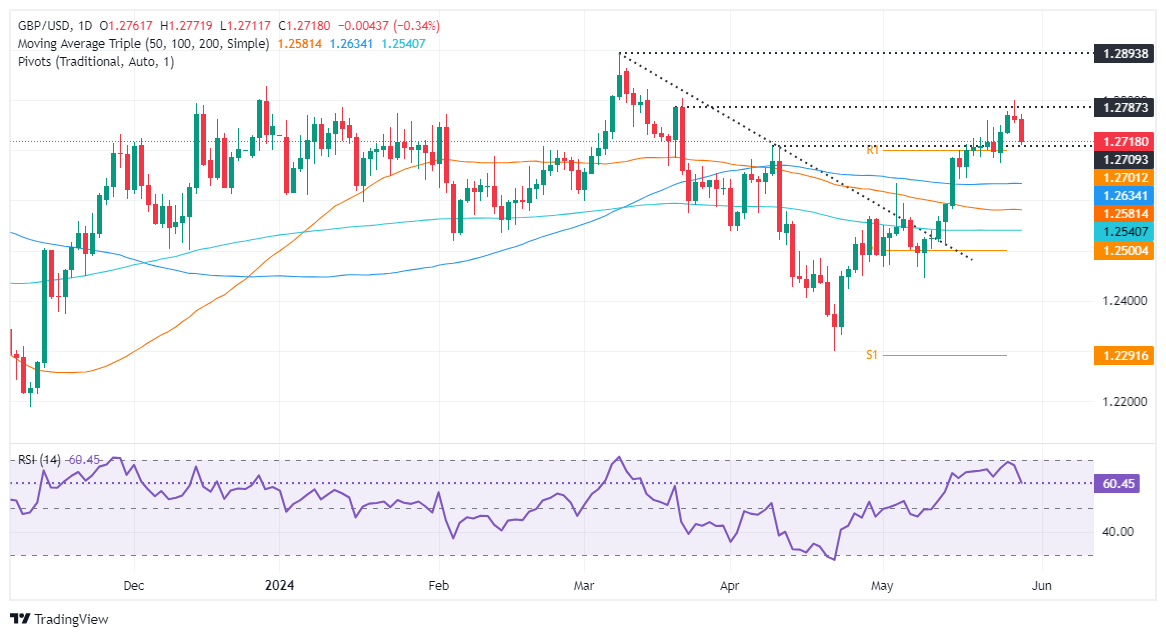
- GBP/USD tumbles to new three-day low as ‘evening star’ chart pattern emerges.
- Buyers’ momentum begins to fade as RSI aims toward the 50-midline.
- If the pair drops below 1.2700, look for further losses; otherwise, bulls can challenge 1.2800.
The British Pound fell to a new weekly low against the Greenback on Wednesday as US Treasury bond yields continued to climb. Federal Reserve officials remained cautious and influenced traders' expectations of just 25 basis points of rate cuts seen toward the end of 2024. The GBP/USD trades at 1.2719, down 0.33%.
GBP/USD Price Analysis: Technical outlook
The GBP/USD formed a three-candle chart formation called an ‘evening star,’ hinting that prices could tumble further. Momentum remains bullish, as depicted by the Relative Strength Index (RSI), but aims toward the 50-midline, which means that buyers are losing momentum.
On further weakness, if GBP/USD drops below 1.2700, the pair could test the May 3 daily high turned support at 1.2634. Once cleared, the next support would be the 50-day moving average (DMA) at 1.2580, followed by the 200-DMA at 1.2539.
On the other hand, if buyers reclaim the current week's high of 1.2777, further gains are seen above 1.2800, like the year-to-date (YTD) high of 1.2893.
GBP/USD Price Action – Daily Chart
British Pound PRICE Today
The table below shows the percentage change of British Pound (GBP) against listed major currencies today. British Pound was the strongest against the Australian Dollar.
| USD | EUR | GBP | JPY | CAD | AUD | NZD | CHF | |
|---|---|---|---|---|---|---|---|---|
| USD | 0.33% | 0.33% | 0.13% | 0.34% | 0.40% | 0.27% | 0.05% | |
| EUR | -0.33% | -0.01% | -0.22% | 0.00% | 0.06% | -0.06% | -0.28% | |
| GBP | -0.33% | 0.00% | -0.22% | -0.02% | 0.05% | -0.05% | -0.29% | |
| JPY | -0.13% | 0.22% | 0.22% | 0.20% | 0.27% | 0.15% | -0.10% | |
| CAD | -0.34% | -0.00% | 0.02% | -0.20% | 0.07% | -0.05% | -0.30% | |
| AUD | -0.40% | -0.06% | -0.05% | -0.27% | -0.07% | -0.11% | -0.34% | |
| NZD | -0.27% | 0.06% | 0.05% | -0.15% | 0.05% | 0.11% | -0.25% | |
| CHF | -0.05% | 0.28% | 0.29% | 0.10% | 0.30% | 0.34% | 0.25% |
The heat map shows percentage changes of major currencies against each other. The base currency is picked from the left column, while the quote currency is picked from the top row. For example, if you pick the British Pound from the left column and move along the horizontal line to the US Dollar, the percentage change displayed in the box will represent GBP (base)/USD (quote).
- USD/CAD rises further to near 1.3700 due to a strong recovery in the US Dollar.
- The US Dollar capitalizes on a significant decline in Fed rate-cut bets for September.
- Investors expect that the BoC will start unwinding its restrictive policy stance.
The USD/CAD pair jumps to near the round-level resistance of 1.3700 in Wednesday’s New York session. The Loonie asset strengthens as the US Dollar extends recovery. The US Dollar Index (DXY), which tracks the Greenback’s value against ix major currencies, moves higher to 104.85 as uncertainty over Federal Reserve’s (Fed) rate-cut timeframe deepens.
Increasing likelihood that the Fed will not cut interest rates before the fourth quarter of the year has dampened risk-appetite of investors. The S&P 500 has opened on a bearish note, reflecting weak appeal for risk-sensitive assets. 10-year US Treasury yields post a fresh three-week high at 4.60% as deepening expectations that the Fed will keep interest rates higher for longer is a favorable situation for them.
The CME FedWatch tool shows that the probability for Fed reducing interest rates from their current levels in the September meeting has come down to 47.6% from 57.5% recorded a week ago. Now investors are seeing the November meeting as the earliest point from when the Fed could return to policy normalization.
Going forward, investors will focus on the United States core Personal Consumption Expenditure Price Index (PCE) data for April, which will be published on Friday. The underlying inflation data will influence market speculation for Fed rate cuts in September.
Meanwhile, the Canadian Dollar weakens as investors expect that the Bank of Canada (BoC) will start reducing interest rates from the June meeting. The upside risks to Canada’s inflation have faded as the higher interest rates have deepened the household crisis. Also, the economy is failing to achieve full employment levels.
- Annual CPI inflation in Germany edged higher to 2.4% in May.
- EUR/USD recovered to the 1.0850 area after the data.
Inflation in Germany, as measured by the change in the Consumer price Index (CPI), rose to 2.4% on a yearly basis in May, Germany's Destatis reported on Wednesday. This reading followed the 2.2% increase recorded in April and came in line with the market expectation. On a monthly basis, the CPI rose 0.1%.
The Harmonized Index of Consumer Prices (HICP), the European Central Bank's (ECB) preferred gauge of inflation, rose 0.2% on a monthly basis as forecast. The annual HICP increased 2.8% in the same period, up from 2.4% in April and above analysts' estimate of 2.7%.
Market reaction
EUR/USD edged higher with the immediate reaction and was last seen trading flat on the day at 1.0855.
- The US Dollar recovers initial weekly losses as market sentiment worsens on Wednesday.
- Markets are licking their wounds, with most equity indices in the red across the globe.
- The US Dollar Index jumps sharply back above 104.50.
The US Dollar (USD) extends its recovery on Wednesday, supported by comments from the Federal Reserve (Fed) Bank of Minneapolis President Neel Kashkari, who spooked markets on Tuesday. Kashkari suggested that a rate hike could still be a possibility this year. Markets ignored that Kashkari is a non-voter this year and can thus speak a little bit more freely and personally, together with his closing remark that he does not see a hike as a possible outcome for now.
On the economic data front, Wednesday’s focus is on the Richmond Fed Manufacturing index for May. Markets have already seen the Dallas Fed Manufacturing number sink further to -19.4 in May from -14.5. Another lower-than-expected Manufacturing Index could mean more easing ahead for the Greenback, with markets rejecting completely the rate hike possibility from Kashkari.
Daily digest market movers: Manufacturing starts to wobble
- At 11:00 GMT, the Mortgage Applications got released by the Mortgage Bankers Association for the week of May 24. The previous week’s data was a positive 1.9% with a firm contraction this week by 5.7%.
- At 12:55 GMT, the Redbook Index for the week of May 24 will come out. The previous week’s reading was at 5.5%.
- At 14:00 GMT, the Richmond Fed Manufacturing Index for May will be released. The previous reading was -7, with a smaller improvement to -2 expected. As mentioned above, the importance of this number has been lined out with the chunky contraction seen on Tuesday in the Dallas Fed Manufacturing data.
- The US Treasury is set to auction a 7-year Note around 17:00 GMT.
- Federal Reserve Bank of New York President John Williams participates in a roundtable with local leaders about community services at an event organized by the Development Authority of the North Country in Watertown. Comments are expected around 17:45 GMT.
- The Fed’s Beige Book is to be released at 18:00 GMT.
- At 23:00 GMT, Federal Reserve Bank of Atlanta President Raphael Bostic participates in a moderated conversation about leadership and the US economic outlook at the Thirteenth Annual AEA Conference on Teaching and Research in Economic Education.
- Both in the Asian-Pacific and the European session, the main equity indices are in the red. However, losses in Europe remain contained to an average of 0.50%.
- According to the CME Fedwatch Tool, Fed Fund futures pricing data suggests a 53.7% chance for keeping rates unchanged in September, against 41.7% chance for a 25 basis points (bps) rate cut and 4.1% chance for an even 50 bps rate cut. A marginal 0.5% price in an interest rate hike, and it has not really increased in odds despite Fed’s Kashkari comments.
- The benchmark 10-year US Treasury Note trades around 4.56% and peaks for this week.
US Dollar Index Technical Analysis: Support confirmed
The US Dollar Index (DXY) played with fire on Tuesday after testing the lower and last support level in the current range. The 100-day Simple Moving Average (SMA) did its part around 104.34, and sent the DXY in a turnaround back up above 104.50. The question will be how long it will last, with the focus shifting to the Q1 US Gross Domestic Product (GDP) second estimate numbers on Thursday and the Personal Consumption Expenditures (PCE) Price Index for April on Friday.
On the upside, the DXY index needs to reclaim key levels it lost last week: the 55-day Simple Moving Average (SMA), currently at 104.82, and the 105.00 big round level. Further up, the following levels to consider are 105.12 and 105.52.
On the downside, the 200-day SMA at 104.42 and the 100-day SMA around 104.34 are the last line of defence. Once that level snaps, an air pocket is placed between 104.30 and 103.00. Should the US Dollar decline persist, the low of March at 102.35 and the low from December at 100.62 are levels to consider.
US Dollar FAQs
The US Dollar (USD) is the official currency of the United States of America, and the ‘de facto’ currency of a significant number of other countries where it is found in circulation alongside local notes. It is the most heavily traded currency in the world, accounting for over 88% of all global foreign exchange turnover, or an average of $6.6 trillion in transactions per day, according to data from 2022. Following the second world war, the USD took over from the British Pound as the world’s reserve currency. For most of its history, the US Dollar was backed by Gold, until the Bretton Woods Agreement in 1971 when the Gold Standard went away.
The most important single factor impacting on the value of the US Dollar is monetary policy, which is shaped by the Federal Reserve (Fed). The Fed has two mandates: to achieve price stability (control inflation) and foster full employment. Its primary tool to achieve these two goals is by adjusting interest rates. When prices are rising too quickly and inflation is above the Fed’s 2% target, the Fed will raise rates, which helps the USD value. When inflation falls below 2% or the Unemployment Rate is too high, the Fed may lower interest rates, which weighs on the Greenback.
In extreme situations, the Federal Reserve can also print more Dollars and enact quantitative easing (QE). QE is the process by which the Fed substantially increases the flow of credit in a stuck financial system. It is a non-standard policy measure used when credit has dried up because banks will not lend to each other (out of the fear of counterparty default). It is a last resort when simply lowering interest rates is unlikely to achieve the necessary result. It was the Fed’s weapon of choice to combat the credit crunch that occurred during the Great Financial Crisis in 2008. It involves the Fed printing more Dollars and using them to buy US government bonds predominantly from financial institutions. QE usually leads to a weaker US Dollar.
Quantitative tightening (QT) is the reverse process whereby the Federal Reserve stops buying bonds from financial institutions and does not reinvest the principal from the bonds it holds maturing in new purchases. It is usually positive for the US Dollar.
- EUR/JPY rebounds after a steep fall that was influenced by BoJ Adach’s support for a reduction in BoJ’s bond-buying.
- The uncertainty over BoJ’s wage growth outlook has limited the scope of further policy tightening.
- German inflation data will impact market speculation for ECB rate cuts beyond June.
The EUR/JPY recovers the dip to near 170.20 that was influenced by Bank of Japan (BoJ) board member Seiji Adachi’s commentary on the monetary policy outlook. BoJ Adachi advocated for reducing bond buying in several stages so that long-term yields better serve as a market signal. However, Adachi didn't provide any timeline for the same.
Over the interest rate outlook, Adachi commented that it would be appropriate to adjust interest rates at a slow pace if underlying inflation steadily moves toward 2%. Adachi’s dovish commentary on the interest rate outlook has deepened uncertainty about the BoJ extending the policy-tightening.
Market participants believe that inflationary pressures in Japan are driven by weak Japanese Yen while a move to higher interest rates should be backed by confidence in prolong wage growth that prompts consumer spendings and boosts price index.
This week, the Japanese Yen will be guided by the Tokyo Consumer Price Index (CPI) for May and the Retail Trade data for April, which will be published on Friday.
Meanwhile, the Euro is under pressure ahead of the preliminary German CPI data for May, which will be published at 12:00 GMT. Economists expect that the annual Harmonized Index of Consumer Prices (HICP) accelerated to 2.7% from the prior reading of 2.4%, with the monthly headline and harmonized inflation data grew at a slower pace of 0.2%.
The German inflation will significantly influence market speculation for European Central Bank (ECB) rate cuts. The ECB is widely anticipated to start reducing interest rates from the June meeting. Therefore, the impact of the German inflation will majorly on the ECB rate-cut path beyond June.
- AUD/JPY lost ground as Adachi highlighted the need to reduce bond-buying in stages.
- The risk aversion sentiment contributed to the downside of the Australian Dollar.
- Australia’s Monthly Consumer Price Index rose 3.6% YoY in April, against the expected decline to 3.4% from 3.5% prior.
AUD/JPY halted its three-day winning streak, trading around 104.30 during the European session on Wednesday. The Japanese Yen (JPY) appreciated against the Australian Dollar (AUD) after Bank of Japan (BoJ) board member Seiji Adachi emphasized reducing bond buying in stages so that long-term yields could better serve as a market signal. However, Adachi did not provide a specific timeline for this adjustment, per Reuters
Regarding the interest rate outlook, Adachi commented that it would be appropriate to increase interest rates at a slow pace if underlying inflation steadily moves toward the 2% target. Earlier in the day, He also highlighted the potential consequences of frequent changes in monetary policy aimed at stabilizing foreign exchange movements. He warned that significant fluctuations in interest rates could disrupt household and corporate investment.
The Australian Dollar (AUD) moves back and forth during the Asian session after the release of the higher-than-expected consumer inflation data. Australia’s Monthly Consumer Price Index rose 3.6% year-over-year in April, surpassing the expected reading of 3.4% and the previous reading of 3.5%.
The stronger consumer inflation data could prompt the Reserve Bank of Australia (RBA) to consider another rate hike. The minutes from the RBA's May policy meeting suggested that the central bank had contemplated a potential interest rate increase.
- Oil pops above $80 for the first time in a month.
- Pressure in Oil markets is rising ahead of the OPEC+ meeting in June.
- The US Dollar Index edges up towards 104.50 after the Fed’s Kashkari hawkish comments.
Oil prices extend their rally for a fourth consecutive day on Wednesday with tensions building up towards the OPEC+ meeting at the beginning of June. Recent reports from Bloomberg Intelligence are pointing to an Oil deficit for the second half of 2024 in case OPEC+ maintains the current production cuts in place. Meanwhile, OPEC+ itself is undercutting its own efforts amid reports that several OPEC members are not adhering to their promised production cuts.
Meanwhile, the US Dollar Index (DXY), which tracks the performance of the US Dollar against a basket of six major currencies, trades stronger after Minneapolis Federal Reserve President Neel Kashkari spooked markets by floating the idea that a rate hike is still on the cards. This pushed markets into risk-off mood, with equities dropping lower and the Greenback moving higher against its main peers.
At the time of writing, Crude Oil (WTI) trades at $80.33 and Brent Crude at $84.62.
Oil news and market movers: OPEC talk of the town
- Chinese Oil buyers are warning of less demand as they slash their production rates with the current Chinese housing market crisis and overall less demand for plastics due to ESG push in Europe and the US.
- Bloomberg reports that OPEC has been using active supply management in order to keep Oil prices supported.
- UBS strategists issued a note on Wednesday, favoring investments in Oil over Gold with more upside potential for Oil against precious metals.
- Tensions remain elevated in the Middle East with Israel’s opposition parties reportedly looking for ways to oust current Prime Minister Benjamin Netanyahu.
Oil Technical Analysis: Substantial recovery
Oil prices have recovered in recent days, printing a new fresh high for May right at the end of month. Although it might look tempting for traders to jump, risk of upside resistance is ample and this build up could be a classic “buy the rumor, sell the fact” type of event, with the possibility that the upcoming OPEC meeting disappoints markets.
On the upside, the 55-day Simple Moving Average (SMA) at $81.31 and the descending trendline at $81.85 are forming an area with a lot of resistance. Once broken through there, the road looks quite open to head to $87.12.
On the downside, a big support area is present with both the 100-day SMA at $78.95 and the 200-day SMA at $79.57. Adding to these, there is an ascending trendline, forming a trifecta of support levels that should avoid another steep decline. Should those levels not hold, a revisit of May’s low near $76.00 looks inevitable.
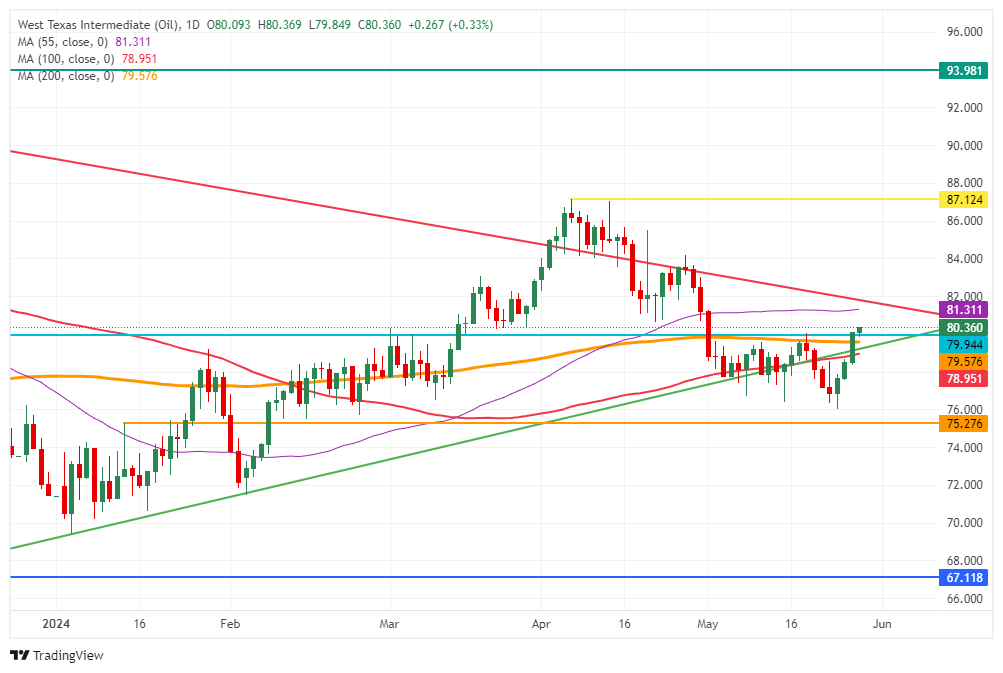
US WTI Crude Oil: Daily Chart
WTI Oil FAQs
WTI Oil is a type of Crude Oil sold on international markets. The WTI stands for West Texas Intermediate, one of three major types including Brent and Dubai Crude. WTI is also referred to as “light” and “sweet” because of its relatively low gravity and sulfur content respectively. It is considered a high quality Oil that is easily refined. It is sourced in the United States and distributed via the Cushing hub, which is considered “The Pipeline Crossroads of the World”. It is a benchmark for the Oil market and WTI price is frequently quoted in the media.
Like all assets, supply and demand are the key drivers of WTI Oil price. As such, global growth can be a driver of increased demand and vice versa for weak global growth. Political instability, wars, and sanctions can disrupt supply and impact prices. The decisions of OPEC, a group of major Oil-producing countries, is another key driver of price. The value of the US Dollar influences the price of WTI Crude Oil, since Oil is predominantly traded in US Dollars, thus a weaker US Dollar can make Oil more affordable and vice versa.
The weekly Oil inventory reports published by the American Petroleum Institute (API) and the Energy Information Agency (EIA) impact the price of WTI Oil. Changes in inventories reflect fluctuating supply and demand. If the data shows a drop in inventories it can indicate increased demand, pushing up Oil price. Higher inventories can reflect increased supply, pushing down prices. API’s report is published every Tuesday and EIA’s the day after. Their results are usually similar, falling within 1% of each other 75% of the time. The EIA data is considered more reliable, since it is a government agency.
OPEC (Organization of the Petroleum Exporting Countries) is a group of 13 Oil-producing nations who collectively decide production quotas for member countries at twice-yearly meetings. Their decisions often impact WTI Oil prices. When OPEC decides to lower quotas, it can tighten supply, pushing up Oil prices. When OPEC increases production, it has the opposite effect. OPEC+ refers to an expanded group that includes ten extra non-OPEC members, the most notable of which is Russia.
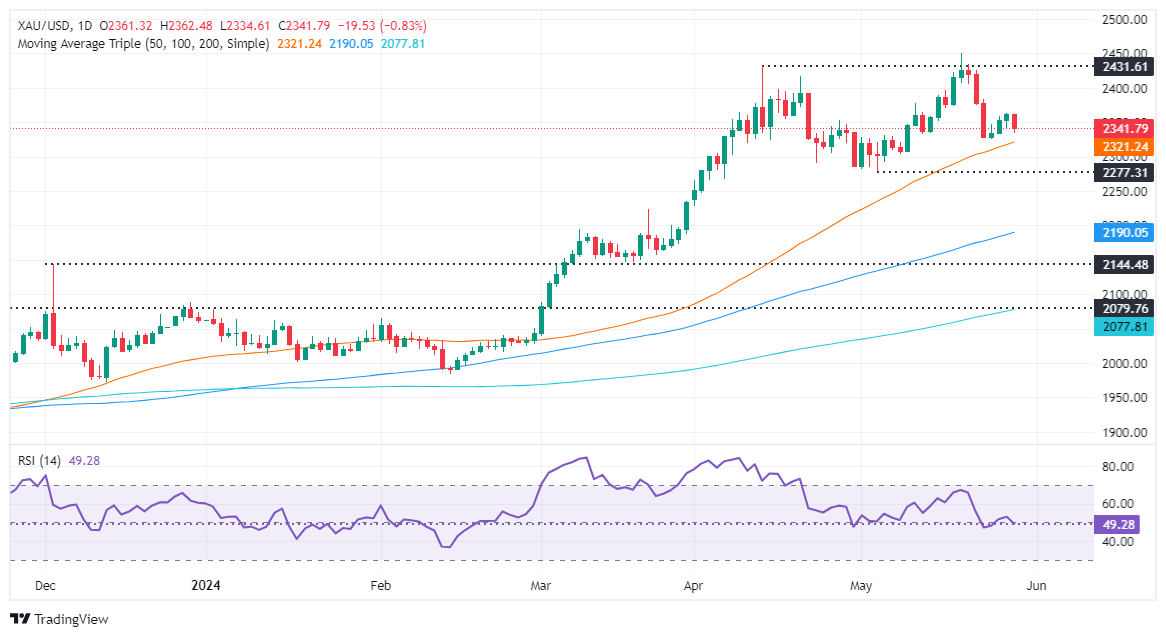
- Gold price tumbles to $2,340 as investors worry that Fed rates will remain higher for longer.
- The US Dollar and bond yields rise as traders pare Fed rate-cut bets for September.
- Investors shift focus to the US core PCE price index data for fresh guidance on Friday.
Gold price (XAU/USD) falls sharply to near $2,340 in Wednesday’s European session. The precious metal weakens after the recovery move to near $2,360 stalled. The yellow metal falls back as Federal Reserve (Fed) policymakers emphasize keeping interest rates higher for longer.
Meanwhile, investors turn cautious as the focus shifts to the United States (US) core Personal Consumption Expenditure Price Index (PCE) data for April, which will be published on Friday. The Fed’s preferred inflation measure is forecasted to have grown steadily on both monthly and annual basis at 0.3% and 2.8%, respectively.
The expected growth in the underlying inflation data would prompt the likelihood of interest rates remaining at higher levels. This scenario bodes poorly for the Gold price given that the opportunity cost of holding investments in non-yielding assets, such as Gold, rises. The condition would be favorable for yields on interest-bearing assets and US Dollar.
At the time of writing, the US Dollar rises to 104.70 and the 10-year US Treasury yields post fresh three-week high around 4.57% on cautious market sentiment.
Daily digest market movers: Gold price comes under pressure after Fed Kashkari’s hawkish guidance
- Gold price resumes its downside journey after a short-lived pullback move to near $2,360. The precious metal comes under pressure as traders redeem significant bets favouring the Fed to begin lowering interest rates from the September meeting. The confidence of traders towards the Fed reducing borrowing rates from September has been shaken by the Fed’s hawkish guidance on interest rates.
- The CME FedWatch tool shows that traders see a 46% chance that the central bank will reduce interest rates from their current levels in September. The odds have come down from 57.5% recorded a week ago.
- Fed officials want to be patient with the current interest rate framework as they lack evidence that inflation will sustainably return to the desired rate of 2%. Despite a decline in inflationary pressures in April after remaining hot for the entire first quarter, policymakers want interest rates to remain elevated. Policymakers worry that the slowdown won’t be long-lasting given the strength in the labor market.
- Meanwhile, Fed policymakers are also open to tightening policy further if progress in the disinflation process stalls or price pressures revamp again. On Tuesday, Minneapolis Fed Bank President Neel Kashkari said in an interview with CNBC broadcast, “I think the odds of us raising rates are quite low, but I don’t want to take anything off the table.”
- When asked about what conditions will boost the confidence of the Fed for rate cuts this year, Kaskari said: "Many more months of positive inflation data, I think, to give me confidence that it’s appropriate to dial back," Reuters reported.
Technical Analysis: Gold price delivers an inverted flag breakdown
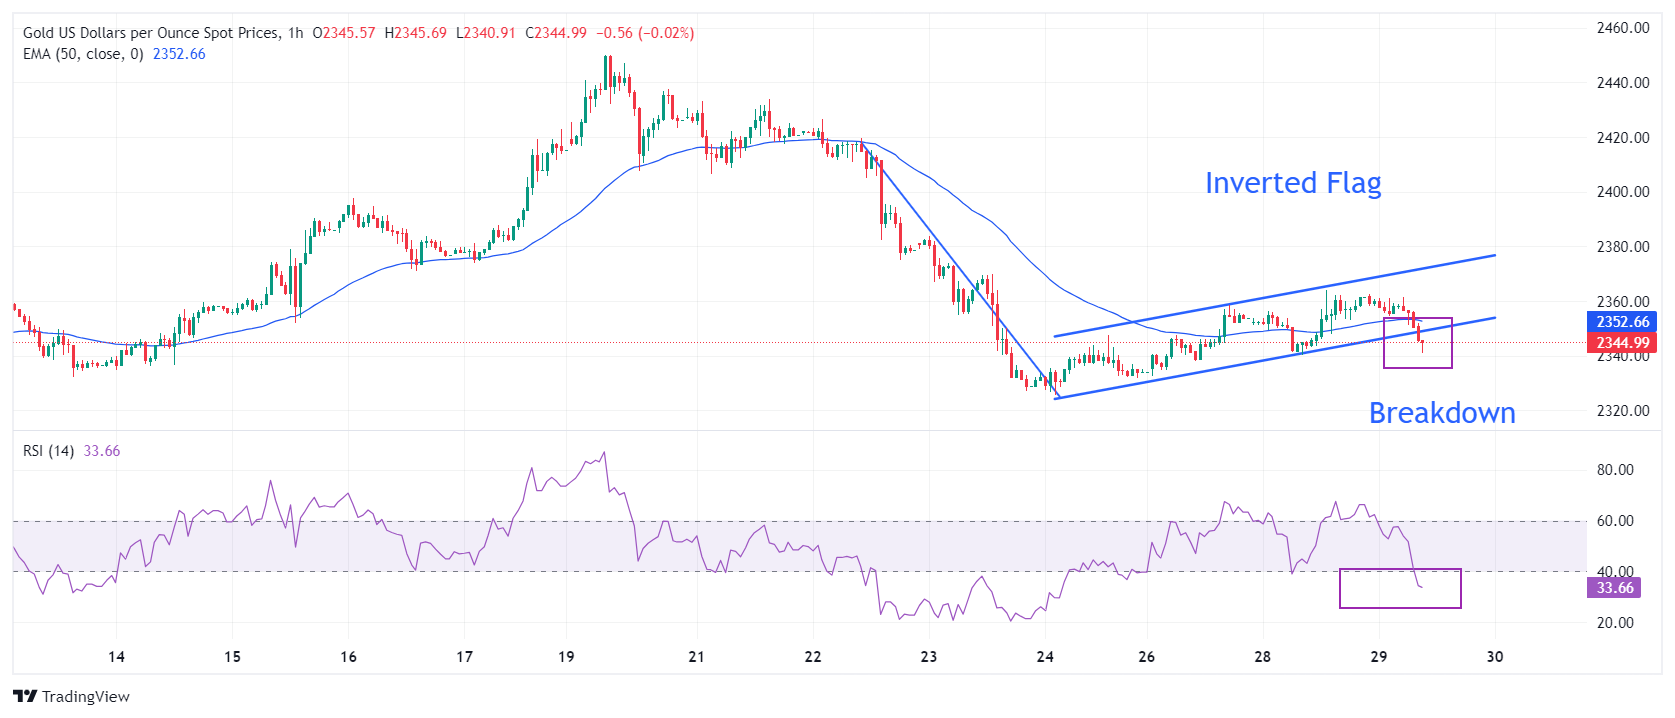
Gold price weakens after the breakdown of an Inverted Flag chart formation on an hourly timeframe. A breakdown of the above-mentioned chart pattern suggests that the downside trend has resumed after the entry of fresh sellers. The near-term outlook is uncertain as the Gold price has slipped below the 50-period Exponential Moving Average (EMA), which trades around $2,350.
The 14-period Relative Strength Index (RSI) has shifted into the bearish range of 20.00-40.00, suggesting that a bearish momentum has been established.
If the Gold price breaks below the May 24 low of around $2,320, more downside will appear. However, a recovery move above the May 28 high of around $2,365 would put bulls in the driving seat.
Gold FAQs
Gold has played a key role in human’s history as it has been widely used as a store of value and medium of exchange. Currently, apart from its shine and usage for jewelry, the precious metal is widely seen as a safe-haven asset, meaning that it is considered a good investment during turbulent times. Gold is also widely seen as a hedge against inflation and against depreciating currencies as it doesn’t rely on any specific issuer or government.
Central banks are the biggest Gold holders. In their aim to support their currencies in turbulent times, central banks tend to diversify their reserves and buy Gold to improve the perceived strength of the economy and the currency. High Gold reserves can be a source of trust for a country’s solvency. Central banks added 1,136 tonnes of Gold worth around $70 billion to their reserves in 2022, according to data from the World Gold Council. This is the highest yearly purchase since records began. Central banks from emerging economies such as China, India and Turkey are quickly increasing their Gold reserves.
Gold has an inverse correlation with the US Dollar and US Treasuries, which are both major reserve and safe-haven assets. When the Dollar depreciates, Gold tends to rise, enabling investors and central banks to diversify their assets in turbulent times. Gold is also inversely correlated with risk assets. A rally in the stock market tends to weaken Gold price, while sell-offs in riskier markets tend to favor the precious metal.
The price can move due to a wide range of factors. Geopolitical instability or fears of a deep recession can quickly make Gold price escalate due to its safe-haven status. As a yield-less asset, Gold tends to rise with lower interest rates, while higher cost of money usually weighs down on the yellow metal. Still, most moves depend on how the US Dollar (USD) behaves as the asset is priced in dollars (XAU/USD). A strong Dollar tends to keep the price of Gold controlled, whereas a weaker Dollar is likely to push Gold prices up.
- NZD/USD extends losses as Fed’s Neel Kashkari stated that a rate hike might still be possible.
- The higher US Treasury yields contributed support for the US Dollar.
- ANZ Business Confidence Index fell to 11.2 in May, marking the lowest reading since last September.
NZD/USD extended losses for the second successive session, trading around 0.6140 during the European hours on Wednesday. The US Dollar (USD) gained ground against the New Zealand Dollar (NZD) after the emergence of the risk aversion sentiment, which could be attributed to the hawkish comments from the Minneapolis Fed President Neel Kashkari during an event in London on Tuesday. As per an MSN report, Kashkari stated “I don’t think anybody has totally taken rate increases off the table.” And suggested that a rate hike might still be possible.
The gains in the US Treasury yields also supported the Greenback. The US Dollar Index (DXY), which measures the USD against six major currencies, trades higher around 104.70, with 2-year and 10-year US Treasury yields at 4.95% and 4.54%, respectively, at the time of writing.
Moreover, the mid-tier US Housing Price Index (MoM) for March was underperforming, with March's number coming in at 0.1% against 1.2% for February, where 0.5% was expected. On Wednesday, the Fed's Beige Book will be released, providing an overview of the current US economic situation based on interviews with key business contacts, economists, market experts, and other sources from the 12 Federal Reserve Districts.
On Kiwi’s front, the ANZ Business Confidence Index fell to 11.2 in May from the previous reading of 14.9, marking the fourth consecutive month of decline and the lowest reading since last September.
The Reserve Bank of New Zealand (RBNZ) has revised its forecast, raising the expected peak in interest rates and delaying the anticipated timing for a rate cut. Traders will closely watch the Yearly New Zealand Budget Release from the New Zealand Treasury on Thursday. Additionally, a highly anticipated speech by RBNZ Governor Adrian Orr is scheduled for Friday.
- EUR/USD dips to near 1.0830 as investors turn cautious ahead of Eurozone/US inflation data.
- ECB Knot advised the use of a gradual rate-cut approach due to dynamic components such as inflation, demand, and wage growth.
- The US Dollar bounces back as investors expect the Fed to start reducing interest rates in the last quarter of the year.
EUR/USD falls to 1.0830 in Wednesday’s European session after failing to recapture a two-month high near 1.0900 on Tuesday. The major currency pair retraces as the market sentiment turns cautious ahead of the release of the Eurozone preliminary Consumer Price Index (CPI) data for May and the United States (US) core Personal Consumption Expenditure Price Index (PCE) data for April, which will be published on Friday.
The Eurozone CPI and US core PCE inflation data will significantly influence market speculation for interest rate cuts by the European Central Bank (ECB) and the US Federal Reserve (Fed).
The Fed’s preferred inflation measure is estimated to have grown steadily on a monthly and annual basis at 0.3% and 2.8%, respectively.
The US Dollar Index (DXY), which tracks the Greenback’s value against six major currencies, extends recovery to 104.80. The sharp recovery in the US Dollar is prompted by dismal market sentiment. Investors turn risk-averse after traders pare Fed rate cut bets for the September meeting as officials have been guiding to keep interest rates at their current levels until they see significant progress in the disinflation process. Currently, investors expect the Fed to start reducing interest rates from the last quarter of the year.
Daily digest market movers: EUR/USD exhibits weakness ahead of German inflation
- EUR/USD drops sharply to near 1.0830 after correcting from the weekly high of 1.0890. The shared currency pair is expected to remain volatile as investors await the preliminary German CPI data for May, which will be published at 12:00 GMT on Wednesday.
- Economists expect monthly headline and harmonized inflation data grew at a slower pace of 0.2% in May. Annual Harmonized Index of Consumer Prices (HICP) is estimated to have accelerated by 2.7% from the prior reading of 2.4%. German inflation data will have a significant impact on the European Central Bank’s interest rate outlook as the nation is the largest contributor to Eurozone’s Gross Domestic Product (GDP).
- Currently, the ECB is widely anticipated to roll back its restrictive interest rate framework, which has been maintained since July 2022. Therefore, investors are interested to know more about how far and fast the ECB will cut its key borrowing rates beyond June. ECB policymakers are reluctant to commit to any subsequent rate cut path and want to remain data-dependent.
- Earlier this week, ECB policymaker and French central bank governor François Villeroy de Galhau rebuffed suggestions of one rate cut each quarter and said, "I don't say that we should commit already in July, but let us keep our freedom on the timing and pace."
- On Tuesday, ECB governing council member and Dutch central bank chief Klaas Knot advised adopting a gradual rate-cut approach and making decisions on interest rates based on quarterly economic projections. Knot highlighted that March projections suggested three or four rate cuts would be appropriate this year. However, recent data showed that wage growth has elevated and the Manufacturing PMI has improved, which undermines the projected rate-cut path based on March’s data.
Technical Analysis: EUR/USD fails to recapture two-month high near 1.0900
EUR/USD faces sharp selling pressure as the US Dollar bounces back strongly. The major currency pair struggles to hold strength even though the breakout of the Symmetrical Triangle chart pattern formed on a daily timeframe.
The shared currency pair's near-term outlook remains firm, as it trades well above all short-to-long-term Exponential Moving Averages (EMAs).
The 14-period Relative Strength Index (RSI) has slipped into the 40.00-60.00 range, suggesting that the momentum, which was leaned toward the upside, has faded for now.
Euro FAQs
The Euro is the currency for the 20 European Union countries that belong to the Eurozone. It is the second most heavily traded currency in the world behind the US Dollar. In 2022, it accounted for 31% of all foreign exchange transactions, with an average daily turnover of over $2.2 trillion a day. EUR/USD is the most heavily traded currency pair in the world, accounting for an estimated 30% off all transactions, followed by EUR/JPY (4%), EUR/GBP (3%) and EUR/AUD (2%).
The European Central Bank (ECB) in Frankfurt, Germany, is the reserve bank for the Eurozone. The ECB sets interest rates and manages monetary policy. The ECB’s primary mandate is to maintain price stability, which means either controlling inflation or stimulating growth. Its primary tool is the raising or lowering of interest rates. Relatively high interest rates – or the expectation of higher rates – will usually benefit the Euro and vice versa. The ECB Governing Council makes monetary policy decisions at meetings held eight times a year. Decisions are made by heads of the Eurozone national banks and six permanent members, including the President of the ECB, Christine Lagarde.
Eurozone inflation data, measured by the Harmonized Index of Consumer Prices (HICP), is an important econometric for the Euro. If inflation rises more than expected, especially if above the ECB’s 2% target, it obliges the ECB to raise interest rates to bring it back under control. Relatively high interest rates compared to its counterparts will usually benefit the Euro, as it makes the region more attractive as a place for global investors to park their money.
Data releases gauge the health of the economy and can impact on the Euro. Indicators such as GDP, Manufacturing and Services PMIs, employment, and consumer sentiment surveys can all influence the direction of the single currency. A strong economy is good for the Euro. Not only does it attract more foreign investment but it may encourage the ECB to put up interest rates, which will directly strengthen the Euro. Otherwise, if economic data is weak, the Euro is likely to fall. Economic data for the four largest economies in the euro area (Germany, France, Italy and Spain) are especially significant, as they account for 75% of the Eurozone’s economy.
Another significant data release for the Euro is the Trade Balance. This indicator measures the difference between what a country earns from its exports and what it spends on imports over a given period. If a country produces highly sought after exports then its currency will gain in value purely from the extra demand created from foreign buyers seeking to purchase these goods. Therefore, a positive net Trade Balance strengthens a currency and vice versa for a negative balance.
Silver prices (XAG/USD) broadly unchanged on Wednesday, according to FXStreet data. Silver trades at $32.10 per troy ounce, steady from Tuesday.
Silver prices have increased by 26.03% since the beginning of the year.
| Unit measure | Today Price |
|---|---|
| Silver price per troy ounce | $32.10 |
| Silver price per gram | $1.03 |
The Gold/Silver ratio, which shows the number of troy ounces of Silver needed to equal the value of one troy ounce of Gold, stood at 73.15 on Wednesday, down from 73.55 on Tuesday.
Investors might use this ratio to determine the relative valuation of Gold and Silver. Some may consider a high ratio as an indicator that Silver is undervalued – or Gold is overvalued – and might buy Silver or sell Gold accordingly. Conversely, a low ratio might suggest that Gold is undervalued relative to Silver.
Silver FAQs
Silver is a precious metal highly traded among investors. It has been historically used as a store of value and a medium of exchange. Although less popular than Gold, traders may turn to Silver to diversify their investment portfolio, for its intrinsic value or as a potential hedge during high-inflation periods. Investors can buy physical Silver, in coins or in bars, or trade it through vehicles such as Exchange Traded Funds, which track its price on international markets.
Silver prices can move due to a wide range of factors. Geopolitical instability or fears of a deep recession can make Silver price escalate due to its safe-haven status, although to a lesser extent than Gold's. As a yieldless asset, Silver tends to rise with lower interest rates. Its moves also depend on how the US Dollar (USD) behaves as the asset is priced in dollars (XAG/USD). A strong Dollar tends to keep the price of Silver at bay, whereas a weaker Dollar is likely to propel prices up. Other factors such as investment demand, mining supply – Silver is much more abundant than Gold – and recycling rates can also affect prices.
Silver is widely used in industry, particularly in sectors such as electronics or solar energy, as it has one of the highest electric conductivity of all metals – more than Copper and Gold. A surge in demand can increase prices, while a decline tends to lower them. Dynamics in the US, Chinese and Indian economies can also contribute to price swings: for the US and particularly China, their big industrial sectors use Silver in various processes; in India, consumers’ demand for the precious metal for jewellery also plays a key role in setting prices.
Silver prices tend to follow Gold's moves. When Gold prices rise, Silver typically follows suit, as their status as safe-haven assets is similar. The Gold/Silver ratio, which shows the number of ounces of Silver needed to equal the value of one ounce of Gold, may help to determine the relative valuation between both metals. Some investors may consider a high ratio as an indicator that Silver is undervalued, or Gold is overvalued. On the contrary, a low ratio might suggest that Gold is undervalued relative to Silver.
Gold prices rose in India on Wednesday, according to data from India's Multi Commodity Exchange (MCX).
Gold price stood at 72,343 Indian Rupees (INR) per 10 grams, up INR 410 compared with the INR 71,933 it cost on Tuesday.
As for futures contracts, Gold prices decreased to INR 72,350 per 10 gms from INR 72,407 per 10 gms.
Prices for Silver futures contracts increased to INR 95,950 per kg from INR 95,448 per kg.
| Major Indian city | Gold Price |
|---|---|
| Ahmedabad | 74,840 |
| Mumbai | 74,635 |
| New Delhi | 74,730 |
| Chennai | 74,910 |
| Kolkata | 74,810 |
Global Market Movers: Comex Gold price faces some pressure from hawkish Fedspeak
- Israeli Prime Minister Benjamin Netanyahu has vowed to continue the war against Hamas amid international condemnation of an air strike that killed at least 45 people in Rafah on Sunday, per the BBC.
- The World Gold Council reported that global physically-backed gold exchange-traded funds (ETFs) witnessed a net outflow of 11.3 metric tonnes last week.
- UBS analysts expect gold prices to reach $2,500 an ounce by September and hit $2,600 an ounce by year-end. The forecast is higher than the initial estimates of $2,400 and $2,500 per ounce, respectively.
- Consumer Confidence improved slightly in May, the Conference Board reported on Tuesday. The figure rose to 102.0 in May from 97.0 in April, beating the estimation of 95.9.
- Fed Governor Michelle Bowman said on Tuesday that she would have supported either waiting to start slowing the quantitative tightening pace or a more moderate tapering process than announced earlier this month.
- Fed Minneapolis President Neel Kashkari said that the central bank should wait for significant progress on inflation before cutting interest rates, adding that he expected no more than two rate cuts in 2024.
(An automation tool was used in creating this post.)
Gold FAQs
Gold has played a key role in human’s history as it has been widely used as a store of value and medium of exchange. Currently, apart from its shine and usage for jewelry, the precious metal is widely seen as a safe-haven asset, meaning that it is considered a good investment during turbulent times. Gold is also widely seen as a hedge against inflation and against depreciating currencies as it doesn’t rely on any specific issuer or government.
Central banks are the biggest Gold holders. In their aim to support their currencies in turbulent times, central banks tend to diversify their reserves and buy Gold to improve the perceived strength of the economy and the currency. High Gold reserves can be a source of trust for a country’s solvency. Central banks added 1,136 tonnes of Gold worth around $70 billion to their reserves in 2022, according to data from the World Gold Council. This is the highest yearly purchase since records began. Central banks from emerging economies such as China, India and Turkey are quickly increasing their Gold reserves.
Gold has an inverse correlation with the US Dollar and US Treasuries, which are both major reserve and safe-haven assets. When the Dollar depreciates, Gold tends to rise, enabling investors and central banks to diversify their assets in turbulent times. Gold is also inversely correlated with risk assets. A rally in the stock market tends to weaken Gold price, while sell-offs in riskier markets tend to favor the precious metal.
The price can move due to a wide range of factors. Geopolitical instability or fears of a deep recession can quickly make Gold price escalate due to its safe-haven status. As a yield-less asset, Gold tends to rise with lower interest rates, while higher cost of money usually weighs down on the yellow metal. Still, most moves depend on how the US Dollar (USD) behaves as the asset is priced in dollars (XAU/USD). A strong Dollar tends to keep the price of Gold controlled, whereas a weaker Dollar is likely to push Gold prices up.
Here is what you need to know on Wednesday, May 29:
Major currency pairs are having a difficult time finding direction in the first half of the week. Following Tuesday's modest rebound, the US Dollar (USD) Index hold steady slightly above 104.50. Later in the day, Consumer Price Index (CPI) data from Germany will be watched closely by market participants. During the American trading hours, the Federal Reserve (Fed) will release its Beige Book.
The upbeat consumer sentiment data from the US, combined with a nearly 2% increase seen in the 10-year US Treasury bond yield, helped the USD stay resilient against its rivals on Tuesday. Early Wednesday, the 10-year US yield holds steady above 4.5%. Meanwhile, US stock index futures trade in negative territory after Wall Street's main indexes registered small gains on Tuesday.
US Dollar PRICE This week
The table below shows the percentage change of US Dollar (USD) against listed major currencies this week. US Dollar was the strongest against the Japanese Yen.
| USD | EUR | GBP | JPY | CAD | AUD | NZD | CHF | |
|---|---|---|---|---|---|---|---|---|
| USD | -0.08% | -0.24% | 0.05% | -0.09% | -0.43% | -0.43% | -0.27% | |
| EUR | 0.08% | -0.19% | 0.17% | -0.01% | -0.42% | -0.44% | -0.16% | |
| GBP | 0.24% | 0.19% | 0.30% | 0.15% | -0.23% | -0.19% | 0.01% | |
| JPY | -0.05% | -0.17% | -0.30% | -0.18% | -0.50% | -0.41% | -0.34% | |
| CAD | 0.09% | 0.00% | -0.15% | 0.18% | -0.37% | -0.34% | -0.23% | |
| AUD | 0.43% | 0.42% | 0.23% | 0.50% | 0.37% | 0.06% | 0.21% | |
| NZD | 0.43% | 0.44% | 0.19% | 0.41% | 0.34% | -0.06% | 0.16% | |
| CHF | 0.27% | 0.16% | -0.01% | 0.34% | 0.23% | -0.21% | -0.16% |
The heat map shows percentage changes of major currencies against each other. The base currency is picked from the left column, while the quote currency is picked from the top row. For example, if you pick the US Dollar from the left column and move along the horizontal line to the Japanese Yen, the percentage change displayed in the box will represent USD (base)/JPY (quote).
During the Asian session, the data from Australia showed that the CPI rose 3.6% on a monthly basis in April. This reading followed the 3.5% increase recorded in March and came in above the market expectation of 3.4%. Other data from Australia showed that the ANZ Business Confidence Index declined to 11.2 in May from 14.9. AUD/USD edged slightly higher following the data releases and was last seen trading above 0.6650.
Australian Dollar consolidates after robust Monthly inflation, US Dollar remains firm.
Bank of Japan (BoJ) board member Seiji Adachi said early Wednesday that they are not yet at a stage where they are convinced there is a sustained achievement of price target, adding that they must maintain accommodative conditions. USD/JPY showed no reaction to these remarks and was last seen trading sideways at around 157.00.
Japanese Yen recovers early losses after BoJ Adachi favors to reduce bond-buying.
After rising toward 1.0900 during the European trading hours, EUR/USD lost its traction and declined toward 1.0850, closing virtually unchanged on Tuesday. The pair stays relatively quiet early Wednesday near Tuesday's closing level.
GBP/USD touched its highest level in over a month above 1.2800 on Tuesday but erased its gains to end the day flat above 1.2750. The pair trades marginally higher on the day at around 1.2770 in the European morning.
Gold posted gains for the third consecutive day on Tuesday. Nevertheless, the recovery seen in the US yields capped XAU/USD's upside and caused it to retreat toward $2,350.
Economic Indicator
Fed's Beige Book
The Beige Book reports on the current US economic situation. Through interviews with key business contacts, economists, market experts, and other sources are gathered by each of the 12 Federal Reserve Districts. The survey gives a picture of the overall US economic growth. An optimistic view of those authorities is considered as positive, or bullish for the USD, whereas a pessimistic view is considered as negative, or bearish for the Dollar.
Read more.Last release: Wed Apr 17, 2024 18:00
Frequency: Irregular
Actual: -
Consensus: -
Previous: -
Source: Federal Reserve
- Silver price extends its upside around $32.25 in Wednesday’s European session, up 0.50% on the day.
- The rising industrial demand for silver and ongoing Middle East geopolitical risks support the white metal.
- The upbeat US economic data and the Fed’s hawkish tone might cap the silver’s upside.
The silver price (XAG/USD) extends the rally near $32.25 during the early European trading hours on Wednesday. The white metal trades in positive territory for the fourth consecutive day amid growing industrial demand. However, investors await the US key data this week for fresh impetus. All eyes will be on the preliminary US Gross Domestic Product (GDP) numbers for Q1 on Thursday and the Core Personal Consumption Expenditures Price Index (PCE) on Friday.
According to the Silver Institute, total industrial demand for silver is projected to rise by 9% to 711 mn oz, driven by demand from the photovoltaic sector. Additionally, UBS analysts expect a substantial shortfall in the silver market, anticipating an undersupply of 215.3 million ounces for the year, representing 17% of world demand. This, in turn, might contribute to the white metal's upside.
Furthermore, the rising geopolitical tensions in the Middle East might boost silver prices. Israeli Prime Minister Benjamin Netanyahu has vowed to continue the war against Hamas amid international condemnation of an air strike that killed at least 45 people in Rafah on Sunday, per the BBC.
On the other hand, the stronger US economic data and the hawkish messages from the Federal Reserve (Fed) might cap the further upside for the white metal. On Tuesday, Fed Minneapolis President Neel Kashkari said that the central bank should wait for significant progress on inflation before cutting interest rates, adding that he expected no more than two rate cuts in 2024. It’s worth noting that high interest rates generally diminish investor sentiment and cause a decrease in demand for silver.
- The Pound Sterling drops after facing selling pressure near 1.2800 due to multiple tailwinds.
- A soft UK inflation outlook could prompt the BoE to start unwinding higher interest rates.
- The US Dollar recovers amid uncertainty ahead of the US core PCE price index.
The Pound Sterling (GBP) corrects to 1.2750 against the US Dollar (USD) in Wednesday’s London session after posting a fresh 10-week high at 1.2800 on Tuesday. The rally in the GBP/USD pair stalls as the United Kingdom (UK) inflation outlook softens and the US Dollar (USD) comes out of the woods.
UK shop price inflation data from the British Retail Consortium (BRC) indicated that prices of food and non-food items eased significantly in May. Annual shop price changes in the popular retail outlets in the UK grew by 0.6%, the slowest pace since November 2021, from the prior reading of 0.8%. Food price inflation dropped for the 13th straight month, declining to 3.2% from 3.4% in April. The agency noted that retailers are passing the benefit of lower prices to consumers.
A softer UK inflation outlook would boost expectations of rate cuts by the Bank of England (BoE), which has been maintaining a restrictive interest rate stance since December 2021. Currently, investors expect that the BoE could use the August meeting as the earliest point to begin the policy-normalization process.
Daily digest market movers: Pound Sterling falls as Fed maintains hawkish interest rate guidance
- The Pound Sterling falls to 1.2750 against the US Dollar as the market sentiment turns cautious. The appeal for risk-perceived assets has become uncertain as investors expect that the Federal Reserve (Fed) will not start reducing interest rates before the fourth quarter of the year. S&P 500 futures have posted significant losses in the Asian session, reflecting a risk-off market mood. The US Dollar Index (DXY), which tracks the Greenback’s value against six major currencies, recovers to 104.70
- Traders redeemed their bets that the Fed to begin lowering borrowing costs from their current levels in the September meeting. The reason traders unwind their bets is that Fed policymakers want to see price pressures decline for months before considering interest rate cuts.
- The CME FedWatch tool shows that the probability of interest rates coming down from their current levels in September has declined to 44% from 58% recorded a week ago. On Tuesday, Minneapolis Fed Bank President Neel Kashkari said that the possibility of more rate hikes is quite low but has not been taken off the table. Kashkari emphasized that the Fed should wait for significant progress in disinflation before moving to rate cuts.
- This week, investors will focus on the core Personal Consumption Expenditure Price Index (PCE) data for April, which will be published on Friday, to get fresh cues about the Federal Reserve interest rate outlook. The Fed’s preferred inflation measure is estimated to have grown steadily on a monthly and annual basis at 0.3% and 2.8%, respectively. Steady inflation growth would prompt the likelihood of interest rates remaining at higher levels.
Technical Analysis: Pound Sterling faces pressure near 1.2800
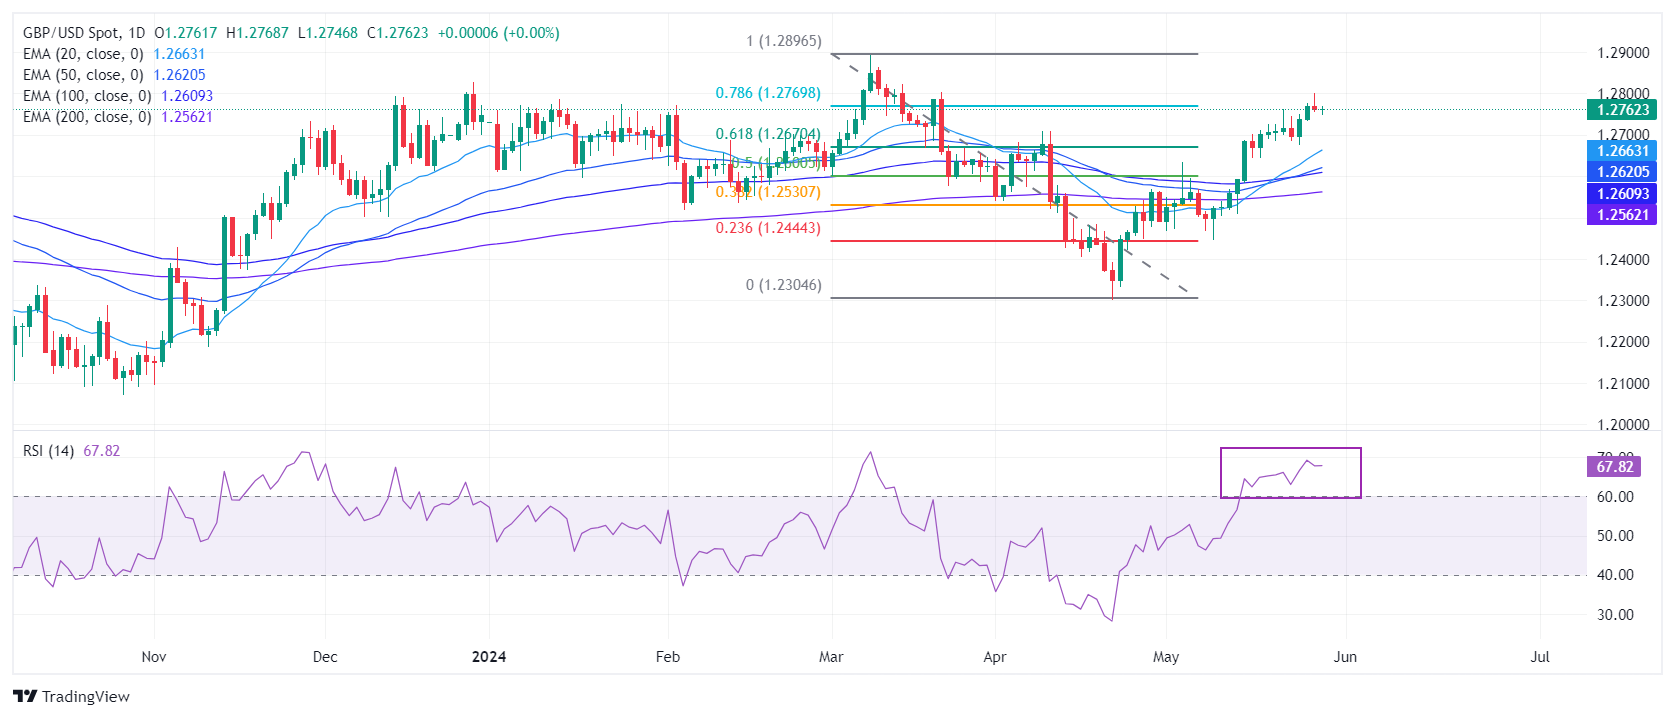
The Pound Sterling faces selling pressure near the round-level resistance of 1.2800. The GBP/USD pair is expected to remain volatile ahead of the release of the Fed’s preferred inflation gauge on Friday. However, the near-term outlook of the Cable remains firm as it holds the 61.8% Fibonacci retracement (plotted from the March 8 high of 1.2900 to the April 22 low at 1.2300) at 1.2670.
The Cable is expected to continue in the bullish trajectory as all short-to-long-term Exponential Moving Averages (EMAs) are sloping higher, suggesting a strong uptrend.
The 14-period Relative Strength Index (RSI) has shifted into the bullish range of 60.00-80.00, suggesting that the momentum has leaned toward the upside.
Pound Sterling FAQs
The Pound Sterling (GBP) is the oldest currency in the world (886 AD) and the official currency of the United Kingdom. It is the fourth most traded unit for foreign exchange (FX) in the world, accounting for 12% of all transactions, averaging $630 billion a day, according to 2022 data. Its key trading pairs are GBP/USD, aka ‘Cable’, which accounts for 11% of FX, GBP/JPY, or the ‘Dragon’ as it is known by traders (3%), and EUR/GBP (2%). The Pound Sterling is issued by the Bank of England (BoE).
The single most important factor influencing the value of the Pound Sterling is monetary policy decided by the Bank of England. The BoE bases its decisions on whether it has achieved its primary goal of “price stability” – a steady inflation rate of around 2%. Its primary tool for achieving this is the adjustment of interest rates. When inflation is too high, the BoE will try to rein it in by raising interest rates, making it more expensive for people and businesses to access credit. This is generally positive for GBP, as higher interest rates make the UK a more attractive place for global investors to park their money. When inflation falls too low it is a sign economic growth is slowing. In this scenario, the BoE will consider lowering interest rates to cheapen credit so businesses will borrow more to invest in growth-generating projects.
Data releases gauge the health of the economy and can impact the value of the Pound Sterling. Indicators such as GDP, Manufacturing and Services PMIs, and employment can all influence the direction of the GBP. A strong economy is good for Sterling. Not only does it attract more foreign investment but it may encourage the BoE to put up interest rates, which will directly strengthen GBP. Otherwise, if economic data is weak, the Pound Sterling is likely to fall.
Another significant data release for the Pound Sterling is the Trade Balance. This indicator measures the difference between what a country earns from its exports and what it spends on imports over a given period. If a country produces highly sought-after exports, its currency will benefit purely from the extra demand created from foreign buyers seeking to purchase these goods. Therefore, a positive net Trade Balance strengthens a currency and vice versa for a negative balance.
Platinum prices fell in United States on Wednesday, according to data compiled by FXStreet.
The price for Platinum stood at 34.17 United States Dollars (USD) per gram, down USD 0.05 compared with the USD 34.23 it cost on Tuesday.
| Unit measure | Platinum Price in USD |
|---|---|
| 1 Gram | 34.17 |
| 10 Grams | 341.73 |
| Troy Ounce | 1,062.80 |
FXStreet calculates Platinum prices in United States by adapting international prices (USD/USD) to the local currency and measurement units. Prices are updated daily based on the market rates taken at the time of publication. Prices are just for reference and local rates could diverge slightly.
(An automation tool was used in creating this post.)
FX option expiries for May 29 NY cut at 10:00 Eastern Time, via DTCC, can be found below
- EUR/USD: EUR amounts
- 1.0750 615m
- 1.0800 1.5b
- 1.0835 1b
- 1.0875 1.8b
- 1.0890 1.2b
- 1.0900 961m
- USD/JPY: USD amounts
- 156.50 628m
- 157.50 1.1b
- 158.00 761m
- AUD/USD: AUD amounts
- 0.6600 518m
- 0.6625 493m
- USD/CAD: USD amounts
- 1.3550 1b
- 1.3800 896m
Bank of Japan (BoJ) board member Seiji Adachi is back on the wires on Wednesday, expressing his take on the central bank’s monetary policy and exchange rate outlook.
Key quotes
There was no policy implication to BoJ’s single-day decrease in bond buying.
Don't have strong view on whether BoJ bond buying reduction should come soon, or later.
We will more carefully watch long-term interest rate moves.
If current FX moves persist, that will certainly have impact on economy, prices.
We will of course respond with monetary policy if FX moves have material impact on economy, prices.
Can't say now whether Yen moves would affect economy, prices.
BoJ will need long time, seek view by various experts, in deciding what to do with its ETF holdings.
We should reduce bond buying in several stages so that long-term yields better serve as market signal.
Don't have preset plan, idea on how soon to reduce BoJ’s bond buying.
My inflation forecasts haven't changed much from April.
Appropriate to adjust interest rates at slow pace if underlying inflation steadily moves toward 2%.
Too early to consider specific timing on next rate move.
Market reaction
USD/JPY keeps its range play intact above 157.00 following these comments, adding 0.05% on the day.
- USD/CHF trades on a flat note near 0.9125 in Wednesday’s early European session.
- The US CB’s Consumer Confidence rose to 102.0 in May from 97.5 in April, better than the estimated.
- The Swiss GDP growth number is estimated to grow by 0.3%.QoQ in Q1.
The USD/CHF pair trades flat around 0.9125 during the early European session on Wednesday. Traders remain cautious ahead of the crucial inflation readings this week. Later on Wednesday, the Fed’s Beige Book will be released, and the Fed’s John Williams is scheduled to speak.
The US Federal Reserve (Fed) is unlikely to cut rates until later this year as inflation remains sticky. Federal Reserve Bank of Minneapolis President Neel Kashkari said on Tuesday that the US central bank’s policy stance is restrictive, but further rate hikes cannot be ruled out. Investors are now pricing in nearly a 50% chance that the Fed will hold rates in September, according to the CME FedWatch tool.
Data from the US Conference Board on Tuesday revealed that Consumer Confidence improved to 102.0 in May from 97.5 in April, better than the estimation of 95.9. The figure unexpectedly rose in May after a decline for three straight months, but worries about inflation persisted, and the US consumer expected higher interest rates over the next year. This continues to underpin the Greenback and create a tailwind for USD/CHF.
Switzerland’s State Secretariat for Economic Affairs (SECO) will report the nation’s Gross Domestic Product (GDP) on Thursday. The GDP growth number for the first quarter (Q1) of 2024 is estimated to expand by 0.3%.QoQ in Q1. If the report shows a stronger-than-expected reading, this could provide some support to the Swiss Franc (CHF).
Apart from this, Israeli forces shelled a tent camp in a designated “safe zone” west of Rafah and killed at least 21 people, including 13 women and girls, in the latest mass killing of Palestinian civilians, according to Al Jazeera. Investors will closely watch the developments surrounding the geopolitical tensions in the Middle East. Any signs of escalating risks might further boost safe-haven assets like the CHF and cap the upside for the pair.
- EUR/USD consolidates within the ascending triangle, indicating a bullish bias.
- The upper boundary of the ascending triangle and the psychological level of 1.0900 appear to be key resistance levels.
- The pair could test the lower boundary of the ascending triangle, followed by the 21-day EMA at 1.0815.
EUR/USD extended losses to near 1.0850 during the Asian session on Wednesday. The pair faces challenges as the US Dollar (USD) gains ground amidst emerging risk aversion sentiment, possibly triggered by hawkish remarks from Minneapolis Fed President Neel Kashkari. Kashkari's comments suggest that rate increases are still a possibility and express uncertainty about the disinflationary process, with a prediction of only two rate cuts.
However, an analysis of the daily chart indicates a bullish bias for the EUR/USD pair, as it consolidates within an ascending triangle. Additionally, the 14-day Relative Strength Index (RSI) momentum indicator is slightly above the 50 level, further supporting this bullish bias.
The EUR/USD pair could potentially challenge the upper boundary of the ascending triangle, followed by the psychological resistance level at 1.0900. Breaking above this level could lead the pair toward the region around the significant level of 1.0950, followed by a three-month high of 1.0981.
On the downside, immediate support for the EUR/USD pair could be found at the lower boundary of the ascending triangle, followed by the 21-day Exponential Moving Average (EMA) at 1.0815. A breach below the psychological level of 1.0800 might exert downward pressure, potentially navigating toward the area around the significant level of 1.0700.
EUR/USD: Daily Chart
- WTI prices edge lower near $79.90 on Wednesday, down 0.20% on the day.
- The stronger USD and Fed’s hawkish stance weigh on the black gold.
- OPEC+ is widely anticipated to maintain this level of output reduction until the end of the year.
Western Texas Intermediate (WTI), the US crude oil benchmark, is trading around $79.90 on Wednesday. The black gold turns red amid renewed US Dollar (USD) demand and the hawkish remarks from the US Federal Reserve (Fed).
Several Fed officials delivered hawkish remarks in recent weeks after data showed that US inflation is stickier than expected. On Tuesday, Fed Minneapolis President Neel Kashkari said that the central bank should wait for significant progress on inflation before cutting interest rates. The higher-for-longer US interest rate narrative continues to weigh on the black gold as it increases the cost of borrowing, which can dampen economic activity and oil demand.
On the other hand, the Organization of the Petroleum Exporting Countries (OPEC) and its allies, including Russia (OPEC+), will hold a virtual meeting on June 2 to review its production policy. Analysts expect that OPEC+ will maintain crude supply curbs at 2.2 million barrels per day, which might limit the downside for WTI prices.“OPEC+ countries are unlikely to raise production given that the current price of Brent is closer to $80 per barrel than $90 per barrel,” said Deutsche Bank analyst Michael Hsueh.
Early Wednesday, the International Monetary Fund (IMF) upgraded China's 2025 economic growth target to 4.5% from 4.1%. The positive development surrounding China’s economic outlook might lift WTI prices since China accounts for 80% of non-OECD oil consumption, making it the world's biggest oil importer.
- The Japanese Yen struggled as BoJ’s Seiji Adachi emphasized the potential consequences of frequent changes in monetary policy.
- The emergence of risk aversion has supported the US Dollar, underpinning the USD/JPY pair.
- Minneapolis Fed President Neel Kashkari suggested the possibility of a rate hike.
The Japanese Yen (JPY) continues to weaken on Wednesday, influenced by a broad market downturn driven by risk aversion sentiment. Furthermore, Bank of Japan (BoJ) board member Seiji Adachi maintained his dovish stance during a speech, potentially contributing to the JPY's decline and supporting the USD/JPY pair.
BoJ’s Adachi emphasized the potential consequences of frequent changes in monetary policy to stabilize foreign exchange movements, warning that significant fluctuations in interest rates could disrupt household and corporate investment. Adachi also highlighted that the BoJ has yet to be convinced of sustained achievement regarding its price target, hence the necessity to uphold accommodative conditions.
The US Dollar (USD) saw a resurgence following remarks by Neel Kashkari, President of the Federal Reserve Bank of Minneapolis, hinting at the possibility of a rate hike. Kashkari remarked, “I don’t believe anyone has completely ruled out the option of increasing rates,” expressing doubts about the disinflationary trend and projecting only two rate cuts.
Fed's Beige Book will be released on Wednesday, providing an overview of the current US economic situation based on interviews with key business contacts, economists, market experts, and other sources from the 12 Federal Reserve Districts.
Daily Digest Market Movers: Japanese Yen loses ground due to broad market downturn
- Traders await the release of the US Gross Domestic Product Annualized (Q1) and Core Personal Consumption Expenditures (PCE) Price Index data later in the week. These high-impact releases are expected to provide cues on potential rate cuts from the Federal Reserve (Fed).
- On Tuesday, the US Housing Price Index (MoM) for March was underperforming, with March's number coming in at 0.1% against 1.2% for February, where 0.5% was expected.
- Japan's Weighted Median Inflation Index, a significant gauge of the country’s trend inflation, increased by 1.1% in April. This growth rate represents a slowdown from the 1.3% increase recorded in March.
- Japan’s Corporate Service Price Index (CSPI). The index posted a year-over-year reading of 2.8% in April, surpassing expectations of 2.3% and marking its fastest rate of increase since March 2015.
- Japan Finance Minister Shun'ichi Suzuki on Tuesday, emphasized the importance of currencies moving in a stable manner that reflects fundamentals, stating that he is closely monitoring foreign exchange (FX) movements. However, Suzuki refrained from commenting on whether Japan has conducted currency intervention.
- At the 2024 BOJ-IMES Conference on Tuesday, Cleveland Federal Reserve President Loretta Mester emphasized the importance of FOMC statements providing a detailed description of the current assessment of the economy, its influence on the outlook, and the associated risks. Mester expects that the Fed will consider enhancing communications as part of its next monetary policy framework review.
- Meanwhile, Federal Reserve (Fed) Governor Michelle Bowman highlighted the significance of continuing to reduce the balance sheet size to achieve ample reserves as quickly as possible, particularly while the economy remains robust. Bowman emphasized the importance of communicating any changes to the run-off rate to ensure it is clear that they do not signify a shift in the Fed's monetary policy stance.
- On Monday, BoJ Governor Kazuo Ueda remarked that progress has been made in moving away from zero and raising inflation expectations, but there is a need to re-anchor them, this time at the 2% target. Additionally, BoJ Deputy Governor Shinichi Uchida stated that they have reverted to a conventional monetary policy framework to achieve a 2% price stability target through adjustments of the short-term policy rate.
- In its report on Monday, the Japanese Cabinet Office stated that the government maintained its view on the economy unchanged for the third consecutive month in May. It noted that the Japanese economy continues to recover at a moderate pace, although there are signs of a recent pause in growth.
Technical Analysis: USD/JPY moves above the major level of 157.00
The USD/JPY pair trades around 157.30 on Wednesday. The daily chart shows a rising channel pattern, indicating the continuation of an upward trend in the market. Additionally, the 14-day Relative Strength Index (RSI) remains above 50, confirming a bullish bias.
The USD/JPY pair may potentially test the psychological level of 158.00, which aligns with the upper boundary of the rising channel. If this level is breached, the next target could be 160.32, marking its highest point in over thirty years.
On the downside, the nine-day Exponential Moving Average (EMA) at 156.72 acts as immediate support, followed by the psychological level of 156.00. Further decline in the USD/JPY pair could apply downward pressure, potentially testing the lower boundary of the rising channel.
USD/JPY: Daily Chart
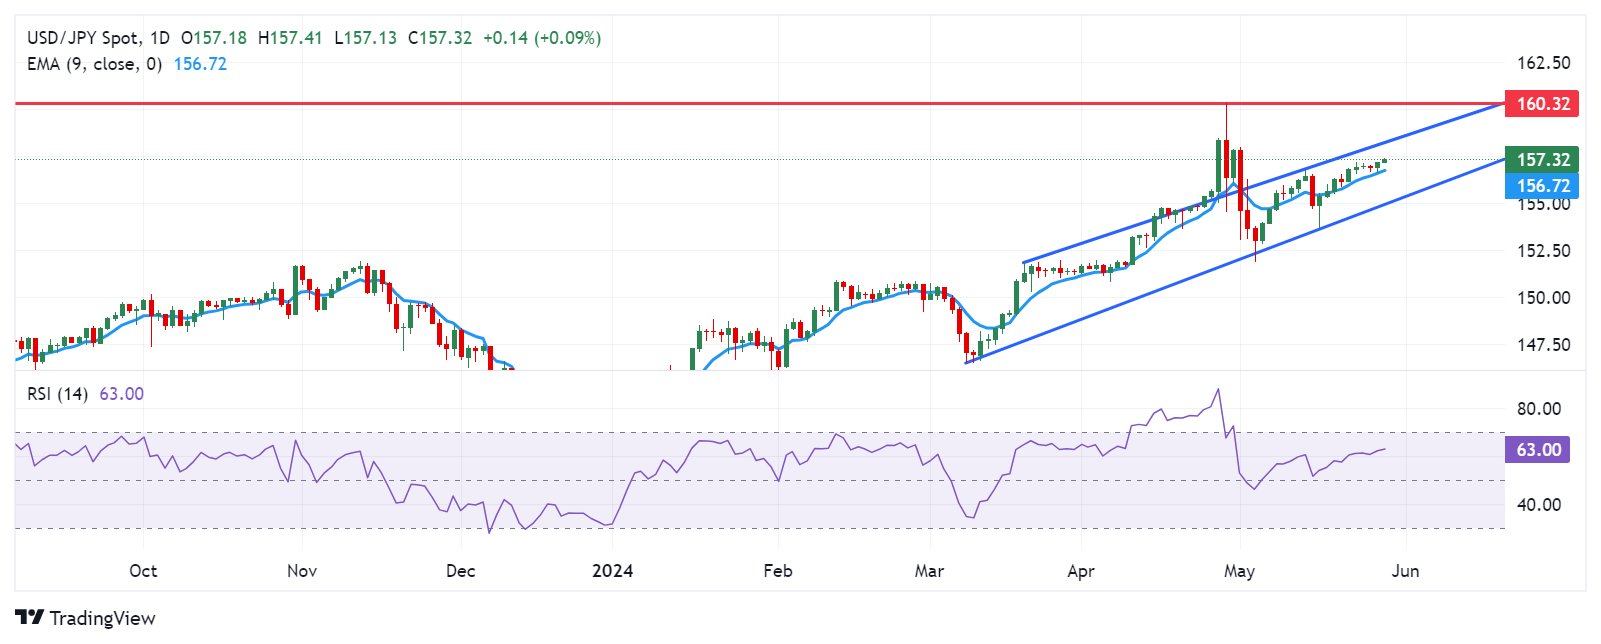
Japanese Yen price today
The table below shows the percentage change of the Japanese Yen (JPY) against listed major currencies today. Japanese Yen was the weakest against the Australian Dollar.
| USD | EUR | GBP | CAD | AUD | JPY | NZD | CHF | |
| USD | 0.03% | 0.06% | 0.11% | -0.03% | 0.01% | 0.10% | 0.02% | |
| EUR | -0.05% | 0.03% | 0.08% | -0.06% | -0.02% | 0.06% | -0.01% | |
| GBP | -0.06% | -0.01% | 0.06% | -0.10% | -0.04% | 0.04% | -0.03% | |
| CAD | -0.13% | -0.06% | -0.04% | -0.16% | -0.09% | -0.02% | -0.09% | |
| AUD | 0.03% | 0.06% | 0.10% | 0.15% | 0.06% | 0.13% | 0.09% | |
| JPY | -0.01% | 0.03% | 0.04% | 0.09% | -0.04% | 0.09% | 0.00% | |
| NZD | -0.10% | -0.06% | -0.04% | 0.02% | -0.14% | -0.07% | -0.09% | |
| CHF | -0.04% | 0.02% | 0.03% | 0.09% | -0.06% | 0.00% | 0.07% |
The heat map shows percentage changes of major currencies against each other. The base currency is picked from the left column, while the quote currency is picked from the top row. For example, if you pick the Euro from the left column and move along the horizontal line to the Japanese Yen, the percentage change displayed in the box will represent EUR (base)/JPY (quote).
Japanese Yen FAQs
The Japanese Yen (JPY) is one of the world’s most traded currencies. Its value is broadly determined by the performance of the Japanese economy, but more specifically by the Bank of Japan’s policy, the differential between Japanese and US bond yields, or risk sentiment among traders, among other factors.
One of the Bank of Japan’s mandates is currency control, so its moves are key for the Yen. The BoJ has directly intervened in currency markets sometimes, generally to lower the value of the Yen, although it refrains from doing it often due to political concerns of its main trading partners. The current BoJ ultra-loose monetary policy, based on massive stimulus to the economy, has caused the Yen to depreciate against its main currency peers. This process has exacerbated more recently due to an increasing policy divergence between the Bank of Japan and other main central banks, which have opted to increase interest rates sharply to fight decades-high levels of inflation.
The BoJ’s stance of sticking to ultra-loose monetary policy has led to a widening policy divergence with other central banks, particularly with the US Federal Reserve. This supports a widening of the differential between the 10-year US and Japanese bonds, which favors the US Dollar against the Japanese Yen.
The Japanese Yen is often seen as a safe-haven investment. This means that in times of market stress, investors are more likely to put their money in the Japanese currency due to its supposed reliability and stability. Turbulent times are likely to strengthen the Yen’s value against other currencies seen as more risky to invest in.
| Raw materials | Closed | Change, % |
|---|---|---|
| Silver | 32.075 | 1.47 |
| Gold | 2360.61 | 0.35 |
| Palladium | 982.61 | -0.49 |
- The Indian Rupee (INR) trades in negative territory for the third consecutive day on Wednesday.
- The combination of a firmer USD, the Fed's hawkish comments, and a cautious mood lift the USD/INR pair.
- Investors will closely monitor India’s Q4 GDP and US Core PCE inflation data, which are due on Thursday.
Indian Rupee (INR) extends the decline amid the cautious mood on Wednesday. The modest rebound of the US Dollar (USD) and the hawkish message from the US Federal Reserve (Fed) support the pair. Meanwhile, uncertainty surrounding India’s upcoming election is likely to weigh on the INR. Nomura analysts forecast a victory for Prime Minister Narendra Modi's Bharatiya Janata Party (BJP) could lift the Indian Rupee.
Investors prefer to wait on the sidelines ahead of key economic data from both India and the US later this week. The first reading of the US Gross Domestic Product (GDP) for Q1 will be due on Thursday. On Friday, the US Core Personal Consumption Expenditures Price Index (Core PCE) for April will be closely watched. If the report shows hotter-than-expected inflation in the US, this could dampen the rate cut expectation from the Fed, supporting the USD. On the Indian docket, India’s GDP number for the March quarter of the last financial year (Q4FY24) will be published on Friday.
Daily Digest Market Movers: Indian Rupee remains weak ahead of key data and India's general election outcome
- Foreign investors withdrew $2.8 billion from Indian equities in May, citing fears over the upcoming election.
- The benchmark Indian equity indices, the BSE Sensex and Nifty 50, were down 0.3% and 0.2%, respectively, on Tuesday after reaching new highs in the previous session.
- India's Gross Domestic Product (GDP) for the March quarter of the last financial year (Q4 FY24) is estimated to see an annual growth of below 7%, compared to 8.4% during the October-December quarter of FY24 (Q3 FY24).
- The International Monetary Fund (IMF) and Nomura forecast India's GDP to grow 7% in 2024.
- The US Conference Board’s Consumer Confidence rose to 102.0 in May from 97.5 in April, above the consensus of 95.9. The figure improved after three months of decline.
- Fed Governor Michelle Bowman said on Tuesday that the central bank would have supported either waiting to slow the QT pace or a more tapered slowing in balance sheet runoff.
- Fed Minneapolis President Neel Kashkari said that the central bank should wait for significant progress on inflation before cutting interest rates, per CNBC.
Technical analysis: USD/INR’s bearish stance persists on the daily chart
The Indian Rupee trades weaker on the day. However, the USD/INR pair remains bearish on the daily chart as it holds below the key 100-day Exponential Moving Average (EMA). The downward momentum is backed by the 14-day Relative Strength Index (RSI), which stands in bearish territory at around 43.85.
The confluence of the 100-day EMA and the support-turned-resistance level at 83.20 appears to be a tough nut to crack for USD/INR buyers. A decisive break above this level could see a rally to a high of May 13 at 83.54. The additional upside filter to watch is a high of April 17 at 83.72, and then the 84.00 psychological mark.
On the other hand, the crucial support level will emerge at the 83.00 barrier. A breach below the mentioned level will see a drop to a low of January 15 at 82.78, followed by a low of March 11 at 82.65.
US Dollar price today
The table below shows the percentage change of US Dollar (USD) against listed major currencies today. US Dollar was the strongest against the Canadian Dollar.
| USD | EUR | GBP | CAD | AUD | JPY | NZD | CHF | |
| USD | 0.01% | 0.01% | 0.02% | -0.16% | -0.01% | -0.04% | -0.04% | |
| EUR | -0.01% | 0.02% | 0.04% | -0.14% | 0.00% | -0.03% | -0.03% | |
| GBP | -0.01% | 0.00% | 0.02% | -0.19% | -0.01% | -0.06% | -0.04% | |
| CAD | -0.03% | -0.01% | 0.00% | -0.19% | -0.02% | -0.08% | -0.07% | |
| AUD | 0.15% | 0.16% | 0.17% | 0.18% | 0.16% | 0.11% | 0.15% | |
| JPY | 0.02% | 0.04% | 0.03% | 0.04% | -0.14% | -0.06% | -0.03% | |
| NZD | 0.04% | 0.05% | 0.06% | 0.07% | -0.12% | 0.04% | -0.01% | |
| CHF | 0.02% | 0.06% | 0.05% | 0.07% | -0.14% | 0.03% | -0.03% |
The heat map shows percentage changes of major currencies against each other. The base currency is picked from the left column, while the quote currency is picked from the top row. For example, if you pick the Euro from the left column and move along the horizontal line to the Japanese Yen, the percentage change displayed in the box will represent EUR (base)/JPY (quote).
Indian Rupee FAQs
The Indian Rupee (INR) is one of the most sensitive currencies to external factors. The price of Crude Oil (the country is highly dependent on imported Oil), the value of the US Dollar – most trade is conducted in USD – and the level of foreign investment, are all influential. Direct intervention by the Reserve Bank of India (RBI) in FX markets to keep the exchange rate stable, as well as the level of interest rates set by the RBI, are further major influencing factors on the Rupee.
The Reserve Bank of India (RBI) actively intervenes in forex markets to maintain a stable exchange rate, to help facilitate trade. In addition, the RBI tries to maintain the inflation rate at its 4% target by adjusting interest rates. Higher interest rates usually strengthen the Rupee. This is due to the role of the ‘carry trade’ in which investors borrow in countries with lower interest rates so as to place their money in countries’ offering relatively higher interest rates and profit from the difference.
Macroeconomic factors that influence the value of the Rupee include inflation, interest rates, the economic growth rate (GDP), the balance of trade, and inflows from foreign investment. A higher growth rate can lead to more overseas investment, pushing up demand for the Rupee. A less negative balance of trade will eventually lead to a stronger Rupee. Higher interest rates, especially real rates (interest rates less inflation) are also positive for the Rupee. A risk-on environment can lead to greater inflows of Foreign Direct and Indirect Investment (FDI and FII), which also benefit the Rupee.
Higher inflation, particularly, if it is comparatively higher than India’s peers, is generally negative for the currency as it reflects devaluation through oversupply. Inflation also increases the cost of exports, leading to more Rupees being sold to purchase foreign imports, which is Rupee-negative. At the same time, higher inflation usually leads to the Reserve Bank of India (RBI) raising interest rates and this can be positive for the Rupee, due to increased demand from international investors. The opposite effect is true of lower inflation.
- USD/CAD appreciates after Fed’s Neel Kashkari suggested that a rate hike might still be possible.
- The US Dollar gained ground due to the appreciation in the US Treasury yields.
- The decline in the WTI price put pressure on the commodity-linked Canadian Dollar.
USD/CAD edges higher for the second consecutive day, trading around 1.3650 during the Asian hours on Wednesday. The emergence of risk aversion drives investors toward the US Dollar (USD), underpinning the USD/CAD pair.
On Tuesday, the risk-on sentiment turned sour after Neel Kashkari, President of the Federal Reserve Bank of Minneapolis, suggested that a rate hike might still be possible. Kashkari stated, “I don’t think anybody has totally taken rate increases off the table,” and expressed uncertainty about the disinflationary process, predicting only two rate cuts.
The appreciation in the US Treasury yields also supported the Greenback. The US Dollar Index (DXY), which measures the USD against six major currencies, was trading higher around 104.70, with 2-year and 10-year US Treasury yields at 4.96% and 4.54%, respectively, at the time of reporting.
Moreover, the mid-tier US Housing Price Index (MoM) for March was underperforming, with March's number coming in at 0.1% against 1.2% for February, where 0.5% was expected. On Wednesday, New York Fed President John Williams is scheduled to speak, and the Fed's Beige Book will be released, providing an overview of the current US economic situation based on interviews with key business contacts, economists, market experts, and other sources from the 12 Federal Reserve Districts.
On Loonie’s front, the downward correction in the crude Oil prices put pressure on the commodity-linked Canadian Dollar (CAD), given the fact that Canada is the largest Oil exporter to the biggest Oil consumer United States (US).
Canada’s Industrial Product Price rose by 1.5% month-over-month in April, above market forecasts of 0.6% to reach a fresh 8-month high, and up from an upwardly revised 0.9% uptick in March. The Raw Materials Price Index increased 5.5% month-over-month in April, compared to the previous rise of 4.3% and above the expected increase of 3.2%.
Having upgraded China’s economic growth target from 4.6% to 5% in 2024 on a strong first quarter, the International Monetary Fund (IMF) Deputy Managing Director lauded China’s efforts to prop up its property market.
Key quotes
IMF expects China's economic growth to slow to 3.3% by 2029 due to aging, slower productivity growth.
IMF upgrades China's 2025 economic growth target to 4.5% from 4.1%.
We see scope for a more comprehensive policy package to address property sector issues.
Central government resources should be deployed to help buyers of pre-sold unfinished homes.
Macroeconomic policies should support domestic demand and mitigate outside risks.
Policy should prioritise providing central government support to the real estate sector.
Welcomes monetary policy measures implemented in 2024 to date.
Market reaction
AUD/USD clings to moderate gains above 0.6650, despite these headlines, as markets assess the latest mixed Australian economic data. The pair is up 0.14% on the day, as of writing.
Bank of Japan (BoJ) board member Seiji Adachi stuck to his dovish rhetoric during his speech on Wednesday.
Key quotes
Changing monetary policy frequently to stablise FX moves would lead to big changes in rate moves
If interest rate moves are too big, that would cause disruptions in household and corporate investment
Responding to short-term FX moves with monetary policy would affect price stability
If excessive yen falls are prolonged and expected to affect achievement of our price target, responding with monetary policy becomes an option.
It is possible to consider responding with monetary policy if FX moves cause big changes in inflation expectations.
Japan's economy is recovering moderately, although there are some weak signs.
Consumption holding steady as a whole mainly for service spending.
Japan's economy not slumping but not in strong shape either with various uncertainties remaining.
BoJ must maintain accommodative financial conditions until price goal achieved.
We are not yet at stage where we are convinced that there is the sustained achievement of price target, so must maintain accommodative conditions.
We must absolutely avoid raising interest rates prematurely.
If we focus too much on downside risks, inflation may accelerate and might force us to tighten monetary rapidly as a result.
By fixing interest rates at current zero levels until inflation is durably at our price target, we might be forced to hike rates rapidly later and therefore risk hurting economy.
We must look not just at downside but upside risks in guiding monetary policy.
Important to adjust degree of monetary support in several stages, as long as underlying inflation continues to head toward 2%.
At some stage in the future, we will likely reduce our JGB purchases.
Market reaction
USD/JPY defends gains above 157.00 following these dovish comments. The risk-off mood is dragging the pair lower.
- The Australian Dollar appreciated after the higher-than-expected Monthly inflation was released on Wednesday.
- Australia’s Monthly Consumer Price Index rose 3.6% YoY in April, surpassing the expected readings of 3.4% and 3.5% prior.
- The US Dollar rebounded due to higher US Treasury yields.
The Australian Dollar (AUD) pared its daily losses after the higher-than-expected Monthly Consumer Price Index was released on Wednesday. This strong data could prompt the Reserve Bank of Australia (RBA) to consider another rate hike. The minutes from the RBA's May policy meeting suggested that the central bank had contemplated a potential interest rate increase.
The Australian Dollar struggled during earlier Asian hours due to increased risk aversion, evidenced by the stronger US Dollar (USD). This strength in the USD can be linked to rising US Treasury yields. The US Dollar Index (DXY), which measures the USD against six major currencies, was trading higher around 104.70, with 2-year and 10-year US Treasury yields at 4.96% and 4.54%, respectively, at the time of reporting.
The US Dollar (USD) rebounded on Tuesday after Neel Kashkari, President of the Federal Reserve Bank of Minneapolis, suggested that a rate hike might still be possible. Kashkari stated, “I don’t think anybody has totally taken rate increases off the table,” and expressed uncertainty about the disinflationary process, predicting only two rate cuts.
According to the CME FedWatch Tool, the likelihood of the Federal Reserve implementing a 25 basis-point rate cut in September decreased to 41.7%, down from 44.9% the previous day. On Wednesday, New York Fed President John Williams is scheduled to speak, and the Fed's Beige Book will be released, providing an overview of the current US economic situation based on interviews with key business contacts, economists, market experts, and other sources from the 12 Federal Reserve Districts.
Daily Digest Market Movers: Australian Dollar appreciates after higher consumer inflation
- Australia’s Monthly Consumer Price Index rose 3.6% year-over-year in April, surpassing the expected reading of 3.4% and the previous reading of 3.5%.
- US Housing Price Index (MoM) for March was underperforming, with March's number coming in at 0.1% against 1.2% for February, where 0.5% was expected.
- Australia's Retail Sales (MoM) rose by 0.1% in April, swinging from the previous 0.4% decline. This growth fell short of market expectations of 0.2%.
- On Tuesday, China’s Politburo, the country’s top leadership, announced that the government will enhance the coordination and integration of fiscal, monetary, investment, consumption, industrial, regional, and other policies with employment policies. Any economic changes in China could significantly impact the Australian market due to the close trade relationship between the two countries.
- At the 2024 BOJ-IMES Conference on Tuesday, Cleveland Federal Reserve President Loretta Mester emphasized the need for FOMC statements to provide a detailed description of the current economic assessment, its impact on the outlook, and the associated risks. Mester anticipates that the Fed will consider improving its communications as part of the next monetary policy framework review.
- Meanwhile, Federal Reserve (Fed) Governor Michelle Bowman stressed the importance of continuing to reduce the balance sheet size to achieve ample reserves as soon as possible, especially while the economy is strong. Bowman underlined the necessity of clearly communicating that any changes to the run-off rate do not indicate a shift in the Fed's monetary policy stance.
Technical Analysis: Australian Dollar hovers around the key level of 0.6650
The Australian Dollar trades around 0.6650 on Wednesday. An analysis of the daily chart suggests a bullish bias for the AUD/USD pair, as it is positioned within a rising wedge. The 14-day Relative Strength Index (RSI) is slightly above the 50 level, further confirming this bullish bias.
The AUD/USD pair could potentially reach a four-month high of 0.6714, followed by the upper limit of the rising wedge around 0.6740.
On the downside, the 21-day Exponential Moving Average (EMA) at 0.6620 serves as key support, aligning with the lower boundary of the rising wedge. The next support level is at the psychological mark of 0.6600. A further decline could exert additional downward pressure on the AUD/USD pair, potentially driving it toward the throwback support region at 0.6470.
AUD/USD: Daily Chart

Australian Dollar price today
The table below shows the percentage change of the Australian Dollar (AUD) against listed major currencies today. The Australian Dollar was the strongest against the Canadian Dollar.
| USD | EUR | GBP | CAD | AUD | JPY | NZD | CHF | |
| USD | 0.02% | 0.03% | 0.06% | -0.10% | 0.03% | 0.00% | -0.02% | |
| EUR | -0.03% | 0.03% | 0.05% | -0.11% | 0.00% | -0.02% | -0.03% | |
| GBP | -0.04% | -0.02% | 0.02% | -0.16% | 0.00% | -0.04% | -0.05% | |
| CAD | -0.06% | -0.03% | 0.00% | -0.18% | -0.02% | -0.07% | -0.08% | |
| AUD | 0.10% | 0.12% | 0.15% | 0.16% | 0.15% | 0.10% | 0.12% | |
| JPY | -0.04% | 0.00% | 0.01% | 0.01% | -0.14% | -0.02% | -0.04% | |
| NZD | 0.00% | 0.02% | 0.04% | 0.07% | -0.11% | 0.04% | -0.03% | |
| CHF | 0.00% | 0.04% | 0.06% | 0.07% | -0.09% | 0.04% | 0.02% |
The heat map shows percentage changes of major currencies against each other. The base currency is picked from the left column, while the quote currency is picked from the top row. For example, if you pick the Euro from the left column and move along the horizontal line to the Japanese Yen, the percentage change displayed in the box will represent EUR (base)/JPY (quote).
Australian Dollar FAQs
One of the most significant factors for the Australian Dollar (AUD) is the level of interest rates set by the Reserve Bank of Australia (RBA). Because Australia is a resource-rich country another key driver is the price of its biggest export, Iron Ore. The health of the Chinese economy, its largest trading partner, is a factor, as well as inflation in Australia, its growth rate and Trade Balance. Market sentiment – whether investors are taking on more risky assets (risk-on) or seeking safe-havens (risk-off) – is also a factor, with risk-on positive for AUD.
The Reserve Bank of Australia (RBA) influences the Australian Dollar (AUD) by setting the level of interest rates that Australian banks can lend to each other. This influences the level of interest rates in the economy as a whole. The main goal of the RBA is to maintain a stable inflation rate of 2-3% by adjusting interest rates up or down. Relatively high interest rates compared to other major central banks support the AUD, and the opposite for relatively low. The RBA can also use quantitative easing and tightening to influence credit conditions, with the former AUD-negative and the latter AUD-positive.
China is Australia’s largest trading partner so the health of the Chinese economy is a major influence on the value of the Australian Dollar (AUD). When the Chinese economy is doing well it purchases more raw materials, goods and services from Australia, lifting demand for the AUD, and pushing up its value. The opposite is the case when the Chinese economy is not growing as fast as expected. Positive or negative surprises in Chinese growth data, therefore, often have a direct impact on the Australian Dollar and its pairs.
Iron Ore is Australia’s largest export, accounting for $118 billion a year according to data from 2021, with China as its primary destination. The price of Iron Ore, therefore, can be a driver of the Australian Dollar. Generally, if the price of Iron Ore rises, AUD also goes up, as aggregate demand for the currency increases. The opposite is the case if the price of Iron Ore falls. Higher Iron Ore prices also tend to result in a greater likelihood of a positive Trade Balance for Australia, which is also positive of the AUD.
The Trade Balance, which is the difference between what a country earns from its exports versus what it pays for its imports, is another factor that can influence the value of the Australian Dollar. If Australia produces highly sought after exports, then its currency will gain in value purely from the surplus demand created from foreign buyers seeking to purchase its exports versus what it spends to purchase imports. Therefore, a positive net Trade Balance strengthens the AUD, with the opposite effect if the Trade Balance is negative.
Australia’s monthly Consumer Price Index (CPI) increased at an annual pace of 3.6% in the year to April, having risen 3.5% in March, data published by the Australian Bureau of Statistics (ABS) showed Wednesday.
The market consensus was for a 3.4% acceleration in the reported period.
Meanwhile, Australia Construction Work Done data came in at -2.9% QoQ in the first quarter, missing expectations of a 0.5% growth. The previous figure stood at 0.7%.
Market reaction
The AUD/USD pair was up 0.11% on the day at 0.6655. following mixed Australian economic data.
Australian Dollar PRICE Today
The table below shows the percentage change of Australian Dollar (AUD) against listed major currencies today. Australian Dollar was the strongest against the Japanese Yen.
| USD | EUR | GBP | JPY | CAD | AUD | NZD | CHF | |
|---|---|---|---|---|---|---|---|---|
| USD | 0.06% | 0.07% | 0.11% | 0.08% | -0.04% | 0.04% | -0.02% | |
| EUR | -0.06% | 0.00% | 0.05% | 0.02% | -0.10% | -0.02% | -0.08% | |
| GBP | -0.07% | -0.01% | 0.04% | -0.02% | -0.12% | -0.02% | -0.09% | |
| JPY | -0.11% | -0.05% | -0.04% | -0.03% | -0.14% | -0.06% | -0.12% | |
| CAD | -0.08% | -0.02% | 0.02% | 0.03% | -0.12% | -0.03% | -0.10% | |
| AUD | 0.04% | 0.10% | 0.12% | 0.14% | 0.12% | 0.09% | 0.05% | |
| NZD | -0.04% | 0.02% | 0.02% | 0.06% | 0.03% | -0.09% | -0.07% | |
| CHF | 0.02% | 0.08% | 0.09% | 0.12% | 0.10% | -0.05% | 0.07% |
The heat map shows percentage changes of major currencies against each other. The base currency is picked from the left column, while the quote currency is picked from the top row. For example, if you pick the Australian Dollar from the left column and move along the horizontal line to the US Dollar, the percentage change displayed in the box will represent AUD (base)/USD (quote).
The People’s Bank of China (PBoC) set the USD/CNY central rate for the trading session ahead on Wednesday at 7.1106, as against the previous day's fix of 7.1101 and 7.2528 Reuters estimates.
- USD/JPY climbed on Wednesday as JPY continues to sell off.
- Yen traders looking ahead to Tokyo CPI inflation on Friday.
- US GDP, PCE inflation key data this week for rate-cut hopefuls.
USD/JPY drifted into the high end on Tuesday, testing towards 157.40 as broad-market weakness in the Japanese Yen (JPY) sends Yen pairs broadly higher. Japanese Tokyo Consumer Price Index (CPI) inflation remains a key print for Yen traders this week, with US growth and inflation figures a high-impact release for investors looking for signs of rate cuts from the Federal Reserve (Fed).
Yen traders will be looking ahead to Friday’s Japanes Tokyo CPI inflation, and Core Tokyo CPI inflation is broadly expected to climb to 1.9% from 1.6%. The Bank of Japan (BoJ), concerned about a return to sub-target inflation, has steadfastly avoided raising interest rates, keeping the Yen’s rate differential with other major central banks much higher than before, sending the JPY even lower despite possible “Yenterventions” in recent weeks.
US Gross Domestic Product (GDP) and Personal Consumption Expenditure (PCE) Price Index inflation, due on Thursday and Friday, respectively, are key prints this week as investors continue to look for signs of Fed rate cuts. US Annualized Q1 GDP is expected to ease to 1.3% from the previous 1.6%, while Core PCE Price Index inflation is forecast to hold steady at 0.3% MoM.
USD/JPY technical outlook
USD/JPY continues to drift into the top end, approaching the 158.00 handle after closing in the green for all but four of the last 17 consecutive trading days. Bullish pressure is keeping the pair pinned deep in bull country, trading firmly on the north side of the 200-day Exponential Moving Average (EMA) at 148.89.
USD/JPY daily chart
- Gold price edges lower on Wednesday on the modest USD recovery.
- The Fed’s hawkish comments and stronger US data support the USD, weighing the precious metal.
- Gold traders will focus on the Fed’s Beige Book and the Fed’s John Williams speech later on Wednesday.
Gold price (XAU/USD) snaps the three-day winning streak on Wednesday amid the modest rebound of the Greenback. Additionally, the hawkish remarks from several Federal Reserve (Fed) officials and stronger-than-expected US economic data diminish expectations of the Fed rate cut in September. This, in turn, boosts the US Dollar (USD) and weighs on the USD-denominated gold price. On the other hand, geopolitical tensions and uncertainty could drive the safe-haven assets for gold. The growing demand from the central bank will continue to underpin higher gold prices in the near term.
Gold traders will keep an eye on the Fed’s Beige Book and the Fed’s John Williams speech on Wednesday. The release of the US Core Personal Consumption Expenditures Price Index (Core PCE) will take centre stage on Friday, which is estimated to show an increase of 0.3% MoM and 2.8% YoY in April. Any signs of stickier inflation in the US could trigger the possibility of delaying the Fed rate cut, exerting some selling pressure on the yellow metal as higher interest rates will increase gold's opportunity costs.
Daily digest market movers: Gold price faces some pressure from the Fed’s hawkish remarks
- Israeli Prime Minister Benjamin Netanyahu has vowed to continue the war against Hamas amid international condemnation of an air strike that killed at least 45 people in Rafah on Sunday, per the BBC.
- The World Gold Council reported that global physically-backed gold exchange-traded funds (ETFs) witnessed a net outflow of 11.3 metric tonnes last week.
- UBS analysts expect gold prices to reach $2,500 an ounce by September and hit $2,600 an ounce by year-end. The forecast is higher than the initial estimates of $2,400 and $2,500 per ounce, respectively.
- Consumer Confidence improved slightly in May, the Conference Board reported on Tuesday. The figure rose to 102.0 in May from 97.0 in April, beating the estimation of 95.9.
- Fed Governor Michelle Bowman said on Tuesday that she would have supported either waiting to start slowing the quantitative tightening pace or a more moderate tapering process than announced earlier this month.
- Fed Minneapolis President Neel Kashkari said that the central bank should wait for significant progress on inflation before cutting interest rates, adding that he expected no more than two rate cuts in 2024.
Technical analysis: Gold price stays bullish in the longer term
The gold price trades with mild losses on the day. Technically, the bullish outlook of the precious metal remains intact as it holds above the key 100-day Exponential Moving Average (EMA) on the 1-hour chart. However, the neutral level of the 14-day Relative Strength Index (RSI) around the 50-midline indicated that further consolidation or directionlessness looks favourable for the time being.
The first upside target will emerge at the upper boundary of the Bollinger Band at $2,427. Sustained yellow metal rallies might pave the way to the all-time high of $2,450. The bullish breakout above this level will see a rally to the $2,500 psychological figure.
On the flip side, a low of May 24 at $2,325 acts as an initial support level for XAU/USD. The next contention level is seen at the $2,300 round mark. Any follow-through selling below this level will expose the lower limit of the Bollinger Band at $2,277, followed by the 100-day EMA of $2,222.
US Dollar price today
The table below shows the percentage change of US Dollar (USD) against listed major currencies today. US Dollar was the strongest against the Japanese Yen.
| USD | EUR | GBP | CAD | AUD | JPY | NZD | CHF | |
| USD | 0.03% | 0.03% | 0.04% | 0.06% | 0.06% | 0.03% | 0.02% | |
| EUR | -0.04% | 0.01% | 0.02% | 0.03% | 0.03% | 0.00% | 0.00% | |
| GBP | -0.03% | 0.00% | 0.01% | 0.01% | 0.03% | -0.01% | -0.01% | |
| CAD | -0.04% | 0.01% | 0.01% | 0.01% | 0.04% | -0.01% | -0.01% | |
| AUD | -0.04% | -0.01% | 0.01% | 0.00% | 0.04% | -0.01% | 0.02% | |
| JPY | -0.06% | -0.03% | -0.03% | -0.03% | -0.02% | -0.03% | -0.04% | |
| NZD | -0.03% | 0.00% | 0.00% | 0.02% | 0.02% | 0.04% | -0.02% | |
| CHF | -0.04% | 0.01% | 0.01% | 0.02% | 0.02% | 0.04% | 0.00% |
The heat map shows percentage changes of major currencies against each other. The base currency is picked from the left column, while the quote currency is picked from the top row. For example, if you pick the Euro from the left column and move along the horizontal line to the Japanese Yen, the percentage change displayed in the box will represent EUR (base)/JPY (quote).
Gold FAQs
Gold has played a key role in human’s history as it has been widely used as a store of value and medium of exchange. Currently, apart from its shine and usage for jewelry, the precious metal is widely seen as a safe-haven asset, meaning that it is considered a good investment during turbulent times. Gold is also widely seen as a hedge against inflation and against depreciating currencies as it doesn’t rely on any specific issuer or government.
Central banks are the biggest Gold holders. In their aim to support their currencies in turbulent times, central banks tend to diversify their reserves and buy Gold to improve the perceived strength of the economy and the currency. High Gold reserves can be a source of trust for a country’s solvency. Central banks added 1,136 tonnes of Gold worth around $70 billion to their reserves in 2022, according to data from the World Gold Council. This is the highest yearly purchase since records began. Central banks from emerging economies such as China, India and Turkey are quickly increasing their Gold reserves.
Gold has an inverse correlation with the US Dollar and US Treasuries, which are both major reserve and safe-haven assets. When the Dollar depreciates, Gold tends to rise, enabling investors and central banks to diversify their assets in turbulent times. Gold is also inversely correlated with risk assets. A rally in the stock market tends to weaken Gold price, while sell-offs in riskier markets tend to favor the precious metal.
The price can move due to a wide range of factors. Geopolitical instability or fears of a deep recession can quickly make Gold price escalate due to its safe-haven status. As a yield-less asset, Gold tends to rise with lower interest rates, while higher cost of money usually weighs down on the yellow metal. Still, most moves depend on how the US Dollar (USD) behaves as the asset is priced in dollars (XAU/USD). A strong Dollar tends to keep the price of Gold controlled, whereas a weaker Dollar is likely to push Gold prices up.
| Index | Change, points | Closed | Change, % |
|---|---|---|---|
| NIKKEI 225 | -44.65 | 38855.37 | -0.11 |
| Hang Seng | -6.19 | 18821.16 | -0.03 |
| KOSPI | -0.14 | 2722.85 | -0.01 |
| ASX 200 | -21.6 | 7766.7 | -0.28 |
| DAX | -96.84 | 18677.87 | -0.52 |
| CAC 40 | -74.69 | 8057.8 | -0.92 |
| Dow Jones | -216.73 | 38852.86 | -0.55 |
| S&P 500 | 1.32 | 5306.04 | 0.02 |
| NASDAQ Composite | 99.09 | 17019.88 | 0.59 |
| Pare | Closed | Change, % |
|---|---|---|
| AUDUSD | 0.66492 | -0.12 |
| EURJPY | 170.653 | 0.18 |
| EURUSD | 1.08594 | 0 |
| GBPJPY | 200.542 | 0.11 |
| GBPUSD | 1.2762 | -0.06 |
| NZDUSD | 0.61406 | -0.16 |
| USDCAD | 1.3644 | 0.1 |
| USDCHF | 0.912 | -0.18 |
| USDJPY | 157.134 | 0.17 |
- Easing Greenback pressure gives Kiwi another leg into fresh highs.
- Momentum remains thin as NZD rtaders grapple with a lack of data.
- US GDP, PCE inflation prints to dominate the last half of the trading week.
NZD/USD eased back into the 0.6140 level in early Wednesday trading as Kiwi traders await a reason to move. The economic calendar is notably thin except for the NZ government’s latest Budget Release on Thursday, leaving NZD traders adrift until Friday’s speech from Reserve Bank of New Zealand (RBNZ) Governor Orr.
US data in the back half of the trading week will drive investor sentiment with an update to US quarterly Gross Domestic Product (GDP) and the latest print of Personal Consumption Expenditure (PCE) Price Index inflation.
Investors have been awaiting signs of movement from the Federal Reserve (Fed) on rate cuts, with markets broadly keeping an eye on a flurry of appearances from Fed officials in the early week. Broad-market hopes for rate cuts continue to wither against a cautious Fed, and rate markets are pricing in roughly even odds of a quarter-point rate trim from the Federal Open Market Committee (FOMC) in September.
NZD/USD technical outlook
The Kiwi is drifting into the high side against the Greenback this week, and the pair has closed in the green for four consecutive trading weeks. Despite recent upswings, the pair is hitting technical consolidation just north of the 200-day Exponential Moving Average (EMA) at 0.6070.
Bullish momentum may be hitting a wall on the NZD/USD with the Moving Average Convergence-Divergence (MACD) signal lines running far ahead of bullish histogram bars, implying buying pressure may be poised for a reversal.
NZD/USD daily chart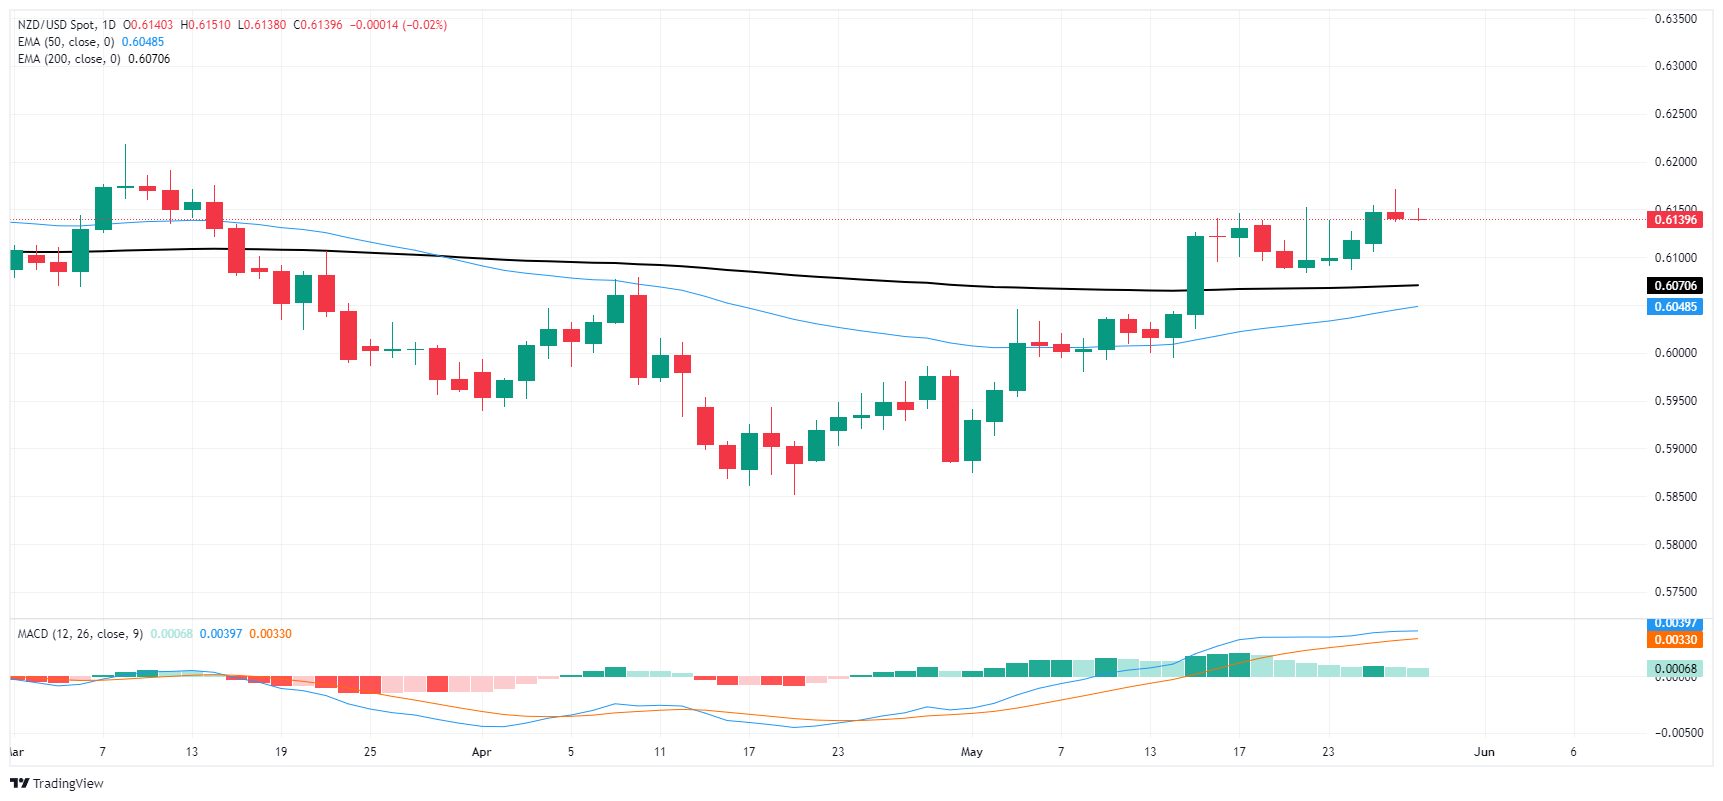


© 2000-2026. All rights reserved.
This site is managed by Teletrade D.J. LLC 2351 LLC 2022 (Euro House, Richmond Hill Road, Kingstown, VC0100, St. Vincent and the Grenadines).
The information on this website is for informational purposes only and does not constitute any investment advice.
The company does not serve or provide services to customers who are residents of the US, Canada, Iran, The Democratic People's Republic of Korea, Yemen and FATF blacklisted countries.
Making transactions on financial markets with marginal financial instruments opens up wide possibilities and allows investors who are willing to take risks to earn high profits, carrying a potentially high risk of losses at the same time. Therefore you should responsibly approach the issue of choosing the appropriate investment strategy, taking the available resources into account, before starting trading.
Use of the information: full or partial use of materials from this website must always be referenced to TeleTrade as the source of information. Use of the materials on the Internet must be accompanied by a hyperlink to teletrade.org. Automatic import of materials and information from this website is prohibited.
Please contact our PR department if you have any questions or need assistance at pr@teletrade.global.
transfers