- Analytics
- News and Tools
- Market News
CFD Markets News and Forecasts — 28-07-2020
| Time | Country | Event | Period | Previous value | Forecast |
|---|---|---|---|---|---|
| 01:30 | Australia | CPI, y/y | Quarter II | 2.2% | -0.4% |
| 01:30 | Australia | Trimmed Mean CPI y/y | Quarter II | 1.8% | 1.4% |
| 01:30 | Australia | Trimmed Mean CPI q/q | Quarter II | 0.5% | 0.1% |
| 01:30 | Australia | CPI, q/q | Quarter II | 0.3% | -2% |
| 06:45 | France | Consumer confidence | July | 97 | 99 |
| 08:00 | Switzerland | Credit Suisse ZEW Survey (Expectations) | July | 48.7 | |
| 08:30 | United Kingdom | Consumer credit, mln | June | -4.597 | -2 |
| 08:30 | United Kingdom | Mortgage Approvals | June | 9.3 | 33.9 |
| 08:30 | United Kingdom | Net Lending to Individuals, bln | June | -3.4 | |
| 12:30 | U.S. | Goods Trade Balance, $ bln. | June | -74.34 | |
| 14:00 | U.S. | Pending Home Sales (MoM) | June | 44.3% | |
| 14:30 | U.S. | Crude Oil Inventories | July | 4.892 | |
| 18:00 | U.S. | Fed Interest Rate Decision | 0.25% | 0.25% | |
| 18:30 | U.S. | Federal Reserve Press Conference | |||
| 22:45 | New Zealand | Building Permits, m/m | June | 35.6% | |
| 23:50 | Japan | Retail sales, y/y | June | -12.3% | -6.5% |
FXStreet reports that analysts at Deutsche Bank think the Federal Reserve's balance sheet may expand to over $20 trillion in less than a decade as the central bank may need to add up to $12 trillion to reach what is equivalent to a shadow Fed Funds rate of -5%, as noted by popular analyst Holger Zschaepitz.
Economists typically use the Fed funds rate. However, that rate was pushed to near-zero levels in the first quarter to counter the coronavirus slowdown. As such, monetary policy entered the zone termed the “zero lower bound" and the fed funds rate has stopped working in models.
Therefore, the focus is on the shadow fed funds rate that can go negative, reflecting the US central bank's additional easing. The shadow rate has been developed by Chicago Booth’s Jing Cynthia Wu and Fan Dora Xia.
The Fed has made it clear time and again that it is not in favor of pushing the official Fed funds rate below zero. However, it can keep buying bonds and other assets for a long time, pushing the shadow rate into the negative.
The central bank has expanded its balance sheet by over $3 trillion in the last four months, lifting inflation expectations and gold prices. The yellow metal surpassed the previous lifetime high of $1,921 reached in September 2011 and is now trading at $1,960 per ounce.
U.S. consumer
confidence drops more than forecast in July
The Conference
Board announced on Tuesday its U.S. consumer confidence fell 5.7 points to 92.6
in July from 98.3 in June.
Economists had
expected consumer confidence to come in at 94.5.
June’s consumer
confidence reading was revised up from originally estimated 98.1.
The survey
showed that the expectations index plunged from 106.1 last month to 91.5 this
month. Meanwhile, the present situation index rose from 86.7 in June to 94.2.
“Consumer
Confidence declined in July following a large gain in June,” noted Lynn Franco,
Senior Director of Economic Indicators at The Conference Board. “The Present
Situation Index improved, but the Expectations Index retreated. Large declines
were experienced in Michigan, Florida, Texas and California, no doubt a result
of the resurgence of COVID-19. Looking ahead, consumers have grown less
optimistic about the short-term outlook for the economy and labor market and
remain subdued about their financial prospects. Such uncertainty about the
short-term future does not bode well for the recovery, nor for consumer
spending.”
According to a release on the Fed's website, "the Federal Reserve Board on Tuesday announced an extension through December 31 of its lending facilities that were scheduled to expire on or around September 30. The three-month extension will facilitate planning by potential facility participants and provide certainty that the facilities will continue to be available to help the economy recover from the COVID-19 pandemic."
"The extensions apply to the Primary Dealer Credit Facility, the Money Market Mutual Fund Liquidity Facility, the Primary Market Corporate Credit Facility, the Secondary Market Corporate Credit Facility, the Term Asset-Backed Securities Loan Facility, the Paycheck Protection Program Liquidity Facility, and the Main Street Lending Program. The Municipal Liquidity Facility is already set to expire on December 31, with the Commercial Paper Funding Facility set to expire on March 17, 2021."
S&P
reported on Tuesday its Case-Shiller Home Price Index, which tracks home prices
in 20 U.S. metropolitan areas, rose 3.7 percent y-o-y in May, following a revised
3.9 percent y-o-y increase in April (originally a 4.0 percent y-o-y gain).
Economists had
expected an advance of 4.0 percent y-o-y.
Phoenix (+9.0
percent y-o-y), Seattle (+6.8 percent y-o-y) and Tampa (+6.0 percent y-o-y)
recorded the highest y-o-y advances in May. Three of the 19 cities reported
greater price gains in the year ending May versus the year ending April.
Meanwhile, the
S&P/Case-Shiller U.S. National Home Price Index, which measures all nine
U.S. census divisions, climbed 4.5 percent y-o-y in May, down from 4.6 percent
y-o-y in the previous month.
Craig J.
Lazzara, Managing Director and Global Head of Index Investment Strategy at
S&P Dow Jones Indices noted that “in contrast with the past eight months,
May's gains were less than April’s. Although prices increased in May, in other
words, they did so at a decelerating rate.” He also added that "more data
will obviously be required in order to know whether May’s report represents a
reversal of the previous path of accelerating prices or merely a slight
deviation from an otherwise intact trend. Even if prices continue to
decelerate, that is quite different from an environment in which prices
actually decline.”
U.S. stock-index futures fell on Tuesday, as investors assessed the latest coronavirus relief bill and mixed raft of corporate earnings reports.
Global Stocks:
Index/commodity | Last | Today's Change, points | Today's Change, % |
Nikkei | 22,657.38 | -58.47 | -0.26% |
Hang Seng | 24,772.76 | +169.50 | +0.69% |
Shanghai | 3,227.96 | +22.73 | +0.71% |
S&P/ASX | 6,020.50 | -23.70 | -0.39% |
FTSE | 6,104.72 | -0.16 | 0.00% |
CAC | 4,909.31 | -30.31 | -0.61% |
DAX | 12,806.16 | -32.50 | -0.25% |
Crude oil | $41.18 | -1.01% | |
Gold | $1,933.00 | +0.10% |
Wall Street. Stocks before the bell
(company / ticker / price / change ($/%) / volume)
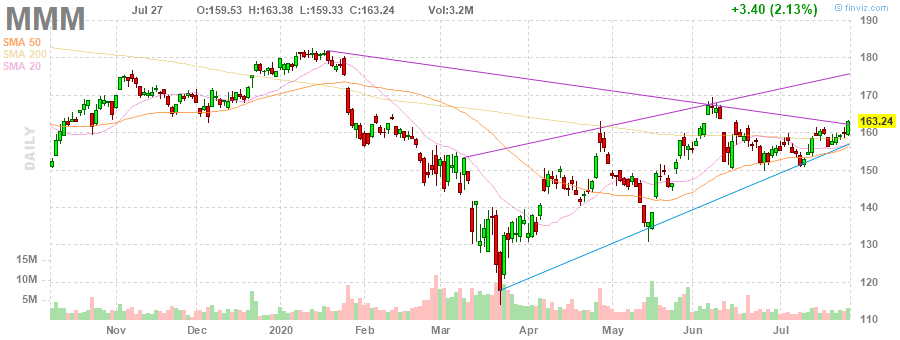
3M Co | MMM | 159 | -4.24(-2.60%) | 58921 |
ALCOA INC. | AA | 13 | -0.24(-1.81%) | 3801 |
ALTRIA GROUP INC. | MO | 43.09 | 0.96(2.28%) | 22755 |
Amazon.com Inc., NASDAQ | AMZN | 3,042.90 | -12.31(-0.40%) | 28342 |
AMERICAN INTERNATIONAL GROUP | AIG | 30.52 | -0.33(-1.07%) | 497 |
Apple Inc. | AAPL | 378.85 | -0.39(-0.10%) | 185292 |
AT&T Inc | T | 29.28 | -0.01(-0.03%) | 98341 |
Boeing Co | BA | 169.5 | -0.71(-0.42%) | 121425 |
Caterpillar Inc | CAT | 139.25 | -0.64(-0.46%) | 2044 |
Chevron Corp | CVX | 91 | -0.04(-0.04%) | 1264 |
Cisco Systems Inc | CSCO | 47 | -0.19(-0.40%) | 12530 |
Citigroup Inc., NYSE | C | 51.19 | -0.10(-0.20%) | 16396 |
Deere & Company, NYSE | DE | 175.65 | -0.35(-0.20%) | 132 |
E. I. du Pont de Nemours and Co | DD | 54.71 | -0.64(-1.16%) | 1234 |
Exxon Mobil Corp | XOM | 43.98 | -0.09(-0.20%) | 5831 |
Facebook, Inc. | FB | 234.1 | 0.60(0.26%) | 54841 |
FedEx Corporation, NYSE | FDX | 169.52 | -1.12(-0.66%) | 1527 |
Ford Motor Co. | F | 6.86 | -0.07(-1.01%) | 95717 |
Freeport-McMoRan Copper & Gold Inc., NYSE | FCX | 13.47 | -0.09(-0.66%) | 8708 |
General Electric Co | GE | 6.7 | -0.01(-0.15%) | 241235 |
General Motors Company, NYSE | GM | 25.62 | -0.08(-0.31%) | 2744 |
Goldman Sachs | GS | 202 | -1.02(-0.50%) | 3151 |
Google Inc. | GOOG | 1,525.00 | -5.20(-0.34%) | 6767 |
Hewlett-Packard Co. | HPQ | 17.64 | -0.17(-0.97%) | 163 |
Home Depot Inc | HD | 267 | -0.42(-0.16%) | 4954 |
HONEYWELL INTERNATIONAL INC. | HON | 150 | -0.76(-0.50%) | 653 |
Intel Corp | INTC | 49.38 | -0.19(-0.38%) | 308287 |
International Business Machines Co... | IBM | 125.9 | -0.31(-0.25%) | 3864 |
International Paper Company | IP | 36.03 | -0.82(-2.22%) | 420 |
Johnson & Johnson | JNJ | 147.52 | 0.34(0.23%) | 4034 |
JPMorgan Chase and Co | JPM | 96.64 | -0.26(-0.27%) | 15446 |
McDonald's Corp | MCD | 198.7 | -2.55(-1.27%) | 109736 |
Merck & Co Inc | MRK | 79.02 | 0.09(0.11%) | 910 |
Microsoft Corp | MSFT | 203.12 | -0.73(-0.36%) | 96448 |
Nike | NKE | 97 | -0.21(-0.22%) | 2146 |
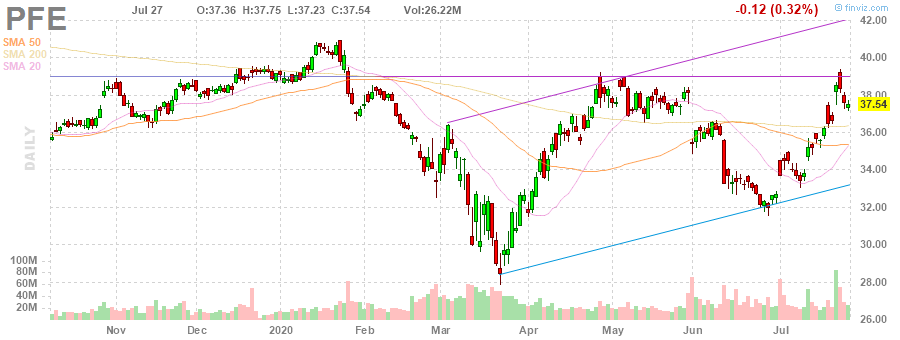
Pfizer Inc | PFE | 38.6 | 1.06(2.82%) | 1071752 |
Procter & Gamble Co | PG | 126.35 | 0.03(0.02%) | 726 |
Starbucks Corporation, NASDAQ | SBUX | 76 | -0.46(-0.60%) | 25065 |
Tesla Motors, Inc., NASDAQ | TSLA | 1,514.97 | -24.63(-1.60%) | 213129 |
The Coca-Cola Co | KO | 48.4 | -0.08(-0.17%) | 12233 |
Travelers Companies Inc | TRV | 116.65 | 0.02(0.02%) | 112 |
Twitter, Inc., NYSE | TWTR | 36.6 | -0.25(-0.68%) | 27331 |
UnitedHealth Group Inc | UNH | 297.1 | -1.50(-0.50%) | 9200 |
Verizon Communications Inc | VZ | 56.78 | -0.09(-0.16%) | 2144 |
Visa | V | 197.4 | 0.49(0.25%) | 23846 |
Wal-Mart Stores Inc | WMT | 131 | -0.21(-0.16%) | 3177 |
Walt Disney Co | DIS | 115.89 | -0.42(-0.36%) | 8641 |
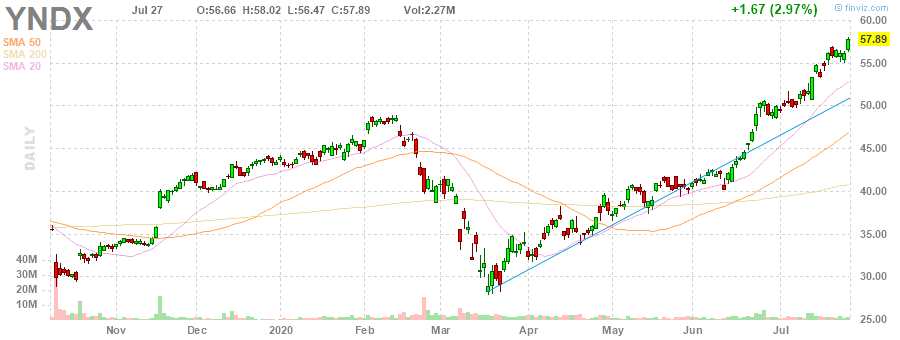
Yandex N.V., NASDAQ | YNDX | 55.49 | -2.40(-4.15%) | 37180 |
Downgrades before the market open
Tesla (TSLA) downgraded to Underperform from Mkt Perform at Bernstein; target $900
| Time | Country | Event | Period | Previous value | Forecast | Actual |
|---|---|---|---|---|---|---|
| 10:00 | United Kingdom | CBI retail sales volume balance | July | -37 | -25 | 4 |
USD traded mixed against other major currencies in the European session on Tuesday as investors turned their attention to the upcoming meeting of the U.S. Federal Reserve and negotiations on the next round of the coronavirus aid in the U.S. Congress. The U.S. currency fell against JPY, GBP and CHF, but rose against the rest of major rivals. The U.S. Dollar Index (DXY), measuring the U.S. currency's value relative to a basket of foreign currencies, increased 0.12% to 93.78.
The Fed will begin its two-day meeting later today and investors expect the U.S. central bank will signal it remains supportive of the economy as the country struggles in its fight against the COVID-19 pandemic. At its June meeting, the Fed left its interest rates unchanged and said it expects to hold the target range for the federal funds rate at the current level at least through 2022 or until the economy “had weathered recent events.”
On Monday, the U.S. Senate Majority Leader Mitch McConnell presented the HEALS Act, a $1 trillion coronavirus aid package that includes money for health, schools, liability protection, and small businesses, $1200 stimulus payments to most Americans and $200 weekly unemployment supplement. He urged Democrats to compromise with Republicans on the plan, as unemployment benefits are to expire at the end of this week.
Investor sentiment was also dampened by growing worries about the potential for a worsening of the coronavirus pandemic. The UK's PM Boris Johnson warned today that they were seeing signs of the second virus wave in some other European countries. According to Johns Hopkins University, the number of confirmed global cases of the COVID-19 increased to 16,495,309, and the U.S. reported 4,294,770 cases of the coronavirus, the most in the world.
FXStreet notes that the S&P 500 Index pushed slightly higher on Monday but maintains a bearish “reversal day” and the Credit Suisse analyst team also now sees the potential for a ‘head and shoulders’ top if the S&P 500 Energy Industry Group break below 260.84/259.49 which would imply a deeper correction.
“Key near-term support is seen at its 13-day average at 3215, with a break below 3200/3198 then needed to confirm the aforementioned top. This would then open the door to a swing lower within the broader sideways range with support seen next at 3173, ahead of 3154 and then more importantly 3116.”
“Resistance is seen at 3240/41, with a move above 3248 needed to ease the topping threat and see a move back to 3266. Above 3279/81 though is needed to reassert an upward bias again, with the top of the February gap seen at 3328/38.”
“S&P 500 Energy Industry Group is likely to be a good barometer for the broader market over the next few sessions, as a break below 260.84/259.49 would complete a large ‘head and shoulders’ top to suggest a deeper setback, with next supports then seen at 235.089 initially, then 208.23. In contrast, a break above 292.19/32 would actually set a small base to turn the risks higher within the range, with next resistance then seen at 314.01 initially.”
FXStreet reports that the stars are aligned for gold prices and a test of the psychological level of $2,000 is within reach now, according to strategists at ABN Amro as a lower dollar, aggressive monetary policy easing, ultra-low interest rates, negative US real yields, fiscal stimulus and the technical outlook all support gold price.
“Since the start of July USD has declined. For a start a more constructive sentiment on financial markets has resulted in lower safe-haven demand for the dollar. In addition, investors shy away from the dollar because of the tensions between the US and China and the Presidential elections. Moreover, the handling of the COVID-19 situation in the US has weighed on the US dollar. Finally, the monetary policy easing by the Fed is a crucial driver of dollar weakness.”
“Central bank policy is a strong driver behind higher gold prices. Official rates are close to zero in a large number of countries and they will unlikely go up in our forecast horizon. Moreover, most central banks have announced QE. This sounds like music to the ears of gold bugs as money floods into the market and currencies begin to decline.”
“In a number of countries there are negative rates (official and/or government bond rates). Gold is not paying any interest rates. So negative rates are another major support to gold prices especially versus the euro.”
“The US may not have negative official rates or government bond yields, but nominal rates corrected for inflation expectations (real rates) are in negative territory. As long as there are expectations that the Fed would move to a form of yield curve control, the upside in US Treasury yields is limited. So, if investors are concerned about inflation in the longer run this will be visible in inflation expectations and negative US real yields. Our US economist expects relatively stable US Treasury yields and no pick-up in inflation, because of the negative effect of the pandemic on the economy. So, we think that this driver should have less impact going forward.”
“Governments have embarked on large-scale fiscal stimulus to support the economy. As a result, fiscal deficits in a large number of countries have risen substantially, even to double digit numbers. This development has made some investors nervous, especially in combination with the substantial amount of monetary policy stimulus. As a result, investors have bought gold.”
“The technical outlook is positive. Investors saw every dip in gold prices as a buying opportunity. Now the psychological resistance of $1,800 per ounce has been surpassed and the all-time high at $1,921 has been taken out. Above that the important psychological level of $2,000 per ounce is within reach.”
Pfizer (PFE) reported Q2 FY 2020 earnings of $0.78 per share (versus $0.80 per share in Q2 FY 2019), beating analysts’ consensus estimate of $0.66 per share.
The company’s quarterly revenues amounted to $11.801 bln (-11.0% y/y), beating analysts’ consensus estimate of $11.553 bln.
The company also raised guidance for FY 2020, projecting EPS of $2.85-2.95 (compared to $2.82-2.92 previously and analysts’ consensus estimate of $2.72) and revenues of $48.6-50.6 bln (compared to $48.5-50.5 bln previously and analysts’ consensus estimate of $48.11 bln).
PFE rose to $38.86 (+3.52%) in pre-market trading.
Yandex N.V. (YNDX) reported Q2 FY 2020 loss of RUB9.90 per share (versus earnings of RUB21.65 per share in Q2 FY 2019), worse than analysts’ consensus estimate of RUB4.31 per share.
The company’s quarterly revenues amounted to RUB41.407 bln (0.0% y/y), beating analysts’ consensus estimate of RUB40.960 bln.
YNDX fell to $56.09 (-3.11%) in pre-market trading.
- We are seeing signs of second virus wave in some other European countries
- We had to take swift, decisive action on Spain quarantine decision
- We will continue to take action where it is necessary
FXStreet notes that EUR/CHF saw a very sharp move higher on Monday towards the 2018 downtrend and the 2019 downtrend at 1.0801/15. The pair is retrating today below the 1.08 mark but the Credit Suisse analyst team expects EUR/CHF to retest the mentioned 1.0815 level.
“EUR/CHF saw a very sharp move higher from the 200-day average to see a test of the pivotal 2018 downtrend and 2019 downtrend at 1.0801/15. We ideally look for the market to take a breather here in line with daily RSI momentum in overbought territory, ahead of another attempt to break above the aforementioned 1.0801/15.”
“A sustained and closing break above 1.0801/15 in due course would then reinforce thoughts of a broader change in trend direction to the upside and see resistance next at 1.0828/38, ahead of the more important 78.6% retracement of the May/July move lower at 1.0849/50.”
“Support at 1.0794 ideally holds to keep the immediate upside bias intact. Removal of here could see a move back to 1.0720/12, where we would expect to see a more concerted effort to hold.”
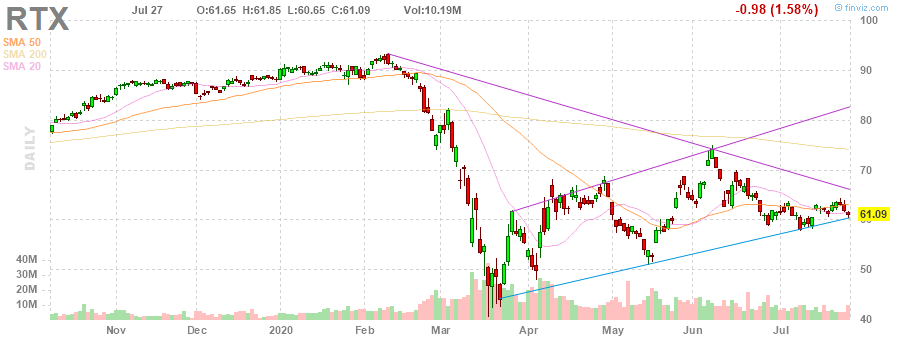
Raytheon Technologies (RTX) reported Q2 FY 2020 earnings of $0.40 per share, beating analysts’ consensus estimate of $0.12 per share.
The company’s quarterly revenues amounted to $14.061 bln (+24.1% y/y), beating analysts’ consensus estimate of $13.385 bln.
RTX rose to $62.50 (+2.31%) in pre-market trading.
3M (MMM) reported Q2 FY 2020 earnings of $1.78 per share (versus $2.20 per share in Q2 FY 2019), missing analysts’ consensus estimate of $1.79 per share.
The company’s quarterly revenues amounted to $7.176 bln (-12.2% y/y), missing analysts’ consensus estimate of $7.286 bln.
MMM fell to $158.30 (-3.03%) in pre-market trading.
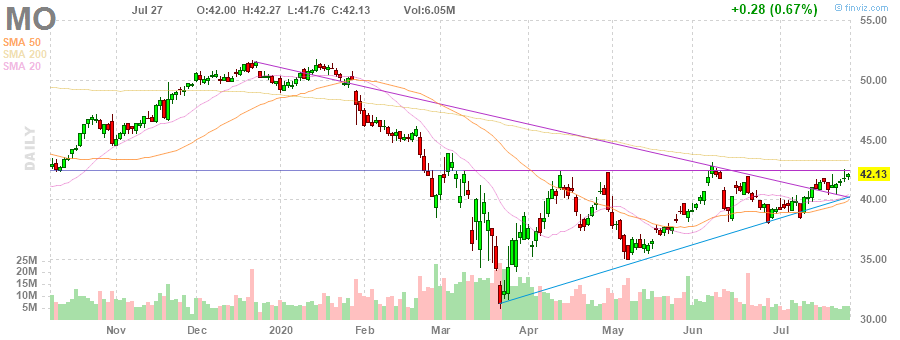
Altria (MO) reported Q2 FY 2020 earnings of $1.09 per share (versus $1.10 per share in Q2 FY 2019), beating analysts’ consensus estimate of $1.06 per share.
The company’s quarterly revenues amounted to $5.062 bln (-2.5% y/y), generally in line with analysts’ consensus estimate of $5.085 bln.
The company also reinstated its FY 2020 guidance, projecting EPS of $4.21-4.38 versus analysts’ consensus estimate of $4.30.
MO rose to $42.25 (+0.28%) in pre-market trading.
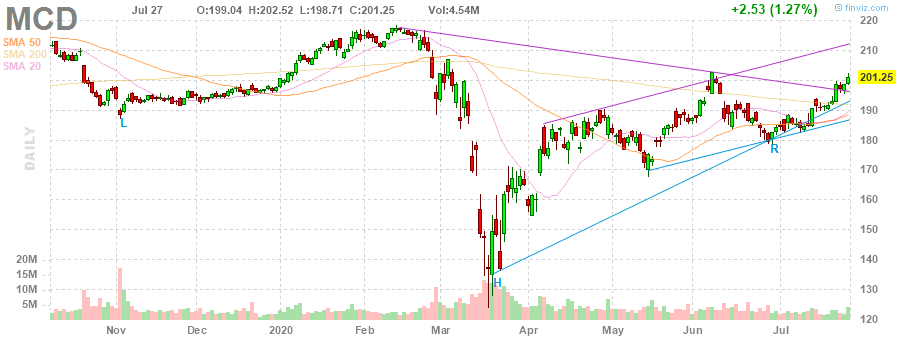
McDonald's (MCD) reported Q2 FY 2020 earnings of $0.66 per share (versus $2.05 per share in Q2 FY 2019), missing analysts’ consensus estimate of $0.76 per share.
The company’s quarterly revenues amounted to $3.761 bln (-29.6% y/y), generally in line with analysts’ consensus estimate of $3.735 bln.
MCD fell to $197.52 (-1.85%) in pre-market trading.
FXStreet notes that the US presidential election is important for Switzerland and its many large international companies, especially during the current cycle when the vote will influence the direction of policy issues such as foreign trade and taxation. The outcome will also determine how the US administration will view the Swiss National Bank’s currency market interventions going forward. USD/CHF has traded between 1.02 and 0.95 over the last five years and recently moved below this trading range. Economists at UBS forecast the pair trading in the 0.90-0.95 range.
“Periods of heightened uncertainty and political risk tend to create pressure on the Swiss franc to appreciate due to its status as a safe-haven currency. This may be more pronounced if the source of the uncertainty involves the ultimate safe-haven currency, namely the US dollar.”
“We may see bouts of CHF strength in the run-up to the election. We think a new lower trading range between 0.90 and 0.95 is likely to be established over time.”
“Apart from currency strength, Swiss equities may be affected by a renewed flare-up in trade rhetoric ahead of the election. Most of the Swiss Market Index’s multinational companies generate only a small portion of their earnings in their home market, so rising trade tensions usually don’t bode well for them. Also, potential changes to corporate tax policy would affect Swiss listed companies, as we estimate that their tax exposure to the US account for up to a quarter of their total corporate taxes. On the other hand, the Swiss Market Index has a defensive sector bias, being dominated by pharmaceuticals and consumer staples while IT-related stocks are significantly underrepresented in the index.”
FXStreet reports that GBP/USD broke above the June high at 1.2808/17 yesterday and analysts at Credit Suisse stay biased higher though the cable is posting small losses today, down -0.08% to 1.2875. Next resistance is seen at the medium-term downtrend from the 2014 peak at 1.3127 and then at the key Q1 2020 highs at 1.3200/15. The market should now ideally hold above it’s 1.2813/07 breakout point.
“GBP/USD is consolidating in the very near-term below resistance at 1.2894/2904 – the 50% retracement of the entire fall from the 2018 peak - after its earlier breakout above key resistance at the June high and 78.6% retracement of the entire fall from late last year at 1.2808/17.”
“This important breakout keeps us biased higher and looking for a break above 1.2894/2904 in due course, with resistance seen next at 1.2936, ahead of 1.2977 and then eventually the long-term downtrend from the 2015 peak, currently seen at 1.3127. With the February and March highs not far above at 1.3200/15, we expect this zone to then prove a tougher barrier.”
“Support stays at 1.2813/07 initially, then 1.2785, with 1.2773/68 ideally holding to keep the immediate risk higher. A break can see a deeper pullback, but with key price and 200-day average support at 1.2717/02 ideally holding further weakness.”
The
Confederation of British Industry (CBI) reported on Tuesday its latest survey
of retailers showed retail sales volume balance stood at +4 in the year to
July, up from -37 in June, which pointed to a stabilization in sales after
three months of sharp declines. That was the highest survey balance since
November 2019. The improvement was primarily driven by stronger grocery sales,
although conditions appear to have eased more widely following the re-opening
of non-essential retailers on July 4.
Economist had
forecast the reading to increase to -25.
However, retail
sales volumes are expected to fall slightly in the year to August (-5).
The report also
revealed that orders placed on suppliers fell for the fourth consecutive month,
though at a slower pace than in June (-14 compared
to -47) and are expected to drop at a similar pace next month (-14).
Rain
Newton-Smith, CBI Chief Economist, noted: “It’s great to see retail sales
stabilize this month, but this doesn’t tell the whole story. This crisis has
created winners and losers within the retail sector and for some businesses the
picture remains bleak. The re-opening of non-essential retail was a vital step
towards recovery but isn’t a cure-all. The Government has provided critical
support for firms and jobs throughout the crisis. But ongoing financial
pressures are a major challenge for some retailers, and additional direct
support to shore up cash flow, such as extension of business rates relief,
should be considered.”
FXStreet reports that last week, the S&P 500 made a valiant effort to break out to new recovery highs but ultimately failed to do so, as the stock markets finished the week on a soft note. Mike Wilson from Morgan Stanley explains three arguments for this move lower and believes it is a healthy correction which will allow the bull market to continue in the end.
“While there was no smoking gun for this weakness, we would chalk it up to three things: first, the spike in COVID cases has continued, and the virus remains far from contained in the US. This spike is challenging the pace of reopening of the US economy, schools, and everyday activities of life. Second, polls are suggesting Joe Biden has a very strong lead over President Trump in this year's election, while the Democrats are also looking like favorites in congressional races. A blue sweep would usher in meaningful changes to policy going forward that are perceived to be less market friendly. Finally, valuations for the most favored parts of the equity market have reached their limits, with some stocks now reaching bubble territory.”
“This should be a correction that creates an opportunity to buy some of these great businesses at lower prices. It may also cause the overall market to trade lower, given how large and important some of these stocks are to the overall index. To me, this would be a healthy development and a necessary condition for the bull market that began in March to eventually continue. For longer-term investors, it should be the pause that refreshes.”
CNBC reports that european equities could jump 10% on the back of a historic agreement over fiscal stimulus in the European Union, Morgan Stanley said in a note Tuesday.
After one of the longest ever European summits a week ago, the 27 member states agreed to tap the markets and raise up 750 billion euros — an unprecedented deal at the EU level, which has yet to be greenlighted by the European Parliament, that has opened the door to common debt borrowing.
The investment bank believes that the recent decision is a “game changer” for Europe, in dealing with the current economic crisis, but also in erasing some long-standing fears over disintegration.
“We see scope for a further 10% outperformance from EMU [European monetary union] equities versus global peers, led by Peripheral indices (15% outperformance),” Morgan Stanley analysts said in a note.
Europe’s STOXX 600 is down about 11% since the start of the year. In comparison, the S&P500 is only down about 1% since the start of the year.
“The European Union could be bureaucratic and that’s to be expected but I think the European recovery fund is a dramatic change, it is unprecedented in terms of its formation,” Chris Dyer, director of global equity at Eaton Vance, told CNBC’s Squawk Box Europe Monday.
He expects European equities to outperform U.S. stocks.
“What we are seeing in Europe is greater cohesion … whereas in the U.S. there is more policy uncertainty to come,” he said.
Reuters reports that the European Central Bank extended on Tuesday a recommendation to euro zone banks not to pay dividends until the end of the year and allowed them to eat into their capital and liquidity buffers for even longer, to help them cope with the economic fallout of the coronavirus pandemic.
The ECB said banks could withstand a second wave of infections, but it called on authorities to be ready to intervene and prevent a credit crunch, possibly including recapitalisations.
The euro zone’s top supervisor extended a ban on dividends and share buybacks by two months until Jan. 1 and recommended that banks “exercise extreme moderation” with bonuses. It will review the decisions in the fourth quarter of the year.
It also allowed them to breach their required liquidity buffer until the end of next year and their total capital requirement for another year.
“All our supervisory measures and actions are and will continue to be aimed at ensuring that the banking sector can remain resilient and support the economic recovery with an adequate supply of credit,” the ECB’s chief supervisor, Andrea Enria, said in a blog post accompanying the decisions.
The ECB’s announcement came the same day the Bank of England said it would assess whether to extend a suspension on payouts such as dividends and share buybacks by banks beyond the end of the year. Banks agreed in March to suspend payouts this year.
In a “vulnerability analysis”, the ECB found that in its central economic scenario, which assumes containment measures until mid-2021, banks would see their aggregate Core Equity Tier 1 capital ratio depleted by approximately 1.9 percentage points to 12.6% by the end of 2022.
The severe scenario, which foresees a strong resurgence of infections, would wipe 5.7 percentage points off their capital to 8.8% over the same period.
FXStreet reports that in opinion of FX Strategists at UOB Group, USD/CNH could slip back to the 6.9645 level in the near-term.
24-hour view: “Our expectation for USD to ‘drift lower to 6.9920’ did not materialize as USD dropped to 6.9970 before closing at 6.9993 (-0.22%). However, USD opened on a weak note this morning and has moved below 6.9900. Downward momentum has improved and the risk from here is for USD to weaken towards 6.9750. This level is quite a strong support and may not yield so easily. Resistance is at 6.9980 followed by 7.0040.”
Next 1-3 weeks: “Our latest narrative was from last Thursday (23 Jul, spot at 7.0155) wherein USD ‘is in a corrective rebound but any advance is expected to face solid resistance at 7.0400’. USD subsequently popped to a high of 7.0301 but has since eased off. For now, there is no change in our view but the underlying tone has softened and from here, a break of 6.9750 would indicate that the correction phase has ended. To look at it another way, a breach of 6.9750 would increase the risk of USD moving below the month-to-date low at 6.9645. For now, the prospect for such a move is not high but it would continue to increase as long as USD does not move above 7.0300 within these few days.”
CNBC reports that gold prices could surge beyond the $2,000 level this year as economic and geopolitical uncertainties lead to a rush for safer assets, analysts predicted.
On Monday, spot gold jumped to record levels, to $1,943.92 per ounce. This level eclipsed the previous record high price set in September 2011.
“We think the current momentum in the next few months will cross the $2,000 an ounce mark. The key question is how much does the rally increase after that,” Commonwealth Bank of Australia’s Vivek Dhar, mining and energy commodities analyst, told CNBC.
He added that in order to see prices well above that level — like $2,500 per ounce, the U.S. would have to move interest rates to below zero.
There is an inverse relationship between gold prices and real yields. Real yield is an investment return that has been adjusted for inflation.
When real yields go down, gold prices will go up, and vice versa. In such a scenario, the opportunity cost of holding gold, a non-yielding asset, is lower as investors are not foregoing interest that would be otherwise earned in yielding assets.
The Fed has kept the benchmark rate at close to zero this year, and talk has centered around whether it should go to negative like its counterparts in Europe and Japan.
Reuters reports that Spain's unemployment rate rose to 15,33% in the second quarter of the year, data from the National Statistics Institute showed on Tuesday, with many more people who lost their job in the coronavirus pandemic not included in the statistic.
The jobless rate rose in the second quarter compared with 14.41% in the previous quarter. It's the highest since the first quarter of 2018.
Economists' polled by Reuters had forecast Spain's unemployment rate would rise more and reach 16.70%.
The data, however, does not show the whole extent of the crisis.
For one thing, workers who are in a furlough scheme are not included as unemployed in this survey. For the first time in an economic crisis, Spain has made massive use of employment protection schemes, known as ERTE, to limit the number of redundancies in the face of forced closure of economic activity.
Then, the National Institute of Statistics said in a statement that just over a million people lost their jobs during the quarter, but have not come to be considered unemployed since they did not meet the technical conditions to be included in this group, such as active job search.
During the second quarter, Spain was one of the countries in the world hit hardest by the coronavirus pandemic, and it implemented one of the strictest lockdowns imposed in Europe from mid-March to June.
FXStreet reports that the impact of the elections on US economic growth, taxation, the trade conflict and the US dollar would impact corporate earnings and the equity market. Meanwhile, the threat of the US imposing tariffs on EU exports, particularly in the automotive sector, continues to linger. On the currency market, economists at UBS expect the euro to strengthen against the US dollar and a stronger sterling in the coming months.
“All paths point to a weaker US dollar against the euro and a stronger British pound in the months ahead. The election will give investors much to mull over, and a period of uncertainty could help the dollar’s safe-haven status to hold ground.”
“Depending on how the election turns out, various European industries will be affected. On the trade front, export-driven sectors including certain industrial companies, automakers with complex global supply chains and luxury goods brands will be impacted. Should tariff fears reemerge, the market would react negatively as we think this headwind is currently only marginally priced in.”
“US policy direction on healthcare may affect the pharma sector, which includes some of Europe’s largest companies by market capitalization. Given the importance of the US market for their profitability, any election outcome perceived to be unfavorable to drug pricing would affect the sector and the overall European market.”
The US dollar index is rising on Tuesday after falling the day before to the lowest level in two years. The ICE index, which tracks the dynamics of the US dollar against six currencies (euro, swiss franc, yen, canadian dollar, pound sterling and swedish krona), adds 0.16% during trading. On Monday, it fell 0.8%, to its lowest since June 2018. Since the beginning of July, the dollar index has lost 3.8% and may show the worst result since April 2011.
Demand for the US currency increased sharply in March this year, when the global economy faced a crisis as a result of lockdowns imposed around the world to curb the spread of the coronavirus. Measures taken by state governments, as well as Central banks, to support the economy, supported stock markets and contributed to the weakening of the dollar.
In recent weeks, the trend to weaken the dollar has increased against the background of an increase in the incidence of coronavirus infection in the United States, with signals of recovery in economic activity in other regions of the world. The Euro - dollar exchange rate on Monday rose to its highest level since September 2018.
The focus of traders ' attention is the two-day meeting of the Federal reserve system, starting on Tuesday. The Central Bank is expected to confirm its commitment to maintaining interest rates close to zero for a long time, which will continue to put pressure on the dollar.
Bloomberg reports that Global potential economic growth is set to drop in coming years due to fallout from the Covid-19 pandemic, amid a rise in unemployment and a cooling of investment by companies, according to Fitch Ratings Ltd.
The ten advanced countries -- covered in its Global Economic Outlook -- showed an average decline in annual potential gross domestic product growth of about 0.6 percentage point compared with Fitch’s previous five-year outlook. U.S. productive potential growth is revised down to 1.4% from 1.9%, the U.K. to 0.9% from 1.6% and the euro zone -- the weighted average of Germany, France, Italy and Spain -- to 0.7% from 1.2%, it said.
“There will be lasting damage to supply-side productive potential from the coronavirus shock as long-term unemployment rises, working hours fall and investment and capital accumulation slow,” Maxime Darmet, a director in Fitch’s economics team, said in a statement.
The world economy entered the second half of 2020 still deeply weighed down by the pandemic. The coronavirus recession is expected to still see GDP levels in the largest advanced economies remain around 3% to 4% below their pre-virus trend path by the middle of this decade, Fitch said.
A weaker outlook for capital accumulation accounts for about half of the revision to potential growth, the ratings agency said. The remainder is explained by the anticipated reduction in labor as unemployment rises and average hours worked fall, according to Fitch.
Cuts to estimated potential GDP imply “catch-up” growth over the next five years will be far more subdued. Fitch projects U.S. growth to average just over 2% from 2023 to 2025, compared with more than 3% if no adjustments were made to estimated potential growth.
The credit ratings agency acknowledged that risks around its projections are “very large.” These include the path of the health crisis, as well as the potential for fiscal consolidation following the stimulus. Conversely, job-subsidy programs in Europe might prove effective in limiting the rise in unemployment on the continent in the next six to 12 months.
Reuters reports that China’s gold consumption fell 38% year-on-year in the first half of 2020, hurt by the coronavirus and a slowing economy, although demand started to recover in the second quarter, the China Gold Association said on Tuesday.
Consumption in China, the world’s biggest gold user, came in at 323.29 tonnes in January-June, the association said on its website.
Consumption nearly halved in the first quarter from a year earlier as strict pandemic containment measures and rising prices hit demand.
Spot gold climbed about 17% over the first six months of 2020 as panicked investors piled into the safe-haven precious metal. Gold hit a record $1,980.57 an ounce on Tuesday.
Chinese dealers have been selling physical gold at discounts to global spot prices since late February in a bid to revive sluggish demand, with the discount widening to over $30 an ounce recently.
Second-quarter consumption was up 17.5% from the first quarter at 174.66 tonnes, according to Reuters calculations. That was still down 26.2% year-on-year.
The slowing of the decline came as China brought the spread of the coronavirus under control in the second quarter, the association said, helped by stimulus policies and “innovative” new ways of tempting consumers.
“Retail companies continue to carry out multiple forms of online marketing,” it said, with manufacturers developing new lightweight gold jewellery to attract younger buyers.
While overall gold consumption in the first half was “unsatisfactory,” gold bullion coin sales were “remarkable” and down only slightly in the second quarter, the association said, without providing further details.
China’s gold output slid 7.3% year-on-year to 217.8 tonnes in the first half, although the association said domestic production had returned to normal in the second quarter, rising 5.8% from the first quarter.
FXStreet reports that extra gains lie ahead for NZD/USD on a breakout of the 0.67 mark, suggested FX Strategists at UOB Group.
24-hour view: “Our view for NZD yesterday was that it ‘could edge above 0.6675 but the major resistance at 0.6700 is unlikely to come under threat’. NZD subsequently rose to a high of 0.6692 before closing on a strong note at 0.6684 (+0.65%). Upward momentum has improved and from here, NZD could crack 0.6700 but the next major resistance at 0.6755 is likely out of reach. Support is at 0.6660 followed by 0.6630.”
Next 1-3 weeks: “We have held the same view since last Wednesday (22 Jul, spot at 0.6640) wherein the ‘break-out of consolidation range has room to run further to 0.6700’. NZD rose to a high of 0.6692 yesterday (27 Jul) before closing on a strong note (0.6684, +0.65%). From here, a break of 0.6700 would not be surprising and would shift the focus to the next major resistance at 0.6755. Only a break of 0.6600 (‘strong support’ level previously at 0.6580) would indicate that the current upward pressure has eased.”
RTTNews reports that Japan's services producer prices increased at a faster pace in June, data from the Bank of Japan showed Tuesday.
The services producer price index grew 0.8 percent on a yearly basis, following May's 0.5 percent increase. The inflation rate accelerated for the first time in five months.
Month-on-month, the services PPI climbed 0.2 percent, in contrast to a 0.6 percent drop in May.
Excluding international transportation, services prices logged an annual growth of 0.9 percent versus 0.6 percent increase a month ago. On a monthly basis, prices were up 0.2 percent after falling 0.5 percent in May.
EUR/USD
Resistance levels (open interest**, contracts)
$1.1863 (2824)
$1.1836 (1095)
$1.1814 (948)
Price at time of writing this review: $1.1727
Support levels (open interest**, contracts):
$1.1650 (50)
$1.1616 (90)
$1.1578 (317)
Comments:
- Overall open interest on the CALL options and PUT options with the expiration date August, 7 is 53013 contracts (according to data from July, 27) with the maximum number of contracts with strike price $1,1400 (4030);
GBP/USD
Resistance levels (open interest**, contracts)
$1.2923 (1854)
$1.2908 (1782)
$1.2897 (1893)
Price at time of writing this review: $1.2854
Support levels (open interest**, contracts):
$1.2783 (67)
$1.2753 (68)
$1.2679 (185)
Comments:
- Overall open interest on the CALL options with the expiration date August, 7 is 19824 contracts, with the maximum number of contracts with strike price $1,3000 (2496);
- Overall open interest on the PUT options with the expiration date August, 7 is 19654 contracts, with the maximum number of contracts with strike price $1,2400 (1526);
- The ratio of PUT/CALL was 0.99 versus 0.96 from the previous trading day according to data from July, 27
* - The Chicago Mercantile Exchange bulletin (CME) is used for the calculation.
** - Open interest takes into account the total number of option contracts that are open at the moment.
| Raw materials | Closed | Change, % |
|---|---|---|
| Brent | 43.45 | 0.79 |
| Silver | 24.5 | 7.55 |
| Gold | 1940.763 | 2.02 |
| Palladium | 2308.89 | 4.02 |
| Index | Change, points | Closed | Change, % |
|---|---|---|---|
| NIKKEI 225 | -35.76 | 22715.85 | -0.16 |
| Hang Seng | -102.07 | 24603.26 | -0.41 |
| KOSPI | 17.42 | 2217.86 | 0.79 |
| ASX 200 | 20.2 | 6044.2 | 0.34 |
| FTSE 100 | -18.94 | 6104.88 | -0.31 |
| DAX | 0.6 | 12838.66 | 0 |
| CAC 40 | -16.81 | 4939.62 | -0.34 |
| Dow Jones | 114.88 | 26584.77 | 0.43 |
| S&P 500 | 23.78 | 3239.41 | 0.74 |
| NASDAQ Composite | 173.09 | 10536.27 | 1.67 |
| Time | Country | Event | Period | Previous value | Forecast |
|---|---|---|---|---|---|
| 10:00 | United Kingdom | CBI retail sales volume balance | July | -37 | -25 |
| 13:00 | U.S. | S&P/Case-Shiller Home Price Indices, y/y | May | 4% | 4% |
| 14:00 | U.S. | Richmond Fed Manufacturing Index | July | ||
| 14:00 | U.S. | Consumer confidence | July | 98.1 | 94.5 |
| Pare | Closed | Change, % |
|---|---|---|
| AUDUSD | 0.71436 | 0.69 |
| EURJPY | 123.812 | 0.28 |
| EURUSD | 1.17475 | 0.89 |
| GBPJPY | 135.717 | 0.09 |
| GBPUSD | 1.28807 | 0.73 |
| NZDUSD | 0.66696 | 0.47 |
| USDCAD | 1.33592 | -0.42 |
| USDCHF | 0.91989 | -0.11 |
| USDJPY | 105.366 | -0.63 |


© 2000-2026. All rights reserved.
This site is managed by Teletrade D.J. LLC 2351 LLC 2022 (Euro House, Richmond Hill Road, Kingstown, VC0100, St. Vincent and the Grenadines).
The information on this website is for informational purposes only and does not constitute any investment advice.
The company does not serve or provide services to customers who are residents of the US, Canada, Iran, The Democratic People's Republic of Korea, Yemen and FATF blacklisted countries.
Making transactions on financial markets with marginal financial instruments opens up wide possibilities and allows investors who are willing to take risks to earn high profits, carrying a potentially high risk of losses at the same time. Therefore you should responsibly approach the issue of choosing the appropriate investment strategy, taking the available resources into account, before starting trading.
Use of the information: full or partial use of materials from this website must always be referenced to TeleTrade as the source of information. Use of the materials on the Internet must be accompanied by a hyperlink to teletrade.org. Automatic import of materials and information from this website is prohibited.
Please contact our PR department if you have any questions or need assistance at pr@teletrade.global.
transfers