- Analytics
- News and Tools
- Market News
CFD Markets News and Forecasts — 28-06-2024
- Silver up 0.49, boosted by lower US inflation data and Fed rate cut prospects.
- Technical analysis shows bearish trends; RSI indicates selling pressure with lower highs, lower lows.
- Resistance levels: $29.19 (50-DMA), $31.54 (June 7 high), $32.00, $32.51 (YTD high).
- Support points: $29.00, $28.28 (June 10, 2021, high), $28.00, $27.01 (May 8 low), $26.82 (100-DMA).
Silver price registered gains of 0.49% as inflationary figures released by the US Bureau of Economic Analysis (BEA) dipped as expected, reigniting Fed rate cut hopes amongst investors. Therefore, the Greenback edged lower, while XAG/USD traded at $29.13 after hitting a daily low of $28.78.
XAG/USD Price Analysis: Technical outlook
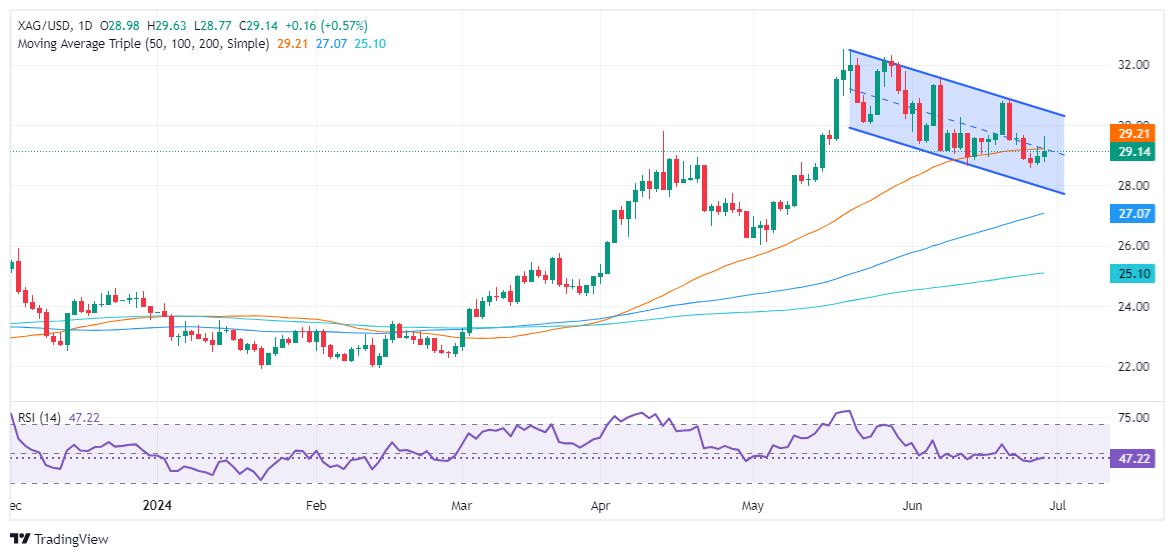
After forming a quasi ‘double top,’ the Silver price extended its losses, which amounted to more than 10% after it peaked at around $32.51 on May 20. The uptrend seems exhausted, as shown by different signals: momentum shifted bearishly as the Relative Strength Index (RSI) entered seller territory, while successive series of lower highs and lower lows confirm the change of the trend.
If buyers want to regain control, they must clear the 50-day moving average (DMA) at $29.19. Once hurdle, the next level would be the June 7 high of $31.54. Clearing this would aim for $32.00 before challenging the year-to-date (YTD) high of $32.51.
Conversely, and the path of least resistance, if XAG/USD slides below $29.00 that could put into play the June 10, 2021, high turned support at $28.28, ahead of exposing the psychological $28.00 mark.
Key support levels lie underneath the latter, with the May 8 swing low of $27.01 up next before challenging the 100-DMA at $26.82.
XAG/USD Price Action – Daily Chart
Economic Indicator
Personal Consumption Expenditures - Price Index (MoM)
The Personal Consumption Expenditures (PCE), released by the US Bureau of Economic Analysis on a monthly basis, measures the changes in the prices of goods and services purchased by consumers in the United States (US).. The MoM figure compares prices in the reference month to the previous month. Price changes may cause consumers to switch from buying one good to another and the PCE Deflator can account for such substitutions. This makes it the preferred measure of inflation for the Federal Reserve. Generally speaking, a high reading is bullish for the US Dollar (USD), while a low reading is bearish.
Read more.Last release: Fri Jun 28, 2024 12:30
Frequency: Monthly
Actual: 0%
Consensus: 0%
Previous: 0.3%
Source: US Bureau of Economic Analysis
- NZD/JPY's bullish run persists as the cross surges past 98.00, marking fresh highs since 2007.
- The 20-day SMA provides robust support at 96.90.
- The strong bullish outlook stays intact, but a consolidation looms.
On Friday, the NZD/JPY cross made significant strides, gaining momentum and setting new cycle highs beyond 98.00. Notably, this represents the pair's highest position since 2007, substantiating the strong bullish bias. However, given the overbought conditions, a healthy correction would be necessary.
The daily chart's Relative Strength Index (RSI) value now sits at 68, entering the overbought territory. This demonstrates a continued bullish advance from earlier in the week, indicating that positive momentum still drives the pair. Despite these strong bullish indicators, the Moving Average Convergence Divergence (MACD) is not turning out green bars, suggesting that buyers may be losing their momentum.
NZD/JPY daily chart
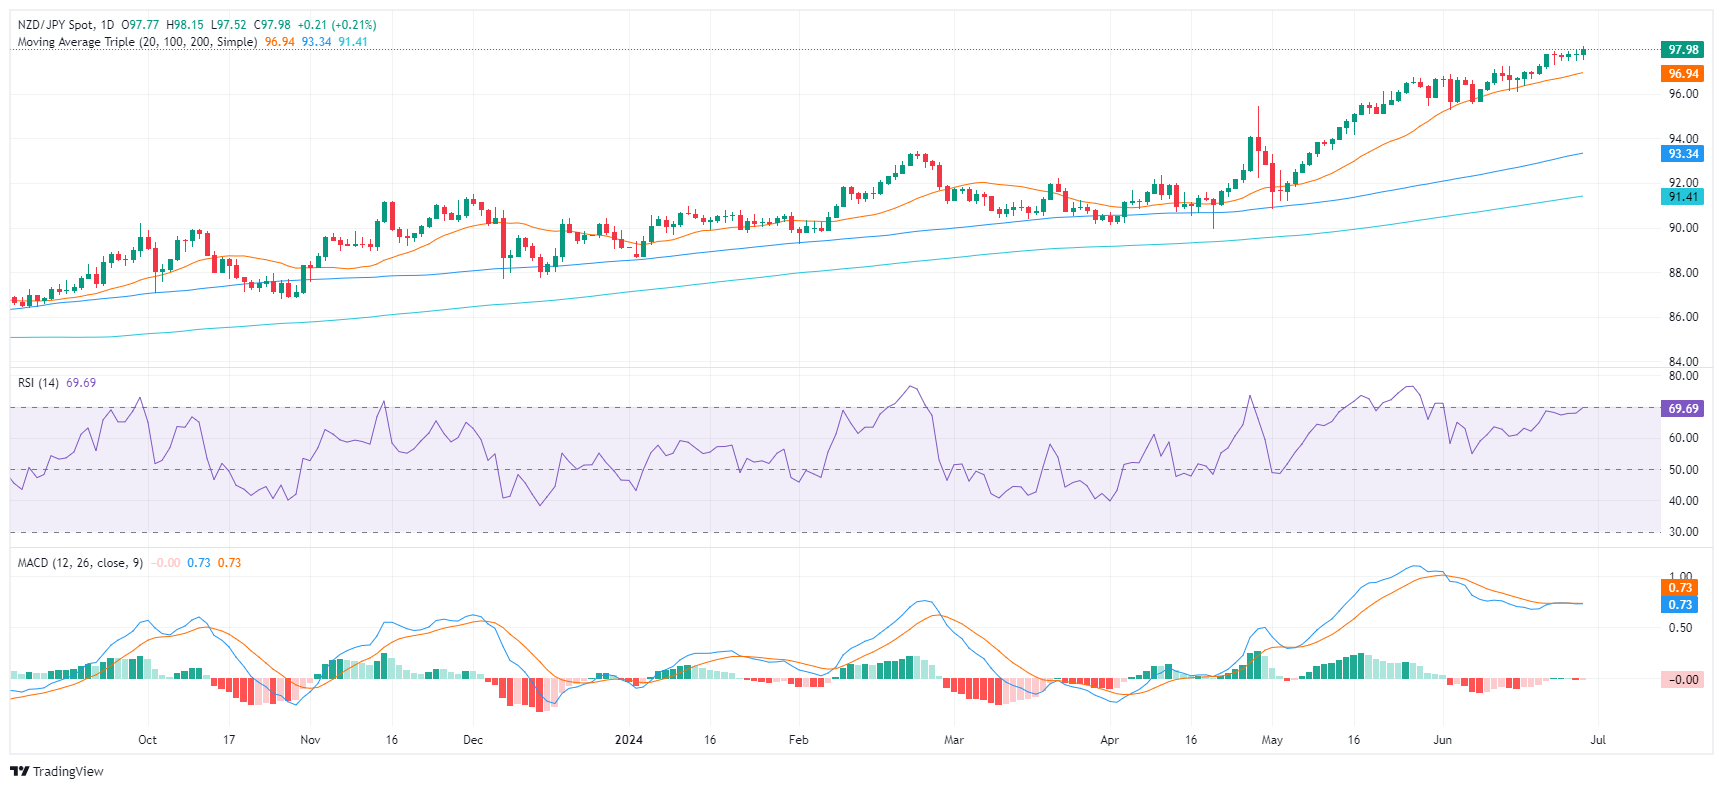
Going forward, market participants keep a keen eye on the immediate support level of 97.00, with additional support at 96.90, close to the 20-day SMA and the previous low of 95.00. Moreover, they have trained their sights on the resistance targets of 98.50 and 99.00. A decisive breach above the ongoing range will provide further confirmation of the upside potential while slipping beneath the 20-day SMA could signal a more profound correction.
- EUR/USD wraps up trading week at familiar technical levels near 1.0700.
- German data broadly missed the mark early Friday.
- US PCE inflation met expectations, but good mood was brief.
EUR/USD pivoted into a sideways grind on Friday, wrapping up a flat trading week after Fiber traders found little reason to push the pair meaningfully in either direction. German import prices and labor figures broadly miss the mark, and US Personal Consumption Expenditure Price Index (PCE) inflation failed to spark a meaningful bid despite printing at forecasts.
German Unemployment Change clocked in higher than expected, showing 19K German consumers were added to unemployment figures in June. This is more than the forecast 15K, but still below the previous month’s 25K. The German Unemployment Rate also ticked higher to 6.0% versus the forecast hold at 5.9%.
Forecasting the Coming Week: Data, politics and the ECB Forum take centre stage
On the US side, Core PCE Price Index inflation ticked down for the year ended May, cooling to 2.6% from the previous 2.8%. While the decline in key inflation readings will be a welcome addition to recent inflation data, it failed to spark a meaningful risk-on bid for investors as the figure was nowhere near cool enough to drive the Federal Reserve (Fed) towards an accelerated pace of interest rate cuts.
US Personal Income rose 0.5% MoM in May compared to the forecast 0.4% and previous 0.3%, but US Personal Spending came in at 0.2% versus the forecast 0.3%, and the previous print saw a slight downside revision to 0.1% from the initial 0.2%.
The University of Michigan (UoM) Consumer Sentiment Index rose to 68.2 in June, up from the previous 65.6 and climbing over the forecast 65.8. However, UoM 5-year Consumer Inflation Expectations ticked down to 3.0% in June, down from the previous 3.1% but inflation expectations continue to ride well above the Fed’s inflation target of 2% annually.
Coming up next week, European inflation numbers will be landing on markets early in the week with German Harmonized Index of Consumer Prices (HICP) figures on Monday, followed by pan-EU HICP inflation on Tuesday. Next week also marks the next US Nonfarm Payrolls (NFP) labor data dump, slated for next Friday.
EUR/USD technical outlook
The Fiber ran directly into technical barriers on Friday, getting swamped out at the 200-hour Exponential Moving Average (EMA) at 1.0715. The pair continue to battle with the 1.0700 handle, and bidders have been thus far failing to throw off a near-term pattern of lower highs.
EUR/USD daily candlesticks continue to grind out a rough consolidation pattern as the pair struggles on the low side of the 200-day EMA at 1.0788. As buyers continue to show signs of exhaustion, a downside break to 2024’s bottom bids at 1.0600 becomes increasingly likely.
EUR/USD hourly chart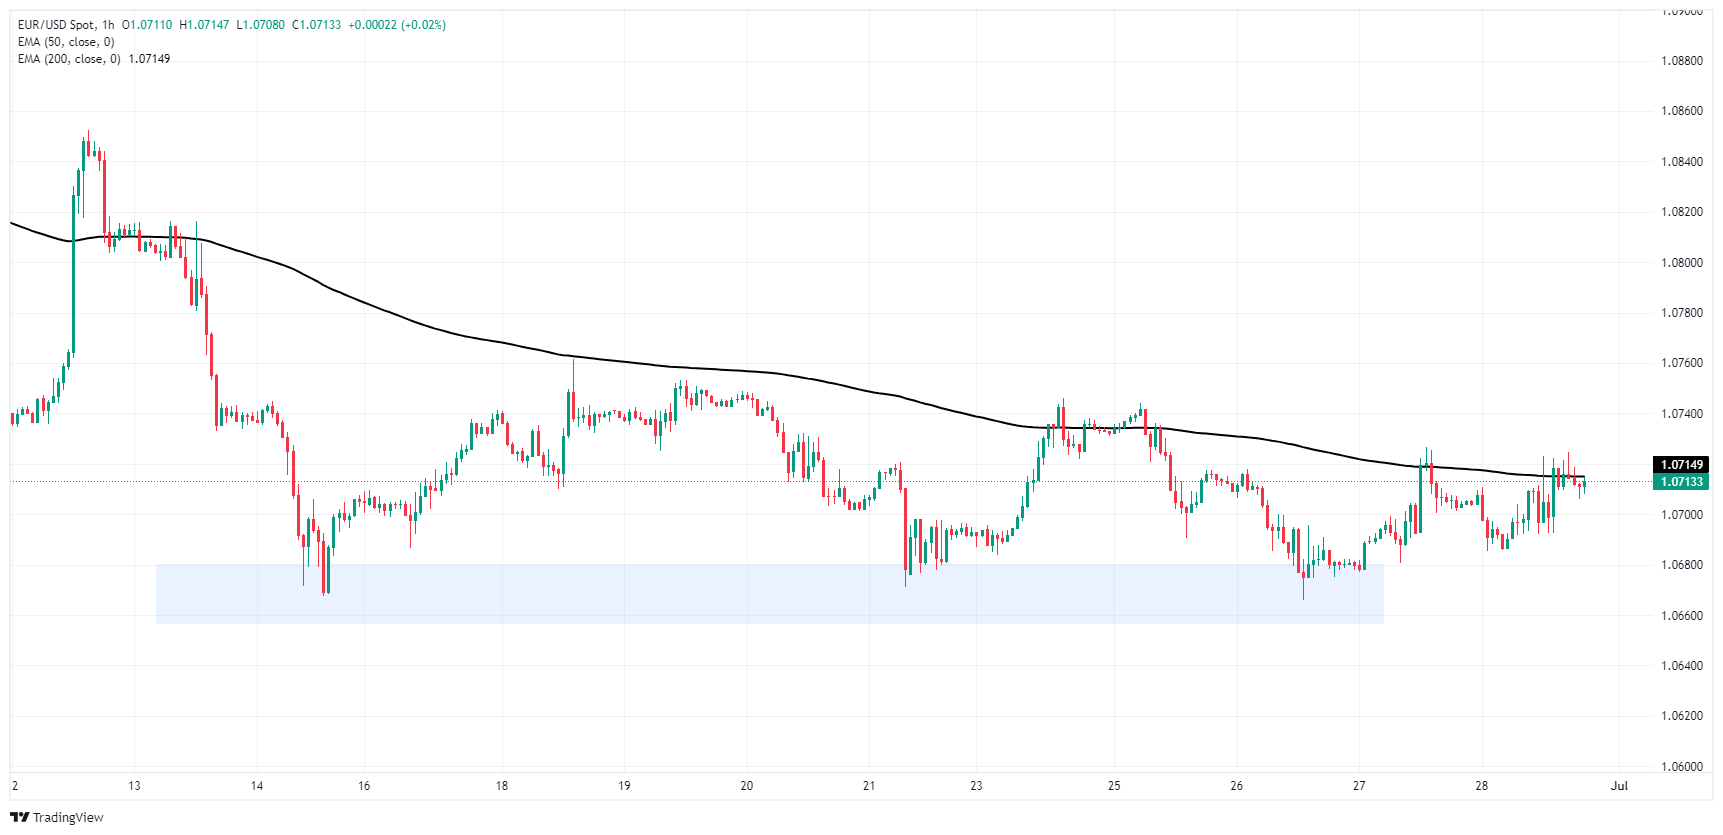
EUR/USD daily chart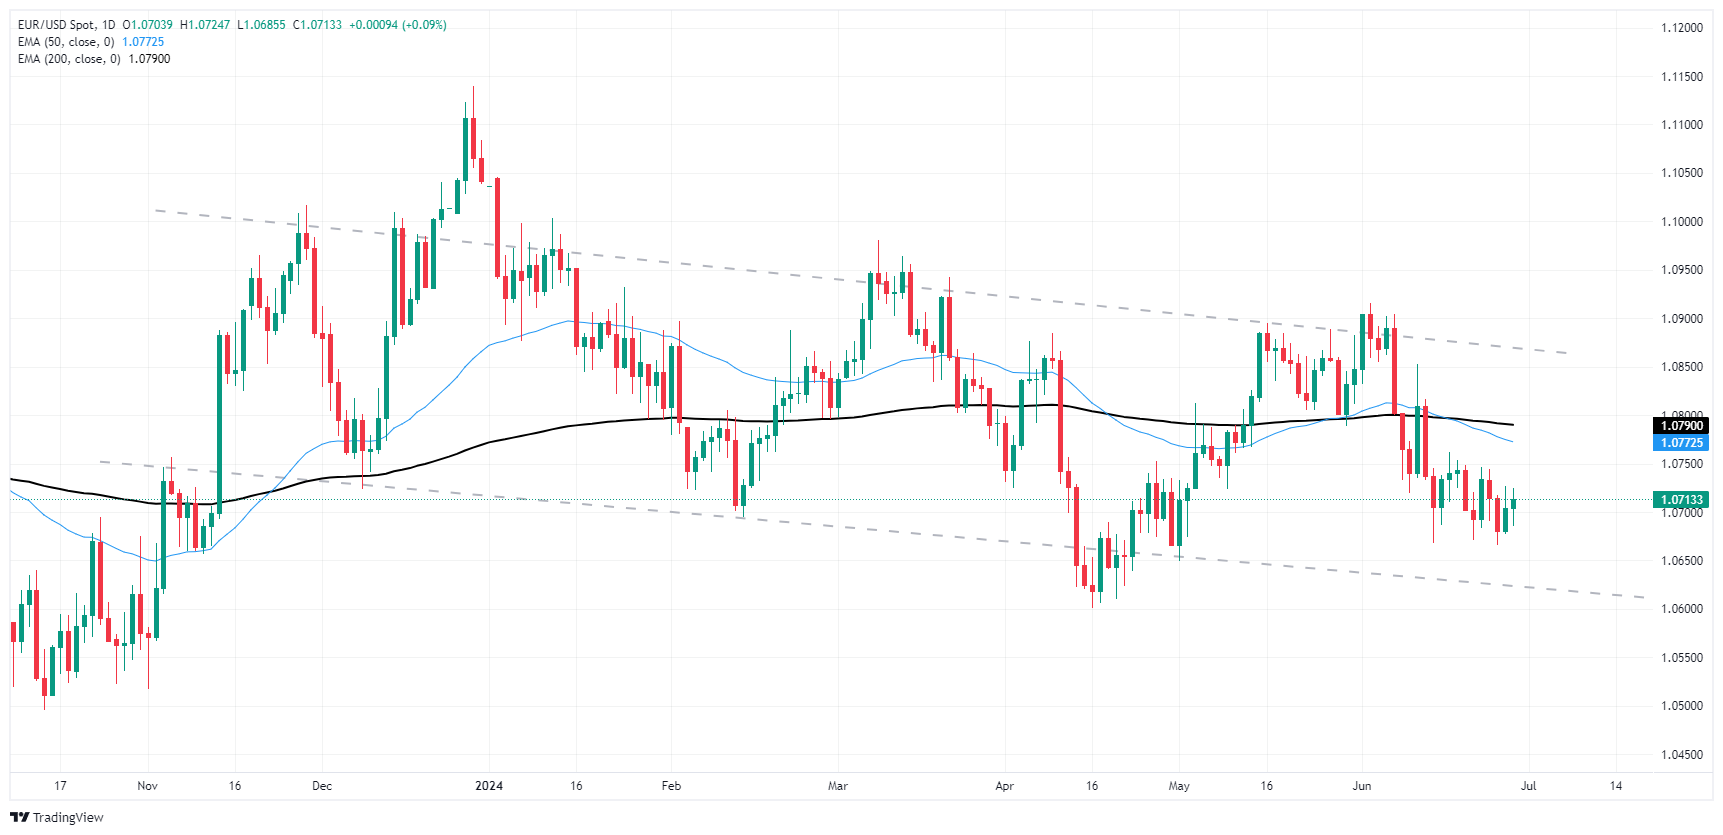
Euro FAQs
The Euro is the currency for the 20 European Union countries that belong to the Eurozone. It is the second most heavily traded currency in the world behind the US Dollar. In 2022, it accounted for 31% of all foreign exchange transactions, with an average daily turnover of over $2.2 trillion a day. EUR/USD is the most heavily traded currency pair in the world, accounting for an estimated 30% off all transactions, followed by EUR/JPY (4%), EUR/GBP (3%) and EUR/AUD (2%).
The European Central Bank (ECB) in Frankfurt, Germany, is the reserve bank for the Eurozone. The ECB sets interest rates and manages monetary policy. The ECB’s primary mandate is to maintain price stability, which means either controlling inflation or stimulating growth. Its primary tool is the raising or lowering of interest rates. Relatively high interest rates – or the expectation of higher rates – will usually benefit the Euro and vice versa. The ECB Governing Council makes monetary policy decisions at meetings held eight times a year. Decisions are made by heads of the Eurozone national banks and six permanent members, including the President of the ECB, Christine Lagarde.
Eurozone inflation data, measured by the Harmonized Index of Consumer Prices (HICP), is an important econometric for the Euro. If inflation rises more than expected, especially if above the ECB’s 2% target, it obliges the ECB to raise interest rates to bring it back under control. Relatively high interest rates compared to its counterparts will usually benefit the Euro, as it makes the region more attractive as a place for global investors to park their money.
Data releases gauge the health of the economy and can impact on the Euro. Indicators such as GDP, Manufacturing and Services PMIs, employment, and consumer sentiment surveys can all influence the direction of the single currency. A strong economy is good for the Euro. Not only does it attract more foreign investment but it may encourage the ECB to put up interest rates, which will directly strengthen the Euro. Otherwise, if economic data is weak, the Euro is likely to fall. Economic data for the four largest economies in the euro area (Germany, France, Italy and Spain) are especially significant, as they account for 75% of the Eurozone’s economy.
Another significant data release for the Euro is the Trade Balance. This indicator measures the difference between what a country earns from its exports and what it spends on imports over a given period. If a country produces highly sought after exports then its currency will gain in value purely from the extra demand created from foreign buyers seeking to purchase these goods. Therefore, a positive net Trade Balance strengthens a currency and vice versa for a negative balance.
- AUD/JPY extends its gains, reaching new highs past 107.00 on Friday.
- Indicators hint at possible downward correction due to overbought conditions.
On Friday, the AUD/JPY pair continued its uptrend, achieving new highs beyond 107.00, surpassing yet again its 2013 high levels.
On a daily scale, the Relative Strength Index (RSI) of the AUDJPY has spiked to 74 from 65 last Thursday. This sharp increase signals a strengthening bullish momentum but simultaneously places the pair in an overbought position, which might incite a downward correction. The Moving Average Convergence Divergence (MACD) shows a continuation of the rising green bars, indicating that the bullish momentum remains strong however an adjustment might be on the horizon due to overbought conditions.
AUD/JPY daily chart
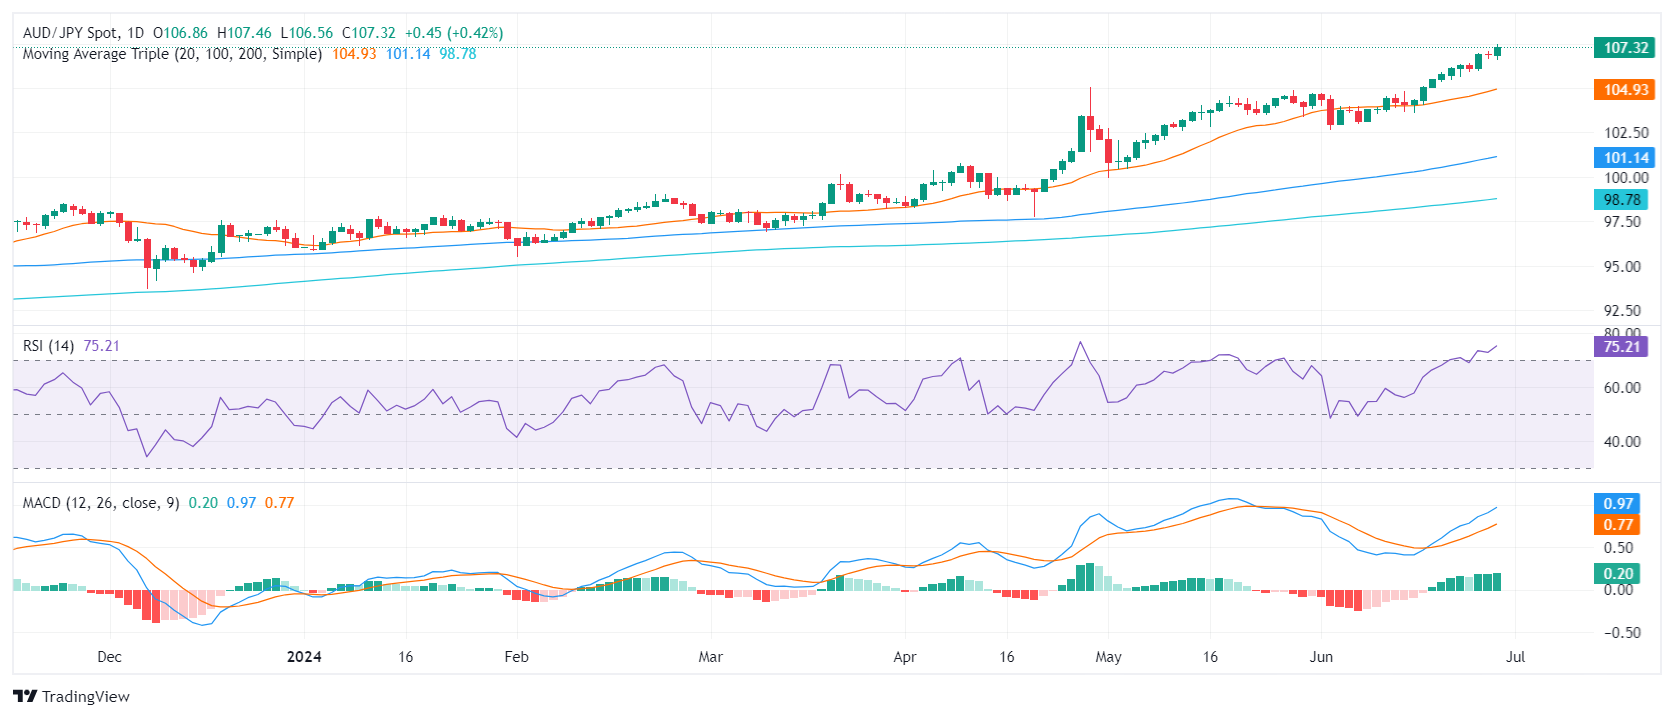
On the broader outlook, the AUD/JPY pair demonstrates persistent bullish trends, which is reinforced by its position above the 20-day, 100-day, and 200-day Simple Moving Averages (SMAs). However, traders should monitor the pair for potential corrections, given the more pronounced indicators for overbought conditions.
If the pair encounters a correction driving it below the 107.00 level, followed by the 106.00 level, it may find new support lines. Thus, the 104.90 (20-day SMA) level might serve as a potential support line. Meanwhile, buyers will explore uncharted territory should the pair persist in its current trend and surpass the 107.50 level.
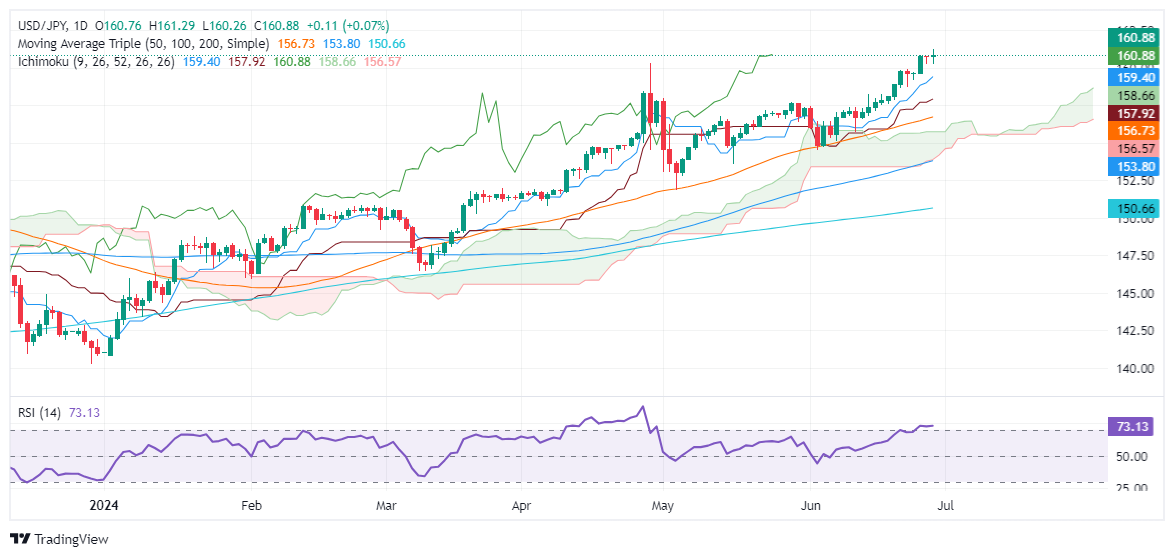
- USD/JPY climbs to 160.89, up 0.08%, buoyed by strong US data and rising Treasury yields.
- Technicals show buyer momentum; RSI overbought but not extreme.
- Resistance levels: 161.00, 162.00, 164.87 (Nov 1986 high), 178 (Apr 1986 high).
- Support found at 159.19 (Tenkan-Sen), 158.75 (June 24 low), 158.65 (Senkou Span A), 157.91 (Kijun-Sen).
The USD/JPY extended its gains on Friday and is set to end the week with more than 0.50% gains after US economic data spurred a jump in the US Treasury, despite increasing speculations that the US central bank could cut rates in 2024. The USD/JPY trades at 160.89, up 0.08%.
USD/JPY Price Analysis: Technical analysis
The USD/JPY uptrend remains intact, though traders are cautious after reclaiming the psychological 160.00 level, which is viewed as the first line of defense for Japanese authorities to intervene in the FX markets. Despite this, the pair has continued to advance steadily, increasing intervention risks.
Momentum favors buyers, even though the Relative Strength Index (RSI) is overbought. However, due to the strength of the uptrend, many technicians consider 80 as the threshold for "extreme" overextended conditions.
The USD/JPY first resistance levels would be the psychological marks of 161.00, 162.00, and so forth, leading up to the November 1986 high of 164.87. Beyond that, the next significant resistance is the April 1986 high of 178.
Conversely, if USD/JPY drops below 160.00, the first support would be the Tenkan-Sen at 159.19, followed by the June 24 low of 158.75. Once those levels are cleared, the next support is the Senkou Span A at 158.65, followed by the Kijun-Sen at 157.91.
USD/JPY Price Action – Daily Chart
Japanese Yen FAQs
The Japanese Yen (JPY) is one of the world’s most traded currencies. Its value is broadly determined by the performance of the Japanese economy, but more specifically by the Bank of Japan’s policy, the differential between Japanese and US bond yields, or risk sentiment among traders, among other factors.
One of the Bank of Japan’s mandates is currency control, so its moves are key for the Yen. The BoJ has directly intervened in currency markets sometimes, generally to lower the value of the Yen, although it refrains from doing it often due to political concerns of its main trading partners. The current BoJ ultra-loose monetary policy, based on massive stimulus to the economy, has caused the Yen to depreciate against its main currency peers. This process has exacerbated more recently due to an increasing policy divergence between the Bank of Japan and other main central banks, which have opted to increase interest rates sharply to fight decades-high levels of inflation.
The BoJ’s stance of sticking to ultra-loose monetary policy has led to a widening policy divergence with other central banks, particularly with the US Federal Reserve. This supports a widening of the differential between the 10-year US and Japanese bonds, which favors the US Dollar against the Japanese Yen.
The Japanese Yen is often seen as a safe-haven investment. This means that in times of market stress, investors are more likely to put their money in the Japanese currency due to its supposed reliability and stability. Turbulent times are likely to strengthen the Yen’s value against other currencies seen as more risky to invest in.
- WTI falls back below $81.00 as bullish momentum gets snipped.
- US Crude Oil initially rallied on Friday, but quickly tumbled into familiar levels.
- The EIA noted that US Crude Oil production hit fresh highs in April.
West Texas Intermediate (WTI) rallied into a fresh eight-week high on Friday as broad-market risk appetite stepped higher, but investor sentiment moderated during the US market session, dragging Crude Oil prices into a fresh low for the day. The Energy Information Administration (EIA) noted that despite a slight increase in overall fossil fuel demand, gasoline demand declined further and the US continues to see near-term highs in overall production output.
Ongoing market hopes for a summertime increase in general Crude Oil demand continue to run aground on a rocky reality as consumer demand for fossil fuels consistently undershoots market forecasts.
According to the EIA, an uptick in US Crude Oil and petroleum products rose to its highest level since December, but increases in US Crude Oil production, which also rose to December peaks at 13.25 million bpd in April, is more than enough to offset supply draws. The EIA also noted a general decline in consumer-level gasoline demand, which fell to 8.83 million bpd in April, the lowest figure since February.
WTI technical outlook
WTI US Crude Oil snapped into a fresh eight-week high of $82.31 on Friday before backsliding into downside chart territory for the trading week’s final session, wrapping up the week battling the $81.00 handle. Near-term chart churn has WTI roiling under firm downside pressure from a supply zone above $81.50 per barrel.
Despite frothy intraday price action, daily candlesticks remain trapped in near-term consolidation as WTI struggles to hold onto bullish territory north of the 200-day Exponential Moving Average (EMA) at $79.00.
WTI hourly chart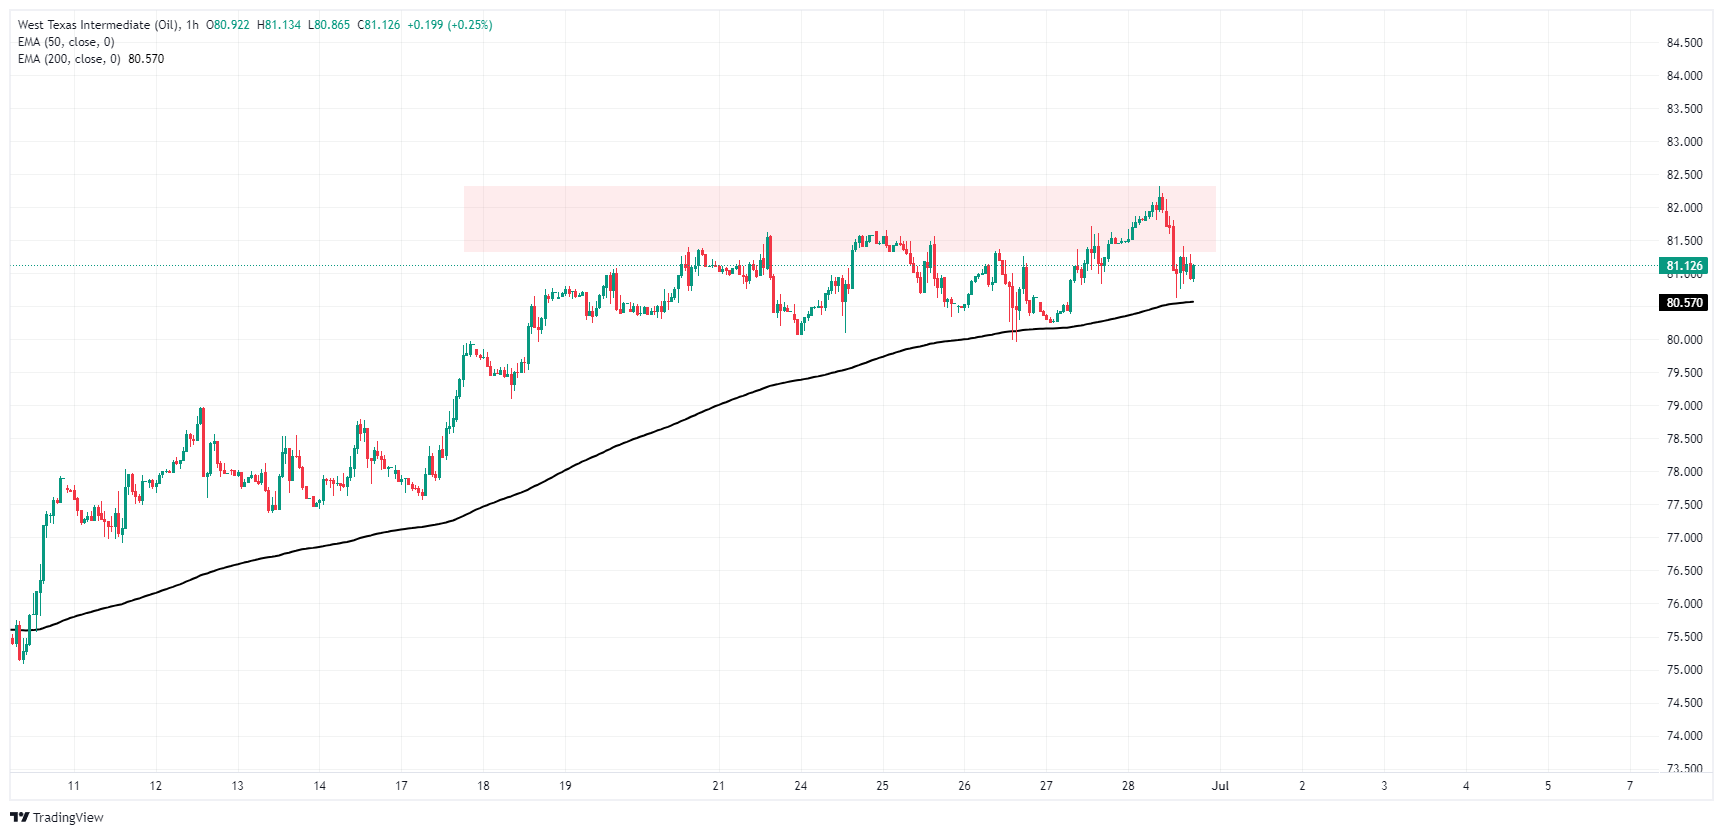
WTI daily chart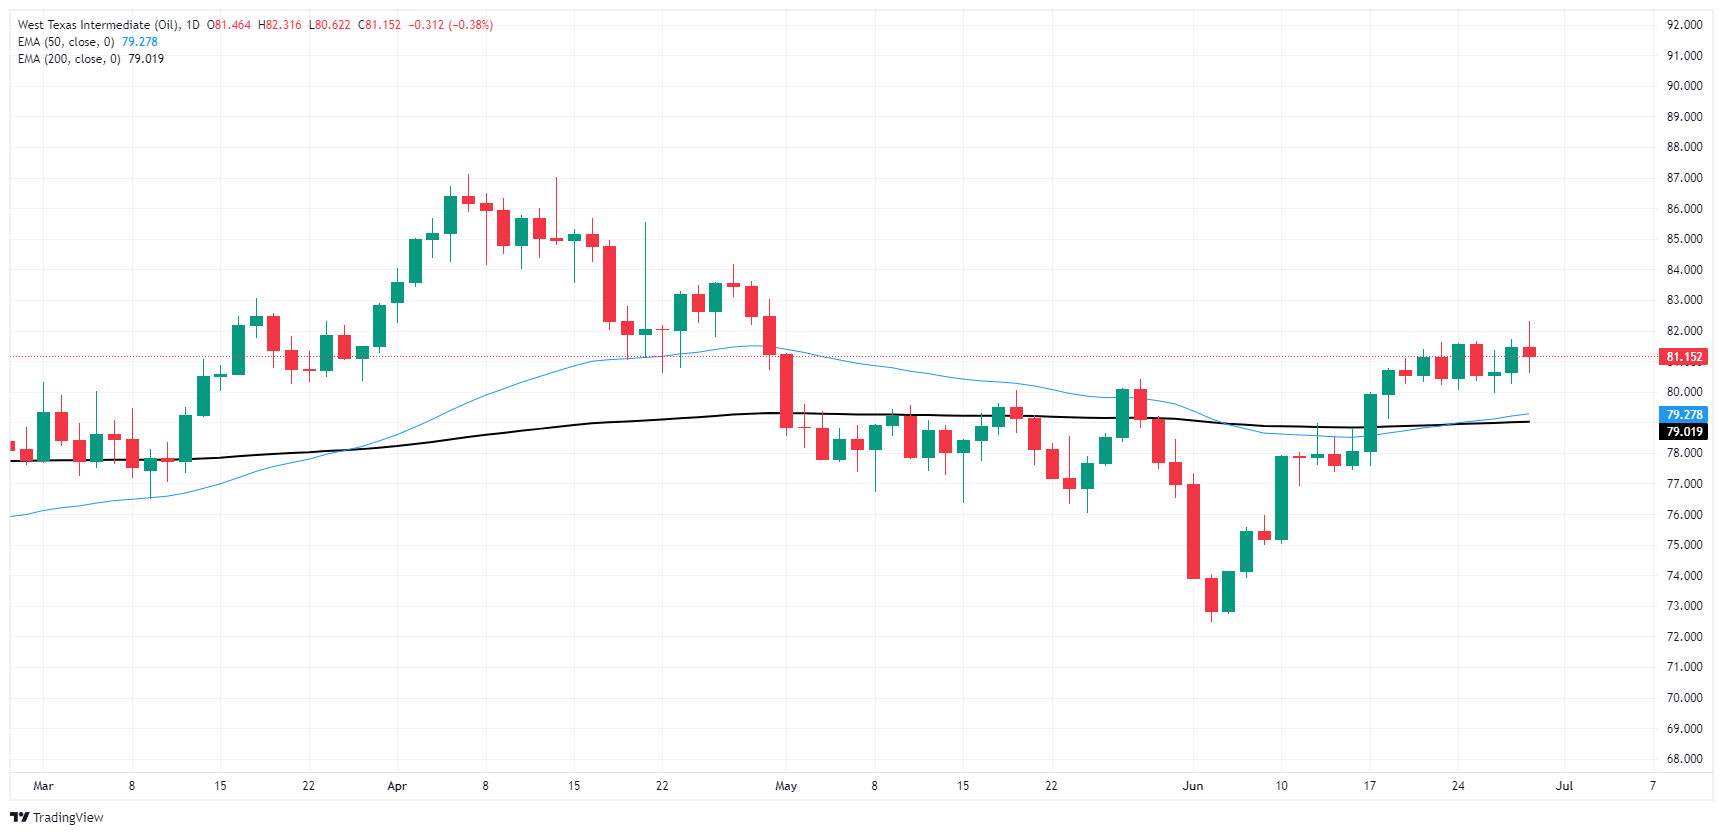
WTI Oil FAQs
WTI Oil is a type of Crude Oil sold on international markets. The WTI stands for West Texas Intermediate, one of three major types including Brent and Dubai Crude. WTI is also referred to as “light” and “sweet” because of its relatively low gravity and sulfur content respectively. It is considered a high quality Oil that is easily refined. It is sourced in the United States and distributed via the Cushing hub, which is considered “The Pipeline Crossroads of the World”. It is a benchmark for the Oil market and WTI price is frequently quoted in the media.
Like all assets, supply and demand are the key drivers of WTI Oil price. As such, global growth can be a driver of increased demand and vice versa for weak global growth. Political instability, wars, and sanctions can disrupt supply and impact prices. The decisions of OPEC, a group of major Oil-producing countries, is another key driver of price. The value of the US Dollar influences the price of WTI Crude Oil, since Oil is predominantly traded in US Dollars, thus a weaker US Dollar can make Oil more affordable and vice versa.
The weekly Oil inventory reports published by the American Petroleum Institute (API) and the Energy Information Agency (EIA) impact the price of WTI Oil. Changes in inventories reflect fluctuating supply and demand. If the data shows a drop in inventories it can indicate increased demand, pushing up Oil price. Higher inventories can reflect increased supply, pushing down prices. API’s report is published every Tuesday and EIA’s the day after. Their results are usually similar, falling within 1% of each other 75% of the time. The EIA data is considered more reliable, since it is a government agency.
OPEC (Organization of the Petroleum Exporting Countries) is a group of 13 Oil-producing nations who collectively decide production quotas for member countries at twice-yearly meetings. Their decisions often impact WTI Oil prices. When OPEC decides to lower quotas, it can tighten supply, pushing up Oil prices. When OPEC increases production, it has the opposite effect. OPEC+ refers to an expanded group that includes ten extra non-OPEC members, the most notable of which is Russia.
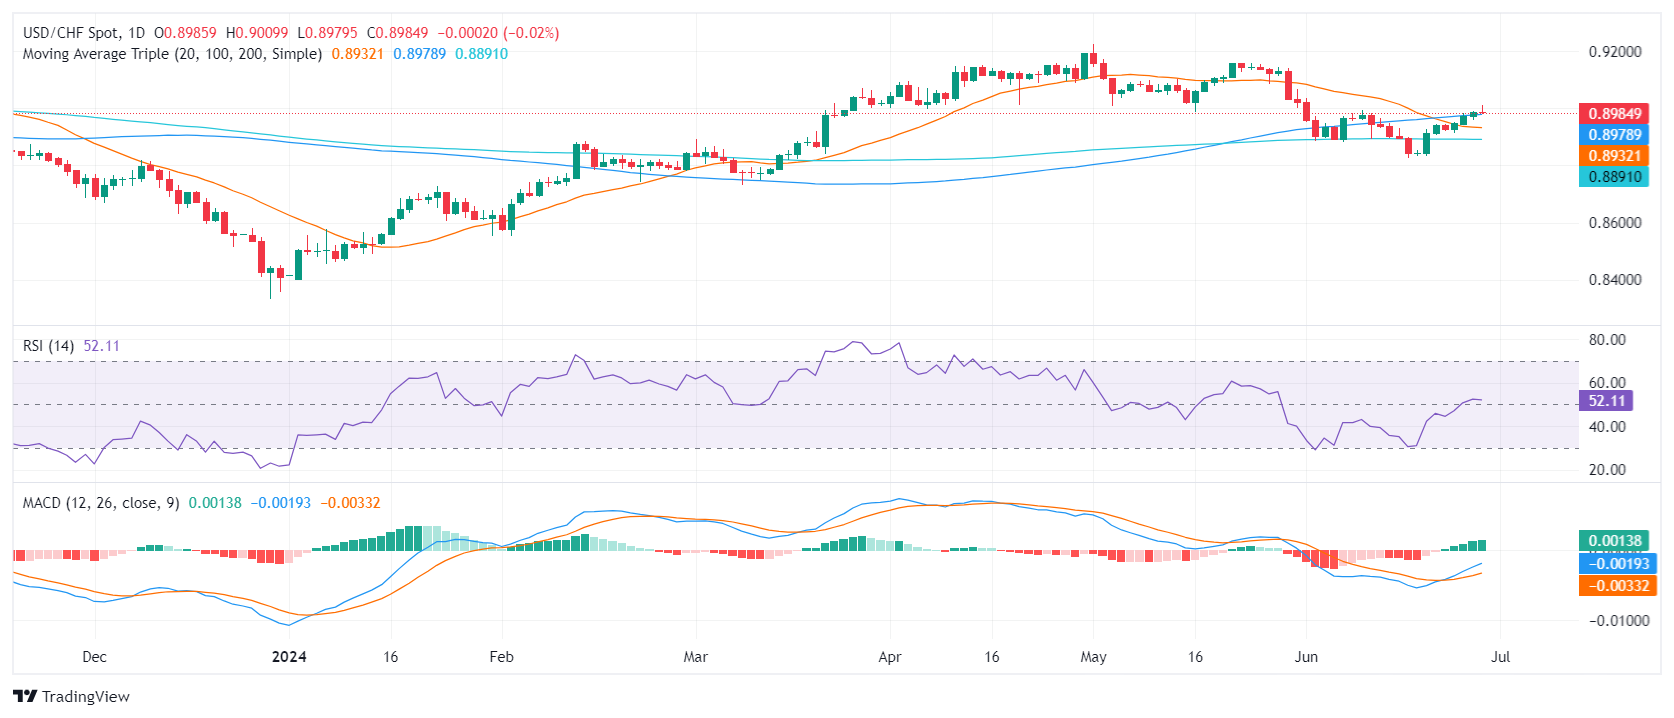
- The USD/CHF pair hits early June's highs but retreats back to 0.8990.
- USD bearishness comes in due to disappointing PCE data for May.
- The market odds for a September interest-rate cut by the Fed have slightly increased.
On Friday, the USD/CHF pair was unable to hold its momentum, depreciating due to soft Personal Consumption Expenditures (PCE) figures from May. Without any significant news or data coming from Switzerland, the pair has mainly been influenced by the US data as investors place their bets on the next Federal Reserve (Fed) movements.
The highlight of Friday was the disappointing PCE) data from the US in May. The PCE inflation edged lower on a yearly basis to 2.6% in May, in line with the market expectations, from 2.7% in April. On a monthly basis, the PCE Price Index remained unchanged in May. As a reaction, the soft data helped increase the probability of a September interest rate cut by the Fed to nearly 66%, according to the CME FedWatch tool.
However, Federal Reserve officials continue to caution about the possibility of an interest rate cut, with Bostic advising that he only sees one cut for this year in Q4, further adding that he has penciled in four cuts for 2025 but questions the reliability of projections so far in advance. As the Fed remains data dependent, eyes will flick to labor data from June for markets to acquire more guidance on the US economy.
The focus on the Swiss economic calendar continues to be minimal with attention being diverted towards Sunday's first round of the French legislative elections which may induce some movement in the eurozone currencies.
USD/CHF technical analysis
Looking at the technical outlook, the pair's positioning appears promising. The pair has solidified its position above the 20, 100, and 200-day Simple Moving Averages (SMA), lending a positive outlook to the future. Despite some bearish undercurrents, the pair have maintained a four-day winning streak and gained nearly 1.50% over the last seven sessions. The focus on the buyers should be maintaining the recently gained 100-day SMA at 0.8980.
USD/CHF daily chart
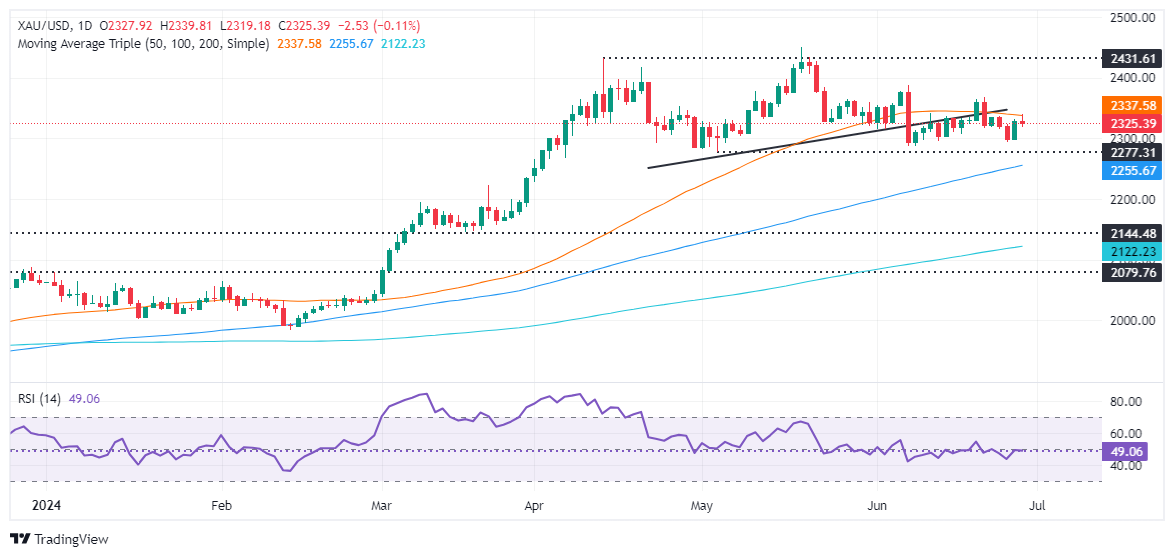
- Gold falls from daily highs, pressured by elevated US Treasury yields.
- May US PCE Index meets forecasts, fuels hope for 2024 Fed rate cuts.
- US 10-year yield hits 4.339%, a high since June 12; DXY at 105.80, down 0.08%.
Gold prices retreated during Friday’s session after an inflation report revealed progress in the disinflationary process and raised hopes that the Federal Reserve (Fed) would cut interest rates in 2024. Even though the golden metal jumped and hit a four-day high of $2,339, it retreated somewhat, with XAU/USD trading at $2,324, down 0.12%.
Bullion prices seesawed after the announcement of the US Personal Consumption Expenditures (PCE) Price Index report for May, which was aligned with estimates and painted an optimistic outlook for American consumers hit by higher prices.
Initially, XAU/USD climbed to a four-day high, but as traders digested the data, US Treasury yields climbed and Gold dropped.
The yield in the US 10-year Treasury note is advancing by five and a half basis points, up to 4.339%, the highest level since June 12. Despite this, the Greenback has failed to follow suit yet recovered from reaching daily lows, with the US Dollar Index (DXY) hovering at around 105.80, down 0.08%.
Other data showed that American consumer sentiment improved slightly compared to June’s preliminary reading, which trailed May’s report.
Some Fed officials crossed the newswires, adopting a cautious approach. Richmond’s Fed President Thomas Barkin didn’t provide any hints regarding cutting interest rates, yet commented that monetary policy shows signs of “lagging,” implying the economy eventually will slow down.
His colleague, San Francisco’s Mary Daly, stated that inflation is cooling, that monetary policy is working, and that inflation is expected to hit the Fed’s target by the end of 2025.
Daily digest market movers: Gold price advances, capitalizing on soft US Dollar
- US PCE for May was lower than April’s by 0.3%, coming in at 0% MoM, as expected. Core PCE increased by 0.1% MoM, matching estimates but below the previous reading of 0.3%.
- Fnal reading of US Consumer Sentiment for June was 68.2, down from May’s 69.1 but an improvement over the preliminary reading of 65.8. Inflation expectations remained steady at 3% for both the short and long term.
- According to CME FedWatch Tool, odds for 25-basis-point Fed rate cut in September are at 69%, up from 64% before US PCE release.
- December 2024 fed funds rate futures contract implies Fed will ease policy by just 35 basis points (bps) toward the end of the year.
Technical analysis: Gold price slumps after testing Head-and-Shoulders neckline
Gold remains on the defensive after a Head-and-Shoulders chart pattern emerges, which hints bullion might edge lower. Momentum shows that neither buyers nor sellers are in control, but the Relative Strength Index (RSI) remains tilted bearish.
If XAU/USD drops below $2,300, the next stop would be the May 3 low of $2,277, followed by the March 21 high of $2,222. Further losses lie underneath, with sellers eyeing the Head-and-Shoulders chart pattern objective from $2,170 to $2,160.
Conversely, if Gold reclaims $2,350, that will expose additional key resistance levels like the June 7 cycle high of $2,387, ahead of challenging the $2,400 figure.
Gold FAQs
Gold has played a key role in human’s history as it has been widely used as a store of value and medium of exchange. Currently, apart from its shine and usage for jewelry, the precious metal is widely seen as a safe-haven asset, meaning that it is considered a good investment during turbulent times. Gold is also widely seen as a hedge against inflation and against depreciating currencies as it doesn’t rely on any specific issuer or government.
Central banks are the biggest Gold holders. In their aim to support their currencies in turbulent times, central banks tend to diversify their reserves and buy Gold to improve the perceived strength of the economy and the currency. High Gold reserves can be a source of trust for a country’s solvency. Central banks added 1,136 tonnes of Gold worth around $70 billion to their reserves in 2022, according to data from the World Gold Council. This is the highest yearly purchase since records began. Central banks from emerging economies such as China, India and Turkey are quickly increasing their Gold reserves.
Gold has an inverse correlation with the US Dollar and US Treasuries, which are both major reserve and safe-haven assets. When the Dollar depreciates, Gold tends to rise, enabling investors and central banks to diversify their assets in turbulent times. Gold is also inversely correlated with risk assets. A rally in the stock market tends to weaken Gold price, while sell-offs in riskier markets tend to favor the precious metal.
The price can move due to a wide range of factors. Geopolitical instability or fears of a deep recession can quickly make Gold price escalate due to its safe-haven status. As a yield-less asset, Gold tends to rise with lower interest rates, while higher cost of money usually weighs down on the yellow metal. Still, most moves depend on how the US Dollar (USD) behaves as the asset is priced in dollars (XAU/USD). A strong Dollar tends to keep the price of Gold controlled, whereas a weaker Dollar is likely to push Gold prices up.
- Dow Jones continues to churn near 39,000.00 as markets await signs of rate cuts.
- US PCE Price Index inflation came in as-expected, easing slightly.
- Despite easing key inflation indicators, figures still remain too high for Fed.
The Dow Jones Industrial Average (DJIA) briefly rallied to 39,440.00 early Friday after US Personal Consumption Expenditure Price Index (PCE) inflation figures printed as markets broadly expected. However, risk appetite settled quickly, and equities slumped back to the day’s opening bids as investors found little has actually changed in the outlook for timing rate cuts from the Federal Reserve (Fed).
Core PCE Price Index inflation ticked down to 2.6% YoY in May, meeting median forecasts and cooling slightly from the previous 2.8%. However, figures still remain well above the Fed’s 2% annual inflation target, and the plodding progress in cooling inflation is unlikely to light a fire underneath the US central bank to begin cutting rates sooner rather than later.
According to the CME’s FedWatch Tool, rate markets are now pricing in 66% odds of at least a quarter-point rate cut from the Federal Open Market Committee (FOMC) on September 18, up slightly from the 60% odds that were priced in before the PCE Price Index inflation print.
US Personal Income rose to 0.5% MoM in May, beating the forecast increase to 0.4% from the previous 0.3%. However, Personal Spending only rose 0.2% versus the forecast 0.3%, and the previous figure saw a slight revision to 0.1% from 0.2%.
The University of Michigan (UoM) Consumer Sentiment Survey rebounded firmly to 68.2, vaulting over the forecast uptick to 65.8 from the previous 65.6. UoM 5-year Consumer Inflation Expectations also ticked lower, down to 3.0% from the previous 3.1%. Despite a slight easing in where consumers expect inflation to be in the next five years, the figure still remains higher than Fed targets.
Consumer price growth expectations continue to hold on the high end, plagued by recent memory of “transitory” inflation pressures that lasted for at least six consecutive quarters. Consumers also remain keenly aware that core inflation figures continue to ride at three-decade highs compared to the long-run average.
Dow Jones news
The Dow Jones was roughly on-balance on Friday, with about half of the index’s constituent securities in the green, though sharp losses in key stocks are dragging the index lower on the day. Salesforce Inc. (CRM) recovered from a jittery bearish pullback heading into the company’s private shareholder meeting this week. The stock is trading up 2.5% on Friday, testing $260.00 per share.
Nike Inc. (NKE) was battered badly on Friday, facing steep enough losses to drag the Dow Jones lower single-handedly. Nike revealed updated forward guidance on Friday, and the company now expects a 10% decline in revenues in the first quarter of 2025 in a reversal of previous guidance that anticipated steady growth in 2025. NKE is down over 20% on the day, trading into a multi-year low of $75.00 per share.
Dow Jones technical outlook
Despite finding a fresh high for the week on Friday, the Dow Jones continues to trade into median levels just north of the 39,000.00 handle. Intraday price action has been slowly drifting higher through the week. Still, volatility has left the index in a notably wobbly stance, and bullish runs tend to be followed immediately by short side slumps.
The Dow Jones is still trading above technical support from the 50-day Exponential Moving Average (EMA) at 38,895.76, but price action continues to middle on the low side of recent all-time highs set above the 40,000.00 major price handle.
Dow Jones five minute chart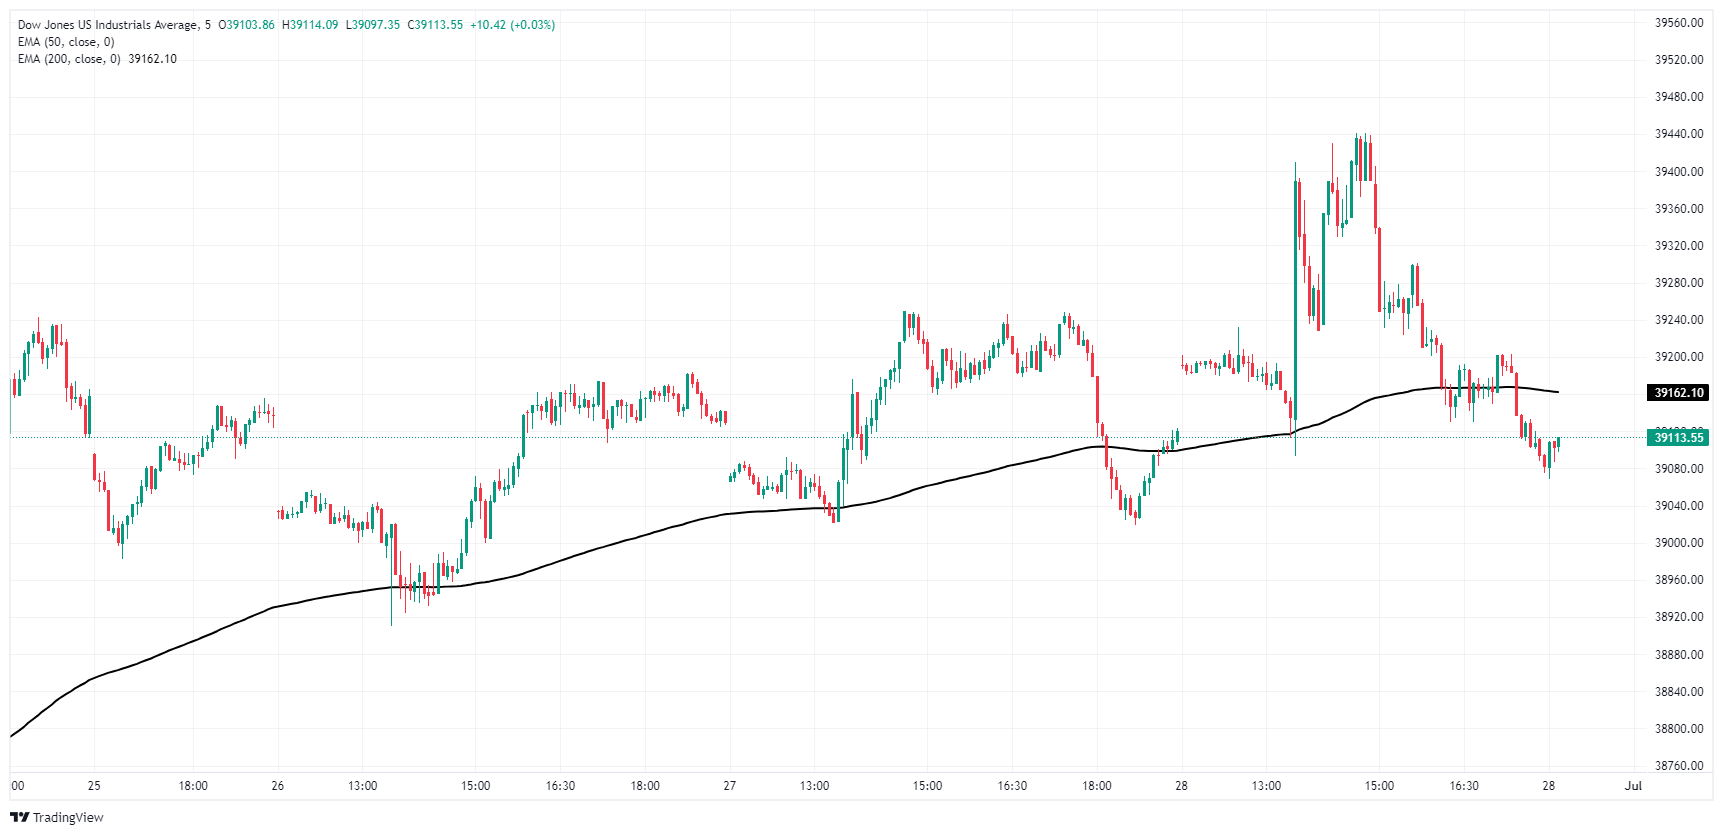
Dow Jones daily chart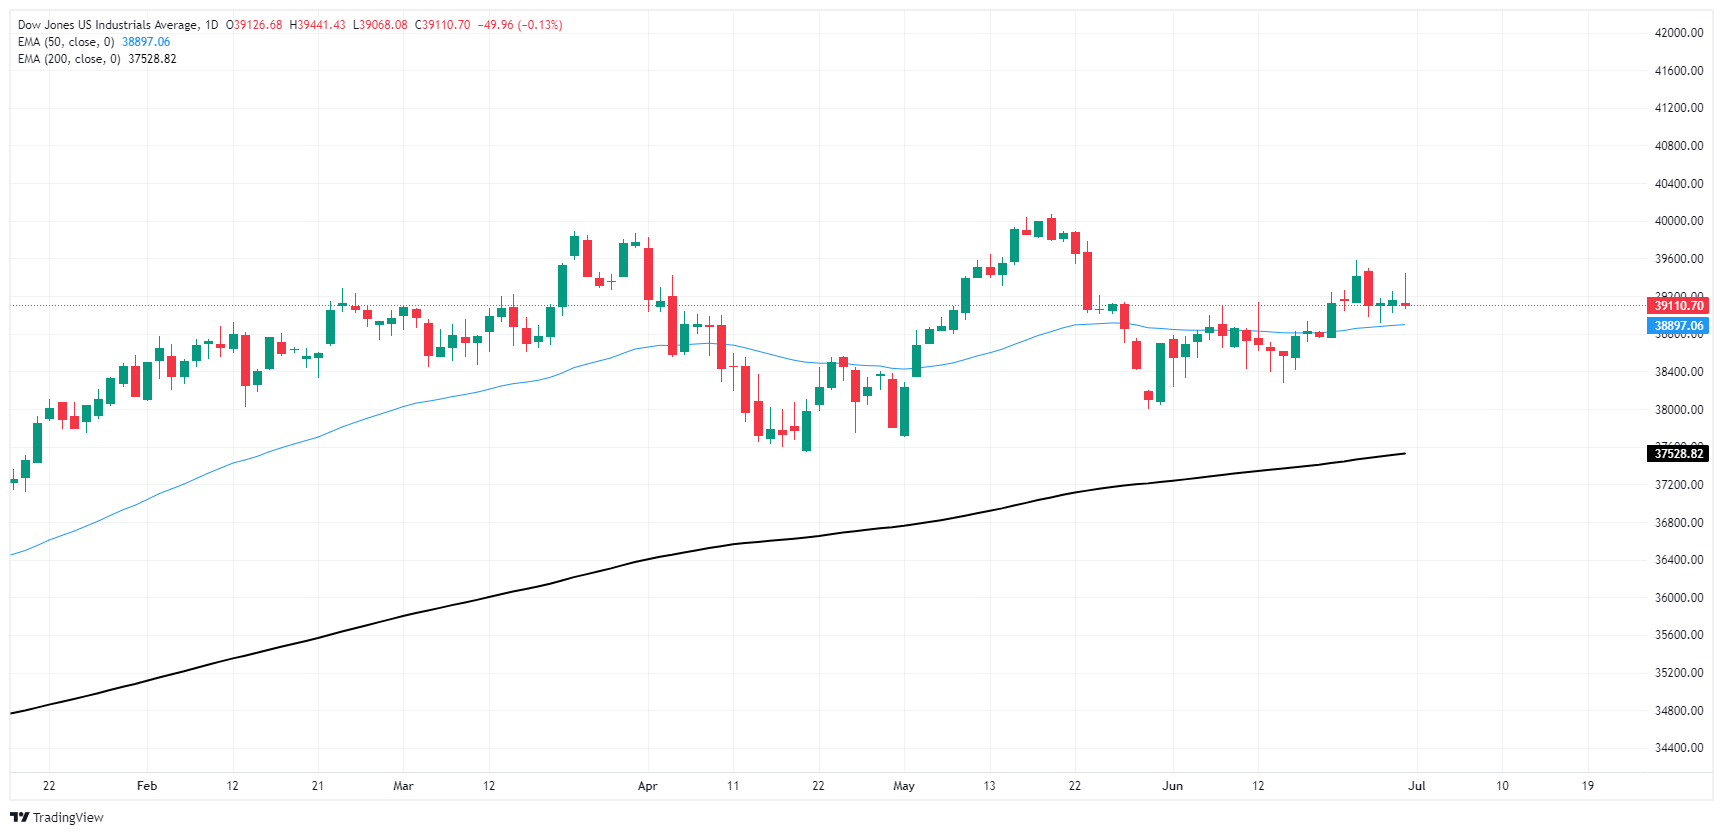
Dow Jones FAQs
The Dow Jones Industrial Average, one of the oldest stock market indices in the world, is compiled of the 30 most traded stocks in the US. The index is price-weighted rather than weighted by capitalization. It is calculated by summing the prices of the constituent stocks and dividing them by a factor, currently 0.152. The index was founded by Charles Dow, who also founded the Wall Street Journal. In later years it has been criticized for not being broadly representative enough because it only tracks 30 conglomerates, unlike broader indices such as the S&P 500.
Many different factors drive the Dow Jones Industrial Average (DJIA). The aggregate performance of the component companies revealed in quarterly company earnings reports is the main one. US and global macroeconomic data also contributes as it impacts on investor sentiment. The level of interest rates, set by the Federal Reserve (Fed), also influences the DJIA as it affects the cost of credit, on which many corporations are heavily reliant. Therefore, inflation can be a major driver as well as other metrics which impact the Fed decisions.
Dow Theory is a method for identifying the primary trend of the stock market developed by Charles Dow. A key step is to compare the direction of the Dow Jones Industrial Average (DJIA) and the Dow Jones Transportation Average (DJTA) and only follow trends where both are moving in the same direction. Volume is a confirmatory criteria. The theory uses elements of peak and trough analysis. Dow’s theory posits three trend phases: accumulation, when smart money starts buying or selling; public participation, when the wider public joins in; and distribution, when the smart money exits.
There are a number of ways to trade the DJIA. One is to use ETFs which allow investors to trade the DJIA as a single security, rather than having to buy shares in all 30 constituent companies. A leading example is the SPDR Dow Jones Industrial Average ETF (DIA). DJIA futures contracts enable traders to speculate on the future value of the index and Options provide the right, but not the obligation, to buy or sell the index at a predetermined price in the future. Mutual funds enable investors to buy a share of a diversified portfolio of DJIA stocks thus providing exposure to the overall index.
- AUD rose against USD due to US inflation reduction and a potential dovish stance from the Fed.
- Soft PCE data from the US may benefit the Aussie policy divergence between the RBA and Fed.
- RBA's delayed rate cuts could bolster the Aussie, contrasting with other G10 central banks' reduction strategies.
Friday's session recorded a significant uplift in the Australian Dollar (AUD) against the US Dollar following an unexpected inflation reduction in the US in May. As a result, expectations of a possibly dovish stance from the Federal Reserve (Fed) grew, leading to a likely divergence in policy with the Reserve Bank of Australia (RBA).
The Australian economy demonstrates minor signs of weakness. However, the heightened inflation rates maintain a stubborn resilience, preventing the RBA from implementing potential rate cuts. The RBA is foreseen delaying rate cuts, making it one of the last G10 country central banks to adopt a reduction policy. These delayed cuts might enhance the further strengthening of the Aussie.
Daily digest market movers: Aussie continues to strengthen amid robust CPI figures
- In terms of the data at hand, the Australian Dollar's strength was bolstered by increased expectations of the RBA further hiking rates after hot Consumer Price Index (CPI) data reported earlier in the week.
- Market indications are now pricing in approximately 40% odds of a 25-basis-point rate hike from RBA on September 24, extending to 50% leading up to November 5.
- US inflation fell to 2.6% YoY in May from 2.7% in April, according to the US Bureau of Economic Analysis. This decrease matched market expectations.
- On a monthly basis, the Personal Consumption Expenditures (PCE) Price Index remained static. The core PCE Price Index rose by 2.6%, a decrease from the 2.8% escalation that was recorded in April.
- As a result, this downtrend toward the Fed’s 2.0% target bumped the probability of a Fed interest rate cut in September to 66%, up from 64% prior to the PCE release, as per the CME FedWatch Tool.
Technical analysis: AUD/USD maintains buyer interest above 20-day SMA
From a technical outlook, the indicators displayed signs of recovery with the Relative Strength Index (RSI) staying above 50, and the Moving Average Convergence Divergence (MACD) printing a fresh green bar. Critical to the future momentum of the pair will be the defense of the 20-day Simple Moving Average (SMA) at 0.6640. As long as buyers manage to sustain above this key level, the future outlook appears promising.
Notably, on Friday, the pair managed to lift back above the 20-day SMA, after dipping to a low of 0.6620, a key indication that buyer defenses remain robust.
Australian Dollar FAQs
One of the most significant factors for the Australian Dollar (AUD) is the level of interest rates set by the Reserve Bank of Australia (RBA). Because Australia is a resource-rich country another key driver is the price of its biggest export, Iron Ore. The health of the Chinese economy, its largest trading partner, is a factor, as well as inflation in Australia, its growth rate and Trade Balance. Market sentiment – whether investors are taking on more risky assets (risk-on) or seeking safe-havens (risk-off) – is also a factor, with risk-on positive for AUD.
The Reserve Bank of Australia (RBA) influences the Australian Dollar (AUD) by setting the level of interest rates that Australian banks can lend to each other. This influences the level of interest rates in the economy as a whole. The main goal of the RBA is to maintain a stable inflation rate of 2-3% by adjusting interest rates up or down. Relatively high interest rates compared to other major central banks support the AUD, and the opposite for relatively low. The RBA can also use quantitative easing and tightening to influence credit conditions, with the former AUD-negative and the latter AUD-positive.
China is Australia’s largest trading partner so the health of the Chinese economy is a major influence on the value of the Australian Dollar (AUD). When the Chinese economy is doing well it purchases more raw materials, goods and services from Australia, lifting demand for the AUD, and pushing up its value. The opposite is the case when the Chinese economy is not growing as fast as expected. Positive or negative surprises in Chinese growth data, therefore, often have a direct impact on the Australian Dollar and its pairs.
Iron Ore is Australia’s largest export, accounting for $118 billion a year according to data from 2021, with China as its primary destination. The price of Iron Ore, therefore, can be a driver of the Australian Dollar. Generally, if the price of Iron Ore rises, AUD also goes up, as aggregate demand for the currency increases. The opposite is the case if the price of Iron Ore falls. Higher Iron Ore prices also tend to result in a greater likelihood of a positive Trade Balance for Australia, which is also positive of the AUD.
The Trade Balance, which is the difference between what a country earns from its exports versus what it pays for its imports, is another factor that can influence the value of the Australian Dollar. If Australia produces highly sought after exports, then its currency will gain in value purely from the surplus demand created from foreign buyers seeking to purchase its exports versus what it spends to purchase imports. Therefore, a positive net Trade Balance strengthens the AUD, with the opposite effect if the Trade Balance is negative.
- Mexican Peso rebounds to 18.24 vs. US Dollar following Banxico's decision to maintain 11.00% rate.
- Decision aligned with recent inflation data, targeting 3% inflation by Q4 2025.
- Inflation risks heightened by service sector, cost pressures, Peso fall and geopolitical tensions.
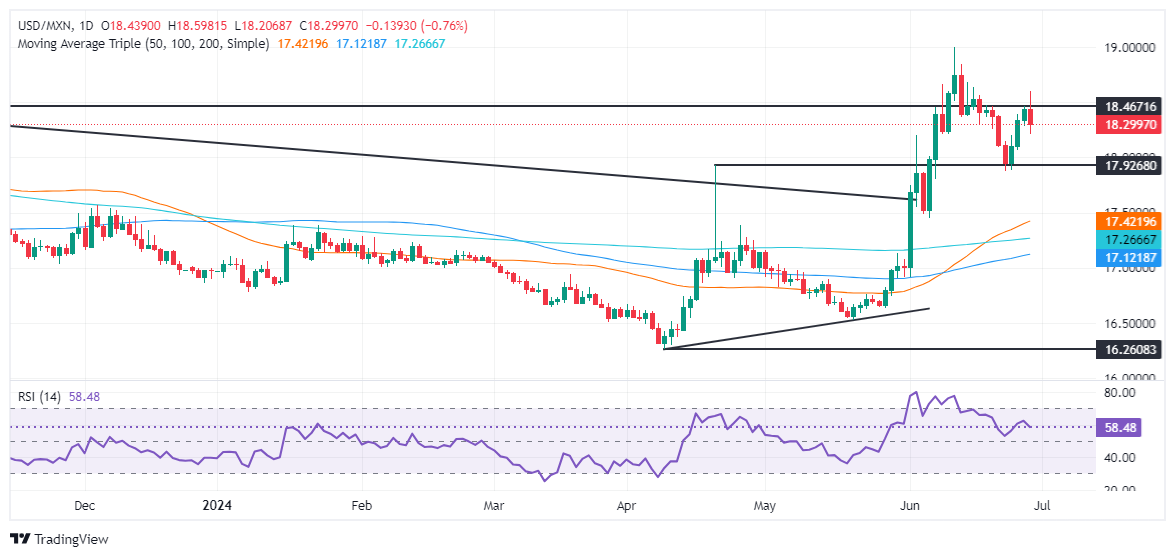
The Mexican Peso recovered ground against the US Dollar and rallied more than 1% on Friday after the Bank of Mexico (Banxico) decided to keep rates unchanged due to “idiosyncratic factors” and the Peso’s depreciation following the June 2 general election results. The USD/MXN trades at 18.24 after hitting a daily high of 18.59.
Banxico left a lifeline to the battered Peso on Thursday, holding rates at 11.00% after inflation reaccelerated, according to June’s mid-month inflation data.
The Mexican institution expects headline inflation to converge to the bank’s 3% target by Q4 2025 and acknowledged that inflation risks are skewed to the upside due to high services inflation, cost pressures, Mexican Peso depreciation and geopolitical conflicts.
Across the border, the US Federal Reserve’s (Fed) preferred inflation gauge came as expected by the consensus, showing an improvement in headline and core Personal Consumption Expenditures (PCE) Price Index.
The data failed to underpin the Greenback, which remains pressured, losing some 0.16% as revealed by the US Dollar Index (DXY). Therefore, the USD/MXN might continue on the back foot toward the remainder of the day as sellers eye an April 19 high of 18.15.
Daily digest market movers: Mexican Peso strengthens after Banxico hold
- Banxico’s decision was not unanimous and was perceived as dovish as Deputy Governor Omar Mejia Castelazo opted for a quarter of a percentage rate cut.
- Mexico’s central bank monetary policy statement highlighted the Governing Board expects the disinflation process to evolve and added that “Looking ahead, the board foresees that the inflationary environment may allow for discussing reference-rate adjustments.”
- A Citibanamex survey showed economists priced out fewer rate cuts by the central bank. They also revised the Gross Domestic Product (GDP) for 2024 downward from 2.2% to 2.1% YoY and expect the USD/MXN exchange rate to finish the year at 18.70, up from 18.00 previously reported.
- US PCE was lower than April’s 0.3% and was 0% MoM as expected. Core PCE expanded by 0.1% MoM as estimated, which is also beneath the previous reading of 0.3%.
- US Consumer Sentiment final reading for June of 68.2 deteriorated compared to May’s 69.1, yet improved as the preliminary reading was 65.8. Inflation expectations remained steady in the short and long periods at 3%.
- CME FedWatch Tool shows odds for a 25-basis-point Fed rate cut at 59.5%, unchanged from the previous day.
Technical analysis: Mexican Peso climbs as USD/MXN tumbles below 18.30
The USD/MXN is undergoing a pullback after hitting a daily high of 18.59 earlier in the day, opening the door to challenging key support levels. From a momentum standpoint, sellers are gathering some steam. This is depicted by the Relative Strength Index (RSI) pointing downward though still remaining bullish, suggesting the pullback could be short-lived.
For a bearish continuation, sellers need to reclaim the April 19 high turned support at 18.15, which would pave the way toward 18.00. The next support would be the 50-day Simple Moving Average (SMA) at 17.37 before testing the 200-day SMA at 17.23.
On the other hand, if buyers achieve a decisive break above the psychological 18.50 level, the next stop would be the year-to-date (YTD) high of 18.99, followed by the March 20, 2023, high of 19.23.
Mexican Peso FAQs
The Mexican Peso (MXN) is the most traded currency among its Latin American peers. Its value is broadly determined by the performance of the Mexican economy, the country’s central bank’s policy, the amount of foreign investment in the country and even the levels of remittances sent by Mexicans who live abroad, particularly in the United States. Geopolitical trends can also move MXN: for example, the process of nearshoring – or the decision by some firms to relocate manufacturing capacity and supply chains closer to their home countries – is also seen as a catalyst for the Mexican currency as the country is considered a key manufacturing hub in the American continent. Another catalyst for MXN is Oil prices as Mexico is a key exporter of the commodity.
The main objective of Mexico’s central bank, also known as Banxico, is to maintain inflation at low and stable levels (at or close to its target of 3%, the midpoint in a tolerance band of between 2% and 4%). To this end, the bank sets an appropriate level of interest rates. When inflation is too high, Banxico will attempt to tame it by raising interest rates, making it more expensive for households and businesses to borrow money, thus cooling demand and the overall economy. Higher interest rates are generally positive for the Mexican Peso (MXN) as they lead to higher yields, making the country a more attractive place for investors. On the contrary, lower interest rates tend to weaken MXN.
Macroeconomic data releases are key to assess the state of the economy and can have an impact on the Mexican Peso (MXN) valuation. A strong Mexican economy, based on high economic growth, low unemployment and high confidence is good for MXN. Not only does it attract more foreign investment but it may encourage the Bank of Mexico (Banxico) to increase interest rates, particularly if this strength comes together with elevated inflation. However, if economic data is weak, MXN is likely to depreciate.
As an emerging-market currency, the Mexican Peso (MXN) tends to strive during risk-on periods, or when investors perceive that broader market risks are low and thus are eager to engage with investments that carry a higher risk. Conversely, MXN tends to weaken at times of market turbulence or economic uncertainty as investors tend to sell higher-risk assets and flee to the more-stable safe havens.
- Canadian Dollar bolstered by rising market sentiment.
- Canada posted a 0.3% uptick in GDP, propping up CAD.
- US PCE inflation also ticked lower, further bolstering rate cut hopes.
The Canadian Dollar (CAD) found some room on the high side on Friday, pushing up by a scant tenth of a percent against the US Dollar amid choppy intraday price action after key economic data broadly met market expectations. Canadian Gross Domestic Product (GDP) ticked higher and US Personal Consumption Expenditure Price Index (PCE) inflation figures cooled slightly.
Canada posted a slight gain in GDP growth in April, rebounding from the previous month’s flat print. A stacked US data docket also generally met market expectations, though US Personal Spending failed to meet expectations despite a post-revision improvement.
Daily digest market movers: Canadian GDP rebounds, US inflation continues to ease for now
- Canadian MoM GDP posted a 0.3% increase in April, meeting market expectations and recovering from the previous month’s 0.0%.
- US PCE Price Index inflation also eased to 2.6% YoY in May, meeting market forecasts and cooling from the previous 2.8%.
- Market bets of a September rate cut from the Federal Reserve (Fed) have ticked higher post-PCE. According to the CME’s FedWatch Tool, rate markets are pricing in 66% odds of at least a quarter-point rate trim from the Fed on September 18, up from a flat 60% pre-PCE inflation.
- University of Michigan (UoM) 5-year Consumer Inflation Expectations also ticked down to 3.0% in June, down from previous 3.1%.
- UoM Consumer Sentiment Index for June also surged to 68.2 from 65.6, vaulting over median market forecasts of 65.8.
Canadian Dollar PRICE Today
The table below shows the percentage change of Canadian Dollar (CAD) against listed major currencies today. Canadian Dollar was the strongest against the Japanese Yen.
| USD | EUR | GBP | JPY | CAD | AUD | NZD | CHF | |
|---|---|---|---|---|---|---|---|---|
| USD | -0.15% | -0.02% | 0.03% | -0.14% | -0.41% | -0.20% | -0.01% | |
| EUR | 0.15% | 0.12% | 0.17% | 0.00% | -0.27% | -0.06% | 0.13% | |
| GBP | 0.02% | -0.12% | 0.02% | -0.13% | -0.39% | -0.18% | -0.02% | |
| JPY | -0.03% | -0.17% | -0.02% | -0.19% | -0.44% | -0.24% | -0.05% | |
| CAD | 0.14% | -0.01% | 0.13% | 0.19% | -0.28% | -0.06% | 0.10% | |
| AUD | 0.41% | 0.27% | 0.39% | 0.44% | 0.28% | 0.21% | 0.38% | |
| NZD | 0.20% | 0.06% | 0.18% | 0.24% | 0.06% | -0.21% | 0.16% | |
| CHF | 0.01% | -0.13% | 0.02% | 0.05% | -0.10% | -0.38% | -0.16% |
The heat map shows percentage changes of major currencies against each other. The base currency is picked from the left column, while the quote currency is picked from the top row. For example, if you pick the Canadian Dollar from the left column and move along the horizontal line to the US Dollar, the percentage change displayed in the box will represent CAD (base)/USD (quote).
Technical analysis: Canadian Dollar recovers ground on Friday, sends USD/CAD into familiar levels
The Canadian Dollar found a bid on Friday, gaining ground against the majority of its major currency peers as markets get set to wrap up a relatively sedate trading week. The CAD gained around one-tenth of one percent against the US Dollar on Friday and climbed nearly one-quarter of one percent against the broadly-battered Japanese Yen.
USD/CAD briefly found a fresh high for the week near 1.3735 early Friday before settling back into familiar near-term lows near 1.3675. CAD strength has briefly halted a recent upswing in the pair on a Greenback bid, sending USD/CAD into a rough near-term corkscrew around the 200-hour Exponential Moving Average (EMA) near the 1.3700 handle.
USD/CAD hourly chart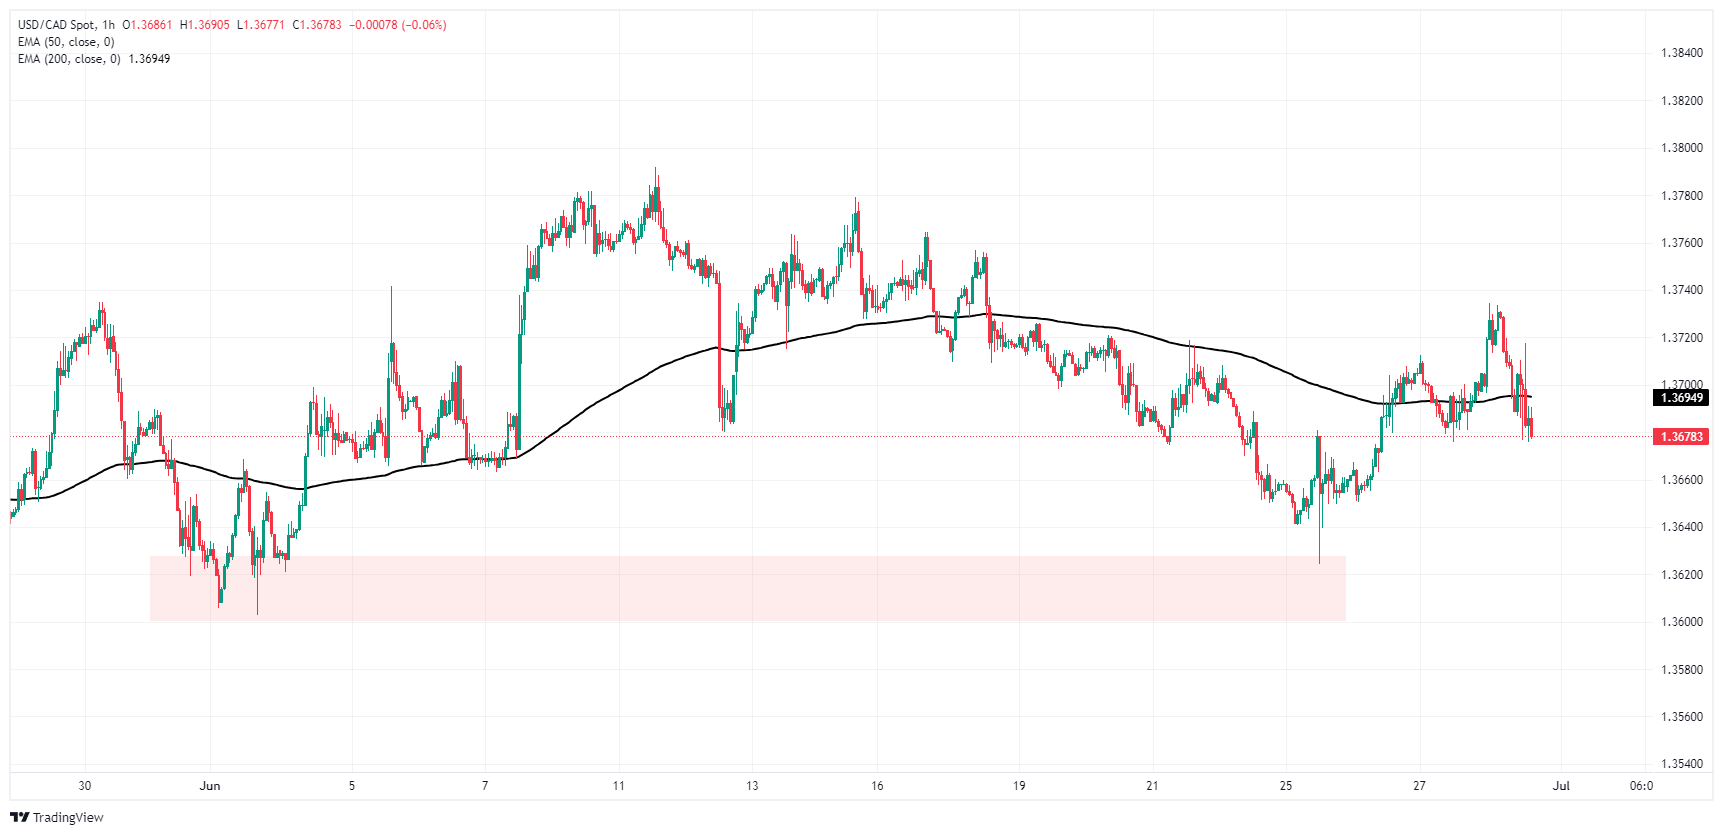
USD/CAD daily chart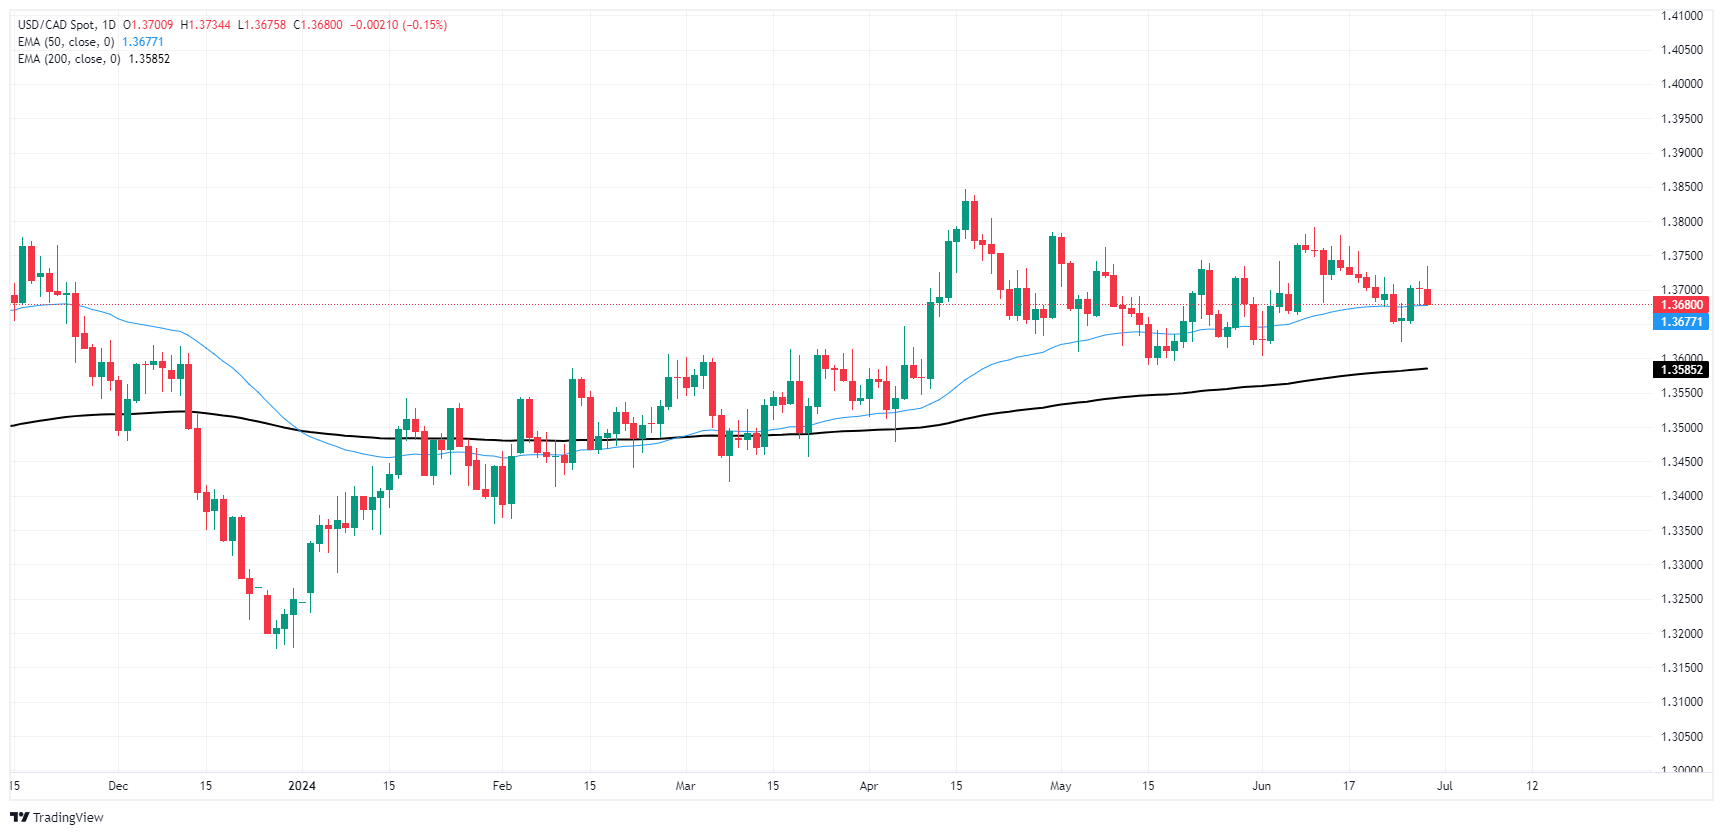
Canadian Dollar FAQs
The key factors driving the Canadian Dollar (CAD) are the level of interest rates set by the Bank of Canada (BoC), the price of Oil, Canada’s largest export, the health of its economy, inflation and the Trade Balance, which is the difference between the value of Canada’s exports versus its imports. Other factors include market sentiment – whether investors are taking on more risky assets (risk-on) or seeking safe-havens (risk-off) – with risk-on being CAD-positive. As its largest trading partner, the health of the US economy is also a key factor influencing the Canadian Dollar.
The Bank of Canada (BoC) has a significant influence on the Canadian Dollar by setting the level of interest rates that banks can lend to one another. This influences the level of interest rates for everyone. The main goal of the BoC is to maintain inflation at 1-3% by adjusting interest rates up or down. Relatively higher interest rates tend to be positive for the CAD. The Bank of Canada can also use quantitative easing and tightening to influence credit conditions, with the former CAD-negative and the latter CAD-positive.
The price of Oil is a key factor impacting the value of the Canadian Dollar. Petroleum is Canada’s biggest export, so Oil price tends to have an immediate impact on the CAD value. Generally, if Oil price rises CAD also goes up, as aggregate demand for the currency increases. The opposite is the case if the price of Oil falls. Higher Oil prices also tend to result in a greater likelihood of a positive Trade Balance, which is also supportive of the CAD.
While inflation had always traditionally been thought of as a negative factor for a currency since it lowers the value of money, the opposite has actually been the case in modern times with the relaxation of cross-border capital controls. Higher inflation tends to lead central banks to put up interest rates which attracts more capital inflows from global investors seeking a lucrative place to keep their money. This increases demand for the local currency, which in Canada’s case is the Canadian Dollar.
Macroeconomic data releases gauge the health of the economy and can have an impact on the Canadian Dollar. Indicators such as GDP, Manufacturing and Services PMIs, employment, and consumer sentiment surveys can all influence the direction of the CAD. A strong economy is good for the Canadian Dollar. Not only does it attract more foreign investment but it may encourage the Bank of Canada to put up interest rates, leading to a stronger currency. If economic data is weak, however, the CAD is likely to fall.
- US Dollar saw a slight dip at the end of the week, clearing daily gains.
- US Dollar finds support amid high US Treasury yields.
- May’s PCE data showed an unexpected deceleration in US inflation.
The end of the week saw the US Dollar, as benchmarked by the DXY Index, settle near 105.80, after hitting a high of 106.13 earlier in the session. This follows the release of Personal Consumption Expenditures (PCE) data, but the losses are limited by the high US Treasury yields.
The American economy remains resilient with slight inflationary signals, which is just enough to keep the Federal Reserve (Fed) from completely embracing the easing cycle.
Daily digest market movers: US Dollar dips on weak PCE data
- On Friday, May’s Personal Consumption Expenditures (PCE) showed headline inflation soften to 2.6% YoY, down from the previous month’s 2.7%.
- Core PCE (which excludes volatile food and energy prices) has also experienced a decline to 2.6% from the previous 2.8% in April.
- US Treasury yields provide resilience to the Dollar, with the 2, 5 and 10-year rates at 4.71%, 4.32%, and 4.33%, respectively.
- Probability of a Fed rate cut in September marginally increased to 66%, up from the pre-release expectation of 64% as per CME Fedwatch Tool.
- Focus will now shift to labor market data from June.
DXY technical outlook: Positive momentum persists, index eyeing higher grounds
Despite the recent data fluctuations, the technical outlook remains positive, with indicators in green but losing some steam. The Relative Strength Index (RSI) continues to be above 50 but appears to point downward, indicating a slight pause in the bullish momentum. The green bars are still developing in the Moving Average Convergence Divergence (MACD), further facilitating the positive view but at a slower pace.
The DXY Index holds above the 20, 100 and 200-day Simple Moving Averages (SMAs), confirming its ongoing positive stance. Despite the Index’s steadiness at the highs seen since mid-May, there is room for further rise, suggesting the DXY is poised for further upside with the 106.50 zone next in sight. Conversely, 105.50 and 105.00 will be areas to observe in case of a drawdown.
Fed FAQs
Monetary policy in the US is shaped by the Federal Reserve (Fed). The Fed has two mandates: to achieve price stability and foster full employment. Its primary tool to achieve these goals is by adjusting interest rates. When prices are rising too quickly and inflation is above the Fed’s 2% target, it raises interest rates, increasing borrowing costs throughout the economy. This results in a stronger US Dollar (USD) as it makes the US a more attractive place for international investors to park their money. When inflation falls below 2% or the Unemployment Rate is too high, the Fed may lower interest rates to encourage borrowing, which weighs on the Greenback.
The Federal Reserve (Fed) holds eight policy meetings a year, where the Federal Open Market Committee (FOMC) assesses economic conditions and makes monetary policy decisions. The FOMC is attended by twelve Fed officials – the seven members of the Board of Governors, the president of the Federal Reserve Bank of New York, and four of the remaining eleven regional Reserve Bank presidents, who serve one-year terms on a rotating basis.
In extreme situations, the Federal Reserve may resort to a policy named Quantitative Easing (QE). QE is the process by which the Fed substantially increases the flow of credit in a stuck financial system. It is a non-standard policy measure used during crises or when inflation is extremely low. It was the Fed’s weapon of choice during the Great Financial Crisis in 2008. It involves the Fed printing more Dollars and using them to buy high grade bonds from financial institutions. QE usually weakens the US Dollar.
Quantitative tightening (QT) is the reverse process of QE, whereby the Federal Reserve stops buying bonds from financial institutions and does not reinvest the principal from the bonds it holds maturing, to purchase new bonds. It is usually positive for the value of the US Dollar.
- GBP/USD steady following a positive UK GDP report and rising US PCE Index.
- Technicals cap pair below 1.2700, key for buyer momentum.
- Strong support at 1.2634/45 (50 & 100-DMAs); RSI suggests seller dominance, risk of more losses.
The GPB/USD is subdued during the North American session on Friday following a positive UK GDP report, yet an uptick in the Fed’s preferred gauge of inflation, the PCE Price Index, capped the major, which trades at 1.2642, virtually unchanged.
GBP/USD Price Analysis: Technical outlook
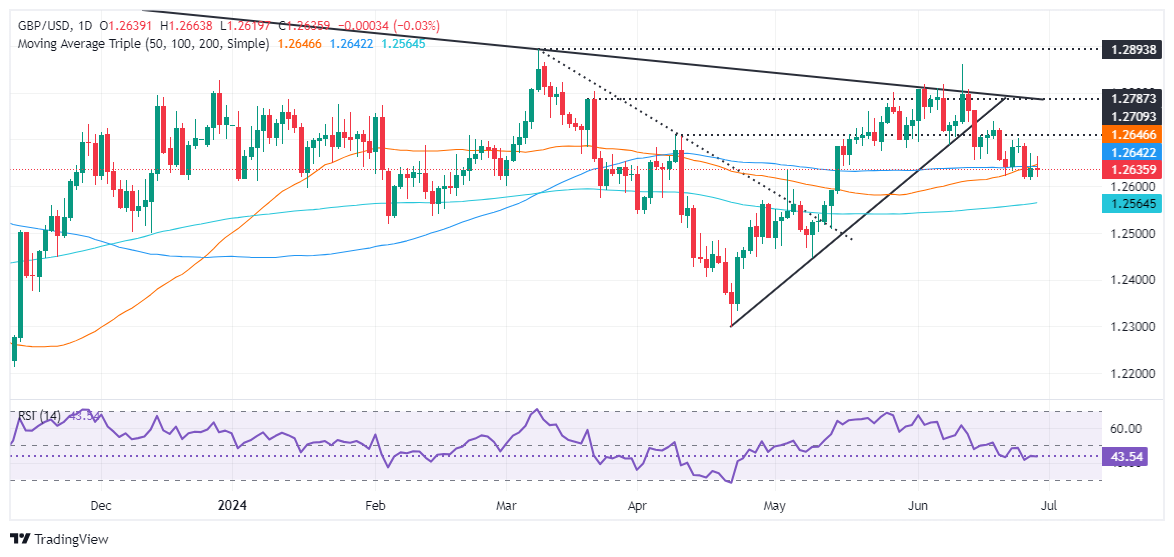
After bouncing off the weekly lows reached on Wednesday, the GBP/USD capped its losses and remained below the 12700 psychological figures, a crucial level for buyers to regain control.
However, sellers are also pressured as they face strong support at the confluence of the 50 and 100-day moving averages (DMAs) at around 1.2634/45, which, if cleared, could exacerbate further downside.
The Relative Strength Index (RSI) hints sellers remain in control, meaning further losses are expected.
The psychological figure of 1.2600 would be the first support. Once surpassed, the next demand zone to challenge would be the 200-DMA at 1.2555, followed by the 1.2500 mark.
For a bullish continuation, traders must claim 1.2700 and clear a previous support trendline turned resistance at around 1.2730/40.
GBP/USD Price Action – Daily Chart
Pound Sterling FAQs
The Pound Sterling (GBP) is the oldest currency in the world (886 AD) and the official currency of the United Kingdom. It is the fourth most traded unit for foreign exchange (FX) in the world, accounting for 12% of all transactions, averaging $630 billion a day, according to 2022 data. Its key trading pairs are GBP/USD, aka ‘Cable’, which accounts for 11% of FX, GBP/JPY, or the ‘Dragon’ as it is known by traders (3%), and EUR/GBP (2%). The Pound Sterling is issued by the Bank of England (BoE).
The single most important factor influencing the value of the Pound Sterling is monetary policy decided by the Bank of England. The BoE bases its decisions on whether it has achieved its primary goal of “price stability” – a steady inflation rate of around 2%. Its primary tool for achieving this is the adjustment of interest rates. When inflation is too high, the BoE will try to rein it in by raising interest rates, making it more expensive for people and businesses to access credit. This is generally positive for GBP, as higher interest rates make the UK a more attractive place for global investors to park their money. When inflation falls too low it is a sign economic growth is slowing. In this scenario, the BoE will consider lowering interest rates to cheapen credit so businesses will borrow more to invest in growth-generating projects.
Data releases gauge the health of the economy and can impact the value of the Pound Sterling. Indicators such as GDP, Manufacturing and Services PMIs, and employment can all influence the direction of the GBP. A strong economy is good for Sterling. Not only does it attract more foreign investment but it may encourage the BoE to put up interest rates, which will directly strengthen GBP. Otherwise, if economic data is weak, the Pound Sterling is likely to fall.
Another significant data release for the Pound Sterling is the Trade Balance. This indicator measures the difference between what a country earns from its exports and what it spends on imports over a given period. If a country produces highly sought-after exports, its currency will benefit purely from the extra demand created from foreign buyers seeking to purchase these goods. Therefore, a positive net Trade Balance strengthens a currency and vice versa for a negative balance.
Price action in the base metal complex is staving off Commodity Trading Advisor (CTA) selling pressure in Copper, however the higher selling trigger, now at $9,350/t, is becoming more of an entrenched risk for the red metal, TDS commodity strategists note.
Demand for base metals in China is weakening
“Indeed, with our gauge of global commodity demand continuing to weaken, while depressed premiums and surging inventories in the Middle Kingdom argue against fundamental tightness, there are plenty of potential catalysts that could see prices ease further from here, particularly given still bloated money manager positioning.”
“While the fundamental situation certainly looks promising in the years to come, the lack of evidence supporting current physical tightness can continue to see these money manager positions unwind.”
“Elsewhere, CTAs are modest buyers of Aluminum and Zinc but prices are close to levels that would see the buying quickly halted or reversed as current momentum signals are on the weaker side.”
Top traders on the Shanghai Futures Exchange (SHFE) have reduced their net Gold (XAU/USD) and Silver (XAG/USD) positions. Precious metals investors are likely to remain on the sidelines for the time being, TDS commodity strategists note.
Precious metals remain on the sidelines
“Top traders on the SHFE have reduced their net Gold and Silver positions by 8.6k and 11.6k lots respectively over the course of this past week. This, along with a macro cohort that has yet to find their bullish conviction on the Yellow Metal, helps explain the relatively weaker price action this week.”
“Elsewhere, the PCE data came in roughly in line with expectations, and the pace represents the lowest level of the cycle. Overall, inflation data continues to gradually normalize back to the trend the Fed would like to see, but it is still not enough evidence for officials to pound the table on policy easing.”
“In this sense, precious metals investors are likely to remain on the sidelines for the time being, however there has been nascent signs the ETF positions could be starting to turn a corner with holdings on course to post their first monthly increase since May 2023.”
The legislative snap election will take place in two rounds with the first round scheduled on the 30th of June and second round on the 7th of July.
Macron's decision to hold snap elections surprised markets and created serious political uncertainty in the eurozone. And, as we get closer to Sunday, here are the forecasts of economists and researchers of seven major banks.
Danske Bank
We can look forward to several significant events and data releases throughout the summer. The upcoming French elections on the next two Sundays could likely result in a "hung parliament," easing market concerns about significant spending increases. Should the National Rally (RN) win an absolute majority, we anticipate a rise in spending. However, RN's recent scaling back of expensive initiatives and softer EU rhetoric suggest that the yield spread to Germany will decrease in either scenario.
ING
If a candidate does not secure 50% of the vote in the first round, only the top two candidates go forward to the second-round vote on 7 July. Given the polls point toward Marine Le Pen's faction at 35% of the vote, the Leftist coalition at 28% of the vote, and the centre at 20%, President Macron's party looks set for a wipeout in parliament. The question for the market is whether a Le Pen government looks at the French bond market and starts dropping some of its plans for seemingly unfunded tax cuts - or pushes ahead. Our eurozone team suspects it will be too early for a new government to substantially water down its pre-election pledges and that it may well be a rocky few months into September – when France needs to deliver to Brussels its plans on how it will fix its 5%+ budget deficit.
OCBC
France’s National Assembly has 577 seats. For an absolute majority, a party needs 289. Anyone who scores >50% of the vote with a turnout of at least a quarter of the local electorate automatically wins a seat. Candidates who fail to garner at least 12.5% of the vote will be eliminated. Those who won >12.5% of the votes will go into the second-round face-off on 7 Jul. As of 27 Jun, polling firm Harris Interactive Toluna predicted 250 to 305 seats for far right Rassemblement National (RN) party and its allies while IfopFiducial suggested 260 seats. Other polls suggest that turnout this year could be higher at around 60%. Polls continue to show consistency in the order: RN most popular followed by left wing party and then Macron’s party is far behind. Polls are pointing to a big defeat for Macron and is suggesting a hung parliament at the moment.
ABN AMRO
Various polls clearly suggest a win for the radical parties over the centrist government, which might lead to three different scenarios in our view. Scenario 1 (Far-right in power – Base case): The far-right gains a (relative) majority but most of its political program would not be possible to implement in those three years. Although we expect fiscal deterioration under this government, this should remain limited assuming the party does not want to trigger a debt crisis, which would scupper its chances to gain full power in the 2027 election. Scenario 2 (Far-left in power – Negative): The most worrying scenario in terms of the economic and fiscal outlook would be a government led by the left coalition. Their political and economic program appears more radical than any other party and would create significant distrust in the market. Scenario 3: (Hung parliament – Benign): None of the three political blocs obtain a clear majority, putting the government on hold for at least a year. This would not be a positive outcome, but it would at least mean no further deterioration in government finances, in contrast to the two scenarios above. One thing is clear: in any of the possible scenarios described, France’s fiscal deficit is unlikely to go back to the 3% deficit target by 2027 as promised by the current government.
Rabobank
Macron’s centrist party was dealt a painful blow in the European elections. Consequently, Macron dismissed parliament and called new parliamentary elections. If Macron’s party wins a majority, we expect an emboldened Macron to pursue more ambitious reforms with improved debt sustainability as a result. A relatively small change in seats could work out well for Macron if some of the left-wing parties don’t unite and are willing to work with him. A right-wing government (cohabitation) would lead to more policy inertia and worse debt metrics.
Although Macron's announcement came as a surprise, there is a possibility that new elections could work in his favour. However, the likelihood of this scenario is quite low. It is more probable that Macron's political standing will diminish, albeit not to the extent of preventing him from establishing a new government. Nevertheless, it is crucial to recognize that this course of action carries inherent risks. Macron's party suffered a substantial setback in the European elections, and unfavourable results in the upcoming elections could exacerbate concerns regarding the sustainability of the country's debt.
MUFG
On Monday we will know exactly how squeezed out the centrists candidates were in round one and the greater that squeeze is the greater the chance of an outright majority in round two for RN or perhaps the New Popular Front. Based on the polling we believe there are perhaps four plausible scenarios: 1) RN wins the most seats but falls short of an outright majority (45%); 2) RN wins an outright majority (25%); 3) NPF wins the largest number of seats but falls short of an outright majority (20%); 4) there is no clear winner and we have complete paralysis with no obvious root to a working government (10%). These are initial scenarios evident in the immediate aftermath of the second round election on 7th July. In other words, scenario 4) could eventually shift and a government is formed but initially it is not obvious.
We have also raised the probability of an RN outright majority based on the interviews from Marine Le Pen and Jordan Bardella that certainly point to a willingness of RN to be pragmatic and possibly park some of their initial more contentious policies for a period of time. The tone from RN certainly suggests the flippant spending and large fiscal deficits touted in 2022 are unlikely which would potentially contain the market fallout in scenario 2). Based on RN communications it seems the worst scenario would be scenario 3) and certainly from a bond market perspective this would fuel the widest OAT/Bund spread move. Scenario 4) is not particularly positive either but the market move might be contained on the hope of an eventual path to a governing coalition can be found.
Deutsche Bank
Staying on politics, it’s going to be an important weekend for markets ahead, as the first round of the French legislative election is taking place on Sunday. Clearly, we won’t know the full results until the second round on July 7, but it will offer a better sense of the likely outcomes in terms of who can reach a majority, if anyone. As it stands, the latest Ifop poll yesterday showed Marine Le Pen’s National Rally on 36%, ahead of the left-wing alliance on 29%, and President Macron’s centrist group on 21%. In terms of seats projected in the National Assembly, that poll suggests the National Rally and its allies would end up with 220-260 seats, falling short of the 289 necessary for a majority. Alongside that, the left-wing alliance would get 180-210 seats, and President Macron’s group would be on 75-110. As a reminder, my team published a two-part guide to the French elections running through the situation and the implications for Europe.
- USD/CAD trades flat at around 1.3700 after a big data day for the pair.
- Canadian GDP showed a 0.3% rise in April suggesting a strong economy.
- US PCE inflation data, the Fed’s preferred gauge, meanwhile, showed progress towards the Fed’s 2.0% target.
USD/CAD trades flat at around 1.3700 on Friday after the release of Canadian economic growth data and US inflation data updated investors' evaluations of the currency pair.
After starting the Asian session in the 1.3730s the pair declined during the day as the Canadian Dollar (CAD) steadily appreciated against its south-of-the-border counterpart. A late-stage rally by the US Dollar (USD), however, brought the pair even as the west coast began to rise.
USD/CAD pulls back following Canadian GDP
The release of Canadian Gross Domestic Product (GDP) data for April at 12:30 GMT strengthened the CAD, speeding up USD/CAD’s descent.
GDP rose 0.3% in April in line with analysts expectations after showing a 0.0% rise in March, according to Statistics Canada. The preliminary estimate for May GDP was also released and showed a 0.1% rise.
Markets took the 0.3% growth rate in April as a positive sign for the economy, however, it is not likely to change the widely held expectation that the Bank Of Canada (BoC) will lower interest rates in July. This is likely to put a floor under downside for USD/CAD. Currencies tend to depreciate when central banks lower interest rates because they reduce foreign capital inflows.
“The solid rise in GDP in April and preliminary estimate of a small increase in May leave the economy on track to perform better than the Bank of Canada expected this quarter, but not by enough to have any real impact on the probability of another interest rate cut in July,” said Stephen Brown, Deputy Chief North America Economist for Capital Economics.
His views were echoed by Robert Both, Senior Macro Strategist at TD Securities, who said, “The April (GDP) strength was widely expected following the flash estimate last month, but we believe new projections for softer growth in May should give the Bank of Canada some added conviction that this strength will not be sustained. A 0.1% print in May would leave Q2 GDP tracking slightly above projections from the April MPR, but we do not think that's enough to derail another cut in July.”
US Inflation steadily declines towards Fed’s target
US inflation data, in the form of the Fed’s preferred inflation gauge, the Personal Consumption Expenditures Price Index, meanwhile, showed price rises cooling in May, as analysts had estimated. The data weighed on the US Dollar (USD) adding further downside to USD/CAD.
PCE fell to 2.6% from 2.7% in April, on a year-on-year basis, whilst Core PCE fell to 2.6% from 2.8% respectively.
The steady decline in PCE inflation towards the Fed’s 2.0% target slightly increased the probability of the Fed making a September interest-rate cut to 66%, from 64% before the release, according to the CME FedWatch Tool, which uses the price of Fed Fund Futures for its estimates.
Speaking after the release, Fed Bank of San Francisco President Mary Daly told CNBC that the cooling inflation data was “good news” but that the “Fed is not done yet”. It suggested the Fed's monetary policy was working.
The US Dollar also gained a small election-related bump from the overall perception that Donald Trump came out of the Presidential debate on Thursday night looking better than President Joe Biden.
Technical Analysis: USD/CAD stuck in a range
From a technical perspective USD/CAD remains trapped in a range after a failed attempt to break out of a Symmetrical Triangle (ST) price pattern back on June 7.
USD/CAD Daily Chart
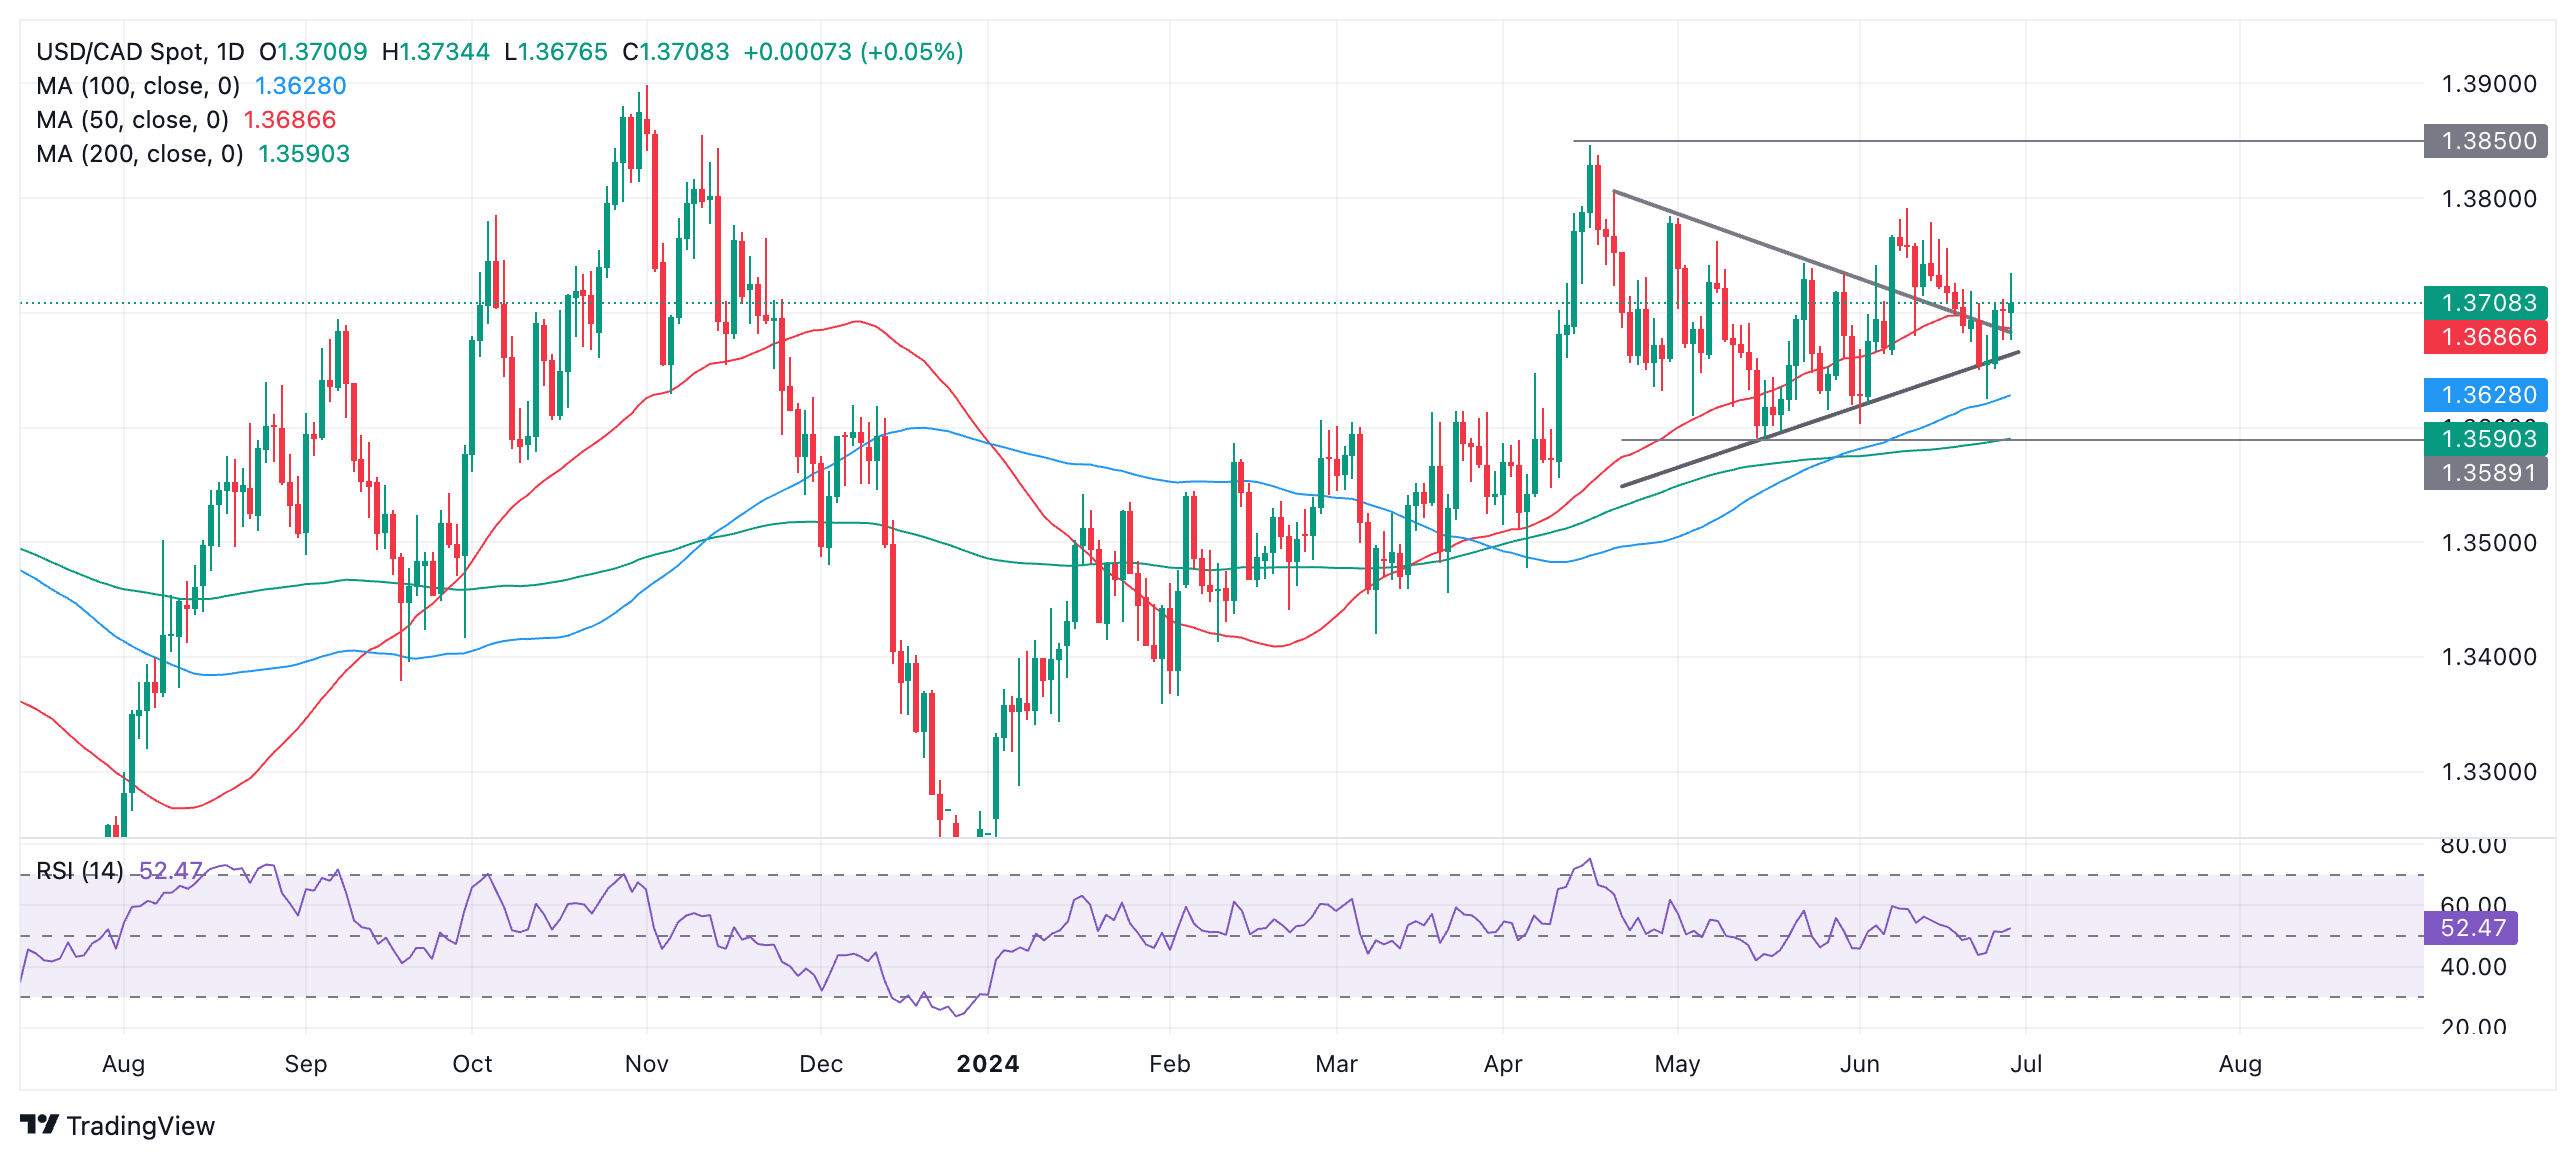
Price action has been bearish since the breakout but the odds continue to favor a resumption of the initial move higher. A break above 1.3791 (June 11 high) would provide bullish confirmation, and lead to a move up to a potential target at 1.3850.
Alternatively a break below 1.3624 would indicate a downside breakout instead with an initial target at 1.3590.
- NZD/USD rebounds strongly to 0.6100 on an expected decline in the US core PCE Inflation data for May.
- Annual US core PCE declined to 2.6% from 2.8% in April.
- Cooling US inflation figures have boosted Fed rate-cut prospects.
The NZD/USD pair recovers its intraday losses and rises to near the round-level resistance of 0.6100 in Friday’s American session. The Kiwi asset gains as the US Dollar (USD) declines after the United States (US) Personal Consumption Expenditure inflation (PCE) report showed that price pressures softened expectedly in May.
The PCE inflation report showed that inflation decelerated to 2.6% from the prior release of 2.8% on a year-on-year. On month, price pressures grew at a slower pace of 0.1% from the former release of 0.3%, upwardly revised from 0.2%. Soft US inflation data has prompted expectations of early rate cuts by the Federal Reserve (Fed).
The US Dollar Index (DXY), which tracks the Greenback’s value against six major currencies, drops to near 105.80.
Meanwhile, the New Zealand Dollar (NZD) will dance to the tunes of the Caixin Manufacturing PMI data for June, which will be published on Monday. Activities in the manufacturing sectors are expected to have grown modestly to 51.2 from the prior release of 51.7. It is worth noting that New Zealand is one of the leading trading partners of China and slower growth in China weighs on the New Zealand Dollar.
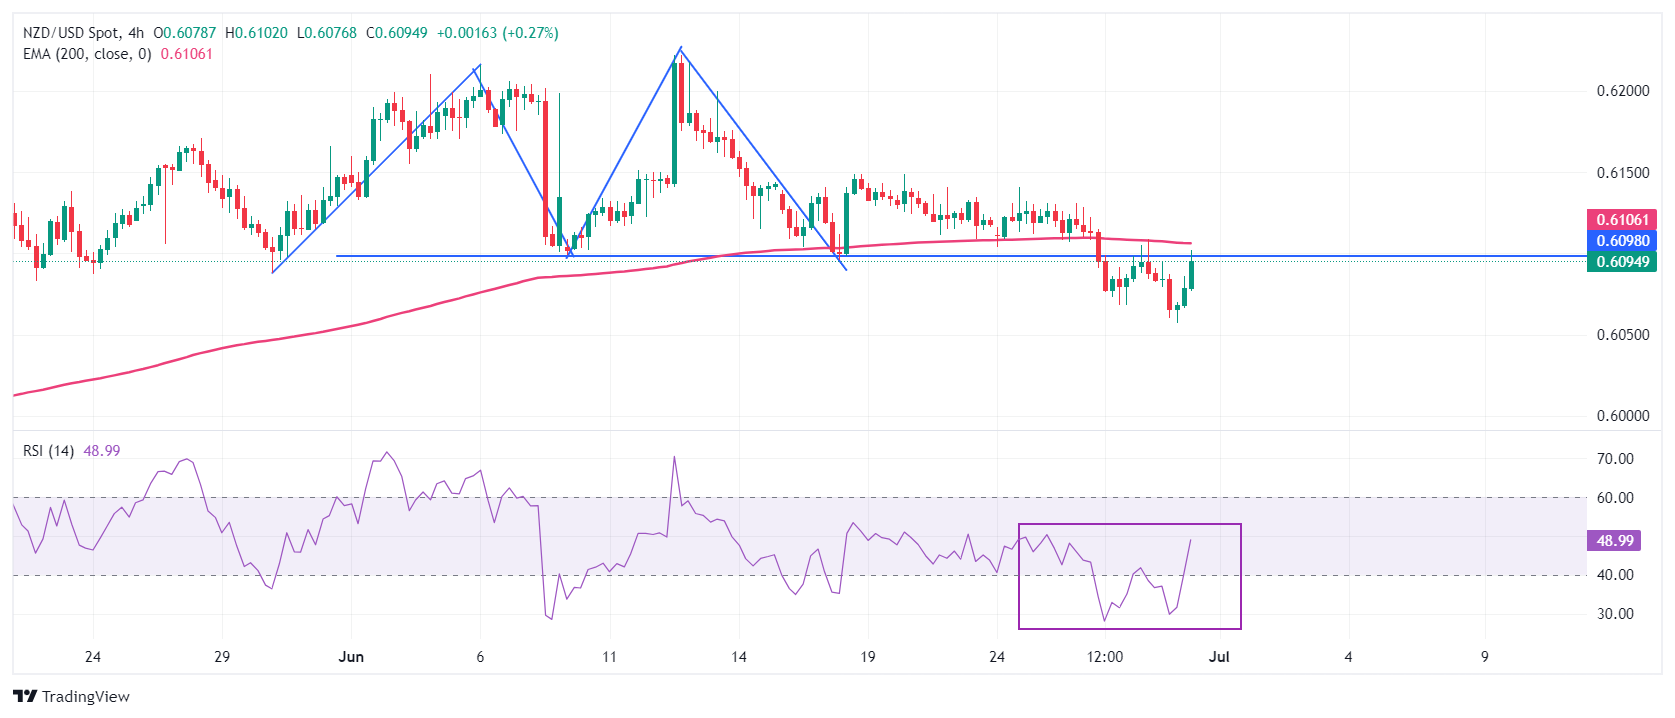
NZD/USD delivers a breakdown of the Double Top chart pattern formed on a four-hour timeframe. The breakdown of the above-mentioned chart pattern triggered after a downside move below the swing low plotted from June 10 low near 0.6100, which results in a bearish reversal.
The 200-period Exponential Moving Average (EMA) near 0.6106 continues to act as a major barricade for the New Zealand Dollar bulls.
The 14-period Relative Strength Index (RSI) rebounds into the 40.00-60.00 range, suggesting that the downside momentum has faded.
A pullback move to near 0.6100 appears to be a selling opportunity for targets towards April 4 high around 0.6050 and the psychological support of 0.6000.
On the contrary, a reversal move above June 12 high of 0.6222, which will expose the asset January 15 high near 0.6250, followed by January 12 high near 0.6280.
NZD/USD four-hour chart
Economic Indicator
Core Personal Consumption Expenditures - Price Index (YoY)
The Core Personal Consumption Expenditures (PCE), released by the US Bureau of Economic Analysis on a monthly basis, measures the changes in the prices of goods and services purchased by consumers in the United States (US). The PCE Price Index is also the Federal Reserve’s (Fed) preferred gauge of inflation. The YoY reading compares the prices of goods in the reference month to the same month a year earlier. The core reading excludes the so-called more volatile food and energy components to give a more accurate measurement of price pressures." Generally, a high reading is bullish for the US Dollar (USD), while a low reading is bearish.
Read more.Last release: Fri Jun 28, 2024 12:30
Frequency: Monthly
Actual: 2.6%
Consensus: 2.6%
Previous: 2.8%
Source: US Bureau of Economic Analysis
After publishing the GDP report, the US Bureau of Economic Analysis releases the Personal Consumption Expenditures (PCE) Price Index data alongside the monthly changes in Personal Spending and Personal Income. FOMC policymakers use the annual Core PCE Price Index, which excludes volatile food and energy prices, as their primary gauge of inflation. A stronger-than-expected reading could help the USD outperform its rivals as it would hint at a possible hawkish shift in the Fed’s forward guidance and vice versa.
After initially dropping by two big figures in the six trading days following the announcement of snap elections in France, EUR/USD has stabilised since around the 1.0700-level but next week could be a week of renewed volatility depending on the result of the first round of elections on Sunday, Head of Research at MUFG Derek Halpenny notes.
Potential for downside move remains
“After initially dropping by two big figures in the six trading days following the announcement of snap elections in France, EUR/USD has stabilised since around the 1.0700-level but next week could be a week of renewed volatility depending on the result of the first round of elections on Sunday.”
“We initially estimated around a 1.0% risk premium was possibly priced into EUR now and based on short-term price action against variables like spreads, this remains a reasonable estimate.”
“With the Euro (EUR) risk premium relatively modest strong RN & NPF performances will likely see EUR/USD close to the 1.0500-level.”
- AUD/USD recovers daily losses and jumps to 0.6670 as US core PCE Inflation declines in May.
- Soft US inflation figures would boost Fed rate-cut hopes.
- The RBA is expected to deliver more rate hikes this year.
The AUD/USD pair revives intraday losses and surges to near 0.6670 in Friday’s New York session after the United States (US) Bureau of Economic Analysis (BEA) published a soft Personal Consumption Expenditure Price Index (PCE) report for May. The report showed that core inflation data grew at a slower pace of 0.1% from the prior release of 0.2%, as expected, on month-on-month. Also, the annual core PCE inflation decelerated expectedly to 2.6% from 2.8% in April.
An expected decline in the US inflation data is expected to spurt expectations for early rate cuts by the Federal Reserve (Fed). The scenario is unfavorable for the US Dollar. The US Dollar Index (DXY) has turned negative and has dropped to 105.80.
The CME FedWatch tool shows that the central bank sees the September meeting as the earliest point for pivoting to policy-normalization. As per the tool, the Fed is expected to deliver two rate cuts this year. Contrary to market expectations, Fed officials forecasted only one rate cut this year.
After the US inflation data release, San Francisco Fed Bank President Mary Daly told in an interview with CNBC that the soft PCE data is good news but we need more good data to gain confidence that inflation will decline to 2%.
On the Aussie front, expectations of more rate hikes by the Reserve Bank of Australia (RBA) have strengthened the Australian Dollar. Market speculation for RBA rate hikes grew further after monthly Consumer Price Index (CPI) data turned out hotter-than-expected on year-on-year. The inflation data rose at a faster pace of 4.0% than expectations of 3.8% and the prior release of 3.6%.
Economic Indicator
Core Personal Consumption Expenditures - Price Index (YoY)
The Core Personal Consumption Expenditures (PCE), released by the US Bureau of Economic Analysis on a monthly basis, measures the changes in the prices of goods and services purchased by consumers in the United States (US). The PCE Price Index is also the Federal Reserve’s (Fed) preferred gauge of inflation. The YoY reading compares the prices of goods in the reference month to the same month a year earlier. The core reading excludes the so-called more volatile food and energy components to give a more accurate measurement of price pressures." Generally, a high reading is bullish for the US Dollar (USD), while a low reading is bearish.
Read more.Last release: Fri Jun 28, 2024 12:30
Frequency: Monthly
Actual: 2.6%
Consensus: 2.6%
Previous: 2.8%
Source: US Bureau of Economic Analysis
After publishing the GDP report, the US Bureau of Economic Analysis releases the Personal Consumption Expenditures (PCE) Price Index data alongside the monthly changes in Personal Spending and Personal Income. FOMC policymakers use the annual Core PCE Price Index, which excludes volatile food and energy prices, as their primary gauge of inflation. A stronger-than-expected reading could help the USD outperform its rivals as it would hint at a possible hawkish shift in the Fed’s forward guidance and vice versa.
Federal Reserve (Fed) Bank of San Francisco President Mary Daly told CNBC on Friday that cooling inflation shows that the Fed's monetary policy is working, per Reuters.
Key takeaways
"Fed is not done yet but PCE data is good news."
"Getting evidence that policy is tight enough."
"It's taking longer for policy to work but it is working."
"If inflation stays sticky or comes down slowly, rates would need to be higher for longer."
"If inflation comes down or labor market falters, can adjust policy."
"Too early to tell on policy."
"Will pay attention to both sides of Fed mandate."
"Hearing from business CEOs they already feel uncertain."
"Fed is apolitical, won't talk about presidential debate."
"Monetary policy is working."
Market reaction
These comments failed to have a noticeable impact on the US Dollar's valuation. At the time of press, the US Dollar Index was down 0.05% on the day at 105.85.
- Silver has bounced off key support and risen up towards the cluster of the 50 and 100-period SMA.
- The overall short-term trend remains bearish, however, with a risk the precious metal could roll over at any time.
- Silver is in a falling channel, but the upper boundary has been briefly breached increasing the risk it could break again.
Silver (XAG/USD) has bounced off key support at the June 13 low, and is currently trading up towards the 50 and 100-period Simple Moving Averages (SMA).
Despite the bounce, the precious metal is in a falling channel formation and the short-term trend is still, on balance, bearish. This suggests the odds favor bearish bets and a continuation lower once the recovery runs out of steam and rolls over. However, there are no signs yet that this is happening.
Silver 4-hour Chart
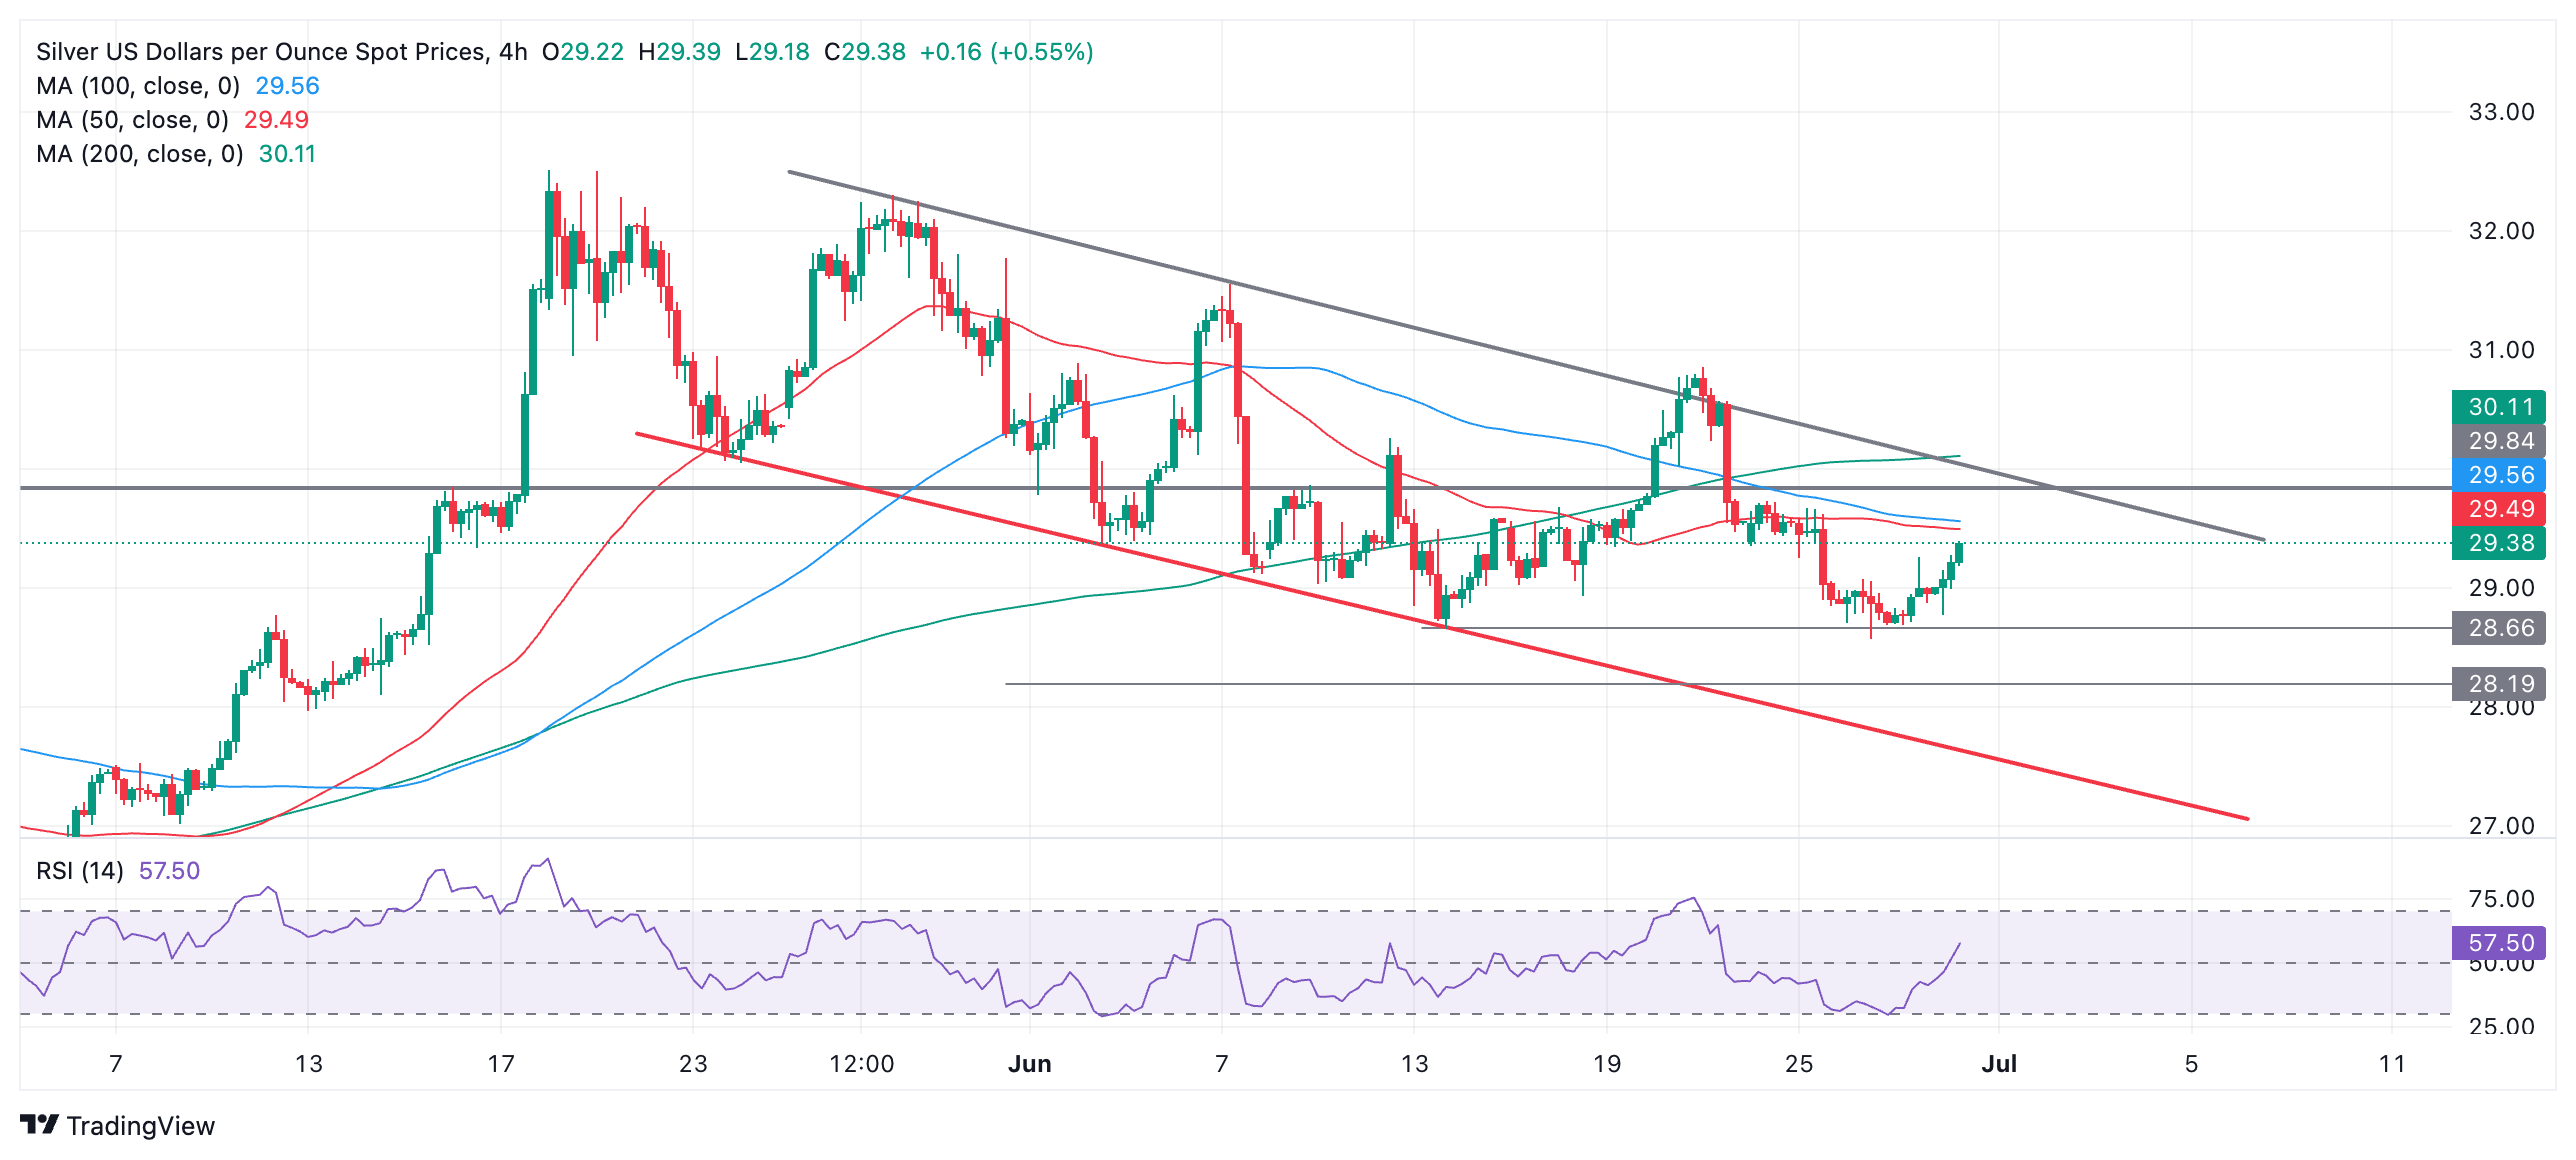
If price does fall back down and pierces below $28.57, the June 26 low that would reconfirm the downside bias, with the next target lying at the lower channel line, at around $27.50.
If Silver continues recovering and breaks on a closing basis above the 50 and 100 SMAs at $29.49 and $29.56 respectively, however, it would probably indicate a continuation higher to the upper channel line at around $29.90. This is also a major resistance level at the top of a four-year consolidation zone. A decisive break above that level would indicate a reversal in the short-term trend.
A decisive break would be one accompanied by a long green up candle that broke clearly above the level and closed near its high or three green candles in a row that broke above the level.
It is worth noting that Silver temporarily broke out of the top of the falling channel on June 20, and although it quickly fell back, the fact it breached the integrity of the channel, albeit temporarily, indicates the upper channel line has been weakened and is more likely to be broken again. This adds a slightly bullish tone to the charts.
USD/CNH slipped after USD/CNY fix came in lower this morning, breaking the past 7-day trend of fixing higher everyday, FX strategist at OCBC Christopher Wong notes.
Third plenum to set long term policy
“Pair was last at 7.2929. Momentum is bullish though RSI shows signs of easing from near overbought conditions. Resistance at 7.30, 7.31 levels. Support at 7.2705 (21 DMA).”
“That said, apart from today, the recent USD/CNY fixings have followed a pattern that continued to reinforce our view that authorities are pursuing a measured pace of RMB depreciation. Change in daily fix on average was about +17.4 pips (19 Jun – 27 Jun) vs. average daily change of about 4.9 pips/day since May 2024.”
“Elsewhere, China announced third plenum will be held on 15 – 18 July to set long term policy on a wide range of economic and political issues.”
USD/JPY continued to power through 161 this morning. This is the highest level since 1986, FX strategist at OCBC Christopher Wong notes.
JPY intervention seems inevitable
“There are expectations that Japanese authorities could soon intervene. While the level of Japanese Yen (JPY) is one factor to consider, officials do focus on the pace of depreciation as the intent of intervention is to curb excessive volatility.”
“As such, the path of least resistance for USD/JPY may still be to the upside, for now. Pair was last at 160.65. Bullish momentum on daily chart intact while RSI in in overbought conditions. Next resistance at 161.20 (138.2% fibo projection of 2023 low to 2023), 164 levels. Support at 157.70 (21 DMA), 156.60 (50 DMA).”
- The US Dollar has Trump and Suzuki to thank for its early recovery on Friday.
- All eyes on the Fed's preferred inflation gauge: PCE
- The US Dollar index hovers around 106.00, back to Wednesday’s levels.
The US Dollar (USD) is having difficulties in pricing in all events and elements that are moving in the markets. Traders are still digesting the Trump-Biden debate where nearly everyone saw former US President Donald Trump as the victor. Not much time though to fret over the event, with risk increasing that the Japanese Ministry of Finance might intervene later this Friday after the Japanese Yen hit a fresh multi-decade low against the US Dollar and snapped above 161.
On the US economic calendar front, only one element which counts, and that is the Fed’s preferred core inflation gauge: Personal Consumption Expenditure Index. Disinflation is expected to remain on track. So only a very large disinflationary surprise would be able to weaken the US Dollar, while an in-line or bigger number would mean a stronger Greenback by the end of this week.
Daily digest market movers: PCE ahead
- At 12:30 GMT, The Personal Consumption Expenditures for May are to be released:
- Core Monthly PCE expected to head from 0.2% to 0.1%.
- Headline Monthly PCE is expected to slide from 0.3% to 0.0%.
- Yearly Headline PCE should abate from 2.7% to 2.6%.
- Yearly Core PCE seen heading from 2.8% to 2.6%.
- The Chicago Purchase Managers Index (PMI) is to be released at 13:45 GMT. Expectation is for the number to remain in contraction from 35.4 to 40.0.
- At 14:00 GMT, the University of Michigan will release its final reading for June:
- Consumer Sentiment to remain quite stable at 65.8, coming from 65.6.
- Inflation expectations locked in at 3.1%.
- Equities are trying to close this week off on a high note, with already several green closures in Asia, while European and US equities are in the green.
- The CME Fedwatch Tool is broadly backing a rate cut in September despite recent comments from Federal Reserve (Fed) officials. The odds now stand at 57.9% for a 25-basis-point cut. A rate pause stands at a 35.9% chance, while a 50-basis-point rate cut has a slim 6.2% possibility.
- The US 10-year benchmark rate trades near the weekly high at 4.30%.
US Dollar Index Technical Analysis: Watch out for Japan
The US Dollar Index (DXY) may go where it wants to go in the coming days, though a sword of Damocles is hanging above its performance. The Japanese Ministry of Finance has repeated its state of emergency on the exchange rate and might intervene at any given moment as of now. That means a substantial move could unfold, which would knock out the Greenback for a moment.
On the upside, the biggest challenge remains 106.52, the year-to-date high from April 16. A rally to 107.35, a level not seen since October 2023, would need to be driven by a surprise uptick in US inflation or a further hawkish shift from the Fed.
On the downside, 105.53 is the first support ahead of a trifecta of Simple Moving Averages (SMA). First is the 55-day SMA at 105.27, safeguarding the 105.00 round figure. A touch lower, near 104.72 and 104.46, both the 100-day and the 200-day SMA form a double layer of protection to support any declines. Should this area be broken, look for 104.00 to salvage the situation.
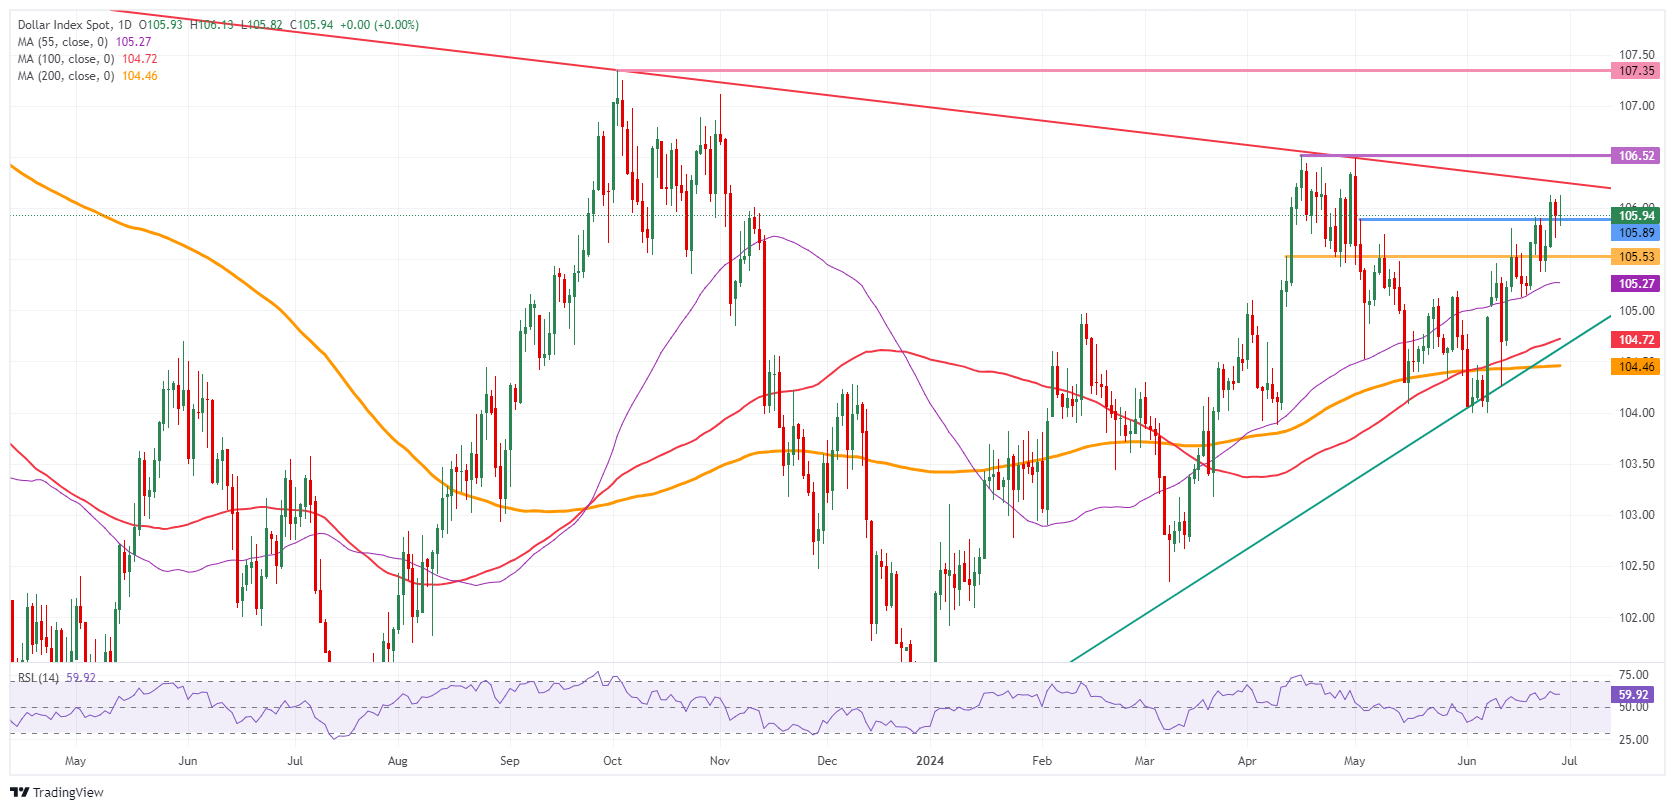
US Dollar Index: Daily Chart
Economic Indicator
Core Personal Consumption Expenditures - Price Index (MoM)
The Core Personal Consumption Expenditures (PCE), released by the US Bureau of Economic Analysis on a monthly basis, measures the changes in the prices of goods and services purchased by consumers in the United States (US). The PCE Price Index is also the Federal Reserve’s (Fed) preferred gauge of inflation. The MoM figure compares the prices of goods in the reference month to the previous month.The core reading excludes the so-called more volatile food and energy components to give a more accurate measurement of price pressures. Generally, a high reading is bullish for the US Dollar (USD), while a low reading is bearish.
Read more.Last release: Fri May 31, 2024 12:30
Frequency: Monthly
Actual: 0.2%
Consensus: 0.3%
Previous: 0.3%
Source: US Bureau of Economic Analysis
After publishing the GDP report, the US Bureau of Economic Analysis releases the Personal Consumption Expenditures (PCE) Price Index data alongside the monthly changes in Personal Spending and Personal Income. FOMC policymakers use the annual Core PCE Price Index, which excludes volatile food and energy prices, as their primary gauge of inflation. A stronger-than-expected reading could help the USD outperform its rivals as it would hint at a possible hawkish shift in the Fed’s forward guidance and vice versa.
First round of French legislative election takes place on 30 Jun (Sunday), FX strategist at OCBC Christopher Wong notes.
Elections in France determine EUR/USD price
“France’s National Assembly has 577 seats. For an absolute majority, a party needs 289. Anyone who scores >50% of the vote with a turnout of at least a quarter of the local electorate automatically wins a seat. Candidates who fail to garner at least 12.5% of the vote will be eliminated. Those who won >12.5% of the votes will go into the second-round face-off on 7 Jul.”
“The Euro (EUR) was last at 1.07 levels. Bearish momentum on daily chart shows signs of fading while RSI was flat. 2-way trades still likely ahead of French election on Sunday. Support at 1.0660/70 levels (recent low) before 1.06 levels. Resistance at 1.0770 (50 DMA), 1.0810 (38.2% fibo retracement of 2024 high to low, 100 DMA).”
The Dollar Index (DXY) eased off recent highs, alongside the dip in UST yields, FX strategist at OCBC Christopher Wong notes.
US Core PCE has everyone’s attention
“Third reading of 1Q GDP report reinforced the view of growing strains on US consumer. Personal consumption was revised down to 1.5% (vs. 2% prior). Data focus today on PCE core (8:30pm SGT). Softer core CPI, PPI readings in May should see core PCE print lower.”
“A weaker than expected print should raise hopes for Fed rate cut. This should also tamper US Dollar (USD) gains, but hotter print may continue to fuel USD momentum.”
“DXY was last at 105.83. Bullish momentum on daily chart intact while RSI was flat. Resistance at 106.20. Support at 105.20 (21, 50 DMAs), 104.80 (61.8% fibo retracement of Oct high to 2024 low). Quarter-end and month-end flows may distort price action today.”
- USD/CHF is now probably in a short-term uptrend, with odds favoring bullish bets.
- It has broken above the last lower high, a trendline and the 50 Simple Moving Average.
- The break above the key 0.8989 resistance level provided further confirmation.
USD/CHF is probably in a short-term uptrend after breaking above the key 0.8989 resistance level (June 11 high). The reversal in trend means the odds now favor more upside going forward.
USD/CHF 4-hour Chart
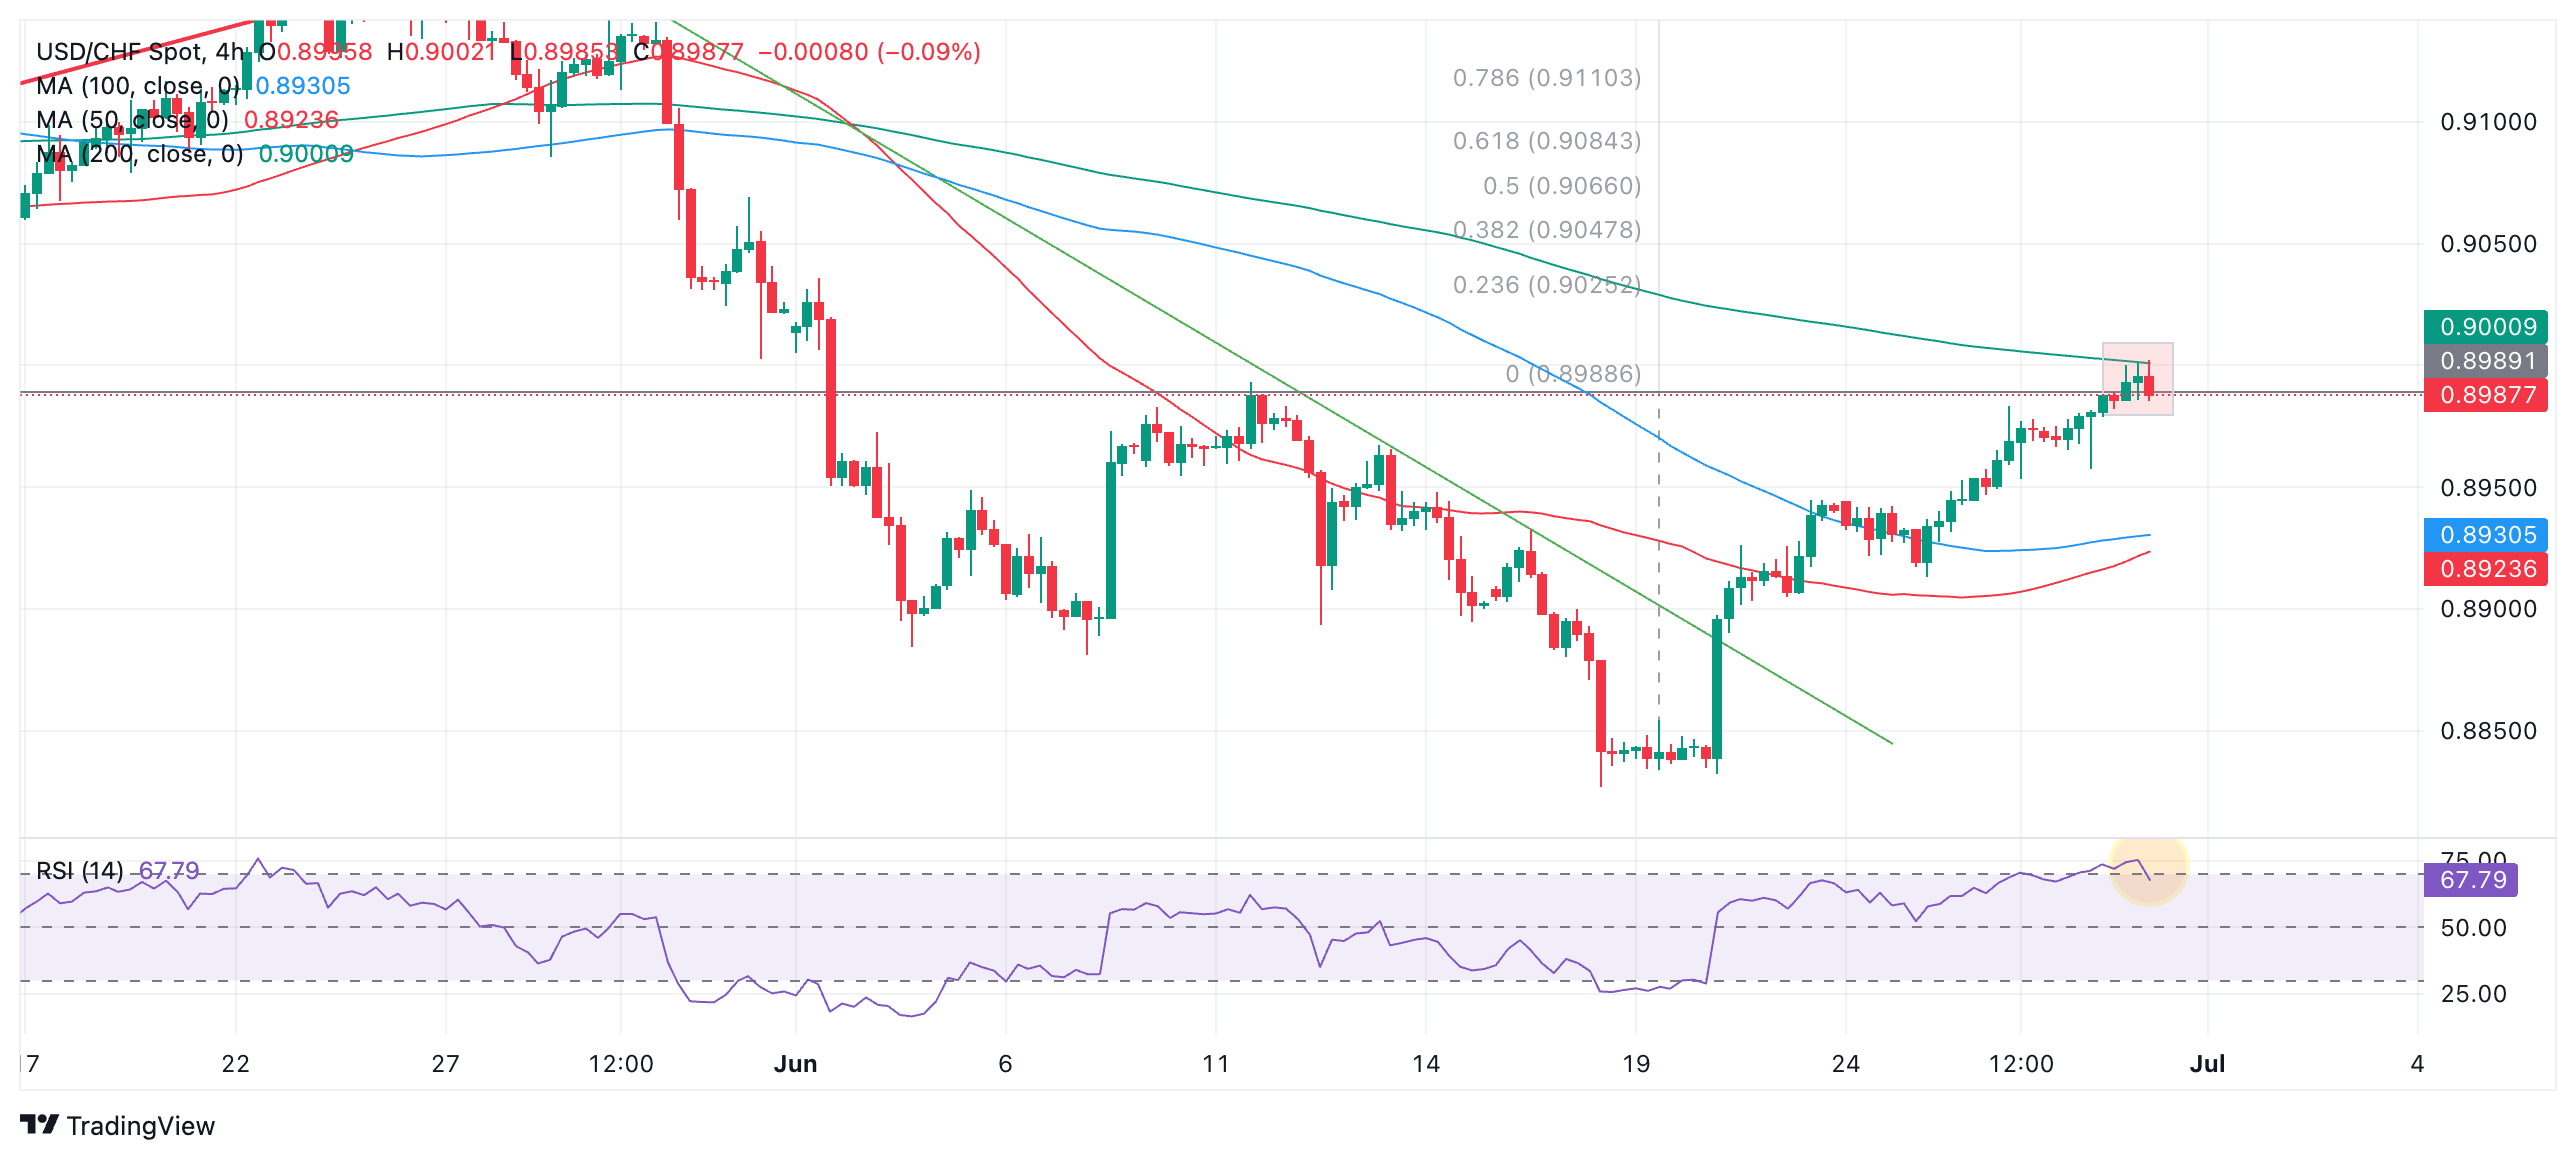
Upside targets for the pair lie at 0.9034 (50-day Simple Moving Average) followed by 0.9084, the 0.618 Fibonacci extension of the height of the bottoming pattern that evolved between June 11-27, and looks similar to a bullish Inverse Head and Shoulders (H&S) pattern. The distinctive square-shaped “head” that formed between June 18-20 is further evidence it might be an Inverse H&S.
A break on a closing basis clearly above 0.9000, and the green 200-period SMA would provide bullish confirmation of a continuation of the trend.
There are, however, signs a pullback may be evolving in the very near term. The Relative Strength Index (RSI) is overbought (shaded circle) and threatening to exit the overbought zone which would be a bearish sign. Whether or not it exits the overbought zone depends on how the current 4-hour bar closes. If it ends bullishly then the RSI will remain overbought; if bearishly it will exit overbought and suggest the beginning of a pullback.
Another sign a pullback may be developing is the Tweezer Top Japanese candlestick bearish reversal pattern (red shaded rectangle) that has formed over the past two candles. Tweezer tops occur at market tops when two bars both rise up to a similar high before closing back down near the middle of the candle. The pattern formed looks much like a "tweezer". It is a fairly reliable short-term reversal sign especially if followed by a bearish third candle. In this case the third candle is in the middle of completing so its not clear whether it will be red, however, it is at the time of writing.
A pullback, if it evolves, would be expected to fall to support at around the 0.8950s initially, from where it might turn around and begin rising again, in line with the dominant short-term uptrend.
- The Japanese Yen starts Friday with a fresh multi-decade low print.
- Japanese Finance Minister Shun’ichi Suzuki “sense of urgency” comments failed to revert price action.
- The US Dollar Index hovers around 106.00 again ahead of PCE inflation release.
The Japanese Yen (JPY) sees traders taunting the Japanese government yet again, with another new historic low printed in the Yen’s performance. This Friday 161.27 was briefly hit before falling back to below 161.00. The move comes with Japanese Finance Minister Shun’ichi Suzuki repeated the same message from Thursday that the Japanese cabinet is “watching the FX moves with a high sense of urgency”, which now has lost its impact and sees markets defying the Ministry in order to take action.
Meanwhile, the US Dollar Index (DXY) – which gauges the value of the US Dollar against a basket of six foreign currencies – is of course in positive territory on the back of this action. Even if US data on Thursday did not allow the US Dollar to outperform, with Durable Goods flatlining and Pending Home Sales shrinking again for a second month in a row. All eyes this Friday on the US Federal Reserve’s preferred inflation gauge: the Personal Consumption Expenditures numbers.
Daily digest market movers: Suzuki lost it already
- At 02:30 GMT, Japanese Finance Minister Shun’ichi Suzuki commented he is watching FX moves with a high sense of urgency. Though this time the impact resulted in a pickup in devaluation for the Japanese Yen. Markets expected to see action this Friday, not more words and same messages.
- At 12:30 GMT, the Personal Consumption Expenditures (PCE) for May will be released. Most important will be the monthly figures:
- Headline PCE expected to head from 0.3% to 0.0%.
- Core PCE should have a soft landing from 0.2% to 0.1%.
- At 13:45 GMT, Chicago Purchase Managers Index will be released. The number is expected to remain in contraction from 35.4 to 40.
- At 14:00 GMT the University of Michigan will release June’s final reading:
- Sentiment Index expected to head from 65.6 to 65.8.
- Inflation expectations should remain stable at 3.1%.
- Equities have chosen to go out with a bang, and are printing green numbers across the globe.
- The CME Fedwatch Tool is broadly backing a rate cut in September despite recent comments from Federal Reserve (Fed) officials. The odds now stand at 57.9% for a 25-basis-point cut. A rate pause stands at a 35.9% chance, while a 50-basis-point rate cut has a slim 6.2% possibility.
- The Overnight indexed Swap curve for Japan shows a 57.9% chance of a rate hike on July 31, and a smaller 19.8% chance for a hike on September 20.
- The US 10-year benchmark rate trades around the middle of this week’s range near 4.30%.
- The benchmark 10-year Japan Treasury Note (JGB) trades around 1.05%, and is easing a touch for this week.
USD/JPY Technical Analysis: If tomorrow never comes
The USD/JPY has just printed a fresh multi-decade high this Friday. The catalyst for the move was the same as the one that triggered a bit of a recovery on Thursday: the words from Japanese Finance Minister Shun’ichi Suzuki. It becomes clear that markets have bought one time into these comments, and now want to see action, which is pushing the Japanese government into a corner and interventions are really looking inevitable.
Although the Relative Strength Index (RSI) is overbought in the daily chart, a correction could still take a few more days. Should PCE data come out further disinflationary, that would not be enough to drive USD/JPY down to 151.91. Instead, look at the 55-day Simple Moving Average (SMA) at 156.53 and the 100-day SMA at 153.81 for traders to quickly build a pivot on and try to test highs again, testing the Japanese deep pockets again.
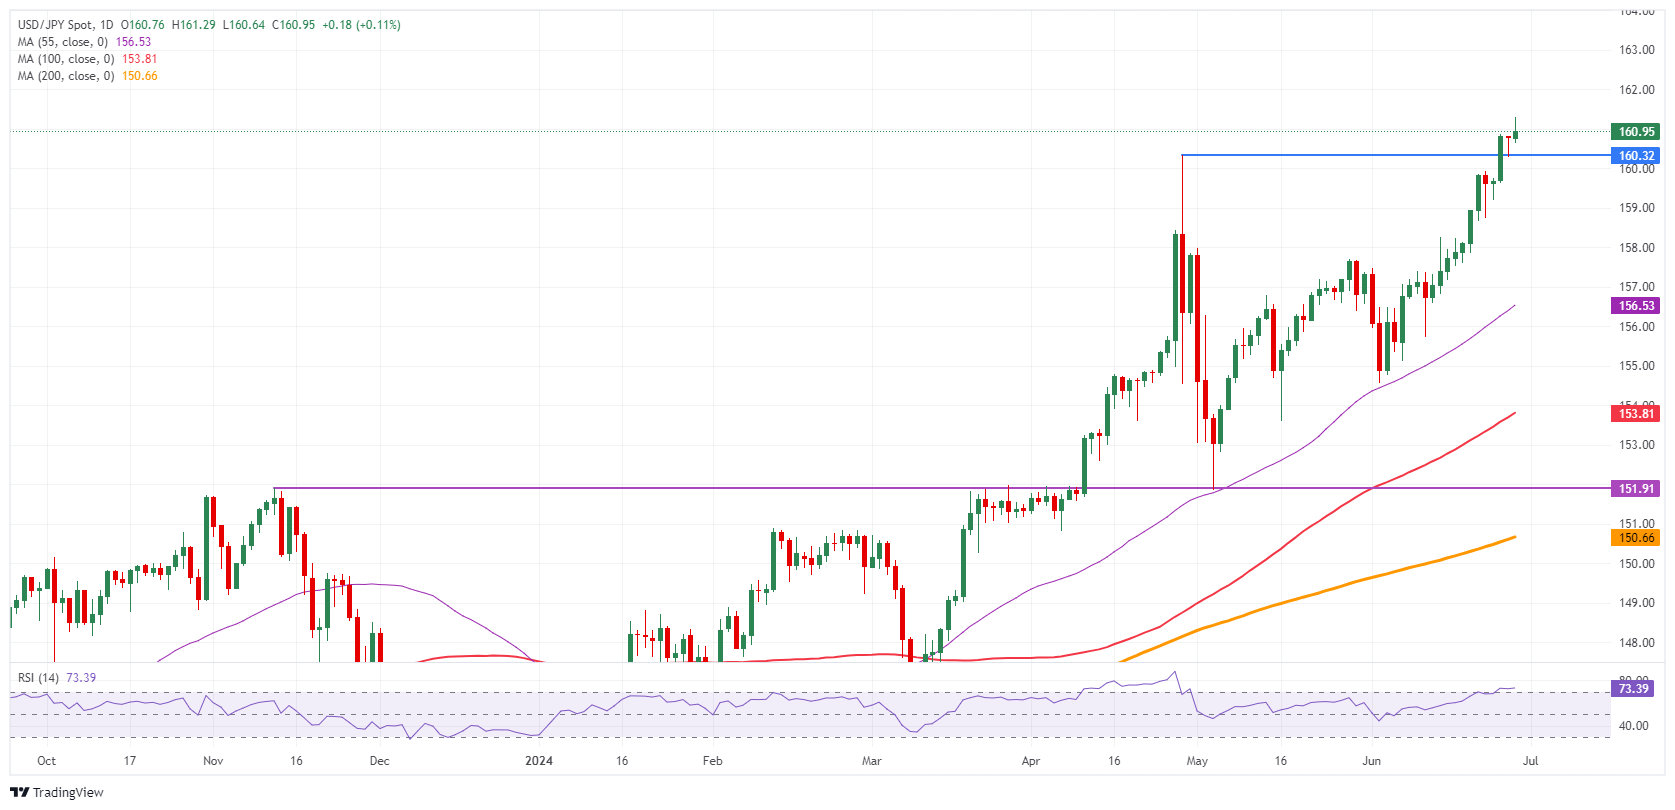
USD/JPY Daily Chart
Japanese Yen PRICE Today
The table below shows the percentage change of Japanese Yen (JPY) against listed major currencies today. Japanese Yen was the strongest against the Swiss Franc.
| USD | EUR | GBP | JPY | CAD | AUD | NZD | CHF | |
|---|---|---|---|---|---|---|---|---|
| USD | -0.06% | -0.14% | -0.18% | -0.09% | -0.19% | -0.03% | 0.04% | |
| EUR | 0.06% | -0.08% | -0.14% | -0.04% | -0.14% | 0.02% | 0.09% | |
| GBP | 0.14% | 0.08% | -0.08% | 0.03% | -0.06% | 0.10% | 0.15% | |
| JPY | 0.18% | 0.14% | 0.08% | 0.07% | -0.01% | 0.14% | 0.23% | |
| CAD | 0.09% | 0.04% | -0.03% | -0.07% | -0.11% | 0.06% | 0.11% | |
| AUD | 0.19% | 0.14% | 0.06% | 0.00% | 0.11% | 0.16% | 0.21% | |
| NZD | 0.03% | -0.02% | -0.10% | -0.14% | -0.06% | -0.16% | 0.05% | |
| CHF | -0.04% | -0.09% | -0.15% | -0.23% | -0.11% | -0.21% | -0.05% |
The heat map shows percentage changes of major currencies against each other. The base currency is picked from the left column, while the quote currency is picked from the top row. For example, if you pick the Japanese Yen from the left column and move along the horizontal line to the US Dollar, the percentage change displayed in the box will represent JPY (base)/USD (quote).
GBP/USD is edging higher today – helped in part by an upward revision to the first quarter GDP data, Global Head of Markets at ING Chris Turner notes.
Positive quarter GDP pushed Sterling upwards
“Encouragingly, consumption seemed to be the biggest driver here. However, we still forecast the Bank of England (BoE) will begin cutting rates in August and will start to signal that in speeches once the 4 July general election has passed.”
“Somewhat amazingly, UK rates are still priced very similarly to the US. We have a much greater conviction that UK rates will come lower and that Pound Sterling (GBP) will be dragged lower too. GBP/CHF has had a decent bounce off of 1.1200, but we look for the move to stall ahead of 1.1400 and a return to 1.12 this summer.”
- WTI looks all set to close on a bullish note for a straight third week.
- Firm Fed rate-cut prospects have improved Oil price appeal.
- Upside risks to the widening Middle East crisis have stemmed supply concerns.
West Texas Intermediate (WTI), futures on NYMEX, post a fresh eight-week high near $82.00 in Friday’s European session. The Oil price is set to close on a positive note for the straight third week amid firm speculation that the Federal Reserve (Fed) will start reducing interest rates from the September meeting.
According to the CME FedWatch tool, traders see a 64% chance of the central bank reducing interest rates from their current levels in the September meeting. The tool also shows that there will be two rate cuts this year instead of one, as projected by Fed officials in their latest dot plot.
For fresh cues on the interest rate outlook, investors will pay attention to the United States (US) core Personal Consumption Expenditure price index (PCE) data for May, which will be published at 12:30 GMT. Annually, price pressures are estimated to have decelerated to 2.6% from the prior release of 2.8%. On month-on-month, the underlying inflation data is expected to have grown at a slower pace of 0.1% from the prior release of 0.2%.
Soft inflation figures would boost expectations of early rate cuts by the Fed. The scenario will improve the overall demand outlook, which will be favorable for the Oil price.
On the geopolitical front, deepening risks of widening Middle East tensions have also prompted the Oil price’s appeal. Israeli Defense Minister Yoav Gallant warned a massacre in Lebanon if Hezbollah launches a war. The spread of war from Gaza to Lebanon would result in supply chain disruptions.
Brent Crude Oil FAQs
Brent Crude Oil is a type of Crude Oil found in the North Sea that is used as a benchmark for international Oil prices. It is considered ‘light’ and ‘sweet’ because of its high gravity and low sulfur content, making it easier to refine into gasoline and other high-value products. Brent Crude Oil serves as a reference price for approximately two-thirds of the world's internationally traded Oil supplies. Its popularity rests on its availability and stability: the North Sea region has well-established infrastructure for Oil production and transportation, ensuring a reliable and consistent supply.
Like all assets supply and demand are the key drivers of Brent Crude Oil price. As such, global growth can be a driver of increased demand and vice versa for weak global growth. Political instability, wars, and sanctions can disrupt supply and impact prices. The decisions of OPEC, a group of major Oil-producing countries, is another key driver of price. The value of the US Dollar influences the price of Brent Crude Oil, since Oil is predominantly traded in US Dollars, thus a weaker US Dollar can make Oil more affordable and vice versa.
The weekly Oil inventory reports published by the American Petroleum Institute (API) and the Energy Information Agency (EIA) impact the price of Brent Crude Oil. Changes in inventories reflect fluctuating supply and demand. If the data shows a drop in inventories it can indicate increased demand, pushing up Oil price. Higher inventories can reflect increased supply, pushing down prices. API’s report is published every Tuesday and EIA’s the day after. Their results are usually similar, falling within 1% of each other 75% of the time. The EIA data is considered more reliable, since it is a government agency.
OPEC (Organization of the Petroleum Exporting Countries) is a group of 13 Oil producing nations who collectively decide production quotas for member countries at twice-yearly meetings. Their decisions often impact Brent Crude Oil prices. When OPEC decides to lower quotas, it can tighten supply, pushing up Oil prices. When OPEC increases production, it has the opposite effect. OPEC+ refers to an expanded group that includes ten extra non-OPEC members, the most notable of which is Russia.
- The Mexican Peso recovers the losses made following the Banxico meeting on Thursday.
- A change in the distribution of voting and language of the statement suggests a higher change of interest-rate cuts in the future.
- USD/MXN trades in volatile ups and downs with no clear trend in the short-term.
The Mexican Peso (MXN) recovers most of the losses it endured after the Bank of Mexico (Banxico) meeting on Thursday. Banxico decided to leave interest rates unchanged at 11.00% and although the decision was widely expected, the change in the language of the statement and the division of voting were not.
These changes suggest Banxico is more likely to cut interest rates in the future than was previously supposed (dovishness). This, in turn, had a moderately weakening effect on the Mexican Peso, since lower interest rates are generally bearish for currencies because they attract lower foreign capital inflows.
At the time of writing, one US Dollar (USD) buys 18.36 Mexican Pesos, EUR/MXN is trading at 19.64, and GBP/MXN at 23.21.
Mexican Peso weakens after changes to voting and Banxico language
The Mexican Peso recovers the losses incurred following the Banxico policy meeting. Several changes to the language of the accompanying statement and the inclusion of a single vote to cut interest rates – by Omar Mejia – were new developments that gave the meeting a dovish slant.
The key changes to the statement were as follows:
- At the previous meeting one member had voted to raise interest rates by 0.25%, in contrast at the June meeting a member voted to cut interest rates by 0.25%.
- Overall it gave little weight to the Peso’s devaluation, according to analysts at Rabobank.
- “Of note was the seemingly little weight the Bank placed on recent MXN depreciation filtering through to higher inflation. Overall, we would argue there is a dovish tilt that leaves the door wide open to further rate cuts this year,” Rabobank said in its note.
- Nevertheless, near-term inflation forecasts were revised up due to pass-through from the weaker Mexican Peso, however, longer-term forecasts were left unchanged.
- New language was added about economic activity slowing down, including “the balance of risks to growth of economic activity is biased to the downside”.
- The same mention of slowing activity preceded the interest-rate cut in March, according to economists at advisory service Capital Economics.
- Further, Banxico added that it saw scope for, “discussing reference rate adjustments”.
- “Our sense is that policymakers have opened the door to a 25bp cut at the August meeting,” said Capital Economics, adding “Even so, once the easing cycle is resumed, we expect that rates will be lowered more gradually than most anticipate.”
- Rabobank expects two 0.25% rate cuts from Banxico in 2024, with a policy rate of 10.50% to end the year.
- Capital Economics are more dovish, expecting four rate cuts and an end-of-year policy rate of 10.00%.
Technical Analysis: USD/MXN displays volatility
USD/MXN rose after the Banxico meeting to touch a weekly high of 18.60, however, it has since fallen back down to the 18.30s.
The pair moved up after the formation of a three-wave ABC correction. This suggests the possibility the pair might not be correcting the short-term downtrend but instead has entered a short-term uptrend.
USD/MXN 4-hour Chart
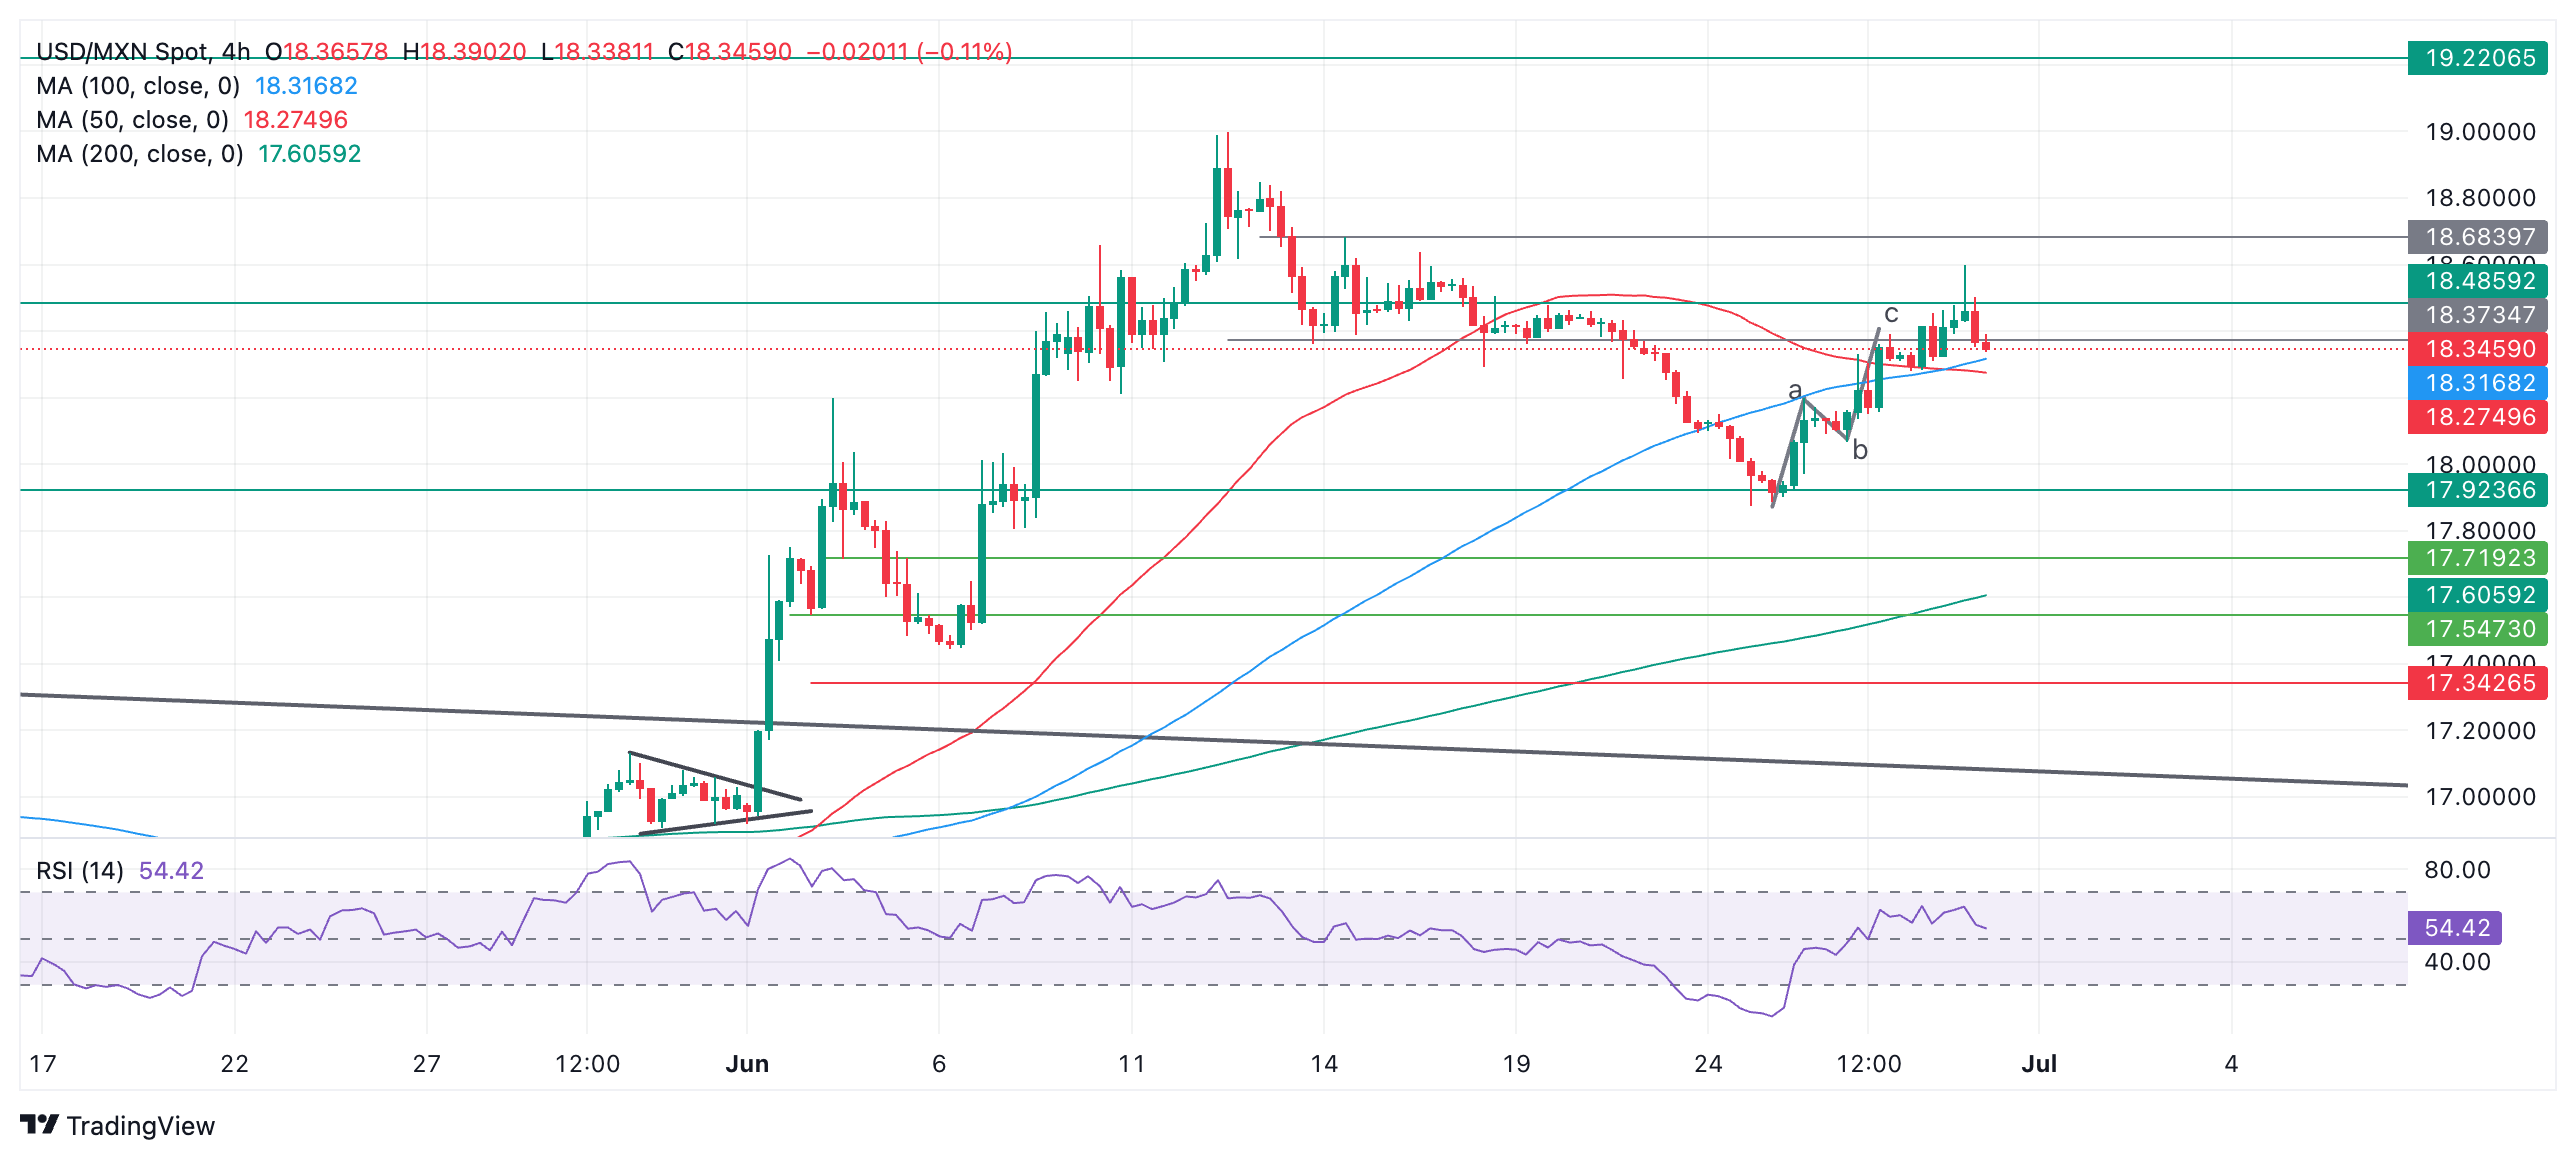
However, the evidence is not strong either way and ultimately the direction of the short-term trend is unclear at the moment.
A move below 18.06 (June 26 low) would suggest the downtrend was resuming and probably see a continuation down to 17.87 (June 24 low).
Alternatively, if USD/MXN rallies and breaks above 18.60 (June 28 high), it is likely to continue up to 18.68 (June 14 high), followed by 19.00 (June 12 high). A break above 19.00 would provide strong confirmation of a resumption of the short-and-intermediate term uptrend.
The direction of the long-term trend remains in doubt.
Economic Indicator
Central Bank Interest Rate
The Bank of Mexico announces a key interest rate which affects the whole range of interest rates set by commercial banks, building societies and other institutions for their own savers and borrowers. Generally speaking, if the central bank is hawkish about the inflationary outlook of the economy and rises the interest rates it is positive, or bullish, for the Mexican Peso.
Read more.Last release: Thu Jun 27, 2024 19:00
Frequency: Irregular
Actual: 11%
Consensus: 11%
Previous: 11%
Source: Banxico
It looks like investors are already bracing for the outcome of Sunday's first round of French parliamentary elections. The 10-year OAT-Bund sovereign yield spread is trading at a wide 82bp and EUR/USD is trading around 1.07, Global Head of Markets at ING Chris Turner notes.
Euro to go back under 1.07 ahead of the French elections
“The question for the market is whether a Le Pen government looks at the French bond market and starts dropping some of its plans for seemingly unfunded tax cuts. Our eurozone team suspects it will be too early for a new government to substantially water down its pre-election pledges and that it may well be tough road into September.”
“Ahead of the weekend election, today sees the European Central Bank (ECB) release its consumer inflation expectations for May. Three-year expectations currently sit at 2.4% and a drop under there would add to expectations that the ECB could cut again in September.
Today's EUR/USD game plan could see a brief spike to 1.0745/60 on the lunchtime US inflation data, but we would not be surprised to see it end the day back under 1.07.
Richmond Federal Reserve President Thomas Barkin said on Friday that he will proceed deliberately on monetary policy while delivering prepared remarks at the Global Interdependence Center in Paris, per Reuters.
Key takeaways
"Lags are still are playing out, policy tightening will eventually slow the economy further."
"Agility is key, must adjust according to new information."
"Services and shelter price-setters still have room to push prices higher."
"Open to the idea that rate hikes are not constraining economy as much as we think, given remarkable strength we are seeing."
Market reaction
These comments don't seem to be impacting the US Dollar's valuation in a meaningful way. At the time of press, the US Dollar Index was virtually unchanged on the day at 105.90.
There is a very strong consensus around a 0.1% month-on-month core PCE deflator for May today. Remember this is the Federal Reserve's (Fed) preferred measure of inflation and following a 0.2% MoM prior reading should give the Fed confidence to start cutting rates later this year, Global Head of Markets at ING Chris Turner notes.
US PCE poses downside risks for the US Dollar
“The market does not fully price in the first Fed rate cut until November and thus there should be room for US short-dated rates to drop as focus shifts more squarely to a September rate cut. US two-year Treasury yields have been consolidating just above 4.70% for the last couple of weeks and a 0.1% MoM core PCE on Friday should make them break lower and drag the dollar with it.”
“The challenge, however, is politics. Last night's presidential debate on CNN saw 67% polling awarding the victory to Donald Trump. We see a potential Trump administration as more positive for the dollar both via looser fiscal policy and also via a more aggressive trade/tariff environment.”
“The Dollar Index (DXY) is now hovering around 106 helped in part by the unchecked rise in USD/JPY. Here, the market seems reasonably calm. This makes it more difficult for Japanese authorities to intervene. DXY will face downside risks from the US inflation data, but we suspect it will find buyers in the 105.50/60 region as investors will prefer to hold dollars over the weekend.”
- EUR/USD drops to near 1.0700 amid uncertainty ahead of US core PCE Inflation data for May.
- The US Dollar exhibits strength on the Fed’s hawkish remarks.
- The near-term outlook of the Euro is uncertain ahead of French elections and the Eurozone preliminary HICP.
EUR/USD edges down to near the crucial support of 1.0700 in Friday’s European session. The major currency pair corrects modestly as the market sentiment is slightly cautious ahead of the United States (US) core Personal Consumption Expenditure price index (PCE) data for May, which will be published on Friday at 12:30 GMT.
The underlying inflation data would influence market speculation on the Federal Reserve (Fed) reducing interest rates from the September meeting, according to the CME FedWatch tool, which also shows that there will be two rate cuts this year. Contrary to market expectations, Fed officials see only one rate cut this year as signaled in the latest dot plot.
On Thursday, Atlanta Fed Bank President Raphael Bostic said rate cuts would become appropriate when they are convinced that inflation is on a clear path towards 2%. When asked about a concrete timeframe for rate cuts, Bostic said "I continue to believe conditions will likely call for a cut in the federal funds rate in the fourth quarter of this year," Reuters reported.
The US PCE report is expected to show that core price pressures grew at a slower pace of 0.1% against 0.2% in April month-on-month. Annually, the underlying inflation is projected to have decelerated to 2.6% from 2.8% in April.
Daily digest market movers: EUR/USD remains on toes ahead of key Eurozone events
- EUR/USD falls to near 1.0700 as the Euro’s outlook appears to be uncertain ahead of French elections outcome and the Eurozone preliminary Harmonized Index of Consumer Prices (HICP) data for June, which will be published on Tuesday.
- Investors worry that new government formation in France could boost spending plans, which could result in a deepening budget crisis. The uncertainty over French elections deepened after French President Emmanuel Macron called for a snap election when his party suffered defeat in the European elections to Marine Le Pen’s far-right National Rally (RN). However, the victory of the National Rally is not inevitable due to the formation of the French left, also known as the Popular Front.
- Investors will pay close attention to the Eurozone preliminary HICP data as it will provide clues about European Central Bank’s (ECB) subsequent rate cuts. The ECB began its rate-cut cycle from early June’s policy meeting in which it reduced its key rates by 25 basis points (bps).
- Meanwhile, the broader decline in price pressures in major nations of the Eurozone has boosted expectations of more rate cuts by the ECB. In France, the preliminary annual Consumer Price Index (CPI) declined expectedly to 2.5% from the prior release of 2.6%. Annual HICP in Spain decelerated to 3.5% from the former reading of 3.8% but remained higher than expectations of 3.4%, while price pressures in Italy were mixed.
Technical Analysis: EUR/USD hovers inside Symmetrical Triangle formation
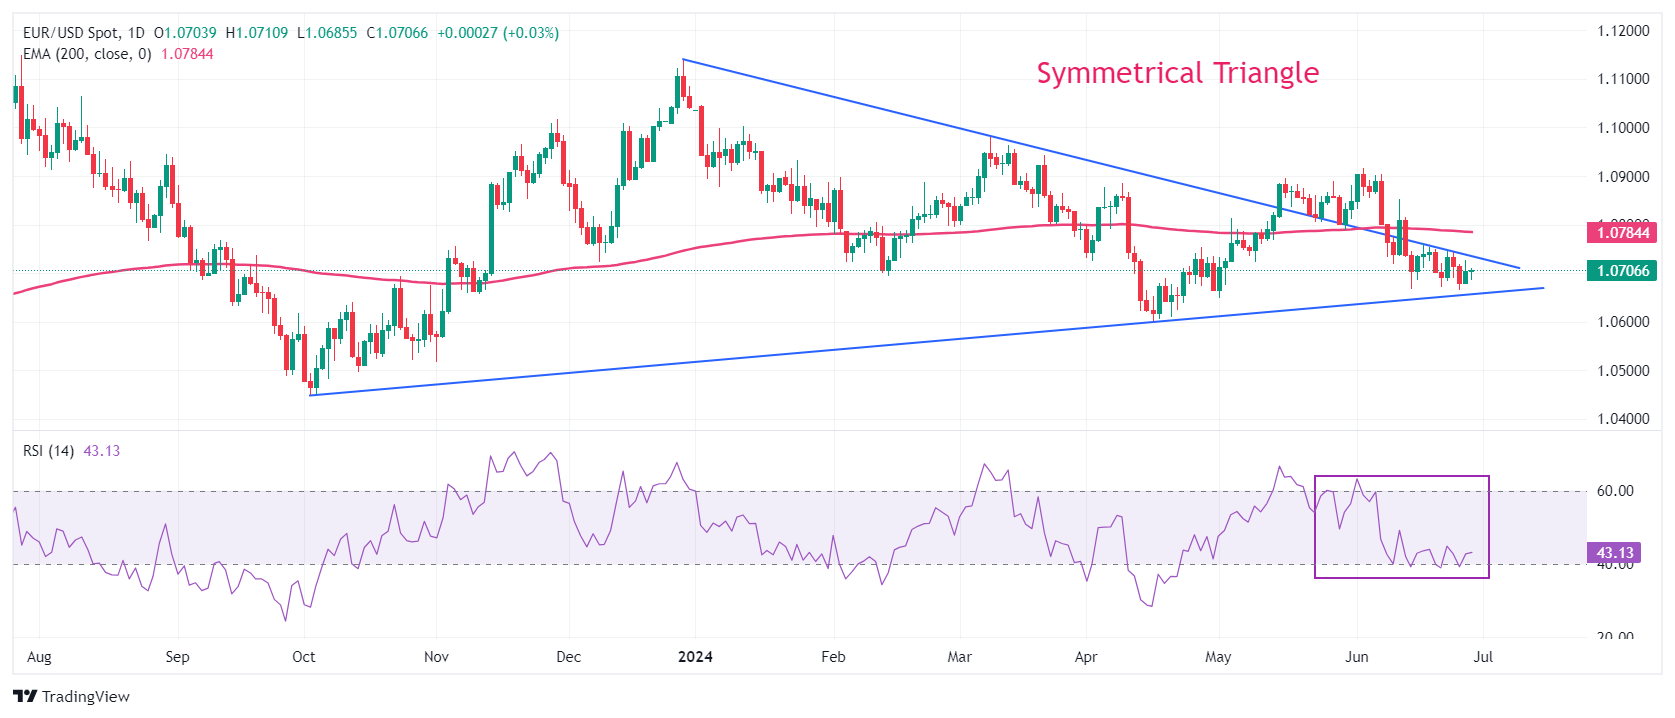
EUR/USD trades inside Thursday’s trading range as investors await the US core PCE inflation reading to make decisive positions. The downward-sloping border of the Symmetrical Triangle pattern formation on a daily time frame continues to remain a major barrier for the Euro bulls. A fresh downside would appear if the asset delivers a decisive breakdown of the above-mentioned chart pattern.
The shared currency pair establishes below the 200-day Exponential Moving Average (EMA) near 1.0780, suggesting that the overall trend is bearish.
The 14-period Relative Strength Index (RSI) hovers near 40.00. A bearish momentum would trigger if the oscillator slips below the same.
Euro FAQs
The Euro is the currency for the 20 European Union countries that belong to the Eurozone. It is the second most heavily traded currency in the world behind the US Dollar. In 2022, it accounted for 31% of all foreign exchange transactions, with an average daily turnover of over $2.2 trillion a day. EUR/USD is the most heavily traded currency pair in the world, accounting for an estimated 30% off all transactions, followed by EUR/JPY (4%), EUR/GBP (3%) and EUR/AUD (2%).
The European Central Bank (ECB) in Frankfurt, Germany, is the reserve bank for the Eurozone. The ECB sets interest rates and manages monetary policy. The ECB’s primary mandate is to maintain price stability, which means either controlling inflation or stimulating growth. Its primary tool is the raising or lowering of interest rates. Relatively high interest rates – or the expectation of higher rates – will usually benefit the Euro and vice versa. The ECB Governing Council makes monetary policy decisions at meetings held eight times a year. Decisions are made by heads of the Eurozone national banks and six permanent members, including the President of the ECB, Christine Lagarde.
Eurozone inflation data, measured by the Harmonized Index of Consumer Prices (HICP), is an important econometric for the Euro. If inflation rises more than expected, especially if above the ECB’s 2% target, it obliges the ECB to raise interest rates to bring it back under control. Relatively high interest rates compared to its counterparts will usually benefit the Euro, as it makes the region more attractive as a place for global investors to park their money.
Data releases gauge the health of the economy and can impact on the Euro. Indicators such as GDP, Manufacturing and Services PMIs, employment, and consumer sentiment surveys can all influence the direction of the single currency. A strong economy is good for the Euro. Not only does it attract more foreign investment but it may encourage the ECB to put up interest rates, which will directly strengthen the Euro. Otherwise, if economic data is weak, the Euro is likely to fall. Economic data for the four largest economies in the euro area (Germany, France, Italy and Spain) are especially significant, as they account for 75% of the Eurozone’s economy.
Another significant data release for the Euro is the Trade Balance. This indicator measures the difference between what a country earns from its exports and what it spends on imports over a given period. If a country produces highly sought after exports then its currency will gain in value purely from the extra demand created from foreign buyers seeking to purchase these goods. Therefore, a positive net Trade Balance strengthens a currency and vice versa for a negative balance.
Barring a break below 7.2920, the US Dollar (USD) could rise and test the major resistance level at 7.3100. USD could break above 7.3100, but it is too early to tell if the next significant resistance at 7.3400 will come into view, UOB Group analysts suggest.
USD is unlikely to break above 7.3100
24-HOUR VIEW: “On Wednesday, USD soared to 7.3080 before pulling back. Yesterday (Thursday), we indicated that ‘the pullback from the high in overbought conditions suggests that instead of continuing to rise, USD is more likely to trade in a range, probably between 7.2920 and 7.3060.’ USD subsequently traded in a narrower range than expected (7.2941/7.3040). Despite the quiet price movements, the underlying tone has improved to some extent. Today, barring a break below 7.2920 (minor support is at 7.2970), USD could rise and test the major resistance at 7.3100. From here, there does not appear to be sufficient momentum for USD to break clearly above this level.”
1-3 WEEKS VIEW: “There have been no significant changes since our update yesterday (27 Jun, spot at 7.2990). As indicated, after the strong advance in USD two days earlier, there is there is still room for USD to rise further. However, while USD could break above 7.3100, it is too early to tell if the next significant resistance at 7.3400 will come into view. Overall, only a breach of 7.2800 (no ‘strong support’ level) would mean that the advance in USD from last has ended.”
The US Dollar (USD) is likely to trade in a range between 160.20 and 161.00. Strong momentum suggests further USD strength. Resistance levels are at 161.00 and 161.50, UOB Group analysts note.
USD needs to breach 159.40 to become weaker
24-HOUR VIEW: “After USD surged two days ago, we indicated yesterday that it ‘could test 161.00 first before levelling off.’ However, USD traded in a range between 160.27 and 160.86, closing largely unchanged at 160.74 (-0.03%). The price action appears to be part of range trading phase. Today, USD is likely to trade between 160.20 and 161.00.”
1-3 WEEKS VIEW: “We continue to hold the same view as yesterday (27 Jun, spot at 160.60). As highlighted, ‘while conditions are severely overbought, strong momentum suggests further USD strength.’ Resistance levels are at 161.00 and 161.50. On the downside, should USD breach 159.40 (no change in ‘strong support’ level), it would suggest that the USD strength from early last week has come to an end.”
The New Zealand Dollar (NZD) is likely to trade sideways between 0.6065 and 0.6115. It may continue to weaken, and the next support level to watch is 0.6040, UOB Group analysts say.
A breach above 0.6135 to end the NZD weakness
24-HOUR VIEW: “While we expected further NZD weakness yesterday, we indicated that ‘the major support at 0.6040 is unlikely to come under threat.’ We also indicated that ‘there is another support at 0.6060.’ NZD weakened less than expected to 0.6069 before recovering to end the day unchanged at 0.6083. The price action is likely part of a sideways trading phase. Today, we expect NZD to trade between 0.6065 and 0.6115.”
1-3 WEEKS VIEW: “There is not much to add to our update from yesterday (27 Jun, spot at 0.6080). As highlighted, NZD is likely to continue to weaken. The next support level to watch is 0.6040. Overall, only a breach of 0.6135 (no change in ‘strong resistance’ level) would mean that the NZD weakness from early last week has ended.”
Silver prices (XAG/USD) rose on Friday, according to FXStreet data. Silver trades at $29.28 per troy ounce, up 1.04% from the $28.98 it cost on Thursday.
Silver prices have increased by 23.05% since the beginning of the year.
| Unit measure | Silver Price Today in USD |
|---|---|
| Troy Ounce | 29.28 |
| 1 Gram | 0.94 |
The Gold/Silver ratio, which shows the number of ounces of Silver needed to equal the value of one ounce of Gold, stood at 79.54 on Friday, down from 80.34 on Thursday.
Silver FAQs
Silver is a precious metal highly traded among investors. It has been historically used as a store of value and a medium of exchange. Although less popular than Gold, traders may turn to Silver to diversify their investment portfolio, for its intrinsic value or as a potential hedge during high-inflation periods. Investors can buy physical Silver, in coins or in bars, or trade it through vehicles such as Exchange Traded Funds, which track its price on international markets.
Silver prices can move due to a wide range of factors. Geopolitical instability or fears of a deep recession can make Silver price escalate due to its safe-haven status, although to a lesser extent than Gold's. As a yieldless asset, Silver tends to rise with lower interest rates. Its moves also depend on how the US Dollar (USD) behaves as the asset is priced in dollars (XAG/USD). A strong Dollar tends to keep the price of Silver at bay, whereas a weaker Dollar is likely to propel prices up. Other factors such as investment demand, mining supply – Silver is much more abundant than Gold – and recycling rates can also affect prices.
Silver is widely used in industry, particularly in sectors such as electronics or solar energy, as it has one of the highest electric conductivity of all metals – more than Copper and Gold. A surge in demand can increase prices, while a decline tends to lower them. Dynamics in the US, Chinese and Indian economies can also contribute to price swings: for the US and particularly China, their big industrial sectors use Silver in various processes; in India, consumers’ demand for the precious metal for jewellery also plays a key role in setting prices.
Silver prices tend to follow Gold's moves. When Gold prices rise, Silver typically follows suit, as their status as safe-haven assets is similar. The Gold/Silver ratio, which shows the number of ounces of Silver needed to equal the value of one ounce of Gold, may help to determine the relative valuation between both metals. Some investors may consider a high ratio as an indicator that Silver is undervalued, or Gold is overvalued. On the contrary, a low ratio might suggest that Gold is undervalued relative to Silver.
(An automation tool was used in creating this post.)
The Australian Dollar (AUD) is likely to trade in a range, probably between 0.6625 and 0.6675, UOB Group FX strategists suggest.
Momentum indicators are flat
24-HOUR VIEW: “Two days ago, AUD soared to 0.6689 before pulling back sharply. Yesterday, we held the view that ‘the sharp pullback has scope to extend, but given the lackluster momentum, any decline is unlikely to reach 0.6600.’ Our view did not materialise, as AUD traded in a range of 0.6640/0.6673, closing unchanged at 0.6648. Momentum indicators are most flat, and AUD is likely to continue to trade in a range today, probably between 0.6625 and 0.6675.”
1-3 WEEKS VIEW: “We continue to hold the same view as Monday (24 Jun, spot at 0.6640). As highlighted, the current price action is likely part of a rangetrading phase. For the time being, AUD is likely to trade between 0.6600 and 0.6685.”
- Gold is likely to witness increased volatility after the US PCE inflation data release on Friday.
- A lower PCE reading would support the yellow metal as it would, in turn, result in lower interest rates – a benefit to non-yielding Gold.
- XAU/USD has broken above a key trendline, further invalidating the bearish H&S topping pattern that had been forming.
Gold (XAU/USD) edges marginally lower, trading in the $2,320s on Friday, ahead of the main economic data event for the week, the US Personal Consumption Expenditures (PCE) – Price Index for May.
The PCE is the US Federal Reserve’s (Fed) preferred inflation gauge, and since the Fed is in charge of setting interest rates, the result could influence their trajectory.
Gold is a non-interest-bearing asset so the level of interest rates impacts its value. Higher interest rates make Gold less attractive to investors whilst the opposite is true of lower rates.
Gold could see volatility from PCE data
Gold will probably experience volatility after US PCE data is released at 12:30 GMT. The consensus estimate is for PCE inflation to fall to 2.6% year-over-year (YoY) in May from 2.7% in April, and to stay unchanged at 0.0% month-over-month (MoM) after rising 0.3% in April.
Core PCE is expected to cool to 2.6% from 2.8% previously on a YoY basis and 0.1% from 0.2% on a MoM basis.
“Our US economists think that core PCE should increase by +0.17% (MoM), based on the CPI and PPI data that we’ve already got. In turn, that would cut the year-on-year rate to 2.63% (YoY), the lowest in over three years,” says Jim Reid, Global Head of Macro at Deutsche Bank.
Fed speakers sounding more optimistic
Commentary from Fed speakers regarding the outlook for interest rates also influences Gold prices, and these were mixed on Thursday.
Atlanta Fed President Raphael Bostic said the Fed had started penciling in future rate cuts, which suggests more concrete plans rather than the vague data dependency of previous Fed-speaker comments.
Bostic expected an interest-rate cut in the fourth quarter as likely followed by four quarter-point cuts in 2025, adding that when the Fed starts cutting rates, it will be the “first in a series; that is a reason for the patience.”
Bostic also dismissed concerns flagged regarding the weakening labor market, saying, “businesses say they see no cliff ahead for the job market."
Another bugbear for the Fed has been high services-sector inflation. However, there are signs this is also cooling, according to the Atlanta Fed President.
His colleague, Fed Board of Governors member Michelle Bowman, however, was more cautious on Thursday, saying, “The Fed is not at a point yet where it can consider making a rate cut.”
Market-based gauges of what the Fed will do next are a bit more optimistic, seeing a relatively high circa 64% probability of the Fed cutting interest rates at (or before) the Fed’s September meeting. The estimate is from the CME FedWatch tool, which calculates chances using 30-day Fed Funds futures prices.
Gold’s longer-term prospects look bright
Gold’s long-term prospects remain positive according to most analysts. Geopolitical uncertainty in the Middle East, Ukraine, from climate change and tech-driven economic challenges, are all risk factors that feed the demand for Gold as a safe haven.
Gold also has a complex relationship with the US Dollar (USD). Whilst a strong US Dollar is negative for Gold because it is priced in USD, it has also lifted demand from mainly Asian central banks as a hedge against their own currencies’ devaluation against the US Dollar.
The BRICS trade confederation is also using Gold as a replacement for the US Dollar as the primary medium for global trade. Given its position as a stable, safe store of value, Gold is the most reliable alternative as a means of exchange between nations with different, often volatile domestic currencies.
“The rest of the world is trying to make sure they're not as dependent on the US Dollar. For them, gold offers another opportunity to hold an asset that is still a pretty significant store of value,” said Joy Yang, Head of Index Product Management & Marketing at MarketVector Indexes, in a recent interview with Kitco News.
Yang thinks these “global trends” will push Gold higher in the future – back up to $2,400, although the kicker will be the Fed’s decision to finally begin cutting interest rates.
Technical Analysis: Gold breaks above trendline, further invalidating H&S
Gold makes another breach of the downsloping trendline that connects the “Head” and “Right Shoulder” of the now invalidated bearish Head and Shoulders (H&S) pattern that formed on the precious metal during April, May and June.
XAU/USD Daily Chart
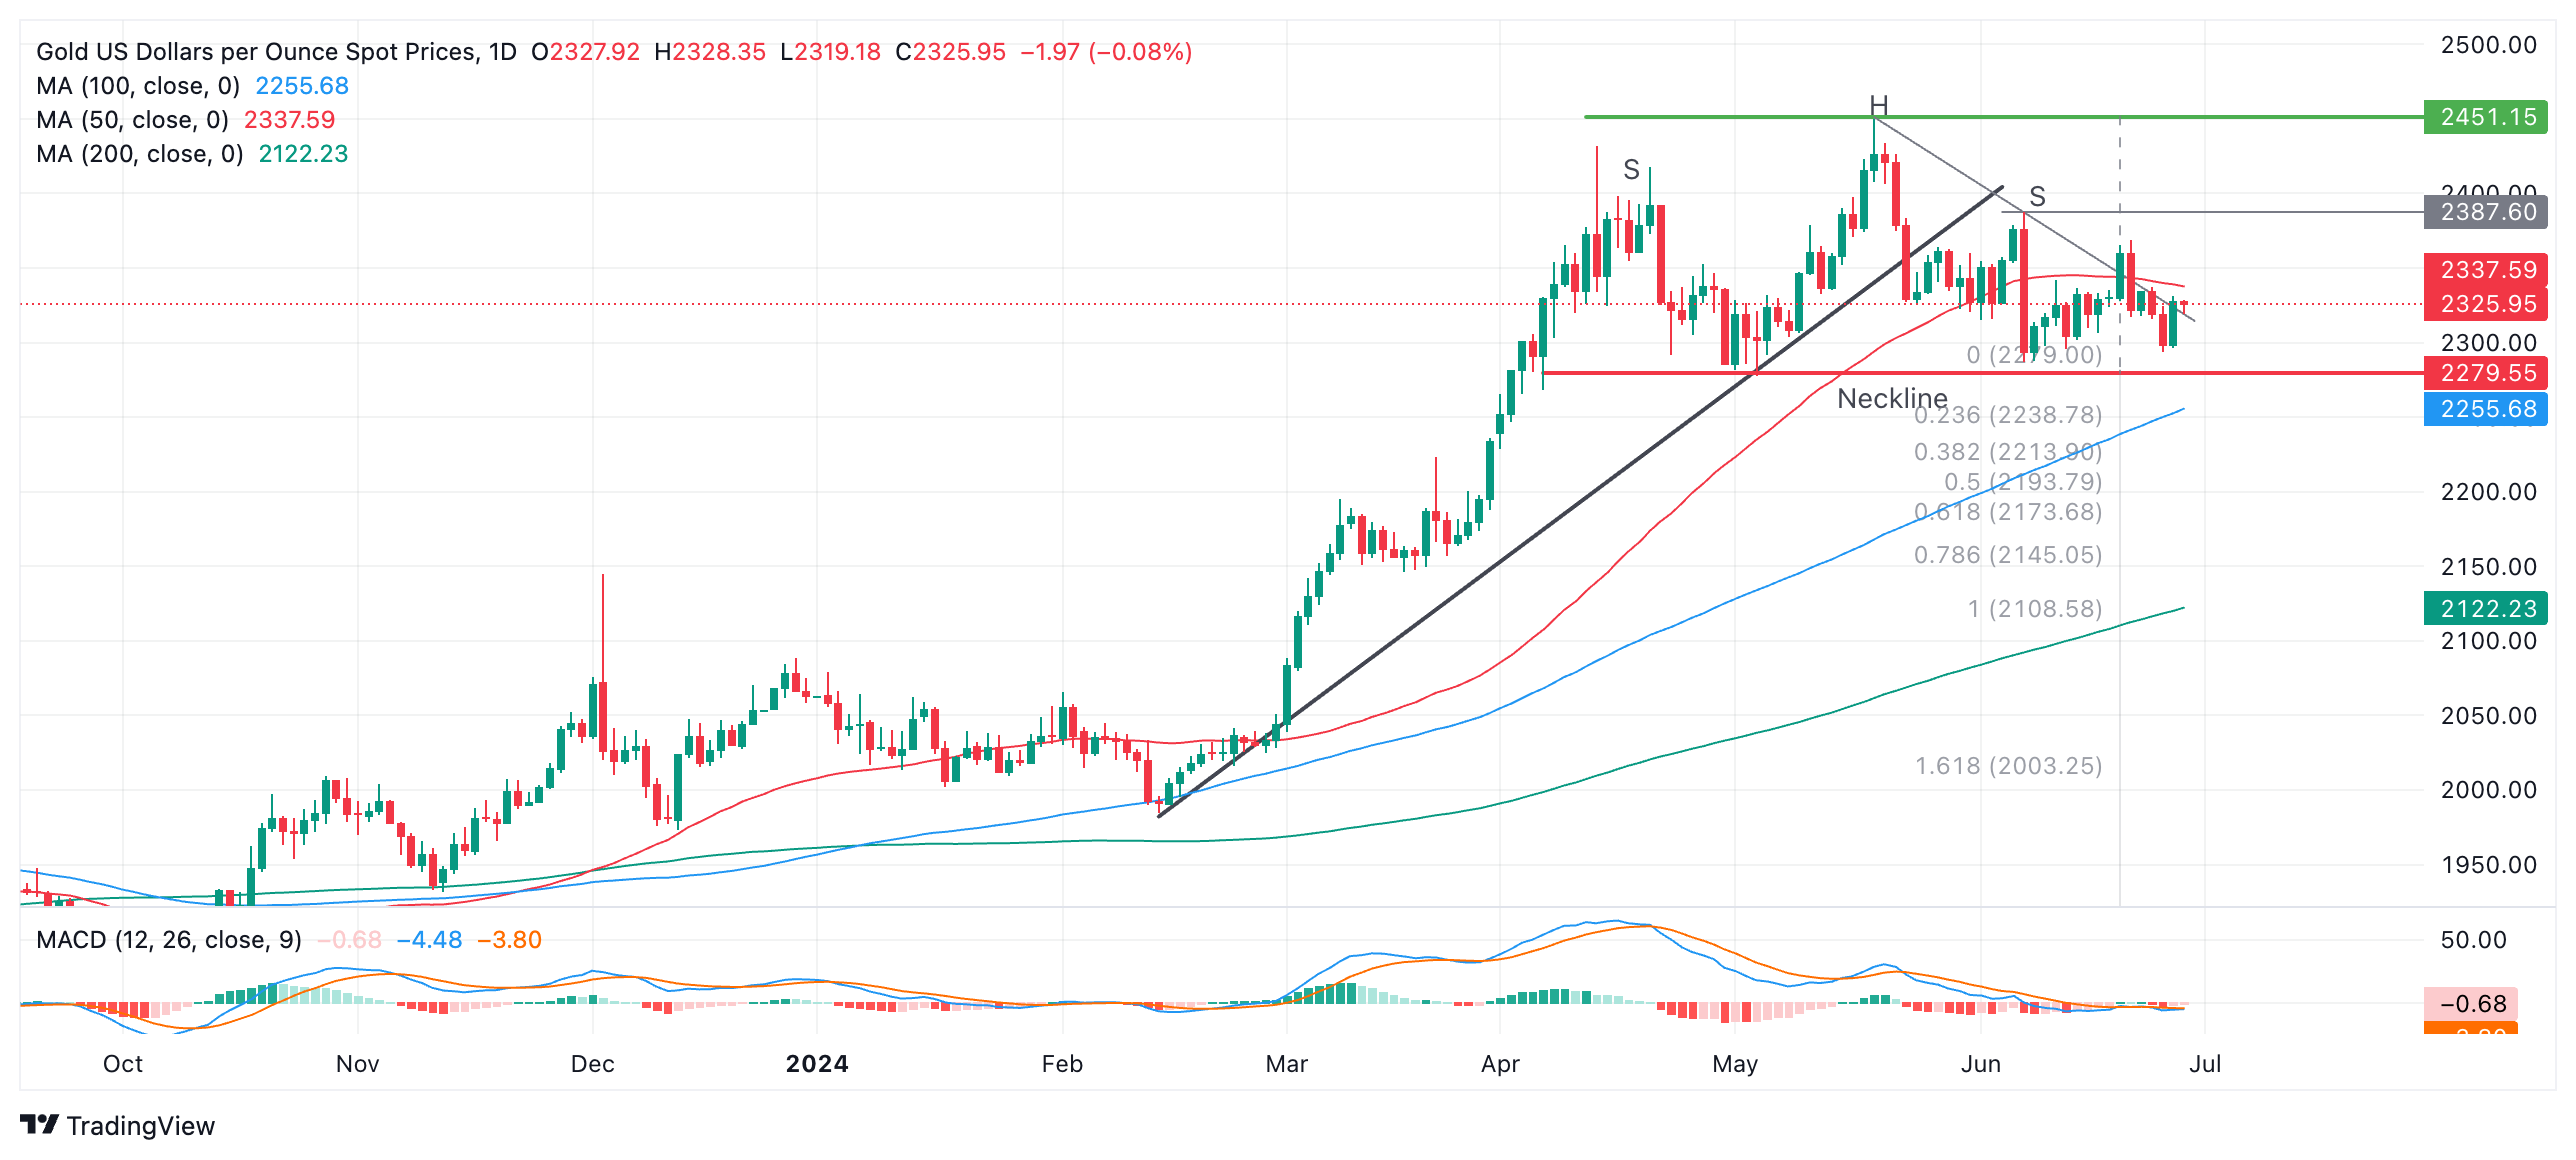
Although the breaches have invalidated the case for an orthodox H&S reversal pattern forming, it is still possible a more complex “multi-shouldered” topping pattern may have formed that might still prove bearish. Overall, the probabilities are lower, however.
If the upside trendline break holds, Gold will likely rise to the $2,369 level (high of June 21). A break above that would be an even more bullish sign, with the next target at $2,388, the June 7 high.
Alternatively, assuming the compromised topping pattern’s neckline at $2,279 is broken, a reversal lower may still follow, with a conservative target at $2,171 and a second target at $2,105 – the 0.618 ratio of the high of the pattern and the full ratio of the high of the pattern extrapolated lower.
There is a risk that the trend is now sideways in both the short and medium term. In the long term, Gold remains in an uptrend.
Economic Indicator
Core Personal Consumption Expenditures - Price Index (YoY)
The Core Personal Consumption Expenditures (PCE), released by the US Bureau of Economic Analysis on a monthly basis, measures the changes in the prices of goods and services purchased by consumers in the United States (US). The PCE Price Index is also the Federal Reserve’s (Fed) preferred gauge of inflation. The YoY reading compares the prices of goods in the reference month to the same month a year earlier. The core reading excludes the so-called more volatile food and energy components to give a more accurate measurement of price pressures." Generally, a high reading is bullish for the US Dollar (USD), while a low reading is bearish.
Read more.Next release: Fri Jun 28, 2024 12:30
Frequency: Monthly
Consensus: 2.6%
Previous: 2.8%
Source: US Bureau of Economic Analysis
After publishing the GDP report, the US Bureau of Economic Analysis releases the Personal Consumption Expenditures (PCE) Price Index data alongside the monthly changes in Personal Spending and Personal Income. FOMC policymakers use the annual Core PCE Price Index, which excludes volatile food and energy prices, as their primary gauge of inflation. A stronger-than-expected reading could help the USD outperform its rivals as it would hint at a possible hawkish shift in the Fed’s forward guidance and vice versa.
The Pound Sterling (GBP) is expected to trade between 1.2620 and 1.2670. Downward momentum is picking up again. The next level to watch is 1.2550, UOB Group analysts note.
The next level to watch is 1.2550
24-HOUR VIEW: “We highlighted yesterday that GBP could break below 1.2600. We added, ‘oversold conditions suggest that the next major support at 1.2550 is unlikely to come into view.’ However, after dipping to a low of 1.2613, GBP rebounded strongly to 1.2670 before easing to close at 1.2639 (+0.14%). The price movements are likely part of a sideways trading phase. Today, we expect GBP to trade between 1.2620 and 1.2670.”
1-3 WEEKS VIEW: “We have held a negative view in GBP since early last week. After GBP fell sharply two days ago, we highlighted yesterday (27 Jun, spot at 1.2620) that ‘downward momentum is picking up again, and a break of 1.2600 would not be surprising.’ We also highlighted that ‘the next level to watch below 1.2600 is at 1.2550.’ We did not quite expect the strong rebound that came close to our ‘strong resistance’ level at 1.2680 (high has been 1.2670). While we continue to hold the same view, given the increased in volatility, we are raising the ‘strong resistance’ level to 1.2800.”
- USD/CAD extends its winning streak due to higher yields on US Treasury bonds.
- US Core PCE inflation, the Fed's preferred inflation gauge, is forecasted to decrease to 2.6% YoY from the previous 2.8% reading.
- Canada’s GDP (MoM) is expected to grow by 0.3% in April, against the neutral growth observed in March.
USD/CAD continues to gain ground for the fourth consecutive day, trading around 1.3710 during the European session on Friday. Investors await Friday’s Core PCE Price Index inflation, which is projected to decrease year-over-year to 2.6% from the previous 2.8%. This data is seen as the Federal Reserve's (Fed) preferred inflation gauge.
Higher yields on US Treasury bonds support the US Dollar (USD) and underpin the USD/CAD pair. This could be attributed to the emergence of risk aversion after the US economy showed an expansion on Thursday. Gross Domestic Product Annualized expanded by 1.4% in Q1, slightly higher than the previous reading of 1.3%, but continuing to point to the lowest growth since the contractions in the first half of 2022.
US Dollar Index (DXY), which measures the value of the US Dollar against six other major currencies, holds ground above 106.00 with 2-year and 10-year US yields standing at 4.72% and 4.29%, respectively, at the time of writing.
Federal Reserve (Fed) Board of Governors member Michelle Bowman noted on Thursday that she is still not ready to support a central bank rate cut with inflation pressures still elevated. Bowman said, adding “We are still not yet at the point where it is appropriate to lower the policy rate, and I continue to see some upside risks to inflation,” per Reuters.
Read the full article: Inflation should ease with current Fed policy
On the Canadian Dollar’s (CAD) side, Statistics Canada is scheduled to release the country's GDP (MoM) later in the North American session. Canada’s economy is expected to grow by 0.3% in April, compared to the neutral growth observed in March.
Higher crude Oil prices limit the downside of the commodity-linked CAD, given the fact that Canada is the largest Oil exporter to the United States (US). West Texas Intermediate (WTI) crude Oil price extends gains for the third successive day, trading near $81.90 during the European session on Friday. Crude Oil prices are set to advance for the third straight week due to supply threats, which could be attributed to an escalating conflict in the Middle East.
Economic Indicator
Gross Domestic Product (MoM)
The Gross Domestic Product (GDP), released by Statistics Canada on a monthly and quarterly basis, is a measure of the total value of all goods and services produced in Canada during a given period. The GDP is considered as the main measure of Canadian economic activity. The MoM reading compares economic activity in the reference month to the previous month. Generally, a high reading is seen as bullish for the Canadian Dollar (CAD), while a low reading is seen as bearish.
Read more.
Polls declared former President Trump the winner immediately after the US presidential debate. Consumer spending figures follow negative revisions within first quarter GDP, UOB strategist Paul Donovan notes. Europe to provide preliminary June consumer price data.
Trump wins the debate, European data ahead
“Polls immediately after the US presidential debate declared former President Trump the winner. This invites increased investor scrutiny of Trump’s policies, especially around trade. The economic consequences of tariffs are relatively obvious, but there is uncertainty about how many campaign pledges will translate into policy action.”
“The cold economic realities offer US May consumer spending and income data, and the price deflator. While price data is the focus, consumer spending figures follow negative revisions within first quarter GDP. The monthly change in the consumer spending deflator should be benign, and the main concern about US inflation amongst economists is why Federal Reserve Chair Powell has seemingly not noticed rising real interest rates.”
“Japan’s Tokyo area consumer price inflation rose slightly more than expected. Recent increases keep the focus on Bank of Japan (BoJ) policy. France and Spain both offer preliminary June consumer price data. The UK revised up its first quarter GDP by a small amount, but small changes in abstract ideas has little relevance to people living in the real world.”
The Euro (EUR) is likely to trade in a range of 1.0685/1.0730 and remain under pressure. There’s a chance of a sustained decline for EUR/USD, but only if it can break below 1.0640, UOB Group analysts note.
The pair remains sidelined
24-HOUR VIEW: “Yesterday, we indicated that EUR 'could decline further, but it is not clear if it can break the significant support level at 1.0640.' Our view was incorrect, as EUR rebounded to 1.0726, closing at 1.0702 (+0.22%). The price action is likely part of a consolidation phase. Today, we expect EUR to trade in a range of 1.0685/1.0730.”
1-3 WEEKS VIEW: “Our update from yesterday (27 Jun, spot at 1.0702) is still valid. As indicated, downward momentum is building again, but at this stage, it does not appear to be enough to suggest the start of a sustained decline. Furthermore, there is a significant support level at 1.0640. That said, provided that 1.0735 (no change in ‘strong resistance’ level from yesterday) is not breached, EUR is likely to remain under pressure, but a sustained decline is likely only if it can break clearly below 1.0640.”
- USD/JPY rises above 161.00 amid firm US Dollar ahead of the US Core PCE Inflation.
- US inflation data is expected to have softened in May.
- Fears of Japan’s intervention have intensified as Yen weakened to 161.00 against the US Dollar.
The USD/JPY pair prints a fresh multi-decade high at 161.28, its highest since 1986, on Friday. The asset rises further as the US Dollar (USD) strengthens amid uncertainty ahead of the United States (US) core Personal Consumption Expenditure price index (PCE) data for May, which will be published on Friday.
The US underlying inflation data will provide cues about when and how much the Federal Reserve (Fed) will reduce interest rates this year. The US PCE report is expected to show that price pressures grew at a slower pace of 0.1% against 0.2% in April month-on-month. Annually, the underlying inflation is projected to decelerate to 2.6% from 2.8% in April.
A scenario in which price pressures decline expectedly or more would boost expectations of early rate cuts by the Fed. Currently, financial markets expect that the Fed will start reducing interest rates from the September meeting. The Fed is also expected to deliver two rate cuts this year against one indicated by officials in the latest dot plot.
Meanwhile, the Japanese Yen weakens even though Bank of Japan (BoJ) signalled further policy tightening to ease price pressures, which have been recently boosted by weak Yen that has prompted exports and increased import costs.
Sheer weakness in the Japanese Yen has also prompted expectations of Japan’s stealth intervention. In an early Asian session, Japanese Finance Minister Shunichi Suzuki said on Friday that the authorities were "deeply concerned" about the impact of "rapid and one-sided" foreign exchange moves on the economy, Reuters reported.
Economic Indicator
Core Personal Consumption Expenditures - Price Index (YoY)
The Core Personal Consumption Expenditures (PCE), released by the US Bureau of Economic Analysis on a monthly basis, measures the changes in the prices of goods and services purchased by consumers in the United States (US). The PCE Price Index is also the Federal Reserve’s (Fed) preferred gauge of inflation. The YoY reading compares the prices of goods in the reference month to the same month a year earlier. The core reading excludes the so-called more volatile food and energy components to give a more accurate measurement of price pressures." Generally, a high reading is bullish for the US Dollar (USD), while a low reading is bearish.
Read more.Next release: Fri Jun 28, 2024 12:30
Frequency: Monthly
Consensus: 2.6%
Previous: 2.8%
Source: US Bureau of Economic Analysis
After publishing the GDP report, the US Bureau of Economic Analysis releases the Personal Consumption Expenditures (PCE) Price Index data alongside the monthly changes in Personal Spending and Personal Income. FOMC policymakers use the annual Core PCE Price Index, which excludes volatile food and energy prices, as their primary gauge of inflation. A stronger-than-expected reading could help the USD outperform its rivals as it would hint at a possible hawkish shift in the Fed’s forward guidance and vice versa.
- The Pound Sterling exhibits a subdued performance against the US Dollar ahead of the US core PCE Inflation for May.
- Revised UK Q1 GDP estimates show that the economy grew at a higher pace of 0.7%.
- Fed policymakers expect rate cuts at this time are inappropriate.
The Pound Sterling (GBP) trades subdued against the US Dollar (USD) in Friday’s London session. The GBP/USD pair edges down this week as investors remain cautious ahead of the United States (US) core Personal Consumption Expenditures (PCE) Price Index data for May, which will be published on Friday.
The core PCE inflation data, the Federal Reserve’s (Fed) preferred inflation measure, is estimated to have decelerated to 2.6% year-over-year (YoY) from April’s reading of 2.8%. On a monthly basis, the underlying inflation is expected to have grown modestly by 0.1% against the prior increase of 0.2%.
Soft inflation figures would boost expectations of early rate cuts by the Fed, while hot numbers will diminish Fed rate-cut prospects and strengthen the US Dollar’s appeal. At the time of writing, the US Dollar Index (DXY), which tracks the Greenback’s value against six major currencies, trades close to the crucial resistance of 106.00.
According to the CME FedWatch tool, 30-day fed funds futures pricing data suggest that traders have priced in two rate cuts this year, and the policy-easing cycle will begin at the September meeting. On the contrary, Fed officials advocate for keeping interest rates at their current levels until they are convinced that inflation will decline to the desired rate of 2%.
On Thursday, Fed Governor Michelle Bowman reiterated that the central bank is not yet at a point where it is appropriate to reduce interest rates. She warned of more rate hikes if progress in disinflation appears to stall or reverse.
Daily digest market movers: Pound Sterling outperforms its major peers
- The Pound Sterling strengthens against its entire peers after the United Kingdom (UK) Office for National Statistics (ONS) reported in its revised Q1 Gross Domestic Product (GDP) report that the economy expanded at a higher rate of 0.7% quarter on quarter (QoQ) than estimates and the preliminary release of 0.6%. On an annualized basis, the economy grew by 0.3%, upwardly revised from 0.2%.
- Meanwhile, uncertainty ahead of UK elections and the timing of the Bank of England (BoE) rate cut will keep the Pound Sterling on its toes. According to the latest exit polls, the Opposition Labor Party is expected to win from the UK Prime Minister Rishi Sunak-led Conservative Party.
- For the BoE rate-cut timeframe, investors expect that the majority of officials will vote for reducing interest rates in the next monetary policy meeting, which will be held on August 1. Policymaker Swati Dhingra and Deputy Governor Dave Ramsden have been supporting rate cuts, and it will be crucial to see which members join them.
- The reason for the high probability of the BoE lowering borrowing rates in August is the return of annual headline inflation to the bank’s target of 2%. However, price pressures in the service sector are still higher than what is required to make rate cuts appropriate.
Pound Sterling Price Today:
British Pound PRICE Today
The table below shows the percentage change of British Pound (GBP) against listed major currencies today. British Pound was the strongest against the New Zealand Dollar.
| USD | EUR | GBP | JPY | CAD | AUD | NZD | CHF | |
|---|---|---|---|---|---|---|---|---|
| USD | 0.00% | -0.08% | 0.10% | 0.08% | 0.21% | 0.27% | 0.02% | |
| EUR | -0.00% | -0.09% | 0.09% | 0.08% | 0.20% | 0.26% | 0.02% | |
| GBP | 0.08% | 0.09% | 0.14% | 0.14% | 0.29% | 0.34% | 0.09% | |
| JPY | -0.10% | -0.09% | -0.14% | -0.03% | 0.11% | 0.16% | -0.06% | |
| CAD | -0.08% | -0.08% | -0.14% | 0.03% | 0.11% | 0.18% | -0.08% | |
| AUD | -0.21% | -0.20% | -0.29% | -0.11% | -0.11% | 0.06% | -0.19% | |
| NZD | -0.27% | -0.26% | -0.34% | -0.16% | -0.18% | -0.06% | -0.26% | |
| CHF | -0.02% | -0.02% | -0.09% | 0.06% | 0.08% | 0.19% | 0.26% |
The heat map shows percentage changes of major currencies against each other. The base currency is picked from the left column, while the quote currency is picked from the top row. For example, if you pick the British Pound from the left column and move along the horizontal line to the US Dollar, the percentage change displayed in the box will represent GBP (base)/USD (quote).
Technical Analysis: Pound Sterling holds crucial support of 1.2600
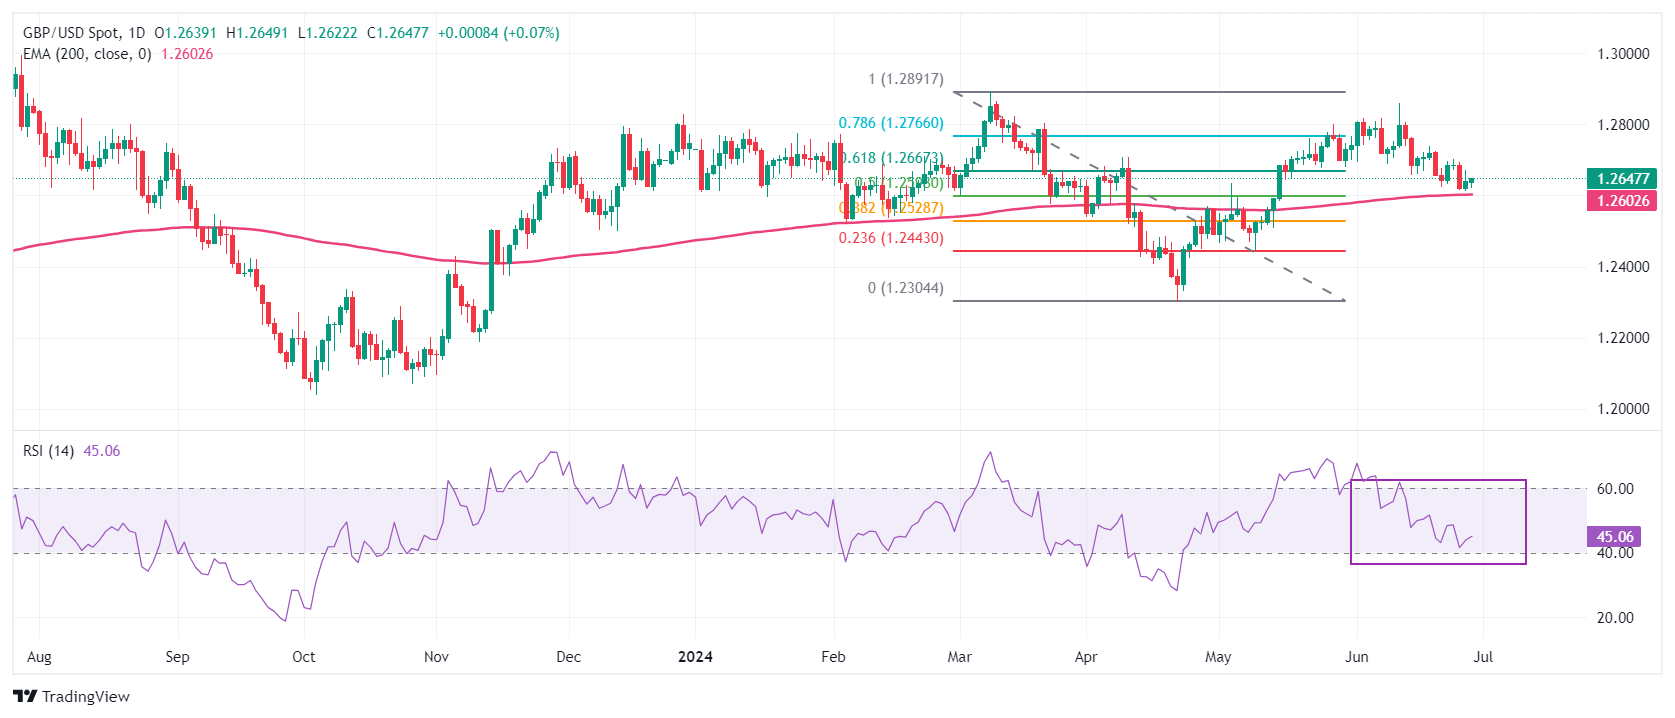
The Pound Sterling holds key support near 1.2600 against the US Dollar. The GBP/USD pair trades inside Thursday’s trading range as investors prefer to remain sideways ahead of the release of the US inflation data. The Cable declines toward the 200-day Exponential Moving Average (EMA), which trades around 1.2590.
The pair has dropped below the 61.8% Fibonacci retracement support at 1.2667, plotted from the March 8 high of 1.2900 to the April 22 low at 1.2300.
The 14-day Relative Strength Index (RSI) oscillates inside the 40.00-60.00 range, indicating a consolidation ahead.
Pound Sterling FAQs
The Pound Sterling (GBP) is the oldest currency in the world (886 AD) and the official currency of the United Kingdom. It is the fourth most traded unit for foreign exchange (FX) in the world, accounting for 12% of all transactions, averaging $630 billion a day, according to 2022 data. Its key trading pairs are GBP/USD, aka ‘Cable’, which accounts for 11% of FX, GBP/JPY, or the ‘Dragon’ as it is known by traders (3%), and EUR/GBP (2%). The Pound Sterling is issued by the Bank of England (BoE).
The single most important factor influencing the value of the Pound Sterling is monetary policy decided by the Bank of England. The BoE bases its decisions on whether it has achieved its primary goal of “price stability” – a steady inflation rate of around 2%. Its primary tool for achieving this is the adjustment of interest rates. When inflation is too high, the BoE will try to rein it in by raising interest rates, making it more expensive for people and businesses to access credit. This is generally positive for GBP, as higher interest rates make the UK a more attractive place for global investors to park their money. When inflation falls too low it is a sign economic growth is slowing. In this scenario, the BoE will consider lowering interest rates to cheapen credit so businesses will borrow more to invest in growth-generating projects.
Data releases gauge the health of the economy and can impact the value of the Pound Sterling. Indicators such as GDP, Manufacturing and Services PMIs, and employment can all influence the direction of the GBP. A strong economy is good for Sterling. Not only does it attract more foreign investment but it may encourage the BoE to put up interest rates, which will directly strengthen GBP. Otherwise, if economic data is weak, the Pound Sterling is likely to fall.
Another significant data release for the Pound Sterling is the Trade Balance. This indicator measures the difference between what a country earns from its exports and what it spends on imports over a given period. If a country produces highly sought-after exports, its currency will benefit purely from the extra demand created from foreign buyers seeking to purchase these goods. Therefore, a positive net Trade Balance strengthens a currency and vice versa for a negative balance.
Here is what you need to know on Friday, June 28:
The US Dollar Index holds steady at around 106.00 early Friday, fluctuating near the multi-week high it set this week. The Bureau of Economic Analysis (BEA) will release the Personal Consumption Expenditures (PCE) Price Index, the Federal Reserve's (Fed) preferred gauge of inflation, for May, alongside Personal Spending and Personal Income data, later in the session.
US Dollar PRICE This week
The table below shows the percentage change of US Dollar (USD) against listed major currencies this week. US Dollar was the strongest against the New Zealand Dollar.
| USD | EUR | GBP | JPY | CAD | AUD | NZD | CHF | |
|---|---|---|---|---|---|---|---|---|
| USD | -0.09% | -0.03% | 0.72% | 0.15% | 0.12% | 0.87% | 0.58% | |
| EUR | 0.09% | 0.08% | 0.90% | 0.29% | 0.23% | 1.00% | 0.74% | |
| GBP | 0.03% | -0.08% | 0.75% | 0.21% | 0.15% | 0.92% | 0.66% | |
| JPY | -0.72% | -0.90% | -0.75% | -0.57% | -0.57% | 0.18% | -0.15% | |
| CAD | -0.15% | -0.29% | -0.21% | 0.57% | -0.03% | 0.71% | 0.46% | |
| AUD | -0.12% | -0.23% | -0.15% | 0.57% | 0.03% | 0.77% | 0.51% | |
| NZD | -0.87% | -1.00% | -0.92% | -0.18% | -0.71% | -0.77% | -0.26% | |
| CHF | -0.58% | -0.74% | -0.66% | 0.15% | -0.46% | -0.51% | 0.26% |
The heat map shows percentage changes of major currencies against each other. The base currency is picked from the left column, while the quote currency is picked from the top row. For example, if you pick the US Dollar from the left column and move along the horizontal line to the Japanese Yen, the percentage change displayed in the box will represent USD (base)/JPY (quote).
Over the weekend, the first round of the French election will take place. According to the latest IFOP Poll, Marine Le Pen’s National Rally party is seen in the lead in the first round with 36% of votes, while President Emmanuel Macron centrist camp is seen in the third place with 21% of votes, behind the left wing New Popular Front, which is projected to receive 29% of votes.
Major equity indexes in the US closed little changed on Thursday as investors refrained from taking large positions ahead of the first Presidential Debate in the US. Early Friday, US stock index futures trade marginally higher and the benchmark 10-year US Treasury bond yield fluctuates in a tight range at around 4.3%.
In the European morning on Friday, the data from the UK showed that the Gross Domestic Product grew at an annual rate of 0.3% in the first quarter. This reading came in above the previous estimate and the market expectation of 0.2%. After posting small gains on Thursday, GBP/USD struggles to extend its recovery and trades below 1.2650.
EUR/USD snapped a two-day losing streak on Thursday but lost its bullish momentum. Early Friday, the pair fluctuates in a tight channel slightly below 1.0700.
During the Asian trading hours, the data from Japan showed that the Tokyo Consumer Price Index rose 2.3% on a yearly basis in June. This reading followed the 2.2% increase recorded in April. Additionally, the Unemployment Rate held steady at 2.6% in May as forecast. USD/JPY extended its weekly rally and touched a fresh multi-decade high near 161.30 in the early Asian session. The pair seems to have entered a consolidation phase at around 161.00 following the earlier jump. Japan’s Chief Cabinet Secretary Yoshimasa Hayashi repeated on Friday that they will take appropriate steps on excessive moves in foreign exchange markets.
After testing $2,300 on Wednesday, Gold regained its traction and registered strong gains on Thursday. XAU/USD stays relatively quiet and trades above $2,320 in the European morning on Friday.
Inflation FAQs
Inflation measures the rise in the price of a representative basket of goods and services. Headline inflation is usually expressed as a percentage change on a month-on-month (MoM) and year-on-year (YoY) basis. Core inflation excludes more volatile elements such as food and fuel which can fluctuate because of geopolitical and seasonal factors. Core inflation is the figure economists focus on and is the level targeted by central banks, which are mandated to keep inflation at a manageable level, usually around 2%.
The Consumer Price Index (CPI) measures the change in prices of a basket of goods and services over a period of time. It is usually expressed as a percentage change on a month-on-month (MoM) and year-on-year (YoY) basis. Core CPI is the figure targeted by central banks as it excludes volatile food and fuel inputs. When Core CPI rises above 2% it usually results in higher interest rates and vice versa when it falls below 2%. Since higher interest rates are positive for a currency, higher inflation usually results in a stronger currency. The opposite is true when inflation falls.
Although it may seem counter-intuitive, high inflation in a country pushes up the value of its currency and vice versa for lower inflation. This is because the central bank will normally raise interest rates to combat the higher inflation, which attract more global capital inflows from investors looking for a lucrative place to park their money.
Formerly, Gold was the asset investors turned to in times of high inflation because it preserved its value, and whilst investors will often still buy Gold for its safe-haven properties in times of extreme market turmoil, this is not the case most of the time. This is because when inflation is high, central banks will put up interest rates to combat it. Higher interest rates are negative for Gold because they increase the opportunity-cost of holding Gold vis-a-vis an interest-bearing asset or placing the money in a cash deposit account. On the flipside, lower inflation tends to be positive for Gold as it brings interest rates down, making the bright metal a more viable investment alternative.
Japan’s Chief Cabinet Secretary Yoshimasa Hayashi reiterated on Friday, noting that he “will take appropriate steps on excessive FX moves.“
Additional quotes
Won't comment on forex levels.
Important for currencies to move in stable manner reflecting fundamentals.
Rapid FX moves undesirable.
Closely watching FX moves.
Market reaction
USD/JPY pays little heed to these comments, trading 0.09% higher on the day near 160.90, consolidating its advance to 38-year highs of 161.28 reached earlier in the Asian session.
Japanese Yen FAQs
The Japanese Yen (JPY) is one of the world’s most traded currencies. Its value is broadly determined by the performance of the Japanese economy, but more specifically by the Bank of Japan’s policy, the differential between Japanese and US bond yields, or risk sentiment among traders, among other factors.
One of the Bank of Japan’s mandates is currency control, so its moves are key for the Yen. The BoJ has directly intervened in currency markets sometimes, generally to lower the value of the Yen, although it refrains from doing it often due to political concerns of its main trading partners. The current BoJ ultra-loose monetary policy, based on massive stimulus to the economy, has caused the Yen to depreciate against its main currency peers. This process has exacerbated more recently due to an increasing policy divergence between the Bank of Japan and other main central banks, which have opted to increase interest rates sharply to fight decades-high levels of inflation.
The BoJ’s stance of sticking to ultra-loose monetary policy has led to a widening policy divergence with other central banks, particularly with the US Federal Reserve. This supports a widening of the differential between the 10-year US and Japanese bonds, which favors the US Dollar against the Japanese Yen.
The Japanese Yen is often seen as a safe-haven investment. This means that in times of market stress, investors are more likely to put their money in the Japanese currency due to its supposed reliability and stability. Turbulent times are likely to strengthen the Yen’s value against other currencies seen as more risky to invest in.
- The core Personal Consumption Expenditures Price Index is set to rise 0.1% MoM and 2.6% YoY in May.
- Markets see a nearly 40% probability that the Federal Reserve will leave the policy rate unchanged in September.
- A hot PCE inflation report could provide a boost to the US Dollar heading into the weekend.
The core Personal Consumption Expenditures (PCE) Price Index, the US Federal Reserve’s (Fed) preferred inflation measure, will be published on Friday by the US Bureau of Economic Analysis (BEA) at 12:30 GMT.
PCE index: What to expect in the Federal Reserve’s preferred inflation measure
The core PCE Price Index, which excludes volatile food and energy prices, is seen as the more influential measure of inflation in terms of Fed positioning. The index is forecast to rise 0.1% on a monthly basis in May, at a softer pace than the 0.2% increase recorded in April. May core PCE is projected to grow at an annual pace of 2.6%, while the headline annual PCE inflation is also forecast to edge lower to 2.6%.
The US Bureau of Labor Statistics (BLS) reported earlier in the month that the Consumer Price Index (CPI) rose 3.3% on a yearly basis in May, while the core CPI increased 3.4% in the same period, down from 3.6% in April.
Previewing the PCE inflation report, “CPI and PPI data suggest core PCE inflation lost further momentum in May, with the series advancing 0.13% m/m — its lowest monthly gain of the year and following a 0.25% April expansion,” TD Securities analysts said. “We also look for the headline PCE and the supercore to print 0.0% each in May. Separately, personal spending likely advanced 0.3% m/m, with income rising 0.4%”, they added.
When will the PCE inflation report be released, and how could it affect EUR/USD?
The PCE inflation data is slated for release at 12:30 GMT. The monthly core PCE Price Index gauge is the most-preferred inflation reading by the Fed, as it’s not distorted by base effects and provides a clear view of underlying inflation by excluding volatile items. Investors, therefore, pay close attention to the monthly core PCE figure.
The CME Group FedWatch Tool shows that markets currently price in a 37.7% probability of the Federal Reserve (Fed) leaving the policy rate unchanged in September. This market positioning suggests that the US Dollar (USD) faces a two-way risk heading into the event.
In case the monthly core PCE rises 0.2%, or more, in May, the immediate market reaction could cause investors to refrain from pricing in a rate reduction in September and help the USD outperform its rivals. On the other hand, a reading of 0.1%, or lower, could trigger a USD selloff ahead of the weekend and open the door for a leg higher in EUR/USD.
Investors, however, could remain reluctant to bet on a steady recovery in the Euro ahead of the first round of French elections on Sunday, even if the PCE inflation figures make it difficult for the USD to find demand. In addition, the data will be released on the last trading day of the second quarter. Hence, quarter-end flows and position adjustments could ramp up market volatility and cause the USD to move irregularly.
FXStreet Analyst Eren Sengezer offers a brief technical outlook for EUR/USD and explains:
“Despite several recovery attempts seen in the last couple of weeks, the Relative Strength Index (RSI) indicator on the daily chart stays below 50, reflecting buyer’s hesitancy. Furthermore, EUR/USD remains within the descending regression channel coming from early June.”
“1.0740 (upper limit of the descending channel) aligns as first resistance. Once EUR/USD rises above this level and stabilizes there, 1.0790-1.0800 (100-day Simple Moving Average (SMA), 200-day SMA, psychological level) could be seen as the next resistance before 1.0900. On the downside, 1.0660 (mid-point of the descending channel) aligns as first support before 1.0600 (lower limit of the descending channel).”
Fed FAQs
Monetary policy in the US is shaped by the Federal Reserve (Fed). The Fed has two mandates: to achieve price stability and foster full employment. Its primary tool to achieve these goals is by adjusting interest rates. When prices are rising too quickly and inflation is above the Fed’s 2% target, it raises interest rates, increasing borrowing costs throughout the economy. This results in a stronger US Dollar (USD) as it makes the US a more attractive place for international investors to park their money. When inflation falls below 2% or the Unemployment Rate is too high, the Fed may lower interest rates to encourage borrowing, which weighs on the Greenback.
The Federal Reserve (Fed) holds eight policy meetings a year, where the Federal Open Market Committee (FOMC) assesses economic conditions and makes monetary policy decisions. The FOMC is attended by twelve Fed officials – the seven members of the Board of Governors, the president of the Federal Reserve Bank of New York, and four of the remaining eleven regional Reserve Bank presidents, who serve one-year terms on a rotating basis.
In extreme situations, the Federal Reserve may resort to a policy named Quantitative Easing (QE). QE is the process by which the Fed substantially increases the flow of credit in a stuck financial system. It is a non-standard policy measure used during crises or when inflation is extremely low. It was the Fed’s weapon of choice during the Great Financial Crisis in 2008. It involves the Fed printing more Dollars and using them to buy high grade bonds from financial institutions. QE usually weakens the US Dollar.
Quantitative tightening (QT) is the reverse process of QE, whereby the Federal Reserve stops buying bonds from financial institutions and does not reinvest the principal from the bonds it holds maturing, to purchase new bonds. It is usually positive for the value of the US Dollar.
- EUR/USD may test the throwback support of 1.0670 around the lower level within the consolidative range.
- The 14-day RSI consolidates below the 50 level; indicating a consolidative range within levels of 1.0760-1.0670.
- The pair could find an immediate barrier at the 14-day EMA at 1.0728.
EUR/USD retraces its gains registered in the previous session, trading around 1.0690 during the Asian hours on Friday. The technical analysis of the daily chart indicates a bearish bias, with the pair consolidating within a descending channel.
The 14-day Relative Strength Index (RSI) is consolidating below the 50 level, suggesting the EUR/USD pair trades within a consolidative range between levels of 1.0760 and 1.0670. If the RSI improves to the 50 level, it would weaken the bearish momentum for the pair.
The EUR/USD pair may test the lower level of the range at 1.0670, which also acts as a throwback support. A break below this level would reinforce the bearish bias, potentially pushing the pair toward the lower boundary of the descending channel near 1.0620.
On the upside, the EUR/USD pair could encounter immediate resistance at the 14-day Exponential Moving Average (EMA) at 1.0728 followed by the upper level of the range at 1.0760. A breakthrough above the latter could lead the pair to test the upper boundary of the descending channel at 1.0780, followed by the psychological level of 1.0800.
EUR/USD: Daily Chart
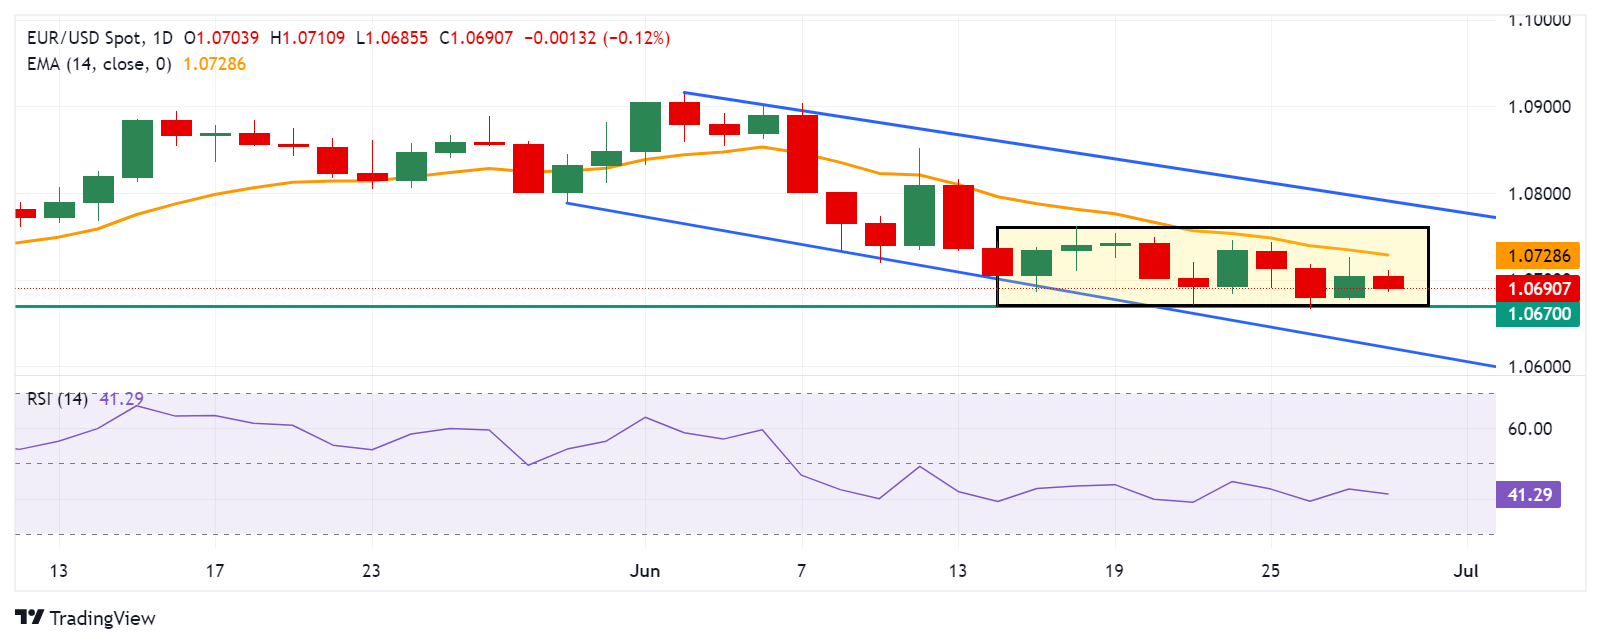
Euro FAQs
The Euro is the currency for the 20 European Union countries that belong to the Eurozone. It is the second most heavily traded currency in the world behind the US Dollar. In 2022, it accounted for 31% of all foreign exchange transactions, with an average daily turnover of over $2.2 trillion a day. EUR/USD is the most heavily traded currency pair in the world, accounting for an estimated 30% off all transactions, followed by EUR/JPY (4%), EUR/GBP (3%) and EUR/AUD (2%).
The European Central Bank (ECB) in Frankfurt, Germany, is the reserve bank for the Eurozone. The ECB sets interest rates and manages monetary policy. The ECB’s primary mandate is to maintain price stability, which means either controlling inflation or stimulating growth. Its primary tool is the raising or lowering of interest rates. Relatively high interest rates – or the expectation of higher rates – will usually benefit the Euro and vice versa. The ECB Governing Council makes monetary policy decisions at meetings held eight times a year. Decisions are made by heads of the Eurozone national banks and six permanent members, including the President of the ECB, Christine Lagarde.
Eurozone inflation data, measured by the Harmonized Index of Consumer Prices (HICP), is an important econometric for the Euro. If inflation rises more than expected, especially if above the ECB’s 2% target, it obliges the ECB to raise interest rates to bring it back under control. Relatively high interest rates compared to its counterparts will usually benefit the Euro, as it makes the region more attractive as a place for global investors to park their money.
Data releases gauge the health of the economy and can impact on the Euro. Indicators such as GDP, Manufacturing and Services PMIs, employment, and consumer sentiment surveys can all influence the direction of the single currency. A strong economy is good for the Euro. Not only does it attract more foreign investment but it may encourage the ECB to put up interest rates, which will directly strengthen the Euro. Otherwise, if economic data is weak, the Euro is likely to fall. Economic data for the four largest economies in the euro area (Germany, France, Italy and Spain) are especially significant, as they account for 75% of the Eurozone’s economy.
Another significant data release for the Euro is the Trade Balance. This indicator measures the difference between what a country earns from its exports and what it spends on imports over a given period. If a country produces highly sought after exports then its currency will gain in value purely from the extra demand created from foreign buyers seeking to purchase these goods. Therefore, a positive net Trade Balance strengthens a currency and vice versa for a negative balance.
Gold prices fell in India on Friday, according to data compiled by FXStreet.
The price for Gold stood at 6,240.07 Indian Rupees (INR) per gram, down compared with the INR 6,248.18 it cost on Thursday.
The price for Gold decreased to INR 72,782.94 per tola from INR 72,877.48 per tola a day earlier.
| Unit measure | Gold Price in INR |
|---|---|
| 1 Gram | 6,240.07 |
| 10 Grams | 62,400.69 |
| Tola | 72,782.94 |
| Troy Ounce | 194,088.00 |
FXStreet calculates Gold prices in India by adapting international prices (USD/INR) to the local currency and measurement units. Prices are updated daily based on the market rates taken at the time of publication. Prices are just for reference and local rates could diverge slightly.
Gold FAQs
Gold has played a key role in human’s history as it has been widely used as a store of value and medium of exchange. Currently, apart from its shine and usage for jewelry, the precious metal is widely seen as a safe-haven asset, meaning that it is considered a good investment during turbulent times. Gold is also widely seen as a hedge against inflation and against depreciating currencies as it doesn’t rely on any specific issuer or government.
Central banks are the biggest Gold holders. In their aim to support their currencies in turbulent times, central banks tend to diversify their reserves and buy Gold to improve the perceived strength of the economy and the currency. High Gold reserves can be a source of trust for a country’s solvency. Central banks added 1,136 tonnes of Gold worth around $70 billion to their reserves in 2022, according to data from the World Gold Council. This is the highest yearly purchase since records began. Central banks from emerging economies such as China, India and Turkey are quickly increasing their Gold reserves.
Gold has an inverse correlation with the US Dollar and US Treasuries, which are both major reserve and safe-haven assets. When the Dollar depreciates, Gold tends to rise, enabling investors and central banks to diversify their assets in turbulent times. Gold is also inversely correlated with risk assets. A rally in the stock market tends to weaken Gold price, while sell-offs in riskier markets tend to favor the precious metal.
The price can move due to a wide range of factors. Geopolitical instability or fears of a deep recession can quickly make Gold price escalate due to its safe-haven status. As a yield-less asset, Gold tends to rise with lower interest rates, while higher cost of money usually weighs down on the yellow metal. Still, most moves depend on how the US Dollar (USD) behaves as the asset is priced in dollars (XAU/USD). A strong Dollar tends to keep the price of Gold controlled, whereas a weaker Dollar is likely to push Gold prices up.
(An automation tool was used in creating this post.)
FX option expiries for June 28 NY cut at 10:00 Eastern Time, via DTCC, can be found below
- EUR/USD: EUR amounts
- 1.0650 2.5b
- 1.0670 2.1b
- 1.0695 1.4b
- 1.0715 1.8b
- 1.0725 1.9b
- 1.0775 962m
- 1.0800 897m
- GBP/USD: GBP amounts
- 1.2645 914m
- 1.2650 614m
- USD/JPY: USD amounts
- 158.00 2.5b
- 158.50 806m
- 159.00 772m
- 159.50 1.7b
- 160.00 2.6b
- 160.25 1.1b
- 160.50 760m
- USD/CHF: USD amounts
- 0.8995 440m
- AUD/USD: AUD amounts
- 0.6620 516m
- USD/CAD: USD amounts
- 1.3700 478m
- 1.3730 661m
- The Indian Rupee extends gains due to expected foreign inflows on bonds joining J.P. Morgan’s Emerging Market Bond Index.
- Indian equity markets appreciate due to the return of foreign institutional investors and growing purchases in index heavyweights.
- US Core PCE to be released on Friday; expected to decrease YoY to 2.6% from the previous 2.8%.
The Indian Rupee (INR) extends its gains for the second successive session during the Asian hours, which could be attributed to the expectations of foreign inflows. Indian bonds are set to enter the JP Morgan Emerging Market (EM) Bond Index on Friday.
Indian equity markets extend gains due to the return of foreign institutional investors and growing purchases in index heavyweights, amidst a solid economy and prospects of policy continuity.
Indian Rupee traders would likely observe key economic data on Friday, including the Federal Fiscal Deficit for May and FX Reserves for the week ending June 17.
On the US Dollar’s (USD) front, Core PCE Price Index inflation is projected to decrease YoY to 2.6% from the previous 2.8%. This data is seen as the Federal Reserve's (Fed) preferred inflation gauge.
Daily Digest Market Movers: Indian Rupee extends gains on foreign inflows
- Foreign investors have already invested approximately $10 billion into the securities eligible to join JPMorgan’s index, according to Business Standard. Meanwhile, Goldman Sachs anticipates at least $30 billion more in inflows in the coming months as India’s weighting on the index steadily rises to 10%.
- Federal Reserve (Fed) Board of Governors member Michelle Bowman noted on Thursday that she is still not ready to support a central bank rate cut with inflation pressures still elevated. Bowman said, adding “We are still not yet at the point where it is appropriate to lower the policy rate, and I continue to see a number of upside risks to inflation,” per Reuters.
- US Gross Domestic Product Annualized expanded by 1.4% in Q1, slightly higher than the previous reading of 1.3%, but continuing to point to the lowest growth since the contractions in the first half of 2022.
- US Initial Jobless Claims showed on Thursday that the number of people claiming unemployment benefits fell to 233,000 in the week ending June 21, below market expectations of 236,000. The claim count fell for a second consecutive week since hitting the 10-month high of 243,000 earlier in June.
- The first US presidential debate between President Joe Biden and Republican Presidential Nominee Donald Trump began on CNN News. Biden acknowledged that “inflation had driven prices substantially higher than at the start of his term but said he deserves credit for putting 'things back together again' following the coronavirus pandemic.” In response, Trump condemned elevated inflation levels. He suggested that tariffs would decrease deficits and urged scrutiny of countries like China, per Reuters.
- The S&P Global Ratings retained its growth forecast for India at 6.8% for FY25, citing high interest rates and government spending boosting demand in the non-agricultural sectors.
- On Tuesday, RBI Governor Shaktikanta Das said that India is on the verge of a major structural shift in its growth trajectory, moving towards sustained 8% GDP growth. Das attributes this growth to several key drivers, including structural reforms such as the Goods and Services Tax (GST), reported by The Economic Times.
Technical analysis: USD/INR falls below 83.50
The USD/INR trades around 83.40 on Friday. The analysis of the daily chart shows a broadening pattern, suggesting a potential correction before a downward movement. The 14-day Relative Strength Index (RSI) is below the 50 level, indicating a bearish bias.
The USD/INR pair tests the immediate support at the 50-day Exponential Moving Average (EMA) of 83.40. A break below this level could potentially strengthen the bearish bias, which could lead the pair toward the lower boundary of the broadening pattern, around the 83.30 level.
Resistance on the upside is anticipated near the upper boundary of the broadening formation, around 83.70, followed by the psychological level of 84.00.
USD/INR: Daily Chart
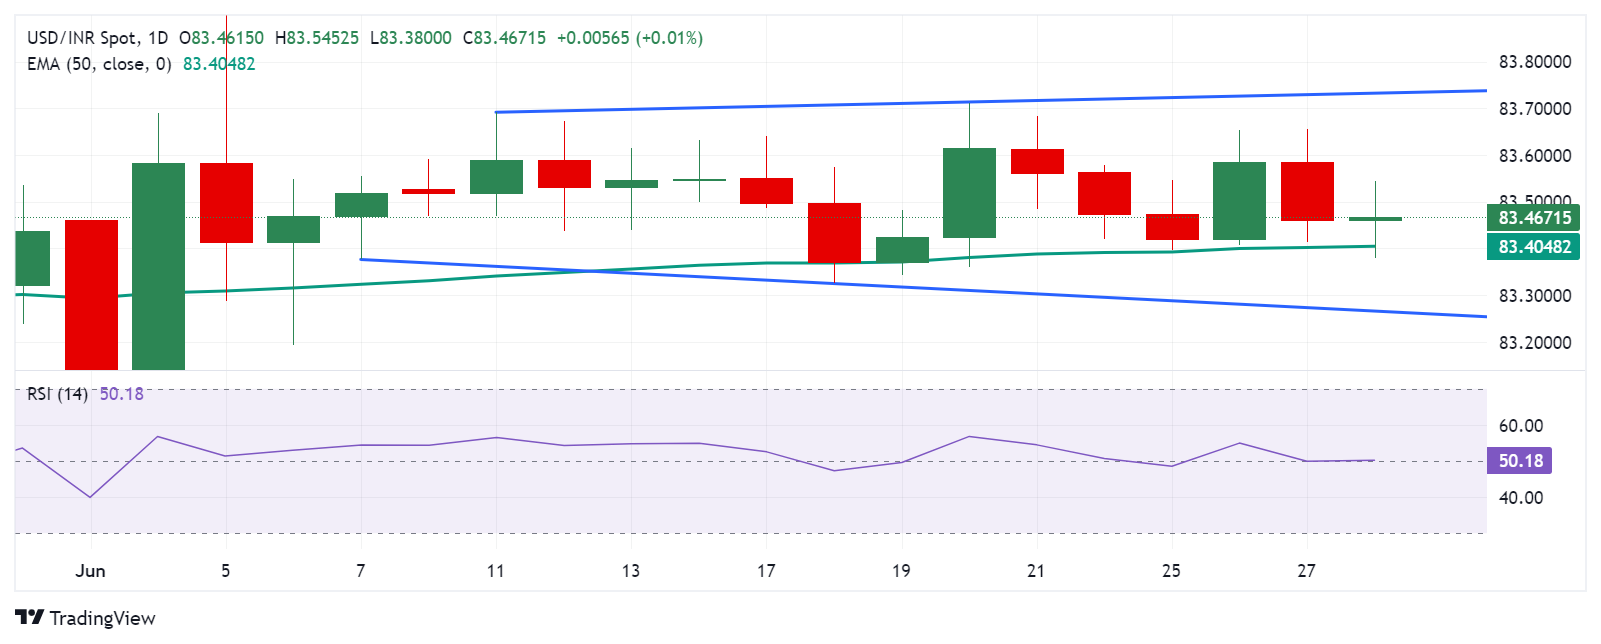
US Dollar PRICE Today
The table below shows the percentage change of US Dollar (USD) against listed major currencies today. US Dollar was the weakest against the Indian Rupee.
| USD | EUR | GBP | JPY | CAD | AUD | NZD | INR | |
|---|---|---|---|---|---|---|---|---|
| USD | 0.16% | 0.13% | 0.16% | 0.22% | 0.36% | 0.37% | 0.03% | |
| EUR | -0.16% | -0.03% | 0.00% | 0.06% | 0.20% | 0.21% | -0.13% | |
| GBP | -0.13% | 0.03% | 0.00% | 0.07% | 0.22% | 0.24% | -0.11% | |
| JPY | -0.16% | 0.00% | 0.00% | 0.03% | 0.19% | 0.19% | -0.13% | |
| CAD | -0.22% | -0.06% | -0.07% | -0.03% | 0.13% | 0.15% | -0.18% | |
| AUD | -0.36% | -0.20% | -0.22% | -0.19% | -0.13% | 0.01% | -0.33% | |
| NZD | -0.37% | -0.21% | -0.24% | -0.19% | -0.15% | -0.01% | -0.34% | |
| INR | -0.03% | 0.13% | 0.11% | 0.13% | 0.18% | 0.33% | 0.34% |
The heat map shows percentage changes of major currencies against each other. The base currency is picked from the left column, while the quote currency is picked from the top row. For example, if you pick the US Dollar from the left column and move along the horizontal line to the Japanese Yen, the percentage change displayed in the box will represent USD (base)/JPY (quote).
Indian Rupee FAQs
The Indian Rupee (INR) is one of the most sensitive currencies to external factors. The price of Crude Oil (the country is highly dependent on imported Oil), the value of the US Dollar – most trade is conducted in USD – and the level of foreign investment, are all influential. Direct intervention by the Reserve Bank of India (RBI) in FX markets to keep the exchange rate stable, as well as the level of interest rates set by the RBI, are further major influencing factors on the Rupee.
The Reserve Bank of India (RBI) actively intervenes in forex markets to maintain a stable exchange rate, to help facilitate trade. In addition, the RBI tries to maintain the inflation rate at its 4% target by adjusting interest rates. Higher interest rates usually strengthen the Rupee. This is due to the role of the ‘carry trade’ in which investors borrow in countries with lower interest rates so as to place their money in countries’ offering relatively higher interest rates and profit from the difference.
Macroeconomic factors that influence the value of the Rupee include inflation, interest rates, the economic growth rate (GDP), the balance of trade, and inflows from foreign investment. A higher growth rate can lead to more overseas investment, pushing up demand for the Rupee. A less negative balance of trade will eventually lead to a stronger Rupee. Higher interest rates, especially real rates (interest rates less inflation) are also positive for the Rupee. A risk-on environment can lead to greater inflows of Foreign Direct and Indirect Investment (FDI and FII), which also benefit the Rupee.
Higher inflation, particularly, if it is comparatively higher than India’s peers, is generally negative for the currency as it reflects devaluation through oversupply. Inflation also increases the cost of exports, leading to more Rupees being sold to purchase foreign imports, which is Rupee-negative. At the same time, higher inflation usually leads to the Reserve Bank of India (RBI) raising interest rates and this can be positive for the Rupee, due to increased demand from international investors. The opposite effect is true of lower inflation.
- NZD/USD attracts fresh sellers on Friday amid a goodish pickup in the USD demand.
- The Fed’s hawkish outlook and rising US bond yields lift the USD to a two-month top.
- The market attention remains glued to the release of the crucial US PCE Price Index.
The NZD/USD pair comes under some renewed selling pressure following the previous day's brief pause and dives to its lowest level since mid-May during the Asian session on Friday. Spot prices currently trade just above mid-0.6000s, down 0.35% for the day, and now seem to have confirmed a bearish breakdown through the 50-day Simple Moving Average (SMA).
The US Dollar (USD) regains positive traction following Thursday's softer US data-led decline and climbs to a nearly two-month peak amid the Federal Reserve's (Fed) hawkish outlook. In fact, the recent comments by a slew of influential FOMC members suggested that the US central bank is in no rush to start its rate-cutting cycle, triggering a fresh leg up in the US Treasury bond yields. Apart from this, some repositioning trade ahead of the crucial US inflation data provides an additional boost to the buck, which turns out to be a key factor exerting downward pressure on the NZD/USD pair.
The New Zealand Dollar (NZD), on the other hand, is weighed down by expectations that the Reserve Bank of New Zealand (RBNZ) will cut rates earlier than projected. This, to a larger extent, overshadows a generally positive tone around the equity markets and fails to lend any support to the risk-sensitive Kiwi, suggesting that the path of least resistance for the NZD/USD pair is to the downside. Traders, however, might prefer to wait for the release of the US Personal Consumption Expenditures (PCE) Price Index for cues about the Fed's future policy decisions and rate-cut path.
A lower-than-expected PCE deflator or a number that is in line with market expectations will back the case for two rate cuts by the Fed this year, which, in turn, could weaken the USD. Meanwhile, any upward surprise should push back the expected timing for the first Fed cut and trigger a fresh leg up for the buck. Hence, the data will play a key role in influencing the near-term USD price dynamics and help determine the next leg of a directional move for the NZD/USD pair. Nevertheless, spot prices seem poised to register heavy weekly losses and prolong a nearly three-week-old downtrend.
US Dollar FAQs
The US Dollar (USD) is the official currency of the United States of America, and the ‘de facto’ currency of a significant number of other countries where it is found in circulation alongside local notes. It is the most heavily traded currency in the world, accounting for over 88% of all global foreign exchange turnover, or an average of $6.6 trillion in transactions per day, according to data from 2022. Following the second world war, the USD took over from the British Pound as the world’s reserve currency. For most of its history, the US Dollar was backed by Gold, until the Bretton Woods Agreement in 1971 when the Gold Standard went away.
The most important single factor impacting on the value of the US Dollar is monetary policy, which is shaped by the Federal Reserve (Fed). The Fed has two mandates: to achieve price stability (control inflation) and foster full employment. Its primary tool to achieve these two goals is by adjusting interest rates. When prices are rising too quickly and inflation is above the Fed’s 2% target, the Fed will raise rates, which helps the USD value. When inflation falls below 2% or the Unemployment Rate is too high, the Fed may lower interest rates, which weighs on the Greenback.
In extreme situations, the Federal Reserve can also print more Dollars and enact quantitative easing (QE). QE is the process by which the Fed substantially increases the flow of credit in a stuck financial system. It is a non-standard policy measure used when credit has dried up because banks will not lend to each other (out of the fear of counterparty default). It is a last resort when simply lowering interest rates is unlikely to achieve the necessary result. It was the Fed’s weapon of choice to combat the credit crunch that occurred during the Great Financial Crisis in 2008. It involves the Fed printing more Dollars and using them to buy US government bonds predominantly from financial institutions. QE usually leads to a weaker US Dollar.
Quantitative tightening (QT) is the reverse process whereby the Federal Reserve stops buying bonds from financial institutions and does not reinvest the principal from the bonds it holds maturing in new purchases. It is usually positive for the US Dollar.
- GBP/USD attracts fresh sellers on Friday, though the downside remains cushioned.
- Traders now seem reluctant to place aggressive directional bets ahead of the US PCE.
- The technical setup suggests that the path of least resistance remains to the downside.
The GBP/USD pair extends the overnight late pullback from the 1.2670 region and trades with a mild negative bias during the Asian session on Friday. Spot prices currently hover around the 1.2635-1.2630 area and remain well within the striking distance of the lowest level since mid-May touched on Thursday.
The British Pound (GBP) continues to be undermined by rising bets for a rate cut by the Bank of England (BoE) in August. Apart from this, some repositioning trade ahead of the crucial US inflation data lifts the US Dollar (USD) to a fresh two-month high, which, in turn, is seen as another factor exerting some downward pressure on the GBP/USD pair. That said, the uncertainty about the Federal Reserve's (Fed) rate-cut path keeps a lid on any further gains for the buck and helps limit the downside for the currency pair.
From a technical perspective, the emergence of fresh selling and acceptance below the 1.2650-1.2645 confluence – comprising 50-day and 100-day Simple Moving Averages (SMAs) – favors bearish traders. Moreover, oscillators on the daily chart have been gaining negative traction and suggest that the path of least resistance for the GBP/USD pair is to the downside. That said, any subsequent slide is likely to find some support near the weekly low, around the 1.2615-1.2610 area, ahead of the 1.2600 mark, which if broken will set the stage for deeper losses.
The GBP/USD pair might then accelerate the downfall towards challenging the very important 200-day SMA, currently pegged near the 1.2560 region en route to the 1.2500 psychological mark. The downward trajectory could extend further towards testing the May monthly swing low, around the 1.2445 area.
On the flip side, the 1.2670 area, or the overnight peak, now seems to act as an immediate hurdle ahead of the 1.2700 round-figure mark. A sustained strength beyond the latter will suggest that the recent corrective decline has run its course and lift the GBP/USD pair beyond the 1.2720-1.2725 supply zone, towards the 1.2800 mark. Bullish traders might then aim back towards challenging the multi-month top, around the 1.2860 region touched on June 12, and lift spot prices further towards the 1.2900 round-figure mark.
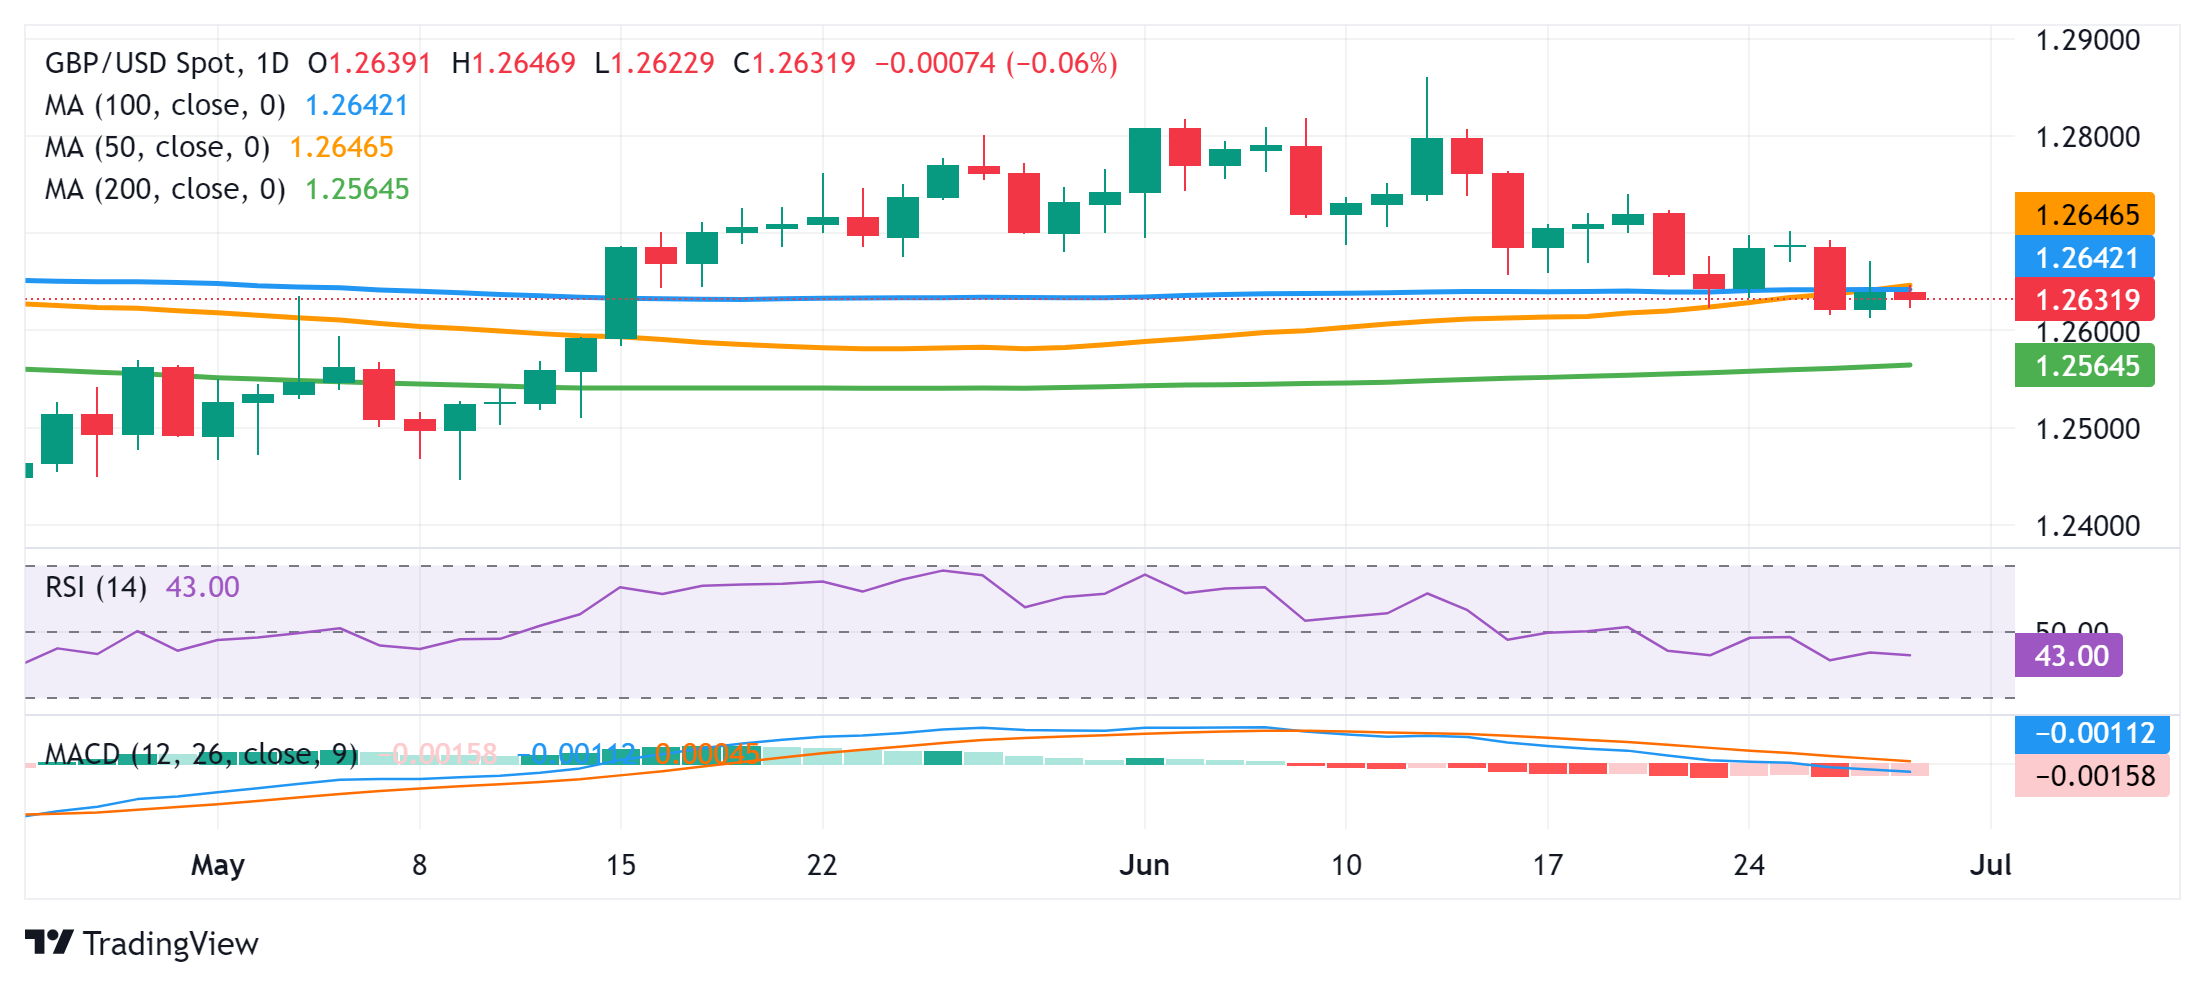
- WTI continues its winning streak due to supply concerns amid Middle-East tensions and weather-related disruptions.
- Escalated tensions between Israel and Lebanon’s Hezbollah could potentially involve Iran, a major Oil exporter.
- Over the past week, Ecuador's production has decreased by 100,000 barrels per day due to heavy rains.
West Texas Intermediate (WTI) crude Oil price extends gains for the third successive session, trading near $81.80 during the Asian session on Friday. Crude Oil prices are set to advance for the third straight week due to supply threats, which could be attributed to an escalating conflict in the Middle East.
Tensions between Israel and Lebanon’s Hezbollah have escalated as Hezbollah has intensified rocket and drone attacks in northern Israel in recent weeks. A broader conflict in the Middle East could potentially involve countries like Iran, a major Oil exporter in the region.
On Thursday, the French foreign ministry expressed concern over the situation in Lebanon. Earlier, Turkey declared its solidarity with Lebanon and called for support from regional governments, according to Reuters.
Reuters also cited FGE Energy on Friday, stating that Oil supplies have been pressured by weather-related disruptions, which could worsen in the coming weeks. Heavy rains have caused Ecuador's production to decline by 100,000 barrels a day over the past week.
The US National Hurricane Center is currently tracking at least one weather system that has the potential to develop into a cyclone and head toward the US Gulf Coast. This could negatively impact a significant portion of the country's energy and export infrastructure.
- USD/CAD attracts fresh buyers on Friday amid a goodish pickup in the USD demand.
- The Fed’s hawkish outlook acts as a tailwind for the US bond yields and the Greenback.
- Bullish Crude Oil prices underpin the Loonie and cap gains ahead of the US PCE data.
The USD/CAD pair catches fresh bids following the previous day's good two-way price moves and spikes to a one-and-half-week high during the Asian session on Friday. Spot prices, however, retreat a few pips in the last hour and currently trade around the 1.3715 region, up just over 0.10% for the day.
As investors look past Thursday's softer US macro releases, the US Dollar (USD) regains positive traction and climbs to a fresh two-month peak, which turns out to be a key factor that provides a goodish lift to the USD/CAD pair. The intraday USD uptick could be attributed to some repositioning trade ahead of the crucial US inflation data, though lacks follow-through amid the uncertainty about the Federal Reserve's (Fed) rate cut path. Hence, the focus will remain on the US Personal Consumption Expenditure (PCE) Price Index, due later this Friday.
A lower-than-expected PCE deflator or a number that is in line with market expectations will back the case for two rate cuts by the Fed this year, which, in turn, could weaken the USD. Meanwhile, any upward surprise should push back the expected timing for the first Fed cut and trigger a fresh leg up for the buck. Nevertheless, the data will play a key role in influencing expectations about the Fed's future policy decisions, which, in turn, will drive the USD demand in the near term and help in determining the next leg of a directional move for the USD/CAD pair.
Heading into the key data risk, growing acceptance that the Fed will start lowering borrowing costs in September amid signs of easing inflationary pressures and moderating US economic growth momentum caps the USD. The Canadian Dollar (CAD), on the other hand, draws support from a surge in domestic consumer inflation, which tempered bets for a July rate cut by the Bank of Canada (BoC). This, along with a further rise in Crude Oil prices to a fresh two-month top, underpins the commodity-linked Loonie and contributes to capping the USD/CAD pair.
Canadian Dollar FAQs
The key factors driving the Canadian Dollar (CAD) are the level of interest rates set by the Bank of Canada (BoC), the price of Oil, Canada’s largest export, the health of its economy, inflation and the Trade Balance, which is the difference between the value of Canada’s exports versus its imports. Other factors include market sentiment – whether investors are taking on more risky assets (risk-on) or seeking safe-havens (risk-off) – with risk-on being CAD-positive. As its largest trading partner, the health of the US economy is also a key factor influencing the Canadian Dollar.
The Bank of Canada (BoC) has a significant influence on the Canadian Dollar by setting the level of interest rates that banks can lend to one another. This influences the level of interest rates for everyone. The main goal of the BoC is to maintain inflation at 1-3% by adjusting interest rates up or down. Relatively higher interest rates tend to be positive for the CAD. The Bank of Canada can also use quantitative easing and tightening to influence credit conditions, with the former CAD-negative and the latter CAD-positive.
The price of Oil is a key factor impacting the value of the Canadian Dollar. Petroleum is Canada’s biggest export, so Oil price tends to have an immediate impact on the CAD value. Generally, if Oil price rises CAD also goes up, as aggregate demand for the currency increases. The opposite is the case if the price of Oil falls. Higher Oil prices also tend to result in a greater likelihood of a positive Trade Balance, which is also supportive of the CAD.
While inflation had always traditionally been thought of as a negative factor for a currency since it lowers the value of money, the opposite has actually been the case in modern times with the relaxation of cross-border capital controls. Higher inflation tends to lead central banks to put up interest rates which attracts more capital inflows from global investors seeking a lucrative place to keep their money. This increases demand for the local currency, which in Canada’s case is the Canadian Dollar.
Macroeconomic data releases gauge the health of the economy and can have an impact on the Canadian Dollar. Indicators such as GDP, Manufacturing and Services PMIs, employment, and consumer sentiment surveys can all influence the direction of the CAD. A strong economy is good for the Canadian Dollar. Not only does it attract more foreign investment but it may encourage the Bank of Canada to put up interest rates, leading to a stronger currency. If economic data is weak, however, the CAD is likely to fall.
- The Australian Dollar loses ground as RBA Deputy Governor Hauser advises against formulating policy based on a single inflation report.
- Australia’s high inflation has fueled speculation that the RBA might raise interest rates again in August.
- The US Dollar appreciates due to higher yields ahead of Friday’s release of Core PCE inflation.
The Australian Dollar (AUD) depreciates against the US Dollar (USD) on Friday, which could be attributed to the dovish comments from the Reserve Bank of Australia’s (RBA) Deputy Governor Andrew Hauser. Hauser said it would be a “bad mistake” to formulate policy in response to a single inflation report. He emphasized that there is still a suite of economic data to come that will require detailed analysis, per Bloomberg.
The AUD gained ground after releasing May's higher-than-expected Monthly Consumer Price Index (CPI). The persistently high inflation has fueled speculation that the RBA might raise interest rates again in August.
The US Dollar (USD) gains ground due to higher yields on US Treasury bonds. Friday’s Core PCE Price Index inflation is projected to decrease YoY to 2.6% from the previous 2.8%. This data is seen as the Federal Reserve's (Fed) preferred inflation gauge.
Daily Digest Market Movers: Australian Dollar declines due to hawkish Fedspeak
- Australia’s 10-year government bond yield surged above 4.4%, reaching a three-week high, as a hot inflation reading fueled fears that the Reserve Bank of Australia might raise interest rates again in the next meeting in August.
- Federal Reserve (Fed) Board of Governors member Michelle Bowman noted on Thursday that she is still not ready to support a central bank rate cut with inflation pressures still elevated. Bowman said, adding “We are still not yet at the point where it is appropriate to lower the policy rate, and I continue to see a number of upside risks to inflation,” per Reuters.
- US Gross Domestic Product Annualized expanded by 1.4% in Q1, slightly higher than the previous reading of 1.3%, but continuing to point to the lowest growth since the contractions in the first half of 2022.
- US Initial Jobless Claims showed on Thursday that the number of people claiming unemployment benefits fell to 233,000 in the week ending June 21, below market expectations of 236,000. The claim count fell for a second consecutive week since hitting the 10-month high of 243,000 earlier in June.
- The first US presidential debate between President Joe Biden and Republican Presidential Nominee Donald Trump began on CNN News. Biden acknowledged that “inflation had driven prices substantially higher than at the start of his term but said he deserves credit for putting 'things back together again' following the coronavirus pandemic.” In response, Trump condemned elevated inflation levels. He suggested that tariffs would decrease deficits and urged scrutiny of countries like China, per Reuters.
- Reserve Bank of Australia (RBA) Assistant Governor Christopher Kent stated on Wednesday that recent data emphasize the necessity of remaining vigilant about potential inflation increases. Kent noted that current policies are contributing to slower demand growth and lower inflation. He also mentioned that no options regarding future interest rate adjustments are being excluded, per Bloomberg.
- Australia’s monthly Consumer Price Index (CPI) jumped by 4.0% in the year to May, up from the 3.6% increase recorded in April, according to data published by the Australian Bureau of Statistics (ABS) on Wednesday. This increase exceeded the market forecast, which predicted a 3.8% growth for the reported period.
Technical Analysis: Australian Dollar falls below 0.6650
The Australian Dollar trades around 0.6630 on Friday. The daily chart analysis indicates a neutral bias for the AUD/USD pair as it consolidates within a rectangle formation. The 14-day Relative Strength Index (RSI) is at the 50 level, also suggesting neutral momentum. Further movement may signal a clear directional trend.
The AUD/USD pair finds support around the 50-day Exponential Moving Average (EMA) at 0.6618. A break below this level could lead the pair to test the lower boundary of the rectangle formation near 0.6585.
On the upside, the AUD/USD pair may face resistance near the upper boundary of the rectangle formation around 0.6695, close to the psychological level of 0.6700. Further resistance appears at 0.6714, the highest level since January.
AUD/USD: Daily Chart
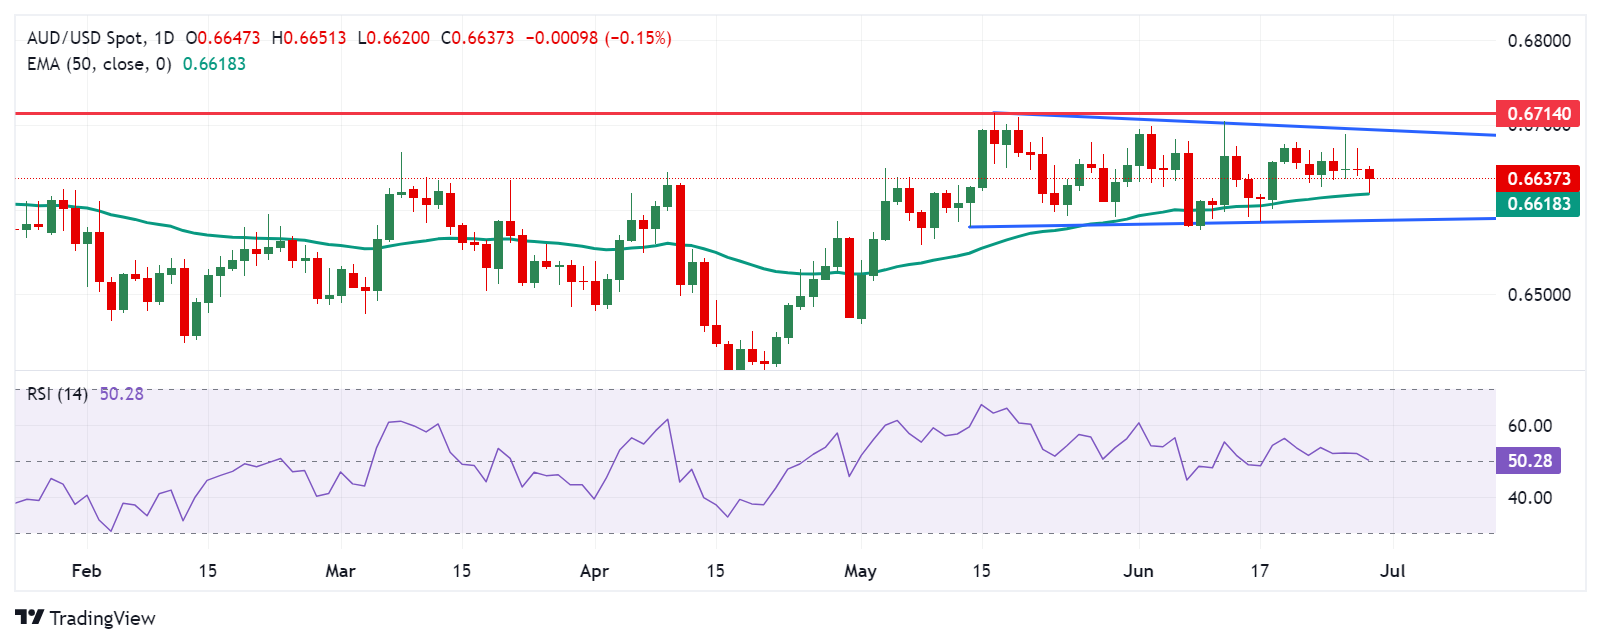
Australian Dollar PRICE Today
The table below shows the percentage change of the Australian Dollar (AUD) against listed major currencies today. The Australian Dollar was the weakest against the US Dollar.
| USD | EUR | GBP | JPY | CAD | AUD | NZD | CHF | |
|---|---|---|---|---|---|---|---|---|
| USD | 0.10% | 0.03% | 0.10% | 0.12% | 0.21% | 0.20% | 0.08% | |
| EUR | -0.10% | -0.06% | -0.03% | 0.02% | 0.09% | 0.10% | -0.02% | |
| GBP | -0.03% | 0.06% | 0.02% | 0.07% | 0.16% | 0.15% | 0.01% | |
| JPY | -0.10% | 0.03% | -0.02% | 0.02% | 0.12% | 0.10% | -0.01% | |
| CAD | -0.12% | -0.02% | -0.07% | -0.02% | 0.08% | 0.07% | -0.07% | |
| AUD | -0.21% | -0.09% | -0.16% | -0.12% | -0.08% | -0.01% | -0.14% | |
| NZD | -0.20% | -0.10% | -0.15% | -0.10% | -0.07% | 0.00% | -0.14% | |
| CHF | -0.08% | 0.02% | -0.01% | 0.00% | 0.07% | 0.14% | 0.14% |
The heat map shows percentage changes of major currencies against each other. The base currency is picked from the left column, while the quote currency is picked from the top row. For example, if you pick the Australian Dollar from the left column and move along the horizontal line to the US Dollar, the percentage change displayed in the box will represent AUD (base)/USD (quote).
Australian Dollar FAQs
One of the most significant factors for the Australian Dollar (AUD) is the level of interest rates set by the Reserve Bank of Australia (RBA). Because Australia is a resource-rich country another key driver is the price of its biggest export, Iron Ore. The health of the Chinese economy, its largest trading partner, is a factor, as well as inflation in Australia, its growth rate and Trade Balance. Market sentiment – whether investors are taking on more risky assets (risk-on) or seeking safe-havens (risk-off) – is also a factor, with risk-on positive for AUD.
The Reserve Bank of Australia (RBA) influences the Australian Dollar (AUD) by setting the level of interest rates that Australian banks can lend to each other. This influences the level of interest rates in the economy as a whole. The main goal of the RBA is to maintain a stable inflation rate of 2-3% by adjusting interest rates up or down. Relatively high interest rates compared to other major central banks support the AUD, and the opposite for relatively low. The RBA can also use quantitative easing and tightening to influence credit conditions, with the former AUD-negative and the latter AUD-positive.
China is Australia’s largest trading partner so the health of the Chinese economy is a major influence on the value of the Australian Dollar (AUD). When the Chinese economy is doing well it purchases more raw materials, goods and services from Australia, lifting demand for the AUD, and pushing up its value. The opposite is the case when the Chinese economy is not growing as fast as expected. Positive or negative surprises in Chinese growth data, therefore, often have a direct impact on the Australian Dollar and its pairs.
Iron Ore is Australia’s largest export, accounting for $118 billion a year according to data from 2021, with China as its primary destination. The price of Iron Ore, therefore, can be a driver of the Australian Dollar. Generally, if the price of Iron Ore rises, AUD also goes up, as aggregate demand for the currency increases. The opposite is the case if the price of Iron Ore falls. Higher Iron Ore prices also tend to result in a greater likelihood of a positive Trade Balance for Australia, which is also positive of the AUD.
The Trade Balance, which is the difference between what a country earns from its exports versus what it pays for its imports, is another factor that can influence the value of the Australian Dollar. If Australia produces highly sought after exports, then its currency will gain in value purely from the surplus demand created from foreign buyers seeking to purchase its exports versus what it spends to purchase imports. Therefore, a positive net Trade Balance strengthens the AUD, with the opposite effect if the Trade Balance is negative.
Japanese Finance Minister Shunichi Suzuki said on Friday that he is “deeply concerned about excessive, one-sided moves on forex. “
Additional comments
Won't comment on forex levels.
Important for currencies to move in stable manner reflecting fundamentals.
Rapid FX moves undesirable.
Deeply concerned about excessive, one-sided moves on forex.
Closely watching FX moves with a high sense of urgency.
No comment on whether current levels are excessive or not.
Believe trust in Japanese currency maintained.
Market reaction
At the time of writing, USD/JPY is extending a retreat from a new 38-year peak of 161.28, currently trading near 160.90. The pair is still up 0.10% on the day.
| Raw materials | Closed | Change, % |
|---|---|---|
| Silver | 28.973 | 0.77 |
| Gold | 232.793 | 1.27 |
| Palladium | 932.09 | 0.74 |
- DXY regains positive traction amid some repositioning ahead of the US PCE Price Index.
- The recent hawkish comments by Fed officials back the case for one rate cut this year.
- Hence, the crucial inflation data will play a key role in driving the USD in the near term.
The US Dollar (USD) attracts fresh buyers following the previous day's softer US macro data-inspired downfall and climbs to a fresh two-month peak during the Asian session on Friday. The USD Index (DXY), which tracks the Greenback against a basket of currencies, is currently placed just above the 106.00 mark, up 0.15% for the day, as traders look to the crucial US inflation data for some meaningful impetus.
The Federal Reserve's (Fed) preferred inflation measure – the Personal Consumption Expenditure (PCE) Price Index – will be released later during the early North American session at 12:30 GMT. A lower-than-expected PCE deflator or a number that is in line with market expectations will back the case for two rate cuts by the Fed this year, which, in turn, could weaken the USD. Meanwhile, any upward surprise should push back the expected timing for the first Fed cut and trigger a fresh leg up for the buck.
Heading into the key data risk, the recent comments from a slew of influential FOMC members suggested that the US central bank is in no rush to start its rate-cutting cycle. In fact, Fed Governor Michelle Bowman said on Thursday that we are not at a point yet to consider a rate cut as the upside risks to inflation persist. Moreover, Atlanta Fed President Raphael Bostic noted that inflation remains a chief concern and that the central bank wants to be absolutely certain that inflation will return to 2% before an initial cut.
This overshadowed Thursday’s unimpressive US data, which indicated that growth momentum in the world's largest economy is moderating. Hence, Friday's release of the US PCE data will drive expectations about the Fed's future policy decisions, which, in turn, should drive the Greenback in the near term. Meanwhile, the first US presidential debate between President Joe Biden and Republican Presidential Nominee Donald Trump failed to provide any impetus to the USD, which remains on track to end in the green for the fourth straight week.
Economic Indicator
Personal Consumption Expenditures - Price Index (YoY)
The Personal Consumption Expenditures (PCE), released by the US Bureau of Economic Analysis on a monthly basis, measures the changes in the prices of goods and services purchased by consumers in the United States (US). The YoY reading compares prices in the reference month to a year earlier. Price changes may cause consumers to switch from buying one good to another and the PCE Deflator can account for such substitutions. This makes it the preferred measure of inflation for the Federal Reserve. Generally, a high reading is bullish for the US Dollar (USD), while a low reading is bearish.
Read more.Next release: Fri Jun 28, 2024 12:30
Frequency: Monthly
Consensus: 2.6%
Previous: 2.7%
Source: US Bureau of Economic Analysis
- Gold price struggles to capitalize on the overnight strong bounce from a two-week low.
- Fed rate cut uncertainty helps limit the USD corrective slide and caps gains for the metal.
- Traders also seem reluctant to place aggressive bets ahead of the key US PCE Price Index.
Gold price (XAU/USD) registered strong gains of over 1% on Thursday and snapped a two-day losing streak to a two-week low touched the previous day. Softer US macro data released on Thursday suggested that growth momentum in the world's largest economy is moderating. This comes on top of signs of easing inflationary pressures and reaffirms market expectations that the Federal Reserve (Fed) will start cutting interest rates. This led to the overnight downfall in the US Treasury bond yields this year, which triggered the US Dollar (USD) corrective slide from its highest level since early May and benefited the precious metal.
Apart from this, geopolitical tensions in the Middle East and the protracted Russia-Ukraine war provided an additional lift to the safe-haven Gold price. The upside for the XAU/USD, however, remains capped as bulls seem reluctant to place aggressive bets and prefer to wait for more cues about the Fed's rate-cut path. Hence, the spotlight remains on the US Personal Consumption Expenditures (PCE) Price Index, due later during the North American session. The crucial US inflation data will influence expectations about the Fed's future policy decision and determine the near-term trajectory for the non-yielding yellow metal.
Daily Digest Market Movers: Gold price awaits US PCE for more cues about the Fed’s rate-cut path
- The softer US macro data published on Thursday lifted bets for an imminent start of the Federal Reserve's rate-cutting cycle this year and triggered a short-covering rally around the Gold price.
- The real US GDP growth for the first quarter was revised up to 1.4% annualized pace, though it marked the slowest rise since spring 2022 and confirmed a sharp slowdown from 3.4% in the previous quarter.
- The US Census Bureau reported that Durable Goods Orders increased by 0.1% in May as compared to a 0.1% fall anticipated and the 0.6% growth (revised from +0.7%) recorded in the previous month.
- Separately, the Labor Department said that Initial Jobless Claims fell to 233,000 in the week ended June 22, but the four-week moving average rose to 236,000, or the highest level since last September.
- Furthermore, US Pending Home Sales – a forward-looking indicator of home sales based on contract signings– unexpectedly decreased by 2.1% in May, to the lowest level on record going back to 2001.
- This comes on top of tepid US Retail Sales figures for May and signs that inflation is subsiding, which, in turn, should allow the Fed to lower borrowing costs as early as at the September policy meeting.
- The US Dollar, however, found some support from comments by Fed Governor Michelle Bowman, saying that we are not at a point yet to consider a rate cut as the upside risks to inflation persist.
- This, in turn, caps any further gains for the XAU/USD ahead of the release of the US Personal Consumption Expenditures (PCE) Price Index – the Fed's preferred inflation gauge – later this Friday.
Technical Analysis: Gold price fails ahead of 50-day SMA support breakpoint turned hurdle
From a technical perspective, the overnight positive move stalled ahead of the 50-day Simple Moving Average (SMA) support breakpoint, now turned resistance. The said barrier is currently pegged near the $2,337-2,338 region, which should now act as a key pivotal point. A sustained strength beyond has the potential to lift the Gold price back towards the $2,360-2,365 supply zone. Some follow-through buying will negate any near-term negative bias and allow bulls to reclaim the $2,400 round-figure mark. The momentum could extend further towards challenging the all-time peak, around the $2,450 area touched in May.
On the flip side, the $2,300 round-figure mark is likely to protect the immediate downside ahead of the $2,285 horizontal support. A convincing break below the latter will be seen as a fresh trigger for bearish traders and drag the Gold price to the 100-day SMA, currently near the $2,250 area. The XAU/USD could eventually drop to the $2,225-2,220 region en route to the $2,200 round-figure mark.
Gold FAQs
Gold has played a key role in human’s history as it has been widely used as a store of value and medium of exchange. Currently, apart from its shine and usage for jewelry, the precious metal is widely seen as a safe-haven asset, meaning that it is considered a good investment during turbulent times. Gold is also widely seen as a hedge against inflation and against depreciating currencies as it doesn’t rely on any specific issuer or government.
Central banks are the biggest Gold holders. In their aim to support their currencies in turbulent times, central banks tend to diversify their reserves and buy Gold to improve the perceived strength of the economy and the currency. High Gold reserves can be a source of trust for a country’s solvency. Central banks added 1,136 tonnes of Gold worth around $70 billion to their reserves in 2022, according to data from the World Gold Council. This is the highest yearly purchase since records began. Central banks from emerging economies such as China, India and Turkey are quickly increasing their Gold reserves.
Gold has an inverse correlation with the US Dollar and US Treasuries, which are both major reserve and safe-haven assets. When the Dollar depreciates, Gold tends to rise, enabling investors and central banks to diversify their assets in turbulent times. Gold is also inversely correlated with risk assets. A rally in the stock market tends to weaken Gold price, while sell-offs in riskier markets tend to favor the precious metal.
The price can move due to a wide range of factors. Geopolitical instability or fears of a deep recession can quickly make Gold price escalate due to its safe-haven status. As a yield-less asset, Gold tends to rise with lower interest rates, while higher cost of money usually weighs down on the yellow metal. Still, most moves depend on how the US Dollar (USD) behaves as the asset is priced in dollars (XAU/USD). A strong Dollar tends to keep the price of Gold controlled, whereas a weaker Dollar is likely to push Gold prices up.
The first US presidential debate between President Joe Biden and Republican Presidential Nominee Donald Trump began on CNN News. It is their first showdown of the 2024 election process.
The first question asked was on the state of the economy, including spiraling inflation, and whether it has been worse off after US President Biden took over.
Biden acknowledged that “inflation had driven prices substantially higher than at the start of his term but said he deserves credit for putting 'things back together again' following the coronavirus pandemic,” per Reuters.
Biden said that he aims to reduce housing prices, increase construction, and limit rent caps if he gets elected for the second term.
Trump condemned elevated inflation levels. He suggested that tariffs would decrease deficits and urged scrutiny of countries like China.
When asked about the Russia-Ukraine war, Trump said that If Russia respected President Biden, he wouldn’t have invaded Ukraine. He added that Biden in fact encouraged Putin to get into the war.
“Shortly after I win the presidency, I will have the horrible war between Russia and Ukraine settled,” Trump said.
Biden refuted saying that former President Trump wants to get out of the North Atlantic Treaty Organization (NATO) and start a nuclear war.
Further, both candidates slammed each other on topics such as immigration, abortion rights, foreign policy and the Middle East conflict.
“Would you support the creation of an independent Palestinian state in order to support peace in the region,” CNN moderator Dana Bash asked Trump.
“I’d have to see,” Trump replied.
developing story, please refresh the page for updates.
US Dollar keeps pushing higher
The US dollar catches a fresh bid against its major currency rivals, mainly driven by surging USD/JPY, as the Japanese Yen slides further. The debate seems to have limited impact across the FX board.
US Dollar PRICE Today
The table below shows the percentage change of US Dollar (USD) against listed major currencies today. US Dollar was the strongest against the Australian Dollar.
| USD | EUR | GBP | JPY | CAD | AUD | NZD | CHF | |
|---|---|---|---|---|---|---|---|---|
| USD | 0.17% | 0.12% | 0.19% | 0.23% | 0.34% | 0.30% | 0.14% | |
| EUR | -0.17% | -0.04% | 0.03% | 0.06% | 0.16% | 0.13% | -0.02% | |
| GBP | -0.12% | 0.04% | 0.06% | 0.09% | 0.20% | 0.17% | -0.01% | |
| JPY | -0.19% | -0.03% | -0.06% | 0.00% | 0.13% | 0.08% | -0.06% | |
| CAD | -0.23% | -0.06% | -0.09% | -0.01% | 0.10% | 0.07% | -0.12% | |
| AUD | -0.34% | -0.16% | -0.20% | -0.13% | -0.10% | -0.03% | -0.21% | |
| NZD | -0.30% | -0.13% | -0.17% | -0.08% | -0.07% | 0.03% | -0.18% | |
| CHF | -0.14% | 0.02% | 0.01% | 0.06% | 0.12% | 0.21% | 0.18% |
The heat map shows percentage changes of major currencies against each other. The base currency is picked from the left column, while the quote currency is picked from the top row. For example, if you pick the US Dollar from the left column and move along the horizontal line to the Japanese Yen, the percentage change displayed in the box will represent USD (base)/JPY (quote).
- USD/JPY marks fresh 38-year high at 161.27.
- Tokyo CPI rose to 2.3% year-over-year in June, up from the previous period's 2.2%.
- The US Dollar (USD) gains ground due to higher yields on US Treasury bonds.
USD/JPY trades around 161.00, the highest level since 1986, during the Asian session on Friday. The Consumer Price Index (CPI) inflation in Tokyo rose to 2.3% year-over-year in June, up from the previous period's 2.2%. Core Tokyo CPI inflation, which excludes volatile food prices, also increased during the same period, reaching 2.1% YoY compared to the previous 1.9%, surpassing the median market forecast of 2.0% YoY.
Japanese Finance Minister Shunichi Suzuki stated on Wednesday that he "will take appropriate steps on excessive FX moves." Suzuki refrained from commenting on specific forex levels or potential interventions but emphasized the importance of currencies moving in a stable manner that reflects fundamentals. Chief Cabinet Secretary Yoshimasa Hayashi echoed similar sentiments as the Finance Minister.
The US Dollar (USD) gains ground due to higher yields on US Treasury bonds. 2-year and 10-year yields stand at 4.72% and 4.30%, respectively, by the press time. Federal Reserve (Fed) Board of Governors member Michelle Bowman noted on Thursday that while current Fed policies should be enough to drag inflation back to target, the Fed shouldn't be unwilling to weigh further rate cuts in inflation data proves sticky.
Friday’s Core PCE Price Index inflation is projected to decrease year-over-year to 2.6% from the previous 2.8%. This data is seen as the Federal Reserve's (Fed) preferred inflation gauge. Market participants are hoping that signs of easing inflation will encourage the Federal Reserve (Fed) to consider rate cuts sooner rather than later.
Japanese Yen FAQs
The Japanese Yen (JPY) is one of the world’s most traded currencies. Its value is broadly determined by the performance of the Japanese economy, but more specifically by the Bank of Japan’s policy, the differential between Japanese and US bond yields, or risk sentiment among traders, among other factors.
One of the Bank of Japan’s mandates is currency control, so its moves are key for the Yen. The BoJ has directly intervened in currency markets sometimes, generally to lower the value of the Yen, although it refrains from doing it often due to political concerns of its main trading partners. The current BoJ ultra-loose monetary policy, based on massive stimulus to the economy, has caused the Yen to depreciate against its main currency peers. This process has exacerbated more recently due to an increasing policy divergence between the Bank of Japan and other main central banks, which have opted to increase interest rates sharply to fight decades-high levels of inflation.
The BoJ’s stance of sticking to ultra-loose monetary policy has led to a widening policy divergence with other central banks, particularly with the US Federal Reserve. This supports a widening of the differential between the 10-year US and Japanese bonds, which favors the US Dollar against the Japanese Yen.
The Japanese Yen is often seen as a safe-haven investment. This means that in times of market stress, investors are more likely to put their money in the Japanese currency due to its supposed reliability and stability. Turbulent times are likely to strengthen the Yen’s value against other currencies seen as more risky to invest in.
The People’s Bank of China (PBOC) set the USD/CNY central rate on Friday at 7.1268, as against the previous day's fix of 7.1270 and 7.2727 Reuters estimates.
| Index | Change, points | Closed | Change, % |
|---|---|---|---|
| NIKKEI 225 | -325.53 | 39341.54 | -0.82 |
| Hang Seng | -373.46 | 17716.47 | -2.06 |
| KOSPI | -7.99 | 2784.06 | -0.29 |
| ASX 200 | -23.4 | 7759.6 | -0.3 |
| DAX | 55.31 | 18210.55 | 0.3 |
| CAC 40 | -78.43 | 7530.72 | -1.03 |
| Dow Jones | 36.26 | 39164.06 | 0.09 |
| S&P 500 | 4.97 | 5482.87 | 0.09 |
| NASDAQ Composite | 53.52 | 17858.68 | 0.3 |
| Pare | Closed | Change, % |
|---|---|---|
| AUDUSD | 0.66466 | -0.01 |
| EURJPY | 172.062 | 0.25 |
| EURUSD | 1.0705 | 0.23 |
| GBPJPY | 203.17 | 0.18 |
| GBPUSD | 1.26406 | 0.15 |
| NZDUSD | 0.60818 | -0.02 |
| USDCAD | 1.36966 | -0.05 |
| USDCHF | 0.89857 | 0.17 |
| USDJPY | 160.722 | 0.02 |


© 2000-2026. All rights reserved.
This site is managed by Teletrade D.J. LLC 2351 LLC 2022 (Euro House, Richmond Hill Road, Kingstown, VC0100, St. Vincent and the Grenadines).
The information on this website is for informational purposes only and does not constitute any investment advice.
The company does not serve or provide services to customers who are residents of the US, Canada, Iran, The Democratic People's Republic of Korea, Yemen and FATF blacklisted countries.
Making transactions on financial markets with marginal financial instruments opens up wide possibilities and allows investors who are willing to take risks to earn high profits, carrying a potentially high risk of losses at the same time. Therefore you should responsibly approach the issue of choosing the appropriate investment strategy, taking the available resources into account, before starting trading.
Use of the information: full or partial use of materials from this website must always be referenced to TeleTrade as the source of information. Use of the materials on the Internet must be accompanied by a hyperlink to teletrade.org. Automatic import of materials and information from this website is prohibited.
Please contact our PR department if you have any questions or need assistance at pr@teletrade.global.
transfers