- Analytics
- News and Tools
- Market News
CFD Markets News and Forecasts — 28-05-2024
- GBP/USD trades with a mild negative bias near 1.2760 on Wednesday.
- The US CB Consumer Confidence Index improved to 102.0 in May.
- The IMF raised the UK growth forecasts but anticipated two to three rate cuts from the BoE.
The GBP/USD pair trades with mild losses around 1.2760 during the Asian session on Wednesday. The modest recovery of the US Dollar (USD) and US yields amid the diminishing expectations of a rate cut by the US Federal Reserve (Fed) in September weighs on the major pair. The Fed’s Beige Book is due later on Wednesday and the Fed’s John Williams is due to speak.
Consumer Confidence improved slightly in May, the Conference Board reported on Tuesday. The figure rose to 102.0 in May from 97.0 in April, beating the estimation of 95.9. However, US consumers remain concerned about inflation, and many households believe interest rates will be higher over the next year.
Meanwhile, US Fed officials delivered more hawkish comments, boosting the Greenback broadly. Fed Governor Michelle Bowman said on Tuesday that she would have supported either waiting to start slowing the quantitative tightening pace or a more moderate tapering process than announced earlier this month. Fed Minneapolis President Neel Kashkari said that the central bank should wait for significant progress on inflation before cutting interest rates, adding that he expected no more than two rate cuts in 2024.
On the other hand, the expectation that the Bank of England (BoE) will start cutting the interest rate in June drags the Pound Sterling (GBP) lower. The International Monetary Fund (IMF) raised the UK growth forecasts but anticipated two to three rate cuts from the BoE. Amid the absence of top-tier economic data releases from the UK, the election speculation could drive movement in the Cable. The worries about political uncertainty might hurt the GBP and create a headwind for the GBP/USD pair.
- EUR/USD failed to capture 1.0890 in Tuesday’s early bull run.
- 1.0860 remains a key consolidation point for the Fiber.
- German CPI inflation due Wednesday, US GDP and PCE inflation loom ahead.
EUR/USD rose to an intraday high near 1.0890 on Tuesday before market flows dragged the pair back down to familiar levels near 1.0860, and the pair is holding on-balance as Euro traders head into a fresh print of German Consumer Price Index (CPI) inflation. Key US data hides just around the corner with Gross Domestic Product (GDP) and Personal Consumption Expenditure (PCE) Price Index inflation due on Thursday and Friday, respectively.
German CPI inflation in May is expected to ease to 0.2% MoM in May, down from the previous 0.5% as investors hope CPI inflation in key European economies will turn around and continue to ease in time to push the European Central Bank (ECB) into a quarter-point cut at the central bank’s upcoming rate call in June.
US investors have been fighting an uphill battle trying to time when the Federal Reserve (Fed) will deliver a first rate cut. Back in December, markets had priced in upwards of six cuts of at least 25 basis points apiece, with the first quarter-point-minimum cut expected in March. Today, rate markets are pricing in roughly-even odds of a quarter-point cut to come in September, with hopes of two total cuts in 2024 withering on the vine.
US Annualized Q1 Gross Domestic Product (GDP) slated for Thursday is forecast to ease to 1.3% from the previous 1.6%. Friday’s US PCE Price Index inflation on Friday is expected to hold steady at 0.3% MoM.
EUR/USD technical outlook
EUR/USD is cycling in familiar technical congestion, but a hidden bullish divergence of the Moving Average Convergence-Divergence (MACD) implies the pair could be primed for a push higher if bidders are able to springboard off of the 200-hour Exponential Moving Average at 1.0844.
However, the 200-day EMA at 1.0804 is acting as a price magnet, threatening to pull the pair down, and daily candlesticks are drifting into familiar middle territory. The daily MACD is also easing back into directionless territory.
EUR/USD hourly chart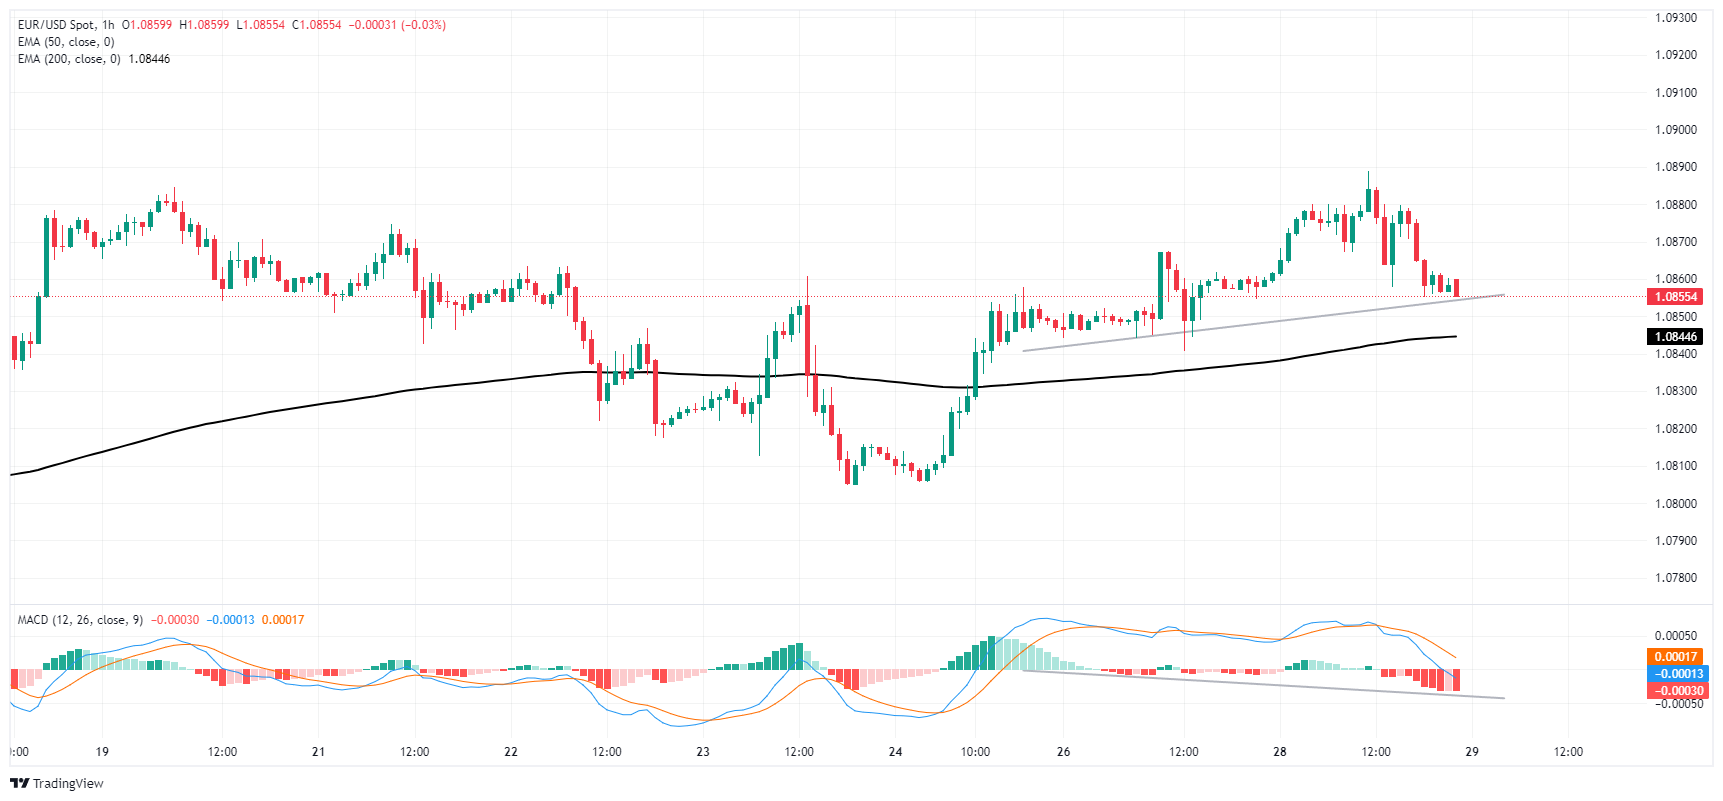
EUR/USD daily chart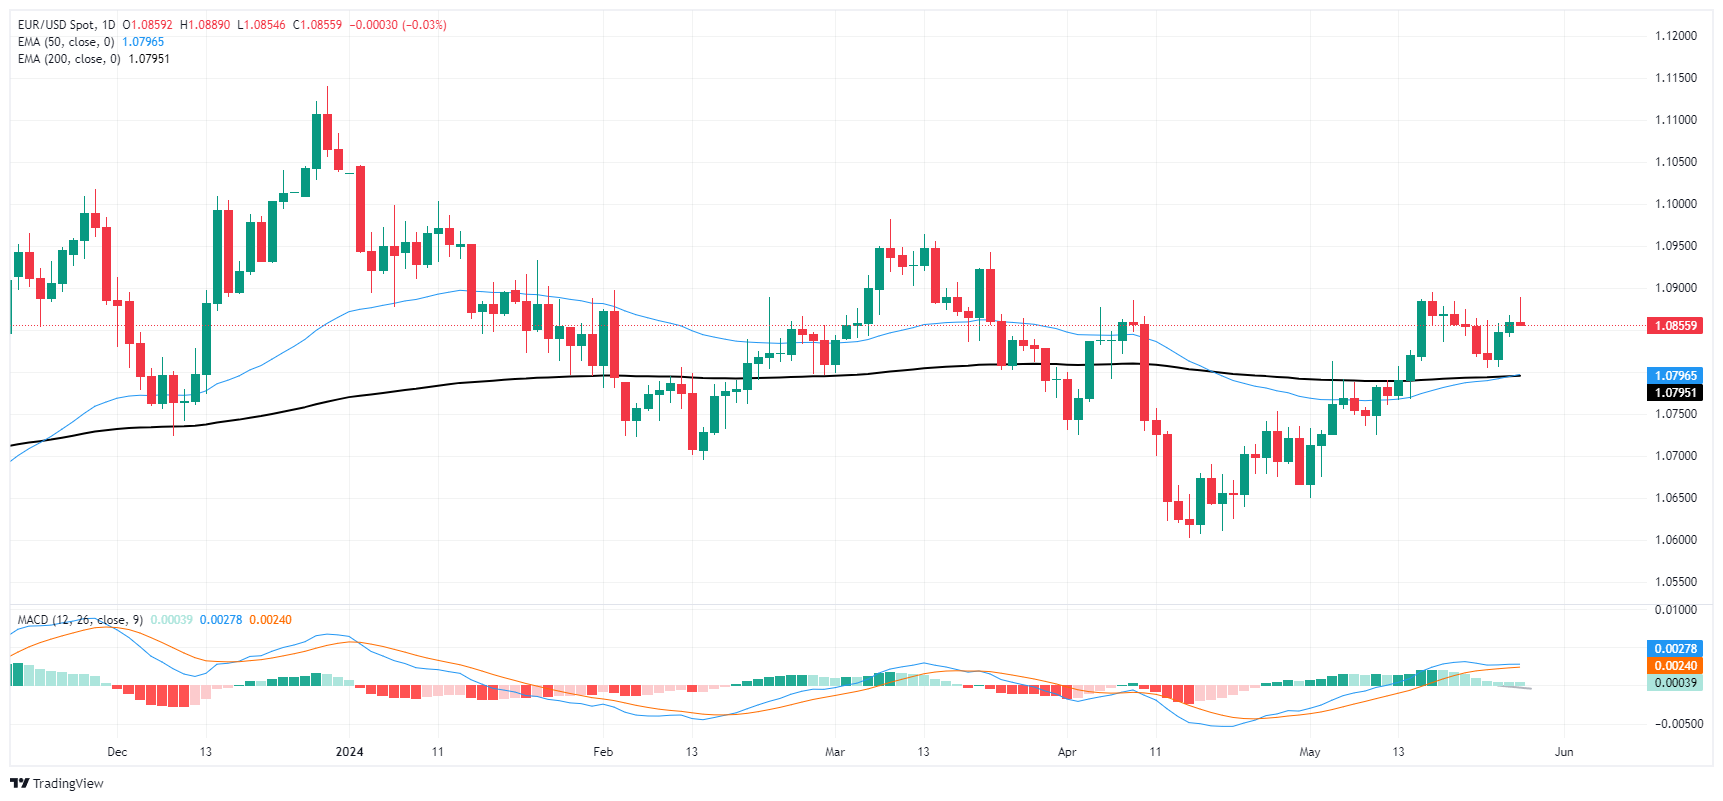
- AUD/USD remains at 0.6649, unchanged as Asian session begins.
- Minneapolis Fed President Kashkari's comments on rate hikes bolster USD strength.
- Upcoming Australian CPI data may influence AUD, with potential rise aiding in recovery.
The Australian Dollar registered minuscule losses against the US Dollar on Tuesday amid higher US Treasury yields. A softer-than-expected US 5-year Treasury note auction boosted the Greenback, which posed gains versus most other currencies. As the Asian session begins, the AUD/USD trades at 0.6649, virtually unchanged.
AUD/USD trades flat as higher US yields and hawkish Fed remarks support US Dollar
Fed speakers grabbed the headlines on Tuesday, led by Minneapolis Fed President Neel Kashkari. He said, “I don’t think anybody has totally taken rate increases off the table,” while in a Q&A session, he answered he wasn’t confident about the evolution of the disinflationary process and foresees just two rate cuts.
Data-wise, the Conference Board revealed that Consumer Confidence persists after hitting 102.0 from 97.5, the highest print after posting three months of decreases. The lift was primarily driven by improved expectations meaning consumer spending may remain robust in the second half of 2024.
Aside from this, US Treasury bond yields jumped on a softer US 5-year T-note auction, with the 10-year note coupon rising seven basis points to 4.548%, a tailwind for the US Dollar.
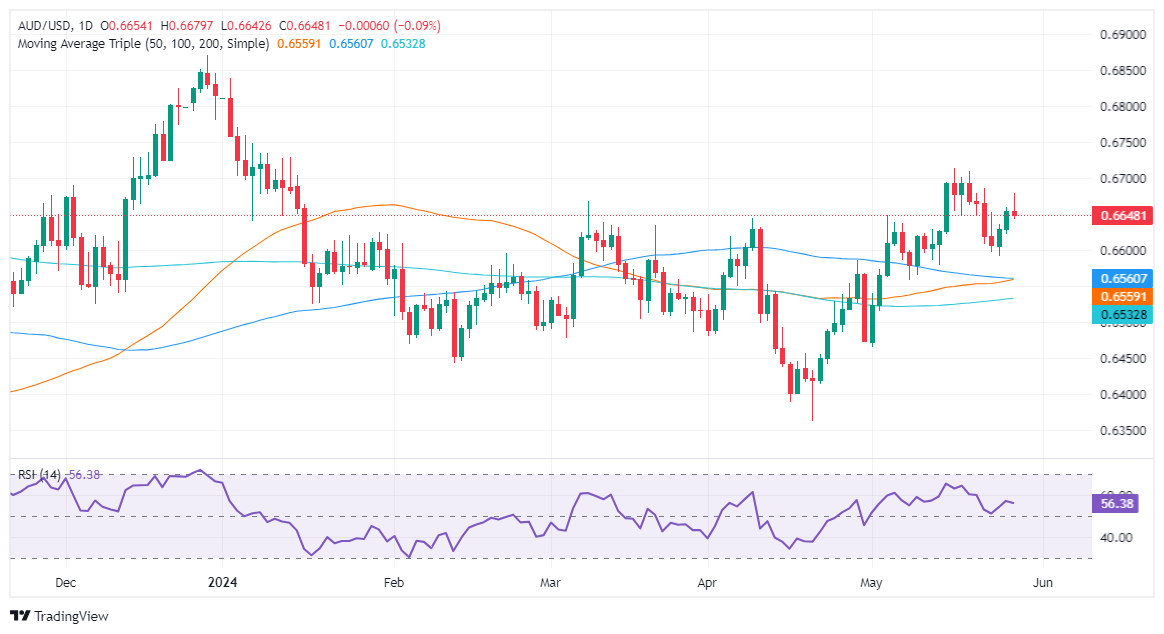
On the Aussie’s front, the schedule would feature the Westpac Leading and the monthly Consumer Price Index (CPI) for April. Analysts estimate prices to fall from around 3.5% YoY to 3.4%, which would maintain the status quo. Otherwise, a rise exceeding expectations could benefit the AUD/USD and push prices toward the March 8 high of 0.6667.
AUD/USD Price Analysis: Technical outlook
The Aussie Dollar remains upward biased despite retreating from weekly highs of 0.6673, amid forming a ‘gravestone doji,’ which hints further downside is seen. Momentum shows that buyers are in charge, as depicted by the Relatives Strength Index (RSI) standing at bullish territory. Still, in the short term, the AUD/USD could be headed for a correction to the latest cycle low of 0.6592 before targeting the year-to-date (YTD) high of 0.6839.
Australian Dollar PRICE This week
The table below shows the percentage change of Australian Dollar (AUD) against listed major currencies this week. Australian Dollar was the strongest against the Japanese Yen.
| USD | EUR | GBP | JPY | CAD | AUD | NZD | CHF | |
|---|---|---|---|---|---|---|---|---|
| USD | -0.08% | -0.17% | 0.11% | -0.15% | -0.29% | -0.40% | -0.24% | |
| EUR | 0.08% | -0.11% | 0.22% | -0.07% | -0.28% | -0.41% | -0.13% | |
| GBP | 0.17% | 0.11% | 0.28% | 0.02% | -0.16% | -0.23% | -0.04% | |
| JPY | -0.11% | -0.22% | -0.28% | -0.31% | -0.43% | -0.44% | -0.39% | |
| CAD | 0.15% | 0.07% | -0.02% | 0.31% | -0.16% | -0.24% | -0.14% | |
| AUD | 0.29% | 0.28% | 0.16% | 0.43% | 0.16% | -0.05% | 0.11% | |
| NZD | 0.40% | 0.41% | 0.23% | 0.44% | 0.24% | 0.05% | 0.15% | |
| CHF | 0.24% | 0.13% | 0.04% | 0.39% | 0.14% | -0.11% | -0.15% |
The heat map shows percentage changes of major currencies against each other. The base currency is picked from the left column, while the quote currency is picked from the top row. For example, if you pick the Australian Dollar from the left column and move along the horizontal line to the US Dollar, the percentage change displayed in the box will represent AUD (base)/USD (quote).
Australian Dollar FAQs
One of the most significant factors for the Australian Dollar (AUD) is the level of interest rates set by the Reserve Bank of Australia (RBA). Because Australia is a resource-rich country another key driver is the price of its biggest export, Iron Ore. The health of the Chinese economy, its largest trading partner, is a factor, as well as inflation in Australia, its growth rate and Trade Balance. Market sentiment – whether investors are taking on more risky assets (risk-on) or seeking safe-havens (risk-off) – is also a factor, with risk-on positive for AUD.
The Reserve Bank of Australia (RBA) influences the Australian Dollar (AUD) by setting the level of interest rates that Australian banks can lend to each other. This influences the level of interest rates in the economy as a whole. The main goal of the RBA is to maintain a stable inflation rate of 2-3% by adjusting interest rates up or down. Relatively high interest rates compared to other major central banks support the AUD, and the opposite for relatively low. The RBA can also use quantitative easing and tightening to influence credit conditions, with the former AUD-negative and the latter AUD-positive.
China is Australia’s largest trading partner so the health of the Chinese economy is a major influence on the value of the Australian Dollar (AUD). When the Chinese economy is doing well it purchases more raw materials, goods and services from Australia, lifting demand for the AUD, and pushing up its value. The opposite is the case when the Chinese economy is not growing as fast as expected. Positive or negative surprises in Chinese growth data, therefore, often have a direct impact on the Australian Dollar and its pairs.
Iron Ore is Australia’s largest export, accounting for $118 billion a year according to data from 2021, with China as its primary destination. The price of Iron Ore, therefore, can be a driver of the Australian Dollar. Generally, if the price of Iron Ore rises, AUD also goes up, as aggregate demand for the currency increases. The opposite is the case if the price of Iron Ore falls. Higher Iron Ore prices also tend to result in a greater likelihood of a positive Trade Balance for Australia, which is also positive of the AUD.
The Trade Balance, which is the difference between what a country earns from its exports versus what it pays for its imports, is another factor that can influence the value of the Australian Dollar. If Australia produces highly sought after exports, then its currency will gain in value purely from the surplus demand created from foreign buyers seeking to purchase its exports versus what it spends to purchase imports. Therefore, a positive net Trade Balance strengthens the AUD, with the opposite effect if the Trade Balance is negative.
- GBP/JPY breached 200.60, setting a fresh 34-year high.
- Thin UK data leaves GBP free to drift higher against the Yen.
- Japanes Tokyo CPI inflation due on Friday.
GBP/JPY drifted into a new 34-year high above 200.60 on Tuesday as Yen pairs continue to pare away JPY strength following suspected “Yenterventions” from the Bank of Japan (BoJ) and Japanese Minstry of Finance who overspent nine trillion Yen on miscellaneous financial operations and is broadly assumed to have intervened directly in global markets in an attempt to shore up the battered Yen.
No official statement from the BoJ or the Ministry has been forthcoming, but markets are challenging Japanese planners and shorting the Yen back into multi-decade lows. The Guppy hit its highest bids in 34 years as the wide rate differential between the BoJ and other central banks including the Bank of England (BoE) remains simply too high for markets to bolster the JPY.
The key datapoint for the GBP/JPY this week will be Japan’s Tokyo Consumer Price Index (CPI) inflation update due on Thursday. Core Tokyo CPI for the year ended in May is expected to tick higher to 1.9% from 1.6%. Headline Tokyo CPI inflation last printed at 1.8% in April.
Markets remain unsure of when the BoE will deliver much-hoped for rate cuts. Previous hopes for a June rate cut have evaporated, and investors are looking for signs that the BoE will make a first rate trim in September.
GBP/JPY technical outlook
The Guppy has traded entirely one-sided since drooping to a near-term low near 191.50. The pair has 4.8% since the beginning of May, and is poised for further gains into multi-decade highs.
GBP/JPY is up over 12% after knocking into the 200-day Exponential Moving Average (EMA) at the beginning of 2024. The pair has closed in the green for all but three of the last 16 consecutive trading days.
GBP/JPY hourly chart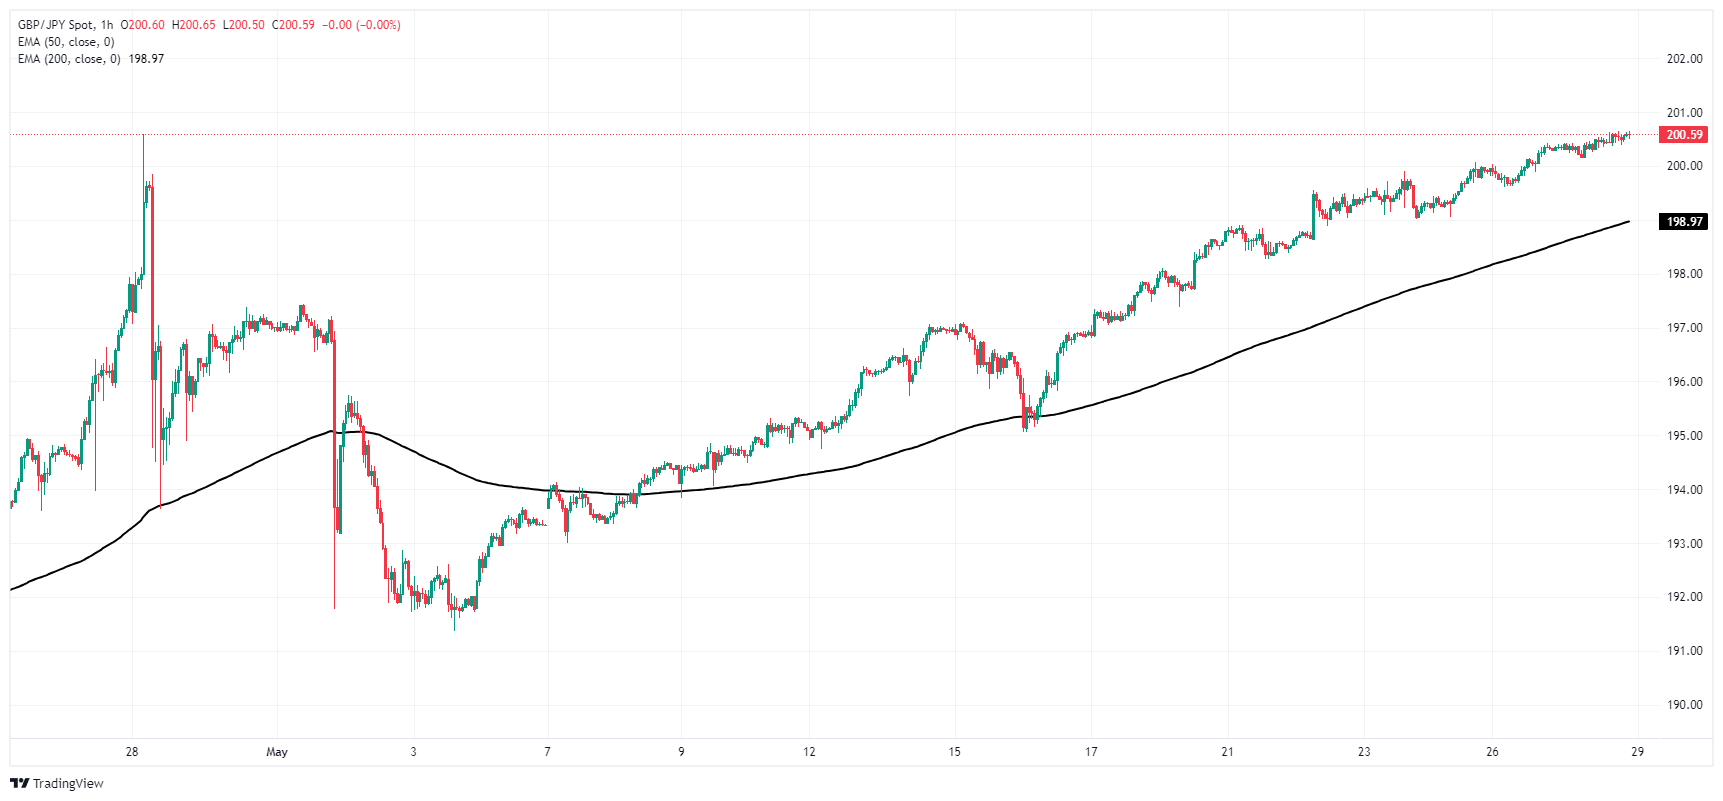
GBP/JPY daily chart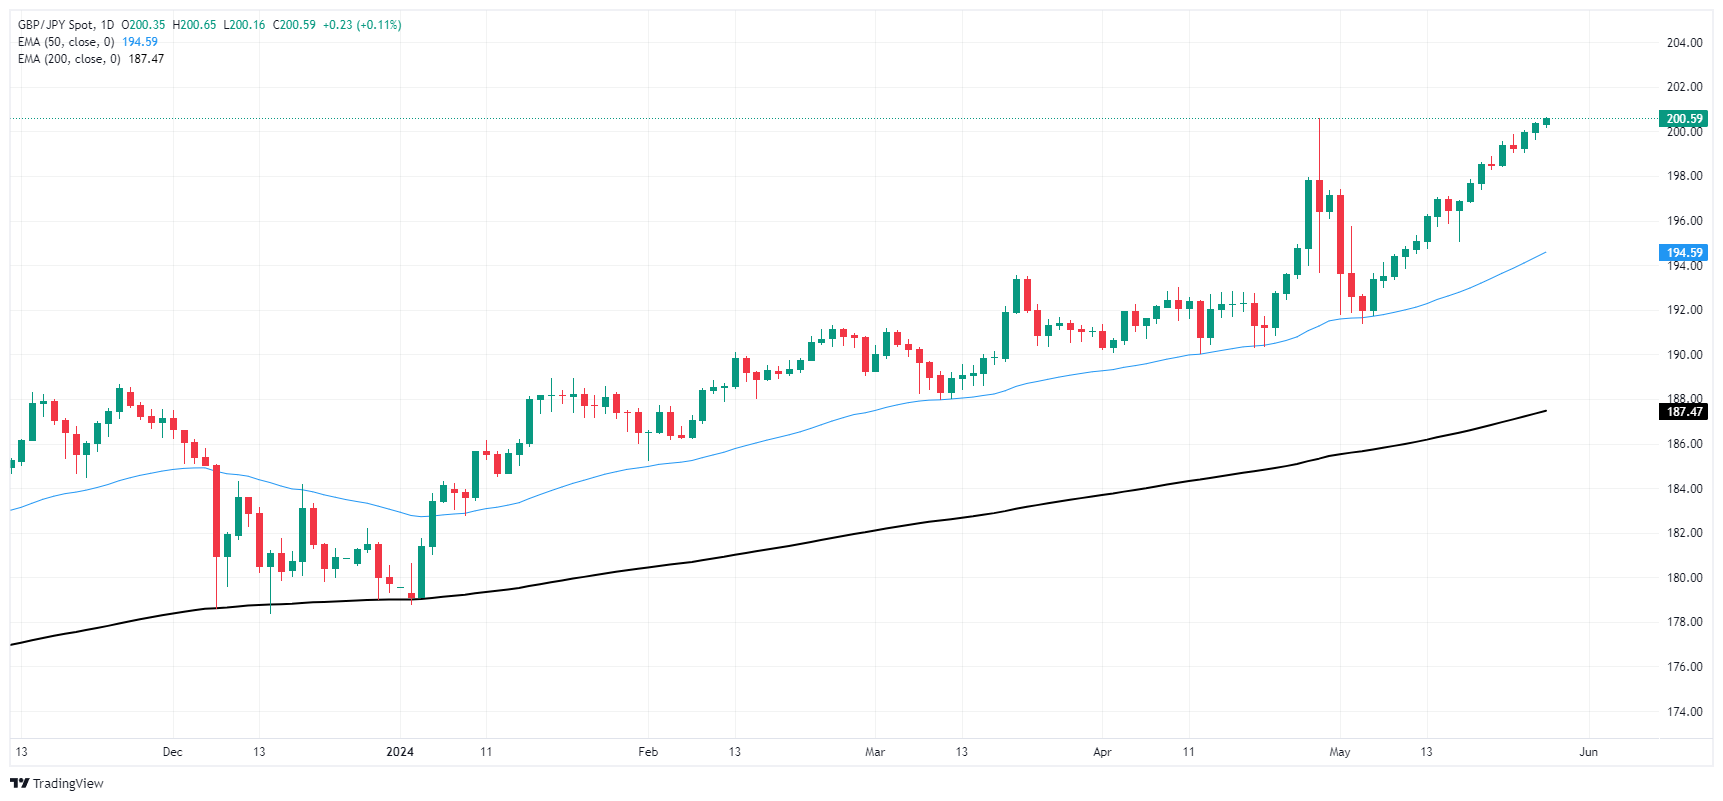
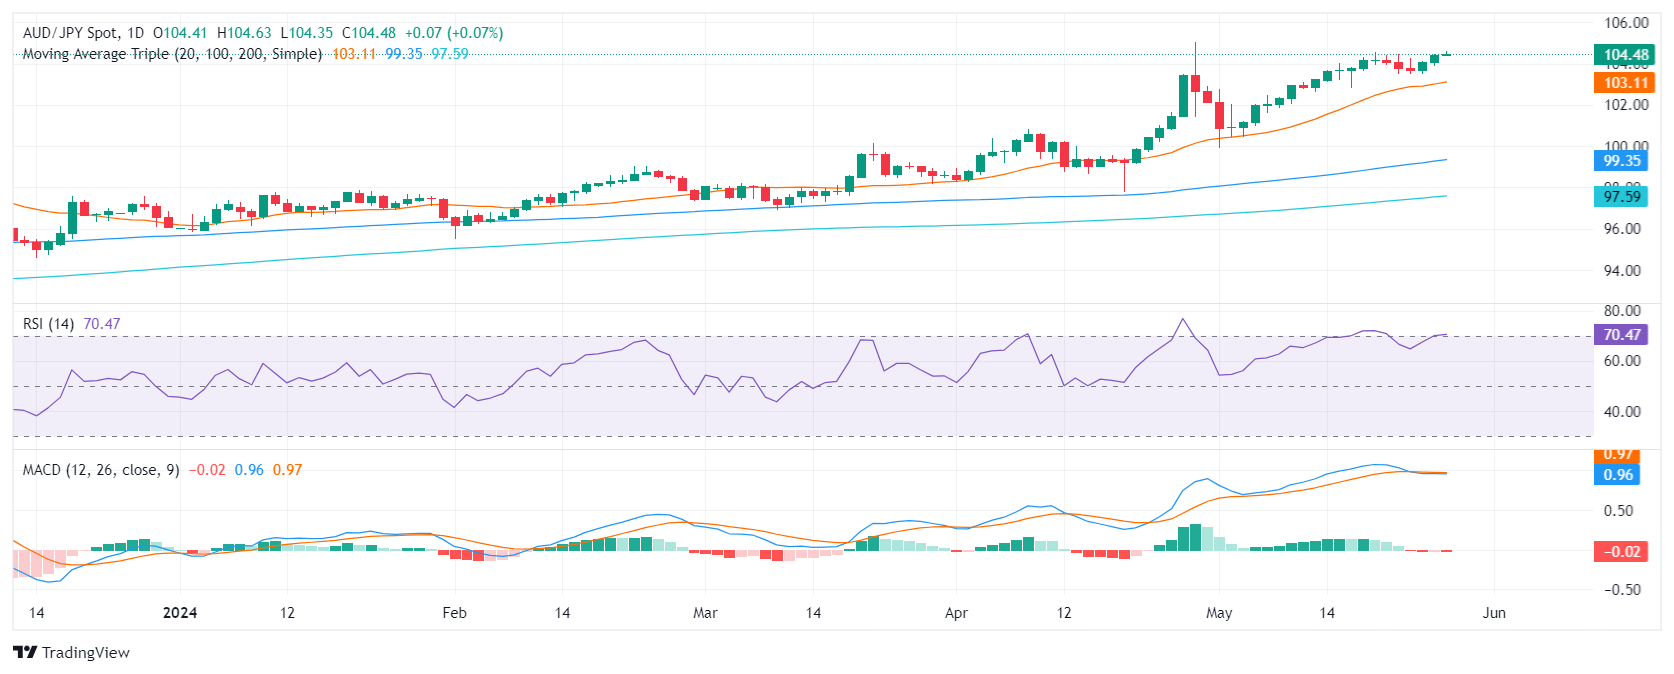
- Daily chart indicators suggest a slowdown in buying traction with RSI positioned above 70 indicating overbought conditions.
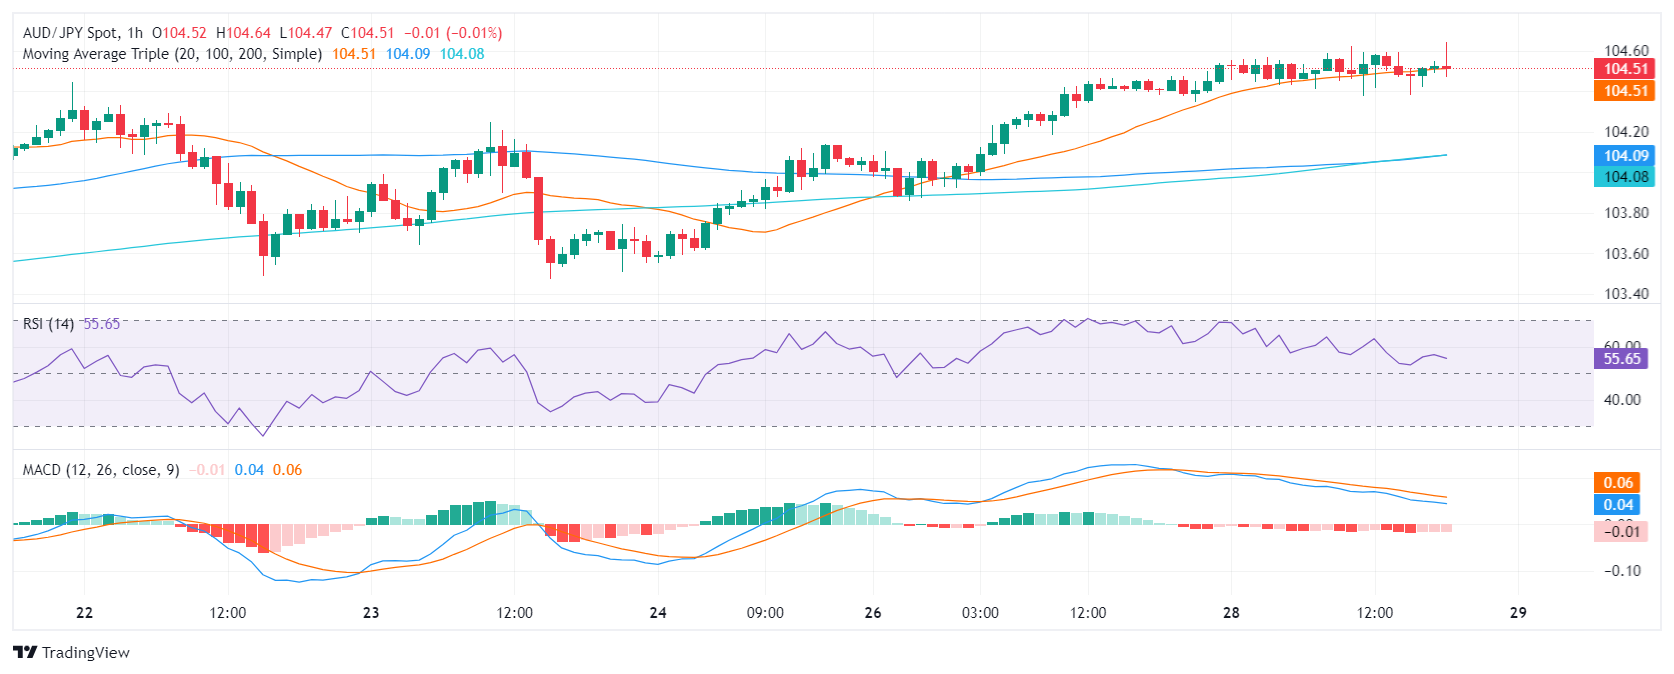
- Hourly chart indicators weaken, implying the possibility of short-term losses in the upcoming Asian session.
- The bulls might not have enough traction to retest the cycle highs above 105.00.
In Tuesday's session, the AUD/JPY pair continued to edge higher, securing some gains but at a seemingly slower pace, stabilizing around the 104.60 mark. Given the extended upward phase with 15 gains out of the last 19 sessions, buyers may be showing signs of fatigue. The market could be heading towards a short-term correction as indicators flash overbought signals.
On the daily chart, the RSI has inched above the 70 territory, an area typically considered overbought. This situation, along with the MACD producing red bars, suggests that while buyers still hold control, their grip is loosening.
AUD/JPY daily chart
The hourly chart portrays similar sentiments. The RSI is nearing 50 and displays a downward bias. Concurrently, the MACD prints rising red bars, hinting at a weakening bullish momentum in the near term.
AUD/JPY hourly chart
Zooming out for the big picture, the AUD/JPY continues to trade above all three key Simple Moving Average (SMA) benchmarks of 20, 100, and 200 days, affirming a bullish perspective. However, with the pair stabilizing around multi-year highs, and overt signs of buyer exhaustion, the possibility of a near-term correction is becoming increasingly apparent. The main resistance is the cycle high just above 105.00 while the 20-day SMA at 103.12 offers itself as a strong support.
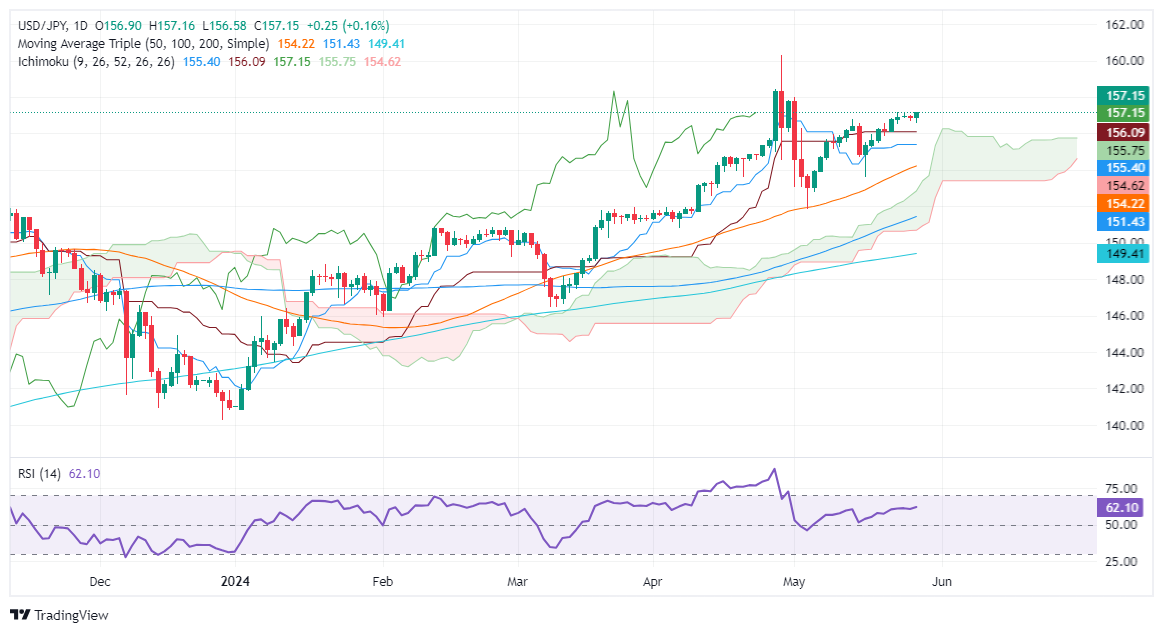
- USD/JPY touches two-week high at 157.15, reflecting continued upward momentum.
- Technical analysis shows prices well above Ichimoku Cloud, indicating strong bullish signals.
- Potential interventions by Japanese authorities create caution among traders eyeing higher positions.
The USD/JPY wavers around 157.00 as the Greenback remains steady in Tuesday’s session. The rise in the US 10-year Treasury bond yields underpins the major, which trades at 157.14 after hitting a two-week high of 157.15.
USD/JPY Price Analysis: Technical outlook
From a technical perspective, the USD/JPY is upward biased, as evidenced by successive series of higher highs and lows and price action standing above the Ichimoku Cloud (Kumo). Additionally, the spot price is also above the Tenkan and Kijun-Sen, a further indication of bulls’ strength. Yet intervention threats by Japanese authorities kept buyers at bay instead of committing to open fresh long positions.
As the USD/JPY cleared the 157.00 figure, further gains are foreseen. The first resistance level would be the April 26 high at 158.44, followed by the year-to-date (YTD) high at 160.32.
Conversely, if it stumbles below 157.00, look for a pullback below the confluence of the Tenkan-Sen at 156.05, which will sponsor a leg down. The next key support levels emerge at the Senkou Span A at 155.72, followed by the Kijun-Sen at 155.39, ahead of the 50-day moving average (DMA) at 154.08.
USD/JPY Price Analysis: Technical outlook
- AUD/NZD cleared daily losses, reaching 1.0852 during Tuesday's session despite soft Australian data.
- Following weak Australian data, the markets anticipate dovish moves from the RBA which may weigh on the Aussie.
- Investors await New Zealand's May ANZ business survey, which could impact the expectations on the next RBNZ policies.
The AUD/NZD is currently trading with slight gains, as market participants digest recent figures from Australia and look forward to ANZ data from New Zealand.
In Australia, Retail sales for April came in slightly under expectations at 0.1% MoM, following a 0.4% decline in March. This lackluster performance could influence the Reserve Bank of Australia's (RBA) policies and might prompt it to take a more dovish approach, taking off the table a rate hike after its New Zealander peer, the Reserve Bank of New Zealand (RBNZ) revived that discussion recently.
On the Kiwis, the anticipation in New Zealand is centered on the ANZ business survey data for May to be released during the upcoming Asian session. Depending on the results, this could sway the betting on the RBNZ's upcoming monetary policy decisions. While officials have hinted at a potential rate cut, market predictions continue to bet on a first cut to occur in Q4.
AUD/NZD technical analysis
On the daily chart, the Relative Strength Index (RSI) maintains its position in negative territory. This is fortified by the red bars of the Moving Average Convergence Divergence (MACD) histogram, confirming a continued downward momentum.
AUD/NZD daily chart
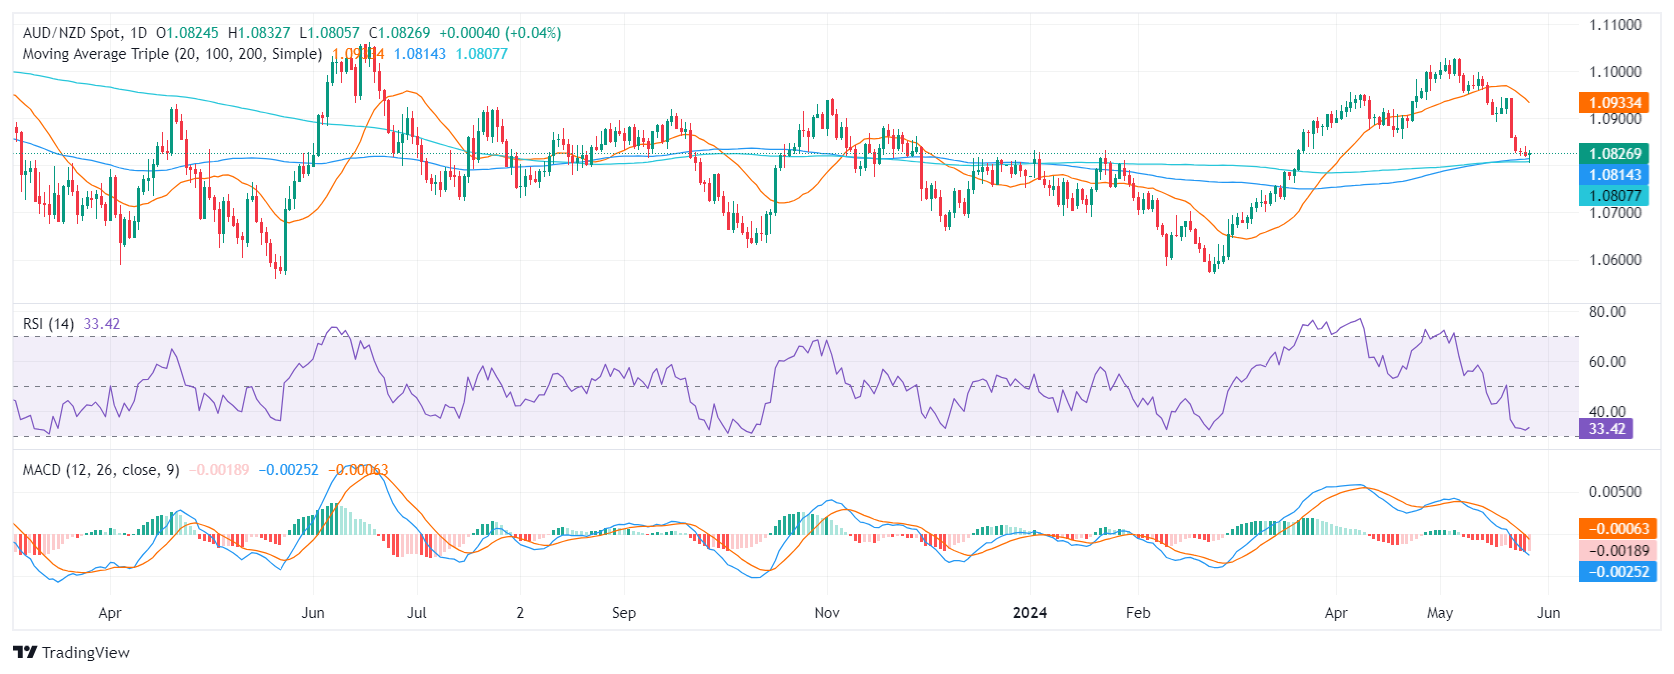
Nevertheless, the pair trades above its 100- and 200-day Simple Moving Averages (SMA), suggesting a medium-to-long uptrend. However, with the AUD/NZD standing below the 20-day SMA, it highlights a dominance for the short-term.
- Crude Oil markets extend rebound, WTI gains over 5% from bottom.
- Barrel traders look to OPEC+ to keep production down.
- US Crude Oil supplies continue to fluster energy markets.
West Texas Intermediate (WTI) US Crude Oil rose on Tuesday as energy markets look to production cuts from the Organization of the Petroleum Exporting Countries (OPEC), and its extended network of non-member partner countries OPEC+, to maintain production cuts in order to try and tamp down global Crude Oil production in the face of disappointing demand.
OPEC begins an online-only meeting on Sunday, June 2, where the Crude Oil alliance is broadly expected to maintain voluntary production caps of 2.2 million bpd that have been in place since the third quarter of 2023. Global Crude Oil demand failed to rebound through 2024 to a degree that energy markets had anticipated, and global production risks running far ahead of how much Crude Oil that global economies can absorb.
US production continues to threaten a widening overhang on demand, and investors will be looking to this week’s Crude Oil supplies and stocks barrel counts from the American Petroleum Institute (API) and the Energy Information Administration (EIA). API and EIA barrel counts both printed higher than expected last week, adding to a supply buildup that has persisted through most of 2024. API Weekly Crude Oil Stocks for the week ended May 24 are slated for late Wednesday, with EIA Crude Oil Stocks Change for the same period expected later Thursday.
Economic Indicator
API Weekly Crude Oil Stock
API’s Weekly Statistical Bulletin (WSB) has reported total U.S. and regional data relating to refinery operations and the production of the four major petroleum products: motor gasoline, kerosene jet fuel, distillate (by sulfur content), and residual fuel oil. These products represent more than 85% of total petroleum industry.
Read more.Next release: Wed May 29, 2024 20:30
Frequency: Weekly
Consensus: -
Previous: 2.48M
Source: American Petroleum Institute
Economic Indicator
EIA Crude Oil Stocks Change
The EIA Crude Oil stockpiles report is a weekly measure of the change in the number of barrels in stock of crude oil and its derivates, and it's released by the Energy Information Administration. This report tends to generate large price volatility, as oil prices impact on worldwide economies, affecting the most, commodity related currencies such as the Canadian dollar. Despite it has a limited impact among currencies, this report tends to affect the price of oil itself, and, therefore, had a more notorious impact on WTI crude futures.
Read more.Next release: Thu May 30, 2024 15:00
Frequency: Weekly
Consensus: -2M
Previous: 1.825M
WTI technical outlook
WTI US Crude Oil climbed over 5% from the last swing low into $76.00 per barrel, cracking $80.00 and climbing over $1.50 per barrel on Tuesday. WTI is testing into last week’s high bids and a near-term consolidation pattern is threatening to harden into the charts.
US Crude Oil is on pace to close in the green for a third straight trading day, and remains down from 2024’s peaks near $87.00. Despite recent downside, WTI remains up in 2024, climbing 12% from the year’s opening bids near $71.50.
WTI hourly chart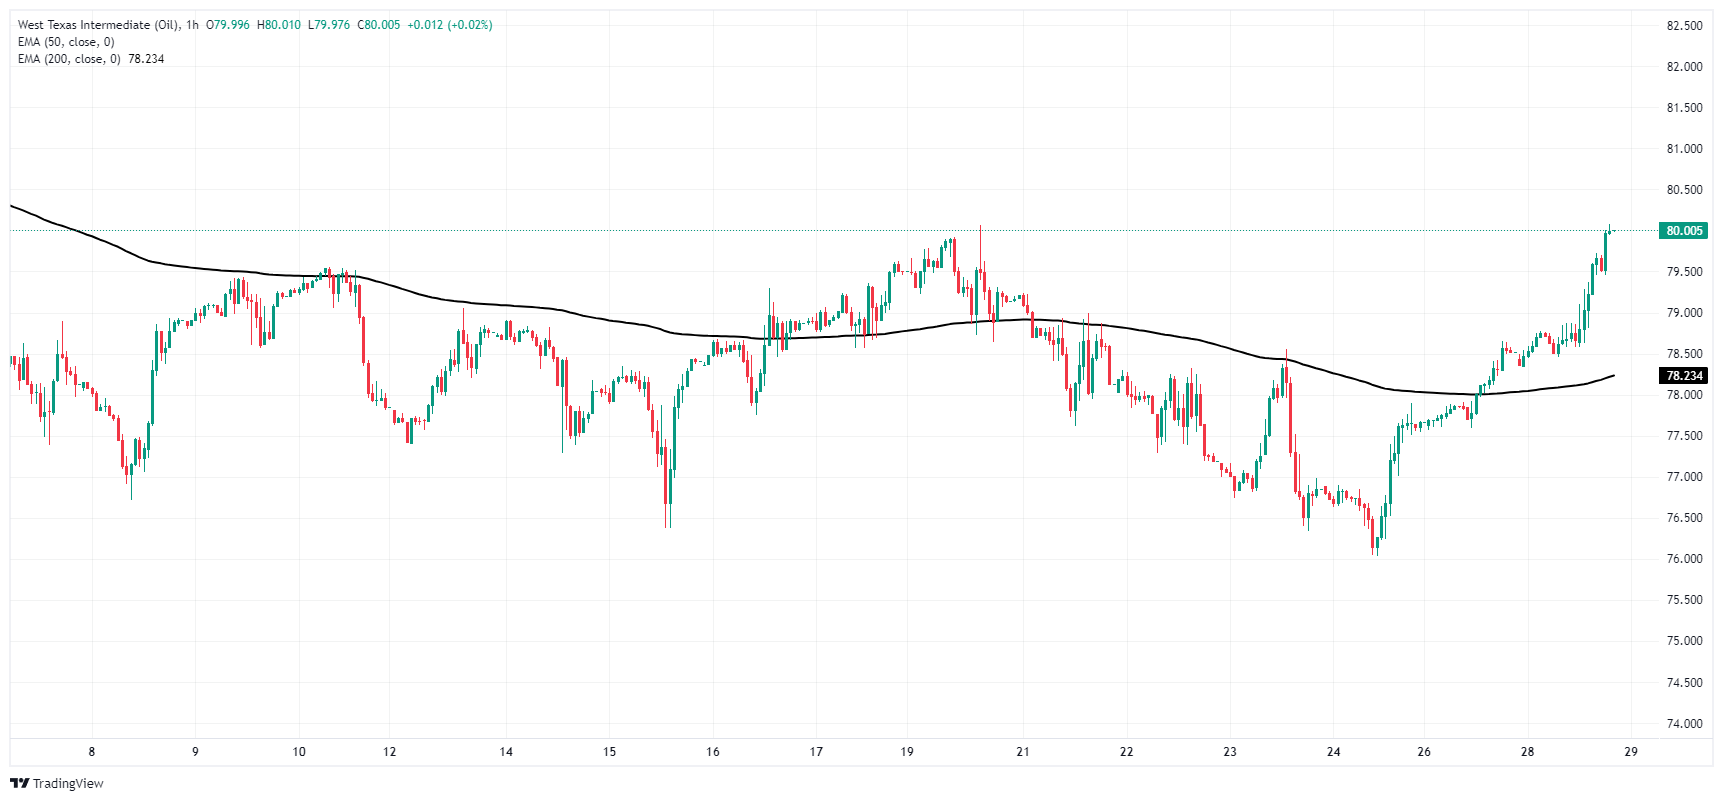
WTI daily chart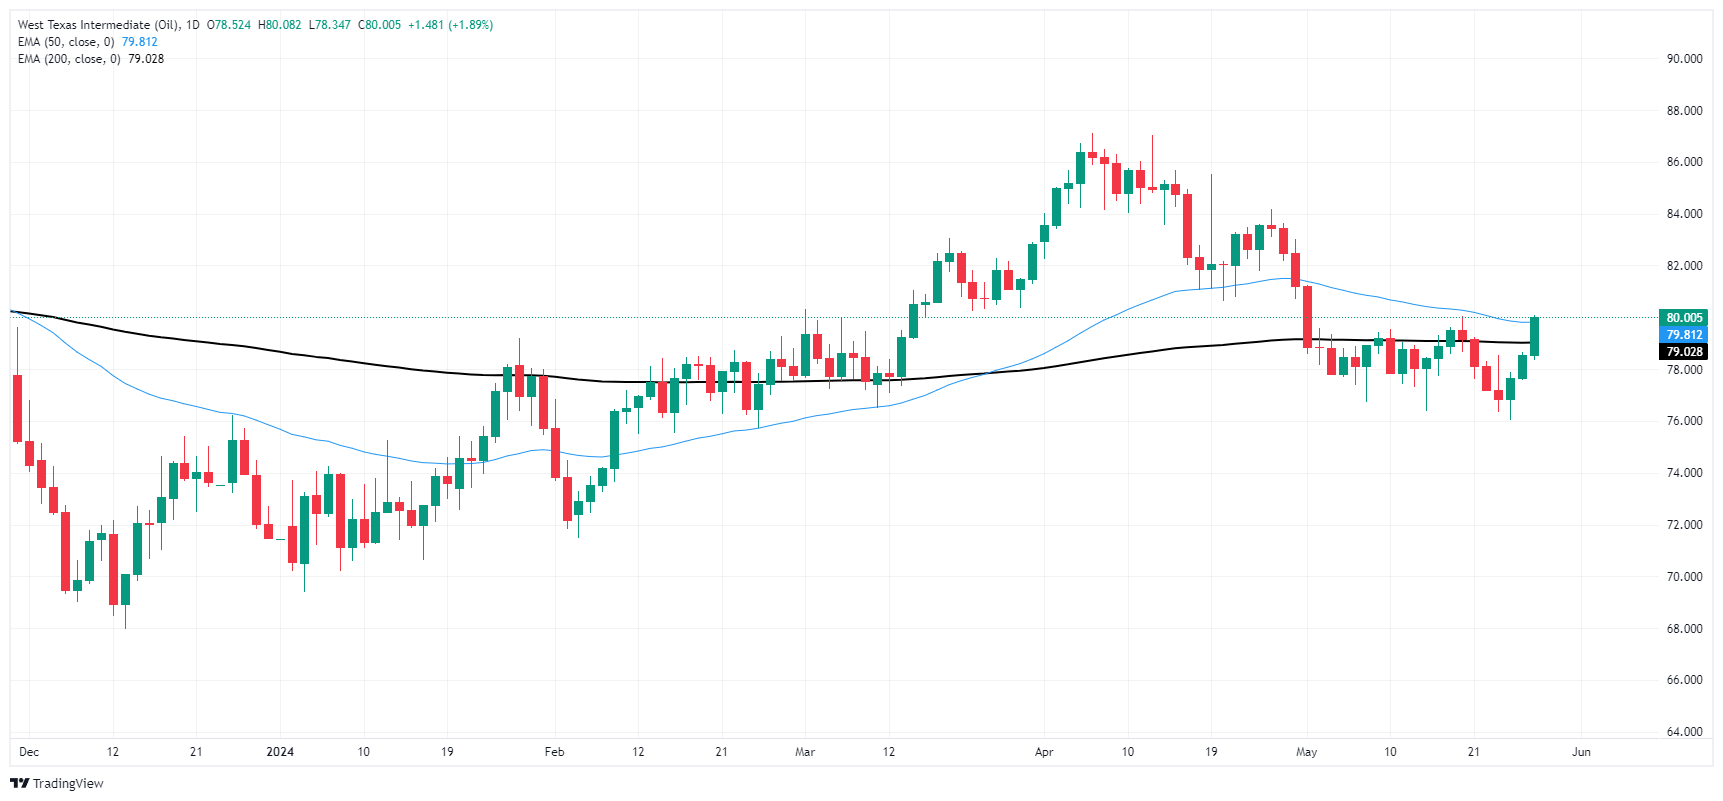
- Gold gains more than 0.30% despite pressure from high US Treasury yields.
- Hawkish remarks from Fed officials, including Governor Michelle Bowman, temper Gold's rise.
- XAU/USD traders are eyeing the release of US core PCE inflation data.
Gold price was modestly up late in the North American session, registering gains of around 0.15% amid high US Treasury bond yields that make it less appealing to hold the non-yielding metal. Consequently, the Greenback erased its previous losses, capping Gold’s rally. The XAU/USD trades at $2,357, above its opening price by 0.28%.
Wall Street trades with losses, while the 10-year Treasury note yield climbs sharply to its highest level since the beginning of May. This spurred a jump in real yields, which usually correlate inversely to Gold prices, putting a lid on the yellow metal’s advance.
Federal Reserve (Fed) officials crossed the wires on Tuesday, delivering a hawkish message. On the data front, the Conference Board (CB) Consumer Confidence improved in May, but recession fears have resurfaced.
Ahead in the week, traders are bracing for the expected release of April’s Personal Consumption Expenditures (PCE) Price Index - the Federal Reserve’s (Fed) preferred measure of inflation. The core figure is expected at 2.8% YoY, while headline PCE is foreseen to increase by 0.3% MoM.
Daily digest market movers: Gold price waxes, wanes around $2,350
- Gold prices stay in the green yet trade off three-day highs reached at $2,364 amid elevated US Treasury yields.
- US 10-year Treasury note yields 4.538%, rising seven basis points and underpinning the Greenback. The US Dollar Index (DXY), which tracks the buck’s performance against a basket of peers, trades at 104.61, up 0.03%.
- Fed Governor Michelle Bowman said she would have supported either waiting to slow the quantitative tightening pace or a more tapered slowing in balance sheet run-off.
- Lastly, Minneapolis Fed President Neel Kashkari stated that he doesn't believe anyone has ruled out further rate increases and added that he anticipates no more than two rate cuts in 2024.
- The US Conference Board Consumer Confidence improved in May after three months of declines, rising to 102.0 from 97.0, exceeding estimates of 95.9.
- Despite improving, Dana Peterson, Chief Economist at The Conference Board, wrote, “a possible resurgence in recession concerns.”
- Americans' perceptions of the likelihood of US recession over the next 12 months rose again in May.
- Fed funds rate futures estimate just 25 basis points of interest rate cuts in 2024, according to data provided by the Chicago Board of Trade (CBOT).
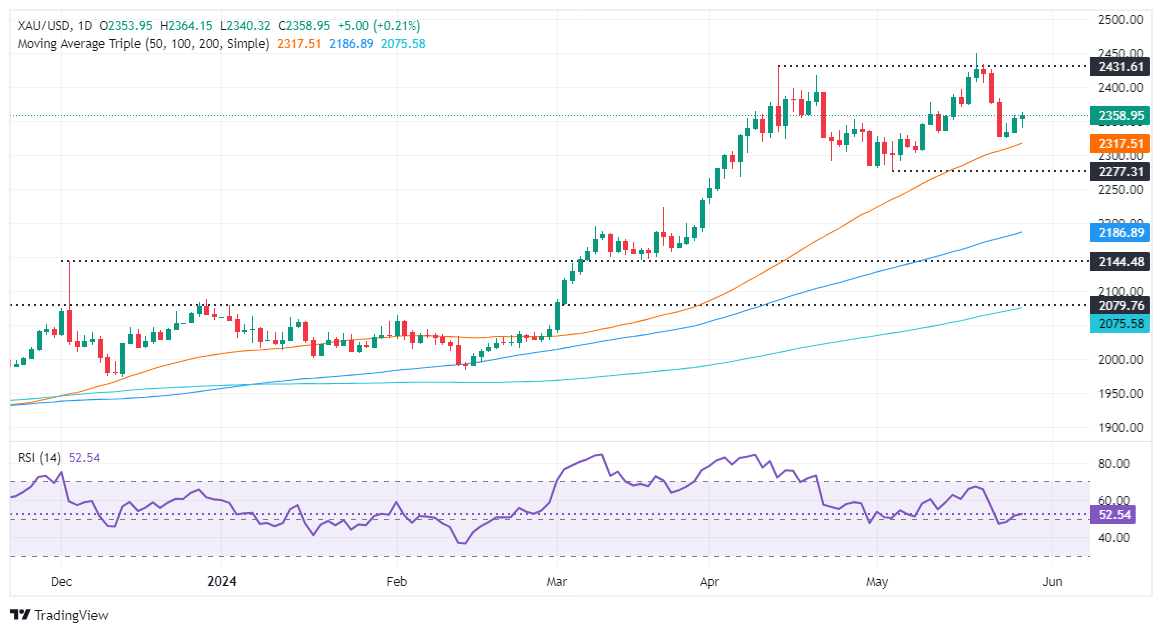
Technical analysis: Gold price stays firm as buyers lose momentum
Gold’s uptrend remains in place, yet the rally is showing signs of exhaustion, with momentum beginning to fade. The Relative Strength Index (RSI) shows that buyers are in charge yet losing momentum as the RSI flattens.
Therefore, if XAU/USD fails to cling to gains above $2,350, that would exert downward pressure on the yellow metal, exposing key support levels.
The first support would be the psychological $2,350 figure. Once cleared, the next stop would be the May 8 low of $2,303, followed by the May 3 cycle low of $2,277.
On the other hand, if XAU/USD stays above $2,350, further gains lie overhead. Up next would be the $2,400 mark, followed by the year-to-date high of $2,450 and then the $2,500 mark.
US Dollar PRICE Today
The table below shows the percentage change of US Dollar (USD) against listed major currencies today. US Dollar was the strongest against the Japanese Yen.
| USD | EUR | GBP | JPY | CAD | AUD | NZD | CHF | |
|---|---|---|---|---|---|---|---|---|
| USD | -0.01% | 0.05% | 0.14% | 0.09% | 0.07% | 0.06% | -0.16% | |
| EUR | 0.01% | 0.07% | 0.15% | 0.08% | 0.09% | 0.12% | -0.17% | |
| GBP | -0.05% | -0.07% | 0.08% | 0.01% | 0.04% | 0.05% | -0.24% | |
| JPY | -0.14% | -0.15% | -0.08% | -0.06% | -0.06% | -0.02% | -0.30% | |
| CAD | -0.09% | -0.08% | -0.01% | 0.06% | -0.01% | 0.01% | -0.27% | |
| AUD | -0.07% | -0.09% | -0.04% | 0.06% | 0.01% | 0.03% | -0.28% | |
| NZD | -0.06% | -0.12% | -0.05% | 0.02% | -0.01% | -0.03% | -0.28% | |
| CHF | 0.16% | 0.17% | 0.24% | 0.30% | 0.27% | 0.28% | 0.28% |
The heat map shows percentage changes of major currencies against each other. The base currency is picked from the left column, while the quote currency is picked from the top row. For example, if you pick the US Dollar from the left column and move along the horizontal line to the Japanese Yen, the percentage change displayed in the box will represent USD (base)/JPY (quote).
Gold FAQs
Gold has played a key role in human’s history as it has been widely used as a store of value and medium of exchange. Currently, apart from its shine and usage for jewelry, the precious metal is widely seen as a safe-haven asset, meaning that it is considered a good investment during turbulent times. Gold is also widely seen as a hedge against inflation and against depreciating currencies as it doesn’t rely on any specific issuer or government.
Central banks are the biggest Gold holders. In their aim to support their currencies in turbulent times, central banks tend to diversify their reserves and buy Gold to improve the perceived strength of the economy and the currency. High Gold reserves can be a source of trust for a country’s solvency. Central banks added 1,136 tonnes of Gold worth around $70 billion to their reserves in 2022, according to data from the World Gold Council. This is the highest yearly purchase since records began. Central banks from emerging economies such as China, India and Turkey are quickly increasing their Gold reserves.
Gold has an inverse correlation with the US Dollar and US Treasuries, which are both major reserve and safe-haven assets. When the Dollar depreciates, Gold tends to rise, enabling investors and central banks to diversify their assets in turbulent times. Gold is also inversely correlated with risk assets. A rally in the stock market tends to weaken Gold price, while sell-offs in riskier markets tend to favor the precious metal.
The price can move due to a wide range of factors. Geopolitical instability or fears of a deep recession can quickly make Gold price escalate due to its safe-haven status. As a yield-less asset, Gold tends to rise with lower interest rates, while higher cost of money usually weighs down on the yellow metal. Still, most moves depend on how the US Dollar (USD) behaves as the asset is priced in dollars (XAU/USD). A strong Dollar tends to keep the price of Gold controlled, whereas a weaker Dollar is likely to push Gold prices up.
The Greenback managed to regain some late traction and trimmed most of its daily losses amidst a decent bounce in US yields and diminishing expectations of a rate cut by the Fed in September.
Here is what you need to know on Wednesday, May 29:
The USD Index (DXY) rebounded from multi-day lows near 104.30 on the back of te strong comeback of US yields. On May 29, weekly Mortgage Applications are due seconded by the Fed’s Beige Book. In addition, Fed’s Williams is due to speak.
EUR/USD failed to sustain the early move to the vicinity of the 1.0900 region, eventually succumbing to the Dollar’s bounce. Germany’s Consumer Confidence tracked by GfK is expected on May 29 along with the flash Inflation Rate for the month of May.
GBP/USD retested the 1.2800 level for the first time since mid-March, although that move ran out of steam towards the end of the NA session. There are no data releases scheduled across the Channel on May 29.
The dollar’s late recovery and the decent bounce in US yields across the curve prompted USD/JPY to poke with multi-week tops beyond 157.00. IN Japan, the Consumer Confidence gauge will be released on May 29 seconded by the speech by BoJ Adachi.
AUD/USD ended Tuesday’s session with marginal losses after advancing to four-day highs near 0.6680. On May 29, the Westpac Leading Index is due along with the RBA’s Monthly CPI Indicator.
WTI prices rose further and surpassed the key $80.00 mark per barrel mainly on hopes that the OPEC+ would maintain its crude oil output cuts unchanged at the cartel’s meeting over the weekend.
Prices of Gold edged higher and broke above the $2,360 mark per troy ounce despite the bounce in the dollar and US yields, while prudence remained on the rise prior to the release of US PCE later in the week. Silver gathered extra pace and advanced for the third session in a row, this time surpassing the $32.00 mark per ounce.
- USD/CHF took a dip in Tuesday’s session and fell to 0.9110.
- Despite the Consumer Confidence index in the US and Housing prices exceeding expectations, the USD remains weak.
- The Federal Reserve maintains a cautious stance, asking the market for patience, which keeps the odds for rate cuts in June or July low.
The USD/CHF pair is trading lower, despite optimistic signals from the US economy, specifically in the Housing market, and Consumer Confidence data. On the Swiss front, its economic calendar remained empty at the start of the week.
The US Consumer Confidence index was reported to have risen to 102, outperforming forecasts while the the S&P/Case-Shiller Home Price Indices also beat expectations and rose by 7.4% YoY in March.
In the meantime, investors remain focused on key economic data, specifically, the forthcoming figures from the Personal Consumption Expenditures (PCE) and Q1 GDP revisions, to be released on Thursday and Friday to provide further market direction. The Federal Reserve (Fed) Beige Book report on Wednesday might also be considered by investors to place bets on the timing of the easing cycle.
USD/CHF technical analysis
In the daily analysis, the Relative Strength Index (RSI) stands in positive territory but exhibits a minor decline in the latest session, indicating a minor momentum shift that could favor sellers in the near term. Concurrently, the Moving Average Convergence Divergence (MACD) shows decreasing green bars, indicating a weakening bullish momentum.
USD/CHF daily chart

- Dow Jones gets dragged down by declines in healthcare and biotech.
- Equities rebalancing after US markets return after holiday.
- Investors on the lookout for signs of rate cuts from cautious Fed.
The Dow Jones Industrial Average (DJIA) shed weight on Tuesday after US markets returned to action following an extended holiday weekend. The Dow Jones drew the short straw of the major US indexes, tumbling three-quarters of a percent as investors pull back on healthcare services and biotech stocks listed on the Dow Jones.
All four of the health-related stocks listed on the Dow Jones are down steeply on Tuesday, dragging the major equity index into the red. The Conference Board’s consumer confidence and inflation outlook both accelerated in May, highlighting the difficulties lying ahead for the Federal Reserve (Fed) to deliver rate cuts as fast and as furious as investors continue to hope for. With economic activity continuing to flaunt broad-market forecasts for a downturn that has yet to materialize, and consumer fears of inflation anchoring realized inflation higher, the Fed’s options for trimming interest rates have been hobbled looking forward.
The CB’s Consumer Confidence Index rose to 102 on Tuesday, up from the revised previous of 97.5, and rising above the forecast 96. CB consumer 12-month inflation expectations also rose to 5.4%, with the share of those expecting higher rates rising to 56.2%.
Investors will be looking ahead to Thursday’s US Annualized Q1 Gross Domestic Product (GDP), which is expected to ease to 1.3% versus the previous 1.6%. Friday’s Core US Personal Consumption Expenditure (PCE) inflation is forecast to hold at 0.3% MoM in April.
Dow Jones news
The Dow Jones is sharply lower compared to its peer US indexes, shedding over 300 points as healthcare stocks send the equity board into its lowest since the beginning of the month. Over two-thirds of the DJIA are in the red on Tuesday, with losses being led by three of the four listed health-associated securities.
Merck & Co Inc. (MRK) is down -2.7% at $126.00 per share, closely followed by biotech firm Amgen Inc. (AMGN), which shed -7 points, falling -2.33% and dropping below $300.00 per share for the first time since the start of the month. Johnson & Johnson (JNJ) also fell -1.81% to $144.31 per share.
Dow Jones technical outlook
The Dow Jones Industrial Average fell back below 38,800.00 on Tuesday as the index sheds over 300 points and shows no signs of slowing. The index has tumbled nearly nine-tenths of a percent on the day, and the index is now down 3.5% from record highs just above 40,000.00.
Despite trading deep into bull country above the 200-day Exponential Moving Average (EMA) at 37,220.31, the Dow Jones is poised for further technical downside as the index tumbles through the 50-day EMA at 38,907.10.
Dow Jones five minute chart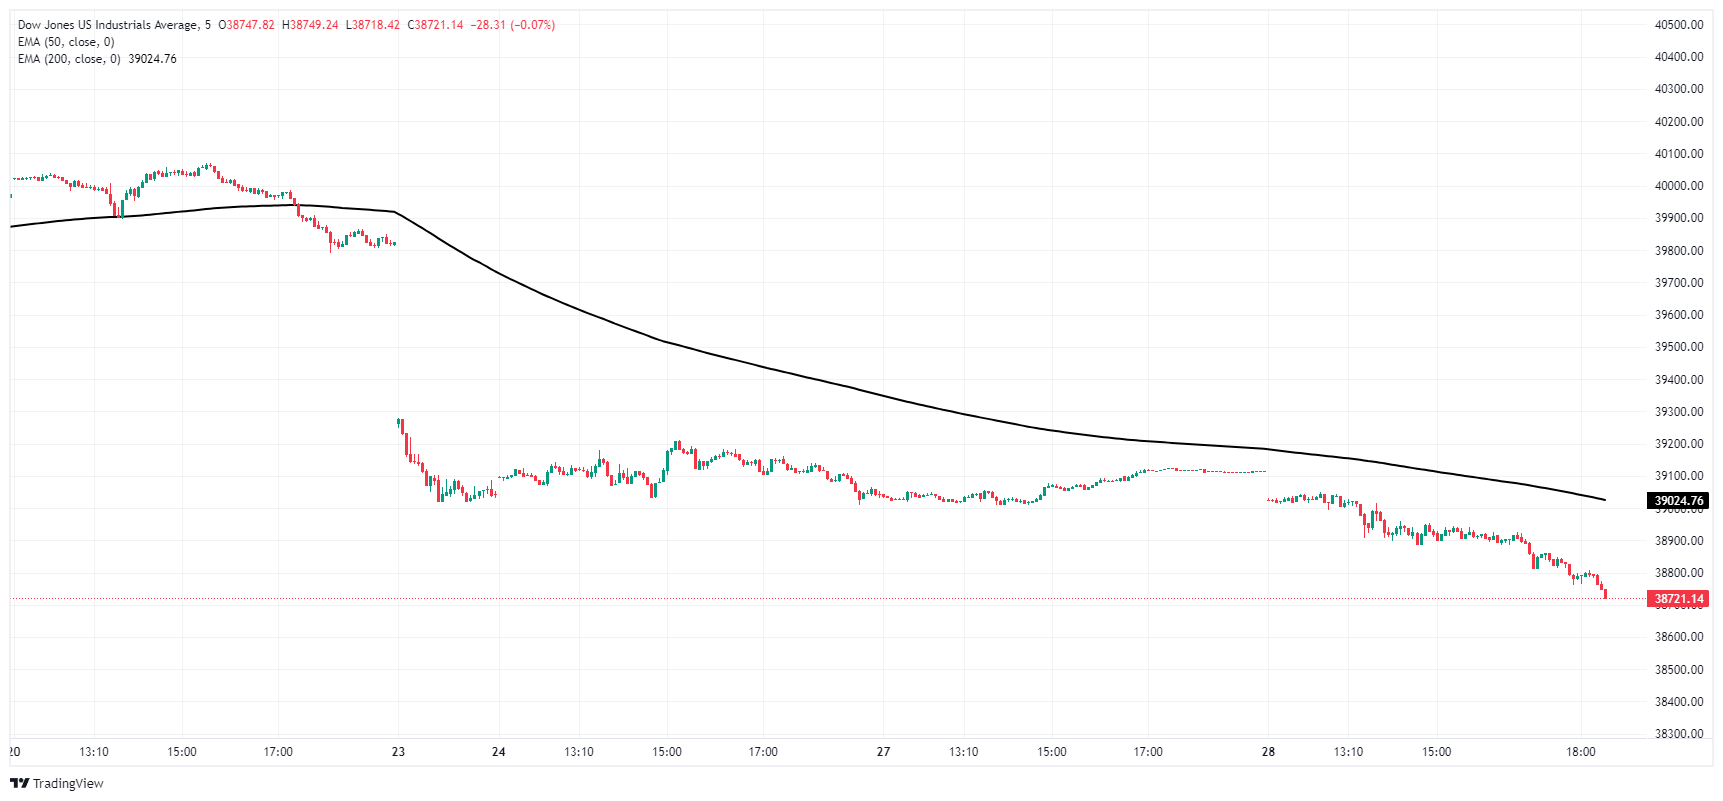
Dow Jones daily chart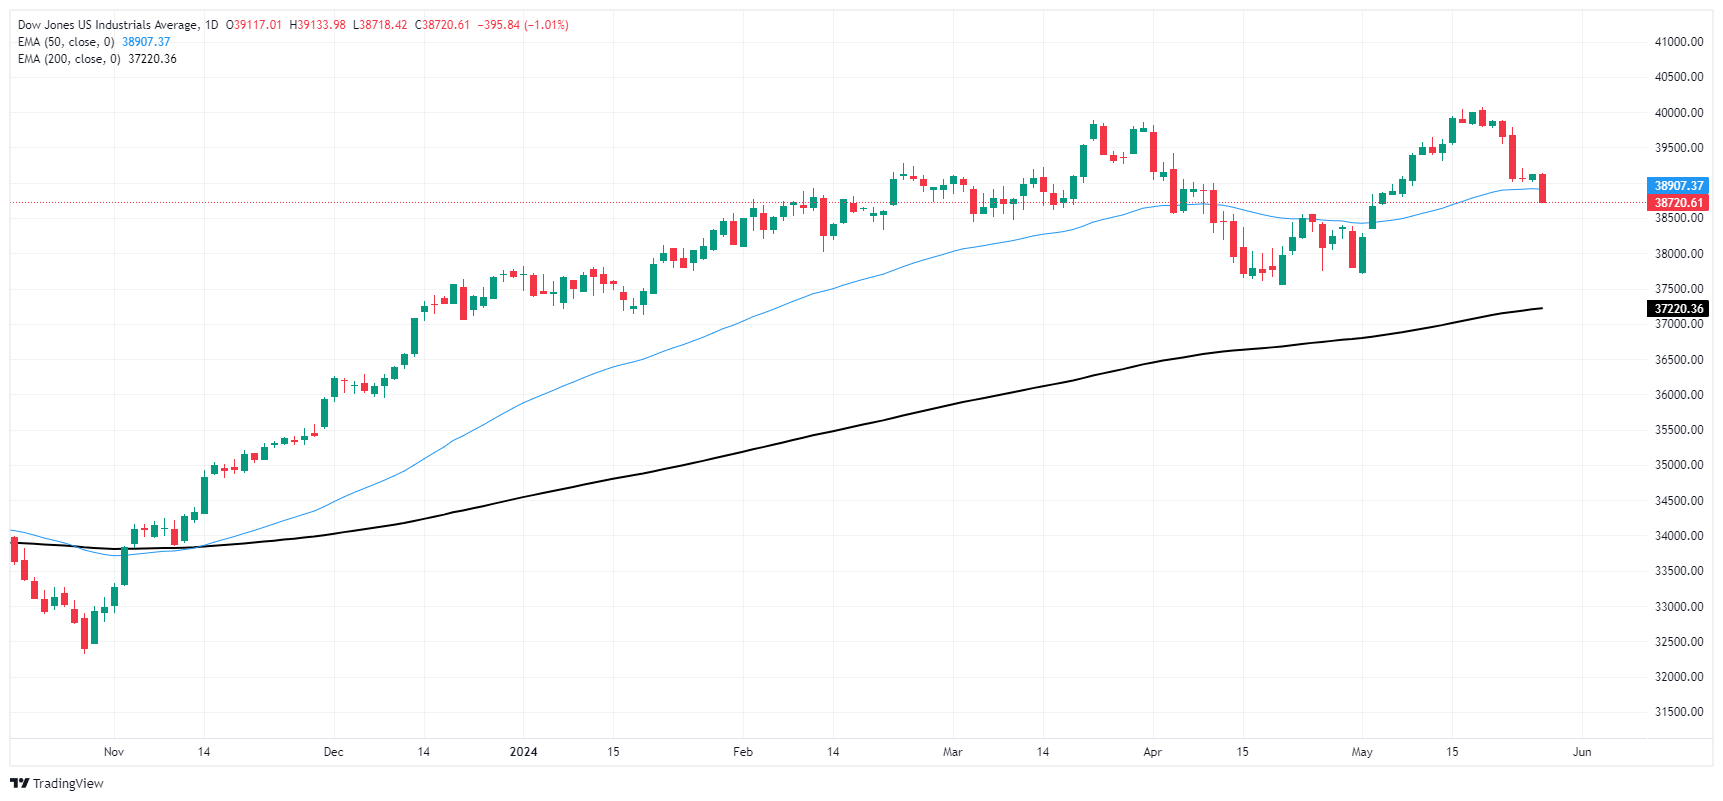
Dow Jones FAQs
The Dow Jones Industrial Average, one of the oldest stock market indices in the world, is compiled of the 30 most traded stocks in the US. The index is price-weighted rather than weighted by capitalization. It is calculated by summing the prices of the constituent stocks and dividing them by a factor, currently 0.152. The index was founded by Charles Dow, who also founded the Wall Street Journal. In later years it has been criticized for not being broadly representative enough because it only tracks 30 conglomerates, unlike broader indices such as the S&P 500.
Many different factors drive the Dow Jones Industrial Average (DJIA). The aggregate performance of the component companies revealed in quarterly company earnings reports is the main one. US and global macroeconomic data also contributes as it impacts on investor sentiment. The level of interest rates, set by the Federal Reserve (Fed), also influences the DJIA as it affects the cost of credit, on which many corporations are heavily reliant. Therefore, inflation can be a major driver as well as other metrics which impact the Fed decisions.
Dow Theory is a method for identifying the primary trend of the stock market developed by Charles Dow. A key step is to compare the direction of the Dow Jones Industrial Average (DJIA) and the Dow Jones Transportation Average (DJTA) and only follow trends where both are moving in the same direction. Volume is a confirmatory criteria. The theory uses elements of peak and trough analysis. Dow’s theory posits three trend phases: accumulation, when smart money starts buying or selling; public participation, when the wider public joins in; and distribution, when the smart money exits.
There are a number of ways to trade the DJIA. One is to use ETFs which allow investors to trade the DJIA as a single security, rather than having to buy shares in all 30 constituent companies. A leading example is the SPDR Dow Jones Industrial Average ETF (DIA). DJIA futures contracts enable traders to speculate on the future value of the index and Options provide the right, but not the obligation, to buy or sell the index at a predetermined price in the future. Mutual funds enable investors to buy a share of a diversified portfolio of DJIA stocks thus providing exposure to the overall index.
- The daily chart flashes overbought signals but the overall trend favors the bulls.
- Post achieving multi-year highs over 96.70, NZD/JPY shows a possibility for a healthy technical correction.
- The pair has a strong support level at 95.00, a crucial point for buyers to defend to contain potential losses.
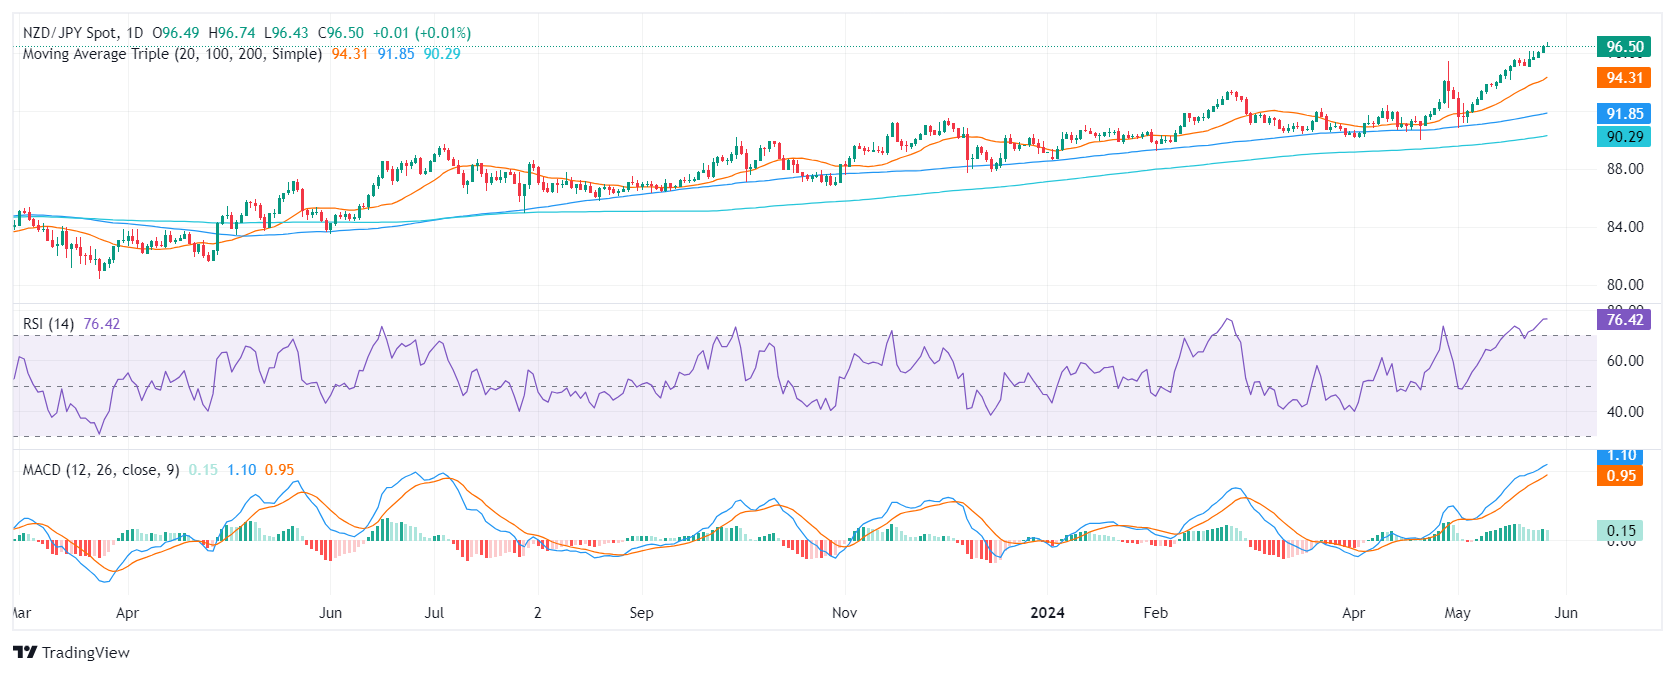
On Tuesday's session, the NZD/JPY pair rose to 96.62 it highest level since July 2007. The outlook has shifted to cautious, with signs of a possible reversal in momentum as indicators flash overbought signals, but the overall bullish outlook remains intact.
Based on the daily chart indicators, the Relative Strength Index (RSI) consistently reflects overbought conditions standing deep in the overbought threshold. This hints at a potential downward price correction. Concurrently, the Moving Average Convergence Divergence (MACD) evidences continued positive momentum with its flat green bars.
NZD/JPY daily chart
Looking at the hourly chart, the RSI demonstrates lower strength compared to the daily view and has already started to edge downwards. In line with that, the MACD histogram suggests negative momentum as revealed by the presence of red bars.
NZD/JPY hourly chart
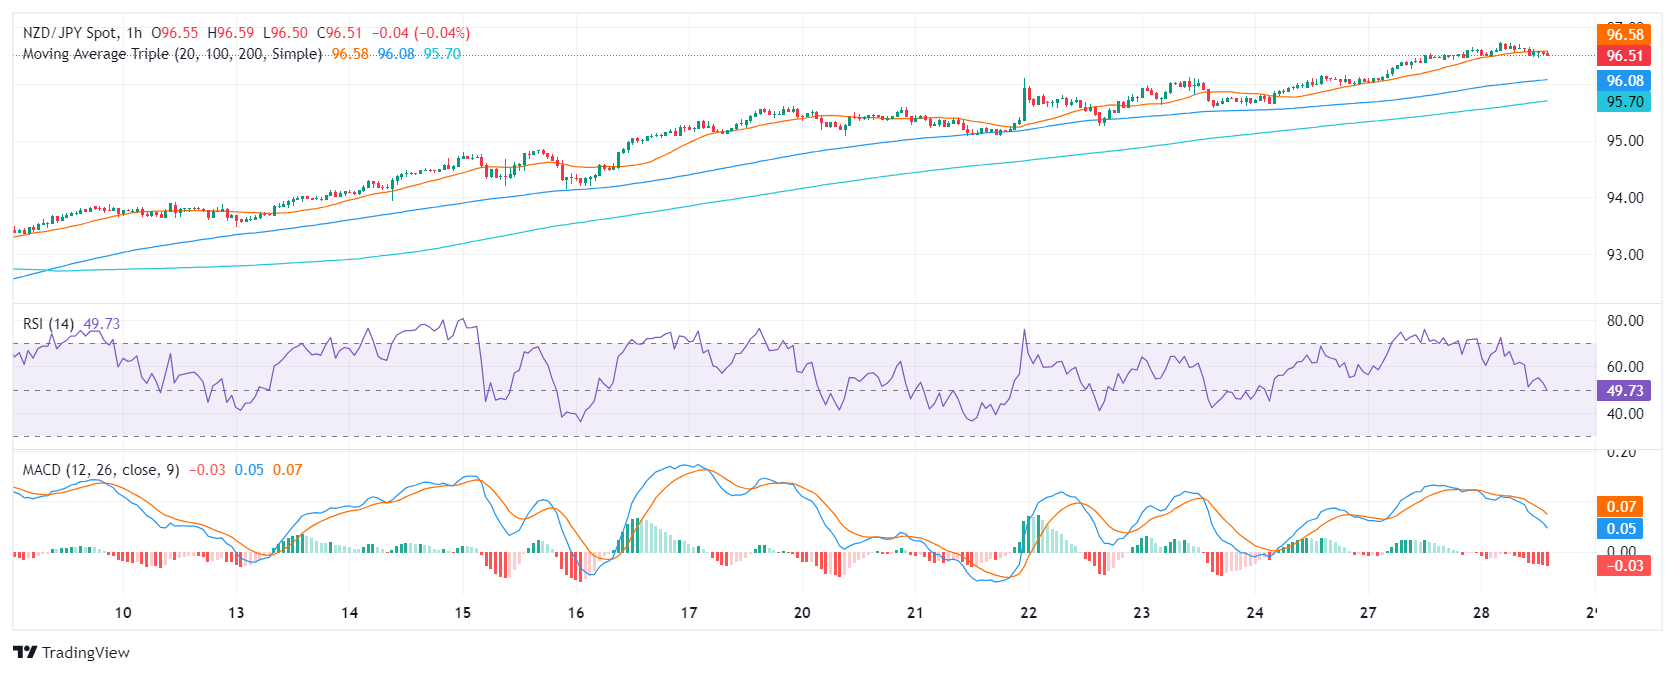
In the broader context, the NZD/JPY presently exhibits a strong uptrend, as displayed by its position above the 20, 100, and 200-day Simple Moving Averages (SMA). This indicates that the currency pair's short-term gains are exceeding both its medium and long-term averages.
As a correction looms, any downward movements that keep the pair above its SMAs could be considered corrective, with the first strong support seen at around 95.00.
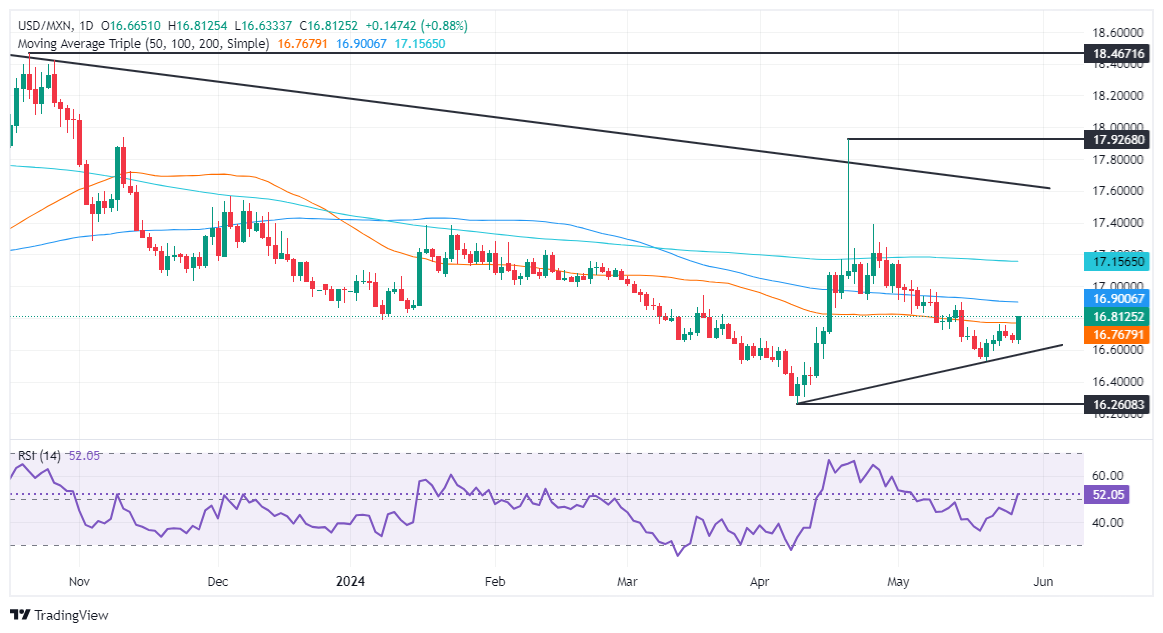
- USD/MXN climbs more than 1%, fueled by strong US economic indicators.
- Minneapolis Fed President Neel Kashkari hints at continued rate hikes, expects only two cuts in 2024.
- Upcoming US PCE data and Mexico's General Elections poised to impact USD/MXN pair.
The Mexican Peso weakened against the US Dollar on Tuesday as the financial markets resumed trading at full strength. A light economic calendar in Mexico keeps traders leaning on the dynamics of the Greenback, which was boosted by hawkish Fedspeak along with renewed optimism from American consumers. The USD/MXN trades at 16.81, gaining 1.05%.
Minneapolis Fed President Neel Kashkari grabbed the headlines during the day by saying that he doesn’t think anyone has taken rate increases off the table, adding that he’s penciling no more than two cuts for 2024. Data-wise, the Conference Board (CB) Consumer Confidence improved in May, yet recession fears reignited.
Dana M. Peterson, Chief Economist at The Conference Board, noted, “The survey also revealed a possible resurgence in recession concerns. The Perceived Likelihood of a US Recession over the Next 12 Months rose again in May, with more consumers believing the recession is ‘somewhat likely’ or ‘very likely.’”
Despite that, the US Dollar was boosted by the jump in US Treasury bond yields, with the 10-year note yield rising five-and-a-half basis points to 4.522%, while the US Dollar Index (DXY) remained unchanged at 104.50.
Meanwhile, traders brace for the release of April’s Personal Consumption Expenditures Price Index (PCE), the Federal Reserve’s (Fed) preferred inflation gauge. That, along with Mexico’s General Elections on Sunday, could dictate the USD/MXN path toward the second half of the year as the Mexican currency remains one of the strongest against the US Dollar.
Daily digest market movers: Mexican Peso retreats on Fedspeak; high US yields
- Last week’s data showed that Mexico’s economic outlook is turning uncertain as the mid-month headline inflation for May rose while underlying prices dipped.
- Mexico’s economic slowdown, as shown by the last Gross Domestic Product (GDP) report and a widening trade deficit, could exert pressure on Mexican Peso.
- May’s Citibanamex poll showed that most economists estimate Banxico will cut rates on June 27 from 11% to 10.75%. The median expects headline inflation at 4.21% and core at 4.07% in 2024.
- Mexico’s schedule will feature the Unemployment Rate, the Fiscal Balance, Foreign Exchange Reserves, and General Elections on June 2.
- US Conference Board Consumer Confidence improved in May after three months of declines. It came at 102.0, up from 97.0, and exceeded estimates of 95.9.
- In the week ahead, the US economic docket will feature the second estimate of Gross Domestic Product (GDP) for Q1 2024, unemployment claims for the last week and the release of core PCE.
- Despite that, fed funds rate futures estimated just 25 basis points of easing toward the end of the year after S&P Global revealed that US business activity is gathering steam.
Technical analysis: Mexican Peso falls as USD/MXN climbs above 16.75
The USD/MXN downtrend remains intact, yet buyers are gathering steam, as the pair tests the 100-day Simple Moving Average (SMA) at 16.76. Momentum shows that bulls are gaining traction, as the Relative Strength Index (RSI) is about to pierce above the 50-midline to turn bullish.
Buyers decisively surpassing the 100-day SMA at 16.70 could open the door for further gains. The next resistance would be the 50-day SMA at 16.89, the psychological figure at 17.00, and the 200-day SMA at 17.14.
On the other hand, a bearish continuation would happen if sellers keep the exchange rate below the 100-day SMA, which could pave the way for a dip to the 2023 low of 16.62, followed by the May 21 cycle low at 16.52 and the year-to-date low of 16.25.
Mexican Peso FAQs
The Mexican Peso (MXN) is the most traded currency among its Latin American peers. Its value is broadly determined by the performance of the Mexican economy, the country’s central bank’s policy, the amount of foreign investment in the country and even the levels of remittances sent by Mexicans who live abroad, particularly in the United States. Geopolitical trends can also move MXN: for example, the process of nearshoring – or the decision by some firms to relocate manufacturing capacity and supply chains closer to their home countries – is also seen as a catalyst for the Mexican currency as the country is considered a key manufacturing hub in the American continent. Another catalyst for MXN is Oil prices as Mexico is a key exporter of the commodity.
The main objective of Mexico’s central bank, also known as Banxico, is to maintain inflation at low and stable levels (at or close to its target of 3%, the midpoint in a tolerance band of between 2% and 4%). To this end, the bank sets an appropriate level of interest rates. When inflation is too high, Banxico will attempt to tame it by raising interest rates, making it more expensive for households and businesses to borrow money, thus cooling demand and the overall economy. Higher interest rates are generally positive for the Mexican Peso (MXN) as they lead to higher yields, making the country a more attractive place for investors. On the contrary, lower interest rates tend to weaken MXN.
Macroeconomic data releases are key to assess the state of the economy and can have an impact on the Mexican Peso (MXN) valuation. A strong Mexican economy, based on high economic growth, low unemployment and high confidence is good for MXN. Not only does it attract more foreign investment but it may encourage the Bank of Mexico (Banxico) to increase interest rates, particularly if this strength comes together with elevated inflation. However, if economic data is weak, MXN is likely to depreciate.
As an emerging-market currency, the Mexican Peso (MXN) tends to strive during risk-on periods, or when investors perceive that broader market risks are low and thus are eager to engage with investments that carry a higher risk. Conversely, MXN tends to weaken at times of market turbulence or economic uncertainty as investors tend to sell higher-risk assets and flee to the more-stable safe havens.
- US markets return after long weekend, Fedspeak to dominate.
- Canadian Dollar recedes as investors shrug off low-tier CAD data.
- Canada saw an uptick in industrial and raw materials inflation in April.
The Canadian Dollar (CAD) is broadly softer on Tuesday, paring away some of the gains found at the start of the trading week. Fedspeak is set to dominate the headlines as investors buckle down for the long wait to US Gross Domestic Product (GDP) and Personal Consumption Expenditure (PCE) inflation due on Thursday and Friday, respectively.
Canada reported an uptick in industrial inflation in April to little market reaction as investors focus on statements from Federal Reserve (Fed) officials. Broad market sentiment took a hit last week after markets were forced to re-price odds of a September rate cut, and traders are looking for firmer signs of rate cut plans from Fed central planners.
Daily digest market movers: Canadian producer-level inflation ticks higher once again
- Canadian Industrial Product Prices rose 1.5% MoM in April, reversing the forecasted decline to 0.6% from the previous 0.9%.
- Canadian Raw Material Price Index also accelerated in April, rising 5.5% against the previous month’s 4.3% (revised down from 4.7%). Median market forecasts had expected a print of 3.2%.
- Comments from Fed officials continue to dominate the market as investors continue to hope for signs of interest rate cuts despite a firmly cautious lean from policymakers.
- Canadian Current Account slated for Thursday to be overshadowed by US Q1 GDP, while market reactions to Canadian Q1 GDP on Friday will be entirely engulfed by US PCE Price Index inflation.
- Markets are expecting a downturn in US GDP, while US PCE inflation is forecast to hold in-line with previous figures, but rate cut hopes could be tainting the picture.
Canadian Dollar PRICE Today
The table below shows the percentage change of Canadian Dollar (CAD) against listed major currencies today. Canadian Dollar was the strongest against the Japanese Yen.
| USD | EUR | GBP | JPY | CAD | AUD | NZD | CHF | |
|---|---|---|---|---|---|---|---|---|
| USD | -0.14% | -0.05% | 0.05% | 0.01% | -0.10% | -0.09% | -0.31% | |
| EUR | 0.14% | 0.09% | 0.17% | 0.13% | 0.04% | 0.09% | -0.15% | |
| GBP | 0.05% | -0.09% | 0.10% | 0.03% | -0.04% | -0.00% | -0.25% | |
| JPY | -0.05% | -0.17% | -0.10% | -0.03% | -0.13% | -0.08% | -0.31% | |
| CAD | -0.01% | -0.13% | -0.03% | 0.03% | -0.11% | -0.06% | -0.31% | |
| AUD | 0.10% | -0.04% | 0.04% | 0.13% | 0.11% | 0.05% | -0.22% | |
| NZD | 0.09% | -0.09% | 0.00% | 0.08% | 0.06% | -0.05% | -0.25% | |
| CHF | 0.31% | 0.15% | 0.25% | 0.31% | 0.31% | 0.22% | 0.25% |
The heat map shows percentage changes of major currencies against each other. The base currency is picked from the left column, while the quote currency is picked from the top row. For example, if you pick the Canadian Dollar from the left column and move along the horizontal line to the US Dollar, the percentage change displayed in the box will represent CAD (base)/USD (quote).
Technical analysis: Canadian Dollar hits a wall, stumbles back
The Canadian Dollar (CAD) is broadly softer on Tuesday, shedding weight across the board and holding flat against the battered Japanese Yen (JPY) as the day’s strongest pair performance from the CAD. Despite broad-spectrum weakness from the Canadian Dollar, pullbacks remain limited, with the CAD trading within a fifth of a percent against nearly all of its major peers.
USD/CAD rebounded to test 1.3650 after arresting a decline below 1.3620, and the 1.3600 handle is firming into a technical barrier rather than a target for short pressure. The pair is still down 0.8% from last week’s peak just above 1.3740, and daily candlesticks are mired in technical congestion near the 50-day Exponential Moving Average (EMA) at 1.3642.
USD/CAD hourly chart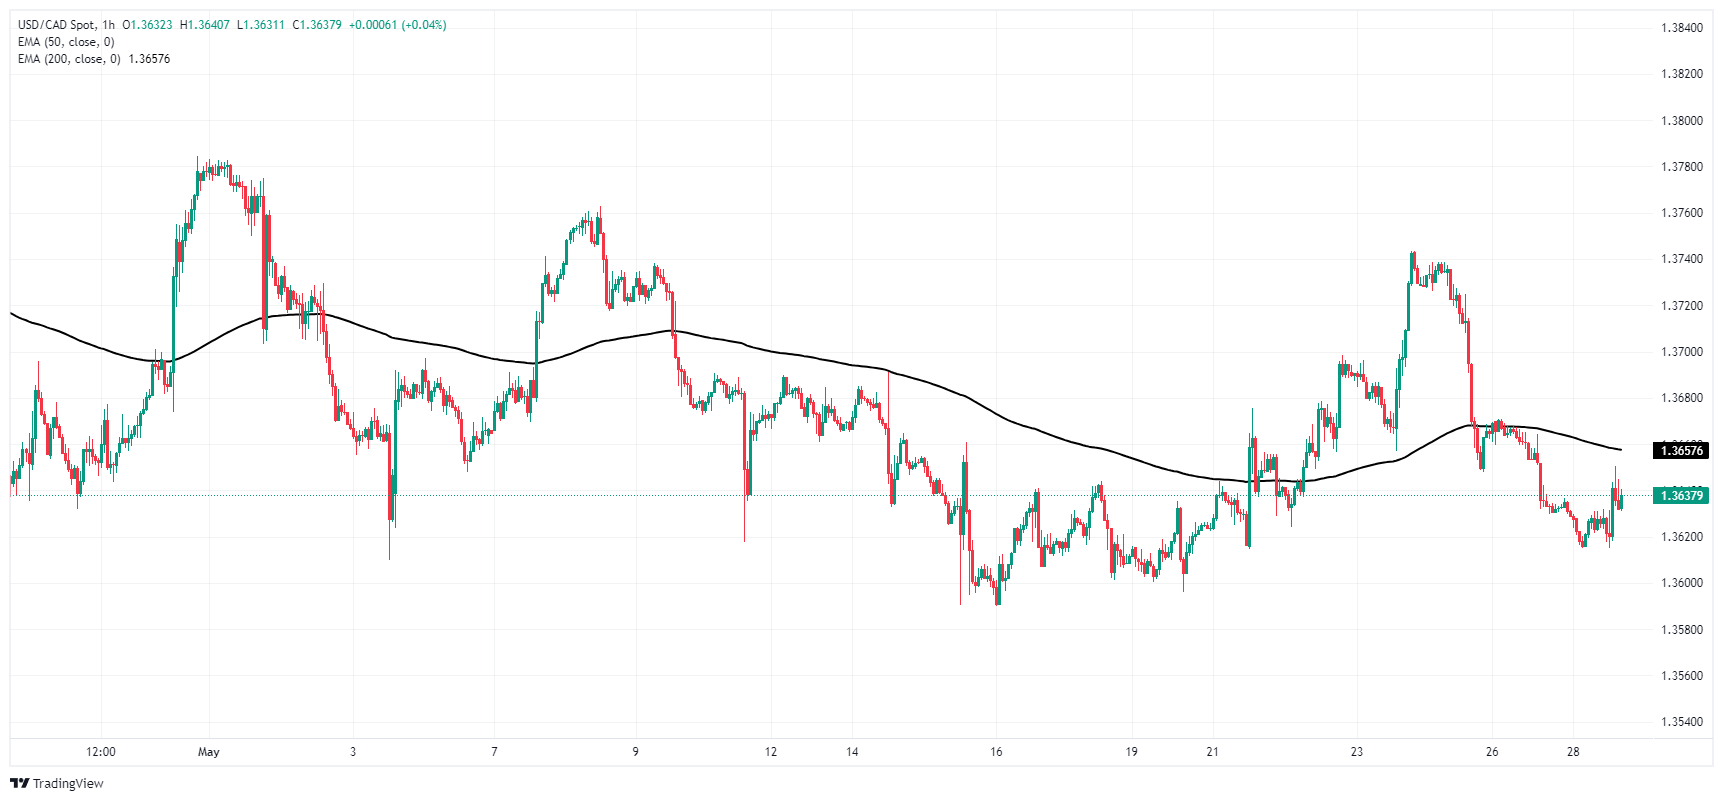
USD/CAD daily chart
Canadian Dollar FAQs
The key factors driving the Canadian Dollar (CAD) are the level of interest rates set by the Bank of Canada (BoC), the price of Oil, Canada’s largest export, the health of its economy, inflation and the Trade Balance, which is the difference between the value of Canada’s exports versus its imports. Other factors include market sentiment – whether investors are taking on more risky assets (risk-on) or seeking safe-havens (risk-off) – with risk-on being CAD-positive. As its largest trading partner, the health of the US economy is also a key factor influencing the Canadian Dollar.
The Bank of Canada (BoC) has a significant influence on the Canadian Dollar by setting the level of interest rates that banks can lend to one another. This influences the level of interest rates for everyone. The main goal of the BoC is to maintain inflation at 1-3% by adjusting interest rates up or down. Relatively higher interest rates tend to be positive for the CAD. The Bank of Canada can also use quantitative easing and tightening to influence credit conditions, with the former CAD-negative and the latter CAD-positive.
The price of Oil is a key factor impacting the value of the Canadian Dollar. Petroleum is Canada’s biggest export, so Oil price tends to have an immediate impact on the CAD value. Generally, if Oil price rises CAD also goes up, as aggregate demand for the currency increases. The opposite is the case if the price of Oil falls. Higher Oil prices also tend to result in a greater likelihood of a positive Trade Balance, which is also supportive of the CAD.
While inflation had always traditionally been thought of as a negative factor for a currency since it lowers the value of money, the opposite has actually been the case in modern times with the relaxation of cross-border capital controls. Higher inflation tends to lead central banks to put up interest rates which attracts more capital inflows from global investors seeking a lucrative place to keep their money. This increases demand for the local currency, which in Canada’s case is the Canadian Dollar.
Macroeconomic data releases gauge the health of the economy and can have an impact on the Canadian Dollar. Indicators such as GDP, Manufacturing and Services PMIs, employment, and consumer sentiment surveys can all influence the direction of the CAD. A strong economy is good for the Canadian Dollar. Not only does it attract more foreign investment but it may encourage the Bank of Canada to put up interest rates, leading to a stronger currency. If economic data is weak, however, the CAD is likely to fall.
- Strong Consumer Confidence and Housing sector data didn’t trigger movements in the USD.
- Next highlight will be Wednesday’s Fed's Beige Book report where markets will get a clearer outlook on the US economy’s health.
- PCE and GDP revisions are the week’s highlights.
The US Dollar Index (DXY) is slowly declining as US markets prepare for the release of economic data this week. On Tuesday, the US reported strong Confidence and Housing sector data, but the USD remains soft ahead of high-tier data to be released during the week.
Despite some mild losses and the markets continuing to give up hopes for an interest rate cut in June or July, the resilient US economy allows the Fed to maintain its cautious stance, which cushions the US Dollar. Thursday's Gross Domestic Product (GDP) and Personal Consumption Expenditures (PCE) will set the pace for bets on upcoming Federal Reserve (Fed) decisions. The current odds predict a first cut in September.
Daily digest market movers: DXY experiences mild losses despite strong low-tier data, focus on Fed's cautious stance
- The Conference Board's Consumer Confidence has come out stronger than expected at 102, versus the anticipated 96.
- Furthermore, the S&P/Case-Shiller Home Price Indices beat expectations with 7.4 YoY print in March.
- April’s Personal Consumption Expenditure (PCE), the Fed’s preferred gauge of inflation, is seen remaining at 2.7% YoY for headline inflation and 2.8% for core. The Q1 GDP is expected to be revised higher.
- Outcome of this data will continue to shape expectations on the easing cycle, dictating the pace of the USD.
DXY technical analysis: Greenback witnesses sustained selling pressure and bear command
The daily chart indicators continue to show mounting steady bearish momentum in the DXY. The Relative Strength Index (RSI) maintains a negative slope and remains in a selling zone, indicating prevailing selling pressure. This is even more evident with the red bars of the Moving Average Convergence Divergence (MACD) indicator that showcase bearish momentum.
In terms of Simple Moving Averages (SMAs), despite the DXY operating below the 20-day SMA and displaying bears’ short-term efficiency, it continues to remain above the 100 and 200-day SMAs, suggesting bulls have relative strength over a more extended timeline.
US Dollar FAQs
The US Dollar (USD) is the official currency of the United States of America, and the ‘de facto’ currency of a significant number of other countries where it is found in circulation alongside local notes. It is the most heavily traded currency in the world, accounting for over 88% of all global foreign exchange turnover, or an average of $6.6 trillion in transactions per day, according to data from 2022. Following the second world war, the USD took over from the British Pound as the world’s reserve currency. For most of its history, the US Dollar was backed by Gold, until the Bretton Woods Agreement in 1971 when the Gold Standard went away.
The most important single factor impacting on the value of the US Dollar is monetary policy, which is shaped by the Federal Reserve (Fed). The Fed has two mandates: to achieve price stability (control inflation) and foster full employment. Its primary tool to achieve these two goals is by adjusting interest rates. When prices are rising too quickly and inflation is above the Fed’s 2% target, the Fed will raise rates, which helps the USD value. When inflation falls below 2% or the Unemployment Rate is too high, the Fed may lower interest rates, which weighs on the Greenback.
In extreme situations, the Federal Reserve can also print more Dollars and enact quantitative easing (QE). QE is the process by which the Fed substantially increases the flow of credit in a stuck financial system. It is a non-standard policy measure used when credit has dried up because banks will not lend to each other (out of the fear of counterparty default). It is a last resort when simply lowering interest rates is unlikely to achieve the necessary result. It was the Fed’s weapon of choice to combat the credit crunch that occurred during the Great Financial Crisis in 2008. It involves the Fed printing more Dollars and using them to buy US government bonds predominantly from financial institutions. QE usually leads to a weaker US Dollar.
Quantitative tightening (QT) is the reverse process whereby the Federal Reserve stops buying bonds from financial institutions and does not reinvest the principal from the bonds it holds maturing in new purchases. It is usually positive for the US Dollar.
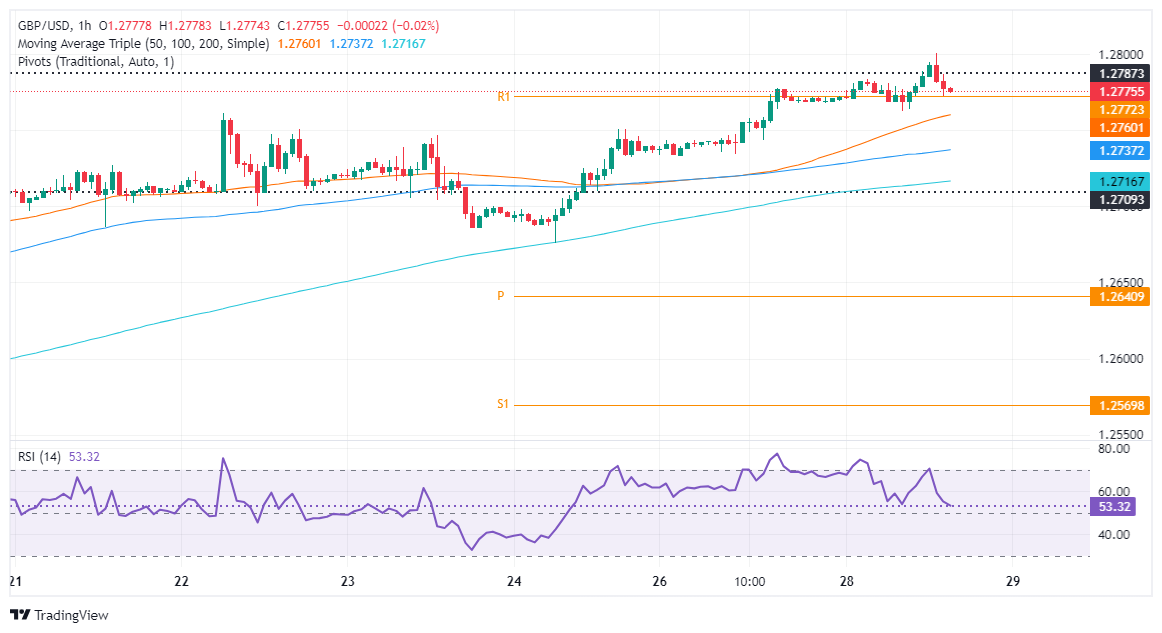
- GBP/USD maintains gains at 1.2786, up 0.14% from daily high.
- Resistance trendline and overbought RSI hint at potential correction.
- Short-term bearish engulfing pattern signals possible downward pressure.
The British Pound demonstrated its resilience against the Greenback on Tuesday, maintaining its gains as traders in the UK and the US returned after a long weekend. The GBP/USD is currently trading at 1.2786, showing a steady increase of 0.14% from its daily high of 1.2800.
GBP/USD Price Analysis: Technical outlook
The GBP/USD tested the 1.2800 figure, yet a confluence of technical indicators with a downslope resistance trendline drawn from the highs of July 2023 and the March 21 cycle high at around 1.2803, pushed the exchange rate back to current spot prices. Momentum is in favor of buyers, but the Relative Strength Index (RSI) is about to turn overbought, hinting the pair could be headed for a correction.
In the short term, the GBP/USD hourly chart has formed a ‘bearish engulfing’ candle chart pattern, an indication that a leg-down is underway. Additionally, bullish momentum is fading as the Relative Strength Index (RSI) aims toward the 50 midline, which, once crossed, could exert downward pressure on the major.
Key support levels lie at the current day’s low of1.2762, followed by the confluence of the 50-simple moving average (SMA) at 1.2759, followed by the confluence of the100-SMA and the S1 pivot point at around 1.2736/39, ahead of the 200-SMA at 1.2716.
Conversely, if buyers stepped in and pushed prices above 1.2803, look for a re-test of the year-to-date (YTD) high of 1.2893.
GBP/USD Price Action – Hourly Chart
- USD/CAD bounces back from 1.3600 as US Dollar recovers due to diminished Fed rate-cut bets.
- Fed officials want to see inflation easing for months before lowering interest rates.
- The BoC is expected to start unwinding the restrictive monetary policy stance from June.
The USD/CAD pair finds a temporary cushion near the round-level support of 1.3600 in Tuesday’s New York session. The Loonie asset finds buying interest as the US Dollar shows some signs of recovery after posting fresh weekly low. The US Dollar Index (DXY), which tracks the Greenback’s value against six major currencies, bounces back from 104.35.
Buying interest in the US Dollar is prompted by diminished bets that were leaned towards a rate-cut move by the Federal Reserve (Fed) in the current interest rate framework in the September meeting. This has also impacted the risk-on market sentiment. The S&P 500 has turned slightly negative at open. 10-year US Treasury yields recover to 4.48%. Fading Fed rate-cut prospects is a favorable scenario for US bond yields.
The reasoning behind traders paring Fed rate-cut bets is uncertainty over progress in the disinflation process. April’s Consumer Price Index (CPI) report showed that inflation slowed after remaining stubbornly higher for three months. However, Fed officials believe that the slowdown in price pressures in April doesn’t appear to be long-lasting.
Fed policymakers want to see inflation declining for months to gain confidence that price pressures will sustainably return to the desired rate of 2%. This week, investors will focus on the core Personal Consumption Expenditure Price Index (PCE) data for April, which will be published on Friday. The Fed’s preferred inflation measure is estimated to have grown steadily on monthly and annual basis at 0.3% and 2.8%, respectively. Steady inflation growth would prompt the likelihood of interest rates remaining at higher levels.
Meanwhile, the Canadian Dollar could come under pressure as investors hope that the Bank of Canada (BoC) will start reducing interest rates from the June meeting. Market participants expect that situation for a rate-cut is ripe as BoC’s preferred core CPI data that excludes eight volatile components has come down to 1.6% on an annual basis. Also, Canada’s Retail Sales are contracting from the past three months.
- CB Consumer Confidence recovered above 100.00 in May.
- US Dollar Index edged higher to the 104.50 area after the data.
Consumer sentiment in the US improved in May, with the Conference Board's Consumer Confidence Index rising to 102.00 from 97.5 in April. The Expectations Index climbed to 74.6 from 68.8 in the same period.
Assessing the findings of the survey, "consumers’ assessment of current business conditions was slightly less positive than last month," noted Dana M. Peterson, Chief Economist at the Conference Board. "However, the strong labor market continued to bolster consumers’ overall assessment of the present situation. Views of current labor market conditions improved in May, as fewer respondents said jobs were hard to get, which outweighed a slight decline in the number who said jobs were plentiful."
Market reaction
The US Dollar Index recovered from session lows following this report and was last seen losing 0.07% on the day at 104.52.
- AUD/USD jumps to 0.6670 with eyes on Australian inflation data for April.
- The US Dollar fails to capitalize on easing Fed rate-cut prospects.
- Fed officials want to see significant progress in the disinflation process before moving to rate cuts.
The AUD/USD pair continues its winning streak for the third trading session on Tuesday. The Aussie asset rises further to 0.6670 as the US Dollar continues to face selling pressure. The US Dollar Index (DXY), which tracks the Greenback’s value against six major currencies, slumps to 104.35 amid a cheerful market mood.
After an extended weekend due to holiday on Monday on account of Memorial Day, the S&P 500 is expected to open on a cautiously bullish note. 10-year US Treasury yields have fallen sharply to 4.45% even though investors lose confidence over the Federal Reserve (Fed) starting to reduce interest rates from their current levels in the September meeting.
The CME FedWatch tool shows that the probability for the Fed maintaining the current policy framework in September has increased slightly above 50% from 34% recorded a week ago. Diminished expectations for the Fed to start lowering key borrowing rates are the outcome of hawkish guidance on interest rates by policymakers.
Fed officials have been reiterating that interest rates are needed to remain at their current levels for long until they get sufficient evidence that inflation will sustainably return to the desired rate of 2%. In the European session, Minneapolis Fed Bank President Neel Kashkari emphasized waiting for significant progress in inflation before lowering interest rates. Kashkari added that more rate hikes remain on cards if inflation fails to come down.
Meanwhile, the Australian Dollar holds strength despite domestic Retail Sales data failing to match expectations. Monthly Retail Sales data for April rose at a slower pace of 0.1% from the consensus of 0.2%. In March, Retail Sales were contracted by 0.4%.
Going forward, investors will focus on the monthly Consumer Price Index (CPI) data for April, which will be published on Wednesday. The inflation data is estimated to have decelerated to 3.4% from the prior reading of 3.5%.
- The US Dollar extends its decline on Tuesday with US markets coming out of a long weekend.
- All eyes are on Fed speakers and chunky Treasury issuances across the curve.
- The US Dollar Index eases further below 104.50 and starts to look bleak.
The US Dollar (USD) extends its recent decline on Tuesday while US markets come back again after a long weekend due to the Memorial Day bank holiday on Monday. The Greenback eases as a risk-on sentiment sets the scene for the beginning of the week, topped up with comments from Japanese Finance Minister Shun’ichi Suzuki. Suzuki warned against speculators that are propping up for more Japanese Yen devaluation by saying that Japan is ready to take more, bigger and firmer steps in order to have a stable exchange rate, Bloomberg reported.
On the economic data front, the US Treasury will auction four bond issuances in several maturities across the yield curve, and three US Federal Reserve (Fed) speakers are set to make comments on Tuesday.
Daily digest market movers: Housing and Manufacturing sings on the wall
- At 12:55 GMT, the weekly Redbook Index for the week ending on May 24 is set to be released. The previous week’s result came in at 5.5%.
- The March Housing Price Index will be released at 13:00 GMT. February's reading was 1.2%, and a decline to 0.5% is expected. Should the Index fall into contraction, substantial US Dollar easing could materialize.
- At 14:00 GMT, May’s Conference Board Consumer Confidence will be released, with the previous number at 97.0 and 96.0 forecasted.
- At 14:30 GMT, the Dallas Fed will release its Manufacturing Business Index for May. April’s data showed a contraction to -14.5, with an improvement to -12.5 forecasted for May.
- The US Treasury is having four bond auctions on Tuesday:
- At 15:30 GMT, both a 3-month and a 6-month bill are to be allocated.
- At 17:00 GMT, a 2-year and a 5-year note are to be issued.
- Three Fed speakers are lined up on Tuesday:
- Federal Reserve Governor Michelle Bowman already issued comments on Tuesday morning during Asian hours. She iterated it continues to remain important that the Fed sticks to reducing its balance sheet.
- Federal Reserve Bank of Minneapolis President Neel Kashkari will speak at 13:55 GMT in a panel at the Barclays-CEPR International Monetary Policy Forum.
- Around 17:00 GMT, Federal Reserve Bank of San Francisco President Mary Daly participates in a panel discussion about Artificial Intelligence (AI) and the Economy at the Federal Reserve Bank of San Francisco, together with Federal Reserve Governor Lisa Cook.
- Chinese equity markets were under pressure on Tuesday after their rally on Monday. European equities are up a quarter of a percent during European trading hours. US equity futures are also trading in the green ahead of the opening bell.
- The CME Fedwatch Tool is pricing 99.1% for no change in the policy rate for June. September futures are in a stalemate, where it is a neck-and-neck race with 48.4% chances for keeping rates unchanged against 46.4% chances for a 25 basis points (bps) rate cut and 4.7% chances for even 50 bps rate cut. A marginal 0.4% price in an interest rate hike.
- The benchmark 10-year US Treasury Note trades around 4.45% in a tight range ahead of the US opening bell.
US Dollar Index Technical Analysis: Testing vital support
The US Dollar Index (DXY) is playing a dangerous game on Tuesday, testing important support levels and retreating for a third day in a row. Ahead of the US opening bell, the DXY is testing the 200-day Simple Moving Average (SMA) at 104.41. With the 100-day SMA very close, at 104.32, much room opens up for a nosedive should markets start to unwind their Dollar long positions.
On the upside, the DXY index needs to reclaim key levels it lost last week: the 55-day Simple Moving Average (SMA) at 104.88 and the 105.00 big round level. Further up, the following levels to consider are 105.12 and 105.52.
On the downside, the 200-day SMA at 104.41 and the 100-day SMA around 104.32 are the last line of defence. Once that level snaps, an air pocket is placed between 104.30 and 103.00. Should the US Dollar decline persist, the low of March at 102.35 and the low from December at 100.62 are levels to consider.
US Dollar FAQs
The US Dollar (USD) is the official currency of the United States of America, and the ‘de facto’ currency of a significant number of other countries where it is found in circulation alongside local notes. It is the most heavily traded currency in the world, accounting for over 88% of all global foreign exchange turnover, or an average of $6.6 trillion in transactions per day, according to data from 2022. Following the second world war, the USD took over from the British Pound as the world’s reserve currency. For most of its history, the US Dollar was backed by Gold, until the Bretton Woods Agreement in 1971 when the Gold Standard went away.
The most important single factor impacting on the value of the US Dollar is monetary policy, which is shaped by the Federal Reserve (Fed). The Fed has two mandates: to achieve price stability (control inflation) and foster full employment. Its primary tool to achieve these two goals is by adjusting interest rates. When prices are rising too quickly and inflation is above the Fed’s 2% target, the Fed will raise rates, which helps the USD value. When inflation falls below 2% or the Unemployment Rate is too high, the Fed may lower interest rates, which weighs on the Greenback.
In extreme situations, the Federal Reserve can also print more Dollars and enact quantitative easing (QE). QE is the process by which the Fed substantially increases the flow of credit in a stuck financial system. It is a non-standard policy measure used when credit has dried up because banks will not lend to each other (out of the fear of counterparty default). It is a last resort when simply lowering interest rates is unlikely to achieve the necessary result. It was the Fed’s weapon of choice to combat the credit crunch that occurred during the Great Financial Crisis in 2008. It involves the Fed printing more Dollars and using them to buy US government bonds predominantly from financial institutions. QE usually leads to a weaker US Dollar.
Quantitative tightening (QT) is the reverse process whereby the Federal Reserve stops buying bonds from financial institutions and does not reinvest the principal from the bonds it holds maturing in new purchases. It is usually positive for the US Dollar.
- The Oil price extends upside as uncertainty ahead of the OPEC+ meeting neutralizes the impact of fading Fed rate-cut prospects.
- Easing Fed rate-cut bets fail to uplift the US Dollar’s appeal.
- Fed officials believe that slowdown in April’s CPI report won’t be long-lasting.
West Texas Intermediate (WTI), futures on NYMEX, move higher towards weekly high near $79.25 in Tuesday’s European session. The Oil price extends its winning streak for the third trading session as uncertainty among investors ahead of the OPEC+ meeting scheduled for June 2 offsets the impact of easing bets leaned towards the Federal Reserve (Fed) reducing interest rates from the September meeting.
Investors caution that the Oil supply could reduce further if OPEC members extend the current cut of two million barrels per day. This will uplift the Oil prices due to supply concerns in an already tight market.
Meanwhile, market speculation for Fed rate cut in the September meeting has diminished significantly and investors now expect that centra bank will start reducing borrowing rates in the last quarter of this year. The failure of soft United States (US) Consumer Price Index (CPI) report of April in building confidence among policymakers that the progress in the disinflation process has resumed after stalling for straight three months has forced traders to pare rate-cut bets.
A sharp decline in Fed rate-cut prospects has failed to uplift the US Dollar. The US Dollar Index (DXY), which tracks the Greenback’s value against six major currencies, extends its downside to 104.40.
Going forward, investors will focus on the US core Personal Consumption Expenditure Price Index (PCE) data for April, which will be published on Friday. The Fed’s preferred inflation measure is estimated to have grown steadily on monthly and annual basis at 0.3% and 2.8%, respectively. This would weaken the case of Fed rate cuts in September further.
- Natural Gas prices decline nearly 2% amid reports that Israeli opposition parties discuss plans to oust Prime Minister Benjamin Netanyahu.
- Ireland, Norway and Spain have officially recognized the Palestinian state as strikes over Rafah continue.
- The US Dollar Index retreats further, testing the last lines of defense.
Natural Gas price (XNG/USD) is testing this week’s low on Tuesday after prices fell on Monday due to extensive profit-taking. The decline on Tuesday comes on the back of headlines that the opposition in Israel is planning to meet on Wednesday to look for ways to oust Prime Minister Benjamin Netanyahu. Tensions build up in Israel after several world nations expressed their concerns after the attack on a refugee camp in Rafah, which killed at least 45 people.
Meanwhile, the US Dollar Index (DXY) eases further on Tuesday ahead of the official start of the week for US markets after a bank holiday on Monday for Memorial Day. The retreat comes after warnings from Japanese Finance Minister Shun’ichi Suzuki, who pushed against any attempts to further devalue the Japanese Yen by saying that every measure is at their disposal in order to assure a stable exchange rate. The US economic agenda is set to kick off with a slew of data and four US Federal Reserve (Fed) speakers.
Natural Gas is trading at $2.77 per MMBtu at the time of writing.
Natural Gas news and market movers: Tensions brewing and pressure on US
- On Tuesday morning witnesses reported to Reuters that tanks have reached the outskirts of Rafah City.
- Israeli opposition leader Yair Lapid, Yisrael Beytenu chairman Avigdor Liberman, and New Hope chairman Gideon Sa'ar are set to meet on Wednesday to discuss the creation of an alternative government and removing Israeli Prime Minister Benjamin Netanyahu from his function, KAN reports citing sources.
- Newswire Axios reported that the US is still assessing whether Israel violated a red line with the Rafah strikes.
- Bloomberg’s Power and Gas research calculated that, despite the current hiccups in supply, the European bloc is still set to hit a 100% full Gas storage inventory ahead of the winter season.
Natural Gas Technical Analysis: US caught in its support for Israel
Natural Gas is sliding lower with rumors of possibly an opposition coalition formation that could take over power from current ruling Prime Minister Benjamin Nethanyahu, an event that could de-escalate the situation in the region. After the Rafah massacre over the weekend, international disapproval is growing and even the US is seeing how its arguments to stand by Israel are starting to run out. If a new coalition took control of the government, the current offensive in Gaza could be ended and recalled, easing tensions in the region.
The $3.00 marker as a big figure was easily broken on Wednesday. The pivotal level near $3.07 (high of March 6, 2023) remains key as prices failed to post a daily close above it. Further up, the fresh year-to-date high at $3.16 is the level to beat.
On the downside, the 200-day Simple Moving Average (SMA) is acting as first support near $2.53. Should that support area fail to hold, then the pivotal level near $2.14 should do the trick ahead of $2.11, where both the 55-day and 100-day SMA are trading.
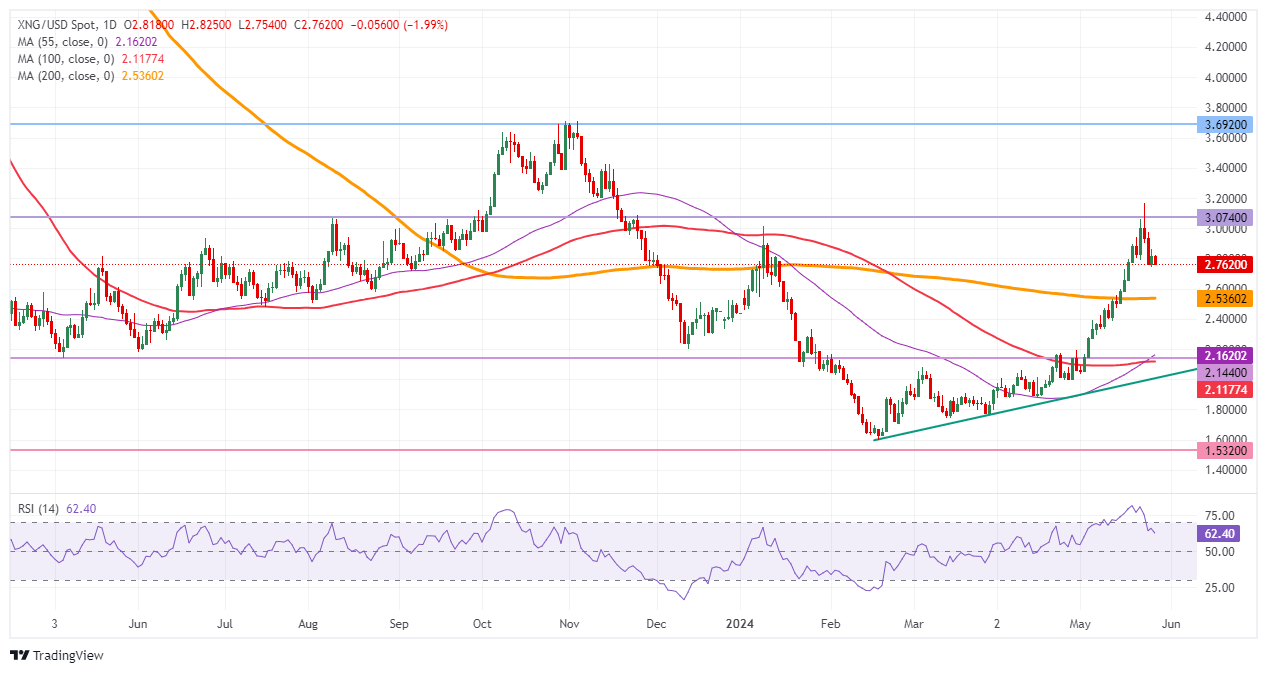
Natural Gas: Daily Chart
Natural Gas FAQs
Supply and demand dynamics are a key factor influencing Natural Gas prices, and are themselves influenced by global economic growth, industrial activity, population growth, production levels, and inventories. The weather impacts Natural Gas prices because more Gas is used during cold winters and hot summers for heating and cooling. Competition from other energy sources impacts prices as consumers may switch to cheaper sources. Geopolitical events are factors as exemplified by the war in Ukraine. Government policies relating to extraction, transportation, and environmental issues also impact prices.
The main economic release influencing Natural Gas prices is the weekly inventory bulletin from the Energy Information Administration (EIA), a US government agency that produces US gas market data. The EIA Gas bulletin usually comes out on Thursday at 14:30 GMT, a day after the EIA publishes its weekly Oil bulletin. Economic data from large consumers of Natural Gas can impact supply and demand, the largest of which include China, Germany and Japan. Natural Gas is primarily priced and traded in US Dollars, thus economic releases impacting the US Dollar are also factors.
The US Dollar is the world’s reserve currency and most commodities, including Natural Gas are priced and traded on international markets in US Dollars. As such, the value of the US Dollar is a factor in the price of Natural Gas, because if the Dollar strengthens it means less Dollars are required to buy the same volume of Gas (the price falls), and vice versa if USD strengthens.
- Gold imports to China, its largest market, fell by 38% in April.
- The data could indicate Chinese demand is weakening.
- XAU/USD is probably forming a Bear Flag continuation pattern.
Gold (XAU/USD) is trading lower in the $2,340s on Tuesday, despite sentiment taking a negative turn (normally positive for Gold) on the back of concerns that demand in China – Gold’s largest market – might be fading.
Gold weakens after imports to China fall
Gold imports to China via Hong Kong fell 38% in April compared to the previous month, according to data from the Hong Kong Census and Statistics Department, released on Monday.
Net imports into the world's largest Gold consumer totaled 34.6 metric tons in April, compared to 55.8 tonnes in March, the data showed.
Gold stored in Hong Kong International Airport accounts for the lion’s share of the Gold that is imported into mainland China. The commodity is mainly moved from one country to another principally by air so it gets stored at Hong Kong Airport before making the last leg of its journey across the border into China.
The data marks a change from the high consumption recorded in the first quarter, which showed a 5.94% rise from a year earlier, according to data from the China Gold Association (CGA). 308.91 metric tons of the precious metal were consumed in the first three months of the year, the China Daily reported.
Technical Analysis: Gold might be forming a Bear Flag
Gold price is consolidating in a rectangular formation (red-shaded area) after its steep decline from the dizzy heights reached last week. The sell-off has taken XAU/USD below a major trendline, ushering in a new more bearish technical environment for the precious metal.
The result is that Gold is probably in a short-term downtrend now, favoring short positions over longs.
XAU/USD 4-hour Chart
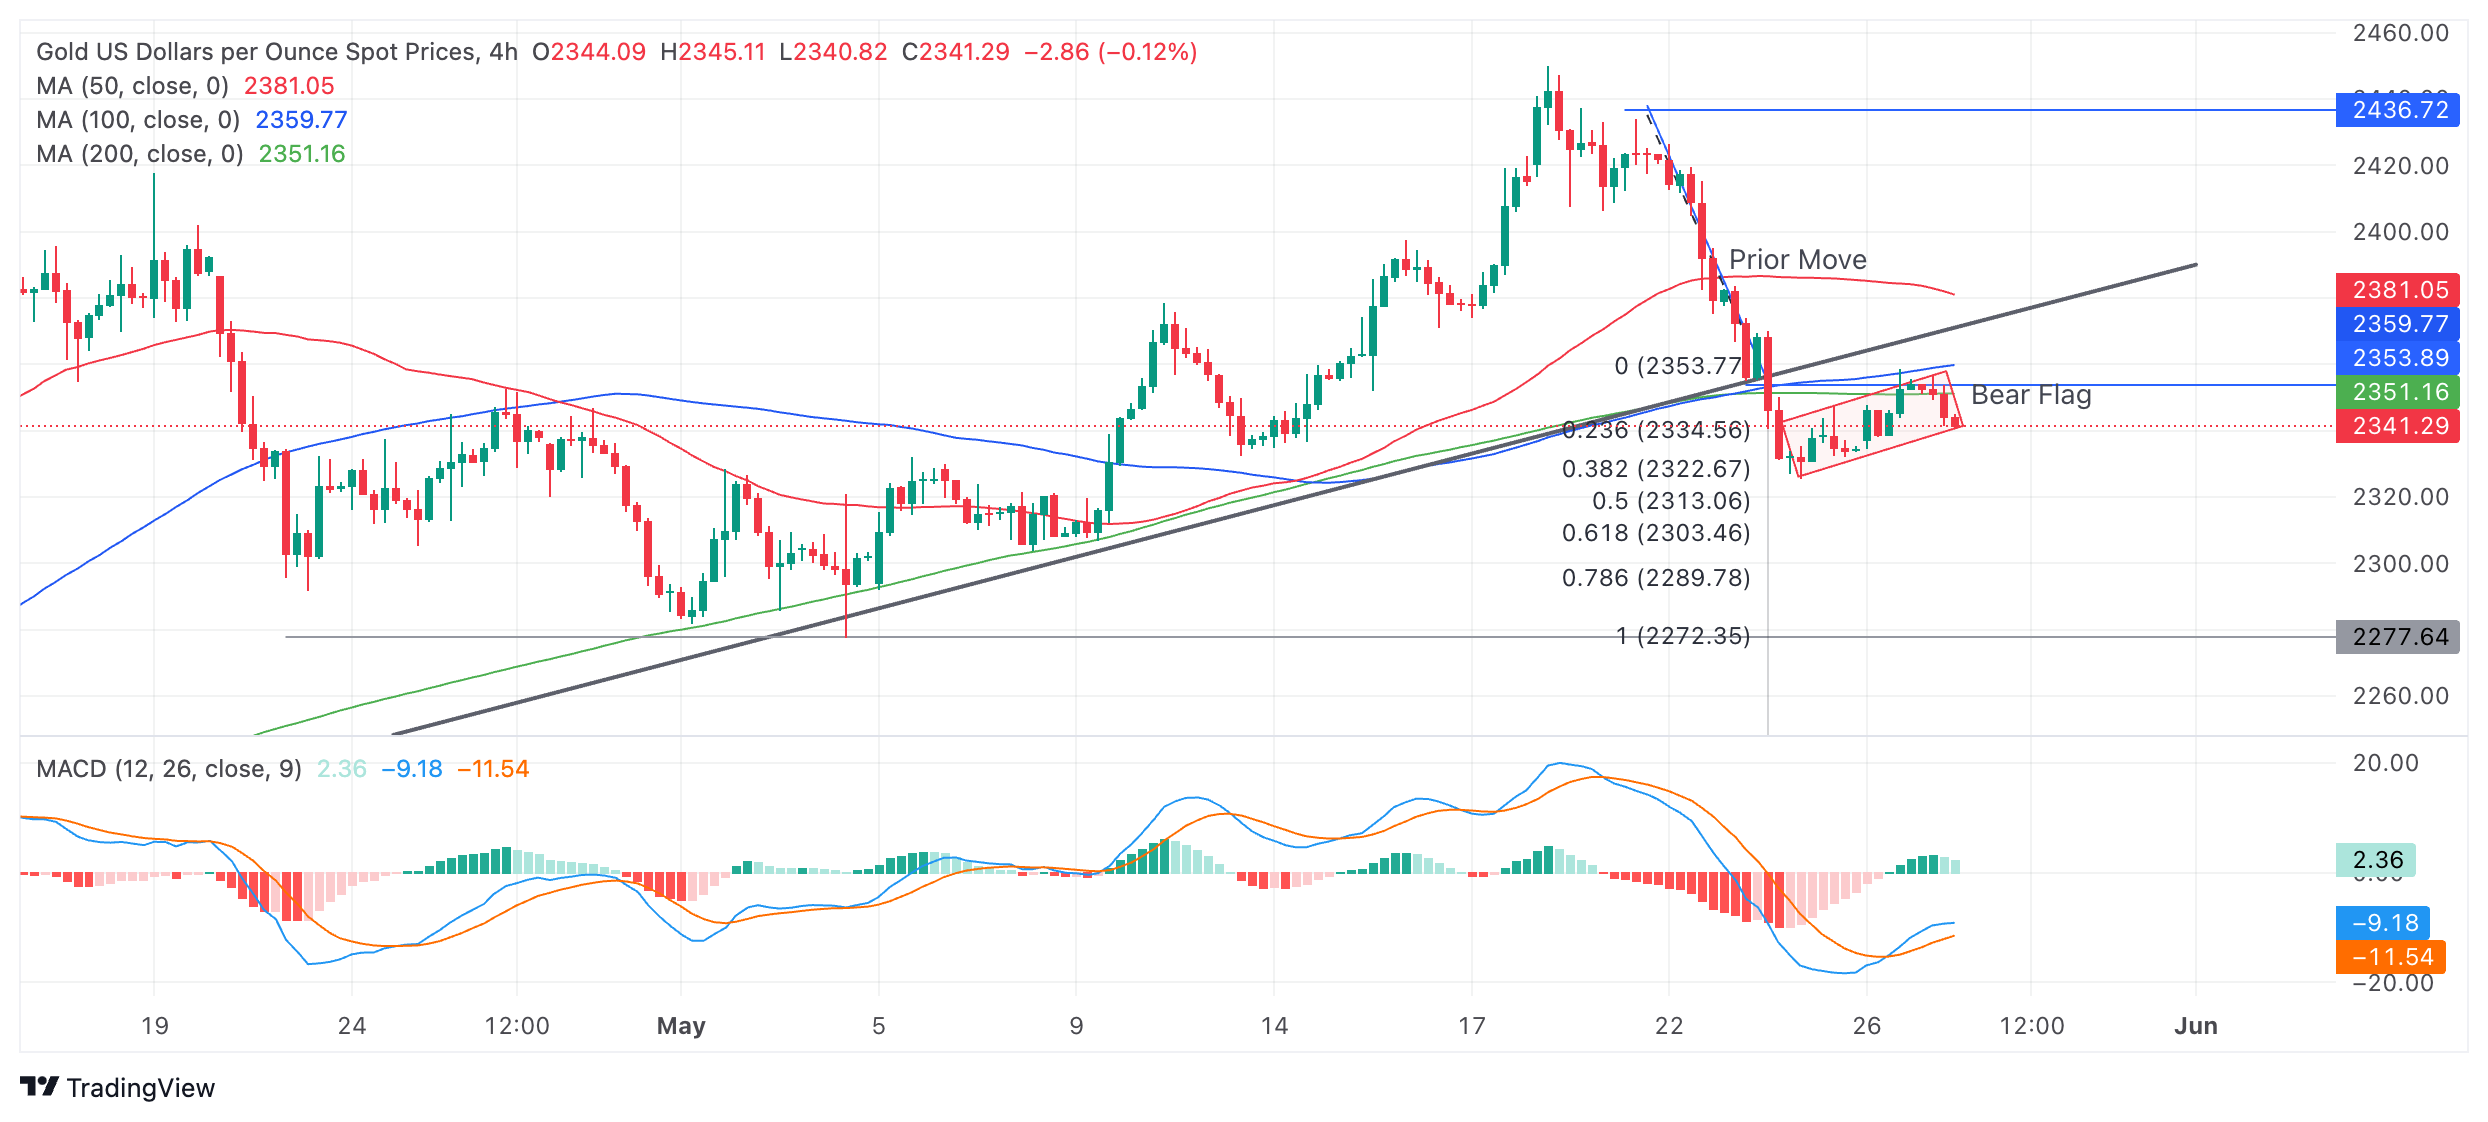
The precious metal has pulled back since bottoming on May 24 but it looks vulnerable to breaking down. The pullback might be a Bear Flag continuation price pattern. If so, it would suggest substantial downside – to at least $2,300 – in the event of a break below the $2,325 May 24 lows.
Last week’s decisive break of the major trendline indicates a likely follow-through lower. The conservative target for the follow-through is $2,303 (the Fibonacci 0.618 extrapolation of the down move prior to the break – from $2,435 to $2,355).
A more bearish move could see Gold fall all the way down to $2,272 (the 100% extrapolation of the move prior to the break). The latter level is also the support from the May 3 lower high. A break below the $2,325 lows would provide confirmation of more downside to these targets.
The Moving Average Convergence Divergence (MACD) indicator crossed above its signal line on Monday, and the pullback continued developing in line with the signal from the indicator. However, it has weakened again on Tuesday and is currently pressuring the base of the rectangle.
The precious metal’s medium and long-term trends are still bullish, suggesting the risk of a recovery remains high, yet price action is not supporting a resumption hypothesis.
A decisive break back above the trendline, now at $2,375, would provide evidence of a recovery and reversal of the short-term downtrend.
A decisive break would be one accompanied by a long green bullish candle or three green candles in a row.
Gold FAQs
Gold has played a key role in human’s history as it has been widely used as a store of value and medium of exchange. Currently, apart from its shine and usage for jewelry, the precious metal is widely seen as a safe-haven asset, meaning that it is considered a good investment during turbulent times. Gold is also widely seen as a hedge against inflation and against depreciating currencies as it doesn’t rely on any specific issuer or government.
Central banks are the biggest Gold holders. In their aim to support their currencies in turbulent times, central banks tend to diversify their reserves and buy Gold to improve the perceived strength of the economy and the currency. High Gold reserves can be a source of trust for a country’s solvency. Central banks added 1,136 tonnes of Gold worth around $70 billion to their reserves in 2022, according to data from the World Gold Council. This is the highest yearly purchase since records began. Central banks from emerging economies such as China, India and Turkey are quickly increasing their Gold reserves.
Gold has an inverse correlation with the US Dollar and US Treasuries, which are both major reserve and safe-haven assets. When the Dollar depreciates, Gold tends to rise, enabling investors and central banks to diversify their assets in turbulent times. Gold is also inversely correlated with risk assets. A rally in the stock market tends to weaken Gold price, while sell-offs in riskier markets tend to favor the precious metal.
The price can move due to a wide range of factors. Geopolitical instability or fears of a deep recession can quickly make Gold price escalate due to its safe-haven status. As a yield-less asset, Gold tends to rise with lower interest rates, while higher cost of money usually weighs down on the yellow metal. Still, most moves depend on how the US Dollar (USD) behaves as the asset is priced in dollars (XAU/USD). A strong Dollar tends to keep the price of Gold controlled, whereas a weaker Dollar is likely to push Gold prices up.
- The Pound Sterling jumps to 1.2780 as the US Dollar declines with eyes on US core PCE inflation data.
- US core PCE inflation is forecasted to have grown at a steady pace on a monthly and an annual basis.
- A slower decline in the UK inflation in April diminished BoE rate-cut prospects.
The Pound Sterling (GBP) approaches the round-level resistance of 1.2800 in Tuesday’s European session. The strength in the GBP/USD pair is driven by the upbeat Pound Sterling, which capitalizes on risk-on sentiment and deepening uncertainty about when the Bank of England (BoE) will start reducing interest rates.
Earlier, investors expected the BoE to start reducing interest rates from the June meeting. Firm speculation for BoE rate cuts was built on expectations that the United Kingdom's annual headline inflation will return to the desired rate of 2% in April. BoE Governor Andrew Bailey said in an event organised by the International Monetary Fund (IMF) in Washington on April 16 that “inflation in the UK will fall near its 2% target next month” and “has declined roughly in step with the BoE’s forecast in February”, Bloomberg reported.
However, the pace at which the underlying inflation declined was insufficient to drag price pressures to the 2% target, and it softened to 2.3%. Apart from a slower decline in headline inflation, stubborn service inflation appears to be a major barrier that is making the last mile for price pressures towards the 2% target extremely stubborn.
Daily digest market movers: Pound Sterling advances as US Dollar remains on backfoot
- The Pound Sterling advances to 1.2780 against the US Dollar as the latter is under pressure due to investors’ higher risk appetite. The appeal for risk-perceived assets has strengthened even though investors’ expectations for the Federal Reserve (Fed) reducing interest rates from the September meeting have diminished significantly.
- The CME FedWatch tool shows that traders see a roughly 50% chance of the Fed maintaining the current monetary policy framework in September. The odds of keeping rates unchanged have increased from 34% recorded a week ago. This could trigger a bullish reversal move in the US Dollar, which has been facing significant selling pressure since Friday. The US Dollar Index (DXY), which tracks the Greenback’s value against six major currencies, has posted a fresh weekly low near 104.40.
- Traders have pared Fed rate-cut bets as officials have reiterated that the current interest rate framework is sufficiently restrictive and needs to be held for a longer period until they are assured that inflation will sustainably return to the 2% target before considering rate cuts. Fed policymakers want to see price pressures declining for months to get that kind of confidence.
- Going forward, investors will focus on the United States (US) core Personal Consumption Expenditure Price Index (PCE) data for May, which will be published on Friday. The core PCE inflation data, which is the Fed’s preferred inflation measure, will provide fresh cues over the inflation outlook.
- Economists expect monthly and annual core PCE inflation to grow steadily by 0.3% and 2.8%, respectively. A hotter-than-expected inflation reading will be favorable for the US Dollar as it will force traders to pare dovish bets for September, while soft figures will do the opposite.
Technical Analysis: Pound Sterling sets to reclaim 1.2800
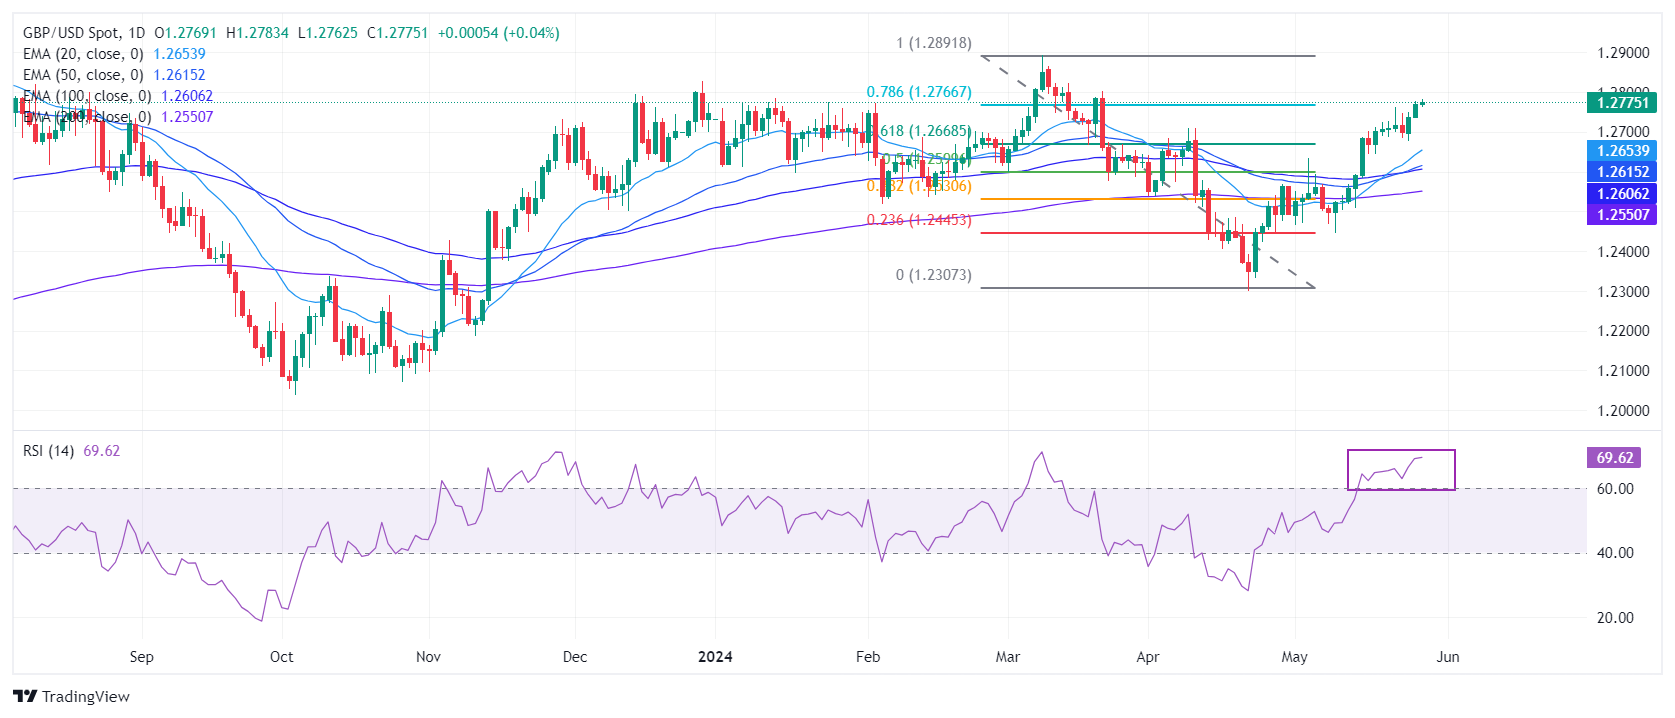
The Pound Sterling extends its upside to 1.2780 against the US Dollar. The GBP/USD pair aims to recapture the round-level resistance of 1.2800. The appeal for the Cable strengthens as it reaches the 78.6% Fibonacci retracement (plotted from the March 8 high of 1.2900 to the April 22 low at 1.2300) at 1.2770.
The Cable is expected to remain bullish as all short-to-long-term Exponential Moving Averages (EMAs) are sloping higher, suggesting a strong uptrend.
The 14-period Relative Strength Index (RSI) has shifted into the bullish range of 60.00-80.00, suggesting that the momentum has leaned toward the upside.
Pound Sterling FAQs
The Pound Sterling (GBP) is the oldest currency in the world (886 AD) and the official currency of the United Kingdom. It is the fourth most traded unit for foreign exchange (FX) in the world, accounting for 12% of all transactions, averaging $630 billion a day, according to 2022 data. Its key trading pairs are GBP/USD, aka ‘Cable’, which accounts for 11% of FX, GBP/JPY, or the ‘Dragon’ as it is known by traders (3%), and EUR/GBP (2%). The Pound Sterling is issued by the Bank of England (BoE).
The single most important factor influencing the value of the Pound Sterling is monetary policy decided by the Bank of England. The BoE bases its decisions on whether it has achieved its primary goal of “price stability” – a steady inflation rate of around 2%. Its primary tool for achieving this is the adjustment of interest rates. When inflation is too high, the BoE will try to rein it in by raising interest rates, making it more expensive for people and businesses to access credit. This is generally positive for GBP, as higher interest rates make the UK a more attractive place for global investors to park their money. When inflation falls too low it is a sign economic growth is slowing. In this scenario, the BoE will consider lowering interest rates to cheapen credit so businesses will borrow more to invest in growth-generating projects.
Data releases gauge the health of the economy and can impact the value of the Pound Sterling. Indicators such as GDP, Manufacturing and Services PMIs, and employment can all influence the direction of the GBP. A strong economy is good for Sterling. Not only does it attract more foreign investment but it may encourage the BoE to put up interest rates, which will directly strengthen GBP. Otherwise, if economic data is weak, the Pound Sterling is likely to fall.
Another significant data release for the Pound Sterling is the Trade Balance. This indicator measures the difference between what a country earns from its exports and what it spends on imports over a given period. If a country produces highly sought-after exports, its currency will benefit purely from the extra demand created from foreign buyers seeking to purchase these goods. Therefore, a positive net Trade Balance strengthens a currency and vice versa for a negative balance.
- NZD/USD strengthens on weak US Dollar and China’s announcement of stimulus to revive property sector.
- Market speculation for Fed reducing interest rates from September has weakened.
- NZD/USD approaches the crucial resistance of 0.6220.
The NZD/USD pair refreshes its 10-week high at 0.6165 in Tuesday’s European session. The Kiwi asset strengthens on multiple tailwinds such as soft US Dollar and China’s announcement of fresh stimulus measures to boost demand for its beleaguered housing sector.
The US Dollar Index (DXY), which tracks the US Dollar’s value against six major currencies, has extended its downside to 104.50. The US Dollar fails to capitalize on diminished expectations over the Federal Reserve (Fed) starting to reduce interest rates from the September meeting. The decline in market speculation for Fed rate cuts in September is the outcome of a strong United States (US) economic outlook and policymakers’ hawkish stance on the interest rate outlook.
Meanwhile, the New Zealand Dollar strengthened after China’s Shanghai announced several measures to revive the housing sector from the crisis. The administration acknowledges cutting down payment requirements, lowering minimum mortgage rates, and restrictions on home purchases will be eased. Being a proxy to China’s economy, the appeal for the New Zealand Dollar improves.
On the domestic front, investors await the NZ Budget Release that will indicate the scale of spendings, borrowing and revenue collection by the government.
NZD/USD is approaching the horizontal resistance plotted from February 22 high around 0.6220. The Kiwi asset strengthened after a bullish crossover of the 20 and 50-day Exponential Moving Averages (EMAs) around 0.6020, which suggested that a bullish trend has been triggered.
The 14-period Relative Strength Index (RSI) shifts comfortably into the bullish range of 60.00-80.00, indicating that the momentum has leaned toward the upside.
An upside move above the round-level resistance of 0.6200 will drive the asset January 15 high near 0.6250, followed by January 12 high near 0.6280.
On the contrary, fresh downside would appear if the asset breaks below April 4 high around 0.6050 This would drag the asset towards the psychological support of 0.6000 and April 25 high at 0.5969.
NZD/USD daily chart
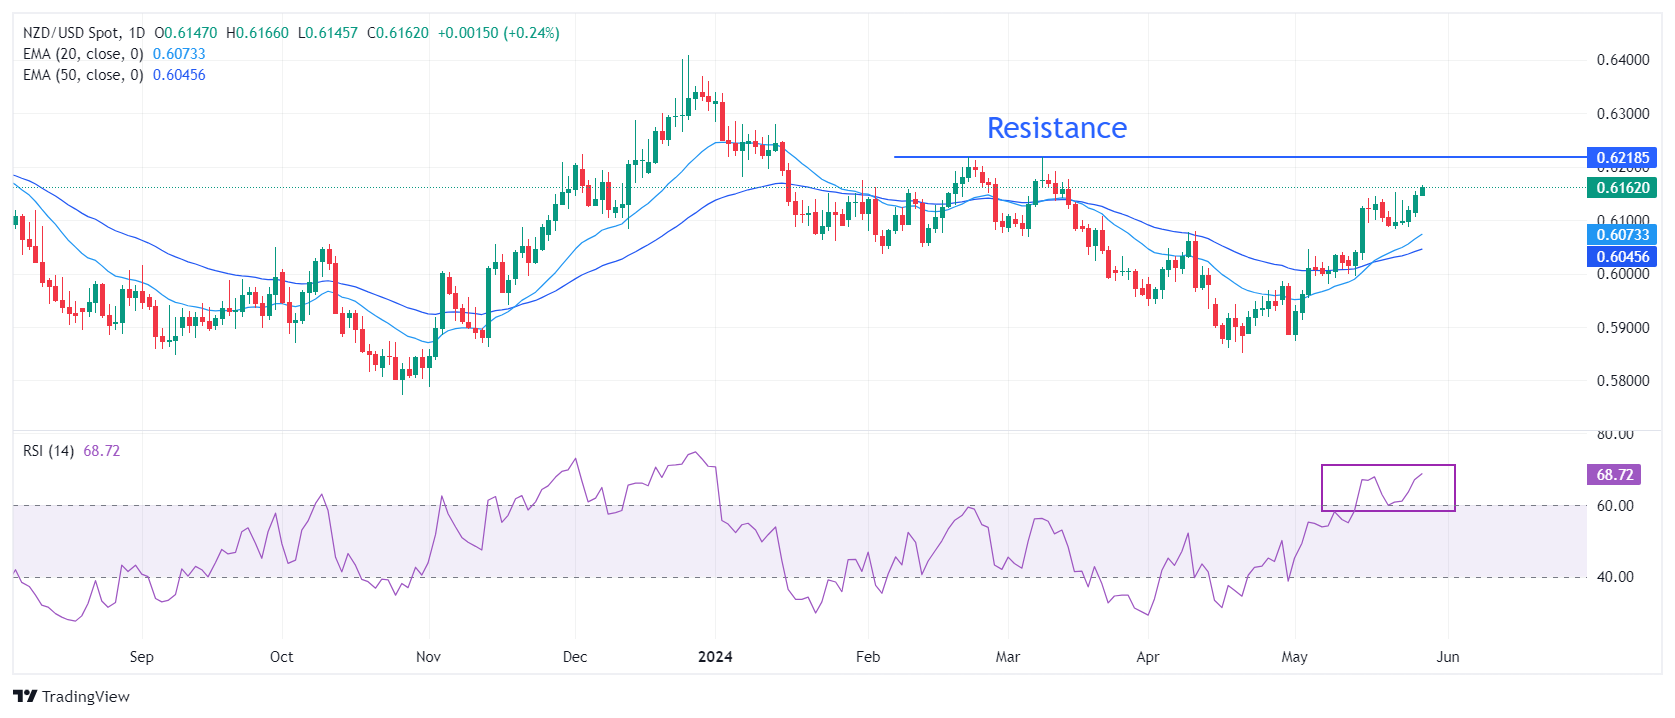
On Tuesday, China’s Politburo, the country’s top leadership, said “the government will promote employment and encourage entrepreneurship.”
Additional quotes
Will promote the coordination and linkage of fiscal, monetary, investment, consumption, industrial, regional and other policies with employment policies.
Will put high-quality and sufficient employment as prioritised goal for economic and social development.
Necessary to improve employment support policies for key groups.
Necessary to adhere to the employment of young people such as college graduates as the top priority.
Necessary to deepen reform of the employment system and mechanism.
Will improve the employment public service system.
Will support development of companies and industries with strong job creation capabilities.
Will stabilize scale and income of people lifted out of poverty, and prevent the large-scale return to poverty due to unemployment.
Will take multiple measures to promote the employment of migrant workers.
Will guide talents from outside the country to return to their hometowns and urban talents to go to the countryside to start businesses.
Market reaction
AUD/USD is defending gains near 0.6655 following these above comments. The pair is up 0.12% on the day, at the time of writing.
Silver prices (XAG/USD) fell on Tuesday, according to FXStreet data. Silver trades at $31.47 per troy ounce, down 1.05% from the $31.80 it cost on Monday.
Silver prices have increased by 23.56% since the beginning of the year.
| Unit measure | Today Price |
|---|---|
| Silver price per troy ounce | $31.47 |
| Silver price per gram | $1.01 |
The Gold/Silver ratio, which shows the number of troy ounces of Silver needed to equal the value of one troy ounce of Gold, stood at 74.48 on Tuesday, up from 74.02 on Monday.
Investors might use this ratio to determine the relative valuation of Gold and Silver. Some may consider a high ratio as an indicator that Silver is undervalued – or Gold is overvalued – and might buy Silver or sell Gold accordingly. Conversely, a low ratio might suggest that Gold is undervalued relative to Silver.
(An automation tool was used in creating this post.)
Silver FAQs
Silver is a precious metal highly traded among investors. It has been historically used as a store of value and a medium of exchange. Although less popular than Gold, traders may turn to Silver to diversify their investment portfolio, for its intrinsic value or as a potential hedge during high-inflation periods. Investors can buy physical Silver, in coins or in bars, or trade it through vehicles such as Exchange Traded Funds, which track its price on international markets.
Silver prices can move due to a wide range of factors. Geopolitical instability or fears of a deep recession can make Silver price escalate due to its safe-haven status, although to a lesser extent than Gold's. As a yieldless asset, Silver tends to rise with lower interest rates. Its moves also depend on how the US Dollar (USD) behaves as the asset is priced in dollars (XAG/USD). A strong Dollar tends to keep the price of Silver at bay, whereas a weaker Dollar is likely to propel prices up. Other factors such as investment demand, mining supply – Silver is much more abundant than Gold – and recycling rates can also affect prices.
Silver is widely used in industry, particularly in sectors such as electronics or solar energy, as it has one of the highest electric conductivity of all metals – more than Copper and Gold. A surge in demand can increase prices, while a decline tends to lower them. Dynamics in the US, Chinese and Indian economies can also contribute to price swings: for the US and particularly China, their big industrial sectors use Silver in various processes; in India, consumers’ demand for the precious metal for jewellery also plays a key role in setting prices.
Silver prices tend to follow Gold's moves. When Gold prices rise, Silver typically follows suit, as their status as safe-haven assets is similar. The Gold/Silver ratio, which shows the number of ounces of Silver needed to equal the value of one ounce of Gold, may help to determine the relative valuation between both metals. Some investors may consider a high ratio as an indicator that Silver is undervalued, or Gold is overvalued. On the contrary, a low ratio might suggest that Gold is undervalued relative to Silver.
- AUD/JPY appreciated after Japan's Weighted Median Inflation Index showed a slowdown on Tuesday.
- Japan’s Corporate Service Price Index posted a reading of 2.8% YoY in April, marking its fastest increase since March 2015.
- Australia’s Retail Sales grew 0.1% in April, against the expected 0.2% and the previous decline of 0.4%.
AUD/JPY continues its winning streak for the third consecutive session on Tuesday, trading around 104.50 during the European session. The appreciation of the AUD/JPY cross is attributed to the softer Japanese Yen (JPY) following the Bank of Japan (BoJ) publishing the latest data earlier in the day. Japan's Weighted Median Inflation Index, a significant gauge of the country’s inflation trend, increased by 1.1% in April, slowing from the 1.3% increase recorded in March.
However, the Japanese Yen found some strength during the early Asian hours, supported by Japan’s improved Corporate Service Price Index (CSPI). The CSPI posted a year-over-year reading of 2.8% in April, surpassing expectations of 2.3% and marking its fastest rate of increase since March 2015.
Additionally, Japan Finance Minister Shun'ichi Suzuki emphasized the importance of currencies moving in a stable manner that reflects fundamentals. Suzuki stated that he is closely monitoring foreign exchange (FX) movements but refrained from commenting on whether Japan has conducted currency intervention.
Across the pond, the Australian Dollar (AUD) continues to strengthen despite softer Australia's Retail Sales (MoM), which rose by 0.1% in April, swinging from the previous 0.4% decline and falling short of market expectations of 0.2%.
Moreover, the latest Reserve Bank of Australia (RBA) meeting minutes indicated that the board found it difficult to forecast future changes in the cash rate, acknowledging that recent data increase the likelihood of inflation persisting above the 2-3% target for an extended period.
Gold prices rose in India on Tuesday, according to data from India's Multi Commodity Exchange (MCX).
Gold price stood at 71,933 Indian Rupees (INR) per 10 grams, up INR 11 compared with the INR 71,922 it cost on Monday.
As for futures contracts, Gold prices decreased to INR 71,829 per 10 gms from INR 72,009 per 10 gms.
Prices for Silver futures contracts decreased to INR 94,127 per kg from INR 94,608 per kg.
| Major Indian city | Gold Price |
|---|---|
| Ahmedabad | 74,455 |
| Mumbai | 74,270 |
| New Delhi | 74,275 |
| Chennai | 74,510 |
| Kolkata | 74,460 |
Global Market Movers: Comex Gold price holds rebound, as US inflation awaited
- An Israeli airstrike triggered a fire that killed 45 people in a tent camp in the Gazan city of Rafah, officials said on Monday. Global leaders called for the implementation of a World Court order to halt Israel's attacks, per Reuters.
- According to the recent Fed meeting minutes, the central bank would take longer than anticipated to gain greater confidence in inflation moving to the 2% target.
- Traders have reduced their bets on interest rate reduction by the US Federal Reserve (Fed) to 49% odds in September, down from 63% a week earlier, according to the CME FedWatch tool.
- The preliminary US Gross Domestic Product (GDP) Annualized is estimated to grow 1.4% in Q1 from 1.6% in the previous reading.
- The US Core Personal Consumption Expenditures Price Index (Core PCE), the Fed’s preferred inflation gauge, is expected to show an increase of 0.3% MoM and 2.8% YoY in April.
- UBS analysts raised their gold price projection to $2,600 by the end of 2024. Citi experts forecast that gold will reach $3,000 per ounce during the next six to eighteen months.
(An automation tool was used in creating this post.)
Gold FAQs
Gold has played a key role in human’s history as it has been widely used as a store of value and medium of exchange. Currently, apart from its shine and usage for jewelry, the precious metal is widely seen as a safe-haven asset, meaning that it is considered a good investment during turbulent times. Gold is also widely seen as a hedge against inflation and against depreciating currencies as it doesn’t rely on any specific issuer or government.
Central banks are the biggest Gold holders. In their aim to support their currencies in turbulent times, central banks tend to diversify their reserves and buy Gold to improve the perceived strength of the economy and the currency. High Gold reserves can be a source of trust for a country’s solvency. Central banks added 1,136 tonnes of Gold worth around $70 billion to their reserves in 2022, according to data from the World Gold Council. This is the highest yearly purchase since records began. Central banks from emerging economies such as China, India and Turkey are quickly increasing their Gold reserves.
Gold has an inverse correlation with the US Dollar and US Treasuries, which are both major reserve and safe-haven assets. When the Dollar depreciates, Gold tends to rise, enabling investors and central banks to diversify their assets in turbulent times. Gold is also inversely correlated with risk assets. A rally in the stock market tends to weaken Gold price, while sell-offs in riskier markets tend to favor the precious metal.
The price can move due to a wide range of factors. Geopolitical instability or fears of a deep recession can quickly make Gold price escalate due to its safe-haven status. As a yield-less asset, Gold tends to rise with lower interest rates, while higher cost of money usually weighs down on the yellow metal. Still, most moves depend on how the US Dollar (USD) behaves as the asset is priced in dollars (XAU/USD). A strong Dollar tends to keep the price of Gold controlled, whereas a weaker Dollar is likely to push Gold prices up.
Inflation expectations among Eurozone consumers declined from 3.0% in March to 2.9% in April for the next 12 months, the European Central Bank’s (ECB) monthly Consumer Expectation Survey showed on Tuesday.
Additional takeaways
“The year ahead inflation expectations hit the lowest level since September 2021. “
“Expectations for inflation three years out slipped to 2.4% from 2.5%, still far above the ECB's 2% target.”
"Younger respondents continued to report lower inflation expectations than older respondents, although there was a convergence of inflation perceptions across age groups."
“Income expectations remained unchanged while consumers were also less pessimistic about growth, predicting a 0.8% contraction in the next year versus a 1.1% drop seen a month earlier.”
“They also expected only a slight increase in unemployment, implying a broadly stable labor market.”
Market reaction
At the press time, EUR/USD is trimming gains to trade near 1.0865, as easing inflation expectations ramp up ECB June rate cut bets.
Euro PRICE Today
The table below shows the percentage change of Euro (EUR) against listed major currencies today. Euro was the strongest against the British Pound.
| USD | EUR | GBP | JPY | CAD | AUD | NZD | CHF | |
|---|---|---|---|---|---|---|---|---|
| USD | -0.10% | -0.00% | 0.00% | -0.04% | -0.07% | -0.20% | -0.19% | |
| EUR | 0.10% | 0.10% | 0.09% | 0.04% | 0.04% | -0.05% | -0.08% | |
| GBP | 0.00% | -0.10% | 0.00% | -0.06% | -0.05% | -0.15% | -0.19% | |
| JPY | 0.00% | -0.09% | 0.00% | -0.03% | -0.05% | -0.14% | -0.15% | |
| CAD | 0.04% | -0.04% | 0.06% | 0.03% | -0.03% | -0.12% | -0.15% | |
| AUD | 0.07% | -0.04% | 0.05% | 0.05% | 0.03% | -0.09% | -0.14% | |
| NZD | 0.20% | 0.05% | 0.15% | 0.14% | 0.12% | 0.09% | -0.03% | |
| CHF | 0.19% | 0.08% | 0.19% | 0.15% | 0.15% | 0.14% | 0.03% |
The heat map shows percentage changes of major currencies against each other. The base currency is picked from the left column, while the quote currency is picked from the top row. For example, if you pick the Euro from the left column and move along the horizontal line to the US Dollar, the percentage change displayed in the box will represent EUR (base)/USD (quote).
- The Mexican Peso edges lower on Tuesday as market sentiment dips on a variable global interest-rate outlook.
- Israel’s bombing of a tent camp in Rafah continues to keep tensions fraught in the region.
- MXN maintains a bullish long-term trend on the back of a higher interest-rate outlook.
The Mexican Peso (MXN) edges lower in its most heavily traded pairs on Tuesday as market sentiment ebbs on continuing uncertainty regarding the global interest-rate outlook whilst Israel’s actions in Rafah keep tensions alive in the Middle East. Asian stock markets closed lower, with the Shanghai Composite down 0.46%, the Nikkei 0.11% lower and the ASX200 closing 0.28% in the red.
USD/MXN is exchanging hands at 16.68 at the time of writing, EUR/MXN is trading at 18.14 and GBP/MXN at 21.30.
Mexican Peso edges lower as sentiment dips
The Mexican Peso trades marginally lower in its key pairs on Tuesday as the low volatility trading environment endures. Traders are mostly in waiting-and-see mode ahead of the week’s key release: April’s US Personal Consumption Expenditure (PCE) data – the US Federal Reserve's (Fed) preferred gauge of inflation – out on Friday.
Mexican Unemployment data for April is scheduled on Thursday and the Mexican Presidential elections are on Sunday. At the moment the Morena party candidate Claudia Sheinbaum is expected to succeed Manuel Lopez Obrador as President, maintaining the status quo.
Mexican Peso supported by interest rate differential
The Mexican Peso is in an overall bullish trend in its key pairs, helped by the interest rate differential between Mexico and its major counterparts. High interest rates of 11.00% in Mexico continue to favor the Peso, which benefits from investor inflows.
A recent Citibanamex survey showed most economists expected Banxico to cut interest rates in June. However, Banxico Deputy Governor Irene Espinosa recently said that interest rates should remain at their current level because of continued inflationary pressures. Mid-month May headline inflation in Mexico showed a rise to 4.78%, surpassing the previous month’s 4.63%, confirming persistent inflationary pressures, and backing up Espinosa’s hawkish views.
Technical Analysis: USD/MXN trades in a holding pattern
USD/MXN – or the number of Pesos that can be bought with one US Dollar – trades flat after breaking below the grey trendline of the recovery from the May 21 low. Despite the break, the new short-term uptrend remains intact and still favors longs over shorts.
USD/MXN 4-hour Chart
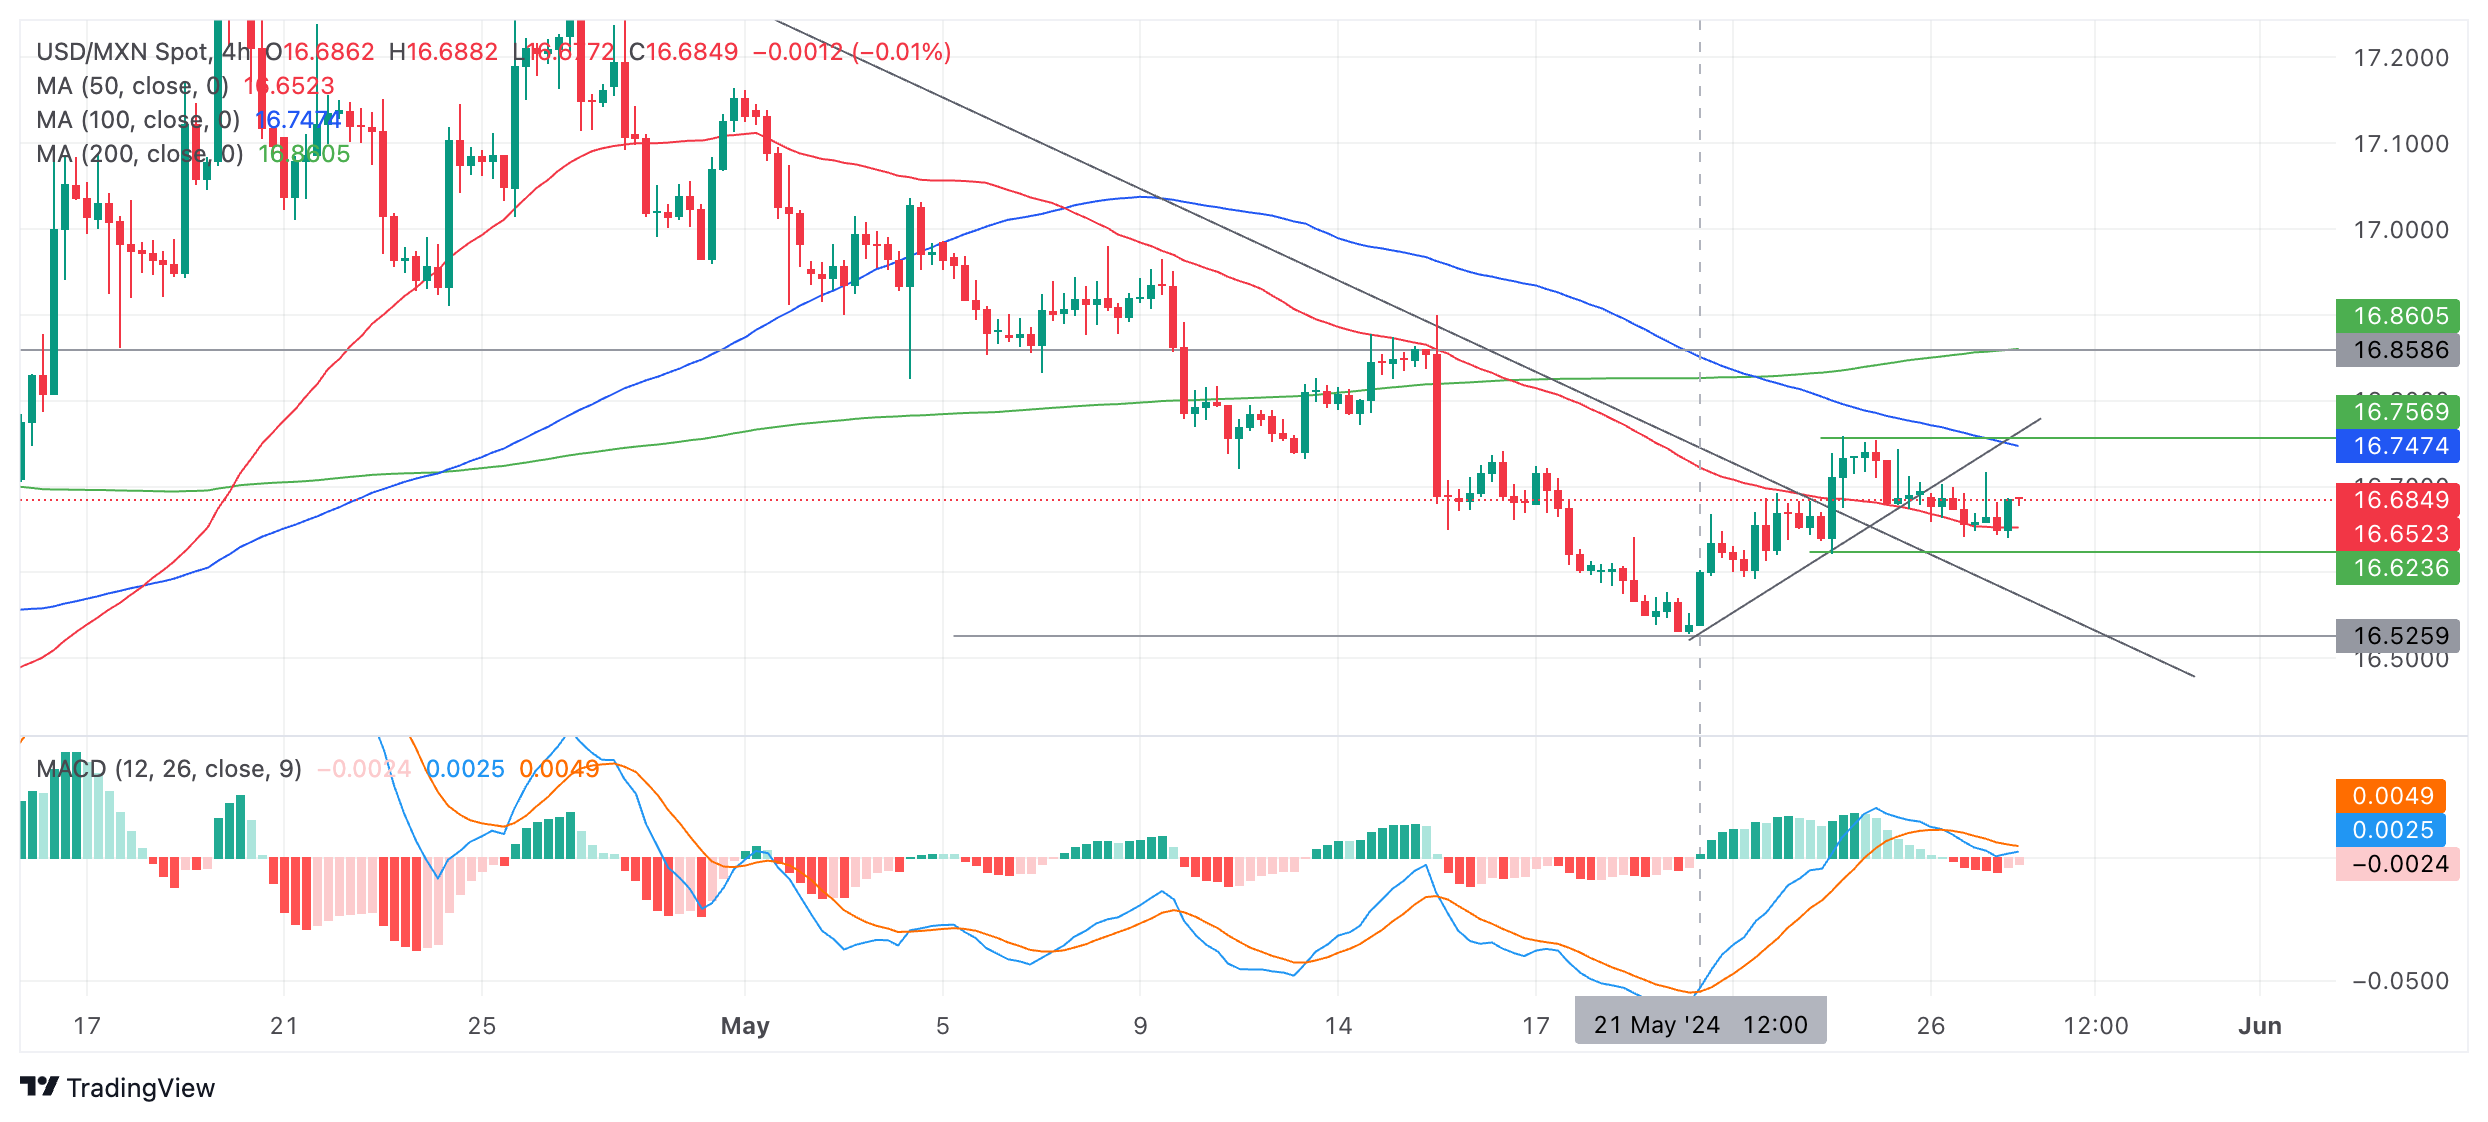
A break above the 16.76 (May 23 high) would probably confirm a continuation of the young uptrend to a possible target at the previous range lows around 16.85.
The Moving Average Convergence Divergence (MACD) indicator has crossed below its red signal line, giving a sell signal and possibly indicating further weakness. A break below the swing low at 16.62 could indicate a possible continuation down to the low of May 21 at 16.52.
Given that the medium and long-term trends are bearish, there also remains a risk of the pair continuing lower due to longer-term currents.
Mexican Peso FAQs
The Mexican Peso (MXN) is the most traded currency among its Latin American peers. Its value is broadly determined by the performance of the Mexican economy, the country’s central bank’s policy, the amount of foreign investment in the country and even the levels of remittances sent by Mexicans who live abroad, particularly in the United States. Geopolitical trends can also move MXN: for example, the process of nearshoring – or the decision by some firms to relocate manufacturing capacity and supply chains closer to their home countries – is also seen as a catalyst for the Mexican currency as the country is considered a key manufacturing hub in the American continent. Another catalyst for MXN is Oil prices as Mexico is a key exporter of the commodity.
The main objective of Mexico’s central bank, also known as Banxico, is to maintain inflation at low and stable levels (at or close to its target of 3%, the midpoint in a tolerance band of between 2% and 4%). To this end, the bank sets an appropriate level of interest rates. When inflation is too high, Banxico will attempt to tame it by raising interest rates, making it more expensive for households and businesses to borrow money, thus cooling demand and the overall economy. Higher interest rates are generally positive for the Mexican Peso (MXN) as they lead to higher yields, making the country a more attractive place for investors. On the contrary, lower interest rates tend to weaken MXN.
Macroeconomic data releases are key to assess the state of the economy and can have an impact on the Mexican Peso (MXN) valuation. A strong Mexican economy, based on high economic growth, low unemployment and high confidence is good for MXN. Not only does it attract more foreign investment but it may encourage the Bank of Mexico (Banxico) to increase interest rates, particularly if this strength comes together with elevated inflation. However, if economic data is weak, MXN is likely to depreciate.
As an emerging-market currency, the Mexican Peso (MXN) tends to strive during risk-on periods, or when investors perceive that broader market risks are low and thus are eager to engage with investments that carry a higher risk. Conversely, MXN tends to weaken at times of market turbulence or economic uncertainty as investors tend to sell higher-risk assets and flee to the more-stable safe havens.
- ECB’s Isabel Schnabel said that Quantitative Easing may have weakened the transmission of monetary policy during the recent tightening cycle.
- The annual inflation rate moderated to 2.3% in April, tempering expectations of a rate cut in June among investors.
- The Pound Sterling gains as the BoE expects to maintain higher rates for longer ahead of the general election in the UK.
EUR/GBP rebounds from the nine-month low of 0.8496 recorded on Monday, trading around 0.8520 during the European session on Tuesday. European Central Bank (ECB) Executive Board member Isabel Schnabel said at the 2024 BOJ-IMES Conference on Tuesday that Quantitative Easing (QE) may have weakened the transmission of monetary policy during the recent tightening cycle. In a bank-based economy, targeted longer-term refinancing operations can provide substantial support with a smaller footprint.
Investors are likely awaiting the inflation surveys due later in the day for cues on the ECB’s monetary policy outlook. Additionally, German Consumer Price Index (CPI) inflation figures are scheduled for release on Wednesday, with markets expecting Germany’s economy to grow by only 0.2% month-over-month (MoM) in May, compared to the previous 0.5%.
In the United Kingdom (UK), the annual inflation rate moderated to 2.3% in April, edging closer to the Bank of England's (BoE) target of 2%. This moderation has tempered expectations of a rate cut in June among investors, which could support the Pound Sterling (GBP) and undermine the EUR/GBP cross.
The Pound Sterling (GBP) gains momentum as traders anticipate that the Bank of England (BoE) will maintain its borrowing costs for longer to cool inflation. Moreover, UK Prime Minister Rishi Sunak called for general elections on July 4. Bloomberg reported on Friday that Citigroup strategist Jamie Searle said that the UK election in July will "further reduce the chance of a near-term BoE cut," adding that it lowers the risk of a later election interfering with the BoE cycle and allows the focus to remain on data-dependency.
Federal Reserve (Fed) Bank of Minneapolis President Neel Kashkari told CNBC on Tuesday that the Fed should wait for significant progress on inflation before lowering the policy rate, per Reuters.
Kashkari also reiterated that the central bank could potentially even hike interest rates if inflation fails to come down further.
Market reaction
These comments don't seem to be having a significant impact on the US Dollar's valuation against its major rivals. At the time of press, the US Dollar Index was down 0.1% on the day at 104.48.
- EUR/USD rises further to 1.0880 as the US Dollar extends its downside.
- The US Dollar weakens even though investors see the Fed returning to policy normalization in the last quarter of the year.
- ECB policymakers refuse to commit to more rate cuts after June.
EUR/USD posts a fresh weekly high at 1.0880 in Tuesday’s European session. The major currency pair strengthens amid soft US Dollar (USD) and deepening uncertainty over the pace at which the European Central Bank (ECB) will reduce key borrowing rates after the June meeting.
The US Dollar Index (DXY), which tracks the US Dollar’s value against six major currencies, extends its decline to 104.40. The US Dollar is facing the heat even though investors’ expectations for the Federal Reserve (Fed) reducing interest rates from the September meeting have faded significantly. The CME FedWatch tool shows that the probability of the Fed maintaining the current policy framework in September has increased to 50% compared with the roughly 35% seen a week before.
The strong United States (US) economic outlook and policymakers’ hawkish guidance on interest rates have forced traders to pare rate bets. This week, market speculation for Fed rate cuts will be guided by the core Personal Consumption Expenditure price index (PCE) data for April, which will be published on Friday. The core PCE inflation data, which is the Fed’s preferred inflation measure, is estimated to have remained steady on a monthly and annual basis.
Daily digest market movers: EUR/USD capitalizes on soft US Dollar
- EUR/USD extends its winning streak for the third trading day on Tuesday. The shared currency pair jumps to 1.0880 as debate over the path of rate cuts by the European Central Bank has deepened. The ECB is all set to deliver an interest rate cut in its monetary policy meeting on June 6, barring no surprise. Therefore, investors discuss how far and at what pace the ECB will ease its monetary policy after June.
- ECB policymakers refuse to commit to any pre-defined rate-cut path and prefer to remain data-dependent. Meanwhile, market speculation for ECB rate cuts for the entire year has also been impacted as a few policymakers have warned that the adaptation of an aggressive policy easing could revamp price pressures again. Investors now expect that the ECB will lower key borrowing costs one more time after June. A week ago, investors were expecting three rate cuts in 2024 while expecting six rate cuts at the beginning of the year.
- On Monday, ECB policymaker and Governor of the French central bank François Villeroy de Galhau said in an interview with German newspaper Boersen Zeitung that the June rate cut is a done deal and discussions are about how far and fast interest rates will come down. Villeroy pushed back suggestions of one rate cut each quarter and said: "I don't say that we should commit already in July, but let us keep our freedom on the timing and pace."
- On the same day, ECB Chief economist Philip Lane said in a speech in Dublin that the pace at which interest rates will be reduced depends on the strength of the underlying inflation demand, Reuters reported. The absence of upward surprises in inflation and demand will allow the ECB to deploy an aggressive rate-cut approach, while upside risks to inflation and demand would force the ECB to ease interest rates gradually.
- This week, the major trigger for the Euro’s price action will be the Eurozone preliminary inflation data for May, which will be published on Friday. The inflation data will provide fresh cues about whether the ECB will extend the rate-cut spell to July. But before that, investors will focus on the preliminary May inflation reading for Germany, which will be released on Wednesday. Monthly headline and harmonized inflation is expected to have grown at a slower rate by 0.2%. The annual headline inflation is estimated to have accelerated to 2.7% from 2.4% in April.
Technical Analysis: EUR/USD prints a fresh weekly high at 1.0880
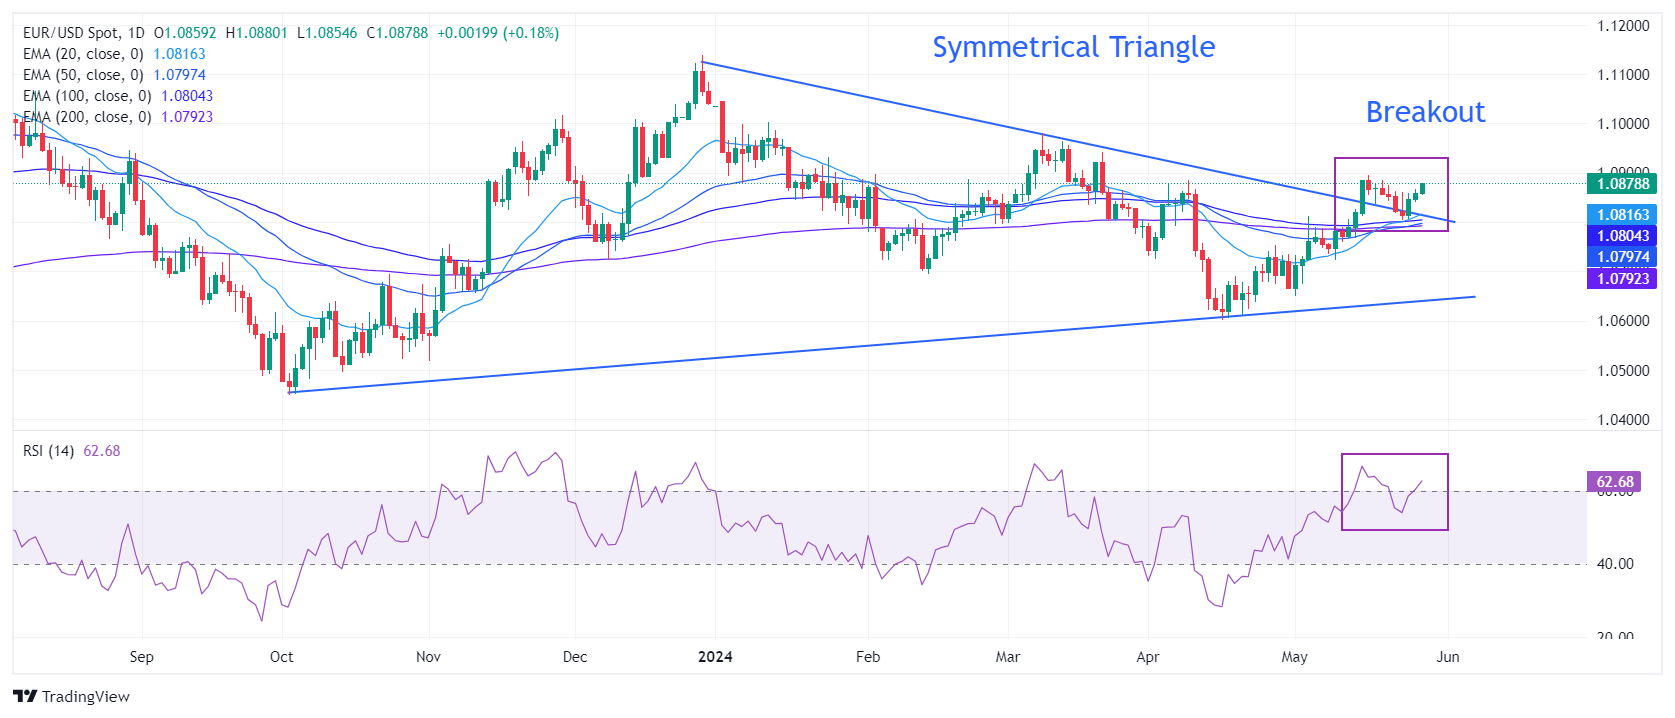
EUR/USD climbs to 1.0880 ahead of crucial Eurozone/US inflation data. The major currency pair indicates broader strength as it firmly holds the breakout of the Symmetrical Triangle chart pattern formed on a daily timeframe.
The shared currency pair’s near-term outlook remains firm as it trades well above all short-to-long-term Exponential Moving Averages (EMAs).
The 14-period Relative Strength Index (RSI) has slipped into the 40.00-60.00 range, suggesting that the momentum, which was leaned toward the upside, has faded for now.
The major currency pair is likely to recapture a two-month high around 1.0900. A decisive break above this level would drive the asset towards the March 21 high at around 1.0950 and the psychological resistance of 1.1000. However, a downside move below the 200-day EMA at 1.0800 could push it further down.
Euro FAQs
The Euro is the currency for the 20 European Union countries that belong to the Eurozone. It is the second most heavily traded currency in the world behind the US Dollar. In 2022, it accounted for 31% of all foreign exchange transactions, with an average daily turnover of over $2.2 trillion a day. EUR/USD is the most heavily traded currency pair in the world, accounting for an estimated 30% off all transactions, followed by EUR/JPY (4%), EUR/GBP (3%) and EUR/AUD (2%).
The European Central Bank (ECB) in Frankfurt, Germany, is the reserve bank for the Eurozone. The ECB sets interest rates and manages monetary policy. The ECB’s primary mandate is to maintain price stability, which means either controlling inflation or stimulating growth. Its primary tool is the raising or lowering of interest rates. Relatively high interest rates – or the expectation of higher rates – will usually benefit the Euro and vice versa. The ECB Governing Council makes monetary policy decisions at meetings held eight times a year. Decisions are made by heads of the Eurozone national banks and six permanent members, including the President of the ECB, Christine Lagarde.
Eurozone inflation data, measured by the Harmonized Index of Consumer Prices (HICP), is an important econometric for the Euro. If inflation rises more than expected, especially if above the ECB’s 2% target, it obliges the ECB to raise interest rates to bring it back under control. Relatively high interest rates compared to its counterparts will usually benefit the Euro, as it makes the region more attractive as a place for global investors to park their money.
Data releases gauge the health of the economy and can impact on the Euro. Indicators such as GDP, Manufacturing and Services PMIs, employment, and consumer sentiment surveys can all influence the direction of the single currency. A strong economy is good for the Euro. Not only does it attract more foreign investment but it may encourage the ECB to put up interest rates, which will directly strengthen the Euro. Otherwise, if economic data is weak, the Euro is likely to fall. Economic data for the four largest economies in the euro area (Germany, France, Italy and Spain) are especially significant, as they account for 75% of the Eurozone’s economy.
Another significant data release for the Euro is the Trade Balance. This indicator measures the difference between what a country earns from its exports and what it spends on imports over a given period. If a country produces highly sought after exports then its currency will gain in value purely from the extra demand created from foreign buyers seeking to purchase these goods. Therefore, a positive net Trade Balance strengthens a currency and vice versa for a negative balance.
- Silver price edges lower as investors adopt caution ahead of looming US PCE Inflation.
- The hawkish sentiment surrounding the Fed’s stance on maintaining higher interest rates weakens non-yielding assets like Silver.
- The escalated situation in the Middle East could provide some support for safe-haven assets like Silver.
Silver prices edged lower to near $31.40 per troy ounce during the early European session on Tuesday. The grey metal is struggling due to market caution ahead of the Federal Reserve's preferred measure of inflation, the Core Personal Consumption Expenditures (PCE) Price Index data, which is due on Friday. This data is crucial for assessing future US monetary policy. The US Core PCE is expected to show an increase of 0.3% month-over-month and 2.8% year-over-year in April.
Non-yielding assets like Silver are under pressure due to the hawkish sentiment surrounding the US Federal Reserve (Fed), which is committed to maintaining higher interest rates for an extended period. Last week, Fed officials tempered expectations for rate cuts, cautioning that the central bank still needs more evidence that inflation will eventually decline to its 2% annual target.
However, the decline in the US Dollar (USD) could help Silver attract buyers, as it becomes cheaper for investors and consumers using other currencies. This increased affordability can lead to higher demand for silver from overseas buyers, driving up its price.
Additionally, escalated geopolitical tensions in the Middle East could provide some support to the safe-haven Silver. Reuters reported on Sunday that an Israeli strike in the Gazan city of Rafah caused a fire that killed 45 people, triggering further outcry from international delegations and sustaining geopolitical risks that favor higher crude oil prices. Such geopolitical uncertainties often lead investors to seek safe-haven assets like Silver, which can further boost its price.
Here is what you need to know on Tuesday, May 28:
The US Dollar (USD) is having a hard time finding demand early Tuesday after weakening modestly against its major rivals on Monday. Housing Price Index for March, Conference Board's Consumer Confidence Index and Dallas Fed Manufacturing Business Index for May will be featured in the US economic calendar later in the day. Several Federal Reserve (Fed) policymakers are scheduled to deliver speeches during the American trading hours.
The USD Index edged lower in the second half of the day on Monday and closed the day in negative territory. Following a three-day holiday, the benchmark 10-year US Treasury bond yield declines slightly early Tuesday and US stock index futures trade marginally higher on the day.
US Dollar PRICE This week
The table below shows the percentage change of US Dollar (USD) against listed major currencies this week. US Dollar was the weakest against the New Zealand Dollar.
| USD | EUR | GBP | JPY | CAD | AUD | NZD | CHF | |
|---|---|---|---|---|---|---|---|---|
| USD | -0.27% | -0.29% | -0.09% | -0.31% | -0.48% | -0.77% | -0.28% | |
| EUR | 0.27% | -0.04% | 0.20% | -0.02% | -0.28% | -0.60% | 0.04% | |
| GBP | 0.29% | 0.04% | 0.20% | -0.02% | -0.23% | -0.48% | 0.03% | |
| JPY | 0.09% | -0.20% | -0.20% | -0.26% | -0.42% | -0.61% | -0.22% | |
| CAD | 0.31% | 0.02% | 0.02% | 0.26% | -0.19% | -0.46% | -0.03% | |
| AUD | 0.48% | 0.28% | 0.23% | 0.42% | 0.19% | -0.23% | 0.27% | |
| NZD | 0.77% | 0.60% | 0.48% | 0.61% | 0.46% | 0.23% | 0.48% | |
| CHF | 0.28% | -0.04% | -0.03% | 0.22% | 0.03% | -0.27% | -0.48% |
The heat map shows percentage changes of major currencies against each other. The base currency is picked from the left column, while the quote currency is picked from the top row. For example, if you pick the US Dollar from the left column and move along the horizontal line to the Japanese Yen, the percentage change displayed in the box will represent USD (base)/JPY (quote).
The data from Japan showed that the Corporate Service Price Index rose 2.8% on a yearly basis in April, following the 2.4% increase recorded in March. Additionally, Japan's Weighted Median Inflation Index, a key measure of the country’s trend inflation, rose 1.1% in April, slowing from a 1.3% increase in March. USD/JPY showed no reaction to these figures and was last seen moving sideways slightly below 157.00.
Japanese Yen receives pressure after Japan's Weighted Median Inflation shows slowdown.
Following a quiet European session, EUR/USD stretched higher in the American trading hours on Monday and ended the day in positive territory. The pair holds its ground early Tuesday and was last seen trading above 1.0870.
GBP/USD gained 0.25% on Monday and advanced toward 1.2800 early Tuesday, reaching its highest level in two months. The pair stays relatively quiet and fluctuates at around 1.2780 to being the European session.
Gold staged a decisive rebound and rose nearly 1% on Monday. XAU/USD, however, seems to be struggling to preserve its recovery momentum, trading in the red below $2,350 early Tuesday.
Gold price rebounds on weaker US Dollar, investors await US key data.
The Australian Bureau of Statistics reported on Tuesday that Retail Sales rose 0.1% on a monthly basis in April. This reading followed the 0.4% decline recorded in March and came in below the market expectation for an increase of 0.2%. After closing in positive territory on Monday, AUD/USD entered a consolidation phase above 0.6650 on Tuesday.
Australian Dollar rises amid subdued US Dollar ahead of looming US PCE.
Economic Indicator
Consumer Confidence
The Consumer Confidence index, released on a monthly basis by the Conference Board, is a survey gauging sentiment among consumers in the United States, reflecting prevailing business conditions and likely developments for the months ahead. The report details consumer attitudes, buying intentions, vacation plans and consumer expectations for inflation, labor market, stock prices and interest rates. The data shows a picture of whether or not consumers are willing to spend money, a key factor as consumer spending is a major driver of the US economy. Generally, a high reading is bullish for the US Dollar (USD), while a low reading is bearish. Note: Because of restrictions from the Conference Board, FXStreet Economic Calendar does not provide this indicator's figures.
Read more.Last release: Tue Apr 30, 2024 14:00
Frequency: Monthly
Actual: -
Consensus: -
Previous: -
Source: Conference Board
- USD/CHF edges lower to 0.9120 in Tuesday’s early European session.
- The Fed’s officials remain cautious as inflation remains sticky above the 2% target.
- The cautious mood and the Middle East geopolitical risks boost traditional safe-haven currencies like the CHF.
The USD/CHF pair weakens to 0.9120 during the early European session on Tuesday. The selling pressure of the Greenback drags the pair lower. Meanwhile, the cautious mood in the market remains to underpin the Swiss Franc (CHF) ahead of the Gross Domestic Product (GDP) data from Switzerland and the US, which are due on Thursday.
The hawkish tone from Federal Reserve (Fed) officials in the minutes of the recent meeting, hotter-than-expected US inflation data, and stronger PMI data have triggered speculation that the US central bank will delay interest rate cuts this year. Financial markets have priced in nearly a 50% odds that the Fed will hold rates in September, according to the CME FedWatch tool. Inflation in the US remains sticky, and Fed policymakers emphasized the need to hold rates higher-for-longer to gain confidence that inflation will move towards the 2% target. This, in turn, might lift the Greenback for the time being and create a tailwind for USD/CHF.
Investors will closely watch the release of the Personal Consumption Expenditures (PCE) index on Friday for fresh impetus. The US headline PCE is expected to show an increase of 0.3% MoM and 2.7% YoY in April. The Core PCE, the Fed’s preferred inflation gauge, is projected to show a rise of 0.3% MoM and 2.8% YoY in April. The hotter inflation data might further underpin the USD against the CHF.
On the Swiss front, the cautious mood and the ongoing geopolitical tensions in the Middle East might boost safe-haven flows and support the CHF. Gazan officials reported on Monday that an Israeli airstrike triggered a fire that killed 45 people in a tent camp in the Gazan city of Rafah. Global leaders called for the implementation of a World Court order to halt Israel's attacks, per Reuters. Apart from this, the Swiss GDP number is estimated to expand 0.3% QoQ in Q1, while the annual GDP is forecast to grow 0.1% in Q1. The upbeat reading could further lift the CHF in the near term.
FX option expiries for May 28 NY cut at 10:00 Eastern Time, via DTCC, can be found below
- EUR/USD: EUR amounts
- 1.0670 459m
- 1.0800 403m
- 1.0860 719m
- 1.0875 743m
- 1.0900 1.3b
- 1.0910 1.2b
- USD/JPY: USD amounts
- 155.50 1.1b
- 156.00 670m
- 158.00 600m
- USD/CHF: USD amounts
- 0.9050 800m
- AUD/USD: AUD amounts
- 0.6650 933m
- 0.6725 523m
Japan's Weighted Median Inflation Index, a key measure of the country’s trend inflation, rose 1.1% in April, slowing from a 1.3% increase in March, the latest data published by the Bank of Japan (BoJ) showed on Tuesday.
The data is amongst the indicators closely watched as a gauge of whether price rises are broadening.
Meanwhile, the central bank’s three key measurements of underlying inflation all fell below 2% in April for the first time since August 2022, data showed.
Market reaction
As the disinflationary trend gathers steam, it raises doubts about the timing of the BoJ’s next interest rate hike. At the time of writing, USD/JPY is off the lows, trading near 156.75, still down 0.08% so far.
Bank of Japan FAQs
The Bank of Japan (BoJ) is the Japanese central bank, which sets monetary policy in the country. Its mandate is to issue banknotes and carry out currency and monetary control to ensure price stability, which means an inflation target of around 2%.
The Bank of Japan has embarked in an ultra-loose monetary policy since 2013 in order to stimulate the economy and fuel inflation amid a low-inflationary environment. The bank’s policy is based on Quantitative and Qualitative Easing (QQE), or printing notes to buy assets such as government or corporate bonds to provide liquidity. In 2016, the bank doubled down on its strategy and further loosened policy by first introducing negative interest rates and then directly controlling the yield of its 10-year government bonds.
The Bank’s massive stimulus has caused the Yen to depreciate against its main currency peers. This process has exacerbated more recently due to an increasing policy divergence between the Bank of Japan and other main central banks, which have opted to increase interest rates sharply to fight decades-high levels of inflation. The BoJ’s policy of holding down rates has led to a widening differential with other currencies, dragging down the value of the Yen.
A weaker Yen and the spike in global energy prices have led to an increase in Japanese inflation, which has exceeded the BoJ’s 2% target. Still, the Bank judges that the sustainable and stable achievement of the 2% target has not yet come in sight, so any sudden change in the current policy looks unlikely.
- USD/CAD edges down to 1.3600 as the US Dollar’s appeal is uncertain.
- US core PCE Price Index is projected to have grown steadily in April.
- Canada’s weak household spending and consistently easing price pressures prompt BoC rate-cut prospects.
The USD/CAD pair drops further to near the round-level support of 1.3600 in Tuesday’s Asian session. The Loonie asset is under pressure as the US Dollar (USD) weakens even though traders seethe Federal Reserve (Fed) keeping interest rates steady in the September meeting.
The market sentiment is upbeat despite the fact that rate-cuts from the Fed has been delayed. S&P 500 futures have posted some decent gains in the Tokyo session. The US Dollar Index (DXY), which tracks the Greenback’s value against six major currencies, has extended its losing spell for the third trading session on Tuesday and has dropped to near 104.40.
10-year US Treasury yields falls further to 4.64% even though market speculation for Fed rate cuts in September has diminished. Historically, the scenario is favorable for yields on interest-bearing assets but they still struggle for a firm footing.
Going forward, the US Dollar will be guided by the United States (US) core Personal Consumption Expenditure Price Index (PCE) data for April, which will be published on Friday. The Fed’s preferred inflation measure is estimated to have grown steadily on monthly and annual basis at 0.3% and 2.8%, respectively. This would weaken the case of Fed rate cuts in September further.
Meanwhile, the Canadian Dollar is capitalizing on upbeat market sentiment. Th near-term outlook of the Canadian Dollar is uncertain as investors expect that the Bank of Canada (BoC) will start reducing interest rates from the June meeting.
Risks of Canada’s inflation remaining persistent have eased due to weak consumer spending and dismal economic outlook, prompting bets favoring rate cuts in June. This week, investors will focus on the Q1 Gross Domestic Product (GDP) data, which will indicate the economic health of Canada.
European Central Bank (ECB) policymaker Isabel Schnabel said on Tuesday that “QE may have weakened the transmission of monetary policy during the recent tightening cycle.”
“In a bank-based economy targeted longer-term refinancing operations can provide substantial support with a smaller footprint,” she added.
Market reaction
EUR/USD is trading 0.18% higher on the day at 1.0877, as of writing.
Euro PRICE Today
The table below shows the percentage change of Euro (EUR) against listed major currencies today. Euro was the strongest against the US Dollar.
| USD | EUR | GBP | JPY | CAD | AUD | NZD | CHF | |
|---|---|---|---|---|---|---|---|---|
| USD | -0.17% | -0.08% | -0.13% | -0.10% | -0.24% | -0.21% | -0.18% | |
| EUR | 0.17% | 0.09% | 0.03% | 0.05% | -0.07% | -0.00% | -0.02% | |
| GBP | 0.08% | -0.09% | -0.04% | -0.03% | -0.14% | -0.09% | -0.11% | |
| JPY | 0.13% | -0.03% | 0.04% | 0.04% | -0.09% | -0.03% | -0.02% | |
| CAD | 0.10% | -0.05% | 0.03% | -0.04% | -0.14% | -0.07% | -0.08% | |
| AUD | 0.24% | 0.07% | 0.14% | 0.09% | 0.14% | 0.06% | 0.03% | |
| NZD | 0.21% | 0.00% | 0.09% | 0.03% | 0.07% | -0.06% | -0.01% | |
| CHF | 0.18% | 0.02% | 0.11% | 0.02% | 0.08% | -0.03% | 0.00% |
The heat map shows percentage changes of major currencies against each other. The base currency is picked from the left column, while the quote currency is picked from the top row. For example, if you pick the Euro from the left column and move along the horizontal line to the US Dollar, the percentage change displayed in the box will represent EUR (base)/USD (quote).
Cleveland Federal Reserve President Loretta Mester participated in a panel discussion titled "Policy Panel Discussion" at the Bank of Japan (BoJ) - Institute for Monetary and Economic Studies, in Tokyo, on Tuesday.
Key quotes
Would be preferable for FOMC statements to use more words to describe current assessment of economy, how that influences the outlook, and the risks to that outlook.
Scenario analysis should also be incorporated as a standard part of Fed communications.
Would like Fed to publish anonymized matrix of economic and policy projections so market participants can see linkage between each participant’s outlook and their view of appropriate policy associated with that outlook.
Expect the Fed will consider communications as part of its next monetary policy framework review.
Market reaction
The US Dollar Index was last seen trading at 104.43, down 0.16% on the day. These comments fail to have any market impact.
Federal Reserve (Fed) Governor Michelle Bowman participated in a panel discussion titled "Policy Panel Discussion" at the Bank of Japan (BoJ) - Institute for Monetary and Economic Studies, in Tokyo, on Tuesday.
Key quotes
Would have supported either waiting to slow QT pace or a more tapered slowing in balance sheet run off.
'In my view' bank reserves are not yet near 'ample' levels given still-sizable take-up of on-RRP.
Important to keep reducing balance sheet size to reach ample reserves as soon as possible and while economy is strong.
Important to communicate any change to run-off rate do not reflect a change in Fed's monetary policy stance .
'Strongly' supports principle of balance sheet holdings primarily being composed of treasuries.
A longer-run balance sheet 'tilted slightly' toward shorter maturities would allow flexibility in approach.
In future, when Fed conducts QE to restore market functioning or financial stability it should communicate that purchases will be temporary and unwound when market conditions have normalized.
FOMC would have benefited from earlier decision to taper and end QE in 2021; would have allowed earlier rate hikes.
Market reaction
The US Dollar Index pays little heed to these above comments, keeping its range near 104.50, down 0.15% on the day.
- The Japanese Yen gained ground amid improvement in Japan’s Services PPI released on Tuesday.
- Japan’s Corporate Service Price Index posted a reading of 2.8% YoY in April, marking its fastest increase since March 2015.
- The decline in US Treasury yields put pressure on the US Dollar.
The Japanese Yen (JPY) continues to strengthen for the second consecutive day on Tuesday, drawing support from Japan’s Corporate Service Price Index (CSPI). The index posted a year-over-year reading of 2.8% in April, surpassing expectations of 2.3% and marking its fastest rate of increase since March 2015.
The Japanese Yen could have received some support following remarks from Japan Finance Minister Shun'ichi Suzuki on Tuesday, suggesting a potential for verbal intervention. Suzuki emphasized the importance of currencies moving in a stable manner that reflects fundamentals, stating that he is closely monitoring foreign exchange (FX) movements. However, he refrained from commenting on whether Japan has conducted currency intervention.
The US Dollar (USD) continues to lose ground following the decline in the US Treasury yields. Traders are likely to await the Federal Reserve's preferred measure of inflation, the Personal Consumption Expenditures (PCE) Price Index data, which is due on Friday, to assess future US monetary policy.
Daily Digest Market Movers: Japanese Yen extends gains on remarks from BoJ officials
- The 2024 BOJ-IMES Conference continues on Tuesday. Scheduled speakers include US Federal Reserve (Fed) officials such as Fed Governor Michelle Bowman and Cleveland Fed President Loretta Mester.
- The Japanese Yen gained strength from the comments from Bank of Japan (BoJ) officials on Monday. BoJ Governor Kazuo Ueda remarked that progress has been made in moving away from zero and raising inflation expectations, but there is a need to re-anchor them, this time at the 2% target.
- Additionally, BoJ Deputy Governor Shinichi Uchida stated that they have reverted to a conventional monetary policy framework, with the objective of achieving a 2% price stability target through adjustments of the short-term policy rate. Uchida also said that they have successfully navigated past the zero-lower bound.
- The Japanese Cabinet Office stated in its report on Monday that the government maintained its view on the economy unchanged for the third consecutive month in May. It noted that the Japanese economy continues to recover at a moderate pace, although there are signs of a recent pause in growth.
- UoM 5-year Consumer Inflation Expectations eased slightly to 3.0%, falling below the forecasted 3.1%. Despite the upward revision of the Consumer Sentiment Index to 69.1 from a preliminary reading of 67.4, it still indicated the lowest level in six months. These figures likely bolstered investors’ sentiment regarding potential rate cuts by the Federal Reserve.
- Japan’s National Consumer Price Index (CPI) dropped to 2.5% YoY in April from 2.7% in the previous month, marking the second consecutive month of moderation but still staying above the Bank of Japan’s (BoJ) 2% target. This sustained inflationary trend exerts pressure on the central bank to contemplate policy tightening.
Technical Analysis: USD/JPY maintains its position above 156.50
The USD/JPY pair trades around 156.70 on Tuesday. The daily chart shows a rising wedge pattern, indicating a potential bearish reversal as the pair approaches the wedge's apex. However, the 14-day Relative Strength Index (RSI) remains slightly above 50, still maintaining a bullish bias.
The pair might test the upper boundary of the rising wedge around 157.45. If it surpasses this level, the next target could be 160.32, representing its highest point in over thirty years.
On the downside, the nine-day Exponential Moving Average (EMA) at 156.48 serves as immediate support, followed by the lower edge of the rising wedge and the psychological level of 156.00. A breach of these levels could exert downward pressure on the USD/JPY pair, potentially leading it towards the throwback support at 151.86.
USD/JPY: Daily Chart
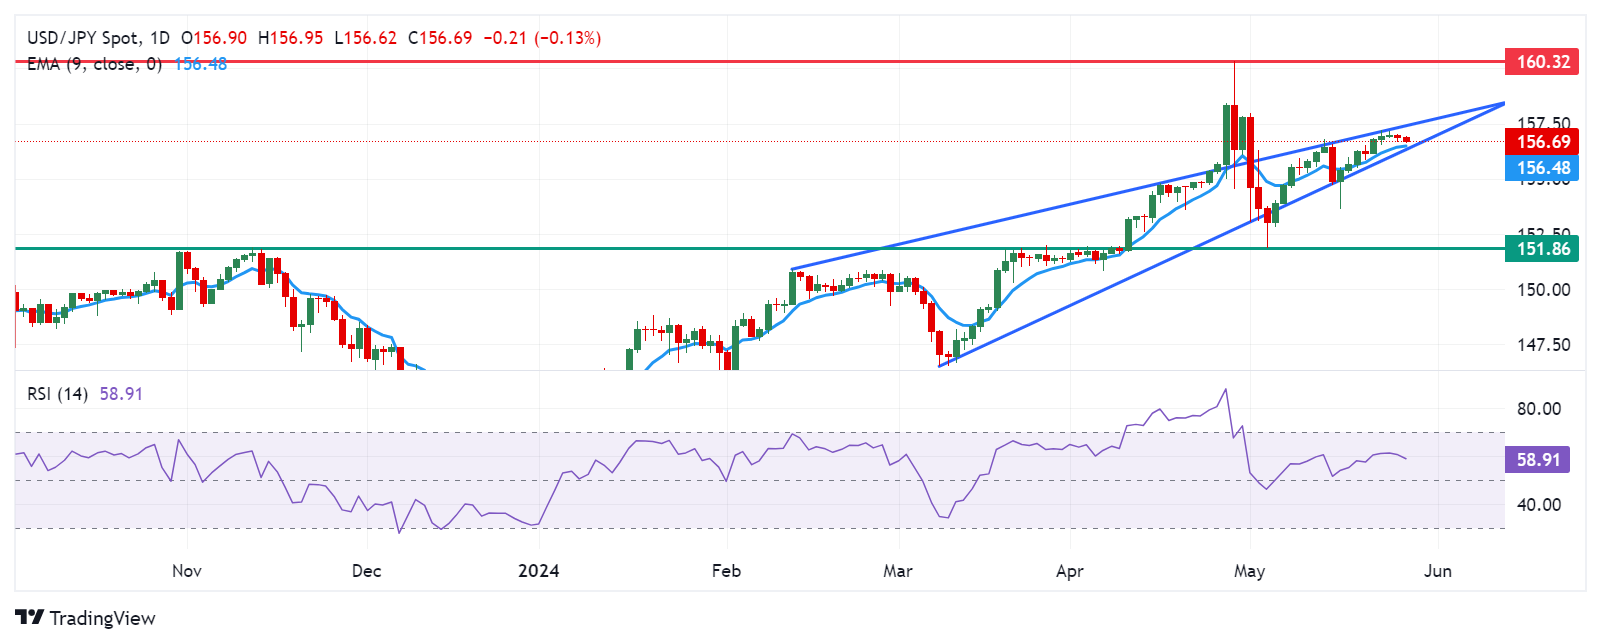
Japanese Yen price today
The table below shows the percentage change of the Japanese Yen (JPY) against listed major currencies today. Japanese Yen was the strongest against the US Dollar.
| USD | EUR | GBP | CAD | AUD | JPY | NZD | CHF | |
| USD | -0.16% | -0.08% | -0.08% | -0.25% | -0.11% | -0.14% | -0.18% | |
| EUR | 0.16% | 0.08% | 0.07% | -0.07% | 0.05% | 0.01% | 0.00% | |
| GBP | 0.08% | -0.08% | -0.01% | -0.18% | -0.02% | -0.07% | -0.08% | |
| CAD | 0.08% | -0.07% | -0.01% | -0.17% | 0.00% | -0.04% | -0.06% | |
| AUD | 0.25% | 0.07% | 0.16% | 0.17% | 0.15% | 0.11% | 0.10% | |
| JPY | 0.10% | -0.04% | 0.02% | 0.00% | -0.15% | -0.04% | -0.05% | |
| NZD | 0.15% | -0.01% | 0.07% | 0.07% | -0.08% | 0.04% | -0.01% | |
| CHF | 0.15% | -0.01% | 0.07% | 0.07% | -0.08% | 0.05% | 0.01% |
The heat map shows percentage changes of major currencies against each other. The base currency is picked from the left column, while the quote currency is picked from the top row. For example, if you pick the Euro from the left column and move along the horizontal line to the Japanese Yen, the percentage change displayed in the box will represent EUR (base)/JPY (quote).
Japanese Yen FAQs
The Japanese Yen (JPY) is one of the world’s most traded currencies. Its value is broadly determined by the performance of the Japanese economy, but more specifically by the Bank of Japan’s policy, the differential between Japanese and US bond yields, or risk sentiment among traders, among other factors.
One of the Bank of Japan’s mandates is currency control, so its moves are key for the Yen. The BoJ has directly intervened in currency markets sometimes, generally to lower the value of the Yen, although it refrains from doing it often due to political concerns of its main trading partners. The current BoJ ultra-loose monetary policy, based on massive stimulus to the economy, has caused the Yen to depreciate against its main currency peers. This process has exacerbated more recently due to an increasing policy divergence between the Bank of Japan and other main central banks, which have opted to increase interest rates sharply to fight decades-high levels of inflation.
The BoJ’s stance of sticking to ultra-loose monetary policy has led to a widening policy divergence with other central banks, particularly with the US Federal Reserve. This supports a widening of the differential between the 10-year US and Japanese bonds, which favors the US Dollar against the Japanese Yen.
The Japanese Yen is often seen as a safe-haven investment. This means that in times of market stress, investors are more likely to put their money in the Japanese currency due to its supposed reliability and stability. Turbulent times are likely to strengthen the Yen’s value against other currencies seen as more risky to invest in.
- Indian Rupee holds positive ground on Tuesday.
- The weaker USD and foreign flows into Indian equities created a headwind for USD/INR.
- Traders await India’s Q4 GDP and US PCE inflation data, which are due on Friday.
Indian Rupee (INR) trades in positive territory on Tuesday on a softer US dollar (USD). The appreciation of the INR is backed by a positive trend in domestic equities, with the country’s benchmark indices reaching new peaks. Foreign flows into Indian equities are expected to be a significant driver for the INR this week as investors await the outcome of India's general elections on June 4.
Investors will closely monitor the release of India’s Gross Domestic Product (GDP) for the fourth quarter of 2023 on Friday, which is estimated to moderate to 6.7% in Q4 from the previous reading of 8.4%. In case of weaker-than-expected growth, this could exert some pressure on the Indian Rupee. On the US docket, the final reading of the Personal Consumption Expenditures Price Index (PCE) for April will be in the spotlight on Friday. The hotter-than-expected PCE inflation data could lower the expectation of Fed rate cuts and boost the Greenback.
Daily Digest Market Movers: Indian Rupee remains firm due to strong foreign inflows into Indian equities
- Indian equity indices registered strong gains, with BSE Sensex and Nifty 50 hitting fresh record highs but ended the session in the red.
- Despite negative foreign fund flows in most emerging markets, India continues to attract large investments, owing to strong ETF inflows and positive investor sentiment, according to a research by Kotak Institutional Equities (KIE).
- India's economy is likely to grow at its slowest pace in a year in the first quarter due to weak demand, according to a Reuters poll.
- Gazan officials said on Monday that an Israeli airstrike triggered a fire that killed 45 people in a tent camp in the Gazan city of Rafah. Global leaders called for the implementation of a World Court order to halt Israel's attacks, per Reuters.
- Investors are now pricing in 34 basis points (bps) of the Federal Reserve (Fed) rate cut over 2024, down from nearly 50 bps of cuts expected earlier this month.
- The US Core Personal Consumption Expenditures Price Index (Core PCE), is estimated to show an increase of 0.3% MoM and 2.8% YoY in April.
Technical analysis: USD/INR turns bearish on the daily chart
The Indian Rupee trades stronger on the day. The USD/INR pair resumes a bearish outlook after breaking below the neckline of the Head and Shoulders pattern last week. The path of least resistance is to the downside as the pair holds below the key 100-day Exponential Moving Average (EMA) on the daily chart, and the 14-day Relative Strength Index (RSI) stands in bearish territory around 37.80.
The potential upside barrier for USD/INR will emerge near the support-turned-resistance level and the 100-day EMA at 83.20. Sustained rallies could expose a high of May 13 at 83.54 en route to a high of April 17 at 83.72, and then the 84.00 psychological level.
On the downside, a decisive break below the 83.00 round mark could drag the pair to the next downside target near a low of January 15 at 82.78. The additional downside filter to watch is a low of March 11 at 82.65.
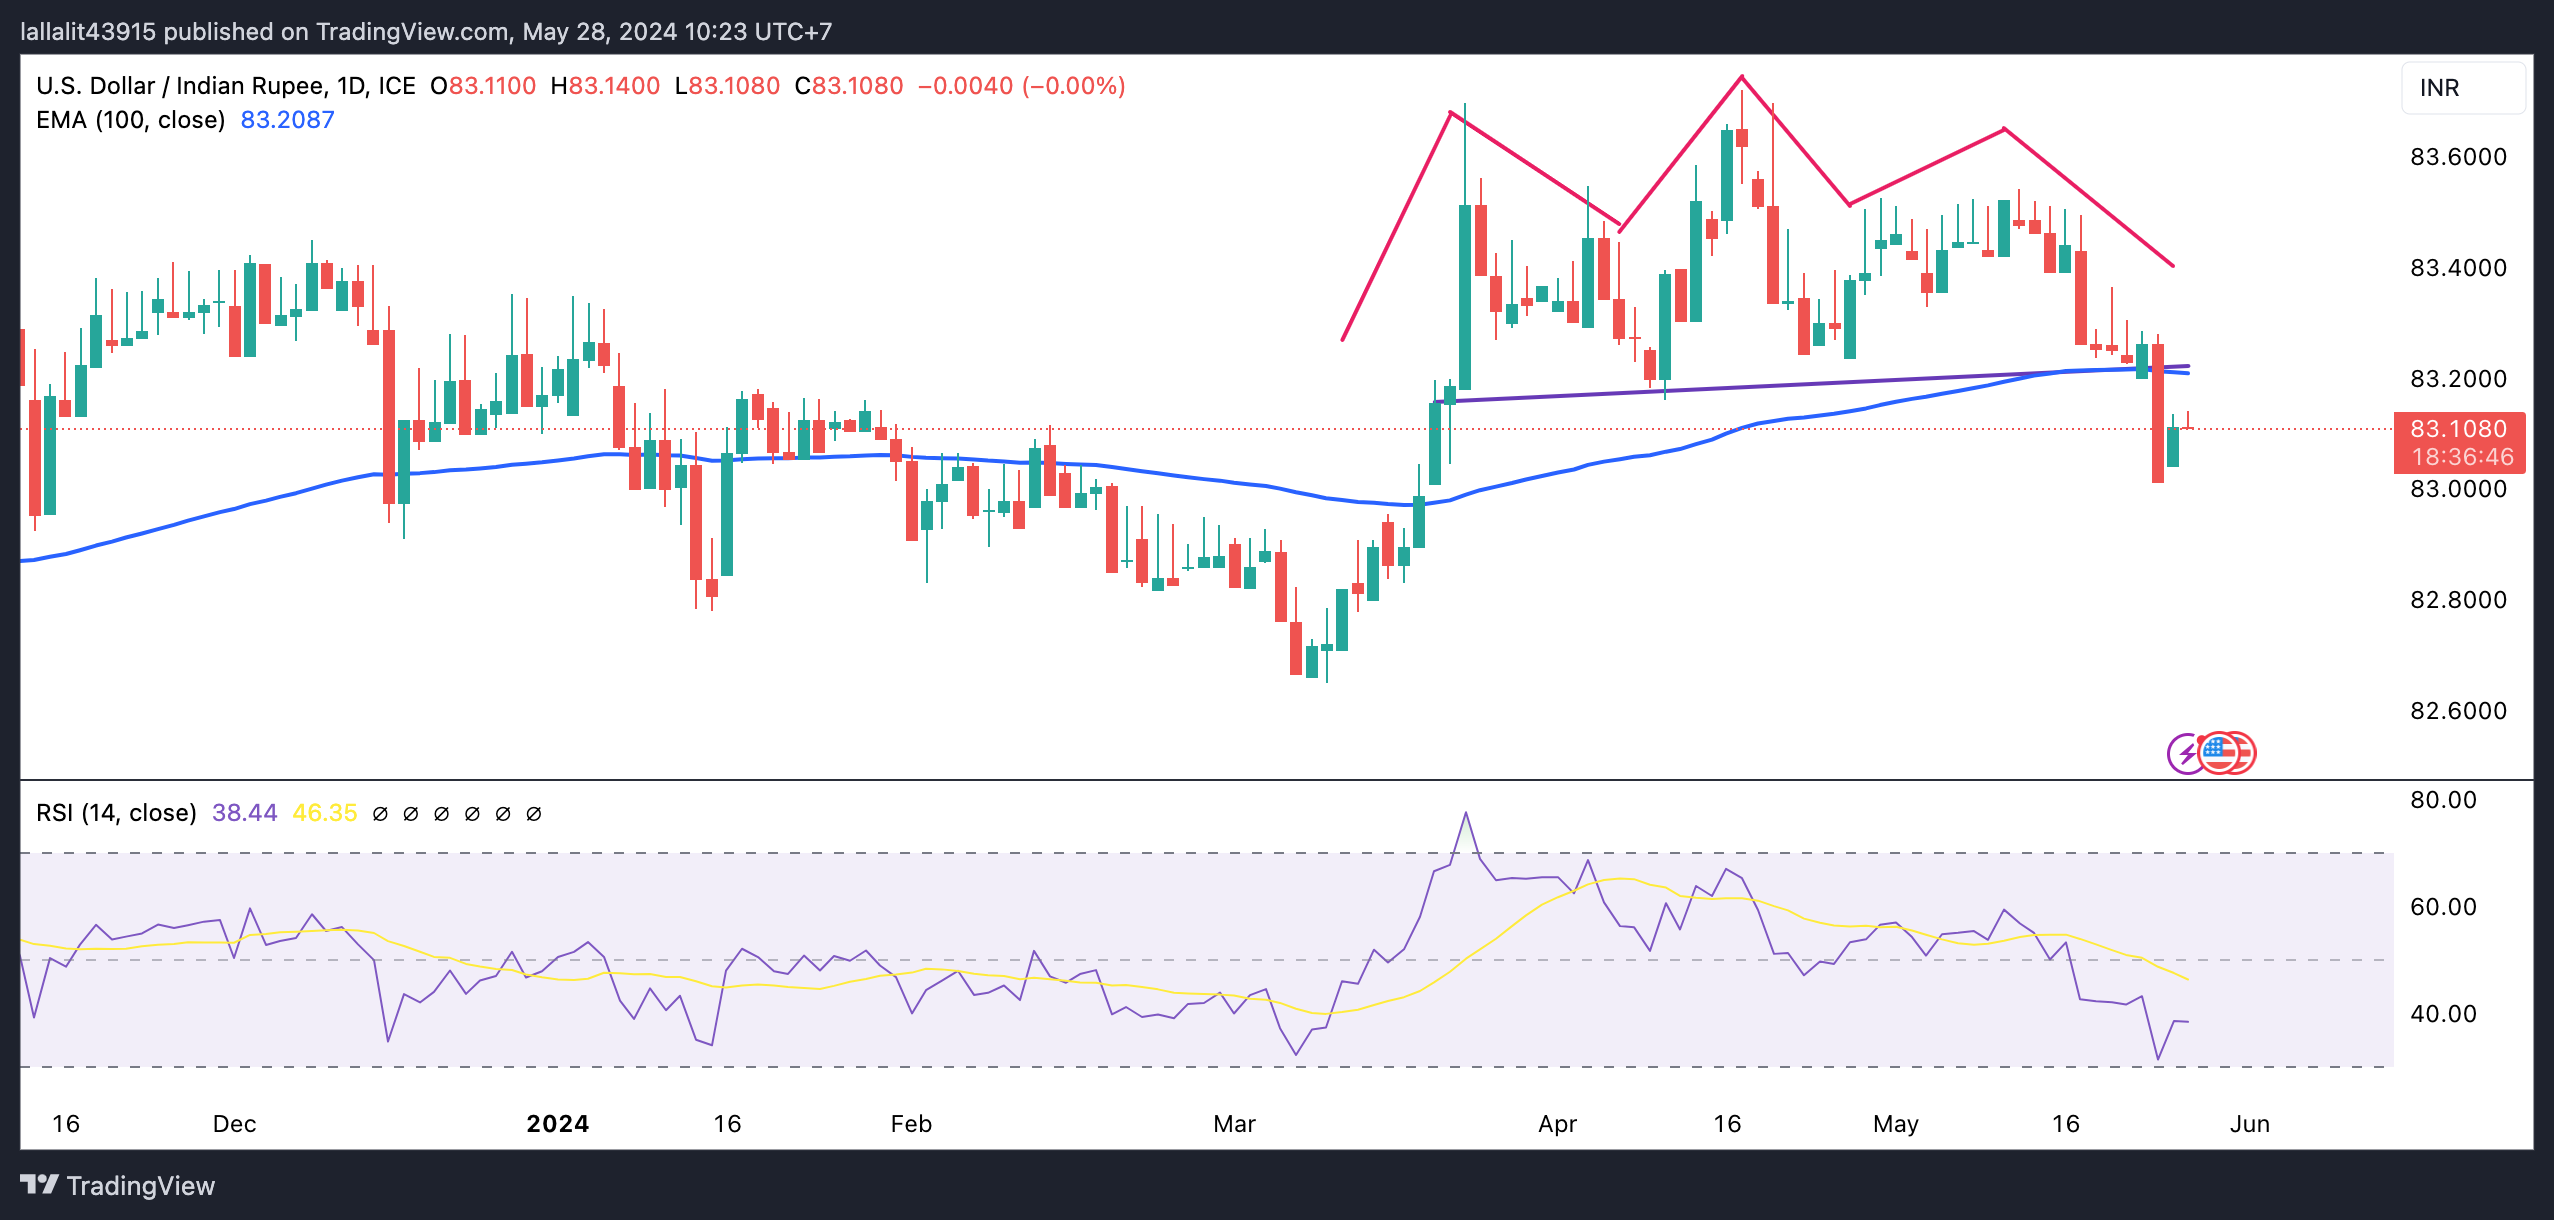
US Dollar price today
The table below shows the percentage change of US Dollar (USD) against listed major currencies today. US Dollar was the weakest against the Australian Dollar.
| USD | EUR | GBP | CAD | AUD | JPY | NZD | CHF | |
| USD | -0.17% | -0.08% | -0.10% | -0.27% | -0.15% | -0.18% | -0.16% | |
| EUR | 0.16% | 0.08% | 0.06% | -0.10% | 0.03% | -0.02% | 0.02% | |
| GBP | 0.08% | -0.08% | -0.02% | -0.18% | -0.06% | -0.10% | -0.07% | |
| CAD | 0.10% | -0.06% | 0.02% | -0.15% | -0.04% | -0.08% | -0.05% | |
| AUD | 0.27% | 0.09% | 0.17% | 0.17% | 0.13% | 0.09% | 0.12% | |
| JPY | 0.14% | -0.03% | 0.06% | 0.01% | -0.14% | -0.04% | -0.01% | |
| NZD | 0.18% | 0.02% | 0.10% | 0.07% | -0.09% | 0.05% | 0.04% | |
| CHF | 0.16% | 0.00% | 0.08% | 0.07% | -0.07% | 0.03% | -0.01% |
The heat map shows percentage changes of major currencies against each other. The base currency is picked from the left column, while the quote currency is picked from the top row. For example, if you pick the Euro from the left column and move along the horizontal line to the Japanese Yen, the percentage change displayed in the box will represent EUR (base)/JPY (quote).
Indian Rupee FAQs
The Indian Rupee (INR) is one of the most sensitive currencies to external factors. The price of Crude Oil (the country is highly dependent on imported Oil), the value of the US Dollar – most trade is conducted in USD – and the level of foreign investment, are all influential. Direct intervention by the Reserve Bank of India (RBI) in FX markets to keep the exchange rate stable, as well as the level of interest rates set by the RBI, are further major influencing factors on the Rupee.
The Reserve Bank of India (RBI) actively intervenes in forex markets to maintain a stable exchange rate, to help facilitate trade. In addition, the RBI tries to maintain the inflation rate at its 4% target by adjusting interest rates. Higher interest rates usually strengthen the Rupee. This is due to the role of the ‘carry trade’ in which investors borrow in countries with lower interest rates so as to place their money in countries’ offering relatively higher interest rates and profit from the difference.
Macroeconomic factors that influence the value of the Rupee include inflation, interest rates, the economic growth rate (GDP), the balance of trade, and inflows from foreign investment. A higher growth rate can lead to more overseas investment, pushing up demand for the Rupee. A less negative balance of trade will eventually lead to a stronger Rupee. Higher interest rates, especially real rates (interest rates less inflation) are also positive for the Rupee. A risk-on environment can lead to greater inflows of Foreign Direct and Indirect Investment (FDI and FII), which also benefit the Rupee.
Higher inflation, particularly, if it is comparatively higher than India’s peers, is generally negative for the currency as it reflects devaluation through oversupply. Inflation also increases the cost of exports, leading to more Rupees being sold to purchase foreign imports, which is Rupee-negative. At the same time, higher inflation usually leads to the Reserve Bank of India (RBI) raising interest rates and this can be positive for the Rupee, due to increased demand from international investors. The opposite effect is true of lower inflation.
- WTI Oil price appreciates ahead of OPEC+ meeting, where the group will discuss extending voluntary output cuts.
- An Israeli strike in the Gazan city of Rafah killed 45 people, sustaining geopolitical risks that favor higher crude Oil prices.
- Fed officials suggested maintaining higher rates that are negatively impacting the US economic outlook and reducing Oil demand.
West Texas Intermediate (WTI) Oil prices inch higher ahead of the Organization of the Petroleum Exporting Countries and allies including Russia (OPEC+) meeting scheduled for June 2, where group producers will discuss extending voluntary output cuts of 2.2 million barrels per day into the second half of 2024. WTI crude Oil prices trade around $78.70 per barrel during the Asian hours on Tuesday.
Oil prices are gaining support from escalated geopolitical tensions in the Middle East. Reuters reported on Sunday that an Israeli strike in the Gazan city of Rafah caused a fire that killed 45 people, triggering further outcry from international delegations and sustaining geopolitical risks that favor higher crude Oil prices. Additionally, reports of the death of an Egyptian soldier due to Israeli strikes near Rafah have added to the risk premium on crude Oil.
Traders are likely to await the Federal Reserve's preferred measure of inflation, the Personal Consumption Expenditures (PCE) Price Index data, which is due on Friday, to assess future US monetary policy. Last week, Fed officials tempered expectations for rate cuts, cautioning that the central bank still needs more evidence that inflation will eventually decline to its 2% annual target. Prolonged elevated interest rates are negatively impacting the US economic outlook and reducing Oil demand.
Reuters reported on Sunday, citing Iran’s Tasnim news agency, that an economic council led by Iran's interim president Mohammad Mokhber has approved a plan to increase the country's Oil output from 3.6 million barrels per day (bpd) to 4 million bpd.
- Commentary from Fed officials on interest rates and inflation outlook will be closely scrutinized this week.
- Fedspeak could help reverberate the market expectations for a September rates on-hold decision.
- Fed rate outlook could significantly impact the value of the US Dollar across its major rivals.
Federal Reserve (Fed) policymakers are set to make their scheduled appearances on Tuesday, as full markets return, anticipating the release of the high-impact US PCE inflation due later this week.
Meanwhile, the US Dollar remains under moderate selling pressure so far this week, extending Friday’s downside, fuelled by an unexpected easing in UoM 5-year Consumer Inflation Expectations for May. The reading came in at 3.0% , down from April’s 3.1% and below the market consensus of 3.1%. Markets are pricing in a 50% probability that the Fed will hold interest rates in September, according to the CME Group’s FedWatch Tool.
In the past week, Fed policymakers leaned in favor of a cautious stance on the inflation outlook, raising concerns amongst the market participants on potential Fed rate cuts this year. Therefore, the upcoming speeches by Fed Governor Michelle Bowman and Cleveland Fed President Loretta Mester in the Asian session will be closely scrutinized by markets for gauging the path forward on interest rates.
Both these officials are due to participate in a panel discussion titled "Policy Panel Discussion" at the Bank of Japan - Institute for Monetary and Economic Studies, in Tokyo. The event is scheduled at 04:55 GMT.
Later in the American session, Fed Governor Lisa Cook and San Francisco Fed President Mary Daly will take up the rostrum to share their thoughts at a panel discussion titled "AI and the Economy" at an event hosted by the Federal Reserve Bank of San Francisco.
Fed FAQs
Monetary policy in the US is shaped by the Federal Reserve (Fed). The Fed has two mandates: to achieve price stability and foster full employment. Its primary tool to achieve these goals is by adjusting interest rates. When prices are rising too quickly and inflation is above the Fed’s 2% target, it raises interest rates, increasing borrowing costs throughout the economy. This results in a stronger US Dollar (USD) as it makes the US a more attractive place for international investors to park their money. When inflation falls below 2% or the Unemployment Rate is too high, the Fed may lower interest rates to encourage borrowing, which weighs on the Greenback.
The Federal Reserve (Fed) holds eight policy meetings a year, where the Federal Open Market Committee (FOMC) assesses economic conditions and makes monetary policy decisions. The FOMC is attended by twelve Fed officials – the seven members of the Board of Governors, the president of the Federal Reserve Bank of New York, and four of the remaining eleven regional Reserve Bank presidents, who serve one-year terms on a rotating basis.
In extreme situations, the Federal Reserve may resort to a policy named Quantitative Easing (QE). QE is the process by which the Fed substantially increases the flow of credit in a stuck financial system. It is a non-standard policy measure used during crises or when inflation is extremely low. It was the Fed’s weapon of choice during the Great Financial Crisis in 2008. It involves the Fed printing more Dollars and using them to buy high grade bonds from financial institutions. QE usually weakens the US Dollar.
Quantitative tightening (QT) is the reverse process of QE, whereby the Federal Reserve stops buying bonds from financial institutions and does not reinvest the principal from the bonds it holds maturing, to purchase new bonds. It is usually positive for the value of the US Dollar.
| Raw materials | Closed | Change, % |
|---|---|---|
| Silver | 31.715 | 4.3 |
| Gold | 2353.01 | 0.73 |
| Palladium | 992.37 | 2.66 |
- The Australian Dollar continues to gain ground due to improved risk appetite.
- Australia’s Retail Sales grew 0.1% in April, against the expected 0.2% and the previous decline of 0.4%.
- The US Dollar depreciates due to lower US Treasury yields.
The Australian Dollar (AUD) continues to strengthen against the US Dollar (USD) for the third consecutive session on Tuesday, despite the softer Australia's Retail Sales (MoM), which rose by 0.1% in April, reversing the previous 0.4% decline. This growth fell short of market expectations of 0.2%.
The AUD's strength is also reinforced by an improved risk appetite. Furthermore, the latest Reserve Bank of Australia (RBA) meeting minutes suggested that the board found it challenging to predict future changes in the cash rate, noting that recent data increases the likelihood of inflation remaining above the 2-3% target for an extended period.
The US Dollar (USD) continues to lose ground following the decline in the US Treasury yields. The US Dollar Index (DXY), which measures the value of the US Dollar against the six other major currencies, trades around 104.50 with 2-year and 10-year yields on US Treasury bonds standing at 4.94% and 4.46%, respectively, by the press time.
According to the CME FedWatch Tool, the probability of the Federal Reserve implementing a 25 basis-point rate cut in September has decreased to 44.9%, down from 49.6% a week earlier. On Tuesday, several US Federal Reserve (Fed) officials are scheduled to speak, including Fed Governor Michelle Bowman, Cleveland Fed President Loretta Mester, and Minneapolis Fed President Neel Kashkari.
Daily Digest Market Movers: Australian Dollar appreciates due to risk-on sentiment
- China's Shanghai has announced measures to support the property sector, including reducing down payment requirements and lowering minimum mortgage rates. Additionally, China launched a US$47 billion state-backed fund on Friday to strengthen its semiconductor industry. Any economic changes in China could significantly impact the Australian market due to the close trade relationship between the two countries.
- University of Michigan's 5-year Consumer Inflation Expectations for May on Friday, eased slightly to 3.0%, below the forecasted 3.1%. Despite the upward revision of the Consumer Sentiment Index to 69.1 from a preliminary reading of 67.4, it still marked the lowest level in six months.
- The US Census Bureau released Durable Goods Orders on Friday, showing a solid recovery in April with a 0.7% month-over-month increase, compared to the forecasted 0.8% decline. However, March’s figure was revised down to 0.8% from the initial estimate of 2.6%.
- On Thursday, Australian Consumer Inflation Expectation of future inflation over the next 12 months fell to 4.1% in May from 4.6% in April, marking the lowest level since October 2021.
- The S&P Global US Composite PMI surged to 54.4 in May, marking the highest level since April 2022. The Service PMI rose to 54.8, indicating the biggest output growth in a year, while the Manufacturing PMI increased to 50.9.
Technical Analysis: Australian Dollar moves above the major level of 0.6650
The Australian Dollar trades around 0.6660 on Tuesday. Analysis of the daily chart indicates a bullish bias for the AUD/USD pair, as it is positioned within a rising wedge. The 14-day Relative Strength Index (RSI) is slightly above the 50 level, further confirming this bullish bias.
The AUD/USD pair could potentially reach a four-month high of 0.6714, followed by the upper limit of the ascending triangle around 0.6730.
On the downside, the 21-day Exponential Moving Average (EMA) at 0.6618 serves as key support, followed by the psychological level of 0.6600. A further decline could put downward pressure on the AUD/USD pair, potentially driving it toward the throwback support region at 0.6470.
AUD/USD: Daily Chart
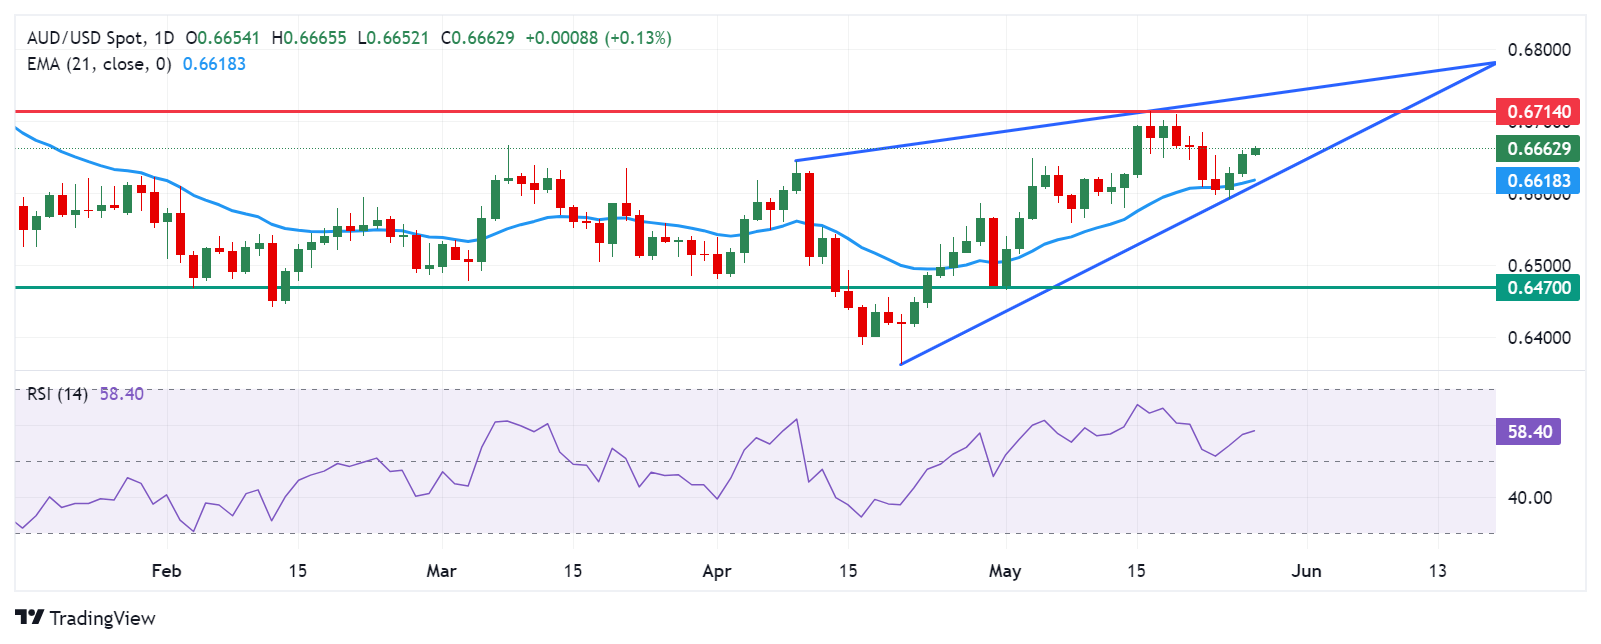
Australian Dollar price today
The table below shows the percentage change of the Australian Dollar (AUD) against listed major currencies today. The Australian Dollar was the strongest against the US Dollar.
| USD | EUR | GBP | CAD | AUD | JPY | NZD | CHF | |
| USD | -0.11% | -0.05% | -0.05% | -0.11% | -0.06% | -0.16% | -0.15% | |
| EUR | 0.11% | 0.06% | 0.05% | 0.00% | 0.05% | -0.05% | -0.03% | |
| GBP | 0.05% | -0.06% | -0.01% | -0.06% | -0.01% | -0.11% | -0.09% | |
| CAD | 0.05% | -0.04% | 0.02% | -0.04% | 0.00% | -0.10% | -0.07% | |
| AUD | 0.11% | 0.02% | 0.06% | 0.06% | 0.05% | -0.04% | -0.01% | |
| JPY | 0.06% | -0.03% | 0.01% | -0.02% | -0.05% | -0.09% | -0.08% | |
| NZD | 0.18% | 0.05% | 0.11% | 0.12% | 0.04% | 0.11% | 0.05% | |
| CHF | 0.13% | 0.03% | 0.09% | 0.09% | 0.06% | 0.08% | -0.03% |
The heat map shows percentage changes of major currencies against each other. The base currency is picked from the left column, while the quote currency is picked from the top row. For example, if you pick the Euro from the left column and move along the horizontal line to the Japanese Yen, the percentage change displayed in the box will represent EUR (base)/JPY (quote).
Australian Dollar FAQs
One of the most significant factors for the Australian Dollar (AUD) is the level of interest rates set by the Reserve Bank of Australia (RBA). Because Australia is a resource-rich country another key driver is the price of its biggest export, Iron Ore. The health of the Chinese economy, its largest trading partner, is a factor, as well as inflation in Australia, its growth rate and Trade Balance. Market sentiment – whether investors are taking on more risky assets (risk-on) or seeking safe-havens (risk-off) – is also a factor, with risk-on positive for AUD.
The Reserve Bank of Australia (RBA) influences the Australian Dollar (AUD) by setting the level of interest rates that Australian banks can lend to each other. This influences the level of interest rates in the economy as a whole. The main goal of the RBA is to maintain a stable inflation rate of 2-3% by adjusting interest rates up or down. Relatively high interest rates compared to other major central banks support the AUD, and the opposite for relatively low. The RBA can also use quantitative easing and tightening to influence credit conditions, with the former AUD-negative and the latter AUD-positive.
China is Australia’s largest trading partner so the health of the Chinese economy is a major influence on the value of the Australian Dollar (AUD). When the Chinese economy is doing well it purchases more raw materials, goods and services from Australia, lifting demand for the AUD, and pushing up its value. The opposite is the case when the Chinese economy is not growing as fast as expected. Positive or negative surprises in Chinese growth data, therefore, often have a direct impact on the Australian Dollar and its pairs.
Iron Ore is Australia’s largest export, accounting for $118 billion a year according to data from 2021, with China as its primary destination. The price of Iron Ore, therefore, can be a driver of the Australian Dollar. Generally, if the price of Iron Ore rises, AUD also goes up, as aggregate demand for the currency increases. The opposite is the case if the price of Iron Ore falls. Higher Iron Ore prices also tend to result in a greater likelihood of a positive Trade Balance for Australia, which is also positive of the AUD.
The Trade Balance, which is the difference between what a country earns from its exports versus what it pays for its imports, is another factor that can influence the value of the Australian Dollar. If Australia produces highly sought after exports, then its currency will gain in value purely from the surplus demand created from foreign buyers seeking to purchase its exports versus what it spends to purchase imports. Therefore, a positive net Trade Balance strengthens the AUD, with the opposite effect if the Trade Balance is negative.
- NZD/USD trades in positive territory for the fifth consecutive day around 0.6165 on Tuesday.
- Investors will closely watch the US PCE, which is expected to show an increase of 2.8% YoY in April.
- China's Shanghai has announced support measures to boost the housing market.
The NZD/USD pair extends the rally near 0.6165 on Tuesday during the early Asian session. The pair edges higher to the highest level since March amid the softer US Dollar (USD). Investors await the fresh catalysts, with the US Gross Domestic Product Annualized (GDP) and Core Personal Consumption Expenditures Price Index due later this week. Also, the Reserve Bank of New Zealand’s (RBNX) Governor Orr's speech will be closely watched on Friday.
The markets lower their bets on interest rate cuts by the US Federal Reserve (Fed) following the hawkish stance from Fed officials and stronger-than-expected US economic data. Investors will keep an eye on the key US PCE inflation data on Friday. The US Core PCE is projected to show an increase of 0.3% MoM and 2.8% YoY in April. The hotter inflation might dampen expectations of Fed rate cuts and boost the Greenback.
On the other hand, RBNZ Deputy Governor Christian Hawkesby highlighted that cutting interest rates is not part of the near-term discussion. The RBNZ held its cash rate steady at a 15-year high of 5.5% and suggested that restrictive policy needs to be maintained longer to ensure inflation returns to the 1-3% target range.
On Tuesday, China's Shanghai announced property sector support measures to optimize the local real estate market and promote stable and sound development, per the Global Times. Analysts believe it will offer a significant boost to the housing market. The combination of hawkish holds from the RBNZ and the Chinese stimulus plan continues to underpin the China-proxy Kiwi against the USD.
Taking the lead from similar support measures in other cities, China’s Shanghai city announced several measures to inject life into its beleaguered property sector on Tuesday.
Key details
Cuts down payment requirement.
Lowers minimum mortgage rates.
Restrictions on home purchases will be eased.
Required years of social security or income tax payments for non-shanghai residents will be reduced from five to three years.
Market reaction
In reaction to the above announcement, AUD/USD flirts with intraday highs near 0.6665 while the country’s property sector stocks rally nearly 2%.
Australian Dollar FAQs
One of the most significant factors for the Australian Dollar (AUD) is the level of interest rates set by the Reserve Bank of Australia (RBA). Because Australia is a resource-rich country another key driver is the price of its biggest export, Iron Ore. The health of the Chinese economy, its largest trading partner, is a factor, as well as inflation in Australia, its growth rate and Trade Balance. Market sentiment – whether investors are taking on more risky assets (risk-on) or seeking safe-havens (risk-off) – is also a factor, with risk-on positive for AUD.
The Reserve Bank of Australia (RBA) influences the Australian Dollar (AUD) by setting the level of interest rates that Australian banks can lend to each other. This influences the level of interest rates in the economy as a whole. The main goal of the RBA is to maintain a stable inflation rate of 2-3% by adjusting interest rates up or down. Relatively high interest rates compared to other major central banks support the AUD, and the opposite for relatively low. The RBA can also use quantitative easing and tightening to influence credit conditions, with the former AUD-negative and the latter AUD-positive.
China is Australia’s largest trading partner so the health of the Chinese economy is a major influence on the value of the Australian Dollar (AUD). When the Chinese economy is doing well it purchases more raw materials, goods and services from Australia, lifting demand for the AUD, and pushing up its value. The opposite is the case when the Chinese economy is not growing as fast as expected. Positive or negative surprises in Chinese growth data, therefore, often have a direct impact on the Australian Dollar and its pairs.
Iron Ore is Australia’s largest export, accounting for $118 billion a year according to data from 2021, with China as its primary destination. The price of Iron Ore, therefore, can be a driver of the Australian Dollar. Generally, if the price of Iron Ore rises, AUD also goes up, as aggregate demand for the currency increases. The opposite is the case if the price of Iron Ore falls. Higher Iron Ore prices also tend to result in a greater likelihood of a positive Trade Balance for Australia, which is also positive of the AUD.
The Trade Balance, which is the difference between what a country earns from its exports versus what it pays for its imports, is another factor that can influence the value of the Australian Dollar. If Australia produces highly sought after exports, then its currency will gain in value purely from the surplus demand created from foreign buyers seeking to purchase its exports versus what it spends to purchase imports. Therefore, a positive net Trade Balance strengthens the AUD, with the opposite effect if the Trade Balance is negative.
The People’s Bank of China (PBoC) set the USD/CNY central rate for the trading session ahead on Tuesday at 7.1101, as against the previous day's fix of 7.1091 and 7.2403 Reuters estimates.
Australia’s Retail Sales, a measure of the country’s consumer spending, rose 0.1% MoM in April from the previous reading of a 0.4% decline, according to the official data published by the Australian Bureau of Statistics (ABS) on Tuesday. The figure came in weaker than market expectations with an increase of 0.2%.
Market reaction to Australia’s Retail Sales data
At the time of writing, the AUD/USD pair is up 0.08% on the day at 0.6658.
Australian Dollar FAQs
One of the most significant factors for the Australian Dollar (AUD) is the level of interest rates set by the Reserve Bank of Australia (RBA). Because Australia is a resource-rich country another key driver is the price of its biggest export, Iron Ore. The health of the Chinese economy, its largest trading partner, is a factor, as well as inflation in Australia, its growth rate and Trade Balance. Market sentiment – whether investors are taking on more risky assets (risk-on) or seeking safe-havens (risk-off) – is also a factor, with risk-on positive for AUD.
The Reserve Bank of Australia (RBA) influences the Australian Dollar (AUD) by setting the level of interest rates that Australian banks can lend to each other. This influences the level of interest rates in the economy as a whole. The main goal of the RBA is to maintain a stable inflation rate of 2-3% by adjusting interest rates up or down. Relatively high interest rates compared to other major central banks support the AUD, and the opposite for relatively low. The RBA can also use quantitative easing and tightening to influence credit conditions, with the former AUD-negative and the latter AUD-positive.
China is Australia’s largest trading partner so the health of the Chinese economy is a major influence on the value of the Australian Dollar (AUD). When the Chinese economy is doing well it purchases more raw materials, goods and services from Australia, lifting demand for the AUD, and pushing up its value. The opposite is the case when the Chinese economy is not growing as fast as expected. Positive or negative surprises in Chinese growth data, therefore, often have a direct impact on the Australian Dollar and its pairs.
Iron Ore is Australia’s largest export, accounting for $118 billion a year according to data from 2021, with China as its primary destination. The price of Iron Ore, therefore, can be a driver of the Australian Dollar. Generally, if the price of Iron Ore rises, AUD also goes up, as aggregate demand for the currency increases. The opposite is the case if the price of Iron Ore falls. Higher Iron Ore prices also tend to result in a greater likelihood of a positive Trade Balance for Australia, which is also positive of the AUD.
The Trade Balance, which is the difference between what a country earns from its exports versus what it pays for its imports, is another factor that can influence the value of the Australian Dollar. If Australia produces highly sought after exports, then its currency will gain in value purely from the surplus demand created from foreign buyers seeking to purchase its exports versus what it spends to purchase imports. Therefore, a positive net Trade Balance strengthens the AUD, with the opposite effect if the Trade Balance is negative.
Japanese Finance Minister Shunichi Suzuki said on Tuesday that he has a strong concern over the negative effects of weakened Yen and he will take all necessary measures on foreign exchange (FX) as required.
Key quotes
emphasizes stability in FX movements to reflect fundamentals
opposes undesirable excessive currency fluctuations
to take all necessary measures on foreign exchange as required
expresses strong concern over negative effects of weakened yen
prioritizes wage growth above inflation
refrains from commenting on government intervention in markets
Important for currencies to move in stable manner reflecting fundamentals
is closely watching FX moves
weak yen boosts exporters' profits but it increases the burden on consumers
is more concerned about the negative impact of a weak yen
Market reaction
These comments have little to no market reaction to the Japanese Yen (JPY). At the time of writing, USD/JPY is trading 0.04% lower on the day to trade at 156.84.
Japanese Yen FAQs
The Japanese Yen (JPY) is one of the world’s most traded currencies. Its value is broadly determined by the performance of the Japanese economy, but more specifically by the Bank of Japan’s policy, the differential between Japanese and US bond yields, or risk sentiment among traders, among other factors.
One of the Bank of Japan’s mandates is currency control, so its moves are key for the Yen. The BoJ has directly intervened in currency markets sometimes, generally to lower the value of the Yen, although it refrains from doing it often due to political concerns of its main trading partners. The current BoJ ultra-loose monetary policy, based on massive stimulus to the economy, has caused the Yen to depreciate against its main currency peers. This process has exacerbated more recently due to an increasing policy divergence between the Bank of Japan and other main central banks, which have opted to increase interest rates sharply to fight decades-high levels of inflation.
The BoJ’s stance of sticking to ultra-loose monetary policy has led to a widening policy divergence with other central banks, particularly with the US Federal Reserve. This supports a widening of the differential between the 10-year US and Japanese bonds, which favors the US Dollar against the Japanese Yen.
The Japanese Yen is often seen as a safe-haven investment. This means that in times of market stress, investors are more likely to put their money in the Japanese currency due to its supposed reliability and stability. Turbulent times are likely to strengthen the Yen’s value against other currencies seen as more risky to invest in.
- Japanese Tokyo CPI inflation, US GDP & PCE inflation key data this week.
- Core Tokyo CPI inflation expected to tick higher on Friday.
- Rate cut-hungry investors hope US PCE inflation will hold steady in April.
USD/JPY is treading water ahead of Tuesday’s Pacific market session, holding ground just below the 157.00 handle as investors await key data that will determine the pace of rate cuts from central banks moving forward.
The trading week opened quietly with US markets shuttered on Monday for the Memorial Day holiday, and Tuesday will officially kick off the full trading week for the USD/JPY pair. Data remains thin in the early week, and investors will be keeping one eye out for further Fedspeak from Federal Reserve (Fed) policymakers. Several key Fed heads are due to speak in the early half of the trading week, and officials from the Bank of Japan (BoJ) found little progress in talking up the Yen on Monday.
Japanese Corporate Services Price Index inflation rose faster than expected through the year ended in April, rising 2.8% YoY, expanding faster than the previous period’s 2.3% and accelerating at its fastest pace since 2015.
Japanese Tokyo Consumer Price Index (CPI) inflation is due later this week, with markets expecting a similar uptick in inflationary pressure with Core Tokyo CPI inflation forecast to tick up to 1.9% YoY versus the previous 1.6%.
Read more: Japanese Corporate Service Price Index climbs to 2.8% annually from 2.3%
US Gross Domestic Product (GDP) growth and Personal Consumption Expenditure (PCE) Price Index inflation figures are due in the back half of this week; Thursday’s US quarterly GDP growth is expected to tick down to 1.4% in Q1 compared to the previous 1.6%, while investors are looking for Friday’s Core PCE Price Index inflation is to hold steady at 0.3% MoM.
USD/JPY technical outlook
Despite broad weakness in the Greenback on Monday, the Yen couldn’t find a foothold, keeping USD/JPY hobbled beneath the 157.00 handle. The USD has climbed steadily against the beleaguered JPY, shrugging off a set of suspected “Yenterventions” in recent weeks.
USD/JPY has clawed back over half of the losses incurred following a steep tumble from multi-year highs at 160.32, and the pair remains deep in bull country. USD/JPY has traded on the north side of the 200-day Exponential Moving Average (EMA) at 149.13 since January, and the pair is up over 11% in 2024.
USD/JPY hourly chart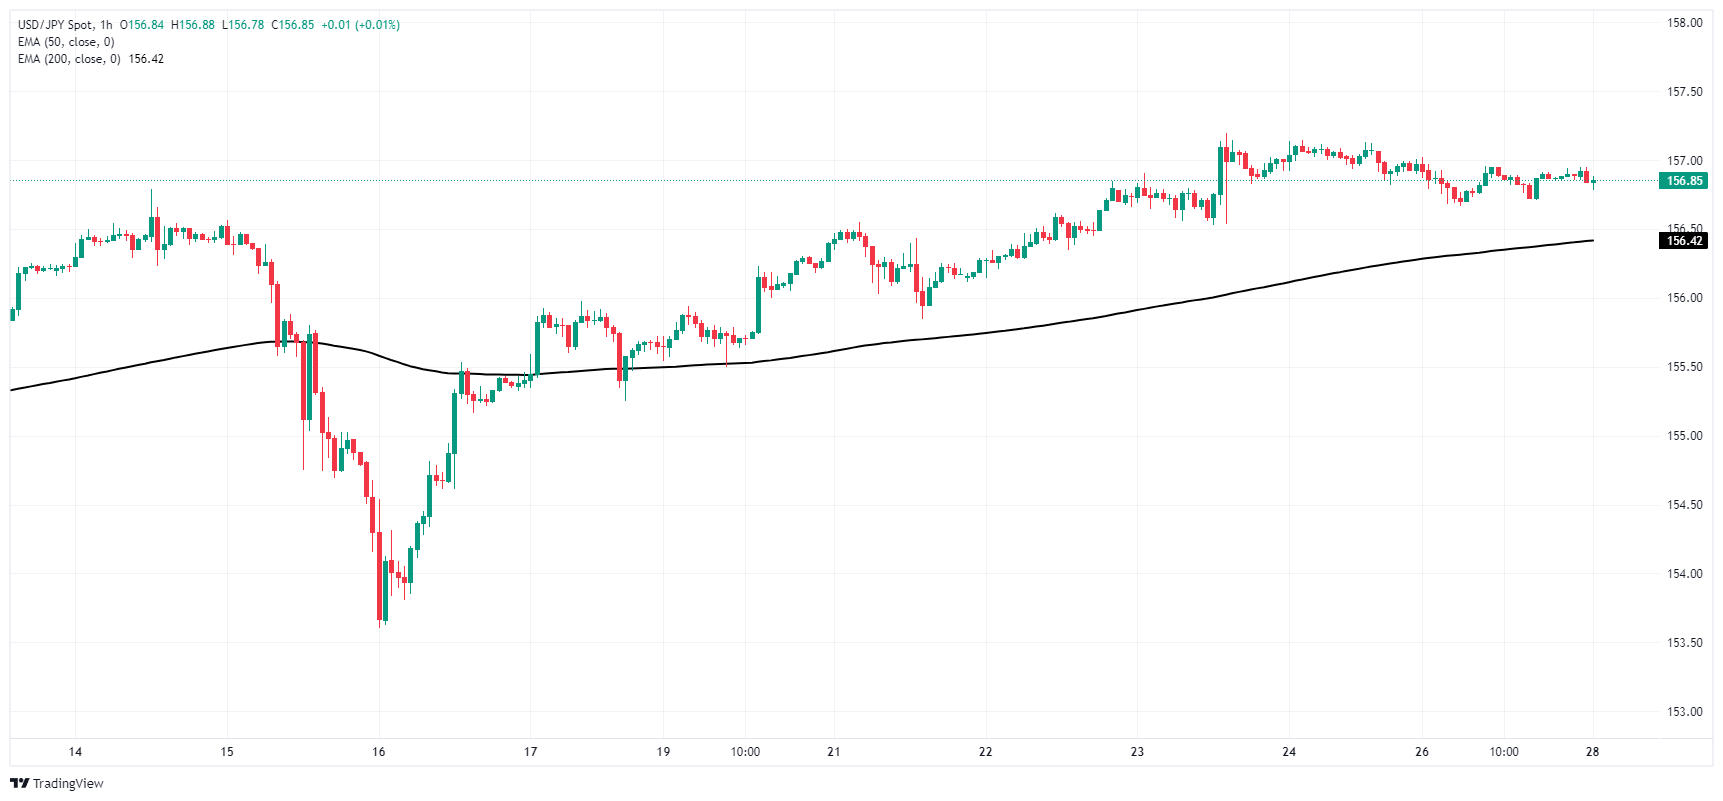
USD/JPY daily chart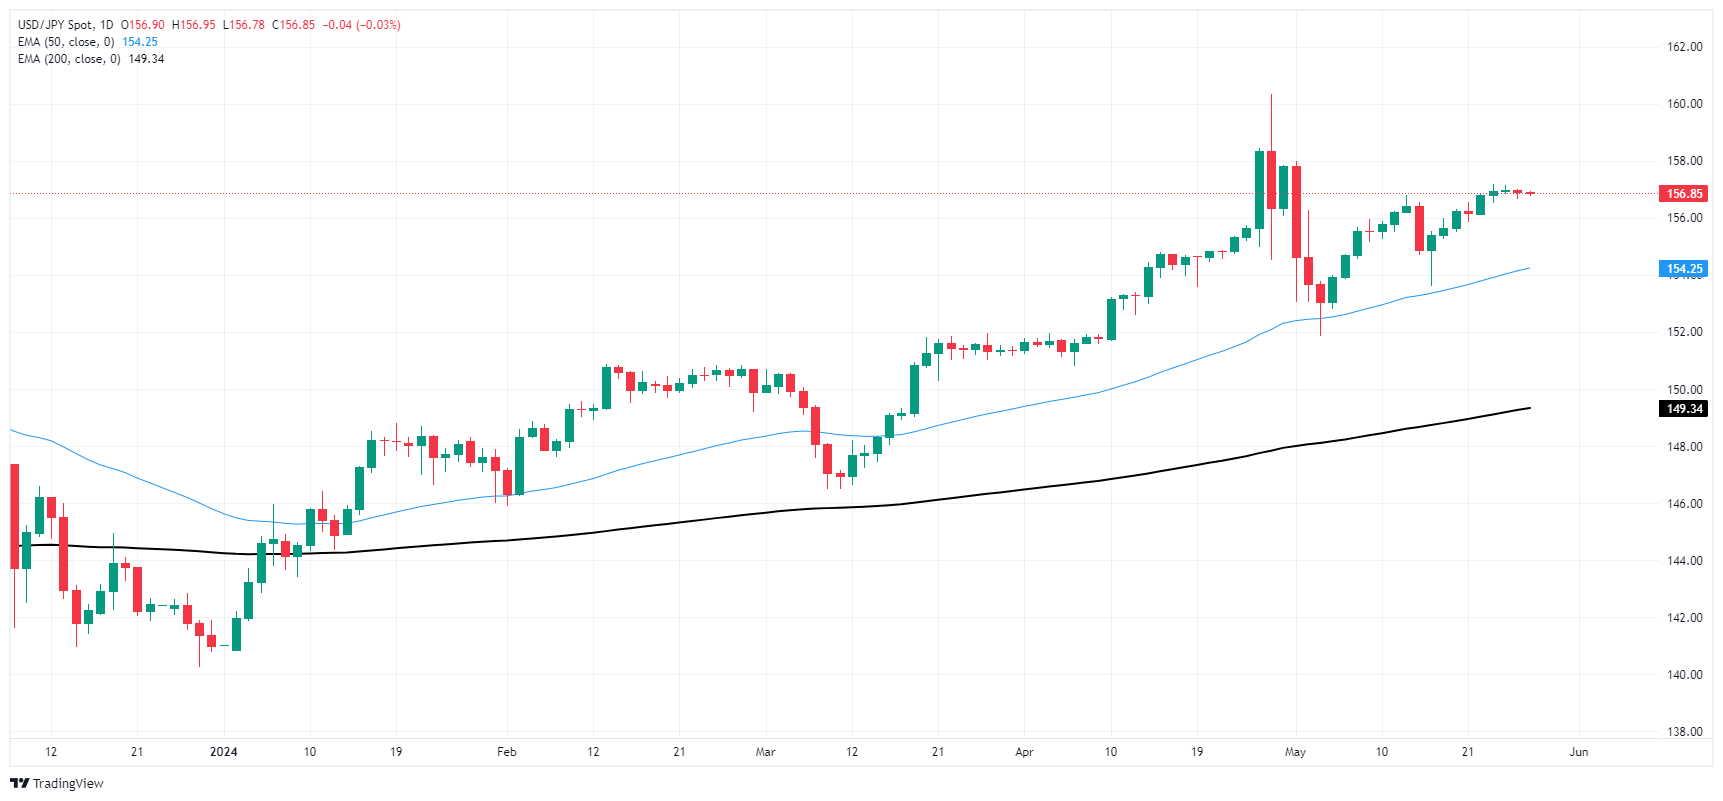
- Gold price gains momentum in Tuesday’s early Asian session.
- The weaker USD and ongoing Middle East geopolitical tensions support the precious metal.
- Traders will monitor the US CB Consumer Confidence and the speeches from the Fed’s Kashkari, Daly and Cook on Tuesday.
Gold price (XAU/USD) edges higher on Tuesday after bouncing off two-week lows of $2,325. The uptick of yellow metal is bolstered by the softer US Dollar (USD) and safe-haven flows amid the ongoing geopolitical tensions in the Middle East. On the other hand, higher short-term Treasury yields following hawkish Fed minutes and stronger US economic data are likely to support the Greenback in the near term. Traders might prefer to wait on the sidelines ahead of the key US inflation data this week.
The US Conference Board’s Consumer Confidence is due on Tuesday, along with the Fed’s Neel Kashkari, Mary Daly and Lisa Cook speeches. The US Core Personal Consumption Expenditures Price Index (Core CPE) will take center stage on Friday. More hawkish comments from Fed officials and any signs of sticky inflation, traders might shift back the prospects of the first Fed rate cut. This, in turn, is likely to boost the USD and exert some selling pressure on the USD-denominated gold price.
Daily digest market movers: Gold price remains strong amid Fed’s hawkish comments and stronger US data
- An Israeli airstrike triggered a fire that killed 45 people in a tent camp in the Gazan city of Rafah, officials said on Monday. Global leaders called for the implementation of a World Court order to halt Israel's attacks, per Reuters.
- According to the recent Fed meeting minutes, the central bank would take longer than anticipated to gain greater confidence in inflation moving to the 2% target.
- Traders have reduced their bets on interest rate reduction by the US Federal Reserve (Fed) to 49% odds in September, down from 63% a week earlier, according to the CME FedWatch tool.
- The preliminary US Gross Domestic Product (GDP) Annualized is estimated to grow 1.4% in Q1 from 1.6% in the previous reading.
- The US Core Personal Consumption Expenditures Price Index (Core PCE), the Fed’s preferred inflation gauge, is expected to show an increase of 0.3% MoM and 2.8% YoY in April.
- UBS analysts raised their gold price projection to $2,600 by the end of 2024. Citi experts forecast that gold will reach $3,000 per ounce during the next six to eighteen months.
Technical analysis: Gold price maintains a positive stance in the long term
The gold price trades on a positive note on the day. According to the 1-hour chart, the precious metal keeps the bullish vibe unchanged as it holds above the key 100-day Exponential Moving Average (EMA). Nonetheless, the 14-day Relative Strength Index (RSI) hovers around the 50-midline, indicating a neutral level or balance between bullish and bearish positions, which means consolidation or directionlessness cannot be ruled out.
The upper boundary of the Bollinger Band at $2,430 acts as an immediate resistance level for XAU/USD. Any follow-through buying above the mentioned level will attract some buyers to the all-time high of $2,450 and then the $2,500 psychological barrier.
In the bearish environment, the first downside target will emerge near the $2,300 round mark. A breach of this level could drag the yellow metal lower to $2,268, followed by the 100-day EMA of $2,220.
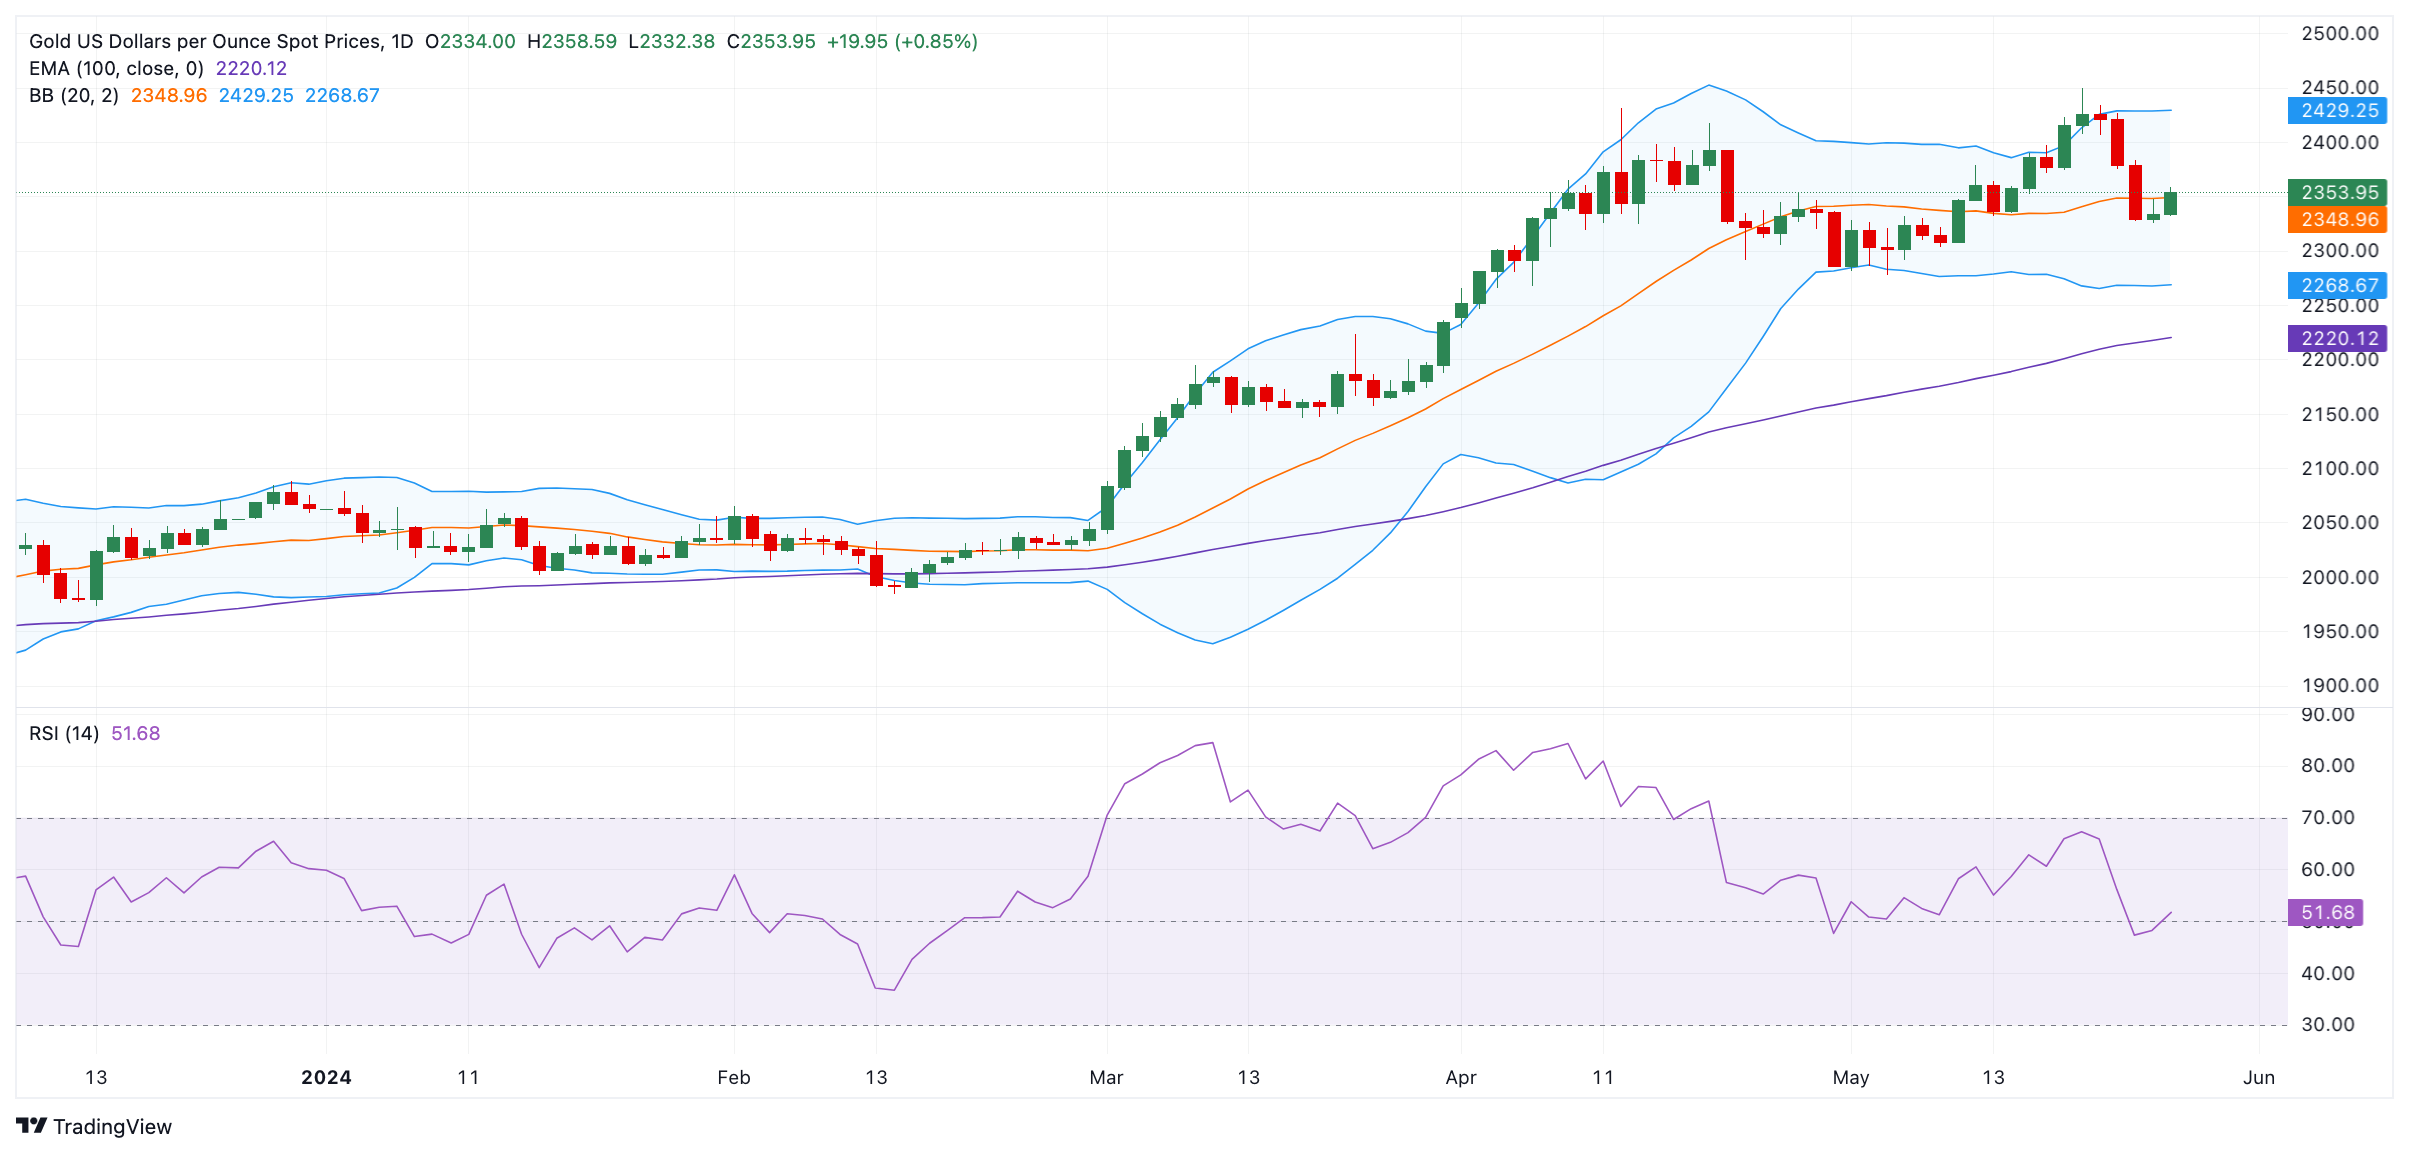
US Dollar price today
The table below shows the percentage change of US Dollar (USD) against listed major currencies today. US Dollar was the weakest against the Swiss Franc.
| USD | EUR | GBP | CAD | AUD | JPY | NZD | CHF | |
| USD | -0.03% | -0.01% | -0.01% | -0.03% | -0.01% | -0.05% | -0.07% | |
| EUR | 0.03% | 0.02% | 0.01% | 0.00% | 0.02% | -0.02% | -0.03% | |
| GBP | 0.00% | -0.02% | -0.01% | -0.02% | 0.01% | -0.04% | -0.05% | |
| CAD | 0.01% | -0.01% | -0.01% | -0.01% | 0.01% | -0.03% | -0.04% | |
| AUD | 0.03% | 0.00% | 0.02% | 0.01% | 0.02% | -0.02% | -0.03% | |
| JPY | 0.00% | -0.03% | -0.02% | -0.01% | -0.04% | -0.06% | -0.05% | |
| NZD | 0.05% | 0.02% | 0.04% | 0.03% | 0.02% | 0.05% | 0.00% | |
| CHF | 0.05% | 0.03% | 0.05% | 0.05% | 0.06% | 0.05% | 0.01% |
The heat map shows percentage changes of major currencies against each other. The base currency is picked from the left column, while the quote currency is picked from the top row. For example, if you pick the Euro from the left column and move along the horizontal line to the Japanese Yen, the percentage change displayed in the box will represent EUR (base)/JPY (quote).
Gold FAQs
Gold has played a key role in human’s history as it has been widely used as a store of value and medium of exchange. Currently, apart from its shine and usage for jewelry, the precious metal is widely seen as a safe-haven asset, meaning that it is considered a good investment during turbulent times. Gold is also widely seen as a hedge against inflation and against depreciating currencies as it doesn’t rely on any specific issuer or government.
Central banks are the biggest Gold holders. In their aim to support their currencies in turbulent times, central banks tend to diversify their reserves and buy Gold to improve the perceived strength of the economy and the currency. High Gold reserves can be a source of trust for a country’s solvency. Central banks added 1,136 tonnes of Gold worth around $70 billion to their reserves in 2022, according to data from the World Gold Council. This is the highest yearly purchase since records began. Central banks from emerging economies such as China, India and Turkey are quickly increasing their Gold reserves.
Gold has an inverse correlation with the US Dollar and US Treasuries, which are both major reserve and safe-haven assets. When the Dollar depreciates, Gold tends to rise, enabling investors and central banks to diversify their assets in turbulent times. Gold is also inversely correlated with risk assets. A rally in the stock market tends to weaken Gold price, while sell-offs in riskier markets tend to favor the precious metal.
The price can move due to a wide range of factors. Geopolitical instability or fears of a deep recession can quickly make Gold price escalate due to its safe-haven status. As a yield-less asset, Gold tends to rise with lower interest rates, while higher cost of money usually weighs down on the yellow metal. Still, most moves depend on how the US Dollar (USD) behaves as the asset is priced in dollars (XAU/USD). A strong Dollar tends to keep the price of Gold controlled, whereas a weaker Dollar is likely to push Gold prices up.
| Index | Change, points | Closed | Change, % |
|---|---|---|---|
| NIKKEI 225 | 253.91 | 38900.02 | 0.66 |
| Hang Seng | 218.41 | 18827.35 | 1.17 |
| KOSPI | 35.39 | 2722.99 | 1.32 |
| ASX 200 | 60.7 | 7788.3 | 0.79 |
| DAX | 81.34 | 18774.71 | 0.44 |
| CAC 40 | 37.52 | 8132.49 | 0.46 |
| Pare | Closed | Change, % |
|---|---|---|
| AUDUSD | 0.6654 | 0.35 |
| EURJPY | 170.291 | 0.03 |
| EURUSD | 1.08562 | 0.05 |
| GBPJPY | 200.279 | 0.2 |
| GBPUSD | 1.27677 | 0.21 |
| NZDUSD | 0.61495 | 0.4 |
| USDCAD | 1.36331 | -0.22 |
| USDCHF | 0.91332 | -0.1 |
| USDJPY | 156.862 | -0.02 |
The Japanese Corporate Services Price Index, a measure of input prices paid by corporations, rose to 2.8% for the year ended in April, compared to the previous month's annualized 2.3%.
April's uptick in corporate inflation represents the highest rate of price growth impacting corporations since 2015.
Market reaction
USD/JPY is trading tightly on the bearish side of the 157.00 handle as Pacific session traders come online on Tuesday.
About Japanese Corporate Services Price Index
The Corporate Service Price Index (CSPI) released by the Bank of Japan measures the prices of services traded among companies. It presents price developments that reflect most sensitively the supply and demand conditions in the services market. It is also considered as an indicator for inflationary pressures. Normally, a high reading is seen as positive (or bullish) for the JPY, while a low reading is seen as negative (or bearish).


© 2000-2026. All rights reserved.
This site is managed by Teletrade D.J. LLC 2351 LLC 2022 (Euro House, Richmond Hill Road, Kingstown, VC0100, St. Vincent and the Grenadines).
The information on this website is for informational purposes only and does not constitute any investment advice.
The company does not serve or provide services to customers who are residents of the US, Canada, Iran, The Democratic People's Republic of Korea, Yemen and FATF blacklisted countries.
Making transactions on financial markets with marginal financial instruments opens up wide possibilities and allows investors who are willing to take risks to earn high profits, carrying a potentially high risk of losses at the same time. Therefore you should responsibly approach the issue of choosing the appropriate investment strategy, taking the available resources into account, before starting trading.
Use of the information: full or partial use of materials from this website must always be referenced to TeleTrade as the source of information. Use of the materials on the Internet must be accompanied by a hyperlink to teletrade.org. Automatic import of materials and information from this website is prohibited.
Please contact our PR department if you have any questions or need assistance at pr@teletrade.global.
transfers