- Analytics
- News and Tools
- Market News
CFD Markets News and Forecasts — 28-05-2020
| Time | Country | Event | Period | Previous value | Forecast |
|---|---|---|---|---|---|
| 01:30 | Australia | Private Sector Credit, y/y | April | 3.6% | |
| 01:30 | Australia | Private Sector Credit, m/m | April | 1.1% | |
| 05:00 | Japan | Construction Orders, y/y | April | -14.3% | |
| 05:00 | Japan | Housing Starts, y/y | April | -7.6% | -12.1% |
| 05:00 | Japan | Consumer Confidence | May | 21.6 | |
| 06:00 | United Kingdom | Nationwide house price index, y/y | May | 3.7% | 2.8% |
| 06:00 | United Kingdom | Nationwide house price index | May | 0.7% | -1% |
| 06:00 | Germany | Retail sales, real adjusted | April | -5.6% | -12% |
| 06:00 | Germany | Retail sales, real unadjusted, y/y | April | -2.8% | -14.3% |
| 06:45 | France | Consumer spending | April | -17.9% | -15% |
| 06:45 | France | CPI, m/m | May | 0% | 0.1% |
| 06:45 | France | CPI, y/y | May | 0.3% | 0.3% |
| 06:45 | France | GDP, q/q | Quarter I | -0.1% | -5.8% |
| 07:00 | Switzerland | KOF Leading Indicator | May | 63.5 | 70 |
| 08:00 | Eurozone | Private Loans, Y/Y | April | 3.4% | |
| 08:00 | Eurozone | M3 money supply, adjusted y/y | April | 7.5% | 7.8% |
| 09:00 | Eurozone | Harmonized CPI, Y/Y | May | 0.3% | 0.1% |
| 09:00 | Eurozone | Harmonized CPI ex EFAT, Y/Y | May | 0.9% | 0.8% |
| 12:30 | Canada | Industrial Product Price Index, y/y | April | -2.4% | |
| 12:30 | Canada | Industrial Product Price Index, m/m | April | -0.9% | |
| 12:30 | U.S. | Goods Trade Balance, $ bln. | April | -64.38 | |
| 12:30 | Canada | GDP (m/m) | March | 0% | -9% |
| 12:30 | U.S. | Personal spending | April | -7.5% | -12.6% |
| 12:30 | U.S. | PCE price index ex food, energy, m/m | April | -0.1% | -0.3% |
| 12:30 | U.S. | PCE price index ex food, energy, Y/Y | April | 1.7% | 1.1% |
| 12:30 | U.S. | Personal Income, m/m | April | -2% | -6.5% |
| 12:30 | Canada | GDP (YoY) | Quarter I | 0.3% | -10% |
| 12:30 | Canada | GDP QoQ | Quarter I | 0.1% | |
| 13:45 | U.S. | Chicago Purchasing Managers' Index | May | 35.4 | 40 |
| 14:00 | U.S. | Reuters/Michigan Consumer Sentiment Index | May | 71.8 | 74 |
| 15:00 | U.S. | Fed Chair Powell Speaks | |||
| 17:00 | U.S. | Baker Hughes Oil Rig Count | May | 237 |
The U.S. Energy
Information Administration (EIA) revealed on Thursday that crude inventories
jumped by 7.928 million barrels in the week ended May 22. Economists had
forecast a drop of 1.944 million barrels.
At the same
time, gasoline stocks fell by 0.724 million barrels, while analysts had
expected a gain of 0.100 million barrels. Distillate stocks climbed by 5.495
million barrels, while analysts had forecast an increase of 1.771 million
barrels.
Meanwhile, oil
production in the U.S. decreased by 100,000 barrels a day to 11.400 million
barrels a day.
U.S. crude oil imports averaged 7.2 million barrels per day last week, increased by 2.0 million barrels per day from the previous week.
FXStreet reports that according to economists at TD Securities, with the Q1 and March GDP data to capture the start of the lockdown period, there is little informational value for CAD to reflect concern. The 1.37 handle should be sticky while 1.3850 offers resistance for the USD/CAD.
“Consistent with Statistics Canada's nowcast, we expect a decline of roughly 10% annualized. The drop should be driven largely by consumer spending (-13.6%), underpinned by a roughly 25% anticipated drop in services spending.”
The CAD, like much of its dollar bloc peers, has latched itself onto two factors: broad USD variation and equities. Indeed, USDCAD's move below 1.40 has largely been a reflection of the USD leg rather than CAD bullishness.”
“We are looking to the 1.3700/30 area as providing some interim support in the coming weeks. Resistance is located at 1.3850.”
The National
Association of Realtors (NAR) announced on Thursday its seasonally adjusted
pending home sales index (PHSI) tumbled 21.8 percent m-o-m to 69.0 in April,
after a 20.8 percent m-o-m decline in March.
Economists had
expected pending home sales to decrease 15 percent m-o-m in April.
On y-o-y basis,
the index sank 33.8 percent after a 16.3 percent plunge in March.
According to
the report, all regional indices recorded m-o-m declines in April. The
Northeast PHSI slumped 48.2 percent m-o-m to 42.6 in April, 52.6 percent lower
than a year ago. In the Midwest, the index dropped 15.9 percent m-o-m to 72.0
last month, down 26.0 percent from April 2019. Pending home sales in the South fell
15.4 percent m-o-m to an index of 87.6 in April, a 29.6 percent drop from April
2019. The index in the West decreased 20.0 percent m-o-m in April 2020 to 57.1,
down 37.2 percent from a year ago.
However, Lawrence
Yun, NAR’s chief economist, expects that April will be the lowest point for
pending contracts, and the month of May, consequently, will be the lowest point
for closed sales. “While coronavirus mitigation efforts have disrupted contract
signings, the real estate industry is ‘hot’ in affordable price points with the
wide prevalence of bidding wars for the limited inventory,” he said. “In the
coming months, buying activity will rise as states reopen and more consumers
feel comfortable about homebuying in the midst of the social distancing
measures.”
The U.S.
Commerce Department reported on Thursday that the durable goods orders tumbled 17.2
percent m-o-m in April, following a revised 16.6 percent m-o-m plunge in February
(originally a 14.4 percent m-o-m decline). That was the biggest drop in durable
goods orders since August 2014.
Economists had
forecast a 19.0 percent m-o-m slump.
According to
the report, orders for durable goods excluding transportation fell 7.4 percent
m-o-m in April, following a revised 1.7 percent m-o-m decrease in March
(originally a drop of 0.2 percent m-o-m), much better than the economists’ forecast
of 14.0 percent m-o-m decline.
Meanwhile,
orders for non-defense capital goods excluding aircraft, a closely watched
proxy for business spending plans, decreased 5.8 percent m-o-m in April after a
revised 1.1 percent fall m-o-m in March (originally a 0.1 percent m-o-m decrease).
Economists had called for a 10.0 percent m-o-m plunge in core capital goods orders
in March.
Shipments of these core capital goods fell 5.4 percent
m-o-m in April after a 1.2 percent m-o-m drop in the prior month.
A report from
the Commerce Department showed on Thursday that the U.S. economy contracted
more rapidly than initially thought in the first quarter of 2020, due to a
downward revision to private inventory investment was partly offset by upward
revisions to personal consumption expenditures (PCE) and nonresidential fixed
investment.
According to the
second estimate, the U.S. gross domestic product (GDP) fell at a 5.0 percent
annual rate in the first quarter, faster than a 4.8 percent drop reported in
the advance estimate.
Economists had
expected the decline rate to stay unrevised at 4.8 percent, following the fourth
quarter's increase of 2.1 percent.
The decrease in
real GDP in the first quarter reflected negative contributions from PCE,
private inventory investment, nonresidential fixed investment, and exports that
were partly offset by positive contributions from residential fixed investment,
federal government spending, and state and local government spending. Imports,
which are a subtraction in the calculation of GDP, fell.
U.S. stock-index futures traded mixed on Thursday, as investors took a breather after a two-day rally that lifted the market to its best levels since early March. The risk sentiment was also suppressed by growing tensions between Washington and Beijing, especially after China's parliament voted to move forward with security legislation for Hong Kong.
Global Stocks:
Index/commodity | Last | Today's Change, points | Today's Change, % |
Nikkei | 21,916.31 | +497.08 | +2.32% |
Hang Seng | 23,132.76 | -168.60 | -0.72% |
Shanghai | 2,846.22 | +9.42 | +0.33% |
S&P/ASX | 5,851.10 | +76.10 | +1.32% |
FTSE | 6,210.52 | +66.27 | +1.08% |
CAC | 4,741.29 | +52.55 | +1.12% |
DAX | 11,733.59 | +75.90 | +0.65% |
Crude oil | $32.69 | -0.37% | |
Gold | $1,737.20 | +1.55% |
(company / ticker / price / change ($/%) / volume)
3M Co | MMM | 160.5 | 2.35(1.49%) | 20172 |
ALCOA INC. | AA | 9.9 | 0.14(1.43%) | 26399 |
ALTRIA GROUP INC. | MO | 39.5 | 0.45(1.15%) | 13873 |
Amazon.com Inc., NASDAQ | AMZN | 2,381.36 | -29.03(-1.20%) | 31303 |
American Express Co | AXP | 103 | 1.77(1.75%) | 77524 |
AMERICAN INTERNATIONAL GROUP | AIG | 31.97 | 0.46(1.46%) | 3136 |
Apple Inc. | AAPL | 315.69 | -2.42(-0.76%) | 280898 |
AT&T Inc | T | 32.01 | 0.16(0.50%) | 97398 |
Boeing Co | BA | 156.86 | 7.34(4.91%) | 1046050 |
Caterpillar Inc | CAT | 124.35 | 1.93(1.58%) | 22426 |
Chevron Corp | CVX | 94.23 | 0.33(0.35%) | 23180 |
Cisco Systems Inc | CSCO | 45.49 | -0.47(-1.02%) | 69699 |
Citigroup Inc., NYSE | C | 53.16 | 0.90(1.72%) | 186619 |
Deere & Company, NYSE | DE | 155.92 | 2.56(1.67%) | 2788 |
E. I. du Pont de Nemours and Co | DD | 49.49 | 0.33(0.67%) | 634 |
Exxon Mobil Corp | XOM | 46.58 | 0.34(0.74%) | 94292 |
Facebook, Inc. | FB | 223.47 | -5.67(-2.47%) | 371955 |
FedEx Corporation, NYSE | FDX | 130.31 | -0.12(-0.09%) | 7607 |
Ford Motor Co. | F | 6.04 | 0.01(0.17%) | 530294 |
Freeport-McMoRan Copper & Gold Inc., NYSE | FCX | 9.33 | 0.04(0.43%) | 33708 |
General Electric Co | GE | 7.48 | 0.19(2.61%) | 1504361 |
General Motors Company, NYSE | GM | 27.75 | -0.04(-0.14%) | 33217 |
Goldman Sachs | GS | 212.52 | 2.86(1.36%) | 51852 |
Google Inc. | GOOG | 1,399.77 | -18.07(-1.27%) | 6707 |
Hewlett-Packard Co. | HPQ | 15.97 | -1.15(-6.72%) | 239972 |
Home Depot Inc | HD | 249.75 | 2.39(0.97%) | 25484 |
Intel Corp | INTC | 62.79 | -0.77(-1.21%) | 71809 |
International Business Machines Co... | IBM | 127.04 | 1.50(1.19%) | 19268 |
Johnson & Johnson | JNJ | 145.98 | 1.09(0.75%) | 34657 |
JPMorgan Chase and Co | JPM | 103.38 | 2.01(1.98%) | 194407 |
McDonald's Corp | MCD | 190.5 | 2.78(1.48%) | 21903 |
Merck & Co Inc | MRK | 78.28 | 0.73(0.94%) | 29290 |
Microsoft Corp | MSFT | 179.6 | -2.21(-1.22%) | 215017 |
Nike | NKE | 100.49 | 0.62(0.62%) | 32326 |
Pfizer Inc | PFE | 37.66 | 0.25(0.67%) | 25743 |
Procter & Gamble Co | PG | 115.15 | 1.26(1.11%) | 20380 |
Starbucks Corporation, NASDAQ | SBUX | 78.9 | 0.30(0.38%) | 15721 |
Tesla Motors, Inc., NASDAQ | TSLA | 813 | -7.23(-0.88%) | 64510 |
The Coca-Cola Co | KO | 47.37 | 0.64(1.37%) | 62281 |
Travelers Companies Inc | TRV | 108.4 | 1.58(1.48%) | 16727 |
Twitter, Inc., NYSE | TWTR | 31.33 | -1.74(-5.26%) | 949959 |
UnitedHealth Group Inc | UNH | 307.67 | 3.90(1.28%) | 20855 |
Verizon Communications Inc | VZ | 55.68 | 0.54(0.98%) | 27290 |
Visa | V | 194.18 | 1.36(0.71%) | 35681 |
Wal-Mart Stores Inc | WMT | 123.3 | 0.82(0.67%) | 33973 |
Walt Disney Co | DIS | 121.6 | 0.07(0.06%) | 101719 |
Yandex N.V., NASDAQ | YNDX | 41.01 | 0.34(0.84%) | 3313 |
The data from
the Labor Department revealed on Thursday the number of applications for
unemployment reduced last week to the lowest level since the U.S. economy went
into lockdown made to fight the COVID-19 pandemic, but still remained high.
According to
the report, the initial claims for unemployment benefits totaled 2,123,000 for
the week ended May 23. That brings the number of job losses over the past ten weeks to more than 40 million.
Economists had
expected 2,100,000 new claims last week.
Claims for the
prior week were revised upwardly to 2,446,000 from the initial estimate of 2,438,000.
Meanwhile, the
four-week moving average of claims fell to 2,608,000 from a revised 3,044,000
in the previous week.
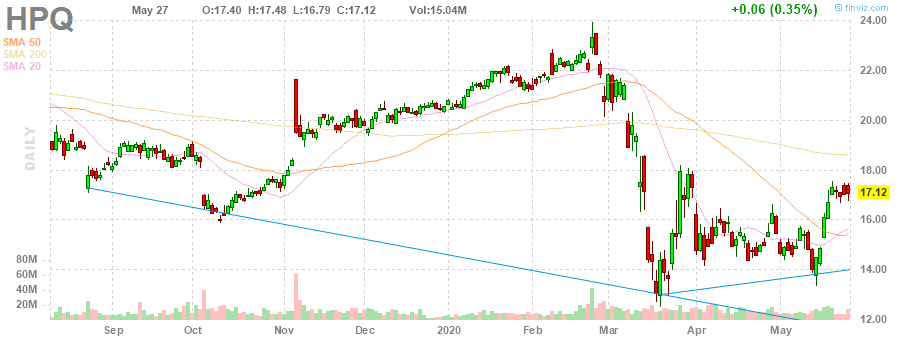
HP (HPQ) downgraded to Neutral from Overweight at JP Morgan; target $20
Walt Disney (DIS) downgraded to Underperform at Imperial Capital; target lowered to $105
| Time | Country | Event | Period | Previous value | Forecast | Actual |
|---|---|---|---|---|---|---|
| 09:00 | Eurozone | Industrial confidence | May | -32.5 | -27 | -27.5 |
| 09:00 | Eurozone | Consumer Confidence | May | -22 | -18.8 | -18.8 |
| 09:00 | Eurozone | Business climate indicator | May | -1.99 | -2.43 | |
| 09:00 | Eurozone | Economic sentiment index | May | 64.9 | 70.3 | 67.5 |
| 12:00 | Germany | CPI, m/m | May | 0.4% | -0.1% | -0.1% |
| 12:00 | Germany | CPI, y/y | May | 0.9% | 0.6% | 0.6% |
| 12:30 | U.S. | Continuing Jobless Claims | May | 24912 | 25750 | 21052 |
| 12:30 | Canada | Current Account, bln | Quarter I | -9.3 | -10 | -11.1 |
| 12:30 | U.S. | Initial Jobless Claims | May | 2446 | 2100 | 2123 |
| 12:30 | U.S. | Durable Goods Orders ex Transportation | April | -1.7% | -14% | -7.4% |
| 12:30 | U.S. | Durable Goods Orders | April | -16.6% | -19% | -17.2% |
| 12:30 | U.S. | Durable goods orders ex defense | April | -17.4% | -16.2% | |
| 12:30 | U.S. | PCE price index, q/q | Quarter I | 1.4% | 1.3% | 1.3% |
| 12:30 | U.S. | PCE price index ex food, energy, q/q | Quarter I | 1.3% | 1.8% | 1.6% |
| 12:30 | U.S. | GDP, q/q | Quarter I | 2.1% | -4.8% | -5% |
GBP changed little against most other major currencies in the European session on Thursday amid concerns over an impasse in Brexit trade talks and speculations about negative interest rates.
The UK told the European Union (EU) on Wednesday that it needed to break an impasse to get a Brexit trade deal by the end of the year. British Prime Minister Boris Johnson will travel to Brussels next month to evaluate the progress of Brexit trade talks. The current transition period will end on December 31. The UK's government continues to insist that the transition period is not to be extended.
The threat of negative rates also continues to weigh on the pound.The Bank of England's (BoE) policymaker Michael Saunders refused to rule out negative rates. When asked about his views on taking the key interest below zero, Saunders said he had nothing to add to last week's remarks from the BoE's governor Andrew Bailey. "I'm not going to get into the detail of [negative rates]," he said. "We review out policy toolkit, all aspects of it, on a regular basis, and so if we have got more to say on that, we will say so.
The general risk sentiment was also suppressed by rising tensions between the U.S. and China, especially after China's parliament voted to move forward with security legislation for Hong Kong.
Germany's
Federal Statistical Office (Destatis) reported on Thursday the country’s
consumer price index (CPI) is expected to decrease 0.1 m-o-m in May after gaining
0.4 percent m-o-m in the previous month.
On the y-o-y
basis, Germany’s inflation rate is seen to rise 0.6 percent this month,
following a 0.9 percent advance in April. That is the lowest inflation rate since
September 2016.
Economists had
predicted inflation would drop 0.1 percent m-o-m, but would increase 0.6
percent y-o-y in May.
According to the
report, food price growth decelerated to 4.5 percent y-o-y in May from 4.8
percent y-o-y in April, while energy prices fell 8.5 percent y-o-y after a 5.8
percent y-o-y drop in the previous month. Services costs rose 1.3 percent y-o-y
in May, the same pace as in April.
Meanwhile, the
harmonized index of consumer prices for Germany (HICP), which is calculated for
European purposes, is expected to be flat m-o-m and to increase 0.5 percent
y-o-y.
FXStreet notes that EUR/GBP has held key support at 0.8875 as expected to maintain its base and economists at Credit Suisse stay biased higher with the “measured base objective” at 0.9057.
“We look for a clear break above a cluster of key resistances at 0.8976/94 (including the 38.2% retracement of the March/April fall and ‘neckline’ to the March top) with the ‘measured base objective’ then at 0.9057. Although a pullback from here should be allowed for, we look for a break in due course with resistance next at the 50% retracement of the fall from March at 0.9086 and eventually the 61.8% retracement at 0.9184.”
“Support moves to 0.8931 initially, then the 13-day average at 0.8916. Beneath 0.8888/78 is now needed to warn of a potentially more important topside failure with support then seen next at 0.8826 ahead of the uptrend from March at 0.8821.”
HP (HPQ) reported Q2 FY 2020 earnings of $0.51 per share (versus $0.53 per share in Q2 FY 2019), beating analysts’ consensus estimate of $0.45 per share.
The company’s quarterly revenues amounted to $12.469 bln (-11.2% y/y), missing analysts’ consensus estimate of $12.781 bln.
The company also issued in-line guidance for Q3 FY 2020, projecting EPS of $0.39-0.45 versus analysts’ consensus estimate of $0.45.
HPQ fell to $16.05 (-6.25%) in pre-market trading.
FXStreet notes that EUR/JPY continues to rally strongly after establishing a base and Credit Suisse’s bias stays higher with the next resistance at the April highs at 119.01/04 and the 200-day average at 119.26.
“We see resistance at the April highs at 119.01/04 and with the falling 200-day average not far above at 119.26, we would expect this to cap at first. A break in due course though can expose the medium-term, downtrend from September 2018, today at 120.00.”
“Near-term support is seen higher at 118.61/51, then 118.14, with yesterday’s low and moving average cluster at 117.70/53 now ideally holding further weakness.”
- Nothing to add on negative rates beyond what BoE governor Bailey remarked last week
- It's possible that gilt yields would not fall much below BoE bank rate with more QE, but it's still worth doing
USD/CNH now looks to 7.2000 - UOB
FXStreet reports that FX Strategists at UOB Group keep the bullish bias unaltered in USD/CNH, with the next level of relevance at 7.2000.
24-hour view: “We highlighted yesterday that ‘a clear break of last week’s 7.1645 top could lead to a rush higher in USD’. USD subsequently blast past 7.1645 and soared to 7.1966 before easing off. Upward momentum remains robust and further USD strength would not be surprising. That said, overbought conditions suggest that any advance above 7.2000 may not be sustainable. Support is at 7.1680 but only a breach of 7.1600 would indicate that the current strong advance is ready to take a breather.”
Next 1-3 weeks: “We warned yesterday ‘the risk of USD breaking above 7.1652 has increased’ and highlighted that such a move ‘could potentially lead to a sharp and rapid rise’. While the subsequent rally did not break the major 7.2000 level (high of 7.1966), strong upward momentum suggests the risk for the coming days is still on the upside. Note that the record high was at 7.1960 in September last year and from here, a break of 7.2000 could potentially lead to further strong gains as once above this ‘round number’ resistance, the next resistance level of note is nearer to 7.2400. All in, the current positive outlook is deemed as intact as long as USD holds above 7.1400 (‘strong support’ level was at 7.1100 yesterday).”
- It is safer to err on the side of easing too much
- And then tightening later if needed
- Risks to economy are to the downside
- But with limited policy space, there is less scope to get the economy back on track
- Some recovery in economic activity is likely as lockdown eases
- A relatively slow recovery would be costly
- Sees risks of UK falling into slip into lowflation trap that is much harder to escape
- The risks of a pickup in inflation are pretty negligible
- Picture of a dramatic fall in output is clear-cut
FXStreet reports that above key resistance at 1.1009/19 on a closing basis, EUR/USD would mark an important base with resistance then seen at 1.1145/66, per Credit Suisse.
“A close 1.1019 would see a base achieved to mark a more significant turn higher with resistance next at 1.1065, then 1.1145/66 – the late March high and 61.8% retracement of the March collapse. Whilst we would expect to cap at first, a direct break can see resistance next at 1.1237, with the 78.6% retracement at 1.1311 and with the 38.2% retracement of the entire 2018/2020 bear trend at 1.1369.”
“Support is seen at 1.0984 initially then 1.0955, with the 13-day average and yesterday’s low at 1.0934/32 needing to hold to keep the immediate risk higher in the range. A break can see a fall back to 1.0870/64.”
Reuters reports that China will strive to achieve positive economic growth this year, Premier Li Keqiang said on Thursday, adding that growth remained important even though the government had not set any target for the first time in years.
China does not need a massive stimulus but liquidity will be increased because "exceptional situations call for exceptional measures", Li said during his once-a-year news conference following the close of the annual meeting of parliament.
US, China decoupling will not be good for both sides or the world
US, China stand to gain from cooperation, lose from confrontation
US, China should expand common interests
According to the report from European Commission, in May 2020, economic sentiment on the continent showed first signs of a recovery after the record slumps of March and April. The Economic Sentiment Indicator (ESI) edged up in both the euro area (by 2.6 points to 67.5) and the EU (by 2.9 points to 66.7).1 The Employment Expectations Indicator (EEI) led the way, bouncing back by 11.3 points in both areas to – still historically low – levels of 70.2 (euro area) and 70.9 (EU) points.
In the euro area, the ESI’s uptick reflected a recovery in industry and consumer confidence which neutralised about a fifth of the combined slump of March and April. Services confidence, by contrast, continued declining, albeit at a lower rate than in the preceding two months. Changes in construction and retail trade confidence were much more contained, with the former posting a small decline and the latter remaining virtually flat.
The recovery in industry confidence (+5.0) was entirely attributable to a vivid improvement in managers’ production expectations which reversed roughly half of the decline registered over March and April. Services confidence continued declining (-5.0), but at a
lower pace than in March and April. While views on the past business situation and past demand got, again, much worse, significantly improved demand expectations provided a glimmer of hope for the months to come. Consumer confidence recovered (+3.2) on the back of households’ much improved expectations in respect of their financial conditions, their intentions to make major purchases and the general economic situation. Construction confidence fell slightly (-1.3), as the assessments of the level of order books continued plummeting, but managers’ employment expectations brightened significantly. Finally, financial services confidence (not included in the ESI) edged up (+3.3), as the persisting downward trend in the assessments of the past business situation and past demand was outweighed by a turnaround in managers’ demand expectations.
FXStreet reports that sentiment in the commodity market remains fragile amid rising geopolitical tensions as crude oil fell as the prospect of rising supply rattled sentiment, strategists at ANZ Bank apprise.
“Yesterday it emerged that Russia was determined to ease back on output cuts in July. Even though this complies with the supply agreement, it disappointed the market.”
“Some confidence in the supply agreement was strengthened after Russia’s President Putin and Saudi Arabia’s Crown Prince bin Salman reiterated their cooperation.”
“The market was reminded of the fragile nature of the recovery, with signs that gasoline demand in the US remains low. The US Memorial Day holiday usually marks the start of the peak demand season. However, early estimates suggest gasoline demand was down by nearly 30% from last year as people stay close to home.”
Bloomberg reports that prime Minister Shinzo Abe says Japan’s virus response measures are the world’s biggest, but economists say the packages won’t be the last.
The cabinet approved measures Wednesday that double Japan’s stimulus to about 40% of gross domestic product. Masaki Kuwahara at Nomura Securities is among economists who say a third or even fourth extra budget will be needed because the first two, as big as they are, only limit the economic damage from coronavirus, but don’t boost demand as needed for a strong recovery.
Japan’s latest stimulus package goes well beyond what was expected, but Kuwahara doesn’t expect the recession to be more shallow because of it. Since the measures focus on giving lifelines to households and keeping businesses from going bankrupt, rather than getting people to spend more, Kuwahara isn’t raising his forecasts. He still sees the economy shrinking 23.9% this quarter, and rebounding only 13% the next.
“I’m not changing my view because the new stimulus measures won’t increase demand,” he said. “Just because the size is big, that doesn’t mean the impact will be big.”
It’s not just the dearth of demand that will inevitably require more government spending. There’s also the lure of the Tokyo Olympics, which had to be postponed because of the virus.
Policy makers are hoping to hold the games next year, but Japan will need to get back on its feet quickly to do so, according to economist Yoshimasa Maruyama at SMBC Nikko Securities.
“The economy won’t be able to survive unless they do a third extra budget in the summer,” he said. “Without that, I don’t think the economy will be able to recover to a point where we can host the Olympics.”
CNBC reports that the European Union needs to agree on additional coronavirus-related stimulus “in the coming months,” a top EU official told, after a ground-breaking plan to help the region was proposed Wednesday.
The European Commission, the executive arm of the EU, proposed to raise 750 billion euros ($826 billion) in public markets and distribute that money in the form of grants and loans to the 27 EU countries. However, some nations are reluctant to approve the idea as it would mark the first time the EU tapped financial markets together on such a large scale.
The proposal needs to be agreed upon by EU members before it can be implemented.
“We cannot delay (an agreement),” Valdis Dombrovskis, executive vice president of the European Commission, told CNBC in an exclusive interview.
“We need an agreement already in the coming months.”
The coronavirus has hit Europe’s economy hard. The European Central Bank, in charge of monetary policy across 19 EU countries, forecasts a 15% contraction in GDP in the second quarter alone. Meanwhile, the European Commission said in early May that the 27 EU countries together could contract by 7.4% this year.
Speaking to CNBC, Dombrovskis said the additional coronavirus stimulus was not yet pre-allocated but Italy, Spain, France, Poland and Germany are expected to receive “substantial amounts of money.”
FXStreet reports that Bart Melek, Head of Commodity Strategy at TD Securities (TDS), said in the latest client note, gold prices will eventually turn out a winner, in the wake of the US-China tensions and global efforts to drive inflation higher.
“I think the potential for a new trade war with China could be a trigger for new gold buying.
Gold prices will continue to be caught in a tug-of-war between deflation and inflation.
The global economy continues to face deflationary threats as the world adjusts to lower growth expectations as the COVID-19 pandemic has decimated the global economy.
Deflation will push real interest rates higher, making gold less attractive.
Governments and central banks have said that they will do whatever it takes to drive economic growth back to normal levels.
This reaction will drive inflation and push real yields back down and gold prices higher.”
According to the ifo Economic Forecast 2020 Update, the German economy will probably shrink by 6.6 percent this year and then grow from this low level by 10.2 percent next year, according to the updated ifo Economic Forecast for 2020/2021.
“This is based on our evaluation of the ifo survey conducted among companies in May. On average, participants consider it most likely that their own business situation will return to normal in nine months,” says Timo Wollmershaeuser, Head of Forecasts at ifo.
“This means that, after a sharp slump of 12.4 percent in the second quarter of 2020, the economy ought to recover by the middle of next year. Only then will production of goods and services attain the level it would have reached without the coronavirus crisis,” Wollmershaeuser adds.
However, the forecast depends heavily on how quickly companies’ business situation returns to normal. In the best case, companies indicate that this might take an average of only five months. Economic output would then shrink by only 3.9 percent this year, with growth next year reaching 7.4 percent. In the worst case, with an average normalization period of 16 months, economic output would shrink by 9.3 percent this year and grow by 9.5 percent next year. The recovery would then be drawn out well into 2022.
| Time | Country | Event | Period | Previous value | Forecast | Actual |
|---|---|---|---|---|---|---|
| 01:00 | New Zealand | ANZ Business Confidence | May | -66.6 | -41.8 | |
| 01:30 | Australia | Private Capital Expenditure | Quarter I | -2.6% | -2.6% | -1.6% |
During today's Asian trading, the US dollar fell moderately against the euro and rose against the Japanese yen.
Support for the euro continues to be provided by optimism about the economic recovery plan after the coronavirus.
The European Commission on Wednesday presented an unprecedented plan to support the region's economy, providing a total of 750 billion euros in grants and loans to EU countries to recover from the crisis caused by the COVID-19 coronavirus pandemic.
European Commission President Ursula von der Leyen, who unveiled the plan at the plenary session of the European Parliament in Brussels, said that 500 billion euros of the total amount will be subsidies, and 250 billion euros - loans to EU countries. The program will be adopted only if it receives the approval of all EU countries.
The ICE Dollar index, which shows the value of the US dollar against six major world currencies, fell by 0.21% compared to the previous trading day.
Growing tensions between the United States and China offset the optimism associated with the gradual opening of economies against the background of easing restrictions imposed due to the coronavirus pandemic.
Hong Kong no longer enjoys autonomy in relation to the Chinese authorities, US Secretary of State Mike Pompeo said.
CNBC reports that the Chinese yuan could weaken to as low as 7.40 against the U.S. dollar as tensions between Beijing and Washington show little signs of abating anytime soon.
That’s according to Marc Chandler, chief market strategist and managing partner at Bannockburn Global Forex.
“If you were to tell me what we’re gonna go ... toward 7.30, 7.40 on the (yuan against the dollar), I could see how that could happen because I don’t see how these tensions can ease in the next several months,” Chandler told CNBC.
As of Thursday morning, the onshore Chinese yuan traded at 7.1675 per dollar, while its offshore counterpart changed hands at 7.1855 against the greenback. A day earlier, the offshore yuan touched its weakest level against the dollar since Sep. 3, when the dollar traded as high as 7.1963 against the offshore currency.
The weakening of the yuan comes as tensions between China and the U.S. ramped up in recent days over a number of issues — from Beijing’s treatment of minority Uighur Muslims in the Xinjiang region to a proposed national security bill for Hong Kong that sparked a fresh wave of protests. The U.S. has also threatened sanctions on China.
At present, Chandler said, the People’s Bank of China appears to be “tolerating” the weakness in the Chinese yuan which “typically happens as the tensions with the U.S. escalate.”
“The Chinese do look like they’re tolerating or resisting very moderately the downward pressure on the (yuan),” the strategist said. He warned this could have a “spillover” impact beyond just the Chinese currency and the Hong Kong dollar, but also for Beijing’s competitors in East Asia or the broader emerging markets.
“I think this is the fear that people have … that China weakens and that is … the lead indicator of emerging markets as an asset class,” Chandler said.
FXStreet reports that FX Strategists at UOB Group remain constructive on EUR/USD and see extra gains on a close above 1.1020 in the near-term.
24-hour view: “Our expectation for the ‘rapid advance in EUR to take a breather’ was incorrect as it dropped briefly to 1.0932, snapped back up to 1.1030 before easing off to end the day at 1.1003 (+0.21%). Despite the overall choppy price actions, the underlying tone appears to be firm. For today, EUR could ratchet higher but is unlikely to break the strong resistance at 1.1050. On the downside, only a break of 1.0955 would indicate the current tentative upward pressure has eased.”
Next 1-3 weeks: “EUR continues to trade in a choppy manner as it surged and recouped most of last week’s decline (1.0980, +0.54%). The advance is quickly approaching the top our expected 1.0800/1.1000 range (overnight high of 1.0995) and upward momentum has ticked up. While the bias is tilted to the upside, EUR has to close above 1.1020 before a more sustained advance can be expected. In the meanwhile, the outlook for EUR is deemed as mildly positive as long as it does move below 1.0900 within these few days.”
Reuters reports that British employers turned a bit less pessimistic about hiring and investment this month as the government moved to relax its coronavirus lockdown of much of the economy, according to a survey published by a recruiting industry body.
The Recruitment & Employment Confederation’s Business confidence measure remained negative but rose to -10 from -21 in April. Short-term demand for permanent staff improved to -5 from -9.
“Coronavirus has caused a huge slowdown in the labour market, but this data indicates that the worst could be behind us,” REC chief executive Neil Carberry said.
Demand for workers in May was strongest in the health and care sector but was likely to rise more broadly, REC said.
Separately, the Institute of Directors said a quarter of its member firms using the government’s wage subsidy programme would struggle to contribute to the salaries of furloughed workers from August, raising the prospect of job losses.
A third survey, published by the Confederation of British Industry and covering the March-May period, showed companies in the services sector were more pessimistic about growth over the next three months than they have ever been.
Firms expected to cut back on investment in the year ahead at the fastest pace since the financial crisis, although to a lesser degree for information technology, the survey showed.
eFXdata reports that Citi likes NZD in G10 space and prefers shorts in AUD/NZD in the long-term.
"Kiwi is an outperformer in G10 as the country starts to grind back into gear. The outlook v AUD is very favourable and the debate in Australia “now is that’s its more likely that I can fly (from my Darling Point office in Sydney) to Queenstown before I can fly to Queensland or Western Australia (wouldn’t want to anyway)”. Citi notes.
"Longer term AUDNZD downside remains attractive," Citi adds.
CNBC reports that the U.S. coronavirus death toll crossed 100,000 as Dr. Anthony Fauci warned that states should not go “leapfrogging” over reopening guidelines.
California Governor Gavin Newsom said guidelines for reopening gyms and related businesses could be released within “a week or so” while New York Governor Andrew Cuomo told Republicans to “stop abusing” states hit hardest by the coronavirus.
South Korea reported a jump in cases that are largely attributed to an infection cluster in Bucheon, fuelling worries over a second wave of outbreak.
Global cases: More than 5.62 million
Global deaths: At least 353,000
U.S. cases: More than 1.68 million
U.S. deaths: More than 100,000
EUR/USD
Resistance levels (open interest**, contracts)
$1.1116 (2845)
$1.1078 (2540)
$1.1048 (1740)
Price at time of writing this review: $1.1017
Support levels (open interest**, contracts):
$1.0978 (702)
$1.0966 (1173)
$1.0947 (1655)
Comments:
- Overall open interest on the CALL options and PUT options with the expiration date June, 5 is 93243 contracts (according to data from May, 27) with the maximum number of contracts with strike price $1,0700 (5293);
GBP/USD
Resistance levels (open interest**, contracts)
$1.2414 (1212)
$1.2344 (610)
$1.2300 (296)
Price at time of writing this review: $1.2260
Support levels (open interest**, contracts):
$1.2212 (1369)
$1.2156 (1096)
$1.2119 (1131)
Comments:
- Overall open interest on the CALL options with the expiration date June, 5 is 23860 contracts, with the maximum number of contracts with strike price $1,3500 (3420);
- Overall open interest on the PUT options with the expiration date June, 5 is 30049 contracts, with the maximum number of contracts with strike price $1,3500 (3095);
- The ratio of PUT/CALL was 1.26 versus 1.25 from the previous trading day according to data from May, 27
* - The Chicago Mercantile Exchange bulletin (CME) is used for the calculation.
** - Open interest takes into account the total number of option contracts that are open at the moment.
| Raw materials | Closed | Change, % |
|---|---|---|
| Brent | 34.41 | -4.97 |
| Silver | 17.23 | 0.76 |
| Gold | 1709.101 | -0.08 |
| Palladium | 1932.28 | -0.7 |
| Index | Change, points | Closed | Change, % |
|---|---|---|---|
| NIKKEI 225 | 148.06 | 21419.23 | 0.7 |
| Hang Seng | -83.3 | 23301.36 | -0.36 |
| KOSPI | 1.42 | 2031.2 | 0.07 |
| ASX 200 | -5 | 5775 | -0.09 |
| FTSE 100 | 76.49 | 6144.25 | 1.26 |
| DAX | 153.04 | 11657.69 | 1.33 |
| CAC 40 | 82.5 | 4688.74 | 1.79 |
| Dow Jones | 553.16 | 25548.27 | 2.21 |
| S&P 500 | 44.36 | 3036.13 | 1.48 |
| NASDAQ Composite | 72.14 | 9412.36 | 0.77 |
| Time | Country | Event | Period | Previous value | Forecast |
|---|---|---|---|---|---|
| 01:00 | New Zealand | ANZ Business Confidence | May | -66.6 | |
| 01:30 | Australia | Private Capital Expenditure | Quarter I | -2.8% | -2.6% |
| 09:00 | Eurozone | Consumer Confidence | May | -22.0 | -18.8 |
| 09:00 | Eurozone | Industrial confidence | May | -30.4 | -27 |
| 09:00 | Eurozone | Business climate indicator | May | -1.81 | |
| 09:00 | Eurozone | Economic sentiment index | May | 67 | 70.3 |
| 12:00 | Germany | CPI, m/m | May | 0.4% | -0.1% |
| 12:00 | Germany | CPI, y/y | May | 0.9% | 0.6% |
| 12:30 | U.S. | Continuing Jobless Claims | May | 25073 | 25750 |
| 12:30 | Canada | Current Account, bln | Quarter I | -8.76 | -10 |
| 12:30 | U.S. | Initial Jobless Claims | May | 2438 | 2100 |
| 12:30 | U.S. | Durable Goods Orders ex Transportation | April | -0.2% | -14% |
| 12:30 | U.S. | Durable Goods Orders | April | -14.4% | -19% |
| 12:30 | U.S. | Durable goods orders ex defense | April | -15.8% | |
| 12:30 | U.S. | PCE price index, q/q | Quarter I | 1.4% | 1.3% |
| 12:30 | U.S. | PCE price index ex food, energy, q/q | Quarter I | 1.3% | 1.8% |
| 12:30 | U.S. | GDP, q/q | Quarter I | 2.1% | -4.8% |
| 14:00 | U.S. | Pending Home Sales (MoM) | April | -20.8% | |
| 15:00 | U.S. | Crude Oil Inventories | May | -4.983 | -2.5 |
| 15:00 | U.S. | FOMC Member Williams Speaks | |||
| 23:01 | United Kingdom | Gfk Consumer Confidence | May | -33 | |
| 23:30 | Japan | Tokyo CPI ex Fresh Food, y/y | May | -0.1% | -0.2% |
| 23:30 | Japan | Unemployment Rate | April | 2.5% | 2.7% |
| 23:30 | Japan | Tokyo Consumer Price Index, y/y | May | 0.2% | |
| 23:50 | Japan | Retail sales, y/y | April | -4.6% | -11.5% |
| 23:50 | Japan | Industrial Production (MoM) | April | -3.7% | -5.1% |
| 23:50 | Japan | Industrial Production (YoY) | April | -5.2% |
| Pare | Closed | Change, % |
|---|---|---|
| AUDUSD | 0.66151 | -0.45 |
| EURJPY | 118.538 | 0.45 |
| EURUSD | 1.10047 | 0.27 |
| GBPJPY | 132.031 | -0.43 |
| GBPUSD | 1.22595 | -0.59 |
| NZDUSD | 0.61799 | -0.23 |
| USDCAD | 1.37521 | -0.24 |
| USDCHF | 0.96794 | 0.24 |
| USDJPY | 107.698 | 0.16 |


© 2000-2026. All rights reserved.
This site is managed by Teletrade D.J. LLC 2351 LLC 2022 (Euro House, Richmond Hill Road, Kingstown, VC0100, St. Vincent and the Grenadines).
The information on this website is for informational purposes only and does not constitute any investment advice.
The company does not serve or provide services to customers who are residents of the US, Canada, Iran, The Democratic People's Republic of Korea, Yemen and FATF blacklisted countries.
Making transactions on financial markets with marginal financial instruments opens up wide possibilities and allows investors who are willing to take risks to earn high profits, carrying a potentially high risk of losses at the same time. Therefore you should responsibly approach the issue of choosing the appropriate investment strategy, taking the available resources into account, before starting trading.
Use of the information: full or partial use of materials from this website must always be referenced to TeleTrade as the source of information. Use of the materials on the Internet must be accompanied by a hyperlink to teletrade.org. Automatic import of materials and information from this website is prohibited.
Please contact our PR department if you have any questions or need assistance at pr@teletrade.global.
transfers