- Analytics
- News and Tools
- Market News
CFD Markets News and Forecasts — 28-02-2023
- The oil price has extended its correction to near $76.60 amid anxiety among investors ahead of Caixin Manufacturing PMI.
- Rising bets for a sheer economic recovery in China after the rollback of lockdown curbs are supporting an upside in PMI figures.
- A build-up of oil inventories by oil inventories at 6.20 million barrels, reported US API, is indicating weak demand.
West Texas Intermediate (WTI), futures on NYMEX, have corrected firmly after facing firmer barricades above $77.50 in the late New York session. The oil price has dropped $76.60 and is expected to remain on the tenterhooks as investors are awaiting the release of the Caixin Manufacturing PMI data for fresh impetus.
There is no denying the fact that global institutions and investment banking firms are gung-ho for solid economic recovery in China after its administration dismantled pandemic controls post a three-year lockdown period. China’s post-pandemic era is expected to be resilient as the People’s Bank of China (PBoC) has promised a sheer revival in domestic demand through expansionary monetary policy.
Investors were surprised by weak January’s Caixin Manufacturing PMI data and are now anxious for February figures as a continuation of a downbeat spell will spoil the market mood. Broadly, the market sentiment is still risk averse as investors are anticipating a gloomy outlook due to hawkish Western central banks. And, now weak China’s Manufacturing PMI will worsen investors' risk appetite further.
According to the consensus, IHS Markit will report Caixin Manufacturing PMI at 50.2, higher than the prior release of 49.2.
Apart from the Caixin Manufacturing PMI, the oil inventory report by the United States Energy Information Administration (EIA) for the week ending February 24 will be keenly watched.
On Tuesday, the US American Petroleum reported a huge pile of oil inventories at 6.20 million barrels but lower than the prior release of nearly 10 million barrels. Oil stockpiles are continuously rising for the past three months, indicating a sheer decline in the overall demand.
- GBP/JPY formed an inverted hammer, meaning sellers are in charge.
- The GBP/JPY would face strong support at the confluence of the 100/200/20-day EMAs.
- GBP/JPY Price Analysis: In the near term, it’s neutral to upward biased.
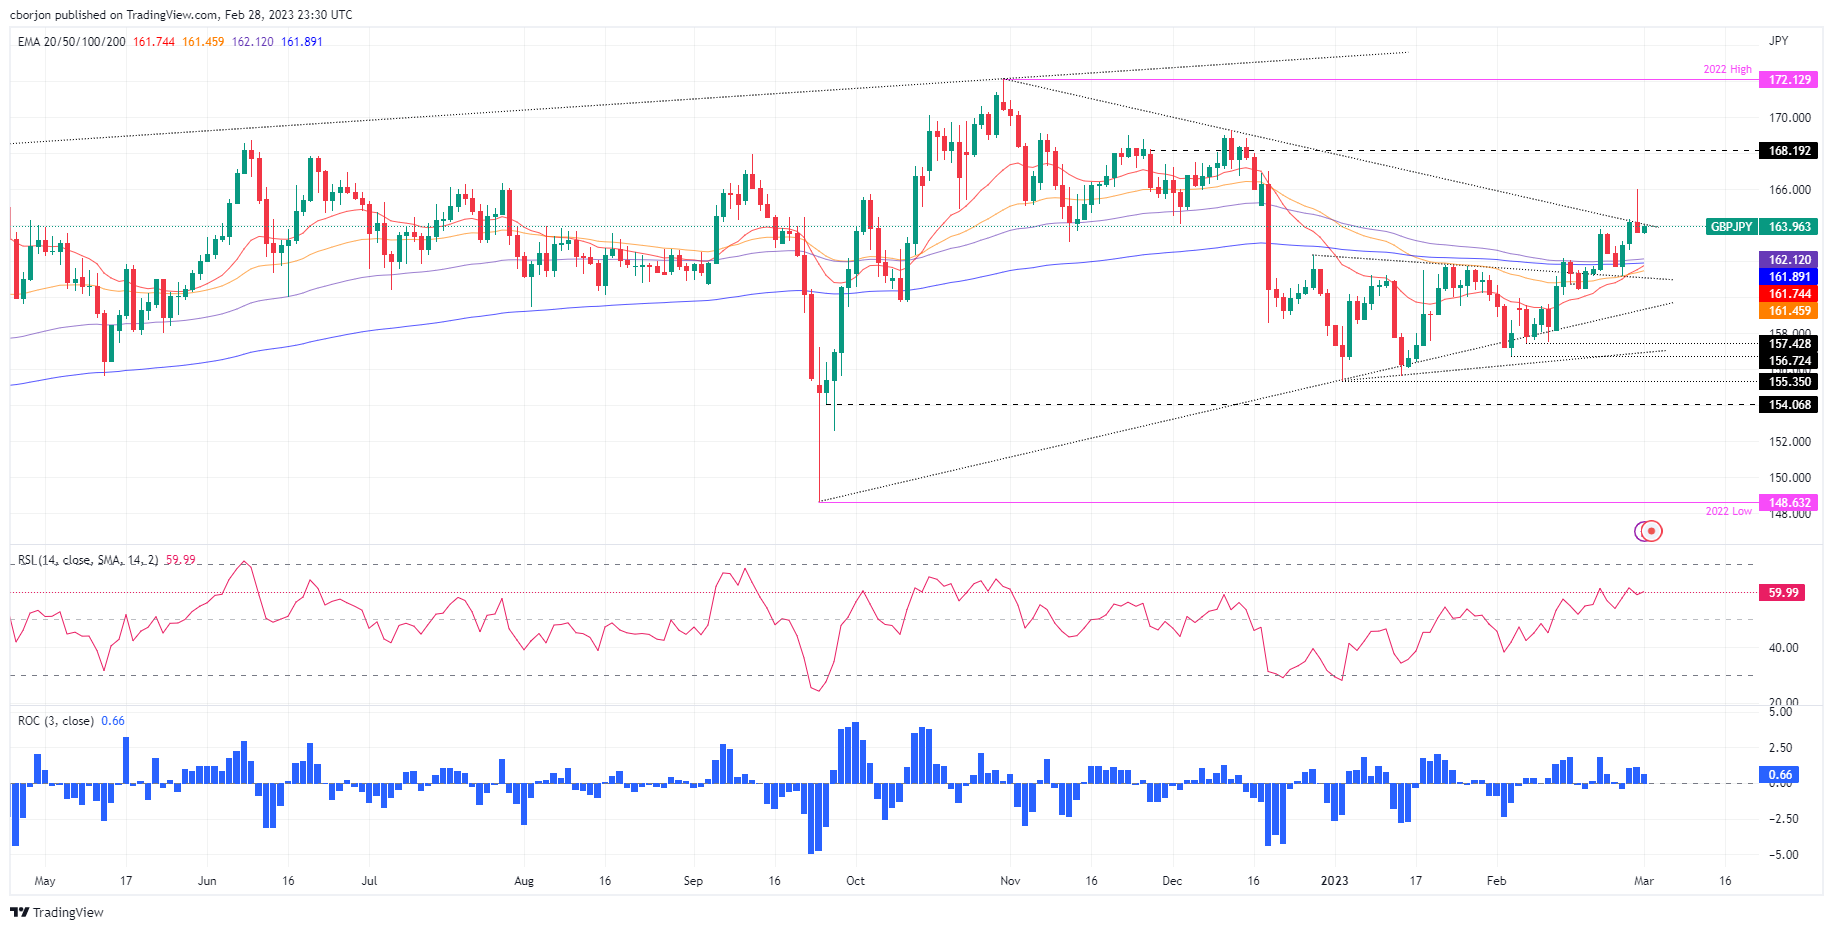
The GBP/JPY registers a minimal upside as Wednesday’s Asian session begins. On Tuesday, the GBP/JPY printed losses of 0.35% and formed an inverted hammer, meaning that further downside is expected. At the time of typing, the GBP/JPY exchanges hands at 163.90 after hitting a YTD high on Tuesday of 166.00.
GBP/JPY Price Action
After hitting a new year-to-date high, the GBP/JPY retraced more than 200 pips and achieved a daily close below 163.60. Traders should be aware that the cross-currency pair pierced a four-month-old downslope trendline, but buyers unable to commit to its longs and sellers stepping in around 166.00 dragged the exchange rates lower.
The Relative Strength Index (RSI), albeit in bullish territory, is almost flat, while the Rate of Change (RoC) suggests that buying pressure is waning. Therefore, further downside is expected.
Hence, the GBP/JPY first support would be the February 28 daily low of 163.58, which, once cleared, would exacerbate a fall toward the weekly low of 162.59. A breach of the latter would send the GBP/JPY toward the confluence of the 100 and the 20-day Exponential Moving Averages (EMAs) at around 161.89/74, respectively.
As an alternate scenario, the GBP/JPY first resistance would be 164.00. Once the GBP/JPY hurdles that level, and the 165.00 figure would be the next to be challenged by Pound Sterling (GBP) buyers, ahead of the YTD high at 166.00.
GBP/JPY Daily chart
GBP/JPY Key technical levels
Australian GDP overview
Reserve Bank of Australia’s (RBA) readiness for further increase in interest rates and expectations of solid economic recovery highlights Australia’s fourth-quarter (Q4) Gross Domestic Product (GDP) figures, up for publishing at 00:30 GMT on Wednesday, for the AUD/USD pair traders.
The recent data from Australia portray a mixed picture as downbeat housing market data, inflation numbers and mixed employment report contrasts with upbeat Retail Sales. Even with these statistics in mind, the Aussie Q4 GDP is likely to print slightly better figures and could lure the AUD/USD bulls.
That said, forecasts suggest the annualized pace of economic growth to come in at 2.7%, softer than the previous period's 5.9%, while the quarter-on-quarter (QoQ) numbers could mark the improvement with 0.8% growth figures versus 0.6% prior.
Ahead of the outcome, Westpac said,
The economy was in transition heading into year-end as earlier policy and reopening supports worked against the adverse impacts of inflation and interest rates. Hence, we anticipate a soft read for domestic demand, with solid consumer spending being partially offset by flatness in building work and a modest decline in business investment. Westpac’s revised forecast is 0.8% QoQ, 2.8% YoY.
How could it affect the AUD/USD?
AUD/USD grinds higher past 0.6700 amid upbeat expectations from the key economic data from Australia during early Wednesday. Adding strength to the recovery could be the US Dollar’s latest retreat, as well as hopes of more investments from China and the easing tussles between the Washington and Beijing after US President Joe Biden’s scaling back of the previous plans to restrict American investments in China, per Politico.
That said, Australia’s Q4 GDP is likely to carry less importance for the pair traders, considering the present focus on the risk-aversion and hawkish Fed bets, as well as the key events lined up for publishing in March, including China PMI and Fed meetings. Also likely to dilute the importance of the data is the latest Reserve Bank of Australia (RBA) monetary policy meeting that failed to impress the hawks despite showing readiness to inflation the benchmark rate.
Hence, positive data from Australia might offer a knee-jerk rebound in the AUD/USD prices but not affect the overall bearish trend. On the contrary, downbeat figures won’t hesitate to please bears with a fresh multi-month low.
Technically, AUD/USD seesaws around the 100-DMA and an upward-sloping support line from late November 2022, highlighting the importance of the 0.6700 support. However, bears remain hopeful of meeting the last December’s low near 0.6630 unless the quote rises past the 200-DMA hurdle surrounding 0.6800.
Key notes
AUD/USD grinds above 0.6700 as Australia GDP, China/US PMI loom
AUD/USD Forecast: The 0.6700 area still critical, Australian data in focus
About the Aussie GDP release
The Gross Domestic Product released by the Australian Bureau of Statistics is a measure of the total value of all goods and services produced by Australia. The GDP is considered a broad measure of economic activity and health. A rising trend has a positive effect on the AUD, while a falling trend is seen as negative (or bearish) for the AUD.
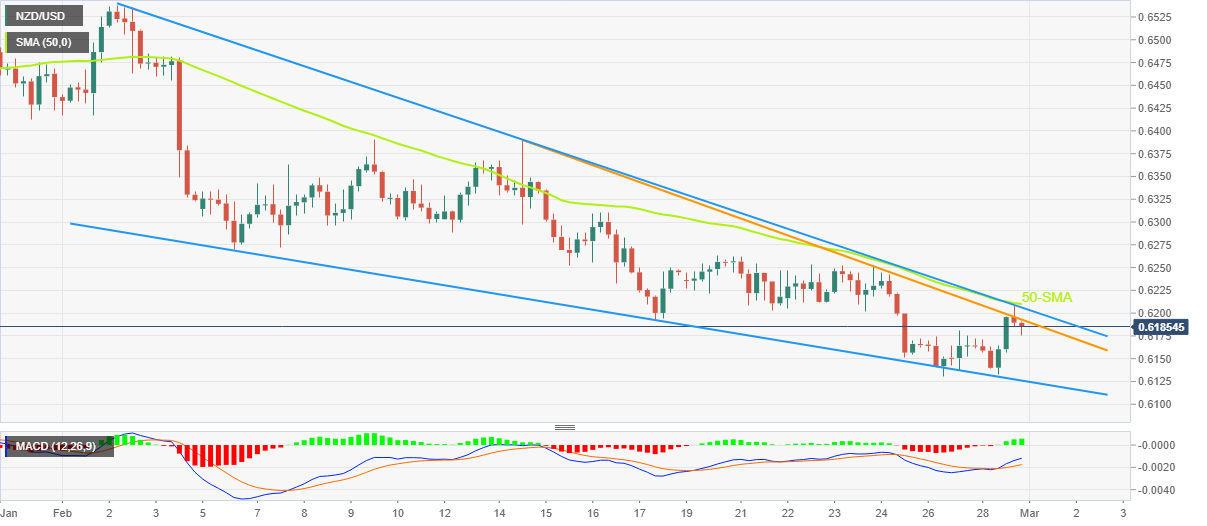
- NZD/USD struggles inside one-month-old bullish chart formation after easing from weekly top.
- Bullish MACD signals add strength to the upside bias.
- Sellers need validation from mid-November 2022 low for further dominance.
NZD/USD picks up bids to reverse the previous day’s pullback from an important resistance surrounding 0.6200 during early Wednesday. In doing so, the Kiwi pair appears softer within the one-month-long falling wedge bullish chart formation.
In addition to the latest pick-up, the bullish MACD signals also add strength to the recovery hopes.
However, a two-week-old descending resistance line, close to the 0.6200 round figure, restricts the immediate upside of the quote.
Following that, a convergence of the 50-bar Simple Moving Average (SMA) and the stated falling wedge’s top line seems a tough nut to crack for the NZD/USD buyers around 0.6210.
In a case where the Kiwi pair remains firmer past 0.6210, the mid-February high near 0.6390 and the previous monthly top surrounding 0.6540 could act as intermediate halts during the theoretical run-up targeting the 0.6600 threshold.
On the flip side, pullback moves may witness multiple hurdles near 0.6170 and 0.6130 before poking the stated wedge’s lower line, close to 0.6120 by the press time.
Even if the NZD/USD bears defy the bullish chart pattern by breaking the 0.6120 support, lows marked during mid-November 2022, around 0.6060 could challenge the pair’s further downside.
NZD/USD: Daily chart
Trend: Further upside expected
- USD/CHF is marching towards 0.9430 as investors’ risk appetite has trimmed dramatically.
- The street is expecting that US recession fears cannot be ignored as the Fed has decided to announce more rates.
- Switzerland’s government admitted that it expects an economic slowdown but no recession this year.
The USD/CHF pair is facing fragile hurdles after a sheer run-up of around 0.9420 in the early Tokyo session. The Swiss Franc asset is expected to continue its vertical run as investors are gung-ho for safe-haven assets to dodge sheer volatility.
Federal Reserve (Fed) policymakers have kept on reiterating that the current monetary policy is not sufficiently restrictive enough to bring down the persistent inflation in the near period. Therefore, investors should brace for more rate hikes to cool down the Consumer Price Index (CPI) significantly.
Gains generated by S&P500 on Monday were surrendered in Tuesday’s session as the street is anticipating that recession fears cannot be ignored as the Fed has decided to announce more rates through summer to trim the stubbornness in the United States inflation. The US Dollar Index (DXY) has displayed a responsive buying action and has crossed the critical resistance of 104.60 amid a decline in investors’ risk appetite. Meanwhile, the alpha delivered on the 10-year US Treasury yields has scaled marginally higher to near 3.93%.
Contrary to the hawkish stance supported by the street, Vassili Serebriakov, FX strategist, at UBS said “The disinflation story continues. It took a bit of a pause in January, but it's not a reversal. We think some of the dollar strength is exaggerated. So we are cautiously fading dollar strength.”
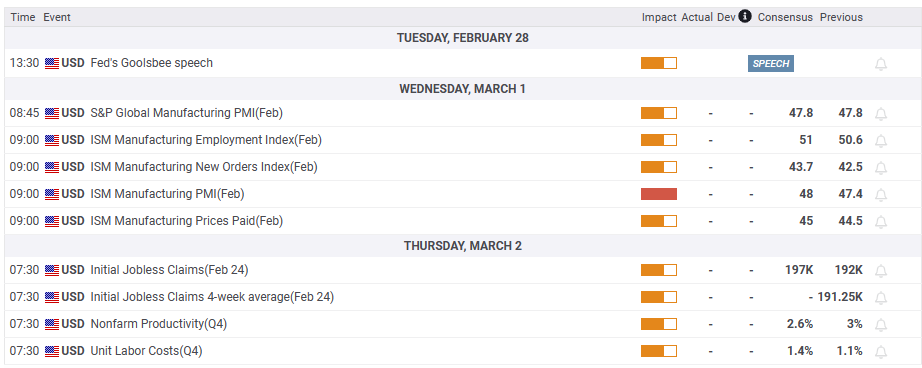
On Wednesday, USD/CHF will remain in action amid the release of the US ISM Manufacturing PMI data. The economic data has been reporting a figure below 50.0 for the past three months and a similar performance is expected today, however, the scale of contraction will be lower. The economic data is seen at 48.0 from the former release of 47.4, posing a gloomy outlook for the US economy ahead.
Meanwhile, the Swiss Franc witnessed pressure after a flat Gross Domestic Product (GDP) (Q4) release on Tuesday. The street was expecting a growth of 0.3%. Switzerland’s government said in a statement on Tuesday that it expects an economic slowdown but no recession this year.
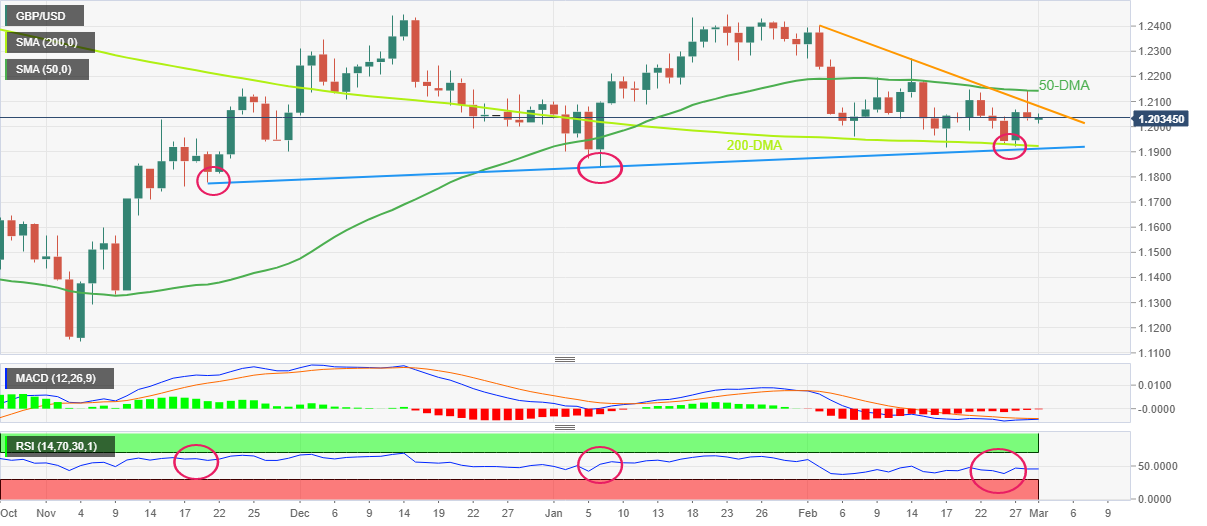
- GBP/USD renews attempt to cross the 50-DMA hurdle amid bullish RSI divergence, sustained trading beyond the key technical support.
- Convergence of 200-DMA, ascending trend line from late November 2022 appears a tough nut to crack for bears.
- Doubts over Brexit deal’s acceptability, mixed US data probe cable bulls amid hawkish Fed concerns.
GBP/USD picks up bids to reverse the previous day’s pullback from the 50-DMA, around 1.2035 during the initial hours of Wednesday’s Asian session. The Cable pair rose to the highest levels in a week earlier on Tuesday before reversing from 1.2143 as optimism surrounding the Brexit deal and the pair’s strength from softer US data faded as the key March month begins.
Although UK PM Rishi Sunak has already signaled that he will move forward without the Democratic Unionist Party’s (DUP) support for Brexit deal, if they turn down his efforts, the fears of witnessing political drag on the key success weighed on the GBP/USD prices on Tuesday. “The framework is what we have agreed with the European Union”, said UK’s Sunak during the BBC interview when asked whether he would impose the new deal without the backing of Northern Ireland's DUP.
Apart from Sunak’s optimism, softer US data and month-end consolidation also initially helped the Cable pair. Among the key US statistics, the US Conference Board’s (CB) Consumer Confidence dropped for the second consecutive month to 102.9 versus 106.0 prior (revised) while US Housing Price Index drops 0.1% in December versus -0.6% market forecasts and -0.1% prior. On the same line, the S&P/Case-Shiller Home Price Indices grew 4.6% YoY during the said month compared to 6.1% market expectations and 6.8% previous readings. Furthermore, Chicago Purchasing Managers’ Index for February eased to 43.6 from 44.3 previous readings and 45.0 market consensus. Additionally, the Richmond Fed Manufacturing Index for the said month eased below 11.0 prior and -5.0 expected to -16 for the said month.
It should be noted that the softer data and month-end positioning failed to weigh on the hawkish Fed bets and recalled the GBP/USD bears late Tuesday as markets prepared for crucial March month events comprising Fed Chairman Jerome Powell’s testimony and Fed meeting.
Against this backdrop, Wall Street closed mixed and the US Treasury bond yields marked minor losses while the US Dollar Index (DXY) regained upside momentum in the last hour to end February on a firmer footing, by marking the first monthly gain in five.
Looking forward, final readings of the UK Manufacturing PMI for February will precede Bank of England (BoE) Governor Andrew Bailey’s speech to highlight today’s economic calendar for the GBP/USD pair traders.
GBP/USD technical analysis
GBP/USD eyes another attempt to cross the 50-DMA hurdle during early Wednesday in Asia, following multiple failures to overcome the same since mid-February.
The Cable pair’s recovery moves take clues from the hidden bullish divergence of the RSI (14), as well as the quote’s refrain from breaking the 1.1920-25 support confluence, including the 200-DMA and ascending support line from November 21, 2022. Adding strength to the upside bias is the impending bull cross on the MACD.
That said, the GBP/USD pair’s high low of the prices and lower high of the RSI (14) line is considered a hidden bullish divergence of the oscillator and suggests the quote’s gradual run-up.
A downward-sloping resistance line from February 02, close to 1.2080 at the latest, can be considered as an immediate hurdle during the anticipated rise of the Cable pair ahead of battling with the 50-DMA level, near 1.2145 by the press time.
Following that, the two-week high of around 1.2270 could probe the GBP/USD bulls before directing them to the multiple tops marked around 1.2445-50.
Meanwhile, a convergence of the 200-DMA and a multi-day-old ascending trend line, around 1.1925-20, appears the key support to watch for the Cable pair sellers to retake control.
GBP/USD: Daily chart
Trend: Further upside expected
- USD/CAD is struggling to surpass 1.3650, however, the upside looks favored amid strength in the USD Index.
- The Canadian Dollar witnessed immense heat on Tuesday after releasing weak GDP (Q4) figures.
- The RSI (14) has shifted into the bullish range of 60.00-80.00 after a long period of more than four months.
The USD/CAD pair has delivered a minor corrective move after failing to continue its upside momentum above 1.3650 in the early Asian session. The Loonie asset is expected to recover the corrective move as the US Dollar is extremely solid amid rising bets for more rates by the Federal Reserve (Fed) as inflation in the United States economy is getting more stubborn.
The Canadian Dollar witnessed immense heat on Tuesday after releasing weak Gross Domestic Product (GDP) (Q4) numbers. The annualized GDP remained flat lower than the expectations of 1.5% and the former release of 2.3%. While the monthly GDP (Dec) contracted by 0.1% vs. a flat consensus.
The US Dollar Index (DXY) is aiming to cross the immediate resistance of 104.60 as the risk-aversion theme has been strengthened amid hawkish Fed bets and geopolitical tensions. S&P500 was offered on Tuesday as investors see recession amid deepening rate hike discussions among Fed policymakers.
USD/CAD is meaningfully strengthened after delivering a breakout of the downward-sloping trendline plotted from October 13 high at 1.3978 on a daily scale. The 10-period Exponential Moving Average (EMA) at 1.3558 is providing cushion to the US Dollar bulls.
Meanwhile, the Relative Strength Index (RSI) (14) has shifted into the bullish range of 60.00-80.00 after a long period of more than four months. More upside looks favored as the momentum oscillator is not showing any sign of divergence and overbought levels.
The Loonie asset is expected to add more gains after surpassing February 24 high at 1.3665, which will drive the asset toward the horizontal resistance plotted from December 07 high around 1.3700 followed by November 03 high around 1.3800.
Alternatively, a break below February 6 high at 1.3474 will drag the asset to near January 26 high around 1.3408. A slippage below the same will expose the asset to February 16 low around 1.3357.
USD/CAD daily chart
-638132209251701907.png)
- Gold price bears are moving in to fade the Tuesday rally.
- US Dollar was momentarily knocked off its perch on softer data.
- Federal Reserve sentiment keeps the US Dollar afloat and Gold price weighed.
The Gold price stabilised at the end of the day and is up 0.5% near $1,826.67 after travelling from a low of $1,804 and $1,831 on the day. Weakness in the US economic data was widespread and weighed on the greenback that had otherwise been resurging on the back of prior inflationary readings.
Gold price rallies on poor United States of America data readings
Among the US data on Tuesday, Gold price rallied on the back of a survey of Consumer Confidence showed a decline to a three-month low of 102.9 in February. The Chicago Business Barometer, also known as the Chicago PMI, dropped to 43.6 in February from 44.3 in the prior month, according to a report from ISM-Chicago and MNI. The S&P CoreLogic Case-Shiller 20-city Home Price Index also dropped 0.5% in December.
Looking ahead, the Gold price could now be affected by the ISM manufacturing PMI which should continue reflecting the fragility of the sector in February (market f/c: 45.5); the final estimate to the S&P Global manufacturing PMI will likely confirm this too, analysts at Westpac said. ''Meanwhile, construction spending is expected to remain subdued in January given softening demand (market f/c: 0.2%). Minneapolis Federal Reserve president Neel Kashkari is also due to speak.''
Federal Reserve sentiment reigns
However, the US rate futures have priced in a peak fed funds rate of 5.4% hitting in September. The market has all but priced out Federal Reserve rate cuts this year. Consequently, the US Dollar index, DXY, which measures the currency against a basket of major currencies, managed to claw back by some 0.18% in late morning trade on Wall Street and was set for a February gain of over 2.5%, its first monthly increase since September. The Federal Reserve sentiment is keeping the greenback in the hands of the bulls as marked price in the notion that the central bank will have to raise interest rates more than initially expected.
Gold technical analysis
As per the prior Gold price analysis, Gold price rallied as follows:
Gold prior analysis
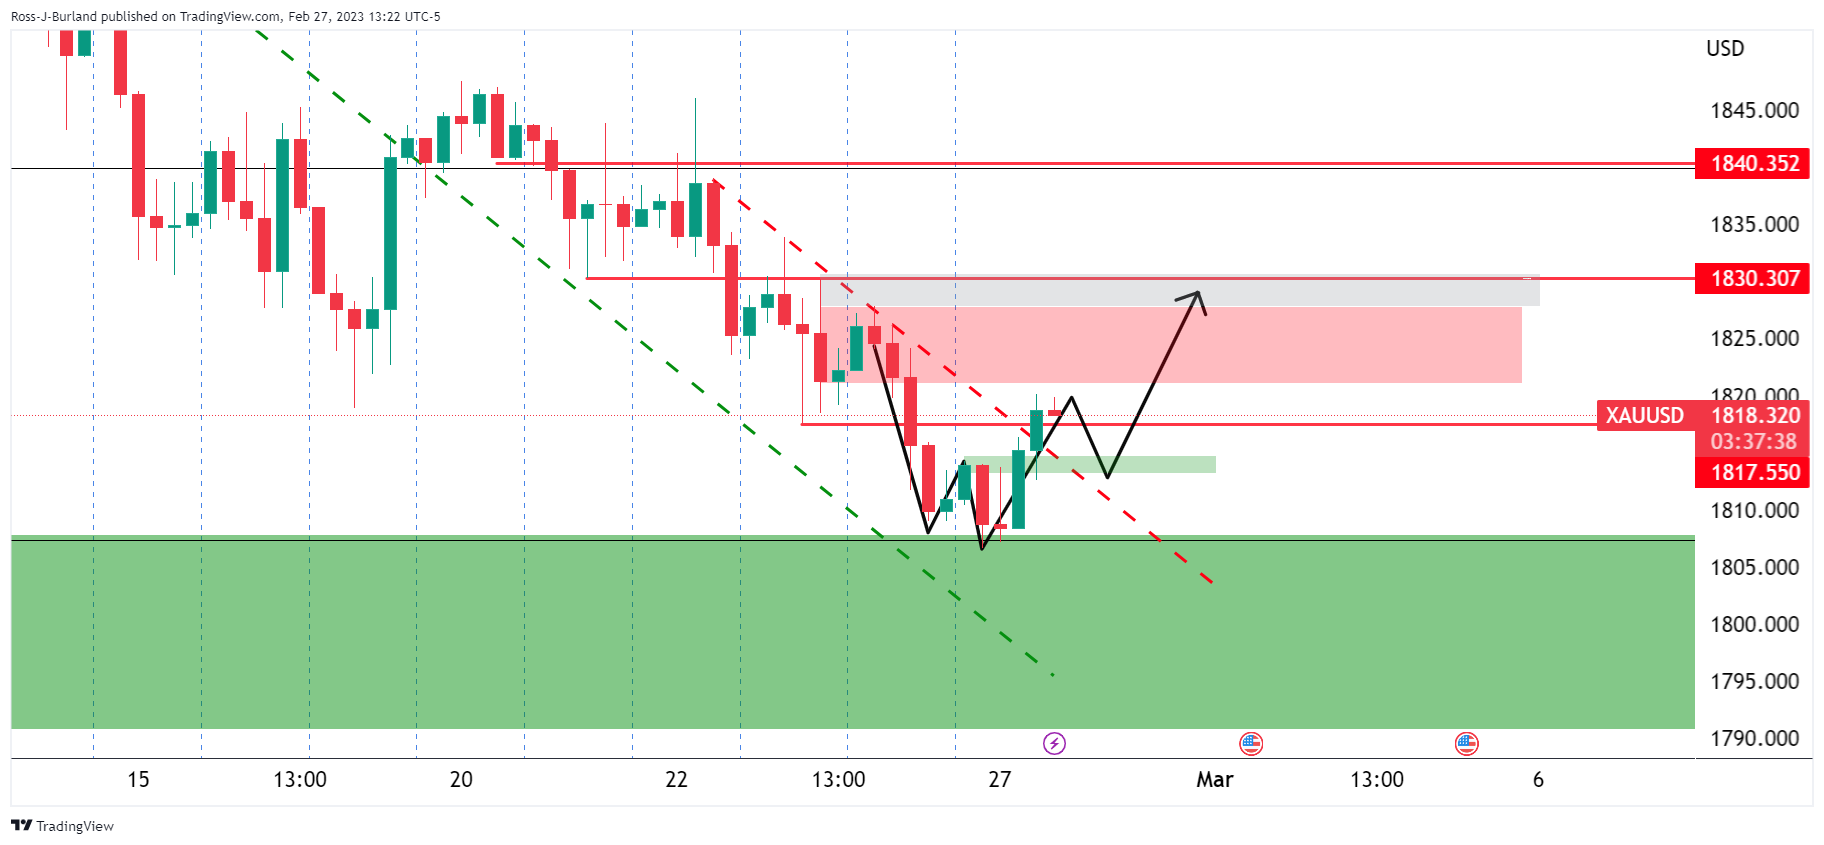
The prior Gold price analysis said ''the double bottom near the $1,800 psychological Gold price level is offering a compelling case for a move towards the $1,830s, a touch above the January opening lows. However, a retest of the W-formation's neckline could be on the cards first.''
Gold price update
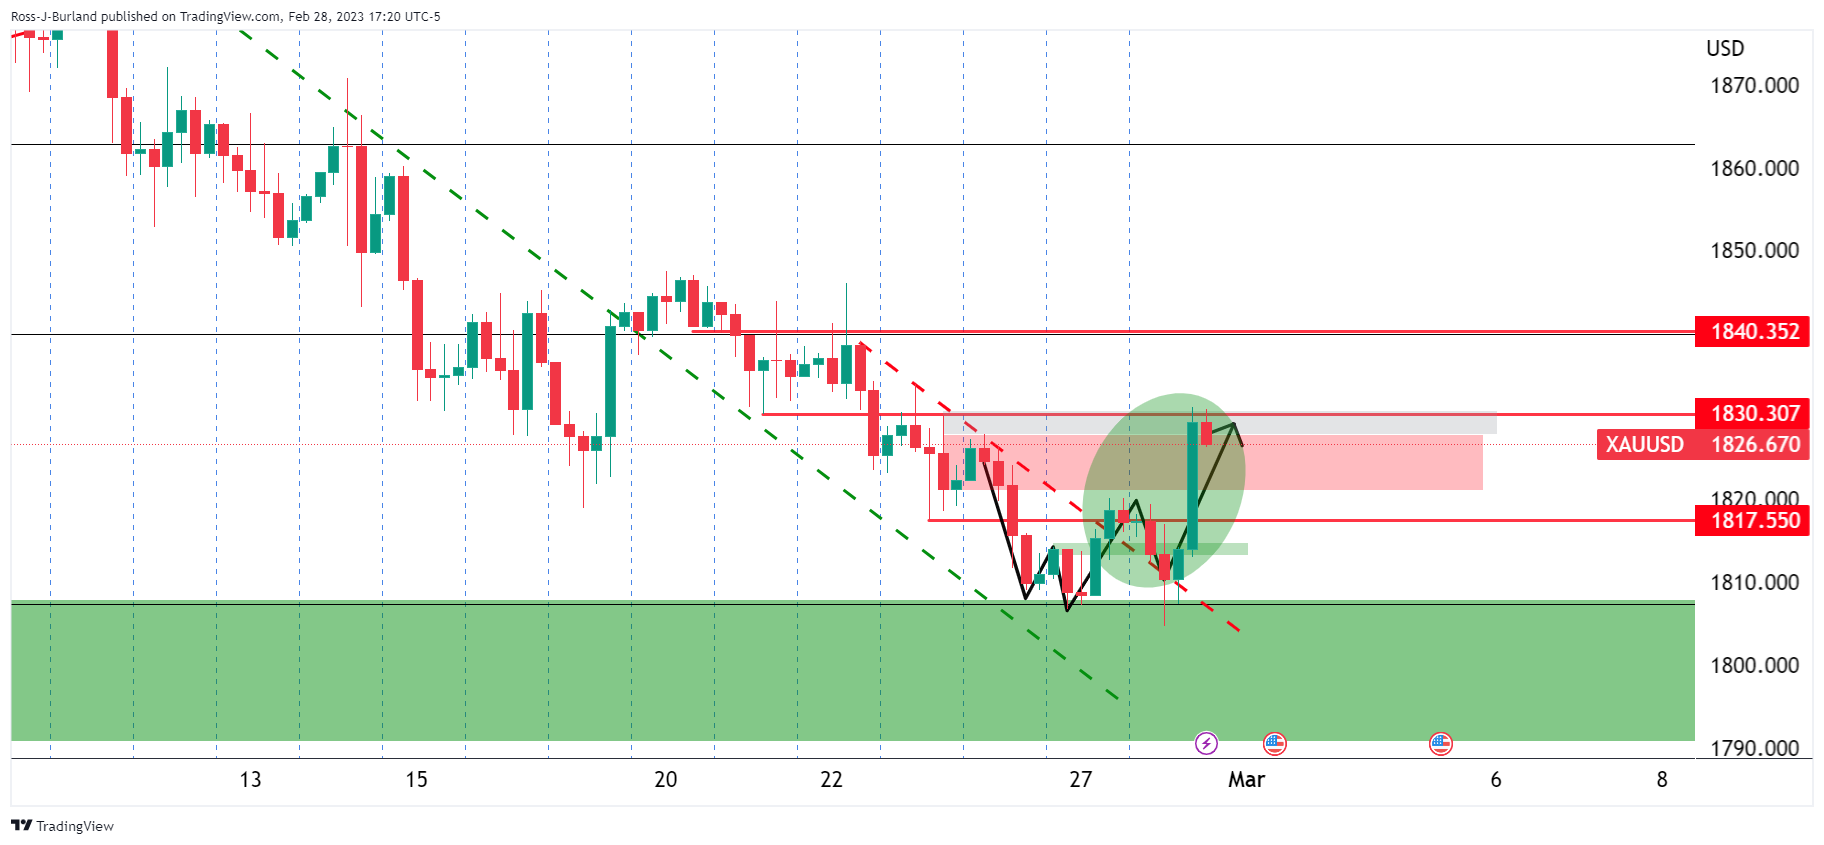
As illustrated, the Gold price burst higher after the correction and offered bulls an opportunity in late European and US markets to the target area. At this juncture, a correction is underway and bears can look to the lower time frame structure for a fading set-up:
Gold price H1 and M5 charts
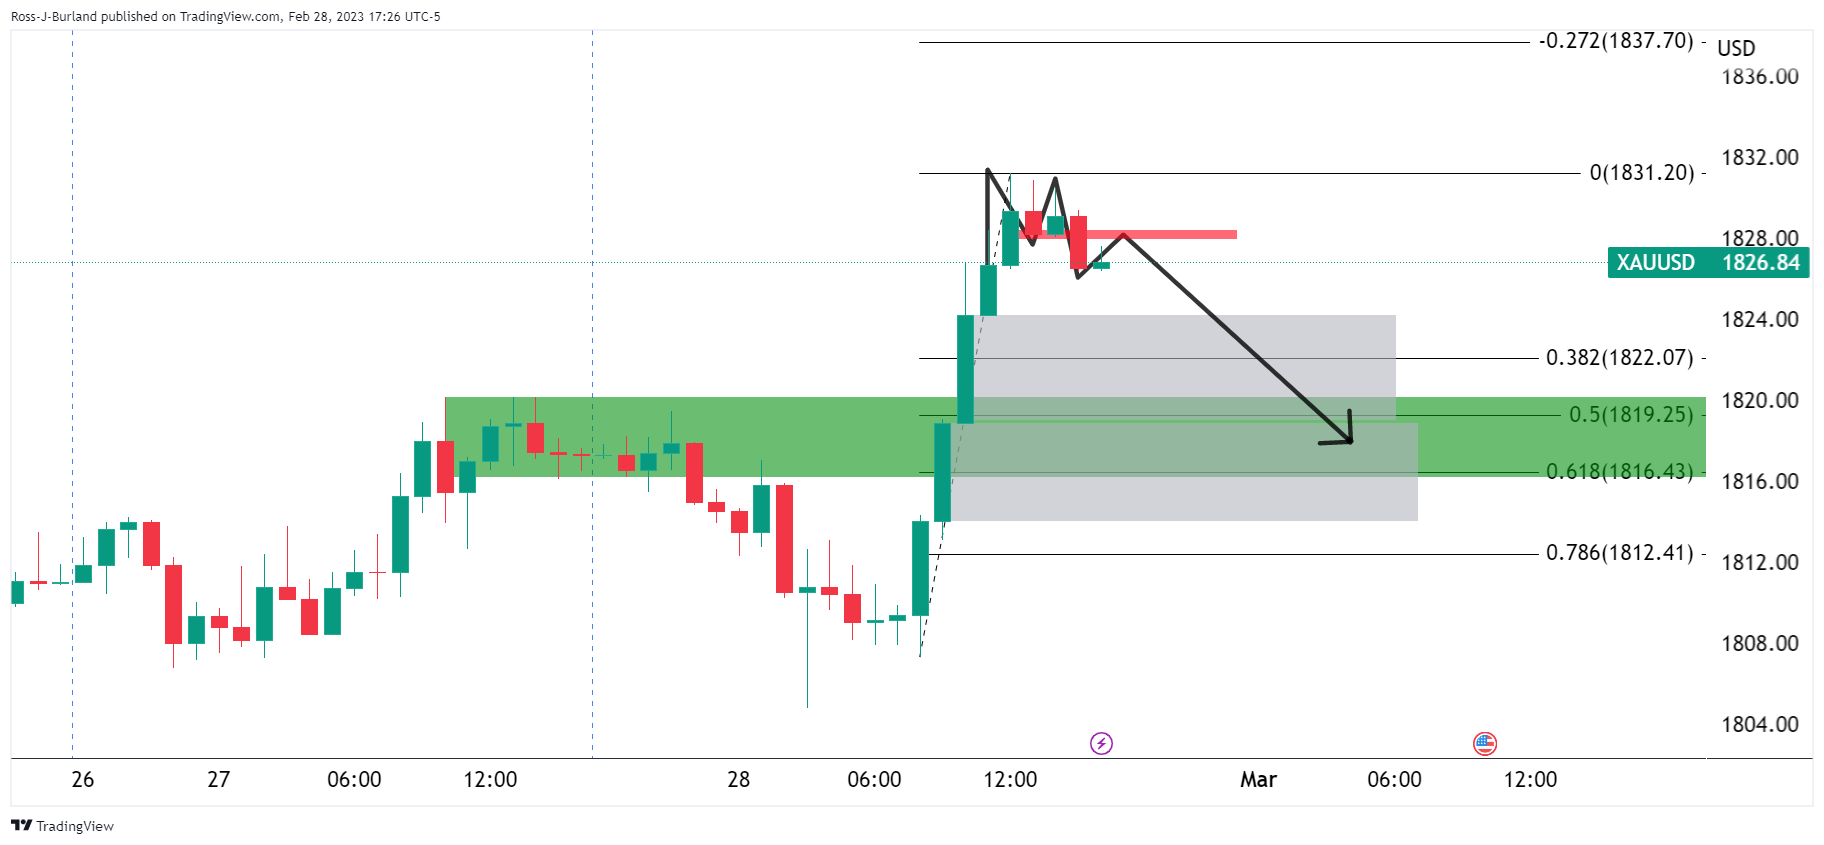
The hourly topping pattern is in play and the price imbalances below it are compelling for a move back into old resistance down the Fibonacci scale towards $1,820.
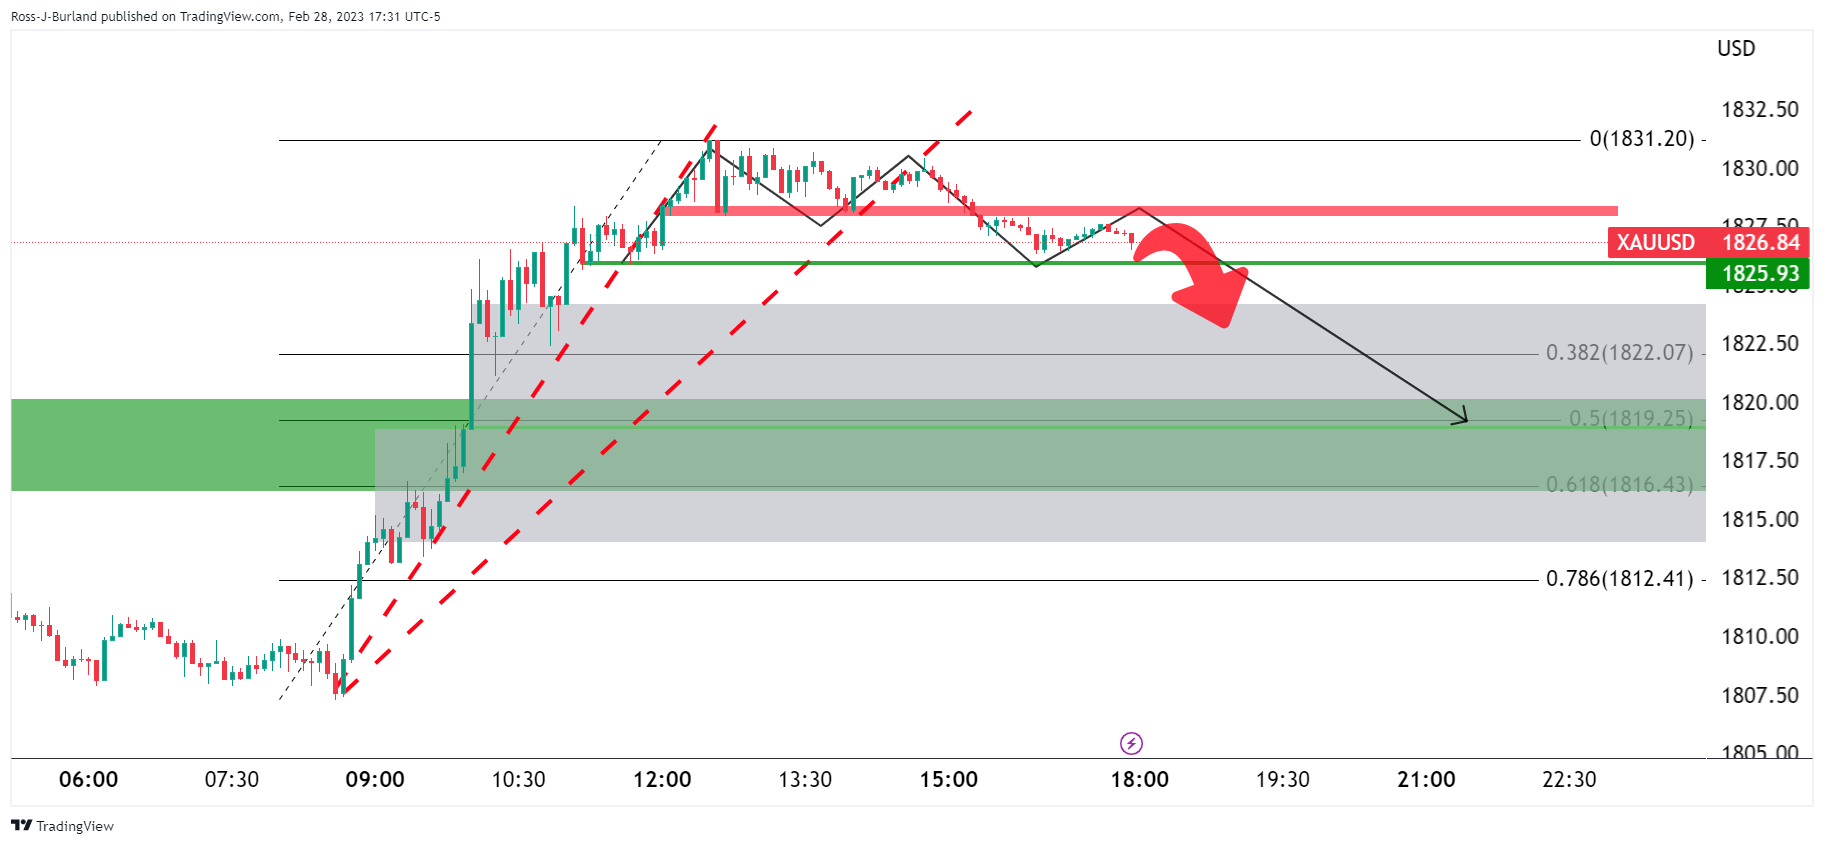
The Gold price 5-min chart shows a structure near $1,826 that needs to give out in order for there to be prospects of a move to the target area.
- EUR/GBP recovered some ground and finished Tuesday’s sessions with gains but shy of 0.8800.
- Long-term, the EUR/GBP fall below the 20/50-day EMA would exert downward pressure on the pair.
- On an intraday time frame, the EUR/GBP is headed for a bearish continuation, with sellers targeting 0.8730s.
The EUR/GBP jumped after hitting a daily low at 0.8754 after piercing the 100-day Exponential Moving Average (EMA), which rests at 0.8759. Nevertheless, it finished Tuesday’s session with minuscule gains of 0.02%. At the time of writing, the EUR/GBP is trading at 0.8792.
After falling below the 20 and 50-day Exponential Moving Averages (EMAs) in the last week, the Euro (EUR) recovered some ground. Nevertheless, it clashed with the 20-day EMA at around the 0.8330s area and tumbled on news that the Eurozone (EU) and the United Kingdom (UK) reached an agreement on Northern Ireland. That exacerbated a fall below the 0.8800 figure, but EU’s inflation figures on Tuesday bolstered the EUR, which is staging a comeback.
Therefore, the EUR/GBP jumped and is hoovering underneath the 50-day EMA at 0.8808, waiting for a fresh catalyst.
EUR/GBP Price Action
Intraday speaking, the EUR/GBP 4-hour chart suggests the pair is downward biased, with all the EMAs sitting above the exchange rate and backed by the Relative Strength Index (RSI) in bearish territory, and it’s aiming down. In addition, the Rate of Change (RoC) it’s almost neutral.
As long as the EUR/GBP remains below the February 27 daily high of 0.8835, the path of least resistance is bearish. Hence, the EUR/GBP’s first support would be the daily pivot point at 0.8790, which, once breached, the pair’s next stop would be the S1 pivot at 0.8763. If sellers stepped in, that would open the door to test January’s 19 daily low of 0.8721, slightly below the S2 daily pivot point at 0.8730.
An alternative scenario would be that the EUR/GBP reclaims 0.8811, opening the door for further upside.
Trend: Downward biased.
EUR/GBP 4-Hour chart
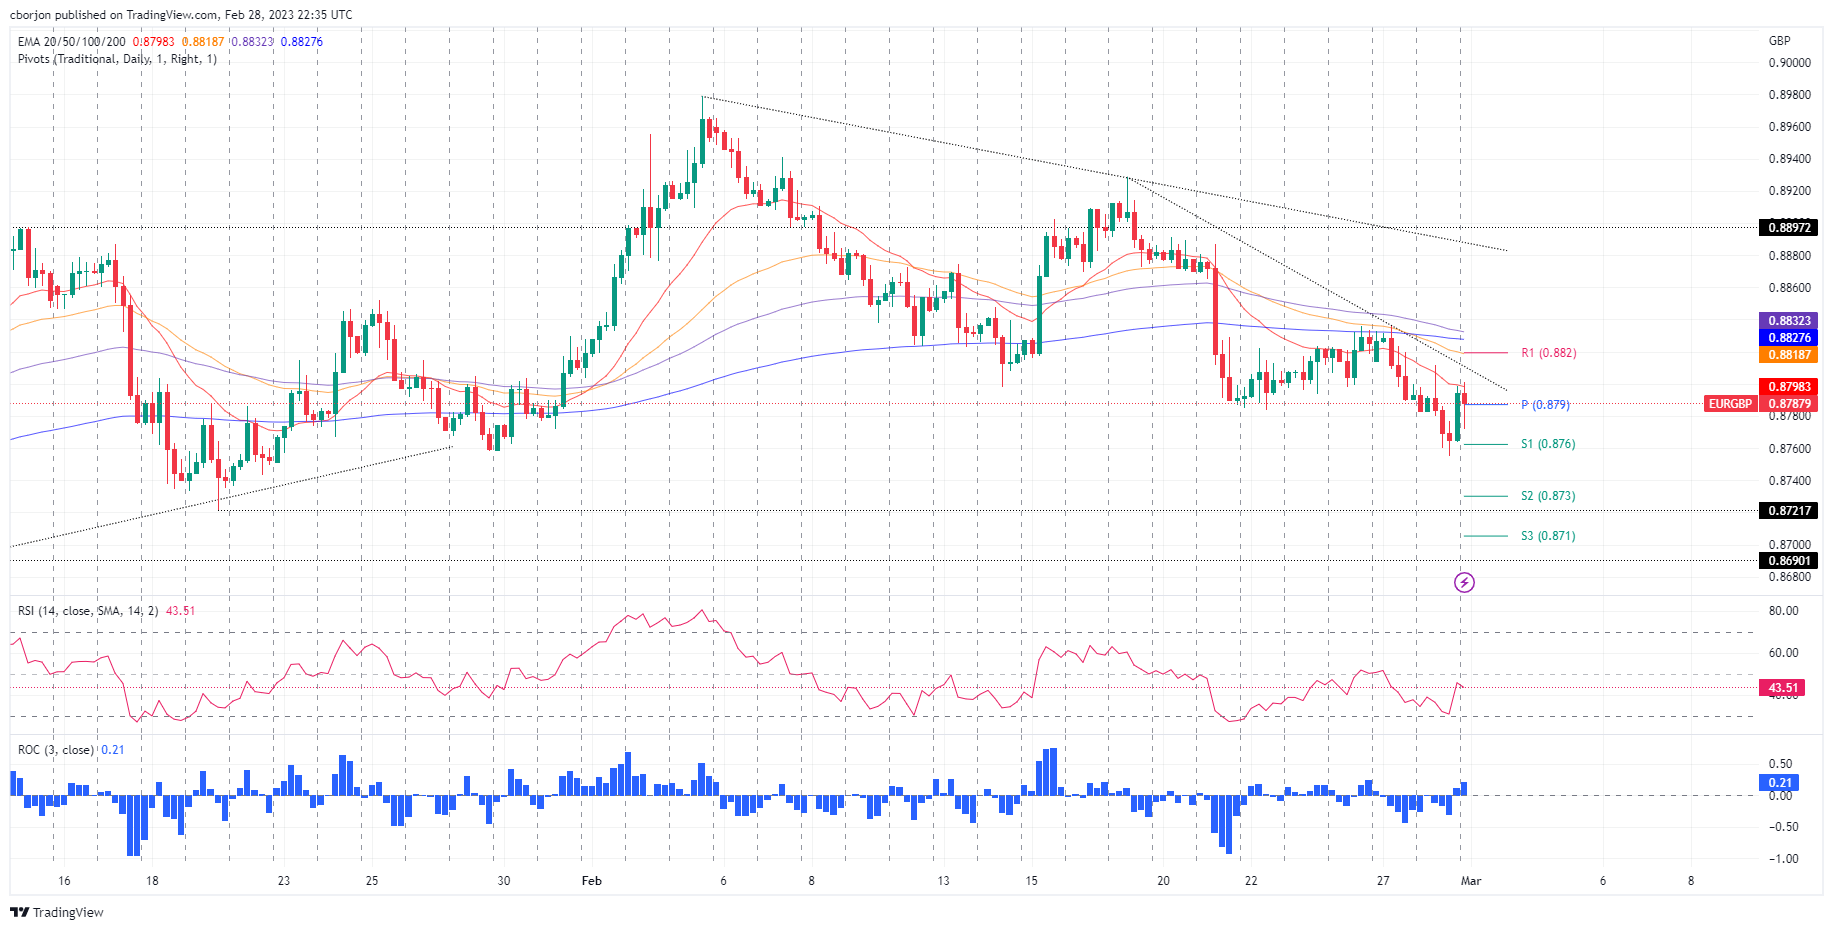
EUR/GBP Key technical levels
- AUD/USD stays defensive above 0.6700, having failed to recover much from two-month low.
- Mixed sentiment, month-end consolidation joined upbeat Aussie Retail Sales to probe bears at multi-day low.
- Sellers seek softer prints of Aussie GDP, China PMI to break 0.6700 support.
- Hawkish Fed bets, geopolitical concerns keep bears hopeful even as softer US data restrict immediate downside.
AUD/USD picks up bids to refresh intraday high around 0.6730, following a pullback from 0.6757 in the last hour, as traders await the key Australian fourth-quarter (Q4) Gross Domestic Product (GDP) details. Adding strength to early Wednesday’s cautious mood are the official activity numbers from China.
The Aussie pair managed to bounce off a two-month low the previous day after Australia Retail Sales marked a stellar 1.9% growth in January, versus 1.5% expected and -4.0% prior. Also keeping the AUD/USD buyers hopeful were headlines shared by Politico suggesting US President Joe Biden’s scaling back of the previous plans to restrict American investments in China. Further, mostly softer US data and month-end consolidation also strengthened the Aussie pair’s corrective bounce off the multi-day low on Tuesday.
That said, the US Conference Board’s (CB) Consumer Confidence dropped for the second consecutive month to 102.9 versus 106.0 prior (revised) while US Housing Price Index drops 0.1% in December versus -0.6% market forecasts and -0.1% prior. On the same line, the S&P/Case-Shiller Home Price Indices grew 4.6% YoY during the said month compared to 6.1% market expectations and 6.8% previous readings. Furthermore, Chicago Purchasing Managers’ Index for February eased to 43.6 from 44.3 previous readings and 45.0 market consensus. Additionally, the Richmond Fed Manufacturing Index for the said month eased below 11.0 prior and -5.0 expected to -16 for the said month.
It should, however, be noted that the hawkish Fed bets remain on the table despite the recently downbeat US data and keeps exerting downside pressure on the AUD/USD price ahead of the key Aussie data. As a result, the FEDWATCH tool highlights the market’s bets on Fed fund futures to be around 5.4% by late 2023 versus 5.1% signaled earlier by the US Federal Reserve (Fed).
Amid these plays, Wall Street closed mixed and the US Treasury bond yields marked minor losses while the US Dollar Index (DXY) regained upside momentum in the last hour to end February on a firmer footing, by marking the first monthly gain in five.
Looking ahead, Australia’s Q4 GDP, expected 0.8% QoQ versus 0.6%, will be crucial for the AUD/USD pair before China’s NBS Manufacturing PMI and Non-Manufacturing PMI for January, as well as Caixin Manufacturing PMI for the said month. “We expect Q4 GDP growth to come in at 1.0% q/q (3.0% y/y), suggesting the economy ended the year with quite a bit of momentum despite aggressive monetary tightening. While the partial data suggest a strong outcome for GDP, it will be the inflation and wages indicators in the GDP report that will be key for policy perspective. We expect the RBA’s preferred measure of wider labor costs – non-farm average earnings per hour – to have risen a modest 0.6% q/q,” said Analysts at the ANZ Bank ahead of the data release.
Technical analysis
AUD/USD seesaws around the 100-DMA and an upward-sloping support line from late November 2022, highlighting the importance of the 0.6700 support. However, bears remain hopeful of meeting the last December’s low near 0.6630 unless the quote rises past the 200-DMA hurdle surrounding 0.6800.
- EUR/USD has confidently slipped below 1.0580 as more rates by the Fed are in pipeline.
- S&P500 failed to hold gains added on Monday as higher rates by the Fed will push the US economy into a recession.
- German preliminary annualized HICP is expected to decline to 9.0% from the prior release of 9.2%.
The EUR/USD pair has slipped below the critical support of 1.0580 in the early Asian session as fears of more rates announcement by the Federal Reserve (Fed) are mounting among the market participants. The major currency pair is expected to re-test a seven-week low around 1.0530 as skyrocketing hawkish Fed bets have forced investors to hide behind the US Dollar to dodge volatility.
S&P500 failed to hold gains added on Monday as the street expects that higher rates by the Fed will push the United States economy into a recession. No doubt, the strong labor market is propelling consumer spending at the current juncture. However, a continuation of policy tightening will break optimism among firms, and demand for labor will be trimmed significantly.
The recovery move in the US Dollar Index (DXY) has pushed it above 104.60 and is expected to fuel it further to recapture a seven-week high around 105.00. Meanwhile, the return on 10-year US Treasury bonds is still inside the woods around 3.93%.
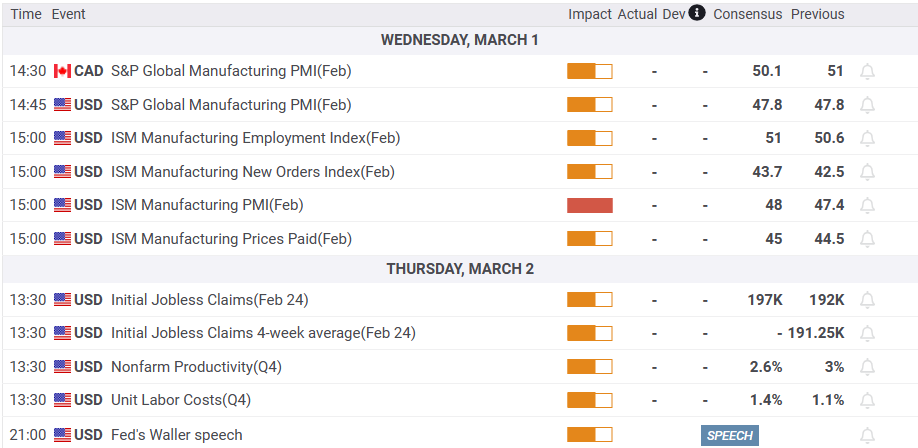
For further guidance, the US ISM Manufacturing PMI data will remain in limelight. As per the projections, the economic data is seen at 48.0 from the former release of 47.4. Apart from that, the New Orders Index that conveys forward demand is expected to rebound to 43.7 from the prior figure of 42.5.
On the Eurozone front, investors are keeping an eye on preliminary German Harmonized Index of Consumer Prices (HICP) (Feb) data. The annualized data is expected to decline to 9.0% from the prior release of 9.2%. It seems that rising interest rates by the European Central Bank (ECB) are doing the job effectively. However, ECB President Christine Lagarde has confirmed the continuation of the 50 basis points (bps) rate hike culture for the March monetary policy as the current monetary policy is not restrictive enough to squeeze inflationary pressures as expected.
- Silver continues its recovery despite broad US Dollar strength and high UST yields.
- A bullish engulfing candle pattern in the XAG/USD daily chart emerged, warranting upside pressure.
- XAG/USD Price Analysis: In the medium term, the white metal is downward biased.
Silver price is staging a comeback after falling to fresh YTD lows at $20.43 a troy ounce and climbs toward the $20.80 area as Wall Street closes. The white metal is posting gains of 1.30% and is trading at $20.89 at the time of typing.
Silver’s rally was capped by fundamental reasons like a strong US Dollar (USD), up 0.32% per the US Dollar Index, and rising UST yields. Despite all that, Silver hit a daily high at $21.00 before retracing some of its gains.
XAG/USD Price Action
Technically speaking, XAG/USD is forming a bullish engulfing candle pattern, which would exacerbate a rally above $21.00, though it remains far from changing Silver’s bias.
The Relative Strength Index (RSI) exited from oversold conditions at 30, sponsored Tuesday’s gains, while the Rate of Change (RoC) portrays that previous selling pressure is waning.
The XAG/USD needs to crack the psychological $21.00 barrier for a bullish continuation. Once done, that would pave the way toward the 20 and 200-day Exponential Moving Averages (EMAs) at $21.82 and $21.89 a troy ounce, respectively, ahead of testing the 100-day EMA at $22.09.
On the flip side, the XAG/USD next support would be $20.43, which, once cleared, would keep sellers in charge, exposing the white metal to new YTD lows. The next floor would be the psychological $20.00, ahead of testing the November 3 daily low of $18.84.
XAG/USD Daily chart
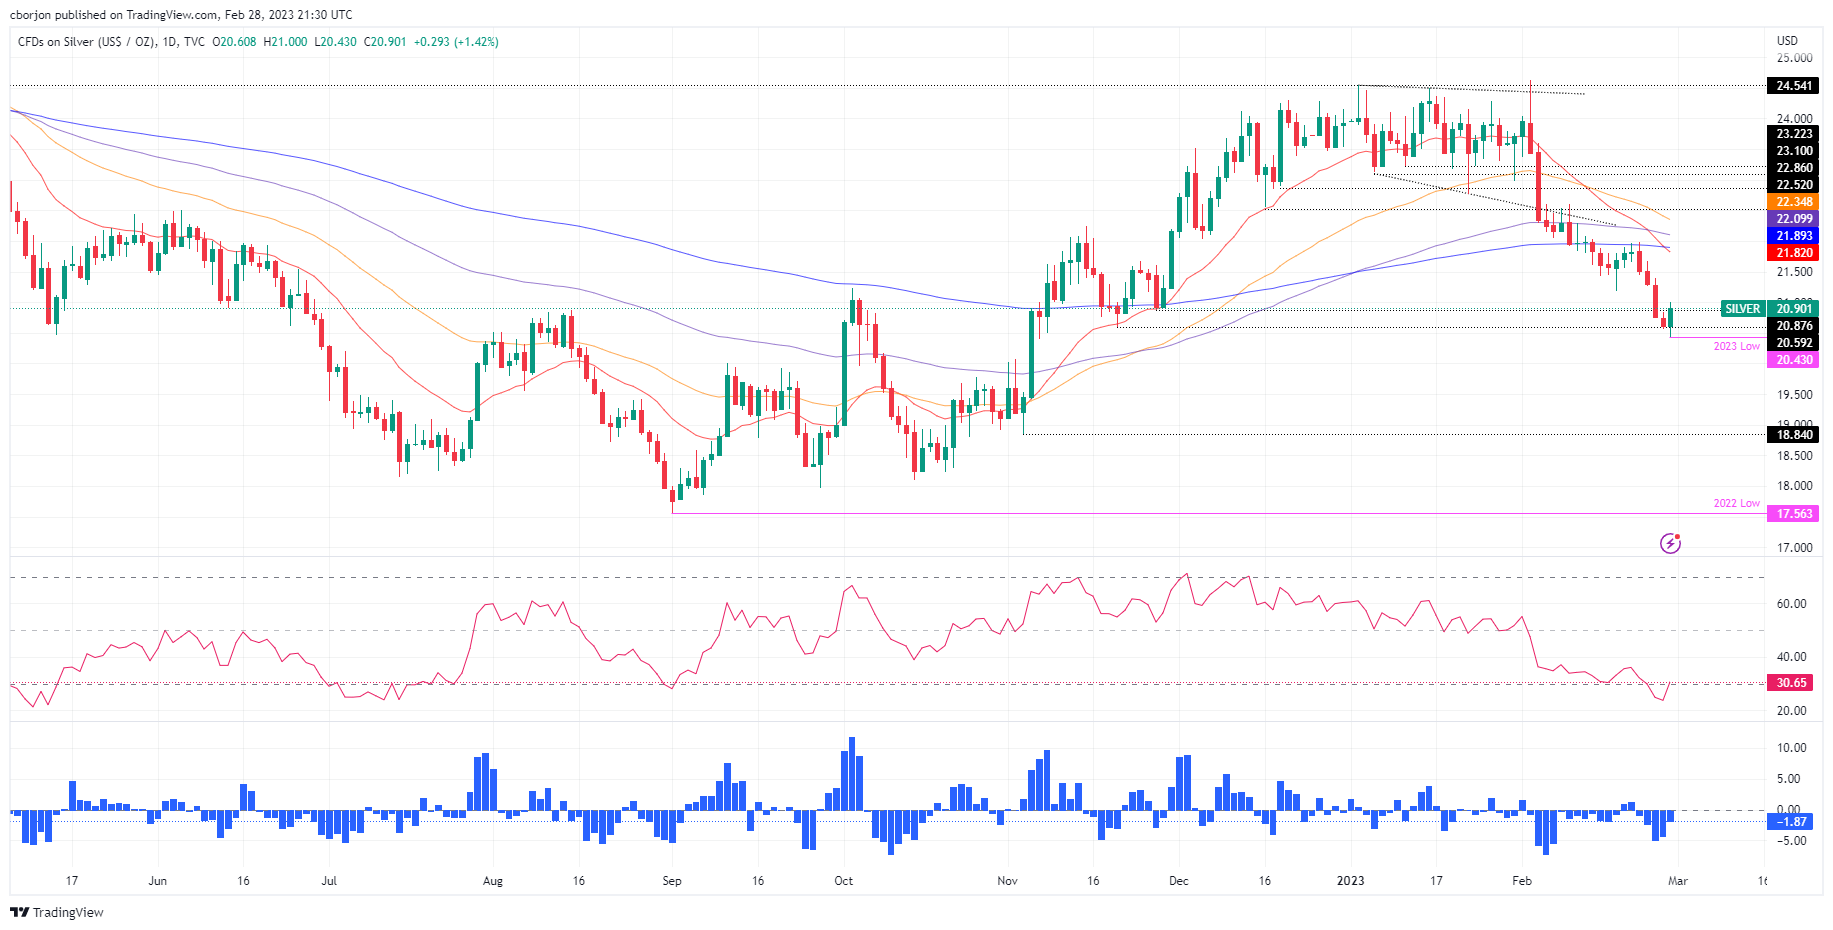
XAG/USD Key technical levels
- NZD/USD is pulling up into the 0.6200 area and testing channel resistance.
- NZD/USD bears are lurking near a 61.8% Fibonacci.
NZD/USD rallied on Tuesday and reached up to test 0.62 the figure before meeting strong opposition from the bear in the later part of the day on Wall Street. At the time of writing, NZD/USD is trading at 0.6180, slightly off the 0.6207 highs but well up from the lows of the day down at 0.6132.
''The move was reasonably unique to the Kiwi; unlike on many other occasions, it wasn’t a USD move,'' analysts at ANZ Bank said. ''That’s seen the Kiwi outperform on crosses, notably against the AUD, as below. There wasn’t a clear catalyst, but as each day passes, the weight of evidence on the side of the Reserve Bank of New Zealand having to do more seems to grow,'' the analysts added.
''The jobs market doesn’t seem to be cooling. The 3-way tussle we spoke of yesterday (between those citing rebuild activity, those concerned about the disruption to exports and impact on Crown finances, and those expecting a USD rebound) is also at front of mind, and that’s suggestive of volatility.''
As for the US Dollar, despite some cooler data over the last couple of key releases, it remains bid with the US rate futures that have priced in a peak fed funds rate of 5.4% hitting in September supporting the bid. The market has all but priced out rate cuts this year. Consequently, the US Dollar index, DXY, which measures the currency against a basket of major currencies, was higher by 0.18% in late morning trade on Wall Street and set for a February gain of over 2.5%, its first monthly increase since September.
NZD/USD technical analysis
Meanwhile, NZD/USD is still eyeing up 0.6200 in the current bull correction:
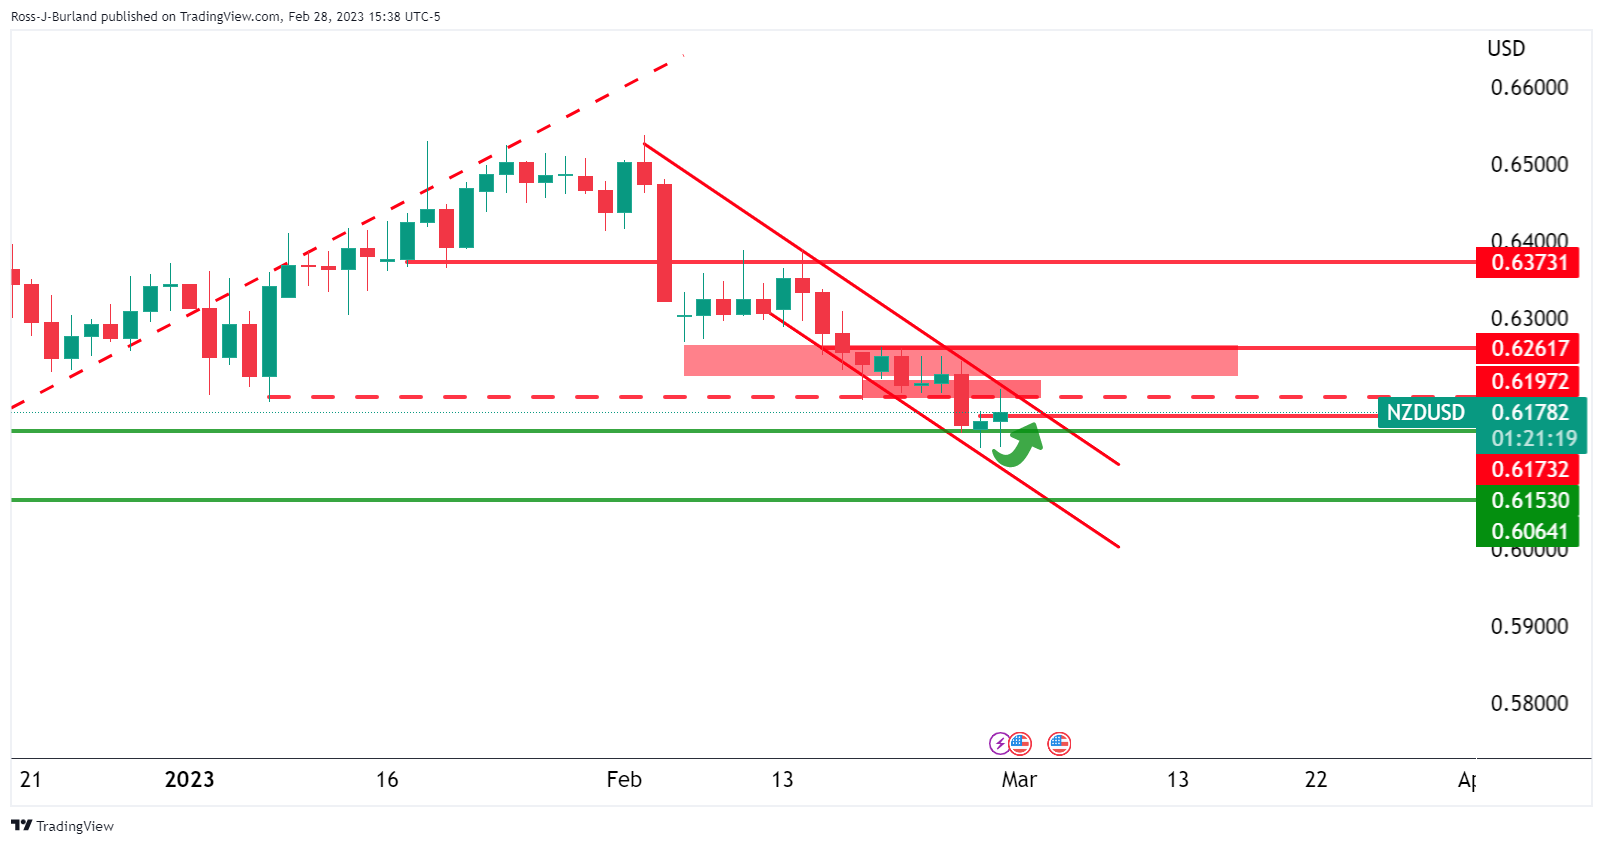
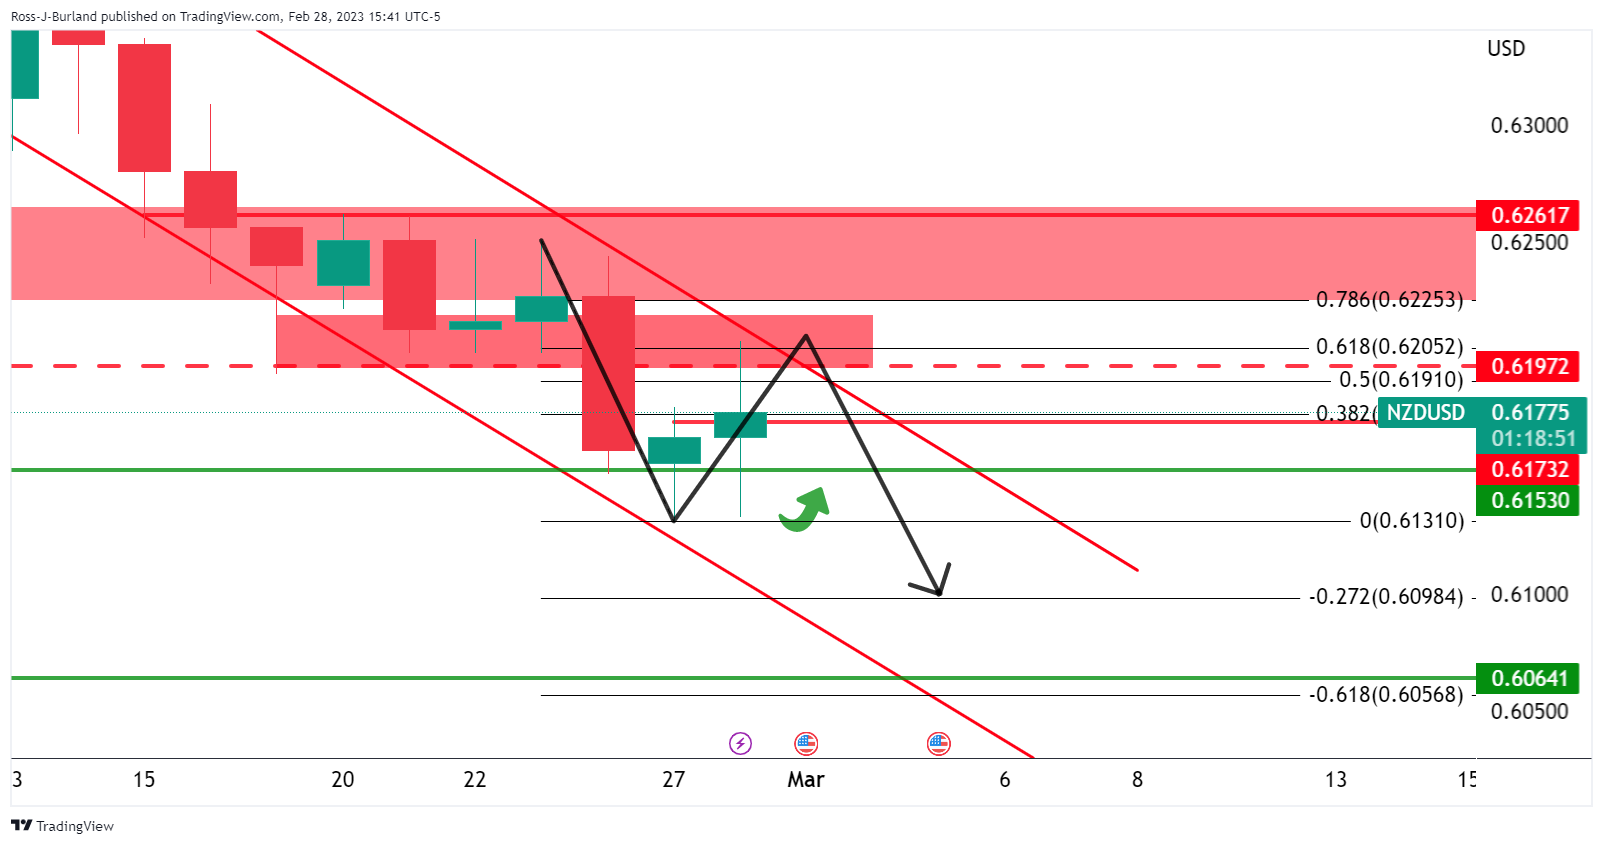
The 61.8% Fibonacci is eyed as a key resistance near where horizontal meets channel resistance.
What you need to take care of on Wednesday, March 1:
USD reverse early losses and finished the day unevenly across the FX board. Correlations were off amid month-end flows, although the risk-averse sentiment remained the same. Most European indexes finished the day in the red, while Wall Street ended mixed.
The focus was on higher-than-anticipated inflation in Spain and France, boosting speculation the ECB will continue on the tightening path for longer than expected. Also, US Consumer Confidence fell for a second consecutive month in February, taking its toll on the Greenback. On a positive note, the report also showed inflation expectations decreased from the previous month.
EUR/USD peaked at 1.0644, but turned south during the American afternoon and now hovers around 1.0590.
The GBP/USD pair surged to 1.2143 on news the EU and the UK reached a deal over trade rules in Northern Ireland, the so-called “Windsor Framework,” meant to fix the issues resulting from the Northern Ireland Protocol. The pair later gave up to USD demand and now trades at around 1.2050.
AUD/USD is little changed on a daily basis, trading at around 0.6730. Australia will publish Q4 GDP figures early on Wednesday.
USD/CAD surged and stands near an intraday high of 1.3632 as Canada's GDP unexpectedly shrank 0.1% MoM in December. The country reported null annual growth in the last quarter of 2022, much worse than the 1.5% advance expected.
Weak stocks and easing US government bond yields weighed on USD/JPY, down on Tuesday and currently at around 136.10.
Gold jumped on demand for safety, and is currently hovering around $1,828 a troy ounce. Crude oil prices advance, with WTI now changing hands at $76.80 per barrel.
Shiba Inu Price Prediction: Is there a chance for traders to short the “Dogecoin killer”?
Like this article? Help us with some feedback by answering this survey:
- GBP/USD is back under pressure as the US Dollar resurges.
- Despite softer US data, the greenback is correcting the sell-off on Tuesday.
- GBP got only some temporary relief from the ''Windsor Framework'' deal.
GBP/USD was making good ground on Tuesday following on from the rally that started on Monday in an agreement that was made and hailing the end of a tense dispute between Britain and the EU over Northern Ireland. New trade rules were put together that could resolve import issues and border checks in Northern Ireland and that could help to ensure Northern Ireland was not somehow treated separately from the rest of the United Kingdom. The deal has been dubbed the "Windsor Framework" — a change to the original Northern Ireland Protocol — attempts to solve those issues.
The Pound Sterling climbed to a high of 1.2143 from 1.1925 at the start of this week after the UK's Prime Minister Rishi Sunak's announcement. Also, the cost of insuring British government debt against default dropped to its lowest in three weeks, close to January's five-month lows, reflecting greater investor confidence. But analysts said that any positives for the pound from the newly minted post-Brexit rules would likely not last, given the economic outlook.
''We remain unconvinced about the UK’s current fundamental backdrop,'' analysts at Rabobank said. ''In the absence of a deal on the Northern Ireland protocol, we expect upside flurries in GBP to be short-lived.''
Additionally, the analysts said, ''Comments around the risk of overtightening by BoE Chief economist Pill supported the notion that the Bank could be close to a pause in policy.'' Markets expect UK rates to peak around 4.8% by the end of the year, up from 4.0% now. At the beginning of the month, the expected peak was just 4.0%.
US Dollar bounces back to life
Meanwhile, the US Dollar has been dominating markets in the US and choppy trading on Wall Street. A round of mainly weak economic data knocked it off its perch but it soon turned over and was back on track for the best monthly gain since September. The Federal Reserve sentiment is keeping the greenback in the hands of the bulls as marked price in the notion that the central bank will have to raise interest rates more than initially expected.
Despite some cooler data over the last couple of key releases, due to the prior slew of inflationary outcomes, the US rate futures have priced in a peak fed funds rate of 5.4% hitting in September. The market has all but priced out rate cuts this year. Consequently, the US Dollar index, DXY, which measures the currency against a basket of major currencies, was higher by 0.18% in late morning trade on Wall Street and set for a February gain of over 2.5%, its first monthly increase since September.
As for the data that was released on Tuesday, showing signs of cracks in the economy, US single-family home prices increased at their slowest pace in December since the summer of 2020 while the US Chicago PMI fell to 43.6 in February, weaker than expected, after sliding to 44.3 in January. To round it off, Consumer Confidence also lost its footing this month to 102.9, down from a revised 106 reading last month.
- WTI erases Monday’s losses and jumps from around $75.60s on China’s reopening expectations.
- US inventories fell, a headwind for WTI price.
- WTI Price Analysis: To continue sideways unless bulls reclaim $78.00 bpd.
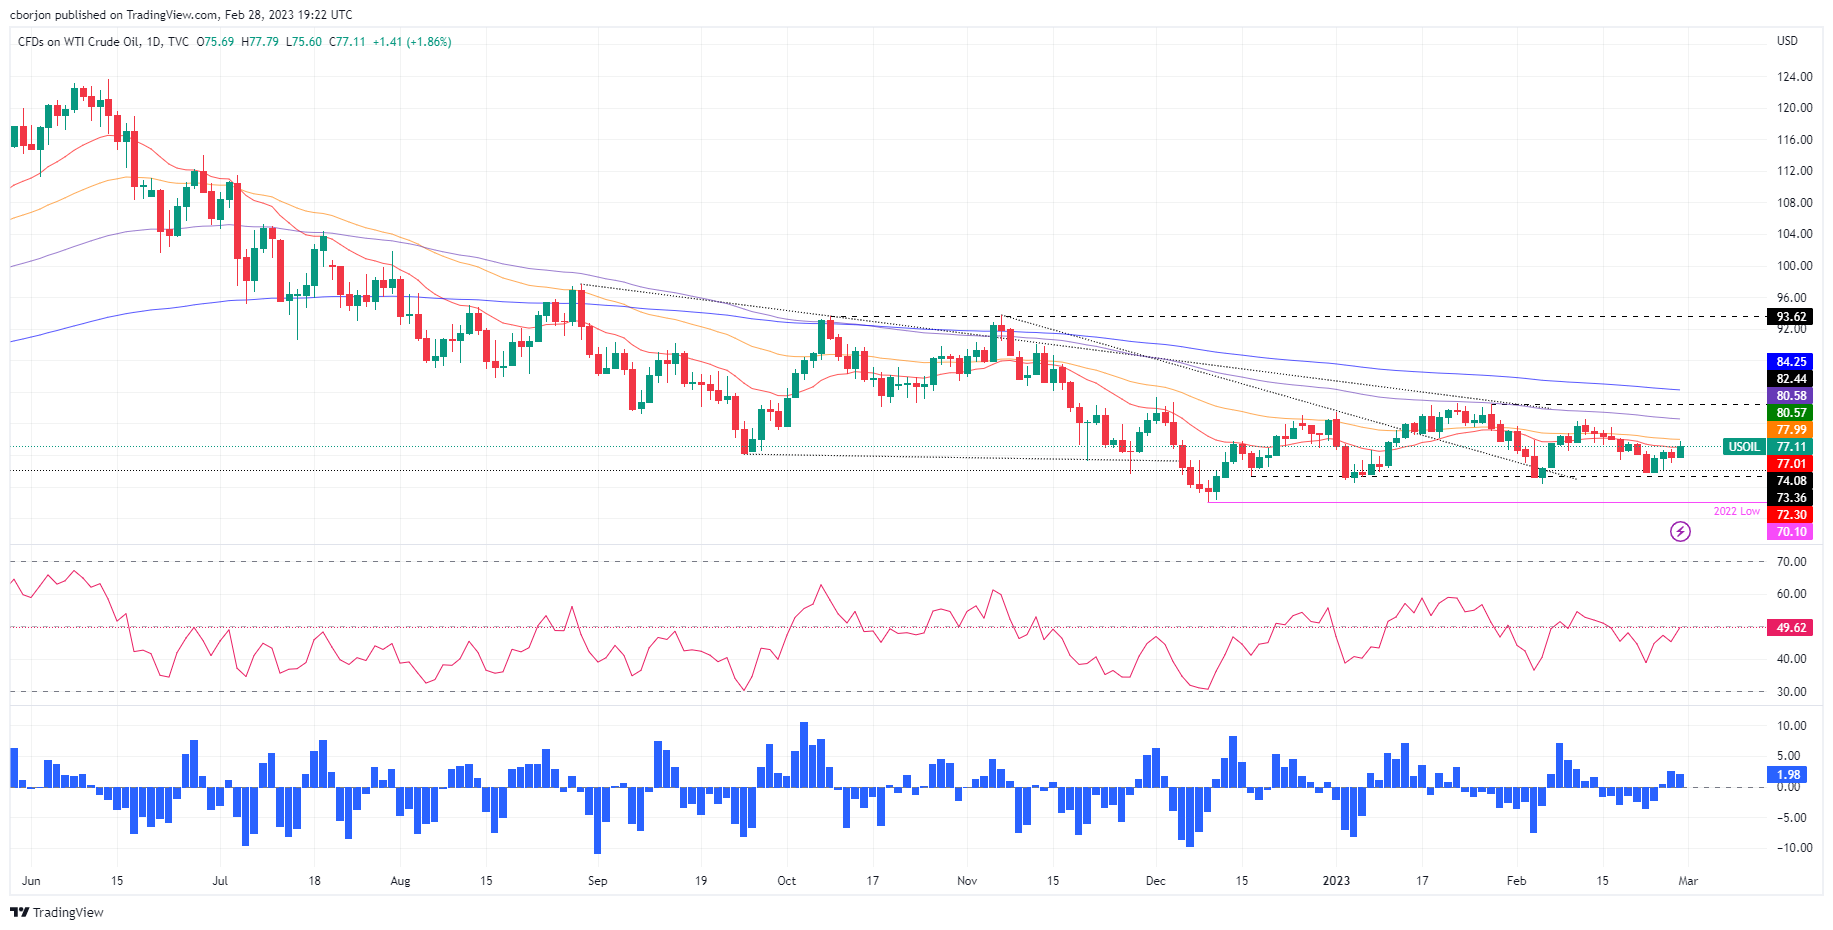
Western Texas Intermediate (WTI), the US crude oil benchmark, advance 1.90% on Tuesday courtesy of renewed expectations for oil demand due to China, despite growing speculations that the US Federal Reserve (Fed) would continue to tighten monetary conditions. Therefore, WTI is trading at $77.11, above its opening price, after hitting a low of $75.60.
Sentiment remains upbeat as Wall Street registers gains, except for the Dow Jones. The greenback has recently recovered some ground, capping WTI’s gains during the day, as the US Dollar Index edges up 0.14%.
WTI has reversed Monday’s losses spurred by expectations of increasing oil demand due to China’s reopening. That offset speculations that the Fed would raise rates at least to the 5.25%-5.50% threshold, as money market futures had shown. Furthermore, the US Energy Information and Administration (EIA) office said that production in the US fell to 12.10 million bpd, its lowest since April 2022.
In the meantime, Russia’s oil exports to China grew due to rising demand and lower freight costs.
Nevertheless, WTI’s rally was capped by the Organization of the Petroleum Exporting Countries (OPEC) announcement, which reported that OPEC+ countries pumped 28.97 million barrels per day (bpd) in February, up 150K from January. However, production remains 700K bpd below from September 2022.
According to a Reuters poll, oil prices are expected to rise above $90 a barrel toward the 2023 second half, as Chinese demand recovers and Russia’s output falls.
WTI Technical analysis
Technically speaking, WTI’s daily chart is neutral to downward biased. During Tuesday’s session, it was rejected at the 50-day Exponential Moving Average (EMA) around 77.99, though it’s clinging to gains above the 20-day EMA at 77.02. The Relative Strength Index (RSI) triggered a bullish signal as it crossed above the 50-midline, but buyers must reclaim the 50-day EMA for a bullish continuation that could send WTI rallying toward the YTD high at $82.44. On the flip side, a fall below the 20-day EMA will spur a drop to the February 22 daily low of $73.83.
- AUD/USD is correcting and the bulls might have only just got going.
- AUD/USD bulls eye the 78.6% Fibonacci near 0.6800.
AUD/USD is making a positive effort for the initial balance of the week, moving up into shorts that built from a breakout below 0.7000 in the middle of the month. The moves follow the pre-market open analysis from Monday Asia, here:
- AUD/USD Price Analysis: Bulls eye a correction to test dynamic resistance
AUD/USD prior analysis
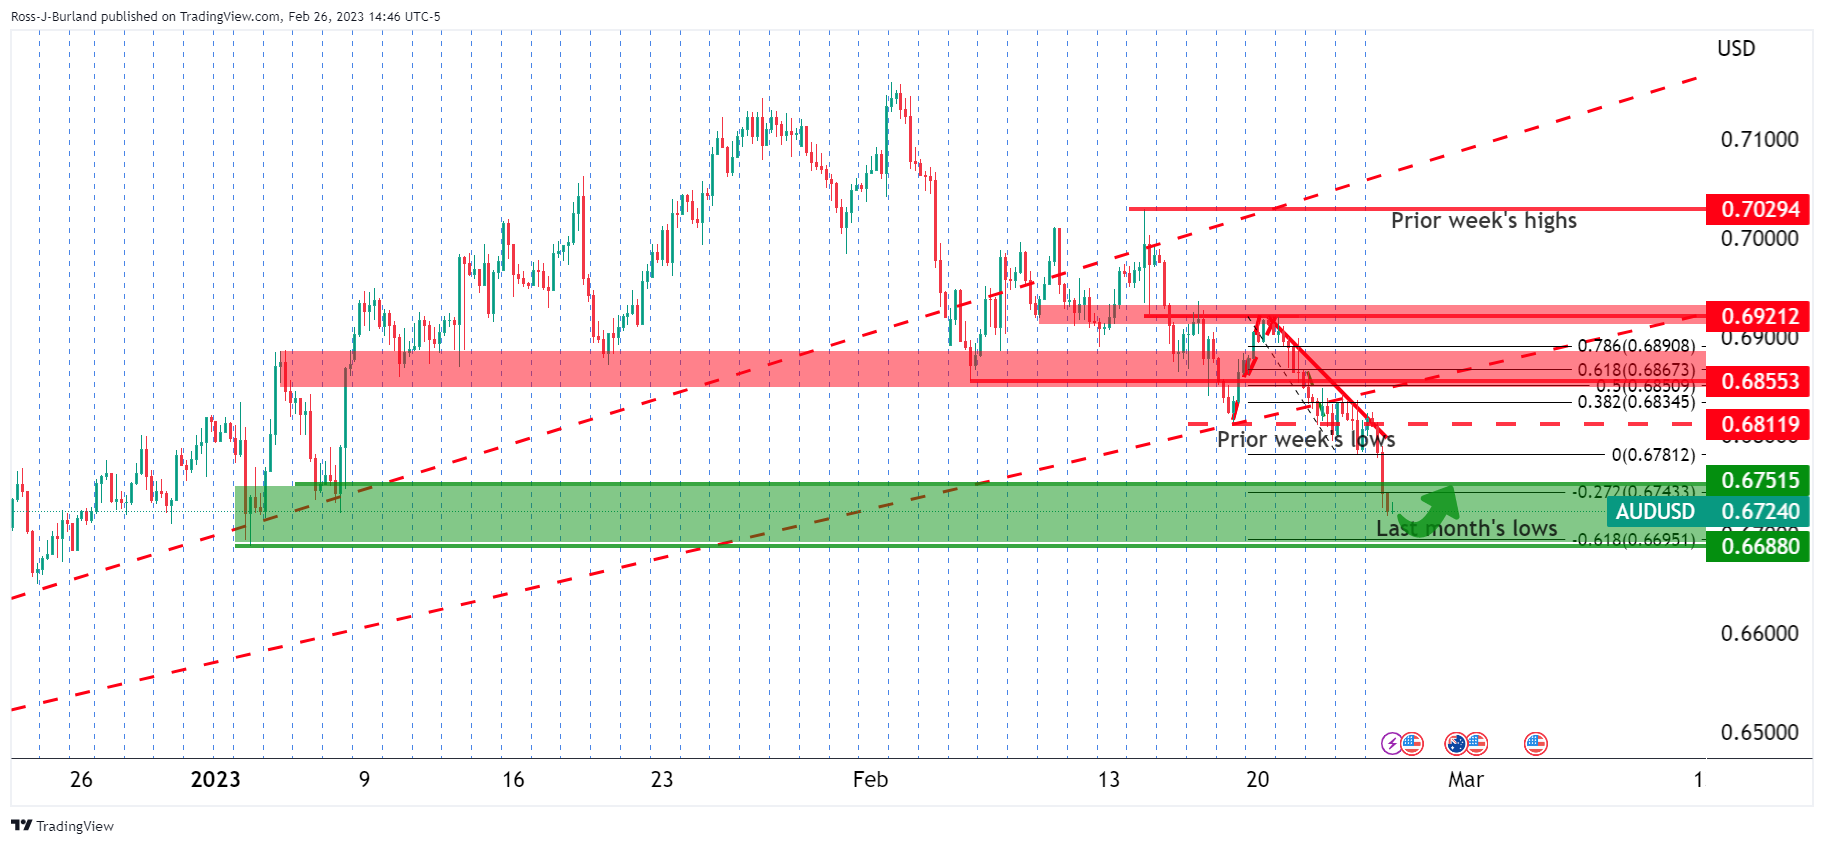
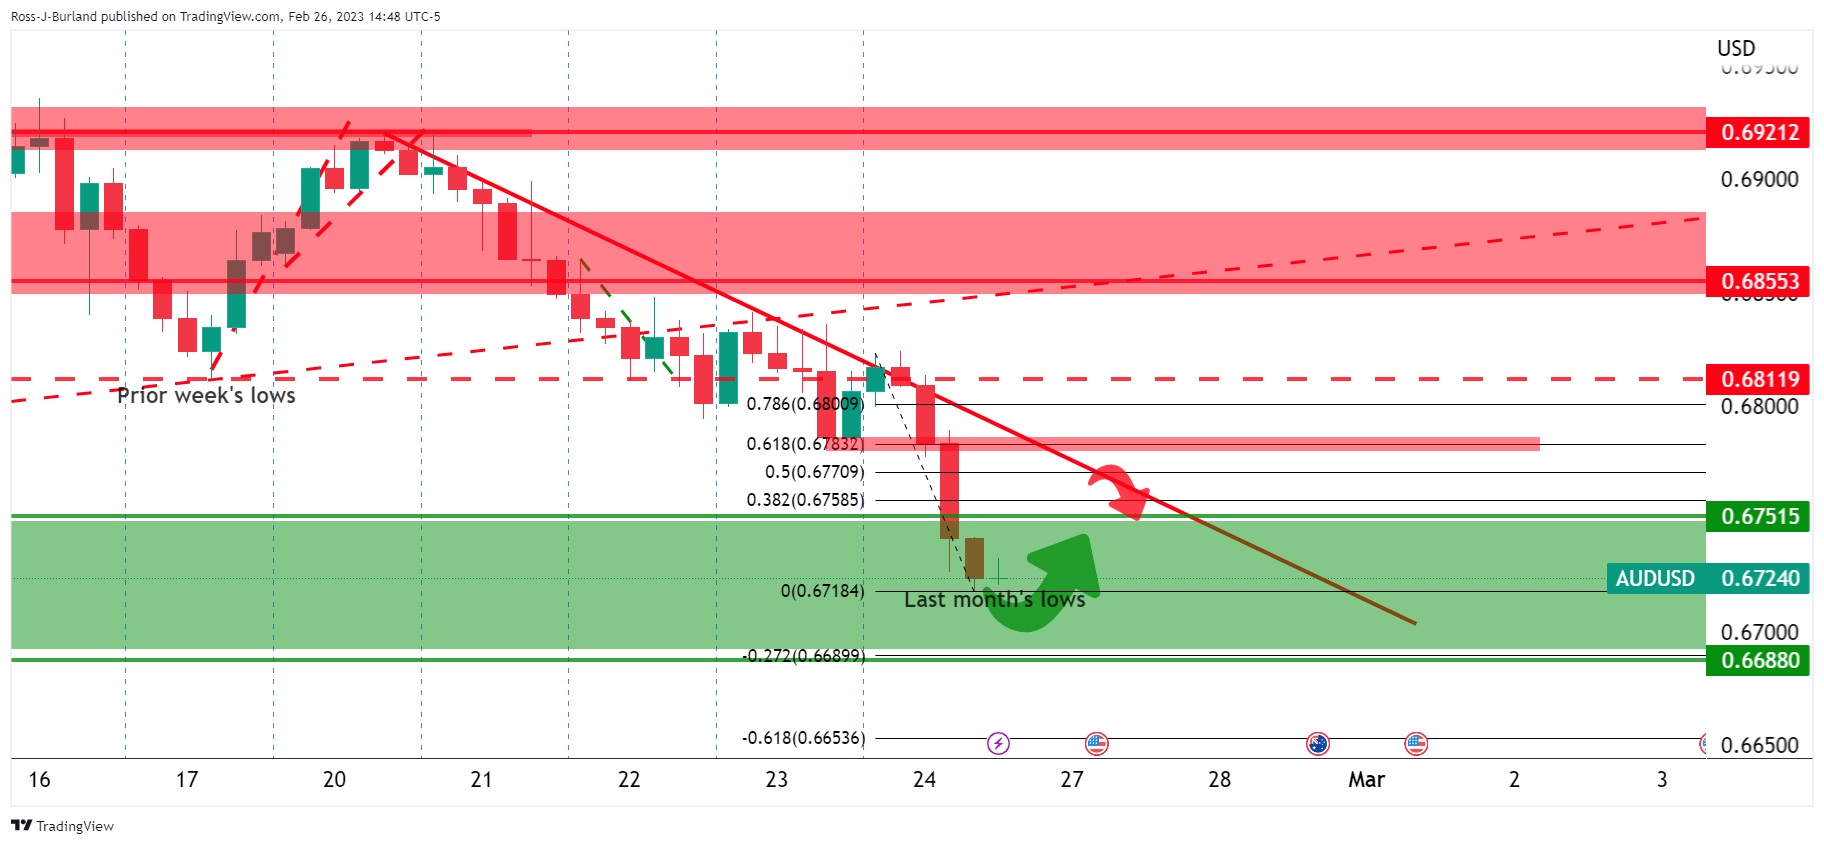
It was explained that while potentially on course for a full test of last month's lows, AUD/USD was in a correction zone and the trendline resistance was compelling for a target of liquidity.
AUD/USD update
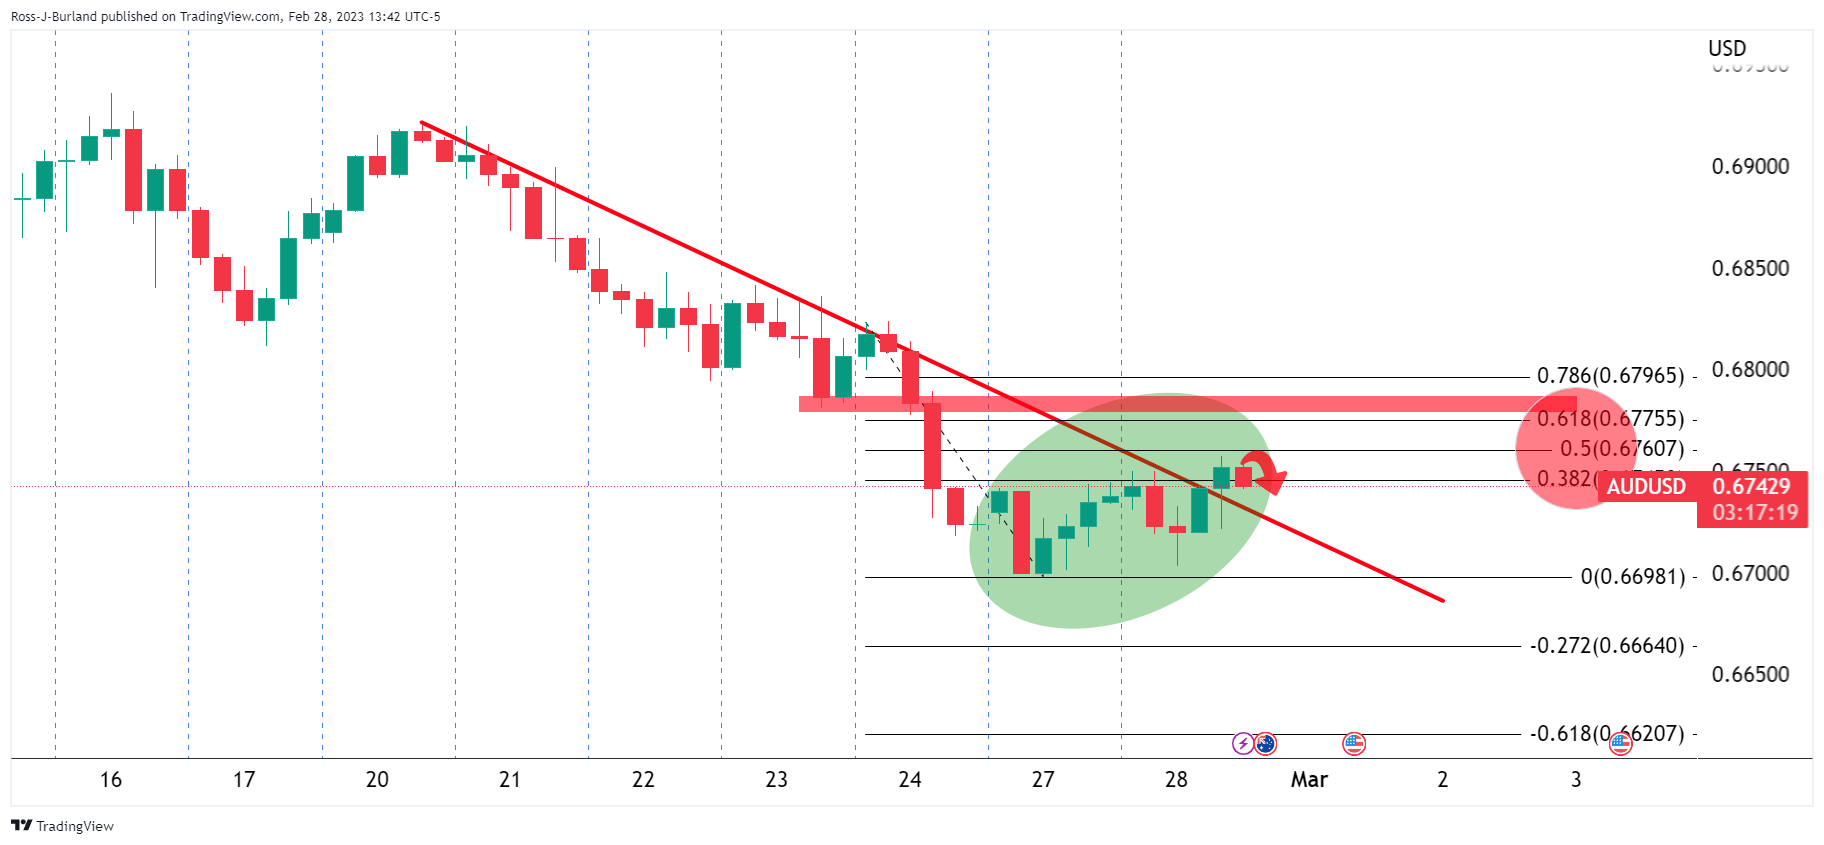
AUD/USD has reached toward a 50% mean reversion area and is starting to come under pressure. However, that is not to say that the correction is on the way out. Instead, it could be building up into a geometrical pattern:

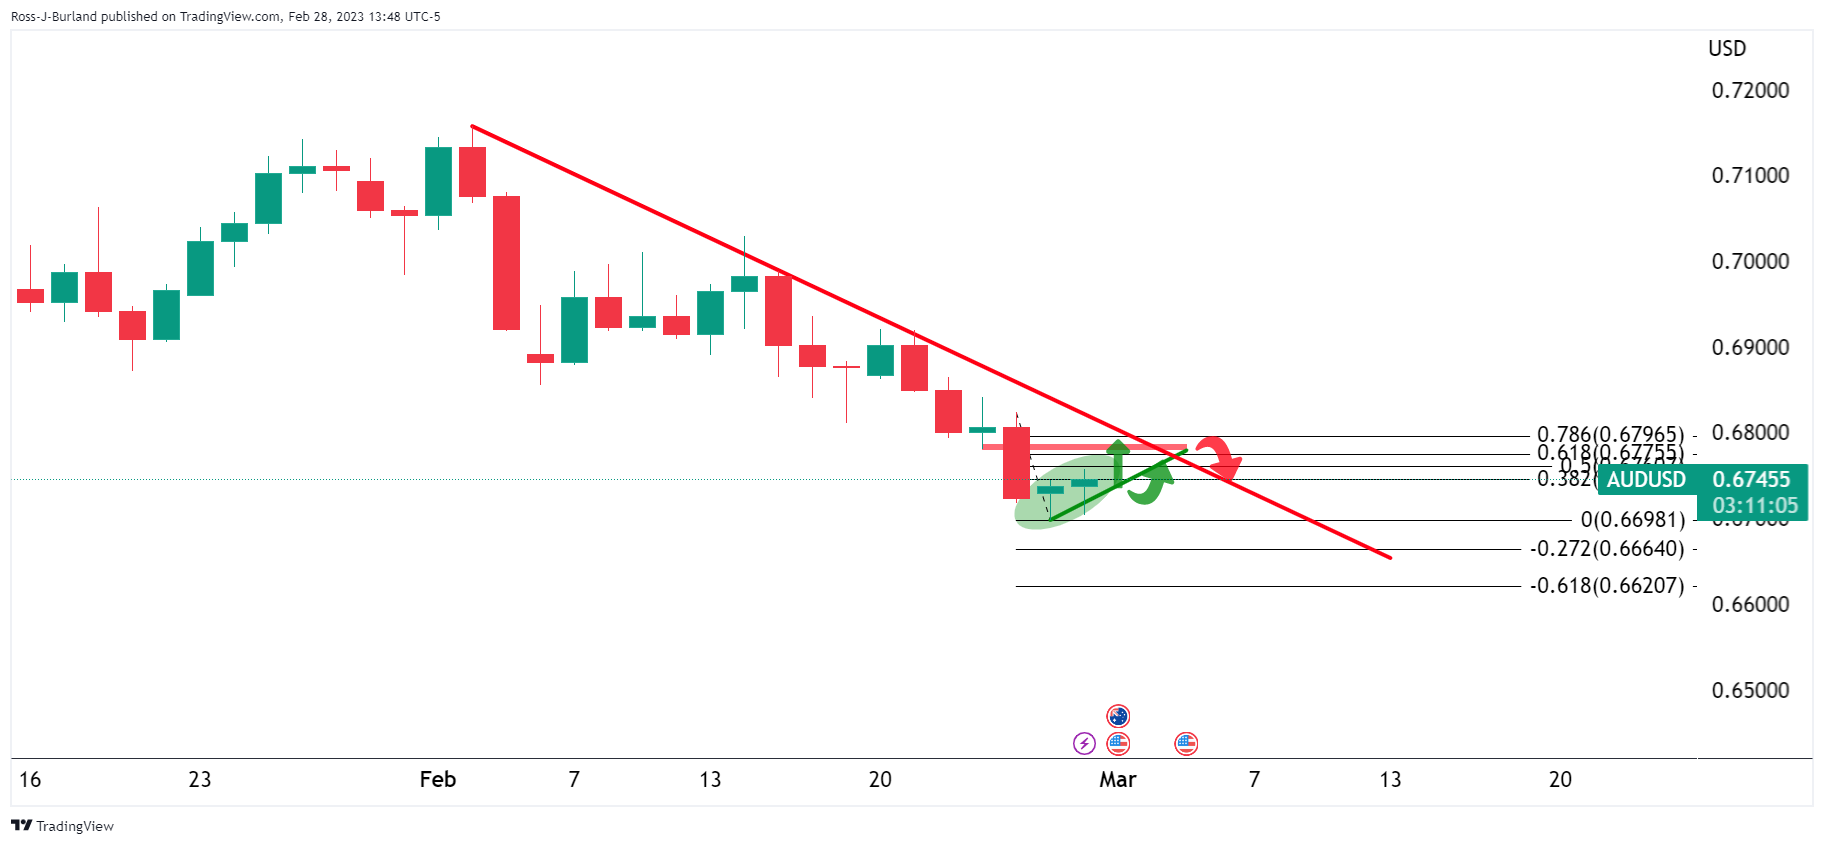
A target of the 78.6% Fibonacci higher up near 0.6800 would align with the daily trendline resistance as follows:
- EUR/USD's rally has been met with strong opposition from the bears.
- EUR/USD bulls have not thrown in the towel yet and eye 1.0700.
As per the prior analysis, EUR/USD Price Analysis: Bulls on the sidelines in anticipation of a discount, the more composed bulls, tolerant of the initial runaway train who waited for a discount were paid off nicely with the pair rallying from lows of 1.0580 to a high of 1.0645 between London and ahead of the cash open on Wall Street.
EUR/USD prior analysis
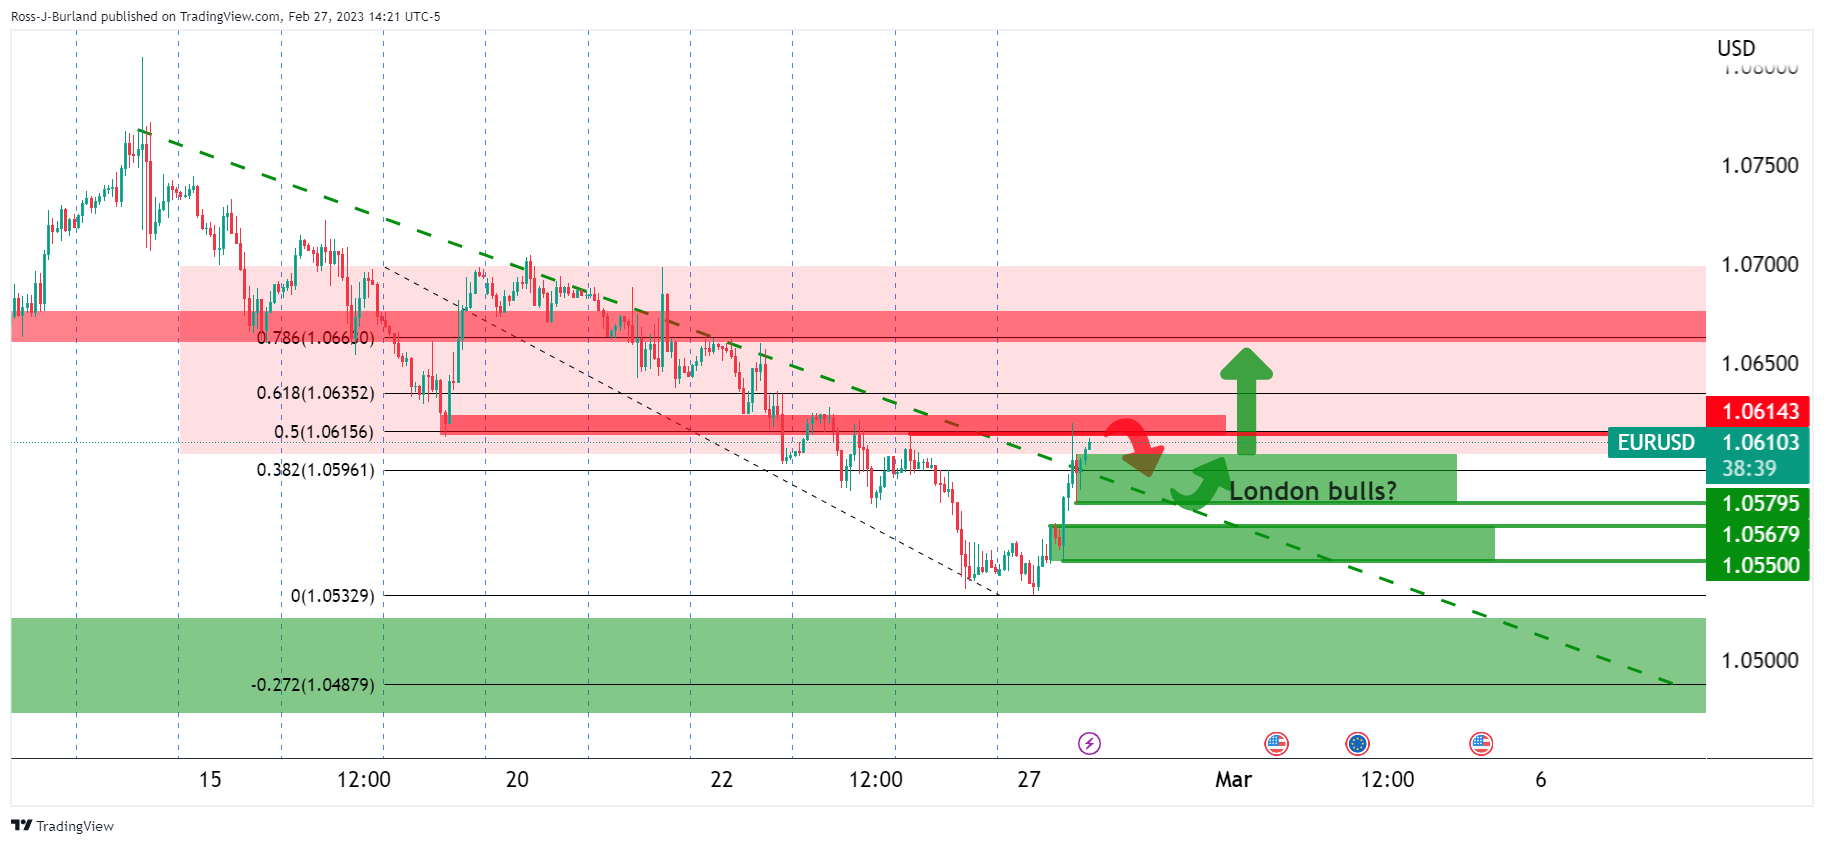
It was stated that EUR/USD could be an attractive play for the bulls if enough of a discount was awarded from what would have been regarded as counter-trendline support as illustrated above. It was explained that Asian shorts could set up the day for London traders as a buy-low opportunity.
EUR/USD update
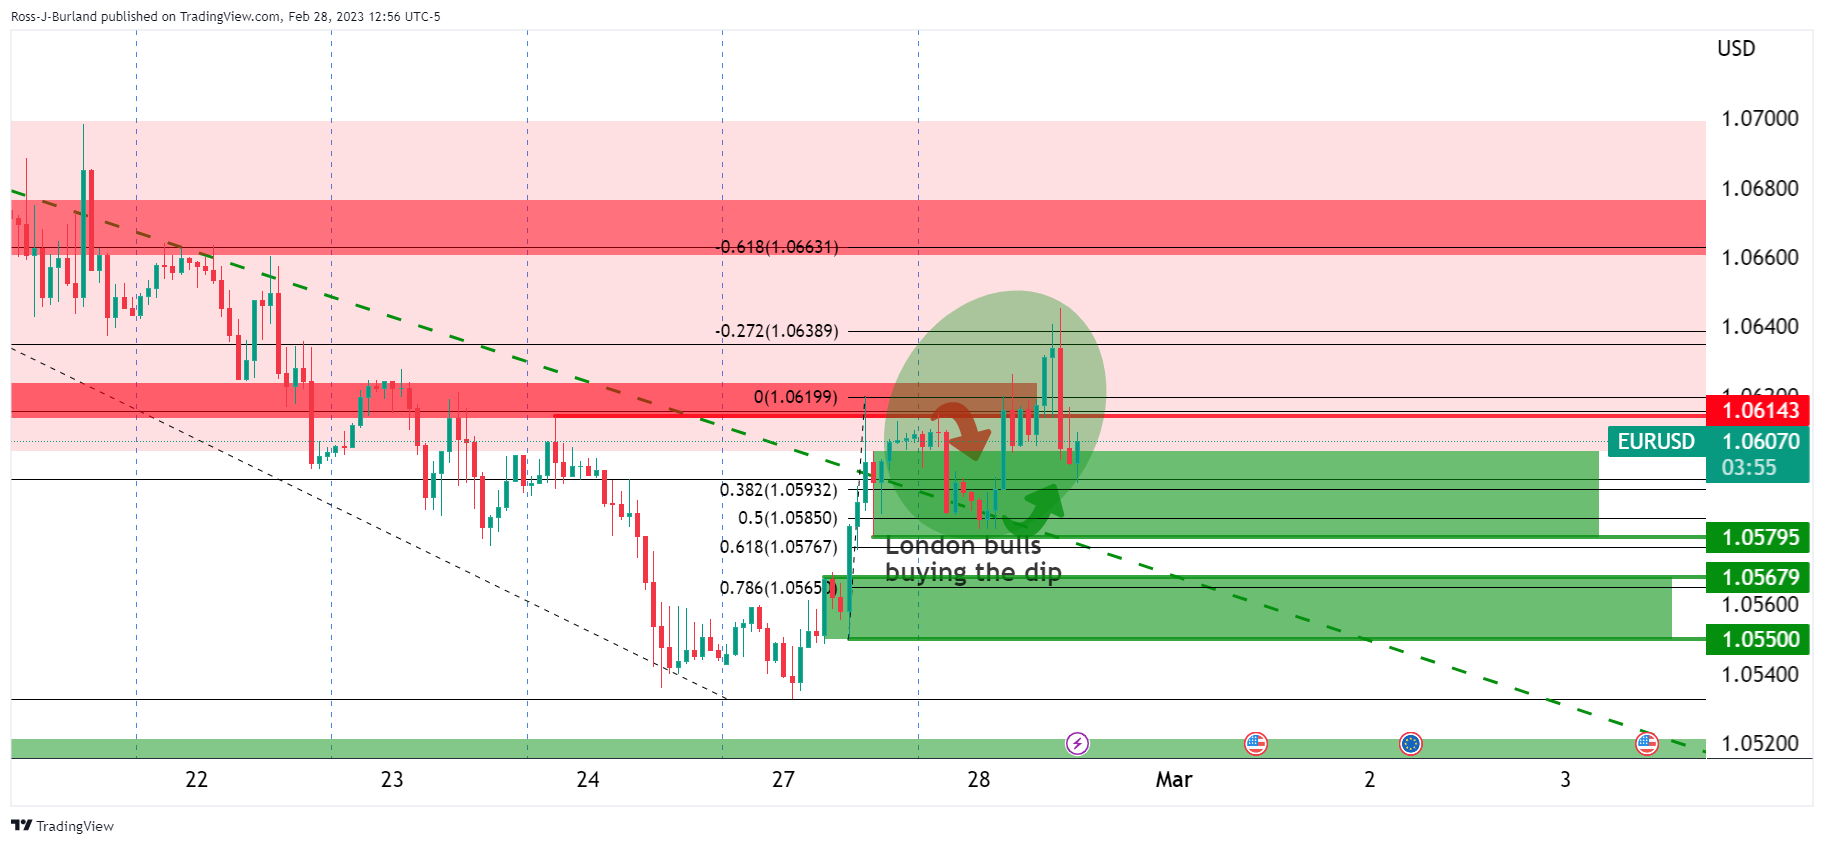
As shown, the bulls did indeed get a discount from the Asian sell-off into London's buyers.
It was explained in the prior analysis that while the bias is to the downside, as per the longer-term outlook, there were prospects of a correction into the bearish trend:
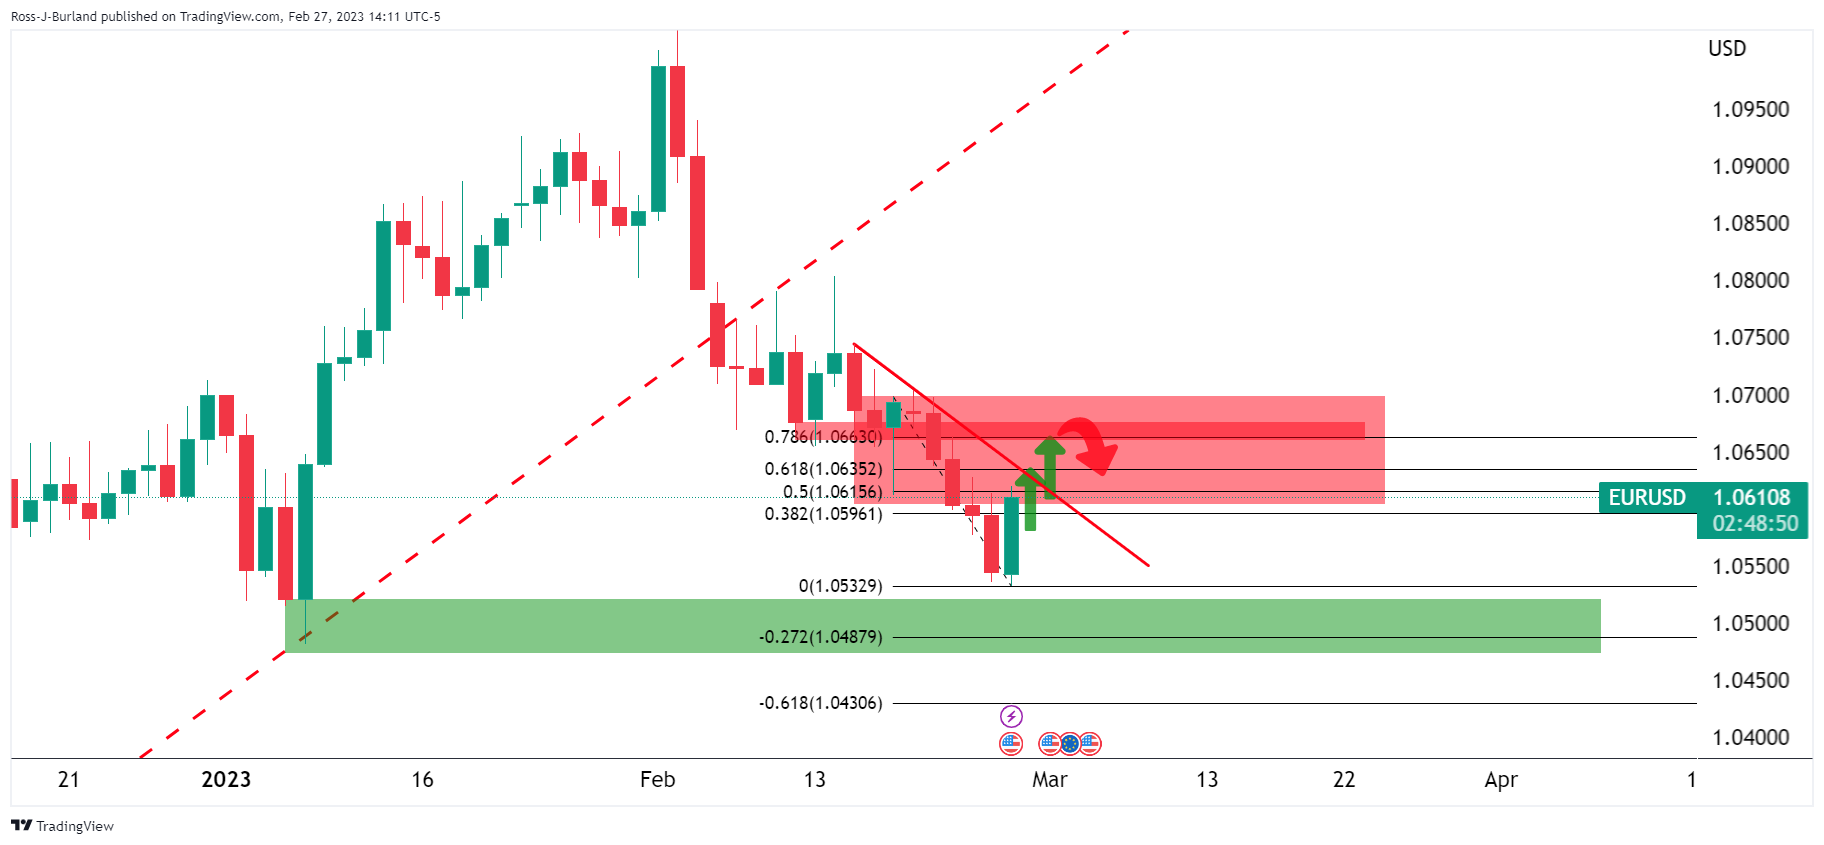
I was explained that ''this might only be premature in the correction and this could offer a buy-low opportunity for bulls in the coming sessions in anticipation of a test of the trendline resistance.''
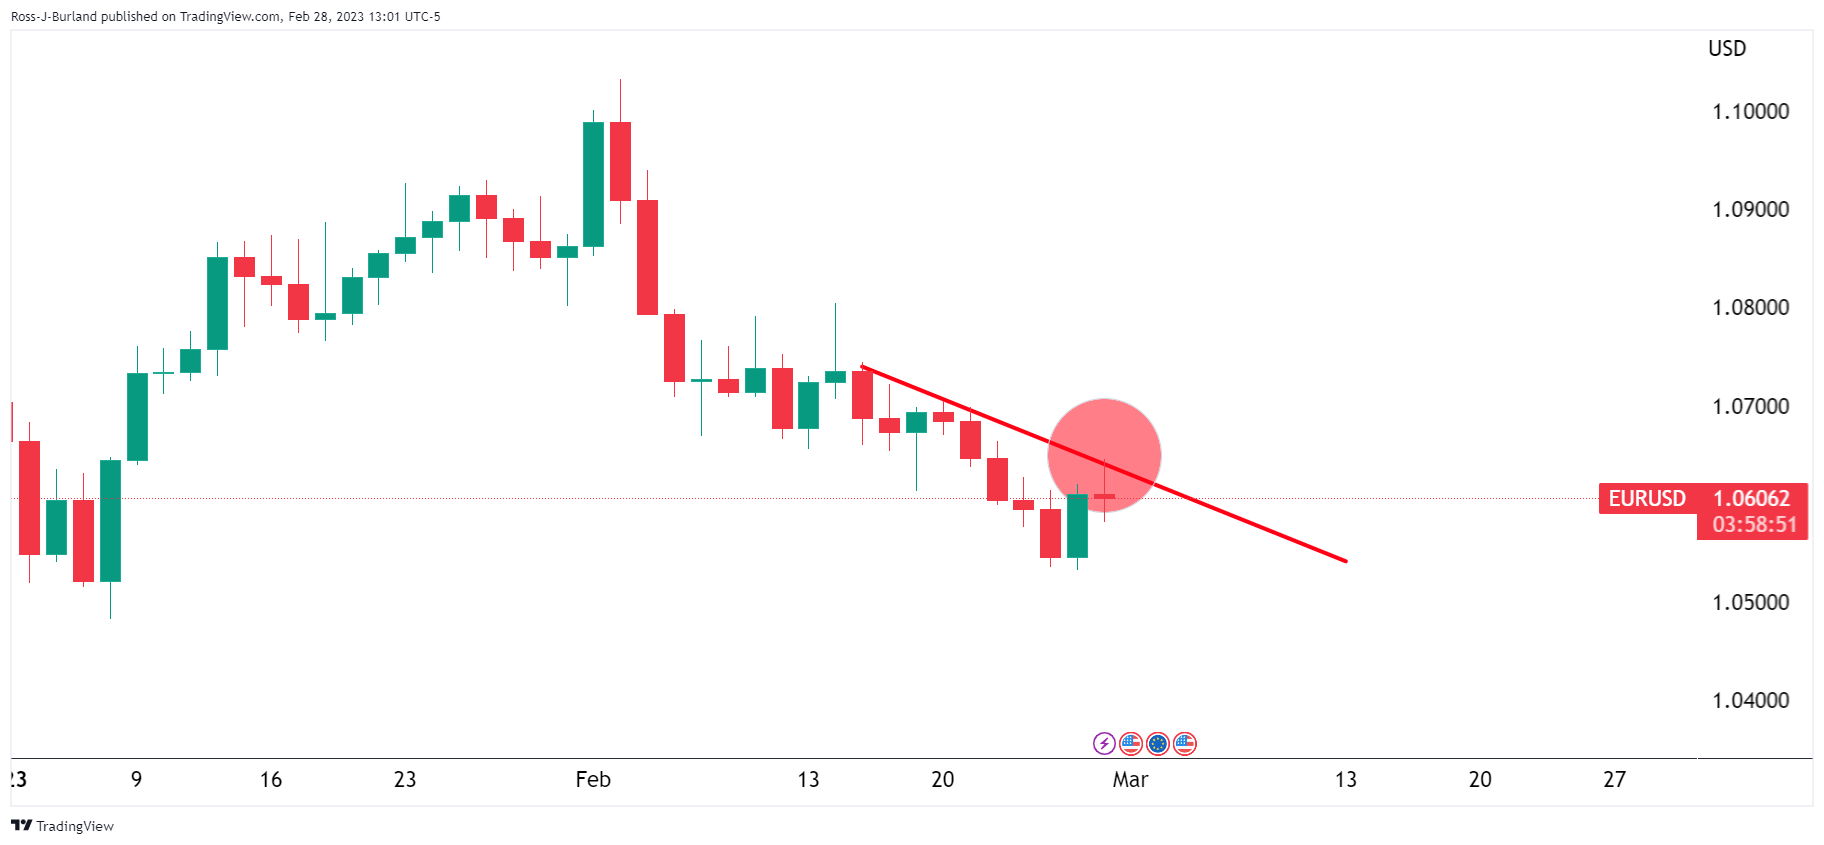
That is what we got as shown in the daily chart above. However, there are still prospects of a firmer test and a move higher for the day ahead given how short the market is and the following illustrates such a scenario across the daily and hourly time frames:
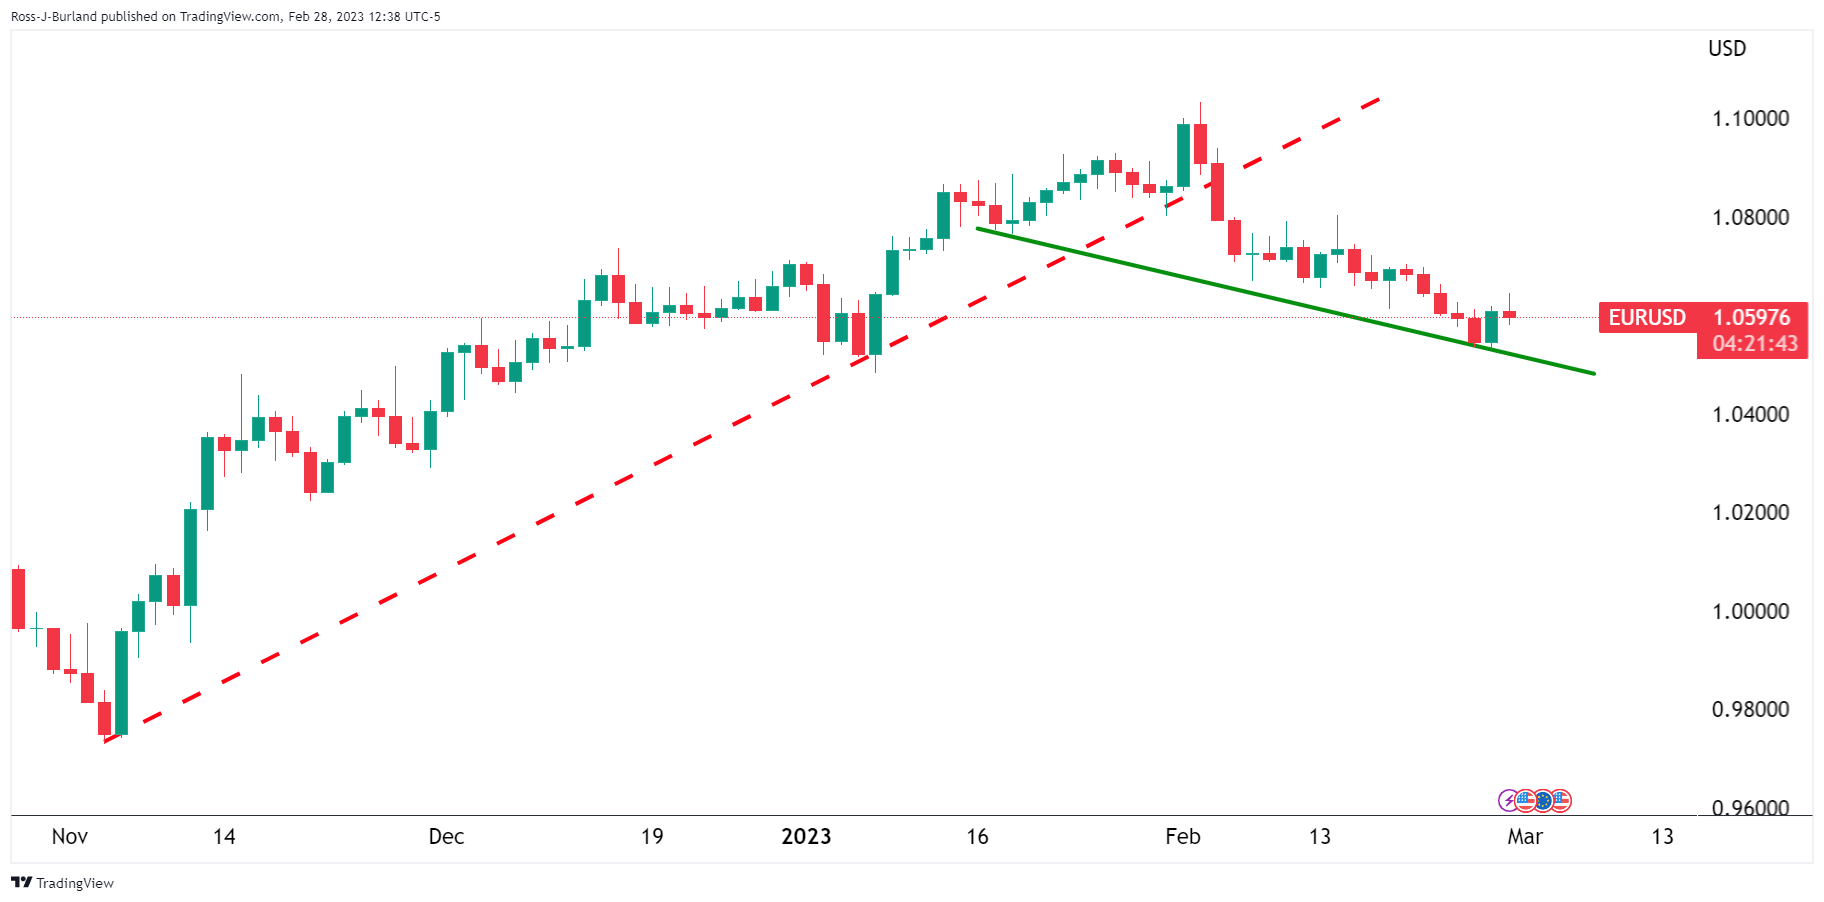
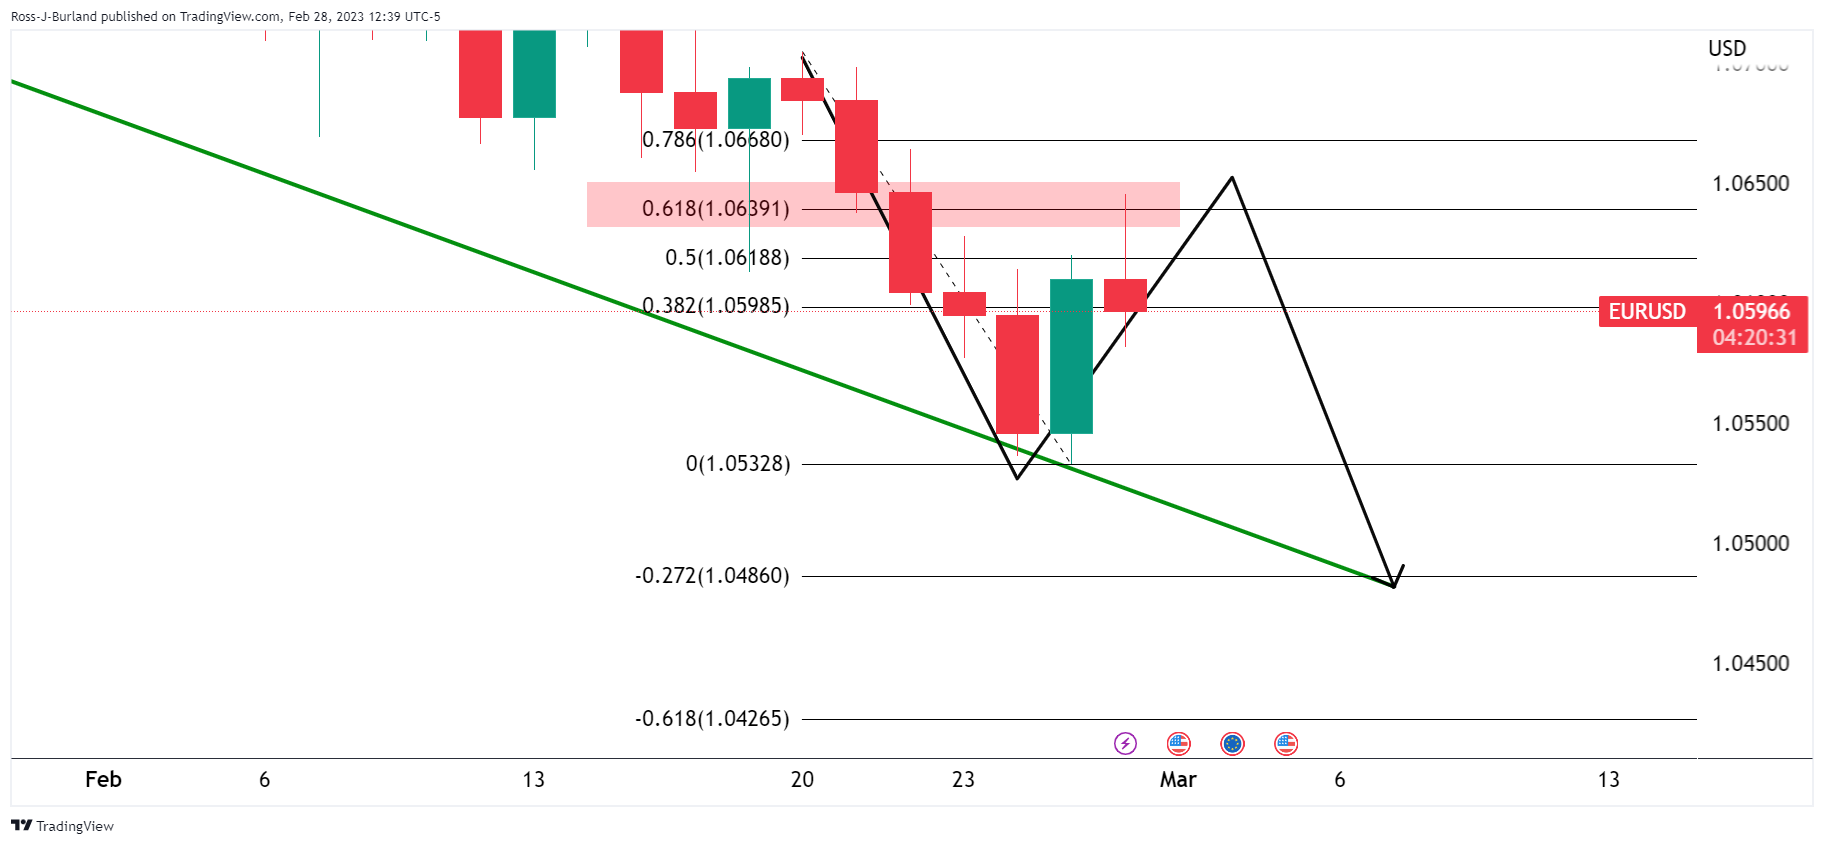
The strong bull candle has a lot of commitment in there and despite the sell-off in the US session, bulls may remain committed still which offers prospects of another test higher as per the following hourly chart:
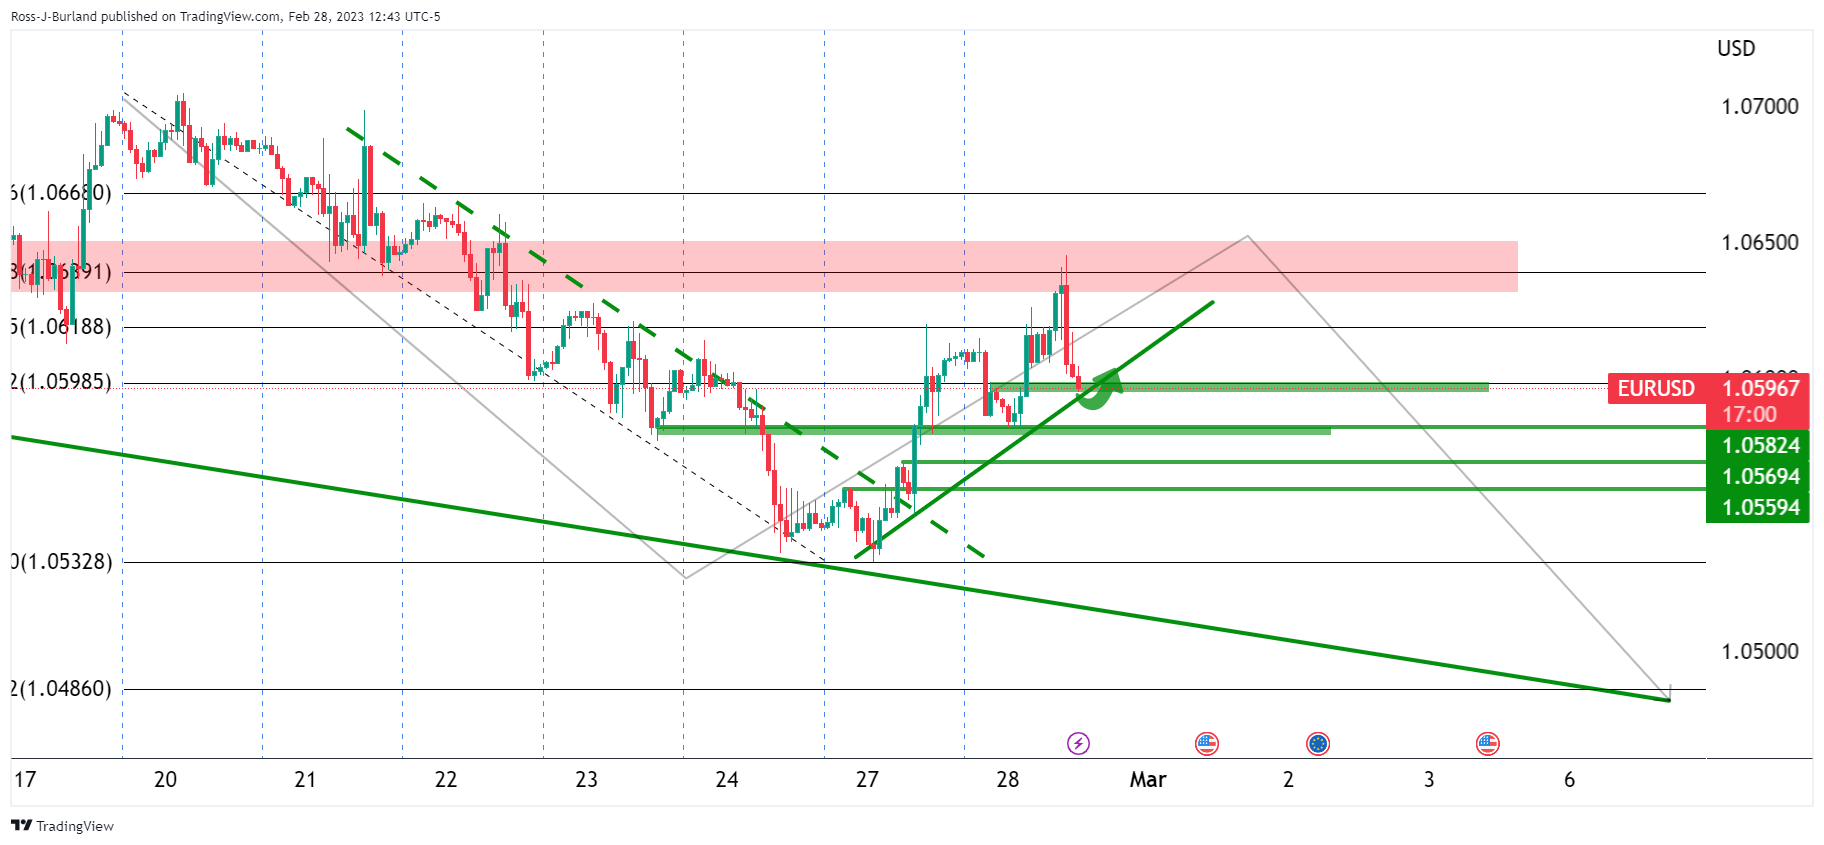
Bulls could be seen to emerge from a number of sweet spots on the chart as illustrated.
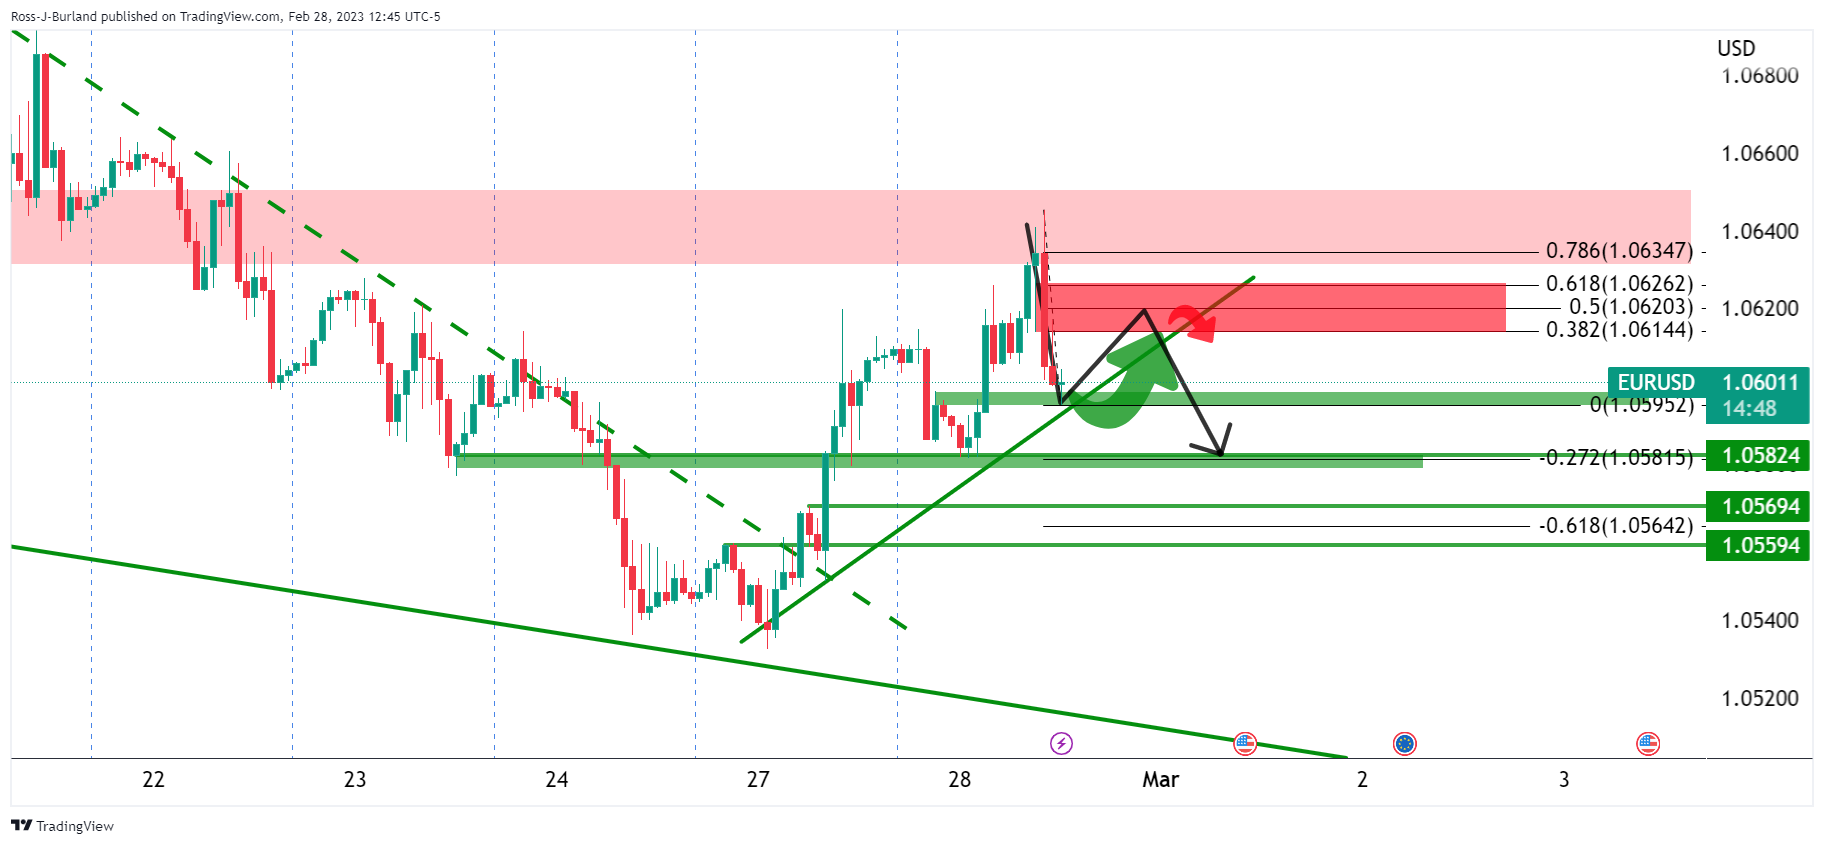
However, 1.0620/50 could be a tough nut to crack and this might take a number of sessions to break down. 1.0580 will be key in this regard should the bears continue to push back.
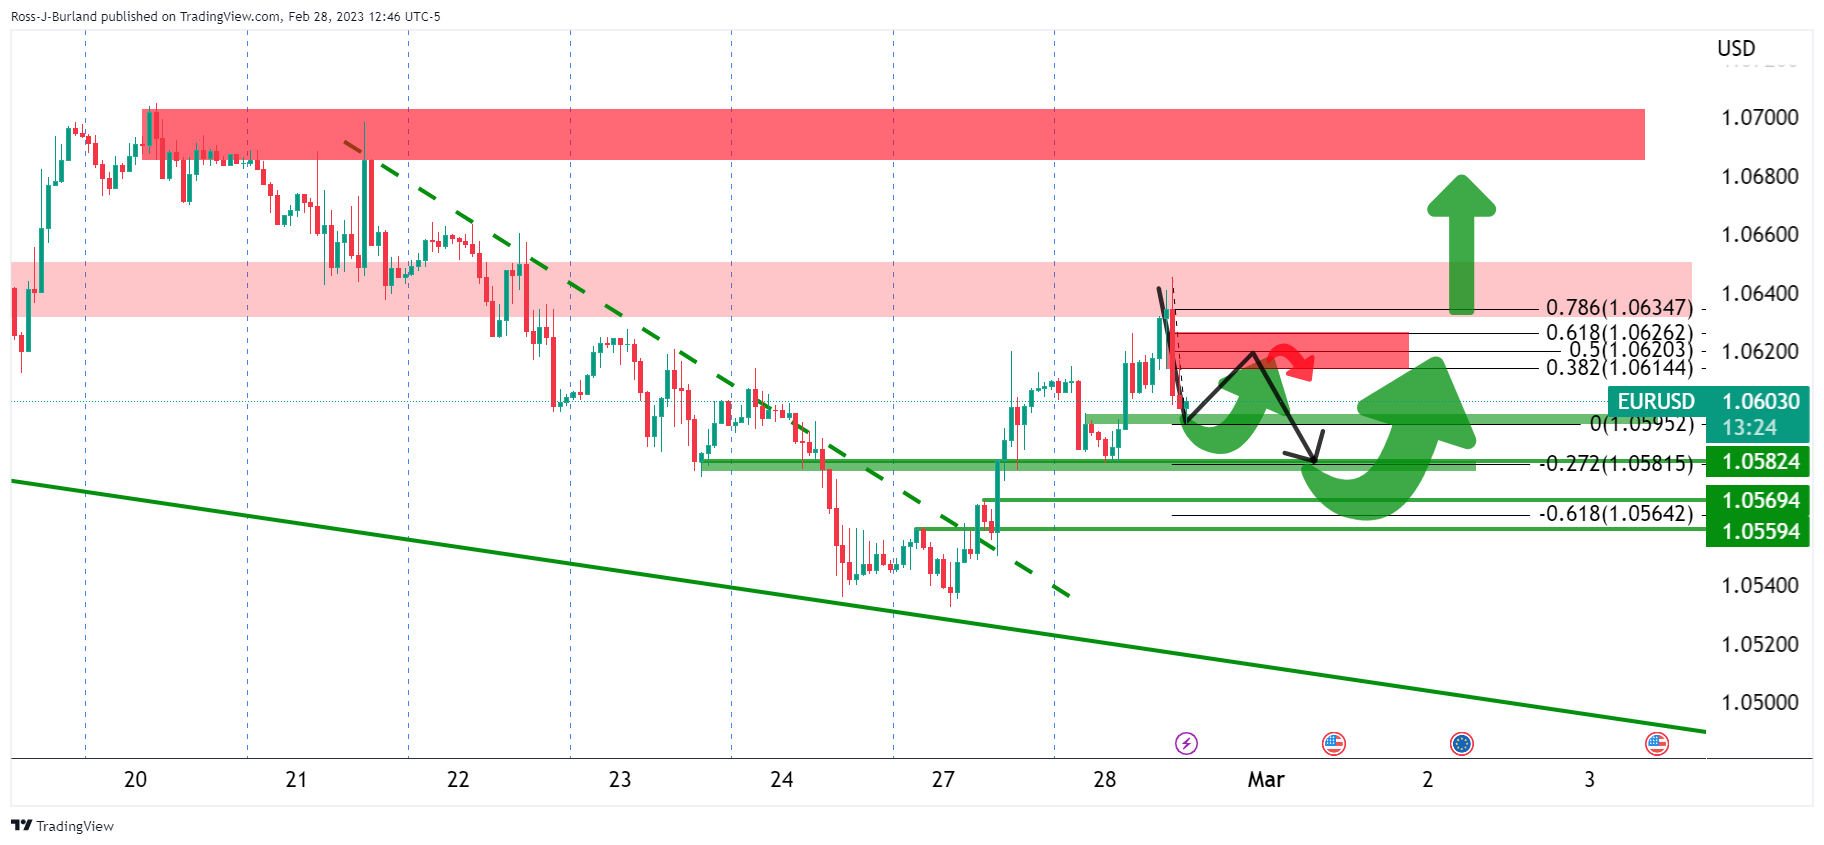
1.07 is eyed as a key target for the days ahead.
- USD/JPY hovers at around 136.00, an essential level for bulls to extend their gains.
- A bullish resumption would happen once the USD/JPY reclaims 137.00, with bulls eyeing 140.00.
- Otherwise, USD/JPY bears would have the upper hand if the major falls beneath 136.00.
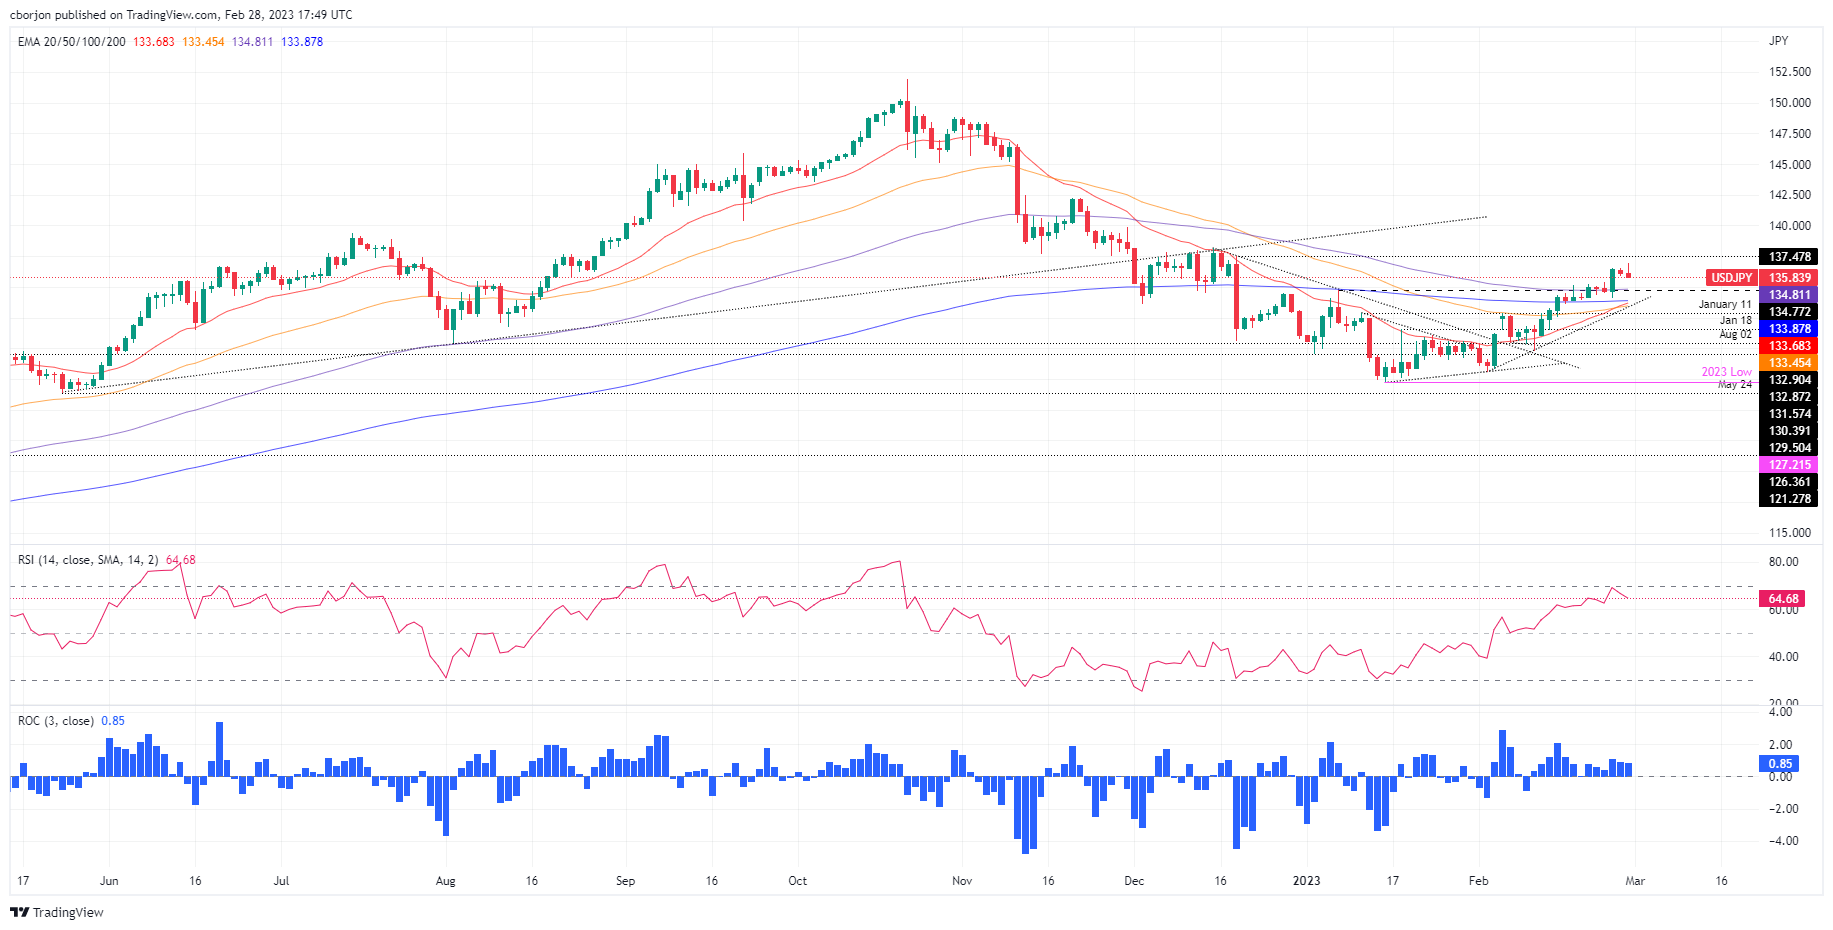
After hitting a new YTD high at 136.91, the USD/JPY fell short of piercing the 137.00 figure and is staging a recovery as the New York session progresses. At the time of writing, the USD/JPY is trading at 135.85, below its opening price by 0.24%.
The USD/JPY bias is upward once the pair emerged above the 100-day Exponential Moving Average (EMA) last Friday. That exacerbated a rally above 136.00, an important price level for USD/JPY bulls as they prepare to launch an assault to 137.00. Though, the pair remains vulnerable at around 136.00, with sellers eyeing to drag prices below the latter, which would exacerbate a fall toward the 100-day EMA at 134.81.
For a bullish continuation, the USD/JPY needs to rise above 137.00, opening the door toward the 140.00 mark. But on its way north, the USD/JPY would face some hurdles. The first supply area would be the December 20 daily high at 137.47, followed by the December 16 high at 137.80, ahead of testing the November 30 daily high at 139.89.
USD/JPY Daily chart
USD/JPY Key technical levels
- Last Friday’s report of a high Core PCE, the Fed’s gauge for inflation, augmented speculations of rates “higher for longer.”
- US housing data in the United States was mixed, though the markets mainly ignored it.
- XAU/USD Price Forecast: Albeit jumping at the 200-DMA, downside risks remain below $1850.
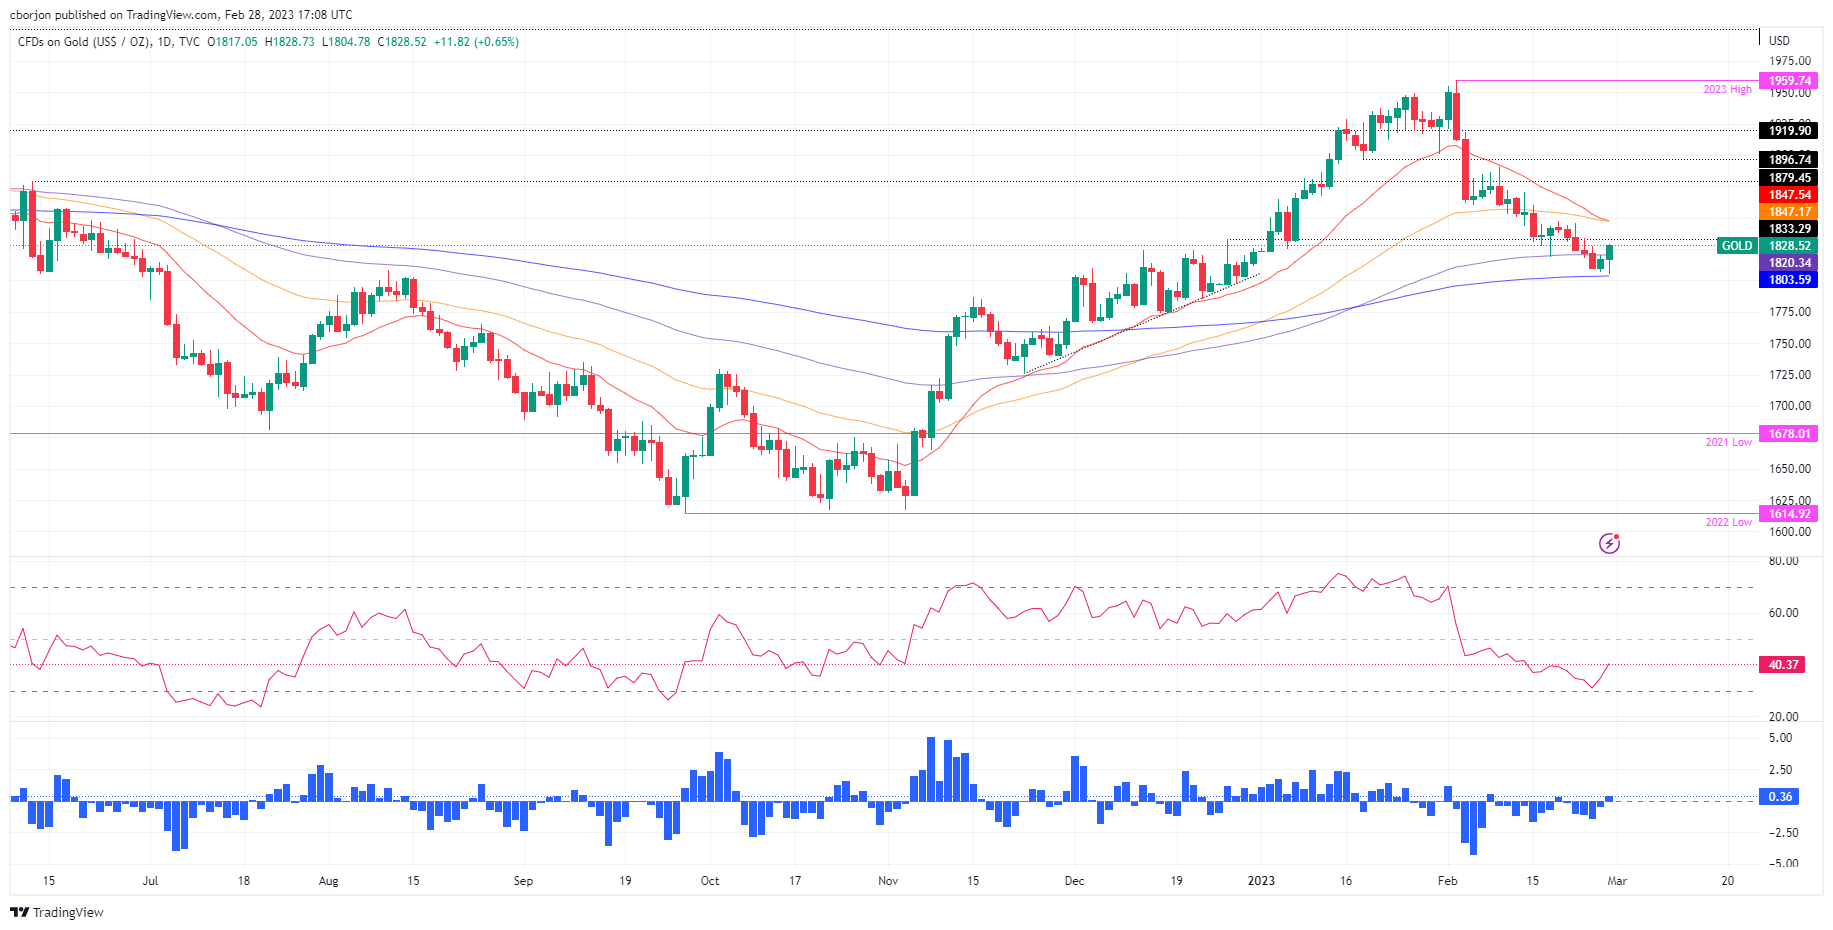
Gold price is recovering after hitting a new YTD low of $1804.78, rising above the 100-day Exponential Moving Average (EMA). Factors like a mixed sentiment and a soft US Dollar (USD) are tailwinds for the yellow metal, even though there are growing speculations for higher rates in the United States (US). Hence, the XAU/USD is trading at $1827.03, above its opening price by 0.56%.
The jump in Gold prices is courtesy of an offered US Dollar
The financial markets narrative has not changed. Last Friday’s US Core Personal Consumption Expenditure (PCE), the Fed’s preferred gauge for inflation edging higher above expectations and closing to the 5% mark, caused a repricing for the Federal Funds Rate (FFR) terminal rate. Money market futures estimates 25 bps rate increases in March, May, and June, which would drag the FFR to the 5.25% - 5.50% range. Nevertheless, some investors are betting the Fed will ease in Q4 2023.
In the meantime, the US economic docket features housing data. According to the US Federal Housing Finance Agency’s data released on Tuesday, house prices in the US decreased by 0.1% from November to December. The S&P/Case-Shiller Home Price Index for December was also released and showed a year-over-year increase of 4.6%, lower than the previous month’s 6.8% and lower than the 6.1% estimated by analysts.
The US Dollar Index (DXY), a measure of the buck’s value against a basket of peers, has been volatile during Tuesday’s session, at around 104.630. Meanwhile, UST yields, mainly the 10-year benchmark note rate, sit at 3.936% and gains two bps, capping XAU/USD rally towards the $1830 area.
XAU/USD Price Analysis: Technical outlook
Technically speaking, the XAU/USD’s recovery above the 100-day EMA keeps Gold bulls hopeful of reclaiming the $1850 area and cemented the case for a bottom around $1800. Nevertheless, the 20-day EMA is about to cross below the 50-day EMA in the $1847 area, which would be of greater importance for sellers, leaning to the $1850 region as they try to re-test the $1800 figure.
XAU/USD needs to get above the intersection of the 20/50-day EMAs for a bullish continuation. Once done, that could pave the way towards the February 9 high at $1890.21, ahead of $1900. For a bearish scenario, the XAU/USD needs to drop below the 100-day EMA at 1820.31, exacerbating a re-test of the 200-day EMA at $1803.57.
What to watch?
Economists at Société Générale discuss EUR outlook. In their view, risks for the shared currency are tilted to the downside.
Key support below 1.0500 at 1.0450
“EUR/USD support at 1.0450 if 1.05 gives way.”
“March seasonals are bearish.”
“European stocks and spreads have outperformed the US since the start of the year and a reconvergence would undermine the bullish EUR/USD view.”
“Euro flash CPI for February is due this week and could cause more pain for bonds but also for EUR/USD if the data surprises to the upside.”
Economists at Wells Fargo expect the GBP/USD pair to move gradually higher toward 1.22 by the end of the year.
BoE will be comfortable shifting to a slower pace of rate hikes
“Should inflation continue to show a pronounced declaration, and activity and survey data show renewed softening, we expect the BoE to deliver a final 25 bps rate to 4.25% in March and to begin cutting interest rates as early as Q4 of this year. Our forecast policy rate peak is well below the level implied by current market pricing.”
“The less aggressive approach we envisage from the BoE is an important reason we expect that, over the medium-term, the Pound will be an underperformer against a broadly soft USD, targeting a GBP/USD exchange rate of just 1.2200 by the end of this year and 1.2400 by mid-2024.”
- Canada’s economy grew at a 0% pace in Q4, annualized, justifying the BoC pause in rate increases.
- US house prices tumbled while the US Dollar continued to trade in the backfoot.
- USD/CAD Price Analysis: Further upside is warranted on a daily close above 1.3600.
After dismal economic data reported from Canada, the USD/CAD advances toward the 1.3600 figure, while the US Dollar (USD) registers some losses. In addition, market sentiment shifted sour as US equities opened in the red. At the time of writing, the USD/CAD exchanges hands at around 1.3610.
Canada’s GDP was flat, a tailwind for USD/CAD
Statistics Canada revealed the Gross Domestic Product (GDP) for Q4, which was expected at 2.9% QoQ, though missed estimates and came flat at 0%. According to the agency, inventory accumulations and declines in business investment, mainly machinery, and equipment were the reasons for weaker growth in Q4.
Even though the reading is negative, it takes the pressure off the Bank of Canada (BoC). The BoC announced at its last monetary policy meeting that it would pause rate hikes. Consequently, further USD/CAD strength is warranted, as the US Federal Reserve (Fed) is expected to continue its tightening cycle with speculation around the financial markets that the Fed could go as high as 6%, according to Bank of America (BofA) Global Research.
The USD/CAD jumped after the data release and printed a daily high of 1.3609. Nevertheless, the dust had settled, and the major retraced toward the 1.3590s area.
On the US front, monthly house prices dropped in December by 0.1% MoM, in data published by the US Federal Housing Finance Agency showed on Tuesday. At the same time, the S&P/Case-Shiller Home Price Index arrived at 4.6% YoY in December, down from 6.8% in November and lower than analysts’ estimate of 6.1%.
Also read:
- Canada: Annualized real GDP declines to 0% in Q4 vs. 1.5% expected
- US: Housing Price Index declines 0.1% in December vs -0.6% expected
USD/CAD Technical analysis
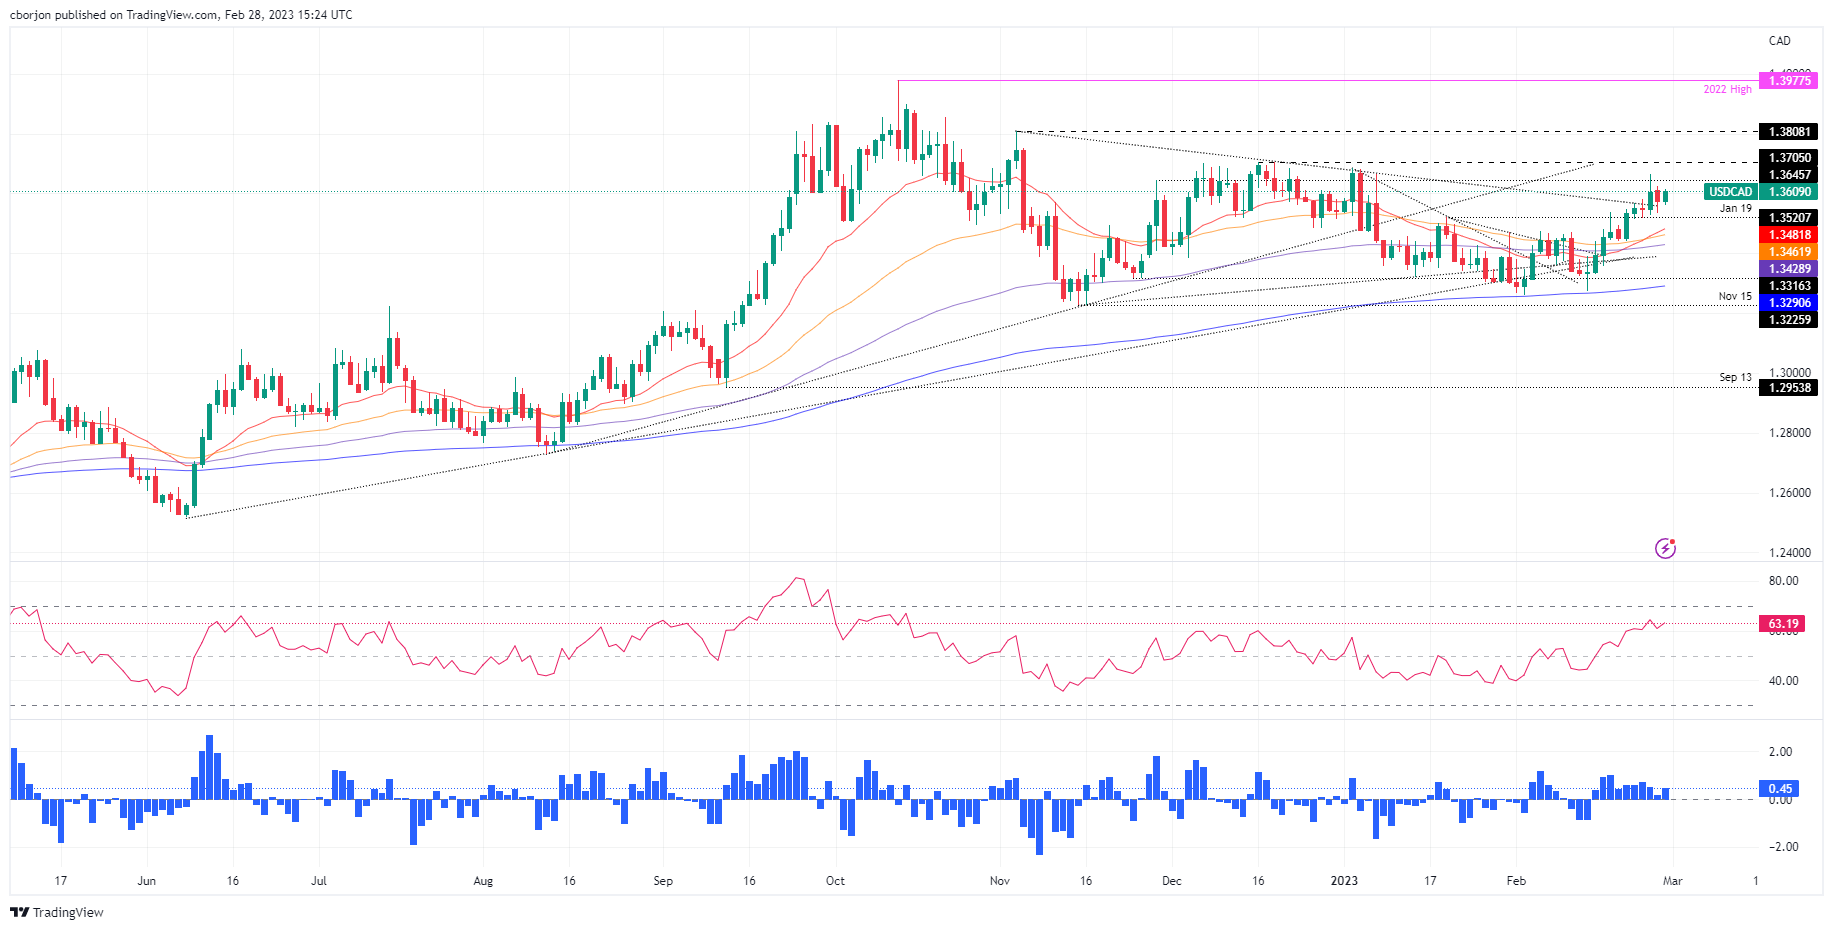
The USD/CAD daily chart portrays the pair as upward biased after bottoming around 1.3200. After falling to YTD lows at 1.3262, the USD/CAD has prolonged its gains and has broken above crucial resistance areas, like the 20, 50, and 100-day Exponential Moving Averages (EMAs). Therefore, interest rate differentials and technical momentum could pave the way for further upside.
The USD/CAD next resistance would be the daily high at 1.3609. A breach of the latter will expose the YTD high at 1.3685, ahead of 1.3700, followed by the November 3 swing high at 1.3808.
What to Watch
There is scope for near-term softness on the policy divergence that's underway between the Fed and BoC, but a broad weakening trend in the USD by mid-year will give CAD a lift, economists at CIBC Capital Markets report.
Loonie could stay under a bit of pressure in the near term
“The Loonie could stay under a bit of pressure in the near term with risks of a move towards 1.37, as markets focus on the divergence in policy that is underway between the Fed, which is still expected to take rates a quarter point higher at least two more times, and the BoC that is currently on hold.”
“By June, we still expect to see enough evidence of a cooling in US growth and inflation to have markets looking past the end of a US tightening cycle, a development that should put the US Dollar on the defensive.”
“We see USD/CAD ending the year at 1.31.”
“With global growth likely to receive a lift as central banks outside of North America also start to cut policy rates towards neutral, and higher commodity prices benefitting Canada’s export sector, look for USD/CAD to reach 1.28 in 2024.”
- Consumer confidence in the US weakened in February.
- US Dollar Index stays in the red below 104.50 after the data.
Consumer sentiment in the US deteriorated modestly in February with the Conference Board's Consumer Confidence Index declining to 102.9 from 106 in January (revised from 107.1). This reading came in below the Reuters estimate of 108.5.
Further details of the publication revealed that the Jobs Hard-to-Get Index edged lower to 10.5 from 11.1 and the one-year consumer inflation rate expectations declined to 6.3% from 6.7% in December.
Market reaction
The US Dollar Index stays on the back foot after this data and was last seen losing 0.17% on the day at 104.46.
Hopes of a swift further decline in the inflation rate have received a noticeable damper at the beginning of 2023. Accordingly, the Fed will probably raise interest rates several more times, economists at Commerzbank report.
No further disinflation
“Our review of various core measures suggests that the inflation trend is probably still above 4%, way above the Fed's 2% target.”
“The Fed will hope that the effects of rate hikes have not yet shown up because of the usual lags in their impact. This will change and price pressures will then ease noticeably as the year progresses. If this does not happen, the Fed has obviously not cooled demand sufficiently. Significantly more rate hikes than previously expected (our forecast: three further hikes by June of 25 basis points each to 5.50% for the upper end of the target range) would then be likely.”
- EUR/USD adds to the weekly recovery beyond the 1.0600 mark.
- The 55-day SMA at 1.0715 emerges as the next up barrier near term.
EUR/USD extends the optimism seen at the beginning of the week and looks to extend the breakout of 1.0600 the figure on Tuesday.
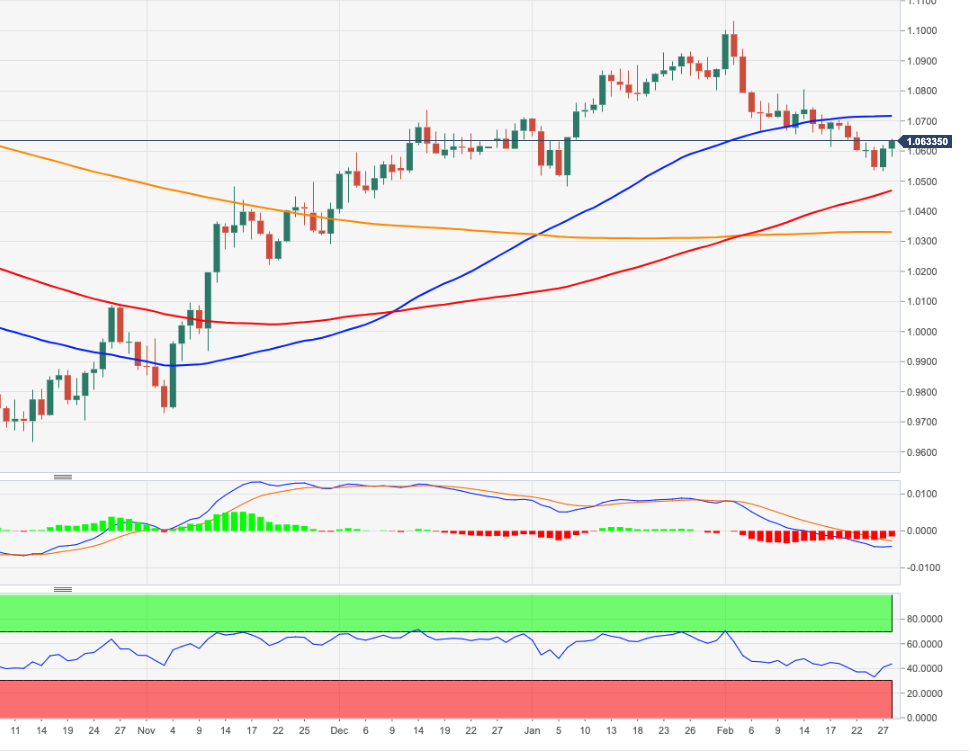
There is a provisional up barrier at the 55-day SMA at 1.0715 prior to the weekly high at 1.0804 (February 14). A convincing move above this level could open the door to extra gains in the short-term horizon.
Looking at the longer run, the constructive view remains unchanged while above the 200-day SMA, today at 1.0328.
EUR/USD daily chart
- France and Spain's inflation numbers surpass expectations, according to preliminary data in February.
- Agreement between the UK and EU boosts the Pound.
- EUR/GBP moving with a bearish bias.
The EUR/GBP is falling on Tuesday, trading at the lowest level in a month. The cross broke under 0.8780 and fell to 0.8759, the lowest level since late January.
EUR and GBP outperforming
Despite falling versus the Pound, the Euro is among the top performers on Tuesday boosted by rising Eurozone government bond yields. The German 2-year yield rose to the highest since 2008 and the 10-year stands at 2.70%, up 4.65% for the day, at the highest since July 2011.
France and Spain reported preliminary inflation numbers showing an unexpected acceleration. French CPI rose 7.2% from a year ago, against expectations of 7%. Spain's CPI rose 6.1% from 5.9%, above the market consensus of 5.7%.
Inflation figures boosted a decline in European bonds and an increase in European Central Bank tightening expectations. Despite those effects, EUR/GBP drifted lower.
The Pound benefited from the deal between the European Union and the United Kingdom on the Northern Ireland Protocol. "This had been widely reported for weeks but markets reacted positively to the news. Now comes the hard part, as Prime Minister Sunak must get Parliament to approve the agreement", explained analysts at Brown Brothers Harriman. They suspect the deal will eventually be passed "but there is absolutely nothing to get bullish about. The agreement simply avoids a potential trade war as the UK had threatened to unilaterally change the Brexit deal, which would trigger sanctions from the EU".
The Brexit deal and an improvement in market sentiment are favoring the Pound on Tuesday. Also, some technical factors contribute to the negative momentum. EUR/GBP broke below 0.8780 and fell to 0.8759. It is hovering near the lows, under pressure.
Technical levels
Economists at Société Générale discuss USD/INR technicals. The pair could enjoy further gains on a break past the 82.95/83.30 resistance zone.
82.30 is crucial support
“USD/INR has evolved within a large sideways consolidation resembling an ascending triangle; a clear direction has been lacking.”
“Overcoming the resistance zone at 82.95/83.30 would be essential for affirming an extended uptrend.”
“Recent bullish gap at 82.30 is the first layer of support. In case this gets violated, a short-term pullback is likely.”
See: USD/INR to move slightly lower toward 81.50 by year-end – Commerzbank
GBP/USD surged higher and closed the day above 1.2000. Economists at Scotiabank believe that the pair could extend its rally as high as the mid-1.24s.
Last week’s peak is a potential double bottom trigger
“Sterling had a very positive session overall yesterday (bullish outside range to reject the 200-Day Moving Average support). Follow-through demand puts near-term focus on the mid-1.21 zone where last week’s high and the 55-DMA converge.”
“Last week’s peak is a potential double bottom trigger following the GBP’s two recent tests of the 1.1925/30 area. Gains through here would target a retest of the GBP’s recent peaks in the mid-1.24s at least.”
USD/CNY rose for the fifth consecutive week from 6.70 in mid-January to 6.96 last week. Economists at Commerzbank believe that the pair could move back lower in the coming quarters.
Heightened US-China tensions are likely to keep the volatility high
“Heightened geopolitical tensions between the US and China could continue to support USD/CNY in the near term. However, CNY could stabilize somewhat if the upcoming economic data shows a continued improvement in the economy.”
“Further, the tailwinds from Covid reopening and an expected weaker Dollar later this year could support a modest appreciation of the CNY in the coming quarters. But an expected narrowing in China’s trade surplus will limit the pace of any possible yuan appreciation.”
“Heightened US-China tensions are likely to keep the volatility high.”
- House prices in the US declined at a softer pace than expected in December.
- US Dollar Index stays in negative territory at around 104.50.
House prices in the US declined by 0.1% on a monthly basis in December, the monthly data published by the US Federal Housing Finance Agency showed on Tuesday. This reading came in better than the market expectation for a decrease of 0.6%.
Meanwhile, the S&P/Case-Shiller Home Price Index arrived at 4.6% on a yearly basis in December, down from 6.8% in November and lower than analysts' estimate of 6.1%.
Market reaction
The US Dollar stays under modest selling pressure after this report and the US Dollar Index was last seen losing 0.15% on the day at 104.47.
Analysts at Société Générale discuss GBP outlook. The GBP/USD pair is not out of the woods yet.
Resistance running at 1.2450
“Much stronger than forecast UK services PMI and optimism that inflation will fall sharply by the end of the year have caused the narrative on the pound to improve. GBP/USD is not in the clear however and must hold the 200-DMA at 1.1926 to avoid deeper losses which could still materialise in March.”
“The outlook for wider Fed/BoE policy spread should limit upside for GBP/USD in the medium-term with resistance running at 1.2450.”
“The new deal between the UK and the EU on changes to the NI protocol will be signed but will not immediately translate into windfalls for the economy and the currency. It has no impact on the BoE and at what level interest rates peak.”
- GBP/USD turns positive for the second successive day and climbs back above the 1.2100 mark.
- A positive risk tone undermines the USD and lends some support amid the latest Brexit optimism.
- Bulls might still wait for a sustained strength beyond the 50-day SMA before placing fresh bets.
The GBP/USD pair catches fresh bids following an early slide to the 1.2025 area on Tuesday and builds on the previous day's solid bounce from the very important 200-day Simple Moving Average (SMA). The momentum pushes spot prices to a four-day high, beyond the 1.2100 mark, during the early North American session and is sponsored by a combination of factors.
The latest optimism over a new deal on the Northern Ireland protocol between the UK and EU, along with rising bets for additional rate hikes by the Bank of England (BoE), underpin the British Pound. Adding to this, a generally positive tone around the equity markets weighs on the safe-haven US Dollar and lends some support to the GBP/USD pair. That said, the prospects for further policy tightening by the Fed should act as a tailwind for the Greenback and cap the major amid looming recession risks.
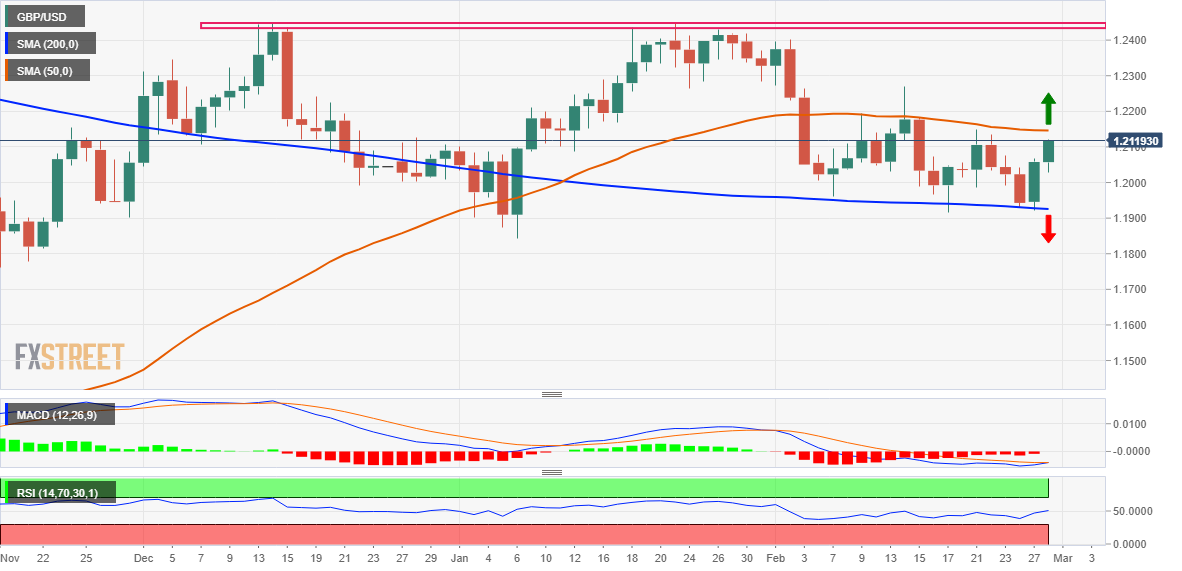
Moreover, neutral oscillators on the daily chart warrant some caution for aggressive bullish traders and before positioning for a further appreciating move for the GBP/USD pair. Hence, any subsequent move up is more likely to confront stiff resistance and remain capped near the 50-day SMA, currently around the 1.2145 region. Some follow-through buying, however, could trigger a short-covering rally and lift spot prices beyond the 1.2200 mark, towards the recent swing high, around the 1.2265-1.2270 zone.
On the flip side, the 1.2065-1.2060 area now seems to act as immediate support ahead of the 1.2025 zone (the daily low) and the 1.2000 psychological mark. Any further decline might continue to attract some buyers and remain limited near the 200-day SMA, currently pegged near the 1.1925-1.1920 region. A convincing break below the latter will complete a bearish double-top pattern formed near the 1.2445 area and drag the GBP/USD pair to the YTD low, around the 1.1840 zone touched in January.
GBP/USD daily chart
Key levels to watch
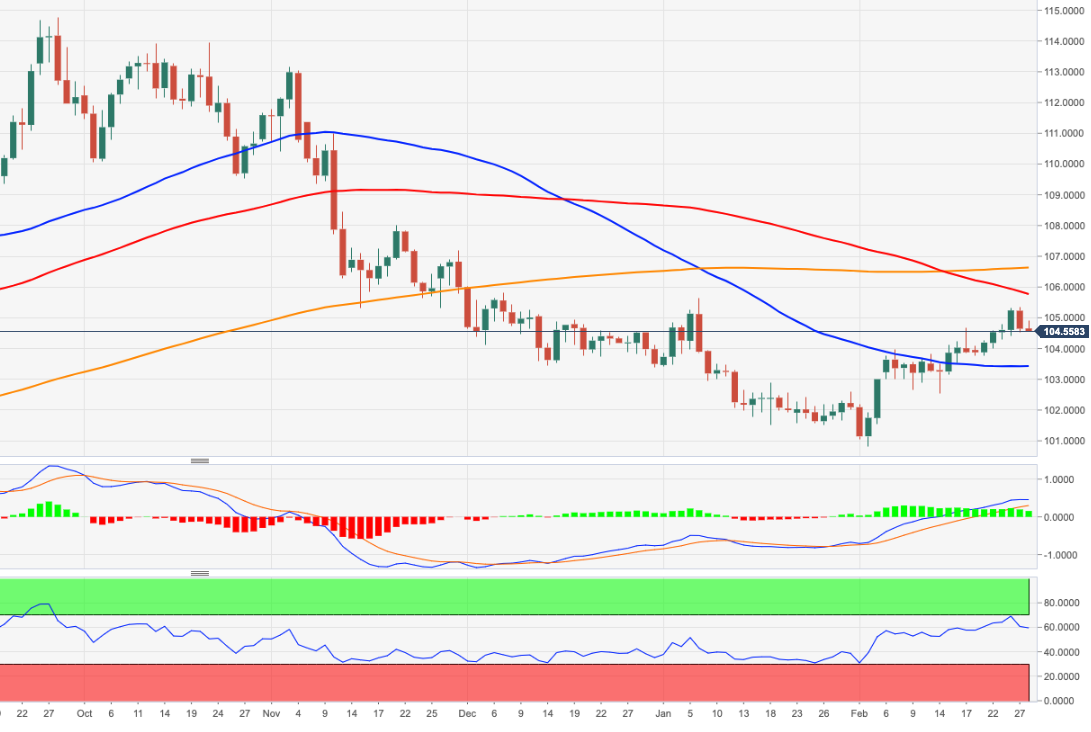
- DXY recedes to the lower end of the weekly range near 104.60.
- Next on the upside emerges the 2023 peak around 105.60.
DXY alternates gains with losses near 104.60 following Monday’s marked retracement.
The ongoing price action favours the continuation of the uptrend despite the ongoing corrective move. Further bouts of strength should then clear the February high at 105.35 (February 27) to allow for a probable challenge of the 2023 top at 105.63 (January 6).
In the longer run, while below the 200-day SMA at 106.49, the outlook for the index remains negative.
DXY daily chart
- Canadian economy performed much worse than expected in Q4.
- USD/CAD rises toward 1.3600 following the disappointing GDP data.
The Canadian economy stagnated in the fourth-quarter with the annualized real Gross Domestic product (GDP) growth arriving at 0%. This reading followed the 2.3% expansion recorded in the third quarter and missed the market expectation for a growth of 1.5% by a wide margin.
On a monthly basis, real GDP in Canada contracted by 0.1%.
Statistics Canada explained slower inventory accumulations and declines in business investment in machinery and equipment were behind the poor economic performance in Q4.
Market reaction
USD/CAD edged higher with the initial reaction and was last seen posting small daily gains at 1.3585.
- AUD/USD is seen consolidating its recent fall to the lowest level since January.
- A positive risk tone undermines the USD and benefits the risk-sensitive Aussie.
- The setup still favours bearish traders and supports prospects for further losses.
The AUD/USD pair seesaws between tepid gains/minor losses, though manages to hold its neck above the 0.6700 mark heading into the North American session on Tuesday. The setup, meanwhile, remains tilted in favour of bearish traders and supports prospects for a further near-term depreciating move.
A modest recovery in the risk sentiment undermines the safe-haven US Dollar and turns out to be a key factor lending some support to the risk-sensitive Aussie. That said, rising bets for more interest rate hikes by the Fed remain supportive of elevated US Treasury bond yields and act as a tailwind for the Greenback. This, along with looming recession risks and geopolitical tensions, suggests that the path of least resistance for the AUD/USD pair is to the downside.
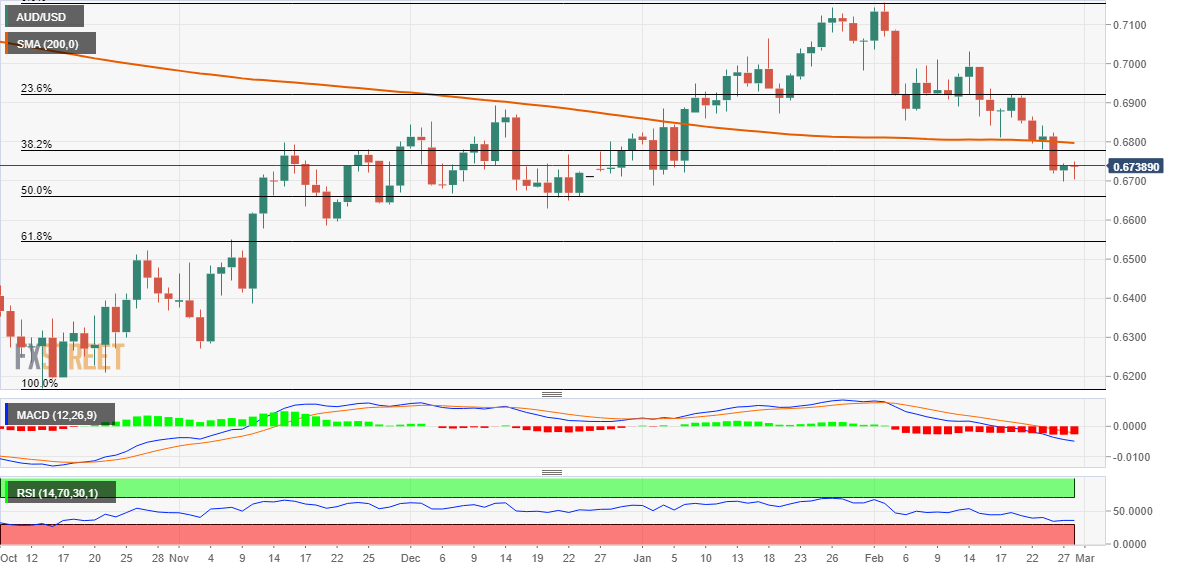
From a technical perspective, Friday's breakdown through confluence support near the 0.6800-0.6780 region was seen as a fresh trigger for bearish traders. The said area comprises the 200-day SMA and the 38.2% Fibonacci retracement level of the rally from the October 2022 low. Moreover, oscillators on the daily chart are holding deep in the negative territory and are still far from being in the oversold zone, validating the bearish outlook for the AUD/USD pair.
That said, bearish traders are likely to wait for sustained weakness below the 0.6700 round figure before placing fresh bets. The AUD/USD pair might then accelerate the fall to the 0.6660 zone, or the 50% Fibo. level, en route to the 0.6600 mark. The downward trajectory could get extended further towards the 61.8% Fibo. level, around the 0.6550 region. The latter should act as a strong base for spot prices and help limit further losses, for the time being.
On the flip side, any meaningful recovery attempt beyond the 0.6750 level, or the daily top, could meet with a fresh supply near the 0.6780-0.6800 confluence support breakpoint, now turned resistance. A sustained strength beyond, however, might trigger a short-covering rally and lift the AUD/USD pair to the next relevant hurdle near the 0.6875-0.6880 region. This is followed by the 0.6900 mark and the 23.6% Fibo. level, around the 0.6925 area, which should cap gains.
AUD/USD daily chart
Key levels to watch
USD/CAD gains through 1.35 points to a test of 1.37, Shaun Osborne, Chief FX Strategist at Scotiabank, reports.
Gains through 1.37 cannot be excluded
“USD/CAD strength may persist a little longer now; not only has the pair traded through key resistance but trend strength (DMI) oscillators have aligned bullishly for the USD across intraday, daily and weekly studies. This should mean firm support for the USD on modest dips from here and ongoing pressure higher towards a retest of the 1.37 area, where USD gains stalled late last year.”
“Initial support is likely to emerge in the mid-1.35 zone but the support zone likely runs fairly deep (back to the 1.35 area).”
“Gains through 1.37 – which cannot be excluded, given the bullish alignment of trend strength oscillators – would suggest USD gains can extend a little more to retest the 1.38 zone.”
Economists at Commerzbank analyze the figures for Gold imports in China.
China’s low Gold imports from Hong Kong not a sign of weak consumer demand
“According to data from the Census and Statistics Department of the Hong Kong government, China imported a good 22 tons of Gold from Hong Kong on a net basis in January. This was only roughly half as much as in December.
“Refinitiv data show that physical premiums for Gold in China, that is to say, the surcharge payable on the global reference price level, amounted to as much as $30 per troy ounce in January. The decrease in gold imports cannot, therefore, be seen as a sign of weaker consumer demand. It is more likely the case that there was insufficient supply in China.”
“A week ago, the Swiss Federal Customs Administration had already published figures for Gold exports to China in January. They paint a mixed picture: whereas shipments to China likewise fell sharply to 26 tons, those to Hong Kong increased to 27 tons, their highest level since April 2019. This also points to robust Gold demand in China following the end of the coronavirus restrictions.”
USD is mixed versus majors. As economists at Scotiabank note, the supportive yield story is fading.
Spreads turn mildly less supportive
“The USD is trading mixed versus the majors but retains a soft undertone overall, suggesting more weakness ahead for the USD in the short run at least.”
“The Dollar’s essential problem is that the supportive yield story that powered gains for much of the past month is a bit less compelling now as markets price other central banks (essentially, the BoE and ECB) a little more aggressively.”
“Month-end flows may provide the USD with some support over the session.”
Canadian GDP overview
Tuesday's economic docket highlights the release of monthly Canadian GDP growth figures for December, due to be published at 13:30 GMT. Statistics Canada will also release the quarterly growth figures, making this more significant than the ones including only monthly data. Consensus estimates suggest that the economy remained flat during the reported month and expanded by a 1.9% annualized pace during the October-December period. This, however, will mark a slowdown from the 2.9% growth recorded in the previous quarter.
Analysts at CIBC offer a brief preview and explain: “Growth in the Canadian economy continued to cool during the final quarter of 2022 (1.3%), likely clocking in at a pace below the economy’s long-run potential and therefore helping ease inflationary pressures. Continued weakness in commodity prices likely brought a further drop in the overall price deflator and a second successive quarterly decline in GDP in nominal terms. The monthly GDP print for December is expected to show little change in economic activity for that month, although the advance estimate for January should point to at least modest growth for the first month of 2023 if the surge in employment is a reliable guide.”
How could it affect USD/CAD?
Ahead of the key macro release, a goodish pickup in Crude Oil prices underpins the commodity-linked Loonie and drags the USD/CAD pair lower for the second straight day. A stronger-than-expected report will point to an economy that remains resilient. This should be enough to provide an additional boost to the domestic currency and pave the way for deeper losses for the major.
Conversely, a softer reading should reaffirm speculations that the Bank of Canada (BoC) will pause the rate-hiking cycle. This, along with bets for further policy tightening by the Fed, should assist the USD/CAD pair to capitalize on the recent breakout momentum through the 100-day Simple Moving Average (SMA). Nevertheless, the data should infuse some volatility around the CAD pairs and allow traders to grab short-term opportunities.
Key Notes
• Canadian GDP Preview: Forecasts from six major banks, economy cooling, but not stalling
• USD/CAD Forecast: Bulls have the upper hand above 100-day SMA amid Fed rate hike bets
• USD/CAD Price Analysis: Bears lurking at key H4 resistance
About the Canadian GDP
The Gross Domestic Product released by Statistics Canada is a measure of the total value of all goods and services produced by Canada. The GDP is considered a broad measure of Canadian economic activity and health. Generally speaking, a rising trend has a positive effect on the CAD, while a falling trend is seen as negative (or bearish) for the CAD.
AUD/USD continues its decline toward 0.6700. Further losses toward 0.6660 are on the cards, potentially to 0.6550, economists at Société Générale report.
Support 0.6660, resistance 0.6800
“AUD/USD evolved within a Head and Shoulders. Confirmation of this formation has resulted in a short-term down move. The decline is expected to persist towards 0.6660 and target of the pattern near 0.6550.”
“Confluence of the MA and the neckline at 0.6800/0.6870 is the first layer of resistance near term.”
See – AUD/USD: Near-term outlook remains weak – UOB
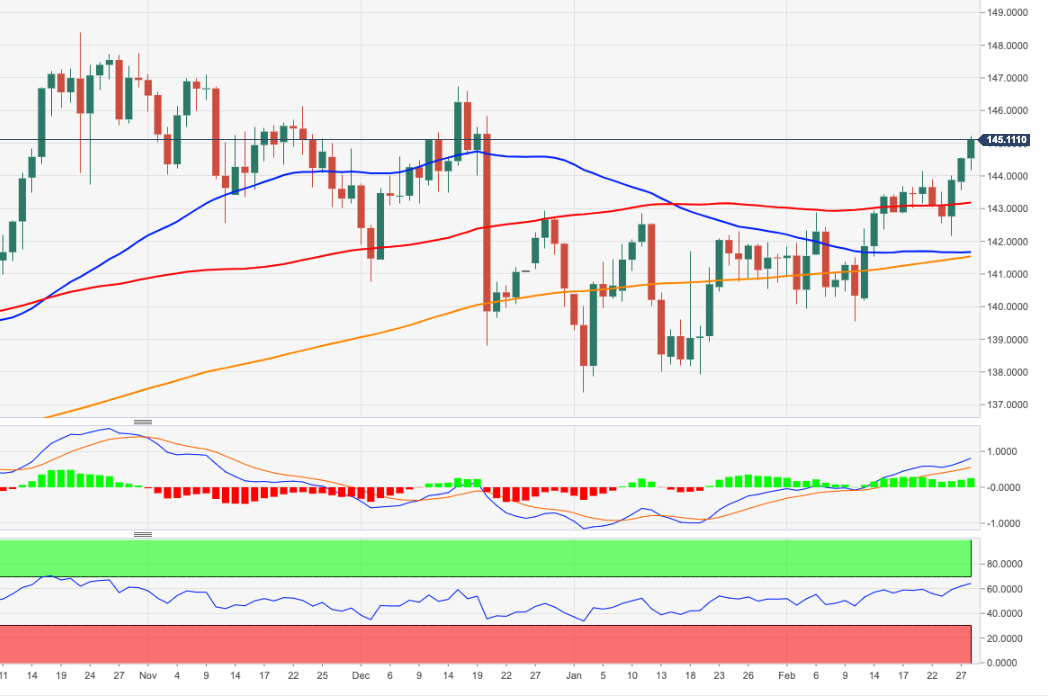
- EUR/JPY climbs to fresh yearly highs past the 145.00 mark on Tuesday.
- Further up comes the December 2022 high near 146.70.
EUR/JPY adds to the ongoing strong rebound and surpasses the key hurdle at 145.00 the figure on Tuesday.
The continuation of the current upside momentum should challenge the December 2022 top at 146.72 (December 15) ahead of the 2022 high at 148.40 (October 21 2022).
In the meantime, while above the 200-day SMA, today at 141.50, the outlook for the cross is expected to remain positive.
EUR/JPY daily chart
The Dollar is restrengthening on Tuesday after a soft start to the week. Risk sentiment is too fragile for a big USD correction, in the opinion of economists at ING.
Further improvements in risk sentiment may become harder to sustain
“US data may not move the market dramatically today, so the Dollar may be primarily driven by global risk sentiment.”
“We struggle to see a material and sustained recovery in global equities in such a worsening valuation environment, and with data still supporting the Fed’s hawks for now, the Dollar’s short-term bias still appears neutral/modestly bullish.”
“A return above 105.00 in DXY seems possible in the ISM services release on Friday.”
EUR/USD is hanging in around 1.06. Economists at Société Générale expect the pair to move back higher toward 1.10 by the end of March.
Yield differentials are wind in the Euro’s sails
“We argued that a bit of risk aversion and wider credit spreads could take EUR/USD to 1.06 (and GBP/USD below 1.2). Both went marginally further, and we could still see some wobbles in the days ahead but yield differentials should start to matter again and I expect we’ll be climbing back towards EUR/USD 1.10 by the end of March.”
“As for Sterling, everything now depends on DUP support for the Windsor Framework. Some negotiation may be required, but if support is forthcoming, we might see EUR/GBP get back below 0.86.”
Economists at Nordea see a weak NOK until the summer.
NOK will remain weak for now
“We expect the NOK to remain weak until the summer – with our view for EUR/NOK around 11.10 in 3M and 10.00 by mid-2023.”
“We expect a somewhat lower EUR/NOK toward year-end, but the pair will likely remain high in a historical context.”
“Norges Bank reducing their NOK sales after the summer should help the NOK. Other bright spots for the NOK should be higher petroleum investments, the reopening of China which means higher oil prices, and central banks pausing their rate hikes.”
“We see EUR/NOK around 10.60 at end-2023”
Economists at Société Générale discuss JPY outlook. The USD/JPY pair is forecast at 125 by the end of the year.
Yen to continue to appreciate gradually in the next few years
“We expect the Japanese Yen to resume appreciating and the USD/JPY pair to move toward 125 at the end of 2023.”
“We are also expecting the Yen to continue to appreciate gradually in the next few years, along with the US treasury yield decline and the rising possibility of Japan overcoming deflation.”
- NZD/USD languishes near the YTD low and seems vulnerable to decline further.
- Hawkish Fed expectations, elevated US bond yields act as a tailwind for the USD.
- Looming recession risks, acceptance below the 200-day SMA favour bearish traders.
The NZD/USD pair comes under fresh selling pressure on Tuesday and drops closer to a nearly three-month low touched the previous day. Spot prices manage to bounce back to mid-0.6100s during the first half of the European session, though the near-term bias remains tilted in favour of bearish traders.
The US Dollar stalls the overnight pullback from a seven-week high amid rising US Treasury bond yields, bolstered by hawkish Fed expectations. In fact, the markets seem convinced that the US central bank will stick to its hawkish stance in the wake of stubbornly high inflation. This, in turn, favours the USD bulls and supports prospects for an extension of the near-term depreciating move for the NZD/USD pair.
Apart from this, a generally weaker risk tone should act as a tailwind for the safe-haven Greenback and contribute to driving flows away from the risk-sensitive Kiwi. The market sentiment remains fragile amid worries about economic headwinds stemming from rapidly rising borrowing costs. This, along with geopolitical tensions, keeps a lid on the overnight optimistic move in the global equity markets.
The NZD/USD pair, meanwhile, now seems to have found acceptance below a technically significant 200-day Simple Moving Average (SMA). This adds credence to the near-term negative outlook and suggests that the path of least resistance for spot prices is to the downside. Traders now look to the US macro data - regional Manufacturing PMIs and the Conference Board's Consumer Confidence Index - for a fresh impetus.
Technical levels to watch
The Swiss Franc eased a little against EUR over the past few days. Economists at Commerzbank believe that the EUR/CHF pair could extend its advance, but the Swiss National Bank is set to avoid a substantial depreciation of the CHF.
SNB likely to keep a close eye on Franc exchange rate
“As we assume that the price data, and in particular core inflation, from the Eurozone due to be published this week is unlikely to signal the all-clear regarding price pressure, further upside pressure in EUR/CHF might arise.”
“The SNB is likely to keep a close eye on Franc depreciation and – if necessary – intervene if the CHF were to depreciate too much, just as was the case last year.”
“The threat of interventions and hawkish SNB communication is likely to limit depreciation pressure on the Franc for now, at least while inflation pressure in Switzerland remains elevated.”
The continuation of the uptrend could see USD/CNH challenge the 7.0000 level and beyond in the short-term horizon, comment UOB Group’s Economist Lee Sue Ann and Markets Strategist Quek Ser Leang.
Key Quotes
24-hour view: “While we expected USD to strengthen further yesterday, we were of the view that ‘the major resistance at 7.0000 is unlikely to come into view’. We noted, ‘Support is at 6.9650, followed by 6.9550’. Our view was not wrong as USD rose to 6.9898 before pulling back to a low of 6.9551. The pullback amid overbought conditions suggests USD is likely to consolidate today, expected to be within a range of 6.9500/6.9800.”
Next 1-3 weeks: “There is no change in our view from yesterday (27 Feb, spot at 6.9750). As highlighted, the strong boost in momentum from last Friday is likely to lead to further USD strength. The resistance levels to watch are at 7.0000 and 7.0200. On the downside, a break of 6.9220 (no change in ‘strong support’ level) would indicate that the USD strength that started early this month has ended.”
- EUR/USD advances further north of the 1.0600 barrier.
- The dollar gives away part of the initial bullish attempt.
- Flash inflation figures in France and Spain surprised to the upside.
The single currency extends the auspicious start of the week and lifts EUR/USD to the 1.0620 region, or 3-session tops, on turnaround Tuesday.
EUR/USD picks up pace on higher CPIs
EUR/USD advances for the second session in a row and looks to extend the recent breakout of the key 1.0600 barrier amidst the generalized flattish performance of the global markets on Tuesday.
Some extra support for the single currency also comes after advanced inflation figures in both France and Spain surprised to the upside for the month of February, suggesting that the battle to tame inflation in the euro area could extend further than initially estimated.
Earlier in the session Import Prices in Germany contracted at a monthly 1.2% in January and rose 6.6% over the last twelve months.
In the US, all the attention will be on the release of the Conference Board’s Consumer Confidence gauge seconded by the FHFA’s House Price Index, preliminary trade balance results and manufacturing gauges tracked by the Chicago Fed and the Dallas Fed.
What to look for around EUR
Price action around EUR/USD remains somewhat flat in line with the rest of the global markets, although the pair manages well to reclaim the area beyond 1.0600 the figure so far on Tuesday.
In the meantime, price action around the European currency should continue to closely follow dollar dynamics, as well as the potential next moves from the ECB after the bank has already anticipated another 50 bps rate raise at the March event.
Back to the euro area, recession concerns now appear to have dwindled, which at the same time remain an important driver sustaining the ongoing recovery in the single currency as well as the hawkish narrative from the ECB.
Key events in the euro area this week: France Flash Inflation Rate (Tuesday) – Germany/EMU Final Manufacturing PMI, Germany Unemployment Change, Flash Inflation Rate (Wednesday) – EMU Flash Inflation Rate, Unemployment Rate, ECB Accounts (Thursday) – Germany Balance of Trade, Final Services PMI, EMU Final Services PMI (Friday).
Eminent issues on the back boiler: Continuation of the ECB hiking cycle amidst dwindling bets for a recession in the region and still elevated inflation. Impact of the Russia-Ukraine war on the growth prospects and inflation outlook in the region. Risks of inflation becoming entrenched.
EUR/USD levels to watch
So far, the pair is gaining 0.02% at 1.0610 and a breakout of 1.0715 (55-day SMA) would target 1.0804 (weekly high February 14) en route to 1.1032 (2023 high February 2). On the flip side, the next support aligns at 1.0532 (monthly low February 27) seconded by 1.0481 (2023 low January 6) and finally 1.0328 (200-day SMA).
Swedish growth data came on the soft side this morning. Economists at ING expect the EUR/SEK pair to turn back higher and trade above the 11.10 mark.
Grim data in Sweden
“The second print of fourth-quarter data showed a larger contraction (0.9%) than previously estimated (0.6%). Although this is clearly backward-looking data, the ongoing tightening by the Riksbank, a very fragile housing market and high inflation continue to point to a rather grim economic outlook in Sweden.”
“We see the recent good performance of SEK as unsustainable unless data start pointing at an improvement in the growth outlook. A return to 11.10+ in EUR/SEK (paired with elevated volatility) is a tangible possibility in the coming weeks.”
- GBP/USD attracts some dip-buying on Tuesday and turns positive for the second straight day.
- The latest optimism over a new Brexit deal underpins the British Pound and lends support.
- A modest USD contributes to the uptick, though hawkish Fed expectations could cap gains.
The GBP/USD pair reverses an intraday dip to the 1.2025 area and turns positive for the second straight day on Tuesday. The momentum lifts spot prices to a four-day high during the first half of the European session, with bulls now awaiting a sustained move beyond the 1.2100 round-figure mark.
The British Pound continues to draw support from the optimism over the confirmation of a final deal on the Northern Ireland protocol between the UK and EU. Apart from this, rising bets for additional rate hikes by the Bank of England (BoE), along with the emergence of some US Dollar selling, lend support to the GBP/USD pair. The upside, however, remains capped amid reports that the former UK Prime Minister Borish Johnson asked the Democratic Unionist Party (DUP) leaders to be cautious and think hard before backing the "Windsor framework".
Furthermore, a combination of factors should act as a tailwind for the buck and further contribute to keeping a lid on GBP/USD pair, at least for now. Expectations that the Federal Reserve will stick to its hawkish stance for longer to tame stubbornly high inflation triggers a fresh leg up in the US Treasury bond yields. Moreover, a weaker risk tone - amid looming recession risks and geopolitical tensions - could lend support to the safe-haven Greenback. This, in turn, warrants some caution before placing aggressive bullish bets around the major.
Market participants now look forward to speeches by BoE officials - Deputy Governor Jon Cunliffe, Chief Economist Huw Pill and Monetary Policy Committee member Catherine Mann. Later during the early North American session, traders will take cues from the US economic docket, featuring the release of Regional Manufacturing PMIs and the Conference Board's Consumer Confidence Index. This, along with the US bond yields and the broader market risk sentiment, should influence the USD price dynamics and provide some impetus to the GBP/USD pair.
Technical levels to watch
The New Zealand Dollar has lifted off its lows as concerns about global inflation and central bank interest rate hikes have eased. Over the coming year, economists at Westpac expect the Kiwi to strengthen further.
NZD/AUD to weaken over 2023 and 2024
“We expect that the NZD/USD will strengthen further over 2023 and 2024. We forecast the NZD/USD will lift to 0.67 by year end and will tick up to 0.68 by the end of 2024 as as the global interest rate cycle peaks and then moves into the rear-view mirror.”
“The Australian economy is poised to benefit relatively more from the reopening of the Chinese economy than New Zealand. With that in mind, we expect the NZD/AUD to weaken over 2023 and 2024. Specifically, we forecast the NZD/AUD to fall to 0.88 by the end of 2024.”
Switzerland’s government said in a statement on Tuesday that it expects an economic slowdown but no recession this year.
This comes after the Swiss economy showed no growth in the fourth quarter of 2022, in the face of a "challenging international situation”.
On a quarterly basis, the country’s Gross Domestic Product (GDP) arrived at 0% in Q4 2022 vs. a growth of 0.3% and 0.2% recorded in the third quarter.
Meanwhile, the USD/CHF pair is consolidating gains below 0.9340, currently trading 0.19% higher on the day at 0.9371.
- USD/JPY touches a fresh YTD top on Tuesday and is supported by a combination of factors.
- Hawkish Fed expectations, elevated US bond yields continue to underpin the Greenback.
- The incoming BoJ Governor Ueda’s dovish remarks weigh on the JPY and remain supportive.
- Looming recession risks benefit the JPY’s safe-haven status and might cap gains for the pair.
The USD/JPY pair catches fresh bids following the previous day's brief pause and climbs to a fresh YTD top during the first half of the European session on Tuesday. The pair is currently placed around the 136.65-136.70 area and seems poised to prolong its upward trajectory witnessed since the beginning of this month.
A fresh leg up in the US Treasury bond yields, bolstered by hawkish Fed expectations, helps revive the US Dollar demand, which, in turn, acts as a tailwind for the USD/JPY pair. The markets seem convinced that the US central bank will continue to tighten its monetary policy to bring inflation down back to the 2% target. The bets were reaffirmed by the stronger US PCE Price Index last week, which indicated that inflation isn't coming down quite as fast as hoped. This remains supportive of elevated US bond yields and lends some support to the Greenback.
The Japanese Yen (JPY), on the other hand, is weighed down by the overnight dovish remarks from the incoming Bank of Japan (BoJ) Governor Kazuo Ueda. Addressing the upper house of the parliament, Ueda said that the benefits of the BoJ's stimulus outweigh its side effects. He also stressed the need to maintain the ultra-loose policy to support the fragile economy and reinforced that the BoJ isn't seeking a quick move away from a decade of massive easing. This, in turn, is seen as another factor that provides an additional lift to the USD/JPY pair.
That said, a generally softer risk tone benefits the JPY's relative safe-haven status and keeps a lid on any further gains for the major, at least for the time being. The market sentiment remains fragile amid worries about economic headwinds stemming from rising borrowing costs and geopolitical tensions. Nevertheless, the fundamental backdrop suggests that the path of least resistance for the USD/JPY pair is to the upside. Bulls, however, might wait for some follow-through buying beyond the 137.00 mark before placing fresh bets and positioning for further gains.
Technical levels to watch
EU and UK strike Brexit deal on Northern Ireland. Positive momentum for Sterling is likely to be short-lived, economists at Commerzbank report.
Northern Ireland protocol to have little influence on inflation developments
“An agreement in the row about the Northern Ireland protocol has been reached between the United Kingdom and the EU. The positive momentum for Sterling is likely to remain limited though.”
“An agreement in connection with the Northern Ireland protocol is likely to have little influence on short-term inflation developments and as a result the market is likely to return its attention to data publications and comments by BoE members again pretty quickly. In this context, we remain sceptical for Sterling.”
“The BoE remains hesitant as far as further monetary policy tightening is concerned and signalled recently that it would soon reach the end of the rate hike cycle. As long as it sticks to that view, while the data publications do not signal an improvement on the inflation front Sterling is likely to remain under depreciation pressure.”
European Commissioner for Economy Paolo Gentiloni said in a statement on Tuesday, “EU is likely to avoid a severe recession.”
Further comments
“The economic outlook is less pessimistic than originally thought.”
“The economic scenario is still uncertain.”
Market reaction
EUR/USD is accelerating its renewed upside above 1.0600, trading at 1.0623 as of writing, 0.16% on the day.
According to UOB Group’s Economist Lee Sue Ann and Markets Strategist Quek Ser Leang, extra gains in USD/JPY target the 137.90 level in the near term.
Key Quotes
24-hour view: “We highlighted yesterday that ‘the rapid rise appears to be overdone and USD is unlikely to advance much further’ and we expected USD to trade in a range between 135.50 and 136.65. Our view of range trading was not wrong even though USD traded within a narrower range than expected (135.90/136.55). Further range trading appears likely, expected to be within a range of 135.80/136.60.”
Next 1-3 weeks: “We continue to hold the same view as yesterday (27 Feb, spot at 136.30). As highlighted, after the strong rise late last week, upward momentum has been boosted and this will likely lead to further USD strength. The next resistance level to watch is at 137.90. That said, overbought short-term conditions could lead to 1-2 day of consolidation first. On the downside, a breach of 135.00 (no change in ‘strong support’ level) would indicate that the USD strength that started in the middle of the month has run its course.”
Open interest in natural gas futures markets dropped for the second consecutive session on Monday, now by nearly 22K contracts according to preliminary readings from CME Group. Volume, instead, increased by around 86.4K contracts after two daily pullbacks in a row.
Natural Gas: Another test of the $2.00 area remains on the table
Prices of the natural gas extended further the rebound on Monday. The bullish move, however, was on the back of shrinking open interest, which removes strength from the current uptrend and opens the door to some corrective decline in the very near term. That said, another retracement to the area of recent lows in the sub-$2.00 mark per MMBtu should not be ruled out for the time being.
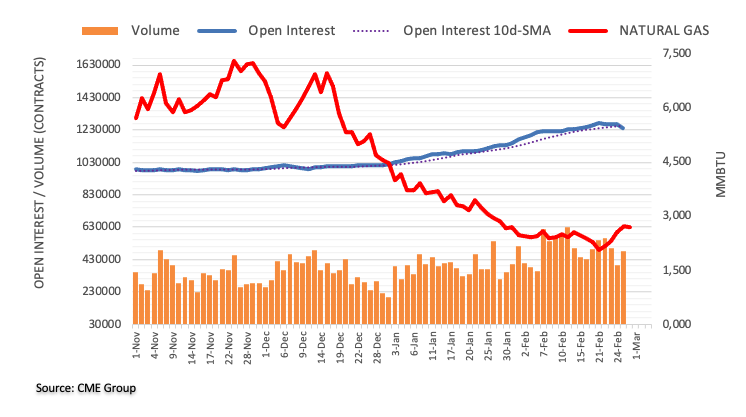
EUR/USD trades in negative territory slightly below 1.0600. The pair could challenge the 1.0500 level, analysts at ING report.
Hawkish expectations for ECB tightening to support EUR
“Markets are currently pricing in around 130-140 bps of tightening before reaching the peak. This could offer some floor to the Euro.”
“We expect any re-strengthening of the Dollar to see high-beta commodity currencies more at risk than the Euro for the time being. Still, the risks of 1.0500 being tested in the near term remain elevated.”
Further selling pressure could motivate NZD/USD to challenge the solid support at the 0.6100 region in the next few weeks, note UOB Group’s Economist Lee Sue Ann and Markets Strategist Quek Ser Leang.
Key Quotes
24-hour view: “We expected NZD to weaken further yesterday but we noted, ‘oversold conditions suggest the major support at 0.6100 is unlikely to come under threat today’. We added, ‘There is another support at 0.6135’. NZD dropped to a low of 0.6132 before rebounding. The rebound amid oversold conditions suggests NZD has likely moved into a consolidation phase. In other words, NZD is likely to trade sideways today, expected to be between 0.6135 and 0.6195.”
Next 1-3 weeks: “Our update from yesterday (27 Feb, spot at 0.6165) still stands. As highlighted, while NZD is still weak, it remains to be seen if NZD has enough momentum to break below the next major support at 0.6100. All in all, only a breach of the ‘strong resistance’ at 0.6225 (no change in level) would indicate that the NZD weakness that started in the middle of the month has come to an end.”
UK Prime Minister (PM) Rishi Sunak said in a BBC News interview that “the framework is what we have agreed with the European Union” when whether he would impose the new deal without the backing of Northern Ireland's Democratic Unionist Party (DUP).
He added, “This is not necessarily about me or any one political party. This is about what's best for the people and communities and businesses of Northern Ireland and this agreement will make a hugely positive difference to them.”
Market reaction
The GBP/USD pair is off the low, trading at around 1.2040 on Sunak’s comments. The pair is still losing 0.18% on the day.
- USD/CAD regains positive traction on Tuesday amid the emergence of fresh USD buying.
- Hawkish Fed expectations, elevated US bond yields and recession fears benefit the buck.
- A pickup in Oil prices does little to underpin the Loonie and hinder the intraday move up.
The USD/CAD pair catches fresh bids on Tuesday and builds on its intraday positive move through the early European session. The momentum lifts spot prices back above the 1.3600 mark in the last hour and is sponsored by renewed US Dollar buying interest.
Following a brief pause on Monday, the USD is back in demand and remains pinned near a seven-month high amid the prospects for further policy tightening by the Federal Reserve. The markets now seem convinced that the US central bank will have to raise rates more than initially expected to tame stubbornly high inflation. The bets were lifted by the US PCE Price Index released last Friday, which indicated that inflation isn't coming down quite as fast as hoped.
Moreover, the incoming positive US macro data point to an economy that remains resilient despite rising borrowing costs and should allow the Fed to stick to its hawkish stance for longer. This, in turn, triggers a resh leg up in the US Treasury bond yields and continues to lend support to the USD. Apart from this, a generally weaker risk tone - amid looming recession risks and geopolitical tensions - benefits the Greenback's relative safe-haven status.
The USD/CAD bulls, meanwhile, seem unaffected by a goodish pickup in Crude Oil prices, which tend to underpin the commodity-linked Loonie. This, in turn, suggests that the path of least resistance for the pair is to the upside. Traders now look forward to the release of the monthly Canadian GDP, due later during the early North American session. The US economic docket features the Conference Board's US Consumer Confidence Index and regional manufacturing PMIs.
This, along with the US bond yields and the broader risk sentiment, will drive demand for the buck. Apart from this, Oil price dynamics should provide some impetus to the USD/CAD pair and help traders to grab short-term opportunities.
Technical levels to watch
The Pound is one of the best-performing currencies since the start of the week after the confirmation of a new UK-EU deal on Northern Ireland. However, this impact might prove to be only temporary, economists at ING report.
GBP may continue to prove more resilient than other pro-cyclical currencies
“It seems hard that the Pound will find sustained support simply based on the new NI deal. The central bank story should instead remain the most central driver of GBP, and given the lack of data today, markets will watch three Bank of England speakers today: Jon Cunliffe, Huw Pill and Catherine Mann.”
“Markets are definitely swinging on the hawkish side, expecting a total of 80 bps of tightening before reaching a peak. For now, the global central bank narrative and improving UK data are not giving many reasons to unwind such hawkish expectations, and the GBP may continue to prove more resilient than other pro-cyclical currencies.”
CME Group’s flash data for crude oil futures markets noted traders increased their open interest positions for the third day in a row on Monday, this time by around 6.6K contracts. In the same line, volume shrank for the second straight session, now by around 146.7K contracts.
WTI: Temporary hurdle comes at $77.50
Prices of the WTI started the week on the back foot, although the daily decline was amidst declining open interest and volume, which warns against the continuation of the retracement and favours further recovery instead. That said, the immediate target for the commodity emerges at the interim 55-day SMA, today near $77.50.
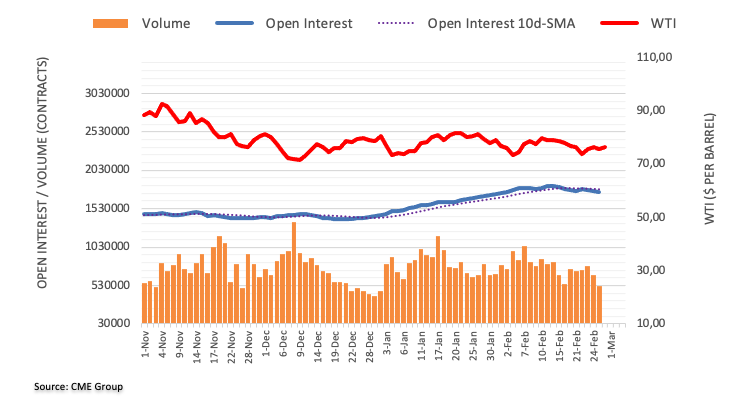
In the view of UOB Group’s Economist Lee Sue Ann and Markets Strategist Quek Ser Leang, GBP/USD is now seen trading within the 1.1970-1.2150 range.
Key Quotes
24-hour view: “We highlighted yesterday that GBP ‘is likely to weaken further even though a sustained decline below 1.1915 is unlikely’. GBP dropped to a low of 1.1923 before rebounding strongly to a high of 1.2064. GBP could rise further even though it is unlikely to challenge the major resistance at 1.2150. Note that there is another resistance level at 1.2100. On the downside, a breach of 1.2010 (minor support is at 1.2040) would indicate that upward momentum has eased.”
Next 1-3 weeks: “Yesterday (27 Feb, spot at 1.1945), we highlighted that the risk for GBP had shifted to the downside. We did not anticipate the strong rebound that took out our ‘strong resistance’ level at 1.2050 (high has been 1.2064). The price actions suggest GBP is trading in a broad consolidation range and for the time being, likely between 1.1970 and 1.2150.”
The focus is on the inflation data in the Eurozone. An upside surprise on the core inflation rate could lift the Euro, economists at Commerzbank report.
EUR/USD levels should be limited at present
“Whereas the headline rate is likely to have fallen in February, core inflation is likely to have remained stubborn. The ECB had underlined repeatedly that it is keeping a particular eye on the development of core inflation as the underlying price rises are relevant for the ECB.”
“A surprise on the upside might further fuel the rate hike expectations for the ECB and following yesterday’s appreciation against USD, the Euro might receive further appreciation momentum.”
“For the time being, however, the USD side should be able to stand its ground so that scope for higher EUR/USD levels should be limited at present.
Here is what you need to know on Tuesday, February 28:
The positive shift witnessed in risk mood and mixed macroeconomic data releases from the US weighed on the US Dollar (USD) and the US Dollar Index (DXY) snapped a four-day winning streak on Monday. Early Tuesday, the DXY clings to modest recovery gains as investors await the Conference Board's consumer Confidence Survey for February. The US economic docket will also feature January Trade Balance data and Statistics Canada will release the Gross Domestic Product figure for the fourth quarter. Several Bank of England policymakers are scheduled to speak later in the session.
US CB Consumer Confidence Preview: Focus on possible recession-related hints.
The US Census Bureau reported on Monday that Durable Goods Orders declined by 4.5% on a monthly basis in January, compared to the market expectation for a contraction of 4%. Although other data from the US revealed that Pending Home Sales rose by 8.1% in January, the US Dollar struggled to find demand with risk flows dominating the financial markets. In the early European morning on Tuesday, US stock index futures are trading flat while the 10-year US Treasury bond yield moves sideways above 3.9% following Monday's modest retreat.
EUR/USD took advantage of the broad USD weakness and gained more than 50 pips on Monday. The pair, however, seems to be struggling to preserve its recovery momentum and was last seen trading in negative territory slightly below 1.0600.
Fueled by the improving market mood, GBP/USD surged higher and closed the day above 1.2000. The pair stays in a consolidation phase below 1.2050 early Tuesday. British Prime Minister Rishi Sunak announced late Monday that they have amended the original Northern Ireland Protocol deal and agreed on a new "Windsor framework" with the European Union.
USD/JPY managed to hold above 136.00 despite the selling pressure surrounding the USD on Monday. During the Asian trading hours, Incoming Bank of Japan (BoJ) Deputy Governor Ryozo Himino reiterated that they need to continue to support the economy with easy monetary policy. "We must debate specifics of exit policy only when stable, sustained achievement of the BoJ's price target comes into sight," Himino added.
The data from New Zealand showed early Tuesday that the ANZ Business Confidence Index improved to -43.3 in February from -52 in January, coming in better than the market expectation of -61. NZD/USD failed to capitalize on the upbeat sentiment data and was last seen trading in negative territory slightly below 0.6150.
Retail Sales in Australia recovered in January, rising 1.9% on a monthly basis following December's 3.9% decline. Although AUD/USD edged higher with the initial reaction to this data, it lost its traction in the European morning and started to decline toward 0.6700.
The Canadian economy is forecast to contract by 0.2% on a quarterly basis in the fourth quarter after having expanded by 0.7% in the previous quarter. Ahead of the GDP report, USD/CAD fluctuates in a narrow range slightly below 1.3600.
Gold price posted marginal gains on Monday as the pullback in the US Treasury bond yields remained limited. XAU/USD edges lower toward $1,810 in the early European session.
Bitcoin failed to make a decisive move in either direction and closed the first trading day of the week virtually unchanged. BTC/USD stays under modest bearish pressure early Tuesday and trades below $23,500. Ethereum continues to inch lower toward $1,600 after having registered small losses on Monday.
- Gold price comes under renewed selling pressure amid reviving USD demand.
- Hawkish Fed expectations, elevated US bond yields underpin the Greenback.
- Recession fears lend support to the safe-haven XAU/USD and help limit losses.
Gold price struggles to capitalize on the previous day's modest rebound from the $1,807-$1,806 area, or the YTD low and meets with a fresh supply on Tuesday. The XAU/USD remains depressed through the early European session and is currently placed just above the $1,810 level, down nearly 0.30% for the day.
Following a modest pullback from a seven-week high on Monday, the US Dollar (USD) is back in demand amid expectations for further policy tightening by the Federal Reserve (Fed). This, in turn, is seen as a key factor exerting some downward pressure on the US Dollar-denominated Gold price. The markets now seem convinced that the Fed will stick to its hawkish stance in the wake of stubbornly high inflation.
The bets were lifted by the Personal Consumption Expenditure (PCE) Price Index from the United States (US), which indicated that inflation isn't coming down quite as fast as hoped. Moreover, several Fed officials stressed the need to raise interest rates to bring inflation down. This remains supportive of elevated US Treasury bond yields and further drives flow away from the non-yielding Gold price.
Investors, meanwhile, remain worried about economic headwinds stemming from rapidly rising borrowing costs. This, along with geopolitical tensions, keeps a lid on the overnight optimistic move in the equity markets and lends some support to the safe-haven Gold price. This, in turn, warrants caution before placing fresh bearish bets around the XAU/USD and positioning for a further depreciating move.
Nevertheless, the prospects for further policy tightening by the Fed should continue to boost the Greenback and favours the XAU/USD bears. Gold price seems poised to weaken further below the $1,800 mark and test the 100-day Simple Moving Average (SMA) support, currently around the $1,792 area. This should act as a pivotal point, which if broken decisively will set the stage for deeper losses.
Technical levels to watch
USD/CNY broke above the 6.90 handle. Economists at HSBC expect the Yuan to strengthen against the Dollar when risk appetite improves amid strong data and pro-growth measures.
Awaiting new catalysts for growth optimism
“Although geopolitical tensions may not dissipate any time soon, we think the start of the National People's Congress (NPC) on 5 March 2023, together with upcoming economic data releases (such as China’s official PMIs for February on 1 March, trade data on 7 March, inflation data on 9 March, and a series of activity data from retail sales, industrial production to urban fixed asset investment in mid-March), could ensure growth optimism returns, which should help shore up the CNY.”
“High-frequency data in February point to a continued recovery in intra-city traffic and industrial production. Home prices in big cities have also shown signs of a rebound. For the upcoming NPC, we expect the government to announce a GDP growth target of ‘above 5%’ and a larger budget deficit of 3.2% (from 2.8% in 2022). This should reassure investors that a pro-growth mind-set will remain at the fore, probably supporting the Yuan.”
Considering advanced prints from CME Group for gold futures markets, open interest shrank by nearly 2K contracts at the beginning of the week, reversing the previous daily build. Volume followed suit and went down for the second session in a row, this time by around 32.7K contracts.
Gold continues to target $1800
Gold’s auspicious start of the week was, however, amidst diminishing open interest and volume and this favours the resumption of the downtrend in the very near term. Against that, the immediate target emerges at the key $1800 region per ounce troy.
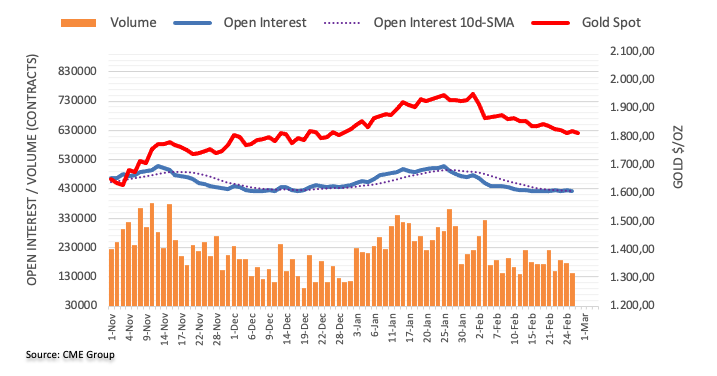
UOB Group’s Economist Lee Sue Ann and Markets Strategist Quek Ser Leang suggest EUR/USD risks extra decline while below the 1.0625 level for the time being.
Key Quotes
24-hour view: “Yesterday, we held the view that EUR could dip to 1.0520 before stabilizing. EUR subsequently dipped to 1.0531 before staging surprisingly robust rebound (high has been 1. a 0619). The rebound could extend but a sustained rise above 1.0625 is unlikely (next resistance is at 1.0670). Support is at 1.0580, followed by 1.0550.”
Next 1-3 weeks: “We have held a negative EUR view for more than a week. Yesterday (27 Feb 2023, spot at 1.0555), we highlighted that EUR is likely to continue to weaken to 1.0485 as long as it stays below 1.0625. We did not anticipate the to a high of 1.0619 in NY trade. Downward mo strong rebound mentum is waning rapidly. A breach of 1.0625 would suggest that the EUR weakness has ended and it has moved into a consolidation phase.”
- The index reclaims ground lost following Monday’s decline.
- US yields maintain the February rally well in place.
- Consumer Confidence, housing data, trade balance next on tap.
The greenback, in terms of the USD Index (DXY), leaves behind part of Monday’s retracement and revisits the 104.80 region on Tuesday.
USD Index looks at data
The index regains the smile and refocuses on the 105.00 neighbourhood amidst some decent recovery and ahead of the opening bell in the old continent on turnaround Tuesday.
The dollar’s negative start of the week came in response to some profit taking among investors following last week’s sharp advance in the index, while the continuation of the march north in US yields continue to support the current strong momentum in the buck.
In the US data space, advanced Goods Trade Balance is due seconded by the FHFA’s House Price Index, the Chicago PMI, Consumer Confidence tracked by the Conference Board and the Richmond Fed Manufacturing Index.
What to look for around USD
The index appears bid near the 105.00 barrier amidst the resumption of the buying interest in the dollar in the first half of the week.
The probable pivot/impasse in the Fed’s normalization process narrative is expected to remain in the centre of the debate along with the hawkish message from Fed speakers, all after US inflation figures for the month of January showed consumer prices are still elevated, the labour market remains tight and the economy maintains its resilience.
The loss of traction in wage inflation – as per the latest US jobs report - however, seems to lend some support to the view that the Fed’s tightening cycle have started to impact on the still robust US labour markets somewhat.
Key events in the US this week: Advanced Goods Trade Balance, FHFA House Price Index, CB Consumer Confidence (Tuesday) – MBA Mortgage Approvals, Final Manufacturing PMI, ISM Manufacturing, Construction Spending (Wednesday) – Initial Jobless Claims (Thursday) – Final Services PMI, ISM Non-Manufacturing (Friday).
Eminent issues on the back boiler: Rising conviction of a soft landing of the US economy. Persistent narrative for a Fed’s tighter-for-longer stance. Terminal rates near 5.5%? Fed’s pivot. Geopolitical effervescence vs. Russia and China. US-China trade conflict.
USD Index relevant levels
Now, the index is gaining 0.20% at 104.85 and faces the next hurdle at 105.35 (monthly high February 27) seconded by 105.63 (2023 high January 6) and then 106.49 (200-day SMA). On the other hand, the breach of 103.43 (55-day SMA) would open the door to 102.58 (weekly low February 14) and finally 100.82 (2023 low February 2).
- AUD/USD struggles to capitalize on its modest uptick amid renewed USD buying.
- Hawkish Fed expectations, elevated US bond yields help revive the USD demand.
- Recession fears offset the upbeat Australian Retail Sales and act as a headwind.
The AUD/USD pair attracts some sellers following an uptick to mid-0.6700s and stalls a modest recovery from its lowest level since January touched the previous day. The pair retreats to the lower end of its daily range, around the 0.6730-0.6725 region during the early European session and is pressured by reviving US Dollar demand.
The prospects for further policy tightening by the Fed remain supportive of elevated US Treasury bond yields and continue to act as a tailwind for the USD. In fact, the markets seem convinced that the US central bank will stick to its hawkish stance for longer in the wake of stubbornly high inflation. The bets were reaffirmed by the stronger US PCE Price Index released last Friday, which indicated that inflation isn't coming down quite as fast as hoped.
Market participants, meanwhile, remain worried about economic headwinds stemming from rapidly rising borrowing costs. Apart from this, geopolitical tensions keep a lid on the overnight optimistic move in the equity markets, which further benefits the safe-have Greenback and contributes to capping the upside for the risk-sensitive Aussie. This overshadows better-than-expected Australian Retail Sales and does little to lend any support to the AUD/USD pair.
In fact, the Australian Bureau of Statistics reported that Retail Sales grew by 1.9% in January against consensus estimates for a 1.5% rise and the 3.9% downfall recorded in the previous month. The AUD/USD pair's inability to gain any meaningful traction in reaction to the upbeat domestic data suggests that the downtrend witnessed since the beginning of this month is still far from being over. Bears, however, might wait for a sustained break below the 0.6700 mark.
Traders now look to the US economic docket - featuring the release of regional manufacturing PMI and the Conference Board's Consumer Confidence Index. This, along with the US bond yields and the broader risk sentiment, might influence the USD price dynamics and provide some impetus to the AUD/USD pair later during the early North American session. Nevertheless, the fundamental backdrop suggests that the path of least resistance for spot prices is to the downside.
Technical levels to watch
Gold price remains sluggish. XAU/USD eyes daily close for Falling Wedge confirmation, FXStreet’s Dhwani Mehta reports.
Crucial support seen at Monday’s low of $1,807
“Gold price is teasing a falling wedge formation on the daily chart, having opened Tuesday above the falling trendline resistance at $1,814. Daily closing above the latter is needed to validate the bullish reversal pattern, with a quick test of Friday’s high at $1,828 on Gold buyers’ radars.”
“On the downside, crucial support is seen at Monday’s low of $1,807, below which the $1,800 mark will be tested. Further declines will challenge the bullish 100-Daily Moving Average at $1,795. The last line of defense for Gold buyers is seen at the falling trendline (wedge) support, now at $1,789.”
- Silver price snaps four-day downtrend while bouncing off the lowest levels since early November 2022.
- Bearish MACD signals, sustained trading below 200-DMA keep sellers hopeful.
- Multiple hurdles stand tall to challenge XAG/USD buyers.
Silver price (XAG/USD) clings to mild gains around $20.70 as bulls struggle to defend the first daily gains in five during early Tuesday.
That said, the bright metal dropped to the lowest levels since November 2022 before bouncing off $20.56. The metal’s recovery could be linked to a U-turn from the three-month-old horizontal support.
Despite the latest rebound, the XAG/USD remains on the seller’s radar as it stays below the 200-DMA amid bearish MACD signals.
Even if the precious metal crosses the 200-DMA hurdle of $21.00, a downward-sloping resistance line from February 02, close to $21.25 by the press time, could challenge the Silver buyers afterward.
It’s worth observing that the XAG/USD bears remain hopeful unless the quote stays below the $22.00-10 resistance area comprising multiple tops marked since the last November.
On the contrary, a daily closing below the aforementioned three-month-old horizontal support near $20.50 will challenge an ascending support line from early September 2022, around $20.25 to please the Silver bears.
It should be noted that the $20.00 psychological magnet acts as an extra filter toward the south.
Overall, the Silver price remains weak unless breaking the $22.10 hurdle. The downside moves, however, appear to have limited room towards the south.
Silver price: Daily chart
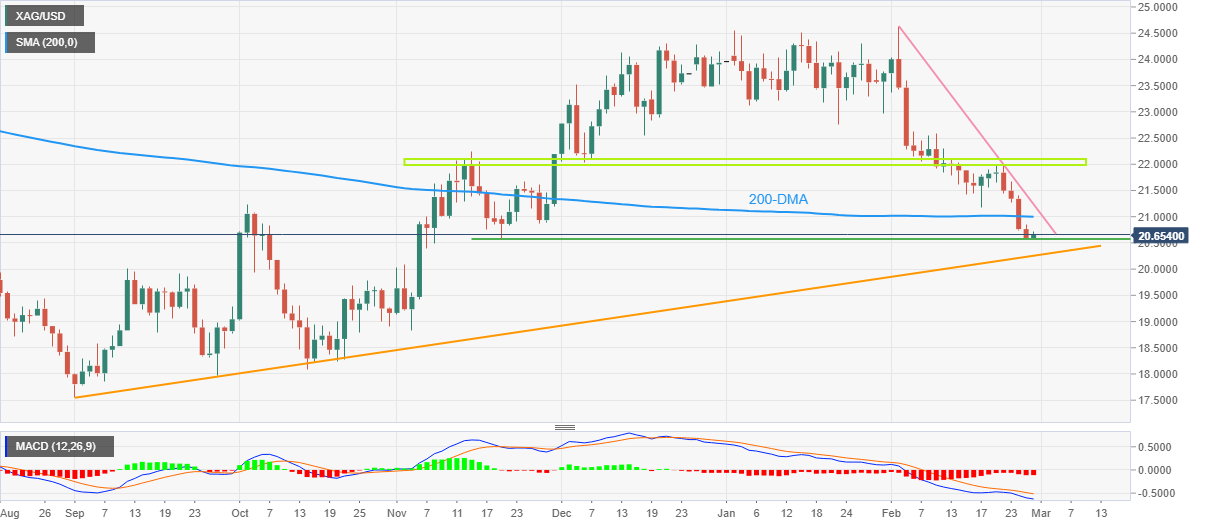
Trend: Bearish
Analysts at Goldman Sachs said in their latest oil price outlook, they see Brent to average at $90/barrel (Bbl) in Q2 2023 as against the previous forecast of $105/Bbl.
Additional quotes
Oil prices seen gradually rising to $100/Bbl by December.
Expected to stay at $100/Bbl in 2024, assuming OPEC boosts output by 1 million bpd in H2.
If OPEC stays Put, Brent ‘likely to reach’ 107/Bbl in Dec.
Assume OPEC will reverse production cut at its June meeting.
- GBP/JPY holds lower ground near the intraday bottom, snaps two-day uptrend.
- Doubts over Brexit deal’s capacity to gain British Parliamentary approval probe the earlier hopes of overcoming month-long political deadlock.
- Yields grind higher amid month-end positioning mixed sentiment.
- Unimpressive Japan data, incoming BoJ policymakers’ defense of easy money policy keep buyers hopeful.
GBP/JPY pares the monthly gain as it retreats from the seven-week high to 164.15 during early Tuesday. In addition to the month-end consolidation, receding optimism over the recently agreed EU-UK Brexit deal also seems to tease the sellers of the cross-currency pair.
The initial agreement between UK Prime Minister Rishi Sunak and European Commission President Ursula von der Leyen over Northern Ireland Protocol (NIP) is yet to gain parliamentary approval and hence doubts about the same probe GBP/JPY buyers.
On the same line is the news shared by BBC News saying, the leader of the Democratic Unionist Party (DUP) has said he and his colleagues will take their time to examine the new Brexit deal for Northern Ireland. Daily Express news also challenges the Brexit optimism by saying, “Boris Johnson has privately urged the DUP to be cautious about backing Rishi Sunak's Brexit deal.”
Alternatively, odds favoring the continued existence of the Bank of Japan’s (BoJ) easy money policy challenge the GBP/JPY bears. That said, the incoming Bank of Japan (BoJ) Deputy Governor Shinichi Uchida testified before the Japanese parliament’s Upper House while defending the central bank’s easy money policy. In doing so, Uchida rules out hopes of altering the 2.0% inflation target, as well as hopes of bolstering the Yield Curve Control (YCC) policy. Earlier in the day, BoJ Deputy Governor Masazumi Wakatabe said, “Central banks must remain on guard against the potential dangers of secular stagnation and low inflation as price rises driven by cost-push factors do not last long,” per Reuters.
It should be noted that the mixed Japan data and yields fail to offer clear directions to the pair traders. That said, Japan’s Industrial Production shrunk 4.6% in January versus -2.6% expected and 0.3% prior growth. However, the Retail Trade grew 1.9% MoM on a seasonally adjusted basis from 1.1% prior and -0.2% market forecasts.
Against this backdrop, the US 10-year and two-year Treasury bond yields regain upside momentum around 3.93% and 4.80% respectively, despite being lackluster of late. Further, the S&P 500 Futures also trace Wall Street’s gains by the press time.
Looking ahead, Brexit headlines and BoJ updates are key to watch for the GBP/JPY pair traders for clear directions.
Technical analysis
The monthly bullish channel keeps GBP/JPY buyers hopeful even as the overbought RSI hints at a pullback toward the 200-DMA support of 163.40.
FX option expiries for Feb 28 NY cut at 10:00 Eastern Time, via DTCC, can be found below.
- EUR/USD: EUR amounts
- 1.0500 1.3b
- 1.0530 656m
- 1.0625 559m
- GBP/USD: GBP amounts
- 1.1850 854m
- USD/JPY: USD amounts
- 134.50 600m
- 136.00 592m
- 137.50 850m
- AUD/USD: AUD amounts
- 0.7000 1.1b
- USD/CAD: USD amounts
- 1.3425 650m
- NZD/USD is exposed to 0.6130 after retreating from 0.6180 as the risk-on mood has faded.
- The 10-year US Treasury yields have jumped above 3.93% amid rising fears of more rates by the Fed.
- Investors are expecting an increase in the Caixin Manufacturing PMI to 50.2.
The NZD/USD pair delivered a downside break of the sideways auction formed in a range of 0.6160-0.6182 in the Asian session. The Kiwi asset has now slipped further and is declining towards 0.6130 in the early European session as the risk-on profile has retreated after a recovery move.
The US Dollar Index (DXY) has extended its revival move to near 104.50 as galloping consumer spending from households in the United States economy is bolstering the case of continuation of policy tightening by the Federal Reserve (Fed).
S&P500 futures have surrendered their entire gains added in the Asian session, portraying a sheer recovery in the risk aversion theme. Also, the 10-year US Treasury yields have jumped above 3.93%.
Bearish bets for the New Zealand Dollar are escalating as investors are getting anxious ahead of the release of the Caixin Manufacturing PMI (Feb) data, which will release on Wednesday. Investors are expecting an increase in the PMI figures to 50.2 from the former release of 49.2. The reopening of the Chinese economy with a promising economic outlook due to fiscal stimulus has backed bullish bets for the Caixin PMI data.
It is worth noting that New Zealand is one of the leading trading partners of China and higher manufacturing activities will also strengthen the New Zealand Dollar.
Inflationary pressures in the New Zealand economy could decelerate ahead as retail demand has dropped firmly. The Retail Sales data for the fourth quarter of CY2022 has contracted by 0.6% while the street was expecting an expansion of 1.5%. This might provide some relief to the Reserve Bank of New Zealand (RBNZ).
The “case for 50 bps rate hike in March remains solid,” European Central Bank (ECB) Chief Economist Philip Lane said in a Reuters interview on Tuesday.
Additional quotes
“Positive supply shocks since December, rate hikes, have curbed inflationary pressures.”
“Intermediate stage pricing pressures begin to fade.’
“Need lower inflation projections, lower realized underlying inflation for rates hikes to end.”
“Forward-looking indicators for food, energy, goods suggest inflation slowdown.”
“Rate plateau should be held for some time; rates could be in restrictive territory for a number of quarters.”
“Supply-side component of services inflation to ease; wage impact uncertain.”
Market reaction
The Euro remains little impressed by the above comments, as EUR/USD loses 0.19% on the day to trade at 1.0585 at the time of writing.
- USD/JPY remains sidelined, fails to extend week-start pullback from two-month high.
- Impending bear cross on MACD, bearish chart formation challenges Yen pair buyers.
- 50-SMA adds strength to the 135.00 support holding the door for sellers.
USD/JPY seesaws near 136.30-40 during the initial hours of Tuesday’s European session. In doing so, the Yen pair fails to extend the previous day’s U-turn from the two-month high while staying inside a three-week-old rising wedge bearish chart pattern.
In addition to the rising wedge and lackluster moves, the impending bear cross on the MACD also keeps USD/JPY sellers hopeful unless the quote defies the bearish chart pattern. For that, the Yen pair needs to remain successfully beyond the 136.90 immediate hurdle, as well as cross the 137.00 round figure.
It’s worth observing that the mid-December 2022 high near 138.20 acts as the last defense of the USD/JPY bears, a break of which could quickly propel the prices towards the 140.00 psychological magnet.
Meanwhile, a convergence of the 50-SMA and the aforementioned wedge’s bottom line highlights the 135.00 round figure as the short-term key support.
Should the USD/JPY bears keep the reins below the 135.00 support confluence, the early month high near 133.00 may probe sellers during the theoretical south run targeting the monthly low of near 128.00.
Overall, USD/JPY bulls seem to run out of steam after posting the biggest monthly jump in four months. Though, bears are far from entry unless the quote stays beyond 135.00.
USD/JPY: Four-hour chart
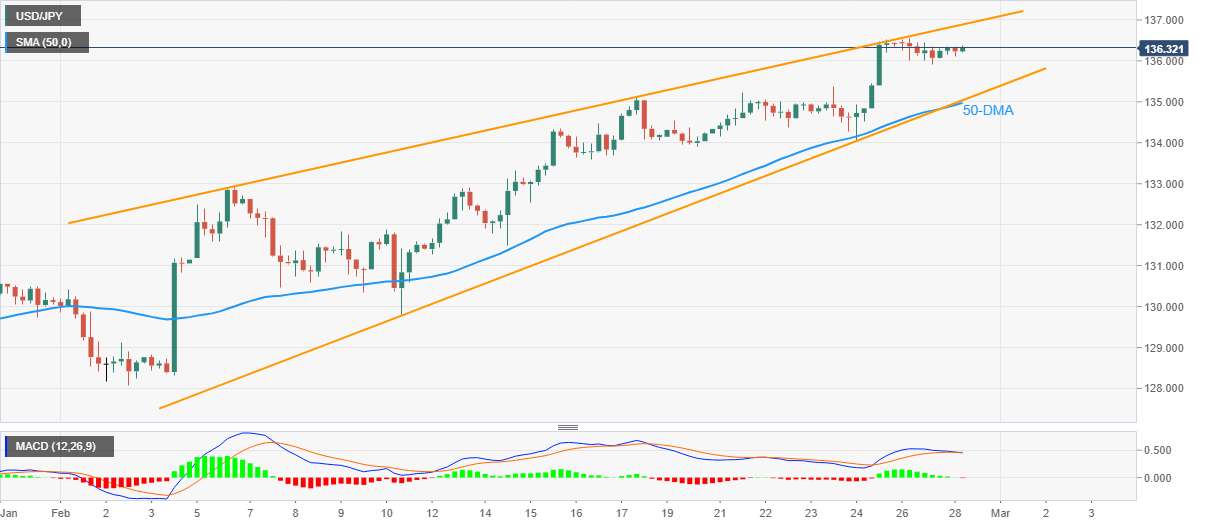
Trend: Limited upside expected
- EUR/USD has refreshed its day low at 1.0582 as a recovery in the risk appetite theme has faded.
- Federal Reserve could push interest rates to 6%in the battle against stubborn inflation.
- European Central Bank looks set to deliver one more 50 bps interest rate hike in March.
- EUR/USD has sensed selling pressure while attempting to deliver a breakout of the downward-sloping trendline from 1.0805.
EUR/USD has delivered a breakdown of the consolidation formed above the round-level resistance of 1.0600 in the early European session. The major currency pair has sensed immense pressure while reclaiming the 1.0600 resistance as the US Dollar Index (DXY) has rebounded modestly. The USD Index has sensed interest after dropping to near 104.30. A sideways auction is anticipated from the USD Index as investors are expected to remain on the sidelines after the release of the United States ISM Manufacturing PMI data, which is scheduled for Wednesday.
Gains added by the S&P500 futures in morning Asia have trimmed. It looks like the risk-appetite theme has retreated as the dismal market mood is roaring again. The return distributed on 10-year US Treasury bonds has rebounded to near 3.93%.
Resilience in US consumer spending pushes Fed’s rate projections near 6%
Right from the labor market data to households' spending, the majority of the economic indicators have confirmed resilience in the retail demand in the United States economy. To soften the red-hot inflation, Federal Reserve (Fed) chair Jerome Powell has already pushed rates to 4.50-4.75%. Considering the recent spark in the inflationary pressures, it won’t be early mentioning the current monetary policy as incompetent to decelerate the stubborn inflation.
Therefore, the street is expecting a higher terminal rate projection than the current estimates of 5.3%. Analysts at Bank of America (BofA) expect Fed chair Jerome Powell to announce three more rate hikes this year considering the resilience in the demand-driven inflation. The BofA sees the terminal rate above 6%. The investment banking firm expects a recession if a higher terminal rate projection materializes.
US Manufacturing PMI is in focus for further action
This week, the mega event will be the US ISM Manufacturing PMI data. Manufacturing activities in the US economy have been contracting for the past three months. Again, a dry spell is expected as firms have paused their expansion plans to avoid higher interest obligations.
The economic data is expected to improve to 48.0 from the former release of 47.4. A figure below 50.0 is considered as a contraction in activities. It would be appropriate considering it a decline in the contraction streak. The New Orders Index that conveys forward demand is expected to rebound to 43.7 from the prior figure of 42.5.
Economic Confidence fails to grab the 100.00 figure
It was the sixth time on Monday when Eurozone Economic Confidence failed to garb the figure of 100.00. The street expected the sentiment data at 101.00, however, it even failed to surpass the prior figure of 99.8. The rising cost of living pressures has dented the confidence of households in the economy. Individuals are struggling to address their necessities amid higher prices for goods and services due to galloping inflation.
European Central Bank (ECB) President Christine Lagarde is reiterating the need for interest rate escalation by 50 basis points (bps) in the March monetary policy meeting to strengthen its defense in the battle against persistent inflation.
EUR/USD technical outlook
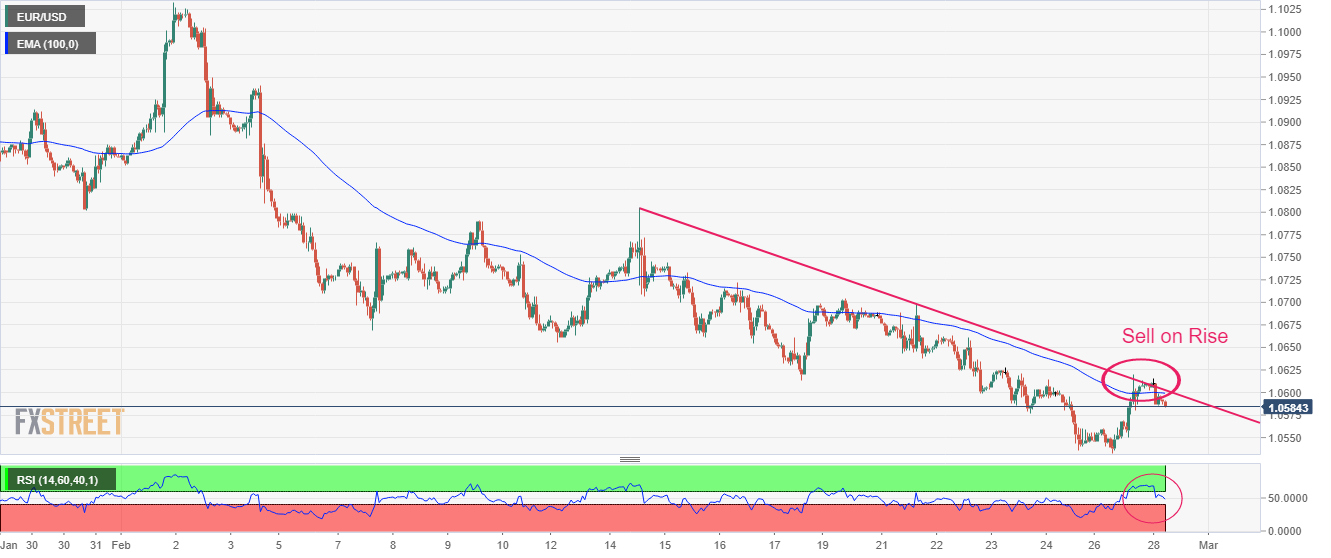
EUR/USD has sensed immense selling pressure after a pullback move to near the downward-sloping trendline plotted from February 14 high at 1.0805 on an hourly scale. This indicates that the market participants are following a ‘sell on rise’ strategy while dealing with EUR/USD.
The shared currency pair has failed to sustain above the 100-period Exponential Moving Average (EMA) at 1.0660.
Also, the Relative Strength Index (RSI) (14) has slipped into the 40.00-60.00 range from the bullish range of 60.00-80.00.
- GBP/USD takes offers to refresh intraday low, fades week-start run-up.
- DUP raises doubts on UK PM-inspired Brexit deal on grounds of practicality, NI’s place in the UK.
- Former British PM Boris Johnson also pushed DUP to check new deal thoroughly.
- Hawkish Fed bets, mixed concerns keep Cable bears hopeful despite sluggish end of February.
GBP/USD fades Brexit-inspired optimism heading into Tuesday’s London open as the Cable pair renews intraday low near 1.2040 while paring the biggest daily run-up in a month, marked the previous day.
The Cable pair’s latest pullback could be linked to the US Dollar’s recovery, as well as fresh doubts on the Brexit deal between UK Prime Minister Rishi Sunak and European Commission President Ursula von der Leyen.
UK PM Sunak hailed framework that delivers ‘decisive breakthrough’ on trade in Northern Ireland (NI), per The Telegraph. However, the leader of the Democratic Unionist Party (DUP) has said he and his colleagues will take their time to examine the new Brexit deal for Northern Ireland, reported the BBC. Also challenging optimism surrounding the NI Protocol norms are the reports shared by the Daily Express saying, “Boris Johnson has privately urged the DUP to be cautious about backing Rishi Sunak's Brexit deal.”
On the other hand, the US Dollar Index (DXY) prints mild gains around 104.80, following a downbeat start of the week, as greenback bulls cheer hawkish Fed bets despite mixed US data amid an unimpressive day so far. Adding strength to the US Dollar’s rebound could be the recent pick-up in yields.
Talking about the risk catalysts, market sentiment improves on headlines suggesting the fact that the US offers an olive branch to Chinese companies despite its political differences with the dragon nation. “Despite fraying relations with Beijing, US President Joe Biden is expected to forego expansive new restrictions on American investment in China, denying a push by some hawks in his administration and Congress,” reported Politico late Monday. Alternatively, US National Security Advisor Jake Sullivan’s comments on China suggest that the political tussle among the world’s top two economies stays on the table. “China’s stance on the Russian invasion of Ukraine puts it in an “awkward” position internationally and any weapons support to Russia would come with ‘real costs,’” said US Security Adviser Sullivan on CNN’s “State of the Union” on Monday.
It should be noted that the Bank of England (BoE) policymakers stay on the same ground as their Federal Reserve (Fed) counterparts and put a floor under the GBP/USD price.
While portraying the mood, , the S&P 500 Futures print mild gains around 3,995, extending the week-start rebound from the monthly low, whereas the US two-year Treasury yields remain sidelined near 4.79% after reversing from a three-month high on Monday. That said, the US 10-year Treasury bond coupons seek clear directions near 3.92% following a downbeat start of the week.
Moving on, US Conference Board’s Consumer Confidence, Chicago Purchasing Managers’ Index and Richmond Fed Manufacturing Index for February, as well as the preliminary US trade numbers for January, will decorate the calendar and will be important for the pair traders to watch. Though, major attention should be given to the Brexit developments as the newly agreed deal heads to the British Parliament for approval.
Technical analysis
A clear downside break of the two-week-old resistance-turned-support line near 1.2040 becomes necessary for the GBP/USD bears to retake control. Until then, the Cable bulls can keep poking a downward-sloping resistance line from February 02, close to 1.2110 by the press time.
- EUR/GBP holds lower ground at monthly bottom, extends pullback from 50-DMA.
- Lower-high formation keeps sellers hopeful amid bearish MACD signals.
- 2.5-month-old ascending support line, 100-DMA lures bears during further downside.
- Bulls need validation from three-week-long falling resistance line.
EUR/GBP remains depressed around 0.8790, refreshing the monthly low, as traders brace for Tuesday’s European session. In doing so, the cross-currency pair extends the previous day’s pullback from the 50-DMA hurdle amid bearish MACD signals.
Also keeping the EUR/GBP sellers hopeful is the pair’s lower high formation, as portrayed by a three-week-old descending resistance line surrounding 0.8850 by the press time.
That said, the pair sellers appear well-set to drop towards an upward-sloping support line from December 19, 2022, close to 0.8760. However, the pair’s further downside is likely to be limited by the 100-DMA support level near 0.8750.
In a case where the cross-currency pair remains weak past 0.8750, the lows marked in January 2023 and late December 2022, respectively near 0.8720 and 0.8690, could act as additional downside filters.
Meanwhile, EUR/GBP recovery remains elusive unless the quote stays below the 50-DMA hurdle of 0.8831.
Even if the quote rises past 0.8831, the aforementioned three-week-old resistance line could challenge the pair buyers near 0.8850.
Following that, the mid-February swing high surrounding 0.8930 appears the last defense of the EUR/GBP bears.
EUR/GBP: Daily chart
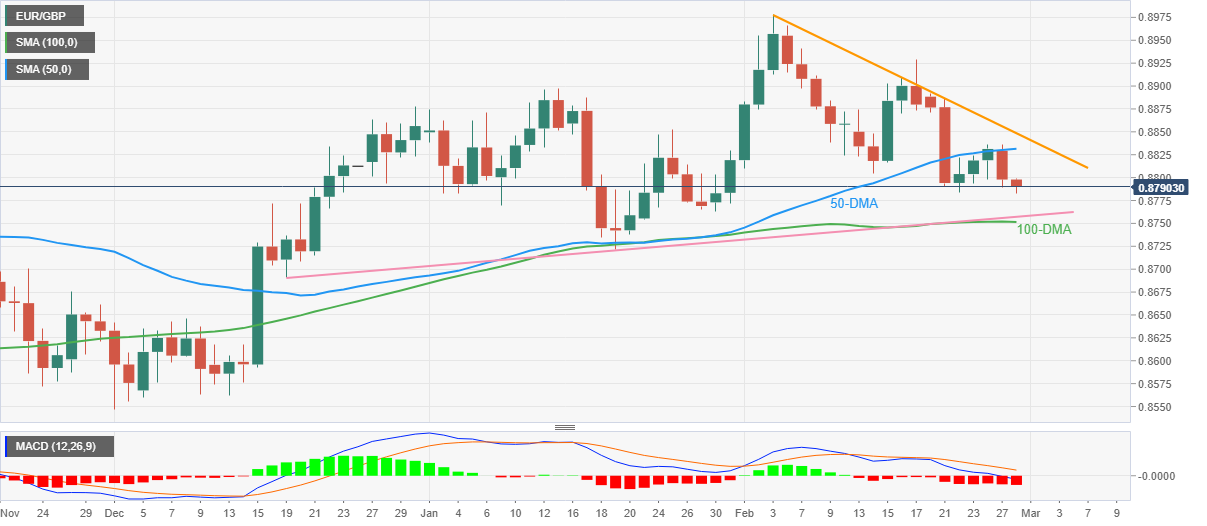
Trend: Further downside expected
- Asian indices have rebounded comprehensively as investors shrug off Fed rate hike fears.
- Chinese stocks will remain volatile ahead of the Caixin Manufacturing PMI data.
- BoJ Himino has also considered the easy monetary policy as appropriate till the central bank achieves 2% inflation confidently.
Markets in the Asian domain have shown an overall recovery as fears of more rates by the Federal Reserve (Fed) to achieve price stability amid rising consumer spending in the United States has faded. A rebound in the risk appetite theme has infused some strength into the risk-sensitive assets. The US Dollar Index (DXY) has rebounded after a perpendicular correction to near 104.20. The recovery move in the USD Index looks fragile as investors’ risk-taking ability is improving gradually.
At the press time, Japan’s Nikkei225 added 0.17%, ChinaA50 gained 0.11%, Hang Seng jumped 0.46%, and Nifty50 recovered 0.20%.
A sheer caution is expected for Chinese stocks as investors are awaiting the release of the Caixin Manufacturing PMI, which is scheduled for Wednesday. The street is anticipating a power-pack recovery in the Chinese economy after remaining locked for three years to contain the spread of Covid-19. Chinese administration is pumping stimulus to trigger economic recovery. Also, the People’s Bank of China (PBoC) has promised an expansionary monetary policy to revive growth.
Japanese equities seem directionless amid dovish stances from Bank of Japan (BoJ) policymakers. After dovish remarks from BoJ Governor Nominee Kazuo Ueda, BoJ Deputy Governor Ryozo Himino has also considered the easy monetary policy as appropriate for now. However, BoJ Himino has also cited an optimal time will come when the BoJ would exit easy policy, which will be good for both the public and banks.
The oil price is on the verge of reclaiming the 76.00 resistance as investors are worried that sheer supply cuts from Russia will trigger the demand-supply equilibrium. The black gold will remain in action as the US American Petroleum Institute (API) will release the oil inventories data for the week ending February 24.
- USD/CAD picks up bids to reverse the week-start pullback from monthly top.
- Cautious optimism underpins WTI rebound amid sluggish session.
- US Dollar remains on the way to posting the first monthly gain in five amid hawkish Fed concerns.
- Canada's Q4 GDP could help Loonie pair buyers on matching downbeat forecasts.
USD/CAD prints a gradual rebound from intraday low amid a sluggish end to February, picking up bids to 1.3585 heading into Tuesday’s European session. In doing so, the Loonie pair fails to justify the recent rebound in Canada’s key export item, namely WTI crude oil, as traders brace for the fourth quarter (Q4) Canadian Gross Domestic Product (GDP) data.
That said, the WTI crude oil bulls attack $76.00 while the refreshing intraday top, as well as reversing the previous day’s pullback from a one-week high. It should be noted that he hopes of easing US-China tension and hopes of upbeat inflation, as well as manufacturing activity in China, add strength to the black gold’s latest rebound.
On the other hand, the US Dollar Index (DXY) prints mild gains around 104.80, following a downbeat start of the week, as greenback bulls cheer hawkish Fed bets despite mixed US data amid an unimpressive day so far.
Talking about the risk catalysts, market sentiment improves on headlines suggesting the fact that the US offers an olive branch to Chinese companies despite its political differences with the dragon nation. “Despite fraying relations with Beijing, US President Joe Biden is expected to forego expansive new restrictions on American investment in China, denying a push by some hawks in his administration and Congress,” reported Politico late Monday.
However, US National Security Advisor Jake Sullivan’s comments on China suggest that the political tussle among the world’s top two economies stays on the table. “China’s stance on the Russian invasion of Ukraine puts it in an “awkward” position internationally and any weapons support to Russia would come with ‘real costs,’” said US Security Adviser Sullivan on CNN’s “State of the Union” on Monday.
That said, mixed US data jostled with the hawkish Fed speak and the US-China tension contributed to the lack of market clarity. That said, US Durable Goods Orders slumped -4.5% in January versus -4.0% expected and 5.1% prior. However, the Nondefense Capital Goods Orders ex Aircraft grew 0.8% versus 0.0% analysts’ expectations and -0.3% previous readings. On the same line, the US Pending Home Sales rallied 8.0% MoM versus 1.0% expected and 1.1% prior. At home, Canada’s Q4 Current Account Deficit grew to -10.64B versus -8.41B.
Against this backdrop, the S&P 500 Futures print mild gains around 3,995, extending the week-start rebound from the monthly low, whereas the US two-year Treasury yields remain sidelined near 4.79% after reversing from a three-month high on Monday. That said, the US 10-year Treasury bond coupons seek clear directions near 3.92% following a downbeat start of the week.
Looking ahead, Canada’s Q4 GDP Annualized, expected to ease to 1.5% versus 2.9% prior, could keep the USD/CAD buyers hopeful. Also important to watch will be the second-tier US data, namely Conference Board’s Consumer Confidence, Chicago Purchasing Managers’ Index and Richmond Fed Manufacturing Index for February, as well as the preliminary US trade numbers for January.
Technical analysis
Unless dropping back below the previous resistance line from early November, around 1.3570 by the press time, USD/CAD remains on the bull’s radar.
- Gold price retreats towards intraday low amid sluggish session, stays on the way to first monthly loss in five.
- A pause in Treasury bond buying, mixed US-China headlines join hawkish Fed bets to keep XAU/USD sellers hopeful.
- Repeated failures to cross $1,825 resistance confluence tease Gold bears as March looms.
Gold price (XAU/USD) remains sluggish as traders brace for a quiet end to the volatile February, after an upbeat start to the week. The yellow metal’s latest weakness could be linked to the mixed concerns surrounding the US-China ties, as well as the unimpressive prints of the second-tier US data. However, hawkish Federal Reserve (Fed) concerns and upbeat US Treasury bond yields, despite the latest inaction, keep the Gold bears hopeful.
Also read: Gold Price Forecast: XAU/USD eyes daily close for Falling Wedge confirmation
Gold Price: Key levels to watch
The Technical Confluence Detector shows that the Gold price grinds below the $1,825 resistance confluence which encompasses the Fibonacci 38.2% on one-week and the previous monthly low.
With this, the XAU/USD flirts with Fibonacci 38.2% on one-day, around $1,815, a break of which could quickly drag the metal prices towards $1,809 support level, including the previous weekly low and Pivot Point one-day S1.
In case where the Gold price remains weak past $1,809, there appears a smooth road towards $1,800 threshold comprising Pivot Point one-week S1 and Fibonacci 161% on one-day.
On the flip side, Fibonacci 23.6% on daily and Pivot Point one-day R1 guards immediate upside of the Gold price near $1,820 and $1,822, before highlighting the key $1,825 hurdle.
Should the XAU/USD price remains firmer past $1,825, a convergence of the 10-DMA and Fibonacci 61.8% on one-day, near $1,833, precedes the $1,838 hurdle including Pivot Point one-week R1 and one-day R3 to challenge the bulls.
Overall, the Gold price stays well-set to end February on a negative note.
Here is how it looks on the tool
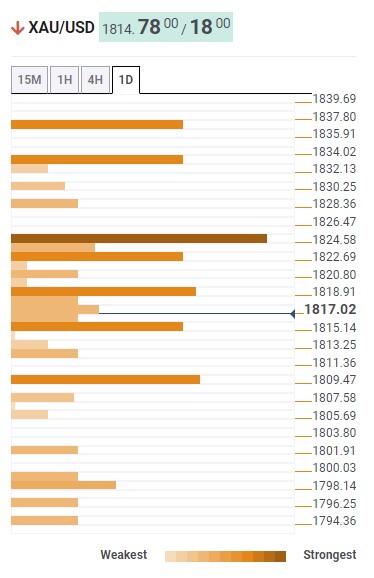
About Technical Confluences Detector
The TCD (Technical Confluences Detector) is a tool to locate and point out those price levels where there is a congestion of indicators, moving averages, Fibonacci levels, Pivot Points, etc. If you are a short-term trader, you will find entry points for counter-trend strategies and hunt a few points at a time. If you are a medium-to-long-term trader, this tool will allow you to know in advance the price levels where a medium-to-long-term trend may stop and rest, where to unwind positions, or where to increase your position size.
Incoming Bank of Japan (BoJ) Deputy Governor Ryozo Himino is testifying before Japan’s parliament Upper House on Tuesday.
Key quotes
Minus interest rate policy has negative impacts on financial institutions' profits.
Must be mindful of negative impact on banks from minus rate but focus now should be on keeping easy policy to support economy.
Need to consider various scenarios on exit from stimulus and come up with measures to respond to them.
If conditions fall in place for BoJ to exit easy policy, that will be good for both the public and banks.
Steering smooth exit from easy policy important, must think of various scenarios.
Best approach is to support economy with easy policy until inflation can achieve boj's price target excluding impact of import price rises.
Must debate specifics of exit policy only when stable, sustained achievement of boj's price target comes into sight.
Specific debate on exit from stimulus should be held when achievement of inflation target stably and sustainably becomes in sight.
BoJ may need to prepare with various scenarios in mind, but actual exit details should be decided taking into account economic conditions at the time.
Must carefully monitor how import prices affect trend inflation.
Related links
- USD/JPY steadies above 136.00 as yields pause previous retreat, BoJ dovish stance appears safe
- Incoming BoJ Depty. Gov Uchida: Widening yield target band itself would weaken effects of easing
- USD/INR has shifted its range below 82.70 amid an overnight correction in the USD Index.
- The Indian Rupee will display a power-pack action after the release of the Q3 GDP data.
- S&P500 futures have further added gains after a modest positive Monday, portraying ease in the risk-off mood.
The USD/INR pair has shifted its business below 82.70 in the Asian session led by an overnight sell-off in the US Dollar Index (DXY). The asset has slipped as investors have ignored clouds of uncertainty associated with accelerating consumer spending in the United States amid an upbeat labor market.
US tight labor market has shifted the bargaining power in the favor of job seekers from the hiring agencies amid a shortage of labor. This has flushed significant liquidity in the palms of households for disposal, which is fueling retail demand efficiently. No doubt, the fears of more rates by the Federal Reserve (Fed) are skyrocketing. But for now, the risk-off profile has eased gradually.
S&P500 futures have further added gains after a modest positive Monday session, portraying an improvement in the risk appetite of the market participants. The alpha generated on 10-year US treasury bonds has turned lackluster around 3.92%.
Meanwhile, the Indian Rupee will display a power-pack action after the release of the Q3 Gross Domestic Product (GDP) data for FY2022-23. The Indian economy showed double-digit growth in Q1 as helicopter money released by the Indian administration and expansionary monetary policy by the Reserve Bank of India (RBI) was spurting overall growth. In the second quarter, GDP started moderating and trimmed to 6.3% as the administration started contracting liquidity to bring down galloping inflation.
The RBI projected the real GDP growth for 2022-23 at 6.8% and for the third quarter at 4.4%.
On the oil front, the oil price has recovered to near $75.80 as the economy is betting on China’s reopening after a prolonged lockdown to contain the pandemic. It is worth noting that India is one of the leading importers of oil in the world and higher oil prices can impact the Indian rupee.
- AUD/USD is facing hurdles in stretching its recovery above 0.6750 despite upbeat Australian Retail Sales data.
- The Aussie has formed a Hammer candlestick pattern near the crucial support plotted near 0.6710.
- A pullback move to near five-period EMA cannot be ruled out.
The AUD/USD pair is struggling to stretch its recovery above the 0.6750 resistance in the Asian session. A recovery move in the Aussie asset from the round-level support of 0.6700 lacks strength as the risk-off mood has not disappeared yet. The US Dollar Index (DXY) has attempted a recovery after building a cushion around 104.30. However, a sideways performance is widely anticipated after a vertical downside move and ahead of the release of the United States ISM Manufacturing PMI data.
S&P500 futures have added more gains after registering a modest recovery on Monday. The 10-year US Treasury yields are struggling to sustain gains above 3.92%.
The Australian Dollar has failed to find significant bids despite the release of the upbeat monthly Retail Sales (Jan) data. The Australian Bureau of Statistics reported the monthly economic data at 1.9%, higher than the consensus of 1.5%. In December, Retail Sales contracted by 3.9%.
AUD/USD has formed a Hammer candlestick pattern near the crucial support plotted from December 29 low at 0.6710. The formation of Hammer candlestick indicates an emergence of responsive buyers as they consider the asset a ‘value buy’ now after a sheer downside.
It is worth noting that the asset has diverged extremely from the five-period Exponential Moving Average (EMA) at 0.6768. Extremely shorter-term EMAs usually remain sticky with each other. A case of divergence results in a reversion of prices towards the EMA. Therefore, a pullback move cannot be ruled out.
The Relative Strength Index (RSI) (14) has slipped into the bearish range of 20.00-40.00, which favors a downside momentum.
Should the Aussie asset break below Monday’s low around 0.6700, US Dollar bulls will drag the asset towards December 7 low at 0.6668 followed by December 20 low at 0.6629.
On the contrary, a break above February 23 high at 0.6842 will drive the asset toward February 21 high at 0.6920. A break above the latter will expose the major for more upside towards the psychological resistance at 0.7000.
AUD/USD daily chart
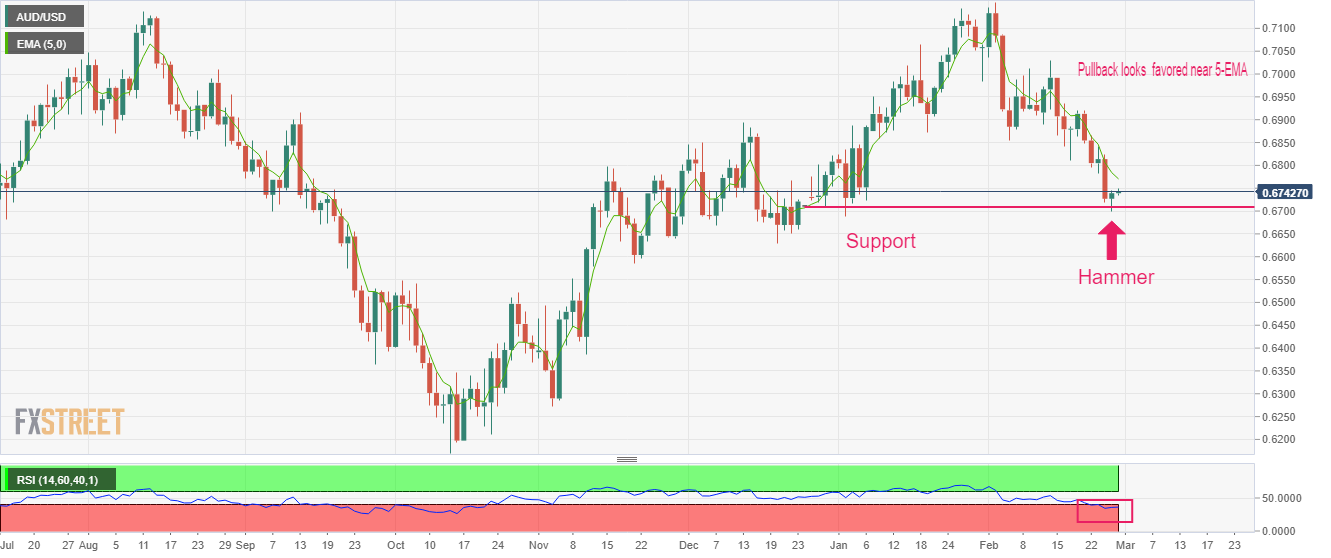
- GBP/USD remains sidelined after rising the most in seven weeks.
- UK PM Sunak manages to strike all-around acceptability with latest Brexit deal.
- Sluggish oscillators probe traders around previous resistance line.
- Key DMAs, support line challenge Cable bears despite snapping four-month uptrend in February.
GBP/USD struggles to extend the Brexit deal-induced gains around 1.2050-60 during early Tuesday. Even so, the Cable pair defends the previous day’s rebound from the key technical levels while also keeping the upside break of a short-term key resistance line, now support.
It’s worth noting that the sluggish MACD and RSI conditions challenge the Cable pair buyers after the quote rose the most on a daily since early January. That said, the GBP/USD remains on the way to posting the first monthly loss in five.
On a different page, optimism surrounding UK Prime Minister Rishi Sunak’s Brexit deal keeps the GBP/USD buyers hopeful as most of the hard Brexiteers have so far praised the initial deal for the Northern Ireland Protocol (NIP) that needs UK Parliamentary approval.
Also read: UK PM Sunak: Found a way to end the uncertainty for Northern Ireland
Hence, recent inaction in the market pushes back the bearish bias surrounding the GBP/USD as it defends the previous day’s fundamental, as well as technical, catalysts that recalled the bulls on Monday.
As a result, the Cable pair is on the way to poking a downward-sloping resistance line from February 02, close to 1.2110 by the press time, unless it drops below the resistance-turned-support line near 1.2040.
Even if the quote drops below 1.2040, the 100-DMA and 200-DMA, respectively near 1.1960 and 1.1920, could challenge the GBP/USD bears. Also acting as a downside filter is an upward-sloping support line from early January, close to 1.1930 by the press time.
On the flip side, a successful break of the 1.2110 resistance line could propel the GBP/USD price toward the mid-February high surrounding 1.2270. However, the double tops marked near 1.2445-50 appear a tough nut to crack for the bulls afterward.
GBP/USD: Daily chart
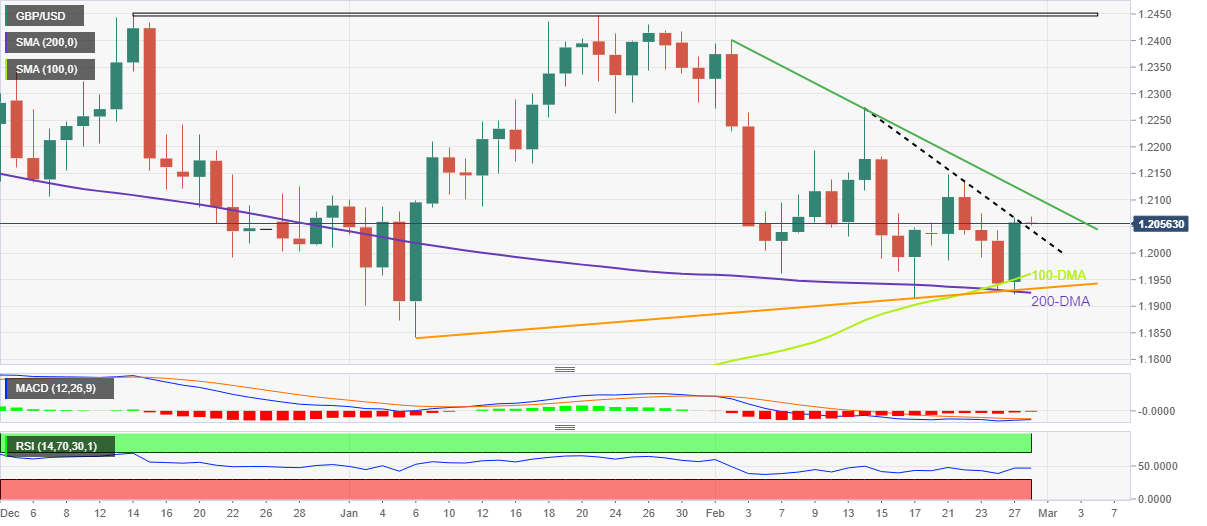
Trend: Further upside expected
- USD/JPY struggles to extend the week-start pullback from two-month high.
- Yields remain lackluster, stock futures print mild gains amid mond-end positioning.
- Second-tier positives for sentiment also push back the Yen pair sellers.
- Incoming BoJ Board pours cold water on face of hawkish expectations, defend YCC moves though.
USD/JPY treads water around 136.10-20 during Tuesday’s Asian session while portraying the market’s inaction amid the month-end positioning and a lack of major data/events. Even so, dovish comments from the incoming Bank of Japan (BoJ) officials join cautious optimism to put a floor under the Yen price after it reversed from the two-month high on Monday.
Recently, Incoming Bank of Japan (BoJ) Deputy Governor Shinichi Uchida testified before the Japanese parliament’s Upper House while defending the central bank’s easy money policy. In doing so, Uchida rules out hopes of altering the 2.0% inflation target, as well as hopes of bolstering on the Yield Curve Control (YCC) policy.
Also read:
Previously, BoJ Deputy Governor Masazumi Wakatabe said, “Central banks must remain on guard against the potential dangers of secular stagnation and low inflation as price rises driven by cost-push factors do not last long,” per Reuters.
It should be noted that the downbeat prints of Japan Industrial Production (IP) for January contrasted with a welcome growth in the nation’s Retail Trade numbers but failed to provide any clear directions to the USD/JPY. That said, Japan’s IP shrunk 4.6% in January versus -2.6% expected and 0.3% prior growth. However, the Retail Trade grew 1.9% MoM on a seasonally adjusted basis from 1.1% prior and -0.2% market forecasts.
On the other hand, market sentiment improves on headlines suggesting the fact that the US offers an olive branch to Chinese companies despite its political differences with the dragon nation and hence challenges the USD/JPY bears due to the quote’s risk-barometer status. “Despite fraying relations with Beijing, US President Joe Biden is expected to forego expansive new restrictions on American investment in China, denying a push by some hawks in his administration and Congress,” reported Politico late Monday.
Elsewhere, mixed US data jostled with the hawkish Fed speak and the US-China tension to contribute to the lack of market’s clarity. That said, US Durable Goods Orders slumped -4.5% in January versus -4.0% expected and 5.1% prior. However, the Nondefense Capital Goods Orders ex Aircraft grew 0.8% versus 0.0% analysts’ expectations and -0.3% previous readings. On the same line, the US Pending Home Sales rallied 8.0% MoM versus 1.0% expected and 1.1% prior.
Further, Federal Reserve Governor Philip Jefferson said on Monday that it is important to get back to 2% inflation to allow those sorts of sustained economic gains. Reuters also portrayed hawkish Fed concerns while saying, “Economic data this month reflected still tight jobs markets and inflation remaining sticky, leading Fed funds futures traders to bet on higher rates, which in the US are now seen peaking in September at 5.4%, up from 4.58% now.” Hence, the hawkish Fed concerns probe the risk-takers. On the same line could be the Sino-American tension surrounding Taiwan and Russia.
Moving on, USD/JPY traders should pay attention to the risk catalysts ahead of the second-tier US data for clear directions.
Technical analysis
Despite reversing from a three-week-old ascending resistance line, around 136.90 by the press time, USD/JPY remains bullish unless breaking the 200-day Exponential Moving Average (EMA) support of 133.90.
| Raw materials | Closed | Change, % |
|---|---|---|
| Silver | 20.629 | -0.76 |
| Gold | 1817.23 | 0.29 |
| Palladium | 1429.15 | 1.61 |
Incoming Bank of Japan (BoJ) Deputy Governor Shinichi Uchida is testifying before the Japanese parliament’s Upper House on Tuesday.
Key quotes
Reviewing current easy policy just to address side-effects will reduce stimulus effect on economy.
Widening yield target band itself would weaken effects of easing.
It is too early to discuss an exit.
The specifics of the exit will be determined by the economic situation.
Market reaction
USD/JPY fails to react to the dovish comments from Uchida. The pair is currently trading at 136.20, almost unchanged on the day.
- Markets sentiment remains cautiously optimistic as traders brace for a quiet end to volatile February.
- Hopes of upbeat earnings, mixed US data allowed Wall Street benchmarks to close with mild gains.
- Yields remain lackluster after reversing from multi-day high amid month-end inaction.
- Headlines surrounding China, Brexit and central bankers allow traders to pare the monthly losses.
Global traders appear less interested to mark big moves as the volatile February comes to an end. Even so, mixed US data and risk-positive headlines allow bears to take a breather during Tuesday’s sluggish Asian session.
While portraying the mood, the S&P 500 Futures print mild gains around 3,995, extending the week-start rebound from the monthly low, whereas the US two-year Treasury yields remain sidelined near 4.79% after reversing from a three-month high on Monday. That said, the US 10-year Treasury bond coupons seek clear directions near 3.92% following a downbeat start of the week.
Earlier on Tuesday, market sentiment improves on headlines suggesting the fact that the US offers an olive branch to Chinese companies despite its political differences with the dragon nation and hence allows the S&P 500 Futures to track Wall Street’s gains by the press time. “Despite fraying relations with Beijing, US President Joe Biden is expected to forego expansive new restrictions on American investment in China, denying a push by some hawks in his administration and Congress,” reported Politico late Monday.
Also underpinning the cautious optimism are the hopes of an upbeat US earnings season considering the upbeat employment and inflation figures. It’s worth noting that Monday’s mixed US data exerted downside pressure on the US Treasury bond yields and allowed the equity traders to remain optimistic.
Talking about the data, US Durable Goods Orders slumped -4.5% in January versus -4.0% expected and 5.1% prior. However, the Nondefense Capital Goods Orders ex Aircraft grew 0.8% versus 0.0% analysts’ expectations and -0.3% previous readings. On the same line, the US Pending Home Sales rallied 8.0% MoM versus 1.0% expected and 1.1% prior.
Elsewhere, talks of upbeat China inflation, backed by Securities Daily, as well as UK PM Rishi Sunak’s capacity to deliver a Brexit deal after months of inaction on the front, also seem to favor the market’s risk appetite.
Meanwhile, Federal Reserve Governor Philip Jefferson said on Monday that it is important to get back to 2% inflation to allow those sorts of sustained economic gains. Reuters also portrayed hawkish Fed concerns while saying, “Economic data this month reflected still tight jobs markets and inflation remaining sticky, leading Fed funds futures traders to bet on higher rates, which in the US are now seen peaking in September at 5.4%, up from 4.58% now.” Hence, the hawkish Fed concerns probe the risk-takers. On the same line could be the Sino-American tension surrounding Taiwan and Russia.
Looking forward, the second-tier US data, namely Conference Board’s Consumer Confidence, Chicago Purchasing Managers’ Index and Richmond Fed Manufacturing Index for February, as well as the preliminary US trade numbers for January, will be important for intraday directions. However, major attention will be given to the risk catalysts.
Also read: Forex Today: Sentiment fragile ahead of clearer clues
In an exclusive interview with CNN News on Monday, US Treasury Secretary Janet Yellen expressed her take on the inflation and economic outlook.
Key quotes
“I would say, ‘So far, so good,’” referring to the US inflation battle.
“Obviously there are risks, and the global situation we face is very uncertain.”
“There can be shocks from it. But look, inflation still is too high, but generally if you look over the last year, inflation has been coming down. And I know the Fed is committed to continuing the process of bringing it down to more normal levels, and I believe they’ll be successful with it.”
“The extraordinary measures undertaken by the Treasury Department to delay breaching the debt ceiling will help pay the government’s bills until at least early June.”
“Congress has to stand up and say they’re committed to having the government pay the bills that are due.”
“We will see an increasing toll on Russia’s economic trajectory over time.”
“And their ability to replenish the military equipment that’s been destroyed in their attacks on Ukraine, that’s been very greatly jeopardized.”
“We have been extremely clear that we will not tolerate systematic violations by any country of the sanctions that we have put in place that are intended to deprive Russia of access to military equipment to wage this war.”
“And we have been very clear with the Chinese government and have made clear to Chinese firms and financial institutions that the consequences of violating those sanctions would be very severe.”
Related reads
- US Dollar Index eyes the first monthly gain in five despite week-start retreat from multi-day top
- Turnaround tuesday?
- USD/CAD bulls are in town but they face a standoff at key 4-hour resistance.
- M-formation topping pattern could lead to significant downside in coming sessions.
USD/CAD has struggled to break 1.3600 as it climbs trendline support on the daily chart but suffers a blow from the US data pivot on Monday tempering the hawkish sentiment around the Federal Reserve to start the week. USD/CAD reached a high of 1.3665 on Friday and suffered a drop of around 90 pips on Monday for the opening balance. At this juncture, bulls need to commit or face prospects of a significant correction in the coming days.
USD/CAD daily chart
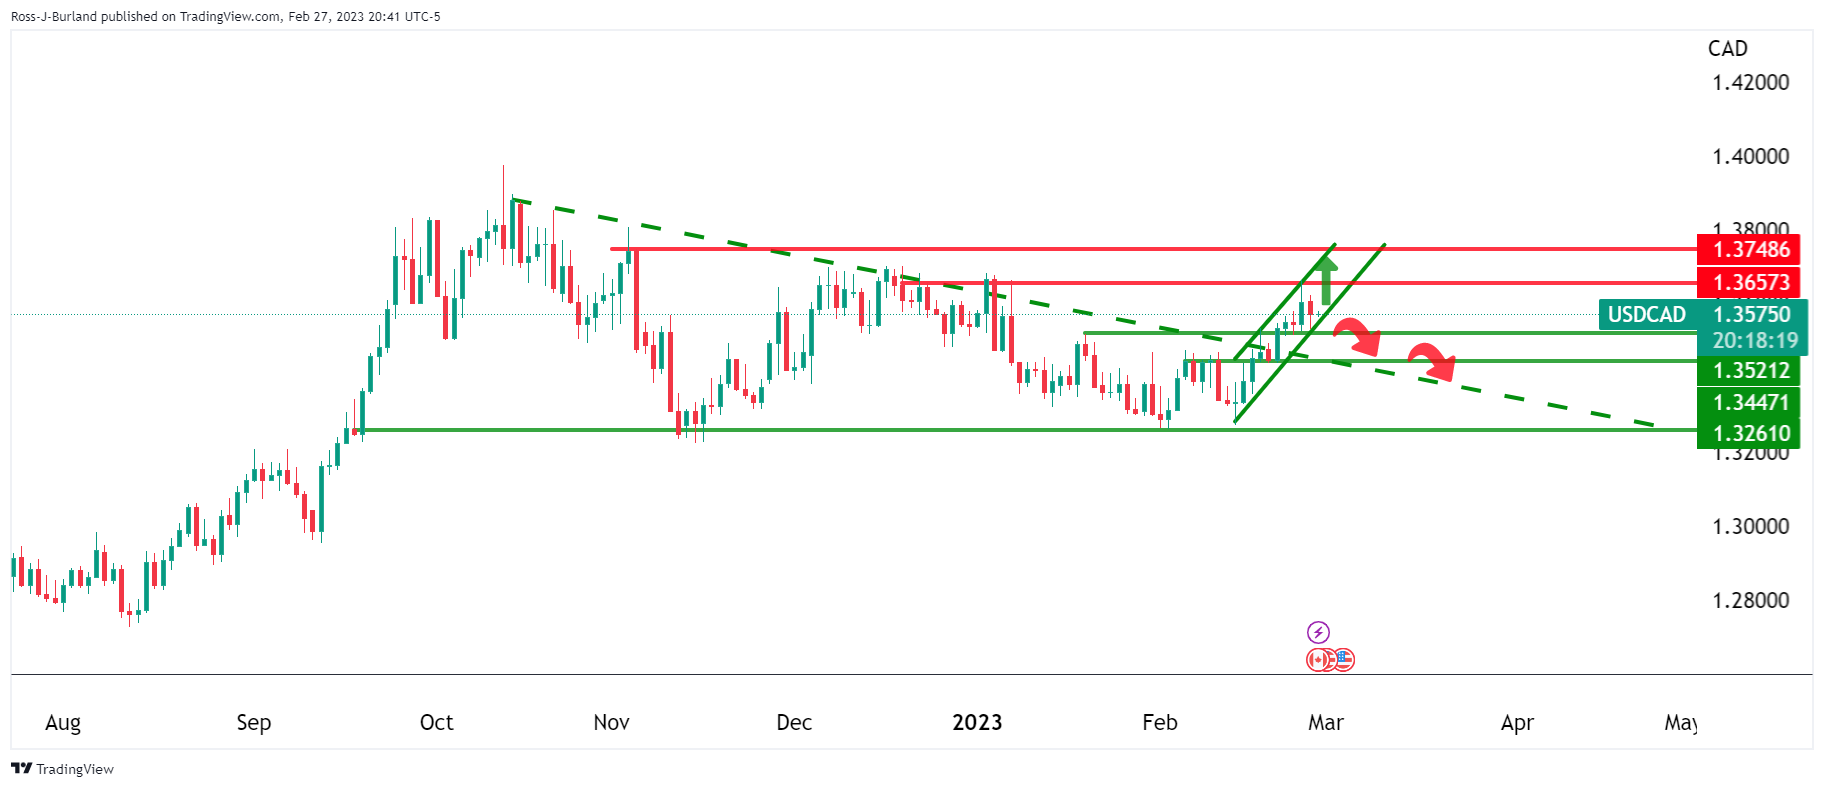
The channel is valid, for the time being, so there are prospects of a move higher should the support hold. However ...
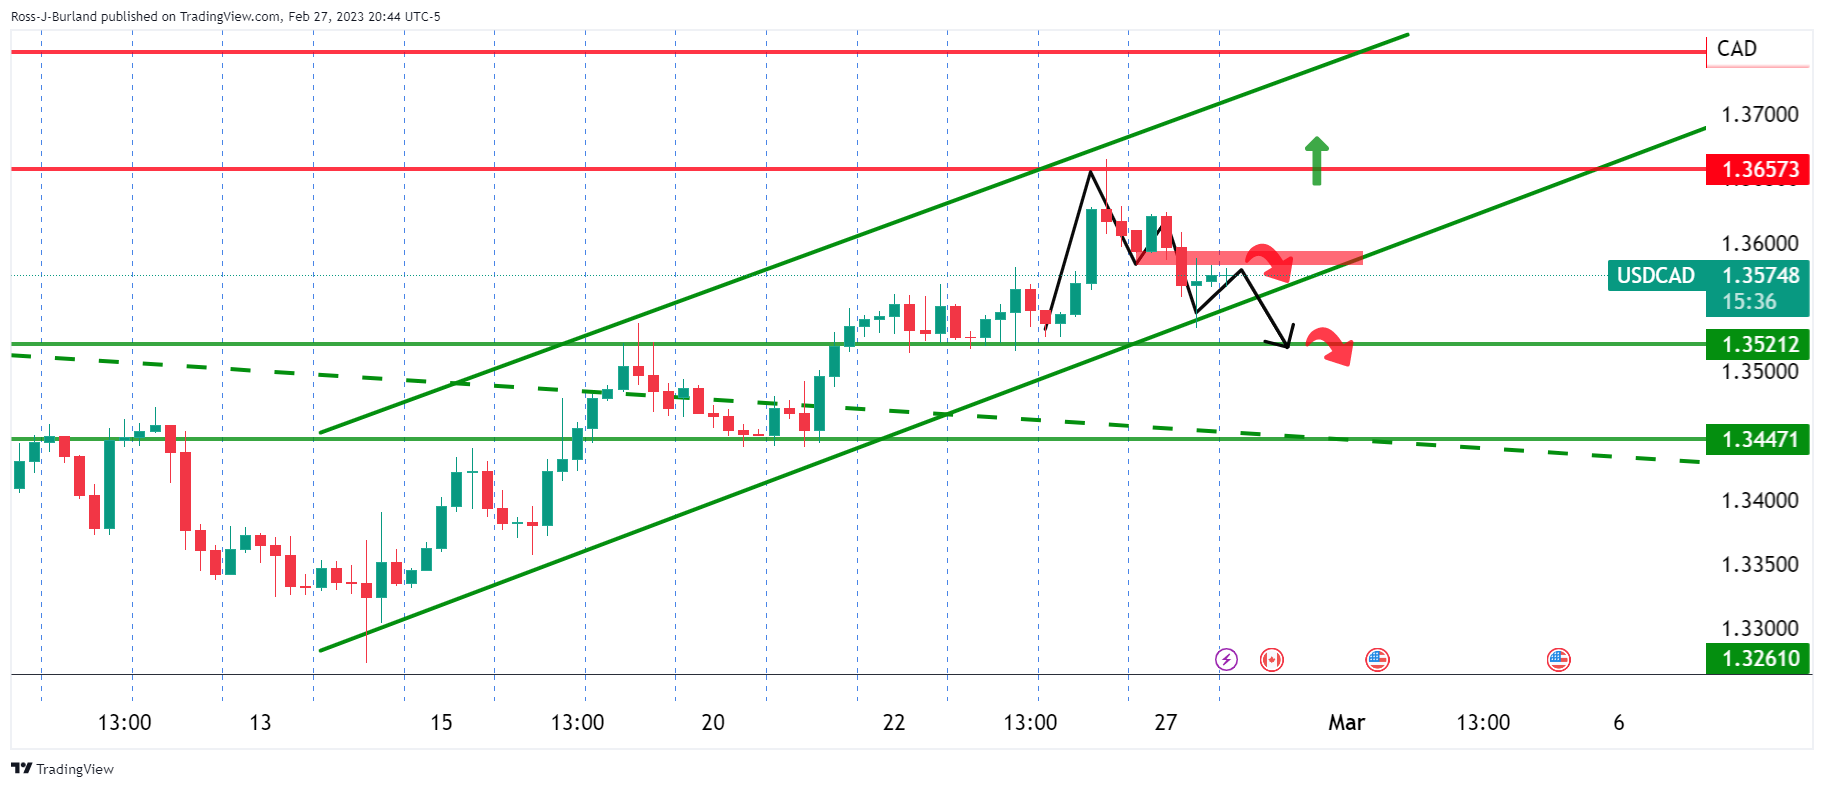
There is an M-formation topping pattern on the 4-hour chart and should the neckline hold as resistance, the bears could be encouraged to follow through:
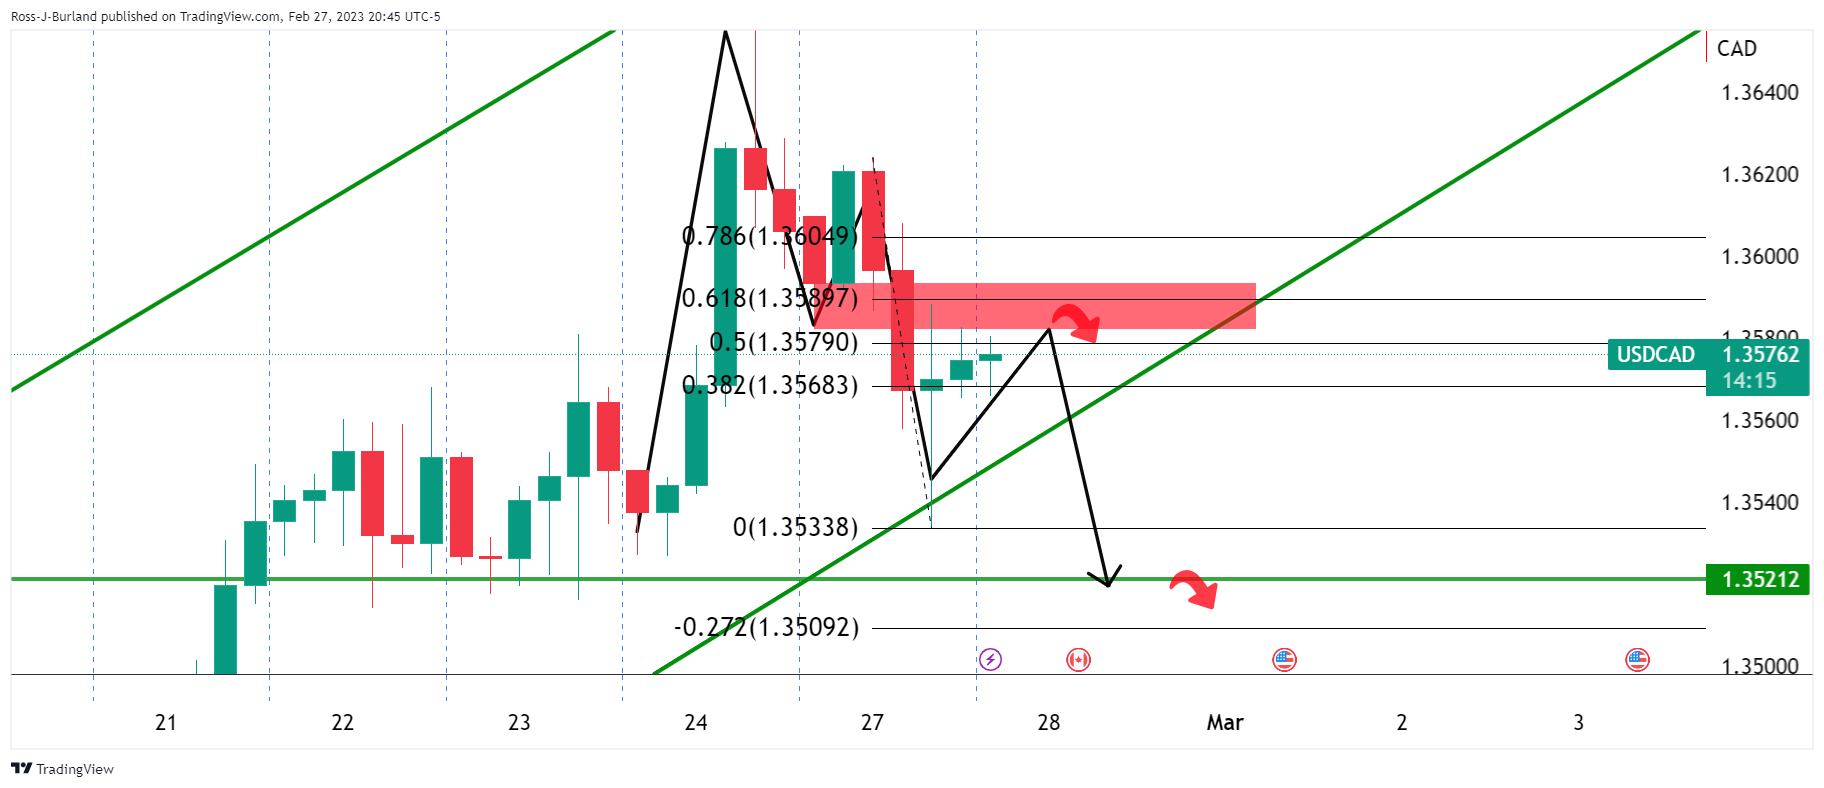
The M-formation is a reversion pattern and hence the price is coming up to test the neckline. 1.3520 to the downside is key if the neckline were to act as resistance.
The Bank of Japan's deputy gov nominee Uchida is crossing the wires and has stated that changing 2% inflation target is unthinkable.
Key comments
Will firmly continue monetary easing to lay ground for companies to raise wages.
Too early to seek exit from monetary stimulus now.
Interest rate, balance sheet adjustment are keys to exit from easy policy.
In what order boj will adjust interest rates, balance sheet will depend on economic conditions at the time.
It is not as if boj has an exit strategy written in paper.
Must be able to exit from easy policy whatever the economic situation could be based on experience guiding easy policy, dealing with market forces.
See no immediate need to revise govt-boj joint statement.
USD/JPY update
USD/JPY Price Analysis: Bears seek a break in trendline support
There are risks of a long squeeze for the days ahead. If the bears get below 135.50 and then 134, 132.50 will be eyed:

- Silver price has sensed a buying interest after testing Monday’s low around $20.55.
- Four-day losing spell in the Silver price has paused for now as investors have ignored Fed’s rate hike fears.
- Upbeat consumer spending in the US economy amid strong wage gains is supporting higher Fed’s interest rate projections.
Silver price (XAU/USD) has rebounded after gauging buying interest around $20.55 in the Tokyo session. On a broader note, the white metal is inside the woods in a range between $20.55-20.80 as investors have shifted their focus toward the release of the United States ISM Manufacturing PMI gamut on Wednesday.
Four-day losing spell in the Silver price has paused for now as investors have started digesting the fact that the Federal Reserve (Fed) is required to make the monetary policy more restrictive to achieve price stability. However, the losing spell could continue as geopolitical tensions between the US and China have not been shrugged off yet.
S&P500 futures have extended their recovery further amid a revival in investors’ risk appetite. The US Dollar Index (DXY) has continued to juggle around 104.30 after a steep correction from around 105.00. Market sentiment is turning positive as investors have ignored hawkish Fed fears, however, the US yields are not in a mood to deliver a decline. The alpha offered on the 10-year US government bonds has rebounded to near 3.93%.
Upbeat consumer spending in the US economy amid strong wage gains is supporting higher interest rate projections for the Fed as the battle against persistent inflation is getting brawled further.
Silver technical analysis
Silver price is displaying a consolidation formed in a range of $20.55-20.80 after a sheer perpendicular downside on an hourly scale. The asset looks vulnerable as the 20-period Exponential Moving Average (EMA) at $20.65 is acting as a barricade for the Silver price.
The Relative Strength Index (RSI) (14) is struggling to surrender the bearish range of 20.00-40.00.
Silver hourly chart
-638131457294944797.png)
- EUR/USD treads water after bouncing off 1.0530 support confluence, as well as crossing short-term resistance line.
- Downbeat oscillators, 50-day EMA challenge Euro bulls amid a quiet session.
- Bears have a bumpy road on their return unless breaking 1.0440 mark.
EUR/USD bulls take a breather around 1.0600 during early Tuesday, after posting the biggest daily gain in nearly a month the previous day. Even so, the major currency pair remains on the way to posting the first monthly loss in five.
That said, the quote’s sustained bounce off the 1.0530 support confluence, as well as a clear upside break of the previous resistance line from February 14, keeps the short-term EUR/USD buyers hopeful.
It’s worth noting that the 50-day Exponential Moving Average (EMA) and 61.8% Fibonacci retracement level of the pair’s moves between late November 2022 and early February 2023 highlights 1.0530 as the key support.
However, the bearish MACD signals and downbeat RSI (14), as well as the EUR/USD pair’s recent inaction around the 1.0600 round figure, challenge the bulls below the 50-day EMA hurdle of 1.0665.
Hence, the EUR/USD remains on the bull’s radar but the recovery moves need validation from the 1.0665 hurdle, a break of which could quickly propel the quote towards the mid-February swing high surrounding 1.0800.
Meanwhile, a downside break of the resistance-turned-support line, near 1.0585 by the press time, could drag the pair back to the 1.0530 support confluence.
It should be noted that the pair’s weakness past 1.0530 could witness a bumpy road towards the south as lows marked during January 2023 and early December 2022 could challenge the bears around 1.0480 and 1.0440 in that order.
EUR/USD: Daily chart
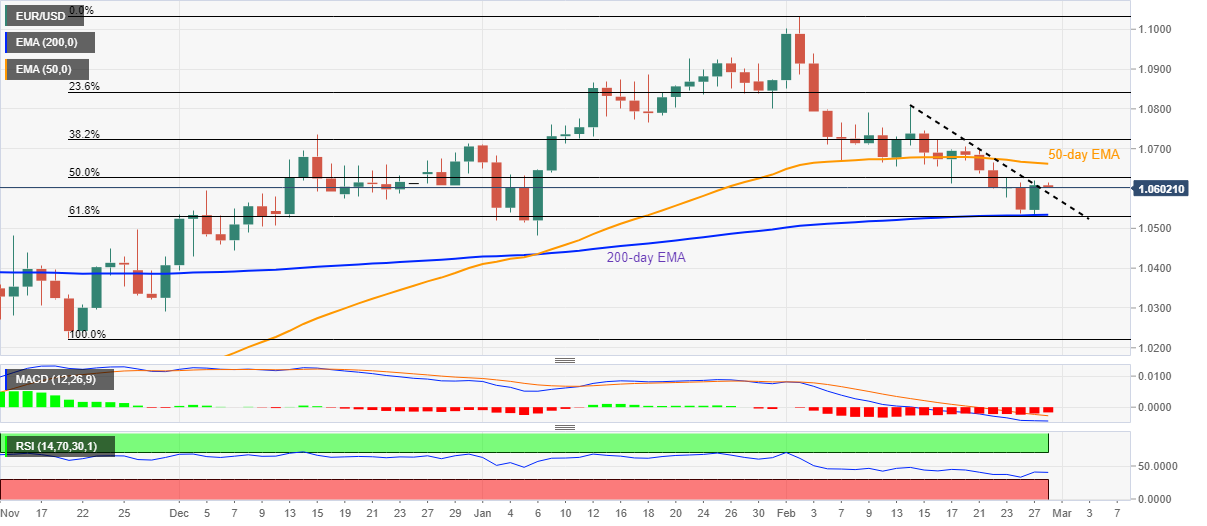
Trend: Limited upside expected
In recent trade today, the People’s Bank of China (PBOC) set the yuan at 6.9519 vs. the last close of 6.9433.
About the fix
China maintains strict control of the yuan’s rate on the mainland.
The onshore yuan (CNY) differs from the offshore one (CNH) in trading restrictions, this last one is not as tightly controlled.
Each morning, the People’s Bank of China (PBOC) sets a so-called daily midpoint fix, based on the yuan’s previous day's closing level and quotations taken from the inter-bank dealer.
- Gold price is oscillating in a narrow range below $1,820.00 as investors await US Manufacturing PMI.
- S&P500 futures have added more gains to Monday’s recovery, indicating an improvement in investors’ risk appetite.
- The resilience observed in US consumer spending has forced the street to ramp up its terminal rate projections.
Gold price (XAU/USD) is demonstrating a sideways auction below $1,820.00 in the Asian session. The precious metal is expected to come out of the woods as investors are shifting their focus towards the United States ISM Manufacturing PMI (Feb), which is scheduled for Wednesday.
Investors should note that US Manufacturing PMI is contracting consecutively for the past three months. As per the consensus, the economic data is expected to contract again, however, the scale of contraction will be lower. The US Manufacturing PMI is seen at 48.0, lower than the former release of 47.4.
S&P500 futures have added more gains to Monday’s recovery in the Asian session, portraying an improvement in the risk appetite of the market participants. The US Dollar Index (DXY) is expected to demonstrate a volatility contraction till the release of the US ISM Manufacturing PMI data. The 10-year US Treasury yields are juggling around 3.92%.
Meanwhile, resilience observed in consumer spending (Feb) in the United States has forced the street to ramp up their terminal rate projections. A note from Bank of America (BofA) suggests Fed chair Jerome Powell announcing three more rate hikes this year considering the resilience in the demand-driven inflation. The BofA sees the terminal rate above 6% and recession appears more likely than a soft landing.
Gold technical analysis
Gold price is auctioning in a Falling Channel chart pattern in which every pullback is considered as a selling opportunity before a reversal move. The precious metal has sensed resistance around $1,820.00 after a minor pullback move.
The 20-period Exponential Moving Average (EMA) at $1,815.83 is providing a cushion to the Gold bulls.
The Relative Strength Index (RSI) (14) is attempting to shift into the bullish range of 60.00-80.00.
Gold hourly chart
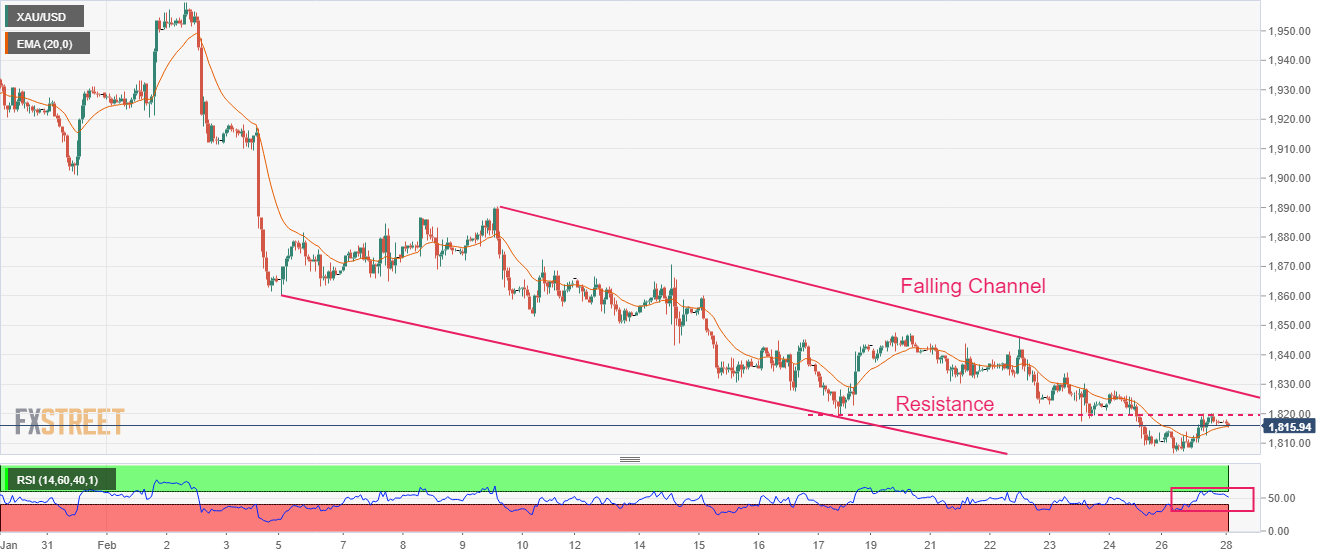
- USD/CHF remains pressured after reversing from the highest levels since early December the previous day.
- Risk-on mood, month-end consolidation joins mixed US data to favor sellers.
- Swiss Q4 GDP expected to ease on YoY but improve on seasonally adjusted QoQ basis.
- Second-tier US data, risk catalysts also important for fresh impulse.
USD/CHF portrays the pre-data anxiety while making rounds to 0.9350 during early Tuesday. Even so, the cautious optimism in the market, as well as the broad US Dollar weakness, allows the Swiss currency pair to consolidate the first monthly gain in four.
The trade-positive headline from the White House joined a retreat in the US Treasury bond yields to underpin the latest cautious optimism.
That said, That said, the US offers an olive branch to China companies despite its political differences with the dragon nation and hence allows the S&P 500 Futures to track Wall Street’s gains by the press time. “Despite fraying relations with Beijing, US President Joe Biden is expected to forego expansive new restrictions on American investment in China, denying a push by some hawks in his administration and Congress,” reported Politico late Monday.
It’s worth noting that the US Treasury bond yields remain lackluster while the S&P 500 Futures print mild gains, by tracking Wall Street’s upbeat closing, amid quiet hours of Tuesday’s trading.
On Monday, US Durable Goods Orders slumped -4.5% in January versus -4.0% expected and 5.1% prior. However, the Nondefense Capital Goods Orders ex Aircraft grew 0.8% versus 0.0% analysts’ expectations and -0.3% previous readings. On the same line, the US Pending Home Sales rallied 8.0% MoM versus 1.0% expected and 1.1% prior.
Even so, Federal Reserve Governor Philip Jefferson said on Monday that it is important to get back to 2% inflation to allow those sorts of sustained economic gains. Reuters also portrayed hawkish Fed concerns while saying, “Economic data this month reflected still tight jobs markets and inflation remaining sticky, leading Fed funds futures traders to bet on higher rates, which in the US are now seen peaking in September at 5.4%, up from 4.58% now.”
Moving on, Swirzerland’s fourth quarter (Q4) Gross Domestic Product (GDP) will be crucial for immediate direction. Forecasts suggest that the QoQ GDP is up 0.3% versus 0.2% prior but the YoY figure hints at a contraction in economic activities by 1.2% versus previous growth of 0.5%.
Apart from the Swiss GDP, the second-tier US data, namely Conference Board’s Consumer Confidence, Chicago Purchasing Managers’ Index and Richmond Fed Manufacturing Index for February, as well as the preliminary US trade numbers for January, will also be important for USD/CHF traders to watch for clear directions.
Technical analysis
USD/CHF pullback remains elusive unless the quote stays beyond a two-week-old ascending support line, around 0.9320 by the press time.
- AUD/JPY has touched an intraday high of 92.00 as upbeat Australian Retail Sales fuel hawkish RBA bets.
- Monthly Australian Retail Sales have landed at 1.9%, higher than the consensus of 1.5%.
- BoJ Ueda favors the continuation of the expansionary policy to accelerate wages and domestic demand.
The AUD/JPY has kissed the immediate resistance of 92.00 as the Australian Bureau of Statistics has reported higher-than-expected monthly Retail Sales (Jan) data. The economic data has landed at 1.9%, higher than the consensus of 1.5%. In December, Retail Sales contracted by 3.9%.
In times, when the Reserve Bank of Australia (RBA) and other policymakers are building a roadmap to soften inflationary pressures, upbeat retail demand data is going to add to the current troubles. Australian inflation has not shown a peak yet despite the RBA has already pushed its Official Cash Rate (OCR) to 3.35%. RBA’s policy tightening spell is not expected to halt anywhere amid an absence of evidence conveying a deceleration in the overall demand.
The cross will display a power-pack action on Wednesday as the Australian Gross Domestic Product (GDP) and monthly Consumer Price Index (CPI) will release.
As per the projections, a growth of 0.7% is seen in the Q4 of 2022, against 0.6% released in the third quarter. On an annualized basis, the Australian GDP is expected to deliver a growth of 2.7% vs. the former release of 5.9%.
Apart from the Australian GDP data, monthly CPI (Jan) is expected to soften to 7.9% from the former release of 8.4%. A decline in the monthly inflationary pressures will provide relief to RBA Governor Philip Lowe and other policymakers, which are worried about Australia’s sticky inflation.
On the Tokyo front, a surprise dovish tone adopted by Bank of Japan (BoJ) Governor Nominee Kazuo Ueda is impacting the Japanese Yen. It is appropriate from the viewpoint of BoJ Ueda to continue the expansionary policy to accelerate wages and domestic demand as multi-decade-high Japanese inflation is an outcome of international forces.
In early Asia, annual Japan’s Retail Trade (Jan) jumped to 6.3% vs. the consensus of 4.0% and the prior release of 3.8%. However, the Japanese Yen failed to capitalize on the same.
- AUD/NZD picks up bids to extend week-start rebound from monthly low.
- Australia Retail Sales rose past market forecasts and prior readings to print 1.9% growth in January.
- Convergence of 100-EMA, previous support line from late December 2022 challenge buyers.
- Upbeat oscillators, firmer Aussie data suggest further upside.
AUD/NZD bulls keep the reins around the mid-1.0900s while stretching the week-start recovery moves following the strong Australia Retail Sales data on early Tuesday. In doing so, the cross-currency pair approaches the short-term key resistance confluence.
That said, Australia’s seasonally adjusted Retail Sales rose 1.9% MoM versus 1.5% market forecasts and -3.9% previous readings, which in turn allowed the Aussie pair to refresh the intraday high near 0.6750.
Not only the upbeat Aussie data but the quote’s rebound from the 38.2% Fibonacci retracement level of the pair’s run-up between late 2022 and early February 2023, as well as the bullish MACD signals and upbeat RSI (14), also keep the AUD/NZD buyers hopeful.
However, a convergence of the 100-bar Exponential Moving Average (EMA) and the previous resistance line from late December 2022, around 1.0960, appears the key hurdle for the AUD/NZD bulls to cross to convince the buyers.
Following that, a run-up towards the 1.1000 psychological magnet and then to the monthly high surrounding 1.1090 can’t be ruled out.
Alternatively, the stated 38.2% Fibonacci retracement level puts a floor under the AUD/NZD prices of around 1.0900.
Following that, a seven-week-old horizontal support zone near 1.0880 will be crucial for the pair traders to watch as a break of which could convince sellers to retake control.
AUD/NZD: Four-hour chart
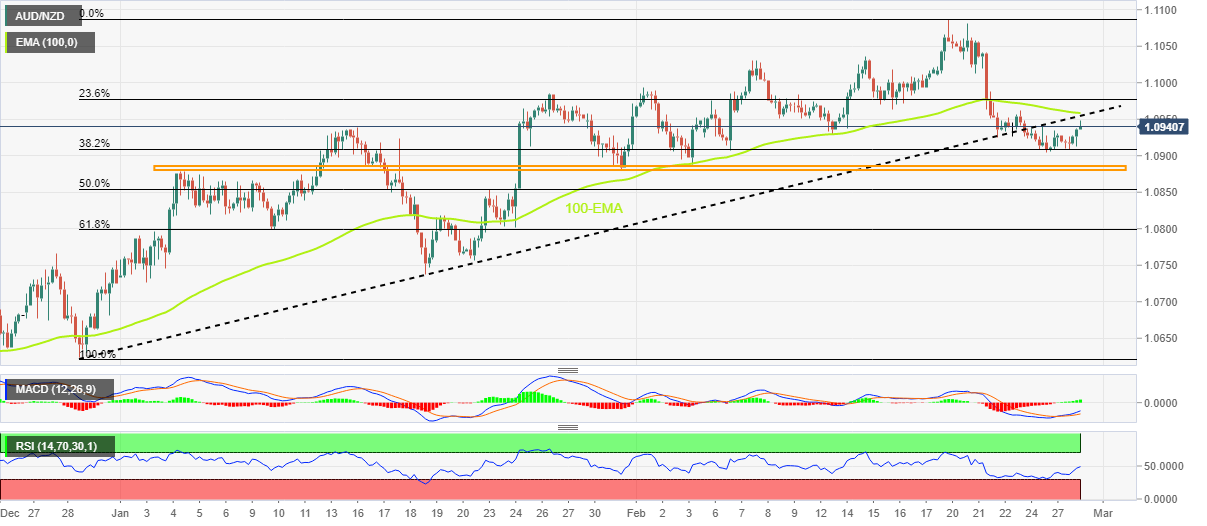
Trend: Further upside expected
- AUD/USD picks up bids to stretch the week-start rebound from seven-week low.
- Australia Retail Sales rose more than expected in January with 1.9% MoM growth.
- Risk-on mood, mixed US data and month-end positioning add strength to corrective bounce.
- Second-tier US statistics eyed for clear directions, risk catalysts are important too.
AUD/USD bulls cheer strong Australia Retail Sales to extend the week-start recovery towards 0.6750 during early Tuesday. In doing so, the Aussie pair also cheers risk-on mood, as well as softer US Treasury bond yields and mixed data.
That said, Australia’s seasonally adjusted Retail Sales rose 1.9% MoM versus 1.5% market forecasts and -3.9% previous readings, which in turn allowed the Aussie pair to refresh intraday high near 0.6750.
Apart from the upbeat Aussie data, trade-positive headline from the White House also seems to underpin the AUD/USD pair’s recovery, mainly due to the pair’s risk-barometer status.
That said, the US offers an olive branch to China companies despite its political differences with the dragon nation and hence allows the S&P 500 Futures to track Wall Street’s gains by the press time.
“Despite fraying relations with Beijing, US President Joe Biden is expected to forego expansive new restrictions on American investment in China, denying a push by some hawks in his administration and in Congress,” reported Politico late Monday.
Even so, the geopolitical woes, as well as the hawkish Fed talks, not to forget the looming concerns surrounding the Australia recession, seem to keep the AUD/USD sellers hopeful.
It’s worth noting that piece from Bloomberg cited risks of Australia recession by saying, “Reserve Bank of Australia chief Philip Lowe’s expectation of further interest-rate rises ahead has prompted economists and money markets to narrow the odds of a recession in the $1.5 trillion economy.”
On the other hand, Federal Reserve Governor Philip Jefferson said on Monday that it is important to get back to 2% inflation to allow those sorts of sustained economic gains. Reuters also portrayed hawkish Fed concerns while saying, “Economic data this month reflected still tight jobs markets and inflation remaining sticky, leading Fed funds futures traders to bet on higher rates, which in the US are now seen peaking in September at 5.4%, up from 4.58% now.”
It should be noted that mixed US data joined the month-end consolidation to help the AUD/USD pair recover from the previous monthly low on Monday. That said, US Durable Goods Orders slumped -4.5% in January versus -4.0% expected and 5.1% prior. However, the Nondefense Capital Goods Orders ex Aircraft grew 0.8% versus 0.0% analysts’ expectations and -0.3% previous readings. On the same line, the US Pending Home Sales rallied 8.0% MoM versus 1.0% expected and 1.1% prior.
Looking ahead, AUD/USD traders should pay attention to the risk catalysts, as well as the second-tier US data relating to consumer sentiment and manufacturing activity, for intraday directions. However, major attention will be given to Wednesday’s Australia Gross Domestic Product (GDP) for the fourth quarter (Q4).
Technical analysis
Despite a successful recovery from the three-month-old ascending support line, close to 0.6720 by the press time, AUD/USD buyers need validation from the 200-DMA resistance of around the 0.6800 round figure to keep the reins.
The Retail Sales released by the Australian Bureau of Statistics is out as follows:
- Australia Retail Sales MoM Jan: 1.9% (est 1.5%, prev -3.9%).
- Rose 7.5% compared with January 2022.
The Bureau said ''an additional information release on 7 March 2023 will see the inclusion of more detailed results for the January 2023 reference period. Additional timeseries spreadsheets will be published, including; state by industry results, state by industry sub-group results, quarterly turnover volumes, and online sales.''
AUD/USD update
AUD/USD has popped to a session high of 0.6750:
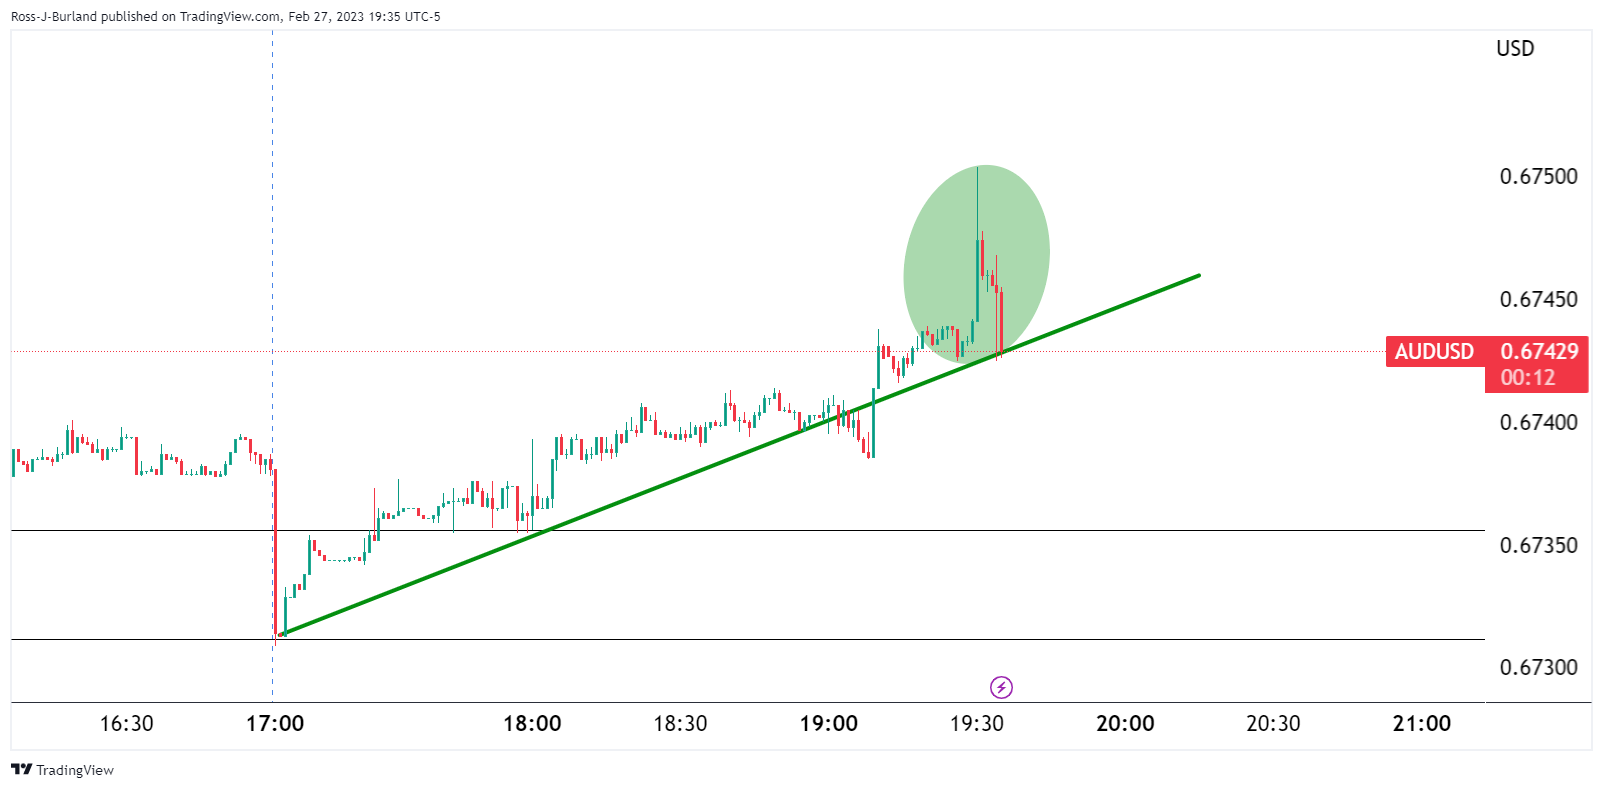
About the Retail Sales
The Retail Sales released by the Australian Bureau of Statistics is a survey of goods sold by retailers is based on a sampling of retail stores of different types and sizes and it''s considered as an indicator of the pace of the Australian economy. It shows the performance of the retail sector over the short and mid-term. Positive economic growth anticipates bullish trends for the AUD, while a low reading is seen as negative or bearish.
| Index | Change, points | Closed | Change, % |
|---|---|---|---|
| NIKKEI 225 | -29.52 | 27423.96 | -0.11 |
| Hang Seng | -66.53 | 19943.51 | -0.33 |
| KOSPI | -20.97 | 2402.64 | -0.87 |
| ASX 200 | -82.2 | 7224.8 | -1.12 |
| FTSE 100 | 56.41 | 7935.11 | 0.72 |
| DAX | 171.69 | 15381.43 | 1.13 |
| CAC 40 | 108.28 | 7295.55 | 1.51 |
| Dow Jones | 72.17 | 32889.09 | 0.22 |
| S&P 500 | 12.2 | 3982.24 | 0.31 |
| NASDAQ Composite | 72.04 | 11466.98 | 0.63 |
- GBP/USD bulls are in town as the US Dollar weakness and Brexit noise comes back to the fore.
- The Bank of England is seen increasing Bank Rate by a further 25 bps to 4.25% in March.
GBP/USD is flat in Asia as markets consolidate the opening range and US "Dollar softness that kicked in at the start of the week. At the time of writing, GBP/USD is trading at 1.2065 and has stuck to a 1.2042/67 range so far. Sterling is up from a 7-week low due to not only US Dollar weakness but also following British Prime Minister Rishi Sunak signing a new trade deal with the European Union.
The Northern Ireland Protocol has been a factor playing into the Pound's trajectory in the forex space in recent days while a new agreement, known as the Windsor Framework, has been drawn out between the two sides. The agreement is designed to safeguard trade flows within the UK, protecting Northern Ireland’s place within the UK. However, as the Guardian writes, ''the prime minister is obviously not out of the woods. Once the detail emerges, there could be ministerial resignations.''
''Mr Sunak says 'parliament will have a vote at the appropriate time and that vote will be respected'. This gives him the advantage of timing over his would-be opponents who might otherwise find a way to engineer a vote at a moment of maximum danger and force the government to win with Labour support, which would damage, perhaps fatally, Mr Sunak.''
Meanwhile, the Bank of England is seen increasing Bank Rate by a further 25 bps to 4.25% in March. ''We think the BoE will be comfortable pivoting to a 25bps hike in March, followed by a pause in May,'' analysts at Standard Chartered argued. They suggest that they will do so but two factors are key:
''(1) just how generous pay rewards are for public-sector unions, and (2) whether government efforts to reduce economic inactivity – to be outlined in the budget on 14 March – are successful. The former could potentially send an unwanted inflationary signal to the private sector, while the latter could help provide some additional slack to the labour market and also help work through lingering labour supply shortages owing to COVID and Brexit,'' the analysts explained.
- US Dollar Index pares monthly gains amid mixed US data, geopolitical concerns.
- Hawkish Fed bets keep DXY bulls hopeful amid sluggish end to a volatile month.
- Second-tier US statistics eyed for intraday directions, headlines surrounding China, Russia also important for fresh impulse.
US Dollar Index (DXY) holds lower grounds near 104.60 during the mid-Asian session on Tuesday, after posting the biggest daily loss in five. It’s worth noting that the greenback’s previous losses could be linked to mixed US data and a retreat in the US Treasury bond yields. The latest pause in the DXY, however, could be linked to the mixed sentiment in the market ahead of the second-tier US data release.
On Monday, the greenback’s gauge versus the six major currencies traced a treat in the US Treasury bond yields amid mixed US data to tease the DXY sellers around the multi-day top.
US Durable Goods Orders slumped -4.5% in January versus -4.0% expected and 5.1% prior. However, the Nondefense Capital Goods Orders ex Aircraft grew 0.8% versus 0.0% analysts’ expectations and -0.3% previous readings. On the same line, the US Pending Home Sales rallied 8.0% MoM versus 1.0% expected and 1.1% prior.
With this, the benchmark 10-year US Treasury bond yields dropped three basis points (bps) to 3.92% after a five-week uptrend while the two-year counterpart followed the suit by retreating from a three-month high to 4.78%.
It should be noted, however, that the Fed policymakers defend their hawkish bias and underpin the hopes of higher Fed rates, which in turn challenge the US Dollar Index bears. That said, Federal Reserve Governor Philip Jefferson said on Monday that it is important to get back to 2% inflation to allow those sorts of sustained economic gains. Reuters also portrayed hawkish Fed concerns while saying, “Economic data this month reflected still tight jobs markets and inflation remaining sticky, leading Fed funds futures traders to bet on higher rates, which in the US are now seen peaking in September at 5.4%, up from 4.58% now.”
Not only the hawkish Fed bets but the fears surrounding the US-China ties, despite the recent show of olive branch by the White House, also keeps the DXY buyers hopeful. On Monday, US National Security Advisor Jake Sullivan said on CNN’s “State of the Union,” China’s stance on the Russian invasion of Ukraine puts it in an “awkward” position internationally and any weapons support to Russia would come with “real costs.”
“Despite fraying relations with Beijing, US President Joe Biden is expected to forego expansive new restrictions on American investment in China, denying a push by some hawks in his administration and in Congress,” reported Politico late Monday.
Amid these plays, Wall Street closed positive and the S&P 500 Futures also prints mild gains by the press time.
Moving on, the second-tier US data, namely US Conference Board’s Consumer Confidence, Chicago Purchasing Managers’ Index and Richmond Fed Manufacturing Index for February, as well as the preliminary US trade numbers for January, will be important for immediate directions.
Technical analysis
A clear downside break of a three-week-old ascending trend line, now resistance around 104.70, directs US Dollar Index (DXY) bears toward the previous weekly bottom surrounding 103.75.
- The cross is picking strength amid weakness in the Japanese Yen led by BoJ Ueda’s dovish stance.
- GBP/JPY is in a markup phase after delivering a breakout of Wyckoff’s Accumulation.
- The RSI (14) is aiming to shift to the bullish range of 60.00-80.00, which will result in a bullish momentum ahead.
The GBP/JPY pair has refreshed its two-month high at around 164.46 in the Asian session after continuing its two-day winning streak. The cross is picking strength amid weakness in the Japanese Yen led by the dovish stance adopted by Bank of Japan (BoJ) Governor Nominee Kazuo Ueda over monetary policy guidance.
BoJ Ueda considers the current monetary policy as appropriate for spurting the wages and growth rate as a recent jump in Japan’s inflationary pressures is backed by rising import prices. Therefore, a sustained 2% inflation target can be achieved by keeping the expansionary monetary policy intact.
Meanwhile, the Pound Sterling is enjoying gains due to the smooth flow of the Northern Ireland deal with European Commission (EC) President Ursula von der Leyen. The Agreement assures smooth free-flowing trade from the European Union with the United Kingdom citing the UK and EU are allies, friends, and trading partners.
On a daily scale, GBP/JPY is in a markup phase after delivering a breakout of Wyckoff’s Accumulation pattern. Wyckoff’s accumulation indicates a period of inventory shift from the retail participants to the institutional investors. The cross is marching towards the horizontal resistance plotted from November 17 high around 169.10.
The 10-period Exponential Moving Average (EMA) at 162.65 will continue to provide support to the Pound Sterling bulls.
Meanwhile, the Relative Strength Index (RSI) (14) is aiming to shift to the bullish range of 60.00-80.00, which will result in a bullish momentum ahead.
A decisive break above the immediate resistance of 164.50 will drive the cross toward December 20 high around 167.00 followed by the ultimate resistance plotted from November 17 high around 169.10.
Alternatively, a break below February 24 low at 161.22 will negate the bullish reversal and will drag the asset toward February 14 low at 160.11 and January 25 low at 159.50.
GBP/JPY daily chart
-638131401862506967.png)
| Pare | Closed | Change, % |
|---|---|---|
| AUDUSD | 0.67393 | 0.15 |
| EURJPY | 144.537 | 0.44 |
| EURUSD | 1.06097 | 0.62 |
| GBPJPY | 164.328 | 0.79 |
| GBPUSD | 1.20625 | 0.98 |
| NZDUSD | 0.61681 | 0.03 |
| USDCAD | 1.35743 | -0.25 |
| USDCHF | 0.93573 | -0.35 |
| USDJPY | 136.232 | -0.17 |
Retail Sales Overview
Early Tuesday, the market sees preliminary readings of Australia's seasonally adjusted Retail Sales for December month at 00:30 GMT. Market consensus suggests a stronger seasonally adjusted MoM print of 1.4% versus -3.9% prior, suggesting a sustained improvement in economic activity.
Given the recently stronger Aussie inflation data and the upbeat comments from the Reserve Bank of Australia's (RBA) officials, not to forget the challenges to sentiment ahead of the month-end consolidation, today’s Aussie Retail Sales appear crucial for the AUD/USD traders.
It should be noted that China’s official NBS Manufacturing PMI and Non-Manufacturing PMI, up for publishing around 01:00 AM GMT on Wednesday, also increases the importance of the Asia-Pacific economic calendar on Tuesday.
Ahead of the data, Westpac said,
An underlying slowdown in retail sales should continue to be evident in January despite recent volatility (Westpac f/c: 1.0%mth, median forecast 1.5%, after December’s shock -3.9%).
How could it affect AUD/USD?
AUD/USD struggles to defend the week-start recovery while portraying the pre-data anxiety around 0.6740 by the press time. The Aussie pair’s inaction could also be linked to the mixed headlines surrounding China. As the US White House braces for easy China-linked policies for investments, per Politico, while also keeping the Dragon nation on the radar for its alleged role in the Ukraine-Russia tension.
That said, the recent chatters surrounding the Aussie recession, amid fears of comparatively higher rates in Australia than the US, may also seek validation from today’s Aussie Retail Sales data. Hence, recovery in the key statistics may allow the AUD/USD buyers to extend the latest rebound to cross the immediate technical hurdle while a negative surprise, which is more likely, could recall the Aussie pair buyer by highlighting the hawkish Fed concerns.
Technically, AUD/USD rebound remains elusive unless providing a sustained daily close beyond 0.6740 resistance confluence, comprising the 100-DMA and previous support line from late November 2022.
Key Notes
AUD/USD faces barricades around 0.6750 ahead of Australian GDP and US PMI data
AUD/USD Forecast: Australian data will set the next direction
About Australian Retail Sales
The Retail Sales released by the Australian Bureau of Statistics is a survey of goods sold by retailers based on a sampling of retail stores of different types and sizes and it's considered an indicator of the pace of the Australian economy. It shows the performance of the retail sector over the short and mid-term. Positive economic growth anticipates bullish trends for the AUD, while a low reading is seen as negative or bearish.
© 2000-2026. All rights reserved.
This site is managed by Teletrade D.J. LLC 2351 LLC 2022 (Euro House, Richmond Hill Road, Kingstown, VC0100, St. Vincent and the Grenadines).
The information on this website is for informational purposes only and does not constitute any investment advice.
The company does not serve or provide services to customers who are residents of the US, Canada, Iran, The Democratic People's Republic of Korea, Yemen and FATF blacklisted countries.
Making transactions on financial markets with marginal financial instruments opens up wide possibilities and allows investors who are willing to take risks to earn high profits, carrying a potentially high risk of losses at the same time. Therefore you should responsibly approach the issue of choosing the appropriate investment strategy, taking the available resources into account, before starting trading.
Use of the information: full or partial use of materials from this website must always be referenced to TeleTrade as the source of information. Use of the materials on the Internet must be accompanied by a hyperlink to teletrade.org. Automatic import of materials and information from this website is prohibited.
Please contact our PR department if you have any questions or need assistance at pr@teletrade.global.
