- Analytics
- News and Tools
- Market News
CFD Markets News and Forecasts — 26-09-2024
The headline Tokyo Consumer Price Index (CPI) for September rose 2.2% YoY, compared to a 2.6% rise in the previous reading, the Statistics Bureau of Japan showed on Friday. Meanwhile, the Tokyo CPI ex Fresh Food, Energy increased 1.6% YoY, compared to the previous reading of 1.6% rise.
Additionally, Tokyo CPI ex Fresh Food rose 2.0% YoY in September, compared to a 2.4% rise in August, and was in line with the market consensus of 2.0%.
Market reaction to the Tokyo Consumer Price Index
As of writing, the USD/JPY pair was up 0.19% on the day at 145.10.
Inflation FAQs
Inflation measures the rise in the price of a representative basket of goods and services. Headline inflation is usually expressed as a percentage change on a month-on-month (MoM) and year-on-year (YoY) basis. Core inflation excludes more volatile elements such as food and fuel which can fluctuate because of geopolitical and seasonal factors. Core inflation is the figure economists focus on and is the level targeted by central banks, which are mandated to keep inflation at a manageable level, usually around 2%.
The Consumer Price Index (CPI) measures the change in prices of a basket of goods and services over a period of time. It is usually expressed as a percentage change on a month-on-month (MoM) and year-on-year (YoY) basis. Core CPI is the figure targeted by central banks as it excludes volatile food and fuel inputs. When Core CPI rises above 2% it usually results in higher interest rates and vice versa when it falls below 2%. Since higher interest rates are positive for a currency, higher inflation usually results in a stronger currency. The opposite is true when inflation falls.
Although it may seem counter-intuitive, high inflation in a country pushes up the value of its currency and vice versa for lower inflation. This is because the central bank will normally raise interest rates to combat the higher inflation, which attract more global capital inflows from investors looking for a lucrative place to park their money.
Formerly, Gold was the asset investors turned to in times of high inflation because it preserved its value, and whilst investors will often still buy Gold for its safe-haven properties in times of extreme market turmoil, this is not the case most of the time. This is because when inflation is high, central banks will put up interest rates to combat it. Higher interest rates are negative for Gold because they increase the opportunity-cost of holding Gold vis-a-vis an interest-bearing asset or placing the money in a cash deposit account. On the flipside, lower inflation tends to be positive for Gold as it brings interest rates down, making the bright metal a more viable investment alternative.
- EUR/USD recovered ground on Thursday, sticking close to near-term highs.
- Despite recovery, Fiber remains on the south side of 1.1200.
- US PCE inflation to be the week’s key data print.
EUR/USD tuned back into the high end on Thursday, getting bolstered by a broad-market selloff in the Greenback. US data that printed better than expected helped to ease concerns of a possible economic slowdown within the US economy looming over the horizon.
The US economy still isn’t out of the woods yet, with key activity data still easing, but the hard edge of recession fears has been filed off. Friday still has one final hurdle for data-hounds to lurch over, however. US Personal Consumption Expenditure (PCE) inflation figures due during the last trading session of the week could throw a spanner in the works if they come out wildly out-of-tune with forecasts.
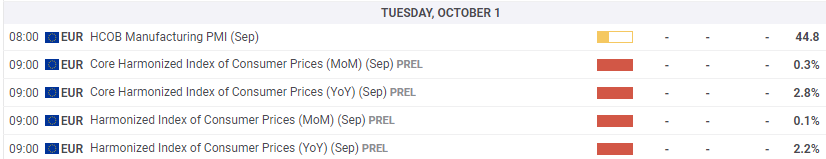
Across the Atlantic, pan-EU confidence indicators are also expected on Friday, but most of these indexed surveys are expected to stick close to previous figures. EUR traders will be much more interested in European Harmonized Index of Consumer Prices (HICP) inflation numbers for September, which are due next Tuesday.
The Federal Reserve's recent decision to cut interest rates by 50 basis points raised apprehensions in global markets, with some investors fearing that the drastic move was a response to an impending economic downturn in the US. However, Fed Chair Jerome Powell clarified that the rate cut was a proactive measure aimed at supporting the US labor market, rather than a reactive response to recessionary signals.
Positive data on US Durable Goods Orders and weekly Initial Jobless Claims further reinforced the Fed's position, with both indicators surpassing expectations. The narrative of a "soft landing" for the economy remained intact. The upcoming release of the Personal Consumption Expenditure (PCE) inflation data on Friday will serve as a crucial litmus test for evaluating the impact of the recent rate cut by the Fed.
In August, US Durable Goods Orders stagnated at 0.0% month-on-month, falling short of the previous month's significant growth but still outperforming the projected contraction of 2.6%. Additionally, the Initial Jobless Claims for the week ending September 20 showed a decrease to 218K, beating the anticipated 225K and signaling a decline from the revised figure of 222K in the preceding week.
EUR/USD price forecast
Despite Thursday’s bullish bounceback, Fiber remains capped below the 1.1200 handle. Bidders are struggling to muscle EUR/USD back into the high end, but a lack of meaningful momentum in the hands of sellers is limiting options for a downside swing.
The pair remains well-bid on the north side of the 50-day Exponential Moving Average (EMA) near 1.1040, while price action still has plenty of room to move into the top end and reclaim chart paper above 1.1200.
EUR/USD daily chart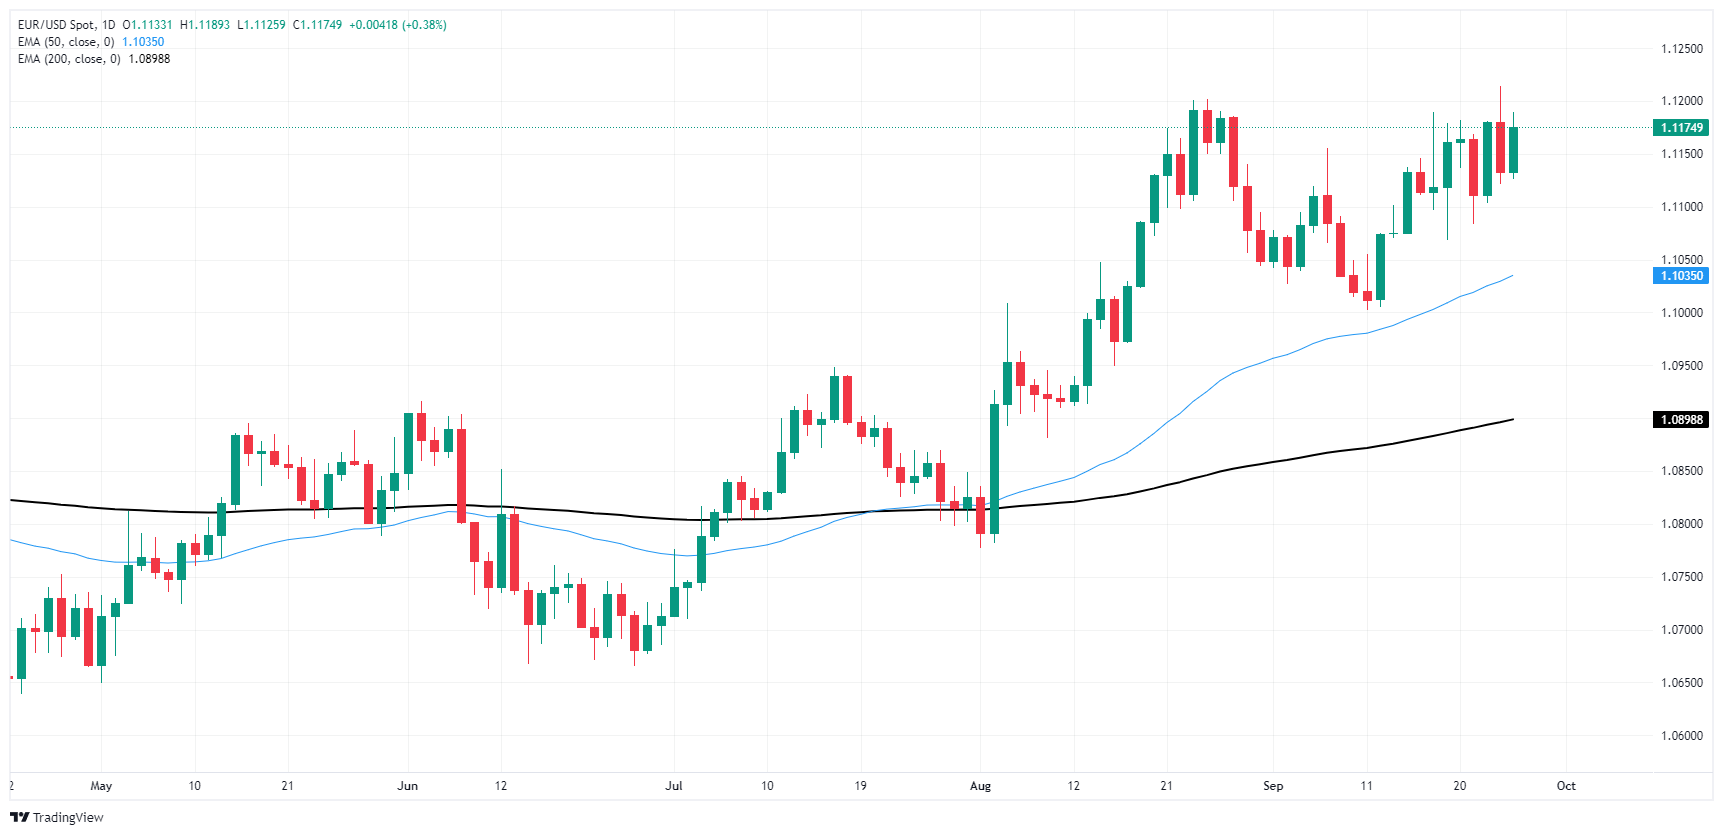
Euro FAQs
The Euro is the currency for the 20 European Union countries that belong to the Eurozone. It is the second most heavily traded currency in the world behind the US Dollar. In 2022, it accounted for 31% of all foreign exchange transactions, with an average daily turnover of over $2.2 trillion a day. EUR/USD is the most heavily traded currency pair in the world, accounting for an estimated 30% off all transactions, followed by EUR/JPY (4%), EUR/GBP (3%) and EUR/AUD (2%).
The European Central Bank (ECB) in Frankfurt, Germany, is the reserve bank for the Eurozone. The ECB sets interest rates and manages monetary policy. The ECB’s primary mandate is to maintain price stability, which means either controlling inflation or stimulating growth. Its primary tool is the raising or lowering of interest rates. Relatively high interest rates – or the expectation of higher rates – will usually benefit the Euro and vice versa. The ECB Governing Council makes monetary policy decisions at meetings held eight times a year. Decisions are made by heads of the Eurozone national banks and six permanent members, including the President of the ECB, Christine Lagarde.
Eurozone inflation data, measured by the Harmonized Index of Consumer Prices (HICP), is an important econometric for the Euro. If inflation rises more than expected, especially if above the ECB’s 2% target, it obliges the ECB to raise interest rates to bring it back under control. Relatively high interest rates compared to its counterparts will usually benefit the Euro, as it makes the region more attractive as a place for global investors to park their money.
Data releases gauge the health of the economy and can impact on the Euro. Indicators such as GDP, Manufacturing and Services PMIs, employment, and consumer sentiment surveys can all influence the direction of the single currency. A strong economy is good for the Euro. Not only does it attract more foreign investment but it may encourage the ECB to put up interest rates, which will directly strengthen the Euro. Otherwise, if economic data is weak, the Euro is likely to fall. Economic data for the four largest economies in the euro area (Germany, France, Italy and Spain) are especially significant, as they account for 75% of the Eurozone’s economy.
Another significant data release for the Euro is the Trade Balance. This indicator measures the difference between what a country earns from its exports and what it spends on imports over a given period. If a country produces highly sought after exports then its currency will gain in value purely from the extra demand created from foreign buyers seeking to purchase these goods. Therefore, a positive net Trade Balance strengthens a currency and vice versa for a negative balance.
Federal Reserve (Fed) Governor Lisa Cook said on Thursday that she endorsed the 50 basis points (bps) interest rate cut last week as a way to address increased "downside risks" to employment, per Reuters.
Key quotes
"I wholeheartedly supported the decision.“
"That decision reflected growing confidence that, with an appropriate recalibration of our policy stance, the solid labor market can be maintained in a context of moderate economic growth and inflation continuing to move sustainably down to our target.”
"In thinking about the path of policy moving forward, I will be looking carefully at incoming data, the evolving outlook, and the balance of risks.”
"As labor demand and supply are now more evenly balanced, it may become more difficult for some individuals to find employment.”
"The return to balance in the labor market between supply and demand, as well as the ongoing return toward our inflation target, reflects the normalization of the economy after the dislocations of the pandemic.”
"This normalization, particularly of inflation, is quite welcome, as a balance between supply and demand is essential for sustaining a prolonged period of labor-market strength."
Market reaction
The US Dollar Index (DXY) is trading 0.02% higher on the day at 100.58, as of writing.
Fed FAQs
Monetary policy in the US is shaped by the Federal Reserve (Fed). The Fed has two mandates: to achieve price stability and foster full employment. Its primary tool to achieve these goals is by adjusting interest rates. When prices are rising too quickly and inflation is above the Fed’s 2% target, it raises interest rates, increasing borrowing costs throughout the economy. This results in a stronger US Dollar (USD) as it makes the US a more attractive place for international investors to park their money. When inflation falls below 2% or the Unemployment Rate is too high, the Fed may lower interest rates to encourage borrowing, which weighs on the Greenback.
The Federal Reserve (Fed) holds eight policy meetings a year, where the Federal Open Market Committee (FOMC) assesses economic conditions and makes monetary policy decisions. The FOMC is attended by twelve Fed officials – the seven members of the Board of Governors, the president of the Federal Reserve Bank of New York, and four of the remaining eleven regional Reserve Bank presidents, who serve one-year terms on a rotating basis.
In extreme situations, the Federal Reserve may resort to a policy named Quantitative Easing (QE). QE is the process by which the Fed substantially increases the flow of credit in a stuck financial system. It is a non-standard policy measure used during crises or when inflation is extremely low. It was the Fed’s weapon of choice during the Great Financial Crisis in 2008. It involves the Fed printing more Dollars and using them to buy high grade bonds from financial institutions. QE usually weakens the US Dollar.
Quantitative tightening (QT) is the reverse process of QE, whereby the Federal Reserve stops buying bonds from financial institutions and does not reinvest the principal from the bonds it holds maturing, to purchase new bonds. It is usually positive for the value of the US Dollar.
- USD/CAD weakens to around 1.3470 in Friday’s early Asian session.
- The US August PCE data will be in the spotlight on Friday.
- The softer US Dollar weighs on the pair, but lower crude oil prices might cap its downside.
The USD/CAD pair edges lower to near 1.3470 during the early Asian session on Friday, pressured by the weaker US Dollar (USD) broadly. Investors await bigger clues about the economy's health after upbeat US economic data on Thursday. The US Personal Consumption Expenditures (PCE) Price Index for August will take center stage on Friday.
With its larger-than-normal reduction last week, the Federal Reserve (Fed) sent a clear message that interest rates are heading considerably lower in the future. This, in turn, exerts some selling pressure on Greenback against the Canadian Dollar (CAD).
Fed Officials penciled in another 50 basis points (bps) rate cuts by the end of the year and another 100 bps reductions by the end of 2025. Nonetheless, the release of US PCE data, the Fed’s preferred price metric, could give them hints about the US central bank’s path ahead. The headline PCE is expected to show an increase of 2.3% YoY in August, while the core PCE is projected to show a rise of 2.7% YoY in the same report. In the case of the hotter-than-expected inflation data, this could help limit the USD’s losses.
On the Loonie front, Bank of Canada (BoC) Governor Tiff Macklem said on Tuesday that it is reasonable to expect more rate cuts as the BoC has made progress in bringing inflation back down to the 2% target. Meanwhile, the fall in crude oil prices could weigh on commodity-linked CAD as Canada is the largest oil exporter to the United States (US), and lower crude oil prices tend to have a negative impact on the CAD value.
Canadian Dollar FAQs
The key factors driving the Canadian Dollar (CAD) are the level of interest rates set by the Bank of Canada (BoC), the price of Oil, Canada’s largest export, the health of its economy, inflation and the Trade Balance, which is the difference between the value of Canada’s exports versus its imports. Other factors include market sentiment – whether investors are taking on more risky assets (risk-on) or seeking safe-havens (risk-off) – with risk-on being CAD-positive. As its largest trading partner, the health of the US economy is also a key factor influencing the Canadian Dollar.
The Bank of Canada (BoC) has a significant influence on the Canadian Dollar by setting the level of interest rates that banks can lend to one another. This influences the level of interest rates for everyone. The main goal of the BoC is to maintain inflation at 1-3% by adjusting interest rates up or down. Relatively higher interest rates tend to be positive for the CAD. The Bank of Canada can also use quantitative easing and tightening to influence credit conditions, with the former CAD-negative and the latter CAD-positive.
The price of Oil is a key factor impacting the value of the Canadian Dollar. Petroleum is Canada’s biggest export, so Oil price tends to have an immediate impact on the CAD value. Generally, if Oil price rises CAD also goes up, as aggregate demand for the currency increases. The opposite is the case if the price of Oil falls. Higher Oil prices also tend to result in a greater likelihood of a positive Trade Balance, which is also supportive of the CAD.
While inflation had always traditionally been thought of as a negative factor for a currency since it lowers the value of money, the opposite has actually been the case in modern times with the relaxation of cross-border capital controls. Higher inflation tends to lead central banks to put up interest rates which attracts more capital inflows from global investors seeking a lucrative place to keep their money. This increases demand for the local currency, which in Canada’s case is the Canadian Dollar.
Macroeconomic data releases gauge the health of the economy and can have an impact on the Canadian Dollar. Indicators such as GDP, Manufacturing and Services PMIs, employment, and consumer sentiment surveys can all influence the direction of the CAD. A strong economy is good for the Canadian Dollar. Not only does it attract more foreign investment but it may encourage the Bank of Canada to put up interest rates, leading to a stronger currency. If economic data is weak, however, the CAD is likely to fall.
- GBP/USD edged into a fresh multi-year high on Thursday.
- Despite a lack of UK data, GBP continues to grind higher.
- Better-than-expected US data keeps Greenback short pressure elevated.
The GBP/USD currency pair reached a 31-month high of 1.3434 on Thursday, marking a significant milestone in its upward trajectory. This surge was primarily driven by a widespread selloff of the US dollar, buoyed by improved economic indicators that alleviated concerns about a potential economic slowdown.
The data docket remains light on the UK side for the remainder of the week, and Cable traders will be forced to sit on their hands and wait for GBP-centric data due next week, starting with UK Gross Domestic Product (GDP) figure slated for Monday.
The Federal Reserve's recent decision to cut interest rates by 50 basis points raised apprehensions in global markets, with some investors fearing that the drastic move was a response to an impending economic downturn in the US. However, Fed Chair Jerome Powell clarified that the rate cut was a proactive measure aimed at supporting the US labor market, rather than a reactive response to recessionary signals.
Positive data on US Durable Goods Orders and weekly Initial Jobless Claims further reinforced the Fed's position, with both indicators surpassing expectations. The narrative of a "soft landing" for the economy remained intact. The upcoming release of the Personal Consumption Expenditure (PCE) inflation data on Friday will serve as a crucial litmus test for evaluating the impact of the recent rate cut by the Fed.
In August, US Durable Goods Orders stagnated at 0.0% month-on-month, falling short of the previous month's significant growth but still outperforming the projected contraction of 2.6%. Additionally, the Initial Jobless Claims for the week ending September 20 showed a decrease to 218K, beating the anticipated 225K and signaling a decline from the revised figure of 222K in the preceding week.
GBP/USD price forecast
The GBP/USD, also known as Cable, has been steadily reaching multi-year highs, and there are few significant technical obstacles in the way for Pound bulls. However, the strong upward momentum has made GBP/USD vulnerable to a possible downward correction as market dynamics come into play. If there is a significant buildup of selling pressure in the current price region, it could easily push the price below the key support level at 1.3100 and towards the 50-day Exponential Moving Average (EMA) at 1.3076.
GBP/USD daily chart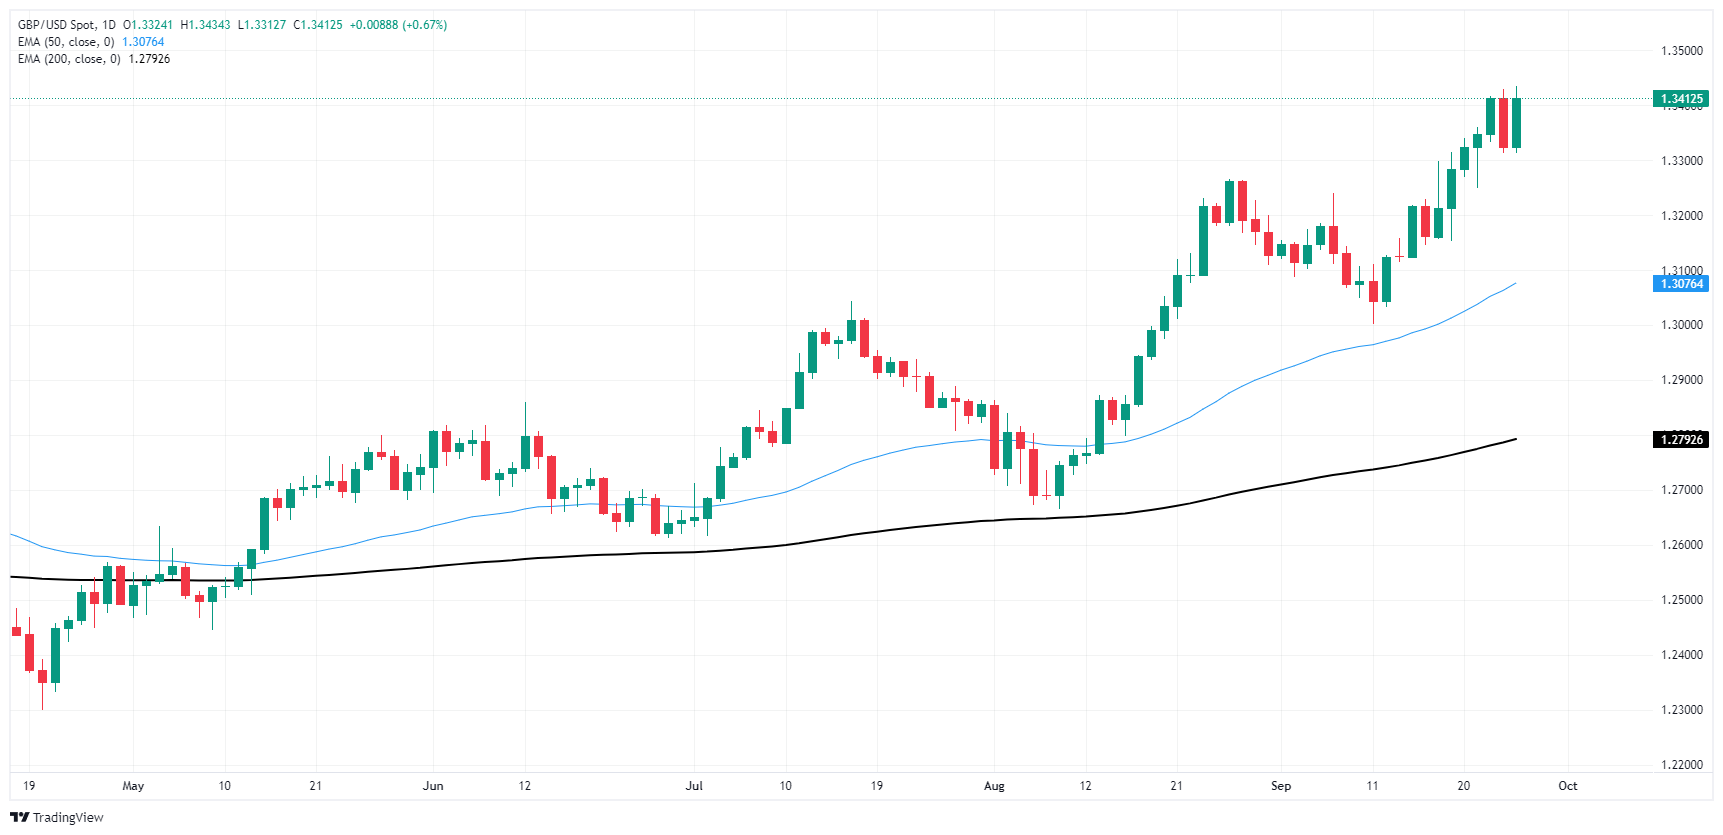
Pound Sterling FAQs
The Pound Sterling (GBP) is the oldest currency in the world (886 AD) and the official currency of the United Kingdom. It is the fourth most traded unit for foreign exchange (FX) in the world, accounting for 12% of all transactions, averaging $630 billion a day, according to 2022 data. Its key trading pairs are GBP/USD, aka ‘Cable’, which accounts for 11% of FX, GBP/JPY, or the ‘Dragon’ as it is known by traders (3%), and EUR/GBP (2%). The Pound Sterling is issued by the Bank of England (BoE).
The single most important factor influencing the value of the Pound Sterling is monetary policy decided by the Bank of England. The BoE bases its decisions on whether it has achieved its primary goal of “price stability” – a steady inflation rate of around 2%. Its primary tool for achieving this is the adjustment of interest rates. When inflation is too high, the BoE will try to rein it in by raising interest rates, making it more expensive for people and businesses to access credit. This is generally positive for GBP, as higher interest rates make the UK a more attractive place for global investors to park their money. When inflation falls too low it is a sign economic growth is slowing. In this scenario, the BoE will consider lowering interest rates to cheapen credit so businesses will borrow more to invest in growth-generating projects.
Data releases gauge the health of the economy and can impact the value of the Pound Sterling. Indicators such as GDP, Manufacturing and Services PMIs, and employment can all influence the direction of the GBP. A strong economy is good for Sterling. Not only does it attract more foreign investment but it may encourage the BoE to put up interest rates, which will directly strengthen GBP. Otherwise, if economic data is weak, the Pound Sterling is likely to fall.
Another significant data release for the Pound Sterling is the Trade Balance. This indicator measures the difference between what a country earns from its exports and what it spends on imports over a given period. If a country produces highly sought-after exports, its currency will benefit purely from the extra demand created from foreign buyers seeking to purchase these goods. Therefore, a positive net Trade Balance strengthens a currency and vice versa for a negative balance.
- EUR/JPY rises to 161.79 after surpassing the 50-DMA, marking its third consecutive day of gains.
- Momentum shows signs of consolidation ahead, with resistance at 162.45/65 and the 200-DMA at 164.10.
- A break below 160.74 could expose the pair to support at 158.99/98, near the Tenkan Sen level.
The EUR/JPY printed solid gains of over 0.40% on Thursday, extending its rally to three consecutive days. Data from the United States (US) improved risk appetite and consequently weighed on the Japanese Yen due to its safe-haven status. At the time of writing, the cross-pair trades at 161.79.
EUR/JPY Price Forecast: Technical outlook
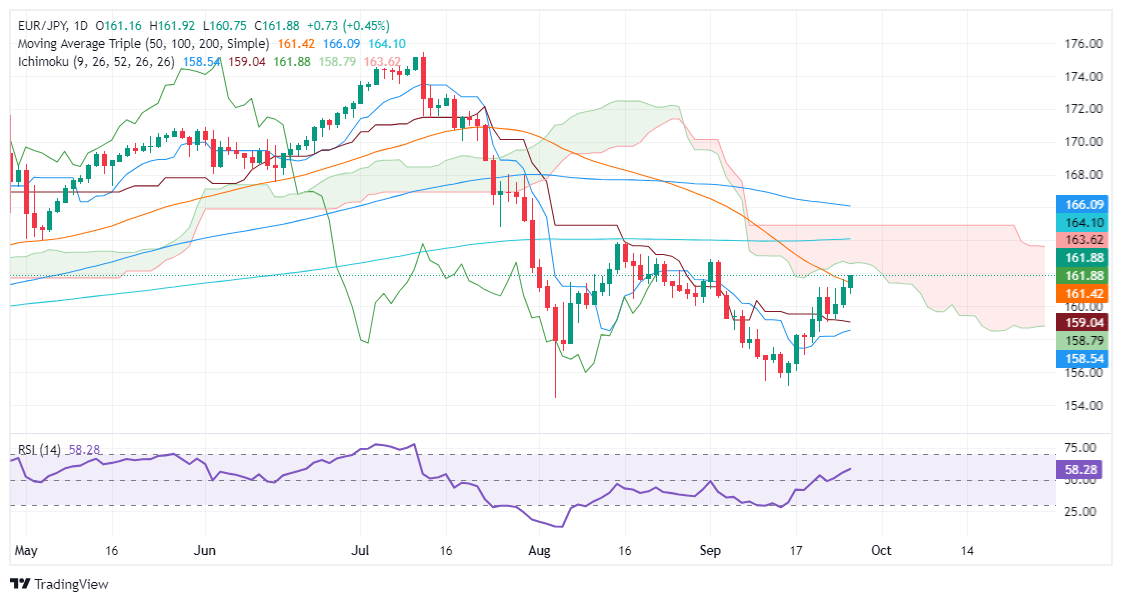
The EUR/JPY uptrend remains intact, although the pair aimed higher to the bottom of the Ichimoku Cloud (Kumo) after surpassing the 50-day moving average (DMA) at 161.19.
Momentum hints that buyers are losing some steam, as depicted by the Relative Strength Index (RSI) slope turning flat, meaning the consolidation lies ahead.
If EUR/JPY clears the bottom of the Kumo at around 162.45/65, the next resistance level would be the Senkou Span B at 163.13, followed by the 200-day moving average (DMA) at 164.10.
Conversely, if EUR/JPY dives below the September 26 low of 160.74, the next support would be the confluence of the September 24 daily low of and the Tenkan Sen at around 158.99/98
EUR/JPY Price Action – Daily Chart
Euro PRICE Today
The table below shows the percentage change of Euro (EUR) against listed major currencies today. Euro was the strongest against the Australian Dollar.
| USD | EUR | GBP | JPY | CAD | AUD | NZD | CHF | |
|---|---|---|---|---|---|---|---|---|
| USD | 0.00% | 0.00% | 0.01% | 0.01% | 0.03% | -0.00% | -0.04% | |
| EUR | -0.00% | -0.01% | 0.00% | -0.03% | 0.03% | -0.02% | -0.04% | |
| GBP | -0.00% | 0.01% | 0.02% | -0.01% | 0.04% | 0.00% | -0.03% | |
| JPY | -0.01% | 0.00% | -0.02% | -0.01% | 0.04% | -0.01% | -0.01% | |
| CAD | -0.01% | 0.03% | 0.00% | 0.00% | 0.00% | 0.00% | -0.04% | |
| AUD | -0.03% | -0.03% | -0.04% | -0.04% | -0.01% | -0.02% | -0.05% | |
| NZD | 0.00% | 0.02% | -0.01% | 0.01% | -0.00% | 0.02% | -0.04% | |
| CHF | 0.04% | 0.04% | 0.03% | 0.01% | 0.04% | 0.05% | 0.04% |
The heat map shows percentage changes of major currencies against each other. The base currency is picked from the left column, while the quote currency is picked from the top row. For example, if you pick the Euro from the left column and move along the horizontal line to the US Dollar, the percentage change displayed in the box will represent EUR (base)/USD (quote).
- The NZD/USD pair recovered on Thursday, settling at 0.6330.
- The RSI and MACD indicators are turning bullish, supporting the prospect of further gains.
- Buyers cleared most of Wednesday’s losses.
On Thursday, the NZD/USD pair recovered from Wednesday's losses, gaining by 0.95% and settling at 0.6330. The pair is moving in a sideways trading pattern, indicating indecision between the bulls and bears. That being said,bulls seem to have an advantage.
The technical indicators suggest that the buying pressure behind NZD/USD is increasing. The Relative Strength Index (RSI) is rising above 50 the Moving Average Convergence Divergence (MACD) histogram prints rising green bars, also giving arguments to the buyers.
NZD/USD daily chart
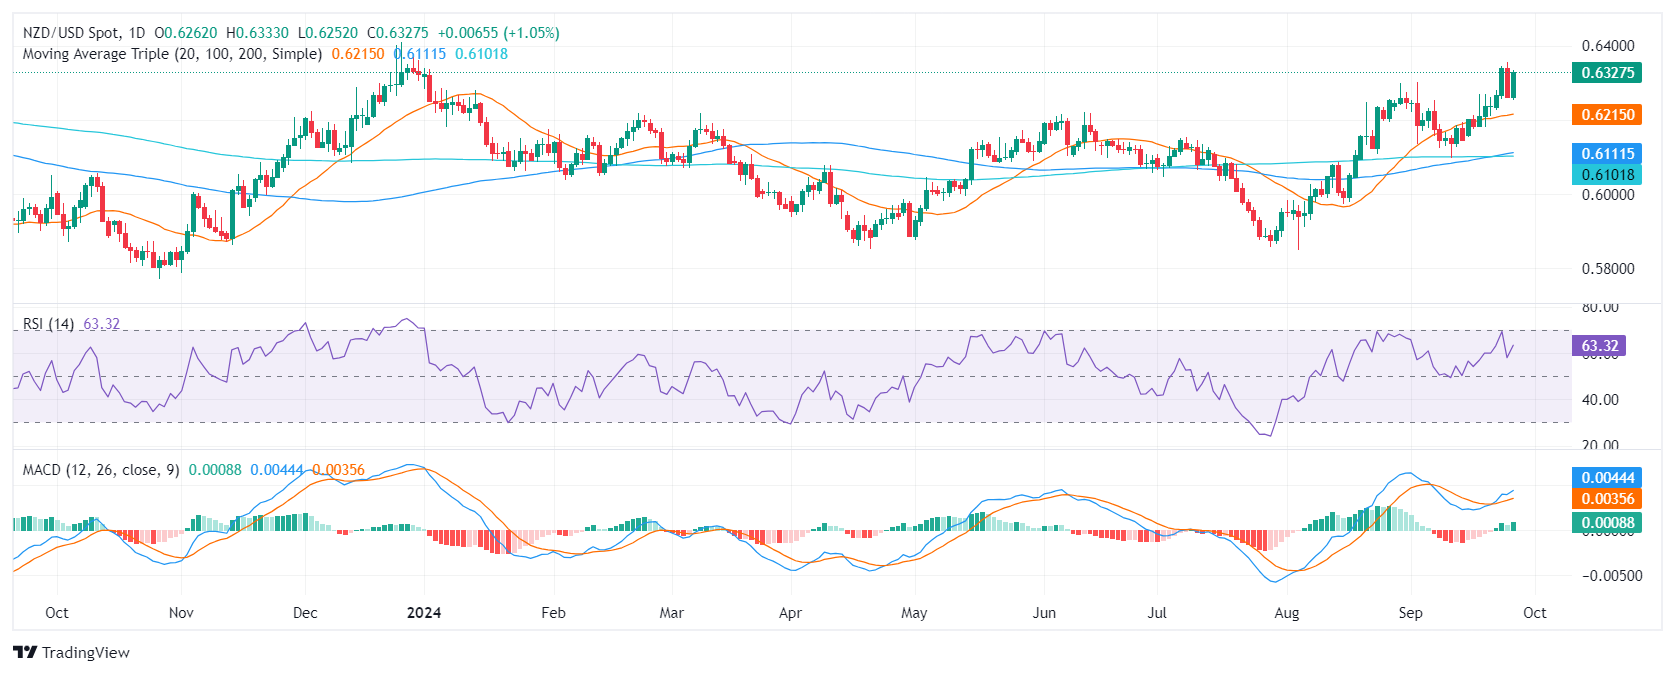
The overall outlook for the NZD/USD is bullish. The pair is trading above its key moving averages, and the technical indicators are regaining strength. Buyers seem to have hit a solid resistance at 0.6350 but seem to be gearing up for a retest. In that sense a break above could pave the way for for upside and the pair could test the 0.6400 level. On the other hand, if the pair runs out of steam, the 0.6300 area can act as a barrier to selling pressure.
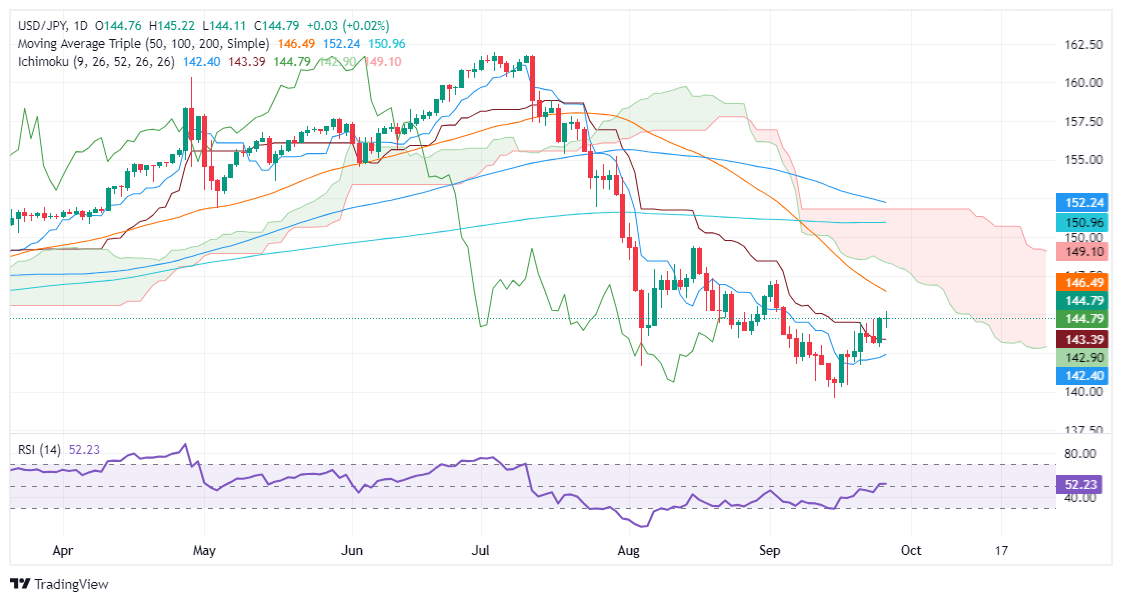
- USD/JPY trades flat at 144.72 after hitting a three-week high of 145.21, as election uncertainty dampens momentum.
- Doji candlestick and flat RSI suggest market indecision, with key resistance at the 50-DMA of 146.49.
- A break below 144.11 could lead to further declines, testing support levels at 143.39 and 142.39.
The USD/JPY remains subdued after seesawing within a 110-pip range, where the pair hit a three-week high of 145.21. Uncertainty around the Japanese election has overshadowed speeches by Bank of Japan (BoJ) officials, who decided to hold rates unchanged last week. At the time of writing, the major trades at 144.72, flat.
USD/JPY Price Forecast: Technical outlook
From a technical standpoint, the downtrend is set to continue. Thursday’s price action forms a ‘doji’, meaning neither buyers nor sellers commit to solid positions. Even the Relative Strength Index (RSI), despite showing bulls in charge, the RSI slope is flat at 51.
If USD/JPY buyers push prices above the September 26 high at 145.21, that could prompt a challenge of the 50-day moving average (DMA) at 146.49 before testing the 147.00 mark. The next resistance would be the bottom of the Ichimoku Cloud (Kumo) at around 148.20-50.
Conversely, if the pair slumps below the September 26 low of 144.11, that will test the Kijun-Sen at 143.39, followed by the Senkou Span A at 142.89. On further weakness, the Tenkan-Sen will be the Bulls' last line of defense at 142.39.
USD/JPY Price Action – Daily Chart
Japanese Yen PRICE Today
The table below shows the percentage change of Japanese Yen (JPY) against listed major currencies today. Japanese Yen was the strongest against the US Dollar.
| USD | EUR | GBP | JPY | CAD | AUD | NZD | CHF | |
|---|---|---|---|---|---|---|---|---|
| USD | -0.38% | -0.65% | 0.01% | -0.06% | -1.00% | -1.00% | -0.51% | |
| EUR | 0.38% | -0.28% | 0.39% | 0.32% | -0.62% | -0.62% | -0.13% | |
| GBP | 0.65% | 0.28% | 0.66% | 0.60% | -0.34% | -0.36% | 0.15% | |
| JPY | -0.01% | -0.39% | -0.66% | -0.06% | -1.02% | -1.02% | -0.53% | |
| CAD | 0.06% | -0.32% | -0.60% | 0.06% | -0.93% | -0.94% | -0.44% | |
| AUD | 1.00% | 0.62% | 0.34% | 1.02% | 0.93% | 0.00% | 0.50% | |
| NZD | 1.00% | 0.62% | 0.36% | 1.02% | 0.94% | -0.00% | 0.50% | |
| CHF | 0.51% | 0.13% | -0.15% | 0.53% | 0.44% | -0.50% | -0.50% |
The heat map shows percentage changes of major currencies against each other. The base currency is picked from the left column, while the quote currency is picked from the top row. For example, if you pick the Japanese Yen from the left column and move along the horizontal line to the US Dollar, the percentage change displayed in the box will represent JPY (base)/USD (quote).
- AUD/USD surges higher amidst positive Australian economic data.
- Monetary policy divergence continues to favor the Aussie.
- Focus shifts to US PCE data, which may influence market expectations for Fed rate cuts in November.
The AUD/USD pair surged higher on Thursday, rising by 0.90% to 0.6890. The Australian Dollar strengthened after the release of positive economic data and the hawkish stance of the Reserve Bank of Australia (RBA) this week. Meanwhile, the US Dollar weakened as markets are hopping for a larger cut by the Federal Reserve (Fed) in November.
Amidst a multifaceted economic landscape in Australia, the Reserve Bank of Australia's (RBA) assertive stance on inflation has led markets to anticipate a modest reduction in interest rates by only 0.25% in 2024.
Daily digest market movers: Australian Dollar rises sharply on RBA's rate hold
- The Aussie advanced significantly against the US Dollar after the RBA kept its interest rates unchanged at 4.35%, but maintained a hawkish message.
- In fact, RBA Governor Michelle Bullock stated that the bank isn’t considering rate cuts.
- Market participants anticipate that the Fed may implement another 50 basis point (bps) interest rate cut in November, following its initial 50 bps reduction to 4.75%-5.00% last week.
- Investors are closely watching the upcoming release of the United States (US) Personal Consumption Expenditure Price Index (PCE) data for August.
- The core PCE inflation data, which is the Fed's preferred inflation gauge, is expected to increase from 2.6% in July to 2.7%.
- A sustained increase in inflation could reinforce expectations for the Fed to reduce interest rates by 50 bps in November, while a stronger-than-expected reading may dampen those expectations.
AUD/USD technical outlook: Aussie regains momentum after Wednesday’s decline
After a decline to around 0.6800, the AUD/USD pair gained momentum, rising to near 0.6900. Indicators including the Relative Strength Index (RSI) and Moving Average Convergence Divergence (MACD) indicators suggest a steady bullish momentum and the pair may be set to retest the area above 0.6900.
If the Aussie resumens its downside it might retest the 0.6800 area which proved to be a strong support. Below, 0.6750 and 0.6730 line up.
Australian Dollar FAQs
One of the most significant factors for the Australian Dollar (AUD) is the level of interest rates set by the Reserve Bank of Australia (RBA). Because Australia is a resource-rich country another key driver is the price of its biggest export, Iron Ore. The health of the Chinese economy, its largest trading partner, is a factor, as well as inflation in Australia, its growth rate and Trade Balance. Market sentiment – whether investors are taking on more risky assets (risk-on) or seeking safe-havens (risk-off) – is also a factor, with risk-on positive for AUD.
The Reserve Bank of Australia (RBA) influences the Australian Dollar (AUD) by setting the level of interest rates that Australian banks can lend to each other. This influences the level of interest rates in the economy as a whole. The main goal of the RBA is to maintain a stable inflation rate of 2-3% by adjusting interest rates up or down. Relatively high interest rates compared to other major central banks support the AUD, and the opposite for relatively low. The RBA can also use quantitative easing and tightening to influence credit conditions, with the former AUD-negative and the latter AUD-positive.
China is Australia’s largest trading partner so the health of the Chinese economy is a major influence on the value of the Australian Dollar (AUD). When the Chinese economy is doing well it purchases more raw materials, goods and services from Australia, lifting demand for the AUD, and pushing up its value. The opposite is the case when the Chinese economy is not growing as fast as expected. Positive or negative surprises in Chinese growth data, therefore, often have a direct impact on the Australian Dollar and its pairs.
Iron Ore is Australia’s largest export, accounting for $118 billion a year according to data from 2021, with China as its primary destination. The price of Iron Ore, therefore, can be a driver of the Australian Dollar. Generally, if the price of Iron Ore rises, AUD also goes up, as aggregate demand for the currency increases. The opposite is the case if the price of Iron Ore falls. Higher Iron Ore prices also tend to result in a greater likelihood of a positive Trade Balance for Australia, which is also positive of the AUD.
The Trade Balance, which is the difference between what a country earns from its exports versus what it pays for its imports, is another factor that can influence the value of the Australian Dollar. If Australia produces highly sought after exports, then its currency will gain in value purely from the surplus demand created from foreign buyers seeking to purchase its exports versus what it spends to purchase imports. Therefore, a positive net Trade Balance strengthens the AUD, with the opposite effect if the Trade Balance is negative.
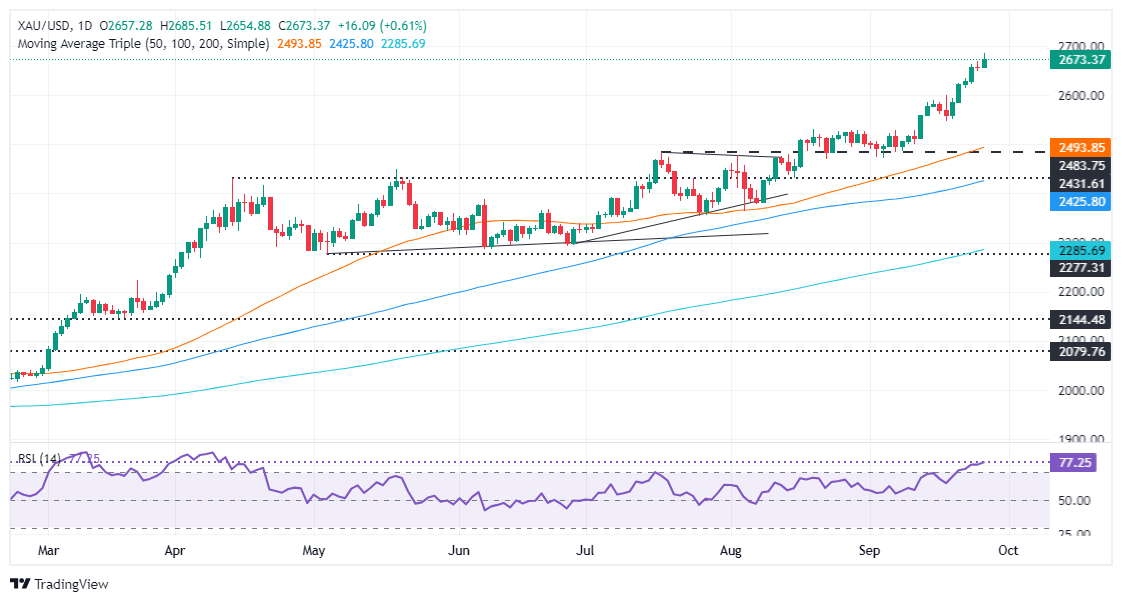
- Gold reaches an all-time high of $2,685, buoyed by China’s stimulus and Middle East tensions.
- Despite strong US Dollar, Fed’s recent 50 bps rate cut fuels bullish sentiment for continued gains in Bullion.
- US economic data points to a ‘soft landing’ scenario, keeping market optimism high for further Gold upside.
Gold hit a new all-time high of $2,685 on Thursday as the Greenback began to recover from earlier losses sustained in the Asian and European sessions. US data portrays a ‘soft landing’ scenario, while China’s stimulus and rising tensions in the Middle East boosted Bullion prices. At the time of writing, the XAU/USD trades at $2,670.
Sentiment remains positive as portrayed by US equities. US Treasury bond yields remained firm, with the 10-year T-note yielding 3.798%, up one basis point (bps), while the Greenback, as portrayed by the US Dollar Index (DXY), is flat at 100.91.
China’s news supports Gold’s upward move. The Politburo remains firm in stabilizing the real estate market, adding more fiscal stimulus after the People’s Bank of China (PBoC) lowered the 7-day reverse repo rates by 20 bps, bringing rates from 1.70% to 1.50%.
This and last week's 50 bps rate cut by the Federal Reserve (Fed) pushed the golden metal to print subsequent record highs as global central banks cut borrowing costs. Even though the US Dollar remained strong, expectations that the Fed would embark on an ‘aggressive’ easing cycle kept bulls riding the trend.
The US economy grew sharply in the second quarter of 2024, according to the Bureau of Economic Analysis (BEA). Meanwhile, the US Department of Labor revealed that fewer people asked for unemployment benefits last week, a sign that the labor market remains strong.
Daily digest market movers: Gold price stays firm amid high US yields
- Missile strikes between Israel and Hezbollah underpin Gold prices.
- The US Gross Domestic Product (GDP) for Q2 in its final reading was 3%, exceeding estimates of 2.9%.
- US Durable Goods Orders in August were unchanged at 0%, exceeding forecasts of a -2.6% contraction, but missed July’s 9.8% increase.
- Initial Jobless Claims for the week ending September 21 were 218K, below estimates for a 225K jump and the previous reading of 222K.
- According to the World Gold Council, global physically-backed Gold ETFs saw modest net inflows of 3 metric tons last week.
- Market participants have fully priced in at least a 25 bps rate cut by the Fed. However, according to the CME FedWatch Tool, the odds of a 50 bps cut have decreased to 51.3%, down from a 60% chance the previous day.
XAU/USD technical outlook: Gold price advances past $2,660
Gold price hit a record high of $2,685 on Thursday, but it has retreated to current spot prices. However, the momentum favors buyers, though the rally seems overextended, as portrayed by the Relative Strength Index (RSI) climbing further to overbought territory, close to testing the extreme levels above 80.
If XAU/USD extends its rally past the current year-to-date (YTD) peak of $2,685, the next resistance would be the $2,700 mark. Up next would be the $2,750 level, followed by $2,800.
On the flip side, if XAU/USD drops below $2,650, look for a test of the September 18 daily high at $2,600. The following key support levels to test will be the September 18 low of $2,546, followed by the 50-day Simple Moving Average (SMA) at $2,488.
Gold FAQs
Gold has played a key role in human’s history as it has been widely used as a store of value and medium of exchange. Currently, apart from its shine and usage for jewelry, the precious metal is widely seen as a safe-haven asset, meaning that it is considered a good investment during turbulent times. Gold is also widely seen as a hedge against inflation and against depreciating currencies as it doesn’t rely on any specific issuer or government.
Central banks are the biggest Gold holders. In their aim to support their currencies in turbulent times, central banks tend to diversify their reserves and buy Gold to improve the perceived strength of the economy and the currency. High Gold reserves can be a source of trust for a country’s solvency. Central banks added 1,136 tonnes of Gold worth around $70 billion to their reserves in 2022, according to data from the World Gold Council. This is the highest yearly purchase since records began. Central banks from emerging economies such as China, India and Turkey are quickly increasing their Gold reserves.
Gold has an inverse correlation with the US Dollar and US Treasuries, which are both major reserve and safe-haven assets. When the Dollar depreciates, Gold tends to rise, enabling investors and central banks to diversify their assets in turbulent times. Gold is also inversely correlated with risk assets. A rally in the stock market tends to weaken Gold price, while sell-offs in riskier markets tend to favor the precious metal.
The price can move due to a wide range of factors. Geopolitical instability or fears of a deep recession can quickly make Gold price escalate due to its safe-haven status. As a yield-less asset, Gold tends to rise with lower interest rates, while higher cost of money usually weighs down on the yellow metal. Still, most moves depend on how the US Dollar (USD) behaves as the asset is priced in dollars (XAU/USD). A strong Dollar tends to keep the price of Gold controlled, whereas a weaker Dollar is likely to push Gold prices up.
The Greenback navigated quite a bearish session on Thursday, giving away a big chunk of Wednesday’s gains despite higher yields and amidst a persistently firm sentiment in the risk-associated universe.
Here is what you need to know on Friday, September 27:
The US Dollar Index (DXY) dropped markedly and revisited the a100.50 region in a context favourable to the risk-related galaxy. The PCE data will gather all the attention seconded by the final print of the Michigan Consumer Sentiment, Personal Income and Personal Spending.
EUR/USD managed to regain some composure and faded most of Wednesday’s steep retracement, revisiting the 1.1190 zone. The German labour market report takes centre stage, along with the final Consumer Confidence, Consumer Inflation Expectation and Economic Sentiment. In addition, the ECB’s Cipollone and Lane are due to speak.
GBP/USD reclaimed the 1.3400 barrier and above and clinched fresh yearly peaks on the back of the better tone in the risk-associated space. The next important data release across the Channel will be the GDP figures on September 30 along with Mortgage Approvals.
USD/JPY rose to three-week highs north of the 145.00 mark before giving away most of those gains towards the end of the day. Inflation figures in Tokyo are due along with weekly Foreign Bond Investment figures and the final Coincident Index and Leading Economic Index.
AUD/USD rose markedly and flirted once again with the key 0.6900 barrier on the back of news of fresh stimulus in China and the vacillating tone in the greenback. Next on tap in Oz will be the Housing Credit figures, and Private Sector Credit.
Another negative day saw prices of WTI tumble below the $67.00 mark per barrel to clinch new two-week lows on the back of OPEC+ plans to hike oil output.
Gold prices maintained their uptrend well in place and clocked an all-time high near the $2,690 mark per ounce troy despite higher US yields. Silver followed suit and climbed to the $32.70 zone per ounce for the first time since December 2012.
- Durable Goods Orders remained almost flat in August.
- US GDP grew at an annual rate of 3.0% in the second quarter of 2024.
- Initial Jobless Claims in the US fell to 218K in the week ending September 21.
The US Dollar Index (DXY), which measures the value of the USD against a basket of six currencies, is flat after a muted market reaction to a slew of robust US economic data. The DXY is trading at 100.88 at the time of writing.
Economic data this week showed evidence of resilience in the US economy. To add to that, the Fed has already stated that its response will depend on the interplay between these contrasting signals, balancing the need to address potential risks while ensuring the ongoing health of the economy.
Daily digest market movers: US Dollar sees losses after data points, Fed speakers
- New Orders for US manufactured durable goods remained virtually unchanged in August, rising by a marginal $0.1 billion to $289.7 billion, marking the sixth increase in the last seven months.
- Excluding transportation, New Orders increased by 0.5%, driven by a 1.9% rise in electrical equipment, appliances, and components. Excluding defense, new orders declined by 0.2%.
- Gross Domestic Product (GDP) in the US grew at an annual rate of 3.0% in the second quarter of 2024, in line with the initial estimate.
- Initial Jobless Claims in the US fell to 218K in the week ending September 21, below both the consensus estimate of 225K and the previous week's revised figure of 222K.
- The data supports the notion that the economy holds steady with no need of aggressive easing.
- In the meantime, Fed speakers are trying to push more dovish rhetoric.
- Atlanta Fed President Raphael Bostic highlighted that a 50-basis-point cut puts the central bank in a stronger position to handle economic uncertainties.
- Similarly, Minneapolis Fed President Neel Kashkari pointed out that a larger cut provides the Fed with more aggressive tools if inflation continues to ease.
- Chicago Fed President Austan Goolsbee echoed this sentiment, noting that a significant cut now gives the Fed greater room to adjust if economic conditions worsen.
- Fed Governor Michele Bowman dissented, favoring a more cautious 25-basis-point reduction, reflecting concerns about moving too aggressively.
DXY technical outlook: DXY momentum reverses with continued bearish dominance
Technical analysis of the DXY index reveals that the Relative Strength Index (RSI) and Moving Average Convergence Divergence (MACD) indicators suggest bearish momentum, with the RSI remaining in negative territory and the MACD printing flat green bars. This indicates weak buying pressure and suggests a continuation of bearish dominance.
Additionally, the strong resistance level at 101.00 limits the upside potential for the US Dollar. Key support levels include 100.50, 100.30 and 100.00, while resistance levels are located at 101.00, 101.30 and 101.60.
Australian Dollar FAQs
One of the most significant factors for the Australian Dollar (AUD) is the level of interest rates set by the Reserve Bank of Australia (RBA). Because Australia is a resource-rich country another key driver is the price of its biggest export, Iron Ore. The health of the Chinese economy, its largest trading partner, is a factor, as well as inflation in Australia, its growth rate and Trade Balance. Market sentiment – whether investors are taking on more risky assets (risk-on) or seeking safe-havens (risk-off) – is also a factor, with risk-on positive for AUD.
The Reserve Bank of Australia (RBA) influences the Australian Dollar (AUD) by setting the level of interest rates that Australian banks can lend to each other. This influences the level of interest rates in the economy as a whole. The main goal of the RBA is to maintain a stable inflation rate of 2-3% by adjusting interest rates up or down. Relatively high interest rates compared to other major central banks support the AUD, and the opposite for relatively low. The RBA can also use quantitative easing and tightening to influence credit conditions, with the former AUD-negative and the latter AUD-positive.
China is Australia’s largest trading partner so the health of the Chinese economy is a major influence on the value of the Australian Dollar (AUD). When the Chinese economy is doing well it purchases more raw materials, goods and services from Australia, lifting demand for the AUD, and pushing up its value. The opposite is the case when the Chinese economy is not growing as fast as expected. Positive or negative surprises in Chinese growth data, therefore, often have a direct impact on the Australian Dollar and its pairs.
Iron Ore is Australia’s largest export, accounting for $118 billion a year according to data from 2021, with China as its primary destination. The price of Iron Ore, therefore, can be a driver of the Australian Dollar. Generally, if the price of Iron Ore rises, AUD also goes up, as aggregate demand for the currency increases. The opposite is the case if the price of Iron Ore falls. Higher Iron Ore prices also tend to result in a greater likelihood of a positive Trade Balance for Australia, which is also positive of the AUD.
The Trade Balance, which is the difference between what a country earns from its exports versus what it pays for its imports, is another factor that can influence the value of the Australian Dollar. If Australia produces highly sought after exports, then its currency will gain in value purely from the surplus demand created from foreign buyers seeking to purchase its exports versus what it spends to purchase imports. Therefore, a positive net Trade Balance strengthens the AUD, with the opposite effect if the Trade Balance is negative.
- The Dow Jones rallied 200 points on Thursday as investors recover footing.
- US data came in broadly better than expected, easing recession fears.
- Despite a litany of Fed speakers, almost none addressed monetary policy.
The Dow Jones Industrial Average rebounded around 200 points on Thursday, with investors reinvigorated after US economic data eased rising fears of an economic slowdown. A better-than-expected Durable Goods Orders print has assuaged fears that the Federal Reserve (Fed) might have aggressively cut rates last week in response to a deteriorating economic outlook. However, investors will still be keeping a close eye on monthly jobs report figures in the coming weeks.
US Durable Goods Orders held flat at 0.0% in August, well below the previous month's revised 9.9%, but still beat the forecast of a 2.6% contraction. Initial Jobless Claims for the week ended September 20 also beat forecasts, printing at 218K versus the expected 225K and easing down from the previous week's revised 222K.
The recent 50 bps rate cut by the Federal Reserve (Fed) has caused some concerns in global markets. Some investors are worried that the large rate cut might be a response to a potential economic slowdown in the US. However, Fed Chair Jerome Powell stated last week that the rate cut was not a hasty reaction to signs of a recession, but rather a proactive measure to support the US labor market.
US Durable Goods Orders and week-on-week Initial Jobless Claims helped to bolster the Fed head's case, with both figures printing better than expected and the "soft landing" economic rhetoric holding steady. However, Friday's Personal Consumption Expenditure (PCE) inflation print will draw plenty of attention, and will be the real test of last week's Fed rate cut.
Dow Jones news
The Dow Jones is tilted firmly into the bullish side on Thursday, with over two-thirds of the equity index firmly planted in the green. Caterpillar (CAT) is trading firmly higher on the day, rising 3.3% near $391 per share following reports that China has unveiled another massive stimulus package meant to reinvigorate the Chinese housing and construction industries, a move that Caterpillar is widely expected to benefit from.
Dow Jones price forecast
Despite Thursday’s bullish tilt, the Dow Jones is struggling to make headway after the midweek’s bearish pullback. Still, price action is within arm’s reach of recent all-time highs, and bidders will have their sights set on the next leg up.
Dow Jones buyers have stubbornly staked their claim on the 42,000 handle, shrugging off signs of overbought conditions. On the low side, sellers will be looking to drag the equity board back down toward the 50-day Exponential Moving Average (EMA) near 40,870.
Dow Jones daily chart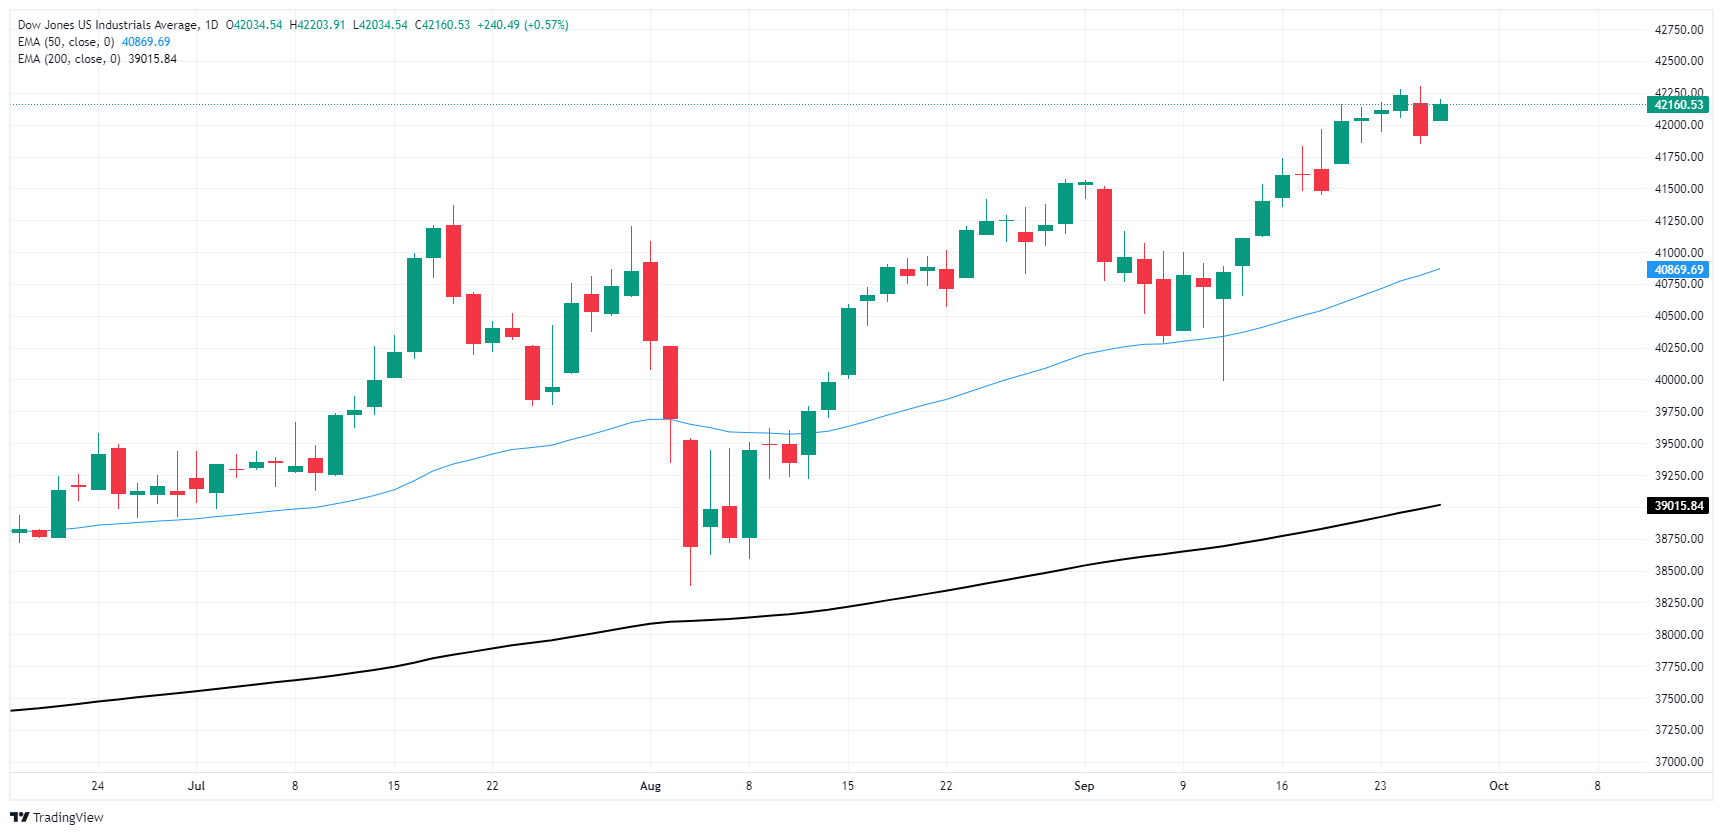
Dow Jones FAQs
The Dow Jones Industrial Average, one of the oldest stock market indices in the world, is compiled of the 30 most traded stocks in the US. The index is price-weighted rather than weighted by capitalization. It is calculated by summing the prices of the constituent stocks and dividing them by a factor, currently 0.152. The index was founded by Charles Dow, who also founded the Wall Street Journal. In later years it has been criticized for not being broadly representative enough because it only tracks 30 conglomerates, unlike broader indices such as the S&P 500.
Many different factors drive the Dow Jones Industrial Average (DJIA). The aggregate performance of the component companies revealed in quarterly company earnings reports is the main one. US and global macroeconomic data also contributes as it impacts on investor sentiment. The level of interest rates, set by the Federal Reserve (Fed), also influences the DJIA as it affects the cost of credit, on which many corporations are heavily reliant. Therefore, inflation can be a major driver as well as other metrics which impact the Fed decisions.
Dow Theory is a method for identifying the primary trend of the stock market developed by Charles Dow. A key step is to compare the direction of the Dow Jones Industrial Average (DJIA) and the Dow Jones Transportation Average (DJTA) and only follow trends where both are moving in the same direction. Volume is a confirmatory criteria. The theory uses elements of peak and trough analysis. Dow’s theory posits three trend phases: accumulation, when smart money starts buying or selling; public participation, when the wider public joins in; and distribution, when the smart money exits.
There are a number of ways to trade the DJIA. One is to use ETFs which allow investors to trade the DJIA as a single security, rather than having to buy shares in all 30 constituent companies. A leading example is the SPDR Dow Jones Industrial Average ETF (DIA). DJIA futures contracts enable traders to speculate on the future value of the index and Options provide the right, but not the obligation, to buy or sell the index at a predetermined price in the future. Mutual funds enable investors to buy a share of a diversified portfolio of DJIA stocks thus providing exposure to the overall index.
- GBP/USD got pushed into another multi-year high on Thursday.
- Broad-market Greenback weakness has bolstered Cable further.
- The Pound Sterling rally is continuing unabated despite a lack of UK data.
GBP/USD clipped another multi-year peak on Thursday, hitting a 31-month high bid 1.3434 as Cable gets pushed into the high end by broad-market Greenback selling. Risk appetite has swung back into the high end on the back of better-than-expected US economic figures, easing investor concerns of a potential economic slowdown.
The Federal Reserve's (Fed) recent 50 bps rate trim sparked an undercurrent of concern in global markets, with some investors spooked by the possibility that the Fed's jumbo rate cut might have been in response to a looming economic slowdown with the US. Fed Chair Jerome Powell insisted last week that the Fed's double cut was not a rapid response to potential recession data, but rather a pre-emptive move to help shore up the US labor market.
US Durable Goods Orders and week-on-week Initial Jobless Claims helped to bolster the Fed head's case, with both figure printing better than expected and the "soft landing" economic rhetoric holding steady. However, Friday's Personal Consumption Expenditure (PCE) inflation print will draw plenty of attention, and will be the real test of last week's Fed rate cut.
US Durable Goods Orders in August printed a flat 0.0% MoM, well below the previous month's revised 9.9%, but still beat the forecast of a 2.6% contraction. Initial Jobless Claims for the week ended September 20 also beat forecasts, printing at 218K versus the expected 225K and easing down from the previous week's revised 222K.
GBP/USD price forecast
With Cable continuing to grind through multi-year highs, little relevant technical resistance lies in the way of Pound bulls. However, an extremely one-sided push into the high end has left GBP/USD price action exposed to a potential downside snap as market velocity takes hold. A buildup of short pressure at the current region could easily shoot bids back below the 1.3100 handle and into the 50-day Exponential Moving Average (EMA) at 1.3076.
GBP/USD daily chart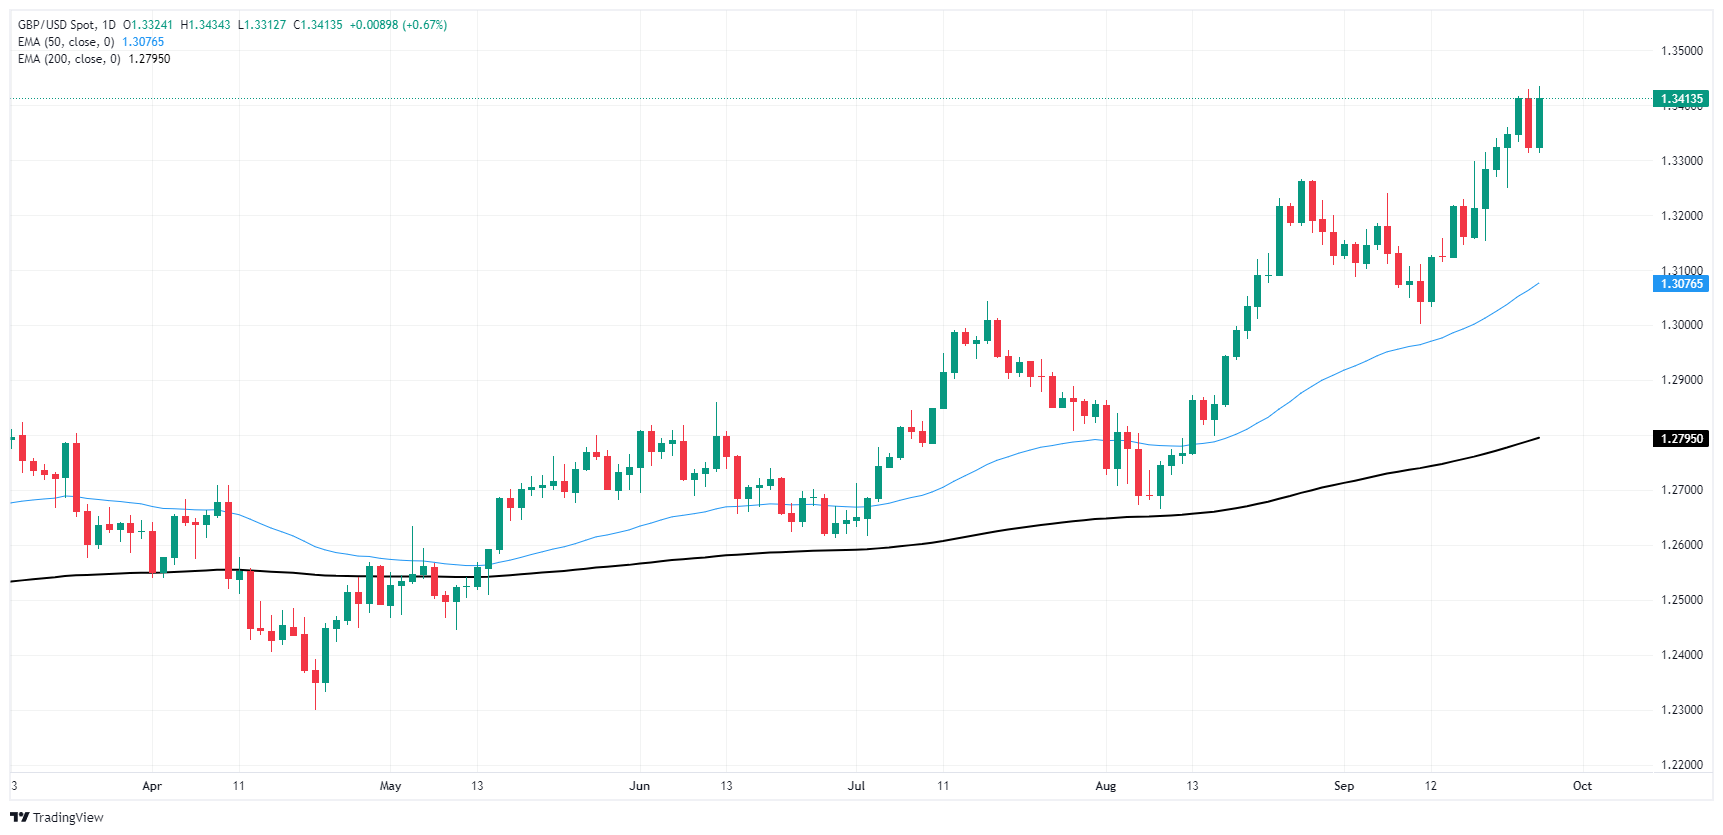
Pound Sterling FAQs
The Pound Sterling (GBP) is the oldest currency in the world (886 AD) and the official currency of the United Kingdom. It is the fourth most traded unit for foreign exchange (FX) in the world, accounting for 12% of all transactions, averaging $630 billion a day, according to 2022 data. Its key trading pairs are GBP/USD, aka ‘Cable’, which accounts for 11% of FX, GBP/JPY, or the ‘Dragon’ as it is known by traders (3%), and EUR/GBP (2%). The Pound Sterling is issued by the Bank of England (BoE).
The single most important factor influencing the value of the Pound Sterling is monetary policy decided by the Bank of England. The BoE bases its decisions on whether it has achieved its primary goal of “price stability” – a steady inflation rate of around 2%. Its primary tool for achieving this is the adjustment of interest rates. When inflation is too high, the BoE will try to rein it in by raising interest rates, making it more expensive for people and businesses to access credit. This is generally positive for GBP, as higher interest rates make the UK a more attractive place for global investors to park their money. When inflation falls too low it is a sign economic growth is slowing. In this scenario, the BoE will consider lowering interest rates to cheapen credit so businesses will borrow more to invest in growth-generating projects.
Data releases gauge the health of the economy and can impact the value of the Pound Sterling. Indicators such as GDP, Manufacturing and Services PMIs, and employment can all influence the direction of the GBP. A strong economy is good for Sterling. Not only does it attract more foreign investment but it may encourage the BoE to put up interest rates, which will directly strengthen GBP. Otherwise, if economic data is weak, the Pound Sterling is likely to fall.
Another significant data release for the Pound Sterling is the Trade Balance. This indicator measures the difference between what a country earns from its exports and what it spends on imports over a given period. If a country produces highly sought-after exports, its currency will benefit purely from the extra demand created from foreign buyers seeking to purchase these goods. Therefore, a positive net Trade Balance strengthens a currency and vice versa for a negative balance.
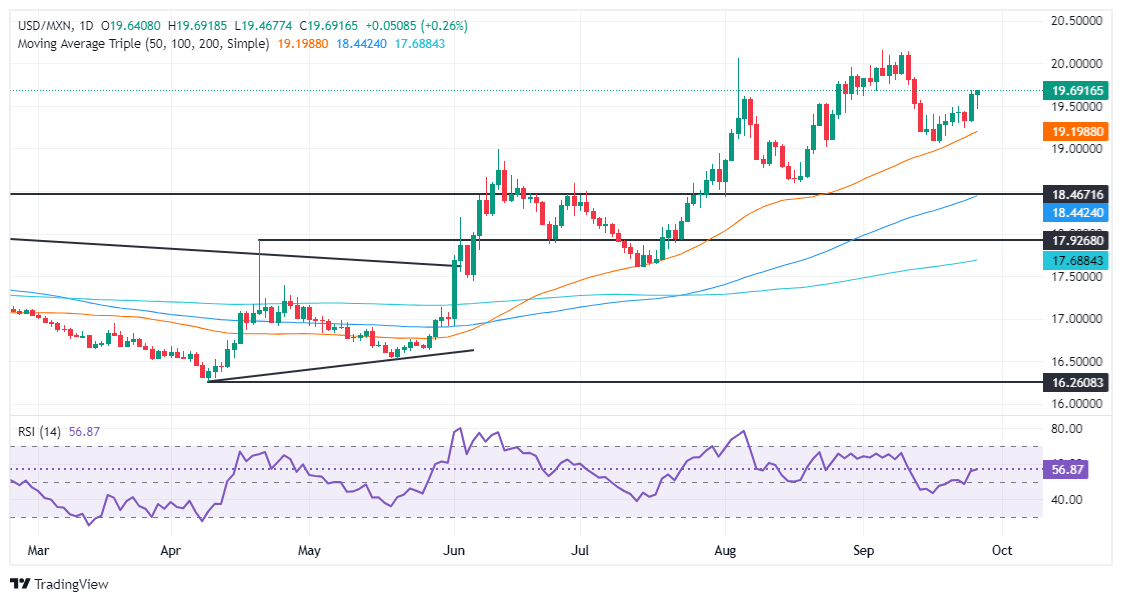
- Mexican Peso is virtually unchanged after hitting a daily high of 19.46.
- Banxico expected to cut rates by 25 bps, but a larger cut could push USD/MXN toward the 20.00 level.
- Mexico's inflation continues to ease, boosting hopes for further rate cuts to stimulate the economy.
The Mexican Peso recovered slightly against the US Dollar on Thursday after data from the United States (US) suggested the economy fares well despite decelerating. Traders' eyes are on the Bank of Mexico (Banxico) monetary policy decision at around 19:00 GMT. The USD/MXN trades at 19.64, virtually unchanged.
Mexico’s economic docket remains absent, though mixed Retail Sales and Economic Activity figures could prompt Banxico to lower rates to stimulate the economy, though it isn’t in the Mexican central bank's mandate. Furthermore, Tuesday’s inflation report was positive, with the headline and underlying readings continuing to slow down in July.
In the last meeting, Banxico’s Governing Board decided to lower interest rates by 25 basis points (bps) from 11.00% to 10.75% in a 3-2 vote split. Governor Victoria Rodriguez and Deputy Governors Galia Borja and Omar Mejia supported a cut. At the same time, Deputy Governors Irene Espinosa and Jonathan Heath favored a pause on its easing cycle.
The question is: How much would Banxico ease policy after the Federal Reserve (Fed) slashed rates by 50 basis points? In the latest Bloomberg survey, 20 of 25 analysts had priced in a 0.25% cut, but four expect a 0.50% cut while one expects the board to hold rates unchanged.
A higher-than-expected rate cut could sponsor a leg-up in the USD/MXN toward the psychological 20.00 figure. Conversely, if Banxico maintains the status quo, it could be positive for the Peso, which could test the 19.50 figure and below.
Across the south of the border, the US schedule revealed final Gross Domestic Product (GDP) figures for Q2 2024, which were better than expected, while jobs data showed that the number of Americans filing for unemployment benefits was lower than anticipated and also below the previous number.
Meanwhile, Fed speakers had crossed the newswires but failed to comment on monetary policy.
Daily digest market movers: Mexican Peso stays firm amid lack of catalysts
- Mexican political turmoil eases as market participants prepare for the change of president on October 1, a bank holiday in Mexico. President-Elect Claudia Sheinbaum’s speech will be watched for hints about her economic plan.
- USD/MXN whipsawed and erased earlier losses, boosted by the buck’s recovery.
- Banxico is expected to lower borrowing costs by 175 bps toward the end of 2025, according to the swaps markets.
- US Dollar Index (DXY), which tracks the buck’s performance against a basket of six peers, is virtually unchanged at 100.90.
- Market participants have fully priced in at least a 25 bps rate cut by the Fed. However, the odds for 50 bps of easing are 51.3%, lower than the 60% chance a day ago, according to the CME FedWatch Tool.
USD/MXN technical analysis: Mexican Peso hovers at around 19.60
The uptrend remains in place, with USD/MXN eyeing further upside, which could happen if they push the spot price above the current weekly high of 19.68, opening the door to challenge the September 12 peak at 19.84 ahead of the psychological 20.00 figure. Momentum favors further upside as the Relative Strength Index (RSI) is bullish.
Failure to conquer 19.68 could pave the way for lower prices. The first support would be the 19.50 mark, followed by the September 24 swing low of 19.23, before the pair moves toward the September 18 low of 19.06. Once those levels are surpassed, the 19.00 figure emerges as the next line of defense.
Mexican Peso FAQs
The Mexican Peso (MXN) is the most traded currency among its Latin American peers. Its value is broadly determined by the performance of the Mexican economy, the country’s central bank’s policy, the amount of foreign investment in the country and even the levels of remittances sent by Mexicans who live abroad, particularly in the United States. Geopolitical trends can also move MXN: for example, the process of nearshoring – or the decision by some firms to relocate manufacturing capacity and supply chains closer to their home countries – is also seen as a catalyst for the Mexican currency as the country is considered a key manufacturing hub in the American continent. Another catalyst for MXN is Oil prices as Mexico is a key exporter of the commodity.
The main objective of Mexico’s central bank, also known as Banxico, is to maintain inflation at low and stable levels (at or close to its target of 3%, the midpoint in a tolerance band of between 2% and 4%). To this end, the bank sets an appropriate level of interest rates. When inflation is too high, Banxico will attempt to tame it by raising interest rates, making it more expensive for households and businesses to borrow money, thus cooling demand and the overall economy. Higher interest rates are generally positive for the Mexican Peso (MXN) as they lead to higher yields, making the country a more attractive place for investors. On the contrary, lower interest rates tend to weaken MXN.
Macroeconomic data releases are key to assess the state of the economy and can have an impact on the Mexican Peso (MXN) valuation. A strong Mexican economy, based on high economic growth, low unemployment and high confidence is good for MXN. Not only does it attract more foreign investment but it may encourage the Bank of Mexico (Banxico) to increase interest rates, particularly if this strength comes together with elevated inflation. However, if economic data is weak, MXN is likely to depreciate.
As an emerging-market currency, the Mexican Peso (MXN) tends to strive during risk-on periods, or when investors perceive that broader market risks are low and thus are eager to engage with investments that carry a higher risk. Conversely, MXN tends to weaken at times of market turbulence or economic uncertainty as investors tend to sell higher-risk assets and flee to the more-stable safe havens.
- The EUR/GBP has steadily declined over the past trading days.
- The RSI and MACD are both suggesting that selling pressure is rising.
- Oversold conditions might prompt an upward correction.
The EUR/GBP pair has been in a steady decline over the past trading days and fell to 0.8330 on Thursday with 0.30% losses.
The Relative Strength Index (RSI) is suggesting that selling pressure is rising, with the RSI value at 33, in the near oversold area, and a declining slope. The Moving Average Convergence Divergence (MACD) also suggests that selling pressure is rising, with the MACD histogram red and rising.
EUR/GBP Daily Chart
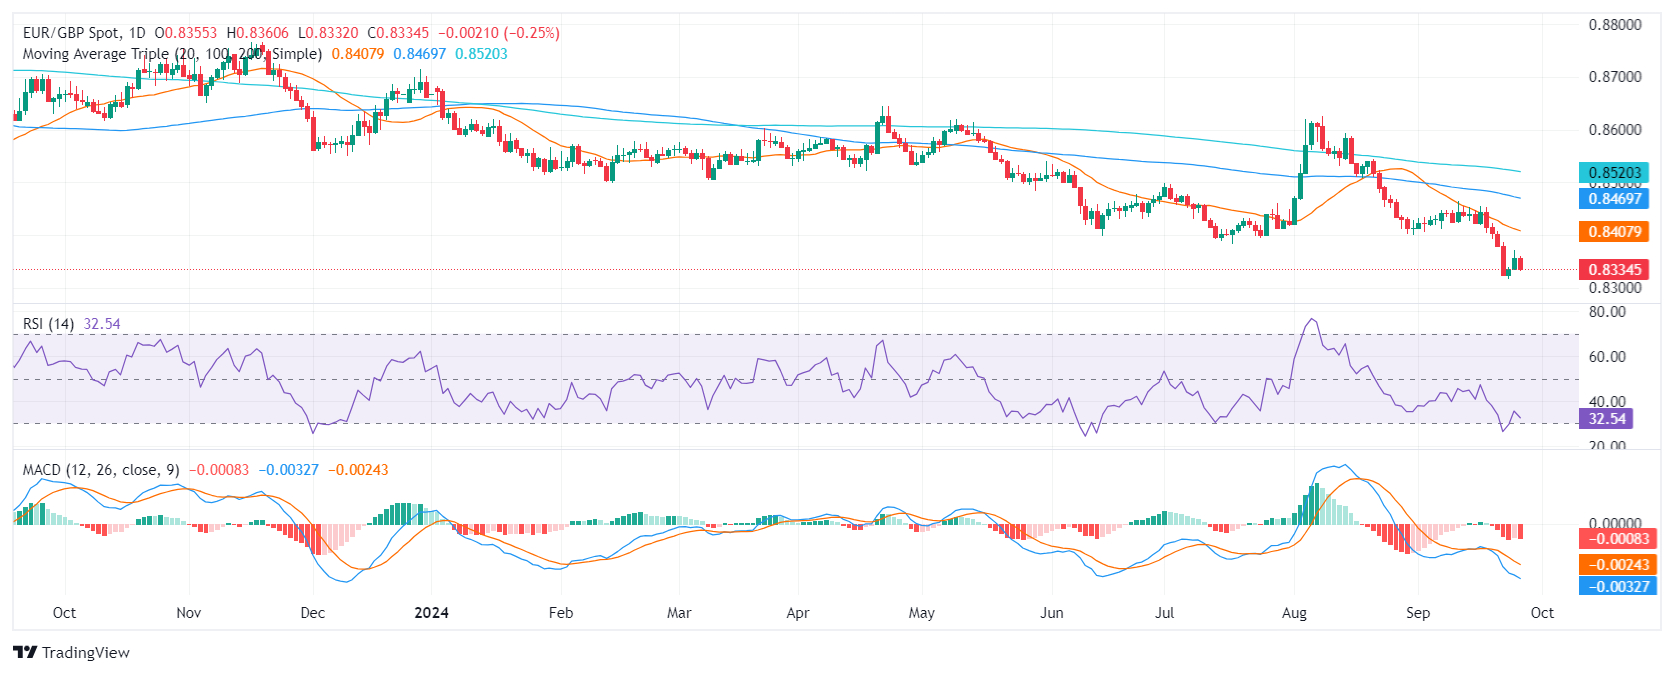
Based on the current technical picture, the EUR/GBP pair is likely to remain under pressure in the near term. The bears seem to be in control, and the bulls need to break above the 0.8400 resistance level to regain control. If the bears manage to break below the 0.8300 support level, the pair could fall further. However, with indicators flashing oversold signals, traders shouldn't take off the table an upward correction.
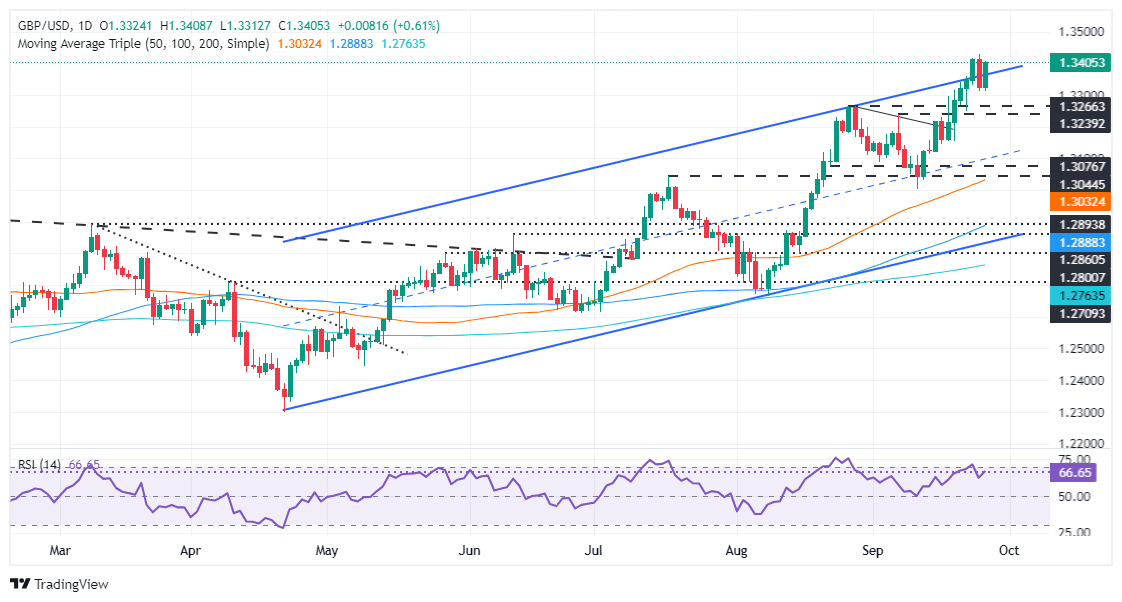
- GBP/USD gains 0.59%, trading at 1.3394 after rebounding from a daily low of 1.3312.
- Break above 1.3400 could push the pair towards the YTD high of 1.3437 and further resistance at 1.3500.
- Failure to reclaim 1.3400 may lead to testing the September 25 low of 1.3312.
The Pound Sterling climbs over 0.59% against the Greenback, boosted by an improvement in risk appetite, sponsored by China’s stimulus to its economy and increasing odds for a ‘soft landing’ in the US after revealing robust economic data. The GBP/USD trades at 1.3394 after bouncing off daily lows of 1.3312.
GBP/USD Price Forecast: Technical outlook
The GBP/USD resumed its uptrend after diving below the top trendline of an ascending channel, which, in the short term, was a sign of sellers’ strength. However, bulls emerged around the week's lows and lifted the exchange rate. Still, it remains shy of the crucial 1.3400 figure, today’s high.
If GBP/USD reclaims 1.3400, the next resistance will be the 1.3429-1.3437 area, the confluence of the current year-to-date (YTD) high and March 1, 2022 daily high, followed by 1.3450. On further strength, 1.3500 will emerge as the next key resistance level.
Conversely, GBP/USD failure at 1.3400 will sponsor a test of the September 25 daily low of 1.3312. A decisive break will expose the August 27 high turned support at 1.3266, followed by the September 23 low of 1.3248.
GBP/USD Price Action – Daily Chart
British Pound PRICE Today
The table below shows the percentage change of British Pound (GBP) against listed major currencies today. British Pound was the strongest against the Japanese Yen.
| USD | EUR | GBP | JPY | CAD | AUD | NZD | CHF | |
|---|---|---|---|---|---|---|---|---|
| USD | -0.36% | -0.61% | 0.04% | -0.06% | -0.93% | -0.89% | -0.40% | |
| EUR | 0.36% | -0.26% | 0.39% | 0.30% | -0.57% | -0.53% | -0.04% | |
| GBP | 0.61% | 0.26% | 0.64% | 0.56% | -0.31% | -0.29% | 0.23% | |
| JPY | -0.04% | -0.39% | -0.64% | -0.08% | -0.97% | -0.95% | -0.44% | |
| CAD | 0.06% | -0.30% | -0.56% | 0.08% | -0.86% | -0.83% | -0.33% | |
| AUD | 0.93% | 0.57% | 0.31% | 0.97% | 0.86% | 0.05% | 0.54% | |
| NZD | 0.89% | 0.53% | 0.29% | 0.95% | 0.83% | -0.05% | 0.50% | |
| CHF | 0.40% | 0.04% | -0.23% | 0.44% | 0.33% | -0.54% | -0.50% |
The heat map shows percentage changes of major currencies against each other. The base currency is picked from the left column, while the quote currency is picked from the top row. For example, if you pick the British Pound from the left column and move along the horizontal line to the US Dollar, the percentage change displayed in the box will represent GBP (base)/USD (quote).
Crude oil prices are slumping as the left tail continues to fatten, TDS macro analyst Daniel Ghali notes.
Supply risk premia is melting
“OPEC+ is backed into a corner. Supply risk premia is melting, and further delays to planned output increases won't do the trick. Global oil demand growth is weakening, and not necessarily exclusively owing to slowing global growth.”
“There's still a massive risk premium baked into oil prices, a legacy of critically-low spare capacity during the pandemic-era bull market, suggesting the combination of weakening demand growth and rising supply threatens to inflict a lot more damage to prices than anticipated given expected balances.”
- AUD/USD recovers sharply from 0.6820 as the Australian Dollar strengthens.
- Investors await Fed Powell’s speech for fresh interest rate guidance.
- The core PCE inflation is expected to have accelerated to 2.7% in August.
The AUD/USD pair bounces back strongly from Wednesday’s low of 0.6820 to near the round-level resistance of 0.6900 in Thursday’s North American session. The Aussie asset strengthens amid upbeat Australian Dollar (AUD).
The Aussie Dollar performs strongly as the Reserve Bank of Australia (RBA) is expected to leave interest rates at their current levels for the entire year. In the monetary policy on Tuesday, the RBA kept its Official Cash Rate (OCR) steady to 4.35% and conveyed that the option of more rate hikes was not on the table.
Meanwhile, the US Dollar (USD) exhibits a sluggish performance near the crucial resistance of 101.00. The US Dollar struggles to extend recovery as investors look for Federal Reserve (Fed) Chair Jerome Powell’s speech to get fresh cues on the interest rate outlook.
Currently, financial market participants expect that the Fed could deliver one another 50 basis points (bps) interest rate cut in November. Last week, the Fed started the policy-easing cycle with a larger-than-usual interest rate cut of 50 bps to 4.75%-5.00%.
Going forward, investors will focus on the United States (US) Personal Consumption Expenditure Price Index (PCE) data for August, which will be published on Friday.
Economists estimate the core PCE inflation data, a Fed’s preferred inflation gauge, to have grown at a faster rate of 2.7% from 2.6% in July. Signs of inflation remaining persistent would prompt market expectations for the Federal Reserve (Fed) to cut interest rates by 50 basis points (bps) in the November meeting. On the contrary, hot figures would dampen them.
Australian Dollar FAQs
One of the most significant factors for the Australian Dollar (AUD) is the level of interest rates set by the Reserve Bank of Australia (RBA). Because Australia is a resource-rich country another key driver is the price of its biggest export, Iron Ore. The health of the Chinese economy, its largest trading partner, is a factor, as well as inflation in Australia, its growth rate and Trade Balance. Market sentiment – whether investors are taking on more risky assets (risk-on) or seeking safe-havens (risk-off) – is also a factor, with risk-on positive for AUD.
The Reserve Bank of Australia (RBA) influences the Australian Dollar (AUD) by setting the level of interest rates that Australian banks can lend to each other. This influences the level of interest rates in the economy as a whole. The main goal of the RBA is to maintain a stable inflation rate of 2-3% by adjusting interest rates up or down. Relatively high interest rates compared to other major central banks support the AUD, and the opposite for relatively low. The RBA can also use quantitative easing and tightening to influence credit conditions, with the former AUD-negative and the latter AUD-positive.
China is Australia’s largest trading partner so the health of the Chinese economy is a major influence on the value of the Australian Dollar (AUD). When the Chinese economy is doing well it purchases more raw materials, goods and services from Australia, lifting demand for the AUD, and pushing up its value. The opposite is the case when the Chinese economy is not growing as fast as expected. Positive or negative surprises in Chinese growth data, therefore, often have a direct impact on the Australian Dollar and its pairs.
Iron Ore is Australia’s largest export, accounting for $118 billion a year according to data from 2021, with China as its primary destination. The price of Iron Ore, therefore, can be a driver of the Australian Dollar. Generally, if the price of Iron Ore rises, AUD also goes up, as aggregate demand for the currency increases. The opposite is the case if the price of Iron Ore falls. Higher Iron Ore prices also tend to result in a greater likelihood of a positive Trade Balance for Australia, which is also positive of the AUD.
The Trade Balance, which is the difference between what a country earns from its exports versus what it pays for its imports, is another factor that can influence the value of the Australian Dollar. If Australia produces highly sought after exports, then its currency will gain in value purely from the surplus demand created from foreign buyers seeking to purchase its exports versus what it spends to purchase imports. Therefore, a positive net Trade Balance strengthens the AUD, with the opposite effect if the Trade Balance is negative.
- USD/CAD has pulled back within a strong downtrend.
- It will probably continue falling as the wave C of a Measured Move unfolds.
USD/CAD has pulled back within the midst of a strong downtrending move. On Wednesday the pair recouped about half the losses from the previous day and formed a Marubozu Japanese candlestick continuation pattern. These are long red candles that close near their lows.
It is often the case that the market will retrace 50% of the Marubozu, which is what happened on Wednesday. Thursday sees a renewal of weakness so far.
USD/CAD Daily Chart
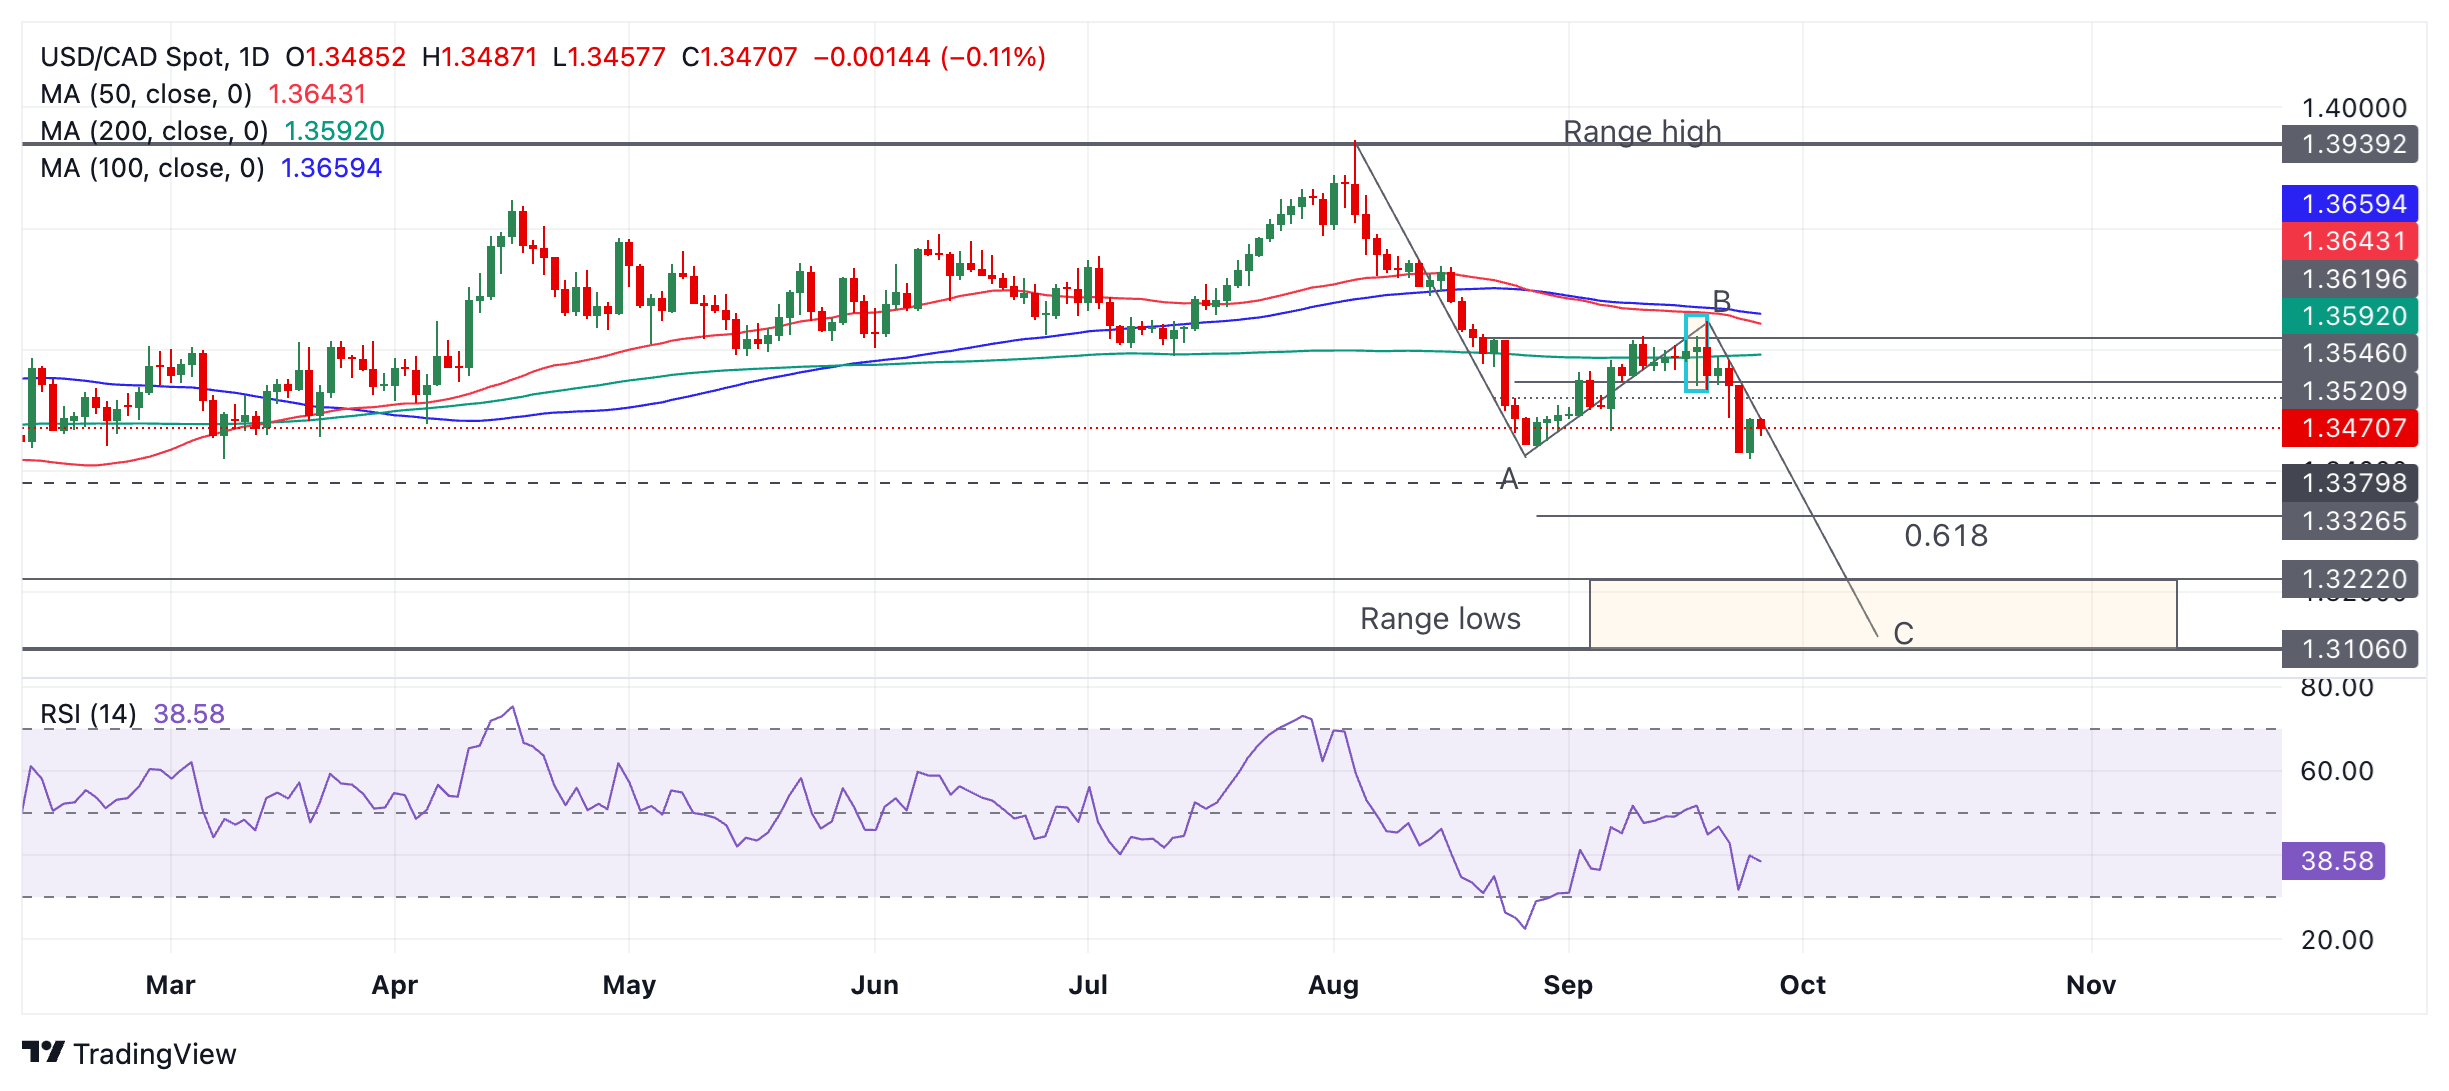
USD/CAD’s move down from the range high, which started on August 5, looks like an ABC pattern, otherwise known as a “Measured Move” (see labels on chart above). Such patterns are like large zig-zags. The wave C usually reaches a similar length to wave A, or at a minimum a Fibonacci 61.8% of A.
Assuming USD/CAD is in a wave C it will probably continue to unfold despite the present pullback. It should reach at least the conservative target for the pattern at 1.3326, the Fibonacci 61.8% extrapolation of wave A. In a very bearish case it could fall to the zone of the range lows (orange shaded rectangle on chart above).
A break below the low of the Marubozu candle at around 1.3419 would provide bearish confirmation of more downside to the aforesaid targets.
- Initial Jobless Claims rose to 218K, up from the previous week's 222K.
- Continuing Jobless Claims increased to 1.834M in the week ending September 14.
US citizens that newly applied for unemployment insurance benefits reached 218K in the week ending September 21, according to the US Department of Labor (DoL) on Thursday. The prints came in below initial consensus (225K) and were lower than the previous weekly figure of 222K (revised from 219K).
Further details of the publication revealed that the advance seasonally adjusted insured unemployment rate was 1.2% and the 4-week moving average was 224.75K, a decrease of 3.5K from the previous week's revised average.
In addition, Continuing Claims rose by 13K to 1.834M in the week ending September 14.
Market reaction
The US Dollar Index (DXY) trades in an inconclusive day around the 100.90 region following the release of US data.
- Durable Goods Orders in the US stayed pat in August, beating expectations.
- The US confirmed that the economy grew at an annualized pace of 3% in Q2.
- The US Dollar Index gains upward momentum with the news, approaching 101.00.
“New orders for manufactured durable goods in August, up six of the last seven months, increased $0.1 billion or virtually unchanged to $289.7 billion,” the US Census Bureau reported.
“This followed a 9.9 per cent July increase. Excluding transportation, new orders increased by 0.5 per cent. Excluding defense, new orders decreased 0.2 percent. Electrical equipment, appliances, and components, up two of the last three months, drove the increase, $0.3 billion or 1.9 per cent to $14.4 billion.”
At the same time, Real Gross Domestic Product (GDP) increased at an annual rate of 3.0 per cent in the second quarter of 2024, as previously estimated, according to the US Bureau of Economic Analysis (BEA).
Market reaction
The US Dollar Index jumped with the positive news and hovers around 100.80 ahead of the American opening.
- Bitpanda Deputy CEO expects more clarity on US crypto regulation no matter the winner of the US presidential elections.
- Favorable macroeconomic conditions should support crypto markets in 2025, the executive says.
- The approval of more spot ETFs is likely despite Bitcoin, Ethereum’s slow start, he says.
Lukas Enzersdorfer-Konrad is the deputy CEO at Bitpanda, a crypto exchange based in Europe with more than five million users. At the European Blockchain Convention held in Barcelona, the executive shared with FXStreet his views on the current state of the crypto industry and its regulation, how the upcoming US presidential elections can affect markets and what traders need to consider when investing in crypto.
-638629502681756718.jpg)
Lukas Enzersdorfer-Konrad. Source: Bitpanda.
Q: It has been an eventful year in the crypto market. How do you assess the market behavior in 2024?
If we look at 2024 and the outlook for 2025, it has been quite macroeconomically driven. We saw for the first time [interest] rate cuts by the US Federal Reserve and by the European Central Bank in Europe, which are potentially to be continued over the next year. This means that money is getting less expensive, which is a good starting point for a high-risk asset class such as crypto.
Also, with the US elections coming up, no matter who wins we will get more clarity on how crypto in the US is going to be dealt with. This year we still saw a lot of confusion in the US market. So these are two events that will potentially have a positive impact on crypto sentiment.
Q: And what about the technical developments within the crypto space?
A different aspect is that we have seen a lot of development in Layer 1 and Layer 2 chains. Ecosystems are growing on Ethereum and Solana (SOL), so the next wave will be a very interesting one, with real applications and real use-case applications for on-chain activity that will drive Web3 as part of the next cycle.
Next US administration set to bring clarity on crypto, no matter Trump or Harris
Q: About the US presidential election, do you see it as a binary event for crypto? Is it a “Trump positive and Kamala negative,” or it isn’t that clear?
It does not matter if it is Kamala Harris or Donald Trump, there will be more clarity for a five-year planning cycle, which will support the institutional adoption of crypto. There can be speculation about how Trump is more pro-crypto than Harris, but this is something we will not know until one of them is elected.
Q: What is your opinion on the current US Securities and Exchange Commission (SEC) crackdown on the crypto industry?
It is very interesting to follow. There are so many different interests in the US playing into the many SEC trials that go beyond what is beneficial for crypto. It is interesting to see the personal opinions of the people involved.
Clarity will only come after the US presidential election and with the end of all these trials. So, it’s the right thing that these legal battles are happening instead of being postponed forever.
Q: Does crypto need SEC Chair Gary Gensler gone?
I would say yes.
Crypto market is becoming more transparent
Q: Besides more clarity in regulation, what does crypto need to bring as added value to increase adoption?
For crypto as an asset class, two things are needed: first, building Web3 interactions and on-chain applications that people start to use. We are still right at the beginning of this process.
The other one is real-world interaction with regulated stablecoins to have remittance, payment services and facilitators. Bitcoin is not a vehicle for payments, it is a vehicle for storing value. Like with Gold, it won’t be used to pay, but stablecoins will, and they are now seeing momentum in Europe with MiCA, which is a regulatory catalyst. That’s a very interesting play for next year.
Q: Crypto trading is still a mysterious world if you compare it to Forex, where fundamentals are more clear. How can exchanges help traders understand what is going on?
Crypto markets are very immature and untransparent. Still, if you think about crypto ten or five years ago, it was a much more untransparent market than it is now. From a nature perspective, Forex markets are very similar to crypto. It is just that FX already is optimized and there is much more history.
There will always be some non transparency on why prices are moving. For example, we saw how Germany sold Bitcoin reserves out of a trial, and it was understandable. Years ago, this would have not happened because some random wallets that nobody knew about just dumped crypto into the market.
On the other side, it also gives people opportunities when it comes to trading strategies, because you can still make more money from crypto compared to FX.
Q: How does Bitpanda help traders understand what is going on in the markets?
We do not try to tell people what to invest in. We are about ensuring the access and the storage of value, making trading, custody and staking available in the best way for our customers.
What to buy and when to buy? This is for a customer to decide on their own.
Q: If you had to give advice to a trader, what would you tell him in terms of what to look at?
If you are investing in crypto, you are investing indirectly in the adoption of blockchain technology. So it is not just understanding the technology and how it works, but also the user cases and which L1s and L2s are in play so you can judge whether it will get traction. Then, invest in tokens around these ecosystems.
For trading, it is much more useful to apply technical analysis from the old world, but that depends on your investment horizon.
How the crypto market dynamics are shifting with institutions getting in
Q: About the approval of the US spot Bitcoin and Ethereum ETFs. Do you think these ETFs are living up to expectations?
I would say yes, absolutely. ETFs are the next step of giving a new type of investor access to the asset class, but market sentiment needs to also support that.
You can have best access for institutional investors, but they will not move larger amounts of capital if growth expectations are not there. The fortune of the ETFs will be driven by macroeconomic trends – the price of money, interest rates – and also on clarity – meaning the US election and the regulatory frameworks. We will see further ETFs inflows in the coming years when the market is better.
Until now, geopolitical factors were mostly affecting existing stock markets, but nowadays are also affecting crypto. Further investments also need a positive macroeconomic outlook, and the current one is not that positive.
Q: Are you expecting new ETFs to be approved in the US: Solana, XRP, etc?
In general, yes, it will come. The question is when?
Q: When do you think this will happen?
I don’t know.
Q: How do you see the correlation between crypto and traditional stock markets, is it going to grow or decouple?
With more participants of the traditional markets now moving into crypto, the correlation will increase. Not in price, but in activity. Trading activity Monday to Friday in crypto is already much higher compared to five or seven years ago. We have fewer spikes during the weekend because retail trading activity is declining.
Q: What is your Bitcoin price forecast for one year?
I believe that Bitcoin price will be higher in one year. Where will it stand? We will see.
- EUR/GBP is correcting back after an extended down move which took the pair to a key target level.
- The RSI momentum indicator has exited oversold and given a buy signal.
EUR/GBP has pulled back after trending lower. It remains in a short and medium-term downtrend, however, suggesting the decline could resume. It is a principle of technical analysis that “the trend is your friend” which means that the odds favor a continuation of the bear trend for EUR/GBP.
EUR/GBP Daily Chart
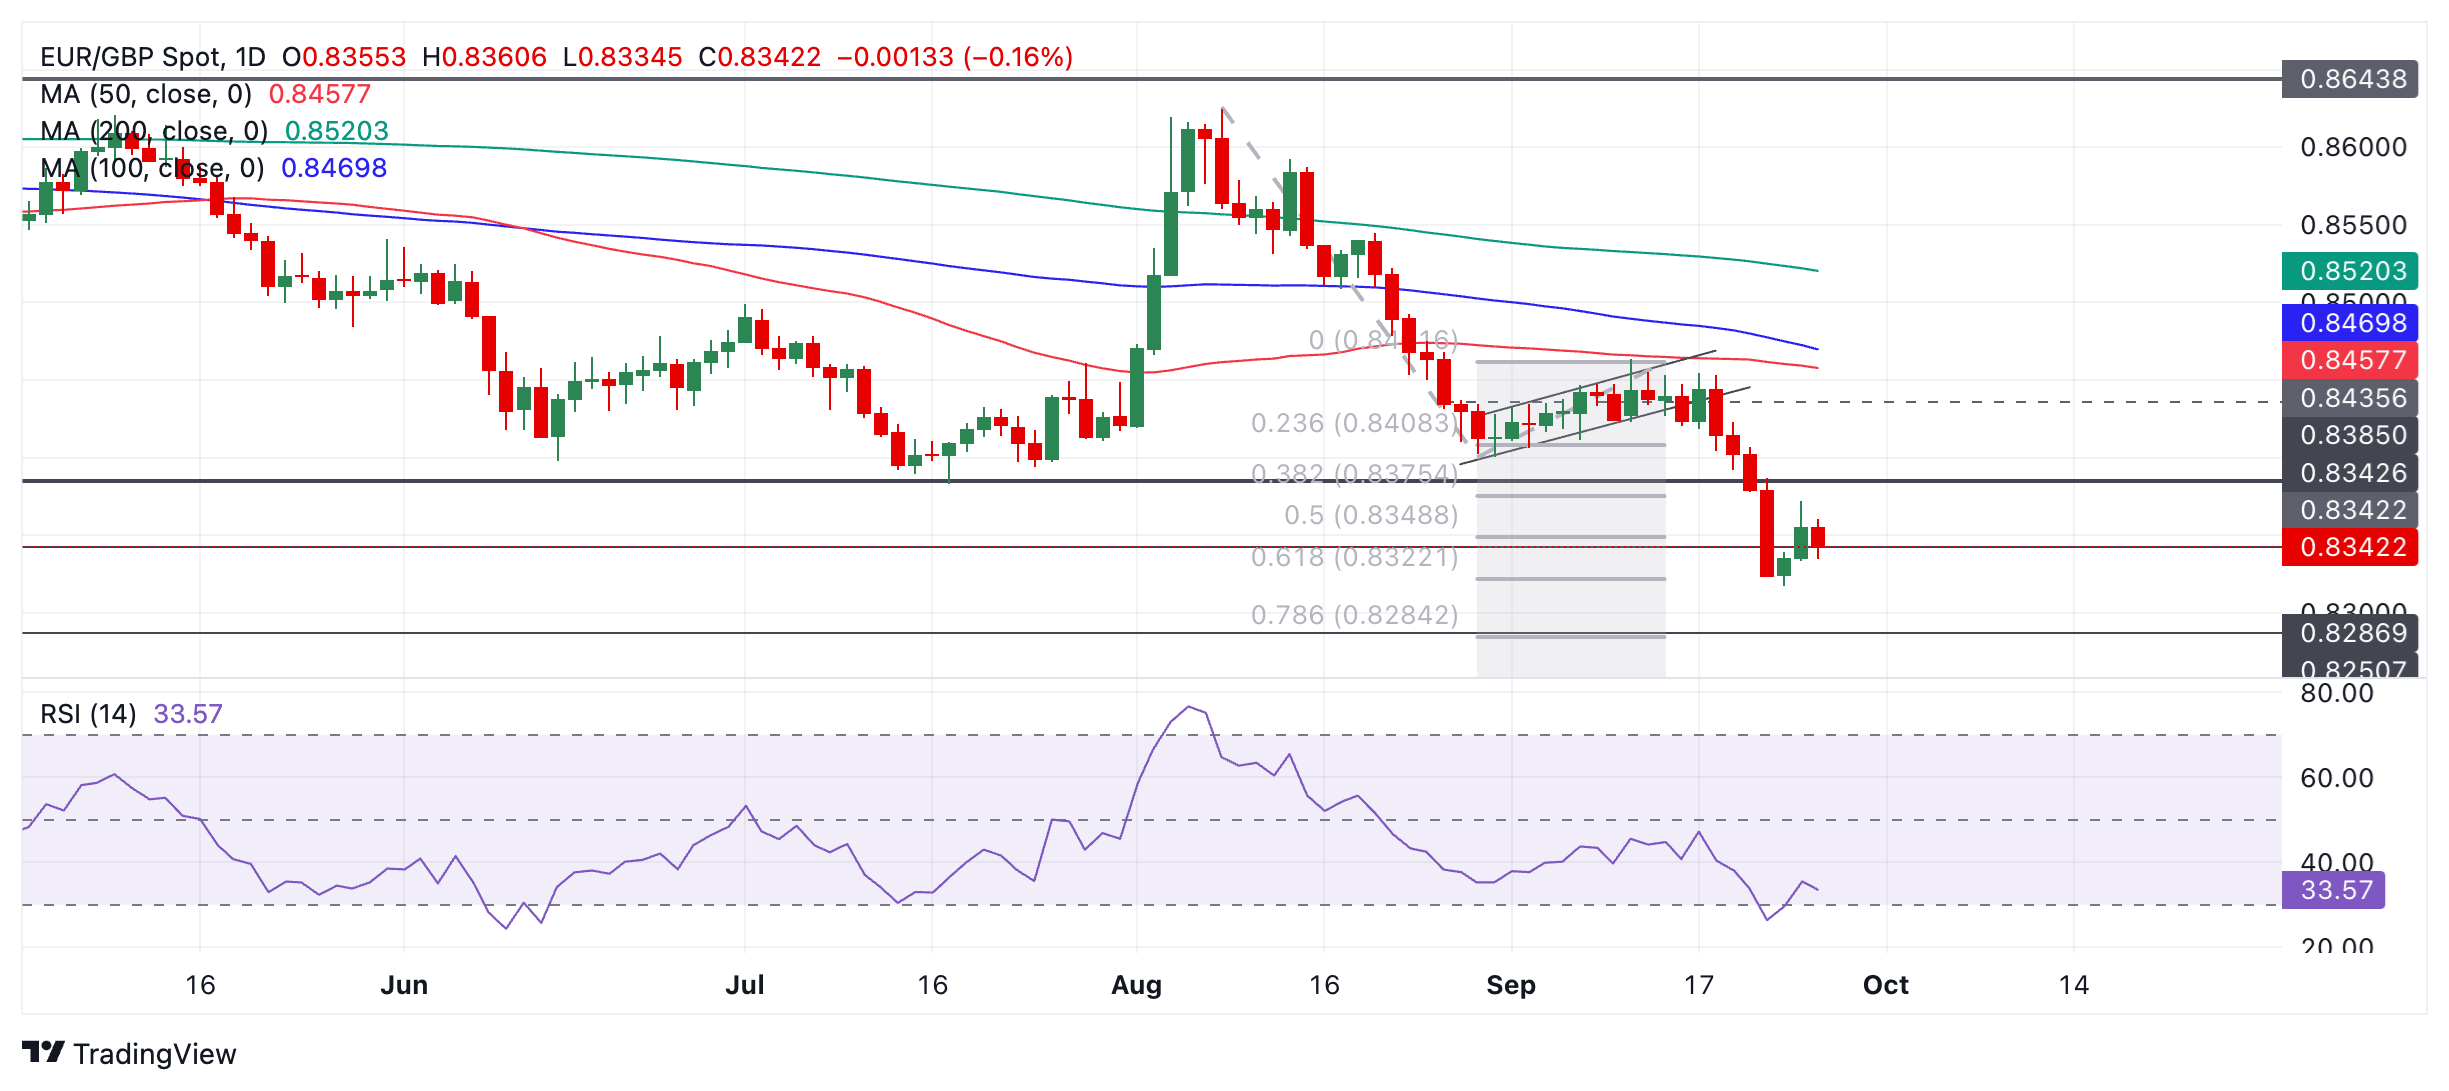
That said, EUR/GBP has reached a potential downside target for the bear move that began at the August 5 high when it reached the top of its range. As such it may have completed its bearish decline. The target is the 61.8% extrapolation of the initial move down during August before the channel that formed in early September and pulled back higher for two weeks.
A break below the 0.8317 September 24 low would reconfirm a continuation of the downtrend towards the next target at 0.8287, the August 2022 low.
The Relative Strength Index (RSI) has exited oversold, suggesting the risk of an extended correction unfolding to the upside.
European gas demand is down 10% y-o-y due to weak demand from the power and heating sector, while industrial gas demand remains flat, Rabobank’s commodity analysts note.
Geopolitical tensions continue to drive price volatility
“A colder-than-usual winter will increase heating demand and competition for LNG, but Europe is unlikely to come out as the premium global gas market. Higher winter heating demand also poses a new risk for 2025, as it will force Europe’s LNG imports to rise again!”
“Geopolitical tensions, particularly around Russian gas deliveries and Middle Eastern conflicts, continue to drive price volatility. Speculative positioning has also influenced recent price movements, with the potential for further sell-offs depending on geopolitical developments. We still expect TTF gas prices to average €38/MWh in Q4 and €36-37/MWh in winter 2025/2026.”
“The European carbon market is closely following price variations of the TTF gas market, while geopolitical risks remain the key drivers for volatility. Elevated gas prices are driving demand for more carbon-intensive coal-fired power plants and consequently EU Allowances (EUAs) this winter. We forecast EUA prices to range €68-71/t CO2e in Q4.”
- Silver breaks to a new high for the year and a 12-year high for the precious metal overall.
- The news of another stimulus package from the Chinese government helped push up the commodity.
- The escalating conflict in the Middle East and expectations of aggressive Fed easing further propel Silver.
Silver (XAG/USD) breaks to a new high for 2024 and a 12-year high overall on Thursday, after the Chinese authorities announced another 1 trillion CNY of extra stimulus on top of the package of measures already proposed by the People’s Bank of China (PBoC). China is the largest consumer of Silver in the world so the stimulus is expected to increase demand for the commodity.
Silver also saw gains from the escalation of the conflict in the Middle East between Israel and Hezbollah, and continued bets the Federal Reserve (Fed) will cut its key fed funds rate by another half a percent at its November meeting. Lower interest rates are positive for Silver because they increase the attractiveness of the non-interest bearing asset.
Technical Analysis: Silver breaks above key trendline and rallies
Silver has broken decisively above a key trendline and escaped from the range it was trapped in since May 2024.
It is now in an established short and medium-term uptrend and given “the trend is your friend” according to technical analysis theory, the odds favor an extension higher.
Silver Daily Chart
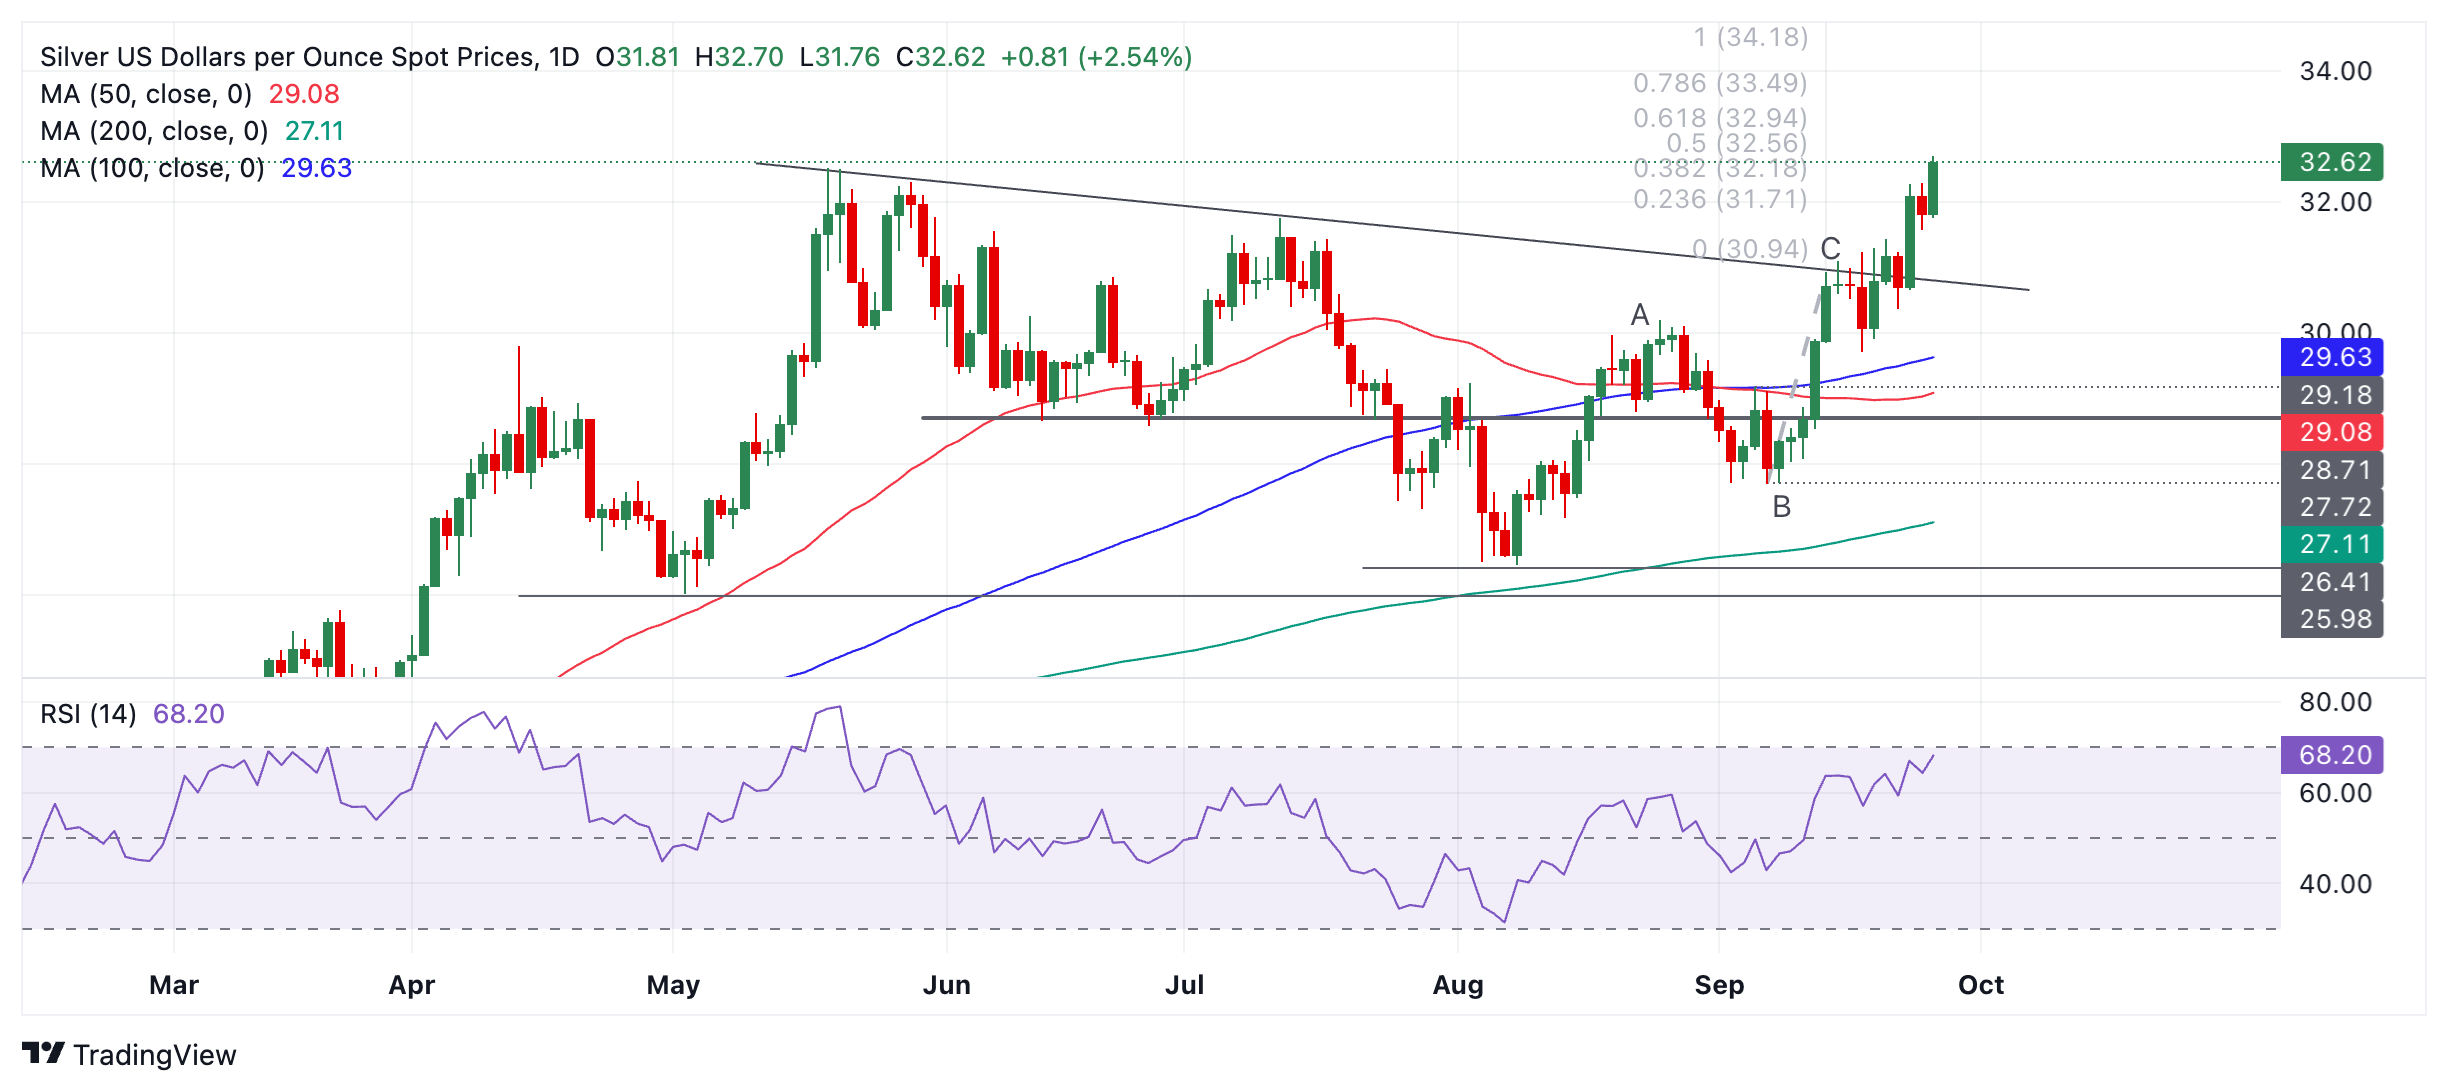
The next target on the radar is $32.94, the 0.618 Fibonacci ratio extrapolation of the C wave of the Measured Move pattern outlined prior to the breakout above the trendline. A really bullish move could eventually reach $34.18, the 100% extrapolation of wave C.
The Relative Strength Index (RSI) momentum gauge is not yet overbought, indicating there is probably more upside left in the market.
- AUD/JPY remains firms on multiple tailwinds.
- The RBA left its key interest rates steady at 4.35% on Tuesday.
- Investors await Japan’s Tokyo CPI data for fresh BoJ’s interest rate outlook.
The AUD/JPY pair rises further to near 99.60 in Thursday’s European session. The cross extends its winning spell for the ninth trading day on Thursday as the Australian Dollar (AUD) performs strongly on multiple tailwinds such as: Reserve Bank of Australia’s (RBA) hawkish interest rate outlook and China’s larger-than-expected monetary stimulus.
After leaving the Official Cash Rate (OCR) unchanged at 4.35% on Tuesday, the comments from the RBA indicated that it is unlikely to start reducing interest rates this year due to sticky price pressures and upbeat labor market health.
In addition to the RBA’s hawkish guidance, the announcement of a slew of stimulus packages by China has also strengthened the AUD’s outlook. It is worth noting that the Australia is the leading trading partner of China and an attempt to revive the Chinese economy will have a positive impact on the Australian Dollar.
Meanwhile, the Japanese Yen (JPY) will be guided by the Tokyo Consumer Price Index (CPI) data for August, which will be published on Friday. The Tokyo CPI excluding Fresh Food is estimated to have grown by 2%, slower than 2.4% in July. This would dampen market expectations for the Bank of Japan (BoJ) to hike interest rates further.
AUD/JPY gathers strength to break above the horizontal resistance plotted from September 2 high of 99.87 on a daily timeframe. Given a nine-day winning spree, the risk-barometer would thrash the immediate resistance. Upward-sloping 20-day Exponential Moving Average (EMA) near 97.40 suggests that the near-term trend is bullish.
The 14-day Relative Strength Index (RSI) has climbed above 60.00. A bullish momentum would trigger if the oscillator sustains above the same.
Going forward, a decisive break above September 2 high of 99.87 will result in further upside in the asset towards the psychological resistance of 100.00 and July 30 high of 101.78.
On the flip side, a downside move below September 25 low of 98.50 would drag the asset towards the 20-day EMA, which is currently trading around 97.40, followed by September 12 high near 95.70.
AUD/JPY daily chart
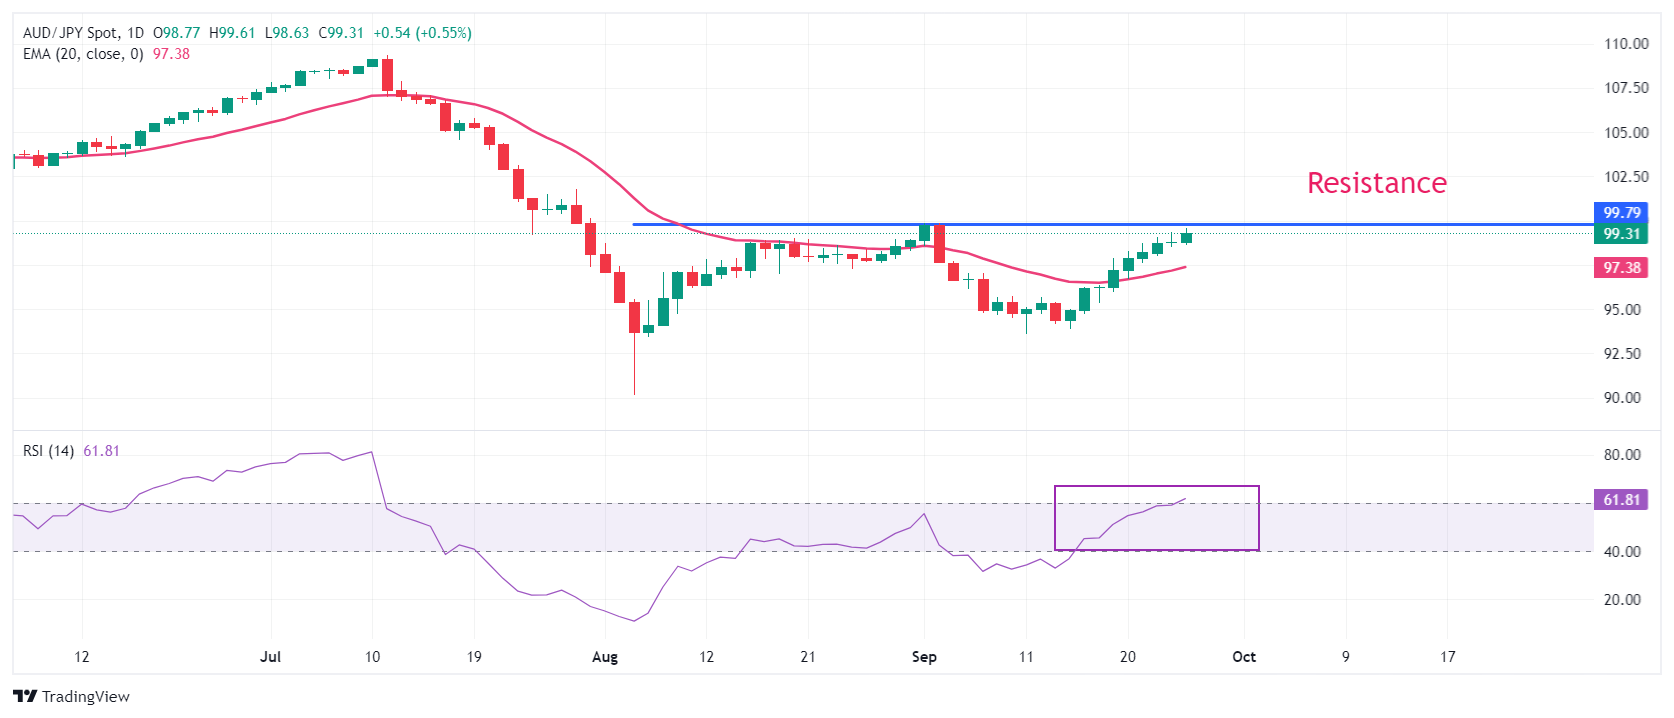
Australian Dollar FAQs
One of the most significant factors for the Australian Dollar (AUD) is the level of interest rates set by the Reserve Bank of Australia (RBA). Because Australia is a resource-rich country another key driver is the price of its biggest export, Iron Ore. The health of the Chinese economy, its largest trading partner, is a factor, as well as inflation in Australia, its growth rate and Trade Balance. Market sentiment – whether investors are taking on more risky assets (risk-on) or seeking safe-havens (risk-off) – is also a factor, with risk-on positive for AUD.
The Reserve Bank of Australia (RBA) influences the Australian Dollar (AUD) by setting the level of interest rates that Australian banks can lend to each other. This influences the level of interest rates in the economy as a whole. The main goal of the RBA is to maintain a stable inflation rate of 2-3% by adjusting interest rates up or down. Relatively high interest rates compared to other major central banks support the AUD, and the opposite for relatively low. The RBA can also use quantitative easing and tightening to influence credit conditions, with the former AUD-negative and the latter AUD-positive.
China is Australia’s largest trading partner so the health of the Chinese economy is a major influence on the value of the Australian Dollar (AUD). When the Chinese economy is doing well it purchases more raw materials, goods and services from Australia, lifting demand for the AUD, and pushing up its value. The opposite is the case when the Chinese economy is not growing as fast as expected. Positive or negative surprises in Chinese growth data, therefore, often have a direct impact on the Australian Dollar and its pairs.
Iron Ore is Australia’s largest export, accounting for $118 billion a year according to data from 2021, with China as its primary destination. The price of Iron Ore, therefore, can be a driver of the Australian Dollar. Generally, if the price of Iron Ore rises, AUD also goes up, as aggregate demand for the currency increases. The opposite is the case if the price of Iron Ore falls. Higher Iron Ore prices also tend to result in a greater likelihood of a positive Trade Balance for Australia, which is also positive of the AUD.
The Trade Balance, which is the difference between what a country earns from its exports versus what it pays for its imports, is another factor that can influence the value of the Australian Dollar. If Australia produces highly sought after exports, then its currency will gain in value purely from the surplus demand created from foreign buyers seeking to purchase its exports versus what it spends to purchase imports. Therefore, a positive net Trade Balance strengthens the AUD, with the opposite effect if the Trade Balance is negative.
The Bank of Mexico (Banxico) will hold its regular meeting this evening (European time). At the moment, all signs point to another 25bp cut to 10.5%. This is supported by the fact that Banxico, with its last rate cut in early August, has already made it clear that the focus of policymakers has changed in recent months. The focus is now much more on the weakening real economy, while inflation, which remains very stubborn, seems to be taking a back seat, Commerzbank’s FX analyst Michael Pfister notes.
Banxico is likely to cut rates by 25bp today
“This is also supported by the fact that Banxico went ahead with the rate cut even though the Mexican peso has depreciated significantly in recent weeks, pointing to stronger imported inflationary pressures in the coming months. Recent statements from officials also leave little doubt that they will continue their monetary easing today.”
“With real interest rates still quite high and other central banks considering increasing the pace of quantitative easing, one might wonder whether Banxico will also start cutting rates by 50 basis points. However, this seems unlikely, at least for the time being.”
“The reasons for this are the aforementioned stubborn inflation, but also the fact that the data from the real economy, while pointing to a slowdown, do not point to a significant economic downturn. In short, Banxico is likely to cut rates by another 25 basis points today.”
The Czech National Bank (CNB) yesterday lowered its key interest rate by 25 basis points. This had been almost certain to happen and was therefore irrelevant for the CZK exchange rates, Commerzbank’ Head of FX and Commodity Research Ulrich Leuchtmann notes.
CZK bulls seem to be right
“There was the indication that the extremely rapid interest rate cuts (from 7% in mid-December to 4¼% now) will now come to an end. Although headline inflation, at 2.4% year-on-year, seems to offer little cause for concern, core inflation, at 3.9%, is still too high, and services inflation, at 6.5%, would give me sleepless nights if I were a CNB decision-maker. A more cautious approach is therefore called for.”
“And there is still a risk that the previous extremely rapid interest rate cuts may have been too much of a good thing. Cutting the key interest rate by 275 basis points in a very short period of time is something you can only do if you are absolutely certain that inflationary pressure has eased significantly. I am always skeptical when central bankers believe they can predict the future with the highest precision. Instead of rapid interest rate cuts followed by a sudden stop, I would prefer a gradual approach.”
“In the end, the CZK bulls may be right. Either because the CNB has coincidentally found the right time to step off the interest rate cutting gas. Or because other central banks make similar mistakes. Or because the CNB is much smarter than I can imagine and can therefore actually control this timing with a high degree of certainty. I am well aware of my possible inadequacies. Let's just hope that the CNB officials are too.”
- Remarks from Fed Chair Jerome Powell and his colleagues will hog the limelight on Thursday.
- Fed officials lately explained why they supported an outsized rate cut at the September meeting.
- Powell’s speech and Fed commentary could rock the US Dollar against its major rivals.
With the return of US Federal Reserve (Fed) policymakers to the rostrum late last week, the US Dollar (USD) continues to bear the brunt of the dovish Fed outlook on interest rates.
The US central bank opted last week for a 50 basis points (bps) rate cut, bringing the fed funds rate to a range of 4.75%-5.0%. The Summary of Economic Projections, the so-called Dot Plot chart, suggested an additional 150 bps of rate cuts for this year and the next.
Fed policymakers stick to the dovish stance
Since then, several Fed officials have justified their stance for an outsized rate cut move, barring Fed Governor Michele Bowman, who dissented by favoring a 25 bps reduction following the September policy meeting.
Citing progress on disinflation and loosening labor market conditions, Atlanta Fed President Raphael Bostic and his Minneapolis and Chicago counterparts, Neel Kashkari and Austan Goolsbee respectively, explained on Monday their reasons behind voting for a large rate cut instead of a smaller first cut in four years.
In his remarks prepared for a virtual event organized by the European Economics and Financial Centre on Monday, Bostic said that “in my view, the 50-basis-point adjustment at the meeting last week positions us well should the risks to our mandates turn out to be less balanced than I am thinking,”
Kashkari said that the 50 bps rate cut was the ‘right decision.’ Meanwhile, Goolsbee came out the most dovish, stating that “many more rate cuts are likely needed over the next year, rates need to come down significantly.”
FXStreet’s FedTracker, which gauges the tone of Fed officials’ speeches on a dovish-to-hawkish scale from 0 to 10 using a custom AI model, rated Goolsbee’s words as dovish with a score of 2.0.
Fed Governor Michelle Bowman called for a "more measured approach" to cutting interest rates on Tuesday, citing that "I continue to see greater risks to price stability, especially while the labor market continues to be near estimates of full employment.”
Conversely to Goolsbee’s valuation, FXStreet’s FedTracker rated Bowman’s words as hawkish with a score of 7.0.
Fed Governor Adrian Kugler said late Wednesday that she “strongly supported” the Fed’s decision to cut the interest rates by a half point last week. Kugler added that she “will support additional rate cuts going forward.”
FXStreet’s FedTracker rated Kugler’s comments as dovish with a score of 3.2.
Markets are currently pricing in a 61% probability that the Fed will cut rates by another 50 bps in November, according to the CME Group’s FedWatch Tool. For the next two Fed meetings, changes to the Fed rate are implying an over 80% probability of 75 bps or more in cuts from the current level.
Powell speech to hog the limelight
Amid growing expectations of an outsized rate cut at the next policy meeting, all eyes turn to a bunch of Fed officials who are due to make their scheduled appearances at two different events, starting from 13:10 GMT on Thursday.
Boston Fed President Susan Collins, Fed Governor Adriana Kugler, Fed Vice Chair For Supervision Michael Barr, and Minneapolis Fed President Neel Kashkari are due to participate in a virtual fireside chat at the Boston Fed’s Financial Inclusion and Banking Supervision Workshop. Collins and Kugler are scheduled to speak at 13:10 GMT while Barr and Kashkari are scheduled at 17:00 GMT.
At 13:15 GMT, Fed Governor Michelle Bowman delivers a speech about the US economic outlook and monetary policy at a workshop organized by the Mid-size Bank Coalition of America Board of Directors.
Almost at the same time, Fed Chairman Jerome Powell’s pre-recorded opening remarks at the US Treasury Market Conference, in New York, will be delivered. New York Fed President John Williams and Fed official Barr are also going to speak at the conference.
Meanwhile, Fed Governor Lisa Cook will participate in a moderated discussion about artificial intelligence and workforce development at an event hosted by the Federal Reserve Bank of Cleveland and Columbus State Community College, in Ohio. The event is scheduled for 14:30 GMT.
The main focus will be on Powell’s speech, as traders look out for fresh hints on the size of the next Fed rate cuts. Powell, during his post-September meeting press conference, said that "our decision today reflects growing confidence that strength in the labor market can be maintained,” adding that “we concluded that 50 bps cut was the right thing.”
About Jerome Powell (via Federalreserve.gov)
"Jerome H. Powell first took office as Chair of the Board of Governors of the Federal Reserve System on February 5, 2018, for a four-year term. He was reappointed to the office and sworn in for a second four-year term on May 23, 2022. Mr. Powell also serves as Chairman of the Federal Open Market Committee, the System's principal monetary policymaking body. Mr. Powell has served as a member of the Board of Governors since taking office on May 25, 2012, to fill an unexpired term. He was reappointed to the Board and sworn in on June 16, 2014, for a term ending January 31, 2028."
Fed FAQs
Monetary policy in the US is shaped by the Federal Reserve (Fed). The Fed has two mandates: to achieve price stability and foster full employment. Its primary tool to achieve these goals is by adjusting interest rates. When prices are rising too quickly and inflation is above the Fed’s 2% target, it raises interest rates, increasing borrowing costs throughout the economy. This results in a stronger US Dollar (USD) as it makes the US a more attractive place for international investors to park their money. When inflation falls below 2% or the Unemployment Rate is too high, the Fed may lower interest rates to encourage borrowing, which weighs on the Greenback.
The Federal Reserve (Fed) holds eight policy meetings a year, where the Federal Open Market Committee (FOMC) assesses economic conditions and makes monetary policy decisions. The FOMC is attended by twelve Fed officials – the seven members of the Board of Governors, the president of the Federal Reserve Bank of New York, and four of the remaining eleven regional Reserve Bank presidents, who serve one-year terms on a rotating basis.
In extreme situations, the Federal Reserve may resort to a policy named Quantitative Easing (QE). QE is the process by which the Fed substantially increases the flow of credit in a stuck financial system. It is a non-standard policy measure used during crises or when inflation is extremely low. It was the Fed’s weapon of choice during the Great Financial Crisis in 2008. It involves the Fed printing more Dollars and using them to buy high grade bonds from financial institutions. QE usually weakens the US Dollar.
Quantitative tightening (QT) is the reverse process of QE, whereby the Federal Reserve stops buying bonds from financial institutions and does not reinvest the principal from the bonds it holds maturing, to purchase new bonds. It is usually positive for the value of the US Dollar.
- Crude Oil is under pressure again, already down over 2.00% on Thursday.
- Additional China stimulus is being offset by Saudi Arabia rumors and a ceasefire proposal on Lebanon.
- The US Dollar Index holds steady ahead of a very volatile data calendar, with the Fed’s Powell speech in focus.
Crude Oil nosedives for a second day and sees losses accelerate on Thursday in what seems to be a sharp correction. Nearly all gains booked on the China stimulus plan rollout and built-up tension in Lebanon are being offset by a ceasefire deal put on the table by the United States (US) and France during an emergency meeting at the United Nations (UN). An additional driver pushing Crude prices even lower on Thursday is the rumors that Saudi Arabia is set to give up its price target of $100 per barrel in light of the upcoming production normalization, the Financial Times reports.
The US Dollar Index (DXY), which tracks the performance of the Greenback against six other currencies, trades steady, just ahead of an expected very volatile trading day. On the economic data front, the third reading of the US Gross Domestic Product (GDP) for the second quarter and Durable Goods Orders data for August are due to be released. Add in there eight Federal Reserve (Fed) members that will take the stage, and volatility is bound to take place in the DXY later in the day.
At the time of writing, Crude Oil (WTI) trades at $68.02 and Brent Crude at $71.35.
Oil news and market movers: Saudi Arabia gets in line with reality
- Saudi Arabia is preparing to abandon its unofficial price target of $100 a barrel for Crude as it prepares to increase output, the Financial Times reported on Thursday, citing people familiar with the matter.
- Signs that Libyan oil will return to the market are also weighing on prices after delegates from divided Libya's east and west agreed on the process of appointing a central bank governor. This is a step closer to resolving the crisis over control of the country's oil revenue, Reuters reports.
- The US, France, and several allies called for an immediate 21-day ceasefire across the Israel-Lebanon border while also expressing support for a ceasefire in Gaza following intense discussions at the United Nations, Bloomberg reports.
- Foreign Minister Israel Katz said there will be no ceasefire in the North, as Israel will continue to fight Hezbollah, Bloomberg reports.
Oil Technical Analysis: Catalysts for profit taking
Crude Oil traders have not been able to enjoy their profits for a long time. Several counterarguments, such as the ceasefire deal that has been put on the table and now Saudi Arabia letting loose of its price target in Oil, are enough to completely unwind incurred gains that were reached on the back of the elevated tensions in the Middle East. Going forward, a further escalation in the MIddle East with a ground offensive might be enough to quickly push Crude back up to above $70.00.
At current levels, $71.46 is back in focus as a first price cap on the upside after a brief false break. If positive momentum continues, a return to $75.27 (the January 12 high) could play out. Along the way towards that level, the 55-day Simple Moving Average (SMA) at $73.83 could ease the rally a bit. Once above $75.27, the first resistance to follow is $76.24, with the 100-day SMA in play.
On the downside, $67.11, a triple bottom in the summer of 2023, should support any downturns. Further down, the next level in line is $64.38, the low from March and May 2023.
WTI Oil FAQs
WTI Oil is a type of Crude Oil sold on international markets. The WTI stands for West Texas Intermediate, one of three major types including Brent and Dubai Crude. WTI is also referred to as “light” and “sweet” because of its relatively low gravity and sulfur content respectively. It is considered a high quality Oil that is easily refined. It is sourced in the United States and distributed via the Cushing hub, which is considered “The Pipeline Crossroads of the World”. It is a benchmark for the Oil market and WTI price is frequently quoted in the media.
Like all assets, supply and demand are the key drivers of WTI Oil price. As such, global growth can be a driver of increased demand and vice versa for weak global growth. Political instability, wars, and sanctions can disrupt supply and impact prices. The decisions of OPEC, a group of major Oil-producing countries, is another key driver of price. The value of the US Dollar influences the price of WTI Crude Oil, since Oil is predominantly traded in US Dollars, thus a weaker US Dollar can make Oil more affordable and vice versa.
The weekly Oil inventory reports published by the American Petroleum Institute (API) and the Energy Information Agency (EIA) impact the price of WTI Oil. Changes in inventories reflect fluctuating supply and demand. If the data shows a drop in inventories it can indicate increased demand, pushing up Oil price. Higher inventories can reflect increased supply, pushing down prices. API’s report is published every Tuesday and EIA’s the day after. Their results are usually similar, falling within 1% of each other 75% of the time. The EIA data is considered more reliable, since it is a government agency.
OPEC (Organization of the Petroleum Exporting Countries) is a group of 13 Oil-producing nations who collectively decide production quotas for member countries at twice-yearly meetings. Their decisions often impact WTI Oil prices. When OPEC decides to lower quotas, it can tighten supply, pushing up Oil prices. When OPEC increases production, it has the opposite effect. OPEC+ refers to an expanded group that includes ten extra non-OPEC members, the most notable of which is Russia.
After disappointing regional PMIs and German survey data, markets are pushing hard for the ECB to cut twice more this year. Fundamentals support a pause in October, but the evidence is growing that the region is softening rapidly, TDS economist James Rossiter notes.
October meeting can end up with a dovish hold
“Importantly, the PMIs have not been strongly correlated with GDP growth over the last 18 months, and Olympic distortions are likely to continue this disconnect in the data. Policymakers therefore won't have seen enough evidence of a slowdown by the 17 October ECB meeting. Markets love PMIs, but central bankers are patient for better-quality data.”
“Inflation & labour market data remain too strong. The ECB's internal Domestic Inflation measure has not fallen as rapidly as other underlying inflation measures. The unemployment rate is at a record low, the participation rate is at a record high, and the high-frequency Indeed wage data that the ECB looks at points to accelerating wages. Bottom line: hot inflation and wages are not yet a thing of the past, arguing for a cautious cutting cycle for now. Lower energy prices help somewhat, though.”
“October could therefore end up being a very dovish ‘hold’ meeting. The market's near-70% chance of a cut is probably about double where we think the true probability lies. That said, the risks are building that the ECB cuts 25bps at each of its meetings from December (rather than quarterly).”
- USD/CAD falls slightly ahead of the Fed Powell’s speech.
- Investors look for fresh interest rate cues for the November meeting.
- The Canadian economy is estimated to have barely grown in July.
The USD/CAD pair edges lower to near 1.3465 in Thursday’s European session after a strong recovery on Wednesday. The Loonie asset faces a mild sell-off as the US Dollar (USD) struggles to extend recovery, with the US Dollar Index (DXY) facing pressure near 101.00.
The next move in the US Dollar will be guided by Fed Chair Jerome Powell’s speech at 13:20 GMT in which he is expected to provide fresh guidance on interest rates. In last week’s press conference after the policy decision of interest rate reduction by 50 basis points (bps) to 4.75%-5.00%, the comments from Jerome Powell suggested that the larger-than-usual rate cut will not be the new normal.
On the contrary, the probability of the Fed delivering another 50 bps interest rate cut in November is 61%, higher than 39% a week ago, according to the CME FedWatch tool.
Meanwhile, the Canadian Dollar (CAD) will be influenced by the monthly Gross Domestic Product (GDP) data for July, which will be published on Friday. Economists estimate the Canadian economy to have grown by 0.1% after remaining flat in June.
USD/CAD prints a fresh swing low near 1.3400 on a daily timeframe, suggesting a firm bearish trend. The Loonie asset weakens after slipping below the August 28 low of 1.3440. A declining 20-day Exponential Moving Average (EMA) near 1.3545 indicates more downside.
The 14-day Relative Strength Index delivers a range shift move into the 20.00-60.00 territory from 40.00-80.00, which suggests that pullbacks would be considered as selling opportunities by investors.
Going forward, a further correction by the major below the immediate support of 1.3400 would expose it to January 31 low of 1.3360 and June 9 low of 1.3340.
In an alternate scenario, a recovery move above the psychological support of 1.3500 would drive the asset towards April 5 low of 1.3540, followed by September 20 high of 1.3590.
USD/CAD daily chart
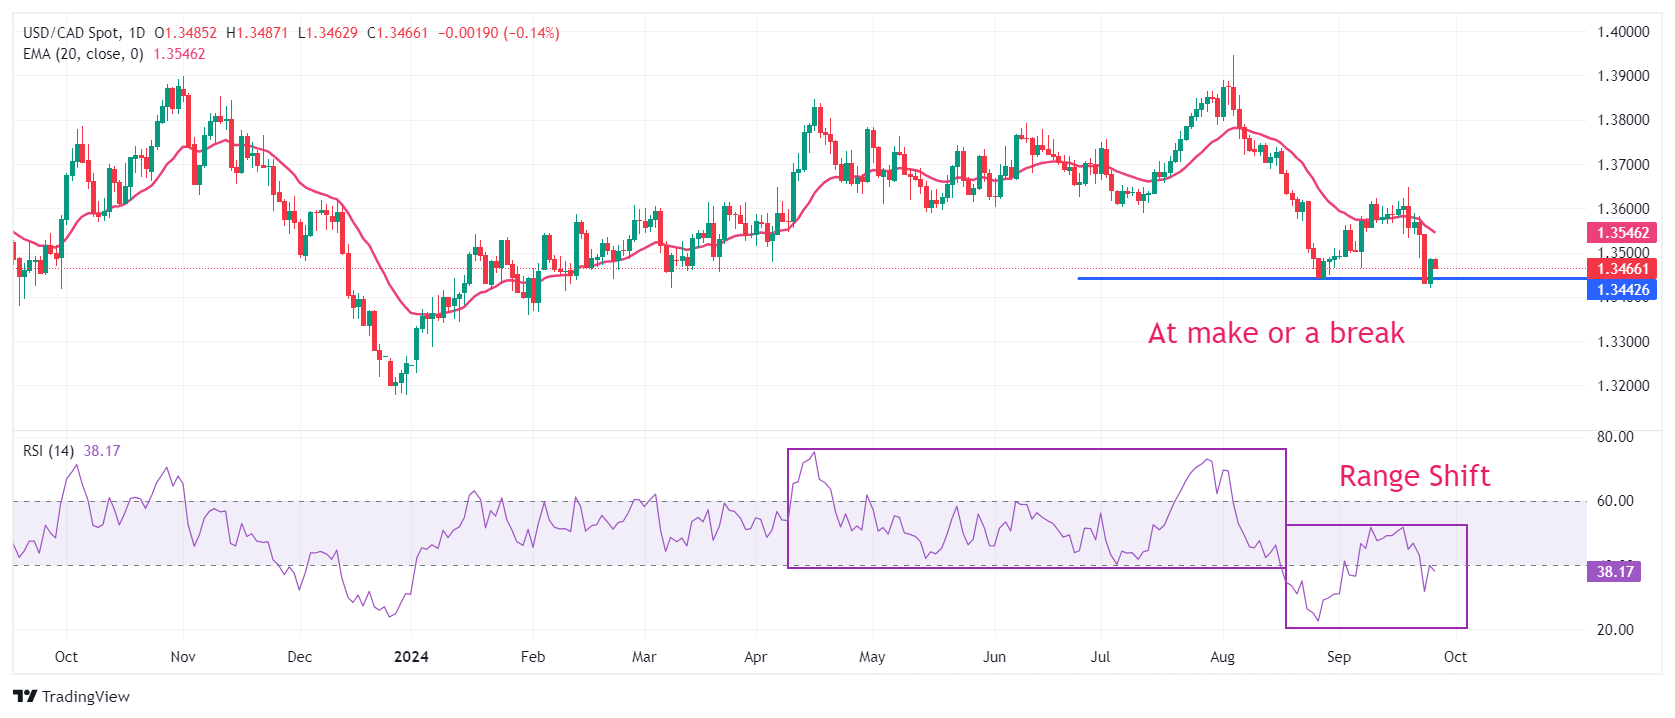
Canadian Dollar FAQs
The key factors driving the Canadian Dollar (CAD) are the level of interest rates set by the Bank of Canada (BoC), the price of Oil, Canada’s largest export, the health of its economy, inflation and the Trade Balance, which is the difference between the value of Canada’s exports versus its imports. Other factors include market sentiment – whether investors are taking on more risky assets (risk-on) or seeking safe-havens (risk-off) – with risk-on being CAD-positive. As its largest trading partner, the health of the US economy is also a key factor influencing the Canadian Dollar.
The Bank of Canada (BoC) has a significant influence on the Canadian Dollar by setting the level of interest rates that banks can lend to one another. This influences the level of interest rates for everyone. The main goal of the BoC is to maintain inflation at 1-3% by adjusting interest rates up or down. Relatively higher interest rates tend to be positive for the CAD. The Bank of Canada can also use quantitative easing and tightening to influence credit conditions, with the former CAD-negative and the latter CAD-positive.
The price of Oil is a key factor impacting the value of the Canadian Dollar. Petroleum is Canada’s biggest export, so Oil price tends to have an immediate impact on the CAD value. Generally, if Oil price rises CAD also goes up, as aggregate demand for the currency increases. The opposite is the case if the price of Oil falls. Higher Oil prices also tend to result in a greater likelihood of a positive Trade Balance, which is also supportive of the CAD.
While inflation had always traditionally been thought of as a negative factor for a currency since it lowers the value of money, the opposite has actually been the case in modern times with the relaxation of cross-border capital controls. Higher inflation tends to lead central banks to put up interest rates which attracts more capital inflows from global investors seeking a lucrative place to keep their money. This increases demand for the local currency, which in Canada’s case is the Canadian Dollar.
Macroeconomic data releases gauge the health of the economy and can have an impact on the Canadian Dollar. Indicators such as GDP, Manufacturing and Services PMIs, employment, and consumer sentiment surveys can all influence the direction of the CAD. A strong economy is good for the Canadian Dollar. Not only does it attract more foreign investment but it may encourage the Bank of Canada to put up interest rates, leading to a stronger currency. If economic data is weak, however, the CAD is likely to fall.
- GBP/CAD may be beginning a bearish phase after touching the top of its channel and reversing lower.
- It is showing bearish divergence with momentum.
GBP/CAD might have reversed its short-term uptrend after testing the top of its rising channel, forming a bearish reversal candlestick pattern (orange rectangle on chart below) and then establishing a sequence of lower lows and lower highs.
GBP/CAD 4-hour Chart
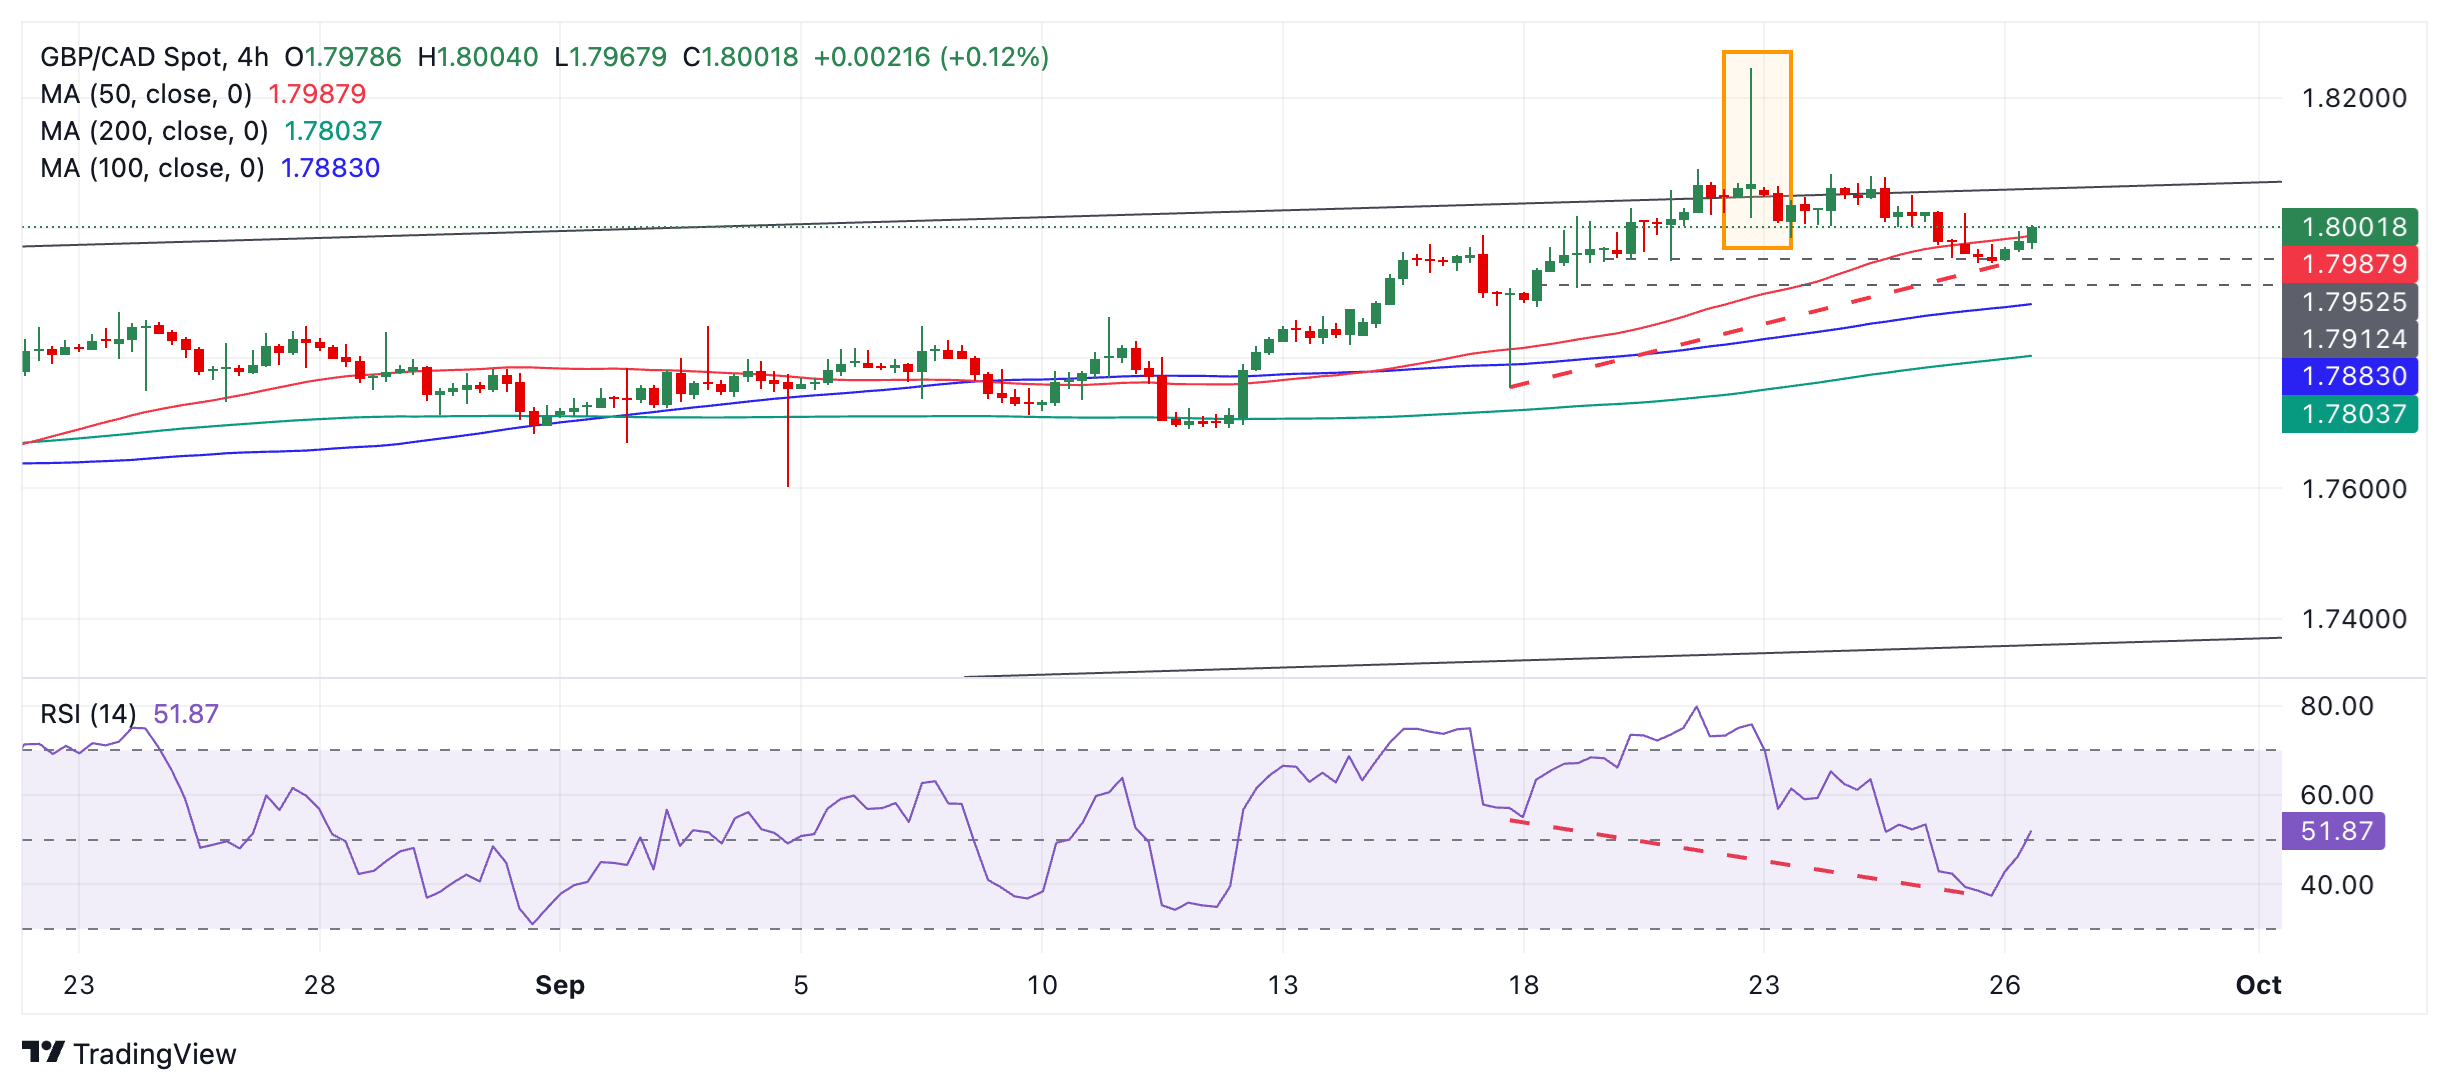
Although GBP/CAD has pulled back over recent periods, it has probably reversed trend and a break below 1.7946 (September 25 low) would confirm more downside. Downside targets lie at 1.7754 (September 17 low and 50-day SMA), 1.7694 (September 16 low) and 1.7603 (September 4 low) and 1.7407 (August 8 low). A break below 1.7907 would provide stronger confirmation.
Although GBP/CAD is in an uptrend on all time frames, it is nevertheless oscillating within an ascending channel. It is possible, therefore, that it may be entering one of its counter-trend bear phases.
The Relative Strength Index (RSI) has formed a bearish divergence with price compared to the September 17 low (red dashed line on chart above). Although the price was much lower on September 17 momentum was not. This suggests underlying weakness could push prices down.
A break above the high of the Shooting Star at 1.8245 would confirm a resumption of the uptrend. If so, the next target lies at 1.8278, the 61.8% extrapolation of the prior move higher.
Any further bullishness beyond the confines of the channel is likely to be short-lived, however. Such moves are signs of “exhaustion” and are a precursor to deeper corrections on the horizon.
USD/MXN has traded sideways after facing resistance near 20/20.15 in August. A retest of recent pivot high near 20/20.15 is likely; this is a crucial hurdle, Société Générale FX analysts note.
20/20.15 is a crucial hurdle
“USD/MXN has evolved within a sideways consolidation after facing resistance near 20/20.15 in August.”
“It recently defended the confluence of a multi-month ascending trend line and the 50-DMA near 18.95 resulting in a bounce. Daily MACD remains anchored within positive territory denoting prevalence of upward momentum.”
“A retest of recent pivot high near 20/20.15 is likely; this is a crucial hurdle. If the pair establishes above this zone, ongoing uptrend could extend.”
- EUR/USD moves higher after correcting to near 1.1120 as the US Dollar struggles to extend recovery.
- Fed Powell’s speech will provide cues about November's likely interest rate cut size.
- The ECB could deliver a second consecutive interest rate cut in October.
EUR/USD edges slightly higher in Thursday’s European session after correcting to near 1.1120 on Wednesday. The major currency pair rebounds ahead of the US Federal Reserve (Fed) Chair Jerome Powell’s speech at 13:20 GMT. On Wednesday, the shared currency pair faced selling pressure after testing territory above the round-level resistance of 1.1200 as the US Dollar (USD) bounced back. The US Dollar Index (DXY), which tracks the Greenback’s value against six major currencies, hovers near Wednesday’s high around 101.00.
Along with Powell, seven other policymakers: Boston Fed Bank President Susan Collins, Fed Governor Adriana Kugler, Fed Governor Michelle Bowman, New York Fed Bank President John Williams, Fed Vice Chair for Supervision Michael Barr, Fed Governor Lisa Cook, and Minneapolis Fed Bank President Neel Kashkari are also lined up to speak during the New York session.
Fed policymakers are expected to provide cues about the likely interest rate action in the remainder of the year. Currently, markets expect that the Fed will reduce interest rates further by 75 basis points (bps) collectively in the remaining two meetings, according to the CME FedWatch tool. The tool also shows that the probability of the Fed announcing a second straight interest rate cut by 50 basis points (bps) in November has increased to 61% from 39% a week ago.
Meanwhile, the latest comments from Fed policymakers have indicated that they were concerned over deteriorating labor market conditions. Out of 12 members-led Federal Open Market Committee (FOMC), only Fed Governor Michelle Bowman supported beginning the rate-cut cycle gradually by a 25 bps rate cut in September.
To get cues about the current inflation status, investors will focus on the United States (US) core Personal Consumption Expenditures Price Index (PCE) data for August, which will be published on Friday. The underlying inflation data is estimated to have grown at a faster pace of 2.7% against the July print of 2.6%.
Daily digest market movers: EUR/USD rises despite uncertainty over Eurozone’s outlook
- EUR/USD rebounds to near 1.1150 as investors underpin the Euro (EUR) against the US Dollar (USD). The performance of the Euro against other major currencies is weak due to growing speculation that the European Central Bank (ECB) could cut the Rate on Deposit Facility for the second time in a row next month. This would be the third dovish decision by the ECB this year.
- On Tuesday, the comments from Dutch ECB governing council member Klaas Knot in an interview with the Dutch TV program Nieuwsuur indicated that the central bank will continue the policy-easing cycle to at least the first half of 2025 to a level between 2% and 3% saying, "I would expect us to continue to gradually reduce interest rates in the coming time, also in the first half of 2025."
- Market expectations for the ECB to reduce interest rates in October have been prompted by deepening concerns over the Eurozone’s activity growth. The Eurozone Composite PMI unexpectedly sank into contraction in September, as shown by the flash HCOB PMI report compiled with S&P Global.
- For fresh inflation status, investors will focus on the preliminary German Harmonized Index of Consumer Prices (HICP) data for September, which will be published on Monday. Signs of further slowdown in inflationary pressures would prompt market expectations of an ECB 50 bps interest rate cut, while hot figures would weaken them.
- Meanwhile, a survey from Growth From Knowledge (GFK) showed on Thursday that German Consumer Confidence improved to -21.2 in October against estimates of -21.5 and the former release of -21.9.
Technical Analysis: EUR/USD holds key 20-day EMA
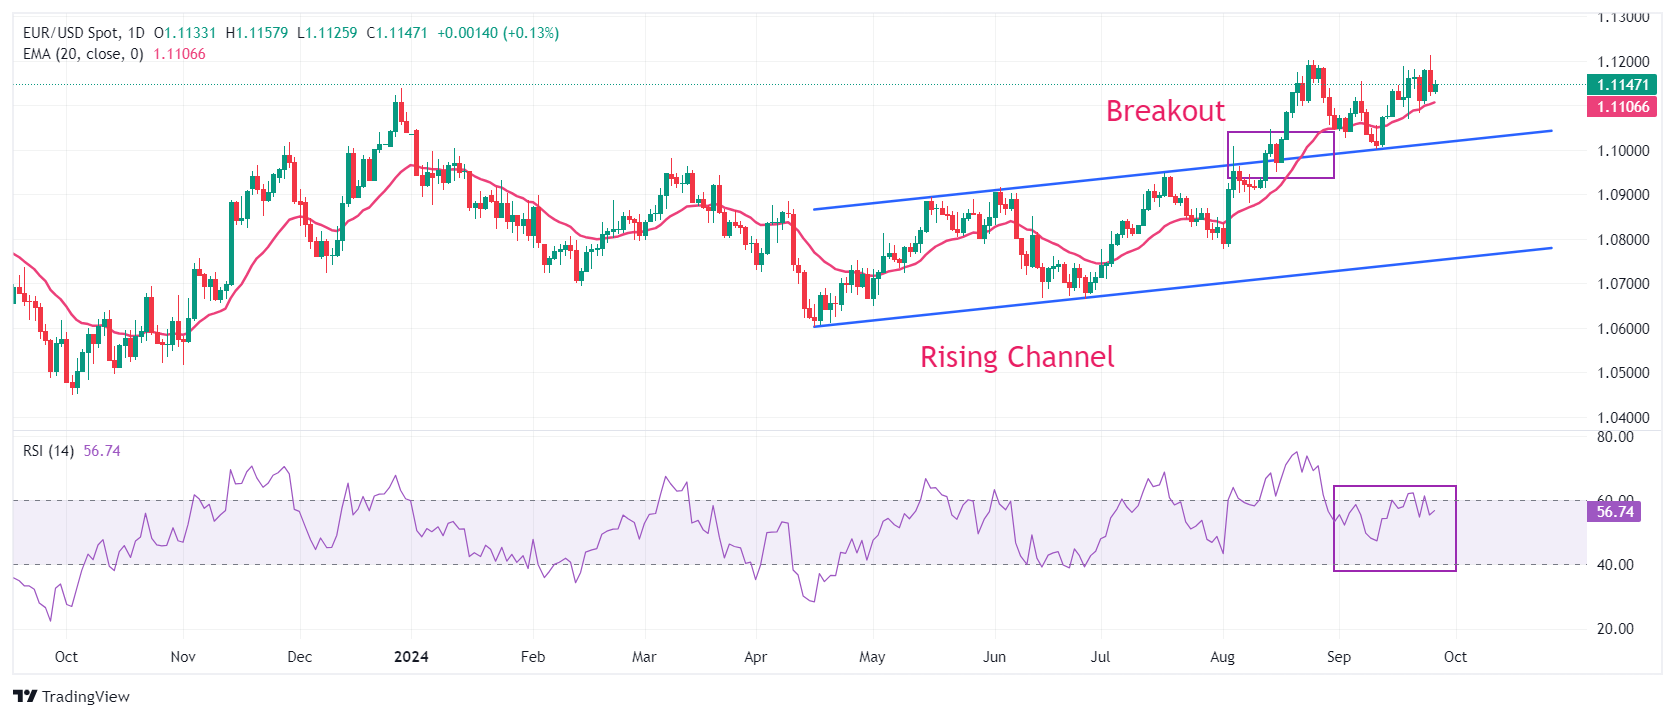
EUR/USD rebounds slightly from 1.1120 in the European trading session on Thursday. The major currency pair corrected on Wednesday from the key resistance of 1.1200. The near-term outlook of the shared currency pair remains firm as it holds the breakout of the Rising Channel chart pattern formed on a daily time frame near the psychological support of 1.1000.
The upward-sloping 20-day Exponential Moving Average (EMA) near 1.1100 suggests that the near-term trend is bullish.
The 14-day Relative Strength Index (RSI) consolidates below 60.00, suggesting momentum is weakening.
Looking up, a decisive break above the round-level resistance of 1.1200 will result in further appreciation toward the July 2023 high of 1.1276. On the downside, the psychological level of 1.1000 and the July 17 high near 1.0950 will be major support zones.
Euro FAQs
The Euro is the currency for the 20 European Union countries that belong to the Eurozone. It is the second most heavily traded currency in the world behind the US Dollar. In 2022, it accounted for 31% of all foreign exchange transactions, with an average daily turnover of over $2.2 trillion a day. EUR/USD is the most heavily traded currency pair in the world, accounting for an estimated 30% off all transactions, followed by EUR/JPY (4%), EUR/GBP (3%) and EUR/AUD (2%).
The European Central Bank (ECB) in Frankfurt, Germany, is the reserve bank for the Eurozone. The ECB sets interest rates and manages monetary policy. The ECB’s primary mandate is to maintain price stability, which means either controlling inflation or stimulating growth. Its primary tool is the raising or lowering of interest rates. Relatively high interest rates – or the expectation of higher rates – will usually benefit the Euro and vice versa. The ECB Governing Council makes monetary policy decisions at meetings held eight times a year. Decisions are made by heads of the Eurozone national banks and six permanent members, including the President of the ECB, Christine Lagarde.
Eurozone inflation data, measured by the Harmonized Index of Consumer Prices (HICP), is an important econometric for the Euro. If inflation rises more than expected, especially if above the ECB’s 2% target, it obliges the ECB to raise interest rates to bring it back under control. Relatively high interest rates compared to its counterparts will usually benefit the Euro, as it makes the region more attractive as a place for global investors to park their money.
Data releases gauge the health of the economy and can impact on the Euro. Indicators such as GDP, Manufacturing and Services PMIs, employment, and consumer sentiment surveys can all influence the direction of the single currency. A strong economy is good for the Euro. Not only does it attract more foreign investment but it may encourage the ECB to put up interest rates, which will directly strengthen the Euro. Otherwise, if economic data is weak, the Euro is likely to fall. Economic data for the four largest economies in the euro area (Germany, France, Italy and Spain) are especially significant, as they account for 75% of the Eurozone’s economy.
Another significant data release for the Euro is the Trade Balance. This indicator measures the difference between what a country earns from its exports and what it spends on imports over a given period. If a country produces highly sought after exports then its currency will gain in value purely from the extra demand created from foreign buyers seeking to purchase these goods. Therefore, a positive net Trade Balance strengthens a currency and vice versa for a negative balance.
- The US Dollar bounces back into September’s range and holds near yearly lows on Thursday.
- Besides a big slew of data, a bunch of Fed speakers are set to rock the US Dollar.
- The US Dollar Index bounces off a 15-month low and is set to enter a rough patch with high volatility at hand.
The US Dollar (USD) holds steady near yearly lows ahead of a very volatile day expected on Thursday. Besides a bulk data release, no less than eight US Federal Reserve (Fed) policymakers are set to speak, including Fed Chairman Jerome Powell. Comments will be watched more than ever by market participants after Bloomberg reported on Wednesday that a bond trader took out 118,000 future contracts betting on a big interest rate cut in the Fed’s next meeting in November, the largest size traded on record ever.
On the economic data front, a bulk release will unfold at 12:30 GMT. Besides the weekly Jobless Claims, the August Durable Goods Orders and the third reading of the US Gross Domestic Product (GDP) for the second quarter will be released at the same time, and volatility is bound to pick up once the data comes out.
Daily digest market movers: Here comes the storm
- Bloomberg reported on Wednesday that a bond trader had bought 118,000 SOFR or Fed futures, betting on a 50 basis point rate cut in November. The amount was the largest on record to be traded in one trade and for a single position.
- The Chinese government is adding more stimulus to markets, this time via a capital injection of 1 trillion Yuan (CNY) into several of its major banks.
- At 12:30 GMT, the main part of the economic data for this Thursday will be released:
- Weekly Jobless Claims:
- Initial Claims are expected to rise to 225,000 in the week ending September 20, coming from 219,000 the previous week.
- Continuing Claims for the week ending September 13 have no forecast available and were at 1.829 million the previous week.
- August US Durable Goods Orders:
- Headline Durable Goods is expected to shrink by 2.6% after the surge of 9.8% in July.
- Durable Goods, excluding cars and transportation, are expected to tick up by 0.1% against the small decline of 0.2% in July.
- As always, the revisions for prior data might be more market-moving than the actual numbers.
- Third reading of the US GDP for the second quarter:
- Headline GDP is expected to come in unchanged at 3%.
- Personal Consumption Expenditures (PCE) Prices should remain stable at 2.5% quarter-on-quarter (QoQ).
- Core PCE is not expected to move away from the 2.8% QoQ of the previous reading.
- Weekly Jobless Claims:
- The Kansas Fed Manufacturing Activity Index for September will be released at 15:00 GMT. The expectation is for an increase to 9, coming from 6 in August.
- At 13:10 GMT, Fed policymakers will make their way to the stages:
- At 13:10 GMT, Federal Reserve Bank of Boston President Susan Collins participates in a virtual fireside chat with Fed Governor Adriana Kugler about bank supervision and financial inclusion at a workshop organized by the Federal Reserve Banks of Boston and Minneapolis.
- Around the same time Federal Reserve Governor Michelle Bowman delivers a speech about the US economic outlook and monetary policy at a workshop organized by the Mid-size Bank Coalition of America Board of Directors.
- At 13:20 GMT, Federal Reserve Chairman Jerome Powell delivers pre-recorded opening remarks at the 2024 US Treasury Market Conference in New York, followed by comments by Federal Reserve Bank of New York President John Williams.
- At 14:30 GMT, Federal Reserve Vice Chair for Supervision Michael Barr delivers remarks at the 2024 US Treasury Market Conference in New York, while Federal Reserve Governor Lisa Cook participates in a roundtable discussion about artificial intelligence and the development of the workforce at an event hosted by the Federal Reserve Bank of Cleveland and Columbus State Community College in Ohio.
- At 17:00 GMT, expect comments from Fed Reserve Vice Chair for Supervision Michael Barr, who participates in a virtual fireside chat about financial inclusion with Minneapolis Fed President Neel Kashkari at the Boston Fed's Financial Inclusion and Banking Supervision Workshop.
- Asian equity markets are rallying higher, led by China, after additional capital injections for the banks. European equities are lagging a touch while US futures are aligned with the Asian rally.
- The CME Fedwatch Tool shows a 39.5% chance of a 25 basis-point rate cut at the next Fed meeting on November 7, while 60.5% is pricing in another 50-basis-point rate cut.
- The US 10-year benchmark rate trades at 3.78%, looking to test the three-week high at 3.81%
US Dollar Index Technical Analysis: Data-driven and Fed-driven
The US Dollar Index (DXY) is either set to be thrown left and right on Thursday or could cover a lot of ground in one direction. The first scenario would play out if economic data misses expectations and does not align with all the comments from the Fed speakers. In case all data falls in line with expecctations, and Fed speakers even use recent data to build up their view or outlook, expect to see a potential nosedive or rally in the DXY.
The upper level of the September range remains at 101.90. Further up, the index could go to 103.18, with the 55-day Simple Moving Average (SMA) at 102.36 along the way. The next tranche up is very misty, with the 100-day SMA at 103.57 and the 200-day SMA at 103.76, just ahead of the big 104.00 round level.
On the downside, 100.22 (the September 18 low) is the first support, and a break could point to more weakness ahead. Should that take place, the low from July 14, 2023, at 99.58, will be the next level to look out for. If that level gives way, early levels from 2023 are coming in near 97.73.
GDP FAQs
A country’s Gross Domestic Product (GDP) measures the rate of growth of its economy over a given period of time, usually a quarter. The most reliable figures are those that compare GDP to the previous quarter e.g Q2 of 2023 vs Q1 of 2023, or to the same period in the previous year, e.g Q2 of 2023 vs Q2 of 2022. Annualized quarterly GDP figures extrapolate the growth rate of the quarter as if it were constant for the rest of the year. These can be misleading, however, if temporary shocks impact growth in one quarter but are unlikely to last all year – such as happened in the first quarter of 2020 at the outbreak of the covid pandemic, when growth plummeted.
A higher GDP result is generally positive for a nation’s currency as it reflects a growing economy, which is more likely to produce goods and services that can be exported, as well as attracting higher foreign investment. By the same token, when GDP falls it is usually negative for the currency. When an economy grows people tend to spend more, which leads to inflation. The country’s central bank then has to put up interest rates to combat the inflation with the side effect of attracting more capital inflows from global investors, thus helping the local currency appreciate.
When an economy grows and GDP is rising, people tend to spend more which leads to inflation. The country’s central bank then has to put up interest rates to combat the inflation. Higher interest rates are negative for Gold because they increase the opportunity-cost of holding Gold versus placing the money in a cash deposit account. Therefore, a higher GDP growth rate is usually a bearish factor for Gold price.
As expected, the Reserve Bank of Australia (RBA) decided to leave its cash rate target unchanged at 4.35% in Sep, for a seventh straight meeting, UOB Group economist Lee Sue Ann notes.
RBA to cut on 5 November
“The Reserve Bank of Australia (RBA) kept rates at a 12-year high of 4.35% following its 24 Sep meeting, as expected, and continued to emphasize ‘the need to remain vigilant to upside risks to inflation’.”
“The latest RBA decision came a day before data showing inflation slowing to 2.7% y/y in Aug, from 3.5% y/y in Jul, in line with consensus forecast. It marked the lowest reading since Aug 2021.”
“Our base case remains for the RBA to cut on 5 Nov, though this will be a close call, and very much dependent on upcoming data releases till then, including labour market (due 17 Oct) well as 3Q24 CPI (due 30 Oct) readings.”
EUR/CHF has carved out a higher trough near 0.9300. Recent pivot low of 0.9380 is near term support, Société Générale FX analysts note.
0.9580/0.9600 can be an important resistance zone
“EUR/CHF has recently carved out a higher trough near 0.9300 than the one achieved in August near 0.9210 denoting receding downward momentum. It has embarked on a brief rebound after this test and is probing 50-DMA.”
“Recent pivot low of 0.9380 is near term support. Defence of this can lead to persistence in bounce towards 0.9540 and August high near 0.9580/0.9600; this could be an important resistance zone.”
The Riksbank cut by 25 basis points to 3.25% yesterday as expected. But what came after that was a massive dovish surprise, Commerzbank’s FX analyst Antje Praefcke notes.
Riksbank is now also focusing more on growth
“In summary, the Riksbank has moved to massive frontloading. Further, larger steps are possible in the short term up to the first half of 2025, more than previously signaled. The Riksbank is now also focusing more on growth, which is recovering more slowly than expected, whereas inflation risks have declined significantly. With these significant cuts, the Riksbank wants to ensure that inflation stabilizes close to the target.”
“Although the Riksbank does not formulate it this way, to me it means that it sees the following risk: that if growth remains weak or the economy even shrinks, inflation could fall even further and there could even be a risk of falling back into deflation.”
“In principle, the dovish surprise is a negative factor for the SEK for the time being. However, a falling real interest rate should, as the Riksbank's forecasts indicate, help the economy in the medium term. This should provide the SEK with underlying support. Therefore, a moderate appreciation of the krona remains possible in the coming quarters.”
Reuters reported on Thursday, citing two sources with knowledge of the matter, China is planning to issue special sovereign bonds worth about 2 trillion Yuan ($284.43 billion) this year as part of a fresh fiscal stimulus.
Additional details
China to issue 1 trillion Yuan of special bonds mainly to stimulate consumption.
China to issue another 1 trillion Yuan via special bonds to help local governments tackle debt problems.
Some of the fiscal support measures could be unveiled as early as this week.
Half of the stimulus package designed to stimulate consumption, the other half to help local governments tackle debt problems.
Funds to provide monthly allowance of about 800 yuan per child to all households with two or more children, excluding first child.
Market reaction
At the time of writing, AUD/USD is slightly off intraday highs but trades 0.67% higher on the day at 0.6868.
Australian Dollar FAQs
One of the most significant factors for the Australian Dollar (AUD) is the level of interest rates set by the Reserve Bank of Australia (RBA). Because Australia is a resource-rich country another key driver is the price of its biggest export, Iron Ore. The health of the Chinese economy, its largest trading partner, is a factor, as well as inflation in Australia, its growth rate and Trade Balance. Market sentiment – whether investors are taking on more risky assets (risk-on) or seeking safe-havens (risk-off) – is also a factor, with risk-on positive for AUD.
The Reserve Bank of Australia (RBA) influences the Australian Dollar (AUD) by setting the level of interest rates that Australian banks can lend to each other. This influences the level of interest rates in the economy as a whole. The main goal of the RBA is to maintain a stable inflation rate of 2-3% by adjusting interest rates up or down. Relatively high interest rates compared to other major central banks support the AUD, and the opposite for relatively low. The RBA can also use quantitative easing and tightening to influence credit conditions, with the former AUD-negative and the latter AUD-positive.
China is Australia’s largest trading partner so the health of the Chinese economy is a major influence on the value of the Australian Dollar (AUD). When the Chinese economy is doing well it purchases more raw materials, goods and services from Australia, lifting demand for the AUD, and pushing up its value. The opposite is the case when the Chinese economy is not growing as fast as expected. Positive or negative surprises in Chinese growth data, therefore, often have a direct impact on the Australian Dollar and its pairs.
Iron Ore is Australia’s largest export, accounting for $118 billion a year according to data from 2021, with China as its primary destination. The price of Iron Ore, therefore, can be a driver of the Australian Dollar. Generally, if the price of Iron Ore rises, AUD also goes up, as aggregate demand for the currency increases. The opposite is the case if the price of Iron Ore falls. Higher Iron Ore prices also tend to result in a greater likelihood of a positive Trade Balance for Australia, which is also positive of the AUD.
The Trade Balance, which is the difference between what a country earns from its exports versus what it pays for its imports, is another factor that can influence the value of the Australian Dollar. If Australia produces highly sought after exports, then its currency will gain in value purely from the surplus demand created from foreign buyers seeking to purchase its exports versus what it spends to purchase imports. Therefore, a positive net Trade Balance strengthens the AUD, with the opposite effect if the Trade Balance is negative.
The Fed's Federal Open Market Committee (FOMC) has presented. And now it's the hot rumor on the market: big interest rate cuts (50 basis points instead of 25). It's being discussed for today's SNB decision, it's considered possible for the Riksbank in the future, it's an issue for the Bank of England and for Banxico as well, Commerzbank’s Head of FX and Commodity Research Ulrich Leuchtmann notes.
Market to be massively surprised by inflation above expectations
“The market expects Eurozone inflation of just 1.7% over the next twelve months – well below the ECB target. See figure 1 above. While market expectations probably include a risk premium, this cannot ‘explain away’ the low Eurozone inflation expectations. In particular, the fact that inflation expectations for the subsequent twelve months (1Yx1Y) are similarly low (1.77%) shows that at these prices, the market is not just concerned with insuring itself against euro area inflation by betting on low inflation in the short term. The bets on low inflation are meant seriously.”
“If US inflation is expected to remain at or around today's levels in the medium term (CPI in August 2.5%), but considerably lower in the eurozone, equally large Fed and ECB steps should be assessed differently: the ECB's steps reduce the EUR real interest rate less than the Fed's steps reduce the USD real interest rate.”
“Please note that our economists do not at all share the market's view on inflation. They expect eurozone inflation to slowly approach the 2% target, but not to undershoot it, and even to remain slightly above the target. Our medium-term EUR/USD forecast is therefore based primarily on our expectation that the market will be massively surprised by inflation above expectations.”
In a highly anticipated event, Banxico meets today to set the policy rate. The vast majority of economists favour a 25bp rate cut taking the policy rate to 10.50%. However, financial markets price a 50% chance of a 50bp rate cut.
50% chance of a 50bp rate cut
“The thinking here is that Banxico, like the Fed, could deliver a precautionary large cut now that it has switched away from inflation and towards growth concerns. Additionally, some see this as a window of opportunity for a large cut before the US elections, and an uncertain future for trade policy closes the window for such a large reduction later this year.”
“At the same time, the peso remains vulnerable to the political story. After securing judicial reforms, the government is trying to push a large hike in the minimum wage through Congress. On the former, the rating agency Moody’s is now saying that the constitutional reforms could directly impact Mexico’s sovereign credit rating. Moody’s currently has Mexico at Baa2, (S&P at BBB) and Mexico’s five-year CDS at 120bp is already trading towards a one-notch downgrade.”
“We think Banxico could risk a 50bp rate cut today to ease high real rates quickly. However, the peso would suffer and our near-term bias for USD/MXN is 19.75 and above 20.00 should a 50bp cut be delivered today.”
It is not unreasonable to expect further USD weakness, particularly when there are no significant support levels close by, UOB Group FX strategists Quek Ser Leang and Lee Sue Ann note.
Short-term levels to monitor are 6.9700 and 6.9400
24-HOUR VIEW: “Two days ago, USD plummeted. Yesterday, we indicated that ‘further sharp declines appear likely, and support is at 6.9700.’ USD then dropped to 6.9952 and then rebounded strongly. The rebound lacks momentum, and instead of continuing to advance, USD is more likely to trade in a 7.0180/7.0430 range today.”
1-3 WEEKS VIEW: “Our update from yesterday (25 Sep, spot at 6.9990) remains valid. As highlighted, after the recent sharp drop, it is not unreasonable to expect further USD weakness, particularly when there no significant support levels close by. Meanwhile, the short-term levels to monitor are 6.9700 and 6.9400. Overall, we will continue to expect a lower USD provided that 7.0600 (no change in ‘strong resistance’ level) is not breached.”
Silver prices (XAG/USD) rose on Thursday, according to FXStreet data. Silver trades at $32.25 per troy ounce, up 1.38% from the $31.81 it cost on Wednesday.
Silver prices have increased by 35.52% since the beginning of the year.
| Unit measure | Silver Price Today in USD |
|---|---|
| Troy Ounce | 32.25 |
| 1 Gram | 1.04 |
The Gold/Silver ratio, which shows the number of ounces of Silver needed to equal the value of one ounce of Gold, stood at 82.76 on Thursday, down from 83.54 on Wednesday.
Silver FAQs
Silver is a precious metal highly traded among investors. It has been historically used as a store of value and a medium of exchange. Although less popular than Gold, traders may turn to Silver to diversify their investment portfolio, for its intrinsic value or as a potential hedge during high-inflation periods. Investors can buy physical Silver, in coins or in bars, or trade it through vehicles such as Exchange Traded Funds, which track its price on international markets.
Silver prices can move due to a wide range of factors. Geopolitical instability or fears of a deep recession can make Silver price escalate due to its safe-haven status, although to a lesser extent than Gold's. As a yieldless asset, Silver tends to rise with lower interest rates. Its moves also depend on how the US Dollar (USD) behaves as the asset is priced in dollars (XAG/USD). A strong Dollar tends to keep the price of Silver at bay, whereas a weaker Dollar is likely to propel prices up. Other factors such as investment demand, mining supply – Silver is much more abundant than Gold – and recycling rates can also affect prices.
Silver is widely used in industry, particularly in sectors such as electronics or solar energy, as it has one of the highest electric conductivity of all metals – more than Copper and Gold. A surge in demand can increase prices, while a decline tends to lower them. Dynamics in the US, Chinese and Indian economies can also contribute to price swings: for the US and particularly China, their big industrial sectors use Silver in various processes; in India, consumers’ demand for the precious metal for jewellery also plays a key role in setting prices.
Silver prices tend to follow Gold's moves. When Gold prices rise, Silver typically follows suit, as their status as safe-haven assets is similar. The Gold/Silver ratio, which shows the number of ounces of Silver needed to equal the value of one ounce of Gold, may help to determine the relative valuation between both metals. Some investors may consider a high ratio as an indicator that Silver is undervalued, or Gold is overvalued. On the contrary, a low ratio might suggest that Gold is undervalued relative to Silver.
(An automation tool was used in creating this post.)
Advance in US Dollar (USD) has scope to extend above 145.00; the major resistance at 145.50 is likely out of reach for now. In the longer run, sharp advance reinforces view that USD could recover further to 145.50, UOB Group FX strategists Quek Ser Leang and Lee Sue Ann note.
USD can recover further to 145.50
24-HOUR VIEW: “We indicated yesterday that ‘the price action still seems to be part of a range trading phase, even though it is likely to trade in a lower range of 142.30/144.10 today.’ However, after dipping to 142.89, USD soared, reaching a 3-week high of 144.84. The advance has scope to extend above 145.00 today. The major resistance at 145.50 is likely out of reach for now. To maintain the buildup in momentum, USD must remain above 144.00 with minor support at 144.35.”
1-3 WEEKS VIEW: “In our most recent narrative from three days ago (23 Sep, spot at 144.20), we highlighted that ‘the strong advance in USD last week reinforces our view that USD could recover further to 145.50.’ We will continue to hold the same view provided that 142.30 (‘strong support’ level previously at 141.90) is not breached. Looking ahead, the next level to monitor above 145.50 is 147.00.”
The Czech National Bank (CNB) reduced interest rates by 25bp to 4.25%, as anticipated. The CNB’s press conference offered little new information, disregarding the Federal Reserve’s decision and refraining from commenting on market pricing, ING’s FX strategist Frantisek Taborsky notes.
EUR/CZK to decline in the short term
“Of course, the Fed rate cut and dovish global outlook will be visible in the November forecast in a downward revision of the rates path. On the other hand, the next catalyst is September inflation, which only mechanically points to 2.6% based on the previous deviation from the CNB forecast.”
“That's also what some of our numbers show, despite the drop in fuel and energy prices, which would bring the CNB to an uncomfortable level given another base effect jump in December, raising the chance of inflation returning to 3%. This is why our economists expect a pause in December.”
“From that perspective, we face a hawkish risk over the next two months, while the market leans dovish in our opinion. Paying CZK rates seems challenging in the current environment, but an inflation print could change that. Given this hawkish stance, we still anticipate EUR/CZK to decline in the short term, as suggested by the current rates differential.”
The New Zealand Dollar (NZD) could continue to decline, but it is unlikely to challenge the major support at 0.6200. In the longer run, outlook for NZD is neutral; it is likely to trade between 0.6200 and 0.6340, UOB Group FX strategists Quek Ser Leang and Lee Sue Ann note.
Likely to trade between 0.6200 and 0.6340
24-HOUR VIEW: “Our view for ‘further NZD strength’ yesterday was incorrect, as it plunged from 0.6356 to 0.6261. The sharp decline has gathered some momentum, and NZD could continue to decline today. However, given that conditions are already oversold, NZD is unlikely to challenge the major support at 0.6200 (minor support is at 0.6235). Resistance is at 0.6290, followed by 0.6315.”
1-3 WEEKS VIEW: “After NZD surged two days ago, we indicated yesterday (25 Sep, spot at 0.6350) that it ‘is expected to head higher, potentially to 0.6410.’ We did not anticipate the ensuing selloff that sent NZD plunging to 0.6261. The breach of our ‘strong support’ level at 0.6270 indicates that the buildup in momentum has faded. We hold a neutral NZD view for now, and we expect it to trade between 0.6200 and 0.6340.”
- Gold consolidates just below new all-time highs on Thursday.
- Falling interest rates globally, intensifying geopolitical conflicts and heightened Fed easing bets are the main factors.
- XAU/USD is overbought but rallying and in an uptrend on all timeframes.
Gold (XAU/USD) trades marginally higher in the $2.660s per troy ounce on Thursday amid falling global interest rates, an escalation of the conflict in the Middle East, and a weaker US Dollar (USD) due to increased odds of the US Federal Reserve (Fed) continuing with its aggressive monetary easing strategy.
Gold trades close to record highs
Gold trades just below its record high of $2,670 recorded on Wednesday. The decisions by the People’s Bank of China (PBoC), Swedish Riksbank and Central Bank of Czech Republic to slash interest rates over recent days is advantageous for Gold as it lowers the opportunity cost of holding the non-interest-paying asset, making it more attractive to investors.
A further upside factor is the escalation of the conflict between Israel and Hezbollah. On Wednesday, amid continued missile exchanges between the two enemies, the head of the Israeli Defence Forces, Herzi Halevi, told his troops in northern Israel that they should prepare for a ground offensive on Lebanon. If such an invasion should take place, it will further ratchet up risk aversion and increase safe-haven flows into the yellow metal.
Gold rallies on rising expectations of a 50 bps cut from the Federal Reserve
Although higher-than-expected US New Home Sales data for August and robust Mortgage Applications on Wednesday did not add any evidence that the US economy is heading for a hard landing, markets continue to price in another stimulatory 50 basis point (bps) (0.50%) interest rate cut from the Federal Reserve (Fed) at its November meeting. Labor market data may be more important in this regard, and Jobless Claims data out on Thursday could impact both USD and Gold.
Market-based probabilities of a jumbo 50 bps cut, according to the CME FedWatch tool, remain above 60%, which is higher than the alternative – a modest 25 bps reduction. This keeps pressure on the US Dollar and adds a further tailwind to Gold, which is mainly priced and traded in USD.
Data on Tuesday confirmed investors' worst fears after the Conference Board Consumer Confidence Index fell to 98.7 in September from an upwardly revised 105.6 in August. The result was well below consensus estimates. Labor market concerns voiced by survey respondents were a major factor.
Gold may also be holding its highs after Fed Governor Adriana Kugler (voting member) delivered a relatively dovish speech on Wednesday. Kugler's comments scored a 3.2 on FXStreet’s FedTracker, which gauges the tone of Fed officials’ speeches on a dovish-to-hawkish scale from 0 to 10, using a custom AI model.
Fed Chairman Jerome Powell is scheduled to speak on Thursday and could impact market expectations regarding Fed policy with implications for Gold price.
Technical Analysis: Gold consolidates just below all-time-highs
Gold consolidates just below its record high of $2,670 on Thursday. Overall, it is in an uptrend on a short, medium and long-term basis. Since it is a foundational principle of technical analysis that “the trend is your friend,” the odds favor even more upside for the yellow metal.
XAU/USD Daily Chart
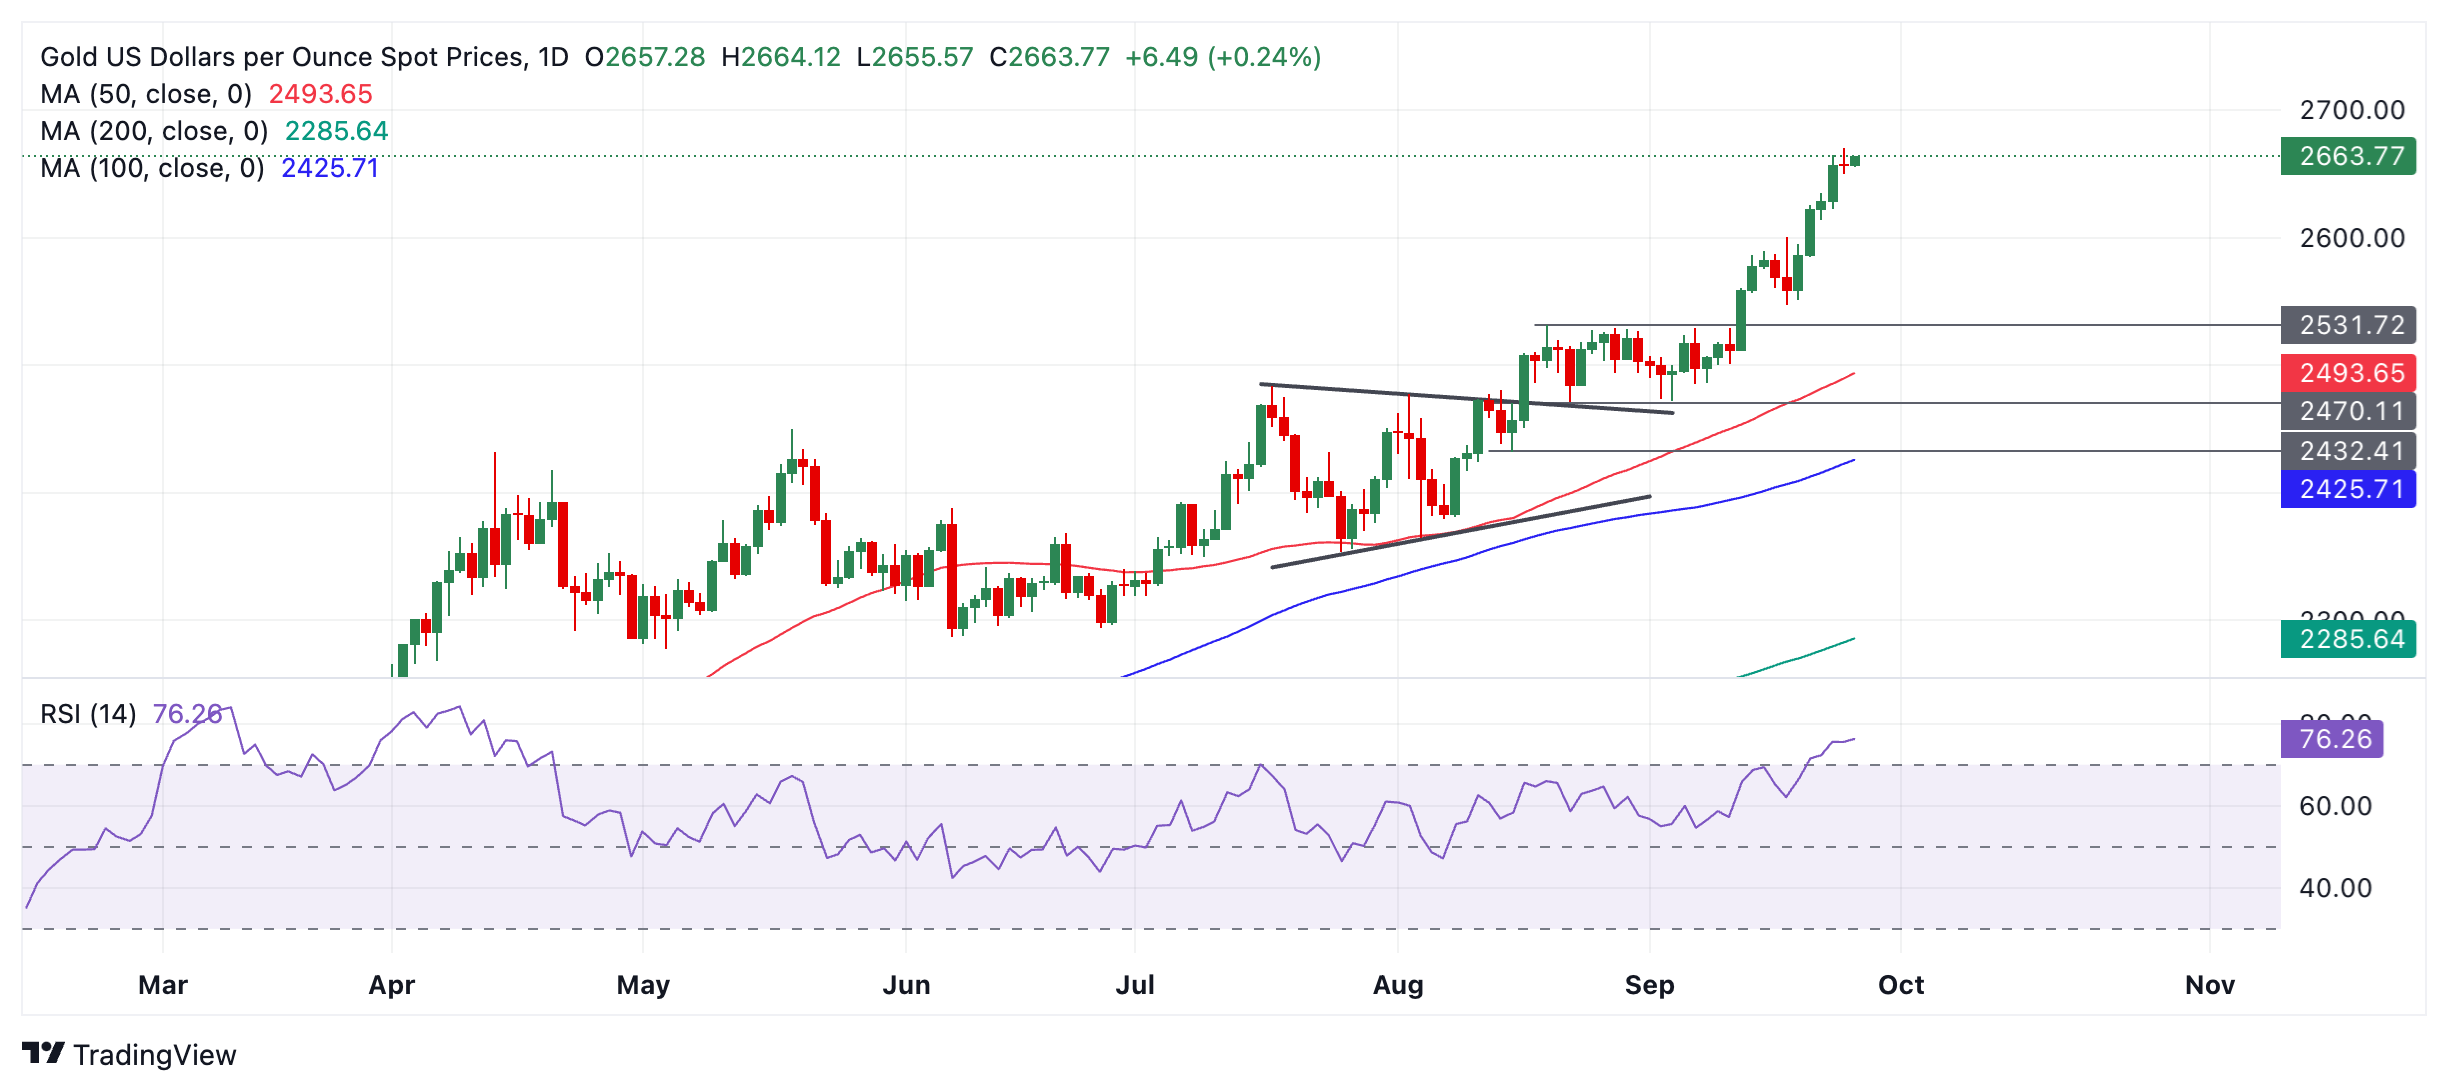
Yet Gold is also now overbought, according to the Relative Strength Index (RSI) momentum indicator, and this increases the chances of a pullback. It also advises traders not to add to their long positions. If Gold exits overbought, it will be a sign to close long positions and sell shorts, as it would suggest a correction is in the process of unfolding.
That said, RSI can remain overbought for fairly long periods of time in a strongly trending market, and if Gold breaks above its record high it will confirm the establishment of a higher high and the extension of the uptrend. The next targets to the upside are the round numbers $2,700 and then $2,750.
If a correction evolves, firm support lies at $2,600 (September 18 high), $2,550 and $2,544 (0.382 Fibonacci retracement of the September rally).
Gold FAQs
Gold has played a key role in human’s history as it has been widely used as a store of value and medium of exchange. Currently, apart from its shine and usage for jewelry, the precious metal is widely seen as a safe-haven asset, meaning that it is considered a good investment during turbulent times. Gold is also widely seen as a hedge against inflation and against depreciating currencies as it doesn’t rely on any specific issuer or government.
Central banks are the biggest Gold holders. In their aim to support their currencies in turbulent times, central banks tend to diversify their reserves and buy Gold to improve the perceived strength of the economy and the currency. High Gold reserves can be a source of trust for a country’s solvency. Central banks added 1,136 tonnes of Gold worth around $70 billion to their reserves in 2022, according to data from the World Gold Council. This is the highest yearly purchase since records began. Central banks from emerging economies such as China, India and Turkey are quickly increasing their Gold reserves.
Gold has an inverse correlation with the US Dollar and US Treasuries, which are both major reserve and safe-haven assets. When the Dollar depreciates, Gold tends to rise, enabling investors and central banks to diversify their assets in turbulent times. Gold is also inversely correlated with risk assets. A rally in the stock market tends to weaken Gold price, while sell-offs in riskier markets tend to favor the precious metal.
The price can move due to a wide range of factors. Geopolitical instability or fears of a deep recession can quickly make Gold price escalate due to its safe-haven status. As a yield-less asset, Gold tends to rise with lower interest rates, while higher cost of money usually weighs down on the yellow metal. Still, most moves depend on how the US Dollar (USD) behaves as the asset is priced in dollars (XAU/USD). A strong Dollar tends to keep the price of Gold controlled, whereas a weaker Dollar is likely to push Gold prices up.
In a highly anticipated event, Banxico meets today to set the policy rate. The vast majority of economists favour a 25bp rate cut taking the policy rate to 10.50%. However, financial markets price a 50% chance of a 50bp rate cut, ING's FX analyst Chris Turner notes.
50% chance of a 50bp rate cut
“The thinking here is that Banxico, like the Fed, could deliver a precautionary large cut now that it has switched away from inflation and towards growth concerns. Additionally, some see this as a window of opportunity for a large cut before the US elections, and an uncertain future for trade policy closes the window for such a large reduction later this year.”
“At the same time, the peso remains vulnerable to the political story. After securing judicial reforms, the government is trying to push a large hike in the minimum wage through Congress. On the former, the rating agency Moody’s is now saying that the constitutional reforms could directly impact Mexico’s sovereign credit rating. Moody’s currently has Mexico at Baa2, (S&P at BBB) and Mexico’s five-year CDS at 120bp is already trading towards a one-notch downgrade.”
“We think Banxico could risk a 50bp rate cut today to ease high real rates quickly. However, the peso would suffer and our near-term bias for USD/MXN is 19.75 and above 20.00 should a 50bp cut be delivered today.”
- AUD/USD price grapples to break above the lower boundary of the ascending channel around the level of 0.6860.
- The 14-day RSI remains above the 50 level, suggesting that bullish sentiment is still intact.
- A successful return into the channel would strengthen the bullish bias for the pair.
AUD/USD retraces its recent losses from the previous session, trading around 0.6860 during the European hours on Thursday. Technical analysis of the daily chart shows the pair attempting to break above the lower boundary of an ascending channel pattern. A successful return to the channel would strengthen the bullish outlook.
The 14-day Relative Strength Index (RSI) remains above the 50 level, suggesting that bullish sentiment is still intact. A further move toward the 70 level would strengthen the upside trend for the pair.
On the upside, the AUD/USD pair is testing the lower boundary of the ascending channel at the 0.6860 level. A successful rebound into the channel would provide support for the pair to move toward the upper boundary, located around the 0.6960 level.
In terms of support, the AUD/USD pair may find immediate support at the nine-day Exponential Moving Average (EMA) around the 0.6815 level. The next key support level is the psychological barrier at 0.6700. A drop below this level could drive the pair further down toward its six-week low of 0.6622, which was recorded on September 11.
AUD/USD: Daily Chart
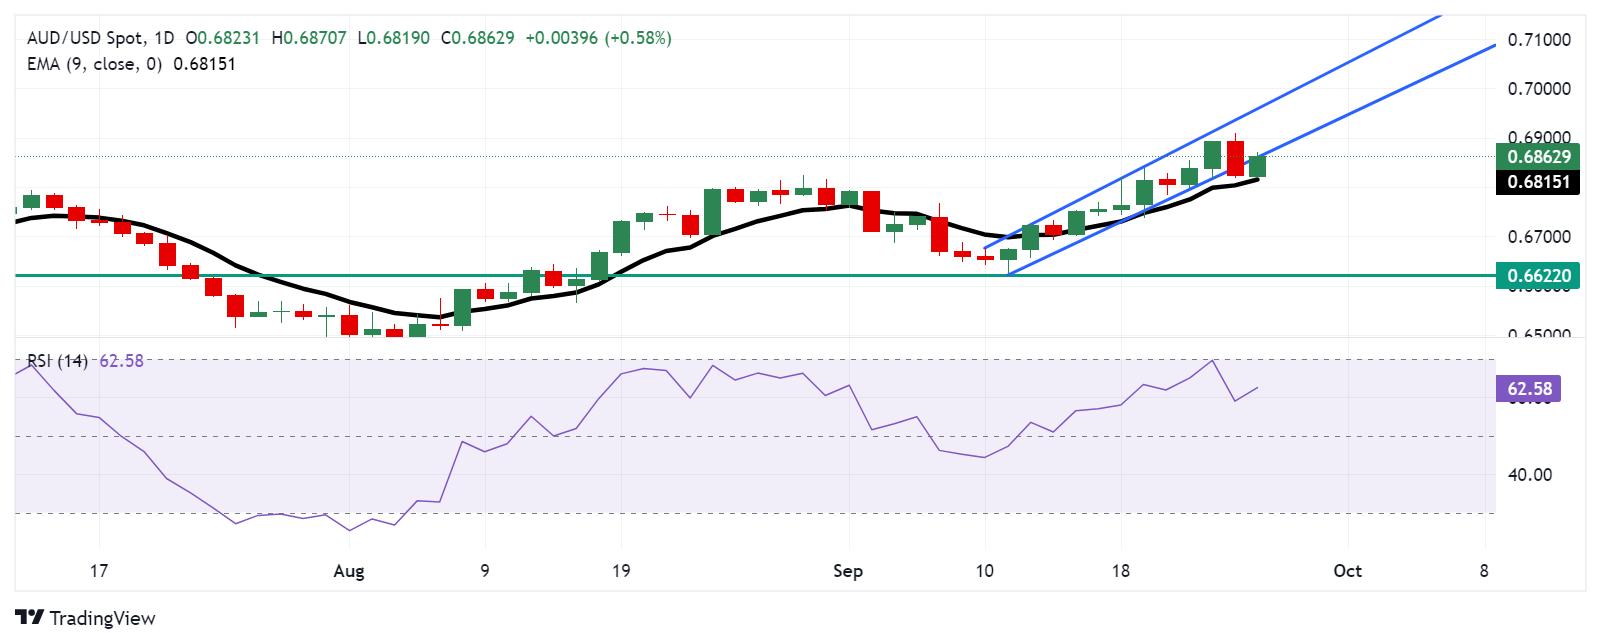
Australian Dollar PRICE Today
The table below shows the percentage change of Australian Dollar (AUD) against listed major currencies today. Australian Dollar was the strongest against the Japanese Yen.
| USD | EUR | GBP | JPY | CAD | AUD | NZD | CHF | |
|---|---|---|---|---|---|---|---|---|
| USD | -0.12% | -0.21% | 0.01% | -0.14% | -0.59% | -0.36% | -0.13% | |
| EUR | 0.12% | -0.09% | 0.11% | -0.02% | -0.46% | -0.24% | -0.01% | |
| GBP | 0.21% | 0.09% | 0.19% | 0.08% | -0.37% | -0.17% | 0.09% | |
| JPY | -0.01% | -0.11% | -0.19% | -0.11% | -0.60% | -0.38% | -0.13% | |
| CAD | 0.14% | 0.02% | -0.08% | 0.11% | -0.44% | -0.22% | 0.02% | |
| AUD | 0.59% | 0.46% | 0.37% | 0.60% | 0.44% | 0.23% | 0.46% | |
| NZD | 0.36% | 0.24% | 0.17% | 0.38% | 0.22% | -0.23% | 0.24% | |
| CHF | 0.13% | 0.00% | -0.09% | 0.13% | -0.02% | -0.46% | -0.24% |
The heat map shows percentage changes of major currencies against each other. The base currency is picked from the left column, while the quote currency is picked from the top row. For example, if you pick the Australian Dollar from the left column and move along the horizontal line to the US Dollar, the percentage change displayed in the box will represent AUD (base)/USD (quote).
The Australian Dollar (AUD) could dip below 0.6800 before stabilisation is likely; the next support at 0.6750 is not expected to come into view. In the longer run, advance in AUD has come to an end; it is likely to trade between 0.6750 and 0.6900 for now, UOB Group FX strategists Quek Ser Leang and Lee Sue Ann note.
Advance in AUD has come to an end
24-HOUR VIEW: “We expected AUD to ‘continue to rise yesterday.’ Our view was incorrect, as it sold off sharply instead, plunging to a low of 0.6817 (closed at 0.6823, -1.00%). The sharp drop could dip below 0.6800 before stabilisation is likely. The next support at 0.6750 is not expected to come into view. On the upside, if AUD breaks above 0.6865 (minor resistance is at 0.6845), it would indicate that the weakness has stabilised.”
1-3 WEEKS VIEW: “We have held a positive AUD view since early last week. As we tracked the advance, in our update from yesterday (25 Sep, spot at 0.6900), we held the view that it ‘could advance further to 0.6955.’ We indicated that ‘the positive outlook is intact as long as 0.6820 (‘strong support’ level) is not breached.’ We did not expect the sharp and swift drop, as AUD plummeted to a low of 0.6817. The price action indicates that the advance in AUD has come to an end. AUD has likely moved into a range trading phase, and it is likely to trade between 0.6750 and 0.6900 for now.”
- The Mexican Peso has made losses in line with the established trend ahead of the Banxico meeting on Thursday.
- Most analysts expect a moderate 0.25% cut to the central bank’s cash rate.
- USD/MXN steadily climbs within its rising channel, solidifying the overall bullish bias.
The Mexican Peso (MXN) seesaws between tepid gains and losses in its major pairs on Thursday, ahead of the Bank of Mexico (Banxico) September policy meeting scheduled for 19:00 GMT. Given changes in interest rates can have the high impact on exchange rates, this is likely to be the most important event for the currency this week.
Mexican Peso: Analysts expect 25 bps rate cut today
The Mexican Peso will be in the spotlight today as the Banxico meet to discuss monetary policy and weigh a cut to its official interest rate.
A reduction in interest rates normally has a depreciating effect on a country’s currency because it makes it a less attractive place for investors to park their capital.
The current consensus amongst economists and analysts is that the central bank will opt for a 25 basis point (bps) cut, or 0.25% reduction, in its official cash rate, bringing it down to 10.50% from 10.75%.
In a recent survey of 25 economists by Bloomberg, 20 expected a 25 bps cut, one expected no-change, and four expected a larger 50 bps cut (0.50%).
The survey was held before Mexican inflation data released on Tuesday showed headline inflation (INPC) over the last 12 months fell to 4.66% in Mexico in mid-September, and core inflation (Subyacente) to 3.95%, according to the Instituto Nacional de Estadística Geografía (INEGI). The slight easing in inflation may have increased the odds of a larger 50 bps cut.
That said, data released on Monday showed buoyant Retail Sales and a greater-than-expected rise in Mexico’s economic activity in July, which would argue for a more moderate reduction in borrowing costs in order to avoid overheating.
At the August meeting, Banxico decided to cut interest rates by 0.25%. But the decision was a close call. Only three members voted for the cut versus two who voted to keep interest rates unchanged. The fact it was not unanimous increases the chances of a smaller 25 bps cut over a larger 50 bps reduction.
“One might wonder whether Banxico will also start cutting rates by 50 basis points,” comments Michael Pfister, FX Analyst at Commerzbank, in a note on Thursday. “However, this seems unlikely, at least for the time being. The reasons for this are the aforementioned stubborn inflation, but also the fact that the data from the real economy, while pointing to a slowdown, do not point to a significant economic downturn. In short, Banxico is likely to cut rates by another 25 basis points today,” adds the analyst.
Technical Analysis: USD/MXN starts rising up within channel again
USD/MXN pushes higher within its rising channel, continuing the uptrend bias of recent months. Overall, it is in a short, medium and long-term uptrend. Given the theory that “the trend is your friend”, it’s more likely than not to continue higher.
USD/MXN Daily Chart
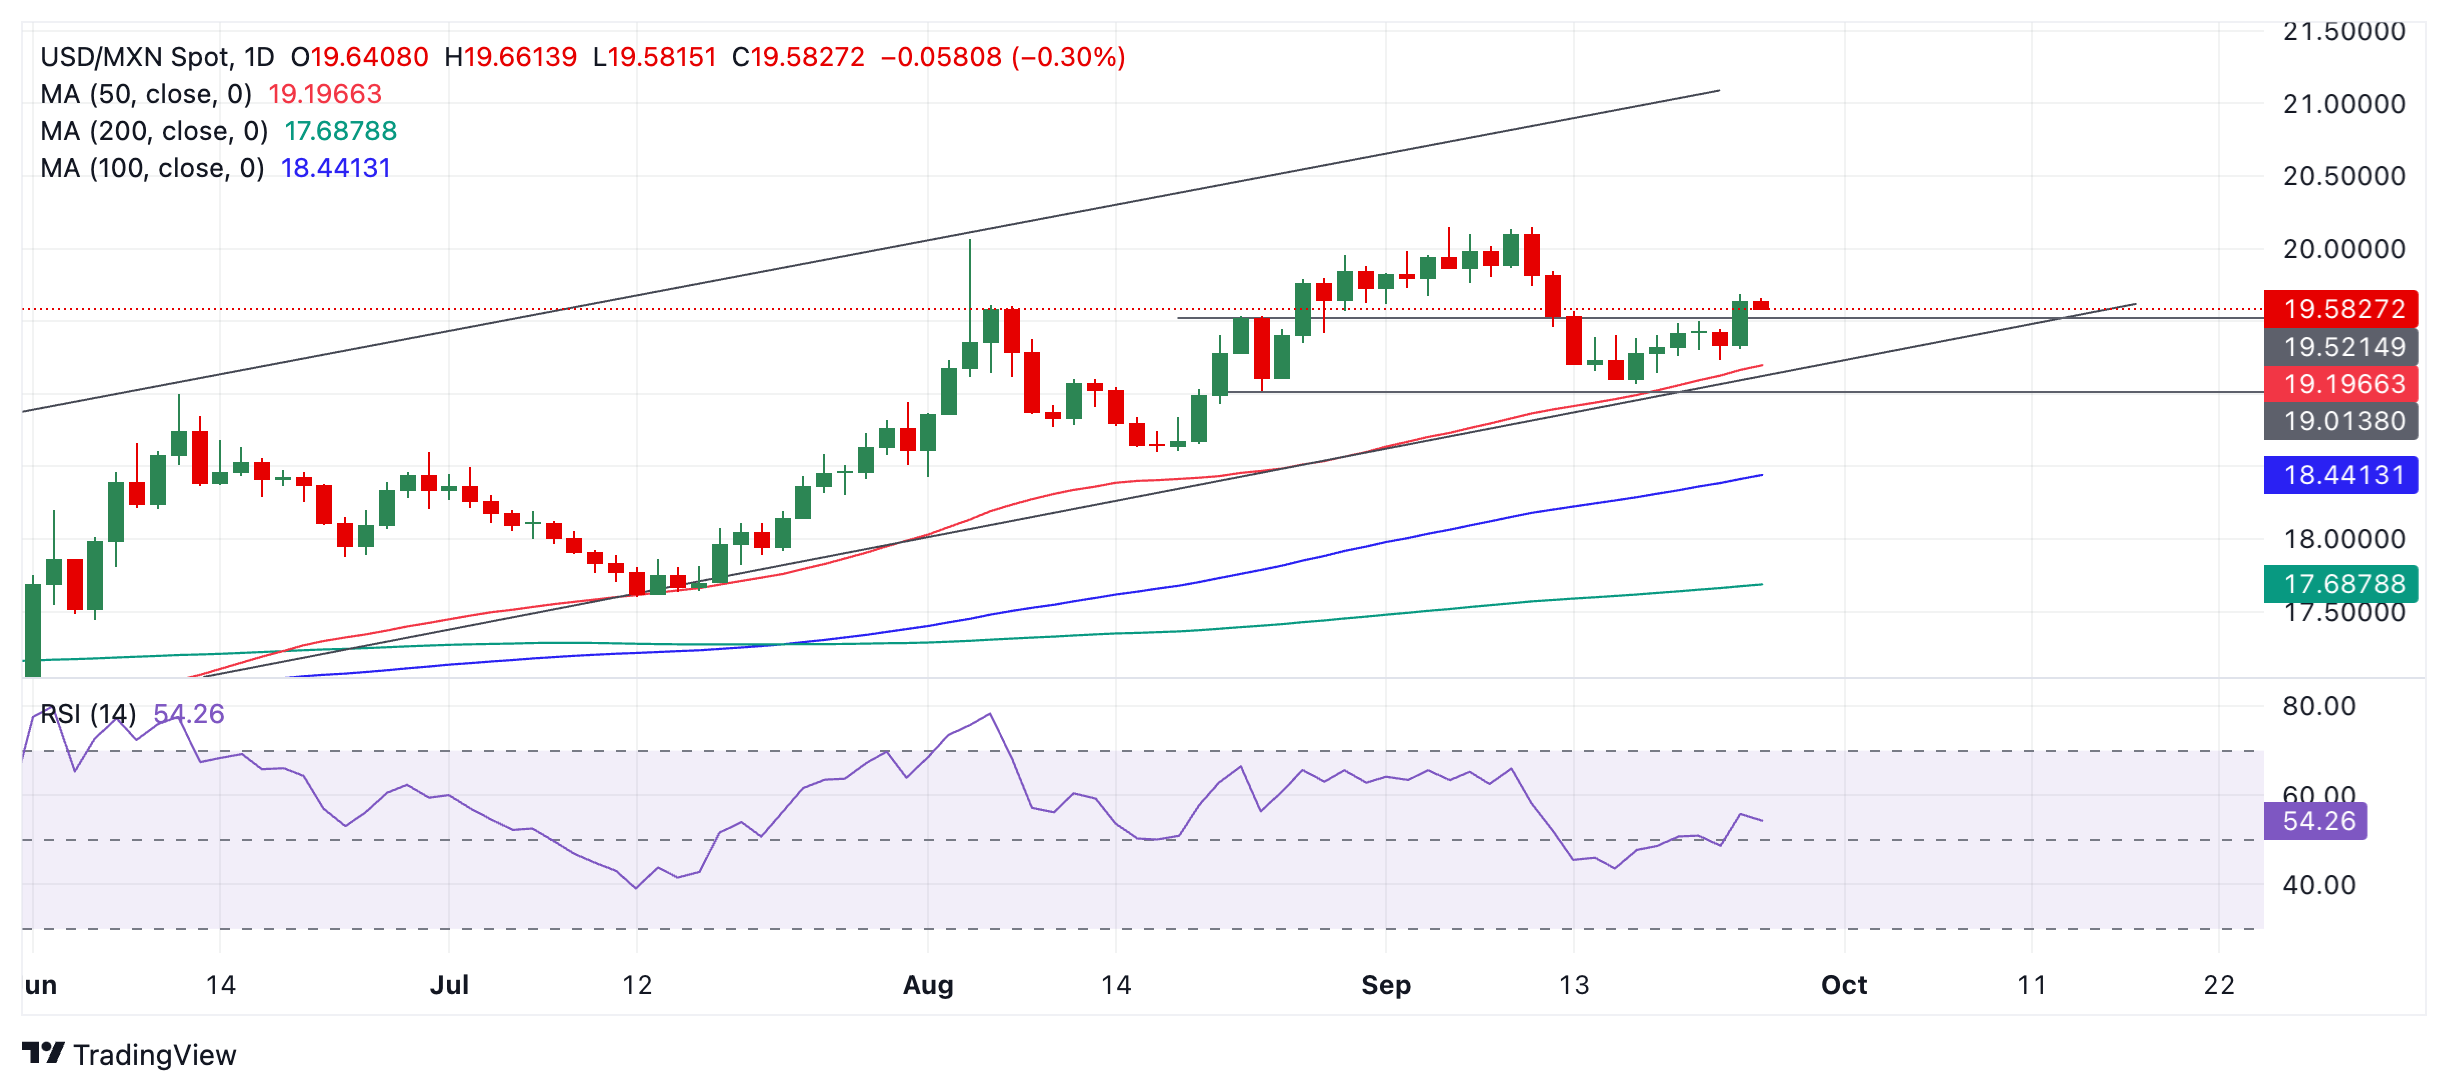
Wednesday’s close above 19.53 (August 23 swing high) provides more bullish confirmation that the pair has established a near-term upside bias after it recently bottomed out at the base of the rising channel.
If it can break above 19.68 (the September 25 high), it will confirm more upside towards a target at 20.15, the high of the yer.
Economic Indicator
Central Bank Interest Rate
The Bank of Mexico announces a key interest rate which affects the whole range of interest rates set by commercial banks, building societies and other institutions for their own savers and borrowers. Generally speaking, if the central bank is hawkish about the inflationary outlook of the economy and rises the interest rates it is positive, or bullish, for the Mexican Peso.
Read more.Next release: Thu Sep 26, 2024 19:00
Frequency: Irregular
Consensus: 10.5%
Previous: 10.75%
Source: Banxico
The support from China’s stimulus story waned yesterday, and EUR/USD’s exploration above 1.1200 proved to be very short-lived amid quarter-end USD buying, ING’s FX strategist Francesco Pesole notes.
EUR/USD’s exploration above 1.1200 is short-lived
“We will likely see a bit more range-bound swings around the 1.110-1.120 area in the near term unless US data offers clearer direction to markets. A 2-year EUR:USD swap rate gap tighter than -100bp (now at -95bp) is still arguing against a major correction in the pair.”
“The eurozone calendar is rather quiet today, but there are three key ECB speakers. President Lagarde will give a welcome address at a conference (but may not touch upon monetary policy), while the dovish-leaning Guindos and hawkish-leaning Schnabel are due to speak later this afternoon.”
The Pound Sterling (GBP) could continue to decline; oversold weakness suggest it is unlikely to threaten the support at 1.3250. In the longer run, more than week-long GBP strength has ended; it is likely to trade in a 1.3200/1.3430 range for the time being, UOB Group FX strategists Quek Ser Leang and Lee Sue Ann note.
Likely to trade in a 1.3200/1.3430
24-HOUR VIEW: “We were of the view that GBP ‘could rise and potentially reach 1.3450’ yesterday. However, after rising to 1.3430, GBP fell and broke below a few support levels, reaching a low of 1.3314. While GBP could continue to decline today, oversold conditions suggest that any weakness is unlikely to threaten the support at 1.3250 (minor support is at 1.3290). On the upside, resistance levels are at 1.3360 and 1.3390.”
1-3 WEEKS VIEW: “Last Tuesday (17 Sep, spot at 1.3210), we indicated that ‘increase in momentum is likely to lead to further GBP strength.’ As GBP subsequently rose, we tracked the advance, and yesterday (25 Sep, spot at 1.3420) we indicated that ‘the boost in momentum indicates further GBP strength is likely, and the next level to watch is 1.3480.’ GBP then rose to 1.3430 and then fell sharply, breaking below our ‘strong support’ level at 1.3330. The breach of the ‘strong support’ level, combined with an ‘outside reversal day’ indicates that GBP strength has ended. The current price movements are likely the early stages of a range trading phase. In other words, we expect GBP to trade in a range for the time being, likely between 1.3200 and 1.3430.”
- WTI attracts some follow-through sellers and dives to a two-week trough on Thursday.
- News that Saudi Arabia will raise output and demand worries weigh on the commodity.
- The technical setup favors bears and supports prospects for a further depreciating move.
West Texas Intermediate (WTI) US crude Oil prices remain under heavy selling pressure for the second straight day and retreat further from a multi-week high, around the $72.20 region touched on Tuesday. The downward trajectory drags the commodity to a two-week low, around the $67.00/barrel mark during the first half of the European session and is sponsored by fresh concerns about global oversupply.
The Financial Times reported that Saudi Arabia – the world's biggest crude exporter – is preparing to abandon its price target of $100/barrier as it prepares to increase output. This comes on top of a potential return of Libyan supply and turns out to be a key factor exerting downward pressure on Crude Oil prices. In fact, Libya's factions took an initial step to resolve the dispute and signed an agreement on the process of appointing a central bank governor.
Furthermore, a hurricane threatening the US Gulf Coast has changed its course – away from oil and gas-producing areas near Texas, Louisiana and Mississippi – and is expected to hit Florida as a 'catastrophic' Category 4 storm. This further eases worries over supply disruptions, which overshadows signs of firmer fuel demand in the US – the world's top oil consumer – and further contributes to the fall amid lingering fuel demand concerns from China.
From a technical perspective, Crude Oil prices showed some resilience below the 61.8% Fibonacci retracement level of the recent recovery from the lowest level since May 2023 touched earlier this month and bounced back to the $68.00 round-figure mark. That said, the lack of follow-through buying, along with the fact that oscillators on the daily chart are holding in negative territory, suggests that the path of least resistance for the commodity is to the downside.
Bearish traders, however, need to wait for a sustained break below the $67.00 round figure before positioning for further losses. Crude Oil prices might then weaken further below the $66.45 area, or the 61.8% Fibo. level, towards the $66.00 mark and the $65.75-$65.70 horizontal support. The downward trajectory could drag the commodity further towards the $65.00 psychological mark en route to the YTD low, around the $64.75 region.
WTI 4-hour chart
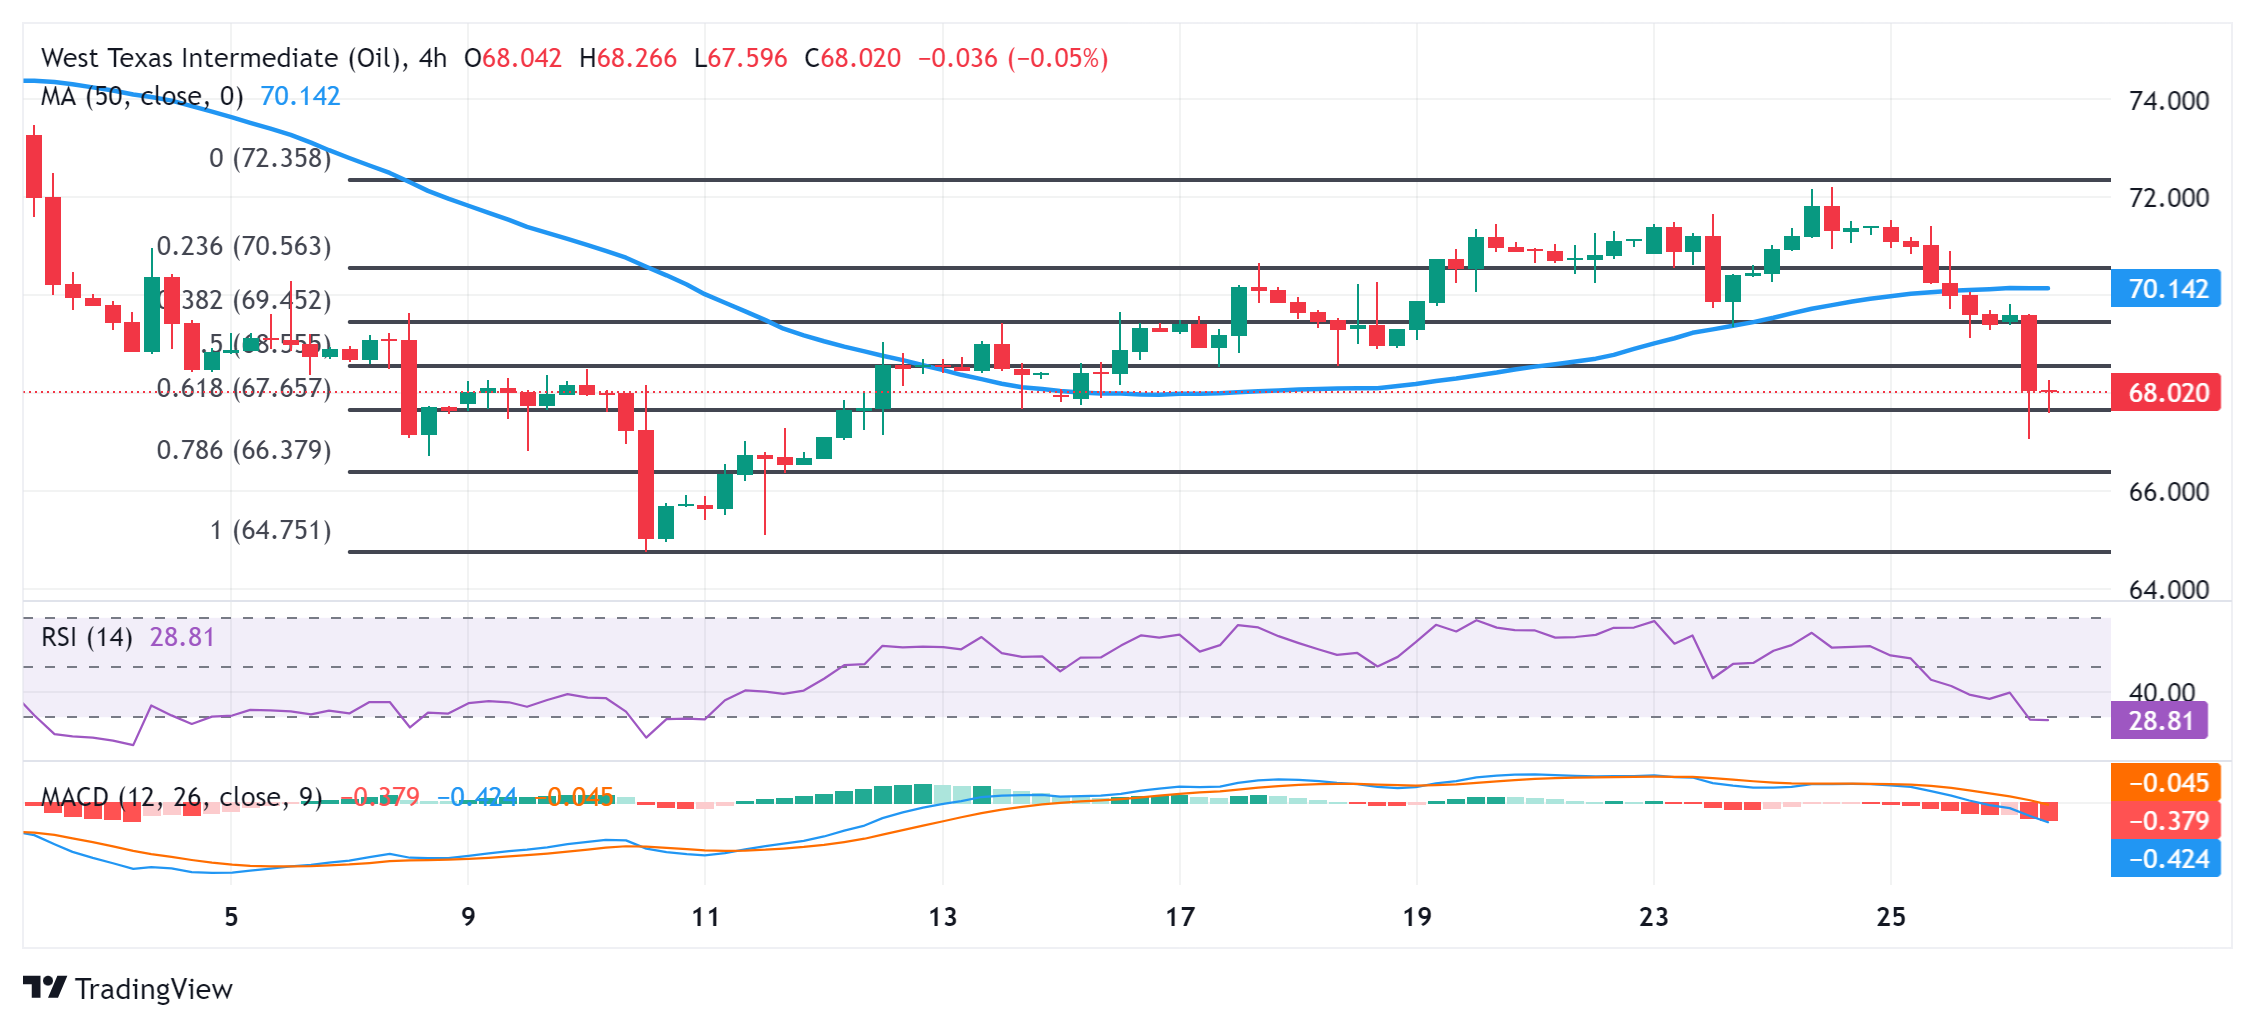
WTI Oil FAQs
WTI Oil is a type of Crude Oil sold on international markets. The WTI stands for West Texas Intermediate, one of three major types including Brent and Dubai Crude. WTI is also referred to as “light” and “sweet” because of its relatively low gravity and sulfur content respectively. It is considered a high quality Oil that is easily refined. It is sourced in the United States and distributed via the Cushing hub, which is considered “The Pipeline Crossroads of the World”. It is a benchmark for the Oil market and WTI price is frequently quoted in the media.
Like all assets, supply and demand are the key drivers of WTI Oil price. As such, global growth can be a driver of increased demand and vice versa for weak global growth. Political instability, wars, and sanctions can disrupt supply and impact prices. The decisions of OPEC, a group of major Oil-producing countries, is another key driver of price. The value of the US Dollar influences the price of WTI Crude Oil, since Oil is predominantly traded in US Dollars, thus a weaker US Dollar can make Oil more affordable and vice versa.
The weekly Oil inventory reports published by the American Petroleum Institute (API) and the Energy Information Agency (EIA) impact the price of WTI Oil. Changes in inventories reflect fluctuating supply and demand. If the data shows a drop in inventories it can indicate increased demand, pushing up Oil price. Higher inventories can reflect increased supply, pushing down prices. API’s report is published every Tuesday and EIA’s the day after. Their results are usually similar, falling within 1% of each other 75% of the time. The EIA data is considered more reliable, since it is a government agency.
OPEC (Organization of the Petroleum Exporting Countries) is a group of 13 Oil-producing nations who collectively decide production quotas for member countries at twice-yearly meetings. Their decisions often impact WTI Oil prices. When OPEC decides to lower quotas, it can tighten supply, pushing up Oil prices. When OPEC increases production, it has the opposite effect. OPEC+ refers to an expanded group that includes ten extra non-OPEC members, the most notable of which is Russia.
The USD rallied across the board on Wednesday as quarter-end flows probably favoured a broad positioning adjustment, ING’s FX strategist Francesco Pesole notes.
Substantial risk USD stays capped into the US election
“Based on the latest CFTC figures, we calculate that the dollar was in net-short territory against the other reported G10 currencies on 17 September, but that amounted to a relatively small 4% of open interest.”
“Today, the US data calendar is quite busy. The third GDP/PCE second-quarter print should not surprise, and jobless claims may be the more market-moving release along with August’s durable goods orders and the leading index. On the Fedspeak side, Chair Powell will give pre-recorded opening remarks, and there is a long list of other speakers: Collins, Bowman, Williams, Barr, Cook and Kashkari. There should be some extra colour on each member’s Dot Plot submission.”
“The quarter-end flows may continue to offer the USD some modest support today, barring negative US data surprises, but the positioning picture did not look that heavily skewed to dollar shorts to justify large readjustments. Ultimately, stronger US data is needed to convince markets to abandon 50bp cut bets. That may not happen overnight, and there is still a substantial risk the dollar will stay capped into the US election.”
- USD/JPY has returned to trade back inside its rising channel after a false breakdown.
- The pair is in a short-term and long-term uptrend suggesting a bias towards the upside.
USD/JPY has recovered back inside its rising channel after a temporary downside break on September 24.
The pair has broken above the 50, 100 and 200-period Simple Moving Averages (SMA) and is in an established short-term uptrend.
USD/JPY 4-hour Chart
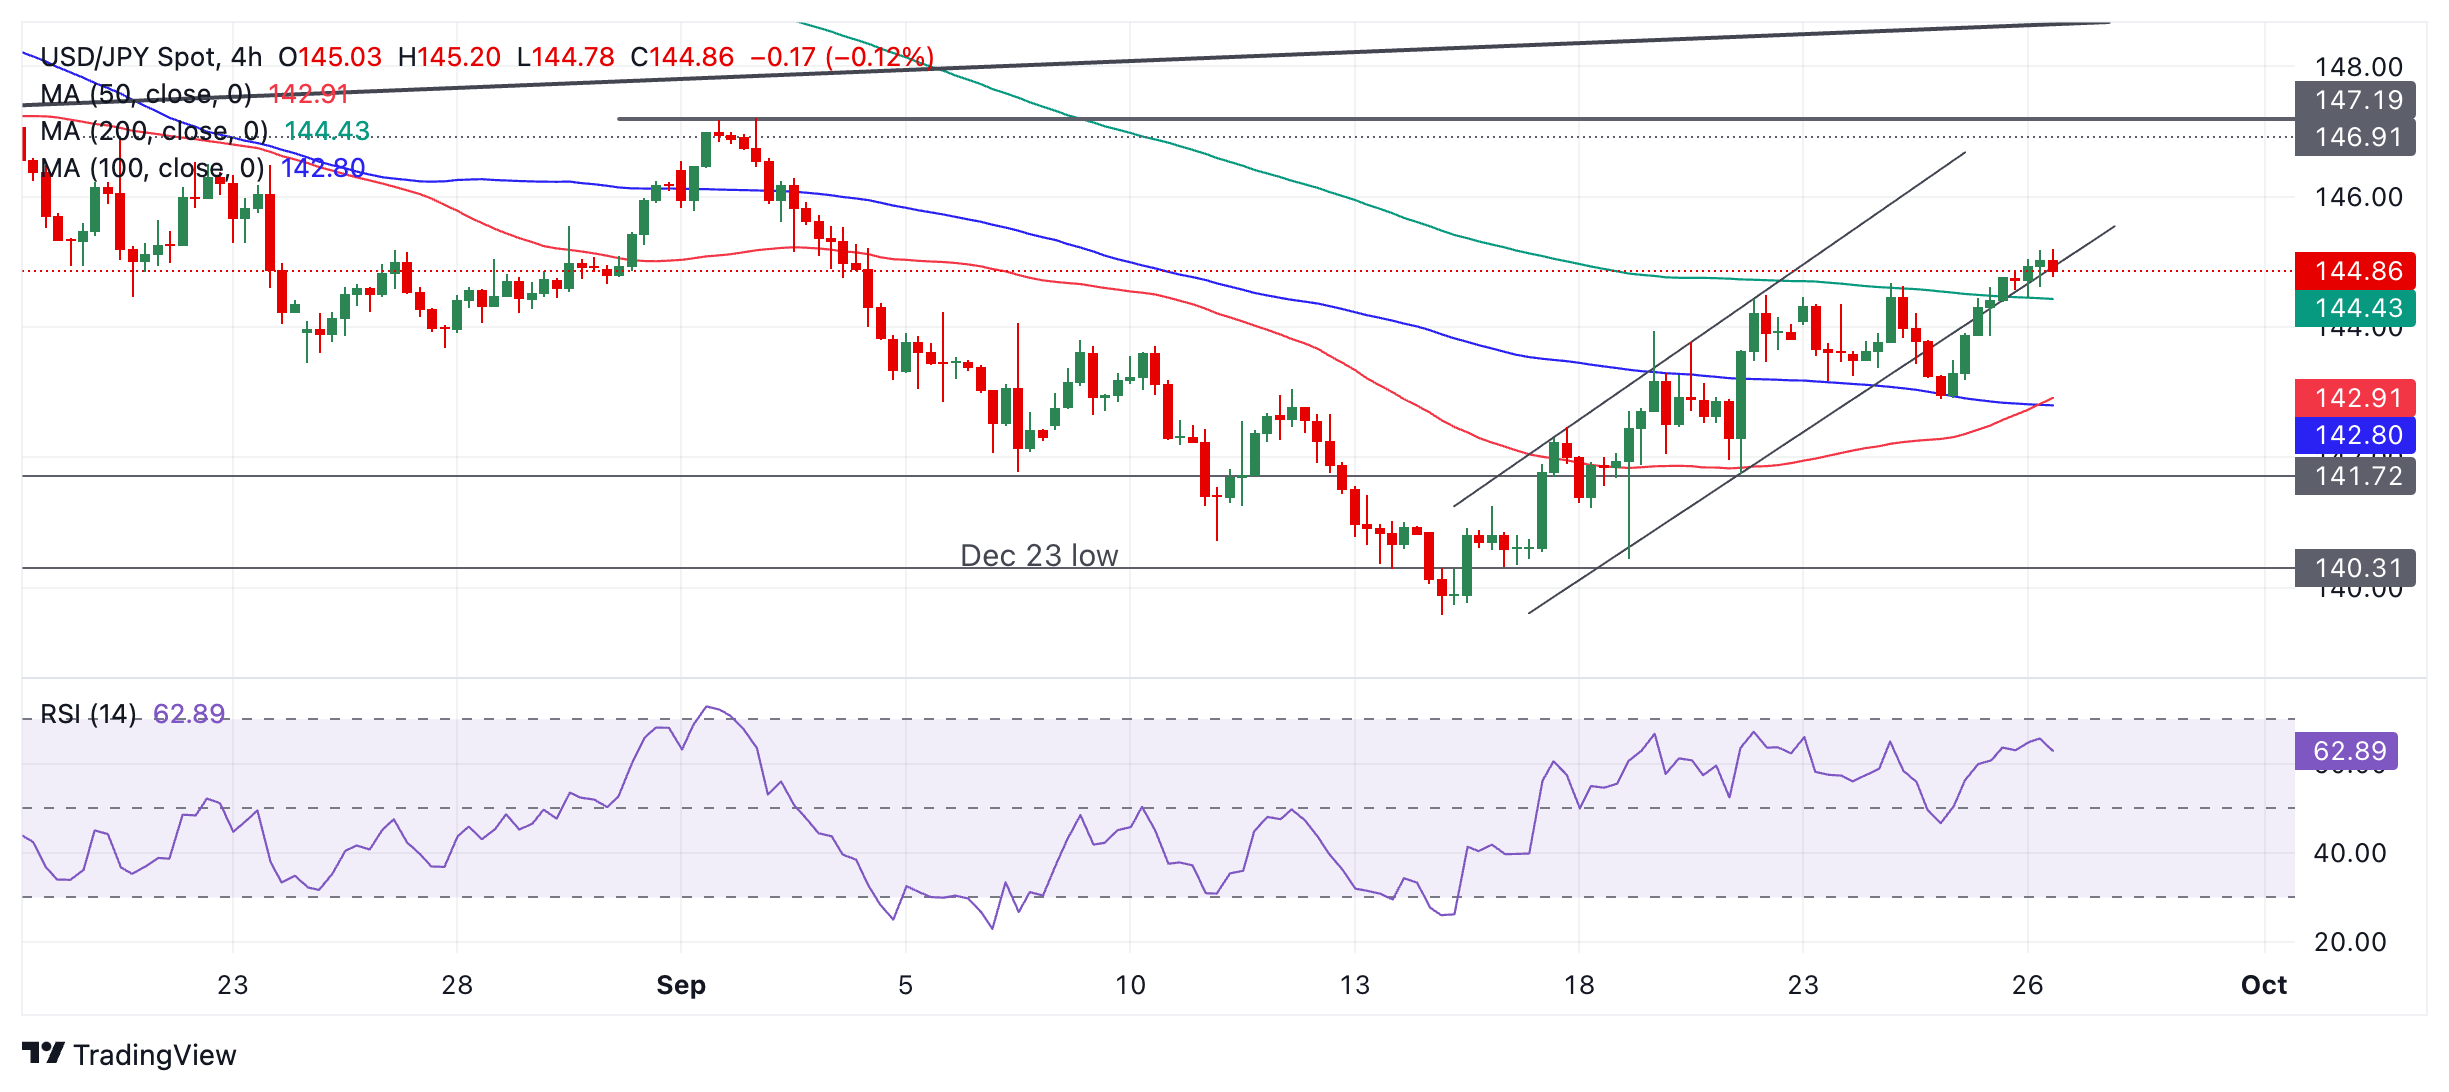
Given it is a principle of technical analysis that “the trend is your friend” the odds favor a continuation higher.
Momentum as measured by the Relative Strength Index (RSI) is confirming the bullish bias, although it is easing somewhat.
A break above the current day’s high of 145.20 would suggest a continuation of the trend with tentative targets lying at 145.50 and finally in a bullish case 146.00.
The medium-term trend was bearish but it is now unclear and could arguably be bullish. USD/JPY remains in a long-term uptrend.
The Euro (EUR) is likely to trade in a 1.1110/1.1170 range. EUR has likely entered a range trading phase, probably between 1.1060 and 1.1215, UOB Group FX strategists Quek Ser Leang and Lee Sue Ann note.
Rangebound for the time being
24-HOUR VIEW: “We highlighted yesterday that ‘there is a chance for EUR to rise above 1.1200, but there does not appear to be enough momentum for it to reach 1.1230.’ While our view was not wrong, as EUR rose to 1.1213, the sharp drop from the high was unexpected (low has been 1.1121). The swift decline appears to be overdone, and EUR is unlikely to weaken much further. Today, EUR is more likely to trade in a 1.1110/1.1170 range.”
1-3 WEEKS VIEW: “Yesterday (25 Sep, spot at 1.1180), we indicated that ‘while the choppy swings over the past couple of days have clouded the outlook, firm short-term momentum suggests EUR could rise towards 1.1230.’ We added, ‘the upside bias is intact as long as it remains above 1.1110.’ EUR then rose to 1.1213, pulling sharply to 1.1121. Although our ‘strong support’ level at 1.1110 has not been breached yet, the short-term upward momentum has faded. EUR has likely entered a range trading phase, probably between 1.1060 and 1.1215.”
- USD/CNH gained ground following China’s plans for fresh stimulus measures to support its economy.
- China plans to inject over CNY 1 trillion in capital into its largest state banks, which are facing challenges.
- CME FedWatch Tool suggests around a 50% chance of totaling 75 basis points Fed rate cuts in 2024.
USD/CNH loses ground as China announces plans for additional stimulus measures to bolster its economy, offsetting the diminishing effects of Tuesday’s measures. The USD/CNH pair trades around 7.00 during the European hours on Thursday. The People’s Bank of China (PBoC) set the USD/CNY central rate for the trading session ahead at 7.0354, as compared to the previous day's fix of 7.0202 and 7.0367 Reuters estimates.
China plans to inject over CNY 1 trillion in capital into its largest state banks, which are facing challenges such as shrinking margins, declining profits, and increasing bad loans. This substantial capital infusion would mark the first of its kind since the 2008 global financial crisis.
The US Dollar (USD) receives downward pressure from rising odds of further interest rate cuts by the US Federal Reserve (Fed) in upcoming policy meetings. According to the CME FedWatch Tool, markets are pricing in around a 50% chance of totaling 75 basis points to be deducted by the Fed to a range of 4.0-4.25% by the end of this year.
Federal Reserve Governor Adriana Kugler said on Wednesday that she “strongly supported” the Fed’s decision to cut the interest rates by a half point last week. Kugler further stated that it will be appropriate to make additional rate cuts if inflation continues to ease as expected, per Bloomberg.
Traders will likely observe the release of the final US Gross Domestic Product (GDP) Annualized for the second quarter (Q2) scheduled to be released later in the North American session.
Interest rates FAQs
Interest rates are charged by financial institutions on loans to borrowers and are paid as interest to savers and depositors. They are influenced by base lending rates, which are set by central banks in response to changes in the economy. Central banks normally have a mandate to ensure price stability, which in most cases means targeting a core inflation rate of around 2%. If inflation falls below target the central bank may cut base lending rates, with a view to stimulating lending and boosting the economy. If inflation rises substantially above 2% it normally results in the central bank raising base lending rates in an attempt to lower inflation.
Higher interest rates generally help strengthen a country’s currency as they make it a more attractive place for global investors to park their money.
Higher interest rates overall weigh on the price of Gold because they increase the opportunity cost of holding Gold instead of investing in an interest-bearing asset or placing cash in the bank. If interest rates are high that usually pushes up the price of the US Dollar (USD), and since Gold is priced in Dollars, this has the effect of lowering the price of Gold.
The Fed funds rate is the overnight rate at which US banks lend to each other. It is the oft-quoted headline rate set by the Federal Reserve at its FOMC meetings. It is set as a range, for example 4.75%-5.00%, though the upper limit (in that case 5.00%) is the quoted figure. Market expectations for future Fed funds rate are tracked by the CME FedWatch tool, which shapes how many financial markets behave in anticipation of future Federal Reserve monetary policy decisions.
- The Pound Sterling recovers to near 1.3350 against the US Dollar as investors expect the Fed to cut interest rates by 50 bps in November.
- Investors await the Fed Powell’s speech on Thursday and the PCE inflation data for August on Friday.
- The BoE is expected to follow a shallow monetary policy-easing cycle.
The Pound Sterling (GBP) rebounds slightly from the key support near 1.3300 against the US Dollar (USD) in Thursday’s London session after correcting sharply on Wednesday. The GBP/USD finds cushion as investors have broadly underpinned the Pound Sterling against the Greenback due to firm speculation that the Federal Reserve’s (Fed) policy-easing cycle would be deeper and faster than the one to be followed by the Bank of England (BoE) in the remainder of the year.
According to the CME FedWatch tool, the central bank is expected to reduce its key borrowing rates further by 75 basis points (bps) in the remaining two meetings this year, suggesting that there will be one 50 bps and one 25 bps rate cut. 30-day Federal fund futures pricing data shows that the probability of the Fed reducing interest rates by a larger-than-usual margin in November has increased to 61% from 39% a week ago.
For fresh interest rate cues, investors will focus on speeches from various Fed policymakers, including Chair Jerome Powell, scheduled in the North American session. Last week, in the press conference after the monetary policy decision of the 50 bps interest rate cut, Powell emphasized remaining data-dependent for further policy action.
On the economic front, market participants await the United States (US) Personal Consumption Expenditure Price Index (PCE) data for August, which will be published on Friday. Signs of further slowdown in inflationary pressures would prompt market expectations of a Fed 50 bps interest rate cut, while hot figures would weaken them.
Daily digest market movers: Pound Sterling trades with caution against its major peers
- The Pound Sterling trades cautiously against its major peers on Thursday due to the absence of top-tier United Kingdom (UK) economic data. Therefore, the British currency is expected to be influenced by the market sentiment and expectations for the BoE interest rate outlook.
- The market mood appears to be favorable for risk-perceived assets due to China’s massive stimulus and growing expectation of additional larger-than-usual interest rate cuts by the Fed. S&P 500 futures have posted significant gains in the European session, exhibiting a strong risk appetite of investors.
- Meanwhile, the BoE is projected to deliver one interest rate cut in any of its two policy meetings remaining this year. The BoE’s policy-easing cycle appears to be shallower than that of other central banks as policymakers remain concerned over price pressures remaining persistent due to high inflation in the service sector. Annual service inflation, which is closely tracked by BoE officials, rose sharply to 5.6% in August from 5.2% in July.
Technical Analysis: Pound Sterling remains above 20-day EMA
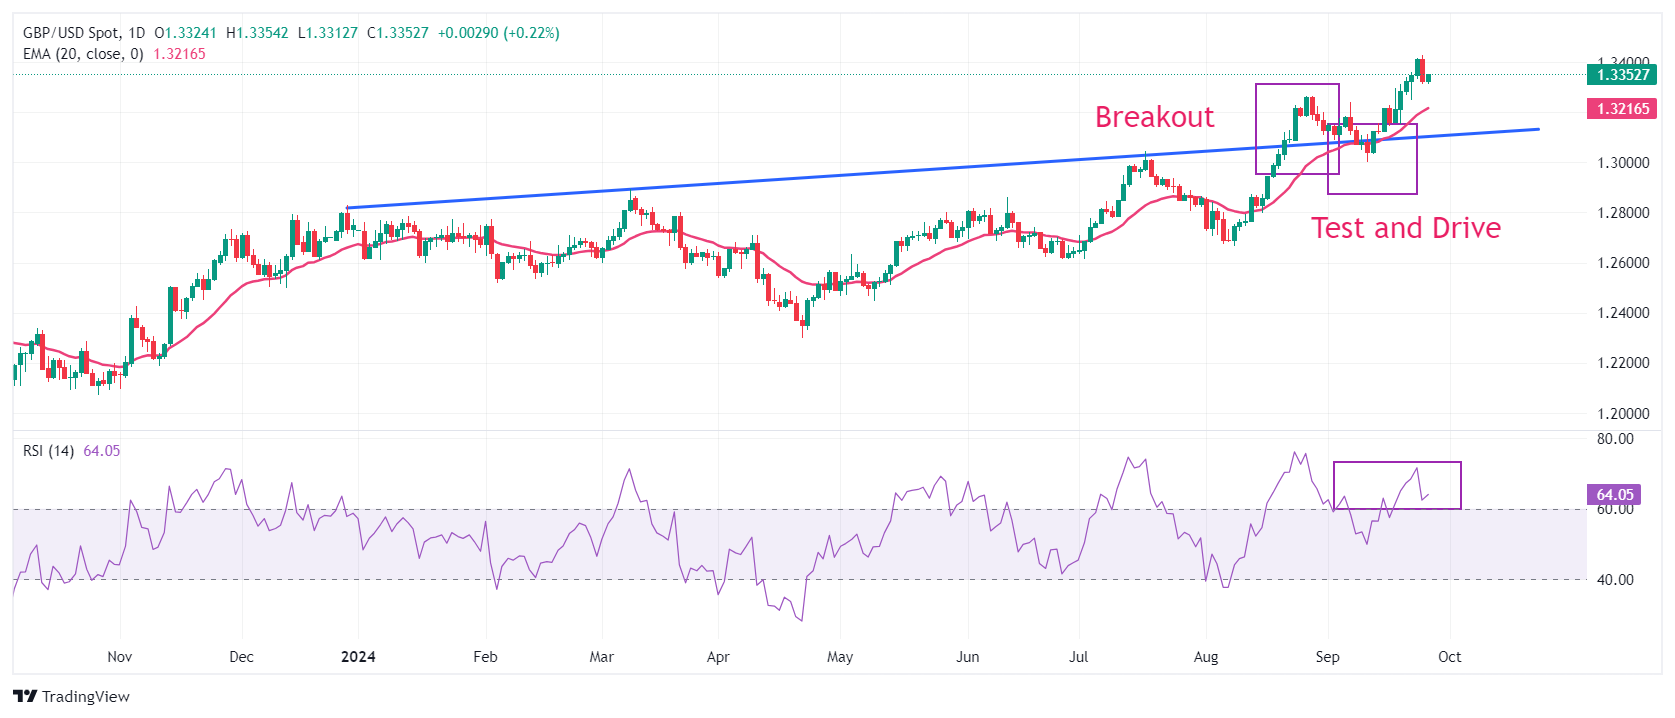
The Pound Sterling edges higher at around 1.3345 in European trading hours against the US Dollar after correcting to near 1.3300 on Wednesday. The GBP/USD pair faced some selling pressure after posting a fresh more-than-two-year high at 1.3430. The near-term outlook of the Cable remains firm as the 20-day Exponential Moving Average (EMA) near 1.3216 is sloping higher.
Earlier in September, the Cable strengthened after recovering from a corrective move to near the trendline plotted from the December 28, 2023, high of 1.2828, from where it delivered a sharp increase after a breakout on August 21.
The 14-day Relative Strength Index (RSI) shifts above 60.00, suggesting an active bullish momentum.
Looking up, the Cable will face resistance near the psychological level of 1.3500. On the downside, the psychological level of 1.3000 emerges as crucial support.
Pound Sterling FAQs
The Pound Sterling (GBP) is the oldest currency in the world (886 AD) and the official currency of the United Kingdom. It is the fourth most traded unit for foreign exchange (FX) in the world, accounting for 12% of all transactions, averaging $630 billion a day, according to 2022 data. Its key trading pairs are GBP/USD, aka ‘Cable’, which accounts for 11% of FX, GBP/JPY, or the ‘Dragon’ as it is known by traders (3%), and EUR/GBP (2%). The Pound Sterling is issued by the Bank of England (BoE).
The single most important factor influencing the value of the Pound Sterling is monetary policy decided by the Bank of England. The BoE bases its decisions on whether it has achieved its primary goal of “price stability” – a steady inflation rate of around 2%. Its primary tool for achieving this is the adjustment of interest rates. When inflation is too high, the BoE will try to rein it in by raising interest rates, making it more expensive for people and businesses to access credit. This is generally positive for GBP, as higher interest rates make the UK a more attractive place for global investors to park their money. When inflation falls too low it is a sign economic growth is slowing. In this scenario, the BoE will consider lowering interest rates to cheapen credit so businesses will borrow more to invest in growth-generating projects.
Data releases gauge the health of the economy and can impact the value of the Pound Sterling. Indicators such as GDP, Manufacturing and Services PMIs, and employment can all influence the direction of the GBP. A strong economy is good for Sterling. Not only does it attract more foreign investment but it may encourage the BoE to put up interest rates, which will directly strengthen GBP. Otherwise, if economic data is weak, the Pound Sterling is likely to fall.
Another significant data release for the Pound Sterling is the Trade Balance. This indicator measures the difference between what a country earns from its exports and what it spends on imports over a given period. If a country produces highly sought-after exports, its currency will benefit purely from the extra demand created from foreign buyers seeking to purchase these goods. Therefore, a positive net Trade Balance strengthens a currency and vice versa for a negative balance.
- EUR/JPY attracts buyers for the third straight day and climbs to a multi-week top.
- A combination of factors undermines the JPY and lends some support to the cross.
- The divergent ECB-BoJ policy expectations warrant some caution for bullish traders.
The EUR/JPY cross gains positive traction for the third successive day and climbs to a three-and-half-week top during the first half of the European session on Thursday. Spot prices currently trade around the 161.55-161.60 region, up over 0.25% for the day, with bulls looking to build on the momentum beyond the 50-day Simple Moving Average (SMA) and
The Japanese Yen (JPY) is undermined by the political uncertainty in Japan, where the ruling Liberal Democratic Party (LDP) will elect its new president on Friday to replace outgoing Prime Minister Fumio Kishida. Apart from this, a generally positive tone around the equity markets is seen denting the JPY's relative safe-haven status and lending some support to the EUR/JPY cross.
The upside for the EUR/JPY cross, however, remains capped amid a modest pullback slide in the shared currency. This week's dismal Eurozone macro data bolstered the case for at least a 25 basis points (bps) interest rate cut by the European Central Bank (ECB) at its October meeting. This marks a big divergence in comparison to hawkish Bank of Japan (BoJ) expectations and caps the pair.
Investors seem convinced that the BoJ will hike interest rates again by the end of this year. The bets were reaffirmed by the BoJ meeting minutes released earlier today, showing that board members shared a view over the need for vigilance to the risk of inflation overshoot and that it was appropriate to adjust the degree of monetary support moderately. This warrants caution for the EUR/JPY bulls.
From a technical perspective, the 50-day Simple Moving Average (SMA) earlier this month crossed below the very important 200-day SMA, forming a bearish 'Death Cross' on the daily chart. This further makes it prudent to wait for strong follow-through buying before positioning for an extension of the EUR/JPY pair's recent upward trajectory witnessed over the past two weeks or so.
Japanese Yen FAQs
The Japanese Yen (JPY) is one of the world’s most traded currencies. Its value is broadly determined by the performance of the Japanese economy, but more specifically by the Bank of Japan’s policy, the differential between Japanese and US bond yields, or risk sentiment among traders, among other factors.
One of the Bank of Japan’s mandates is currency control, so its moves are key for the Yen. The BoJ has directly intervened in currency markets sometimes, generally to lower the value of the Yen, although it refrains from doing it often due to political concerns of its main trading partners. The current BoJ ultra-loose monetary policy, based on massive stimulus to the economy, has caused the Yen to depreciate against its main currency peers. This process has exacerbated more recently due to an increasing policy divergence between the Bank of Japan and other main central banks, which have opted to increase interest rates sharply to fight decades-high levels of inflation.
The BoJ’s stance of sticking to ultra-loose monetary policy has led to a widening policy divergence with other central banks, particularly with the US Federal Reserve. This supports a widening of the differential between the 10-year US and Japanese bonds, which favors the US Dollar against the Japanese Yen.
The Japanese Yen is often seen as a safe-haven investment. This means that in times of market stress, investors are more likely to put their money in the Japanese currency due to its supposed reliability and stability. Turbulent times are likely to strengthen the Yen’s value against other currencies seen as more risky to invest in.
Citing seven sources, Reuters reported on Thursday that the “European Central Bank’s (ECB) October rate decision is seen as wide open.”
Additional takeaways
ECB doves to fight for October rate cut after weak data.
Push for October rate cut likely to face resistance from ECB hawks arguing for pause.
Some sources raised a compromise solution in which rates are kept on hold in October but a strong hint is given about a likely December cut if data doesn't improve. But this would contradict the ECB's "meeting by meeting" approach.
Traders have increased their bets on an October rate cut after the recent weak Euro area business surveys and German sentiment data. Money markets now see an 80% likelihood of the ECB lowering its deposit rate by 25 basis points (bps) to 3.25%, compared to a 50% chance at the start of this week.
Markets are pricing in about 50 bps of rate cuts in total by the year-end.
Market reaction
EUR/USD has pared gains to trade flat at around 1.1135 following this report.
ECB FAQs
The European Central Bank (ECB) in Frankfurt, Germany, is the reserve bank for the Eurozone. The ECB sets interest rates and manages monetary policy for the region. The ECB primary mandate is to maintain price stability, which means keeping inflation at around 2%. Its primary tool for achieving this is by raising or lowering interest rates. Relatively high interest rates will usually result in a stronger Euro and vice versa. The ECB Governing Council makes monetary policy decisions at meetings held eight times a year. Decisions are made by heads of the Eurozone national banks and six permanent members, including the President of the ECB, Christine Lagarde.
In extreme situations, the European Central Bank can enact a policy tool called Quantitative Easing. QE is the process by which the ECB prints Euros and uses them to buy assets – usually government or corporate bonds – from banks and other financial institutions. QE usually results in a weaker Euro. QE is a last resort when simply lowering interest rates is unlikely to achieve the objective of price stability. The ECB used it during the Great Financial Crisis in 2009-11, in 2015 when inflation remained stubbornly low, as well as during the covid pandemic.
Quantitative tightening (QT) is the reverse of QE. It is undertaken after QE when an economic recovery is underway and inflation starts rising. Whilst in QE the European Central Bank (ECB) purchases government and corporate bonds from financial institutions to provide them with liquidity, in QT the ECB stops buying more bonds, and stops reinvesting the principal maturing on the bonds it already holds. It is usually positive (or bullish) for the Euro.
Swiss National Bank (SNB) Vice Chairman Martin Schlegel said in prepared remarks for a press conference on Thursday that “the SNB expands provision of liquidity for Swiss banks.”
Additional comments
Now possible for all banks to obtain liquidity against securities; previously only applied to big banks.
Banks should be required to permanently hold collateral to obtain SNB liquidity.
These measures will further strengthen the Swiss banking sector.
Primary tool of the SNB will be interest rates, but forex interventions could be used if necessary.
After the Swiss National Bank (SNB) lowered the policy rate by another 25 basis points (bps) in the third consecutive meeting, Chairman Thomas Jordan explained the reason behind the move at the post-policy meeting press conference on Thursday.
Key quotes
Inflationary pressure has decreased significantly in Switzerland.
Strong Franc, lower oil, electricity prices contributed to lower inflation forecasts.
Downside risks to inflation higher than upside risks.
Further interest rate cuts may be necessary in coming quarters.
Swiss economic growth will be 'rather modest' in coming quarters.
See no risk of deflation.
Rise of Swiss franc was a major factor in decline of Swiss inflation.
Further interest rate cut 'might' be necessary to ensure price stability.
Market reaction to SNB Jordan's comments
As of writing, USD/CHF is holding the bounce to near 0.8500, still down 0.14% on the day.
SNB FAQs
The Swiss National Bank (SNB) is the country’s central bank. As an independent central bank, its mandate is to ensure price stability in the medium and long term. To ensure price stability, the SNB aims to maintain appropriate monetary conditions, which are determined by the interest rate level and exchange rates. For the SNB, price stability means a rise in the Swiss Consumer Price Index (CPI) of less than 2% per year.
The Swiss National Bank (SNB) Governing Board decides the appropriate level of its policy rate according to its price stability objective. When inflation is above target or forecasted to be above target in the foreseeable future, the bank will attempt to tame excessive price growth by raising its policy rate. Higher interest rates are generally positive for the Swiss Franc (CHF) as they lead to higher yields, making the country a more attractive place for investors. On the contrary, lower interest rates tend to weaken CHF.
Yes. The Swiss National Bank (SNB) has regularly intervened in the foreign exchange market in order to avoid the Swiss Franc (CHF) appreciating too much against other currencies. A strong CHF hurts the competitiveness of the country’s powerful export sector. Between 2011 and 2015, the SNB implemented a peg to the Euro to limit the CHF advance against it. The bank intervenes in the market using its hefty foreign exchange reserves, usually by buying foreign currencies such as the US Dollar or the Euro. During episodes of high inflation, particularly due to energy, the SNB refrains from intervening markets as a strong CHF makes energy imports cheaper, cushioning the price shock for Swiss households and businesses.
The SNB meets once a quarter – in March, June, September and December – to conduct its monetary policy assessment. Each of these assessments results in a monetary policy decision and the publication of a medium-term inflation forecast.
- Silver price retraces its recent losses as China’s fresh stimulus plans offset the fading effects of Tuesday’s measures.
- China plans to inject over CNY 1 trillion in capital into its largest state banks.
- The non-yielding Silver continues to receive support from rising odds of further Fed rate cuts.
Silver price (XAG/USD) edges higher as China, the world’s largest metals market, announces plans for additional stimulus measures to bolster its economy, offsetting the diminishing effects of Tuesday’s earlier actions. Silver price trades around $32.00 per troy ounce during Thursday’s European hours.
China plans to inject over CNY 1 trillion in capital into its largest state banks, which are facing challenges such as shrinking margins, declining profits, and increasing bad loans. This substantial capital infusion would mark the first of its kind since the 2008 global financial crisis.
The safe-haven Silver also receives support from rising tensions in the Middle East. An Israeli airstrike on Beirut killed a senior Hezbollah commander on Tuesday, raising fears of a broader conflict as cross-border rocket attacks intensified.
Meanwhile, the United States, France, and several allies have called for an immediate 21-day ceasefire along the Israel-Lebanon border "Blue Line" and expressed support for a ceasefire in Gaza, following intense discussions at the United Nations on Wednesday.
The non-yielding Silver gained support following last week's substantial 50 basis point rate cut by the US Federal Reserve (Fed). Moreover, rising expectations of additional Fed rate cuts in 2024 are enhancing the appeal of the commodity for investors amid low opportunity cost.
According to the CME FedWatch Tool, markets are currently pricing in a roughly 50% probability that the Fed will implement a total of 75 basis points in rate cuts, bringing rates down to a range of 4.0-4.25% by year’s end. This has weakened the US Dollar (USD), making Silver more affordable for buyers using other currencies and boosting demand for the dollar-denominated commodity.
Silver FAQs
Silver is a precious metal highly traded among investors. It has been historically used as a store of value and a medium of exchange. Although less popular than Gold, traders may turn to Silver to diversify their investment portfolio, for its intrinsic value or as a potential hedge during high-inflation periods. Investors can buy physical Silver, in coins or in bars, or trade it through vehicles such as Exchange Traded Funds, which track its price on international markets.
Silver prices can move due to a wide range of factors. Geopolitical instability or fears of a deep recession can make Silver price escalate due to its safe-haven status, although to a lesser extent than Gold's. As a yieldless asset, Silver tends to rise with lower interest rates. Its moves also depend on how the US Dollar (USD) behaves as the asset is priced in dollars (XAG/USD). A strong Dollar tends to keep the price of Silver at bay, whereas a weaker Dollar is likely to propel prices up. Other factors such as investment demand, mining supply – Silver is much more abundant than Gold – and recycling rates can also affect prices.
Silver is widely used in industry, particularly in sectors such as electronics or solar energy, as it has one of the highest electric conductivity of all metals – more than Copper and Gold. A surge in demand can increase prices, while a decline tends to lower them. Dynamics in the US, Chinese and Indian economies can also contribute to price swings: for the US and particularly China, their big industrial sectors use Silver in various processes; in India, consumers’ demand for the precious metal for jewellery also plays a key role in setting prices.
Silver prices tend to follow Gold's moves. When Gold prices rise, Silver typically follows suit, as their status as safe-haven assets is similar. The Gold/Silver ratio, which shows the number of ounces of Silver needed to equal the value of one ounce of Gold, may help to determine the relative valuation between both metals. Some investors may consider a high ratio as an indicator that Silver is undervalued, or Gold is overvalued. On the contrary, a low ratio might suggest that Gold is undervalued relative to Silver.
- USD/CHF falls sharply from 0.8500 as the SNB reduces its key borrowing rates by 25 bps for the consecutively third meeting.
- The SNB was expected to cut interest rates due to low inflation environment.
- Investors await the US PCE inflation for fresh Fed interest rate guidance.
The USD/CHF pair drops sharply from the psychological resistance of 0.8500 in Thursday’s European session. The Swiss Franc asset faces selling pressure as the Swiss National Bank (SNB) cuts interest rates by 25 basis points (bps) to 1%. This is the third straight SNB's 25 bps interest rate cut.
The SNB was widely anticipated to reduce its key borrowing rates further as inflationary pressures in the Swiss economy have settled more than the bank’s target of 2%. The Swiss annual Consumer Price Index (CPI) has decelerated to 1.1% in August.
Meanwhile, the US Dollar (USD) clings to Thursday’s recovery move as Federal Reserve (Fed) policymakers, including Chair Jerome Powell, line up to comment on the economy and the interest rate outlook. The comments from Fed policymakers will indicate whether the central bank will deliver a second consecutive larger-than-usual 50 bps interest rate cut in November or will slow down the policy-easing cycle by reducing interest rates with a gradual rate of 25 bps.
In the monetary policy meeting last week, the Fed started the rate-cut cycle with a 50-bps decline in interest rates as policymakers were concerned about the deteriorating job growth pace.
The CME FedWatch tool shows that the possibility of the Fed reducing interest rates by 50 bps to 4.25%-4.50% in November has increased to 61% from 39% a week ago.
On the economic front, investors await the United States (US) Personal Consumption Expenditure Price Index (PCE) data for August, which will be published on Friday. Annual core PCE inflation, a Fed’s preferred inflation measure, is estimated to have grown at a faster pace of 2.7% against the July print of 2.6%.
Economic Indicator
SNB Interest Rate Decision
The Swiss National Bank (SNB) announces its interest rate decision after each of the Bank’s four scheduled annual meetings, one per quarter. Generally, if the SNB is hawkish about the inflation outlook of the economy and raises interest rates, it is bullish for the Swiss Franc (CHF). Likewise, if the SNB has a dovish view on the economy and keeps interest rates unchanged, or cuts them, it is usually bearish for CHF.
Read more.Last release: Thu Sep 26, 2024 07:30
Frequency: Irregular
Actual: 1%
Consensus: 1%
Previous: 1.25%
Source: Swiss National Bank
The Swiss National Bank (SNB) announced on Thursday that it lowered the benchmark Sight Deposit Rate by 25 basis points (bps) from 1.25% to 1.00% after concluding its quarterly monetary policy assessment.
The decision aligned with the market expectations.
The SNB has cut the key rate by 50 bps so far this year, emerging as the first major central bank to implement a dovish policy pivot.
Summary of the SNB policy statement
Prepared to intervene on the FX market as necessary.
SNB sees 2024 Swiss growth at around 1.0% (previous forecast was for around 1%).
SNB sees 2025 Swiss growth at around 1.5% (previous forecast was for 1.5%).
SNB sees 2024 inflation at 1.2% (previous forecast was for 1.3%).
SNB sees 2025 inflation at 0.6% (previous forecast was for 1.1%).
SNB sees 2026 inflation at 0.7% (previous forecast was for 1.0%).
Inflationary pressure in Switzerland has again decreased significantly compared to the previous quarter.
Decrease reflects the appreciation of the swiss franc over the last three months.
Further cuts in the SNB policy rate may become necessary in the coming quarters to ensure price stability over the medium term.
Momentum on the mortgage and real estate markets in recent quarters has been weaker than in previous years.
Inflation in switzerland is currently being driven mainly by higher prices for domestic services.
Inflation in many countries remains above central banks’ targets.
Growth momentum in the chemicals/pharmaceuticals industry was particularly strong, while growth in many other industries was moderate.
Market reaction to the SNB interest rate decision
In an initial reaction to the expected SNB rate cut decision, the USD/CHF pair tumbled nearly 60 pips to test 0.8460 before recovering to near 0.8480, where it now wavers. The pair is down 0.22% on the day.
Swiss Franc PRICE Today
The table below shows the percentage change of Swiss Franc (CHF) against listed major currencies today. Swiss Franc was the strongest against the Japanese Yen.
| USD | EUR | GBP | JPY | CAD | AUD | NZD | CHF | |
|---|---|---|---|---|---|---|---|---|
| USD | -0.11% | -0.16% | 0.20% | -0.05% | -0.54% | -0.31% | -0.15% | |
| EUR | 0.11% | -0.05% | 0.29% | 0.04% | -0.41% | -0.19% | -0.03% | |
| GBP | 0.16% | 0.05% | 0.37% | 0.11% | -0.36% | -0.15% | 0.02% | |
| JPY | -0.20% | -0.29% | -0.37% | -0.24% | -0.74% | -0.53% | -0.35% | |
| CAD | 0.05% | -0.04% | -0.11% | 0.24% | -0.47% | -0.27% | -0.08% | |
| AUD | 0.54% | 0.41% | 0.36% | 0.74% | 0.47% | 0.23% | 0.39% | |
| NZD | 0.31% | 0.19% | 0.15% | 0.53% | 0.27% | -0.23% | 0.16% | |
| CHF | 0.15% | 0.03% | -0.02% | 0.35% | 0.08% | -0.39% | -0.16% |
The heat map shows percentage changes of major currencies against each other. The base currency is picked from the left column, while the quote currency is picked from the top row. For example, if you pick the Swiss Franc from the left column and move along the horizontal line to the US Dollar, the percentage change displayed in the box will represent CHF (base)/USD (quote).
FX option expiries for Sept 26 NY cut at 10:00 Eastern Time, via DTCC, can be found below.
EUR/USD: EUR amounts
- 1.1125 890m
- 1.1150 2b
- 1.1180 2.9b
- 1.1190 1.3b
- 1.1250 1.5b
GBP/USD: GBP amounts
- 1.3215 562m
USD/JPY: USD amounts
- 142.20 1.4b
- 143.00 836m
- 143.75 725m
- 144.50 863m
- 145.00 1.4b
- 146.00 723m
USD/CHF: USD amounts
- 0.8250 800m
- 0.8550 1.1b
- 0.8800 509m
AUD/USD: AUD amounts
- 0.6795 945m
- 0.6900 802m
- 0.6910 849m
USD/CAD: USD amounts
- 1.3400 1.4b
- 1.3455 927m
- 1.3460 2.6b
NZD/USD: NZD amounts
- 0.6225 1.3b
- 0.6330 1.5b
- 0.6340 1b
- EUR/GBP remains flat near 0.8355 in Thursday’s early European session.
- The BoE policymaker confirmed it’s appropriate to only cut rates at a gradual pace.
- The ECB is expected to cut deeper interest rates until April next year, noted HSBC analysts.
The EUR/GBP cross flat lines around 0.8355 during the early European session on Thursday. However, a less dovish stance from the Bank of England (BoE) might provide some support to the Pound Sterling (GBP). Traders will take more cues from the European Central Bank's (ECB) policymakers' speeches later in the day, including ECB President Christien Lagarde, Frank Elderson and Luis de Guindos.
The cautious stance of the Bank of England (BoE) could underpin the GBP against the Euro (EUR). BoE policymaker Megan Greene said on Wednesday “I believe the risks to activity are to the upside, which could suggest that the long-run neutral rate is higher and - all else equal - our stance of policy isn’t as restrictive as we had thought. Given this risk, I believe it is appropriate to take a gradual approach to removing restrictiveness.”
On the other hand, the downbeat Germany’s IFO reports earlier this week added to German recession fears, prompting the expectation of additional rate cuts and might cap the upside for the Euro (EUR) in the near term. The ECB is likely to cut deeper interest rates than previously expected, by lowering its key deposit rate by 25 basis points (bps) at each of its upcoming meetings from now until April next year, noted HSBC analysts. The Eurozone Consumer Confidence and Industrial Confidence for September will be published on Friday. Any signs of improvement in the Eurozone economy could help limit the shared currency’s losses in the near term.
ECB FAQs
The European Central Bank (ECB) in Frankfurt, Germany, is the reserve bank for the Eurozone. The ECB sets interest rates and manages monetary policy for the region. The ECB primary mandate is to maintain price stability, which means keeping inflation at around 2%. Its primary tool for achieving this is by raising or lowering interest rates. Relatively high interest rates will usually result in a stronger Euro and vice versa. The ECB Governing Council makes monetary policy decisions at meetings held eight times a year. Decisions are made by heads of the Eurozone national banks and six permanent members, including the President of the ECB, Christine Lagarde.
In extreme situations, the European Central Bank can enact a policy tool called Quantitative Easing. QE is the process by which the ECB prints Euros and uses them to buy assets – usually government or corporate bonds – from banks and other financial institutions. QE usually results in a weaker Euro. QE is a last resort when simply lowering interest rates is unlikely to achieve the objective of price stability. The ECB used it during the Great Financial Crisis in 2009-11, in 2015 when inflation remained stubbornly low, as well as during the covid pandemic.
Quantitative tightening (QT) is the reverse of QE. It is undertaken after QE when an economic recovery is underway and inflation starts rising. Whilst in QE the European Central Bank (ECB) purchases government and corporate bonds from financial institutions to provide them with liquidity, in QT the ECB stops buying more bonds, and stops reinvesting the principal maturing on the bonds it already holds. It is usually positive (or bullish) for the Euro.
- NZD/USD gains ground as it maintains its position within an ascending channel pattern.
- The 14-day RSI remains above the 50 level, supporting the notion of an ongoing uptrend.
- A break below the ascending channel would weaken the ongoing bullish bias.
NZD/USD recovers its recent losses from the previous session, trading around 0.6280 during the early European hours on Thursday. On the daily chart, the pair is testing the lower boundary of the ascending channel pattern. A successful breach below the ascending channel would weaken the ongoing bullish bias.
However, the 14-day Relative Strength Index (RSI) remains above the 50 level, confirming the ongoing bullish trend is intact. Additionally, the nine-day Exponential Moving Average (EMA) is positioned above the 50-day EMA, suggesting the short-term price trend is stronger for the NZD/USD pair.
On the upside, the NZD/USD pair may explore the region around the upper boundary of the ascending channel at the 0.6380 level. A breakthrough above the upper boundary could strengthen bullish bias and support the pair to revisit the 15-month high of 0.6409 level, recorded in December 2023.
In terms of support, the NZD/USD pair may test the immediate nine-day Exponential Moving Average (EMA) at the 0.6251 level. A break below this level could weaken the bullish sentiment and put pressure on the pair to approach the 50-day EMA at 0.6156 level, followed by its five-week low of 0.6106 level.
NZD/USD: Daily Chart
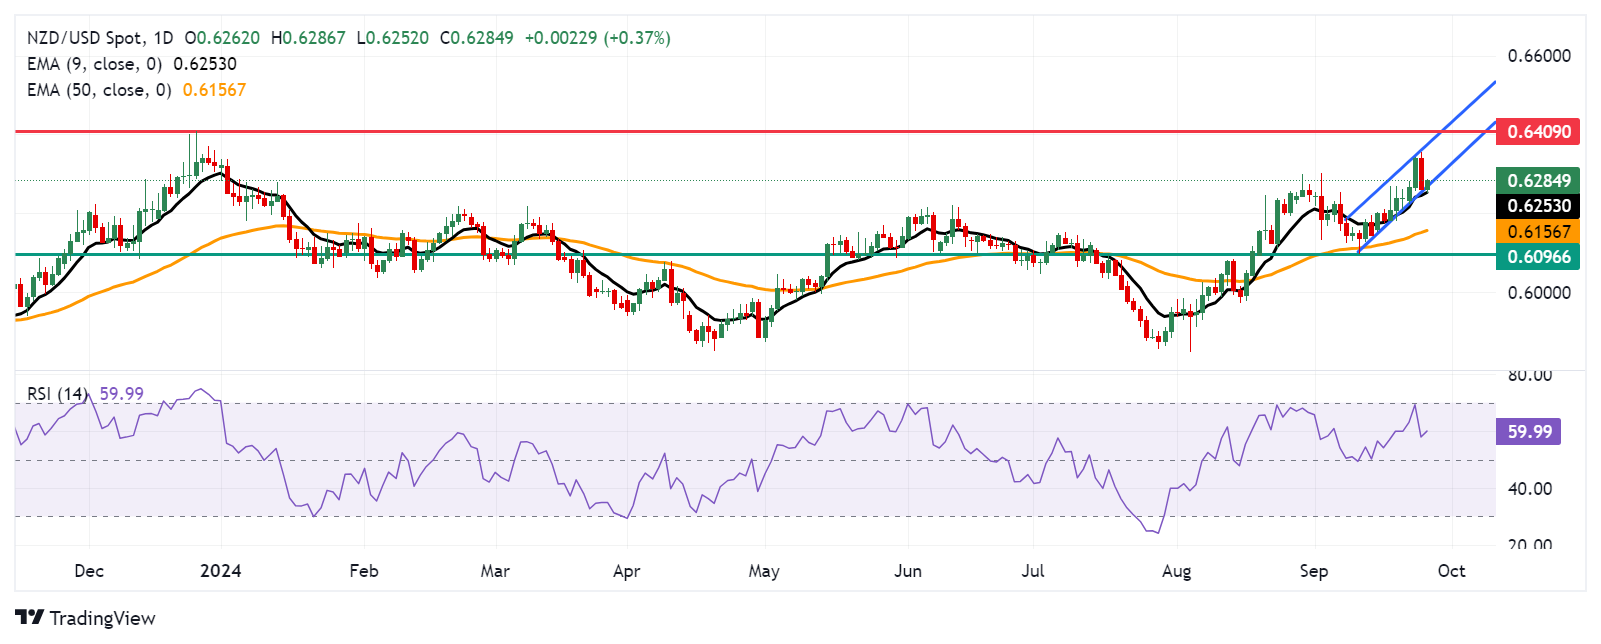
New Zealand Dollar PRICE Today
The table below shows the percentage change of New Zealand Dollar (NZD) against listed major currencies today. New Zealand Dollar was the strongest against the Swiss Franc.
| USD | EUR | GBP | JPY | CAD | AUD | NZD | CHF | |
|---|---|---|---|---|---|---|---|---|
| USD | -0.22% | -0.23% | 0.00% | -0.16% | -0.65% | -0.40% | 0.05% | |
| EUR | 0.22% | -0.02% | 0.23% | 0.06% | -0.43% | -0.18% | 0.27% | |
| GBP | 0.23% | 0.02% | 0.19% | 0.08% | -0.41% | -0.18% | 0.27% | |
| JPY | 0.00% | -0.23% | -0.19% | -0.14% | -0.66% | -0.42% | 0.02% | |
| CAD | 0.16% | -0.06% | -0.08% | 0.14% | -0.48% | -0.24% | 0.19% | |
| AUD | 0.65% | 0.43% | 0.41% | 0.66% | 0.48% | 0.26% | 0.68% | |
| NZD | 0.40% | 0.18% | 0.18% | 0.42% | 0.24% | -0.26% | 0.43% | |
| CHF | -0.05% | -0.27% | -0.27% | -0.02% | -0.19% | -0.68% | -0.43% |
The heat map shows percentage changes of major currencies against each other. The base currency is picked from the left column, while the quote currency is picked from the top row. For example, if you pick the New Zealand Dollar from the left column and move along the horizontal line to the US Dollar, the percentage change displayed in the box will represent NZD (base)/USD (quote).
Here is what you need to know on Thursday, September 26:
After witnessing a solid turnaround in American trading on Wednesday, the US Dollar (USD) pauses its recovery and remains in a consolidative mode heading into the European opening bells on Thursday.
Traders turn cautious and refrain from placing fresh bets on the USD before the release of the pre-recorded speech by US Federal Reserve (Fed) President Jerome Powell. A host of other Fed officials are also due to make their scheduled appearances along with Chair Powell, with their respective speeches trickling in from 13:10 GMT.
The Fed commentary will be critical to gauging the size of the next rate cut in November. Markets are already pricing in a 61% chance of a 50 basis points (bps) rate reduction, according to the CME Group’s Fed WatchTool.
Fed Governor Adriana Kugler said late Wednesday that she “strongly supported” the Fed’s decision to cut the interest rates by a half point last week. Kugler added that she “will support additional rate cuts going forward.”
Apart from the Fedspeak, investors will also look to the mid-impact US Durable Goods Orders and the Jobless Claims data for fresh trading directives.
The US Dollar also stalls its previous upswing, as risk sentiment turns positive, courtesy of the renewed optimism surrounding China’s stimulus measures.
US Dollar PRICE This week
The table below shows the percentage change of US Dollar (USD) against listed major currencies this week. US Dollar was the strongest against the Japanese Yen.
| USD | EUR | GBP | JPY | CAD | AUD | NZD | CHF | |
|---|---|---|---|---|---|---|---|---|
| USD | 0.13% | -0.18% | 0.51% | -0.69% | -0.85% | -0.72% | 0.04% | |
| EUR | -0.13% | -0.36% | 0.40% | -0.81% | -1.03% | -0.84% | -0.10% | |
| GBP | 0.18% | 0.36% | 0.81% | -0.45% | -0.67% | -0.48% | 0.27% | |
| JPY | -0.51% | -0.40% | -0.81% | -1.19% | -1.44% | -1.22% | -0.58% | |
| CAD | 0.69% | 0.81% | 0.45% | 1.19% | -0.10% | -0.02% | 0.72% | |
| AUD | 0.85% | 1.03% | 0.67% | 1.44% | 0.10% | 0.21% | 0.94% | |
| NZD | 0.72% | 0.84% | 0.48% | 1.22% | 0.02% | -0.21% | 0.75% | |
| CHF | -0.04% | 0.10% | -0.27% | 0.58% | -0.72% | -0.94% | -0.75% |
The heat map shows percentage changes of major currencies against each other. The base currency is picked from the left column, while the quote currency is picked from the top row. For example, if you pick the US Dollar from the left column and move along the horizontal line to the Japanese Yen, the percentage change displayed in the box will represent USD (base)/JPY (quote).
Bloomberg News and Reuters reported earlier that China is considering injecting capital worth CNY1 trillion ($142 billion) into top state-owned banks, in a further effort to shore up the economy.
Additionally, China’s Politburo, the country’s top leadership, held a meeting on Thursday and affirmed that they will lower the Reserve Requirement Ratio (RRR) and implement a forceful interest rate cut. The recovery in risk sentiment drives Asian indices closer to two-year highs, with the US S&P 500 futures, the risk barometer, rising 0.60% so far.
Most G10 currencies benefited from risk reset and the faltering US Dollar rebound. The higher-yielding Australian Dollar is seen as the best performer, driving AUD/USD back toward the highest level since February 2023. The Aussie capitalizes on fresh Chinese stimulus measures, last seen trading at 0.6860.
USD/JPY rebounded firmly before entering a consolidation just below 145.00. The pair remains underpinned by the risk-on market mood, which weighs on the safe-haven Japanese Yen. The local currency ignored the Bank of Japan’s (BoJ) July meeting Minutes.
USD/CAD is posting small losses and retreats toward 1.3450, despite the latest leg down in Oil price. The black gold plunged 2% on Wednesday, as supply concerns from the shutdown of the Libyan oilfield eased. WTI is currently shedding 1.45% on the day to trade near $69.
USD/CHF is trading sideways at around 0.8500, awaiting the Swiss National Bank’s (SNB) monetary policy assessment for fresh cues.
GBP/USD is holding the bounce near 1.3350, supported by a better market mood and monetary policy divergence between the Fed and the Bank of England. BoE policymaker Megan Greene said on Wednesday that a “cautious, steady-as-she-goes approach to monetary policy easing is appropriate.”
EUR/USD is testing 1.1150 once again, attempting a tepid recovery in early Europe in the lead-up to speeches from European Central Bank (ECB) President Christine Lagarde and Fed Chair Jerome Powell. Lagarde is due to deliver opening remarks at the European Systemic Risk Board Annual Conference at 13:30 GMT.
Gold price is trading listlessly just below the record high of $2,671. Overbought conditions on Gold’s daily chart point to a potential corrective decline in the near term.
- GBP/JPY gathers strength to around 193.10 in Thursday’s early European session.
- The uncertainty about the BoJ's interest rate path undermines the JPY.
- BoE’s Greene said she prefers a cautious approach to cutting interest rates.
The GBP/JPY cross extends the rally to near 193.10 during the early European session on Thursday. The prospect that the Bank of Japan (BoJ) would delay raising interest rates further this year weighs on the Japanese Yen (JPY). Traders will keep an eye on Japan’s Tokyo Consumer Price Index (CPI) for September, which is due on Friday.
The JPY loses momentum after BoJ Governor Kazuo Ueda signalled that the Japanese central bank is not in a rush to raise interest rates. According to the BoJ meeting minutes released on Thursday, policymakers were divided on how quickly the central bank should raise interest rates further, citing uncertainty on the timing of the next increase in borrowing costs. Several board members noted it would be "appropriate" for the central bank to "start gradually adjusting the significantly low policy interest rate."
On the other hand, the growing speculation that the Bank of England's (BoE) rate-cutting cycle is more likely to be slower than previously expected provides some support to the Pound Sterling (GBP). BoE Governor Andrew Bailey said he was “very encouraged” by the downward path of inflation, and he expected the path for interest rates will be downwards gradually. Meanwhile, BoE policymaker Megan Greene said on Wednesday that she prefers a “cautious approach” to cutting interest rates, warning of the risks from strong wage growth and economic activity.
Japanese Yen FAQs
The Japanese Yen (JPY) is one of the world’s most traded currencies. Its value is broadly determined by the performance of the Japanese economy, but more specifically by the Bank of Japan’s policy, the differential between Japanese and US bond yields, or risk sentiment among traders, among other factors.
One of the Bank of Japan’s mandates is currency control, so its moves are key for the Yen. The BoJ has directly intervened in currency markets sometimes, generally to lower the value of the Yen, although it refrains from doing it often due to political concerns of its main trading partners. The current BoJ ultra-loose monetary policy, based on massive stimulus to the economy, has caused the Yen to depreciate against its main currency peers. This process has exacerbated more recently due to an increasing policy divergence between the Bank of Japan and other main central banks, which have opted to increase interest rates sharply to fight decades-high levels of inflation.
The BoJ’s stance of sticking to ultra-loose monetary policy has led to a widening policy divergence with other central banks, particularly with the US Federal Reserve. This supports a widening of the differential between the 10-year US and Japanese bonds, which favors the US Dollar against the Japanese Yen.
The Japanese Yen is often seen as a safe-haven investment. This means that in times of market stress, investors are more likely to put their money in the Japanese currency due to its supposed reliability and stability. Turbulent times are likely to strengthen the Yen’s value against other currencies seen as more risky to invest in.
China’s Politburo, the country’s top leadership, held a meeting on Thursday, with the key highlights noted below.
Analysed current economic situation and work, plan for future economic works.
Will step up the force of counter-cyclical adjustments of fiscal and monetary policies.
Fundamentals of china's economy and the favorable conditions such as broad market, strong economic resilience and great potential have not changed.
Will ensure necessary fiscal spending.
Will increase the income of low- and middle-income groups and improve the consumption structure.
Will strive to achieve full-year economic, social development targets and tasks.
At present, there are some new conditions and problems in economic operation.
The quality of real estate market should be improved, and 'white list' project loans should be increased.
Will make efforts to stop the falls in property market to get it stabilised.
Will strictly control the new amounts of commercial homes construction.
Will increase efforts to attract and stabilize investment.
Necessary to support and regulate the development of social forces in the old-age care and childcare industries.
Will pay close attention to improving the system of childbirth support policies.
Will strive to stimulate capital market, make great efforts to guide mid- to long-term capital enter the market.
Will attract and stabilize investment, step up the promotion and implementation of reform measures such as foreign investment access in the manufacturing sector.
Will focus on employment of key groups such as fresh college graduates, rural migrant workers.
Will study and roll out policy measures to protect small and medium-sized investors.
It is necessary to do a good job in ensuring the supply and stable prices of food, water, electricity, heat, and other important materials.
Will introduce private economy promotion law to create positive environment for non-public sector economic development.
Market reaction
The Australian Dollar is holding higher ground following these Chinese headlines, with AUD/USD adding 0.43% on the day to trade near 0.6850, as of writing.
- USD/CAD attracts fresh sellers on Wednesday amid a modest USD downtick.
- Dovish Fed expectations, along with a positive risk tone, weigh on the buck.
- Sliding Oil prices to undermine the Loonie and lend support ahead of Fed’s Powell.
The USD/CAD pair meets with some supply during the Asian session on Thursday and erodes a part of the overnight recovery gains from the 1.3420 region, or its lowest level since March 8. Spot prices currently trade around the 1.3470-1.3465 region, down over 0.10% for the day amid a modest US Dollar (USD) downtick, though some follow-through selling around Crude Oil prices could help limit deeper losses.
The USD Index (DXY), which tracks the Greenback against a basket of currencies, stalls the overnight goodish rebound from the vicinity of the YTD low amid bets for another 50 basis points (bps) interest rate cut by the Federal Reserve (Fed) in November. Apart from this, the underlying bullish tone – as depicted by a fresh leg up in the equity markets – further undermines the safe-haven buck and exerts some downward pressure on the USD/CAD pair.
Meanwhile, doubts about sustained fuel demand growth in China – the world's top oil importer – and easing worries over supply disruptions in Libya drag Crude Oil prices further away from a three-week high touched on Tuesday. Despite a slew of stimulus measures announced this week, investors remain uncertain about China's economic recovery. This, along with signs of the return of Libyan oil to the market, further seems to weigh on the black liquid.
This, in turn, could undermine demand for the commodity-linked Loonie and lend some support to the USD/CAD pair. Traders might also prefer to move to the sidelines and refrain from placing aggressive directional bets ahead of speeches by influential FOMC members, including Fed Chair Jerome Powell, later during the North American session. Apart from this, the US economic data will drive the USD demand and produce short-term trading opportunities.
Canadian Dollar FAQs
The key factors driving the Canadian Dollar (CAD) are the level of interest rates set by the Bank of Canada (BoC), the price of Oil, Canada’s largest export, the health of its economy, inflation and the Trade Balance, which is the difference between the value of Canada’s exports versus its imports. Other factors include market sentiment – whether investors are taking on more risky assets (risk-on) or seeking safe-havens (risk-off) – with risk-on being CAD-positive. As its largest trading partner, the health of the US economy is also a key factor influencing the Canadian Dollar.
The Bank of Canada (BoC) has a significant influence on the Canadian Dollar by setting the level of interest rates that banks can lend to one another. This influences the level of interest rates for everyone. The main goal of the BoC is to maintain inflation at 1-3% by adjusting interest rates up or down. Relatively higher interest rates tend to be positive for the CAD. The Bank of Canada can also use quantitative easing and tightening to influence credit conditions, with the former CAD-negative and the latter CAD-positive.
The price of Oil is a key factor impacting the value of the Canadian Dollar. Petroleum is Canada’s biggest export, so Oil price tends to have an immediate impact on the CAD value. Generally, if Oil price rises CAD also goes up, as aggregate demand for the currency increases. The opposite is the case if the price of Oil falls. Higher Oil prices also tend to result in a greater likelihood of a positive Trade Balance, which is also supportive of the CAD.
While inflation had always traditionally been thought of as a negative factor for a currency since it lowers the value of money, the opposite has actually been the case in modern times with the relaxation of cross-border capital controls. Higher inflation tends to lead central banks to put up interest rates which attracts more capital inflows from global investors seeking a lucrative place to keep their money. This increases demand for the local currency, which in Canada’s case is the Canadian Dollar.
Macroeconomic data releases gauge the health of the economy and can have an impact on the Canadian Dollar. Indicators such as GDP, Manufacturing and Services PMIs, employment, and consumer sentiment surveys can all influence the direction of the CAD. A strong economy is good for the Canadian Dollar. Not only does it attract more foreign investment but it may encourage the Bank of Canada to put up interest rates, leading to a stronger currency. If economic data is weak, however, the CAD is likely to fall.
- USD/CHF may gain ground as the SNB is widely expected to deliver a 25 basis point rate cut on Thursday.
- Market participants estimate a 63% chance of a quarter-percentage-point cut by the SNB.
- CME FedWatch Tool suggests around a 50% chance of totaling 75 basis points rate cuts by the Fed in 2024.
USD/CHF hovers around 0.8500 during the Asian session on Thursday, maintaining its position following recent gains from Wednesday. The Swiss Franc (CHF) may receive downward pressure ahead of the Swiss National Bank’s (SNB) interest rate decision scheduled later in the day.
The Swiss National Bank is widely expected to deliver a 25 basis point interest rate cut at its upcoming September meeting. Interest Rate Probabilities suggest that market participants estimate a 63% chance of a quarter-percentage-point cut by the SNB, while for a larger one, the chances are at 37%.
On Wednesday, the ZEW Swiss Survey Expectations fell by 5.4 points from the previous month, registering a reading of -8.8 in September, down from a previous reading of -3.4. UBS, which partners with the CFA Society Switzerland to publish the indicator, noted that the negative reading indicates increasing pessimism among participants about the growth outlook for the Swiss economy over the next six months.
The upside of the USD/CHF pair could be limited due to the subdued US Dollar (USD). The Greenback receives downward pressure from rising odds of further interest rate cuts by the US Federal Reserve (Fed) in upcoming policy meetings. According to the CME FedWatch Tool, markets are pricing in around a 50% chance of totaling 75 basis points to be deducted by the Fed to a range of 4.0-4.25% by the end of this year.
Federal Reserve Governor Adriana Kugler said on Wednesday that she “strongly supported” the Fed’s decision to cut the interest rates by a half point last week. Kugler further stated that it will be appropriate to make additional rate cuts if inflation continues to ease as expected, per Bloomberg.
Traders will likely observe the release of the final US Gross Domestic Product (GDP) Annualized for the second quarter (Q2) scheduled to be released later in the North American session.
Economic Indicator
SNB Interest Rate Decision
The Swiss National Bank (SNB) announces its interest rate decision after each of the Bank’s four scheduled annual meetings, one per quarter. Generally, if the SNB is hawkish about the inflation outlook of the economy and raises interest rates, it is bullish for the Swiss Franc (CHF). Likewise, if the SNB has a dovish view on the economy and keeps interest rates unchanged, or cuts them, it is usually bearish for CHF.
Read more.Next release: Thu Sep 26, 2024 07:30
Frequency: Irregular
Consensus: 1%
Previous: 1.25%
Source: Swiss National Bank
Gold prices rose in India on Thursday, according to data compiled by FXStreet.
The price for Gold stood at 7,162.16 Indian Rupees (INR) per gram, up compared with the INR 7,150.05 it cost on Wednesday.
The price for Gold increased to INR 83,538.60 per tola from INR 83,396.74 per tola a day earlier.
| Unit measure | Gold Price in INR |
|---|---|
| 1 Gram | 7,162.16 |
| 10 Grams | 71,622.09 |
| Tola | 83,538.60 |
| Troy Ounce | 222,768.10 |
FXStreet calculates Gold prices in India by adapting international prices (USD/INR) to the local currency and measurement units. Prices are updated daily based on the market rates taken at the time of publication. Prices are just for reference and local rates could diverge slightly.
Gold FAQs
Gold has played a key role in human’s history as it has been widely used as a store of value and medium of exchange. Currently, apart from its shine and usage for jewelry, the precious metal is widely seen as a safe-haven asset, meaning that it is considered a good investment during turbulent times. Gold is also widely seen as a hedge against inflation and against depreciating currencies as it doesn’t rely on any specific issuer or government.
Central banks are the biggest Gold holders. In their aim to support their currencies in turbulent times, central banks tend to diversify their reserves and buy Gold to improve the perceived strength of the economy and the currency. High Gold reserves can be a source of trust for a country’s solvency. Central banks added 1,136 tonnes of Gold worth around $70 billion to their reserves in 2022, according to data from the World Gold Council. This is the highest yearly purchase since records began. Central banks from emerging economies such as China, India and Turkey are quickly increasing their Gold reserves.
Gold has an inverse correlation with the US Dollar and US Treasuries, which are both major reserve and safe-haven assets. When the Dollar depreciates, Gold tends to rise, enabling investors and central banks to diversify their assets in turbulent times. Gold is also inversely correlated with risk assets. A rally in the stock market tends to weaken Gold price, while sell-offs in riskier markets tend to favor the precious metal.
The price can move due to a wide range of factors. Geopolitical instability or fears of a deep recession can quickly make Gold price escalate due to its safe-haven status. As a yield-less asset, Gold tends to rise with lower interest rates, while higher cost of money usually weighs down on the yellow metal. Still, most moves depend on how the US Dollar (USD) behaves as the asset is priced in dollars (XAU/USD). A strong Dollar tends to keep the price of Gold controlled, whereas a weaker Dollar is likely to push Gold prices up.
(An automation tool was used in creating this post.)
- EUR/USD gains ground around 1.1140 in Thursday’s Asian session.
- Dovish remarks from Fed officials this week might continue to undermine the USD.
- HSBC analysts expect the ECB to cut rates by 25 bps at every meeting from October through to April next year.
The EUR/USD pair trades firmer near 1.1140 during the Asian trading hours on Thursday, bolstered by the weaker Greenback broadly. Several US Federal Reserve (Fed) officials are set to speak on Thursday, including Fed Chair Jerome Powell. Furthermore, the US weekly Initial Jobless Claims, Durable Goods Orders and final US Gross Domestic Product (GDP) Annualized for the second quarter (Q2) will be released.
Traders await fresh catalysts about how aggressive future US rate reductions would be. Many analysts see the Fed raising jumbo rate cuts again in the November meeting. “Given his comments in Jackson Hole and what we heard from him at the press conference, yes, I think Chair Powell would lean toward cutting 50 basis points again if there were further labor market weakness,” said Mr. Matthew Luzzetti, chief US economist at Deutsche Bank.
Earlier this week, Chicago Fed President Austan Goolsbee said policymakers "can't be behind the curve" if the economy is to have a soft landing. Meanwhile, Atlanta Fed President Raphael Bostic noted the US central bank needn't go on a "mad dash" to lower rates. Fed Governor Adriana Kugler said on Wednesday that she “strongly supported” the central bank’s decision last week, adding that it would be appropriate to cut rates further if inflation continues to ease as expected. Traders will take more cues from Fedspeak on Thursday. Any dovish remarks from Fed officials this week could trigger bets for another oversized interest rate cut by the Fed, which drags the Greenback lower against the Euro (EUR).
Survey data released earlier this week showed Eurozone business activity as a whole contracted sharply, triggering speculation that the European Central Bank (ECB) would cut rates again. HSBC analysts said on Wednesday it now expects the ECB to cut interest rates by 25 basis points (bps) at every meeting from October through to April next year, given weakening economic data.
ECB FAQs
The European Central Bank (ECB) in Frankfurt, Germany, is the reserve bank for the Eurozone. The ECB sets interest rates and manages monetary policy for the region. The ECB primary mandate is to maintain price stability, which means keeping inflation at around 2%. Its primary tool for achieving this is by raising or lowering interest rates. Relatively high interest rates will usually result in a stronger Euro and vice versa. The ECB Governing Council makes monetary policy decisions at meetings held eight times a year. Decisions are made by heads of the Eurozone national banks and six permanent members, including the President of the ECB, Christine Lagarde.
In extreme situations, the European Central Bank can enact a policy tool called Quantitative Easing. QE is the process by which the ECB prints Euros and uses them to buy assets – usually government or corporate bonds – from banks and other financial institutions. QE usually results in a weaker Euro. QE is a last resort when simply lowering interest rates is unlikely to achieve the objective of price stability. The ECB used it during the Great Financial Crisis in 2009-11, in 2015 when inflation remained stubbornly low, as well as during the covid pandemic.
Quantitative tightening (QT) is the reverse of QE. It is undertaken after QE when an economic recovery is underway and inflation starts rising. Whilst in QE the European Central Bank (ECB) purchases government and corporate bonds from financial institutions to provide them with liquidity, in QT the ECB stops buying more bonds, and stops reinvesting the principal maturing on the bonds it already holds. It is usually positive (or bullish) for the Euro.
- The Japanese Yen receives downward pressure as traders expect the BoJ to delay further rate hikes.
- The BoJ Meeting Minutes highlighted a consensus among members on the need to remain vigilant regarding inflation risks.
- Traders await US Gross Domestic Product Annualized for the second quarter, scheduled for Thursday.
The Japanese Yen (JPY) remains subdued against the US Dollar (USD) following the Bank of Japan’s (BoJ) minutes from its July policy meeting released on Thursday. The JPY faces challenges as traders expect the BoJ to ponder before further rate hikes.
The BoJ Monetary Policy Meeting Minutes expressed the members’ consensus on the importance of remaining vigilant regarding the risks of inflation exceeding targets. Several members indicated that raising rates to 0.25% would be suitable as a way to adjust the level of monetary support. A few others suggested that a moderate adjustment to monetary support would also be appropriate.
The US Dollar receives downward pressure from rising odds of further interest rate cuts by the US Federal Reserve (Fed) in upcoming policy meetings. According to the CME FedWatch Tool, markets are pricing in around a 50% chance of totaling 75 basis points to be deducted by the Fed to a range of 4.0-4.25% by the end of this year.
Traders are now focused on the release of the final US Gross Domestic Product (GDP) Annualized for the second quarter (Q2) scheduled to be released later in the day. Tokyo’s inflation data will be eyed on Friday, which may provide further guidance on the economic outlook and potential monetary policy moves by the Bank of Japan.
Daily Digest Market Movers: Japanese Yen depreciates due to concerns over BoJ delaying rate hikes
- Federal Reserve Governor Adriana Kugler said on Wednesday that she “strongly supported” the Fed’s decision to cut the interest rates by a half point last week. Kugler further stated that it will be appropriate to make additional rate cuts if inflation continues to ease as expected, per Bloomberg.
- Federal Reserve Governor Michelle Bowman stated on Tuesday that key inflation indicators are still "uncomfortably above" the 2% target, urging caution as the Fed moves forward with interest rate cuts. Despite this, she expressed a preference for a more conventional approach, advocating for a quarter percentage point reduction.
- US Consumer Confidence Index fell to 98.7 in September from a revised 105.6 in August. This figure registered the biggest decline since August 2021.
- On Tuesday, BoJ Governor Kazuo Ueda indicated that the central bank has time to evaluate market and economic conditions before making any policy adjustments, signaling that there is no urgency to raise interest rates again. Ueda also noted that Japan's real interest rate remains deeply negative, which is helping to stimulate the economy and drive up prices.
- Minneapolis Fed President Neel Kashkari said on Monday that he believes there should be and will be additional interest rate cuts in 2024. However, Kashkari expects future cuts to be smaller than the one from the September meeting, per Reuters.
- Chicago Fed President Austan Goolsbee noted, “Many more rate cuts are likely needed over the next year, rates need to come down significantly.” Additionally, Atlanta Fed President Raphael Bostic said that the US economy is close to normal rates of inflation and unemployment and the central bank needs monetary policy to "normalize" as well, per Reuters.
- On Monday, Japan's new "top currency diplomat," Atsushi Mimura, stated in an interview with NHK that the Yen carry trades accumulated in the past have likely been mostly unwound. Mimura cautioned that if such trades were to increase again, it could lead to heightened market volatility. "We are always monitoring the markets to ensure that does not happen," he added.
Technical Analysis: USD/JPY breaks above the descending channel to near 145.00
USD/JPY trades around 145.00 on Thursday. Analysis of the daily chart shows that the pair has breached above the descending channel, indicating a potential for a weakening of bearish bias. Additionally, the 14-day Relative Strength Index (RSI) has moved above the 50 level, suggesting a momentum shift to bullish from bearish sentiment.
On the upside, the USD/JPY pair may explore the region around its six-week high of 149.40.
In terms of support, the USD/JPY pair may test the immediate upper boundary of the descending channel, around the 144.00 level, followed by the nine-day Exponential Moving Average (EMA) at the level of 143.62. A return to the descending channel would reinforce the bearish bias and lead the pair to target the 139.58 region, the lowest point since June 2023.
USD/JPY: Daily Chart
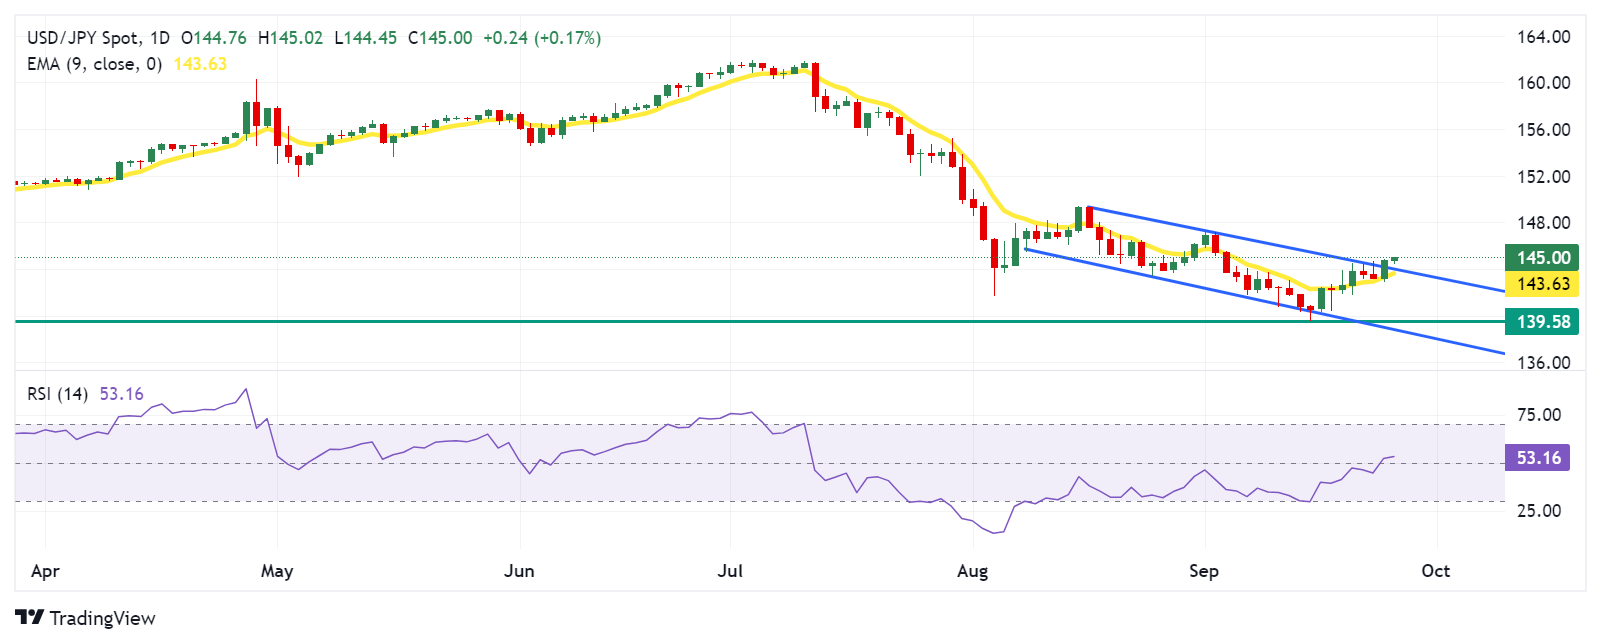
Japanese Yen PRICE Today
The table below shows the percentage change of Japanese Yen (JPY) against listed major currencies today. Japanese Yen was the weakest against the Australian Dollar.
| USD | EUR | GBP | JPY | CAD | AUD | NZD | CHF | |
|---|---|---|---|---|---|---|---|---|
| USD | -0.07% | -0.12% | 0.04% | -0.10% | -0.33% | -0.07% | -0.03% | |
| EUR | 0.07% | -0.05% | 0.08% | -0.03% | -0.26% | 0.00% | 0.06% | |
| GBP | 0.12% | 0.05% | 0.14% | 0.02% | -0.20% | 0.04% | 0.08% | |
| JPY | -0.04% | -0.08% | -0.14% | -0.12% | -0.37% | -0.12% | -0.09% | |
| CAD | 0.10% | 0.03% | -0.02% | 0.12% | -0.22% | 0.04% | 0.07% | |
| AUD | 0.33% | 0.26% | 0.20% | 0.37% | 0.22% | 0.27% | 0.31% | |
| NZD | 0.07% | -0.00% | -0.04% | 0.12% | -0.04% | -0.27% | 0.02% | |
| CHF | 0.03% | -0.06% | -0.08% | 0.09% | -0.07% | -0.31% | -0.02% |
The heat map shows percentage changes of major currencies against each other. The base currency is picked from the left column, while the quote currency is picked from the top row. For example, if you pick the Japanese Yen from the left column and move along the horizontal line to the US Dollar, the percentage change displayed in the box will represent JPY (base)/USD (quote).
Japanese Yen FAQs
The Japanese Yen (JPY) is one of the world’s most traded currencies. Its value is broadly determined by the performance of the Japanese economy, but more specifically by the Bank of Japan’s policy, the differential between Japanese and US bond yields, or risk sentiment among traders, among other factors.
One of the Bank of Japan’s mandates is currency control, so its moves are key for the Yen. The BoJ has directly intervened in currency markets sometimes, generally to lower the value of the Yen, although it refrains from doing it often due to political concerns of its main trading partners. The current BoJ ultra-loose monetary policy, based on massive stimulus to the economy, has caused the Yen to depreciate against its main currency peers. This process has exacerbated more recently due to an increasing policy divergence between the Bank of Japan and other main central banks, which have opted to increase interest rates sharply to fight decades-high levels of inflation.
The BoJ’s stance of sticking to ultra-loose monetary policy has led to a widening policy divergence with other central banks, particularly with the US Federal Reserve. This supports a widening of the differential between the 10-year US and Japanese bonds, which favors the US Dollar against the Japanese Yen.
The Japanese Yen is often seen as a safe-haven investment. This means that in times of market stress, investors are more likely to put their money in the Japanese currency due to its supposed reliability and stability. Turbulent times are likely to strengthen the Yen’s value against other currencies seen as more risky to invest in.
- GBP/USD attracts some dip-buying on Thursday amid a modest USD downtick.
- Bets for another 50 bps Fed rate cut and a positive risk tone undermine the USD.
- The BoE’s relatively hawkish stance remains supportive ahead of Powell’s speech.
The GBP/USD pair regains some positive traction during the Asian session on Thursday and reverses part of the overnight sharp retracement slide from the 1.3430 region, or its highest level since March 2022. Spot prices currently trade around the 1.3335-1.3340 area, up just over 0.10% for the day, and seem poised to resume the recent uptrend witnessed over the past two weeks or so.
Despite the fact that several Federal Reserve (Fed) officials this week tried to push back against market expectations for a more aggressive policy easing going forward, investors are still pricing in a greater chance of an oversized rate cut in November. This, along with the underlying bullish sentiment surrounding the global financial markets, fails to assist the safe-haven US Dollar (USD) to capitalize on Wednesday's solid rebound from the vicinity of the YTD low. This, in turn, is seen as a key factor lending some support to the GBP/USD pair.
Apart from this, expectations that the Bank of England's (BoE) rate-cutting cycle is more likely to be slower than in the United States (US) continues to underpin the British Pound (GBP) and contributes to the GBP/USD pair's intraday uptick. Bullish traders, however, might opt to wait for more cues about the Fed's rate-cut path before positioning for any further appreciating move. Hence, the focus remains glued to speeches by influential FOMC members, including Fed Chair Jerome Powell, which will drive the USD and provide a fresh impetus.
Traders on Thursday will further look to the US economic docket – featuring the release of the final Q2 GDP print, Weekly Initial Jobless Claims and Durable Goods Orders – to grab short-term opportunities later during the early North American session. The aforementioned fundamental backdrop, meanwhile, suggests that the path of least resistance for the GBP/USD pair remains to the upside. Hence, any meaningful corrective decline might still be seen as a buying opportunity and is more likely to remain limited.
US Dollar PRICE Today
The table below shows the percentage change of US Dollar (USD) against listed major currencies today. US Dollar was the strongest against the Japanese Yen.
| USD | EUR | GBP | JPY | CAD | AUD | NZD | CHF | |
|---|---|---|---|---|---|---|---|---|
| USD | -0.05% | -0.09% | 0.06% | -0.09% | -0.28% | -0.04% | -0.02% | |
| EUR | 0.05% | -0.04% | 0.10% | -0.04% | -0.23% | 0.00% | 0.03% | |
| GBP | 0.09% | 0.04% | 0.15% | 0.01% | -0.18% | 0.03% | 0.08% | |
| JPY | -0.06% | -0.10% | -0.15% | -0.13% | -0.35% | -0.13% | -0.08% | |
| CAD | 0.09% | 0.04% | -0.01% | 0.13% | -0.19% | 0.05% | 0.07% | |
| AUD | 0.28% | 0.23% | 0.18% | 0.35% | 0.19% | 0.25% | 0.26% | |
| NZD | 0.04% | -0.01% | -0.03% | 0.13% | -0.05% | -0.25% | 0.02% | |
| CHF | 0.02% | -0.03% | -0.08% | 0.08% | -0.07% | -0.26% | -0.02% |
The heat map shows percentage changes of major currencies against each other. The base currency is picked from the left column, while the quote currency is picked from the top row. For example, if you pick the US Dollar from the left column and move along the horizontal line to the Japanese Yen, the percentage change displayed in the box will represent USD (base)/JPY (quote).
- Silver fails to build on the overnight modest rebound from the vicinity of mid-$31.00s.
- The technical setup supports prospects for an extension of the recent upward trajectory.
- Any meaningful decline might still be seen as a buying opportunity and remain limited.
Silver (XAG/USD) struggles to gain any meaningful traction and oscillates in a narrow trading band, around the $31.80-$31.85 region during the Asian session on Thursday. The white metal, meanwhile, remains within the striking distance of a four-month peak touched on Wednesday and seems poised to prolong the upward trajectory witnessed over the past two weeks or so.
From a technical perspective, the overnight sustained strength beyond the $31.40-$31.45 supply zone comes on the back of the recent breakout through a short-term descending trend-line resistance. This, along with the fact that oscillators on the daily chart are holding comfortably in positive territory and are still away from being in the overbought zone, validates the positive outlook and suggests that the path of least resistance for the XAG/USD is to the upside.
Hence, a subsequent move beyond the $32.00 mark, towards retesting a one-decade top, around mid-$32.00s touched in May, looks like a distinct possibility. Some follow-through buying should pave the way for a further appreciating move towards conquering the $33.00 round-figure mark for the first time since December 2012.
On the flip side, weakness below the overnight swing low, around the $31.60-$31.55 region, is likely to find some support near the $31.25 area ahead of the $31.00 mark. A convincing break below the latter could drag the XAG/USD to the $30.60-$30.55 zone. The downfall could extend further towards the $30.00 psychological mark before the white metal drops to the $29.70-$29.65 area, or the descending trend-line resistance breakpoint, now turned support.
The latter now coincides with the 100-day Simple Moving Average (SMA) and should act as a key pivotal point, which if broken decisively will suggest that the XAG/USD has topped out in the near term and pave the way for a deeper corrective decline.
Silver daily chart
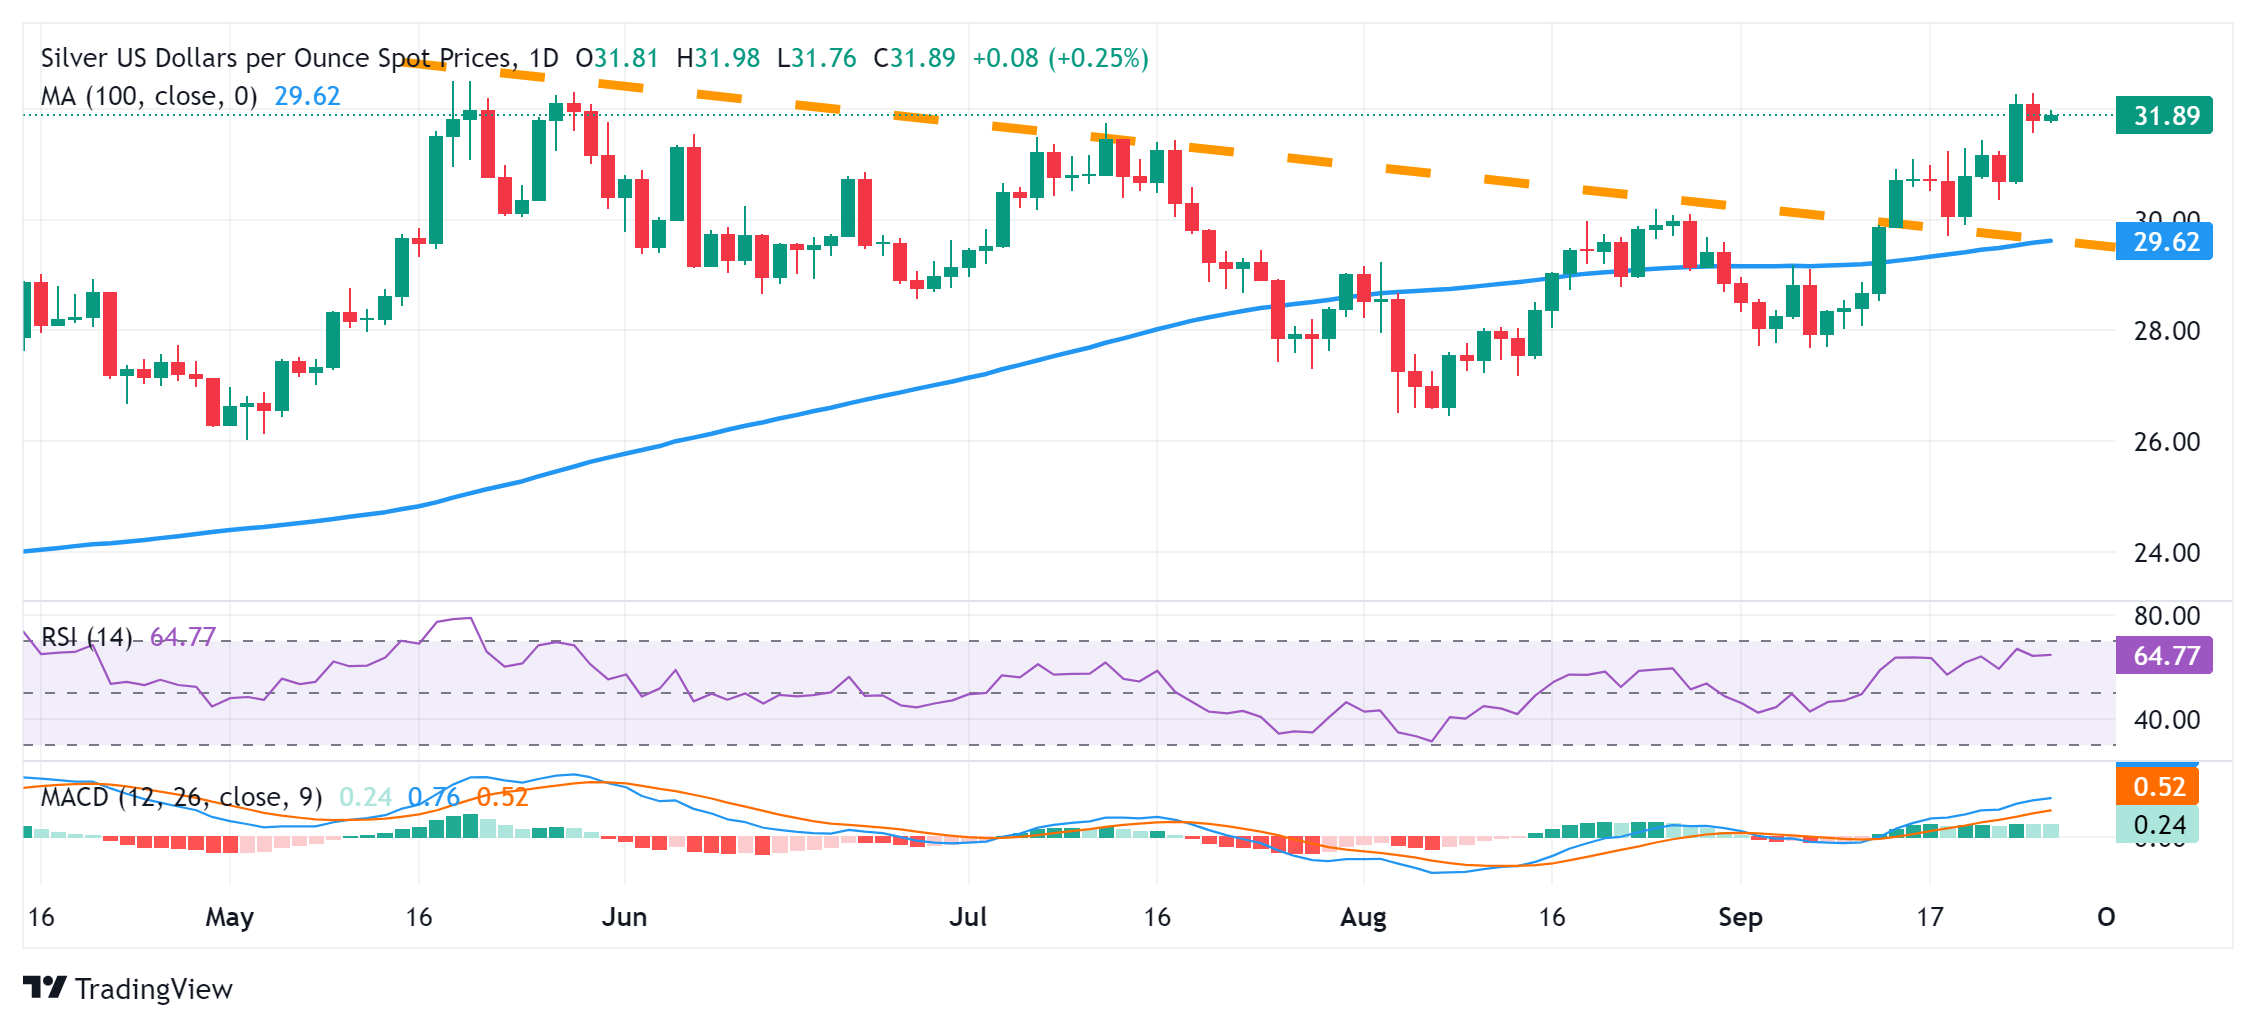
Silver FAQs
Silver is a precious metal highly traded among investors. It has been historically used as a store of value and a medium of exchange. Although less popular than Gold, traders may turn to Silver to diversify their investment portfolio, for its intrinsic value or as a potential hedge during high-inflation periods. Investors can buy physical Silver, in coins or in bars, or trade it through vehicles such as Exchange Traded Funds, which track its price on international markets.
Silver prices can move due to a wide range of factors. Geopolitical instability or fears of a deep recession can make Silver price escalate due to its safe-haven status, although to a lesser extent than Gold's. As a yieldless asset, Silver tends to rise with lower interest rates. Its moves also depend on how the US Dollar (USD) behaves as the asset is priced in dollars (XAG/USD). A strong Dollar tends to keep the price of Silver at bay, whereas a weaker Dollar is likely to propel prices up. Other factors such as investment demand, mining supply – Silver is much more abundant than Gold – and recycling rates can also affect prices.
Silver is widely used in industry, particularly in sectors such as electronics or solar energy, as it has one of the highest electric conductivity of all metals – more than Copper and Gold. A surge in demand can increase prices, while a decline tends to lower them. Dynamics in the US, Chinese and Indian economies can also contribute to price swings: for the US and particularly China, their big industrial sectors use Silver in various processes; in India, consumers’ demand for the precious metal for jewellery also plays a key role in setting prices.
Silver prices tend to follow Gold's moves. When Gold prices rise, Silver typically follows suit, as their status as safe-haven assets is similar. The Gold/Silver ratio, which shows the number of ounces of Silver needed to equal the value of one ounce of Gold, may help to determine the relative valuation between both metals. Some investors may consider a high ratio as an indicator that Silver is undervalued, or Gold is overvalued. On the contrary, a low ratio might suggest that Gold is undervalued relative to Silver.
Bloomberg News and Reuters are carrying a story early Thursday, citing that China is mulling plans to inject capital worth CNY1 trillion ($142 billion) into top state-owned banks, in a further effort to shore up the economy.
“Funding for the injection will mainly come from the issuance of new special sovereign bonds,” media reports.
Such a huge injection would be the first since the global financial crisis (GFC) in 2008.
Market reaction
The Australian Dollar is unmoved in reaction to the above headlines, with AUD/USD holding 0.31% gains on the day to trade near 0.6840, as of writing.
Australian Dollar FAQs
One of the most significant factors for the Australian Dollar (AUD) is the level of interest rates set by the Reserve Bank of Australia (RBA). Because Australia is a resource-rich country another key driver is the price of its biggest export, Iron Ore. The health of the Chinese economy, its largest trading partner, is a factor, as well as inflation in Australia, its growth rate and Trade Balance. Market sentiment – whether investors are taking on more risky assets (risk-on) or seeking safe-havens (risk-off) – is also a factor, with risk-on positive for AUD.
The Reserve Bank of Australia (RBA) influences the Australian Dollar (AUD) by setting the level of interest rates that Australian banks can lend to each other. This influences the level of interest rates in the economy as a whole. The main goal of the RBA is to maintain a stable inflation rate of 2-3% by adjusting interest rates up or down. Relatively high interest rates compared to other major central banks support the AUD, and the opposite for relatively low. The RBA can also use quantitative easing and tightening to influence credit conditions, with the former AUD-negative and the latter AUD-positive.
China is Australia’s largest trading partner so the health of the Chinese economy is a major influence on the value of the Australian Dollar (AUD). When the Chinese economy is doing well it purchases more raw materials, goods and services from Australia, lifting demand for the AUD, and pushing up its value. The opposite is the case when the Chinese economy is not growing as fast as expected. Positive or negative surprises in Chinese growth data, therefore, often have a direct impact on the Australian Dollar and its pairs.
Iron Ore is Australia’s largest export, accounting for $118 billion a year according to data from 2021, with China as its primary destination. The price of Iron Ore, therefore, can be a driver of the Australian Dollar. Generally, if the price of Iron Ore rises, AUD also goes up, as aggregate demand for the currency increases. The opposite is the case if the price of Iron Ore falls. Higher Iron Ore prices also tend to result in a greater likelihood of a positive Trade Balance for Australia, which is also positive of the AUD.
The Trade Balance, which is the difference between what a country earns from its exports versus what it pays for its imports, is another factor that can influence the value of the Australian Dollar. If Australia produces highly sought after exports, then its currency will gain in value purely from the surplus demand created from foreign buyers seeking to purchase its exports versus what it spends to purchase imports. Therefore, a positive net Trade Balance strengthens the AUD, with the opposite effect if the Trade Balance is negative.
- WTI prices could see an uptick due to rising fuel demand and declining stockpiles in the United States.
- EIA Crude Oil Stocks Change declined by 4.471 million barrels in the previous week, against a 1.2 million-barrel decline.
- Oil prices face downward pressure amid skepticism about the effectiveness of China’s stimulus measures to sufficiently boost its economy.
West Texas Intermediate (WTI) Oil prices remain subdued, trading near $69.60 per barrel during Asian trading hours on Thursday. However, crude Oil prices could rise due to increased fuel demand and shrinking stockpiles in the United States, the world's largest Oil consumer. The US Energy Information Administration (EIA) reported a significant drop in US crude Oil inventories, with stockpiles falling by 4.471 million barrels in the week ending September 20, surpassing the anticipated 1.2 million-barrel decline.
Crude Oil prices fell on Wednesday as concerns over potential supply disruptions in Libya diminished. Delegates from Libya's divided east and west reached an agreement on the process for appointing a central bank governor, a key step toward resolving the ongoing conflict over control of the country's Oil revenue, which has previously disrupted exports, according to Reuters.
The prices of Oil face challenges as traders re-evaluate the effectiveness of China’s stimulus plans to significantly boost the economy of the world's largest Oil importer. On Tuesday, People's Bank of China (PBOC) Governor Pan Gongsheng announced to reduction of the Reserve Requirement Ratio (RRR) by 50 basis points (bps). Gongsheng also noted that the central bank would lower the seven-day repo rate from 1.7% to 1.5%, and reduce the down payment for second homes from 25% to 15%. Bloomberg and Reuters reported that China is considering injecting USD 142 billion more of capital into top banks.
The decline in crude Oil prices may be limited by escalating tensions in the Middle East. An Israeli airstrike on Beirut killed a senior Hezbollah commander on Tuesday, raising fears of a broader conflict as cross-border rocket attacks intensified. Meanwhile, the United States, France, and several allies have called for an immediate 21-day ceasefire along the Israel-Lebanon border "Blue Line" and expressed support for a ceasefire in Gaza, following intense discussions at the United Nations on Wednesday.
WTI Oil FAQs
WTI Oil is a type of Crude Oil sold on international markets. The WTI stands for West Texas Intermediate, one of three major types including Brent and Dubai Crude. WTI is also referred to as “light” and “sweet” because of its relatively low gravity and sulfur content respectively. It is considered a high quality Oil that is easily refined. It is sourced in the United States and distributed via the Cushing hub, which is considered “The Pipeline Crossroads of the World”. It is a benchmark for the Oil market and WTI price is frequently quoted in the media.
Like all assets, supply and demand are the key drivers of WTI Oil price. As such, global growth can be a driver of increased demand and vice versa for weak global growth. Political instability, wars, and sanctions can disrupt supply and impact prices. The decisions of OPEC, a group of major Oil-producing countries, is another key driver of price. The value of the US Dollar influences the price of WTI Crude Oil, since Oil is predominantly traded in US Dollars, thus a weaker US Dollar can make Oil more affordable and vice versa.
The weekly Oil inventory reports published by the American Petroleum Institute (API) and the Energy Information Agency (EIA) impact the price of WTI Oil. Changes in inventories reflect fluctuating supply and demand. If the data shows a drop in inventories it can indicate increased demand, pushing up Oil price. Higher inventories can reflect increased supply, pushing down prices. API’s report is published every Tuesday and EIA’s the day after. Their results are usually similar, falling within 1% of each other 75% of the time. The EIA data is considered more reliable, since it is a government agency.
OPEC (Organization of the Petroleum Exporting Countries) is a group of 13 Oil-producing nations who collectively decide production quotas for member countries at twice-yearly meetings. Their decisions often impact WTI Oil prices. When OPEC decides to lower quotas, it can tighten supply, pushing up Oil prices. When OPEC increases production, it has the opposite effect. OPEC+ refers to an expanded group that includes ten extra non-OPEC members, the most notable of which is Russia.
- AUD/JPY steadily moves back closer to a multi-week high touched on Wednesday.
- The RBA’s hawkish stance and a positive risk tone continue to benefit the Aussie.
- Bets for another BoJ rate hike in 2024 should limit the JPY losses and cap the cross.
The AUD/JPY cross attracts some dip-buying during the Asian session on Thursday and jumps back above the 99.00 mark in the last hour, though remains below over a three-week top touched the previous day.
The Australian Dollar (AUD) continues to draw support from a more hawkish stance adopted by the Reserve Bank of Australia (RBA). In fact, the Australian central bank reiterated on Tuesday that policy will need to be restrictive until confidence returns that inflation is moving sustainably towards the target range. Adding to this, RBA Governor Michele Bullock stated that the recent data has not significantly influenced the policy outlook.
Moreover, the latest consumer inflation figures released on Wednesday showed that the core CPI remains above the RBA's 2-3% target band and is not enough to justify rate cuts in the near term. Meanwhile, the RBA's semi-annual Financial Stability Review (FSR) revealed that the risk of widespread financial stress remains limited. Furthermore, a positive risk tone undermines the safe-haven Japanese Yen (JPY) and benefits the risk-sensitive Aussie.
That said, growing acceptance that the Bank of Japan (BoJ) will hike interest rates again by the end of this year should help limit deeper JPY losses and keep a lid on the AUD/JPY cross. The bets were reaffirmed by the BoJ meeting minutes released earlier today, which showed that board members shared a view over the need for vigilance to the risk of inflation overshoot and that it was appropriate to adjust the degree of monetary support moderately.
Even from a technical perspective, the formation of a 'Death Cross' on the daily chart – with the 50-day Simple Moving Average (SMA) crossing below the very important 200-day SMA – warrants some caution for bullish traders. Hence, any subsequent move up is more likely to confront stiff resistance and remain capped near the 100.00 psychological mark, or the 200-day SMA, which should now act as a key pivotal point for the AUD/JPY cross.
Bank of Japan FAQs
The Bank of Japan (BoJ) is the Japanese central bank, which sets monetary policy in the country. Its mandate is to issue banknotes and carry out currency and monetary control to ensure price stability, which means an inflation target of around 2%.
The Bank of Japan has embarked in an ultra-loose monetary policy since 2013 in order to stimulate the economy and fuel inflation amid a low-inflationary environment. The bank’s policy is based on Quantitative and Qualitative Easing (QQE), or printing notes to buy assets such as government or corporate bonds to provide liquidity. In 2016, the bank doubled down on its strategy and further loosened policy by first introducing negative interest rates and then directly controlling the yield of its 10-year government bonds.
The Bank’s massive stimulus has caused the Yen to depreciate against its main currency peers. This process has exacerbated more recently due to an increasing policy divergence between the Bank of Japan and other main central banks, which have opted to increase interest rates sharply to fight decades-high levels of inflation. The BoJ’s policy of holding down rates has led to a widening differential with other currencies, dragging down the value of the Yen.
A weaker Yen and the spike in global energy prices have led to an increase in Japanese inflation, which has exceeded the BoJ’s 2% target. With wage inflation becoming a cause of concern, the BoJ looks to move away from ultra loose policy, while trying to avoid slowing the activity too much.
| Raw materials | Closed | Change, % |
|---|---|---|
| Silver | 31.789 | -1.06 |
| Gold | 265.64 | -0.08 |
| Palladium | 1041.94 | -1.93 |
- Indian Rupee steadies in Thursday’s Asian session.
- A rally in the Chinese Yuan and USD sales from local importers might boost the INR.
- Investors will monitor the final US Q2 GDP Annualized data and Fedspeak on Thursday.
The Indian Rupee (INR) trades flat on Thursday. The sales of the US Dollar (USD) from local corporations, foreign inflows in Indian stocks and bonds, and the stronger Chinese Yuan might underpin the local currency. However, the rise in crude oil prices or risk-averse environment could weigh on the INR and help limit the pair’s losses.
Traders will take more cues from the speeches of the US Federal Reserve (Fed) officials on Thursday, including Chair Jerome Powell. Any hints of another 50 basis points rate reduction by the Fed in November could undermine the USD against the INR. The final US Gross Domestic Product (GDP) Annualized for the second quarter (Q2) will be published later on the same day. On Friday, the Personal Consumption Expenditures Price Index (PCE) will be in the spotlight.
Daily Digest Market Movers: Indian Rupee remains firm amid US Dollar sales from importers
- The Asian Development Bank (ADB) said on Wednesday that it estimates India's economy to grow at 7.0% in fiscal year 2025 and 7.2% in fiscal year 2026, retaining its growth forecasts from April.
- Moody’s Analytics noted that the slowing Indian economy will drag APAC's growth in 2025, as India’s economy is projected to grow by 6.5% in 2025 from an estimated 7.1% for 2024.
- Fed Governor Adriana Kugler said on Wednesday that she “strongly supported” the central bank’s decision last week, adding that it would be appropriate to cut rates further if inflation continues to ease as expected.
- The US New Home Sales fell 4.7% MoM to 716,000 in August from a revised 751,000 in July, the Commerce Department reported Wednesday. This figure came in better than expectations.
- The headline Personal Consumption Expenditures Price Index (PCE) is expected to show an increase of 2.3% YoY in August, while the core PCE is estimated to rise 2.7% in the same reported period.
Technical Analysis: USD/INR’s bearish bias remains in play
The Indian Rupee trades on a flat note on the day. According to the daily chart, the USD/INR pair keeps the negative outlook below the key 100-day Exponential Moving Average (EMA). The 14-day Relative Strength Index (RSI) stands below the midline near 38.35, supporting the sellers for the time being.
Sustained bearish vibes potentially drag USD/INR lower to 83.44, the low of September 23. A break below this level could attract sellers to jump in and expose 83.00, representing the psychological level and the low of May 24.
In the bullish case, a decisive break above the 100-day EMA at 83.62 could see a rally to the next upside targets near the support-turned-resistance level at 83.75. Further north, the next resistance level emerges at the 84.00 round mark.
Indian Rupee FAQs
The Indian Rupee (INR) is one of the most sensitive currencies to external factors. The price of Crude Oil (the country is highly dependent on imported Oil), the value of the US Dollar – most trade is conducted in USD – and the level of foreign investment, are all influential. Direct intervention by the Reserve Bank of India (RBI) in FX markets to keep the exchange rate stable, as well as the level of interest rates set by the RBI, are further major influencing factors on the Rupee.
The Reserve Bank of India (RBI) actively intervenes in forex markets to maintain a stable exchange rate, to help facilitate trade. In addition, the RBI tries to maintain the inflation rate at its 4% target by adjusting interest rates. Higher interest rates usually strengthen the Rupee. This is due to the role of the ‘carry trade’ in which investors borrow in countries with lower interest rates so as to place their money in countries’ offering relatively higher interest rates and profit from the difference.
Macroeconomic factors that influence the value of the Rupee include inflation, interest rates, the economic growth rate (GDP), the balance of trade, and inflows from foreign investment. A higher growth rate can lead to more overseas investment, pushing up demand for the Rupee. A less negative balance of trade will eventually lead to a stronger Rupee. Higher interest rates, especially real rates (interest rates less inflation) are also positive for the Rupee. A risk-on environment can lead to greater inflows of Foreign Direct and Indirect Investment (FDI and FII), which also benefit the Rupee.
Higher inflation, particularly, if it is comparatively higher than India’s peers, is generally negative for the currency as it reflects devaluation through oversupply. Inflation also increases the cost of exports, leading to more Rupees being sold to purchase foreign imports, which is Rupee-negative. At the same time, higher inflation usually leads to the Reserve Bank of India (RBI) raising interest rates and this can be positive for the Rupee, due to increased demand from international investors. The opposite effect is true of lower inflation.
- Gold price remains confined in a narrow trading band, though the downside remains cushioned.
- Bets for another 50 bps Fed rate cut in November cap the USD and offer support for XAU/USD.
- Geopolitical tensions further act as a tailwind ahead of speeches by influential FOMC members.
Gold price (XAU/USD) extends its sideways consolidative price move for the second straight day on Thursday and remains well within striking distance of the record high touched the previous day. Traders opt to move to the sidelines ahead of Federal Reserve (Fed) Chair Jerome Powell's speech later today, which will be looked upon for cues about the pace of interest rate cuts going forward. This, in turn, will play a key role in determining the next leg of a directional move for the non-yielding yellow metal.
In the meantime, bets for another oversized interest rate cut by the US central bank fail to assist the US Dollar (USD) to capitalize on the previous day's solid recovery from the vicinity of the YTD low. Apart from this, rising tensions in the Middle East and concerns over China's economic recovery, despite the latest stimulus plans, act as a tailwind for the safe-haven Gold price. That said, slightly overbought conditions on the daily chart warrant caution before positioning for any further appreciating move.
Daily Digest Market Movers: Gold price bulls await Fed Chair Jerome Powell’s speech before placing fresh bets
- The US Dollar struggles to build on Wednesday's strong recovery gains amid dovish Federal Reserve expectations, which, in turn, continues to lend some support to the non-yielding Gold price.
- Several Fed officials this week tried to push back against bets for a more aggressive easing, though the markets are pricing in a greater chance of a 50 basis points rate cut in November.
- Hence, Fed Chair Jerome Powell's speech later this Thursday will be scrutinized closely for fresh cues about the future rate-cut path and to determine the near-term trajectory for the XAU/USD.
- The US macro data – the final Q2 GDP print, the usual Weekly Initial Jobless Claims, Durable Goods Orders – and speeches by other influential FOMC members should also provide some impetus.
- Meanwhile, the latest optimism led by a new round of Chinese stimulus measures announced this week fades amid doubts over its impact and worries about a global economic downturn.
- Moreover, investors remain concerned about the risk of a further escalation of geopolitical tensions and a broader conflict in the Middle East, offering support to the safe-haven precious metal.
Technical Outlook: Gold price could attract dip-buyers near $2,625, ascending channel throwback
From a technical perspective, the Relative Strength Index (RSI) on the daily chart is flashing overbought conditions and holding back bulls from placing fresh bets. That said, this week's breakout through a short-term ascending trend channel suggests that the path of least resistance for the Gold price remains to the upside. Hence, the subdued range-bound price action might still be categorized as a consolidation phase before the next leg up.
In the meantime, dips towards the ascending channel resistance breakpoint, around the $2,625 region, could be seen as a buying opportunity and remain limited near the $2,600 mark. A convincing break below the latter might prompt some technical selling and drag the Gold price towards the $2,575 region en route to the $2,560 area and the $2,535-2,530 resistance-turned-support.
Gold FAQs
Gold has played a key role in human’s history as it has been widely used as a store of value and medium of exchange. Currently, apart from its shine and usage for jewelry, the precious metal is widely seen as a safe-haven asset, meaning that it is considered a good investment during turbulent times. Gold is also widely seen as a hedge against inflation and against depreciating currencies as it doesn’t rely on any specific issuer or government.
Central banks are the biggest Gold holders. In their aim to support their currencies in turbulent times, central banks tend to diversify their reserves and buy Gold to improve the perceived strength of the economy and the currency. High Gold reserves can be a source of trust for a country’s solvency. Central banks added 1,136 tonnes of Gold worth around $70 billion to their reserves in 2022, according to data from the World Gold Council. This is the highest yearly purchase since records began. Central banks from emerging economies such as China, India and Turkey are quickly increasing their Gold reserves.
Gold has an inverse correlation with the US Dollar and US Treasuries, which are both major reserve and safe-haven assets. When the Dollar depreciates, Gold tends to rise, enabling investors and central banks to diversify their assets in turbulent times. Gold is also inversely correlated with risk assets. A rally in the stock market tends to weaken Gold price, while sell-offs in riskier markets tend to favor the precious metal.
The price can move due to a wide range of factors. Geopolitical instability or fears of a deep recession can quickly make Gold price escalate due to its safe-haven status. As a yield-less asset, Gold tends to rise with lower interest rates, while higher cost of money usually weighs down on the yellow metal. Still, most moves depend on how the US Dollar (USD) behaves as the asset is priced in dollars (XAU/USD). A strong Dollar tends to keep the price of Gold controlled, whereas a weaker Dollar is likely to push Gold prices up.
- The Australian Dollar gains ground as the RBA and Fed adopt different policy outlooks.
- The Reserve Bank of Australia is highly expected to keep interest rates unchanged in the near future.
- The US Federal Reserve may deliver more rate cuts by the end of this year.
The Australian Dollar (AUD) retraces its recent losses against the US Dollar (USD) on Thursday. The AUD/USD pair receives support from the divergent monetary policy outlooks between the two central banks. Additionally, the commodity-linked Aussie Dollar found support as China, its largest trading partner, announced a new round of stimulus measures to boost its economy.
The Reserve Bank of Australia (RBA) held the Official Cash Rate (OCR) steady at 4.35% on Tuesday, offering support to the Australian Dollar and bolstering the AUD/USD pair. Additionally, RBA Governor Michele Bullock confirmed that rates will remain on hold for now.
The Federal Open Market Committee (FOMC) lowered the federal funds rate to a range of 4.75% to 5.0% by delivering a bumper 50 basis point rate cut, marking the Fed’s first rate cut in over four years. According to the CME FedWatch Tool, markets are pricing in around 50% chance of 75 basis points to be deducted by the Fed to a range of 4.0-4.25% by the end of this year.
Daily Digest Market Movers: Australian Dollar appreciates due to a hawkish RBA
- Australian Treasurer Jim Chalmers is set to visit China this week to bolster economic ties between the two nations. "Given our vulnerability to fluctuations in the Chinese economy, it is essential to engage with key Chinese officials in Beijing over the next two days," Chalmers stated.
- In a recent note, JP Morgan advised investors to monitor commodities and bond yields in light of the positive market outlook following China's stimulus proposals on Tuesday. The bank emphasized that global growth has received a new boost from China, a factor that has been lacking in recent years. This development notably reduces the risk of a recession and is seen as favorable for the markets. However, JP Morgan also cautioned about the potential risk of reinflation.
- Australia’s Monthly Consumer Price Index rose 2.7% year-over-year in August, down from the previous 3.5% rise and expected 2.8% increase.
- On Tuesday, People's Bank of China (PBOC) Governor Pan Gongsheng announced that China will reduce the Reserve Requirement Ratio (RRR) by 50 basis points (bps). Gongsheng also noted that the central bank would lower the seven-day repo rate from 1.7% to 1.5%, and reduce the down payment for second homes from 25% to 15%. Additionally, the PBOC cut the one-year Medium-term Lending Facility (MLF) rate from 2.30% to 2.0% on Thursday, following the last reduction in July 2024, when the rate was lowered from 2.50%.
- Federal Reserve Governor Michelle Bowman stated on Tuesday that key inflation indicators are still "uncomfortably above" the 2% target, urging caution as the Fed moves forward with interest rate cuts. Despite this, she expressed a preference for a more conventional approach, advocating for a quarter percentage point reduction.
- US Consumer Confidence Index fell to 98.7 in September from a revised 105.6 in August. This figure registered the biggest decline since August 2021.
- The ANZ-Roy Morgan Australia Consumer Confidence Index rose by 0.8 points to 84.9 this week. Despite this increase, Consumer Confidence has now remained below the 85.0 mark for 86 consecutive weeks. On an annual basis, the index is up by 8.5 points from 76.4.
- The S&P Global US Composite Purchasing Managers Index (PMI) grew at a slower rate in September, registering 54.4 compared to 54.6 in August. The Manufacturing PMI unexpectedly dropped to 47.0, indicating contraction, while the Services PMI expanded more than anticipated, reaching 55.4.
Technical Analysis: Australian Dollar remains below lower boundary of the channel near 0.6850
The AUD/USD pair trades near 0.6830 on Thursday. Technical analysis of the daily chart indicates that the pair has breached below the ascending channel pattern, suggesting a potential for weakening bullish bias. However, the 14-day Relative Strength Index (RSI) remains above 50 level, suggesting that bullish sentiment is still intact.
In terms of resistance, the AUD/USD pair could test the lower boundary of the ascending channel at 0.6860 level. A return to the ascending channel would reinforce the bullish bias and lead the pair to approach the upper boundary of the ascending channel, around the 0.6960 level.
On the downside, the AUD/USD pair could find support at the nine-day Exponential Moving Average (EMA) at 0.6809 level. The next significant support is at the psychological level of 0.6700. A break below this level could push the pair further down toward its six-week low of 0.6622.
AUD/USD: Daily Chart
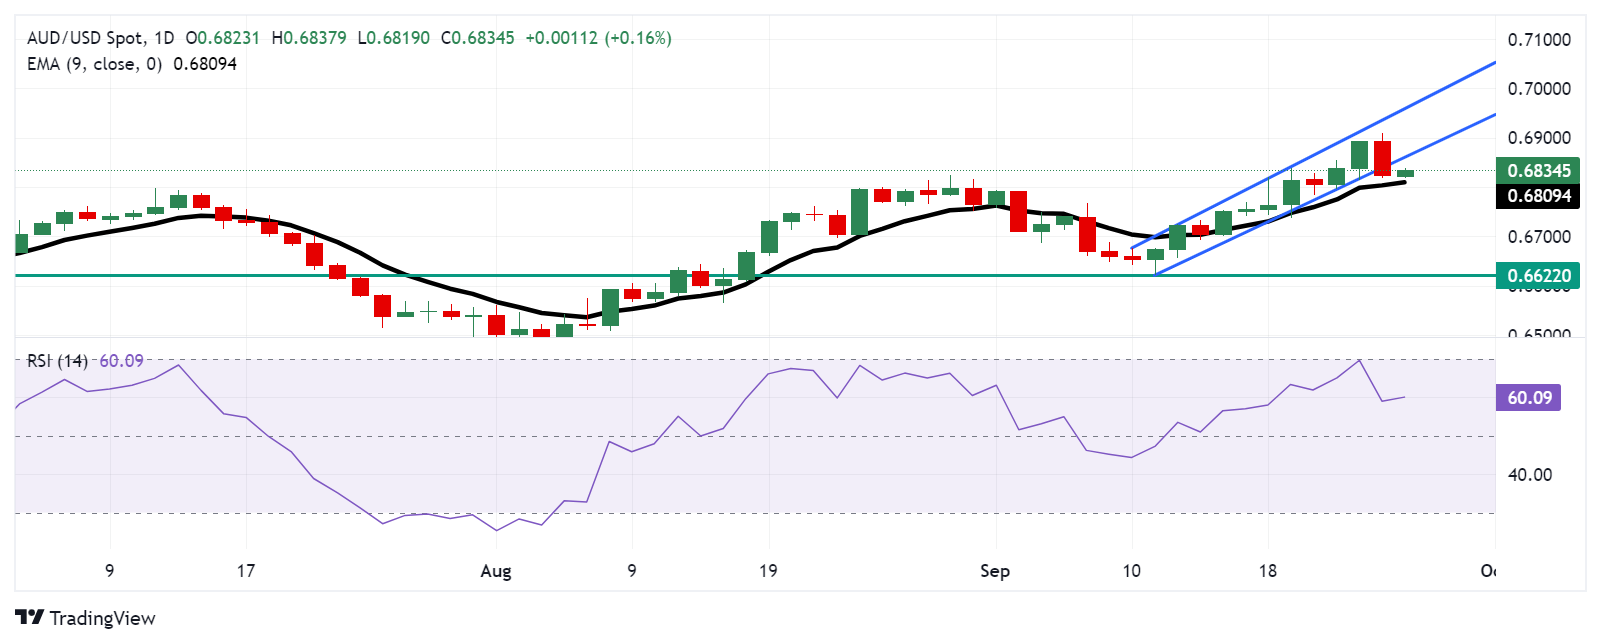
Australian Dollar PRICE Today
The table below shows the percentage change of Australian Dollar (AUD) against listed major currencies today. Australian Dollar was the strongest against the Japanese Yen.
| USD | EUR | GBP | JPY | CAD | AUD | NZD | CHF | |
|---|---|---|---|---|---|---|---|---|
| USD | -0.04% | -0.03% | 0.10% | -0.10% | -0.19% | 0.04% | 0.02% | |
| EUR | 0.04% | 0.00% | 0.11% | -0.07% | -0.15% | 0.08% | 0.06% | |
| GBP | 0.03% | -0.01% | 0.12% | -0.06% | -0.15% | 0.05% | 0.06% | |
| JPY | -0.10% | -0.11% | -0.12% | -0.18% | -0.30% | -0.09% | -0.09% | |
| CAD | 0.10% | 0.07% | 0.06% | 0.18% | -0.09% | 0.12% | 0.13% | |
| AUD | 0.19% | 0.15% | 0.15% | 0.30% | 0.09% | 0.24% | 0.21% | |
| NZD | -0.04% | -0.08% | -0.05% | 0.09% | -0.12% | -0.24% | -0.01% | |
| CHF | -0.02% | -0.06% | -0.06% | 0.09% | -0.13% | -0.21% | 0.01% |
The heat map shows percentage changes of major currencies against each other. The base currency is picked from the left column, while the quote currency is picked from the top row. For example, if you pick the Australian Dollar from the left column and move along the horizontal line to the US Dollar, the percentage change displayed in the box will represent AUD (base)/USD (quote).
Australian Dollar FAQs
One of the most significant factors for the Australian Dollar (AUD) is the level of interest rates set by the Reserve Bank of Australia (RBA). Because Australia is a resource-rich country another key driver is the price of its biggest export, Iron Ore. The health of the Chinese economy, its largest trading partner, is a factor, as well as inflation in Australia, its growth rate and Trade Balance. Market sentiment – whether investors are taking on more risky assets (risk-on) or seeking safe-havens (risk-off) – is also a factor, with risk-on positive for AUD.
The Reserve Bank of Australia (RBA) influences the Australian Dollar (AUD) by setting the level of interest rates that Australian banks can lend to each other. This influences the level of interest rates in the economy as a whole. The main goal of the RBA is to maintain a stable inflation rate of 2-3% by adjusting interest rates up or down. Relatively high interest rates compared to other major central banks support the AUD, and the opposite for relatively low. The RBA can also use quantitative easing and tightening to influence credit conditions, with the former AUD-negative and the latter AUD-positive.
China is Australia’s largest trading partner so the health of the Chinese economy is a major influence on the value of the Australian Dollar (AUD). When the Chinese economy is doing well it purchases more raw materials, goods and services from Australia, lifting demand for the AUD, and pushing up its value. The opposite is the case when the Chinese economy is not growing as fast as expected. Positive or negative surprises in Chinese growth data, therefore, often have a direct impact on the Australian Dollar and its pairs.
Iron Ore is Australia’s largest export, accounting for $118 billion a year according to data from 2021, with China as its primary destination. The price of Iron Ore, therefore, can be a driver of the Australian Dollar. Generally, if the price of Iron Ore rises, AUD also goes up, as aggregate demand for the currency increases. The opposite is the case if the price of Iron Ore falls. Higher Iron Ore prices also tend to result in a greater likelihood of a positive Trade Balance for Australia, which is also positive of the AUD.
The Trade Balance, which is the difference between what a country earns from its exports versus what it pays for its imports, is another factor that can influence the value of the Australian Dollar. If Australia produces highly sought after exports, then its currency will gain in value purely from the surplus demand created from foreign buyers seeking to purchase its exports versus what it spends to purchase imports. Therefore, a positive net Trade Balance strengthens the AUD, with the opposite effect if the Trade Balance is negative.
In its semi-annual Financial Stability Review (FSR) published on Thursday, the Reserve Bank of Australia (RBA) said that “the Australian financial system resilient, risks contained.”
Additional takeaways
Risks include stress in china's financial sector, lack of significant response from Beijing.
Low global risk premia, high leverage increase danger of disorderly downturn in global asset prices.
Financial system vulnerable to digitalisatiion, concentration of ai/cloud providers.
Growth of superannuation to one quarter of financial system could amplify shocks.
Risk of widespread financial stress in australia remains limited.
Small but rising share of australia home borrowers falling behind on payments.
Only around 2% of all owner-occupier borrowers in real danger of defaulting.
Less than 1% of owner-occupier loans more than 90 days in arrears.
Around 0.5% of home loans in arrears estimated to be in negative equity.
Vast majority of borrowers expected to be able to continue servicing debt.
Sees risk households could take on excessive debt once interest rates fall.
Australian banks well capitalised, profitable and have low exposure to bad debt.
Strengthening operation resilience of banks a priority for regulators.
Market reaction
AUD/USD was last seen trading 0.18% higher at 0.6835, underpinned by the encouraging FSR report.
- NZD/USD trades with mild gains near 0.6260 in Thursday’s Asian session.
- Fed's Kugler said she strongly supported half-point rate cut.
- China's rate cuts and new stimulus measures support the Kiwi.
The NZD/USD pair trades with mild positive bias around 0.6260 on Thursday during the Asian trading hours. The uptick of the pair is bolstered by the fresh Chinese stimulus plans and the softer US Dollar (USD) broadly. The final US Gross Domestic Product (GDP) Annualized for the second quarter (Q2) and Federal Reserve (Fed) Chair Jerome Powell's speech will be the highlights on Thursday.
The rising Fed deeper rate cut expectation in November weighs on the Greenback. Meanwhile, the US Dollar Index (DXY), which tracks the USD’s value against six major currencies, edges lower to 100.85. Federal Reserve Governor Adriana Kugler said on Wednesday that she will support additional rate cuts going forward, adding that the Fed should keep the focus on reducing inflation and also shift attention to maximum employment. The markets have priced in nearly 57.4% odds of a second 50 bps rate cut in the November meeting, while the chance of 25 bps stands at 42.6%, according to the CME FedWatch Tool.
The final US Q2 GDP data will be released later in the day, which is projected to expand by 3.0%. On Friday, the attention will shift to the Personal Consumption Expenditures Price Index (PCE), which could be further interpreted by the Fed and might offer some cues about the inflation trajectory in the US. The headline PCE is expected to show an increase of 2.3% YoY in August, while the core PCE is forecast to rise 2.7%.
On the Kiwi front, the People's Bank of China (PBOC) unleashed a swath of stimulus measures including cuts to its benchmark interest rate and reducing the reserve requirement ratio (RRR). This, in turn, lifts the China-proxy New Zealand Dollar (NZD) as China is the largest export partner to New Zealand. Nonetheless, the cautious mood ahead of the key US data or safe-haven flows amid the ongoing geopolitical risks could support the Greenback and cap the pair’s upside.
New Zealand Dollar FAQs
The New Zealand Dollar (NZD), also known as the Kiwi, is a well-known traded currency among investors. Its value is broadly determined by the health of the New Zealand economy and the country’s central bank policy. Still, there are some unique particularities that also can make NZD move. The performance of the Chinese economy tends to move the Kiwi because China is New Zealand’s biggest trading partner. Bad news for the Chinese economy likely means less New Zealand exports to the country, hitting the economy and thus its currency. Another factor moving NZD is dairy prices as the dairy industry is New Zealand’s main export. High dairy prices boost export income, contributing positively to the economy and thus to the NZD.
The Reserve Bank of New Zealand (RBNZ) aims to achieve and maintain an inflation rate between 1% and 3% over the medium term, with a focus to keep it near the 2% mid-point. To this end, the bank sets an appropriate level of interest rates. When inflation is too high, the RBNZ will increase interest rates to cool the economy, but the move will also make bond yields higher, increasing investors’ appeal to invest in the country and thus boosting NZD. On the contrary, lower interest rates tend to weaken NZD. The so-called rate differential, or how rates in New Zealand are or are expected to be compared to the ones set by the US Federal Reserve, can also play a key role in moving the NZD/USD pair.
Macroeconomic data releases in New Zealand are key to assess the state of the economy and can impact the New Zealand Dollar’s (NZD) valuation. A strong economy, based on high economic growth, low unemployment and high confidence is good for NZD. High economic growth attracts foreign investment and may encourage the Reserve Bank of New Zealand to increase interest rates, if this economic strength comes together with elevated inflation. Conversely, if economic data is weak, NZD is likely to depreciate.
The New Zealand Dollar (NZD) tends to strengthen during risk-on periods, or when investors perceive that broader market risks are low and are optimistic about growth. This tends to lead to a more favorable outlook for commodities and so-called ‘commodity currencies’ such as the Kiwi. Conversely, NZD tends to weaken at times of market turbulence or economic uncertainty as investors tend to sell higher-risk assets and flee to the more-stable safe havens.
On Thursday, the People’s Bank of China (PBoC) set the USD/CNY central rate for the trading session ahead at 7.0354, as compared to the previous day's fix of 7.0202 and 7.0367 Reuters estimates.
| Index | Change, points | Closed | Change, % |
|---|---|---|---|
| NIKKEI 225 | -70.33 | 37870.26 | -0.19 |
| Hang Seng | 128.54 | 19129.1 | 0.68 |
| KOSPI | -35.36 | 2596.32 | -1.34 |
| ASX 200 | -15.6 | 8126.4 | -0.19 |
| DAX | -78.13 | 18918.5 | -0.41 |
| CAC 40 | -38.39 | 7565.62 | -0.5 |
| Dow Jones | -293.47 | 41914.75 | -0.7 |
| S&P 500 | -10.67 | 5722.26 | -0.19 |
| NASDAQ Composite | 7.69 | 18082.21 | 0.04 |
- USD/JPY loses traction around 144.60 in Thursday’s early Asian session, down 0.10% on the day.
- Dovish Fed and rising bets on jumbo rate reduction weigh on the USD.
- Board members call for a gradual and timely rate increase, noted BoJ Minutes.
The USD/JPY pair edges lower to near 144.60 during the early Asian session on Thursday. The weakening of the US Dollar (USD) amid rising bets on a jumbo interest rate reduction from the US Federal Reserve (Fed) in November continues to weigh on the pair. Investors await economic data and signals on upcoming interest rate cuts from Fed officials.
Data released by the Commerce Department showed on Wednesday that US New Home Sales fell 4.7% MoM to 716,000 in August from a revised 751,000 in July, above the market consensus. Earlier this week, a weaker-than-expected US consumer sentiment report raised concerns about the health of the labor market, prompting the expectation of further deeper rate cuts by the Fed.
Traders have priced in nearly 57.4% odds of a 50 basis points (bps) cut by the Fed in the November meeting, while the chance of a 25 bps reduction stands at 42.6%, according to the CME FedWatch Tool. The Fed Chair Jerome Powell's speech will be in the spotlight on Thursday. Also, the final US Gross Domestic Product (GDP) Annualized for the second quarter (Q2) is due later in the day, and the figure is estimated to grow by 3.0%. Any indication of additional jumbo rate reduction by the Fed or signs of weakness in the US economy might drag the Greenback lower in the near term.
On the other hand, the Bank of Japan (BoJ) releases minutes of its July policy meeting on Thursday. The BoJ members called for a gradual and timely rate increase. Many members said it was appropriate to raise the interest rates to 0.25%, adjusting the degree of monetary support and few members said it was appropriate to adjust the degree of monetary support moderately.
Finance Minister Shunichi Suzuki said on Tuesday that the central bank will take appropriate monetary policy actions while continuing to coordinate closely with the government. The potential for the BoJ to delay raising interest rates further might undermine the JPY and cap the downside for USD/JPY.
Bank of Japan FAQs
The Bank of Japan (BoJ) is the Japanese central bank, which sets monetary policy in the country. Its mandate is to issue banknotes and carry out currency and monetary control to ensure price stability, which means an inflation target of around 2%.
The Bank of Japan has embarked in an ultra-loose monetary policy since 2013 in order to stimulate the economy and fuel inflation amid a low-inflationary environment. The bank’s policy is based on Quantitative and Qualitative Easing (QQE), or printing notes to buy assets such as government or corporate bonds to provide liquidity. In 2016, the bank doubled down on its strategy and further loosened policy by first introducing negative interest rates and then directly controlling the yield of its 10-year government bonds.
The Bank’s massive stimulus has caused the Yen to depreciate against its main currency peers. This process has exacerbated more recently due to an increasing policy divergence between the Bank of Japan and other main central banks, which have opted to increase interest rates sharply to fight decades-high levels of inflation. The BoJ’s policy of holding down rates has led to a widening differential with other currencies, dragging down the value of the Yen.
A weaker Yen and the spike in global energy prices have led to an increase in Japanese inflation, which has exceeded the BoJ’s 2% target. With wage inflation becoming a cause of concern, the BoJ looks to move away from ultra loose policy, while trying to avoid slowing the activity too much.
| Pare | Closed | Change, % |
|---|---|---|
| AUDUSD | 0.68231 | -1.01 |
| EURJPY | 161.048 | 0.6 |
| EURUSD | 1.1132 | -0.42 |
| GBPJPY | 192.677 | 0.33 |
| GBPUSD | 1.33196 | -0.69 |
| NZDUSD | 0.62632 | -1.18 |
| USDCAD | 1.34812 | 0.38 |
| USDCHF | 0.85037 | 0.87 |
| USDJPY | 144.662 | 1.03 |
The Bank of Japan (BoJ) board members shared their views on the monetary policy outlook on Thursday, per the BoJ Minutes of the July meeting.
Key quotes
Members shared a view over the need for vigilance to the risk of inflation overshoot.
Many members said it was appropriate to raise rates to 0.25%, adjusting the degree of monetary support.
A few members said it was appropriate to adjust the degree of monetary support moderately.
One member said economic conditions were good enough to somewhat push up the current very low policy rate.
One member said they must be vigilant to the impact of rising inflation, driven in part by the weak yen, on household sentiment and small firms' costs.
A few members said it was appropriate to gradually adjust very low rates now to avoid being forced to hike rates rapidly later.
One member said the BOJ must adjust the degree of monetary support further if the strength of capital expenditure and wage growth could be confirmed.
One member said they must carefully look at various risks in proceeding with monetary normalisation.
One member said BOJ must avoid creating too much market expectation of future rate hikes as inflation expectations have yet to be anchored at 2%
One member said it was difficult to move rates mechanically as there was high uncertainty on Japan's neutral rate.
One member said it was difficult to move rates mechanically as there was high uncertainty on Japan's neutral rate level
Cabinet minister representative said must be vigilant to impact of weak yen, rising inflation on households' purchasing power, downside risks to overseas economies
Market reaction to the BoJ Minutes
At the time of writing, USD/JPY was down 0.01% on the day at 144.74.
Bank of Japan FAQs
The Bank of Japan (BoJ) is the Japanese central bank, which sets monetary policy in the country. Its mandate is to issue banknotes and carry out currency and monetary control to ensure price stability, which means an inflation target of around 2%.
The Bank of Japan has embarked in an ultra-loose monetary policy since 2013 in order to stimulate the economy and fuel inflation amid a low-inflationary environment. The bank’s policy is based on Quantitative and Qualitative Easing (QQE), or printing notes to buy assets such as government or corporate bonds to provide liquidity. In 2016, the bank doubled down on its strategy and further loosened policy by first introducing negative interest rates and then directly controlling the yield of its 10-year government bonds.
The Bank’s massive stimulus has caused the Yen to depreciate against its main currency peers. This process has exacerbated more recently due to an increasing policy divergence between the Bank of Japan and other main central banks, which have opted to increase interest rates sharply to fight decades-high levels of inflation. The BoJ’s policy of holding down rates has led to a widening differential with other currencies, dragging down the value of the Yen.
A weaker Yen and the spike in global energy prices have led to an increase in Japanese inflation, which has exceeded the BoJ’s 2% target. With wage inflation becoming a cause of concern, the BoJ looks to move away from ultra loose policy, while trying to avoid slowing the activity too much.


© 2000-2026. All rights reserved.
This site is managed by Teletrade D.J. LLC 2351 LLC 2022 (Euro House, Richmond Hill Road, Kingstown, VC0100, St. Vincent and the Grenadines).
The information on this website is for informational purposes only and does not constitute any investment advice.
The company does not serve or provide services to customers who are residents of the US, Canada, Iran, The Democratic People's Republic of Korea, Yemen and FATF blacklisted countries.
Making transactions on financial markets with marginal financial instruments opens up wide possibilities and allows investors who are willing to take risks to earn high profits, carrying a potentially high risk of losses at the same time. Therefore you should responsibly approach the issue of choosing the appropriate investment strategy, taking the available resources into account, before starting trading.
Use of the information: full or partial use of materials from this website must always be referenced to TeleTrade as the source of information. Use of the materials on the Internet must be accompanied by a hyperlink to teletrade.org. Automatic import of materials and information from this website is prohibited.
Please contact our PR department if you have any questions or need assistance at pr@teletrade.global.
transfers