- Analytics
- News and Tools
- Market News
CFD Markets News and Forecasts — 26-06-2024
ANZ"s Roy Morgan New Zealand Consumer Confidence fell to 83.0 from the previous month's 84.9 as the measure of consumer sentiment retreated in June, sticking close to multi-year lows in the sentiment index.
As noted by ANZ's Chief Economist Sharon Zollner, "consumer pessimism is consistent with the broader economic data that shows households are tightening their belts in the face of restrictive monetary conditions, a stagnant housing market, and a softening labour market." Chief Economist Zollner continued, "slowing CPI inflation and expectations that fixed mortgage rates are likely to decline from here will be providing some relief, but this is clearly only a partial offset to the relatively lengthy list of headwinds."
Economic Indicator
ANZ – Roy Morgan Consumer Confidence
The Consumer Confidence released by the ANZ is a leading index that measures the level of consumer confidence in economic activity. A high level of consumer confidence stimulates economic expansion while a low level drives to economic downturn. A high reading is seen as positive (or bullish) for the NZD, while a low reading is seen as negative (or bearish).
Read more.Last release: Wed Jun 26, 2024 22:00
Frequency: Monthly
Actual: 83
Consensus: -
Previous: 84.9
Source: ANZ
About New Zealand's Roy Morgan Consumer Confidence
The Consumer Confidence released by the ANZ is a leading index that measures the level of consumer confidence in economic activity. A high level of consumer confidence stimulates economic expansion while a low level drives to economic downturn. A high reading is seen as positive (or bullish) for the NZD, while a low reading is seen as negative (or bearish).
- Rate cut hopes slowly bleed confidence on data-thin Wednesday.
- Risk-off market flows take a step higher, but remain subdued amid low-tier data.
- The latter half of the trading week kicks off a flurry of top-tier data releases.
GBP/USD backslid into familiar near-term lows on Wednesday as tepid market flows bolstered the US Dollar. The Pound Sterling remained pinned on the low side as the pair struggled to stay above 1.2600.
Wednesday brought little of note in scheduled releases, with the UK absent from the economic calendar and US New Home Sales Change in May clocking in a -11.3% decline MoM compared to the previous month’s 2.0%, revised sharply from the initial print of -4.7%.
Forex Today: Investors look at US PCE
Thursday kicks off a flurry of meaningful data after spending most of the early week in the doldrums. The Bank of England’s (BoE) latest Financial Stability Report will be published early during the London market session, followed by US Durable Goods Orders, revisions to first-quarter Gross Domestic Product (GDP), and weekly Initial Jobless Claims.
US QoQ is expected to tick upward slightly to 1.4% from the initial print of 1.3%, while May’s US Durable Goods Orders are expected to print a -0.1% contraction compared to the previous month’s revised 0.6%. US Initial Jobless Claims for the week ended June 21 are expected to tick slightly lower to 236K from the previous 238K, but the figure is expected to come in above the four-week average of 232.75K.
Friday will round out the trading week with the UK’s own quarterly GDP revisions, expected to hold steady at 0.6% QoQ, with May’s US Personal Consumption Expenditure Price Index (PCE) inflation. Core PCE Price Index inflation is expected to tick down YoY to 2.6% from the previous 2.8% as market participants hope for further signs of easing inflation to help push the Federal Reserve (Fed) towards rate cuts sooner rather than later.
According to the CME’s FedWatch Tool, rate market bets of a September 18 rate trim from the Federal Open Market Committee (FOMC) have slowly bled out confidence. They are approaching 60% odds of at least a quarter-point rate cut on September 18 after peaking just above 70% last week.
British Pound PRICE This week
The table below shows the percentage change of British Pound (GBP) against listed major currencies this week. British Pound was the strongest against the New Zealand Dollar.
| USD | EUR | GBP | JPY | CAD | AUD | NZD | CHF | |
|---|---|---|---|---|---|---|---|---|
| USD | 0.12% | 0.17% | 0.58% | 0.08% | -0.11% | 0.57% | 0.36% | |
| EUR | -0.12% | 0.07% | 0.53% | 0.01% | -0.20% | 0.50% | 0.32% | |
| GBP | -0.17% | -0.07% | 0.39% | -0.06% | -0.28% | 0.42% | 0.24% | |
| JPY | -0.58% | -0.53% | -0.39% | -0.49% | -0.66% | 0.04% | -0.22% | |
| CAD | -0.08% | -0.01% | 0.06% | 0.49% | -0.18% | 0.48% | 0.30% | |
| AUD | 0.11% | 0.20% | 0.28% | 0.66% | 0.18% | 0.70% | 0.52% | |
| NZD | -0.57% | -0.50% | -0.42% | -0.04% | -0.48% | -0.70% | -0.19% | |
| CHF | -0.36% | -0.32% | -0.24% | 0.22% | -0.30% | -0.52% | 0.19% |
The heat map shows percentage changes of major currencies against each other. The base currency is picked from the left column, while the quote currency is picked from the top row. For example, if you pick the British Pound from the left column and move along the horizontal line to the US Dollar, the percentage change displayed in the box will represent GBP (base)/USD (quote).
GBP/USD technical outlook
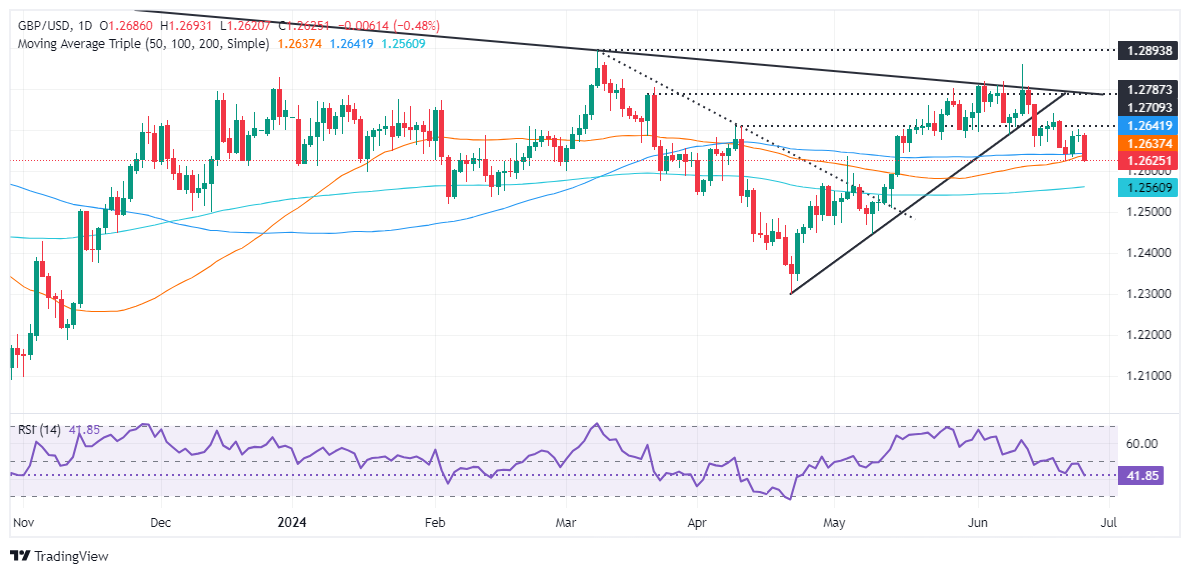
The Cable has extended a two-week backslide as the pair tumbles from the last swing high to 1.2860, shedding the 50-day Exponential Moving Average (EMA) at 1.2671 and is now within touch range of major technical support from the 200-day EMA at 1.2600.
A supply zone priced in above 1.2800 is firmly crimping bullish momentum, and an extended bearish decline will push the GBP/USD down to April’s swing low into 1.2300.
GBP/USD daily chart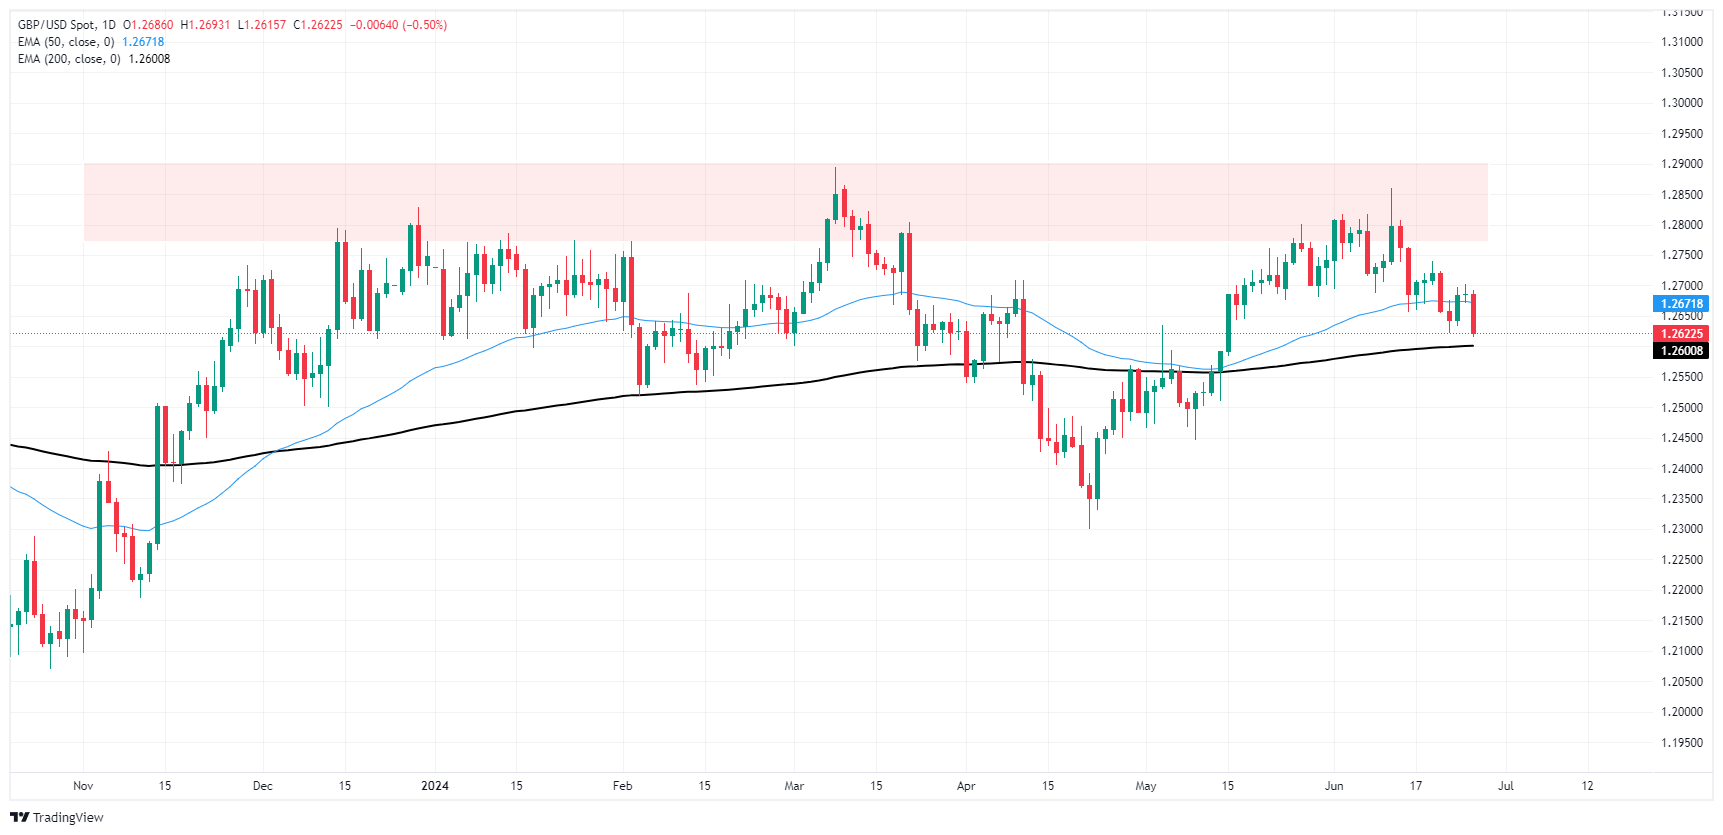
Pound Sterling FAQs
The Pound Sterling (GBP) is the oldest currency in the world (886 AD) and the official currency of the United Kingdom. It is the fourth most traded unit for foreign exchange (FX) in the world, accounting for 12% of all transactions, averaging $630 billion a day, according to 2022 data. Its key trading pairs are GBP/USD, aka ‘Cable’, which accounts for 11% of FX, GBP/JPY, or the ‘Dragon’ as it is known by traders (3%), and EUR/GBP (2%). The Pound Sterling is issued by the Bank of England (BoE).
The single most important factor influencing the value of the Pound Sterling is monetary policy decided by the Bank of England. The BoE bases its decisions on whether it has achieved its primary goal of “price stability” – a steady inflation rate of around 2%. Its primary tool for achieving this is the adjustment of interest rates. When inflation is too high, the BoE will try to rein it in by raising interest rates, making it more expensive for people and businesses to access credit. This is generally positive for GBP, as higher interest rates make the UK a more attractive place for global investors to park their money. When inflation falls too low it is a sign economic growth is slowing. In this scenario, the BoE will consider lowering interest rates to cheapen credit so businesses will borrow more to invest in growth-generating projects.
Data releases gauge the health of the economy and can impact the value of the Pound Sterling. Indicators such as GDP, Manufacturing and Services PMIs, and employment can all influence the direction of the GBP. A strong economy is good for Sterling. Not only does it attract more foreign investment but it may encourage the BoE to put up interest rates, which will directly strengthen GBP. Otherwise, if economic data is weak, the Pound Sterling is likely to fall.
Another significant data release for the Pound Sterling is the Trade Balance. This indicator measures the difference between what a country earns from its exports and what it spends on imports over a given period. If a country produces highly sought-after exports, its currency will benefit purely from the extra demand created from foreign buyers seeking to purchase these goods. Therefore, a positive net Trade Balance strengthens a currency and vice versa for a negative balance.
- GBP/JPY continues to climb to fresh highs as Yen extends backslide.
- Floundering JPY draws out more direct warnings from Japanese officials.
- Market flows unlikely to change as rate differential remains wide.
GBP/JPY set a fresh 16-year high on Wednesday, marking the fourth consecutive day the Guppy has reached a new peak as the Japanese Yen continues to tumble. Increasingly stern alerts from Japanese policymakers regarding the pace of the Yen’s decline has produced very little results as investors await actual policy changes from the Bank of Japan (BoJ) and the Japanese Ministry of Finance (MoF).
Currency chief Masato Kanda, Japan’s Vice Finance Minister noted early Wednesday that he has “serious concern about the recent rapid weakening of the yen”, within Kanda continuing that he and the MoF are closely monitoring market trends with a high sense of urgency”. Kanda ended with saying that “we will take necessary actions against any excessive movements.”
GBP/JPY briefly softened to 202.40 before Guppy traders promptly responded by pushing the pair to a fresh 16-year high at 203.15.
The back half of the trading week kicks off a raft of impactful data for Japan and the UK, with Japanese Retail Trade figures due early Thursday. The Bank of England (BoE) will release its latest Financial Stability Report later in the day, leaving Yen pairs to pivot to face down the latest Japanese Tokyo Consum Price Index (CPI) inflation figures due early Friday. The UK’s first-quarter Gross Domestic Product (GDP) will be revised to round out the trading week.
GBP/JPY technical outlook
A steady grind into the high side leaves GBP/JPY with little meaningful technical resistance levels. The pair has risen 2% from the last swing low into 198.90, trading steadily north of the 200-hour Exponential Moving Average (EMA) rising into 201.60.
Daily candlesticks have churned out an eighth consecutive gain as the Guppy continues its march towards 204.00. The pair is up 13% in 2024, and has closed in the green for six straight months.
GBP/JY hourly chart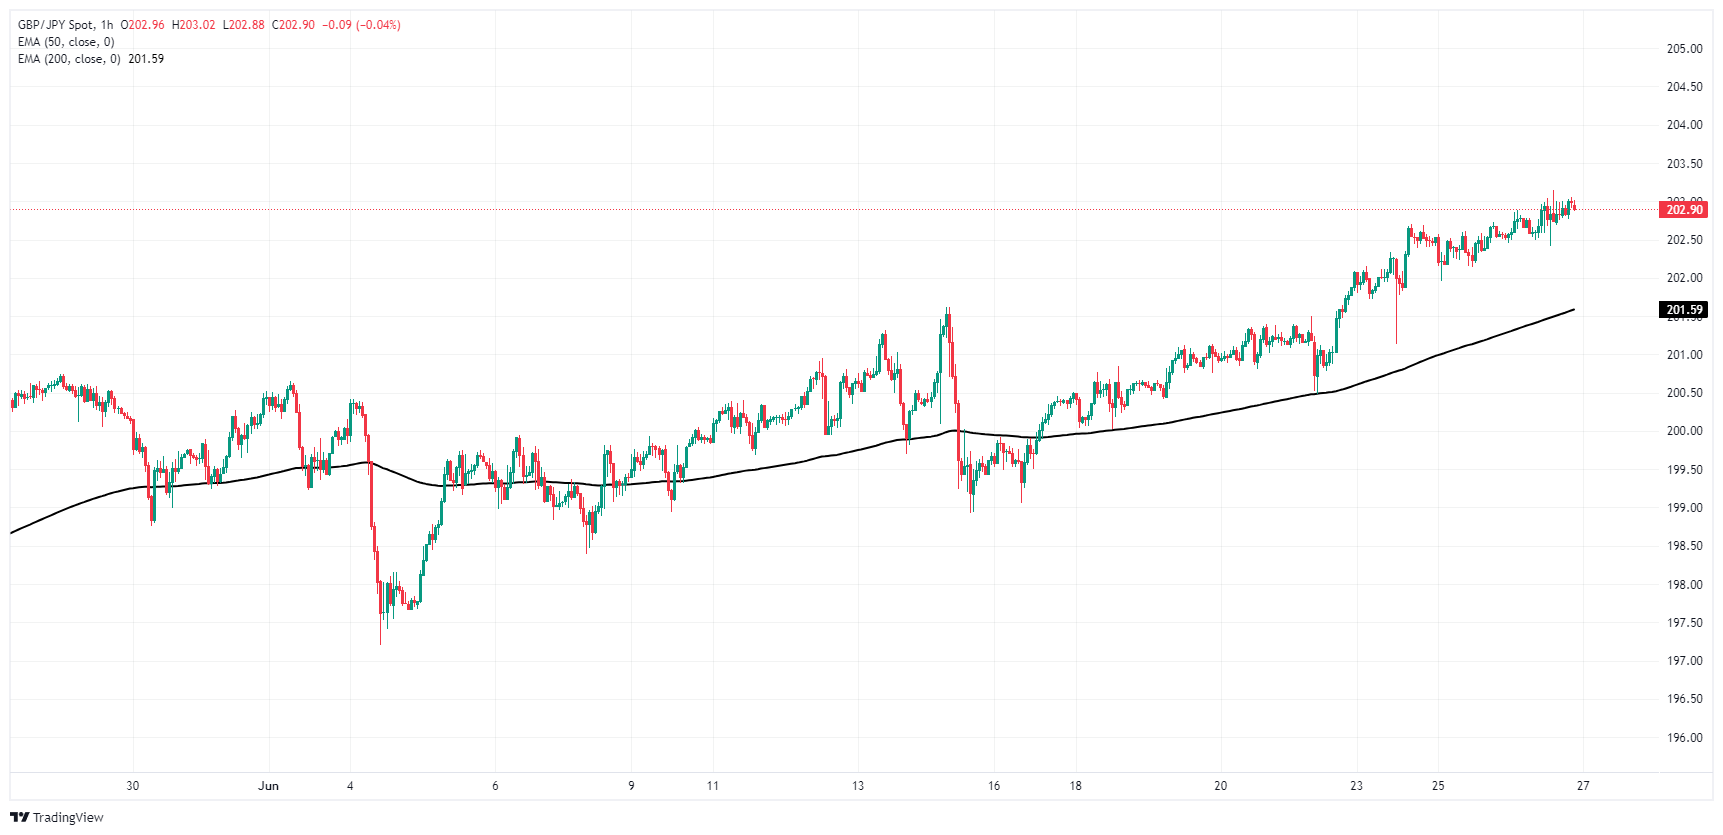
GBP/JPY daily chart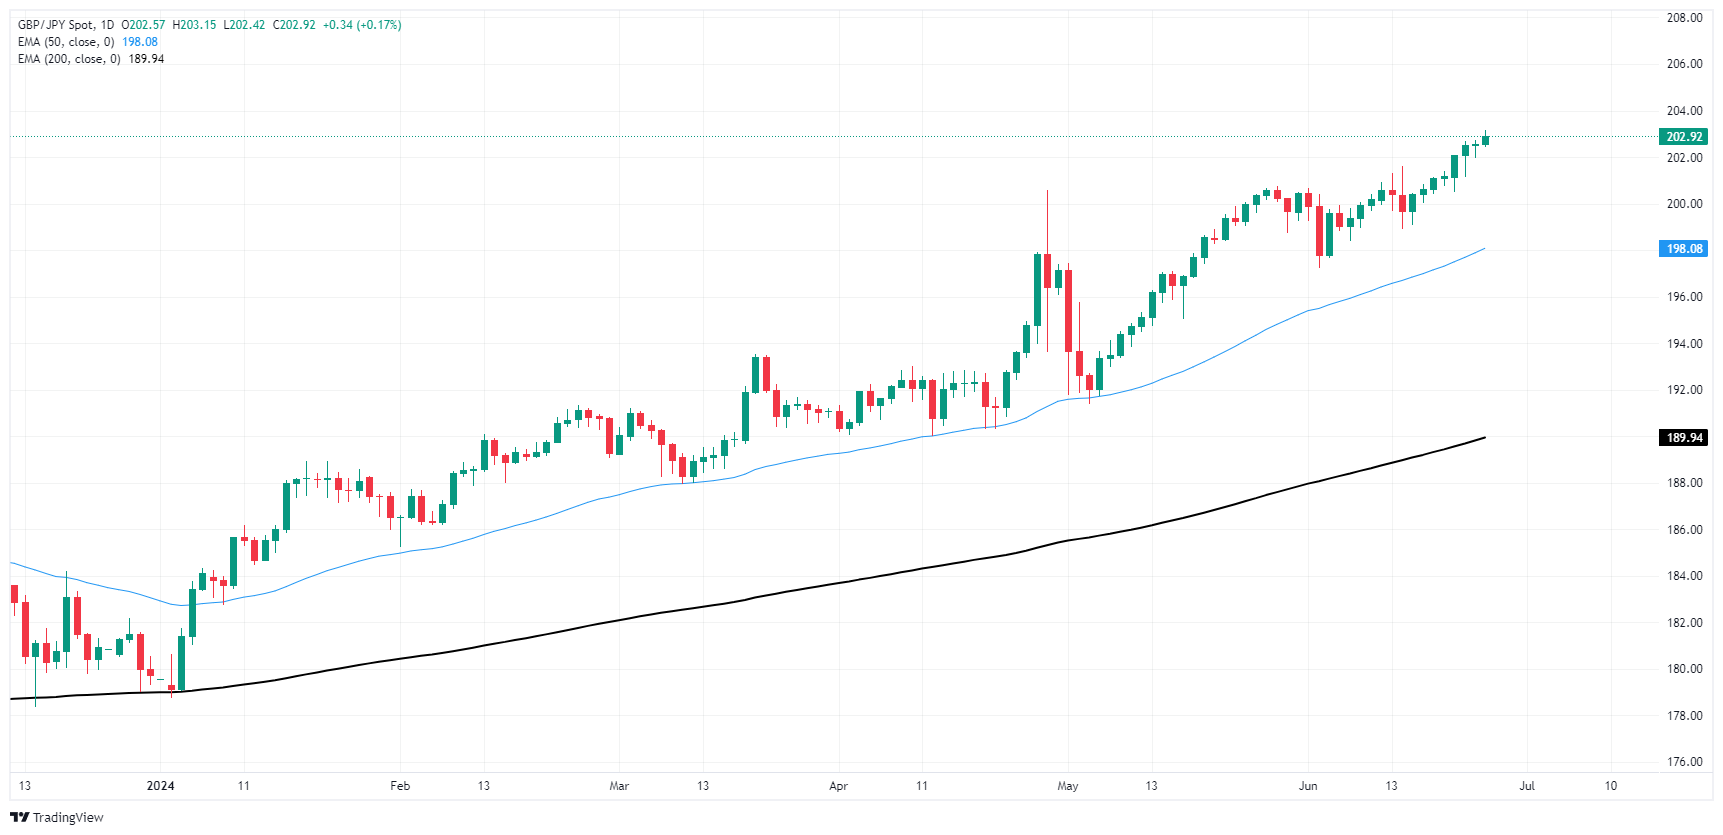
- Silver drops influenced by Fed's Core PCE Price Index anticipation.
- Last week's bearish engulfing pattern and RSI hint at more declines.
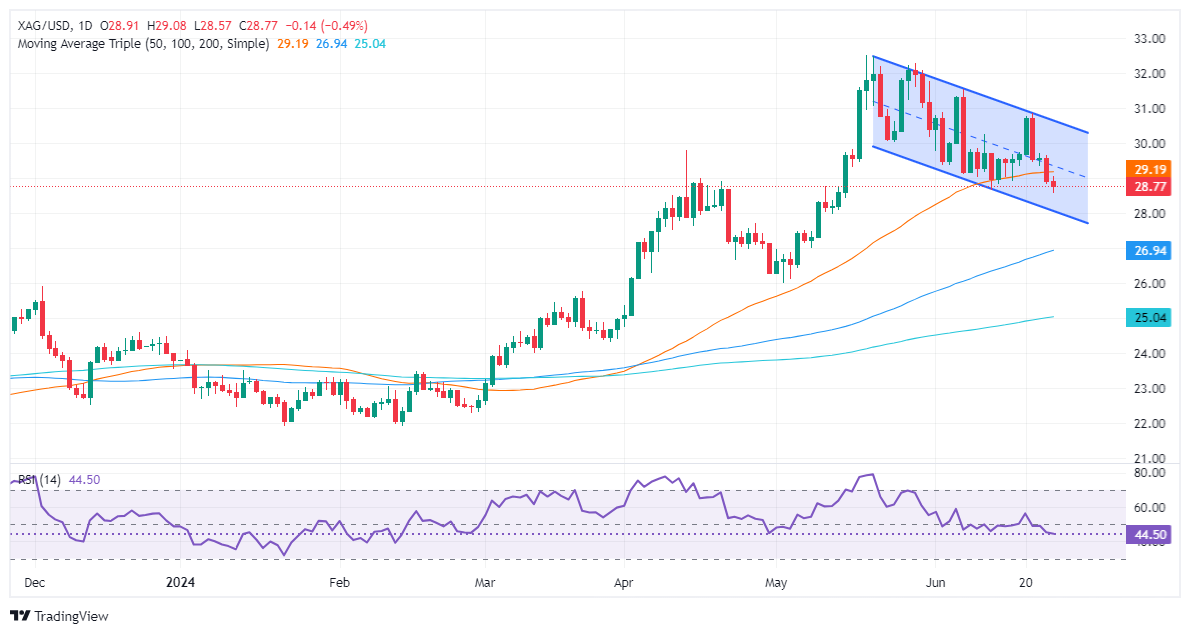
- Support levels: $28.28 (June 10 high), $28.00, $27.01 (May 8 low), $26.82 (100-DMA).
- Resistance points: $29.17 (50-DMA), $31.54 (June 7 high), $32.00, $32.51 (YTD high).
Silver price fell on Wednesday as market participants awaited the release of the Fed’s preferred inflation gauge, the core Personal Consumption Expenditure (PCE) Price Index, after releases from major countries hinted at a reacceleration of inflation. The XAG/USD spot price is at $28.76, down by 0.46%.
XAG/USD Price Analysis: Technical outlook
The grey metal formed a ‘bearish engulfing’ chart pattern last week, indicating potential for further downside. Momentum support sellers, as measured by the bearish Relative Strength Index (RSI), suggest that silver could extend its losses.
Therefore, XAG/USD's first support is the June 10, 2021, high at $28.28. A breach of the latter will expose the psychological $28.00 mark, followed by the May 8 swing low of $27.01, ahead of the 100-DMA at $26.82.
Conversely, if XAG/USD resumes its uptrend, the next resistance level would be the 50-day moving average (DMA) at $29.17. Surpassing this level would target the June 7 high of $31.54. Clearing this would aim for $32.00 before challenging the year-to-date (YTD) high of $32.51.
XAG/USD Price Action – Daily Chart
- On Wednesday, NZD/USD dives further, approaching 100 and 200-day Simple SMA convergence.
- The Kiwi's outlook could skew bearish as the pair nears losing the significant 0.6070 threshold.
On Wednesday, the NZD/USD took a big hit, with the pair plunging towards the convergence of the 100 and 200-day Simple Moving Averages (SMAs) near the 0.6070 level. Pressure mounts on the pair and further losses could be on the horizon if the bears fail to defend this crucial area.
The Relative Strength Index (RSI) for the NZD/USD pair on the daily chart plummeted to 42, suggesting a deepening bearish momentum. Even though it hasn't reached the oversold threshold yet, the declining trend is visible. The Moving Average Convergence Divergence (MACD) indicates bearish sentiment with rising red bars, affirming the stronger position of the sellers.
NZD/USD daily chart
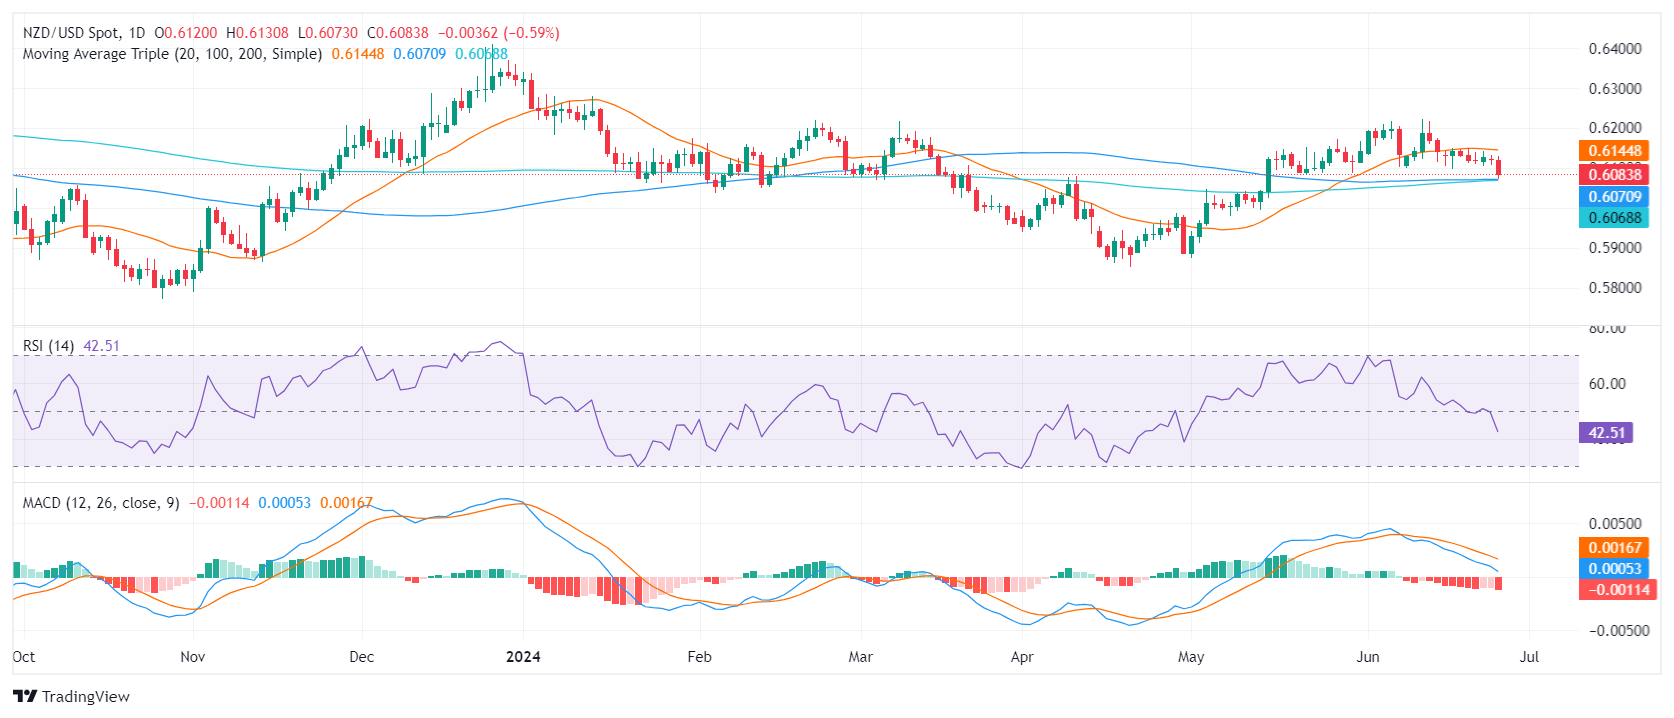
The NZD/USD finds immediate support near the 0.6070 threshold coinciding with the converging 100 and 200-day SMAs. Additional support is lurking lower at 0.6050. A breakdown below these SMAs would validate a deeper sell-off scenario.
On the flip side, resistance is now at the former support level of 0.6100. The 20-day SMA at 0.6145 offers additional resistance, followed by resistance points at 0.6170 and 0.6200. A decisive breakout above these levels could signal a termination of the current bearish trend and a shift in favor of the bulls.
- NZD/JPY continues consolidating at 97.70.
- The 20-day SMA will offer strong support at 96.30 where the sellers will face a strong fortification.
- Despite the consolidation, the bullish outlook remains afloat, with targets set on the key resistance of 98.00.
On Wednesday, the NZD/JPY cross was seen neutral at 97.70 while extending its phase of consolidation. Nevertheless, the pair upholds robust support at the 20-day Simple Moving Average (SMA) of 96.30, maintaining its position near levels not seen since 2007. In that sense, a healthy correction was increasingly necessary to alleviate the overbought conditions.
The daily Relative Strength Index (RSI) currently sits at 64, slightly lower than Tuesday'sreading, indicating a mild downward momentum. Despite this subtle decline, the indicator remains in positive territory, moving away from extreme conditions. Conversely, the Moving Average Convergence Divergence (MACD) prints a fresh red bar, signaling a reduced buying pressure. This hints at a possible continuation of the consolidation phase.
NZD/JPY daily chart
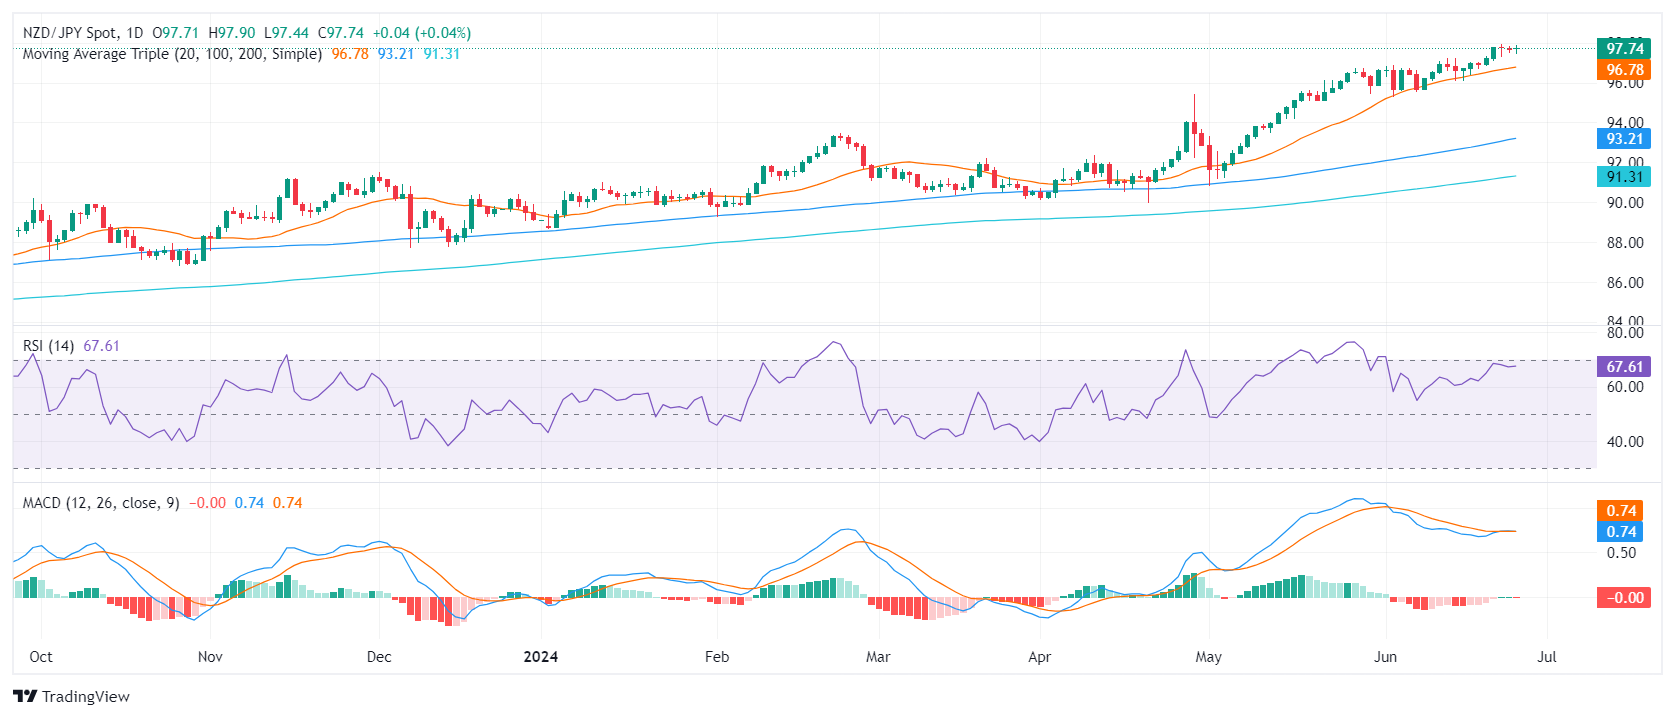
The predominance of bulls above the 20-day SMA reflects the persistent upward pressure supporting the cross. With technical indicators falling back from overbought regions, the upper hand still belongs to the bulls, albeit with the increasing necessity of a correction or consolidation to sustain the upward trajectory.
Looking ahead, market participants are looking closely at the immediate support level of 97.00, and are eyeing the resistance target of 98.00. A decisive break above this consolidation range would confirm further upside potential, whereas a dip below the 20-day SMA could suggest a deeper correction.
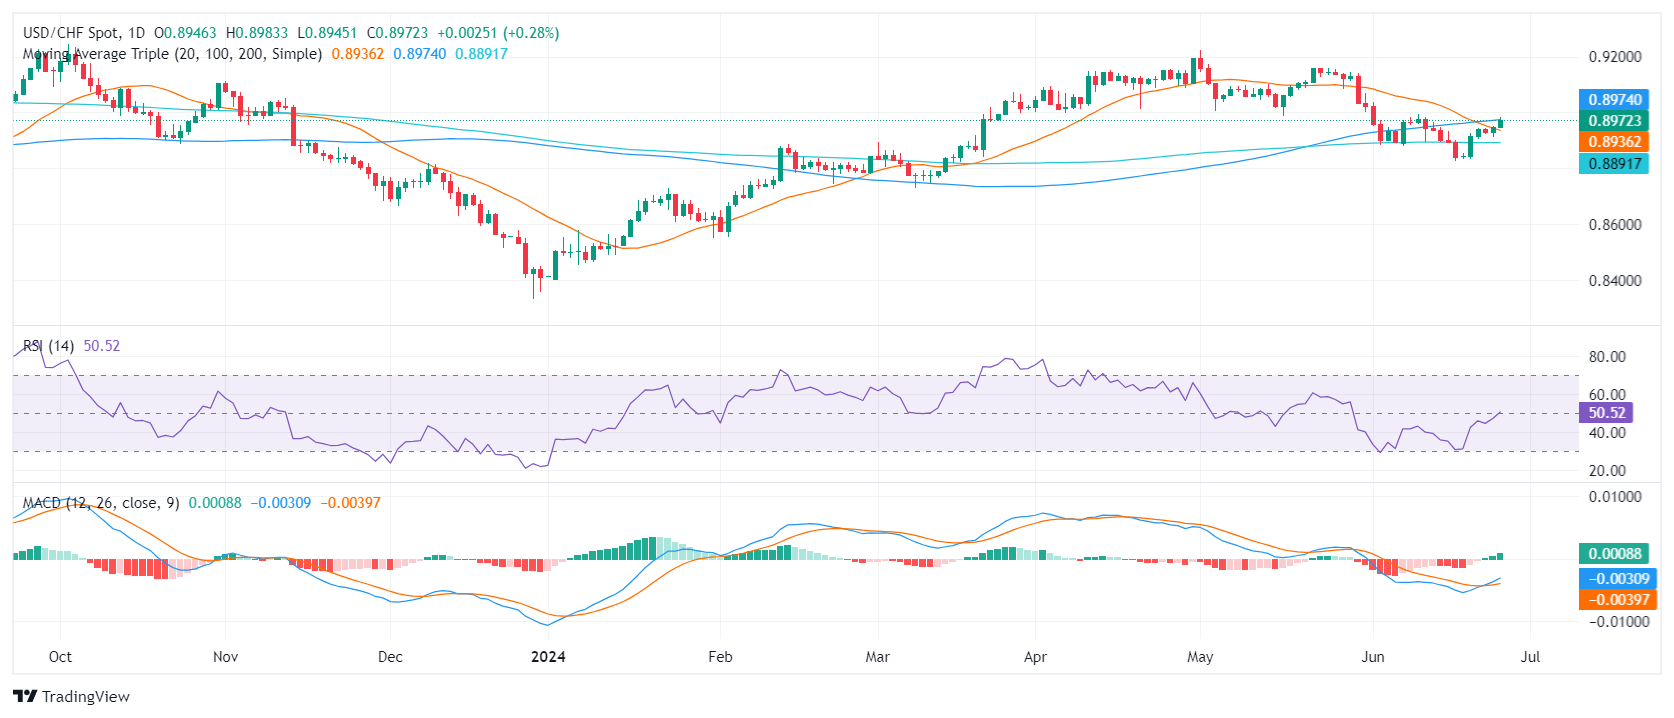
- USD/CHF surges, hitting highs not seen since mid-June and testing the crucial 100-day SMA at 0.8975.
- The strength of USD remained persistent, largely due to elevated Treasury yields.
- Market still bets on a 60% probability of a Fed rate cut in September.
The USD/CHF pair continued to benefit from rising US Treasury yields on Wednesday and shrugged off soft housing data. The Swiss economic calendar remained barren during the session, leaving the pair at the mercy of broader market trends and data from the US.
The latest New Home Sales figures for May took a hit, with the sales sinking to 619K units, causing an approximate 11.3% decrease from the former 698K, catching the market off-guard, as the expectation was set at a more favorable 640K units. Concurrently, the US 2-year, 5-year, and 10-year Treasury yields were reported at 4.74%, 4.33%, and 4.31% respectively, fostering USD attractiveness.
Even though the market suggests a 60% probability for a Fed rate cut of 25 basis points in September as gauged by the CME FedWatch Tool, the Federal Reserve's hinted at only one cut in 2024. Fed officials, including Governor Michelle Bowman, have asserted their hawkish stance, voicing opinions that a policy rate cut, at this juncture, may be premature. Moreover, significant economic events likely to affect the market expectations include the release of the revisions to the Gross Domestic Product (GDP) for Q1, expected to hold steady at 1.3% on Thursday, and the release of the May Personal Consumption Expenditures (PCE) report on Friday, the Fed’s preferred gauge of inflation.
USD/CHF technical analysis
From a technical analysis perspective, the pair's positioning indicates encouraging signs, having successfully established itself above the 20-day and 200-day SMA and vying to negotiate the 100-day average, which if accomplished might solidify its positive outlook. In addition, the Relative Strength Index (RSI) and Moving Average Convergence Divergence (MACD) rose to positive terrain, adding more arguments for the positive outlook.
USD/CHF daily chart
- WTI eased to $80.00 per barrel on Wednesday, continues to churn in a rough range.
- EIA Crude Oil counts reported another week-on-week buildup of US barrel supplies.
- Energy markets continue to hope for a demand upswell to materialize in summer.
West Texas Intermediate (WTI) US Crude Oil tumbled back to $80.00 per barrel on Wednesday after the Energy Information Administration (EIA) reported another unexpected increase in week-on-week US Crude Oil Stocks Change, kicking the legs out from beneath barrel traders that were hoping for a net decrease in US Crude Oil supplies.
According to the EIA, US Crude Oil Stocks Change piled on an additional 3.591 million barrels of Crude Oil for the week ended June 21, well above the forecast -3 million barrel decline and flooding out the previous week’s -2.547 million barrel drawdown. US Crude Oil markets shuddered after another week-on-week buildup, sending WTI back to the $80.00 handle on reaction.
Energy markets are still holding onto hopes of a summertime uptick in fossil fuel demand on the back of increased cooling costs, as well as the summer driving season. This follows a flubbed uptick in Chinese Crude Oil demand that failed to materialize, as well as the US Memorial Day holiday driving season that also failed to make a meaningful dent in US Crude Oil supplies.
WTI technical outlook
WTI continues to trade in a rough range priced in between $80.00 and $81.50, with a hefty supply zone keeping upside momentum hobbled beyond $81.50. Intraday price action is clattering against the 200-hour Exponential Moving Average (EMA) rising through the $80.00 handle.
Daily candlesticks continue to middle around the $81.00 handle, and continued consolidation opens the way up for a bearish turnaround towards the low side of the 200-day EMA at $78.91. A downside push will leave WTI bids exposed to a further decline to early June’s swing low below $73.00 per barrel.
WTI hourly chart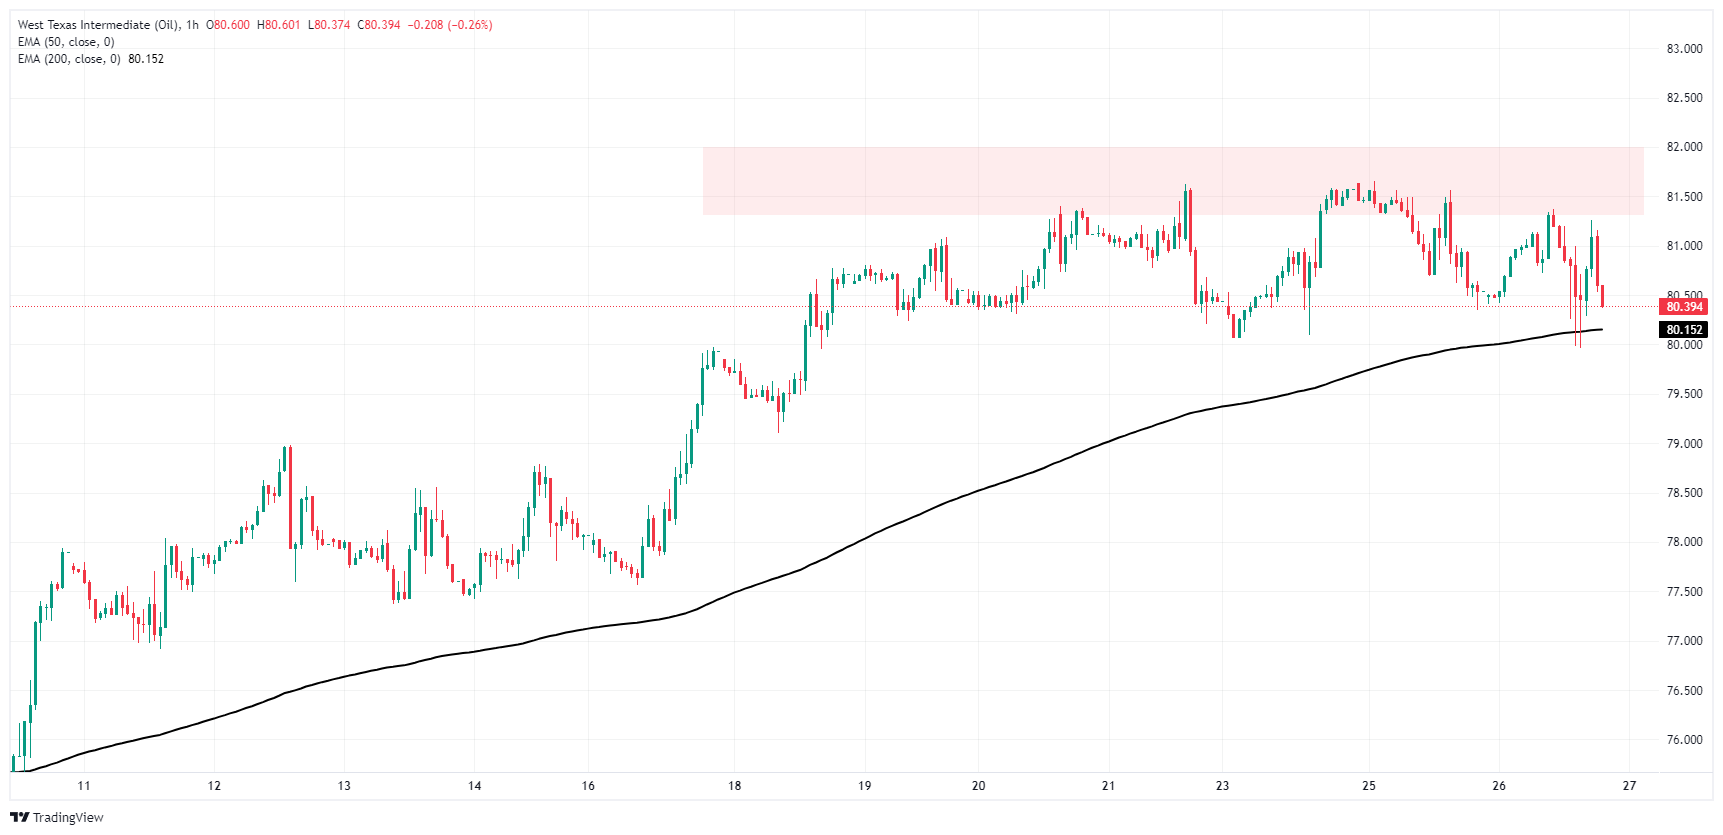
WTI daily chart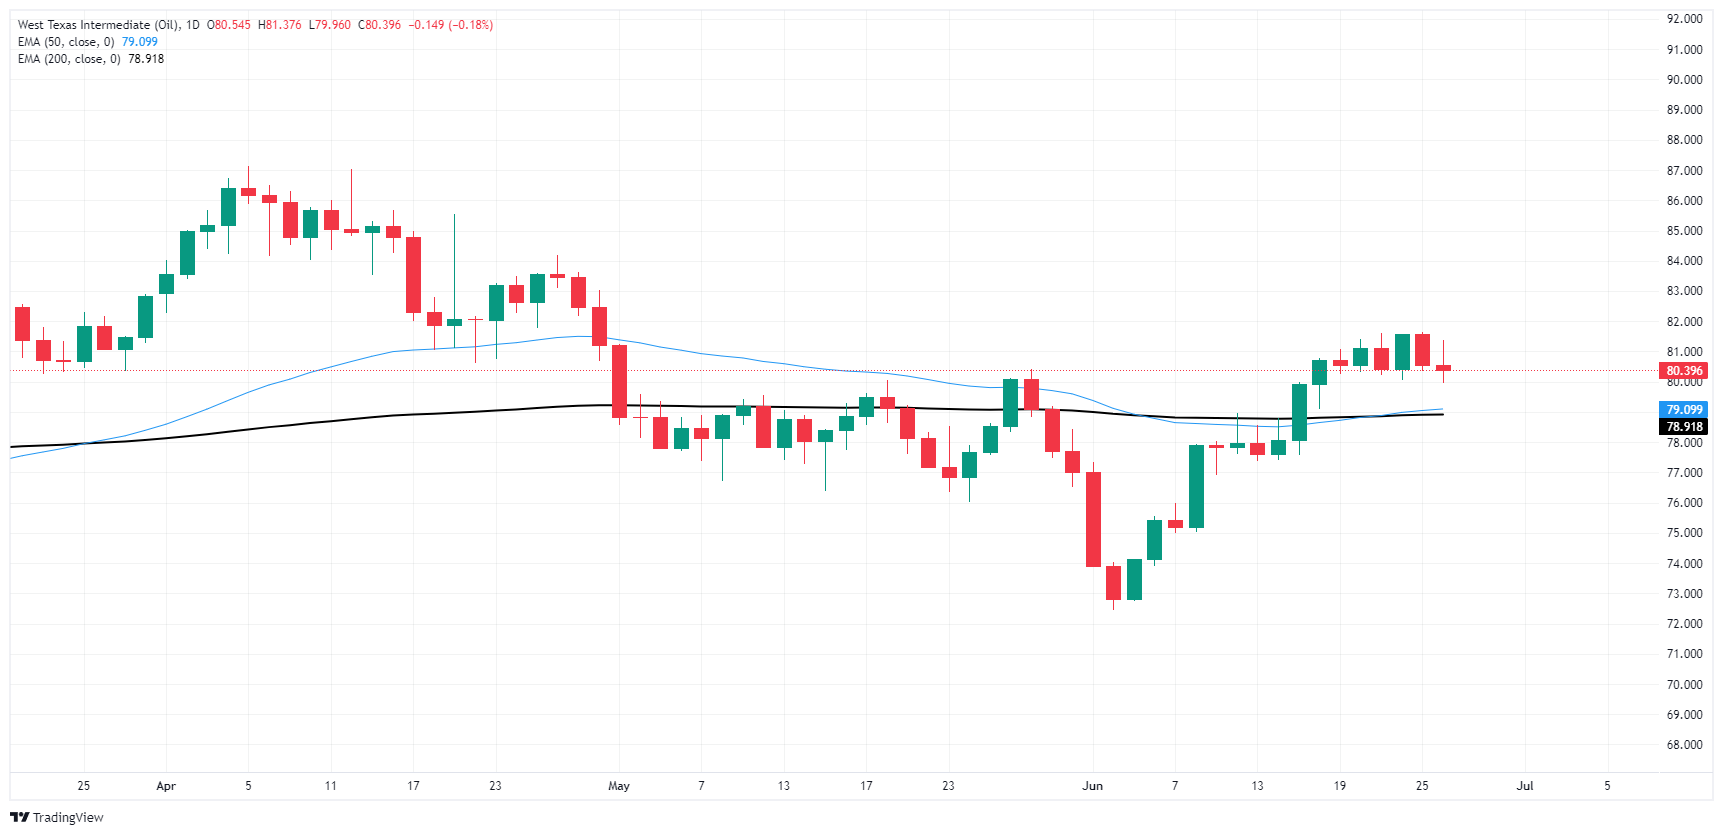
WTI Oil FAQs
WTI Oil is a type of Crude Oil sold on international markets. The WTI stands for West Texas Intermediate, one of three major types including Brent and Dubai Crude. WTI is also referred to as “light” and “sweet” because of its relatively low gravity and sulfur content respectively. It is considered a high quality Oil that is easily refined. It is sourced in the United States and distributed via the Cushing hub, which is considered “The Pipeline Crossroads of the World”. It is a benchmark for the Oil market and WTI price is frequently quoted in the media.
Like all assets, supply and demand are the key drivers of WTI Oil price. As such, global growth can be a driver of increased demand and vice versa for weak global growth. Political instability, wars, and sanctions can disrupt supply and impact prices. The decisions of OPEC, a group of major Oil-producing countries, is another key driver of price. The value of the US Dollar influences the price of WTI Crude Oil, since Oil is predominantly traded in US Dollars, thus a weaker US Dollar can make Oil more affordable and vice versa.
The weekly Oil inventory reports published by the American Petroleum Institute (API) and the Energy Information Agency (EIA) impact the price of WTI Oil. Changes in inventories reflect fluctuating supply and demand. If the data shows a drop in inventories it can indicate increased demand, pushing up Oil price. Higher inventories can reflect increased supply, pushing down prices. API’s report is published every Tuesday and EIA’s the day after. Their results are usually similar, falling within 1% of each other 75% of the time. The EIA data is considered more reliable, since it is a government agency.
OPEC (Organization of the Petroleum Exporting Countries) is a group of 13 Oil-producing nations who collectively decide production quotas for member countries at twice-yearly meetings. Their decisions often impact WTI Oil prices. When OPEC decides to lower quotas, it can tighten supply, pushing up Oil prices. When OPEC increases production, it has the opposite effect. OPEC+ refers to an expanded group that includes ten extra non-OPEC members, the most notable of which is Russia.
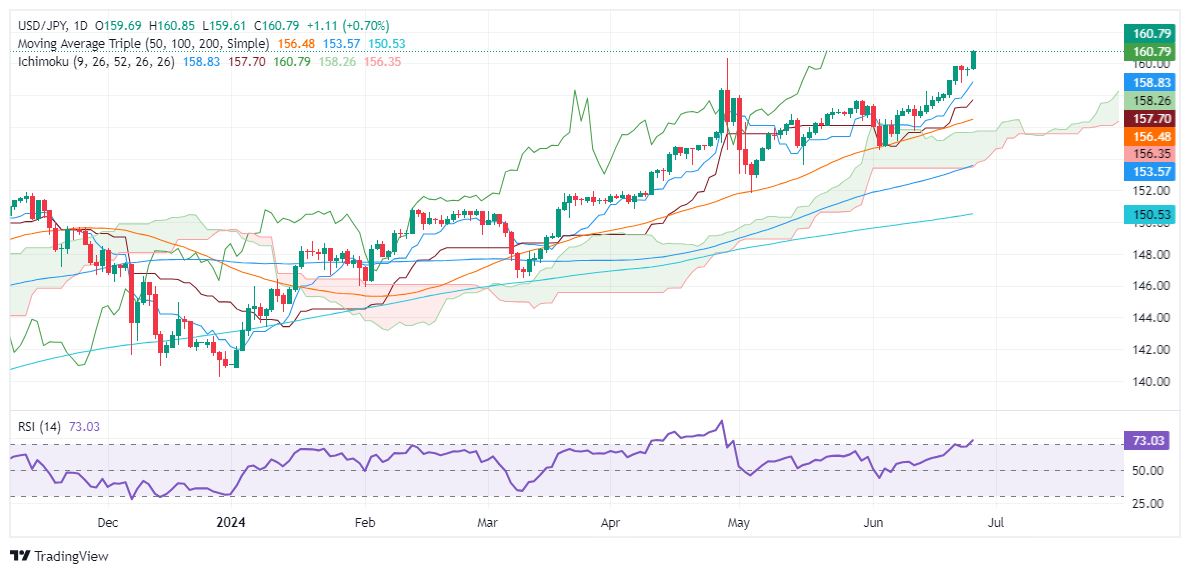
- USD/JPY reaches multi-year peak at 160.83, surpassing key 160.00 level amid USD strength.
- Technicals show strong uptrend with overbought RSI, buying momentum strong.
- Resistance levels: 161.00, 162.00, 164.87 (Nov 1986 high), 178 (Apr 1986 high).
- Support found at 158.75 (June 24 low), Tenkan-Sen at 157.82, Senkou Span A at 157.53, Kijun-Sen at 157.24.
The USD/JPY rallied sharply during Wednesday’s session after the pair hit a 38-year high past the 160.00 psychological figure, seen as the line of the sand for Japanese authorities and the Japanese Yen to intervene in the FX space. Nevertheless, failure to do it prompted US dollar bulls to push the exchange rate higher, and at the time of writing, the pair traded at 160.83, which was up 0.73%.
USD/JPY Price Analysis: Technical outlook
The USD/JPY is upward biased and extended its gains past the psychological 160.00 barrier for the second time since April 29, when the pair printed a year-to-date (YTD) high of 160.32. This has reignited fears that Japanese authorities or the Bank of Japan (BoJ) could step into the plate to halt Yen’s depreciation.
Momentum favors buyers, with the Relative Strength Index (RSI) at overbought conditions. However, due to the strength of the uptrend, most technicians use 80 as “extreme” overextended conditions.
The next resistance would be the psychological levels of 161.00, 162.00, and so forth, ahead of testing November’s 1986 high of 164.87, followed by April's 1986 high of 178.
Conversely, if USD/JPY drops below 160.00, the first support would be June’s 24 low of 158.75, followed by the Tenkan-Sen at 157.82. Once those levels are cleared, the next stop would be the Senkou Span A at 157.53, and then the Kijun-Sen at 157.24.
USD/JPY Price Action – Daily Chart
- US Treasury yields climb as global inflation data sparks fears; 10-year bond yield rises to 4.320%.
- Canadian and Australian inflation data higher than expected, contributing to global yield increases.
- Focus shifts to US May PCE report, with expectations of a slight decrease in both headline and core inflation.
US Treasury yields climbed on Wednesday after some countries revealed inflation data, which was higher than expected and increased fears that the upcoming May’s Personal Consumption Expenditure (PCE) Price Index report in the United States could come hot.
Elevated US yields weighed on Gold, pushing prices to a two-week low
On Tuesday, data from Canada showed that inflation came hotter than expected, spurring a jump in global bond yields. On Wednesday, Australia’s Consumer Price Index (CPI) rose to its highest level in six months, peaking at 4%, well above the Reserve Bank of Australia (RBA) inflation goal.
Focus this week will be on the Fed’s preferred gauge for inflation, the May PCE, which is expected to decrease from 2.7% to 2.6 YoY, while core PCE is anticipated to be 2.6% in the twelve months to May, down from 2.8%.
Other significant data releases include the final reading of Q1 2024 Gross Domestic Product (GDP), Durable Goods Orders, and Initial Jobless Claims.
The US 10-year Treasury bond yield has risen seven basis points to 4.320%, its highest level since mid-June. This pushed Gold prices toward a two-week low of $2,293 before stabilizing at around $2,297.
Data from the Chicago Board of Trade (CBOT) shows that traders expect 36 basis points (bps) of easing, according to December’s 2024 fed funds rate futures contract. In the meantime, the CME FedWatch Tool shows odds for a 25-basis-point Fed rate cut in September at 56.3%, lower than Tuesday’s 59.5%.
Interest rates FAQs
Interest rates are charged by financial institutions on loans to borrowers and are paid as interest to savers and depositors. They are influenced by base lending rates, which are set by central banks in response to changes in the economy. Central banks normally have a mandate to ensure price stability, which in most cases means targeting a core inflation rate of around 2%. If inflation falls below target the central bank may cut base lending rates, with a view to stimulating lending and boosting the economy. If inflation rises substantially above 2% it normally results in the central bank raising base lending rates in an attempt to lower inflation.
Higher interest rates generally help strengthen a country’s currency as they make it a more attractive place for global investors to park their money.
Higher interest rates overall weigh on the price of Gold because they increase the opportunity cost of holding Gold instead of investing in an interest-bearing asset or placing cash in the bank. If interest rates are high that usually pushes up the price of the US Dollar (USD), and since Gold is priced in Dollars, this has the effect of lowering the price of Gold.
The Fed funds rate is the overnight rate at which US banks lend to each other. It is the oft-quoted headline rate set by the Federal Reserve at its FOMC meetings. It is set as a range, for example 4.75%-5.00%, though the upper limit (in that case 5.00%) is the quoted figure. Market expectations for future Fed funds rate are tracked by the CME FedWatch tool, which shapes how many financial markets behave in anticipation of future Federal Reserve monetary policy decisions.
- Australian Dollar is a top performer from the session, favored by hot CPI figures from May.
- Following May's hot CPI figures, the market closely watches further inflation indications for potential RBA action.
- If the RBA holds hawkish, the downside for the Aussie is limited.
Wednesday's session observed an incline in the Australian Dollar (AUD), as it rose to the mark of 0.6690 against the US Dollar, before retracing back to the 0.6650 mark. The recently released Australian inflation data, which came in higher than expected, benefited the Aussie against its peers, but the Greenback itself is also trading with vigor.
In Australia, despite signs of a weaker economy, the stubbornly high inflation acts as a hindrance to the Reserve Bank of Australia's (RBA) potential rate cuts, potentially limiting downside pressure on the Aussie.
Daily Digest Market Movers: Aussie shows resilience amid hot CPI figures
- On the data front, Australia's May Consumer Price Index CPI ran hot. The headline came in at 4.0% YoY vs. 3.8% expected and 3.6% in the previous month.
- This marked the third consecutive month of acceleration to the highest since November, moving further above the 2-3% target range
- As a result of these developments, the swaps market is now pricing in nearly 40% odds of a 25 bps rate hike on September 24, extending to nearly 50% for November 5.
- In the last meeting, Governor Bullock affirmed the RBA "will do what is necessary" to bring inflation back to target and foresees a longer period before inflation gets sustainably back in the target range.
- Accordingly, with the RBA ruling out rate cuts and with markets potentially considering rate hikes, the downside on the Aussie is set to remain constrained.
Technical analysis: AUD/USD looks to retain buyer interest at 20-day average
From a technical standpoint, the outlook remains fairly neutral with no clear directions. The Relative Strength Index (RSI) continues to stay above 50 but remains flat. The Moving Average Convergence Divergence (MACD) continues in the negative sphere with a series of red bars. Anticipation builds around buyers retaining the AUD/USD above the 20-day Simple Moving Average (SMA), a key defensive line that could dictate the future momentum of the pair.
Australian Dollar FAQs
One of the most significant factors for the Australian Dollar (AUD) is the level of interest rates set by the Reserve Bank of Australia (RBA). Because Australia is a resource-rich country another key driver is the price of its biggest export, Iron Ore. The health of the Chinese economy, its largest trading partner, is a factor, as well as inflation in Australia, its growth rate and Trade Balance. Market sentiment – whether investors are taking on more risky assets (risk-on) or seeking safe-havens (risk-off) – is also a factor, with risk-on positive for AUD.
The Reserve Bank of Australia (RBA) influences the Australian Dollar (AUD) by setting the level of interest rates that Australian banks can lend to each other. This influences the level of interest rates in the economy as a whole. The main goal of the RBA is to maintain a stable inflation rate of 2-3% by adjusting interest rates up or down. Relatively high interest rates compared to other major central banks support the AUD, and the opposite for relatively low. The RBA can also use quantitative easing and tightening to influence credit conditions, with the former AUD-negative and the latter AUD-positive.
China is Australia’s largest trading partner so the health of the Chinese economy is a major influence on the value of the Australian Dollar (AUD). When the Chinese economy is doing well it purchases more raw materials, goods and services from Australia, lifting demand for the AUD, and pushing up its value. The opposite is the case when the Chinese economy is not growing as fast as expected. Positive or negative surprises in Chinese growth data, therefore, often have a direct impact on the Australian Dollar and its pairs.
Iron Ore is Australia’s largest export, accounting for $118 billion a year according to data from 2021, with China as its primary destination. The price of Iron Ore, therefore, can be a driver of the Australian Dollar. Generally, if the price of Iron Ore rises, AUD also goes up, as aggregate demand for the currency increases. The opposite is the case if the price of Iron Ore falls. Higher Iron Ore prices also tend to result in a greater likelihood of a positive Trade Balance for Australia, which is also positive of the AUD.
The Trade Balance, which is the difference between what a country earns from its exports versus what it pays for its imports, is another factor that can influence the value of the Australian Dollar. If Australia produces highly sought after exports, then its currency will gain in value purely from the surplus demand created from foreign buyers seeking to purchase its exports versus what it spends to purchase imports. Therefore, a positive net Trade Balance strengthens the AUD, with the opposite effect if the Trade Balance is negative.
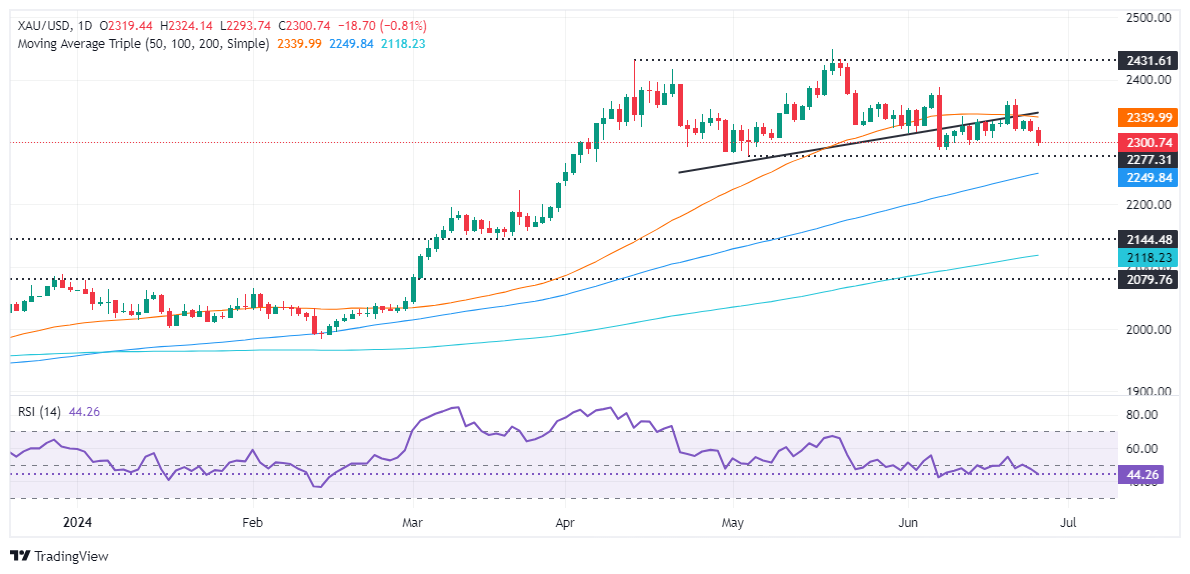
- Gold drops pressured by strong USD and rising Treasury yields.
- DXY hits new monthly peak at 106.13, 10-year yield is up 5.5 bps.
- Fed’s Bowman hints at steady policy and possible hikes if inflation falters.
- Upcoming PCE report expected to show mild inflation decline.
Gold price slumped more than 0.70% on Wednesday as the Greenback soars, underpinned by high US Treasury yields, ahead of the release of the Personal Consumption Expenditures (PCE) Price Index report on Friday. Investors are beginning to price out less easing by the Federal Reserve (Fed), sponsoring the buck’s last leg up. The XAU/USD trades at $2,301 after hitting a daily high of $2,323.
The US Dollar Index (DXY) hit a new monthly high of 106.13 due to the jump in US yields. The 10-year Treasury note yield gains five and a half basis points (bps) at 4.304%.
Fed Governor Michele Bowmanstated on Tuesday that monetary policy will remain steady for “some time” and added that a rate hike would be needed “should progress on inflation stall or even reverse.”
Focus this week will be on the Fed’s preferred gauge for inflation, the May PCE, which is expected to drop from 2.7% to 2.6% YoY, while core PCE is foreseen at 2.6% YoY, down from 2.8%.
Other data will be released, such as the Gross Domestic Product (GDP) Q1 2024 final reading, Durable Goods Orders and Initial Jobless Claims.
Daily digest market movers: Gold price extends its losses on strong US Dollar
- On Monday, San Francisco Fed President Mary Daly leaned dovish as she said, “At this point, inflation is not the only risk we face,” expressing worries about the labor market.
- Fed Governor Lisa Cook was neutral on Tuesday, saying that inflation was most likely to fall “sharply” next year, adding that it would be necessary to ease policy to keep the Fed’s dual mandate more balanced.
- On Thursday, the US economic docket will feature the release of Q1 GDP, expected to end at 1.4% QoQ, down from last year’s Q4 3.4%.
- Durable Goods Orders for May are expected to contract from 0.7% to -0.1%.
- According to CME FedWatch Tool, odds for a 25-basis-point Fed rate cut in September are at 56.3%, down from 59.5% last Tuesday.
- The December 2024 fed funds rate futures contract implies the Fed will ease policy by just 35 basis points (bps) toward the end of the year.
Technical analysis: Gold price respects Head-and-Shoulders neckline, prints new low below $2,300
Gold price remains bearishly biased as the Head-and-Shoulders chart pattern remains in play. The XAU/USD spot price has been unable to crack the neckline, validating the chart pattern, which hints that further downside is expected.
Therefore, the XAU/USD next support would be $2,300. Once cleared, the non-yielding metal would fall to $2,277, the May 3 low, followed by the March 21 high of $2,222. Further losses lie underneath, with sellers eyeing the Head-and-Shoulders chart pattern objective from $2,170 to $2,160.
Conversely, if Gold reclaims $2,350, that will expose additional key resistance levels like the June 7 cycle high of $2,387, ahead of challenging the $2,400 figure.
Gold FAQs
Gold has played a key role in human’s history as it has been widely used as a store of value and medium of exchange. Currently, apart from its shine and usage for jewelry, the precious metal is widely seen as a safe-haven asset, meaning that it is considered a good investment during turbulent times. Gold is also widely seen as a hedge against inflation and against depreciating currencies as it doesn’t rely on any specific issuer or government.
Central banks are the biggest Gold holders. In their aim to support their currencies in turbulent times, central banks tend to diversify their reserves and buy Gold to improve the perceived strength of the economy and the currency. High Gold reserves can be a source of trust for a country’s solvency. Central banks added 1,136 tonnes of Gold worth around $70 billion to their reserves in 2022, according to data from the World Gold Council. This is the highest yearly purchase since records began. Central banks from emerging economies such as China, India and Turkey are quickly increasing their Gold reserves.
Gold has an inverse correlation with the US Dollar and US Treasuries, which are both major reserve and safe-haven assets. When the Dollar depreciates, Gold tends to rise, enabling investors and central banks to diversify their assets in turbulent times. Gold is also inversely correlated with risk assets. A rally in the stock market tends to weaken Gold price, while sell-offs in riskier markets tend to favor the precious metal.
The price can move due to a wide range of factors. Geopolitical instability or fears of a deep recession can quickly make Gold price escalate due to its safe-haven status. As a yield-less asset, Gold tends to rise with lower interest rates, while higher cost of money usually weighs down on the yellow metal. Still, most moves depend on how the US Dollar (USD) behaves as the asset is priced in dollars (XAU/USD). A strong Dollar tends to keep the price of Gold controlled, whereas a weaker Dollar is likely to push Gold prices up.
The Greenback regained further traction and climbed to multi-week highs on the back of the Fed’s policy divergence vs. some of its G10 peers and hawkish Fedspeak, while multi-decade lows in the Japanese yen also added to the Dollar’s gains.
Here is what you need to know on Thursday, June 27:
The USD Index (DXY) added to Tuesday’s advance and managed to reclaim the area beyond the 106.00 barrier along with further upside in US yields. On June 27, the final Q1 GDP Growth Rate will be at the centre of the debate, seconded by Durable Goods Orders, advanced Goods Trade Balance, pending Home Sales and weekly Initial Jobless Claims.
EUR/USD remained well on the defensive and dropped to new monthly lows near 1.0660 on the back of the Dollar’s march north. The EMU’s final Consumer Confidence gauge, Economic Sentiment and Industrial Sentiment are due on June 27.
GBP/USD flirted with its monthly lows near 1.2620 against the backdrop of further improvement in the Greenback and the broad-based offered stance in the risk-linked galaxy. The BoE’s Financial Stability Report (FSR) is due on June 27.
USD/JPY advanced to multi-decade peaks well north of the 160.00 hurdle amidst rising prudence on potential FX intervention by the BoJ. Retail Sales and weekly Foreign Bond Investment figures are expected on June 27.
AUD/USD printed humble gains on expectations that the RBA might keep its restrictive stance for longer, all in response to higher-than-expected inflation figures in Australia. Consumer Inflation Expectations are due on June 27 along with the speech by RBA’s Hauser.
Prices of the WTI remained stuck within their range near $81.00 following another unexpected build in US crude oil supplies and persistent demand concerns.
Gold prices revisited the area below the $2,300 mark per ounce troy, down for the second consecutive session on the back of the stronger Dollar and higher yields. Silver extended its bearish trend and clinched new six-week lows near $28.60.
- Dow Jones hung up on the 39,000.00 handle amid quiet midweek markets.
- Fedspeak continues to press down on rate cut hopes.
- Investors buckle down for the wait to key data on Thursday and Friday.
The Dow Jones Industrial Average (DJIA) is churning just above 39,000.00 in tepid Wednesday trading as markets hunker down for the wait to key data in the back half of the trading week. Federal Reserve (Fed) officials have repeatedly noted the need for patience on policy rates. The US central bank continues to look for firmer signs that inflation will continue easing to the Fed’s 2% annual target. A notable lack of economic slowdown and a still-tight labor market leaves the Fed with little need to rush into rate cuts. Several Fed officials have cautioned that there might be no rate cuts in 2024, while the Fed’s median dot plot of rate expectations suggests only a single quarter-point cut for the year.
A notable lack of data on Wednesday leaves investors to fidget in place and wait for a raft of key US datapoints slated for release on Thursday and Friday. US Durable Goods Orders, a revision to first-quarter US Gross Domestic Product (GDP), and Initial Jobless Claims are all due Thursday. Friday will round out the trading week with a fresh print of US Personal Consumption Expenditure Price Index (PCE) inflation figures for May.
Investors with hopes pinned on at least a quarter-point rate cut from the Fed in September will look for soft-but-not-too-soft US economic figures. Too good a print means the Fed will be even less likely to deliver an early rate trim, while too bad of a data calendar will mean the US is headed for a recession, leaving rate-cut-hungry markets to dream of a happy middle ground.
Dow Jones news
The Dow Jones is up a scant 30 points rounding the corner into the final stretch of Wednesday’s US market session. The major equity index is getting propped up by firm gains in market favorites, but most of the Dow Jones’ constituent securities are in the red on Wednesday, with two-thirds of the listed stocks softly in the red.
Amazon.com Inc. (AMZN) surged nearly 4.5% on Wednesday, approaching $195.00 per share, with Apple Inc. (AAPL) struggling to keep pace, rising 2.3% to $214.00 per share. On the downside, Amgen Inc. (AMGN) and Travelers Companies Inc. (TRV) are each down around 1.7% apiece, with Amgen falling below $315.00 per share and Travelers Companies falling to $205.00 per share.
Dow Jones technical outlook
Dow Jones remains within touch range of the previous day’s closing bids near 39,100.00 on Wednesday. The DJIA remains down from last week’s peak near 39,600.00, but a near-term floor is priced in at Wednesday’s early lows just above 38,900.00.
Daily candlesticks continue to hold just above the 50-day Exponential Moving Average (EMA) at 38,878.00 as bidders try to drag the large-cap index back towards all-time highs set in May just north of the 40,000.00 major handle.
Dow Jones five minute chart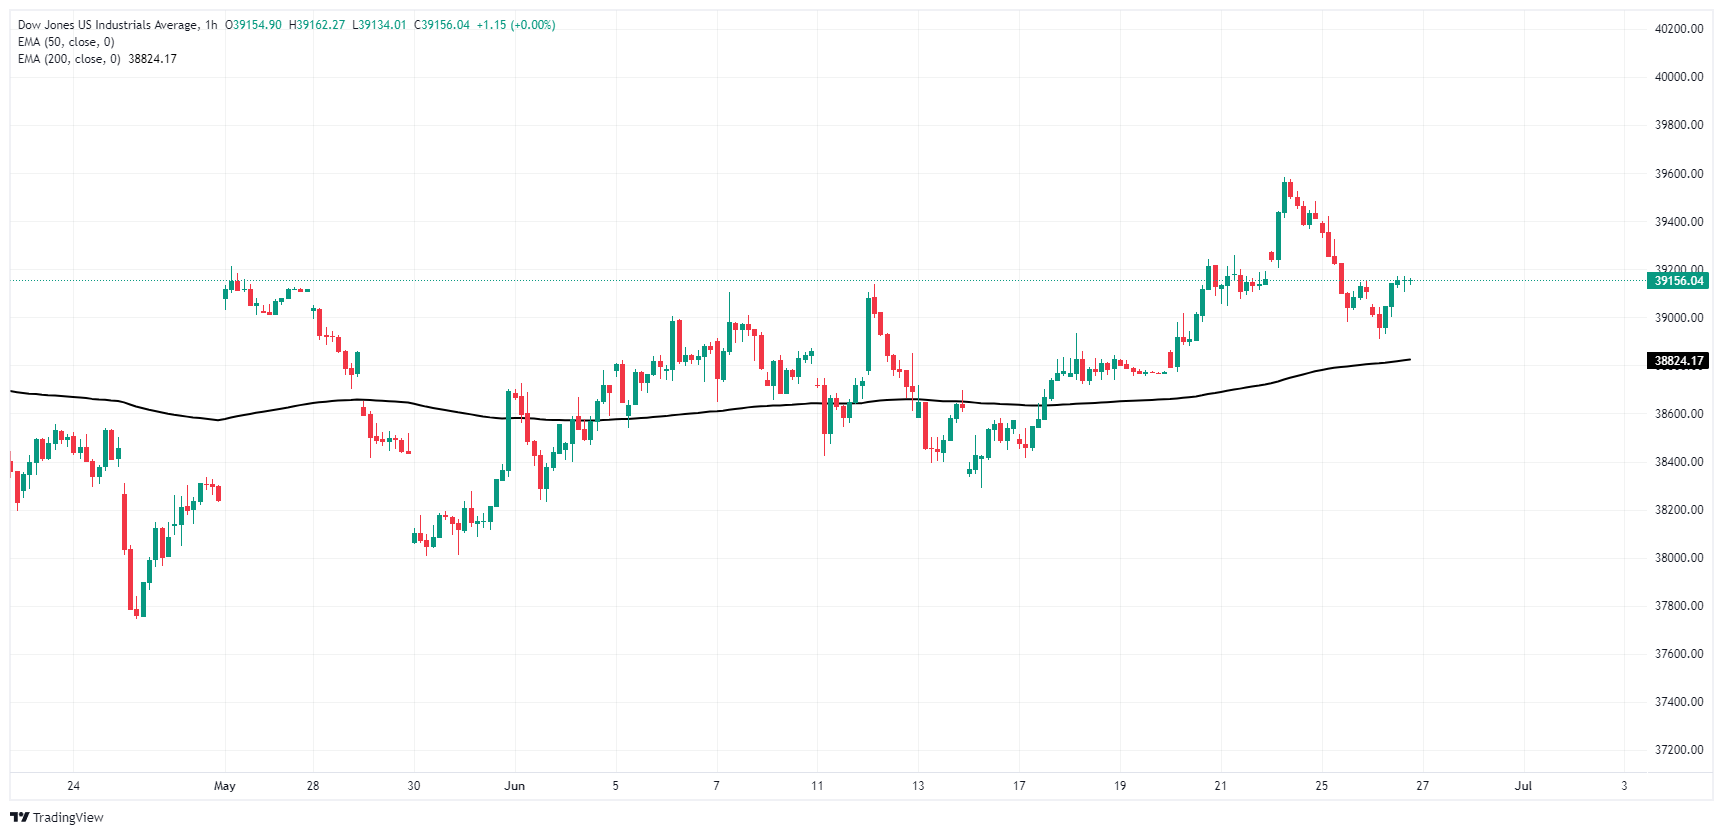
Dow Jones daily chart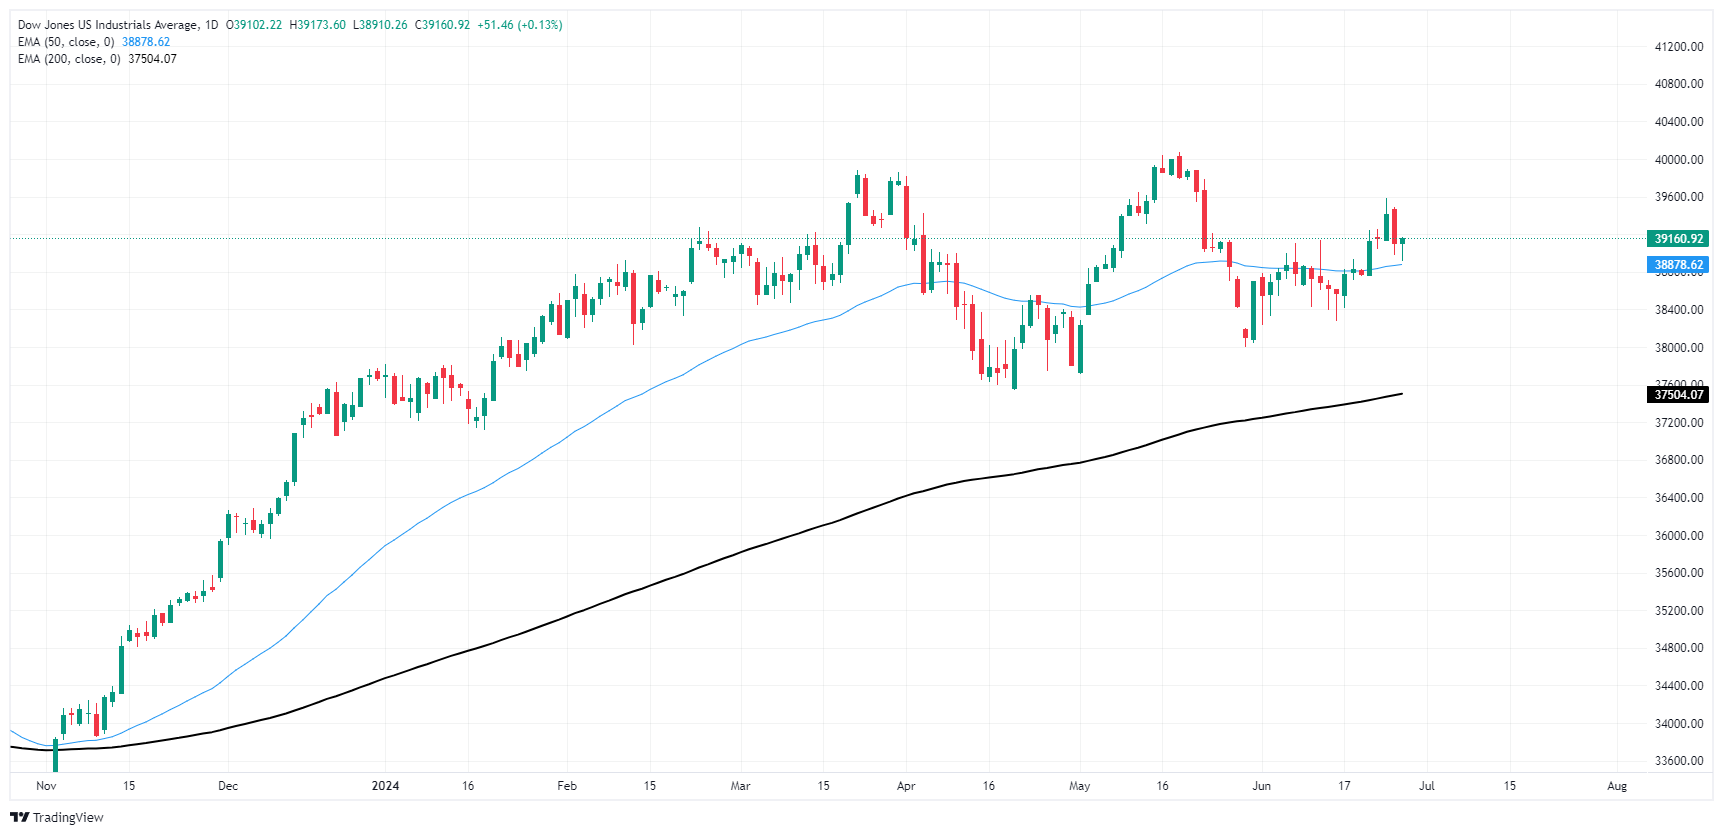
Dow Jones FAQs
The Dow Jones Industrial Average, one of the oldest stock market indices in the world, is compiled of the 30 most traded stocks in the US. The index is price-weighted rather than weighted by capitalization. It is calculated by summing the prices of the constituent stocks and dividing them by a factor, currently 0.152. The index was founded by Charles Dow, who also founded the Wall Street Journal. In later years it has been criticized for not being broadly representative enough because it only tracks 30 conglomerates, unlike broader indices such as the S&P 500.
Many different factors drive the Dow Jones Industrial Average (DJIA). The aggregate performance of the component companies revealed in quarterly company earnings reports is the main one. US and global macroeconomic data also contributes as it impacts on investor sentiment. The level of interest rates, set by the Federal Reserve (Fed), also influences the DJIA as it affects the cost of credit, on which many corporations are heavily reliant. Therefore, inflation can be a major driver as well as other metrics which impact the Fed decisions.
Dow Theory is a method for identifying the primary trend of the stock market developed by Charles Dow. A key step is to compare the direction of the Dow Jones Industrial Average (DJIA) and the Dow Jones Transportation Average (DJTA) and only follow trends where both are moving in the same direction. Volume is a confirmatory criteria. The theory uses elements of peak and trough analysis. Dow’s theory posits three trend phases: accumulation, when smart money starts buying or selling; public participation, when the wider public joins in; and distribution, when the smart money exits.
There are a number of ways to trade the DJIA. One is to use ETFs which allow investors to trade the DJIA as a single security, rather than having to buy shares in all 30 constituent companies. A leading example is the SPDR Dow Jones Industrial Average ETF (DIA). DJIA futures contracts enable traders to speculate on the future value of the index and Options provide the right, but not the obligation, to buy or sell the index at a predetermined price in the future. Mutual funds enable investors to buy a share of a diversified portfolio of DJIA stocks thus providing exposure to the overall index.
- Mexican Peso falls for second consecutive day against US Dollar.
- USD/MXN hits a daily high of 18.33 before trimming gains as Wall Street turns green.
- Banxico expected to keep interest rates unchanged at 11.00% amid sharp Peso depreciation and recent inflation spike.
- Fed Governor Michelle Bowman's hawkish comments support USD.
The Mexican Peso extended its losses for the second consecutive day against the Greenback after the latter rose sharply. This was boosted by the jump in the USD/JPY pair, which exchanges hands at 38-year high as US Treasury bond yields advance as traders brace for the release of crucial inflation data in the United States (US). The USD/MXN trades at 18.23, up 0.73%.
Sentiment shifted positively as Wall Street turned green during the last hour, trimming the USD/MXM pair gains after hitting a daily high of 18.33. Mexico’s economic docket remains scarce as investors brace for Thursday's Bank of Mexico (Banxico) monetary policy.
Banxico is expected to keep interest rates unchanged at 11.00% after the Mexican currency experienced a sharp depreciation following the June 2 election, alongside the sudden jump in June’s mid-month inflation.
The Citibanamex survey showed that most economists expect rates to be unchanged at 11.00%, yet they expect the central bank to cut rates until August.
Besides that, investors are eyeing President-elect Claudia Sheinbaum’s cabinet members on Thursday.
Meanwhile, the USD/MXN experienced back-to-back positive gains sponsored by Federal Reserve (Fed) officials' hawkish comments, particularly Governor Michelle Bowman. She said that rates will remain steady for “some time” and that if the disinflation process stalls, she’s open to another interest rate hike.
Daily digest market movers: Mexican Peso falls as traders await Banxico decision
- Mexico’s economic docket will feature the Balance of Trade for May on Thursday, alongside the Unemployment Rate.
- Citibanamex survey showed economists priced out fewer rate cuts by the central bank, estimating rates will be lowered to 10.25% in 2024, up from 10.00%. Regarding the USD/MXN, the consensus estimates the exchange rate will end the year at 18.70, up from 18.00 in the previous report.
- Regarding economic growth, the consensus revised the Gross Domestic Product (GDP) for 2024 downward from 2.2% to 2.1% YoY.
- CME FedWatch Tool shows odds for a 25-basis-point Fed rate cut at 56.3%, lower than Tuesday’s 59.5%.
Technical analysis: Mexican Peso falls as USD/MXN rallies back above 18.20
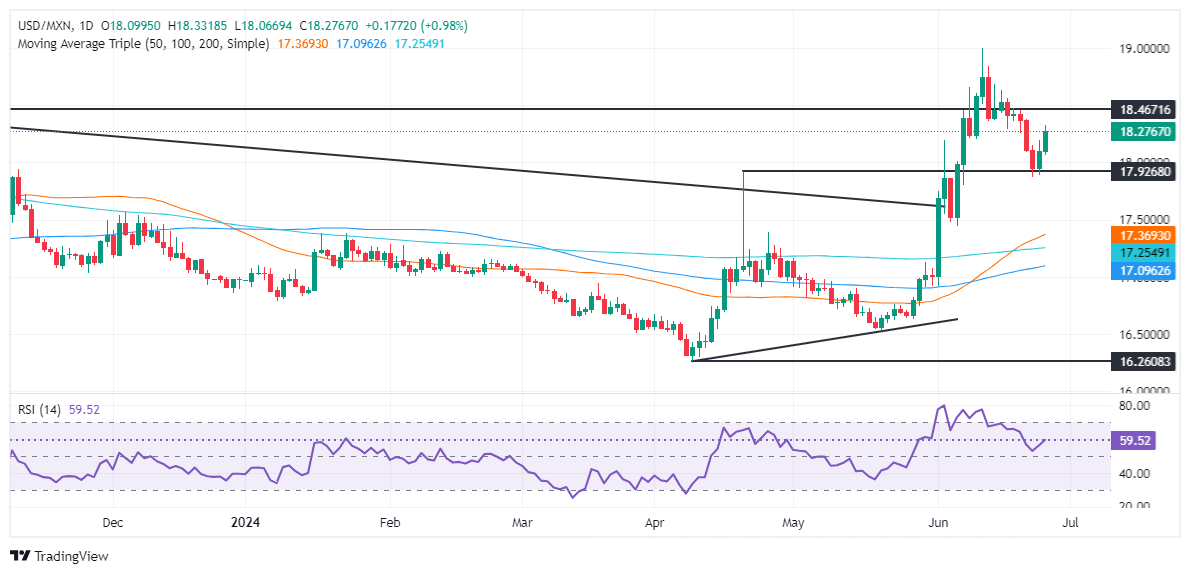
The USD/MXN uptrend remains in play, but the exotic pair will remain volatile during the rest of the session and Thursday as traders await Banxico’s decision. Momentum favors buyers, according to the Relative Strength Index (RSI), is bullish.
For a bullish continuation, buyers need to push the USD/MXN exchange rate past the psychological 18.50 level. Once cleared, the next stop would be the year-to-date (YTD) high of 18.99, followed by the March 20, 2023, high of 19.23, followed by an uptick to 19.50.
On the flip side, if USD/MXN tumbles below 18.00, the next key support level would be the 50-day Simple Moving Average (SMA) at 17.37 before testing the 200-day SMA at 17.23. Once those two levels are cleared, the next stop would be the 100-day SMA at 17.06.
Mexican Peso FAQs
The Mexican Peso (MXN) is the most traded currency among its Latin American peers. Its value is broadly determined by the performance of the Mexican economy, the country’s central bank’s policy, the amount of foreign investment in the country and even the levels of remittances sent by Mexicans who live abroad, particularly in the United States. Geopolitical trends can also move MXN: for example, the process of nearshoring – or the decision by some firms to relocate manufacturing capacity and supply chains closer to their home countries – is also seen as a catalyst for the Mexican currency as the country is considered a key manufacturing hub in the American continent. Another catalyst for MXN is Oil prices as Mexico is a key exporter of the commodity.
The main objective of Mexico’s central bank, also known as Banxico, is to maintain inflation at low and stable levels (at or close to its target of 3%, the midpoint in a tolerance band of between 2% and 4%). To this end, the bank sets an appropriate level of interest rates. When inflation is too high, Banxico will attempt to tame it by raising interest rates, making it more expensive for households and businesses to borrow money, thus cooling demand and the overall economy. Higher interest rates are generally positive for the Mexican Peso (MXN) as they lead to higher yields, making the country a more attractive place for investors. On the contrary, lower interest rates tend to weaken MXN.
Macroeconomic data releases are key to assess the state of the economy and can have an impact on the Mexican Peso (MXN) valuation. A strong Mexican economy, based on high economic growth, low unemployment and high confidence is good for MXN. Not only does it attract more foreign investment but it may encourage the Bank of Mexico (Banxico) to increase interest rates, particularly if this strength comes together with elevated inflation. However, if economic data is weak, MXN is likely to depreciate.
As an emerging-market currency, the Mexican Peso (MXN) tends to strive during risk-on periods, or when investors perceive that broader market risks are low and thus are eager to engage with investments that carry a higher risk. Conversely, MXN tends to weaken at times of market turbulence or economic uncertainty as investors tend to sell higher-risk assets and flee to the more-stable safe havens.
- Canadian Dollar gave a mixed performance, easing against the Greenback.
- Canada reported a potential contraction in wholesale trade in May.
- Fedspeak to continue dominating headlines until high impact data late in the week.
The Canadian Dollar (CAD) is mixed on Wednesday, giving a mediocre performance and settling lower against the US Dollar as Fedspeak continues to weigh on investor focus. Markets await a slew of key economic figures due in the back half of the trading week.
US Durable Goods Orders, Initial Jobless Claims, and US Gross Domestic Product (GDP) figures all slated for Thursday. Friday will follow up with Canadian MoM GDP and US Personal Consumption Expenditure Price Index (PCE) inflation for the month of May.
Statistics Canada (Statscan) warned of a contraction in wholesale trade activities in May, which follows a moderate increase in April’s figures. The Statscan flash estimate is a preview of the final figure that will be published on July 15.
Daily digest market movers: Canadian Dollar churns on Wednesday, eases against Greenback
- Canadian Wholesale Sales likely contracted by 0.9% in May, according to a Statscan flash estimate.
- A decline in upstream business activity will put renewed pressure on Friday’s upcoming Canadian GDP print, which is forecast to rise to 0.3% MoM in April after the previous 0.0%.
- US New Home Sales in May also declined on Wednesday, coming in at -11.3% MoM. This is the sharpest downside correction since July 2022 as housing activity remains subdued.
- US Bank Stress Test information is due later on Wednesday.
- Markets look ahead to Thursday’s US GDP revision for the first quarter, which is expected to hold steady at 1.3% QoQ.
Canadian Dollar price today
The table below shows the percentage change of Canadian Dollar (CAD) against listed major currencies today. Canadian Dollar was the strongest against the Japanese Yen.
| USD | EUR | GBP | CAD | AUD | JPY | NZD | CHF | |
| USD | 0.22% | 0.41% | 0.26% | -0.09% | 0.61% | 0.61% | 0.21% | |
| EUR | -0.22% | 0.19% | 0.04% | -0.31% | 0.41% | 0.40% | 0.00% | |
| GBP | -0.41% | -0.19% | -0.16% | -0.49% | 0.22% | 0.20% | -0.16% | |
| CAD | -0.26% | -0.04% | 0.15% | -0.34% | 0.37% | 0.36% | -0.02% | |
| AUD | 0.09% | 0.30% | 0.48% | 0.34% | 0.71% | 0.71% | 0.35% | |
| JPY | -0.62% | -0.41% | -0.22% | -0.38% | -0.71% | -0.01% | -0.41% | |
| NZD | -0.62% | -0.40% | -0.21% | -0.36% | -0.72% | 0.03% | -0.37% | |
| CHF | -0.24% | -0.02% | 0.17% | 0.02% | -0.32% | 0.39% | 0.39% |
The heat map shows percentage changes of major currencies against each other. The base currency is picked from the left column, while the quote currency is picked from the top row. For example, if you pick the Euro from the left column and move along the horizontal line to the Japanese Yen, the percentage change displayed in the box will represent EUR (base)/JPY (quote).
Technical analysis: Canadian Dollar slumps back to 1.3700 against Greenback
The Canadian Dollar (CAD) was mixed on Wednesday. It rose around four-tenths of one percent against the Japanese Yen and the New Zealand Dollar. However, it shed a third of a percent against the Australian Dollar and backslid a quarter of a percent against the US Dollar.
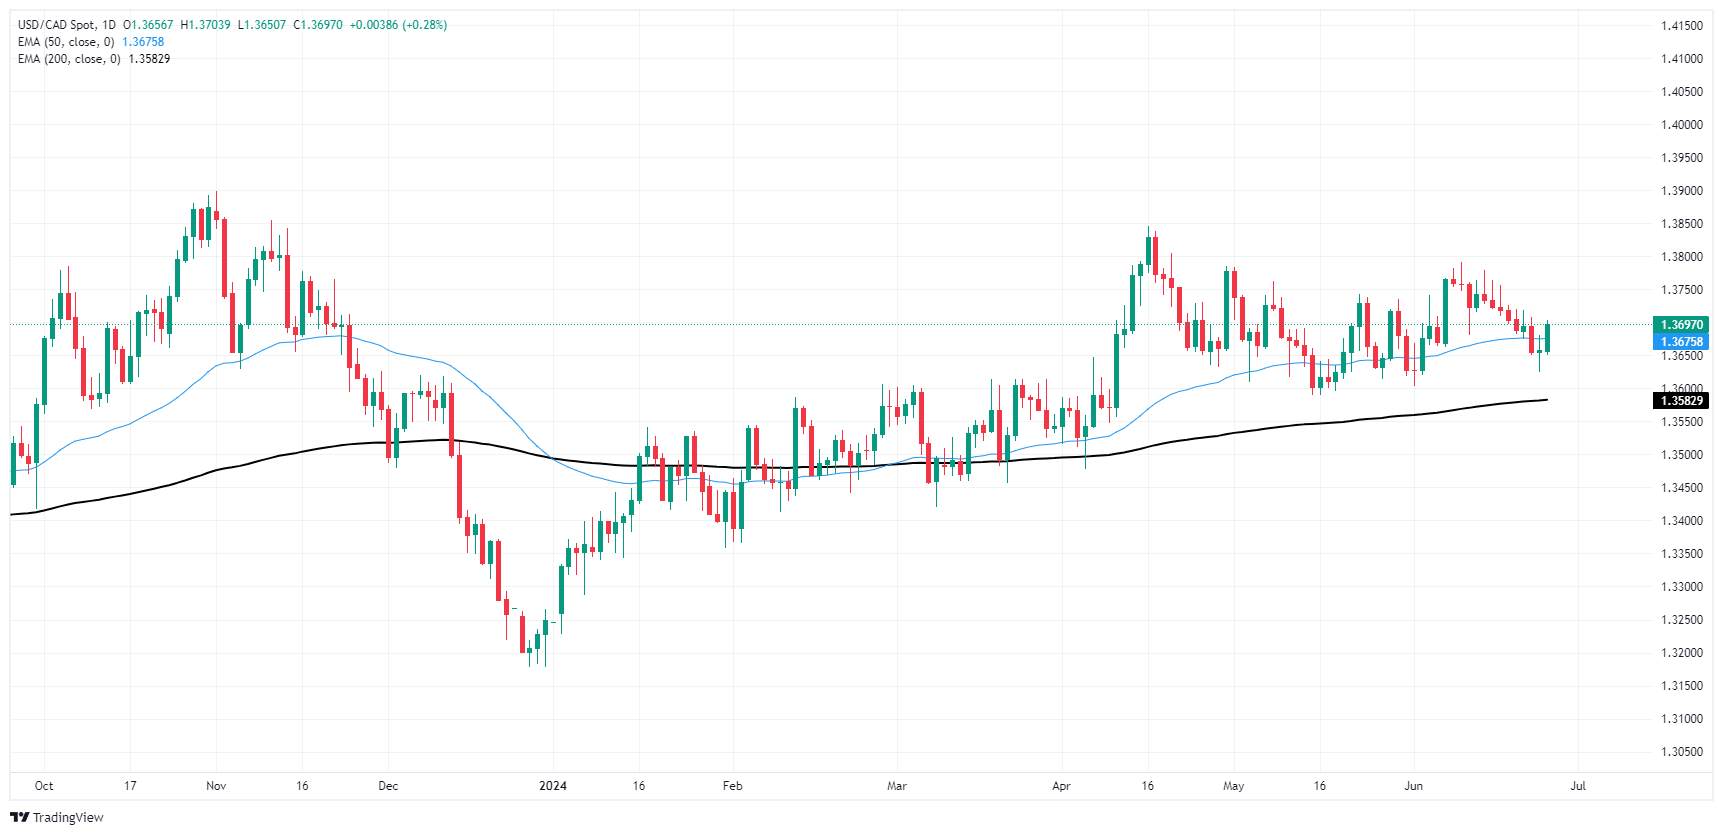
USD/CAD rose to the 1.3700 handle on Wednesday as the Canadian Dollar recedes against the Greenback. The pair briefly set a multi-week low this week before returning to a familiar congestion zone.
Intraday price action is hung up on the 200-hour Exponential Moving Average (EMA) at 1.3692, and daily candlesticks have snapped a near-term losing streak. The 50-day EMA at 1.3675 provides technical support, and the pair continues to grind out a medium-term consolidation pattern north of the 200-day EMA at 1.3582.
USD/CAD hourly chart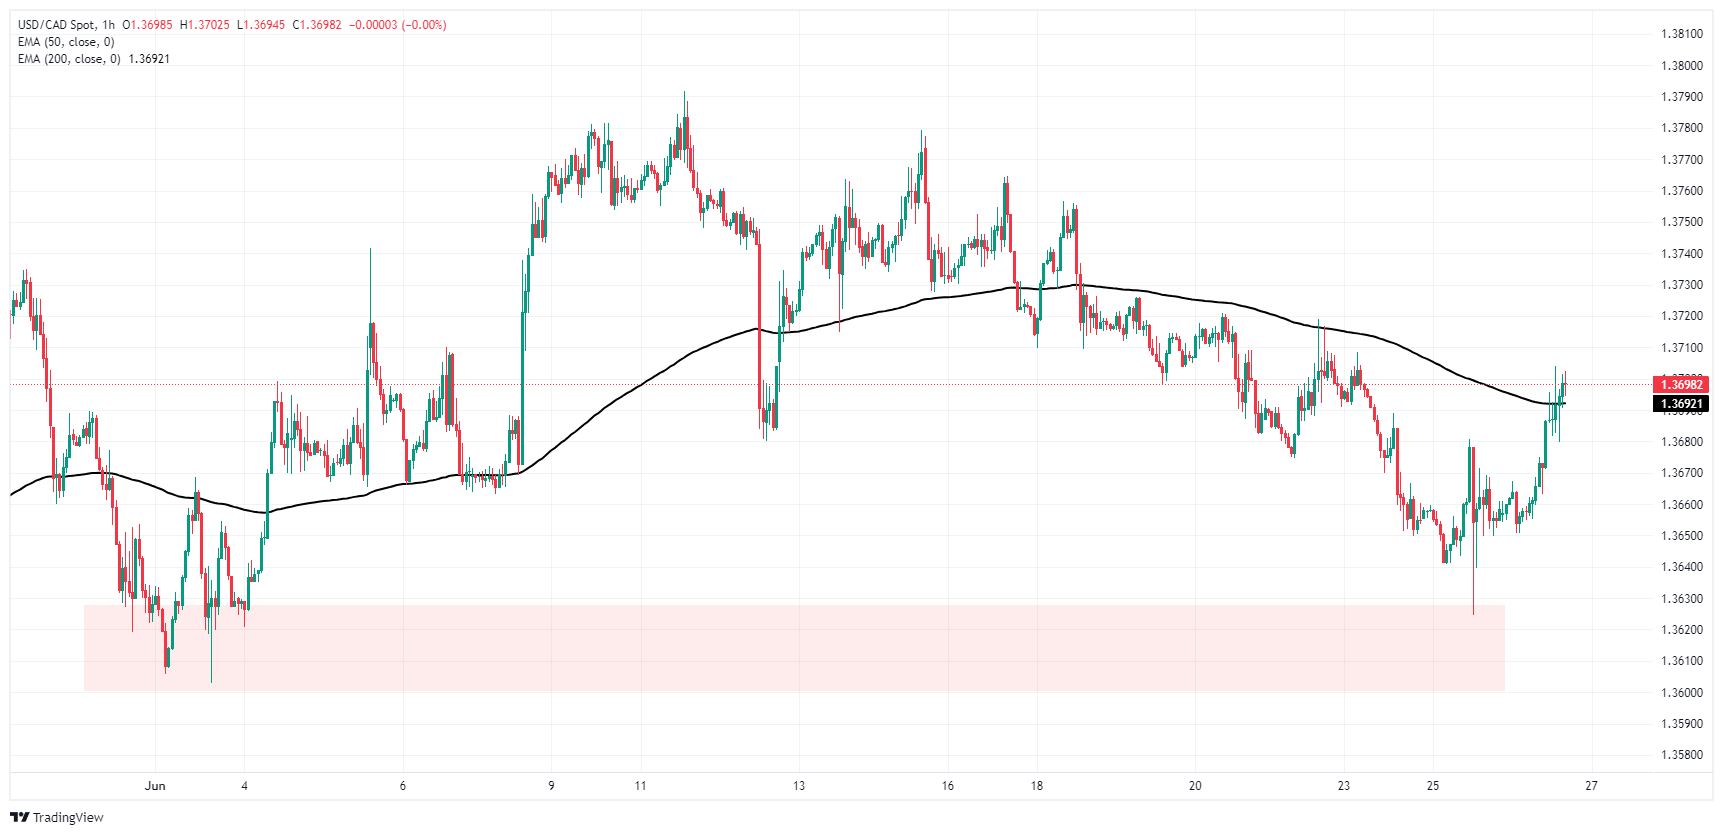
USD/CAD daily chart
 Canadian Dollar FAQs
The key factors driving the Canadian Dollar (CAD) are the level of interest rates set by the Bank of Canada (BoC), the price of Oil, Canada’s largest export, the health of its economy, inflation and the Trade Balance, which is the difference between the value of Canada’s exports versus its imports. Other factors include market sentiment – whether investors are taking on more risky assets (risk-on) or seeking safe-havens (risk-off) – with risk-on being CAD-positive. As its largest trading partner, the health of the US economy is also a key factor influencing the Canadian Dollar.
The Bank of Canada (BoC) has a significant influence on the Canadian Dollar by setting the level of interest rates that banks can lend to one another. This influences the level of interest rates for everyone. The main goal of the BoC is to maintain inflation at 1-3% by adjusting interest rates up or down. Relatively higher interest rates tend to be positive for the CAD. The Bank of Canada can also use quantitative easing and tightening to influence credit conditions, with the former CAD-negative and the latter CAD-positive.
The price of Oil is a key factor impacting the value of the Canadian Dollar. Petroleum is Canada’s biggest export, so Oil price tends to have an immediate impact on the CAD value. Generally, if Oil price rises CAD also goes up, as aggregate demand for the currency increases. The opposite is the case if the price of Oil falls. Higher Oil prices also tend to result in a greater likelihood of a positive Trade Balance, which is also supportive of the CAD.
While inflation had always traditionally been thought of as a negative factor for a currency since it lowers the value of money, the opposite has actually been the case in modern times with the relaxation of cross-border capital controls. Higher inflation tends to lead central banks to put up interest rates which attracts more capital inflows from global investors seeking a lucrative place to keep their money. This increases demand for the local currency, which in Canada’s case is the Canadian Dollar.
Macroeconomic data releases gauge the health of the economy and can have an impact on the Canadian Dollar. Indicators such as GDP, Manufacturing and Services PMIs, employment, and consumer sentiment surveys can all influence the direction of the CAD. A strong economy is good for the Canadian Dollar. Not only does it attract more foreign investment but it may encourage the Bank of Canada to put up interest rates, leading to a stronger currency. If economic data is weak, however, the CAD is likely to fall.
- US Dollar extended recovery to Wednesday, reaching 106.00, its highest level since early May.
- Rising US Treasury yields lent support to the US currency.
- Week's highlight remains June’s PCE inflation data due on Friday.
Wednesday’s session witnessed the US Dollar, as represented by the Dollar Index (DXY), climb to 106.00, a level last observed in early May.
The economic landscape in the US continues to portray resilience. A few signals of disinflation are noticeable, but it still holds on which makes the Federal Reserve (Fed) not fully embrace the easing cycle.
Daily digest market movers: US Dollar elevated by rising Treasury yields, eyes on PCE
- Wednesday's standout data was the New Home Sales for May, which demonstrated a decline of about 11.3% to 619K units from 698K units in the prior release and beneath the 640K expected.
- Simultaneously, US Treasury yields are rising, with the 2, 5 and 10-year rates reported at 4.74%, 4.33%, and 4.31%, respectively.
- Expectations of a potential Fed rate cut in September continue to be high, odds from CME Fedwatch Tool are 60% for 25 bps cut.
- Thursday holds the Gross Domestic Product (GDP) revision for Q1, which is anticipated to hold steady at 1.3%.
- Friday's significant event will still be the May Personal Consumption Expenditures (PCE) report, an inflation gauge favored by the Fed.
- Both headline and core PCE are projected to soften to 2.6% YoY, dropping from 2.7% and 2.8%, respectively, in April.
DXY technical analysis: Bullish momentum continues, index aims high
The technical outlook remains solidly optimistic with indicators firmly in the green. The Relative Strength Index (RSI) preserves a level above 50, while green bars are developing in the Moving Average Convergence Divergence (MACD), suggesting a gathering of strength among bulls. The progressive incline of these indicators demonstrating that the DXY may be preparing for additional upside.
Furthermore, the DXY Index maintains a standing position above the 20, 100 and 200-day Simple Moving Averages (SMAs), confirming a persistently positive outlook. With the Index reaching levels not seen since early May and with indicators showing a propensity for further increment, the DXY is oriented toward further gains. The 106.50 level is the next target for bulls.
Fed FAQs
Monetary policy in the US is shaped by the Federal Reserve (Fed). The Fed has two mandates: to achieve price stability and foster full employment. Its primary tool to achieve these goals is by adjusting interest rates. When prices are rising too quickly and inflation is above the Fed’s 2% target, it raises interest rates, increasing borrowing costs throughout the economy. This results in a stronger US Dollar (USD) as it makes the US a more attractive place for international investors to park their money. When inflation falls below 2% or the Unemployment Rate is too high, the Fed may lower interest rates to encourage borrowing, which weighs on the Greenback.
The Federal Reserve (Fed) holds eight policy meetings a year, where the Federal Open Market Committee (FOMC) assesses economic conditions and makes monetary policy decisions. The FOMC is attended by twelve Fed officials – the seven members of the Board of Governors, the president of the Federal Reserve Bank of New York, and four of the remaining eleven regional Reserve Bank presidents, who serve one-year terms on a rotating basis.
In extreme situations, the Federal Reserve may resort to a policy named Quantitative Easing (QE). QE is the process by which the Fed substantially increases the flow of credit in a stuck financial system. It is a non-standard policy measure used during crises or when inflation is extremely low. It was the Fed’s weapon of choice during the Great Financial Crisis in 2008. It involves the Fed printing more Dollars and using them to buy high grade bonds from financial institutions. QE usually weakens the US Dollar.
Quantitative tightening (QT) is the reverse process of QE, whereby the Federal Reserve stops buying bonds from financial institutions and does not reinvest the principal from the bonds it holds maturing, to purchase new bonds. It is usually positive for the value of the US Dollar.
- GBP/USD declines after struggling at 1.2700, following weak US housing data and strong USD.
- Technical outlook shows bearish momentum with an 'evening star' pattern and RSI indicating further downside.
- Key support levels are the 50-DMA at 1.2636, 1.2600, and 200-DMA at 1.2555.
- For a bullish reversal, GBP/USD needs to surpass 1.2700 and clear resistance at 1.2730/40.
The Pound Sterling lost ground versus the Greenback on Wednesday following the release of US housing data, which highlights the sector's weakness, yet the buck trades at around 8-week highs, as shown by the US Dollar Index (DXY). The GBP/USD trades at 1.2642, down 0.34%.
GBP/USD Price Analysis: Technical outlook
In Tuesday’s article, I wrote, “The pair formed a ‘bullish piercing’ pattern, hinting that traders could challenge the next resistance seen at 1.2700, yet buyers remain reluctant to lift the GBP/USD towards that level.”
The GBP/USD was unable to reach 1.2700 and has broken below Tuesday’s low of 1.2670, printing a new weekly low of 1.2627, after a three-candlestick chart pattern ‘evening star’ emerged.
Momentum supports sellers, as shown by the Relative Strength Index (RSI), which remains bearish and aims lower.
Therefore, the GBP/USD path of least resistance is downwards. It will face the next support level at the 50-DMA at 1.2636. Once that area is surpassed, the psychological 1.2600 mark will follow, ahead of the 200-DMA at 1.2555.
For a bullish continuation, traders must claim 1.2700 and clear a previous support trendline turned resistance at around 1.2730/40.
GBP/USD Price Action – Daily Chart
British Pound PRICE Today
The table below shows the percentage change of British Pound (GBP) against listed major currencies today. British Pound was the strongest against the New Zealand Dollar.
| USD | EUR | GBP | JPY | CAD | AUD | NZD | CHF | |
|---|---|---|---|---|---|---|---|---|
| USD | 0.30% | 0.47% | 0.59% | 0.25% | -0.06% | 0.58% | 0.29% | |
| EUR | -0.30% | 0.16% | 0.27% | -0.08% | -0.35% | 0.29% | -0.01% | |
| GBP | -0.47% | -0.16% | 0.10% | -0.23% | -0.52% | 0.15% | -0.21% | |
| JPY | -0.59% | -0.27% | -0.10% | -0.34% | -0.65% | 0.01% | -0.32% | |
| CAD | -0.25% | 0.08% | 0.23% | 0.34% | -0.34% | 0.35% | 0.02% | |
| AUD | 0.06% | 0.35% | 0.52% | 0.65% | 0.34% | 0.65% | 0.35% | |
| NZD | -0.58% | -0.29% | -0.15% | -0.01% | -0.35% | -0.65% | -0.33% | |
| CHF | -0.29% | 0.01% | 0.21% | 0.32% | -0.02% | -0.35% | 0.33% |
The heat map shows percentage changes of major currencies against each other. The base currency is picked from the left column, while the quote currency is picked from the top row. For example, if you pick the British Pound from the left column and move along the horizontal line to the US Dollar, the percentage change displayed in the box will represent GBP (base)/USD (quote).
Markets turn their attention to Friday’s US PCE deflator, DBS analyst Philip Wee notes.
All eyes are on Friday’s US PCE deflator
“The Dollar Index (DXY) rose 0.2% to 105.63 overnight but stayed in the 105.10-105.90 range set after the Federal Reserve meeting on June 12. At the moment of writing, DXY was almost touching 106.00 (+0.36%).”
“The same trading behaviour was also evident in the US Treasury 10Y yield, which firmed 1.6 bps to 4.25%, inside a 4.20-4.30% range for the comparable period.”
“All eyes will be on Friday’s US PCE deflator, which is expected to mirror the fall in CPI inflation a fortnight ago. Additionally, the Fed’s recent concern over the US unemployment rate rising to 4% in May has not gone unnoticed.”
EUR/USD is trading sideways within a 1.0660-1.0760 range unable to decide its direction ahead of the first round of France’s snap election on June 30, DBS analyst Philip Wee notes.
Euro trading sideways ahead of the inevitable
“EUR/USD is in a 1.0660-1.0760 range, awaiting the first round of France’s snap election on June 30. Assuming none of the parties win an outright majority, a second round will be held on July 7. The polls suggest President Emmanuel Macron’s party will not secure an outright or relative majority.”
“The far-right National Rally leader, Jordan Bardella, said he would not become Prime Minister without an outright majority. Hence, France is looking at a “cohabitation” with Bardella as Prime Minister and Macron as President or political paralysis.”
“The European Central Bank (ECB) will probably play down EU break-up risks at its Forum on Central Banking in Sintra next week. The ECB and the other global central banks will probably be closely aligned in their plans to navigate a data-dependent path toward removing top-level restrictions on rates for the rest of this year.”
- NZD/USD refreshes monthly low near 0.6076 as the Fed’s hawkish remarks strengthen the US Dollar’s appeal.
- Fed Bowman sees interest rates remaining steady for the entire year.
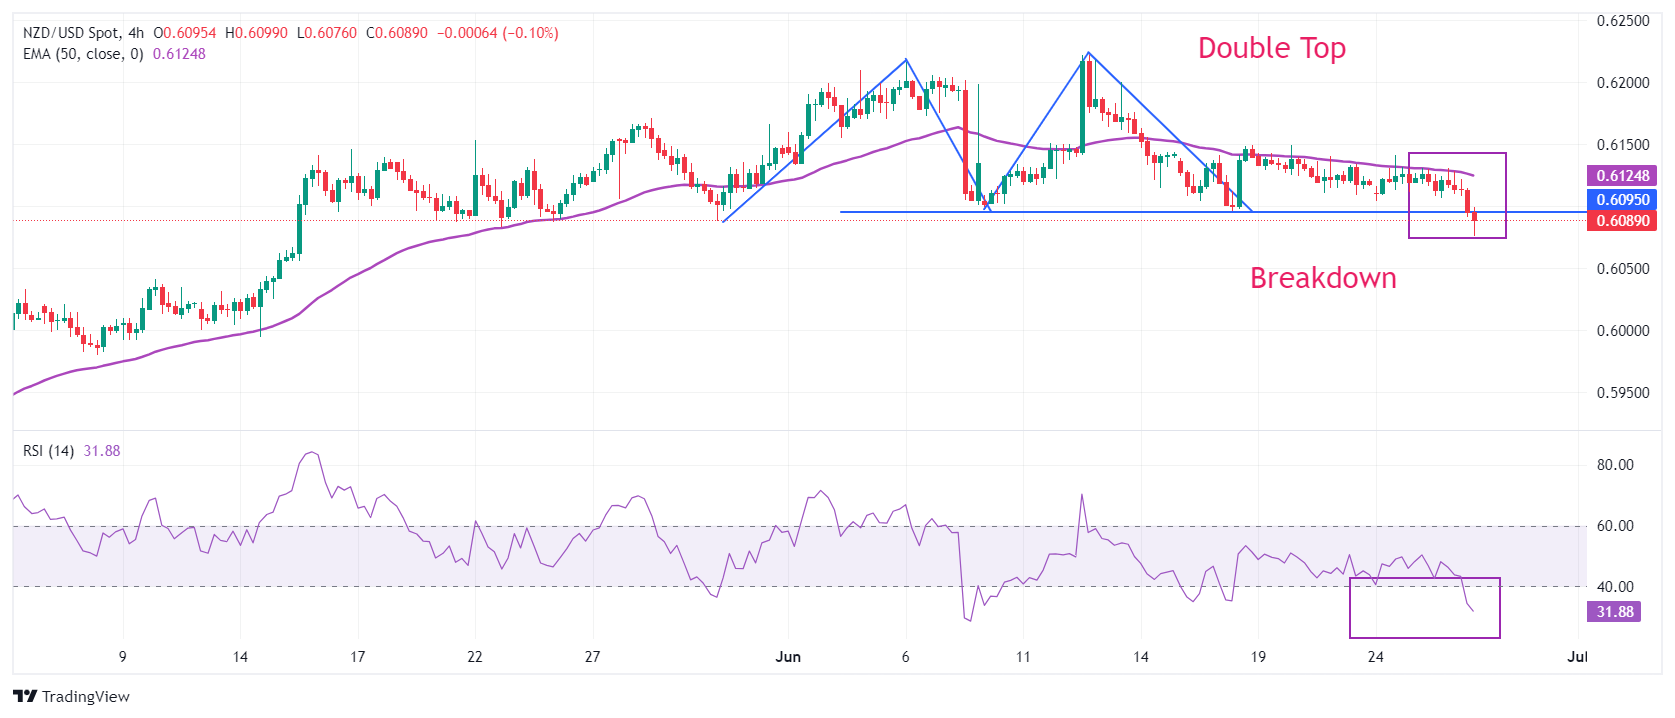
- A Double Top breakdown weakens the New Zealand Dollar.
The NZD/USD pair posts a fresh monthly low near 0.6076 in Wednesday’s New York session. The Kiwi asset faces intense selling pressure after breaking below the crucial support of 0.6100. The pair weakens as the US Dollar (USD) strengthens due to the Federal Reserve’s (Fed) hawkish remarks on the interest rate outlook.
Fed officials advocate for maintaining interest rates steady until they get evidence that inflation will return to the desired rate of 2%. On Tuesday, Fed Governor Michelle Bowman pushed hopes for rate cuts to next year and warned of further policy tightening if the disinflation process stalls or reverses.
Meanwhile, the CME FedWatch tool shows that traders see the central bank choosing the September meeting as the earliest point to start unwinding the restrictive policy framework.
On the Kiwi front, the Reserve Bank of New Zealand (RBNZ) is expected to keep its Official Cash Rate (OCR) steady at 5.5% for the entire year. The NZ inflation has been declining consistently from last five quarters but is still double the required rate of 2%.
NZD/USD delivers a breakdown of the Double Top chart pattern formed in a four-hour timeframe. The breakdown of the above-mentioned chart pattern triggered after a downside move below the swing low plotted from June 10 low near 0.6100, which results in a bearish reversal.
The 50-period Exponential Moving Average (EMA) near 0.6125 continues to act as a major barricade for the New Zealand Dollar bulls.
The 14-period Relative Strength Index (RSI) falls below 40.00. Should the bearish momentum trigger the oscillator established below the same?
Investors would use a pullback move to near 0.6100 as a selling opportunity for targets near April 4 high around 0.6050 and the psychological support of 0.6000.
On the contrary, a reversal move above June 12 high of 0.6222, which will expose the asset January 15 high near 0.6250, followed by January 12 high near 0.6280.
NZD/USD four-hour chart
Economic Indicator
Consumer Price Index ex Food & Energy (YoY)
Inflationary or deflationary tendencies are measured by periodically summing the prices of a basket of representative goods and services and presenting the data as the Consumer Price Index (CPI). CPI data is compiled on a monthly basis and released by the US Department of Labor Statistics. The YoY reading compares the prices of goods in the reference month to the same month a year earlier. The CPI Ex Food & Energy excludes the so-called more volatile food and energy components to give a more accurate measurement of price pressures. Generally speaking, a high reading is bullish for the US Dollar (USD), while a low reading is seen as bearish.
Read more.Next release: Thu Jul 11, 2024 12:30
Frequency: Monthly
Consensus: -
Previous: 3.4%
Source: US Bureau of Labor Statistics
The US Federal Reserve has a dual mandate of maintaining price stability and maximum employment. According to such mandate, inflation should be at around 2% YoY and has become the weakest pillar of the central bank’s directive ever since the world suffered a pandemic, which extends to these days. Price pressures keep rising amid supply-chain issues and bottlenecks, with the Consumer Price Index (CPI) hanging at multi-decade highs. The Fed has already taken measures to tame inflation and is expected to maintain an aggressive stance in the foreseeable future.
Precious metals are losing a bit of steam amid a strengthening US Dollar (USD), TDS Senior Commodity Strategist Ryan McKay notes
Economic data to influence appetite for Gold
“Looking forward, traders are watching the data like hawks and a host of economic data this week could influence the macro cohort's appetite for Gold (XAU/USD).”
“The PCE data will be top of mind after the below consensus CPI and PPI data, and we look for the core segment to advance at its softest monthly pace of the year at 0.13%. Further signs that inflation is easing could start to generate more certainty around the Fed's cutting path.”
“On the flip side however, we see only limited scope for downside should data come in hot. Indeed, CTAs hold a margin of safety above $2,200/oz before any material selling, while physical demand from central banks and Asian precious metals appetite continues to support the market.”
Oil markets are now succumbing to a reversal of systematic flows, TDS Senior Commodity Strategist Ryan McKay notes.
The upside is likely capped for WTI
“Commodity Trading Advisors (CTAs) could remain modest buyers in the short-term in Brent crude, but WTI would need to see prices rally back above $82.50/bbl to renew upside flows.”
“However, we are not anticipating another rout in prices as supply risks are back in focus with tensions building in the Middle East between Israel and Lebanon, while further ship attacks in the Red Sea reignite concerns.”
“A renewed increase in our energy supply risk indicator can support price action in the near term, but ultimately, we still argue the upside is likely capped by increasing global supply and potential OPEC+ increases, which put 2025 balances in question.”
- AUD/USD is trading in a narrow range in the middle of a multi-week range.
- The pair is in a sideways trend which is expected to extend.
- The contraction in volatility may be a harbinger of great volatility to come.
AUD/USD has started trading in a mini range within a range on the 4-hour price chart. The pair has been going sideways since the middle of May but since June 19 the waves of buying and selling have narrowed still further.
AUD/USD 4-hour Chart
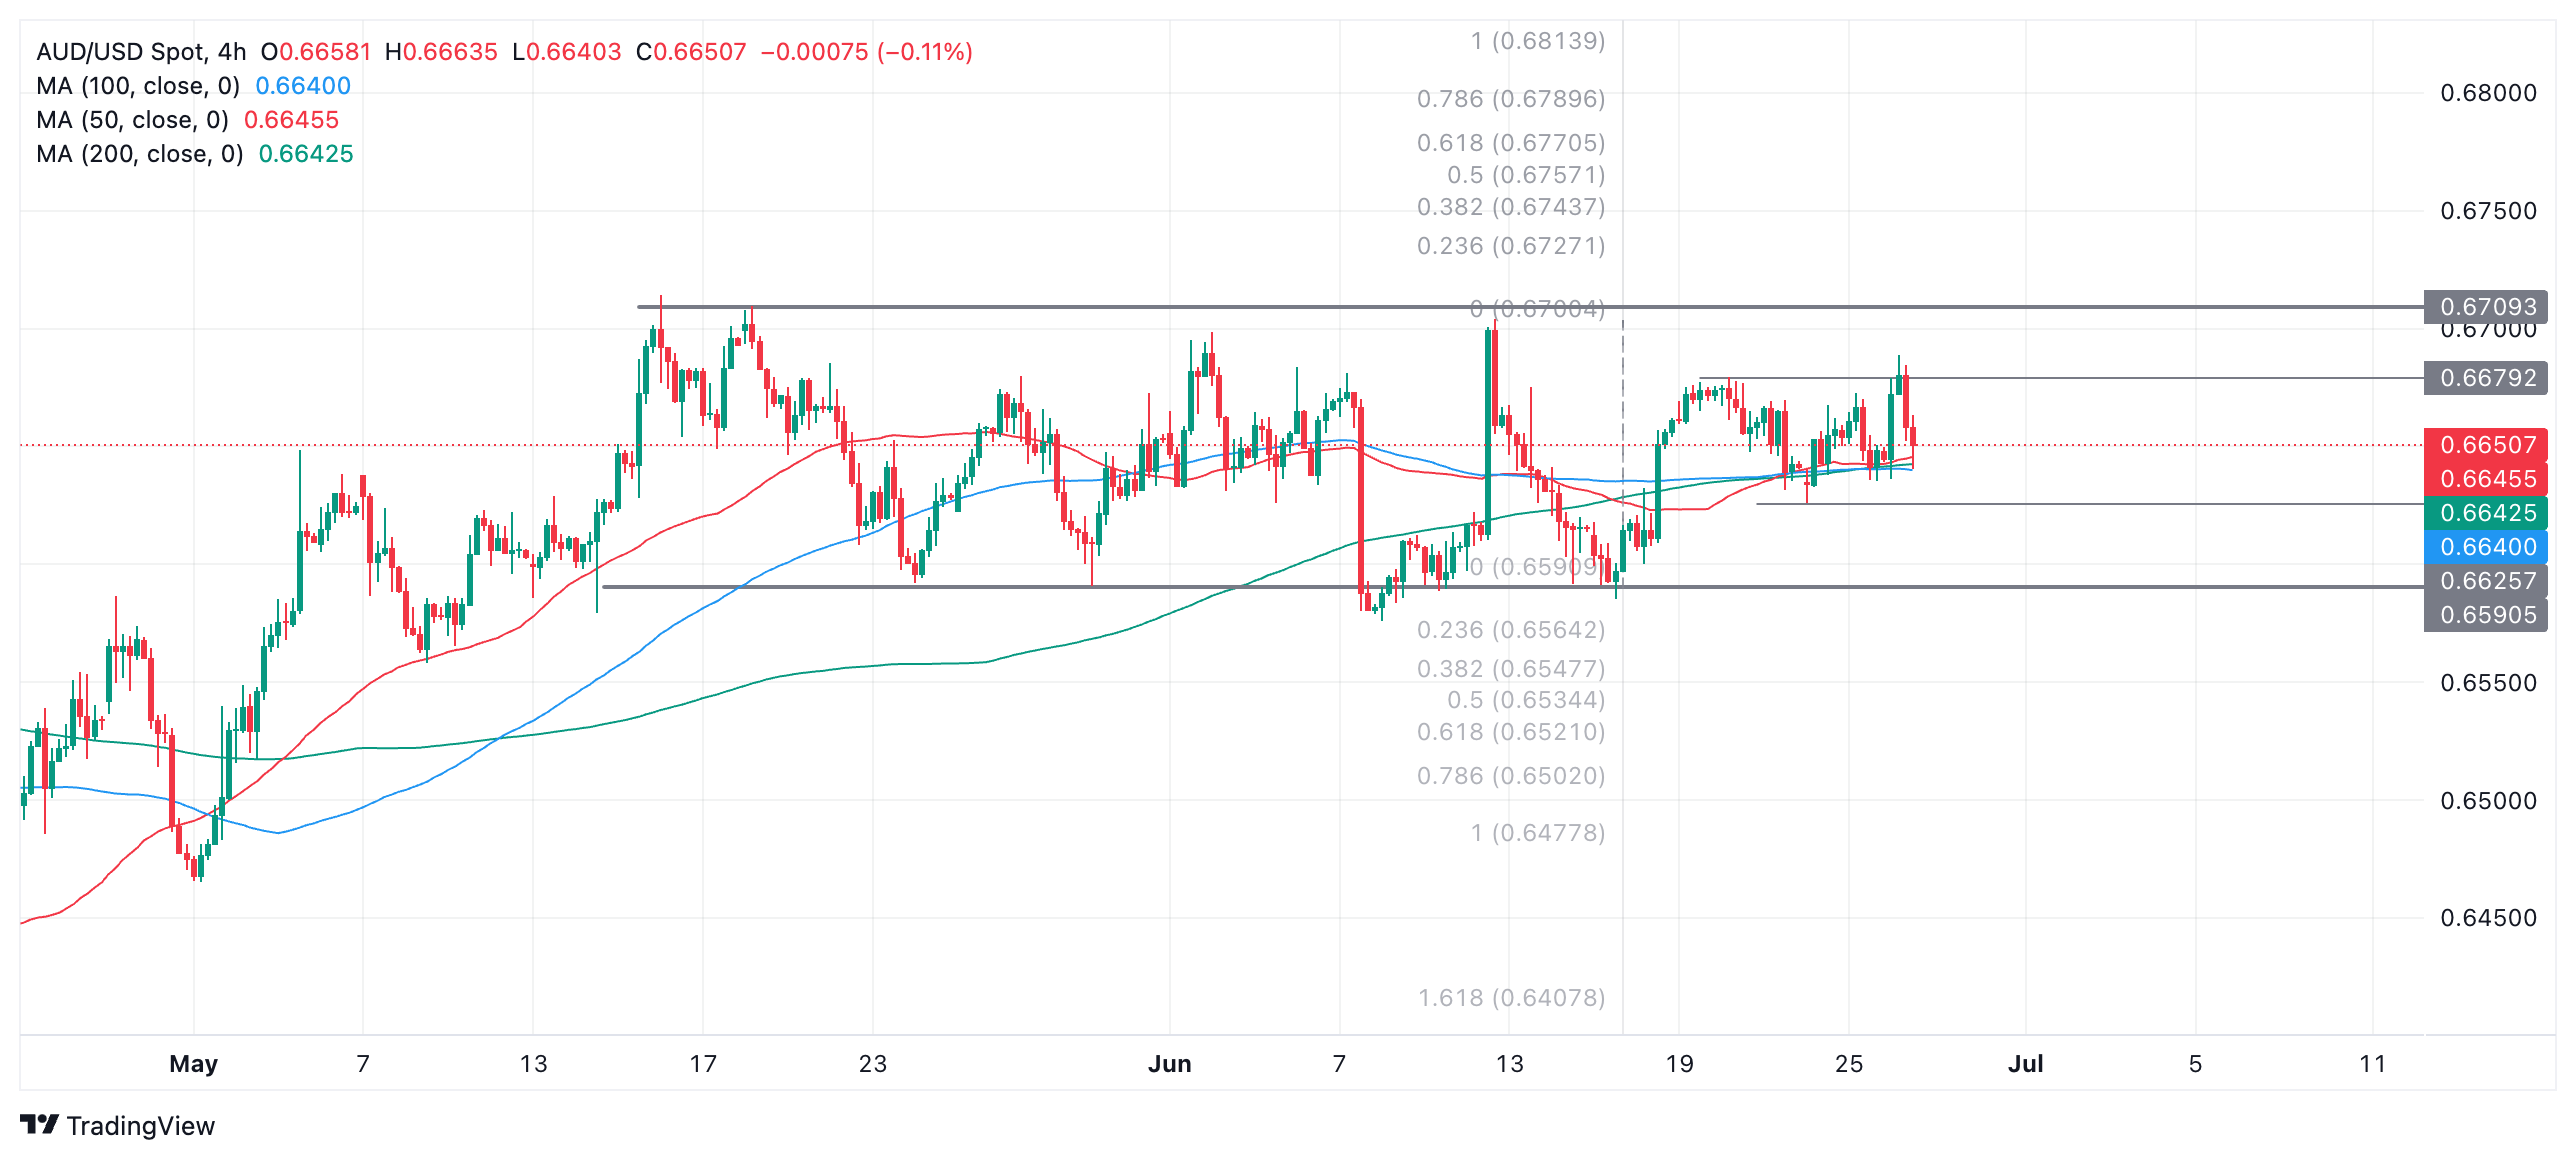
AUD/USD could move either higher or lower within the range. A break above the mini-range high at 0.6679 would probably indicate a continuation up to the range ceiling at 0.6709. Likewise a break below the mini-range low at 0.6625 would probably lead to a move down to the range floor at 0.6590.
The short-term trend is sideways and as long as price remains within the bounds of the range it will likely keep extending within the range – “the trend is your friend” after all.
Eventually the pair will break out of its range and the move is likely to be very strong since it is a general rule of markets that periods of low volatility like now are followed by periods of high volatility.
An upside breakout is marginally more likely to happen because the trend prior to the formation of the range was bullish.
A decisive break above the ceiling of the range would see a follow-through to a conservative target at 0.6770. A decisive break below the range floor on the other hand would indicate a follow-through to an initial target at 0.6521.
A decisive break would be one in which a longer-than-average candle broke out of the range and closed near its high or low, or three successive candles of the same color broke cleanly through the range top or bottom.
The targets are generated using the technical-analysis method of extrapolating the height of the range by a Fibonacci 0.618 ratio higher (in the case of an upside break) or lower (in the case of a downside break). A more generous target would come from extrapolating the full height of the range.
As news and speculation continue to swirl about potential domestic consumer-based stimulus being announced at China's third plenum in July, industrial metal prices have failed to generate any material gains, TDS Senior Commodity Strategist Ryan McKay notes.
Physical demand base metals is low
“Downside momentum has proven resilient despite these lingering hopes as our gauge of commodity demand continues to weaken amid a precarious global macro landscape.”
“Inventory levels of Copper continue to surge in China, while local premiums remain low, signaling little sign of physical demand to back to euphoric positioning in the West. Top SHFE traders have also liquidated their long positions recently and have now taken a net short overnight.”
“AUM for base metal specific ETFs have also notably declined, while money manager positioning is also starting to reverse. CTA positions remain safe with a large margin of safety before the next selling trigger, however as momentum eases the level is drifting closer to market at $9,298/t.”
- Silver is weakening within a descending channel.
- The channel is more likely than not to continue unfolding lower.
- A break below the June 13 low would confirm further downside.
Silver (XAG/USD) looks like it has started to form a descending channel on the 4-hour chart and the evidence is building to argue that it is probably in a short-term downtrend now too. Given the old saying that “the trend is your friend” the odds probably favor a continuation lower – with some important caveats.
Silver 4-hour Chart
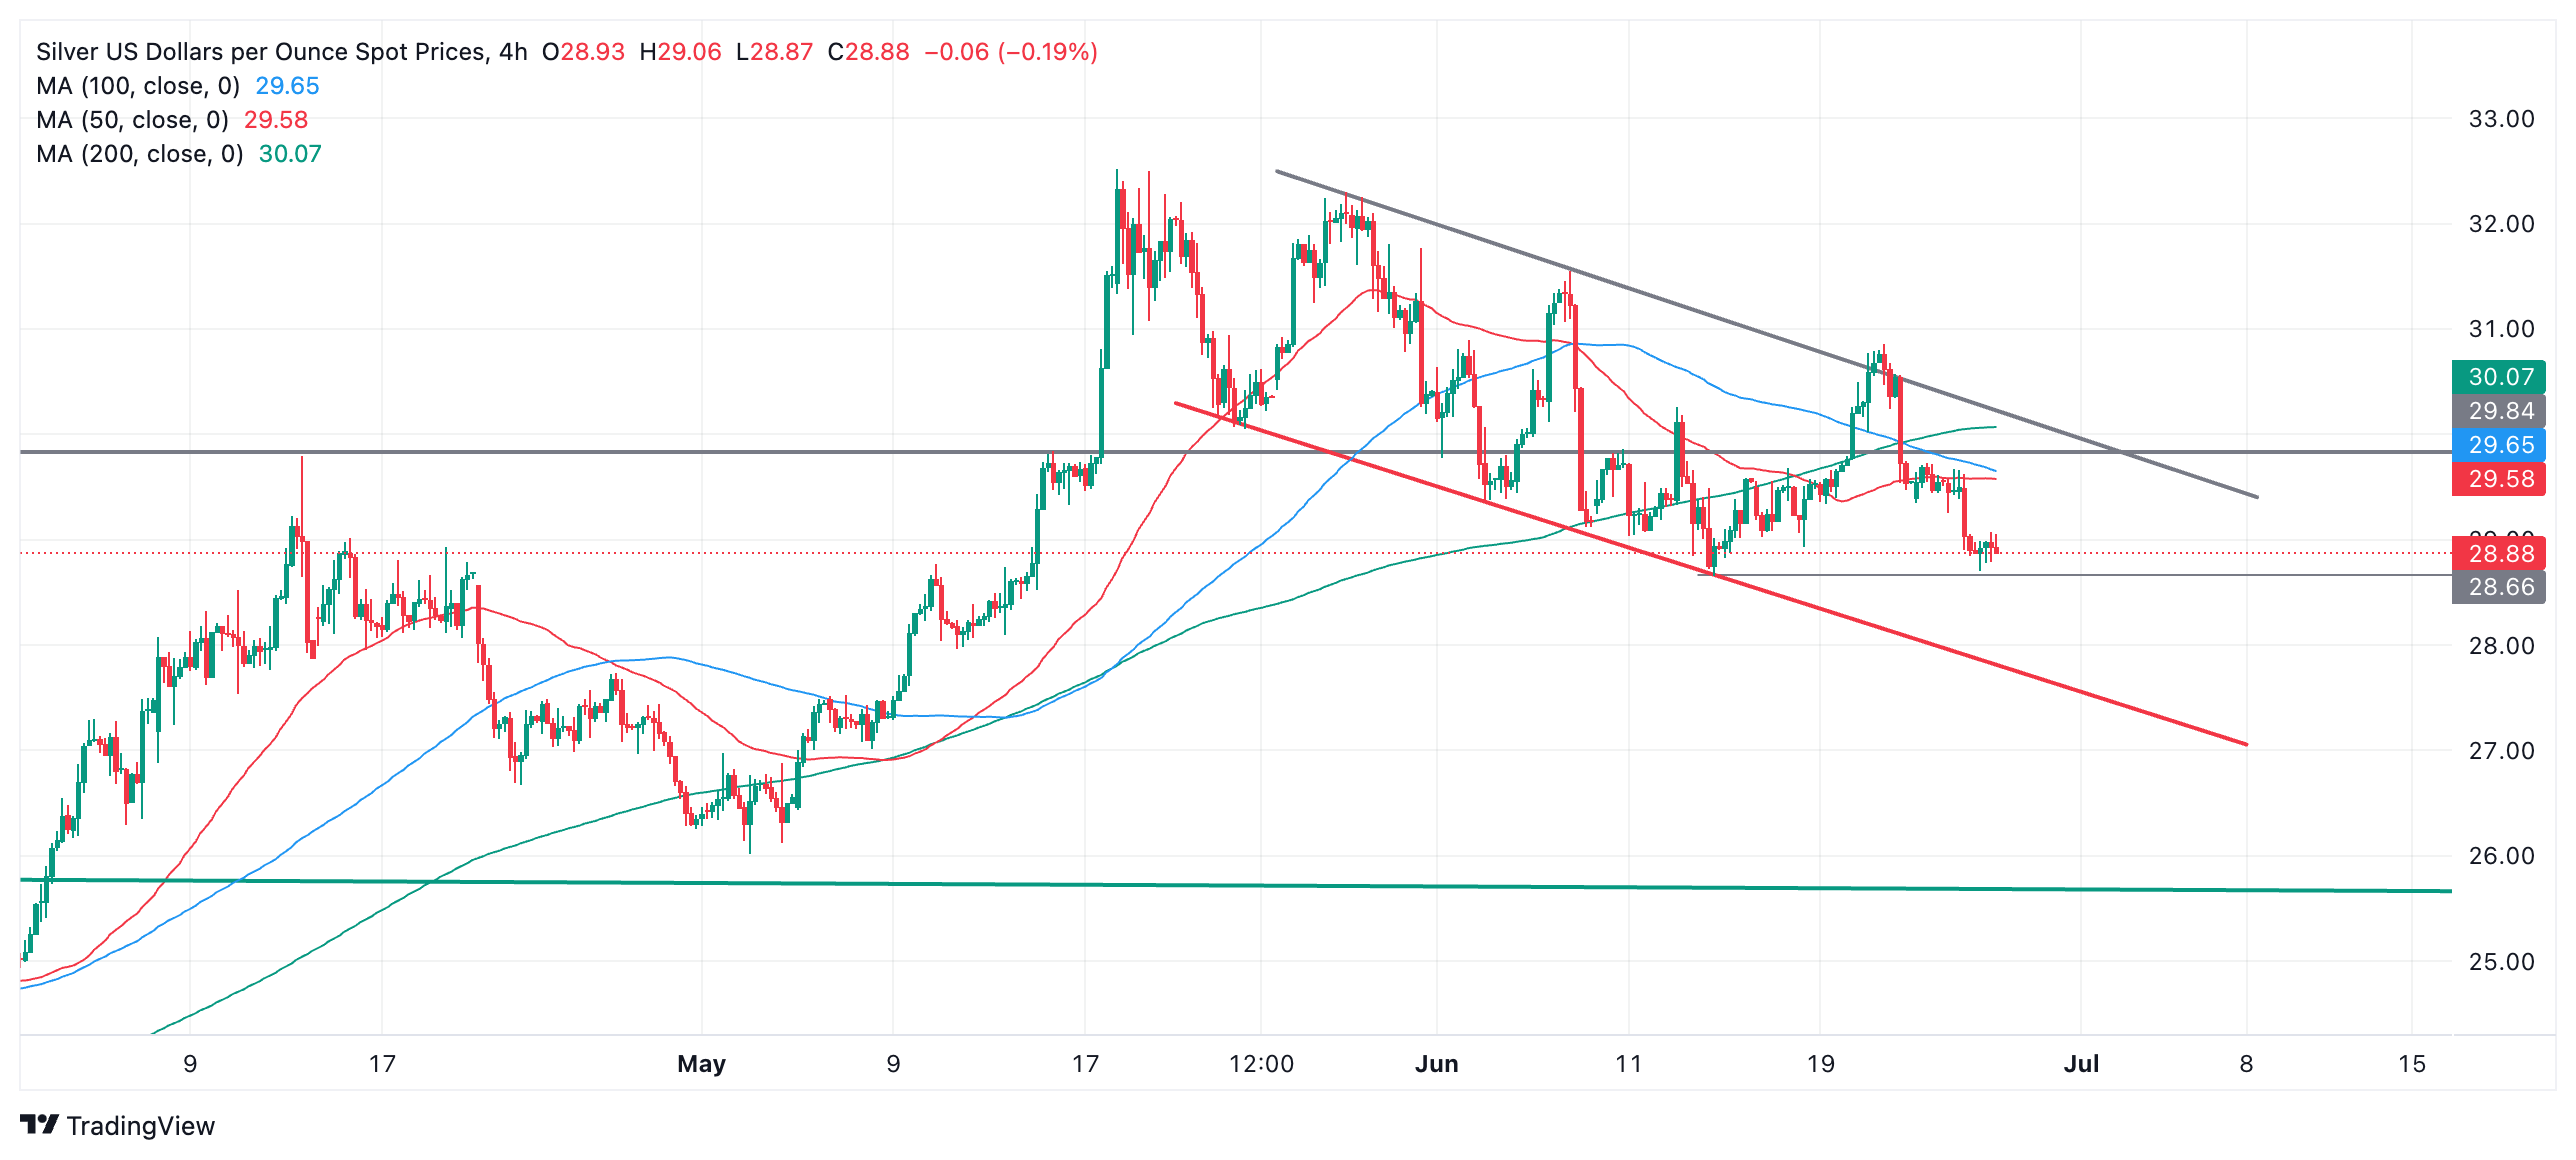
Silver rallied strongly on June 20 and 21 but then failed to break out of the top of its falling channel. It then fell back down, finding support at $28.66, the June 13 lows, from where it has just bounced.
If Silver breaks below $28.66 it will confirm it is in a short-term downtrend and probably continue to decline substantially lower. The next downside target likely lies at the level of the lower channel line, at around $27.50.
The caveat is that Silver did temporarily break out of its channel on June 21, and although it failed to follow-through higher the fact it breached the channel’s upper borderline suggests the integrity of the falling channel has been compromised. This will make it easier for price to break out higher on a second attempt.
If the June 13 lows hold, therefore, and Silver starts to recover it could run back up to the level of the upper channel line at around $29.90, which is also a major resistance level at the top of Silver’s four-year consolidation zone. A decisive break above that level would indicate a major turning point for the precious metal and suggest a new uptrend was probably evolving.
A decisive break would be one accompanied by a long green up candle that broke clearly above the level and closed near its high or three green candles in a row that broke above the level.
- EUR/JPY trades near multi-year highs above 171.00.
- Fears of Japan’s intervention to cushion the Japanese Yen have intensified.
- The ECB is expected to deliver more rate cuts sooner.
The EUR/JPY trades close to multi-year highs around 171.50 in Wednesday’s American session. The cross is expected to face selling pressure as the Japanese Yen could gain significantly with Japan’s intervention against excessive FX volatility moves.
Fears of Japan intervention to provide cushion to weak Yen have deepened as the currency has declined to lowest levels of 160.39 since 1986 against the US Dollar (USD).
The Japanese Yen has remained under pressure despite growing speculation that the Bank of Japan (BoJ) will raise interest rates again sooner. The expectations for further policy-tightening have improved as weak Yen is resulting in higher inflation by making exports competitive in global markets and increasing import costs. The BoJ minutes for the latest meeting showed that one member advocated for an increase "without too much delay" to help bring inflation back down, Reuters reported.
Meanwhile, the Euro is also under pressure due to rising expectations that the European Central Bank (ECB) will deliver subsequent rate cuts. The probability of more rate cuts by the ECB has been prompted by deteriorating economic prospects of Eurozone’s largest economy.
German IFO data that exhibits market sentiment over economy’s current position and forward outlook indicated a gloomy picture. The IFO Business Climate, an early indicator of current conditions and business expectations in Germany, surprisingly declined to 88.6 for June.
The main focus for the Euro (EUR) is on French elections in the short term. The concern is still on potential fiscal direction far-right parties may be taking and if the ‘cohabitation’ outcome comes into play, OCBC analysts Frances Cheung and Christopher Wong note.
French election weighs on the market
“Knee-jerk impact on EUR can vary but is likely to be skewed to the downside, unless outcome surprises with Macron’s Ensemble coalition winning a larger share. The other swing surprise that would be outright negative for EUR would be a >50% win for either the far right or leftist coalition (not our base case).”
“EUR was last at 1.0682. Bearish momentum on daily chart shows signs of fading while RSI rose slightly. Some risks to the upside but 2-way trades still likely ahead of French election risks.”
“Support at 1.0660/70 levels (recent low) before 1.06 levels. Resistance at 1.0770 (50 DMA), 1.0810 (38.2% fibo retracement of 2024 high to low, 100 DMA).”
The recent USD/CNY fixings suggest a measured pace of RMB depreciation, OCBC analysts Frances Cheung and Christopher Wong note.
USD/CNH continues to move up towards 7.31
“The recent USD/CNY fixings have followed a pattern that continued to reinforced out view that authorities are pursuing a measured pace of RMB depreciation.”
“Change in daily fix on average is about +17pips since 19 Jun (about 6 days) vs. average daily change of about 4.5pips/day since May2024. Higher USD/CNY fix and wider CNH-CNY spread gives the impression there could be further weakening in RMB ahead.”
“USD/CNH was last at 7.3011. Momentum is bullish while RSI rose. Risks skewed to the upside. Resistance at 7.31. Support at 7.2705 (21 DMA).”
- The US Dollar trades firmly in the green against nearly all major peers.
- A light data calendar is ahead as markets digest hawkish Fed comments.
- The US Dollar index flirts with a retest of 105.90.
The US Dollar (USD) trades stronger on Wednesday for the second day in a row with some help from US Federal Reserve (Fed) officials, who seem to have turned more hawkish. Federal Reserve Governor Michelle Bowman lit the fire on the fuzz by saying that a rate hike is still an option while she sees too many potential risks that could still drive inflation higher. Her thesis became reality just a few hours later, after neighbouring country Canada released red-hot inflation numbers.
On the economic front, a rather light calendar ahead of Thursday’s Gross Domestic Product (GDP) final estimate and Friday’s Personal Consumption Expenditures (PCE) Price Index release. Still, traders will need to watch out for the Bank Stress Test report, to be published at 20:30 GMT, in which the Fed analyzes how healthy US banks’ balance sheets are in case of financial market distress.
Daily digest market movers: Fed scaring markets
- Markets got spooked by comments from Federal Reserve Governor Michelle Bowman on Tuesday, saying she is "willing to raise the target rate at a future meeting if inflation progress stalls or reverses", while she "expects US inflation to remain elevated for some time, still seeing a number of upside inflation risks."
- At 11:00 GMT, the weekly Mortgage Applications Index from the Mortgage Bankers Association (MBA) will release this week’s numbers. The index rose 0.9% the previous week.
- At 14:00 GMT, New Home Sales data for May is due to come out. Analysts expect sales to increase slightly to 640,000 from April’s 634,000.
- The US Treasury is heading to markets to allot a 5-year Note in the markets at 17:00 GMT.
- The Fed’s Bank Stress Test report will come out near 20:30 GMT.
- Equities are recovering after Nvidia (NVDA) was able to eke out gains on Tuesday at the US closing bell. The main indices in Asia are all in the green and even the Dax and the pan-European index, Euro Stoxx 50, is recovering. US futures are rather mixed, with the Dow Jones Industrial futures in the red against Nasdaq futures in the green and the S&P 500 caught in the middle.
- The CME Fedwatch Tool is broadly backing a rate cut in September despite the recent comments from Fed officials, with odds now standing at 59.5% for a 25 basis point cut. A rate pause stands at a 34.1% chance, while a 50-basis-point rate cut has a slim 6.4% possibility.
- The US 10-year benchmark rate trades at 4.26%, and trades near the high for this week.
US Dollar Index Technical Analysis: Stuck in a rut
The US Dollar Index (DXY) is rolling for a second day in a row, though it looks to be sticking to a sideways trend for now. The Greenback seems to be broadly consolidating, with no new highs and no new lows in over five trading days. However, key economic data to be released on Thursday and Friday might move the needle.
On the upside, the first level to watch is 105.88, which triggered a rejection at the start of May and on Friday last week. Further up, the biggest challenge remains at 106.52, the year-to-date high from April 16. A rally to 107.20, a level not seen since April 2023, would need to be driven by a surprise uptick in US inflation or a sudden hawkish shift from the Fed.
On the downside, 105.52 is the first support ahead of a trifecta of Simple Moving Averages (SMA). First is the 55-day SMA at 105.23, safeguarding the 105.00 round figure. A touch lower, near 104.66 and 104.48, both the 100-day and the 200-day SMA form a double layer of protection to support any declines. Should this area be broken, look for 104.00 to salvage the situation.
US Dollar FAQs
The US Dollar (USD) is the official currency of the United States of America, and the ‘de facto’ currency of a significant number of other countries where it is found in circulation alongside local notes. It is the most heavily traded currency in the world, accounting for over 88% of all global foreign exchange turnover, or an average of $6.6 trillion in transactions per day, according to data from 2022. Following the second world war, the USD took over from the British Pound as the world’s reserve currency. For most of its history, the US Dollar was backed by Gold, until the Bretton Woods Agreement in 1971 when the Gold Standard went away.
The most important single factor impacting on the value of the US Dollar is monetary policy, which is shaped by the Federal Reserve (Fed). The Fed has two mandates: to achieve price stability (control inflation) and foster full employment. Its primary tool to achieve these two goals is by adjusting interest rates. When prices are rising too quickly and inflation is above the Fed’s 2% target, the Fed will raise rates, which helps the USD value. When inflation falls below 2% or the Unemployment Rate is too high, the Fed may lower interest rates, which weighs on the Greenback.
In extreme situations, the Federal Reserve can also print more Dollars and enact quantitative easing (QE). QE is the process by which the Fed substantially increases the flow of credit in a stuck financial system. It is a non-standard policy measure used when credit has dried up because banks will not lend to each other (out of the fear of counterparty default). It is a last resort when simply lowering interest rates is unlikely to achieve the necessary result. It was the Fed’s weapon of choice to combat the credit crunch that occurred during the Great Financial Crisis in 2008. It involves the Fed printing more Dollars and using them to buy US government bonds predominantly from financial institutions. QE usually leads to a weaker US Dollar.
Quantitative tightening (QT) is the reverse process whereby the Federal Reserve stops buying bonds from financial institutions and does not reinvest the principal from the bonds it holds maturing in new purchases. It is usually positive for the US Dollar.
The Japanese Yen (JPY) declined to its weakest level since 1990 against the US Dollar on Wednesday, with USD/JPY touching 160.40 during the European trading hours.
On April 29, the Bank of Japan (BoJ) intervened in the foreign exchange (FX) market and triggered a sharp decline in USD/JPY after the pair hit 160.20. At the time of press, USD/JPY was trading a few pips above this level.
Japanese Finance Minister Shunichi Suzuki repeated earlier in the week that they will continue to take appropriate steps to respond to the declining value of the currency. Meanwhile, Japan Chief Cabinet Secretary Yoshimasa Hayashi said on Monday that excessive volatility in currency markets is undesirable and added that they will closely monitor the FX moves and take necessary steps if needed.
Bank of Japan FAQs
The Bank of Japan (BoJ) is the Japanese central bank, which sets monetary policy in the country. Its mandate is to issue banknotes and carry out currency and monetary control to ensure price stability, which means an inflation target of around 2%.
The Bank of Japan has embarked in an ultra-loose monetary policy since 2013 in order to stimulate the economy and fuel inflation amid a low-inflationary environment. The bank’s policy is based on Quantitative and Qualitative Easing (QQE), or printing notes to buy assets such as government or corporate bonds to provide liquidity. In 2016, the bank doubled down on its strategy and further loosened policy by first introducing negative interest rates and then directly controlling the yield of its 10-year government bonds.
The Bank’s massive stimulus has caused the Yen to depreciate against its main currency peers. This process has exacerbated more recently due to an increasing policy divergence between the Bank of Japan and other main central banks, which have opted to increase interest rates sharply to fight decades-high levels of inflation. The BoJ’s policy of holding down rates has led to a widening differential with other currencies, dragging down the value of the Yen.
A weaker Yen and the spike in global energy prices have led to an increase in Japanese inflation, which has exceeded the BoJ’s 2% target. Still, the Bank judges that the sustainable and stable achievement of the 2% target has not yet come in sight, so any sudden change in the current policy looks unlikely.
- USD/CAD rebounds on reluctance of Fed commentators to endorse near-term interest-rate cuts.
- The pair had been weakening after higher-than-expected inflation in Canada stopped the BoC from beginning its easing cycle.
- USD/CAD lacks directionality on the charts and has declined since making a false breakout higher in early June.
USD/CAD edges higher on Wednesday, trading in the 1.3680s as the US Dollar (USD) firms up on commentary from several Federal Reserve (Fed) rate-setters, that overall suggests the US central bank is reluctant to cut its main interest rate, the Fed Funds rate, due to insufficient progress being made on lowering inflation.
This is viewed as positive for the US Dollar (and USD/CAD), because keeping the Fed Funds rate high leads to greater foreign capital inflows, from investors seeking returns.
Market gauges of the trajectory of Fed rate policy, however, are signaling a more optimistic roughly 66% probability of the Fed cutting interest rates at or before its September meeting. Estimates are based on the CME FedWatch tool, which uses the price of Interest Rate (Fed Funds) Futures for its calculations.
USD/CAD’s rebound comes after a period of weakness for the pair during which investors revised their expectations of the path of Bank of Canada (BoC) monetary policy. From previously expecting the BoC to begin a cycle of interest rate cuts due to declining inflation in Canada they now see the BoC holding its policy rate at the current level – much like the Fed.
The BoC cut their policy interest rate by 0.25% to 4.75% in June, however, the release of higher-than-expected inflation data for May, has now reduced expectations that they will make another cut at their next meeting in July, despite investors expecting one. This has led to an overall appreciation of the Canadian Dollar (CAD) and a decline in USD/CAD.
From a technical perspective, over the short-to-medium term, USD/CAD is seesawing between losses and gains. After a false upside breakout from a Symmetrical Triangle pattern on June 7 it quickly ran out of steam and capitulated, falling back within the triangle. With neither bulls or bears in overall control, and a lack of directional trend, it is likely to continue in this sideways mode until it breaks decisively to one side or another.
USD/CAD Daily Chart
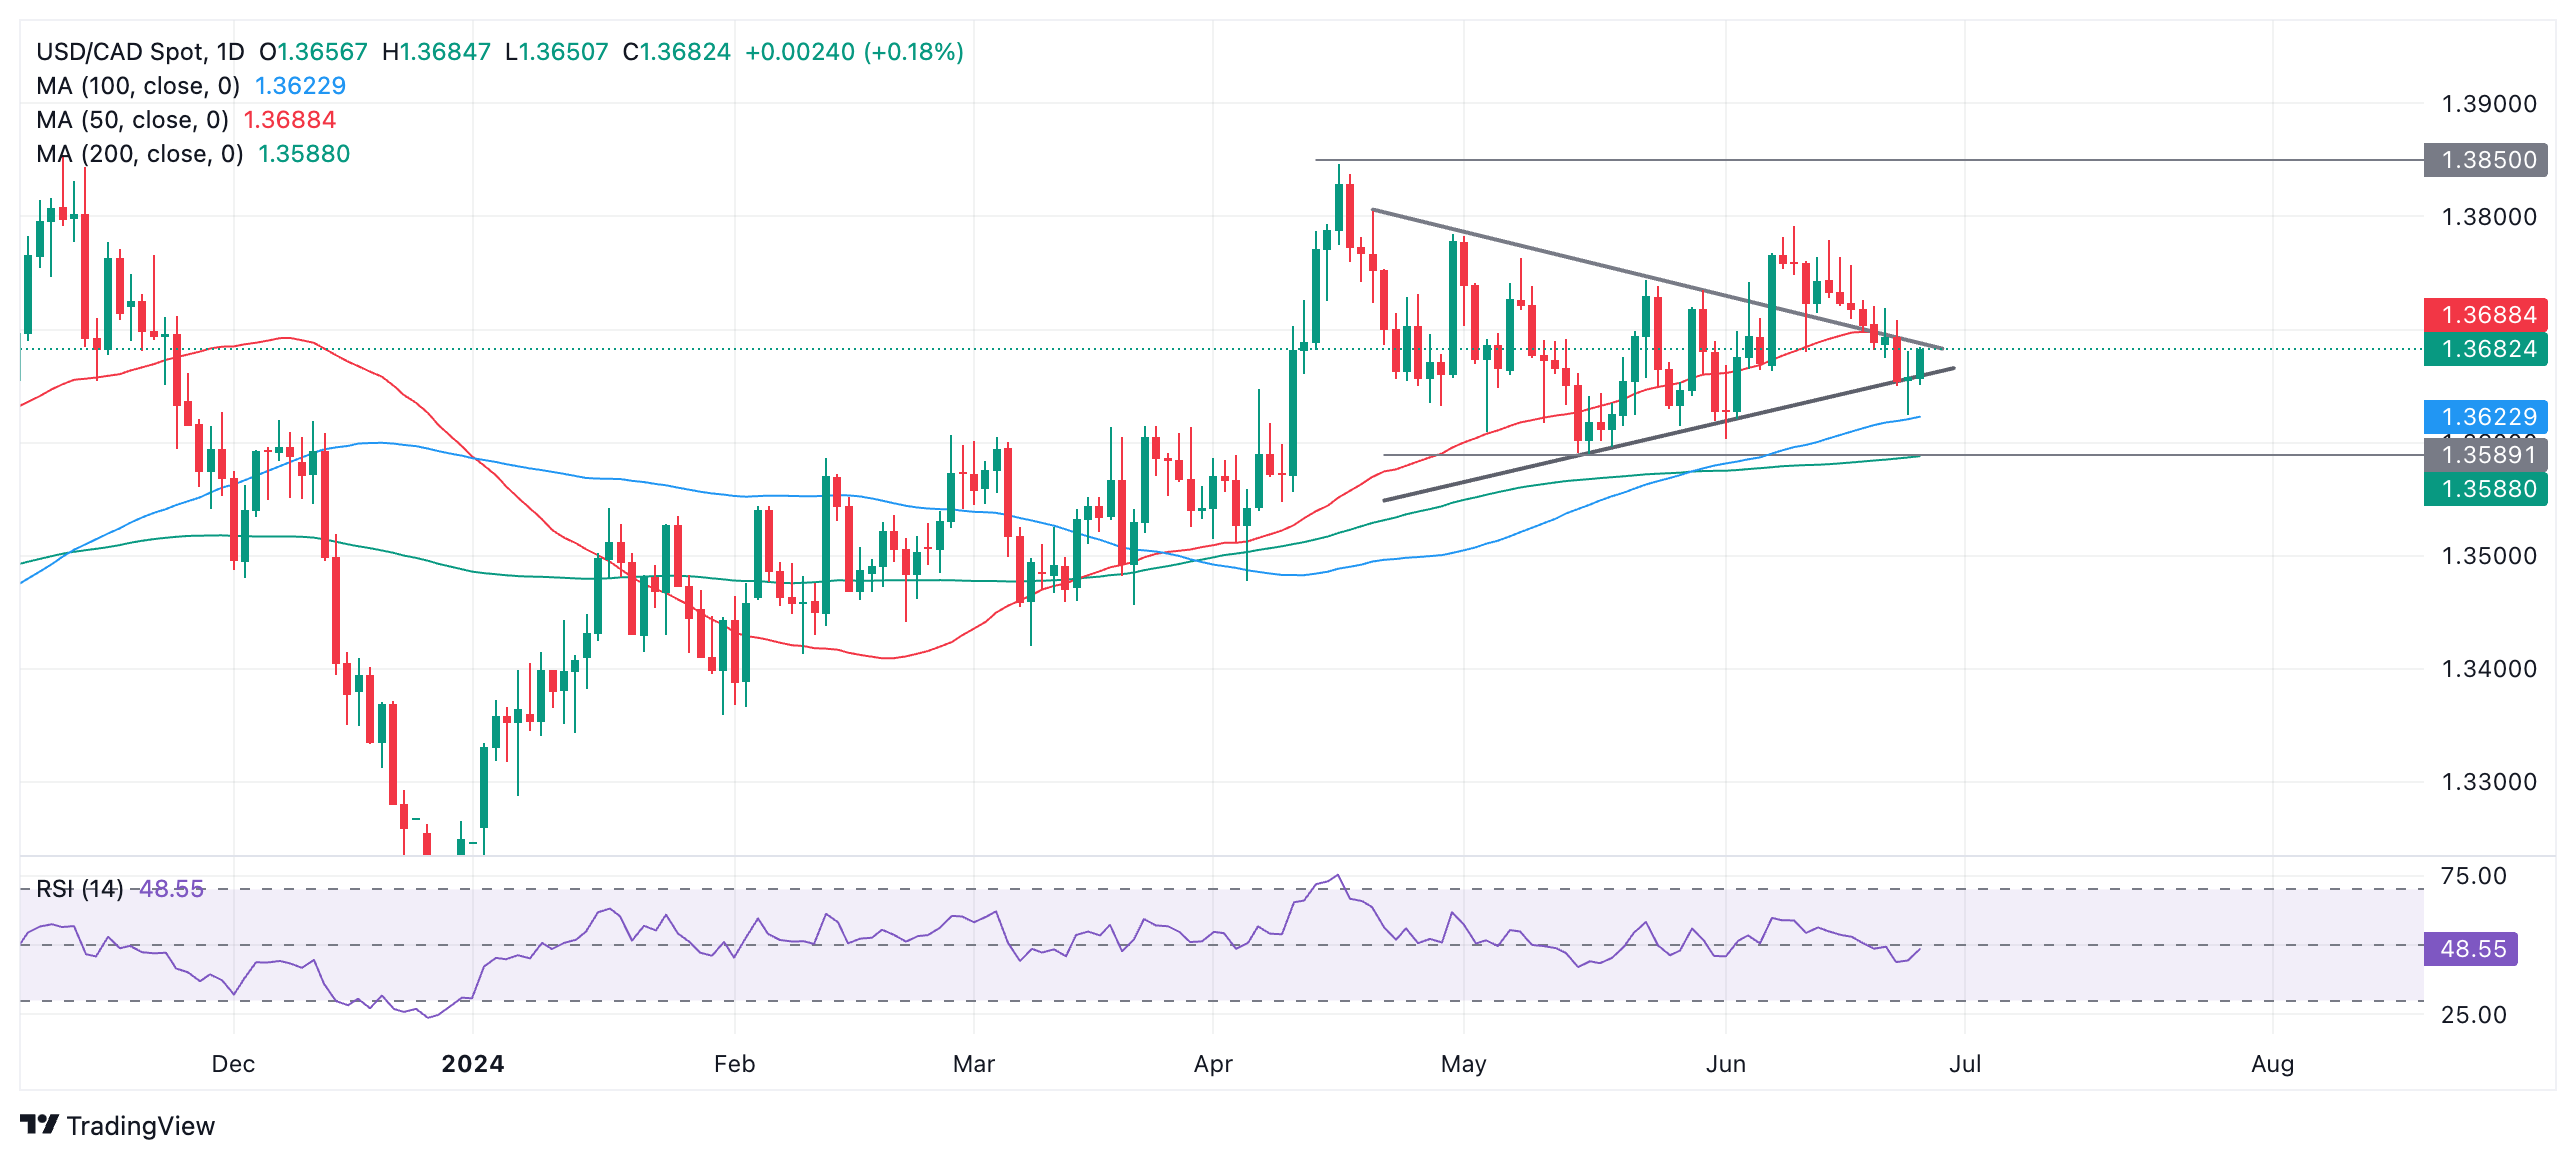
- AUD/USD loses some intraday gains as the US Dollar rises strongly.
- Aussie’s hot CPI report for May has prompted RBA rate-hike bets.
- Investors shift focus to the US core PCE Inflation report for May.
The AUD/USD pair surrenders some of its intraday gains after reaching to near 0.6690 in Wednesday’s European session. The Aussie asset struggles to extend the rally inspired by the hotter-than-expected Australian monthly Consumer Price Index (CPI) data for May.
The data showed that price pressures grew at a robust pace of 4.0% from the estimates of 3.8% and the prior release of 3.6%. As per the inflation report, high prices of fuel, food, electricity and rentals were prompted inflationary pressures.
Stubbornly higher Australian inflation data has kept hopes of more rate hikes by the Reserve Bank of Australia (RBA) on table. Currently, the RBA has been maintaining its Official Cash Rate (OCR) at 4.35% from last eight months.
Meanwhile, the US Dollar (USD) rises to near the crucial resistance of 106.00 as the Federal Reserve (Fed) continues to support the maintenance of the current interest rate framework for a longer period. The US Dollar Index (DXY), which tracks the Greenback’s value against six major currencies, jumps to near the crucial resistance of 106.00. On Tuesday, Fed Governor Michelle Bowman said interest rates need to remain high for some time to bring inflation under control.
Contrary to Fed’s remarks on the interest rate outlook, market participants expect that the Fed will cut interest rates twice this year and will start the policy-normalization process from the September meeting.
On the economic front, investors await the United States (US) core Personal Consumption Expenditure Price Index (PCE) data for May, which will be published on Friday.
EUR/USD is trading close to 1.07 following a soft session for risk sentiment on Tuesday, ING’s analyst Francesco Pesole notes.
Rehn gives a nudge to market doves
“The OAT:Bund 10-year spread continues to hover around 75-80bp, which may well be the level at which it will approach the French election on Sunday. A poll of polls by Bloomberg published yesterday sees a widening of Marine Le Pen National Rally’s lead to over 35% with the leftist New Popular Front alliance stable at 28%.”
“ECB official Olli Rehn sounded relatively dovish in an interview this morning, saying that market pricing for two more rate cuts in 2024 looked ‘reasonable’. While investors aren’t hugely hinging on ECB communication at the current juncture, Rehn’s words were a signal of tolerance towards inflation bumps, which is a euro negative.”
“Still, EUR/USD price action into the weekend will be determined by French election positioning and Friday’s US PCE. We have a bias for a weakening in the pair today and tomorrow back to June’s lows (1.0670), before a rebound on Friday on encouraging PCE figures”.
European Central Bank (ECB) executive board member Fabio Panetta said on Wednesday that the current economic environment in the Eurozone is consistent with a normalization of the monetary stance, per Reuters.
Panetta noted that the ECB will pursue a gradual and smooth normalization, while avoiding even a 'casual forward guidance' on the timing of rate moves.
Market reaction
The Euro struggles to find demand following these comments. At the time of press, EUR/USD was trading at 1.0682, where it was down 0.3% on a daily basis.
- The Japanese Yen softens further, flirting with a break above 160.00.
- With pressure building to the upside in USD/JPY, the risk of a hard correction grows.
- The US Dollar Index pops higher after some hawkish Fed comments.
The Japanese Yen (JPY) weakens again on Wednesday in a near 10-day losing streak that only had one hiccup on the way up. Traders are dipping their toes in the water to see if the Japanese Ministry of Finance is set to intervene in forex markets. Meanwhile, the Bank of Japan is still unclear on when, how and if it will cut its debt-buying program.
Meanwhile, the DXY US Dollar Index – which gauges the value of the US Dollar (USD) against a basket of six foreign currencies – is stronger with the help from the depreciation of the Japanese Yen. The other heavyweight in the basket, the Euro, is not helping either as uncertainty builds up ahead of the French snap elections on Sunday and German consumer confidence deteriorates further. This gives the DXY a boost from outside help even though the Greenback looks overvalued seeing recent economic data.
Daily digest market movers: Empty calendar ahead
- Gareth Berry, the FX and Rates strategist from Macquarie, is expecting the USD/JPY pair to fall to 120.00. This squeeze lower is expected to happen in the next 18 months, Bloomberg reports.
- Head of sales and trading business at Mitsubishi UFJ Trust and Banking Corporation Takafumi Onodera noted that the Japanese authorities will not intervene until Friday’s US Personal Consumption Expenditures (PCE) print. A stronger-than-expected report could spur volatility and send the Yen hurtling toward 163.00 against the US Dollar, spurring officials to make a “rate check” or intervene during a period of thin liquidity. Rate checks warn traders that authorities may be preparing to step in to support the Yen.
- At 11:00 GMT, the Mortgage Bankers Association (MBA) will release the weekly Mortgage Application numbers for the week ending on June 21. Mortgage applications rose by 0.9% the previous week.
- At 14:00 GMT, New Home Sales data for May will come out. Analysts expect sales to increase slightly to 640,000 from April’s 634,000.
- The US Treasury will allot a 5-year Note in the markets at 17:00 GMT.
- The Federal Reserve’s Bank Stress Test report will come out at 20:30 GMT.
- Equities are recovering after Nvidia (NVDA) was able to eke out gains on Tuesday at the US closing bell. The main indices in Asia are all in the green, and even the Dax and the pan-European index, Euro Stoxx 50, are recovering. US futures are rather mixed, with the Dow Jones Industrial futures in the red against Nasdaq futures in the green, and the S&P 500 caught in the middle.
- The CME Fedwatch Tool is broadly backing a rate cut in September despite recent comments from Fed officials. The odds now stand at 57.9% for a 25-basis-point cut. A rate pause stands at a 35.9% chance, while a 50-basis-point rate cut has a slim 6.2% possibility.
- The Overnight indexed Swap curve for Japan shows a 56.6% chance for a rate hike on July 31, and a smaller 49.6% chance for a hike on September 20.
- The US 10-year benchmark rate trades near the weekly high at 4.27%.
- The benchmark 10-year Japan Treasury Note (JGB) trades around 1.023%, breaking above 1% for the first time since June.
USD/JPY Technical Analysis: Everyone looking in the same direction
The USD/JPY pair is flashing red warning lights as price action overheats too much. The best evidence is the Relative Strength Index (RSI), which is close to overbought conditions in the daily chart, while the magic 160.00 level, where Japanese authorities intervened last time, is very near. Do not expect a snap reaction immediately, as authorities will want to see if US data on Thursday and Friday could trigger some easing without sticking their neck out and intervening. At max, 163.00 on the upside could be tested on stronger US data in the coming days, while on the downside, that 151.95 level is again the pivotal support to watch.
Bank of Japan FAQs
The Bank of Japan (BoJ) is the Japanese central bank, which sets monetary policy in the country. Its mandate is to issue banknotes and carry out currency and monetary control to ensure price stability, which means an inflation target of around 2%.
The Bank of Japan has embarked in an ultra-loose monetary policy since 2013 in order to stimulate the economy and fuel inflation amid a low-inflationary environment. The bank’s policy is based on Quantitative and Qualitative Easing (QQE), or printing notes to buy assets such as government or corporate bonds to provide liquidity. In 2016, the bank doubled down on its strategy and further loosened policy by first introducing negative interest rates and then directly controlling the yield of its 10-year government bonds.
The Bank’s massive stimulus has caused the Yen to depreciate against its main currency peers. This process has exacerbated more recently due to an increasing policy divergence between the Bank of Japan and other main central banks, which have opted to increase interest rates sharply to fight decades-high levels of inflation. The BoJ’s policy of holding down rates has led to a widening differential with other currencies, dragging down the value of the Yen.
A weaker Yen and the spike in global energy prices have led to an increase in Japanese inflation, which has exceeded the BoJ’s 2% target. Still, the Bank judges that the sustainable and stable achievement of the 2% target has not yet come in sight, so any sudden change in the current policy looks unlikely.
A short bullish run at the start of this week waned Tuesday and Wednesday overnight. It’s a symptom of the market's caution on risk assets ahead of the French vote on Sunday, ING's FX strategist Francesco Pesole notes.
Stillness is in the air before the weed ends
“Today is a quiet day in markets ahead of the busy latter part of the week, which also includes the first Biden-Trump debate tomorrow. Data releases this week have so far failed to convey any compelling story in US macro.
“Today’s data calendar is light in the US, and there are no scheduled Fed speakers. Yesterday, Michelle Bowman’s call for no cuts in 2024 confirmed her position as the most hawkish member of the Federal Reserve (Fed). Market pricing continues to hover around 45-50bp of easing by year-end.”
“We retain a moderately bullish bias on the US Dollar (USD) for today and tomorrow on the back of this, although the core PCE event on Friday may well prove to be a catalyst for Fed’s dovish repricing and some dollar weakness.”
- The Mexican Peso drifts lower on the eve of the Bank of Mexico policy meeting.
- The overwhelming majority of economists don’t expect the Banxico to cut interest rates.
- USD/MXN forms a bullish two-bar reversal pattern and could correct higher.
The Mexican Peso (MXN) edges lower in its most traded pairs on Wednesday as traders brace for the key event on the radar for the Peso: the Bank of Mexico (Banxico) monetary policy meeting on Thursday.
At the time of writing, one US Dollar (USD) buys 18.16 Mexican Pesos, EUR/MXN is trading at 19.41, and GBP/MXN at 23.01.
Mexican Peso eases ahead of Banxico meeting
The Mexican Peso eases ahead of the Banxico policy meeting on Thursday, although the overwhelming majority of economists expect the central bank to maintain its policy interest rate at its current 11.00% level.
The high interest-rate differential between Mexico and most major economies is advantageous for the Mexican Peso as it attracts greater capital inflows. Deciding not to cut interest rates, therefore, would be considered bullish for the Peso.
According to a Bloomberg survey of economists, 23 of the 25 expect Banxico to hold tight. A recent survey by Mexican lender Citibanamex showed most respondents also expected Banxico to leave rates unchanged at 11.00% at the June meeting – although they did expect a cut in August.
"Banco de Mexico meets Thursday and is expected to keep rates steady at 11.0%,” Dr. Win Thin, Global Head of Markets Strategy at Brown Brothers Harriman (BBH), said in a note on Tuesday. “Recent weakness in MXN is an upside risk to inflation and will keep the bank cautious. The swaps curve has adjusted higher since the May meeting and is pricing in only 75 bp of easing over the next 12 months vs. 125 bp at the start of May,” he added.
Rabobank’s Senior Strategist Christian Lawrence had expected Banxico to cut interest rates by 0.25% at the June meeting. However, he changed his opinion in light of the sharp devaluation of the Mexican Peso since the election, which “has acted as a de facto cut,” says Lawrence.
Economists at Standard Chartered see imported inflation from the post-election depreciation in the Mexican Peso as preventing Banxico from pressing the trigger on rate cuts, supporting the Peso in the process.
“We now expect Banco de México (Banxico) to stay on hold instead of cutting by 25bps at its 27 June meeting, amid sharp currency depreciation driven by elevated political noise and fiscal uncertainty,” says the bank.
Technical Analysis: Two-bar reversal could signal recovery for USD/MXN
USD/MXN forms a two-bar reversal pattern (shaded rectangle in the chart below) which is a fairly reliable indicator of a short-term reversal in the trend.
If Wednesday ends as a green day, it will enhance the signal from the two-bar reversal and suggest a continuation higher, although the distance such a corrective move might go is indeterminate.
USD/MXN Daily Chart
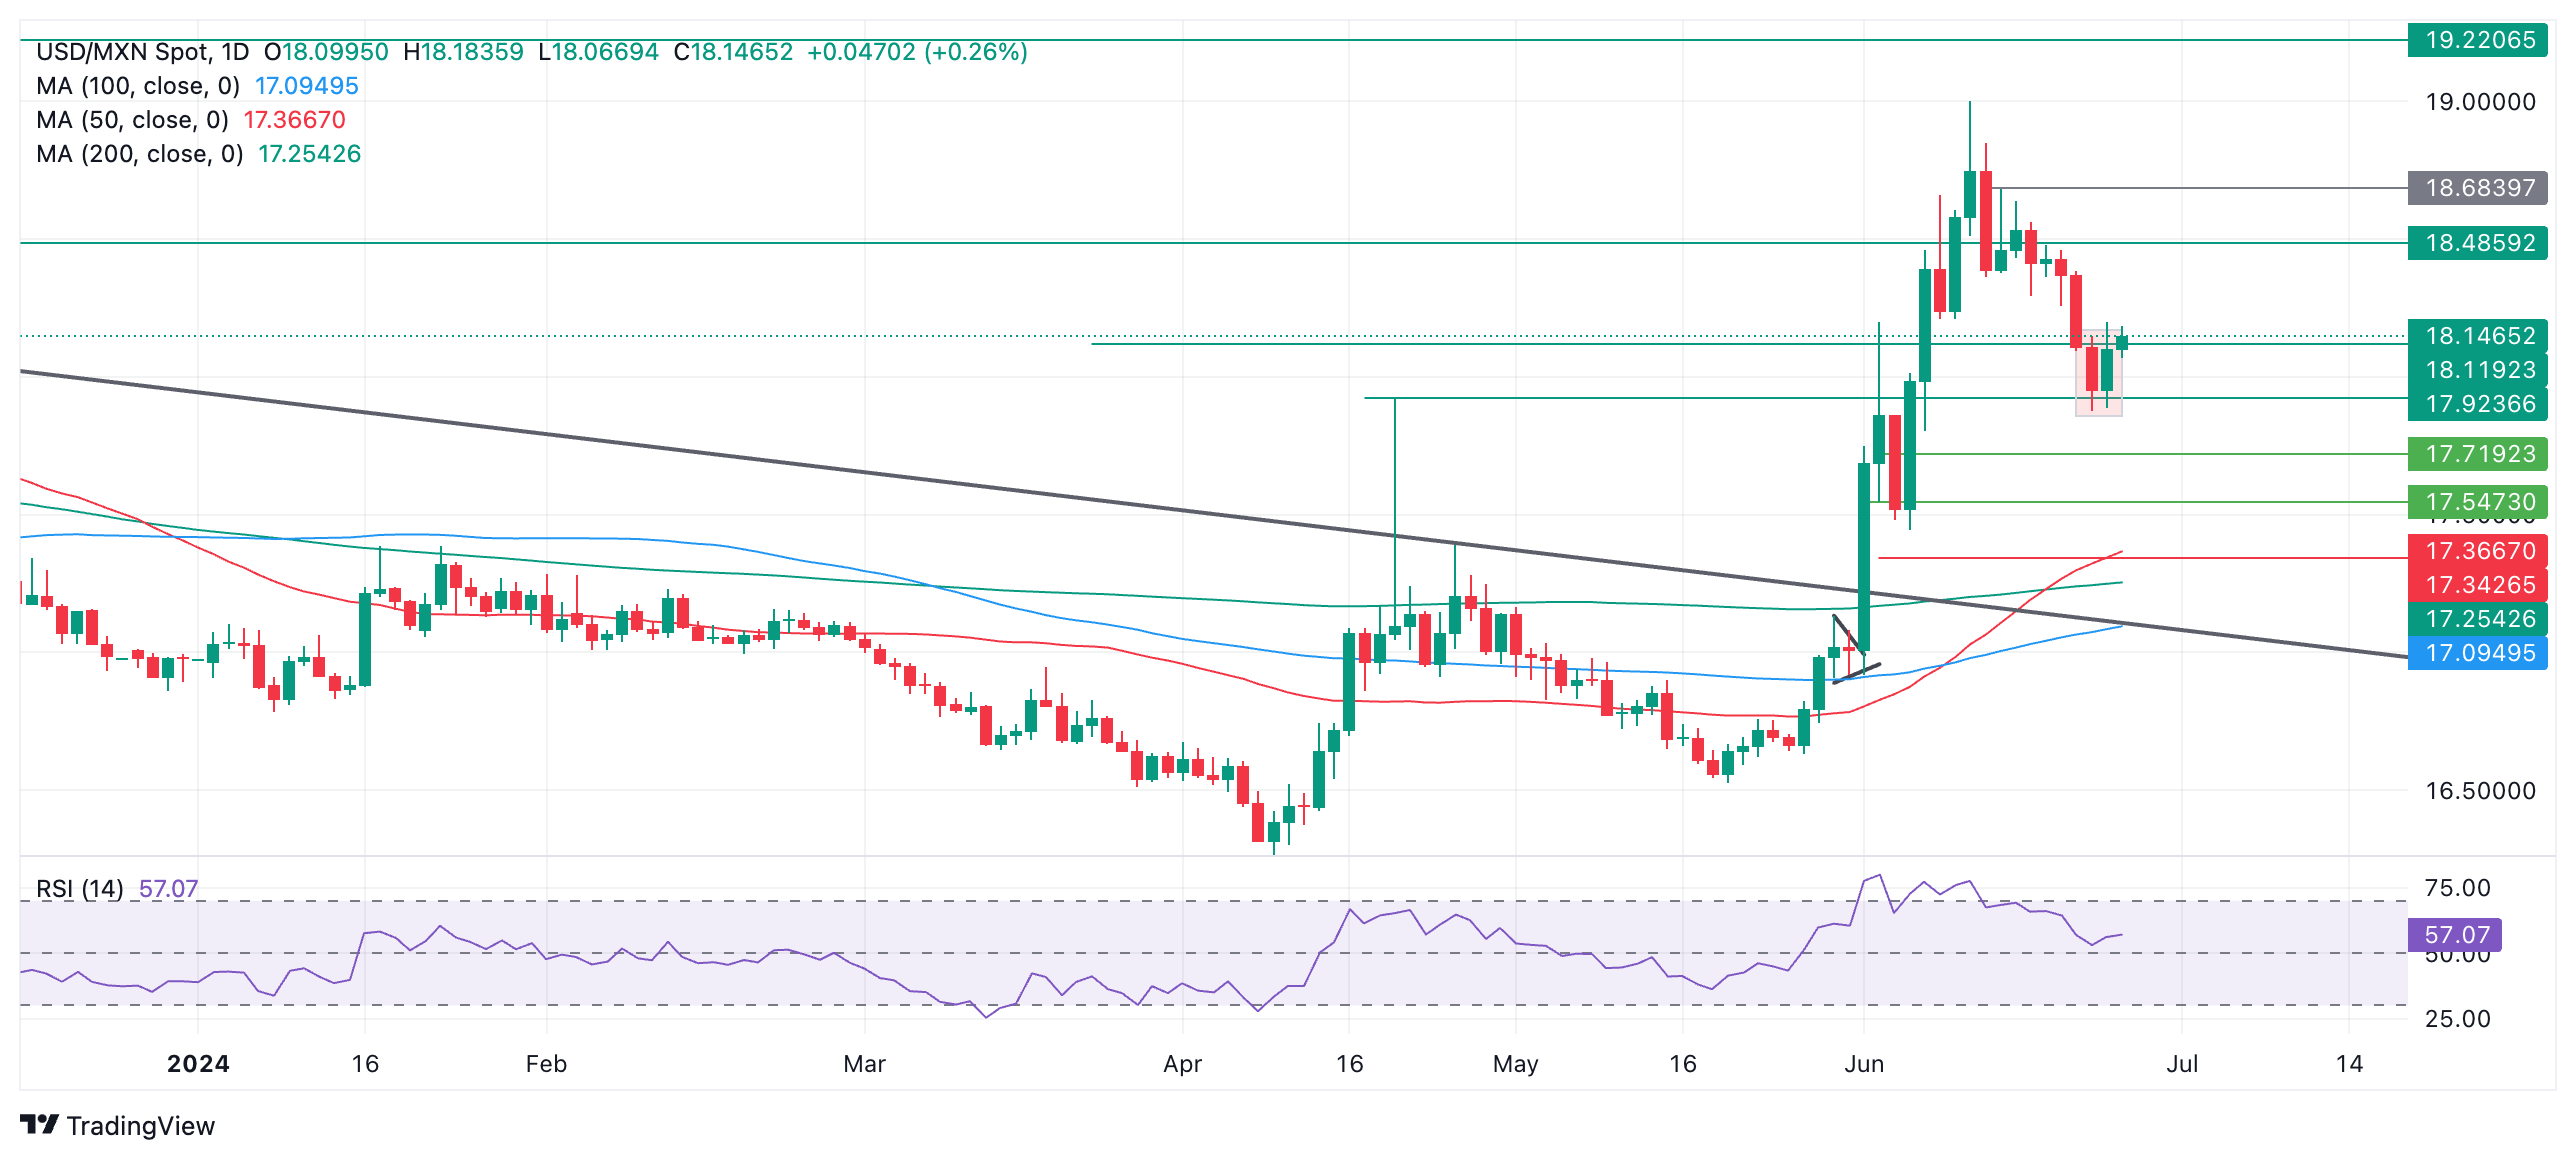
One possible level USD/MXN could rally up to is the June 18 low at 18.30.
At the same time, the short-term trend remains bearish, leaving the pair at risk of a recapitulation lower.
A break below 17.87 (June 24 low) would invalidate the two-bar pattern and probably result in a continuation of the short-term downtrend to a target at 17.71 (a low made in the 4-hour chart on June 4), followed by 17.54 if stronger, the June 4 swing low.
The direction of the long and intermediate-term trends remains in doubt.
Mexican Peso FAQs
The Mexican Peso (MXN) is the most traded currency among its Latin American peers. Its value is broadly determined by the performance of the Mexican economy, the country’s central bank’s policy, the amount of foreign investment in the country and even the levels of remittances sent by Mexicans who live abroad, particularly in the United States. Geopolitical trends can also move MXN: for example, the process of nearshoring – or the decision by some firms to relocate manufacturing capacity and supply chains closer to their home countries – is also seen as a catalyst for the Mexican currency as the country is considered a key manufacturing hub in the American continent. Another catalyst for MXN is Oil prices as Mexico is a key exporter of the commodity.
The main objective of Mexico’s central bank, also known as Banxico, is to maintain inflation at low and stable levels (at or close to its target of 3%, the midpoint in a tolerance band of between 2% and 4%). To this end, the bank sets an appropriate level of interest rates. When inflation is too high, Banxico will attempt to tame it by raising interest rates, making it more expensive for households and businesses to borrow money, thus cooling demand and the overall economy. Higher interest rates are generally positive for the Mexican Peso (MXN) as they lead to higher yields, making the country a more attractive place for investors. On the contrary, lower interest rates tend to weaken MXN.
Macroeconomic data releases are key to assess the state of the economy and can have an impact on the Mexican Peso (MXN) valuation. A strong Mexican economy, based on high economic growth, low unemployment and high confidence is good for MXN. Not only does it attract more foreign investment but it may encourage the Bank of Mexico (Banxico) to increase interest rates, particularly if this strength comes together with elevated inflation. However, if economic data is weak, MXN is likely to depreciate.
As an emerging-market currency, the Mexican Peso (MXN) tends to strive during risk-on periods, or when investors perceive that broader market risks are low and thus are eager to engage with investments that carry a higher risk. Conversely, MXN tends to weaken at times of market turbulence or economic uncertainty as investors tend to sell higher-risk assets and flee to the more-stable safe havens.
The US Dollar (USD) is holding on to Tuesday gains triggered in part by hawkish comments from Federal Reserve (Fed) Governor Michelle Bowman, BBH Global Currency Strategy analysts note.
Fed comments give USD a lift
“Bowman warned ‘we are still not yet at the point where it is appropriate to lower the policy rate’, adding ‘I remain willing to raise the target range for the federal funds rate at a future meeting should progress on inflation stall or even reverse.’”
“Meanwhile, Fed Governor Lisa Cook reminded market participants that ‘with significant progress on inflation and the labor market cooling gradually, at some point it will be appropriate to reduce the level of policy restriction. The timing of any such adjustment will depend on economic data and what they imply.’”
“The cyclical USD uptrend is intact. First, Fed policy continues to diverge with that of most other major central banks. Second, the favourable US macro backdrop justifies an upward reassessment in Fed funds rate expectations. Third, the June composite PMI prints show growth momentum favours the US economy.”
- The Oil price exhibits a sideways move ahead of US oil inventory data.
- US EIA is expected to show a drawdown in oil inventories for the second straight week.
- Investors await the US core PCE inflation for fresh guidance on interest rates.
West Texas Intermediate (WTI) futures on NYMEX trade close to an eight-week high near $82.00 in Wednesday’s European session. The Oil price has remained bullish for almost three weeks on hopes of strong demand due to severe heatwaves in the Northern Hemisphere amid the summer vacation season. The summer season prompts energy demand, which is favorable for the Oil price.
Apart from the improved demand, oil supply disruptions due to Middle East tensions and the Russia-Ukraine war have also kept the Oil price buoyant. Reuters reported, “The Houthis have so far sunk two vessels and seized another, and said on Tuesday they used a missile to hit a vessel in the Arabian Sea.”
In Wednesday’s session, investors will focus on the United States (US) Energy Information Administration (EIA) crude Oil inventories data for the week ending June 21. The report is expected to show that there was a drawdown in Oil stockpiles by three million barrels.
For the broader demand outlook, investors await the US core Personal Consumption Expenditure price index (PCE) data for May, which will be published on Friday. Annually, the underlying inflation data is estimated to have softened to 2.6% from the prior release of 2.8%, with monthly figures growing at a slower pace of 0.1% from 0.2% in April.
Soft inflation numbers would boost expectations of early rate cuts by the Federal Reserve (Fed). This would eventually improve the Oil price’s appeal as lower interest rates prompt liquidity into the economy.
There are several ECB speakers on the agenda today. One speaker, Rehn, has already suggested that two further rate cuts are a reasonable estimate for ECB action this year, Chief Economist at UBS Global Wealth management Paul Donoban notes.
The data calendar is quiet
“The UK’s CBI distributive trades data is a retail sector survey which only three economists can be bothered to forecast. US May new home sales data is more noteworthy, reporting on a sector that is vulnerable to the ever tighter real interest rates of the Federal Reserve (Fed).”
“The French parliamentary debate saw the three political leaders conforming to stereotype on the major issues—markets are unlikely to be moved by this piece of political theater. The increase in the retirement age from 62 to 64 was a contested point (many OECD economies have a retirement age several years higher than 64).”
“The UK leader of the opposition, Starmer, suggested a Labor government would try to reach 2.5% GDP growth. The frequency with which UK data is revised may mean it is years before a true growth rate is uncovered, and efficiency gains from structural change will raise living standards but potentially reduce reported GDP growth.”
Silver prices (XAG/USD) rose on Wednesday, according to FXStreet data. Silver trades at $28.99 per troy ounce, up 0.27% from the $28.91 it cost on Tuesday.
Silver prices have increased by 21.83% since the beginning of the year.
| Unit measure | Silver Price Today in USD |
|---|---|
| Troy Ounce | 28.99 |
| 1 Gram | 0.93 |
The Gold/Silver ratio, which shows the number of ounces of Silver needed to equal the value of one ounce of Gold, stood at 79.91 on Wednesday, down from 80.23 on Tuesday.
Silver FAQs
Silver is a precious metal highly traded among investors. It has been historically used as a store of value and a medium of exchange. Although less popular than Gold, traders may turn to Silver to diversify their investment portfolio, for its intrinsic value or as a potential hedge during high-inflation periods. Investors can buy physical Silver, in coins or in bars, or trade it through vehicles such as Exchange Traded Funds, which track its price on international markets.
Silver prices can move due to a wide range of factors. Geopolitical instability or fears of a deep recession can make Silver price escalate due to its safe-haven status, although to a lesser extent than Gold's. As a yieldless asset, Silver tends to rise with lower interest rates. Its moves also depend on how the US Dollar (USD) behaves as the asset is priced in dollars (XAG/USD). A strong Dollar tends to keep the price of Silver at bay, whereas a weaker Dollar is likely to propel prices up. Other factors such as investment demand, mining supply – Silver is much more abundant than Gold – and recycling rates can also affect prices.
Silver is widely used in industry, particularly in sectors such as electronics or solar energy, as it has one of the highest electric conductivity of all metals – more than Copper and Gold. A surge in demand can increase prices, while a decline tends to lower them. Dynamics in the US, Chinese and Indian economies can also contribute to price swings: for the US and particularly China, their big industrial sectors use Silver in various processes; in India, consumers’ demand for the precious metal for jewellery also plays a key role in setting prices.
Silver prices tend to follow Gold's moves. When Gold prices rise, Silver typically follows suit, as their status as safe-haven assets is similar. The Gold/Silver ratio, which shows the number of ounces of Silver needed to equal the value of one ounce of Gold, may help to determine the relative valuation between both metals. Some investors may consider a high ratio as an indicator that Silver is undervalued, or Gold is overvalued. On the contrary, a low ratio might suggest that Gold is undervalued relative to Silver.
(An automation tool was used in creating this post.)
The July Plenum gives the government a rare opportunity to tackle the lack of confidence by rekindling hopes of growth-friendly reforms, Standard Chartered analysts Shuang Ding and Hunter Chan note.
What to expect from the Third Plenum
"We expect the Plenum to reiterate the Party’s support of private-sector expansion as well as a stronger state sector, and the decisive role of the market in resource allocation."
"In addition, we think they’ll take steps to remove cross-region barriers, encourage innovation and green transition, and improve income distribution."
"We also expect them to attach greater importance to security, addressing risks in the housing and financial sectors and increasing the resilience of the supply chain. The market will likely pay close attention to potential fiscal/tax reforms that are essential for long-term sustainability."
- EUR/USD slips below 1.0700 as the Fed maintains hawkish guidance on interest rates.
- Fed’s Bowman sees no rate cuts this year.
- Investors will focus on the US core PCE and preliminary inflation data for the major economies of the Eurozone this week.
EUR/USD declines below the round-level support of 1.0700 in Wednesday’s European session. The major currency pair remains on the backfoot as the Euro’s near-term outlook weakens amid uncertainty over European Union (EU) legislative elections and growing speculation that the European Central Bank (ECB) could deliver subsequent rate cuts.
Fears over Eurozone elections intensified after French President Emmanuel Macron called for a snap election when his party suffered defeat in preliminary results from Marine Le Pen’s far-right National Rally (RN). The Euro could face more pressure if the shared continent sees a major policy shift.
Meanwhile, expectations for the ECB to deliver back-to-back rate cuts improve as the German economic outlook appears to be worsening due to weak demand prospects. Data showed on Monday that the German IFO Expectations index unexpectedly dropped to 89.0 from the estimates of 91.0 and the former release of 90.3 (downwardly revised from 90.4). On the data release, IFO President Clemens Fuest said, "The German economy is having difficulty overcoming stagnation."
This week, investors will focus on preliminary June inflation data for Spain, France, and Italy, which will be published on Friday.
Daily digest market movers: EUR/USD faces pressure as US Dollar rises
- EUR/USD comes under pressure as an appeal for risk-sensitive assets weakens due to hawkish guidance on interest rates by Federal Reserve (Fed) policymakers, who continue to argue in favor of maintaining the current interest rate framework as they want to see a decline in inflation for months before considering rate cuts. The United States inflation declined more than expected in May, however, officials expect that a one-time decline in price pressures will be insufficient to make rate cuts appropriate.
- On Tuesday, Fed Governor Michelle Bowman delivered hawkish guidance on interest rates. Bowman said they are not at a point where rate cuts become appropriate. She pushed back expectations of rate cuts to 2025 and warned of more hikes if disinflation appears to stall or reverse.
- Contrary to the Fed’s hawkish outlook on interest rates, investors expect two rate cuts this year, and the policy-easing process will begin in the September meeting. For more cues on the interest rate outlook, investors await the core Personal Consumption Expenditures Price Index (PCE) data for May, which will be published on Friday.
- According to the estimates, the PCE inflation report will show that price pressures grew at a slower pace of 0.1% month-on-month from the prior release of 0.2%. Annually, the underlying inflation is expected to rise modestly by 2.6% from 2.8% in April. Soft inflation data would boost expectations of the Fed reducing interest rates in September, while hotter-than-expected figures would weaken them.
Technical Analysis: EUR/USD establishes below 50-day EMA
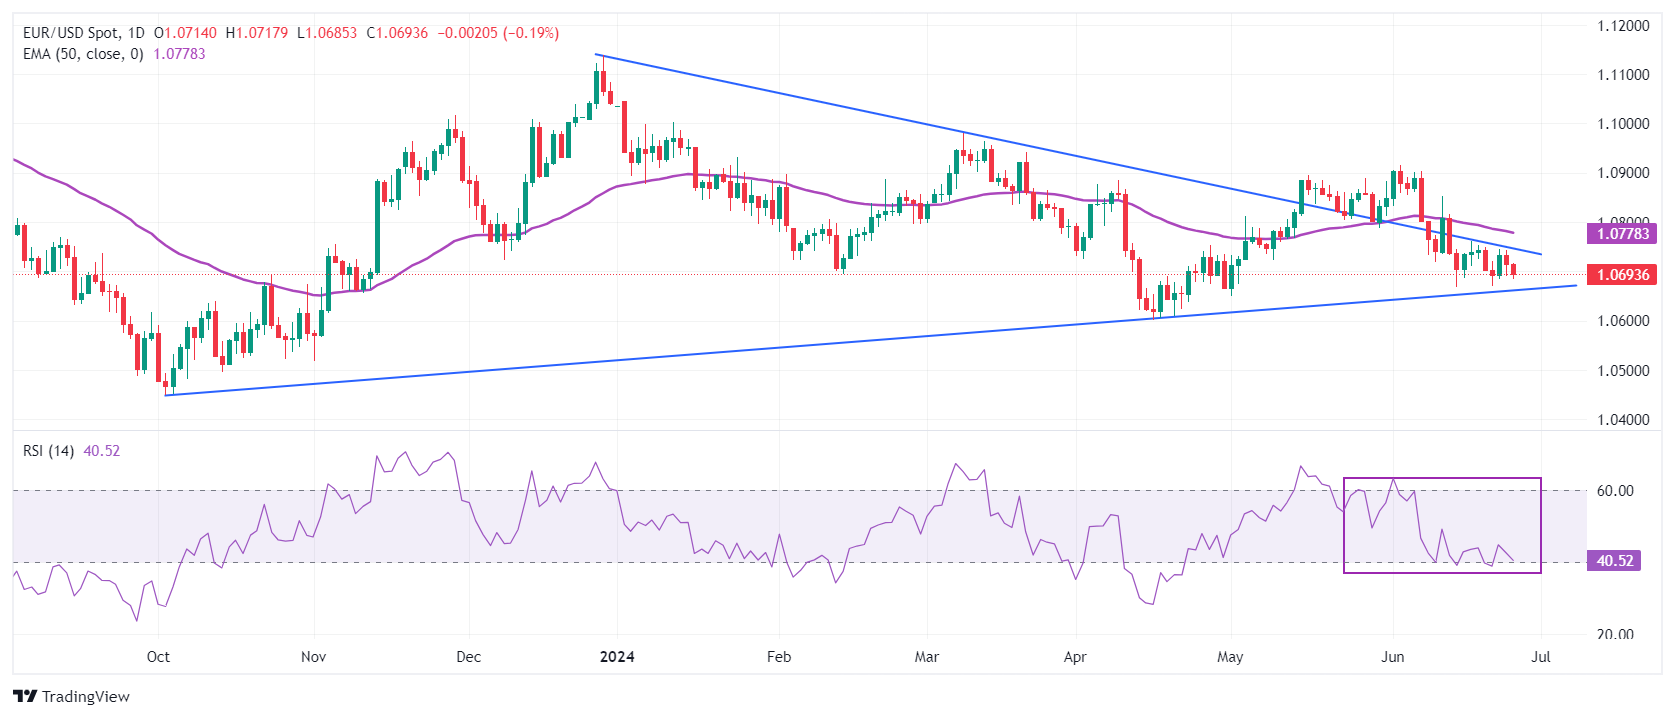
EUR/USD falls slightly below the crucial support of 1.0700. The major currency pair faces selling pressure near the downward-sloping border of a Symmetrical Triangle in the daily chart near 1.0750, which is plotted from 28 December 2023 high around 1.1140. The pair trades below the 50-day Exponential Moving Average (EMA), which indicates that the short-term outlook is bearish.
The 14-period Relative Strength Index (RSI) hovers near 40.00. A bearish momentum would trigger if the oscillator slips below this level.
Euro FAQs
The Euro is the currency for the 20 European Union countries that belong to the Eurozone. It is the second most heavily traded currency in the world behind the US Dollar. In 2022, it accounted for 31% of all foreign exchange transactions, with an average daily turnover of over $2.2 trillion a day. EUR/USD is the most heavily traded currency pair in the world, accounting for an estimated 30% off all transactions, followed by EUR/JPY (4%), EUR/GBP (3%) and EUR/AUD (2%).
The European Central Bank (ECB) in Frankfurt, Germany, is the reserve bank for the Eurozone. The ECB sets interest rates and manages monetary policy. The ECB’s primary mandate is to maintain price stability, which means either controlling inflation or stimulating growth. Its primary tool is the raising or lowering of interest rates. Relatively high interest rates – or the expectation of higher rates – will usually benefit the Euro and vice versa. The ECB Governing Council makes monetary policy decisions at meetings held eight times a year. Decisions are made by heads of the Eurozone national banks and six permanent members, including the President of the ECB, Christine Lagarde.
Eurozone inflation data, measured by the Harmonized Index of Consumer Prices (HICP), is an important econometric for the Euro. If inflation rises more than expected, especially if above the ECB’s 2% target, it obliges the ECB to raise interest rates to bring it back under control. Relatively high interest rates compared to its counterparts will usually benefit the Euro, as it makes the region more attractive as a place for global investors to park their money.
Data releases gauge the health of the economy and can impact on the Euro. Indicators such as GDP, Manufacturing and Services PMIs, employment, and consumer sentiment surveys can all influence the direction of the single currency. A strong economy is good for the Euro. Not only does it attract more foreign investment but it may encourage the ECB to put up interest rates, which will directly strengthen the Euro. Otherwise, if economic data is weak, the Euro is likely to fall. Economic data for the four largest economies in the euro area (Germany, France, Italy and Spain) are especially significant, as they account for 75% of the Eurozone’s economy.
Another significant data release for the Euro is the Trade Balance. This indicator measures the difference between what a country earns from its exports and what it spends on imports over a given period. If a country produces highly sought after exports then its currency will gain in value purely from the extra demand created from foreign buyers seeking to purchase these goods. Therefore, a positive net Trade Balance strengthens a currency and vice versa for a negative balance.
The US Dollar (USD) is likely to edge higher. Any advance is unlikely to reach the major resistance at 7.3000 and 7.3100, UOB Group analysts note.
Below 7.2700 USD to turn lower
24-HOUR VIEW: “We noted yesterday that ‘the price movements still appear to be part of a sideways trading phase.’ We expected USD to trade in a range of 7.2750/7.2910. USD then traded in a slightly narrower range between 7.2763 and 7.2907. Despite the quiet price action, there has been a slight increase in momentum. Today, USD is likely to edge higher, but any advance is unlikely to reach the major resistance at 7.3000. Note that there is another resistance level at 7.2945. Support levels are at 7.2830 and 7.2780.”
1-3 WEEKS VIEW: “We have expected USD to strengthen since early last week. In our latest update from last Friday (21 Jun, spot at 7.2920), we indicated that ‘further USD strength is likely, and the resistance levels to watch are 7.3000 and 7.3100.’ While USD has not been able to make any further headway on the upside, we continue to hold the same view for now. However, if USD breaks below 7.2700 (no change in ‘strong support’ level), it would mean that USD is not strengthening further.”
- Gold weakens after several Federal Reserve officials voice their reluctance to cut interest rates yet.
- The market continues to see a high probability of a cut in September, however.
- XAU/USD pulls back after a break higher invalidates orthodox H&S pattern.
Gold (XAU/USD) edges lower into the $2,310s on Wednesday as investors mull comments from Federal Reserve (Fed) officials, who continue to appear reluctant to cut interest rates amid stubbornly high inflation. The expectation that interest rates will remain elevated is negative for Gold as it keeps the opportunity cost of holding the non-coupon-yielding asset high.
Gold steadily declines on hawkish Fedspeak
Gold ticks marginally lower on Wednesday following an over-half a percent decline on the previous day. Several Fed officials came up to the speakers’ stand one after another and said they think it is still too early to cut interest rates.
Fed Governor Lisa Cook said that “at some point, it will be appropriate to cut rates,” but added that maintaining them at their current level was the right strategy at the moment “to respond to the economic outlook.”
Fed Governor Michelle Bowman said on Tuesday that it was not yet appropriate to cut interest rates. Inflation data would have to be moving more sustainably towards the Fed’s 2.0% target before it was time to “gradually lower policy rate." At the same time, she added that baseline estimates indicated that inflation was on its way down toward the target as long as the Fed keeps policy as it is “for some time."
On Monday, San Francisco Fed President Mary Daly said she did not believe the Fed should cut rates before it was more confident that inflation was headed towards 2.0%. Yet she also cautioned not to focus too heavily on inflation to the detriment of the labor market. If unemployment continued to rise the Fed might have to cut rates to support businesses and maintain employment, according to Reuters.
The market-based probabilities of an interest-rate cut at (or before) the Fed’s September meeting have nudged lower overnight from 67% to 66%, according to the CME FedWatch tool, which calculates chances using Fed Funds futures prices. Such a cut would be a bullish event for Gold.
Of key interest to Gold traders will be the US Personal Consumption Expenditures (PCE) Price Index for May out on Friday, the Federal Reserve’s (Fed) preferred inflation gauge. A lower-than-expected result would increase the chances of the Fed going ahead with an early rate cut and support Gold price. The opposite would be the case if inflation rises.
Technical Analysis: Gold creeps lower towards key support
Gold creeps lower towards key support and the neckline of a possible topping pattern at $2,279 – a break below that would signal a strong down move.
XAU/USD Daily Chart
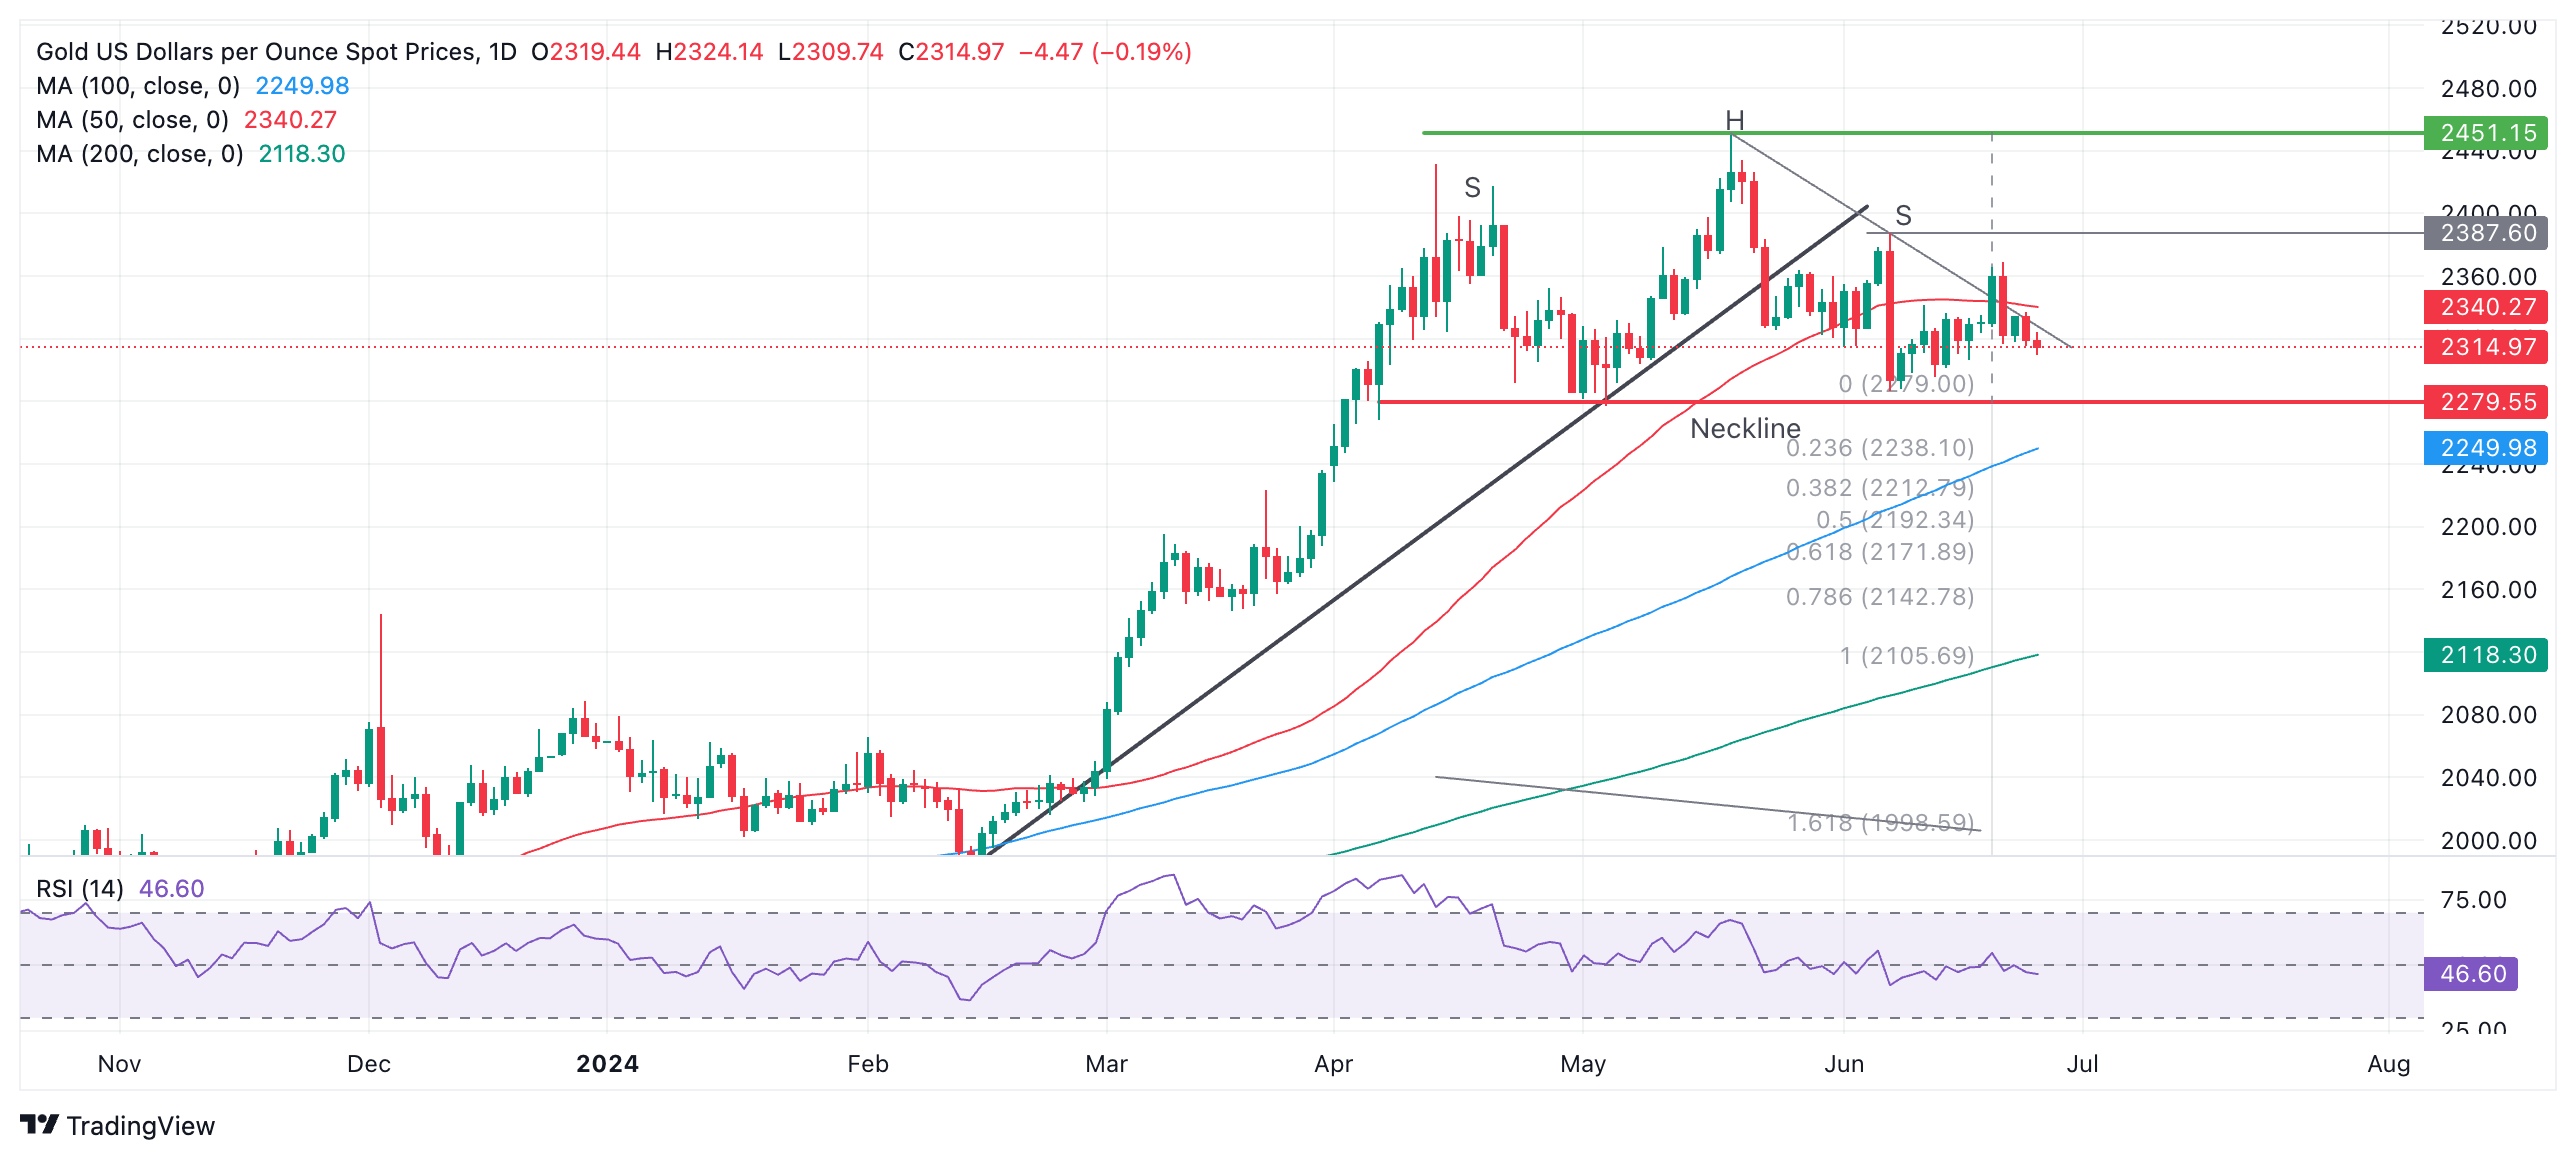
The XAU/USD pair has been forming a bearish Head-and-Shoulders (H&S) pattern over the last three months. However, the upside break on June 20 has brought the validity of the pattern into doubt. That said, a more complex topping pattern that might still prove bearish is still possible.
If so, then a break below the pattern’s neckline at $2,279 would provide confirmation of a reversal lower, with a conservative target at $2,171, and a second target at $2,105.
At the same time, it is also still possible that Gold could find its feet and continue higher. Gold’s original break above the trendline and the 50-day SMA was supposed to reach an initial, conservative target in the mid $2,380s (June 7 high), and it is still possible it could reach that target despite the fallback.
However, it would require a break above $2,350 to confirm a move up to the June 7 high. A further break above that might indicate a continuation up to the May – and all-time – high at $2,450.
A break above that would confirm a resumption of the broader uptrend.
There is a risk that the trend is now sideways in both the short and medium term. In the long term, Gold remains in an uptrend.
Economic Indicator
Personal Consumption Expenditures - Price Index (MoM)
The Personal Consumption Expenditures (PCE), released by the US Bureau of Economic Analysis on a monthly basis, measures the changes in the prices of goods and services purchased by consumers in the United States (US).. The MoM figure compares prices in the reference month to the previous month. Price changes may cause consumers to switch from buying one good to another and the PCE Deflator can account for such substitutions. This makes it the preferred measure of inflation for the Federal Reserve. Generally speaking, a high reading is bullish for the US Dollar (USD), while a low reading is bearish.
Read more.Next release: Fri Jun 28, 2024 12:30
Frequency: Monthly
Consensus: 0%
Previous: 0.3%
Source: US Bureau of Economic Analysis
The US Dollar (USD) is likely to trade sideways between 159.20 and 159.90. It could break above 160.00 but there is another resistance level at 160.25, UOB Group FX strategists suggest.
A potential jump to 160.25 is on the cards
24-HOUR VIEW: “We expected USD to trade sideways between 159.35 and 159.95 yesterday. USD subsequently traded in a range of 159.18/159.78, closing largely unchanged at 159.69 (+0.06%). The price movements still appear to be part of a sideways trading phase. Today, we expect USD to trade between 159.20 and 159.90.”
1-3 WEEKS VIEW: “We have held a positive view in USD since early last week. In our latest narrative from two days ago (24 Jun, spot at 159.85), we indicated that while USD could break above 160.00, it is worth noting that there is another resistance level at 160.25. We continue to hold the same view. On the downside, should USD break below 158.80 (no change in ‘strong support’ level), it would indicate that the USD strength has eased.”
The New Zealand Dollar (NZD) is likely to trade in a sideways range of 0.6100/0.6140, and if it breaks lower, NZD is likely to drift lower towards 0.6085, UOB Group analysts note.
A break below 0.6100/0.6140 to target 0.6085
24-HOUR VIEW: “NZD traded between 0.6108 and 0.6130 yesterday, narrower than our expected sideways trading range of 0.6100/0.6140. The quiet price action provides no fresh clues. We continue to expect NZD to trade in a sideways range of 0.6100/0.6140.”
1-3 WEEKS VIEW: “Our most recent narrative was from last Tuesday (18 Jun, spot at 0.6130), wherein 'as long as NZD remains below 0.6180, it could drift lower towards the support at 0.6085.' While NZD has not been able to make any further headway on the downside, we continue to hold the same view. Overall, only a breach of 0.6160 (‘strong resistance’ level has moved lower from 0.6180) would indicate that the current mild downward pressure has faded.”
For the time being, Australian Dollar (AUD) is likely to trade between 0.6600 and 0.6685, UOB Group strategists note.
A breach of 0.6685 is possible
24-HOUR VIEW: “AUD dipped to 0.6627 two days ago and then recovered to a high of 0.6668. Yesterday, we pointed out that ‘the recovery did not result in any clear increase of momentum.’ We added, “Instead of continuing to recover, AUD is more likely to consolidate between 0.6635 and 0.6675.’ Our view was not wrong, as AUD subsequently traded in a range of 0.6636/0.6673, closing slightly lower at 0.6648 (-0.13%). While we continue to expect AUD to trade in a range, the softened underlying tone suggests a lower range of 0.6625/0.6665.”
1-3 WEEKS VIEW: “Our update from two days ago (24 Jun, spot at 0.6640) is still valid. As indicated, the current price action is likely part of a range-trading phase. For the time being, AUD is likely to trade between 0.6600 and 0.6685.”
- USD/CHF appreciates as the Fed may delay rate cuts to bring inflation under control.
- CME FedWatch Tool indicates a decrease to 67.7% odds of a Fed rate cut in September, down from 68.5% the previous day.
- The Swiss Franc may limit its downside as political and geopolitical uncertainty has driven safe-haven flows.
USD/CHF continues to gain ground for the second consecutive day, trading around 0.8960 during the early European session on Wednesday. This upside could be attributed to the higher US Dollar (USD) due to heightened expectations of delaying interest rate cuts by the Federal Reserve (Fed). According to the CME FedWatch Tool, investors are pricing in 67.7% odds of a Fed rate cut in September, compared to 68.5% a day earlier.
Reuters cited Fed Governor Michelle Bowman repeating her view on Tuesday that holding the policy rate steady for some time will likely be enough to bring inflation under control. Meanwhile, Fed Governor Lisa Cook said it would be appropriate to cut interest rates "at some point" given significant progress on inflation and a gradual cooling of the labor market, though she remained vague about the timing of the easing.
The Greenback also receives support due to the potential risk aversion, which could be attributed to the investors’ caution ahead of the key US economic data releases later this week. The revised US Gross Domestic Product (GDP) for the first quarter (Q1) is scheduled to be released on Thursday, followed by the Personal Consumption Expenditure (PCE) Price Index on Friday.
On the Swiss side, the Swiss Franc (CHF) may find support as political uncertainty in France and the rise of far-right parties in European Parliament elections have driven safe-haven flows. The yield on the 10-year Swiss government bond has declined to 0.56%, the lowest level since August 2022.
Moreover, ongoing geopolitical tensions in the Middle East and Ukraine could further fuel the flight to safety, benefiting the safe-haven CHF. Israeli Prime Minister Benjamin Netanyahu has stated that the most intense phase of the attack against Hamas in Gaza is nearing its end, according to CNN. Meanwhile, Russia has condemned the US for a "barbaric" strike in Crimea, which utilized US-provided missiles, resulting in the deaths of at least four people, including children, and injuring 151 others.
The Pound Sterling (GBP) is likely to trade in a range of 1.2650/1.2700. Slowdown in momentum suggests a slim chance of GBP weakening to 1.2600.
A breach of 1.2705 to signal GBP is stabilised
24-HOUR VIEW: “On Monday, GBP rebounded to a high of 1.2698. Yesterday (Tuesday), we indicated that ‘the robust rebound appears to be overextended, and instead of rising further, GBP is more likely to trade in a range today, probably between 1.2650 and 1.2705.’ Our view of rangetrading was not wrong, even though GBP traded in a narrower range of 1.2670/1.2702. GBP closed largely unchanged at 1.2686 (+0.01%). Further range-trading seems likely today, probably in a range of 1.2650/1.2700.”
1-3 WEEKS VIEW: “We have held a negative view in GBP since early last week. After GBP rebounded two days ago, we highlighted yesterday (25 Jun, spot at 1.2680) that ‘the slowdown in momentum suggests a slim chance of GBP weakening to 1.2600.’ We continue to hold the same view. Overall, only a breach of 1.2705 (no change in ‘strong resistance’ level) would indicate that the weakness in GBP has stabilised.”
- The Pound Sterling trades sideways against the US Dollar as investors shift focus to the US core PCE inflation data for May.
- UK’s high wage inflation refrains BoE policymakers from committing to interest rate cuts.
- Uncertainty over the UK’s parliamentary elections will keep the Pound Sterling on tenterhooks.
The Pound Sterling (GBP) exhibits a lackluster performance against the US Dollar (USD) in Wednesday’s London session. The recovery move in the GBP/USD pair from the more than five-week low of 1.2620 appears to have stalled near the round-level resistance of 1.2700. Investors shift focus towards the United States (US) core Personal Consumption Expenditures Price Index (PCE) data for May, which will be published on Friday.
Investors will pay close attention to the US core PCE inflation data as it is the Federal Reserve’s (Fed) preferred inflation gauge. This data will provide fresh cues about when and how far interest rates will be reduced this year. Annually, the underlying inflation data is estimated to have softened to 2.6% in May from the prior release of 2.8%, with monthly figures growing at a slower pace of 0.1% from 0.2% in April.
Currently, investors expect the Fed to kickstart its rate-cutting cycle at the September meeting and extend it further in November or December.
On the contrary, Fed policymakers continue to advocate maintaining interest rates at their current levels for longer until they get evidence that inflation will return to the desired rate of 2%. Fed officials want to see inflation declining for months to gain confidence in rate cuts and, therefore, delivering a hawkish guidance.
On Tuesday, Fed Governor Michelle Bowman supported the continuation of the current policy framework for some time to tame price pressures. She kept hopes of more rate hikes on the table if disinflation stalls or reverses. When asked about timing for rate cuts, Bowman said she doesn’t see any this year.
Daily digest market movers: Pound Sterling weakens against Australian Dollar
- The Pound Sterling performs strongly against a majority of its peers as fears of policy divergence have intensified due to strong wage growth in the United Kingdom. However, the Pound weakens against the Australian Dollar after Australia’s monthly Consumer Price Index (CPI) rose strongly by 4.0% from expectations of 3.8% and the prior release of 3.6%, which weighed on expectations of more rate cuts by the Reserve Bank of Australia (RBA).
- Unlike the Swiss National Bank (SNB), the Bank of Canada (BoC), and the European Central Bank (ECB), which have begun their policy-easing cycle, the Bank of England (BoE) has not committed to rate cuts in the near term.
- The UK’s high wage growth keeps inflation persistent in the service sector, making interest rate cuts inappropriate in the current situation. Although headline inflation has returned to the desired rate of 2%, officials see service inflation as a preferred measure for decision-making on interest rates and want it to decline for months to gain confidence in lowering borrowing rates.
- Currently, investors expect that the BoE will start reducing interest rates from the August meeting. Meanwhile, political uncertainty in the UK economy is expected to keep the Pound Sterling on its toes. Market participants expect that the opposition Labour Party has the upper hand in parliamentary elections on the Conservative Party. The first round of UK parliamentary elections will commence on July 4.
Pound Sterling Price Today:
British Pound PRICE Today
The table below shows the percentage change of British Pound (GBP) against listed major currencies today. British Pound was the strongest against the Euro.
| USD | EUR | GBP | JPY | CAD | AUD | NZD | CHF | |
|---|---|---|---|---|---|---|---|---|
| USD | 0.21% | 0.12% | 0.13% | 0.08% | -0.42% | 0.15% | 0.16% | |
| EUR | -0.21% | -0.10% | -0.12% | -0.17% | -0.62% | -0.05% | -0.07% | |
| GBP | -0.12% | 0.10% | 0.00% | -0.05% | -0.52% | 0.07% | 0.05% | |
| JPY | -0.13% | 0.12% | 0.00% | -0.04% | -0.54% | 0.06% | 0.05% | |
| CAD | -0.08% | 0.17% | 0.05% | 0.04% | -0.53% | 0.09% | 0.08% | |
| AUD | 0.42% | 0.62% | 0.52% | 0.54% | 0.53% | 0.57% | 0.57% | |
| NZD | -0.15% | 0.05% | -0.07% | -0.06% | -0.09% | -0.57% | 0.00% | |
| CHF | -0.16% | 0.07% | -0.05% | -0.05% | -0.08% | -0.57% | -0.00% |
The heat map shows percentage changes of major currencies against each other. The base currency is picked from the left column, while the quote currency is picked from the top row. For example, if you pick the British Pound from the left column and move along the horizontal line to the US Dollar, the percentage change displayed in the box will represent GBP (base)/USD (quote).
Technical Analysis: Pound Sterling faces resistance near 1.2700
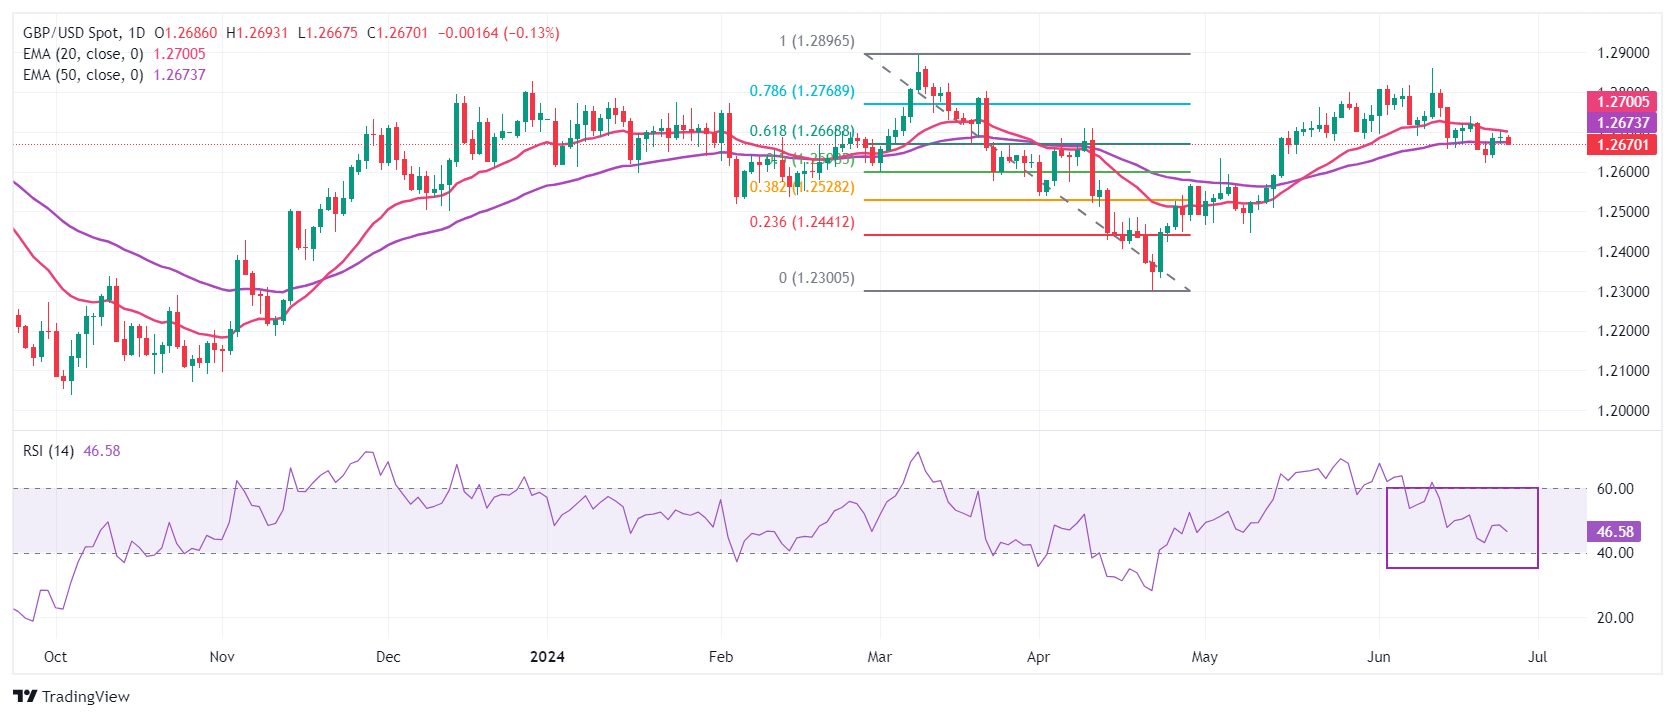
The Pound Sterling faces pressure near 1.2700 against the US Dollar. The GBP/USD pair continues to find sellers near the 20-day Exponential Moving Average (EMA), which trades around 1.2700. Meanwhile, the 50-day EMA is acting as support at around 1.2670.
The Cable trades above the 61.8% Fibonacci retracement support at 1.2667, plotted from the March 8 high of 1.2900 to the April 22 low at 1.2300.
The 14-day Relative Strength Index (RSI) oscillates inside the 40.00-60.00 range, indicating a consolidation ahead.
Pound Sterling FAQs
The Pound Sterling (GBP) is the oldest currency in the world (886 AD) and the official currency of the United Kingdom. It is the fourth most traded unit for foreign exchange (FX) in the world, accounting for 12% of all transactions, averaging $630 billion a day, according to 2022 data. Its key trading pairs are GBP/USD, aka ‘Cable’, which accounts for 11% of FX, GBP/JPY, or the ‘Dragon’ as it is known by traders (3%), and EUR/GBP (2%). The Pound Sterling is issued by the Bank of England (BoE).
The single most important factor influencing the value of the Pound Sterling is monetary policy decided by the Bank of England. The BoE bases its decisions on whether it has achieved its primary goal of “price stability” – a steady inflation rate of around 2%. Its primary tool for achieving this is the adjustment of interest rates. When inflation is too high, the BoE will try to rein it in by raising interest rates, making it more expensive for people and businesses to access credit. This is generally positive for GBP, as higher interest rates make the UK a more attractive place for global investors to park their money. When inflation falls too low it is a sign economic growth is slowing. In this scenario, the BoE will consider lowering interest rates to cheapen credit so businesses will borrow more to invest in growth-generating projects.
Data releases gauge the health of the economy and can impact the value of the Pound Sterling. Indicators such as GDP, Manufacturing and Services PMIs, and employment can all influence the direction of the GBP. A strong economy is good for Sterling. Not only does it attract more foreign investment but it may encourage the BoE to put up interest rates, which will directly strengthen GBP. Otherwise, if economic data is weak, the Pound Sterling is likely to fall.
Another significant data release for the Pound Sterling is the Trade Balance. This indicator measures the difference between what a country earns from its exports and what it spends on imports over a given period. If a country produces highly sought-after exports, its currency will benefit purely from the extra demand created from foreign buyers seeking to purchase these goods. Therefore, a positive net Trade Balance strengthens a currency and vice versa for a negative balance.
The Euro (EUR) could dip below the 1.0689 low. The major support at 1.0670 is unlikely to come under threat. EUR has likely entered a consolidation phase. For the time being, it is likely to trade between 1.0670 and 1.0800, UOB Group analysts note.
The pair is rangebound between 1.0670 and 1.0800
24-HOUR VIEW: “We indicated yesterday that ‘there is room for EUR to rise to 1.0760 before levelling off is likely.’ Our view was incorrect, as EUR fell briefly to a low of 1.0689 before rebounding to close at 1.0713 (-0.18%). The price action has resulted in a slight increase in downward momentum, and EUR could dip below the 1.0689 low today. The major support at 1.0670 is unlikely to come under threat. Resistance is at 1.0730, followed by 1.0745.”
1-3 WEEKS VIEW: “After EUR rebounded strongly two days ago, we highlighted yesterday (25 Jun, spot at 1.0730) that EUR ‘has likely entered a consolidation phase.’ We also highlighted that ‘for the time being, it is likely to trade between 1.0670 and 1.0800.’ We continue to hold the same view.”
Here is what you need to know on Wednesday, June 26:
Major currency pairs continue to fluctuate in familiar ranges as market participants refrain from taking large positions in the absence of fundamental drivers. The US economic calendar will feature New Home Sales data for May on Wednesday. Later in the American session, the US Treasury will hold a 5-year note auction.
The US Dollar (USD) Index, which gauges the USD's valuation against a basket of six major currencies, registered small gains on Tuesday as the mixed action in Wall Street continued. The Dow Jones Industrial Average lost 0.76% on the day, while the Nasdaq Composite gained more than 1%. Early Wednesday, the USD Index clings to modest gains above 105.50 and US stock index futures trade marginally higher.
US Dollar PRICE This week
The table below shows the percentage change of US Dollar (USD) against listed major currencies this week. US Dollar was the strongest against the Swiss Franc.
| USD | EUR | GBP | JPY | CAD | AUD | NZD | CHF | |
|---|---|---|---|---|---|---|---|---|
| USD | 0.04% | -0.19% | 0.08% | -0.19% | -0.51% | 0.14% | 0.28% | |
| EUR | -0.04% | -0.22% | 0.09% | -0.19% | -0.53% | 0.14% | 0.31% | |
| GBP | 0.19% | 0.22% | 0.24% | 0.03% | -0.32% | 0.33% | 0.53% | |
| JPY | -0.08% | -0.09% | -0.24% | -0.27% | -0.56% | 0.14% | 0.20% | |
| CAD | 0.19% | 0.19% | -0.03% | 0.27% | -0.31% | 0.32% | 0.51% | |
| AUD | 0.51% | 0.53% | 0.32% | 0.56% | 0.31% | 0.67% | 0.85% | |
| NZD | -0.14% | -0.14% | -0.33% | -0.14% | -0.32% | -0.67% | 0.17% | |
| CHF | -0.28% | -0.31% | -0.53% | -0.20% | -0.51% | -0.85% | -0.17% |
The heat map shows percentage changes of major currencies against each other. The base currency is picked from the left column, while the quote currency is picked from the top row. For example, if you pick the US Dollar from the left column and move along the horizontal line to the Japanese Yen, the percentage change displayed in the box will represent USD (base)/JPY (quote).
The data from Australia showed earlier in the day that the Consumer Price Index (CPI) rose 4% on a yearly basis in May. This reading followed the 3.6% increase recorded in April and came in above the market expectation of 3.8%. AUD/USD gathered bullish momentum after this data and climbed to its highest level in two weeks near 0.6700.
Statistics Canada reported on Wednesday that the annual CPI rose 2.9% in May, surpassing analysts' estimate for an increase of 2.6%. After falling toward 1.3600 with the immediate reaction to the hot inflation data, USD/CAD staged a rebound and was last seen moving up and down in a tight channel slightly above 1.3650.
GfK Consumer Confidence edged lower to -21.8 in Germany in July from -21.0. EUR/USD stays under modest pressure and trades below 1.0700 in the European morning on Wednesday.
Following Monday's rebound, GBP/USD struggled to preserve its bullish momentum and closed flat on Tuesday. The pair stays on the back foot and trades below 1.2700 early Wednesday.
After ending the day virtually unchanged on Tuesday, USD/JPY advances toward 160.00 in the early European session on Wednesday. In the early trading hours of the Asian session on Tuesday, May Retail Trade data from Japan will be looked upon for fresh impetus.
Gold turned south and closed near $2,320 on Tuesday, erasing all of Monday's gains in the process. XAU/USD struggles to gain traction early Wednesday and fluctuates at around $2,315.
Risk sentiment FAQs
In the world of financial jargon the two widely used terms “risk-on” and “risk off'' refer to the level of risk that investors are willing to stomach during the period referenced. In a “risk-on” market, investors are optimistic about the future and more willing to buy risky assets. In a “risk-off” market investors start to ‘play it safe’ because they are worried about the future, and therefore buy less risky assets that are more certain of bringing a return, even if it is relatively modest.
Typically, during periods of “risk-on”, stock markets will rise, most commodities – except Gold – will also gain in value, since they benefit from a positive growth outlook. The currencies of nations that are heavy commodity exporters strengthen because of increased demand, and Cryptocurrencies rise. In a “risk-off” market, Bonds go up – especially major government Bonds – Gold shines, and safe-haven currencies such as the Japanese Yen, Swiss Franc and US Dollar all benefit.
The Australian Dollar (AUD), the Canadian Dollar (CAD), the New Zealand Dollar (NZD) and minor FX like the Ruble (RUB) and the South African Rand (ZAR), all tend to rise in markets that are “risk-on”. This is because the economies of these currencies are heavily reliant on commodity exports for growth, and commodities tend to rise in price during risk-on periods. This is because investors foresee greater demand for raw materials in the future due to heightened economic activity.
The major currencies that tend to rise during periods of “risk-off” are the US Dollar (USD), the Japanese Yen (JPY) and the Swiss Franc (CHF). The US Dollar, because it is the world’s reserve currency, and because in times of crisis investors buy US government debt, which is seen as safe because the largest economy in the world is unlikely to default. The Yen, from increased demand for Japanese government bonds, because a high proportion are held by domestic investors who are unlikely to dump them – even in a crisis. The Swiss Franc, because strict Swiss banking laws offer investors enhanced capital protection.
FX option expiries for June 26 NY cut at 10:00 Eastern Time, via DTCC, can be found below
- EUR/USD: EUR amounts
- 1.0600 1.4b
- 1.0635 1.8b
- 1.0700 2.4b
- 1.0725 928m
- 1.0750 2b
- 1.0800 526m
- 1.0820 853m
- 1.0845 907m
- GBP/USD: GBP amounts
- 1.2650 458m
- 1.2705 501m
- 1.2720 516m
- USD/CHF: USD amounts
- 0.8850 500m
- 0.8900 901m
- 0.8950 531m
- USD/JPY: USD amounts
- 157.50 1.2b
- 158.95 777m
- 159.00 1.4b
- 159.50 705m
- 160.50 751m
- AUD/USD: AUD amounts
- 0.6660 814m
- 0.6665 687m
- 0.6700 520m
- 0.6745 673m
- 0.6750 650m
- USD/CAD: USD amounts
- 1.3660 428m
- EUR/GBP: EUR amounts
- 0.8400 630m
- 0.8475 898m
- NZD/USD: NZD amounts
- 0.6250 410m
Gold prices remained broadly unchanged in India on Wednesday, according to data compiled by FXStreet.
The price for Gold stood at 6,220.17 Indian Rupees (INR) per gram, broadly stable compared with the INR 6,225.89 it cost on Tuesday.
The price for Gold was broadly steady at INR 72,550.85 per tola from INR 72,617.53 per tola a day earlier.
| Unit measure | Gold Price in INR |
|---|---|
| 1 Gram | 6,220.17 |
| 10 Grams | 62,201.71 |
| Tola | 72,550.85 |
| Troy Ounce | 193,469.10 |
FXStreet calculates Gold prices in India by adapting international prices (USD/INR) to the local currency and measurement units. Prices are updated daily based on the market rates taken at the time of publication. Prices are just for reference and local rates could diverge slightly.
Gold FAQs
Gold has played a key role in human’s history as it has been widely used as a store of value and medium of exchange. Currently, apart from its shine and usage for jewelry, the precious metal is widely seen as a safe-haven asset, meaning that it is considered a good investment during turbulent times. Gold is also widely seen as a hedge against inflation and against depreciating currencies as it doesn’t rely on any specific issuer or government.
Central banks are the biggest Gold holders. In their aim to support their currencies in turbulent times, central banks tend to diversify their reserves and buy Gold to improve the perceived strength of the economy and the currency. High Gold reserves can be a source of trust for a country’s solvency. Central banks added 1,136 tonnes of Gold worth around $70 billion to their reserves in 2022, according to data from the World Gold Council. This is the highest yearly purchase since records began. Central banks from emerging economies such as China, India and Turkey are quickly increasing their Gold reserves.
Gold has an inverse correlation with the US Dollar and US Treasuries, which are both major reserve and safe-haven assets. When the Dollar depreciates, Gold tends to rise, enabling investors and central banks to diversify their assets in turbulent times. Gold is also inversely correlated with risk assets. A rally in the stock market tends to weaken Gold price, while sell-offs in riskier markets tend to favor the precious metal.
The price can move due to a wide range of factors. Geopolitical instability or fears of a deep recession can quickly make Gold price escalate due to its safe-haven status. As a yield-less asset, Gold tends to rise with lower interest rates, while higher cost of money usually weighs down on the yellow metal. Still, most moves depend on how the US Dollar (USD) behaves as the asset is priced in dollars (XAU/USD). A strong Dollar tends to keep the price of Gold controlled, whereas a weaker Dollar is likely to push Gold prices up.
(An automation tool was used in creating this post.)
- The EUR/USD pair could test a throwback support at the 1.0670 level.
- The daily chart suggests a bearish bias as the pair consolidates within the descending channel.
- The immediate resistance appears at the 14-day EMA at the level of 1.0743.
EUR/USD extends its losses for the second consecutive day, trading around 1.0710 during the Asian session on Wednesday. A technical analysis of a daily chart suggests a bearish bias for the pair, as it consolidates within the descending channel.
Additionally, the momentum indicator 14-day Relative Strength Index (RSI) is positioned below the 50 level, suggesting a confirmation of a bearish bias for the EUR/USD pair.
The EUR/USD pair could find immediate support at the psychological level of 1.0700. A break below this level could exert downward pressure on the pair to test the throwback support at the level of 1.0670.
Further decline would strengthen the bearish bias and the pair could navigate the region around the lower boundary of the descending channel near the 1.0640 level.
On the upside, the EUR/USD pair could meet the immediate barrier at the 14-day Exponential Moving Average (EMA) at the level of 1.0743. A breakthrough above this level could lead the pair to test the area around the psychological level of 1.0800 and the upper boundary of the descending channel nearing the level of 1.0810.
Further resistance appears at the vicinity of the significant level of 1.0900 and a three-month high at 1.0915, which was recorded on June 4.
EUR/USD: Daily Chart
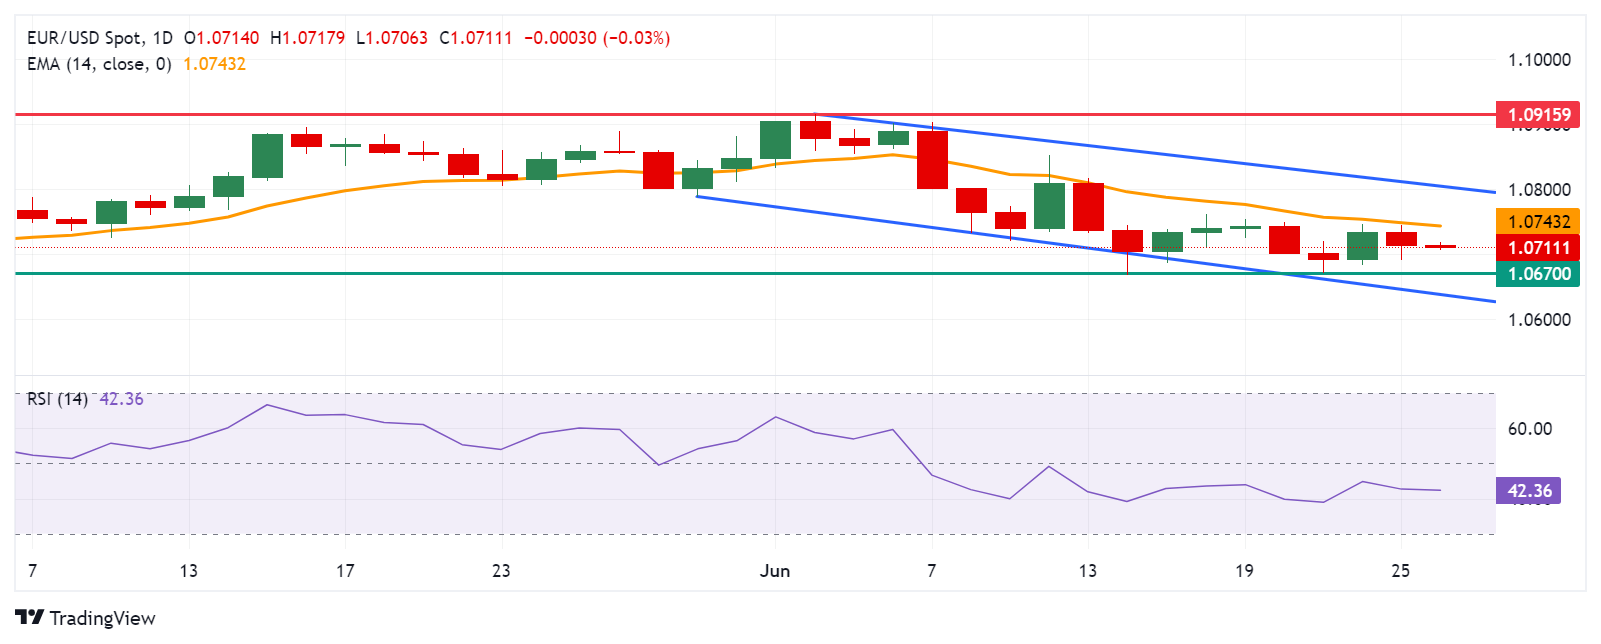
- WTI regains positive traction on Wednesday amid concerns about supply disruption.
- Demand uncertainty might cap any meaningful upside amid a modest USD strength.
- The official US inventory data to provide some impetus ahead of the US PCE on Friday.
West Texas Intermediate (WTI) US crude Oil prices attract fresh buyers during the Asian session on Wednesday and reverse a part of the previous day's retracement slide from the $81.65 area, or a nearly two-month top. The commodity currently trades around the $81.00/barrel mark, up over 0.50% for the day amid persistent geopolitical tensions stemming from Israeli strikes on Gaza and Ukrainian attacks on Russian refineries.
Meanwhile, Russia’s Foreign Ministry summoned US Ambassador Lynne Tracy earlier this week and blamed the US for a barbaric attack in Crimea and said that retaliatory measures would “definitely follow”. Furthermore, the risk of an all-out war between Israel and Lebanon remains alive in the wake of soaring tensions on provocations by Hezbollah, fueling concerns about supply disruptions from the key Oil producing countries. This, in turn, is seen as a key factor acting as a tailwind for the black liquid, though worries about weaker demand in the top Oil consuming nation might keep a lid on any further gains.
Data from the American Petroleum Institute showed on Tuesday that US Oil inventories unexpectedly rose by 914K barrels in the week to June 21. Moreover, a jump in US gasoline stocks last week suggested a weak start to the summer driving season. Meanwhile, a fall in the US Consumer Confidence in June added to worries about the economic outlook. This, along with a modest US Dollar (USD) strength, bolstered by the recent hawkish remarks by influential FOMC members and uncertainty about the likely timing of when the Federal Reserve (Fed) will start cutting rates, might contribute to capping Oil prices.
Market participants now look forward to the official US government data on oil and fuel stockpiles, which is due for release later this Wednesday at 14:30 GMT. The focus, however, will remain squarely on the final US Q1 GDP print on Thursday and the US Personal Consumption Expenditures (PCE) Price Index on Friday. The latter will influence the Fed's future policy decision, which, in turn, will drive the USD demand in the near term and provide some meaningful impetus to Crude Oil prices.
European Central Bank (ECB) policymaker Olli Rehn said on Wednesday, the market expectations that the ECB will reduce interest rates twice more this year to as low as 2.25% in 2025 are ‘reasonable’, per Bloomberg.
The Finnish central bank chief also said that “while officials must ensure inflation returns to 2%, they shouldn’t overly dampen economic activity.”
Market reaction
The above comments maintained the bearish pressure on the EUR/USD pair, as it flirts with intraday lows near 1.0710, at the time of writing.
- NZD/USD loses ground as traders adopt cautious stance ahead of key economic data this week.
- UOB Group analysts suggest that the New Zealand Dollar is expected to consolidate within a range of 0.6100 to 0.6140.
- The US Dollar receives support from the hawkish remarks from the Fed officials.
NZD/USD extends its losses for the second successive session, trading around 0.6110 during the Asian session on Wednesday. The New Zealand Dollar (NZD) struggles possibly due to risk aversion ahead of ANZ – Roy Morgan Consumer Confidence for June due and US Gross Domestic Product (GDP) for the first quarter (Q1) are set to be released on Thursday. Furthermore, the US Personal Consumption Expenditure (PCE) Price Index will be eyed on Friday.
New Zealand's Treasury stated on Wednesday that a weak economy poses a threat to its forecasts. The Treasury is considering additional spending and revenue solutions in response. Meanwhile, economist McLeish noted recent data suggesting economic weakness in New Zealand.
According to UOB Group analysts, the New Zealand Dollar (NZD) is expected to trade within a sideways range of 0.6100 to 0.6140 or potentially drift lower toward 0.6085.
Read the full article: The pair to trade within 0.6100/0.6140 range – UOB Group
US Dollar Index (DXY), which measures the value of the US Dollar (USD) against the six other major currencies, extends its gains for the second successive session. The DXY trades around 105.70 with the higher 10-year yield on US Treasury bond trading at 4.26%, at the time of writing.
Reuters cited Fed Governor Michelle Bowman repeating her view on Tuesday that holding the policy rate steady for some time will likely be enough to bring inflation under control. Meanwhile, Fed Governor Lisa Cook said it would be appropriate to cut interest rates "at some point" given significant progress on inflation and a gradual cooling of the labor market, though she remained vague about the timing of the easing.
- GBP/USD remains confined in a narrow range for the second straight day on Wednesday.
- The mixed fundamental backdrop holds back traders from placing fresh directional bets.
- A break below the 1.2645-1.2640 confluence support will pave the way for deeper losses.
The GBP/USD pair extends its sideways consolidative price move for the second straight day and remains confined in a narrow range below the 1.2700 mark during the Asian session on Wednesday. The lack of any meaningful buying, meanwhile, warrants some caution before positioning for an extension of the recent bounce from the 1.2625-1.2620 region, or the lowest level since mid-May touched last Friday.
Against the backdrop of the Federal Reserve's (Fed) hawkish surprise earlier this month, policymakers have backed the case for keeping interest rates higher for longer. The markets, however, are still pricing in a greater chance that the US central bank will start cutting interest rates in September, which keeps the US Dollar (USD) bulls on the defensive and acts as a tailwind for the GBP/USD pair. That said, the Bank of England's (BoE) dovish pause last week caps the upside for the British Pound (GBP) and the currency pair ahead of the UK general election on July 4.
From a technical perspective, the recent pullback from the 1.2860 area, or a three-month peak touched on June 12 stalled near the 50-day Simple Moving Average (SMA). The said support is currently pegged near the 1.2645-1.2640 region, which now coincides with the 100-day SMA and should act as a key pivotal point. A convincing break below will be seen as a fresh trigger for bearish traders and drag the GBP/USD pair further below the 1.2600 round figure, towards testing the next relevant support near the 1.2560-1.2555 zone en route to the 1.2500 psychological mark.
On the flip side, the 1.2700 round figure is likely to act as an immediate hurdle ahead of the 1.2720-1.2725 supply zone. Some follow-through buying and a sustained strength beyond will suggest that the recent corrective decline has run its course. Given that oscillators have been recovering on the daily chart, the GBP/USD pair might then accelerate the move towards reclaiming the 1.2800 mark. Bulls might eventually aim to challenge the multi-month top, around the 1.2860 region, and lift spot prices further towards the 1.2900 round figure.
GBP/USD daily chart
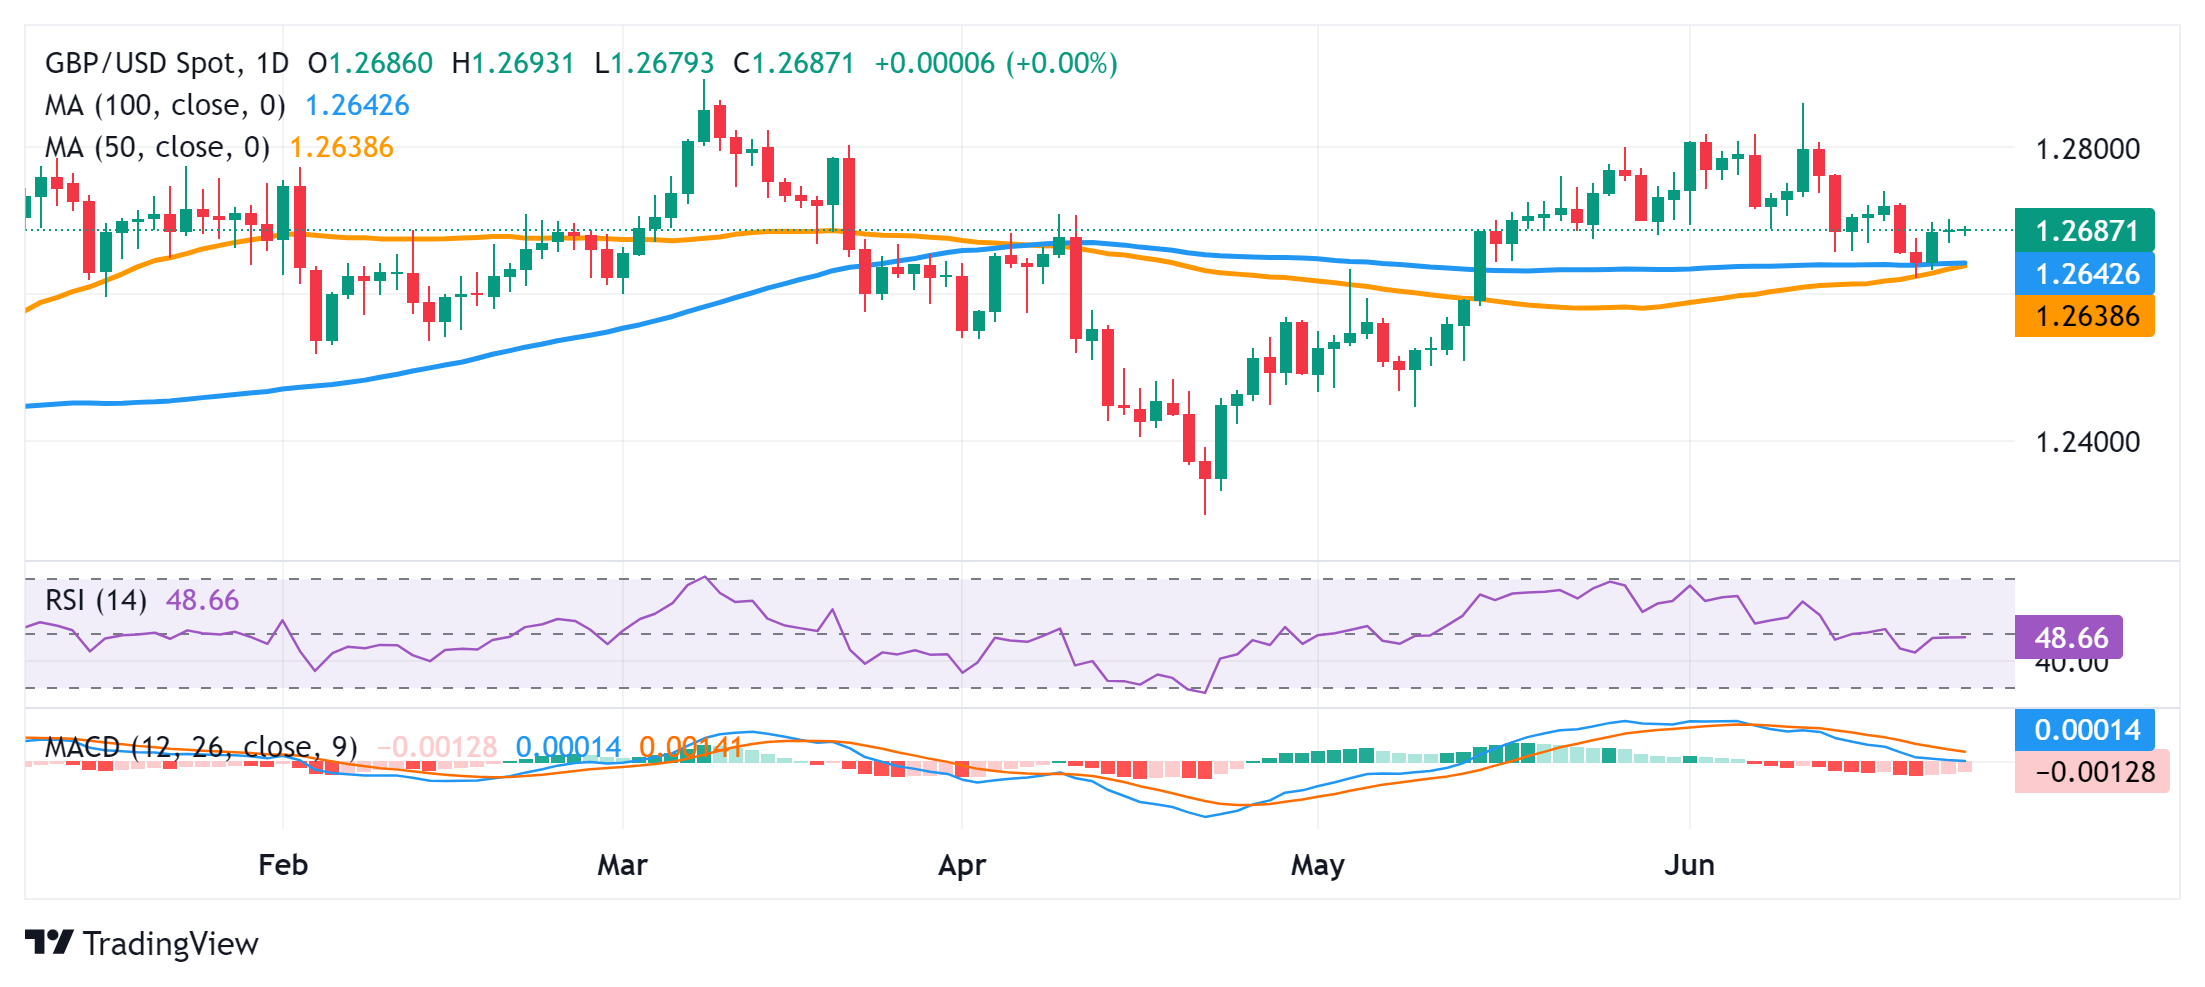
- The Indian Rupee receives support due to expected inflows of foreign investments.
- Indian bonds are scheduled to be included in the JP Morgan Emerging Market Bond Index on June 28.
- Higher crude prices limit the upside of the INR as India is the world's third-largest Oil consumer.
The Indian Rupee (INR) held its ground on Wednesday after two days of gains. The INR received support from expectations of foreign inflows, as Indian bonds are set to enter the JP Morgan Emerging Market (EM) Bond Index on June 28. However, the upside for the Indian Rupee was restrained by month-end dollar demand from importers.
The US Dollar remains calm after posting gains on Tuesday. The advance of the US Treasury yields supported the Greenback. The recent comments by Federal Reserve (Fed) officials indicated that the central bank is not in a rush to start its rate-cutting cycle.
Investors turn cautious ahead of key US economic data releases later this week. The revised US Gross Domestic Product (GDP) for the first quarter (Q1) is scheduled to be released on Thursday, followed by the Personal Consumption Expenditure (PCE) Price Index on Friday.
Daily Digest Market Movers: Indian Rupee remains firm due to inflows of foreign investments
- Foreign investors have already invested approximately $10 billion into the securities eligible to join JPMorgan’s index on June 28, according to Business Standard. Meanwhile, Goldman Sachs anticipates at least $30 billion more in inflows in the coming months as India’s weighting on the index steadily rises to 10%.
- The rise in crude oil prices, driven by expectations of strong summer driving demand, could pressure the Indian Rupee. As the world's third-largest oil consumer after the United States and China, India is significantly impacted by fluctuations in oil prices.
- Reuters cited Fed Governor Michelle Bowman repeating her view on Tuesday that holding the policy rate steady for some time will likely be enough to bring inflation under control. Meanwhile, Fed Governor Lisa Cook said it would be appropriate to cut interest rates "at some point" given significant progress on inflation and a gradual cooling of the labor market, though she remained vague about the timing of the easing.
- The S&P Global Ratings retained its growth forecast for India at 6.8% for FY25, citing high interest rates and government spending boosting demand in the non-agricultural sectors.
- India is expected to become a $4 trillion economy in 2025, surpassing Japan by early next fiscal year to become the world's fourth largest economy, according to Indian Economic Advisory Council to the Prime Minister (EAC-PM) member Sanjeev Sanyal.
Technical analysis: USD/INR hovers around the level of 83.50
The USD/INR trades around 83.50 on Wednesday. The daily chart analysis shows a broadening pattern, representing increasing volatility. This chart pattern suggests a potential correction before moving lower. The 14-day Relative Strength Index (RSI) is positioned below the 50 level, indicating a bearish bias.
The immediate support appears at the 50-day Exponential Moving Average (EMA) at 83.40. A break below this level could exert pressure on the USD/INR pair to navigate the region around the lower boundary of the broadening bottom around the level of 83.30.
On the upside, the USD/INR pair may find resistance at the upper boundary of the broadening formation around the level of 83.70, followed by the psychological level of 84.00.
USD/INR: Daily Chart
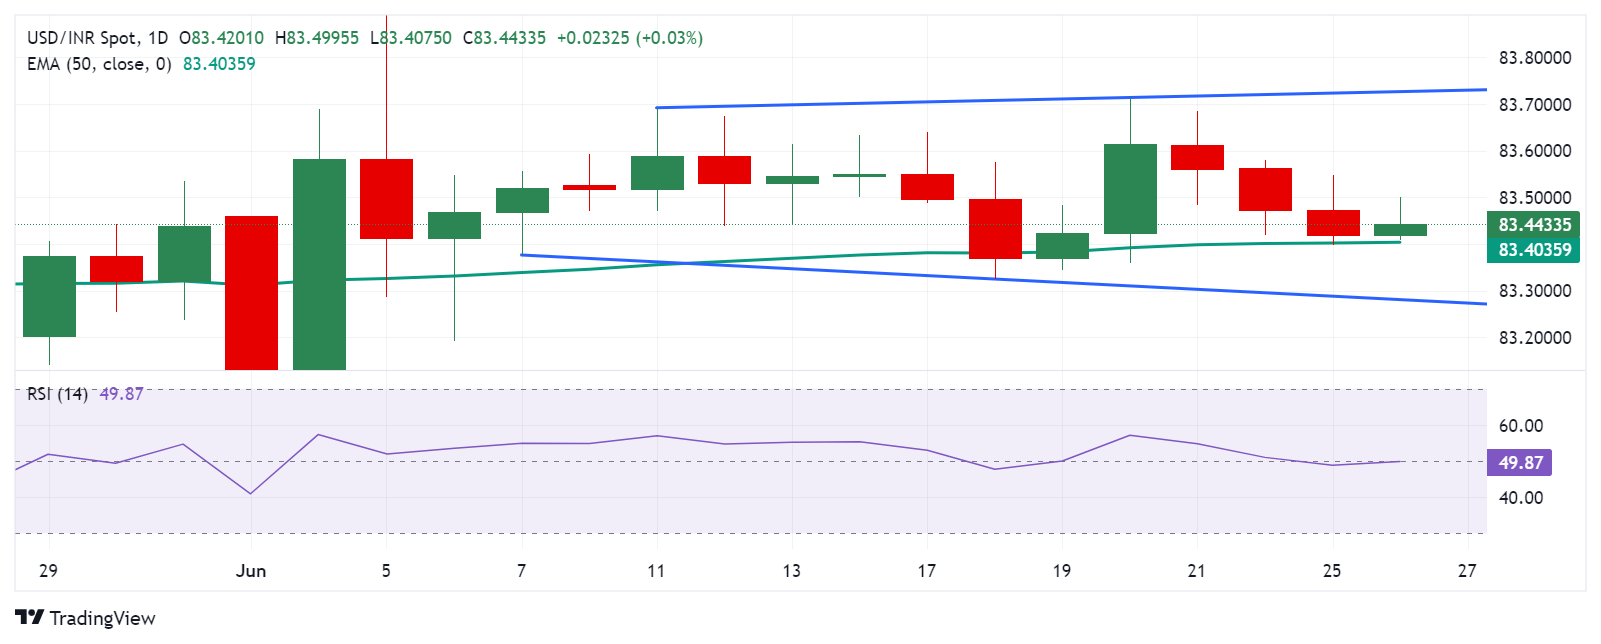
US Dollar price today
The table below shows the percentage change of the US Dollar (USD) against listed major currencies today. The US Dollar was the strongest against the Japanese Yen.
| USD | EUR | GBP | CAD | AUD | JPY | NZD | CHF | |
| USD | -0.04% | -0.05% | -0.05% | -0.49% | 0.07% | 0.01% | -0.06% | |
| EUR | 0.03% | -0.02% | -0.02% | -0.46% | 0.11% | 0.04% | -0.03% | |
| GBP | 0.05% | 0.02% | -0.01% | -0.43% | 0.13% | 0.06% | -0.01% | |
| CAD | 0.05% | 0.02% | 0.01% | -0.43% | 0.13% | 0.08% | 0.00% | |
| AUD | 0.48% | 0.43% | 0.42% | 0.42% | 0.55% | 0.49% | 0.45% | |
| JPY | -0.07% | -0.11% | -0.14% | -0.13% | -0.55% | -0.08% | -0.13% | |
| NZD | -0.03% | -0.07% | -0.08% | -0.08% | -0.52% | 0.07% | -0.05% | |
| CHF | 0.05% | 0.03% | 0.01% | 0.00% | -0.43% | 0.13% | 0.08% |
The heat map shows percentage changes of major currencies against each other. The base currency is picked from the left column, while the quote currency is picked from the top row. For example, if you pick the Euro from the left column and move along the horizontal line to the Japanese Yen, the percentage change displayed in the box will represent EUR (base)/JPY (quote).
Indian Rupee FAQs
The Indian Rupee (INR) is one of the most sensitive currencies to external factors. The price of Crude Oil (the country is highly dependent on imported Oil), the value of the US Dollar – most trade is conducted in USD – and the level of foreign investment, are all influential. Direct intervention by the Reserve Bank of India (RBI) in FX markets to keep the exchange rate stable, as well as the level of interest rates set by the RBI, are further major influencing factors on the Rupee.
The Reserve Bank of India (RBI) actively intervenes in forex markets to maintain a stable exchange rate, to help facilitate trade. In addition, the RBI tries to maintain the inflation rate at its 4% target by adjusting interest rates. Higher interest rates usually strengthen the Rupee. This is due to the role of the ‘carry trade’ in which investors borrow in countries with lower interest rates so as to place their money in countries’ offering relatively higher interest rates and profit from the difference.
Macroeconomic factors that influence the value of the Rupee include inflation, interest rates, the economic growth rate (GDP), the balance of trade, and inflows from foreign investment. A higher growth rate can lead to more overseas investment, pushing up demand for the Rupee. A less negative balance of trade will eventually lead to a stronger Rupee. Higher interest rates, especially real rates (interest rates less inflation) are also positive for the Rupee. A risk-on environment can lead to greater inflows of Foreign Direct and Indirect Investment (FDI and FII), which also benefit the Rupee.
Higher inflation, particularly, if it is comparatively higher than India’s peers, is generally negative for the currency as it reflects devaluation through oversupply. Inflation also increases the cost of exports, leading to more Rupees being sold to purchase foreign imports, which is Rupee-negative. At the same time, higher inflation usually leads to the Reserve Bank of India (RBI) raising interest rates and this can be positive for the Rupee, due to increased demand from international investors. The opposite effect is true of lower inflation.
- USD/CAD oscillates in a range on Wednesday amid a mixed fundamental backdrop.
- Hotter Canadian CPI on Tuesday and an uptick in Oil prices underpin the Loonie.
- The Fed rate-cut uncertainty caps the USD and acts as a headwind for the major.
The USD/CAD pair struggles to capitalize on the previous day's late rebound from the 1.3620-1.3615 region, or a three-week low and remains on the defensive during the Asian session on Wednesday. Spot prices currently trade around mid-1.3600s, nearly unchanged for the day, and the mixed fundamental backdrop warrants some caution for aggressive traders ahead of the key US macro data.
The final US Q1 GDP print is due for release on Thursday, which will be followed by the Personal Consumption Expenditures (PCE) Price Index on Friday. The latter is considered the Federal Reserve’s (Fed) preferred inflation gauge and will play a key role in influencing market expectations about future policy decisions. This, in turn, will drive the US Dollar (USD) demand and provide some meaningful impetus to the USD/CAD pair.
In the meantime, the uncertainty over the likely timing of when the Fed will start its rate-cutting cycle fails to assist the US Dollar (USD) in attracting buyers. The recent hawkish comments by influential FOMC members suggested that the US central bank will not be in a rush to start lowering borrowing costs anytime soon. That said, signs of moderating inflationary pressures keep hopes alive for a September Fed rate cut move and cap the USD.
Meanwhile, an upward surge in Canadian consumer inflation in May forced investors to scale back their bets for a July rate cut by the Bank of Canada (BoC). This, along with an uptick in Crude Oil prices, underpins the commodity-linked Loonie and might further contribute to capping the USD/CAD pair. Hence, any attempted positive move is more likely to attract fresh sellers at higher levels and runs the risk of fizzling out rather quickly.
- Gold price drifts lower for the second straight day amid the Fed’s hawkish outlook.
- A September rate cut by the Fed remains on the table, which caps gains for the USD.
- Persistent geopolitical tensions contribute to limiting the downside for the XAU/USD.
Gold price (XAU/USD) remains under some selling pressure for the second successive day and drops to over a one-week low during the Asian session on Wednesday. Comments from Federal Reserve (Fed) Governors Michelle Bowman and Lisa Cook on Tuesday suggested that the central bank is unlikely to kickstart its rate-cutting cycle anytime soon amid a resilient US economy. The hawkish outlook triggers a modest uptick in the US Treasury bond yields, which acts as a tailwind for the US Dollar (USD) and undermines the non-yielding yellow metal.
Investors, meanwhile, are still pricing in a greater chance of a September Fed rate cut move in the wake of weaker inflation data for May. This, along with the risk of a further escalation of geopolitical tensions in the Middle East and the protracted Russia-Ukraine war, lends some support to the safe-haven Gold price. Traders might also prefer to wait for Thursday's release of the final US Q1 GDP print and the Personal Consumption Expenditures (PCE) Price Index on Friday before positioning for the next leg of a directional move for the XAU/USD.
Daily Digest Market Movers: Gold price continues to be undermined by Fed rate jitters
- Federal Reserve policymakers continue to argue in favor of keeping rates higher for longer, which pushes the US Treasury bond yields higher and caps the upside for the non-yielding Gold price.
- Fed Governor Michelle Bowman showed a willingness to raise borrowing costs if inflation progress stalls and said on Tuesday that they are not yet at the point where it is appropriate to cut rates.
- Separately, Fed Governor Lisa Cook noted that it would be appropriate to cut rates at some point, though a rise in inflation expectations would imply keeping monetary policy restrictive for longer.
- A survey from the Conference Board showed on Tuesday that the US Consumer Confidence Index ticked lower to 100.4 in June from 101.3 in the previous month amid worries about the economic outlook.
- This comes on top of the recent weakness in US Retail Sales and signs of moderating inflationary pressures, which keeps hopes alive for a September Fed rate cut and acts as a headwind for the US Dollar.
- Russia’s Foreign Ministry summoned US Ambassador Lynne Tracy earlier this week and blamed the US for a barbaric attack in Crimea, and said that retaliatory measures would “definitely follow”.
- Concerns about an all-out war between Israel and Lebanon remain alive in the wake of soaring tensions on provocations by Hezbollah, helping limit the downside for the safe-haven precious metal.
- Traders also seem reluctant to place aggressive directional bets and now look forward to the release of the Personal Consumption Expenditures (PCE) Price Index on Friday for some meaningful impetus.
Technical Analysis: Gold price bears now await a break below ascending trendline support
From a technical perspective, the recent failure to capitalize on the strength beyond the 50-day Simple Moving Average (SMA) and the subsequent slide favors bearish traders. Moreover, oscillators on the daily chart have again started gaining negative traction, suggesting that the path of least resistance for the Gold price is to the downside. That said, it will still be prudent to wait for a sustained break below a short-term ascending trendline support, currently pegged near the $2,310 area, before positioning for further losses. The XAU/USD might then weaken further below the $2,300 mark and retest the monthly swing low, around the $2,287-2,286 region. Some follow-through selling will reaffirm the negative bias and expose the 100-day SMA support near the $2,250 area. The downward trajectory could extend further towards the $2,225-2,220 region before the commodity eventually drops to the $2,200 round-figure mark.
On the flip side, any meaningful positive move now seems to confront stiff resistance near the 50-day SMA, currently near the $2,339-2,340 region, ahead of Friday's swing high, around the $2,368-2,369 zone. A sustained strength beyond the latter could lift the Gold price towards the $2,387-2,388 intermediate hurdle en route to the $2,400 round-figure mark. Some follow-through buying will negate any near-term negative bias and allow the XAU/USD to aim back to challenge the all-time peak, around the $2,450 area touched in May.
Gold FAQs
Gold has played a key role in human’s history as it has been widely used as a store of value and medium of exchange. Currently, apart from its shine and usage for jewelry, the precious metal is widely seen as a safe-haven asset, meaning that it is considered a good investment during turbulent times. Gold is also widely seen as a hedge against inflation and against depreciating currencies as it doesn’t rely on any specific issuer or government.
Central banks are the biggest Gold holders. In their aim to support their currencies in turbulent times, central banks tend to diversify their reserves and buy Gold to improve the perceived strength of the economy and the currency. High Gold reserves can be a source of trust for a country’s solvency. Central banks added 1,136 tonnes of Gold worth around $70 billion to their reserves in 2022, according to data from the World Gold Council. This is the highest yearly purchase since records began. Central banks from emerging economies such as China, India and Turkey are quickly increasing their Gold reserves.
Gold has an inverse correlation with the US Dollar and US Treasuries, which are both major reserve and safe-haven assets. When the Dollar depreciates, Gold tends to rise, enabling investors and central banks to diversify their assets in turbulent times. Gold is also inversely correlated with risk assets. A rally in the stock market tends to weaken Gold price, while sell-offs in riskier markets tend to favor the precious metal.
The price can move due to a wide range of factors. Geopolitical instability or fears of a deep recession can quickly make Gold price escalate due to its safe-haven status. As a yield-less asset, Gold tends to rise with lower interest rates, while higher cost of money usually weighs down on the yellow metal. Still, most moves depend on how the US Dollar (USD) behaves as the asset is priced in dollars (XAU/USD). A strong Dollar tends to keep the price of Gold controlled, whereas a weaker Dollar is likely to push Gold prices up.
| Raw materials | Closed | Change, % |
|---|---|---|
| Silver | 28.905 | -2.25 |
| Gold | 231.918 | -0.63 |
| Palladium | 940.88 | -3.18 |
New Zealand’s (NZ) Treasury said in a statement on Wednesday that “weak economy threatens Treasury forecasts.”
NZ Treasury said it is considering additional spending and revenue solutions.
Meanwhile, NZ economist McLeish noted that he sees recent data indicating economic weakness.
Market reaction
NZD/USD is flirting with intraday lows near 0.6115, modestly flat on the day.
- The Australian Dollar inches higher as higher consumer inflation dampens the RBA’s possible rate cuts.
- Australia’s monthly CPI jumped by 4.0% YoY against the expected growth of 3.8% in May.
- The US Dollar remains calm as investors turn cautious ahead of key US economic data releases later this week.
The Australian Dollar (AUD) recovers losses after releasing May's higher-than-expected Monthly Consumer Price Index (CPI). The persistently high inflation is a roadblock to the Reserve Bank of Australia's (RBA) possible rate cuts, potentially supporting the Aussie Dollar and underpinning the AUD/USD pair.
Reserve Bank of Australia (RBA) Assistant Governor Christopher Kent stated on Wednesday that recent data emphasize the necessity of remaining vigilant about potential inflation increases. Kent noted that current policies are contributing to slower demand growth and lower inflation. He also mentioned that no options are being excluded regarding future interest rate adjustments, per Bloomberg.
The US Dollar remains calm after posting gains on Tuesday. Investors turn cautious ahead of key US economic data releases later this week. The revised US Gross Domestic Product (GDP) for the first quarter (Q1) is scheduled to be released on Thursday, followed by the Personal Consumption Expenditure (PCE) Price Index on Friday.
Daily Digest Market Movers: Australian Dollar edges higher due to higher consumer inflation
- Australia’s monthly Consumer Price Index (CPI) jumped by 4.0% in the year to May, up from the 3.6% increase recorded in April, according to data published by the Australian Bureau of Statistics (ABS) on Wednesday. This increase exceeded the market forecast, which predicted a 3.8% growth for the reported period.
- According to Bloomberg, China Premier Li Qiang expressed confidence in China's ability to achieve its full-year growth target of around 5%. On Tuesday, the People's Bank of China injected 300 billion Yuan through seven-day reverse repos, keeping the reverse repo rate at 1.8%. Changes in the Chinese economy could significantly impact the Australian market, given the close trade relationship between China and Australia.
- Australia's Westpac Consumer Confidence rose by 1.7% month-over-month in June, rebounding from a 0.3% decline the previous month. This marks the first increase in four months and the highest level since February.
- On Friday, the US Composite PMI for June surpassed expectations, rising to 54.6 from May’s reading of 54.5. This figure marked the highest level since April 2022. The Manufacturing PMI increased to a reading of 51.7 from a 51.3 figure, exceeding the forecast of 51.0. Similarly, the Services PMI rose to 55.1 from 54.8 in May, beating the consensus estimate of 53.7.
- As per a Reuters report, Fed Reserve Bank of Minneapolis President Neel Kashkari noted on Thursday that it will probably take a year or two to get inflation back to 2%.
- The RBA Governor Michele Bullock said during her latest press conference that the Board discussed potential rate hikes, dismissing considerations of rate cuts in the near term, as per ABC News. Markets have significantly reduced their expectations for a RBA’s rate cut this year, with an easing not anticipated until April next year.
Technical Analysis: Australian Dollar holds a position around 0.6650
The Australian Dollar trades around 0.6660 on Wednesday. Analysis of the daily chart shows a neutral bias for the AUD/USD pair as it consolidates within a rectangle formation. The 14-day Relative Strength Index (RSI) is positioned slightly above the 50 level. Further movement may indicate a clear directional trend.
The AUD/USD pair may find support around the 50-day Exponential Moving Average (EMA) at 0.6616. A break below this level could lead the pair to test the lower boundary of the rectangle formation near 0.6585.
On the upside, the AUD/USD pair may encounter resistance near the upper boundary of the rectangle formation around 0.6695, aligned with the psychological level of 0.6700. Beyond that, potential resistance levels include the high of 0.6714 observed since January.
AUD/USD: Daily Chart
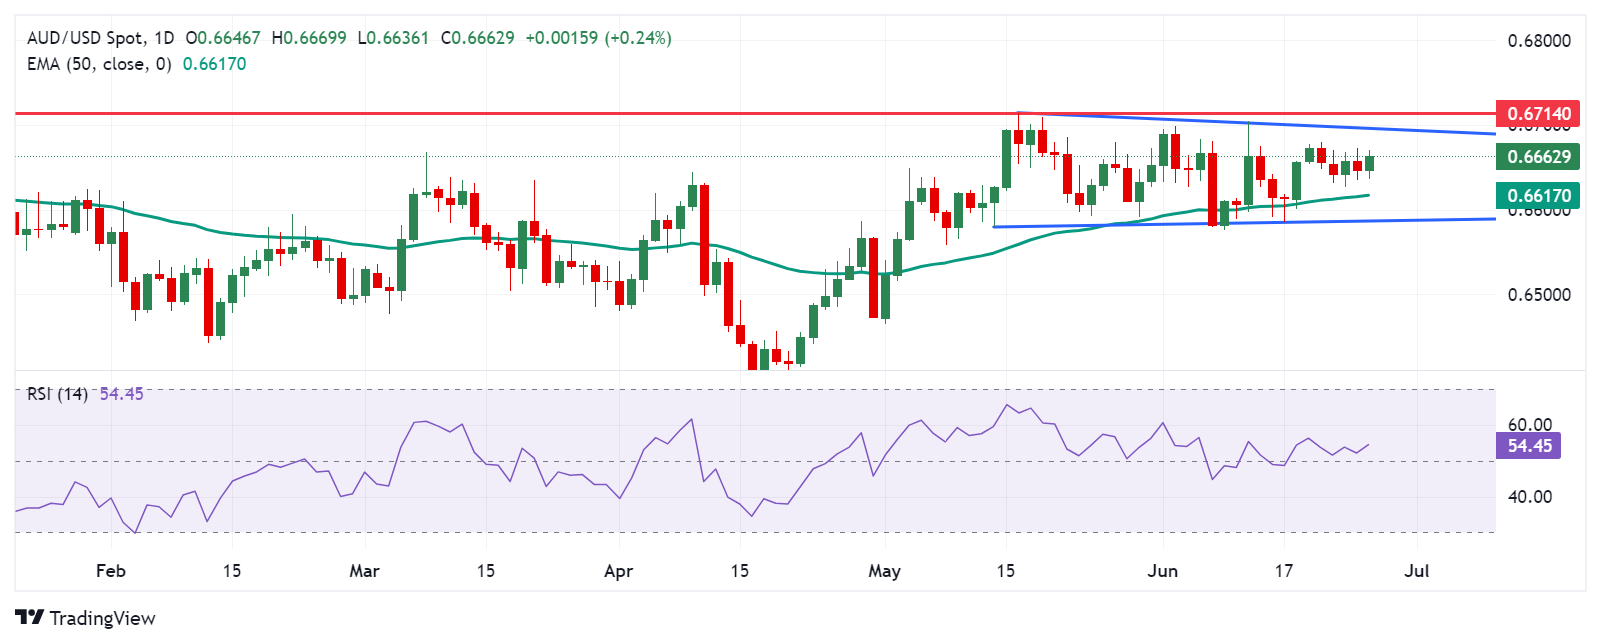
Australian Dollar price today
The table below shows the percentage change of Australian Dollar (AUD) against listed major currencies today. Australian Dollar was the strongest against the Japanese Yen.
| USD | EUR | GBP | CAD | AUD | JPY | NZD | CHF | |
| USD | -0.04% | -0.02% | -0.02% | -0.31% | 0.11% | 0.01% | -0.01% | |
| EUR | 0.03% | 0.01% | 0.02% | -0.27% | 0.17% | 0.05% | 0.02% | |
| GBP | 0.03% | -0.01% | -0.02% | -0.29% | 0.12% | 0.03% | 0.01% | |
| CAD | 0.04% | 0.02% | 0.03% | -0.27% | 0.14% | 0.06% | 0.03% | |
| AUD | 0.33% | 0.22% | 0.28% | 0.27% | 0.45% | 0.33% | 0.34% | |
| JPY | -0.12% | -0.15% | -0.16% | -0.14% | -0.42% | -0.09% | -0.12% | |
| NZD | -0.05% | -0.09% | -0.03% | -0.04% | -0.33% | 0.14% | 0.02% | |
| CHF | 0.02% | -0.03% | -0.01% | -0.03% | -0.31% | 0.12% | 0.03% |
The heat map shows percentage changes of major currencies against each other. The base currency is picked from the left column, while the quote currency is picked from the top row. For example, if you pick the Euro from the left column and move along the horizontal line to the Japanese Yen, the percentage change displayed in the box will represent EUR (base)/JPY (quote).
Australian Dollar FAQs
One of the most significant factors for the Australian Dollar (AUD) is the level of interest rates set by the Reserve Bank of Australia (RBA). Because Australia is a resource-rich country another key driver is the price of its biggest export, Iron Ore. The health of the Chinese economy, its largest trading partner, is a factor, as well as inflation in Australia, its growth rate and Trade Balance. Market sentiment – whether investors are taking on more risky assets (risk-on) or seeking safe-havens (risk-off) – is also a factor, with risk-on positive for AUD.
The Reserve Bank of Australia (RBA) influences the Australian Dollar (AUD) by setting the level of interest rates that Australian banks can lend to each other. This influences the level of interest rates in the economy as a whole. The main goal of the RBA is to maintain a stable inflation rate of 2-3% by adjusting interest rates up or down. Relatively high interest rates compared to other major central banks support the AUD, and the opposite for relatively low. The RBA can also use quantitative easing and tightening to influence credit conditions, with the former AUD-negative and the latter AUD-positive.
China is Australia’s largest trading partner so the health of the Chinese economy is a major influence on the value of the Australian Dollar (AUD). When the Chinese economy is doing well it purchases more raw materials, goods and services from Australia, lifting demand for the AUD, and pushing up its value. The opposite is the case when the Chinese economy is not growing as fast as expected. Positive or negative surprises in Chinese growth data, therefore, often have a direct impact on the Australian Dollar and its pairs.
Iron Ore is Australia’s largest export, accounting for $118 billion a year according to data from 2021, with China as its primary destination. The price of Iron Ore, therefore, can be a driver of the Australian Dollar. Generally, if the price of Iron Ore rises, AUD also goes up, as aggregate demand for the currency increases. The opposite is the case if the price of Iron Ore falls. Higher Iron Ore prices also tend to result in a greater likelihood of a positive Trade Balance for Australia, which is also positive of the AUD.
The Trade Balance, which is the difference between what a country earns from its exports versus what it pays for its imports, is another factor that can influence the value of the Australian Dollar. If Australia produces highly sought after exports, then its currency will gain in value purely from the surplus demand created from foreign buyers seeking to purchase its exports versus what it spends to purchase imports. Therefore, a positive net Trade Balance strengthens the AUD, with the opposite effect if the Trade Balance is negative.
Australia’s monthly Consumer Price Index (CPI) jumped by 4.0% in the year to May after recording a 3.6% increase in April, according to the data published by the Australian Bureau of Statistics (ABS) on Wednesday.
The market forecast was for a 3.8% growth in the reported period.
Market reaction
The AUD/USD pair picks up fresh bids on the data release, adding 0.26% on the day to trade near 0.6660, as of writing.
Australian Dollar PRICE Today
The table below shows the percentage change of Australian Dollar (AUD) against listed major currencies today. Australian Dollar was the strongest against the Japanese Yen.
| USD | EUR | GBP | JPY | CAD | AUD | NZD | CHF | |
|---|---|---|---|---|---|---|---|---|
| USD | -0.01% | -0.03% | 0.08% | -0.04% | -0.31% | -0.09% | 0.05% | |
| EUR | 0.00% | -0.03% | 0.05% | -0.06% | -0.31% | -0.07% | 0.04% | |
| GBP | 0.03% | 0.03% | 0.10% | -0.02% | -0.28% | -0.02% | 0.08% | |
| JPY | -0.08% | -0.05% | -0.10% | -0.12% | -0.41% | -0.15% | -0.03% | |
| CAD | 0.04% | 0.06% | 0.02% | 0.12% | -0.32% | -0.04% | 0.08% | |
| AUD | 0.31% | 0.31% | 0.28% | 0.41% | 0.32% | 0.23% | 0.36% | |
| NZD | 0.09% | 0.07% | 0.02% | 0.15% | 0.04% | -0.23% | 0.13% | |
| CHF | -0.05% | -0.04% | -0.08% | 0.03% | -0.08% | -0.36% | -0.13% |
The heat map shows percentage changes of major currencies against each other. The base currency is picked from the left column, while the quote currency is picked from the top row. For example, if you pick the Australian Dollar from the left column and move along the horizontal line to the US Dollar, the percentage change displayed in the box will represent AUD (base)/USD (quote).
The People’s Bank of China (PBOC) set the USD/CNY central rate on Wednesday at 7.1248, as against the previous day's fix of 7.1225 and 7.2698 Reuters estimates.
- USD/JPY continues to draw some support from the divergent Fed-BoJ policy stance.
- Fears that authorities will intervene to support the JPY cap the upside for the major.
- Traders also seem reluctant ahead of the crucial US PCE Price Index data on Friday.
The USD/JPY pair oscillates in a narrow trading range during the Asian session on Wednesday and is currently placed, around the 159.70-159.75 region, or just below a nearly two-month peak touched earlier this week. The upside, meanwhile, remains capped amid fears that Japanese authorities or the Bank of Japan (BoJ) might intervene in the markets to prop up the domestic currency.
In fact, Japan's Vice Finance Minister Masato Kanda reiterated that the government is prepared to take appropriate action if excessive currency fluctuations have a negative impact on the national economy. Kanda’s comments, however, had minimal impact on the Japanese Yen (JPY) in the wake of the BoJ's reluctance to provide a detailed plan for the reduction of bond purchases. This marks a big divergence in comparison to the Federal Reserve's (Fed) hawkish stance and suggests that the path of least resistance for the USD/JPY pair is to the upside.
Against the backdrop of the Fed's hawkish pause in June, the recent comments by policymakers indicated that the central bank is not in a rush to start its rate-cutting cycle. Fed Governor Michelle Bowman repeated her view on Tuesday that holding the policy rate steady for some time will likely be enough to bring inflation under control. Fed Governor Lisa Cook said it would be appropriate to cut interest rates "at some point" given significant progress on inflation and a gradual cooling of the labor market, though remained vague about the timing of the easing.
That said, signs of easing inflationary pressures in the US keep hopes alive for the first interest rate cut by the Fed in September. This, in turn, is holding back the USD bulls from placing aggressive bets and capping the upside for the USD/JPY pair. Traders also prefer to move to the sidelines ahead of the final US Q1 GDP print on Thursday, which will be followed by the release of the Personal Consumption Expenditures (PCE) Price Index on Friday. The latter will influence the Fed's future policy decision and determine the near-term trajectory for the currency pair.
| Index | Change, points | Closed | Change, % |
|---|---|---|---|
| NIKKEI 225 | 368.5 | 39173.15 | 0.95 |
| Hang Seng | 45.19 | 18072.9 | 0.25 |
| KOSPI | 9.66 | 2774.39 | 0.35 |
| ASX 200 | 105.1 | 7838.8 | 1.36 |
| DAX | -147.96 | 18177.62 | -0.81 |
| CAC 40 | -44.59 | 7662.3 | -0.58 |
| Dow Jones | -299.05 | 39112.16 | -0.76 |
| S&P 500 | 21.43 | 5469.3 | 0.39 |
| NASDAQ Composite | 220.83 | 17717.65 | 1.26 |
| Pare | Closed | Change, % |
|---|---|---|
| AUDUSD | 0.66474 | -0.15 |
| EURJPY | 171.048 | -0.13 |
| EURUSD | 1.07127 | -0.2 |
| GBPJPY | 202.534 | 0.05 |
| GBPUSD | 1.2685 | -0.01 |
| NZDUSD | 0.61196 | -0.07 |
| USDCAD | 1.36551 | 0 |
| USDCHF | 0.89465 | 0.2 |
| USDJPY | 159.659 | 0.06 |
Reserve Bank of Australia (RBA) Assistant Governor Christopher Kent crossed the wires in the last hour, saying that the recent data reinforce the need to be vigilant to upside inflation risks.
Additional Quotes:
- Policy contributing to slower growth of demand and lower inflation.
- Not ruling anything in or out for interest rates.
- The cash rate is above our range of estimates of the nominal neutral rate.
- Financial conditions are particularly restrictive for households.
- Conditions are restrictive for smaller businesses, less so for larger.
- Mortgage payments at record 10% of household disposable income.
- Higher rates provide an incentive for all households to save more and borrow less.
Market Reaction:
The Australian Dollar (AUD) reacts little to the comments and remains at the mercy of the US Dollar (USD) price dynamics, which continues to be underpinned by hawkish comments from Federal Reserve (Fed) officials. The AUD/USD pair was last seen trading around the 0.6440-0.6435 region, slightly lower for the second straight day, though remains confined in a familiar short-term range.


© 2000-2026. All rights reserved.
This site is managed by Teletrade D.J. LLC 2351 LLC 2022 (Euro House, Richmond Hill Road, Kingstown, VC0100, St. Vincent and the Grenadines).
The information on this website is for informational purposes only and does not constitute any investment advice.
The company does not serve or provide services to customers who are residents of the US, Canada, Iran, The Democratic People's Republic of Korea, Yemen and FATF blacklisted countries.
Making transactions on financial markets with marginal financial instruments opens up wide possibilities and allows investors who are willing to take risks to earn high profits, carrying a potentially high risk of losses at the same time. Therefore you should responsibly approach the issue of choosing the appropriate investment strategy, taking the available resources into account, before starting trading.
Use of the information: full or partial use of materials from this website must always be referenced to TeleTrade as the source of information. Use of the materials on the Internet must be accompanied by a hyperlink to teletrade.org. Automatic import of materials and information from this website is prohibited.
Please contact our PR department if you have any questions or need assistance at pr@teletrade.global.
transfers